minutes of technical advisory committee (tac) meeting regarding
Upload
khangminh22Category
view
2download
0
MEETING OF THE REGIONAL TRANSIT TECHNICAL
ADVISORY COMMITTEE
Wednesday, October 5, 2016 10:00 a.m. – 11:45 a.m. SCAG Los Angeles Main Office 818 W. 7th Street, 12th Floor, Policy Committee Room A Los Angeles, California 90017 (213) 236-1800 Teleconferencing Available: To join the meeting: http://scag.adobeconnect.com/rttac/ Conference Number(s): 1 (800) 832-0736 MeetingOne Conference Room Number: 7334636 Videoconferencing Available: Orange SCAG Office Ventura SCAG Office 600 S. Main St, Ste. 906 Orange, CA 92863 950 County Square Dr, Ste 101 Ventura, CA 93003 Imperial SCAG Office Riverside SCAG Office 1405 North Imperial Ave., Suite 1 , CA 92243 3403 10th Street, Suite 805 Riverside, CA 92501 SCAG San Bernardino Office 1170 W. 3rd St, Ste. 140 San Bernardino, CA 92410 If members of the public wish to review the attachments or have any questions on any of the agenda items, please contact Matt Gleason at (213) 236-1832 or [email protected].

REGIONAL TRANSIT TECHNICAL ADVISORY COMMITTEE AGENDA
October 5, 2016
- ii- RTTAC
10/05/2016
The Regional Transit Technical Advisory Committee may consider and act upon any of the items listed on the agenda regardless of whether they are listed as information or action items.
TIME PG#
1.0 CALL TO ORDER (Wayne Wassell, Metro, Regional Transit TAC Chair)
2.0 PUBLIC COMMENT PERIOD - Members of the public desiring to speak on items on the agenda, or items not on the agenda, but within the purview of the Regional Transit Technical Advisory Committee, must fill out and present a speaker’s card to the assistant prior to speaking. Comments will be limited to three minutes. The chair may limit the total time for all comments to twenty (20) minutes.
3.0 CONSENT CALENDAR 3.1 Approval Items
3.1.1 Minutes of the June 30, 2016 Regional Transit TAC
Meeting
5
3
4.0 Receive and File 4.1 Caltrans Section 5304 Sustainable Transportation Planning
Completed Grants
4.2 Transit Performance Measures in California, Caroline Rodier, and Emily Issac, Mineta Transportation Institute
REGIONAL TRANSIT TECHNICAL ADVISORY COMMITTEE AGENDA
October 5, 2016
- ii- RTTAC
10/05/2016
The next Regional Transit Technical Advisory Committee meeting is tentatively scheduled for November 30, 2016. * Attachment under separate cover
5.0 INFORMATION ITEMS
5.1 Trends in the SCAG Region 2005-2015 (Philip Law, Manager of Transit and Rail SCAG)
30
5.2 Imperial Valley College/San Diego State Transit Shuttle Analysis (Steve Fox, SCAG)
30
5.3 FY2013-14 Transit System Performance Report (Matt Gleason, SCAG )
30
6.0 STAFF UPDATE
6.1 FTA Transit Asset Management Final Rulemaking
6.2 RTTAC Chairperson Selection Discussion
5 5
ADJOURNMENT

Regional Transit Technical Advisory Committee (RTTAC) of the
Southern California Association of Governments
June 29, 2016
Minutes
THE FOLLOWING MINUTES ARE A SUMMARY OF ACTIONS TAKEN BY THE REGIONAL TRANSIT TECHNICAL ADVISORY COMMITTEE (RTTAC). AN AUDIO RECORDING OF THE MEETING IS AVAILABLE FOR LISTENING IN SCAG’S OFFICE. The Regional Transit Technical Advisory Committee held its meeting at SCAG’s Downtown Los Angeles Office. The meeting was called to order by Philip Law, Acting Chair.
Members Present:
Kirk Schneider Caltrans District 7 Joyce Rooney Redondo Beach Transit Eric Hoch Santa Monica Big Blue Bus Video Conference:
Gary Hewitt Orange County Transportation Authority Claire Johnson-Winegar Gold Coast Transit Dietter Aragon Antelope Valley Transit Authority Victor Cuate Omnitrans Teleconference:
Shirley Hsiao Long Beach Transit SCAG Staff:
Philip Law Joseph Briglio Matthew Gleason Naresh Amatya Stephen Fox Sarah Jepson Arnold San Miguel David Salgado Evan Finlay
1.0 CALL TO ORDER
Philip Law, Acting Chair, called the meeting to order at 10:07 a.m.
2.0 PUBLIC COMMENT PERIOD
No members of the public requested to comment.
3.0 CONSENT CALENDAR
3.1 Approval Item
3.1.1 Minutes of the March 30, 2016 Regional Transit TAC Meeting
33

Regional Transit Technical Advisory Committee (RTTAC) – June 29, 2016
The Consent Calendar was approved by consensus.
4.0 RECEIVE AND FILE
4.1 Caltrans Section 5304 Sustainable Transportation Planning Grants
5.0 INFORMATION ITEMS
5.1 2017 Active Transportation Program Regional Guidelines
Sarah Jepson, SCAG Active Transportation and Special Programs Manager, provided an update on the Active Transportation Program Regional Guidelines. Ms. Jepson stated the Regional Guidelines outline the process and criteria for selecting the projects that will be awarded funding through SCAG’s regional share of the Active Transportation Program (ATP). It was noted there are three different funding programs within the ATP for which $240 million will be awarded in the current cycle. Further, 50% of the funding is awarded through a statewide competition, 10% is awarded to small urban and rural areas (awarded by the state), and 40% will be awarded by Metropolitan Planning Organizations. SCAG’s share is approximately $50 million. Funding awarded in the current cycle will be available in fiscal years 2019-2020 and 2020-2021. The goals of the program include increasing biking and walking trips, increase safety, ensure disadvantaged communities fully share in the benefits, provide a broad spectrum of projects and enhance public health and achieve greenhouse gas reduction goals. Additionally, three different project types are available for funding; planning, non-infrastructure (education, encouragement and enforcement programs) and infrastructure (bike lanes, cycle tracks, crosswalks). Ms. Jepson noted a call for projects will be announced for Planning and Capacity projects for new applicants only. Total funding available is $2.5 million and projects under $200,000 are sought. Eligible projects include First-Last Mile, Education and Encouragement campaigns and Open Streets and Demonstration projects. Next steps include finalizing the details for the Planning and Capacity call for proposals and preparing the application. The call for proposals date is tentatively scheduled for September 29, 2016 pending approval from the Regional Council. Recommendations will be brought to the Regional Council for approval February 2017 and to the California Transportation Commission March 2017. All interested entities are encouraged to submit proposals. David Salgado, SCAG, asked if “new applicants” are required to be completely new to the process or can previous applicants resubmit proposals. Ms. Jepson responded that new applicants are those who have not been successful in either the statewide or regional funding process. Joyce Rooney, Redondo Beach Transit, asked if bus stop improvements or those that connect to bike and pedestrian facilities are eligible for funding. Ms. Jepson responded that the infrastructure needs to directly support bike and pedestrian activities. Bus stop benches would not be eligible but bike racks and its associated infrastructure are eligible.
44

Regional Transit Technical Advisory Committee (RTTAC) – June 29, 2016
5.2 Santa Monica’s Big Blue Bus Service Restructuring
Eric Hoch, Santa Monica’s Big Blue Bus, reported on their bus service restructuring. Mr. Hoch stated the restructuring effort can be viewed as an Expo Line integration plan as light rail service has been extended to Santa Monica. It was noted the goals of the plan are to create a dense grid of north-south services, to have all routes connect to at least one Expo line station, to reduce service duplication, to improve speed and reliability and increase service on major corridors. Service modifications include six new routes implemented and three enhanced rapid corridors (Rapid 3 on Lincoln Blvd., Rapid 7 on Pico Blvd. and Rapid 12 on Westwood & Overland Blvd. serving UCLA.) In addition, seven routes were significantly changed, either shortened rerouted or extended. Four routes were eliminated and service to Santa Monica College and UCLA were enhanced. Mr. Hoch noted the changes were implemented in four stages as all at once change proved impractical. Overall the plan results in an 11% increase in service hours. Further, the base cash fare was increased January 2016 to fund the service increases. In addition to the service changes 230 new bus stops were installed and 250 stops removed. Routes will be re-examined one year after implementation to determine effectiveness and efficiency. Additionally, a late night demand service is available on Friday and Saturday nights where riders can utilize a taxi service for a fixed fee to complete their trip to or from the Expo line. To incentivize transit use a buy one get one free transit pass program is being offered to riders as well as a TAP card value match. Kirk Schneider, Caltrans, asked if there was an opportunity to provide early input into the Expo stations design as bus service could be better integrated into the facility layout. Mr. Hoch agreed that early input on bus service integration would benefit the process and subsequent service. Joyce Rooney, Redondo Beach Transit, asked if the program to provide matching value on TAP cards adds to the same card or is a separate card issued. Mr. Hoch responded that value is added to the passenger’s existing card. Philip Law, SCAG staff, asked if companies such as Uber and Lyft were considered for the late night demand service. Mr. Hoch responded that the desire for a fixed fee for riders was not conducive to the ride sharing companies’ format.
5.3 FY 2013-14 Transit System Performance Report
Matt Gleason, SCAG staff, reported on findings from the FY 2013-2014 Transit System Performance Report. Mr. Gleason noted the region is complex with 100 transit providers including 70 fixed route providers. Additionally, governance continues to evolve including a merger between Victor Valley Transit and Barstow Transit as well as new service in the Heritage Valley. It was noted per capita trip consumption grew in the mid 2000s then declined following the great recession. In
55

Regional Transit Technical Advisory Committee (RTTAC) – June 29, 2016
recent years it has increased to near 1991 levels. Average trip lengths have been growing particularly for demand response. The region’s overall performance is competitive compared with other regions employing bus and light rail. Mr. Gleason noted the goals of the System Performance Report are to provide a high level overall framework for understanding the region’s transit investments, as a resource for policy makers, as a benchmarking resource for operators, and to facilitate MAP-21 and FAST Act provisions. Mr. Gleason reviewed the findings noting total regional service hours was greater than 20 million reflecting growth in light rail and demand response. Per capita trips are up slightly. Per capita passenger miles remain unchanged and total trips are greater than 700 million. There has been growth in both total passenger miles travelled and per capita passenger miles travelled. Further, 73% of transit service is provided by bus, 6% by rail and 20% by demand response. It was noted the next steps include updating the non-NTD data sources, analyze data at the market sector level and look at current year measures instead of operator profiles which would facilitate better benchmarking. Gary Hewitt, OCTA, stated there is an inherent delay in NTD data reporting and noted data from a recent report on the first quarter of 2016 reflecting declining fixed route bus ridership both regionally and nationally. Mr. Hewitt noted declining bus ridership including an 8% decline for Long Beach Transit, 8% decline at LA Metro, 10% at OCTA, Santa Monica Big Blue Bus declined 13%, Norwalk Transit 12.6%, and Omnitrans declined 11%. Mr. Hewitt suggested that a standing agenda item on this trend may be useful and asked if there is any data that can be accessed that would help transit operators better understand the dynamics behind this trend so policy makers can be notified in a timely manner. Mr. Gleason responded that the next iteration of the report will integrate monthly reporting through summer 2016.
6.0 STAFF UPDATE
6.1 FTA/FHWA Metropolitan Planning Final Rulemaking Matt Gleason, SCAG staff, provided an update on FTA/FHWA Metropolitan Planning Final Rulemaking. Mr. Gleason stated on May 27, 2016 the Federal Highway Administration (FHWA) and Federal Transit Administration (FTA) jointly put forth a Final Rule on new statewide and Nonmetropolitan Transportation Planning and Metropolitan Transportation Planning. The Final Rule is intended to implement the changes to statewide and regional planning mandated by MAP-21 and the FAST Act. It was noted the rulemaking sets out the process by which MPO’s will coordinate with transit operators in setting performance measures and performance targets for the metropolitan planning process. It establishes timelines by which the state has to establish performance targets which is one year after the adoption of the rule.
66

Regional Transit Technical Advisory Committee (RTTAC) – June 29, 2016
Additionally, it establishes a timeline by which MPO’s have to incorporate those targets and performance measures into their plans and programs. Further, any statewide program enacted within two years of the adoption of the final rule would be required to be consistent with and incorporate those performance targets. Philip Law, SCAG staff, further noted transit agencies would need to establish a Public Transportation Agency Safety Plan which must include performance targets. This is to be done within one year of the effective date of the final rule. Additionally, once rulemaking is put forth on state of good repair transit agencies would have two years to establish a Transit Asset Management Plan which also must include performance targets. Subsequently, MPOs would establish performance targets and coordinate with public transit operators.
6.2 RTTAC Chairperson Selection Discussion Matt Gleason, SCAG staff, stated current committee Chairperson, Wayne Wassell, has served the committee well for years and it is felt this would be an appropriate time to rotate the committee chairmanship. Committee members who are interested in serving as Chair are welcome to notify staff of their interest.
ADJOURNMENT
The meeting adjourned at 11:31 a.m.
77
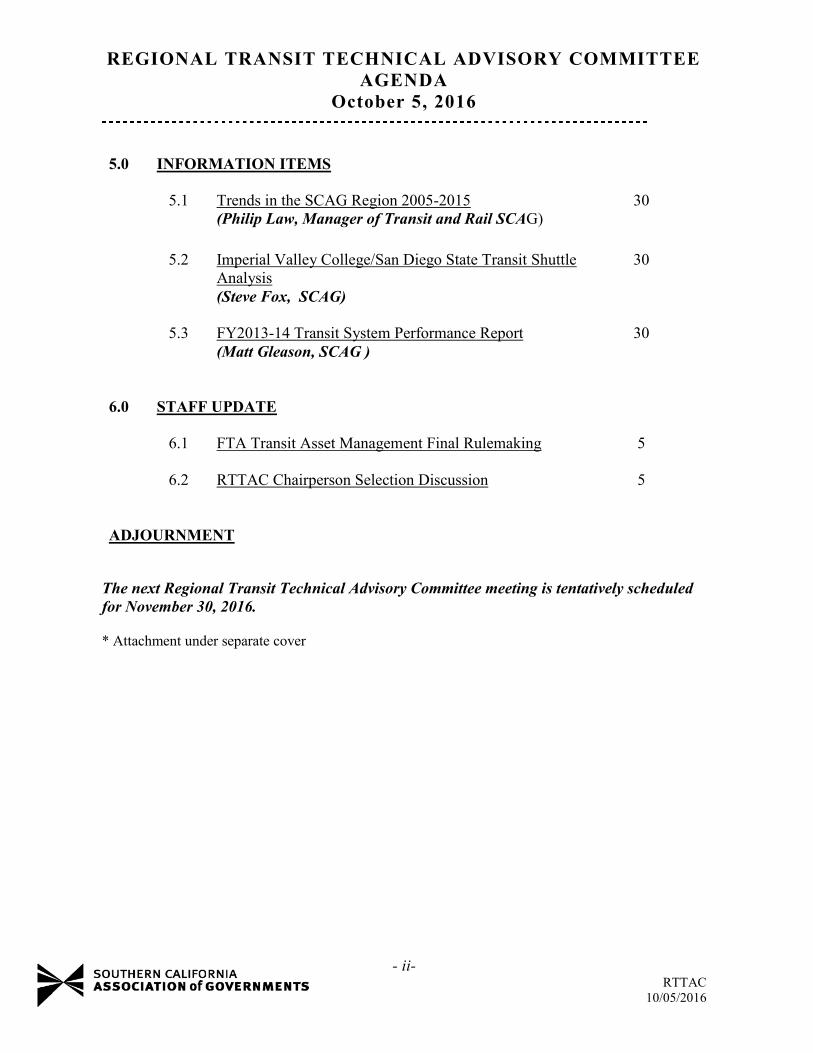
DATE: October 5, 2016
TO: Regional Transit Technical Advisory Committee
FROM: Matt Gleason, Senior Regional Planner, 213-236-1832 [email protected]
SUBJECT: Caltrans Section 5304 Sustainable Transportation Planning Grants
EXECUTIVE SUMMARY: A key aspect of the Transit / Rail department’s annual work effort is the management and oversight of Caltrans Sustainable Communities planning grants. Typically in previous fiscal years, local agencies applied to Caltrans as a subrecipient, and SCAG served as the recipient, due to the agency’s executed master funds transfer agreement. Attached is a matrix overview of the grant projects completed in Fiscal Year 2015-16. BACKGROUND: A key aspect of the Transit / Rail department’s annual work effort is the management and oversight of Caltrans Sustainable Communities planning grants. In previous fiscal years, local agencies typically applied to Caltrans as a subrecipient, and SCAG served as the recipient, due to the agency’s executed master funds transfer agreement with the Caltrans Headquarters Office of Regional and Interagency Planning (ORIP). Attached is a matrix overview of the grant projects completed in Fiscal Year 2015-16. Sustainable Communities Grants. Sustainable Communities grants are funded by the Federal Transit Administration (FTA) Section 5304 and State Highway Account funds. This grant program replaced the Statewide Urban Transit Planning Studies, Rural or Urban Transit Planning Studies, and Transit Planning Student Internship programs in FY 2014-15. The studies in the completed projects were primarily funded through the older programs. The Sustainable Communities Grants fund transportation planning projects that achieve the Caltrans Mission and Grant Program Overarching Objectives, identify and address mobility deficiencies in the multimodal transportation system, encourage stakeholder collaboration, involve active public engagement, integrate Smart Mobility 2010 concepts, and ultimately result in programmed system improvements. Caltrans recently released the FY 2017-18 Sustainable Transportation Planning Grant Application Guide (http://www.dot.ca.gov/hq/tpp/grants/GrantGuideFY2017-18.pdf ). A total of $9.3 million is available for transportation planning projects statewide. Grant applications are due Friday, November 4, 2016 by 5 PM. Appropriate District staff are listed in the Grant Application Guide to contact if there are any questions about developing a competitive grant application. Eligible primary applicants include Metropolitan Planning Organizations, Regional Transportation Planning Agencies, cities and counties, transit agencies, and Native American Tribal Governments.
88

Example Project Types, as identified by Caltrans, include:
Studies that advances a community’s effort to reduce transportation related greenhouse gases
Studies that assist transportation agencies in creating sustainable communities
Studies that advances a community’s effort to address the impacts of climate change and sea level rise
Community to school studies or safe routes to school studies or plans
Jobs and affordable housing proximity studies
Context-sensitive streetscapes or town center plans
Complete street plans Bike and pedestrian safety enhancement
plans Traffic calming and safety enhancement
plans
Corridor enhancement studies Health equity transportation studies Climate change adaptation plans for
transportation facilities Transit planning surveys and research Identification of policies, strategies, and
programs to preserve transit facilities and optimize transit infrastructure
Studies that evaluate accessibility and connectivity of the multimodal transportation network
Short-range transit development plans Transit marketing plans Social service improvement studies Student Internships (Only for Rural
Agencies) Studies that address environmental justice
issues in a transportation related context
Attached is a matrix containing an overview of the grant projects completed in Fiscal Year 2015-16. ATTACHMENT: Attachment A: Caltrans Section 5304 Sustainable Transportation Planning Completed Grants
99

1010
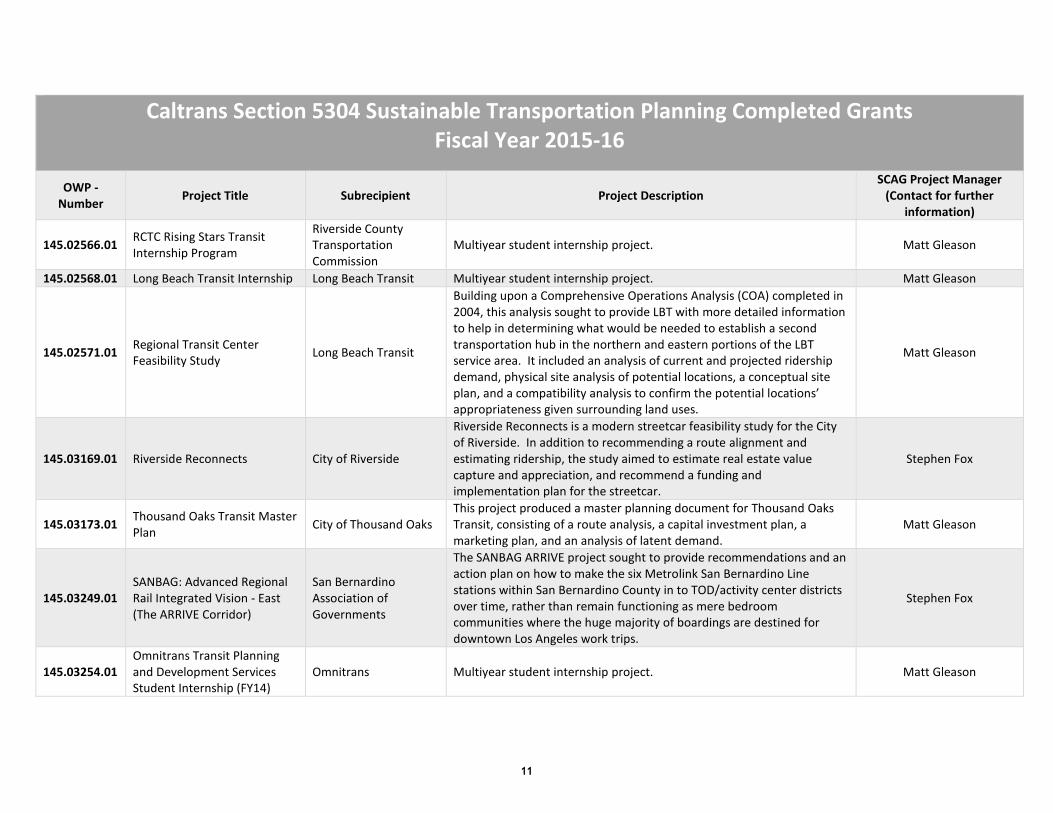
Caltrans Section 5304 Sustainable Transportation Planning Completed Grants Fiscal Year 2015-16
OWP - Number
Project Title Subrecipient Project Description SCAG Project Manager
(Contact for further information)
145.02566.01 RCTC Rising Stars Transit Internship Program
Riverside County Transportation Commission
Multiyear student internship project. Matt Gleason
145.02568.01 Long Beach Transit Internship Long Beach Transit Multiyear student internship project. Matt Gleason
145.02571.01 Regional Transit Center Feasibility Study
Long Beach Transit
Building upon a Comprehensive Operations Analysis (COA) completed in 2004, this analysis sought to provide LBT with more detailed information to help in determining what would be needed to establish a second transportation hub in the northern and eastern portions of the LBT service area. It included an analysis of current and projected ridership demand, physical site analysis of potential locations, a conceptual site plan, and a compatibility analysis to confirm the potential locations’ appropriateness given surrounding land uses.
Matt Gleason
145.03169.01 Riverside Reconnects City of Riverside
Riverside Reconnects is a modern streetcar feasibility study for the City of Riverside. In addition to recommending a route alignment and estimating ridership, the study aimed to estimate real estate value capture and appreciation, and recommend a funding and implementation plan for the streetcar.
Stephen Fox
145.03173.01 Thousand Oaks Transit Master Plan
City of Thousand Oaks This project produced a master planning document for Thousand Oaks Transit, consisting of a route analysis, a capital investment plan, a marketing plan, and an analysis of latent demand.
Matt Gleason
145.03249.01 SANBAG: Advanced Regional Rail Integrated Vision - East (The ARRIVE Corridor)
San Bernardino Association of Governments
The SANBAG ARRIVE project sought to provide recommendations and an action plan on how to make the six Metrolink San Bernardino Line stations within San Bernardino County in to TOD/activity center districts over time, rather than remain functioning as mere bedroom communities where the huge majority of boardings are destined for downtown Los Angeles work trips.
Stephen Fox
145.03254.01 Omnitrans Transit Planning and Development Services Student Internship (FY14)
Omnitrans Multiyear student internship project. Matt Gleason
1111

Transit Performance Measures in California
MTI Report 12-58
Funded by U.S. Department of Transportation and California Department of Transportation
MT
I2012 C
ensus of California W
ater Transit ServicesM
TI Report 12-02
Decem
ber 2012
1212

The Mineta Transportation Institute (MTI) was established by Congress in 1991 as part of the Intermodal Surface Transportation Equity Act (ISTEA) and was reauthorized under the Transportation Equity Act for the 21st century (TEA-21). MTI then successfully competed to be named a Tier 1 Center in 2002 and 2006 in the Safe, Accountable, Flexible, Efficient Transportation Equity Act: A Legacy for Users (SAFETEA-LU). Most recently, MTI successfully competed in the Surface Transportation Extension Act of 2011 to be named a Tier 1 Transit-Focused University Transportation Center. The Institute is funded by Congress through the United States Department of Transportation’s Office of the Assistant Secretary for Research and Technology (OST-R), University Transportation Centers Program, the California Department of Transportation (Caltrans), and by private grants and donations.
The Institute receives oversight from an internationally respected Board of Trustees whose members represent all major surface transportation modes. MTI’s focus on policy and management resulted from a Board assessment of the industry’s unmet needs and led directly to the choice of the San José State University College of Business as the Institute’s home. The Board provides policy direction, assists with needs assessment, and connects the Institute and its programs with the international transportation community.
MTI’s transportation policy work is centered on three primary responsibilities:
MINETA TRANSPORTATION INSTITUTE
Research MTI works to provide policy-oriented research for all levels of government and the private sector to foster the development of optimum surface transportation systems. Research areas in-clude: transportation security; planning and policy development; interrelationships among transportation, land use, and the environment; transportation finance; and collaborative labor-management relations. Certified Research Associates conduct the research. Certification requires an advanced degree, gener-ally a Ph.D., a record of academic publications, and profession-al references. Research projects culminate in a peer-reviewed publication, available both in hardcopy and on TransWeb, the MTI website (http://transweb.sjsu.edu).
Education The educational goal of the Institute is to provide graduate-lev-el education to students seeking a career in the development and operation of surface transportation programs. MTI, through San José State University, offers an AACSB-accredited Master of Science in Transportation Management and a graduate Certifi-cate in Transportation Management that serve to prepare the na-tion’s transportation managers for the 21st century. The master’s degree is the highest conferred by the California State Uni-versity system. With the active assistance of the California
Department of Transportation, MTI delivers its classes over a state-of-the-art videoconference network throughout the state of California and via webcasting beyond, allowing working transportation professionals to pursue an advanced degree regardless of their location. To meet the needs of employers seeking a diverse workforce, MTI’s education program promotes enrollment to under-represented groups.
Information and Technology Transfer MTI promotes the availability of completed research to professional organizations and journals and works to integrate the research findings into the graduate education program. In addition to publishing the studies, the Institute also sponsors symposia to disseminate research results to transportation professionals and encourages Research Associates to present their findings at conferences. The World in Motion, MTI’s quarterly newsletter, covers innovation in the Institute’s research and education pro-grams. MTI’s extensive collection of transportation-related publications is integrated into San José State University’s world-class Martin Luther King, Jr. Library.
The contents of this report reflect the views of the authors, who are responsible for the facts and accuracy of the information presented herein. This document is disseminated under the sponsorship of the U.S. Department of Transportation, University Transportation Centers Program and the California Department of Transportation, in the interest of information exchange. This report does not necessarily reflect the official views or policies of the U.S. government, State of California, or the Mineta Transportation Institute, who assume no liability for the contents or use thereof. This report does not constitute a standard specification, design standard, or regulation.
DISCLAIMER
MTI FOUNDER Hon. Norman Y. Mineta
MTI BOARD OF TRUSTEESFounder, Honorable Norman Mineta (Ex-Officio)Secretary (ret.), US Department of TransportationVice ChairHill & Knowlton, Inc.
Honorary Chair, Honorable Bill Shuster (Ex-Officio)ChairHouse Transportation and Infrastructure CommitteeUnited States House of Representatives
Honorary Co-Chair, Honorable Peter DeFazio (Ex-Officio)Vice ChairHouse Transportation and Infrastructure CommitteeUnited States House of Representatives
Chair, Nuria Fernandez (TE 2017)General Manager and CEOValley Transportation Authority
Vice Chair, Grace Crunican (TE 2016)General ManagerBay Area Rapid Transit District
Executive Director, Karen Philbrick, Ph.D.Mineta Transportation InstituteSan José State University
Joseph Boardman (Ex-Officio)Chief Executive OfficerAmtrak
Anne Canby (TE 2017)DirectorOneRail Coalition
Donna DeMartino (TE 2018)General Manager and CEOSan Joaquin Regional Transit District
William Dorey (TE 2017)Board of DirectorsGranite Construction, Inc.
Malcolm Dougherty (Ex-Officio)DirectorCalifornia Department of Transportation
Mortimer Downey* (TE 2018)PresidentMort Downey Consulting, LLC
Rose Guilbault (TE 2017)Board MemberPeninsula Corridor Joint Powers Board (Caltrain)
Ed Hamberger (Ex-Officio)President/CEOAssociation of American Railroads
Steve Heminger* (TE 2018)Executive DirectorMetropolitan Transportation Commission
Diane Woodend Jones (TE 2016)Principal and Chair of BoardLea+Elliot, Inc.
Will Kempton (TE 2016)Executive DirectorTransportation California
Art Leahy (TE 2018)CEOMetrolink
Jean-Pierre Loubinoux (Ex-Officio)Director GeneralInternational Union of Railways (UIC)
Michael Melaniphy (Ex-Officio)President and CEOAmerican Public Transportation Association (APTA)
Abbas Mohaddes (TE 2018)CEOThe Mohaddes Group
Jeff Morales (TE 2016)CEOCalifornia High-Speed Rail Authority
David Steele, Ph.D. (Ex-Officio)Dean, College of BusinessSan José State University
Beverley Swaim-Staley (TE 2016)PresidentUnion Station Redevelopment Corporation
Michael Townes* (TE 2017)Senior Vice PresidentTransit Sector, HNTB
Bud Wright (Ex-Officio)Executive DirectorAmerican Association of State Highway and Transportation Officials (AASHTO)
Edward Wytkind (Ex-Officio)PresidentTransportation Trades Dept., AFL-CIO
(TE) = Term Expiration or Ex-Officio* = Past Chair, Board of Trustee
Karen Philbrick, Ph.D.Executive Director
Hon. Rod Diridon, Sr.Emeritus Executive Director
Peter Haas, Ph.D.Education Director
Donna MaurilloCommunications Director
Brian Michael JenkinsNational Transportation Safety and Security Center
Asha Weinstein Agrawal, Ph.D.National Transportation Finance Center
Asha Weinstein Agrawal, Ph.D.Urban and Regional Planning San José State University
Jan Botha, Ph.D.Civil & Environmental EngineeringSan José State University
Katherine Kao Cushing, Ph.D.Enviromental Science San José State University
Dave Czerwinski, Ph.D.Marketing and Decision Science San José State University
Frances Edwards, Ph.D.Political Science San José State University
Taeho Park, Ph.D.Organization and Management San José State University
Diana WuMartin Luther King, Jr. LibrarySan José State University
Directors Research Associates Policy Oversight Committee
1313

A publication of
Mineta Transportation InstituteCreated by Congress in 1991
College of BusinessSan José State UniversitySan José, CA 95192-0219
REPORT 12-58
TRANSIT PERFORMANCE MEASURES IN CALIFORNIA
Caroline Rodier, Ph.D.Emily Issac
April 2016
1414

TECHNICAL REPORT DOCUMENTATION PAGE
1. Report No. 2. Government Accession No. 3. Recipient’s Catalog No.
4. Title and Subtitle 5. Report Date
6. Performing Organization Code
7. Authors 8. Performing Organization Report
9. Performing Organization Name and Address 10. Work Unit No.
11. Contract or Grant No.
12. Sponsoring Agency Name and Address 13. Type of Report and Period Covered
14. Sponsoring Agency Code
15. Supplemental Notes
16. Abstract
17. Key Words 18. Distribution Statement
19. Security Classif. (of this report) 20. Security Classif. (of this page) 21. No. of Pages 22. Price
Form DOT F 1700.7 (8-72)
45
CA-MTI-16-1208
Transit Performance Measures in California April 2016
MTI Report 12-57Caroline Rodier, Ph.D. and Emily Issac
Mineta Transportation Institute College of Business San José State University San José, CA 95192-0219
California Department of TransportationDivision of Research, Innovation and Systems InformationMS-42, PO Box 942873Sacramento, CA 94273-0001
U.S. Department of TransportationOffice of the Assistant Secretary for Research and TechnologyUniversity Transportation Centers Program1200 New Jersey Avenue, SEWashington, DC 20590
Final Report
UnclassifiedUnclassified
No restrictions. This document is available to the public through The National Technical Information Service, Springfield, VA 22161
DTRT12-G-UTC21
$15.00
Transit performance measures; Transit data; Metropolitan Planning Organizations; Caltrans; Transit planning
This research is the result of a California Department of Transportation (Caltrans) request to assess the most commonly available transit performance measures in California. Caltrans wanted to understand performance measures and data used by Metropolitan Planning Organizations (MPOs) and transit agencies to help it develop statewide measures. This report serves as a summary reference guide to help Caltrans understand the numerous and diverse performance measures used by MPOs and transit agencies in California. First, investigators review the available literature to identify a complete transit performance framework for the purposes of organizing agency measures, metrics, and data sources. Next, they review the latest transit performance measures documented in planning reports for the four largest MPOs in California (San Francisco Bay Area, Los Angeles, San Diego, and Sacramento). Researchers pay special attention to the transit performance measures used by these MPOs, because these measures are available for the majority of California’s population. Finally, investigators summarize 231 performance measures used by a total 26 local transit agencies in the State of California, based on transit planning documents available on the internet.
1515

To order this publication, please contact:
Mineta Transportation Institute College of Business
San José State University San José, CA 95192-0219
Tel: (408) 924-7560 Fax: (408) 924-7565
Email: [email protected]
transweb.sjsu.edu
by Mineta Transportation Institute All rights reserved
Library of Congress Catalog Card Number:
Copyright © 2016
2016939417
0425161616

Mineta Transportat ion Inst i tute
iv
ACKNOWLEDGMENTS
The authors thank the Mineta Transportation Institute and the California Department of Transportation for funding this work. Thanks also for Dr. Richard Lee for his support of this research report. All errors are those of the authors.
The authors thank MTI staff, including Executive Director Karen Philbrick, Ph.D.; Publication Support Coordinator Joseph Mercado; Executive Administrative Assistant Jill Carter; and Editor and Webmaster Frances Cherman.
1717
Mineta Transportat ion Inst i tute
v
TABLE OF CONTENTS
Executive Summary 1
I. Introduction 4
II. Literature Review 5Data Sources 5Performance Measures 9
III. California Metropolitan Planning Organizations 20General Findings 20Southern California Association of Governments (SCAG) 22San Diego Association of Governments (SANDAG) 24Sacramento Area Council of Governments (SACOG) 25Metropolitan Transportation Commission (MTC) 26
IV. California Transit Agencies 27
V. Conclusion 30
Appendix A: Description of Key National Transit Database (Performance Measure Data) 33
Abbreviations and Acronyms 36
Endnotes 37
Bibliography 41
About the Authors 44
Peer Review 45
1818

Mineta Transportat ion Inst i tute
vi
LIST OF FIGURES
1. Transit Agencies: Frequency of Measures by Performance Categories 28
1919

Mineta Transportat ion Inst i tute
vii
LIST OF TABLES
1. Service Availability 10
2. Service Delivery 11
3. Safety and Security 13
4. Community Impact 14
5. Maintenance 16
6. Financial Performance 18
7. Agency Administration 19
8. Consolidated MPO Measures and Metrics by MPO 21
9. SCAG Regional-Level Performance Analysis 22
10. SCAG Agency-Level Transit Measures 23
11. SCAG Regional Transportation Plan Transit Measures 23
12. SANDAG Transit Performance 25
13. SACOG Transit Performance 25
14. MTC Transit Performance 26
15. Frequency of Performance Measures by Category for Transit Agencies 29
2020

Mineta Transportat ion Inst i tute
1
EXECUTIVE SUMMARY
This research is the result of a California Department of Transportation request to assess the most commonly available transit performance measures in California. Caltrans wanted to understand the transit performance measures currently used by Metropolitan Planning Organizations (MPOs) and transit agencies to help develop its own. In sum, this report serves as a summary reference guide to help Caltrans understand the numerous and diverse performance measures used by MPOs and transit agencies in California.
The first phase of this research involved a review of the available transit performance measure guidance publications. The goal was to identify a complete framework (categories, example metrics, and data) within which to organize this review of California agency measures. The investigators found the Transportation Research Board’s TCRP Report 88, A Guidebook for Developing a Transit Performance-Measurement System (TCRP, 2003)1 to be consistent with and more comprehensive than other more recent and older published guidance documents. Researchers identified the following key transit performance measures for use in this report:
• Service Availability: Ease of transit access based on where (service coverage and/or stop accessibility), how often (frequency), and how long (hours of service) service is provided.
• Service Delivery: Quality of passengers’ day-to-day experiences using transit, such as service reliability, quality of customer service, and passenger comfort.
• Safety and Security: Likelihood that an accident will occur involving passengers or that a passenger will become the victim of a crime while using transit. Examples include the rate of accidents per specified distance, the injury accidents per passenger- miles, and quantity of safety devices and personnel.
• Community Impact: Quality-of-life impacts on the communities served by transit such as mobility, job access, economic growth and productivity, personal finances, pollution reductions, and equitability of transit service.
• Financial Performance: How efficiently agencies use resources to meet travel demand within their budget constraints.
• Agency Administration: Administrative efficiency, including employee productivity, employee relations, workdays lost due to injury, and efficiency of service delivery (i.e., vehicle miles per employee or cost of administrative staff to operations staff).
Major sources of data for these performance measures include the following:
• In-house: Data that transit agencies normally have on hand through good record-keeping – for example, schedule data, system maps, service design standards, dispatch logs, maintenance records, operations logs, accident and incident records, financial data, fleet data, employee records, and complaint records.
2121

Mineta Transportat ion Inst i tute
2Executive Summary
• National Transit Database (NTD): Primary source for data, information, and statistics on the U.S. transit systems. Reporting required by those receiving Urbanized Area Formula Program (Section 5307) or Rural Area Formula Program (Section 5311) grants. Data examples include service area, agency information, fleet information, capital and operating funds, costs and expenses, maintenance, safety, service provided and consumed, and energy consumption.
• Other local, state, and federal agencies: Information on external factors that help evaluate the quality and location of transit service: demographic data, traffic data, GIS data, and transportation planning models.
Automated systems: Technology that improves data accuracy and completeness, timeliness of reporting, and data collection costs: automatic vehicle location (AVL), train control systems, automatic passenger counters (APC), and electronic fareboxes.
Next, investigators examined the use of performance measures in recent reports and publications by the four major California metropolitan planning organizations (MPOs). The MPOs include:
• Southern California Association of Governments (SCAG);
• San Diego Association of Governments (SANDAG);
• Sacramento Area Council of Governments (SACOG);
• San Francisco Bay Area Metropolitan Transportation Commission (MTC).
The measures provided by these MPOs provide the most comprehensive and consistent source of transit performance measure data in California. In other words, these measures are available for a majority of the population of California and, as a result, Caltrans may be particularly interested in these measures as they consider the availability of data and the development of measures for the State of California.
The MPOs studied in this report together evaluate 40 different measures. Nearly half of the performance measures collected by the MPOs measure financial performance.
• Service Availability: All MPOs measured service availability – coverage by SANDAG, SCAG, and SACOG, frequency by SCAG and SANDAG, hours of service by SANDAG and SCAG, and stop accessibility by SANDAG stop accessibility.
• Service Delivery: SANDAG used several measures of service delivery, including missed trips, on-time performance, and passenger load, as well as a measure of passenger environment. SCAG used relative measures of auto and transit travel time.
• Community Impact: All MPOs measured community impacts. SANDAG used demo-graphic data to evaluate service to low-income, elderly, and disabled populations; SCAG, SANDAG, and SACOG examined travel times and/or distance between
2222

Mineta Transportat ion Inst i tute
3Executive Summary
origin and destination locations; and SACOG included service equitability.
• Maintenance: SCAG examined the average age of the transit fleet.
• Financial Performance: All MPOs conducted numerous measures of financial performance – including ridership, productivity, cost-effectiveness, and cost-efficiency.
• Agency Administration: MTC included an administrative performance measure.
The last step of this project was to evaluate the most recent transit agency planning documents in California, based on an internet search. Investigators reviewed documents from 26 transit agencies, which, in total, included 231 performance measures. Researchers found that the most frequently measured category was financial and, within that category, that the top three measures were farebox recovery, passenger trips per vehicle revenue or service hours, and cost per vehicle revenue or service hour. Delivery was the next most frequent performance measure category, and its top measures were on-time performance, responsiveness to calls, number of complaints, and missed trips. Safety measures, such as accidents, crime, and injuries, were also evaluated by some agencies. Less frequently evaluated measures include availability, maintenance, and administrative measures.
Not surprisingly, it appears that when agencies have data they use that data to measure transit performance. The data mandated for National Transit Data, especially financial data, are commonly used to evaluate transit performance by both MPOs and transit agencies. Performance measures also seem to align with agency goals. Transit agency measures tend to focus more on issues related to customer service, whereas MPOs measures focus more on overall scope, location, quality, and equitability of transit service.
2323

Mineta Transportat ion Inst i tute
4
I. INTRODUCTION
This research is the result of a California Department of Transportations’ (Caltrans) request to assess the most commonly available transit performance measures in California. Caltrans wanted to understand performance measures and data used by Metropolitan Planning Organizations (MPOs) and transit agencies to help them develop statewide transit performance measures. In sum, this report serves as a summary reference guide to help Caltrans understand the numerous and diverse performance measures used by MPOs and transit agencies in California. The report consists of three key elements:
1. A review of the available literature to identify a complete framework of the types of transit performance measures available for the purpose of organizing transit performance measures produced by California agencies and the sources of data available to calculate these measures.
2. A discussion of the latest transit performance measures for the four largest MPOs in California (San Francisco Bay Area, Los Angeles, San Diego, and Sacramento). Investigators paid special attention to the transit performance measures used by these MPOs, because these measures are available for the majority of California’s population.
3. A summary of transit measures from 26 local transit agencies in the State of California based on a search of the internet for transit-planning documents.
2424

Mineta Transportat ion Inst i tute
5
II. LITERATURE REVIEW
Investigators reviewed the literature to develop a framework for organizing the numerous and diverse transit performance measures produced by California agencies. To this end, researchers searched the internet for sources that provided comprehensive transit performance frameworks. Research on new specific performance measures is outside of the scope of this project. Investigators found that the Transportation Research Board’s TCRP Report 88, A Guidebook for Developing a Transit Performance-Measurement System2 (hereafter TCRP Report 88) was consistent with frameworks in other publications and the most comprehensive work on the topic. As a result, that report is a major source for this literature review. The review included guidance from the Florida Department of Transportation,3 Best Practices in Evaluating Transit Performance from the Colorado Department of Transportation,4 a TRB conference report on the use of performance measures,5 and a report on digital software tools for analyzing the National Transit Database.6
TCRP Report 88 identifies and provides a detailed summary of over 400 transit performance measures. The report narrows down its index of the 400 transit performance measures by providing recommended core performance measures and categories specific to fixed-route and demand-response services. As presented in section 2.2, these core performance measures and their categories have been adapted for the purposes of this report to provide a framework with which to organize the performance measures used by California agencies.
Based on the reviewed literature, the following sections provide guidance to agencies on the major data sources from which transit agencies can calculate performance metrics (section 2.1) and the major categories under which recommended performance measures and metrics fall (section 2.2). Note that these sections are drawn from TCRP 88 unless otherwise specified.
DATA SOURCES
TCRP Report 88 describes the major data sources from which transit agencies can access the data required to calculate various performance measures. These sources include:
• In-house data;
• National Transit Database;
• Other local, state, and federal agencies;
• Automated systems;
• Manual data collection;
• Surveys; and
• Safety reviews.
2525
Mineta Transportat ion Inst i tute
6Literature Review
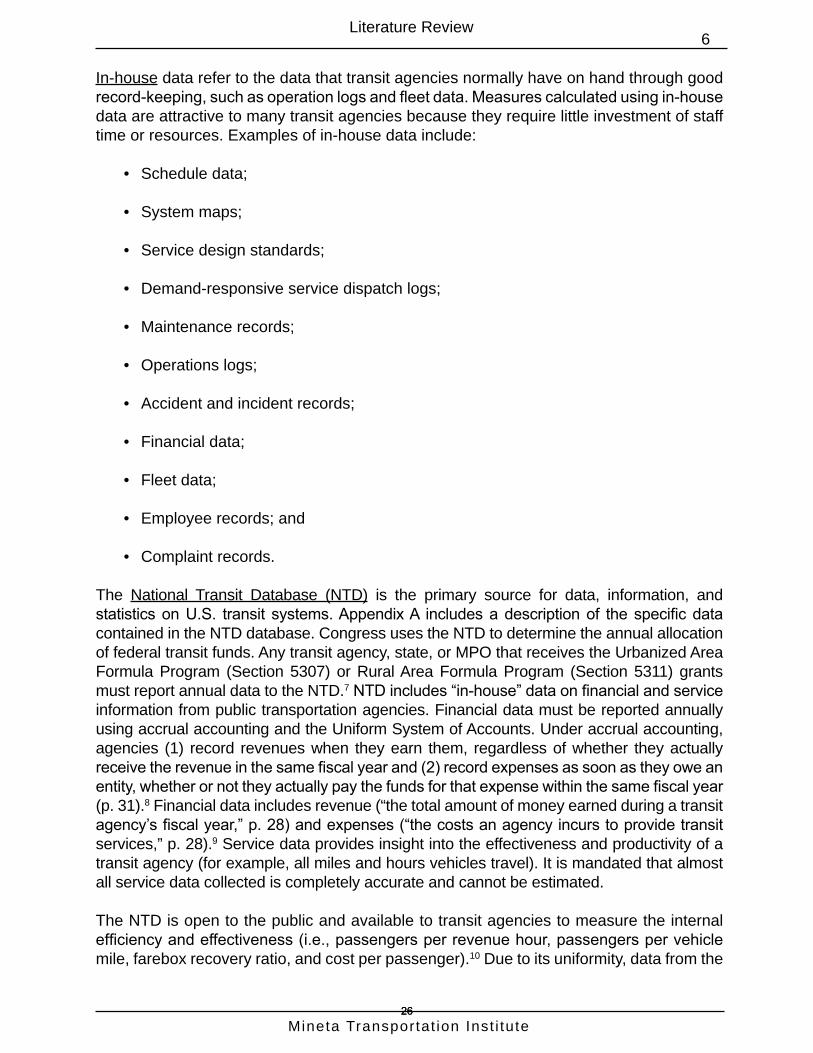
In-house data refer to the data that transit agencies normally have on hand through good record-keeping, such as operation logs and fleet data. Measures calculated using in-house data are attractive to many transit agencies because they require little investment of staff time or resources. Examples of in-house data include:
• Schedule data;
• System maps;
• Service design standards;
• Demand-responsive service dispatch logs;
• Maintenance records;
• Operations logs;
• Accident and incident records;
• Financial data;
• Fleet data;
• Employee records; and
• Complaint records.
The National Transit Database (NTD) is the primary source for data, information, and statistics on U.S. transit systems. Appendix A includes a description of the specific data contained in the NTD database. Congress uses the NTD to determine the annual allocation of federal transit funds. Any transit agency, state, or MPO that receives the Urbanized Area Formula Program (Section 5307) or Rural Area Formula Program (Section 5311) grants must report annual data to the NTD.7 NTD includes “in-house” data on financial and service information from public transportation agencies. Financial data must be reported annually using accrual accounting and the Uniform System of Accounts. Under accrual accounting, agencies (1) record revenues when they earn them, regardless of whether they actually receive the revenue in the same fiscal year and (2) record expenses as soon as they owe an entity, whether or not they actually pay the funds for that expense within the same fiscal year (p. 31).8 Financial data includes revenue (“the total amount of money earned during a transit agency’s fiscal year,” p. 28) and expenses (“the costs an agency incurs to provide transit services,” p. 28).9 Service data provides insight into the effectiveness and productivity of a transit agency (for example, all miles and hours vehicles travel). It is mandated that almost all service data collected is completely accurate and cannot be estimated.
The NTD is open to the public and available to transit agencies to measure the internal efficiency and effectiveness (i.e., passengers per revenue hour, passengers per vehicle mile, farebox recovery ratio, and cost per passenger).10 Due to its uniformity, data from the
2626

Mineta Transportat ion Inst i tute
7Literature Review
NTD is useful for comparing performance across different transit agencies. Examples of the kind of data available from the NTD include:
• Service area characteristics (e.g., area and population);
• Agency type;
• Number of vehicles operated in annual maximum service;
• Sources of, and uses for, capital funds;
• Sources of, and uses for, operating funds;
• Labor hours and cost data;
• Overall agency income and expenses;
• Fleet information;
• Rail and maintenance infrastructure data;
• Directional route miles by bus facility type;
• Safety and security incidents;
• Amount of service provided (e.g., vehicle miles, vehicle hours, and service days);
• Amount of service consumed (e.g., unlinked trips and passenger miles [PM]); and
• Energy consumption.
The Lehman Center for Transportation Research at Florida International University developed software for the Florida DOT to assist in analyzing NTD data and to help select and compare peer agencies.11
Other local, state, and federal agencies can supply information on external factors that help evaluate the quality and location of transit service. This data include:
• Demographic data that typically include employment, population, and housing. Analysts use this data to calculate performance measures related to the number of people by attributes (e.g., income and ethnicity) by type of location (e.g., medical, employment, and education). The U.S. Census Bureau, MPOs, and/or city planning departments typically produce this data. Data from the census and transportation demand models can have relatively small units of analysis. Analysts will typically aggregate this data to different geographic scales, which include and exclude areas with and without transit service. One example is the number of people by attribute of interest (e.g., low-income or environmental justice) located within a quarter mile of a bus stop.
2727

Mineta Transportat ion Inst i tute
8Literature Review
• Traffic data, often available from local public works departments and state Department of Transportations (DOTs), include daily traffic volumes, traffic speeds, sidewalk inventories, traffic signal timing information, and the number of lanes provided on the streets. Local planning, community development, and public works departments may also have information on sidewalk inventory and peak-period traffic volumes. These data are useful for measures that include mobility, travel time, pedestrian and bicycle access to transit stops, and vehicle and person capacity of transit operations.
• GIS Data are often available from planning organizations that already use GIS software in their operations. These data are useful for spatially analyzing data for measures of service coverage, route coverage, and service density. Analysts use GIS data, for example, to calculate actual walking paths to transit stops.
• Transportation planning models (or travel demand models) typically use demo-graphic and transportation data to forecast future travel patterns and demand. These models estimate the relative quantity and quality (i.e., travel time and cost) of transit and auto travel between specific areas of interest, and region-wide. This is another approach to evaluating the quality of transit service in a region. Such transit performance measures would use model data for a current calibrated base year. Similar measures are used to evaluate the future expected performance of regional transportation plans.
Automated systems help improve data accuracy and completeness, timeliness of reporting, and data collection costs.
• Automatic Vehicle Location (AVL) equipment tracks the real-time locations of AVL-equipped buses for dispatching. AVL collects and stores data about bus arrival and departure times at specified locations. Comparisons between scheduled and actual arrival and departure times can provide data for on-time performance measures.
• Train Control Systems maintain safe separations between trains, and provide data similar to that obtained from bus AVL systems. For instance, automatic train control systems that govern when doors open and close are coordinated with fixed- and moving-block signal systems to provide detailed dwell-time information.
• Automatic Passenger Counters (APC) automate the collection of passenger boarding and alighting data so that the number of people getting on and off at individual stops can be recorded. Useful data gathered through APC systems include:
◦ Stop, route, and system-level ridership;
◦ Maximum passenger loads and their locations;
◦ How long standing loads occur during a trip; and
◦ How often loads exceed a pre-determined level.
2828

Mineta Transportat ion Inst i tute
9Literature Review
• Electronic Fareboxes can provide information on ridership and trip patterns by recording passenger boardings and linked trips (trips involving one or more transfers). If integrated with an AVL system, magnetic fare cards or “smart cards” generate data on individuals’ transit travel. Electronic fareboxes that require an operator to press a button on the farebox as each passenger boards can result in errors if, for example, the operator fails to register a boarding, or presses the wrong button.
Manual Data Collection typically includes information on ridership and schedule reliability. Information collected may be less expensive to collect compared to that from automated systems, and is often sufficient for a small transit agency’s purposes. While manual data collection is typically accurate, a limited number of collected samples can cause sampling errors wherein data collected on one day is not representative of conditions in general. The TCRP 88 report identifies three main types of manual data collectors:
• Bus operators record the number of people getting on and off at a particular location. This is typical for demand-responsive systems and for smaller fixed-route systems.
• Traffic checkers are staff that either ride transit vehicles or stand at a location and record data such as arrival times, passenger boarding and alighting volumes, passenger loads, and dwell times. Medium and large fixed-route systems may use traffic checkers.
• Field supervisors record the arrival time of transit vehicles to calculate on-time performance and headway regularity.
Customer Satisfaction Surveys help transit agencies identify customer needs and preferences. They are also used to evaluate how well the transit service meets these needs and preferences, and where improvements can be made.
Safety Reviews of vehicle maintenance are important to identify safety problems before they result in an incident.
Passenger Environment Surveys track the cleanliness and ride comfort of transit.
PERFORMANCE MEASURES
The performance measures listed in the tables below are from the TCRP Report 88’s set of recommended core performance measures for fixed-route services (Chapter Five, p. 110).12 This set represents recommended measures that all transit agencies, at a minimum, would ideally measure to cover all perspectives on their performance. The TCRP Report 88 divides these recommended measures into seven categories. The categories are as follows:
1. Service Availability
2. Service Delivery
2929

Mineta Transportat ion Inst i tute
10Literature Review
3. Safety and Security
4. Community Impact
5. Maintenance
6. Financial Performance
7. Agency Administration
Information on each measure’s metrics and data requirements are from the individual performance measure descriptions offered in Chapter 6 of the Guidebook. The page number next to each measure in the table indicates the page of the Guidebook on which a detailed description of the measure can be found. The letter superscripts indicate which of the four California MPOs examined in this report use the same measures in their own performance monitoring programs. The four MPOs examined are the Southern California Association of Governments (SCAG); the San Diego Association of Governments (SANDAG); the Sacramento Area Council of Governments (SACOG); and the San Francisco Bay Area Metropolitan Transportation Commission (MTC). The last column of the chart indicates the data source for the measure, based on the major types of data sources identified by the TCRP Report 88 on pages 130-140.13
Service availability measures assess the ease with which passengers can use transit services based on where (service coverage and/or stop accessibility), how often (frequency), and how long (hours of service) service is provided. Service availability is a very important measure because transit is only an option if it is easily available to passengers. Service availability measures typically require in-house data, such a trip schedule, hours of operation, and transit stop locations, along with GIS software for information on walking paths to transit stops and information on the number of streets and intersections within an area.
Table 1. Service AvailabilityMeasure Metrics Data Requirements Data SourceService Coverage (p. 180) % area served by transit abc Transit stop locations
Walking paths to transit stops
In-houseGIS software
Frequency (p. 186) Transit vehicles per hour ac Scheduled Headways In-houseTime intervals between transit vehicles (headway) ac
Hours of Service (p. 187) How long service is provided during a day, measured by LOS threshold (for example, A=19-24 hours/day, B=17-18 hours/day, C=14-16 hours/day, D=12-13 hours/day, E=4-11 hours/day, F=0-3 hours/day) c
Hours of operation In-house
3030

Mineta Transportat ion Inst i tute
11Literature Review
Measure Metrics Data Requirements Data SourceStop Accessibility (p. 184)(how easily pedestrians/ bicyclists can access a transit stop from locations in the stop’s vicinity)
Pedestrian level of service Bicycle level of service Street crossing difficulty c % stops/stations ADA accessible c
% of park-and-ride-lot spaces filledNetwork Connectivity Index: number of links (i.e., street segments between intersections), divided by number of nodes (i.e., intersections) in a roadway system
Traffic volumesPedestrian/bicycle facility type/ width and distance between the facility and general traffic Detailed evaluation of conditions at/near a given stop (e.g., grades, lateral clearances, surface hardness, etc.)Number of parking spaces and counts in transit lotsInformation on the number of streets and intersections within an area
Local roadway agency or windshield survey;Outsourced evaluation;In-house information;Local roadway agency
SANDAG=a, SACOG=b, SCAG=c, MTC=d; Source: TCRP Report 88.
Service delivery measures evaluate the quality of passengers’ day-to-day experiences using transit, such as service reliability, the quality of customer service from agency staff, and passenger comfort. Simple service delivery measures (number of missed trips, complaint rate, and customer response time) require only good record-keeping on the part of the transit agency, such as regularly updated incident and compliance logs. However, most measures tend to require large amounts of data, such as extensive manual or automated data collections and customer satisfaction or passenger environment surveys. For instance, to evaluate the rate at which transit vehicles depart or arrive at a location on time requires either field surveys by traffic checkers or automatic vehicle location data.
Table 2. Service DeliveryMeasure Metric Data Requirements Data SourceMissed Trips (p. 211)
Number of trips removed from the daily schedule a
Schedule
Incidents/dispatch logs
In-house
Complaint rate (p. 218) The number of passenger complaints or compliments per unit of time, passengers, or trips
Service hours
Boardings, passengers
Documented complaints and compliments
In-house
Route directness (p. 265) Ratio of route length to the shortest-path length
Additional travel time/ distance compared to an auto making the same trip
Number of deviations
Transit travel time
Auto travel time
Number of deviations
Productivity
Distance between route and deviation target
Population and employment
GIS software, In-house, Traffic Data
Table 1, continued
3131

Mineta Transportat ion Inst i tute
12Literature Review
Measure Metric Data Requirements Data SourceOn-time performance (p. 206)
% transit vehicles departing or arriving at a location on time a
Field surveys or AVL data Manual Data Collection, AVL Data
Customer response time (p. 221)
How quickly, customer inquiries are addressed
Date and time of inquiry and response
In-house Data
Passenger load (p. 230) Passengers per seat a
Number of passengers at the maximum load point
%/number of trips with standees
Maximum number of standees PMT (passenger miles traveled) per seat miles
Passenger counts
Number of seats provided
Manual Data Collection or APC data, In-house Data
Area per passenger Passenger counts
Vehicle dimensions
Manual Data Collection or APC data, In-house Data
Standing time duration Passenger counts
Time information
Manual Data Collection or APC data, In-house Data
Reliability factor (p. 264)
% trips or travel time is no more than X% higher than average
Travel time/speed surveys or AVL data.
Manual Data Collection or AVL data
Transit/auto travel Time (p. 263)
Transit travel times vs. auto travel times c
Transit travel times (schedule data, AVL data, or field checks), auto travel times
In-house or AVL or Manual Data collection, Transportation Planning Models
Number of fare media sales outlets (p. 201)
% of daily trips made via fare card (e.g. MetroCard) purchased out-of-system
Records of sales outlets for transit fare media
Information that tracks fare card serial numbers and use
In-house
Customer satisfaction (p. 227)
An overall rating of customer satisfaction with a transit agency’s service (i.e., % customers “very satisfied”)
Market research based on statistically appropriate sampling plans, questionnaires, and analysis designs
Customer Satisfaction Surveys
Headway regularity (p. 209)
Service regularity: % of headways deviate no more than a specified amount of the scheduled.
Field surveys (e.g., by traffic checkers) or AVL data.
Manual Data Collection or AVL data
Passenger environment (p. 225)
An overall rating of potential passenger satisfaction while riding transit, based on evaluations of cleanliness, customer information, equipment, and operators
Trained checkers sent to collect data; customer surveys on their perceptions of the various categories and indicators.
Manual Data Collection
Customer Satisfaction Passenger Environment Survey
Customer loyalty (p. 229) % “secure” or “vulnerable” transit customers, based on a customer loyalty score
Customer ratings of overall satisfaction, likelihood to continue use and to recommend
Customer Satisfaction Surveys
SANDAG=a, SACOG=b, SCAG=c, MTC=d; Source: TCRP Report 88.
Table 2, continued
3232

Mineta Transportat ion Inst i tute
13Literature Review
Safety and security measures rate the likelihood that an accident will occur involving passengers or that a passenger will become the victim of a crime while using transit. Some examples of safety and security measures include the rate of accidents per specified distance and the injury accidents per passenger-miles. These measures only require in-house data, such as accident records and driver logs, and data recorded to the NTD, such as fatalities, injuries, and property damage. Transit agencies should note that comparisons of safety and security measures across different agencies might be difficult due to differences in reporting methods. Investigators found that safety and security measures were not represented in MPO data reviewed for this report, but that they are collected relatively frequently by transit agencies within MPO regions.
Table 3. Safety and SecurityMeasure Metric Data Requirement Data SourceAccident rate (p. 276)
Number of accidents per specified distance or time
Accident records
Odometers
Driver logs
In-house Data
Incidents of vandalism (p. 287)
Total number of cited criminal activity directed against transit property
Police reports
Repair records
In-house Data
Crime rate (p. 284) Number of crimes against passengers, agency staff, or transit property per year
Crime reports In-house Data
Number of vehicles with specified safety devices (p. 286)
Absolute number or % of vehicles equipped with specified safety devices such as security cameras, intercom systems, emergency alarms, and/or AVL equipment
Number of vehicles with specified devices
Total number of vehicles in fleet
In-house Data
Passenger safety (p. 277)
Fatal accidents per PMT/VMT (vehicle miles traveled)
Injury accidents per passenger-miles/VMT Property-damage-only accidents per PMT/VMT
Recorded data on fatalities, injuries, and property damage
NTD
Response time
Incident/accident durations
Incident/accident reports from law enforcement and the state department of motor vehicles
Other local and state agencies
Police officers per transit vehicle (p. 285)
On-board police officers or security staff per transit vehicle
Number of transit police officers, number of transit vehicles
In-house Data
Source: TCRP Report 88.
Community impact measures deal with quality-of-life impacts on the communities served by transit – such as mobility, job access, economic growth and productivity, personal finances (i.e., savings that individuals derive from choosing to use transit instead of driving), and pollution reductions. Community impact measures also evaluate how equitably transit services are distributed to communities throughout the region. Many community impact measures require access to data from MPOs or city planning departments, such as demographic data on car ownership or per-mile cost of operating an automobile. These
3333

Mineta Transportat ion Inst i tute
14Literature Review
measures likely require the use of GIS software and/or data from a regional transportation-planning model. The TCRP 88 strongly advises transit agencies to work in coordination with the local MPOs when developing community impact measures, and evaluating community impact measures annually or in association with a particular major transit project.
Table 4. Community ImpactMeasure Metric Data Requirement Data SourcePersonal economic impact (p. 249)
% of household income used for transit
Difference in transit and automobile out-of-pocket costs
Average fare
Average system user cost per trip
Average incomes
Average trips by mode
Average parking costs by area
Transit fare
Roadway toll
Cost of operating a car
Census data, travel demand models
Demographics (p. 240) % households without cars
% population too young to drive
% population with incomes under $X a
% elderly/disabled a
Demographic information for certain areas
Information on the areas served by transit agency
Census data
Communications
(p. 251) (How well transit agencies communicate)
Number of residents with positive transit perceptions and with knowledge of transit service
Information provision for persons with disabilities and non-English speakers
Community transit perceptions/knowledge
Number of brochures in alternative formats/ languages
Employee skills including languages
Surveys, In-house data
3434

Mineta Transportat ion Inst i tute
15Literature Review
Measure Metric Data Requirement Data SourceMobility (p. 236)
(The degree of ease of travel between origins and destinations)
Origin-destination travel times
Average speed a c or travel time
VMT b by congestion level
Relative delay rate
Roadway LOS or v/c ratios
Corridor mobility/travel index
Reliability
Travel time, speed, and VMT data by origin and destination
Surveys (O-D, home interview, roadside), In-house data, Traffic data
Congestion burden index % of workforce driving to work
Travel time/speed studies
Free-flow/acceptable-flow rates
VMT or PMT for freeways/arterials
Census Data, Traffic data from local roadway agency
Transportation choice ratio Hourly miles of transit service
Number of lane-miles of highways/ arterials
NTD, Federal Highway Administration
Service equity (p. 244)
Examining those who benefit from the project or service and those who are worse off (at the micro-level) b
Households with no autos
Population with physical disabilities, low-income single parents, people too young or old to drive, unemployed adults, and recent immigrants
GIS software, Labor statistics, Census, National Transportation Surveys, Focus groups, Interviews
Community economic impact (p. 247)
% state/regional gross product by transit
Expenditures by mode, tax revenues from transit
Cost of vehicle accidents
Highway capacity
Parking spaces in the absence of transit
Number of direct jobs in the transit industry in the area
Estimated roadway onstruction project costs
Tax revenue that is dedicated to transit
In-house data, MPOs, State and local taxing authorities
Table 4, continued
3535
Mineta Transportat ion Inst i tute
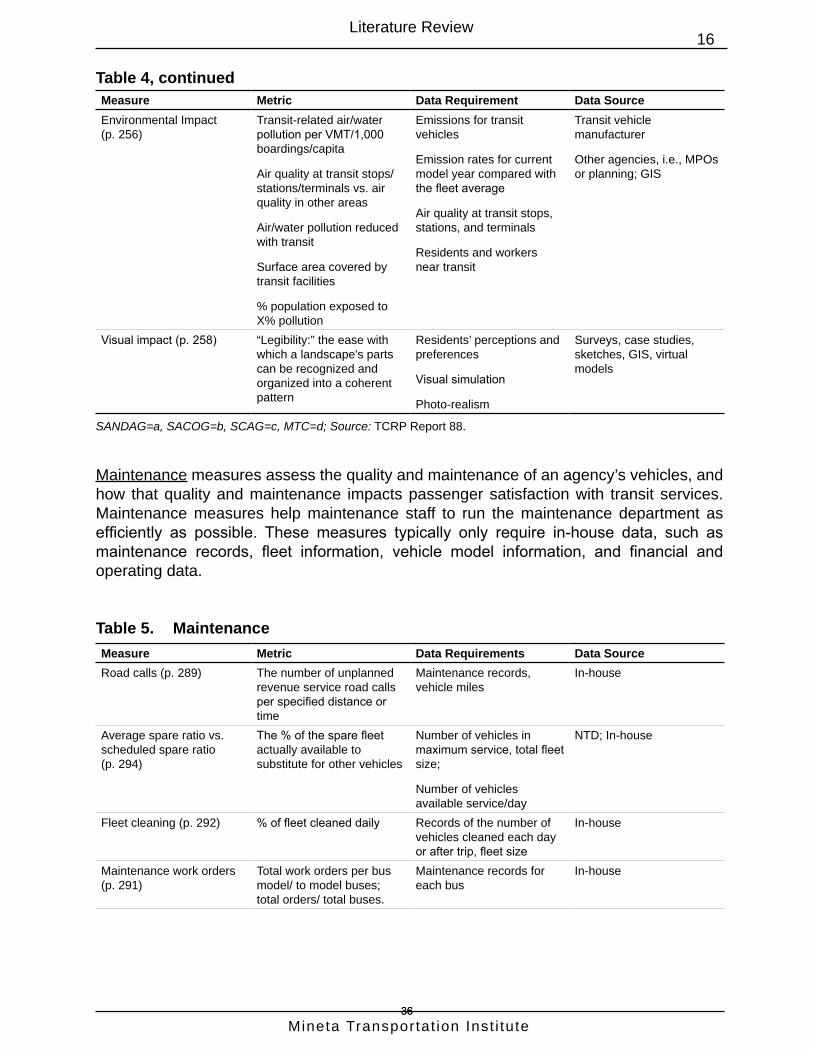
16Literature Review
Measure Metric Data Requirement Data SourceEnvironmental Impact (p. 256)
Transit-related air/water pollution per VMT/1,000 boardings/capita
Air quality at transit stops/stations/terminals vs. air quality in other areas
Air/water pollution reduced with transit
Surface area covered by transit facilities
% population exposed to X% pollution
Emissions for transit vehicles
Emission rates for current model year compared with the fleet average
Air quality at transit stops, stations, and terminals
Residents and workers near transit
Transit vehicle manufacturer
Other agencies, i.e., MPOs or planning; GIS
Visual impact (p. 258) “Legibility:” the ease with which a landscape's parts can be recognized and organized into a coherent pattern
Residents’ perceptions and preferences
Visual simulation
Photo-realism
Surveys, case studies, sketches, GIS, virtual models
SANDAG=a, SACOG=b, SCAG=c, MTC=d; Source: TCRP Report 88.
Maintenance measures assess the quality and maintenance of an agency’s vehicles, and how that quality and maintenance impacts passenger satisfaction with transit services. Maintenance measures help maintenance staff to run the maintenance department as efficiently as possible. These measures typically only require in-house data, such as maintenance records, fleet information, vehicle model information, and financial and operating data.
Table 5. MaintenanceMeasure Metric Data Requirements Data SourceRoad calls (p. 289) The number of unplanned
revenue service road calls per specified distance or time
Maintenance records, vehicle miles
In-house
Average spare ratio vs. scheduled spare ratio (p. 294)
The % of the spare fleet actually available to substitute for other vehicles
Number of vehicles in maximum service, total fleet size;
Number of vehicles available service/day
NTD; In-house
Fleet cleaning (p. 292) % of fleet cleaned daily Records of the number of vehicles cleaned each day or after trip, fleet size
In-house
Maintenance work orders (p. 291)
Total work orders per bus model/ to model buses; total orders/ total buses.
Maintenance records for each bus
In-house
Table 4, continued
3636
Mineta Transportat ion Inst i tute
17Literature Review
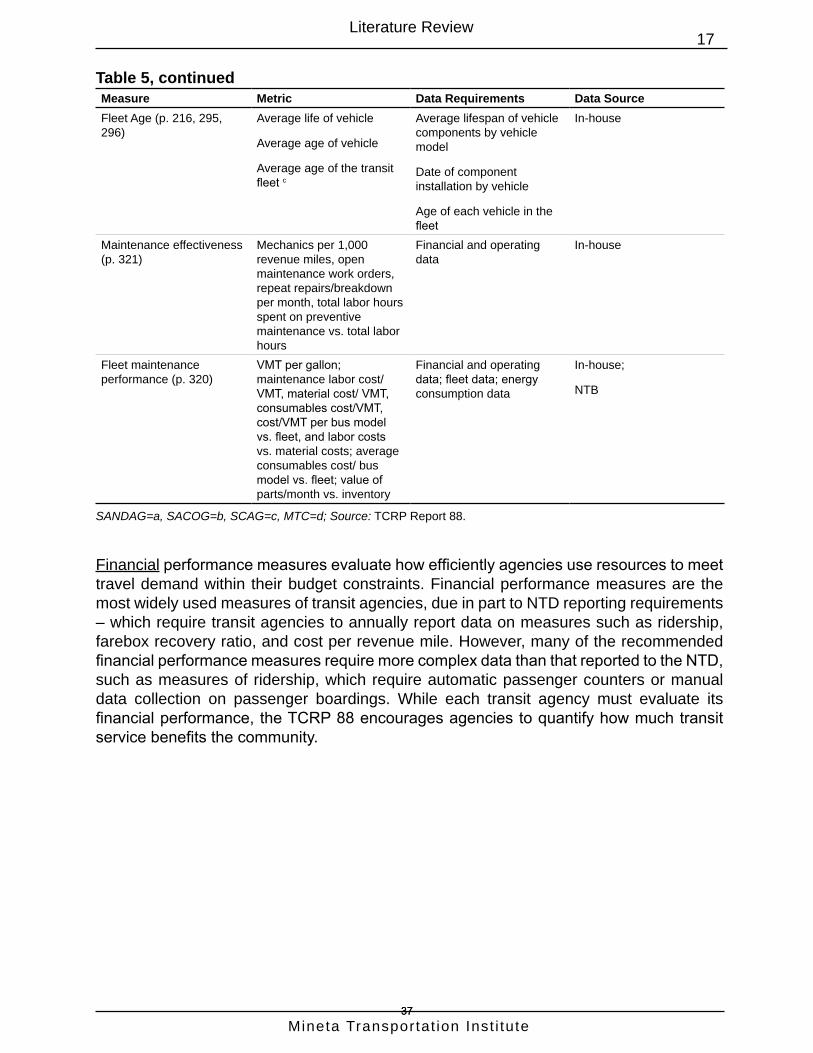
Measure Metric Data Requirements Data SourceFleet Age (p. 216, 295, 296)
Average life of vehicle
Average age of vehicle
Average age of the transit fleet c
Average lifespan of vehicle components by vehicle model
Date of component installation by vehicle
Age of each vehicle in the fleet
In-house
Maintenance effectiveness (p. 321)
Mechanics per 1,000 revenue miles, open maintenance work orders, repeat repairs/breakdown per month, total labor hours spent on preventive maintenance vs. total labor hours
Financial and operating data
In-house
Fleet maintenance performance (p. 320)
VMT per gallon; maintenance labor cost/VMT, material cost/ VMT, consumables cost/VMT, cost/VMT per bus model vs. fleet, and labor costs vs. material costs; average consumables cost/ bus model vs. fleet; value of parts/month vs. inventory
Financial and operating data; fleet data; energy consumption data
In-house;
NTB
SANDAG=a, SACOG=b, SCAG=c, MTC=d; Source: TCRP Report 88.
Financial performance measures evaluate how efficiently agencies use resources to meet travel demand within their budget constraints. Financial performance measures are the most widely used measures of transit agencies, due in part to NTD reporting requirements – which require transit agencies to annually report data on measures such as ridership, farebox recovery ratio, and cost per revenue mile. However, many of the recommended financial performance measures require more complex data than that reported to the NTD, such as measures of ridership, which require automatic passenger counters or manual data collection on passenger boardings. While each transit agency must evaluate its financial performance, the TCRP 88 encourages agencies to quantify how much transit service benefits the community.
Table 5, continued
3737
Mineta Transportat ion Inst i tute
18Literature Review
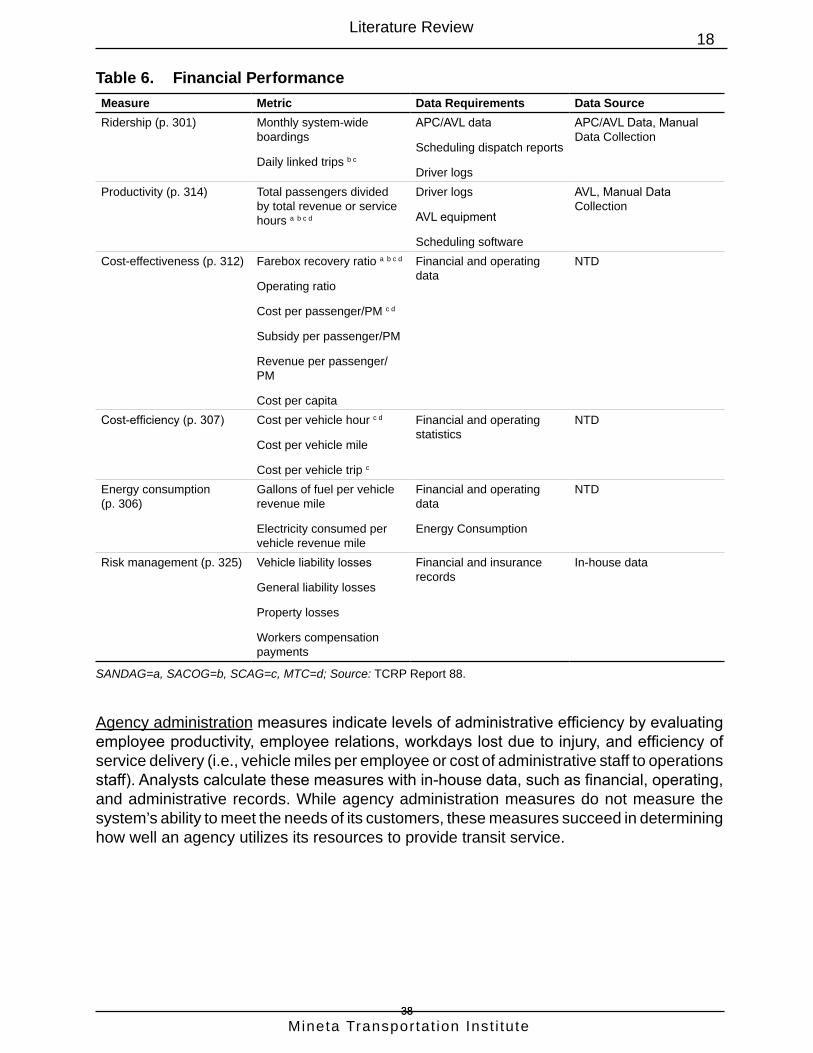
Table 6. Financial PerformanceMeasure Metric Data Requirements Data SourceRidership (p. 301) Monthly system-wide
boardings
Daily linked trips b c
APC/AVL data
Scheduling dispatch reports
Driver logs
APC/AVL Data, Manual Data Collection
Productivity (p. 314) Total passengers divided by total revenue or service hours a b c d
Driver logs
AVL equipment
Scheduling software
AVL, Manual Data Collection
Cost-effectiveness (p. 312) Farebox recovery ratio a b c d
Operating ratio
Cost per passenger/PM c d
Subsidy per passenger/PM
Revenue per passenger/PM
Cost per capita
Financial and operating data
NTD
Cost-efficiency (p. 307) Cost per vehicle hour c d
Cost per vehicle mile
Cost per vehicle trip c
Financial and operating statistics
NTD
Energy consumption (p. 306)
Gallons of fuel per vehicle revenue mile
Electricity consumed per vehicle revenue mile
Financial and operating data
Energy Consumption
NTD
Risk management (p. 325) Vehicle liability losses
General liability losses
Property losses
Workers compensation payments
Financial and insurance records
In-house data
SANDAG=a, SACOG=b, SCAG=c, MTC=d; Source: TCRP Report 88.
Agency administration measures indicate levels of administrative efficiency by evaluating employee productivity, employee relations, workdays lost due to injury, and efficiency of service delivery (i.e., vehicle miles per employee or cost of administrative staff to operations staff). Analysts calculate these measures with in-house data, such as financial, operating, and administrative records. While agency administration measures do not measure the system’s ability to meet the needs of its customers, these measures succeed in determining how well an agency utilizes its resources to provide transit service.
3838
Mineta Transportat ion Inst i tute
19Literature Review
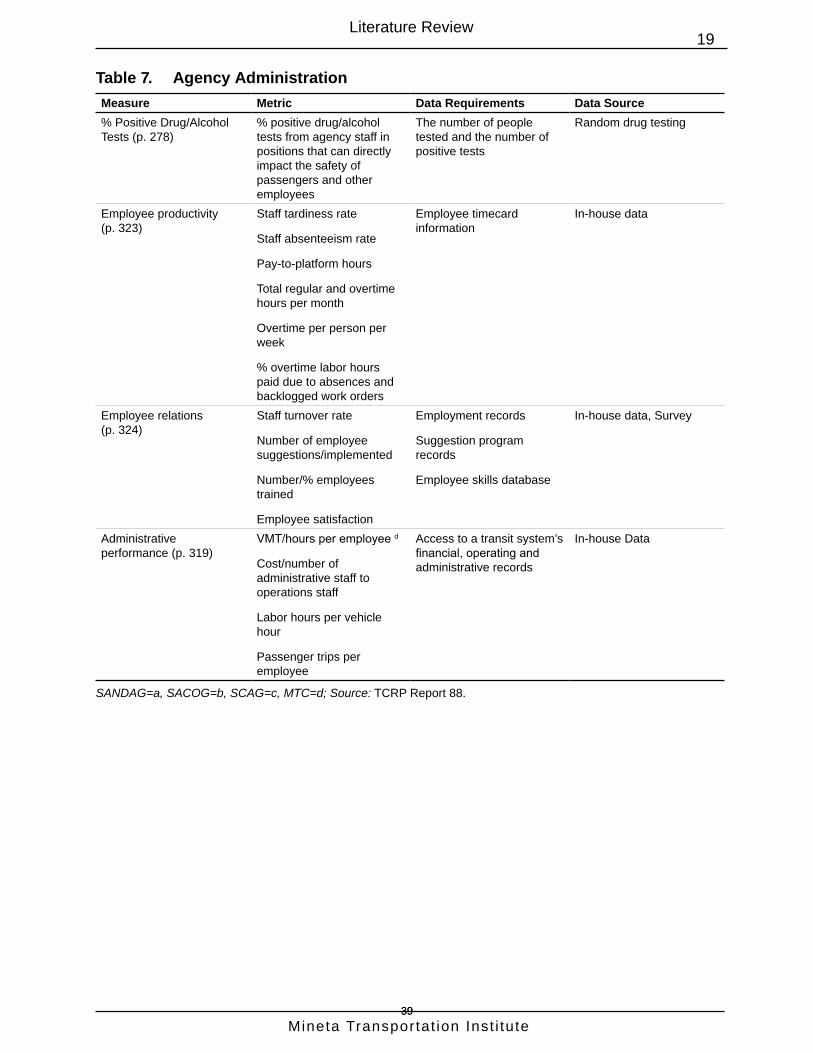
Table 7. Agency AdministrationMeasure Metric Data Requirements Data Source% Positive Drug/Alcohol Tests (p. 278)
% positive drug/alcohol tests from agency staff in positions that can directly impact the safety of passengers and other employees
The number of people tested and the number of positive tests
Random drug testing
Employee productivity (p. 323)
Staff tardiness rate
Staff absenteeism rate
Pay-to-platform hours
Total regular and overtime hours per month
Overtime per person per week
% overtime labor hours paid due to absences and backlogged work orders
Employee timecard information
In-house data
Employee relations (p. 324)
Staff turnover rate
Number of employee suggestions/implemented
Number/% employees trained
Employee satisfaction
Employment records
Suggestion program records
Employee skills database
In-house data, Survey
Administrative performance (p. 319)
VMT/hours per employee d
Cost/number of administrative staff to operations staff
Labor hours per vehicle hour
Passenger trips per employee
Access to a transit system’s financial, operating and administrative records
In-house Data
SANDAG=a, SACOG=b, SCAG=c, MTC=d; Source: TCRP Report 88.
3939

Mineta Transportat ion Inst i tute
20
III. CALIFORNIA METROPOLITAN PLANNING ORGANIZATIONS
Researchers examined the use of performance measures by the four major California metropolitan planning organizations (MPOs) as part of this project, based on information from recent reports and publications found on MPO websites, which are made available to the public. The investigators reviewed system performance reports, regional and metropolitan transportation plans, and coordinated plans. This section presents findings from four major MPOs in California currently using performance measures as part of their transportation planning process. These MPOs include:
• Southern California Association of Governments (SCAG);
• San Diego Association of Governments (SANDAG);
• Sacramento Area Council of Governments (SACOG);
• San Francisco Bay Area Metropolitan Transportation Commission (MTC).
The measures provided by these MPOs provide the most comprehensive and consistent source of transit performance measure data in California. In other words, these measures are available for a majority of the population of California and, as a result, Caltrans may be particularly interested in these measures as it considers the availability of data and the development of measures for the State of California.
GENERAL FINDINGS
The MPOs studied in this report together evaluate 40 different measures as tabulated in Table 8. Nearly half of the performance measures collected by the MPOs measure financial performance. Financial performance is the only category of performance for which MPOs can collect uniform data on the transit agencies within their regions. Federal and state law requires that transit agencies report financial and operating information in order to apportion funding. Therefore, not only is financial and operating information easily accessible due to this reporting requirement, it is also uniform across the thousands of transit agencies in the country.
4040

Mineta Transportat ion Inst i tute
21California Metropolitan Planning Organizations
Table 8. Consolidated MPO Measures and Metrics by MPOCategory Measure Metrics MPOsService Availability
Service Coverage
% transit-supportive area served by transit
% jobs/housing/population with transit access
SANDAG, SCAG, SACOG
% new jobs near high-frequency transit
% new homes near high-frequency transit
SACOG
Frequency Time intervals between transit vehicles (headway) SCAG% stops that have transit service within a specified timeframe(s)
Minimum headways at or below an established threshold
SANDAG
Hours of Service
How long service is provided during a day, measured by LOS threshold (for example, A=19-24 hours/day, B=17-18 hours/day, C=14-16 hours/day, D=12-13 hours/day, E=4-11 hours/day, F=0-3 hours/day) a c
SANDAG, SCAG
Stop Accessibility
Walking distance to bus stop
% stops/stations ADA accessible
SANDAG
Service Delivery
Missed Trips Number of trips removed from the daily schedule
% trips completed
SANDAG
On-Time Performance
% transit vehicles departing or arriving at a location on time
% ADA trips with pickup in schedule window
SANDAG
Passenger Load
Average % seats occupied SANDAG
Transit-Auto Travel Time
Transit travel times vs. auto travel times
Overall transit travel times vs. overall travel time by auto
SCAG
Passenger Environment
Occupancy on board vehicles by distance, speed, fare, and type of service
SANDAG
Community Impact
Demographics Number of return trips provided per week to destinations from rural villages
% bus stops and transit stations fully accessible to disabled populations in the region
SANDAG
Mobility Average speed SCAG, SANDAGService Equitability
% minority and low-income census tracts with transit service vs. average level of service and amenities provided in nonminority census tracts
SANDAG
Total homes in environmental justice areas near high-frequency transit
SACOG
Maintenance Vehicle Age The average age of the transit fleet SCAG
4141
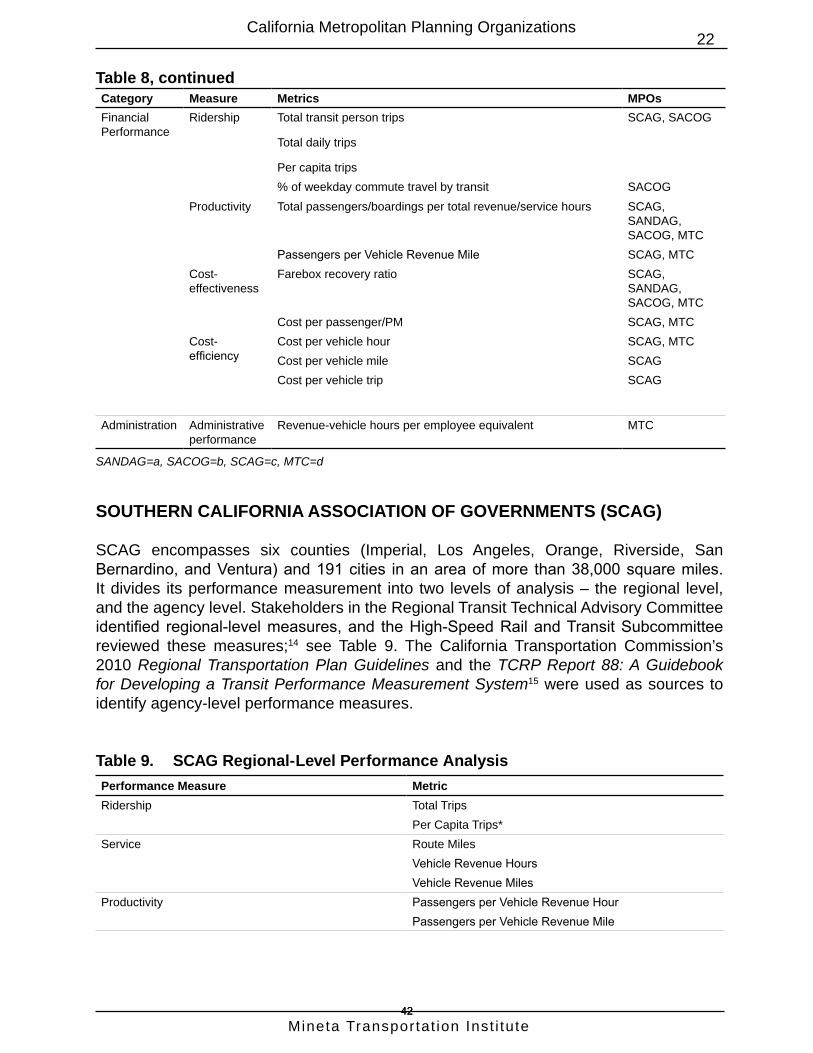
Mineta Transportat ion Inst i tute
22California Metropolitan Planning Organizations
Category Measure Metrics MPOsFinancial Performance
Ridership Total transit person trips
Total daily trips
Per capita trips
SCAG, SACOG
% of weekday commute travel by transit SACOGProductivity Total passengers/boardings per total revenue/service hours SCAG,
SANDAG, SACOG, MTC
Passengers per Vehicle Revenue Mile SCAG, MTCCost-effectiveness
Farebox recovery ratio SCAG, SANDAG, SACOG, MTC
Cost per passenger/PM SCAG, MTCCost-efficiency
Cost per vehicle hour SCAG, MTCCost per vehicle mile SCAGCost per vehicle trip SCAG
Administration Administrative performance
Revenue-vehicle hours per employee equivalent MTC
SANDAG=a, SACOG=b, SCAG=c, MTC=d
SOUTHERN CALIFORNIA ASSOCIATION OF GOVERNMENTS (SCAG)
SCAG encompasses six counties (Imperial, Los Angeles, Orange, Riverside, San Bernardino, and Ventura) and 191 cities in an area of more than 38,000 square miles. It divides its performance measurement into two levels of analysis – the regional level, and the agency level. Stakeholders in the Regional Transit Technical Advisory Committee identified regional-level measures, and the High-Speed Rail and Transit Subcommittee reviewed these measures;14 see Table 9. The California Transportation Commission’s 2010 Regional Transportation Plan Guidelines and the TCRP Report 88: A Guidebook for Developing a Transit Performance Measurement System15 were used as sources to identify agency-level performance measures.
Table 9. SCAG Regional-Level Performance AnalysisPerformance Measure MetricRidership Total Trips
Per Capita Trips*Service Route Miles
Vehicle Revenue HoursVehicle Revenue Miles
Productivity Passengers per Vehicle Revenue HourPassengers per Vehicle Revenue Mile
Table 8, continued
4242

Mineta Transportat ion Inst i tute
23California Metropolitan Planning Organizations
Performance Measure MetricCosts Cost per Vehicle Revenue Hour
Cost per Passenger TripCost per PM
*Per Capita Trips are a key transit performance measure at SCAG because it indicates changes in transit demand that account for population growth. Source: SCAG, Transit System Performance Report – Fiscal Year 2011-12 (2015).
SCAG analyzes regional metrics, which use data from the NTD, by constructing a 20-year time series dating back to 1992. This time series allows SCAG to understand trends and the changing nature of transit service provision and consumption over time in the region. All of the agency-level performance measures used by SCAG for FY 2011-2012 used data obtained from the NTD. See Tables 10 and 11.
Table 10. SCAG Agency-Level Transit MeasuresMeasure MetricsCost Efficiency Operating Cost per Vehicle Revenue Hour
Cost Effectiveness
Farebox RecoveryOperating Cost per Passenger TripOperating Cost per PM
Productivity Passengers per Vehicle Revenue HourPassengers per Vehicle Revenue Mile
Maintenance Fleet Average Vehicle AgeMobility/Travel Time Average Vehicle Speed
Source: SCAG, 2012-2035 RTP Transit Appendixes (2012, p. 10).
Table 11. SCAG Regional Transportation Plan Transit MeasuresPerformance Measure MetricRidership Per Capita Transit TripsAvailability Frequency
Span-of-ServiceLocation of stops and stationsProductivity (boardings per service hour)
Speed Average speed by modal transit vs. average auto speedOverall transit travel times vs. overall travel time by auto (accounting for travel time to and from metro stations/bus stops on each end of the trip)
Costs and Revenues Farebox recoveryCosts per PM traveled
Accessibility % of jobs, housing and population with available transit
Source: SCAG, 2012-2035 RTP Transit Appendixes (2012).
SCAG also executed performance benchmarking to peer regions (New York-Newark-Bridgeport; Chicago-Naperville-Michigan City; Washington-Baltimore-Northern Virginia; Boston-Worcester-Manchester; San Jose-San Francisco-Oakland; Philadelphia-Camden-
Table 9, continued
4343

Mineta Transportat ion Inst i tute
24
Vineland; Houston-Baytown-Huntsville; Atlanta-Sandy Springs-Gainesville; Miami-Fort Lauderdale-Pompano Beach; and Detroit-Warren-Flint) to establish a frame of reference for the cost-effectiveness of current operations and to identify areas where other regions provide service at a lower cost. Performance benchmarking through peer comparison has become a new and popular method for evaluating performance due to the online availability of NTD data to gather information on individual transit agencies. SCAG looked at the following three measures in the peer comparison benchmarking analysis:
• Cost per Person Mile (PM) Traveled;
• Cost per Service Hour;
• System Productivity (passengers per hour by transit type).
SAN DIEGO ASSOCIATION OF GOVERNMENTS (SANDAG)
SANDAG represents 18 cities in the San Diego region. This region uses NTD data submitted to FTA for Transit Title VI on Low-Income and Minority Census Tracts, census data, regional travel demand model, and automatic data collection through the Regional Transit Management System, including automatic vehicle location and automatic passenger counters.16 Table 12 includes a list of their performance measures. These objectives relate to the goals of the Regional Comprehensive Plan (RCP) or the Regional Transportation Plan (RTP), or they are tracked through the annual Transportation Development Act program.
SANDAG relies on the Regional Transit Management System (RTMS), which is an advanced management tool for providing real-time performance monitoring and reporting.17 The RTMS uses data from AVL technology for real-time dispatch control and for real-time vehicle location to monitor on-time performance goals. Additionally, SANDAG utilizes the Passenger Counting Program (PCP), which provides stop-by-stop boarding and alighting information for weekday trips and a sampling of weekend trips. The PCP relies on manually collected data, but will soon use data from Automated Passenger Counters (APC). Currently, 48% of SANDAG vehicles are equipped with AVL, and 75% with APC. SANDAG has plans to advance its real-time transit data by integrating arterial (A-PeMS) and transit (T-PeMS) modules from the Caltrans Performance Measurement System (PeMS). A-PeMS collects and stores arterial data from roadway sensors. T-PeMS is a transit extension that uses APC and AVL, described above, to compute performance measures.
4444

Mineta Transportat ion Inst i tute
25California Metropolitan Planning Organizations
Table 12. SANDAG Transit PerformanceMeasure MetricFinancial Farebox RecoveryProductivity Passengers per revenue-hour
Average % of seats occupied
Access
Walking distance to bus stop (using GIS software)% “existing/planned” smart growth areas served by the minimum transit Number of return trips provided per week to destinations from rural villages% bus stops and transit stations fully accessible to disabled populations
Convenience % stops that have transit service within a specified timeframe(s)Minimum headways (in minutes) that are at or below an established threshold
Reliability and Speed % trips on time at departures, arrivals, and in-route timing points% trips completed% ADA trips with pickup within schedule windowAverage transit operating speed
Environmental Justice % minority/low-income census tracts with transit vs. mean LOS non-minority*Comfort On-board occupancy suit distance, speed, fare, and type of service
* Level of Service (LOS); Non-minority is the population that does not include minorities, who include Black or African-Americans, Hispanics, Asian American or Pacific Islander, and American Indian or Alaskan Native. Source: SANDAG, Coordinated Plan 2014-2018 (2014).
SACRAMENTO AREA COUNCIL OF GOVERNMENTS (SACOG)
The Sacramento Area Council of Governments covers 22 cities in the counties of El Dorado, Placer, Sacramento, Sutter, Yolo, and Yuba. The 2016-2036 Metropolitan Transportation Plan/Sustainable Communities Strategy18 includes information on SACOG’s performance measures. SACOG uses data provided by operators, State Controller Reports, and the NTD to evaluate their performance on the following performance measures presented in Table 13.19
Table 13. SACOG Transit PerformanceMeasures MetricsRidership Total transit person trips
Transit person trips per capita% weekday commute travel by transit
Productivity Passenger boardings per service hourFrequency of serviceTotal daily trips
Financial Transit costs recovered by ticket sales (%)Service Coverage Share of new jobs near high-frequency transit (% of new jobs)
Share of new homes near high-frequency transit (% of new homes)Community Economic Impact Total homes in environmental justice areas near high-frequency transit (% of homes)
Source: SACOG, 2016-2036 Metropolitan Transportation Plan/Sustainable Communities Strategy (2015).
4545
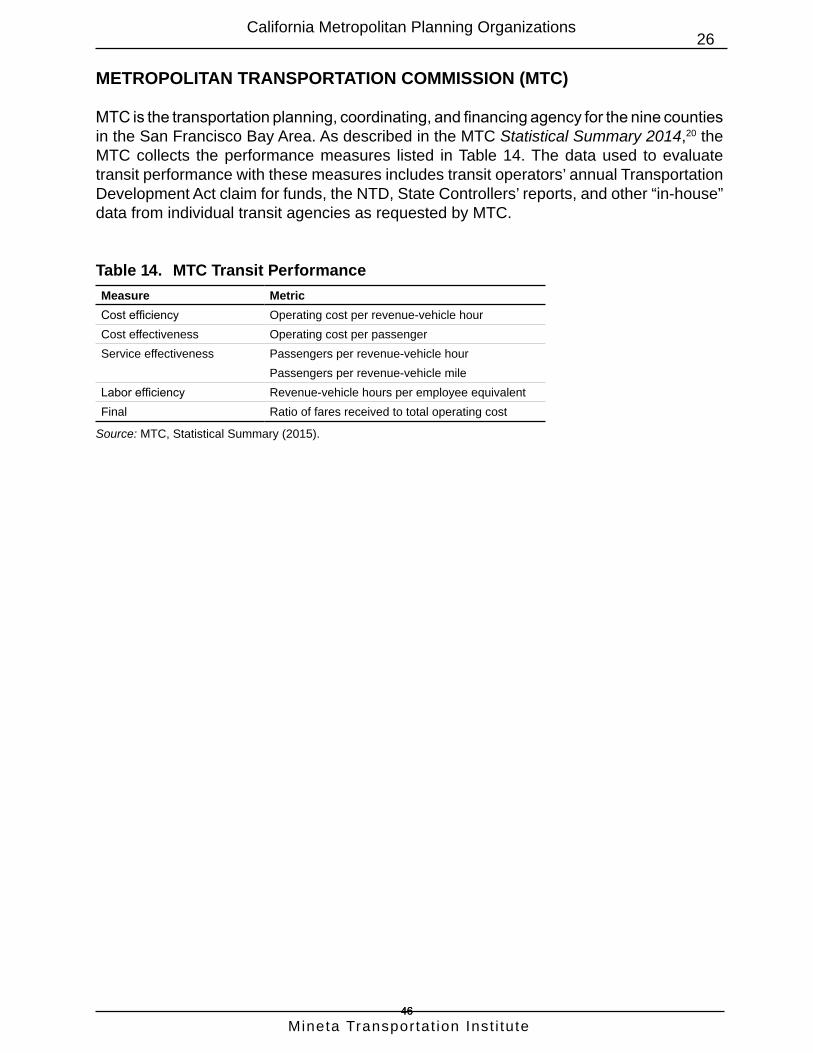
Mineta Transportat ion Inst i tute
26California Metropolitan Planning Organizations
METROPOLITAN TRANSPORTATION COMMISSION (MTC)
MTC is the transportation planning, coordinating, and financing agency for the nine counties in the San Francisco Bay Area. As described in the MTC Statistical Summary 2014,20 the MTC collects the performance measures listed in Table 14. The data used to evaluate transit performance with these measures includes transit operators’ annual Transportation Development Act claim for funds, the NTD, State Controllers’ reports, and other “in-house” data from individual transit agencies as requested by MTC.
Table 14. MTC Transit PerformanceMeasure MetricCost efficiency Operating cost per revenue-vehicle hourCost effectiveness Operating cost per passengerService effectiveness Passengers per revenue-vehicle hour
Passengers per revenue-vehicle mileLabor efficiency Revenue-vehicle hours per employee equivalentFinal Ratio of fares received to total operating cost
Source: MTC, Statistical Summary (2015).
4646

Mineta Transportat ion Inst i tute
27
IV. CALIFORNIA TRANSIT AGENCIES
Investigators identified transit agency planning documents developed from 2010 to 2015 from internet searches. The list of transit agencies in California found in the NTD was a helpful reference for identifying reports with transit performance measures. The scope of the research project did not include the analysis of performance measures from all California transit agencies. Agencies that had developed performance measures but did not evaluate transit performance were not included in this report. Researchers compiled a list of performance measures from the following agencies, using their most recent reports (see date):
• Antelope Valley Transit Authority21
• Caltrain22
• City of Davis23
• City of Lodi24
• Fairfield and Suisun Transit25
• Foothill Transit26
• Fresno Council of Governments27
• Golden Gate28
• San Joaquin Regional Transit District29
• Livermore Amador Valley Transit Authority30
• Los Angeles County Metropolitan Transportation Authority31
• Marin Transit32
• Mendocino Transit Authority33
• Modoc County Transportation Commission34
• Napa County Transportation and Planning Agency35
• Petaluma Transit36
• Placer County Transportation Planning Agency37
• Riverside Transit Agency38
• Sacramento Regional Transit39
4747

Mineta Transportat ion Inst i tute
28California Transit Agencies
• San Mateo County Transit District40
• San Francisco Municipal Transportation Agency41
• Solano Transportation Authority42
• Transit Joint Powers Authority for Merced County43
• Union City Transit44
• Visalia Transit45
• Western Placer Consolidated Transportation Services Agency46 (2011)
Figure 1 shows the frequency of performance measures used by transit agencies by performance measure category. The most frequent measures are in the financial category, followed by the delivery category – and then maintenance, availability, and administration.
Figure 1. Transit Agencies: Frequency of Measures by Performance Categories (N=231)
Table 15 documents the specific measures within each category, as well as the frequency of use. Investigators saw a wide range of measures within the financial category, which largely uses NTD data. The most common measures in the financial category are farebox recovery, passenger trips per vehicle revenue or service hours, and cost per vehicle revenue or service hours. The most common measures for delivery are on-time performance, responsiveness to calls, and number of complaints. For safety, number of accidents, crimes, and injuries are the most typical measures. The measures used for availability include proximity to bus stops and frequency of service.
4848

Mineta Transportat ion Inst i tute
29California Transit Agencies
Table 15. Frequency of Performance Measures by Category for Transit Agencies (N=231)
Measures Metrics Frequency PercentFinancial (N=138) Farebox Recovery 32 23%
Passenger Trips/Vehicle Revenue or Service Hours 24 17%Cost/Vehicle Revenue or Service Hours 21 15%Passenger Trips/Vehicle Revenue or Service Miles 13 9%Cost/Passenger Trips 13 9%Subsidy 10 7%Mean Fare 8 6%Passenger Trips/Week or Month 4 3%Cost/Vehicle Revenue or Service Miles 7 5%Vehicle Revenue Mile/Vehicle Revenue Hour 2 1%Passenger Miles/Vehicle Revenue or Service Miles 1 1%Cost/Passenger Miles 1 1%Energy/Vehicle Revenue or Service Miles 2 1%
Delivery (N=45) On-Time Performance 10 22%Responsiveness to Calls 8 18%Complaints 9 20%Service Calls 5 11%Missed Trips 5 11%Load Factor 4 9%Timed Transfers 2 4%Transit Travel Times 2 4%
Safety (N=20) Accidents 14 70%Crime 3 15%Injuries/Passenger Trips 2 10%Training 1 5%
Availability (N=10) Proximity to Bus Stops 7 70%Frequency 3 30%
Maintenance (N=11) Maintenance 9 82%VMT/Service Interruption 2 18%
Administrative (N=7) Performance 4 57%Hours of Training 1 14%Employee Productivity 1 14%Employee Relations 1 14%
4949

Mineta Transportat ion Inst i tute
30
V. CONCLUSION
The first phase of this research involved a review of the available transit performance measure guidance publications. The goal was to identify a complete framework (categories, example metrics, and data) within which to organize this review of California agency measures. Investigators found the Transportation Research Board’s TCRP Report 88, A Guidebook for Developing a Transit Performance-Measurement System (TCRP, 2003) to be consistent with and more comprehensive than other published guidance documents. Researchers identified the following key transit performance measures for use in this report:
• Service Availability: Ease of transit access based on where (service coverage and/or stop accessibility), how often (frequency), and how long (hours of service) service is provided.
• Service Delivery: Quality of passengers’ day-to-day experiences using transit, as manifested in such categories as service reliability, quality of customer service, and passenger comfort.
• Safety and Security: Likelihood that an accident will occur involving passengers, or that a passenger will become the victim of a crime while using transit. Examples include the rate of accidents per specified distance, the injury accidents per passenger- miles, and quantity of safety devices and personnel.
• Community Impact: Quality-of-life impacts on the communities served by transit, such as mobility, job access, economic growth and productivity, personal finances (i.e., savings that individuals derive from choosing to use transit instead of driving), pollution reductions, and equitability of transit service.
• Financial Performance: How efficiently agencies use resources to meet travel demand within their budget constraints.
• Agency Administration: Efficiency, including employee productivity, employee relations, workdays lost due to injury, and efficiency of service delivery (i.e. vehicle miles per employee, or cost of administrative staff to operations staff).
Major sources of data for these performance measures include the following:
• In-House: Data that transit agencies normally have on hand through good record-keeping– for example, schedule data, system maps, service design standards, dispatch logs, maintenance records, operations logs, accident and incident records, financial data, fleet data, employee records, and complaint records.
• National Transit Database (NTD): Primary source for data, information, and statistics on the U.S. transit systems. Reporting required by those receiving Urbanized Area Formula Program (Section 5307) or Rural Area Formula Program (Section 5311) grants. Data examples include service area, agency information, fleet information, capital and operating funds, costs and expenses, maintenance, safety, service provided and consumed, and energy consumption.
5050

Mineta Transportat ion Inst i tute
31Conclusion
• Other local, state, and federal agencies: Information on external factors that help evaluate the quality and location of transit service – demographic data, traffic data, GIS data, and transportation-planning models.
• Automated systems: Technology that improves data accuracy and completeness, timeliness of reporting, and data collection costs – automatic vehicle location (AVL), train control systems, automatic passenger counters (APC), and electronic fareboxes.
Next, researchers examined the use of performance measures in recent reports and publications by the four major California metropolitan planning organizations (MPOs). These MPOs include:
• Southern California Association of Governments (SCAG);
• San Diego Association of Governments (SANDAG);
• Sacramento Area Council of Governments (SACOG); and
• San Francisco Bay Area Metropolitan Transportation Commission (MTC).
The measures provided by these MPOs provide the most comprehensive and consistent source of transit performance measure data in California. In other words, these measures are available for a majority of the population of California and, as a result, Caltrans may be particularly interested in these measures as they consider the availability of data and the development of measures for the State of California.
The MPOs studied in this report together evaluate 40 different measures. Nearly half of the performance measures collected by the MPOs measure financial performance.
• Service Availability: All MPOs measured service availability – coverage by SANDAG, SCAG, and SACOG, frequency by SCAG and SANDAG, hours of service by SANDAG and SCAG, and stop accessibility by SANDAG.
• Service Delivery: SANDAG used several measures of service delivery, including missed trips, on-time performance, and passenger load, as well as a measure of passenger environment. SCAG used relative measures of auto and transit travel time.
• Community Impact: All MPOs measured community impacts – SANDAG used demographic data to evaluate service to low-income, elderly, and disabled populations; SCAG, SANDAG, and SACOG examined travel times and/or distance between origin and destination locations; and SACOG included service equitability.
• Maintenance: SCAG examined the average age of the transit fleet.
• Financial Performance: All MPOs conducted numerous measures of financial performance – including ridership, productivity, cost-effectiveness, and cost-efficiency.
5151

Mineta Transportat ion Inst i tute
32Conclusion
• Agency Administration: MTC included an administrative performance measure.
The last step in this research was to evaluate the most recent transit agency planning documents in California based on an internet search. Investigators reviewed documents from 26 transit agencies – which included 231 performance measures. Researchers discovered that the most frequently measured category was financial and, within that category, the top three measures were farebox recovery, passenger trips per vehicle revenue or service hours, and cost per vehicle revenue or service hour. Delivery was the next most frequent performance measure category, and its top measures were on-time performance, responsiveness to calls, number of complaints, and missed trips. Safety measures, such as accidents, crime, and injuries, were also evaluated by some agencies. Less frequently evaluated measures included availability, maintenance, and administrative measures.
Not surprisingly, it appears that when agencies have data they use that data to measure transit performance. The data mandated for National Transit Data, especially financial data, are commonly used to evaluate transit performance by both MPOs and transit agencies. Performance measures also seem to align with agency goals. Transit agency measures tend to focus more on issues related to customer service, whereas MPO measures focus more on overall scope, location, quality, and equitability of transit service.
5252

Mineta Transportat ion Inst i tute
33
APPENDIX A: DESCRIPTION OF KEY NATIONAL TRANSIT DATABASE (PERFORMANCE MEASURE DATA)
Appendix A describes the data available from the 2014 National Transit Database (2015) Office of Budget and Policy, Federal Transit Administration, U.S. Department of Transportation.
Category Data LabelsTransit Agency Information State
Organization TypeTransit Agency NameUrbanized Area Urbanized Area PopulationService Area Square Miles Month Fiscal Year EndsTransit ModeService TypeVehicles Operated in Annual Maximum Service (VOMs)
Fleet Size Vehicles Operated in Maximum Services: Directly Operated & Purchased Transportation
Operating Funds State Funds: General Revenue & Dedicated and OtherLocal Funds: General Revenue & Dedicated and OtherFederal Funds: FTA Urbanized Area Formula Funding & OtherDirectly Generated Funds: Directly Operated Fare Revenues, Purchased Transportation Fare Revenues, Other Revenues, & Dedicated and Other
Federal Government Sources for Transit Operating Funds Applied
Urbanized Area Formula Program Funds: Eligible Operating Assistance & Capital Assistance Spent on Operations Capital Program FundsTransportation Bill (e.g., MAP21) FundsOther FTA Funds: Eligible Operating Assistance & Capital Assistance Spent on OperationsFunds Received from Other USDOT Grant ProgramsOther Federal Funds
Transit Capital Funds Applied – Summary and Federal Sources
Directly Generated Funds: Dedicated Taxes, Tolls, and Others & Other Directly Generated Funds
State Funds: Funds Allocated out of General Revenue, Dedicated Taxes, Tolls, and Others, & Total State Funds
Local Funds: Funds Allocated out of General Revenue & Dedicated Taxes, Tolls and Others
Federal Funds: Capital Program, Urbanized Area Formula, MAP-21, Other FTA, Other USDOT, & Other Federal
Capital Funds Applied by Type of Expenditure
Guide WayStationsAdministrative BuildingsFacilitiesRolling StockOther VehiclesFare Revenue Collection EquipmentSystemsOther
5353
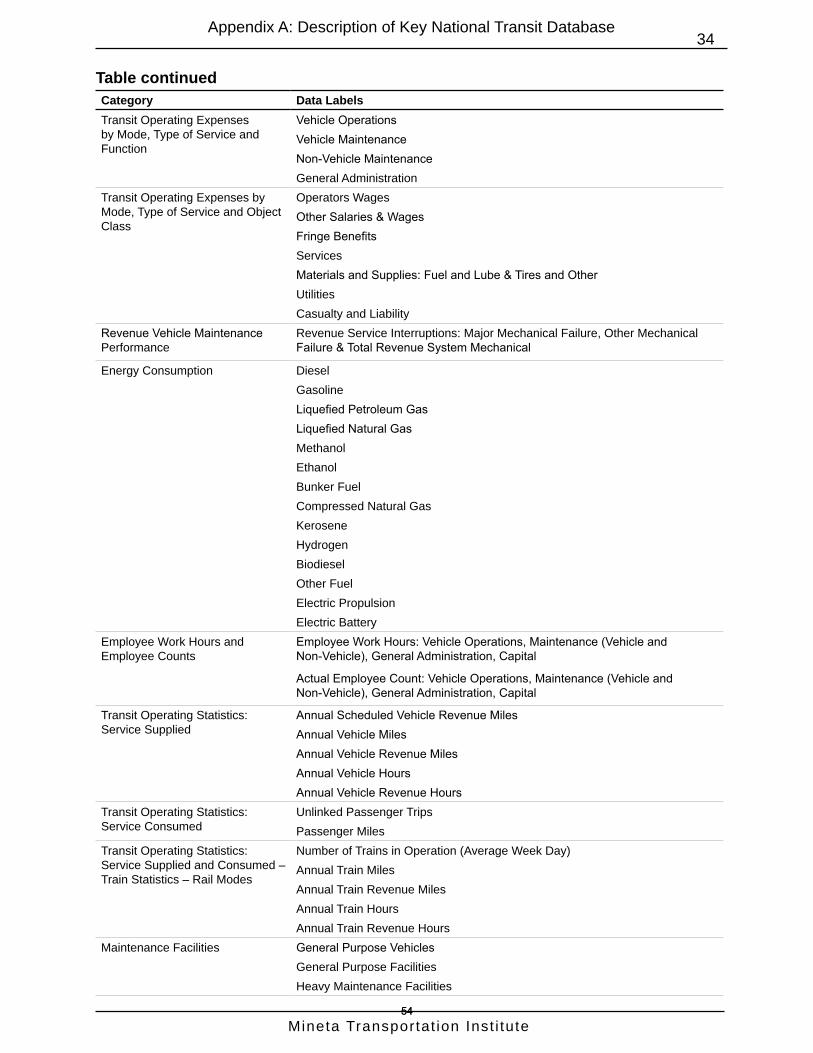
Mineta Transportat ion Inst i tute
34Appendix A: Description of Key National Transit Database
Category Data LabelsTransit Operating Expenses by Mode, Type of Service and Function
Vehicle OperationsVehicle MaintenanceNon-Vehicle Maintenance General Administration
Transit Operating Expenses by Mode, Type of Service and Object Class
Operators WagesOther Salaries & WagesFringe BenefitsServicesMaterials and Supplies: Fuel and Lube & Tires and OtherUtilitiesCasualty and Liability
Revenue Vehicle Maintenance Performance
Revenue Service Interruptions: Major Mechanical Failure, Other Mechanical Failure & Total Revenue System Mechanical
Energy Consumption DieselGasolineLiquefied Petroleum GasLiquefied Natural GasMethanolEthanolBunker FuelCompressed Natural GasKeroseneHydrogenBiodieselOther FuelElectric PropulsionElectric Battery
Employee Work Hours and Employee Counts
Employee Work Hours: Vehicle Operations, Maintenance (Vehicle and Non-Vehicle), General Administration, Capital
Actual Employee Count: Vehicle Operations, Maintenance (Vehicle and Non-Vehicle), General Administration, Capital
Transit Operating Statistics: Service Supplied
Annual Scheduled Vehicle Revenue MilesAnnual Vehicle MilesAnnual Vehicle Revenue MilesAnnual Vehicle HoursAnnual Vehicle Revenue Hours
Transit Operating Statistics: Service Consumed
Unlinked Passenger TripsPassenger Miles
Transit Operating Statistics: Service Supplied and Consumed – Train Statistics – Rail Modes
Number of Trains in Operation (Average Week Day)Annual Train MilesAnnual Train Revenue MilesAnnual Train HoursAnnual Train Revenue Hours
Maintenance Facilities General Purpose VehiclesGeneral Purpose FacilitiesHeavy Maintenance Facilities
Table continued
5454

Mineta Transportat ion Inst i tute
35Appendix A: Description of Key National Transit Database
Category Data LabelsTransit Way Mileage – Rail Modes Track Miles by Type
Number of CrossingsDirectional Route Miles
Transit Way Mileage – Non-Rail Modes
Lane Miles by TypeDirectional Route Miles by Type
Age Distribution of Active Vehicle Inventory
Active Vehicles By Age Grouping (in Years)Total Active FleetAverage Age of Fleet (in Years)
Fare per Passenger and Recovery Ratio
Fare Revenues EarnedTotal Operating ExpensesUnlinked Passenger TripsFare Revenues per Unlinked Passenger Trip Fare Revenues per Total Operating Expense (Recovery Ratio)
Service Supplied and Consumed Ratios: Operating Expenses
per Vehicles Operated in Maximum Serviceper Vehicle Hourper Unlinked Passenger Tripper Passenger Mileper Employee Work Hour
Funds Earned from State Taxes Dedicated at their Source to Transit
Income TaxesSales TaxesProperty TaxesGasoline TaxesOther Taxes
Funds Earned from Local Taxes Dedicated at their Source to Transit
Income TaxesSales TaxesProperty TaxesGasoline TaxesOther Taxes
Statement of Finances Cash and ReceivableInvestmentsSpecial FundsOther AssetsLong-Term DebtTerm Pension LiabilitiesOther Estimated LiabilitiesOther Liabilities
Table continued
5555

Mineta Transportat ion Inst i tute
36
ABBREVIATIONS AND ACRONYMS
ADA Americans with DisabilitiesAPC Automatic Passenger CountersA-PeMS Arterial Performance Measurement SystemAVL Automatic Vehicle LocationCaltrans California Department of TransportationGIS Geographic Information SystemLOS Level of Service MPO Metropolitan Transportation AgencyMTC San Francisco Bay Area Metropolitan Transportation
CommissionNTD National Transit DatabasePCP Passenger Counting ProgramPeMS Performance Measurement SystemPM Passenger MilesPMT Passenger Miles TraveledRTP Regional Transportation PlanRCP Regional Comprehensive PlanRTMS Regional Transit Management SystemSACOG Sacramento Area Council of GovernmentsSANDAG San Diego Association of GovernmentsSCAG Southern California Association of GovernmentsT-PeMS Transit Performance Measurement SystemTCRP Transit Cooperative Research ProgramVMT Vehicle Miles TraveledV/C Volume to Capacity
5656
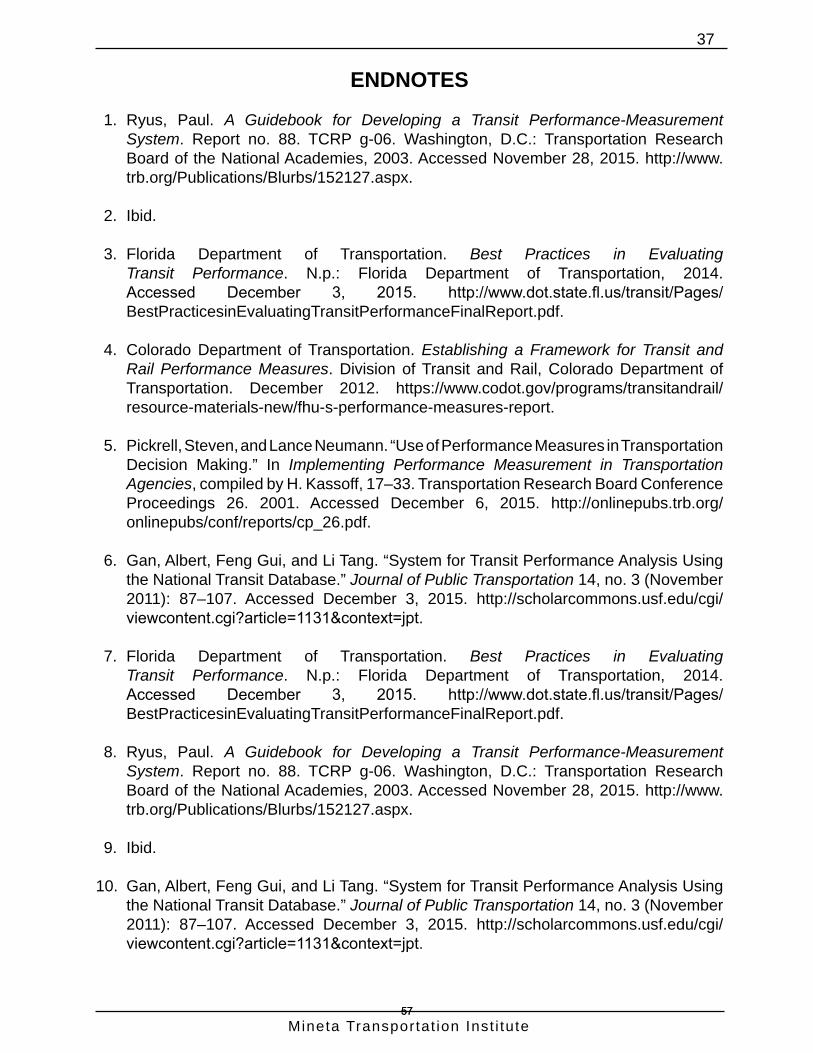
Mineta Transportat ion Inst i tute
37
ENDNOTES
1. Ryus, Paul. A Guidebook for Developing a Transit Performance-Measurement System. Report no. 88. TCRP g-06. Washington, D.C.: Transportation Research Board of the National Academies, 2003. Accessed November 28, 2015. http://www.trb.org/Publications/Blurbs/152127.aspx.
2. Ibid.
3. Florida Department of Transportation. Best Practices in Evaluating Transit Performance. N.p.: Florida Department of Transportation, 2014. Accessed December 3, 2015. http://www.dot.state.fl.us/transit/Pages/BestPracticesinEvaluatingTransitPerformanceFinalReport.pdf.
4. Colorado Department of Transportation. Establishing a Framework for Transit and Rail Performance Measures. Division of Transit and Rail, Colorado Department of Transportation. December 2012. https://www.codot.gov/programs/transitandrail/resource-materials-new/fhu-s-performance-measures-report.
5. Pickrell, Steven, and Lance Neumann. “Use of Performance Measures in Transportation Decision Making.” In Implementing Performance Measurement in Transportation Agencies, compiled by H. Kassoff, 17–33. Transportation Research Board Conference Proceedings 26. 2001. Accessed December 6, 2015. http://onlinepubs.trb.org/onlinepubs/conf/reports/cp_26.pdf.
6. Gan, Albert, Feng Gui, and Li Tang. “System for Transit Performance Analysis Using the National Transit Database.” Journal of Public Transportation 14, no. 3 (November 2011): 87–107. Accessed December 3, 2015. http://scholarcommons.usf.edu/cgi/viewcontent.cgi?article=1131&context=jpt.
7. Florida Department of Transportation. Best Practices in Evaluating Transit Performance. N.p.: Florida Department of Transportation, 2014. Accessed December 3, 2015. http://www.dot.state.fl.us/transit/Pages/BestPracticesinEvaluatingTransitPerformanceFinalReport.pdf.
8. Ryus, Paul. A Guidebook for Developing a Transit Performance-Measurement System. Report no. 88. TCRP g-06. Washington, D.C.: Transportation Research Board of the National Academies, 2003. Accessed November 28, 2015. http://www.trb.org/Publications/Blurbs/152127.aspx.
9. Ibid.
10. Gan, Albert, Feng Gui, and Li Tang. “System for Transit Performance Analysis Using the National Transit Database.” Journal of Public Transportation 14, no. 3 (November 2011): 87–107. Accessed December 3, 2015. http://scholarcommons.usf.edu/cgi/viewcontent.cgi?article=1131&context=jpt.
5757
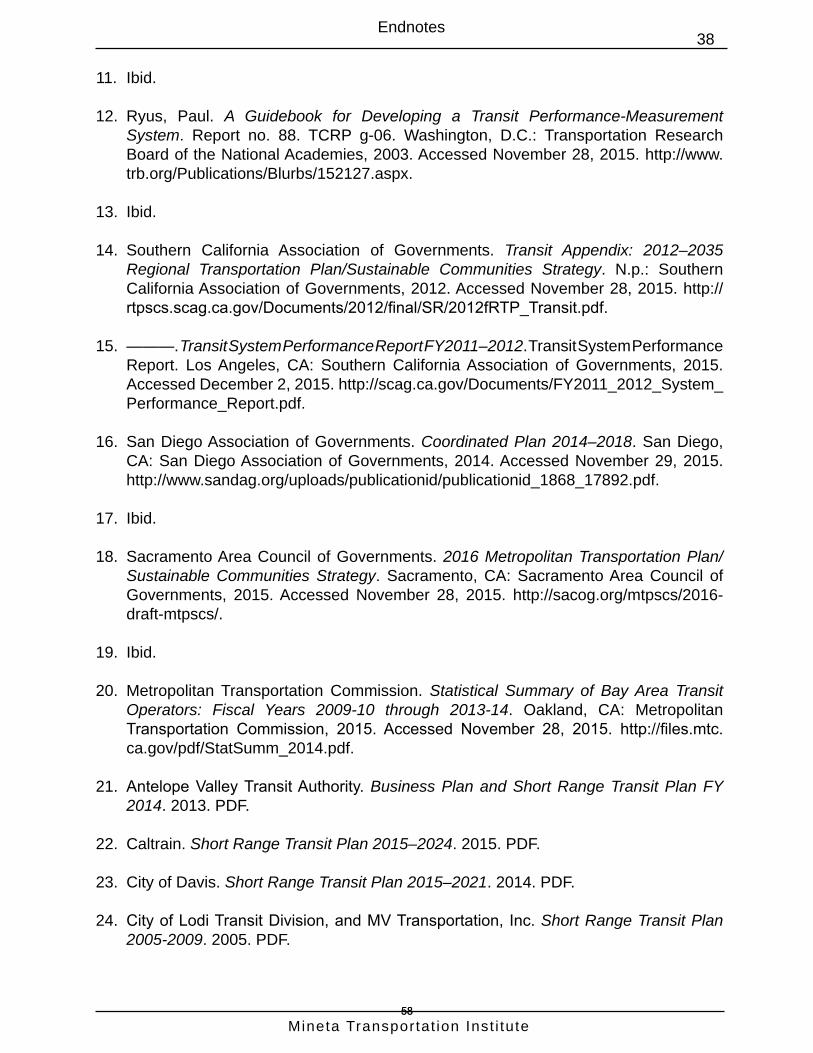
Mineta Transportat ion Inst i tute
38Endnotes
11. Ibid.
12. Ryus, Paul. A Guidebook for Developing a Transit Performance-Measurement System. Report no. 88. TCRP g-06. Washington, D.C.: Transportation Research Board of the National Academies, 2003. Accessed November 28, 2015. http://www.trb.org/Publications/Blurbs/152127.aspx.
13. Ibid.
14. Southern California Association of Governments. Transit Appendix: 2012–2035 Regional Transportation Plan/Sustainable Communities Strategy. N.p.: Southern California Association of Governments, 2012. Accessed November 28, 2015. http://rtpscs.scag.ca.gov/Documents/2012/final/SR/2012fRTP_Transit.pdf.
15. ———. Transit System Performance Report FY2011–2012. Transit System Performance Report. Los Angeles, CA: Southern California Association of Governments, 2015. Accessed December 2, 2015. http://scag.ca.gov/Documents/FY2011_2012_System_Performance_Report.pdf.
16. San Diego Association of Governments. Coordinated Plan 2014–2018. San Diego, CA: San Diego Association of Governments, 2014. Accessed November 29, 2015. http://www.sandag.org/uploads/publicationid/publicationid_1868_17892.pdf.
17. Ibid.
18. Sacramento Area Council of Governments. 2016 Metropolitan Transportation Plan/Sustainable Communities Strategy. Sacramento, CA: Sacramento Area Council of Governments, 2015. Accessed November 28, 2015. http://sacog.org/mtpscs/2016-draft-mtpscs/.
19. Ibid.
20. Metropolitan Transportation Commission. Statistical Summary of Bay Area Transit Operators: Fiscal Years 2009-10 through 2013-14. Oakland, CA: Metropolitan Transportation Commission, 2015. Accessed November 28, 2015. http://files.mtc.ca.gov/pdf/StatSumm_2014.pdf.
21. Antelope Valley Transit Authority. Business Plan and Short Range Transit Plan FY 2014. 2013. PDF.
22. Caltrain. Short Range Transit Plan 2015–2024. 2015. PDF.
23. City of Davis. Short Range Transit Plan 2015–2021. 2014. PDF.
24. City of Lodi Transit Division, and MV Transportation, Inc. Short Range Transit Plan 2005-2009. 2005. PDF.
5858
Mineta Transportat ion Inst i tute
39Endnotes
25. Fairfield and Suisun Transit. Short Range Transit Plan 2012/13–2022/23. 2013. PDF.
26. Foothill Transit. Business Plan and Budget 2014–2015 Proposed. 2014. PDF.
27. City of Fresno. Short Range Transit Plan 2016–2020. 2015. PDF.
28. Golden Gate, Highway, and Transportation District. Short Range Transit Plan 2014–2024. 2015. PDF.
29. San Joaquin Regional Transit District. Short Range Transit Plan 2014–2018. 2013. PDF.
30. Livermore Amador Valley Transit Authority. Final Mini-Short Range Transit Plan 2010 to 2019. 2010. PDF.
31. Los Angeles County Metropolitan Transportation Authority. 2012 Metro Transit Service Policy. N.p.: Los Angeles County Metropolitan Transportation Authority, 2012. Accessed November 28, 2015. http://media.metro.net/images/service_changes_transit_service_policy.pdf.
32. Marin Transit. Short Range Transit Plan 2011/12–2020/21. 2012. PDF.
33. Mendocino Transit Authority. 2012–16 Short Range Transit Development Plan. 2012. PDF.
34. Modoc County Transportation Commission. Short Range Transit Development Plan 2013/14 to 2017/18. 2013. PDF.
35. Napa County Transportation and Planning Agency. Napa County Short Range Transit Plan FY 2013–2022. 2013. PDF.
36. Petaluma Transit. Short Range Transit Plan 2012/13–2021/22. 2012. PDF.
37. Placer County Transportation Planning Agency. Short Range Transit Plan for Western Placer Consolidated Transportation Services Agency. 2011. PDF.
38. Riverside Transit Agency. Short Range Transit Plan 2014–16. 2014. PDF.
39. Sacramento Regional Transit District. Short Range Transit Plan FY 2012–2022. Sacramento, CA: Sacramento Regional Transit District, 2014. Accessed November 28, 2015. http://www.sacrt.com/documents/Planning/SRTP2014.pdf.
40. San Mateo County Transit District. Short Range Transit Plan 2014–2023. 2014. PDF.
41. San Francisco Municipal Transportation Agency. SFMTA Strategic Plan 2013–2018. San Francisco, CA: San Francisco Municipal Transportation Agency, 2012. Accessed November 28, 2015. https://www.sfmta.com/sites/default/files/pdfs/FY%202013%20-%20FY%202018%20SFMTA%20Strategic%20Plan.pdf.
5959

Mineta Transportat ion Inst i tute
40Endnotes
42. Solano Transportation Authority. Coordinated Short Range Transit Plan. 2013. PDF.
43. Transit Joint Powers Authority for Merced County. Short Range Transit Plan 2012–2017. 2012. PDF.
44. Union City Transit. Short Range Plan 2013–2022. 2013. PDF.
45. Visalia Transit. Five Year Short Range Transit Plan 2010/11–2015/16. 2013. PDF.
46. Ibid.
6060

Mineta Transportat ion Inst i tute
41
BIBLIOGRAPHY
AECOM, and AMMA Transit Planning. Short Range Transit Plan FY 2010–11. N.p.: Imperial County Transportation Commission, 2012.
Antelope Valley Transit Authority. Business Plan and Short Range Transit Plan FY 2014. 2013. PDF.
Caltrain. Short Range Transit Plan 2015–2024. 2015. PDF.
City of Davis. Short Range Transit Plan 2015–2021. 2014. PDF.
City of Fresno. Short Range Transit Plan 2016–2020. 2015. PDF.
City of Lodi Transit Division, and MV Transportation, Inc. Short Range Transit Plan 2005-2009. 2005. PDF.
City of San Francisco Office of the Controller. City Services Benchmarking: Public Transportation. By Peg Stevenson. San Francisco, CA: San Francisco Municipal Transportation Agency, 2014. Accessed November 28, 2015. https://www.sfmta.com/sites/default/files/agendaitems/7-10-2014%20City%20Services%20Benchmarking%20Report.pdf.
Colorado Department of Transportation. Establishing a Framework for Transit and Rail Performance Measures. Division of Transit and Rail, Colorado Department of Transportation. December 2012. https://www.codot.gov/programs/transitandrail/resource-materials-new/fhu-s-performance-measures-report.
El Dorado County Transit Authority. Triennial Performance Report FY 2010–2012. N.p.: El Dorado Transit County Authority, 2013. Accessed November 28, 2015. http://3nmak51dheck3t8vkw20jvcz.wpengine.netdna-cdn.com/wp-content/uploads/2015/06/Triennial-Performance-Audit-201012-May.pdf.
Fairfield and Suisun Transit. Short Range Transit Plan 2012/13 - 2022/23. 2013. PDF.
Florida Department of Transportation. Best Practices in Evaluating Transit Performance. N.p.: Florida Department of Transportation, 2014. Accessed December 3, 2015. http://www.dot.state.fl.us/transit/Pages/BestPracticesinEvaluatingTransit PerformanceFinalReport.pdf.
Foothill Transit. Business Plan and Budget 2014-2015 Proposed. 2014. PDF.
Gan, Albert, Feng Gui, and Li Tang. “System for Transit Performance Analysis Using the National Transit Database.” Journal of Public Transportation 14, no. 3 (November 2011): 87–107. Accessed December 3, 2015. http://scholarcommons.usf.edu/cgi/viewcontent.cgi?article=1131&context=jpt.
6161

Mineta Transportat ion Inst i tute
42Bibliography
Golden Empire Transit District. Short Range Transit Plan 15/16–19/20. 2015. PDF.
Golden Gate, Highway, and Transportation District. Short Range Transit Plan 2014–2024. 2015. PDF.
Kiss-off, H. Implementing Performance Measurement in Transportation Agencies. Transportation Research Board Conference Proceedings 26. 2001. Accessed December 6, 2015. http://onlinepubs.trb.org/onlinepubs/conf/reports/cp_26.pdf.
Livermore Amador Valley Transit Authority. Final Mini-Short Range Transit Plan 2010 to 2019. 2010. PDF.
Los Angeles County Metropolitan Transportation Authority. 2012 Metro Transit Service Policy. N.p.: Los Angeles County Metropolitan Transportation Authority, 2012. Accessed November 28, 2015. http://media.metro.net/images/service_changes_transit_service_policy.pdf.
LSC Transportation Consultants, Inc. Western El Dorado County Short- and Long-Range Transit Plan. N.p.: El Dorado Transit, 2014. Accessed November 28, 2015. http://www.edctc.org/C/SLRTP/FINAL%20S-LRTP%20V2%20for%20viewing.pdf.
Marin Transit. Short Range Transit Plan 2011/12–2020/21. 2012. PDF.
Mendocino Transit Authority. 2012–16 Short Range Transit Development Plan. 2012. PDF.
Metropolitan Transportation Commission. Statistical Summary of Bay Area Transit Operators: Fiscal Years 2009–10 through 2013–14. Oakland, CA: Metropolitan Transportation Commission, 2015. Accessed November 28, 2015. http://files.mtc.ca.gov/pdf/StatSumm_2014.pdf.
Modoc County Transportation Commission. Short Range Transit Development Plan 2013/14 to 2017/18. 2013. PDF.
Napa County Transportation and Planning Agency. Napa County Short Range Transit Plan FY 2013–2022. 2013. PDF.
Petaluma Transit. Short Range Transit Plan 2012/13–2021/22. 2012. PDF.
Placer County Transportation Planning Agency. Short Range Transit Plan for Western Placer Consolidated Transportation Services Agency. 2011. PDF.
Riverside Transit Agency. Short Range Transit Plan 2014–16. 2014. PDF.
Ryus, Paul. A Guidebook for Developing a Transit Performance-Measurement System. Report no. 88. TCRP g-06. Washington, DC: Transportation Research Board of the National Academies, 2003. Accessed November 28, 2015. http://www.trb.org/Publications/Blurbs/152127.aspx.
6262

Mineta Transportat ion Inst i tute
43Bibliography
Sacramento Area Council of Governments. 2016 Metropolitan Transportation Plan/Sustainable Communities Strategy. Sacramento, CA: Sacramento Area Council of Governments, 2015. Accessed November 28, 2015. http://sacog.org/mtpscs/2016-draft-mtpscs/.
Sacramento Regional Transit District. Short Range Transit Plan FY 2012–2022. Sacramento, CA: Sacramento Regional Transit District, 2014. Accessed November 28, 2015. http://www.sacrt.com/documents/Planning/SRTP2014.pdf.
San Diego Association of Governments. Coordinated Plan 2014–2018. San Diego, CA: San Diego Association of Governments, 2014. Accessed November 29, 2015. http://www.sandag.org/uploads/publicationid/publicationid_1868_17892.pdf.
San Francisco Municipal Transportation Agency. SFMTA Strategic Plan 2013–2018. San Francisco, CA: San Francisco Municipal Transportation Agency, 2012. Accessed November 28, 2015. https://www.sfmta.com/sites/default/files/pdfs/FY%202013%20-%20FY%202018%20SFMTA%20Strategic%20Plan.pdf.
San Joaquin Regional Transit District. Short Range Transit Plan 2014–2018. 2013. PDF.
San Mateo County Transit District. Short Range Transit Plan 2014–2023. 2014. PDF.
Santa Clara Valley Transportation Authority. Short Range Transit Plan 2014–2023. 2014. PDF.
Solano Transportation Authority. Coordinated Short Range Transit Plan. 2013. PDF.
Southern California Association of Governments. Transit Appendix: 2012–2035 Regional Transportation Plan/Sustainable Communities Strategy. N.p.: Southern California Association of Governments, 2012. Accessed November 28, 2015. http://rtpscs.scag.ca.gov/Documents/2012/final/SR/2012fRTP_Transit.pdf.
———. Transit System Performance Report FY2011–2012. Transit System Performance Report. Los Angeles, CA: Southern California Association of Governments, 2015. Accessed December 2, 2015. http://scag.ca.gov/Documents/FY2011_2012_System_Performance_Report.pdf.
Transit Joint Powers Authority for Merced County. Short Range Transit Plan 2012–2017. 2012. PDF.
Union City Transit. Short Range Plan 2013–2022. 2013. PDF.
Visalia Transit. Five Year Short Range Transit Plan 2010/11–2015/16. 2013. PDF.
6363

Mineta Transportat ion Inst i tute
44
ABOUT THE AUTHORS
CAROLINE RODIER, PH.D.
Caroline Rodier, Ph.D. is a Research Associate at the Mineta Transportation Institute and the Associate Director of the Urban Land Use and Transportation Center—and a Research Scientist—at the Institute of Transportation Studies, University of California, Davis. Dr. Rodier’s major areas of research include transport, land use, and environmental planning and policy analysis; she has extensive experience applying land use and transport models to inform public investment, planning, and policy decisions. She has managed the development of activity-based microsimulation travel models for the State of California and the San Joaquin Valley, as well as California’s PECAS land-use model. Dr. Rodier has expertise in the design and implementation of research projects that routinely make use of expert and stakeholder interviews, focus groups, and travel behavior surveys. Her research includes parking information and pricing technology pilot projects (most recently SFpark); shared-use modes to facilitate first- and last-mile access to transit; travel needs and mobility solutions for diverse populations in California (e.g., the elderly and immigrants); traffic safety impacts of Variable Message Signs; and the scoping plan for California’s landmark climate change legislation, Assembly Bill 32. Dr. Rodier has also conducted reviews of legal and institutional challenges in the areas of automated speed enforcement, low speeds modes (e.g., Segways and neighborhood electric vehicles), and the provision of public parking for carsharing services. Most recently, Dr. Rodier led the development of the content for scenario activities used in the workshop on Automated Vehicles within the Built Environment: 2020, 2035, and 2050 at the Automated Vehicle Symposium 2014 and 2015. She currently serves as the Chair of the Transportation Research Board’s Emerging and Innovative Public Transport and Technologies Committee. She holds a B.A. in U.S. History from Barnard College at Columbia University, and an M.S. in Community Development and a Ph.D. in Ecology from the University of California, Davis.
EMILY ISAAC
Emily Isaac is a Research Assistant at the Institute of Transportation Studies at the University of California, Davis. Since 2014, she has focused her research on transportation network companies and the market for on-demand transportation services. In 2015, she graduated from the University of California, Davis with a bachelor’s degree in Community and Regional Development.
6464

Mineta Transportat ion Inst i tute
45
PEER REVIEW
San José State University, of the California State University system, and the MTI Board of Trustees have agreed upon a peer review process required for all research published by MTI. The purpose of the review process is to ensure that the results presented are based upon a professionally acceptable research protocol.
Research projects begin with the approval of a scope of work by the sponsoring entities, with in-process reviews by the MTI Research Director and the Research Associated Policy Oversight Committee (RAPOC). Review of the draft research product is conducted by the Research Committee of the Board of Trustees and may include invited critiques from other professionals in the subject field. The review is based on the professional propriety of the research methodology.
6565

The Mineta Transportation Institute (MTI) was established by Congress in 1991 as part of the Intermodal Surface Transportation Equity Act (ISTEA) and was reauthorized under the Transportation Equity Act for the 21st century (TEA-21). MTI then successfully competed to be named a Tier 1 Center in 2002 and 2006 in the Safe, Accountable, Flexible, Efficient Transportation Equity Act: A Legacy for Users (SAFETEA-LU). Most recently, MTI successfully competed in the Surface Transportation Extension Act of 2011 to be named a Tier 1 Transit-Focused University Transportation Center. The Institute is funded by Congress through the United States Department of Transportation’s Office of the Assistant Secretary for Research and Technology (OST-R), University Transportation Centers Program, the California Department of Transportation (Caltrans), and by private grants and donations.
The Institute receives oversight from an internationally respected Board of Trustees whose members represent all major surface transportation modes. MTI’s focus on policy and management resulted from a Board assessment of the industry’s unmet needs and led directly to the choice of the San José State University College of Business as the Institute’s home. The Board provides policy direction, assists with needs assessment, and connects the Institute and its programs with the international transportation community.
MTI’s transportation policy work is centered on three primary responsibilities:
MINETA TRANSPORTATION INSTITUTE
Research MTI works to provide policy-oriented research for all levels of government and the private sector to foster the development of optimum surface transportation systems. Research areas in-clude: transportation security; planning and policy development; interrelationships among transportation, land use, and the environment; transportation finance; and collaborative labor-management relations. Certified Research Associates conduct the research. Certification requires an advanced degree, gener-ally a Ph.D., a record of academic publications, and profession-al references. Research projects culminate in a peer-reviewed publication, available both in hardcopy and on TransWeb, the MTI website (http://transweb.sjsu.edu).
Education The educational goal of the Institute is to provide graduate-lev-el education to students seeking a career in the development and operation of surface transportation programs. MTI, through San José State University, offers an AACSB-accredited Master of Science in Transportation Management and a graduate Certifi-cate in Transportation Management that serve to prepare the na-tion’s transportation managers for the 21st century. The master’s degree is the highest conferred by the California State Uni-versity system. With the active assistance of the California
Department of Transportation, MTI delivers its classes over a state-of-the-art videoconference network throughout the state of California and via webcasting beyond, allowing working transportation professionals to pursue an advanced degree regardless of their location. To meet the needs of employers seeking a diverse workforce, MTI’s education program promotes enrollment to under-represented groups.
Information and Technology Transfer MTI promotes the availability of completed research to professional organizations and journals and works to integrate the research findings into the graduate education program. In addition to publishing the studies, the Institute also sponsors symposia to disseminate research results to transportation professionals and encourages Research Associates to present their findings at conferences. The World in Motion, MTI’s quarterly newsletter, covers innovation in the Institute’s research and education pro-grams. MTI’s extensive collection of transportation-related publications is integrated into San José State University’s world-class Martin Luther King, Jr. Library.
The contents of this report reflect the views of the authors, who are responsible for the facts and accuracy of the information presented herein. This document is disseminated under the sponsorship of the U.S. Department of Transportation, University Transportation Centers Program and the California Department of Transportation, in the interest of information exchange. This report does not necessarily reflect the official views or policies of the U.S. government, State of California, or the Mineta Transportation Institute, who assume no liability for the contents or use thereof. This report does not constitute a standard specification, design standard, or regulation.
DISCLAIMER
MTI FOUNDER Hon. Norman Y. Mineta
MTI BOARD OF TRUSTEESFounder, Honorable Norman Mineta (Ex-Officio)Secretary (ret.), US Department of TransportationVice ChairHill & Knowlton, Inc.
Honorary Chair, Honorable Bill Shuster (Ex-Officio)ChairHouse Transportation and Infrastructure CommitteeUnited States House of Representatives
Honorary Co-Chair, Honorable Peter DeFazio (Ex-Officio)Vice ChairHouse Transportation and Infrastructure CommitteeUnited States House of Representatives
Chair, Nuria Fernandez (TE 2017)General Manager and CEOValley Transportation Authority
Vice Chair, Grace Crunican (TE 2016)General ManagerBay Area Rapid Transit District
Executive Director, Karen Philbrick, Ph.D.Mineta Transportation InstituteSan José State University
Joseph Boardman (Ex-Officio)Chief Executive OfficerAmtrak
Anne Canby (TE 2017)DirectorOneRail Coalition
Donna DeMartino (TE 2018)General Manager and CEOSan Joaquin Regional Transit District
William Dorey (TE 2017)Board of DirectorsGranite Construction, Inc.
Malcolm Dougherty (Ex-Officio)DirectorCalifornia Department of Transportation
Mortimer Downey* (TE 2018)PresidentMort Downey Consulting, LLC
Rose Guilbault (TE 2017)Board MemberPeninsula Corridor Joint Powers Board (Caltrain)
Ed Hamberger (Ex-Officio)President/CEOAssociation of American Railroads
Steve Heminger* (TE 2018)Executive DirectorMetropolitan Transportation Commission
Diane Woodend Jones (TE 2016)Principal and Chair of BoardLea+Elliot, Inc.
Will Kempton (TE 2016)Executive DirectorTransportation California
Art Leahy (TE 2018)CEOMetrolink
Jean-Pierre Loubinoux (Ex-Officio)Director GeneralInternational Union of Railways (UIC)
Michael Melaniphy (Ex-Officio)President and CEOAmerican Public Transportation Association (APTA)
Abbas Mohaddes (TE 2018)CEOThe Mohaddes Group
Jeff Morales (TE 2016)CEOCalifornia High-Speed Rail Authority
David Steele, Ph.D. (Ex-Officio)Dean, College of BusinessSan José State University
Beverley Swaim-Staley (TE 2016)PresidentUnion Station Redevelopment Corporation
Michael Townes* (TE 2017)Senior Vice PresidentTransit Sector, HNTB
Bud Wright (Ex-Officio)Executive DirectorAmerican Association of State Highway and Transportation Officials (AASHTO)
Edward Wytkind (Ex-Officio)PresidentTransportation Trades Dept., AFL-CIO
(TE) = Term Expiration or Ex-Officio* = Past Chair, Board of Trustee
Karen Philbrick, Ph.D.Executive Director
Hon. Rod Diridon, Sr.Emeritus Executive Director
Peter Haas, Ph.D.Education Director
Donna MaurilloCommunications Director
Brian Michael JenkinsNational Transportation Safety and Security Center
Asha Weinstein Agrawal, Ph.D.National Transportation Finance Center
Asha Weinstein Agrawal, Ph.D.Urban and Regional Planning San José State University
Jan Botha, Ph.D.Civil & Environmental EngineeringSan José State University
Katherine Kao Cushing, Ph.D.Enviromental Science San José State University
Dave Czerwinski, Ph.D.Marketing and Decision Science San José State University
Frances Edwards, Ph.D.Political Science San José State University
Taeho Park, Ph.D.Organization and Management San José State University
Diana WuMartin Luther King, Jr. LibrarySan José State University
Directors Research Associates Policy Oversight Committee
6666

Bikesharing and Bicycle Safety
MTI Report 12-54
Funded by U.S. Department of Transportation and California Department of Transportation
MT
I2012 C
ensus of California W
ater Transit ServicesM
TI Report 12-02
Decem
ber 2012
6767

11
Trends in the SCAG Region 2005-2015
October 5, 2016
Regional Transit TAC
Philip Law
Manager, Transit/Rail 6868

22
Data Collection Parameters
Timeframe: 2005 to 2015, if available Geography: SCAG region by county Sources:
• American Community Survey• CA Department of Finance• CA Department of Motor Vehicles• CA Employment Development Department• US Energy Information Administration• Census Longitudinal Employer-Household Dynamics, Origin
Destination Employment Statistics• CA Air Resources Board 6969

33
Data Variables
Commute Characteristics
Demographics
Auto Ownership
Fuel Prices
Employment
VMT and Congestion7070

44
7171

55
7272

66
7373

77
7474

88
7575

99
7676

1010
7777

1111
7878

1212
7979

1313
8080

1414
8181

1515
8282

1616
8383

1717
8484

1818
8585

1919
8686

2020
8787

2121
Thank You
8888
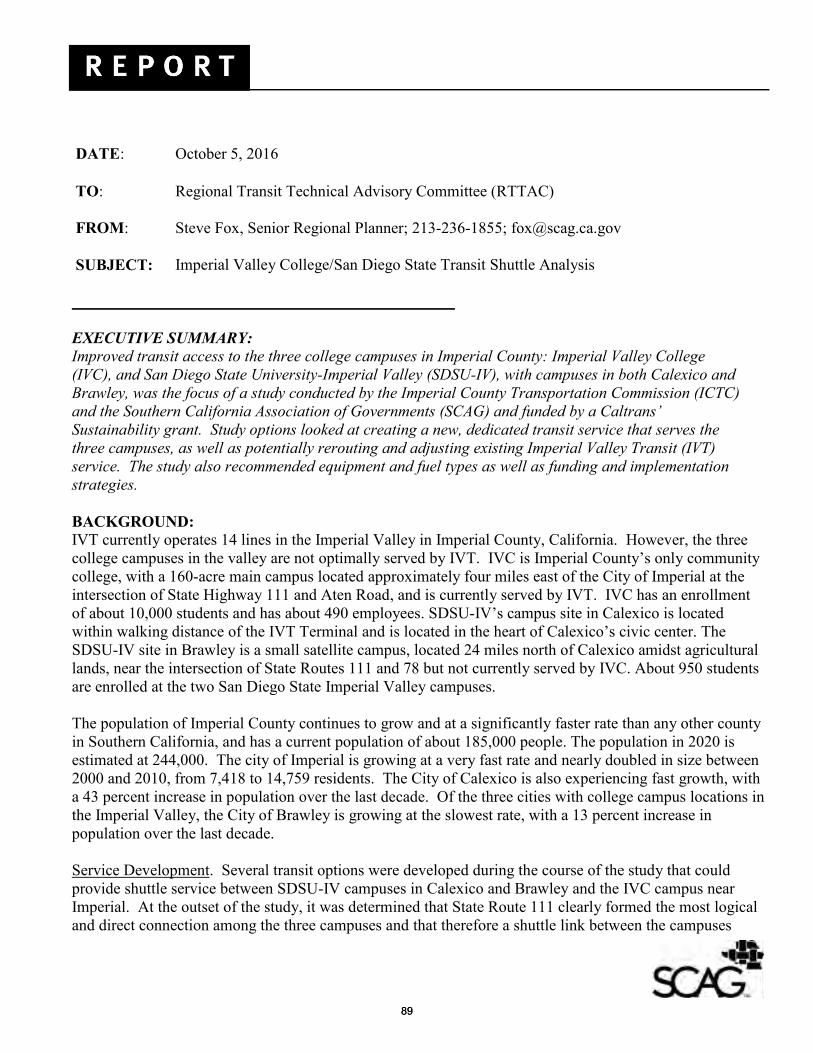
DATE: October 5, 2016
TO: Regional Transit Technical Advisory Committee (RTTAC)
FROM: Steve Fox, Senior Regional Planner; 213-236-1855; [email protected]
SUBJECT: Imperial Valley College/San Diego State Transit Shuttle Analysis
EXECUTIVE SUMMARY: Improved transit access to the three college campuses in Imperial County: Imperial Valley College (IVC), and San Diego State University-Imperial Valley (SDSU-IV), with campuses in both Calexico and Brawley, was the focus of a study conducted by the Imperial County Transportation Commission (ICTC) and the Southern California Association of Governments (SCAG) and funded by a Caltrans’ Sustainability grant. Study options looked at creating a new, dedicated transit service that serves the three campuses, as well as potentially rerouting and adjusting existing Imperial Valley Transit (IVT) service. The study also recommended equipment and fuel types as well as funding and implementation strategies. BACKGROUND: IVT currently operates 14 lines in the Imperial Valley in Imperial County, California. However, the three college campuses in the valley are not optimally served by IVT. IVC is Imperial County’s only community college, with a 160-acre main campus located approximately four miles east of the City of Imperial at the intersection of State Highway 111 and Aten Road, and is currently served by IVT. IVC has an enrollment of about 10,000 students and has about 490 employees. SDSU-IV’s campus site in Calexico is located within walking distance of the IVT Terminal and is located in the heart of Calexico’s civic center. The SDSU-IV site in Brawley is a small satellite campus, located 24 miles north of Calexico amidst agricultural lands, near the intersection of State Routes 111 and 78 but not currently served by IVC. About 950 students are enrolled at the two San Diego State Imperial Valley campuses. The population of Imperial County continues to grow and at a significantly faster rate than any other county in Southern California, and has a current population of about 185,000 people. The population in 2020 is estimated at 244,000. The city of Imperial is growing at a very fast rate and nearly doubled in size between 2000 and 2010, from 7,418 to 14,759 residents. The City of Calexico is also experiencing fast growth, with a 43 percent increase in population over the last decade. Of the three cities with college campus locations in the Imperial Valley, the City of Brawley is growing at the slowest rate, with a 13 percent increase in population over the last decade. Service Development. Several transit options were developed during the course of the study that could provide shuttle service between SDSU-IV campuses in Calexico and Brawley and the IVC campus near Imperial. At the outset of the study, it was determined that State Route 111 clearly formed the most logical and direct connection among the three campuses and that therefore a shuttle link between the campuses
8989

would most likely need to utilize this roadway alignment. Several route alignment options were developed that would connect the three campuses, and some of these options were modified as the study progressed. These included a single route concept connecting all three campuses, a two-route concept with a transfer at IVC (which is between the SDSU campuses), and an express route between the two SDSU campuses that would bypass IVC. As the study progressed, three phases were developed including a short-, medium- and long-term (i.e., Phases One, Two and Three), with the long-term scenario including connections to the main SDSU main campus in San Diego and Northern Arizona University in Yuma, Arizona. Alternatives to reroute and adjust existing IVT services were also designed but were not recommended to be carried forward. Public Outreach. Two rounds of public outreach activities took place for the study. Initial public outreach efforts took place in November 2015 at the three campuses, and gathered focused input from over 300 participants on intercampus travel patterns, student ridership, and other information to provide guidance on transit improvements. Based on this initial input, transit alternatives were developed. The second round of public outreach activities took place in April 2016, where transit alternatives were presented to the college communities. More than 100 people participated in the outreach activities to review transit alternatives and provide input to refine and prioritize the alternatives. Further, a survey was conducted and over 90% of the survey respondents desired new transit service between the three college campuses. Implementation. The Phase One scenario consists of two new “shuttle” routes that meet at the IVC campus connecting the three campuses and has a yearly operating cost of approximately $638,000. The Phase Two scenario consists of adding the express route connecting the two SDSU campuses over the Phase One services bypassing IVC and has a yearly operating cost of $248,000. (The long-term Phase Three scenarios were not costed out as part of the study.) Capital costs include bus shelter equipment and new vehicles required to operate the services at a cost of $3,000,040. Ridership for Phase One is estimated at 79,000 annual passengers resulting in fare revenue of $98,000 (farebox recovery estimated at 15%). Phase Two has annual ridership estimated at 86,000 annual passengers resulting in fare revenue of $108,000 (farebox recovery estimated at 12%). The study recommendations offered several potential sources of funding including federal 5307, state Cap and Trade and local sales tax proceeds. However, in addition to these potential new services, IVT and ICTC have a first priority of implementing additional intra-city circulator routes as recommended in their most recent SRTP. One avenue recommended to increase ridership and farebox revenue is to implement a student/university institutional pass, which currently does not exist for IVT with IVC and SDSU’s Imperial County campuses. NEXT STEPS: IVT and ICTC will actively pursue grant and funding opportunities to implement the campus service recommended in the report. ATTACHMENT:
1. Imperial Valley College/San Diego State Transit Shuttle Analysis Presentation
9090

PRESENTATION TO THEREGIONAL TRANSIT TECHNICAL ADVISORY COMMITTEE
Recommended Plan
Imperial Valley College/San Diego State University Transit Shuttle Analysis
October 5, 2016
c
9191

Imperial County – Study Area
Imperial Valley College/San Diego State University Transit Shuttle Analysis 9292

Imperial Valley Transit (IVT)
FIXED ROUTE services operate along specific routesand fixed time schedules
Service areas include the cities of Niland, Seeley,Ocotillo, Holtville, Calexico, Brawley, Calipatria,Westmorland, West Shores, Heber and El Centro
353 days of operation, including Sundays Average Monthly Passenger Trips are 66,788 Additional dedicated fixed route services for the southern
and northern portions of the City of El Centro (includingthe City of Imperial) and the City of Brawley
Website Address: www.ivtransit.com
Imperial Valley College/San Diego State University Transit Shuttle Analysis 9393

Imperial Valley Transit Fleet
All vehicles are ADA and CARB Compliant
16 - 40 Foot Low-Floor Gillig Transit Buses(Clean Diesel) Wheel Chair Ramp and 2 Wheelchair Tie Down Positions 40 seated, 70+ is the Total Capacity
6 - 25 Foot Cutaway Buses Wheelchair Lift Equipped
Imperial Valley College/San Diego State University Transit Shuttle Analysis 9494

IVT Access
Curb to Curb intercity service for ADA certified disabled persons who cannot access regular fixed route transit service
Fleet consists of 11 – 25 Ft Cutaway vehicles with 4 wheel chair positions each
Up to 20 passengers seated without wheelchairs
FY2015-16 – 32,291 Passengers
FY2015-16 – 9,675 Wheelchairs (30%)
Website Address: www.ivtaccess.org
Imperial Valley College/San Diego State University Transit Shuttle Analysis 9595

IVT Ride
Service operations began Fall 2014; El Centro Summer of 2016 Intracity Dial-A-Ride Consolidation:
Brawley – Calexico - El Centro – Imperial – West Shores
Curb to Curb Demand Response Paratransit Service Seniors age 60 and over OR Disabled (ADA Riders)
Riders must schedule their trips in advance (ALL TRIPS)
14 Low-Floor Cutaways
Website Address: www.ivtride.com
Imperial Valley College/San Diego State University Transit Shuttle Analysis 9696

IVT Meditrans
Service Started July 2016 – 1,300 Passengers first two months
Same Day Round Trip service for Medical Trip Purposes Only
Services all major San Diego Health Care facilities in the I-8 corridorwith service to South Bay once a month Children's Hospital, UCSD Medical Center, Scripps, VA Hospital,
Sharps, Shiley Eye Center, and many others Departs Imperial County @ 7:00am & 11:00am Return Trip from San Diego – Departs @ 3:00pm & 5:30pm
Website Address: www.ivtmedtrans.com
• 3 Cutaways
Imperial Valley College/San Diego State University Transit Shuttle Analysis 9797

IVT Service Area
Imperial Valley College/San Diego State University Transit Shuttle Analysis 9898

IVT Service in Imperial
Imperial Valley College/San Diego State University Transit Shuttle Analysis 9999
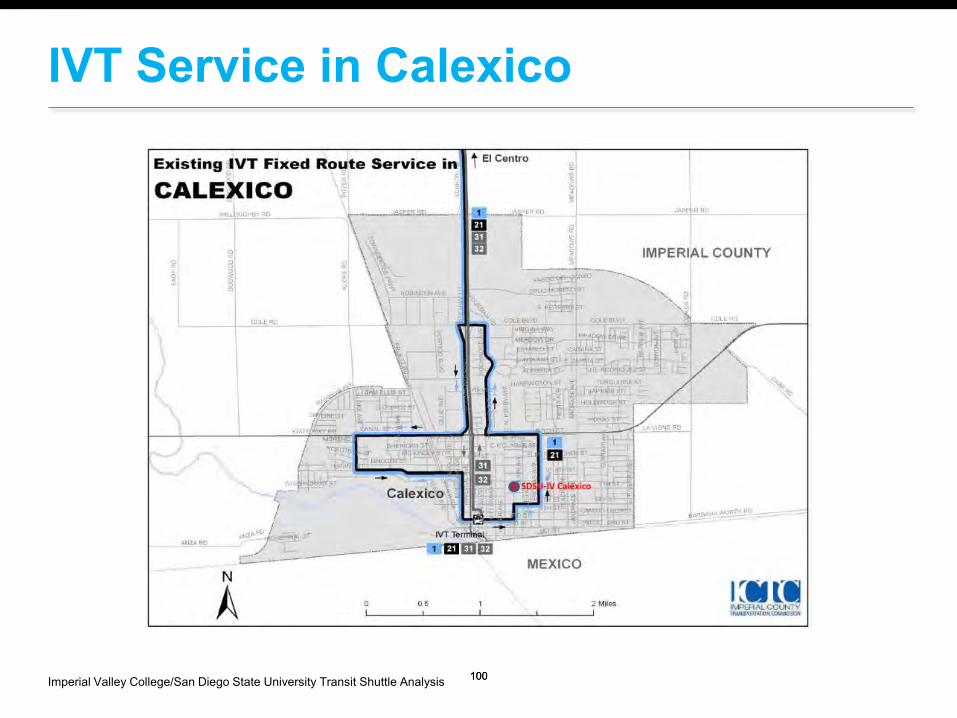
IVT Service in Calexico
Imperial Valley College/San Diego State University Transit Shuttle Analysis 100100

IVT Service in Brawley
Imperial Valley College/San Diego State University Transit Shuttle Analysis 101101

Phase One (2017-2025)Implement IVC Transfer Concept
• Two new “shuttle” routes that meet at the IVC campus
• SDSU Brawley-IVC Route requires approximately 60 minutes cycle time– Uses 1 bus to provide a 60 minute frequency– Service operates from approximately 12:00PM to
10:30PM when school is in session
• SDSU Calexico-IVC Route requires approximately 60 minutes cycle time– Uses 1 bus to provide a 60 minute frequency– Service operates from approximately 6:00AM to
10:30PM when school is in session
Imperial Valley College/San Diego State University Transit Shuttle Analysis 102102
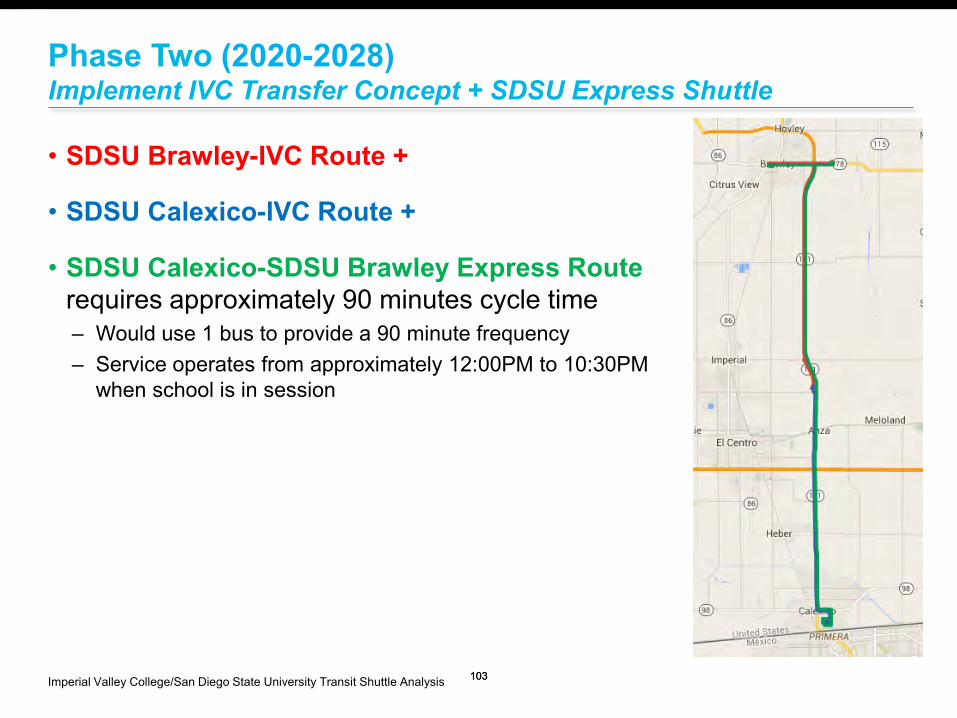
Phase Two (2020-2028)Implement IVC Transfer Concept + SDSU Express Shuttle
• SDSU Brawley-IVC Route +
• SDSU Calexico-IVC Route +
• SDSU Calexico-SDSU Brawley Express Routerequires approximately 90 minutes cycle time– Would use 1 bus to provide a 90 minute frequency– Service operates from approximately 12:00PM to 10:30PM
when school is in session
Imperial Valley College/San Diego State University Transit Shuttle Analysis 103103

Phase 3 – Long TermImplement SDSU Main Campus Service
• IVC-SDSU Main Campus Service – Long term option– Doesn’t fit current funding structure
Imperial Valley College/San Diego State University Transit Shuttle Analysis 104104
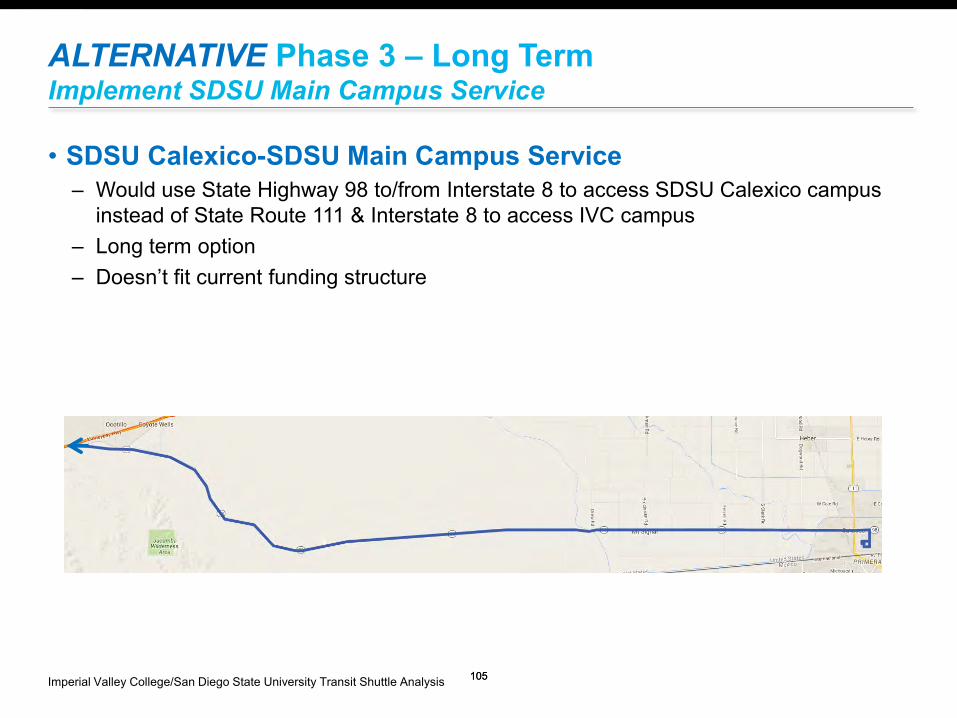
ALTERNATIVE Phase 3 – Long Term Implement SDSU Main Campus Service
• SDSU Calexico-SDSU Main Campus Service– Would use State Highway 98 to/from Interstate 8 to access SDSU Calexico campus
instead of State Route 111 & Interstate 8 to access IVC campus – Long term option– Doesn’t fit current funding structure
Imperial Valley College/San Diego State University Transit Shuttle Analysis 105105

Phase 3 – Long TermImplement NAU -Yuma Service
• IVC-NAU Yuma Service– Long term option– Doesn’t fit current funding structure
Imperial Valley College/San Diego State University Transit Shuttle Analysis 106106

SDSU Brawley Stop LocationCurrently Unserved by IV Transit
Imperial Valley College/San Diego State University Transit Shuttle Analysis 107107

IVC Stop LocationCurrently Served by IV Transit Routes 2, 3, 4, 21 & 22
Imperial Valley College/San Diego State University Transit Shuttle Analysis
Route 2 to/from Niland
Route 2 to/from El CentroRoute 4 from Seeley
Route 22 to/from Niland
Route 3 to/from El Centro & HoltvilleRoute 21 to/from Calexico
108108

SDSU Calexico Stop LocationCurrently Served by IV Transit Routes 1 & 21
Imperial Valley College/San Diego State University Transit Shuttle Analysis
Route 1 to El CentroRoute 21 to IVC
Route 1 from El CentroRoute 21 from IVC
109109

Annual Operating Cost Estimates – Standard Transit BusAll Costs Estimates Are Approximate
• Phase 1 – SDSU Brawley-IVC Route = $248,100/year– SDSU Calexico-IVC Route = $389,900/year– TOTAL Phase 1 Cost = $638,000/year
• Phase 2 – SDSU Brawley-SDSU Calexico Express = $248,100/year– TOTAL Phases 1 & 2 Cost = $886,200/year
Imperial Valley College/San Diego State University Transit Shuttle Analysis 110110

Annual Operating Cost EstimatesAssumptions Utilized
• 201 days per year (based on current IVC Express service)
• Based on revenue hours
• Uses approximate potential operating cost (all in current dollars): – $117.57/hour for potential standard transit bus cost operating cost
Imperial Valley College/San Diego State University Transit Shuttle Analysis 111111

Slide 24 – Examples of Vehicle Types
• Recommended – Standard Transit Bus– 35 foot model recommended
• Body-on-chassis “cutaway” bus
• 15 passenger van
Imperial Valley College/San Diego State University Transit Shuttle Analysis 112112
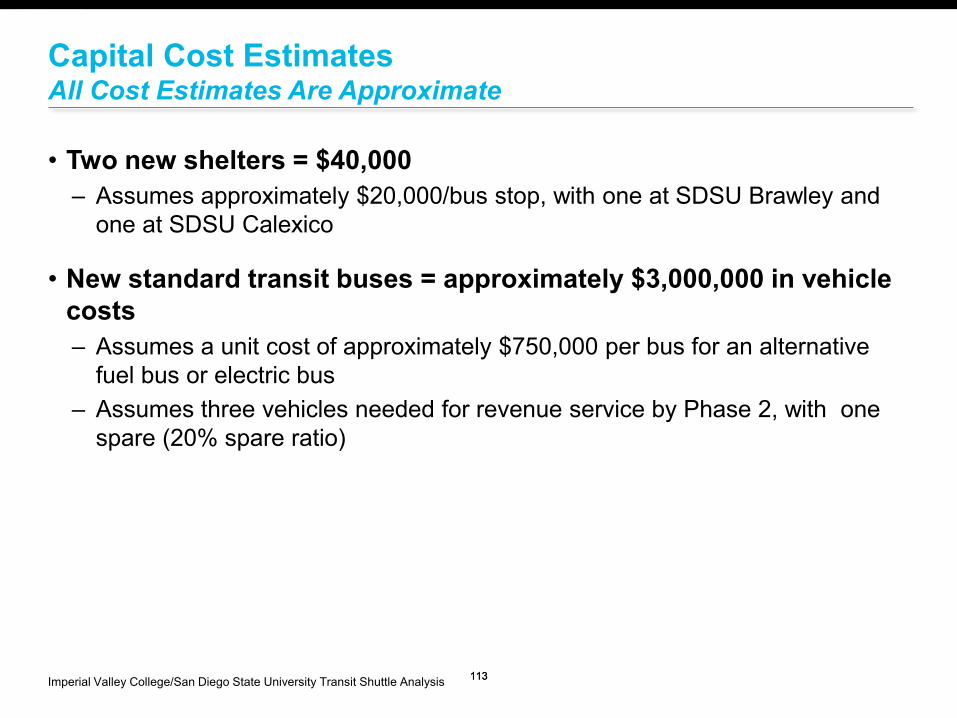
Capital Cost EstimatesAll Cost Estimates Are Approximate
• Two new shelters = $40,000– Assumes approximately $20,000/bus stop, with one at SDSU Brawley and
one at SDSU Calexico
• New standard transit buses = approximately $3,000,000 in vehicle costs– Assumes a unit cost of approximately $750,000 per bus for an alternative
fuel bus or electric bus– Assumes three vehicles needed for revenue service by Phase 2, with one
spare (20% spare ratio)
Imperial Valley College/San Diego State University Transit Shuttle Analysis 113113

Annual Ridership and Revenue EstimatesAll Estimates Are Approximate
• Phase 1 Annual Ridership– SDSU Brawley-IVC Route = 19,000/year– SDSU Calexico-IVC Route = 59,700/year (approximately 30,000/year from
existing IV Transit Route 21)– TOTAL Phase 1 Ridership = 78,700/year
• Phase 1 Annual Revenue– SDSU Brawley-IVC Route = $23,700/year– SDSU Calexico-IVC Route = $74,600/year– TOTAL Phase 1 Revenue = $98,300/year
• Phase 1 Farebox Recovery = 15%
Imperial Valley College/San Diego State University Transit Shuttle Analysis 114114

Annual Ridership and Revenue EstimatesAll Estimates Are Approximate
• Phase 2 Annual Ridership– SDSU Brawley-IVC Route = 14,200/year– SDSU Calexico-IVC Route = 44,800/year (approximately 30,000/year from
existing IV Transit Route 21)– SDSU Calexico-SDSU Brawley Express Route = 27,400/year– TOTAL Phase 2 Ridership = 86,400/year
• Phase 2 Annual Revenue– SDSU Brawley-IVC Route = $17,800/year– SDSU Calexico-IVC Route = $56,000/year– SDSU Calexico-SDSU Brawley Express Route = $34,300/year– TOTAL Phase 2 Revenue = $108,100/year
• Phase 2 Farebox Recovery = 12%
Imperial Valley College/San Diego State University Transit Shuttle Analysis 115115

Funding Considerations
• All phasing assumptions are contingent on funding availability
• Current sources of state and federal funds are essentially prioritized and “spoken for”– Implementation of additional circulator routes considered a priority– Diversion of existing funds for new intercampus shuttle services would mean
service reductions elsewhere – Funding new service under current programs could require several years’
lead time
Imperial Valley College/San Diego State University Transit Shuttle Analysis 116116

Potential Funding Programs
• Federal Sources – Section 5307 Urbanized Formula for both capital and operating funds
(operating funds require a 50% local match)– Section 5339c Low or No Emission Vehicles Grant (capital funds require
20% local match)– CMAQ for capital expenditures (capital funds require 20% local match)
• State Sources– Transportation Development Act (TDA): IV Transit already uses allocation of
Local Transportation Fund (LTF) and State Transit Assistance (STA)– Low Carbon Transit Operation Program (LCTOP) from Cap-and-Trade
• Local Sources– Existing – fares from the public– Potential:
• U-Pass for IVC and San Diego State University• Local Option Sales Tax Measure: requires ballot initiative
Imperial Valley College/San Diego State University Transit Shuttle Analysis 117117

Other Transit Recommendations
• For the new “Imperial Valley University Transit Shuttle” services:– Ridership eligibility
• General public – must be available to the general public if it is an IV Transit service– Express stopping pattern assumed – “closed door” between campus stops– Fare/transfer policy should assume integration with existing IV Transit
services to maximize convenience and ridership – no “fare advantage” to using new shuttle routes as opposed to existing services
– Recommended plan assumes a “regularly-scheduled” service• Orientation to class times might increase required resources
• New service will be branded as the “Imperial Valley University Transit Shuttle”
• Next Steps:
• Phases 1 & 2 will be evaluated as part of the ICTC Short Range
Transit Plan (SRTP). Next SRTP is estimated to begin Spring 2017.
Imperial Valley College/San Diego State University Transit Shuttle Analysis 118118

Discussion andQuestions?
119119

1
FY2013-14 System Performance Report:
Regional Transit Technical Advisory CommitteeOctober 5, 2016
Matt Gleason
120120

2
Goals of the FY13-14 Transit System Performance Report
• Mobility
• Governance
• Service Provision and Consumption
Framework for understanding the region’s transit investments
• Investments and Returns
• Planning for Operations
Resource for Policy Makers
Benchmarking Resource for Operators
• Address performance planning provisions
• Initial step toward transit system performance report for 2016 RTP/SCS
MAP-21
121121

3
FY2013-14 System Performance Report
• Staff previously presented in June
• After comments from RTTAC members, investigations into declining ridership were made over the summer
• Further investigations are pending
• This presentation is an update
122122
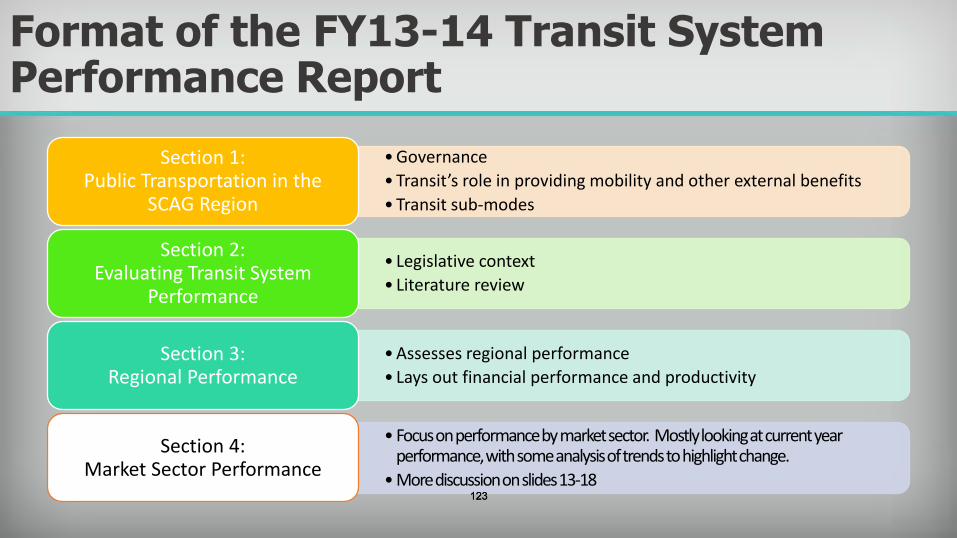
4
Format of the FY13-14 Transit System Performance Report
• Governance
• Transit’s role in providing mobility and other external benefits
• Transit sub-modes
Section 1:Public Transportation in the
SCAG Region
• Legislative context
• Literature review
Section 2: Evaluating Transit System
Performance
• Assesses regional performance
• Lays out financial performance and productivitySection 3:
Regional Performance
• Focus on performance by market sector. Mostly looking at current year performance, with some analysis of trends to highlight change.
• More discussion on slides 13-18
Section 4:Market Sector Performance
123123

5
Measures
• Staff has previously recommend the following measures be used in the report
• Mix of cost efficiency/ effectiveness, productivity, and speed/mobility
• Staff are seeking to include Maintenance measures, but some PT operators report in different manners
Performance Concept Performance Measure
Cost Efficiency
Operating Cost/Revenue Hour
Farebox Recovery
Cost Effectiveness
Operating Cost/Passenger Trip
Operating Cost/Passenger Mile
Service Effectiveness/ Productivity
Passengers/Revenue Hour
Passengers/Revenue Mile
Maintenance Fleet Average Vehicle Age
Mobility/Travel Time Average Vehicle Speed
124124

6
Regional Performance Analysis
Regional Performance Trends
• 10 Year Trend
• 2014 Dollars
• FY2013-14 Data, aggregated at Regional level 125125
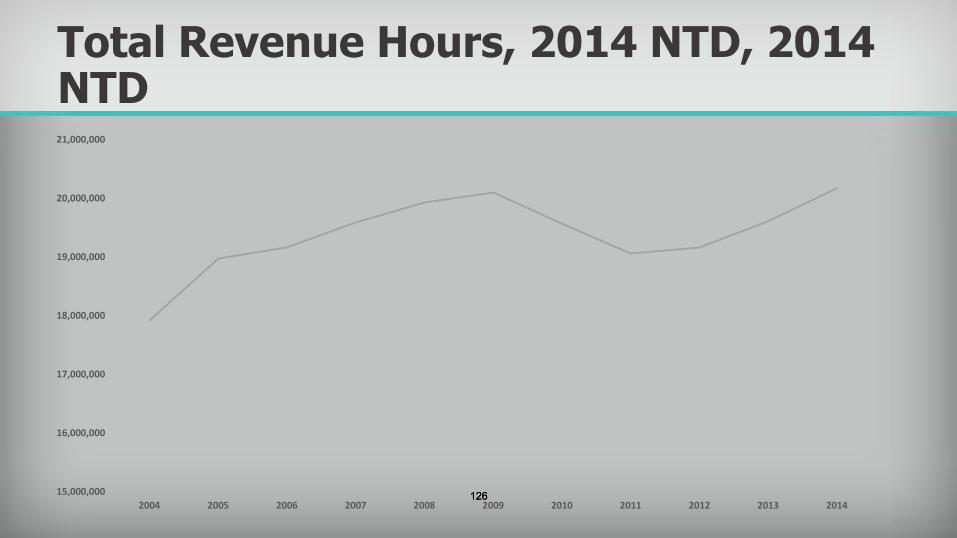
7
Total Revenue Hours, 2014 NTD, 2014 NTD
15,000,000
16,000,000
17,000,000
18,000,000
19,000,000
20,000,000
21,000,000
2004 2005 2006 2007 2008 2009 2010 2011 2012 2013 2014126126

8
Aggregated Monthly Revenue Hours Through June 2016, 2016 NTD
0
5000000
10000000
15000000
20000000
25000000
2004 2005 2006 2007 2008 2009 2010 2011 2012 2013 2014 2015 2016127127

9
Total Unlinked Trips 2004-2016, NTD, 2014 NTD
580,000,000
600,000,000
620,000,000
640,000,000
660,000,000
680,000,000
700,000,000
720,000,000
740,000,000
760,000,000
780,000,000
2004 2005 2006 2007 2008 2009 2010 2011 2012 2013 2014128128

10
Aggregated Monthly Trips through June 2016, 2016 NTD
580,000,000
600,000,000
620,000,000
640,000,000
660,000,000
680,000,000
700,000,000
720,000,000
740,000,000
760,000,000
780,000,000
2004 2005 2006 2007 2008 2009 2010 2011 2012 2013 2014 2015 2016129129

11
Per Capita Trips, 2004-2014, SCAG Region, 2014 NTD
20
25
30
35
40
45
2004 2006 2008 2010 2012 2014130130

12
Aggregated Monthly Per Capita Trips Through June 2016, 2016 NTD
25
27
29
31
33
35
37
39
41
43
45
2004 2005 2006 2007 2008 2009 2010 2011 2012 2013 2014 2015 2016131131

13
Market Sector Analysis
• SCAG Region is very complex environment
• Nearly 70 providers of some sort of fixed route service
• Almost 100 transit providers
• Variety of modes• It’s rare that
metropolitan regions have this many agencies providing public transportation 132132
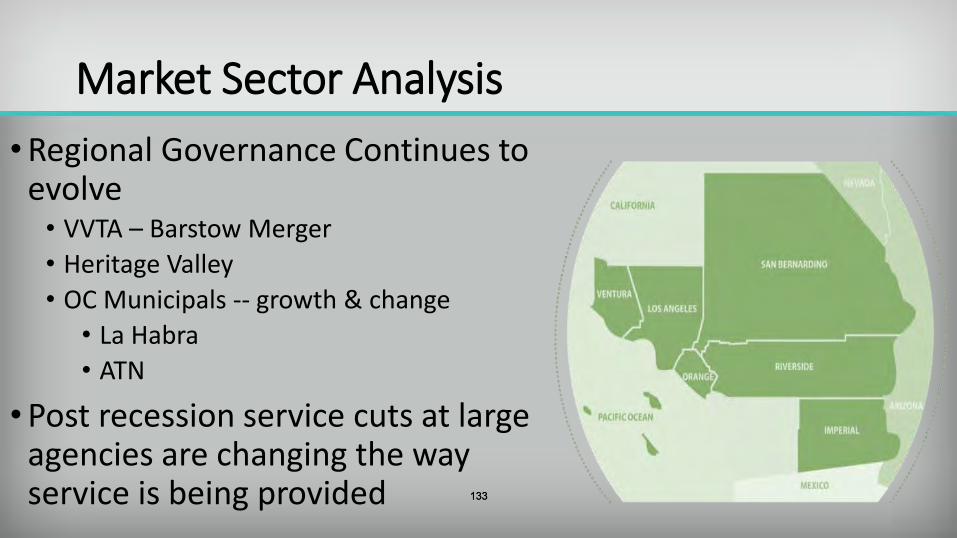
14
Market Sector Analysis
• Regional Governance Continues to evolve
• VVTA – Barstow Merger
• Heritage Valley
• OC Municipals -- growth & change
• La Habra
• ATN
• Post recession service cuts at large agencies are changing the way service is being provided 133133

15
Market Sector Analysis
The market sector concept was developed to:
• Allow closer comparison between similar transit properties
• Stand in as a proxy for land use, financing, and geographic proximity
• Identify broad trends in the way transit service is provided and consumed
134134

16
Service Provision and Consumption by UZA
• Analysis can be done at regional, county, UZA, or market sector levels
• We’ve proposed to use market sectors for this report
Vehicle
Revenue Miles
Vehicle
Revenue Hours
Unlinked
Passenger
Trips
Operating
Expenses
Camarillo0.12% 0.12% 0.01% 0.05%
El Centro-Calexico0.41% 0.26% 0.12% 0.20%
Indio-Cathedral City1.44% 1.35% 0.67% 0.97%
Lancaster-Palmdale1.13% 0.87% 0.50% 0.78%
Los Angeles-Long Beach-Anaheim83.66% 85.43% 93.52% 90.58%
Mission Viejo-Lake Forest-San Clemente 0.08% 0.11% 0.09% 0.09%
Oxnard1.67% 1.59% 3.54% 0.95%
Riverside-San Bernardino 8.35% 7.77% 0.49% 4.68%
Santa Clarita 1.31% 1.04% 0.06% 0.81%
Simi Valley 0.23% 0.22% 0.04% 0.18%
Thousand Oaks 0.37% 0.32% 0.04% 0.20%
Victorville-Hesperia 1.24% 0.92% 3.54% 0.50% 135135

17
Next Steps:Market Sectors
• Proposed Sectors:
Proposed Market Sectors
Coachella Valley Metro Bus
Commuter Rail Metro Rail
East Ventura OC Munis
Imperial OCTA
Inland Empire* Victor Valley
LA County Muni West Ventura
LA County LTSS
*The Inland Empire refers to Western Riverside County and the San Bernardino Valley
136136
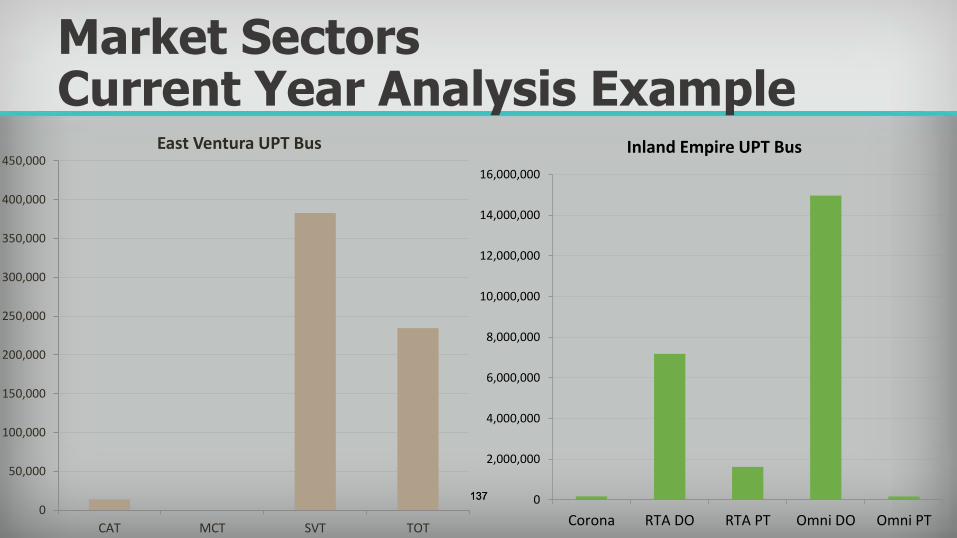
18
Market SectorsCurrent Year Analysis Example
0
50,000
100,000
150,000
200,000
250,000
300,000
350,000
400,000
450,000
CAT MCT SVT TOT
East Ventura UPT Bus
0
2,000,000
4,000,000
6,000,000
8,000,000
10,000,000
12,000,000
14,000,000
16,000,000
Corona RTA DO RTA PT Omni DO Omni PT
Inland Empire UPT Bus
137137

19
Cost per Hour (under 15million UPT)
$500.00
$520.00
$540.00
$560.00
$580.00
$600.00
$620.00
$640.00
$660.00
$680.00
$700.00
$-
$20.00
$40.00
$60.00
$80.00
$100.00
$120.00
$140.00
2004 2005 2006 2007 2008 2009 2010 2011 2012 2013 2014
Coachella East Ventura Imperial LTSS OC Munis Victor Valley West Ventura Metrolink138138
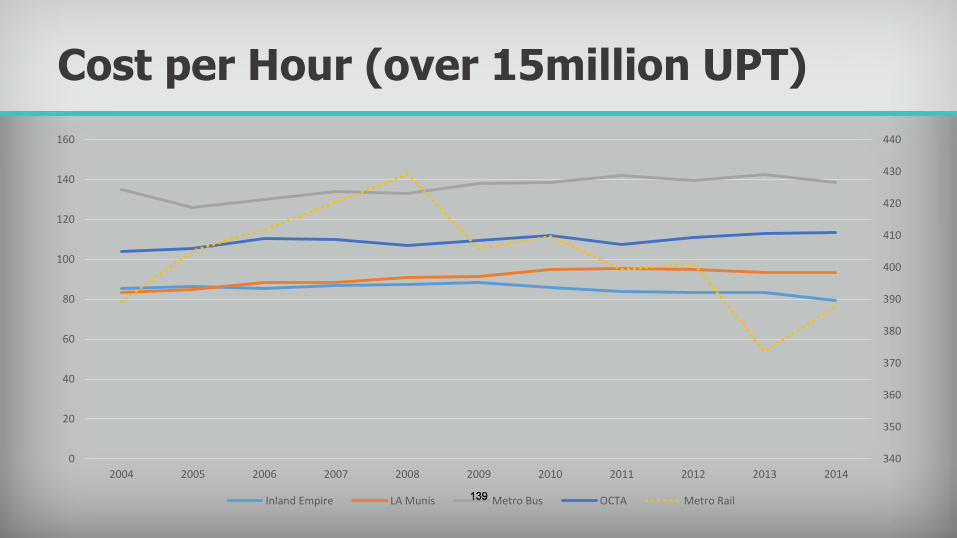
20
Cost per Hour (over 15million UPT)
340
350
360
370
380
390
400
410
420
430
440
0
20
40
60
80
100
120
140
160
2004 2005 2006 2007 2008 2009 2010 2011 2012 2013 2014
Inland Empire LA Munis Metro Bus OCTA Metro Rail139139

21
Cost per Trip (under 15 million UPTs)
$-
$2.00
$4.00
$6.00
$8.00
$10.00
$12.00
$14.00
$16.00
1 2 3 4 5 6 7 8 9 10 11
Coachella Metrolink East Ventura Imperial LTSS OC Munis Victor Valley West Ventura140140

22
Cost per Trip (over 15 million UPTs)
$-
$1.00
$2.00
$3.00
$4.00
$5.00
$6.00
$7.00
1 2 3 4 5 6 7 8 9 10 11
Inland Empire LA Munis Metro Bus Metro Rail OCTA141141

23
Cost per Passenger Mile (under 15 million UPTs)
$0.00
$0.20
$0.40
$0.60
$0.80
$1.00
$1.20
$1.40
2004 2005 2006 2007 2008 2009 2010 2011 2012 2013 2014
Coachella Metrolink Imperial LTSS OC Munis Victor Valley West Ventura142142

24
Cost per Passenger Miles (over 15 million UPTs)
$-
$0.20
$0.40
$0.60
$0.80
$1.00
$1.20
1 2 3 4 5 6 7 8 9 10 11
Inland Empire LA Munis Metro Bus Metro Rail OCTA143143

25
Trips per Hour (under 15 million UPTs)
0
10
20
30
40
50
60
0
5
10
15
20
25
30
35
40
45
2004 2005 2006 2007 2008 2009 2010 2011 2012 2013 2014
Coachella East Ventura Imperial LTSS OC Munis Victor Valley West Ventura Metrolink144144

26
Trips per Hour (over 15 million UPTs)
-10
10
30
50
70
90
110
130
150
0
10
20
30
40
50
60
2004 2005 2006 2007 2008 2009 2010 2011 2012 2013 2014
Inland Empire LA Munis Metro Bus OCTA Metro Rail145145

27
Trips per Mile (under 15 million UPTs)
0
1
2
3
4
5
6
7
2004 2005 2006 2007 2008 2009 2010 2011 2012 2013 2014
Coachella Metrolink East Ventura Imperial LTSS OC Munis Victor Valley West Ventura146146

28
Trips per Mile (over 15 million UPTs)
0.00
1.00
2.00
3.00
4.00
5.00
6.00
7.00
0.00
1.00
2.00
3.00
4.00
5.00
6.00
2004 2005 2006 2007 2008 2009 2010 2011 2012 2013 2014
Inland Empire LA Munis Metro Bus OCTA Metro Rail147147

29
Miles per Hour (under 15 million UPTs)
38
38
39
39
40
40
41
41
0
5
10
15
20
25
2004 2005 2006 2007 2008 2009 2010 2011 2012 2013 2014
Coachella East Ventura Imperial LTSS OC Munis Victor Valley West Ventura Metrolink148148

30
Miles per Hour (over 15 million UPTs)
20
20
21
21
22
22
23
23
24
0
2
4
6
8
10
12
14
16
2004 2005 2006 2007 2008 2009 2010 2011 2012 2013 2014
Inland Empire LA Munis Metro Bus OCTA Metro Rail149149

31
Fleet Average Age (under 15 million UPTs)
0
1
2
3
4
5
6
7
8
9
10
2004 2005 2006 2007 2008 2009 2010 2011 2012 2013 2014
Coachella East Ventura OC Munis West Ventura150150

32
Fleet Average Age (over 15 million UPTs)
0
2
4
6
8
10
12
14
16
2004 2005 2006 2007 2008 2009 2010 2011 2012 2013 2014
Inland Empire LA Munis Metro Rail Metro Bus OCTA151151

33
Farebox Recovery (under 15 million UPTs)
0%
10%
20%
30%
40%
50%
60%
2004 2005 2006 2007 2008 2009 2010 2011 2012 2013 2014
Coachella Metrolink East Ventura Imperial LTSS OC Munis Victor Valley West Ventura152152

34
Farebox Recovery (over 15 million UPTs)
0%
5%
10%
15%
20%
25%
30%
35%
40%
2004 2005 2006 2007 2008 2009 2010 2011 2012 2013 2014
Inland Empire LA Munis Metro Bus Metro Rail OCTA153153

35
Questions?
154154

36
For more information, please contact:
Matt Gleason – [email protected](213)-236-1832
www.scag.ca.gov/transit
155155
Copyright © 2022 FDOKUMEN