Photoelectrocatalytic selective oxidation of 4-methoxybenzyl ...
Upload
khangminh22Category
view
1download
0
Cells 2019, 8, 172; doi:10.3390/cells8020172 www.mdpi.com/journal/cells
Article
Chronic Hypoxia Enhances β-Oxidation-Dependent
Electron Transport via Electron
Transferring Flavoproteins
Dominik C. Fuhrmann 1, Catherine Olesch 1, Nina Kurrle 2,3, Frank Schnütgen 2,3,4,
Sven Zukunft 5, Ingrid Fleming 5 and Bernhard Brüne 1,3,4,6,*
1 Institute of Biochemistry I, Faculty of Medicine, Goethe-University Frankfurt, 60590 Frankfurt, Germany 2 Department of Medicine, Hematology/Oncology, Goethe-University Frankfurt, 60590 Frankfurt, Germany 3 German Cancer Consortium (DKTK), Partner Site, 60590 Frankfurt, Germany 4 Frankfurt Cancer Institute, Goethe-University Frankfurt, 60596 Frankfurt, Germany 5 Institute for Vascular Signaling, Faculty of Medicine, Goethe-University Frankfurt,
60590 Frankfurt, Germany 6 Project Group Translational Medicine and Pharmacology TMP, Fraunhofer Institute for Molecular Biology
and Applied Ecology, 60596 Frankfurt, Germany
* Correspondence: [email protected]; Tel.: +49-69-6301-7424
Received: 22 January 2019; Accepted: 15 February 2019; Published: 18 February 2019
Abstract: Hypoxia poses a stress to cells and decreases mitochondrial respiration, in part by electron
transport chain (ETC) complex reorganization. While metabolism under acute hypoxia is well
characterized, alterations under chronic hypoxia largely remain unexplored. We followed oxygen
consumption rates in THP-1 monocytes during acute (16 h) and chronic (72 h) hypoxia, compared
to normoxia, to analyze the electron flows associated with glycolysis, glutamine, and fatty acid
oxidation. Oxygen consumption under acute hypoxia predominantly demanded pyruvate, while
under chronic hypoxia, fatty acid- and glutamine-oxidation dominated. Chronic hypoxia also
elevated electron-transferring flavoproteins (ETF), and the knockdown of ETF–ubiquinone
oxidoreductase lowered mitochondrial respiration under chronic hypoxia. Metabolomics revealed
an increase in citrate under chronic hypoxia, which implied glutamine processing to α-ketoglutarate
and citrate. Expression regulation of enzymes involved in this metabolic shunting corroborated this
assumption. Moreover, the expression of acetyl-CoA carboxylase 1 increased, thus pointing to fatty
acid synthesis under chronic hypoxia. Cells lacking complex I, which experienced a markedly
impaired respiration under normoxia, also shifted their metabolism to fatty acid-dependent
synthesis and usage. Taken together, we provide evidence that chronic hypoxia fuels the ETC via
ETFs, increasing fatty acid production and consumption via the glutamine-citrate-fatty acid axis.
Keywords: mitochondria; electron transport chain; complex I; TMEM126B; glutamine; fatty acids;
monocytes
1. Introduction
Hypoxia arises when oxygen demands exceed its supply, which often is linked to diseases such
as diabetes, autoimmune disorders, or cancer [1–4]. However, the severity of hypoxia varies, and its
duration ranges from acute to chronic. In contrast to acute hypoxia, the term chronic hypoxia is not
well defined, nor have its metabolic adaptations been explored. Previously, we specified chronic
hypoxia as the phase of the hypoxic response where the protein expression of hypoxia inducible
factors (HIF)-1α and HIF-2α decreased from their initial peaks under acute hypoxia to a steady state

Cells 2019, 8, 172 2 of 17
level slightly above normoxia [5]. This was accompanied by the corresponding regulation of HIF-
inducible genes. They strongly increased under acute hypoxia, and decreased during over 48–72 h of
oxygen shortage. Based on these experiments 1% oxygen and 72 h-incubations were chosen to study
chronic hypoxia.
Mitochondria are major consumers of oxygen in cells, and they are forced to adapt to low oxygen
availability. The activity of the respiratory chain substantially decreases, which is not only caused by
a reduced mitochondrial mass, but it also results from adaptations within the individual respiratory
chain complexes. For example, HIF-1 alters the composition of complex IV by increasing cytochrome
c oxidase subunit (COX) 4-2 expression, which optimizes complex IV for oxygen usage under hypoxic
conditions [6]. In contrast, the activity of complex I is reduced by a HIF-1-facilitated increase of
NADH dehydrogenase (ubiquinone) 1 alpha subcomplex subunit 4-like 2 (NDUFA4L2) [7]. The
adaptive response to chronic hypoxia also includes the proteasomal degradation of the complex I
assembly factor TMEM126B. Thereby, the protein level of complex I is reduced, and oxygen
consumption at this site of the ETC is impaired [8]. However, despite a substantial reduction of
complex I amount and activity, the ETC continues to work at a lower level. This raises the question
of how the ETC is fueled with electrons under acute vs chronic hypoxia. Electrons can be delivered
to the ETC by complex I (NADH:ubiquinone oxidoreductase), complex II (succinate dehydrogenase),
electron-transferring flavoproteins (ETF), and the glycerin-3-phosphate shuttle. Each of these donors
reduces ubiquinone to ubiquinol, which then passes electrons to complex III. Of note, different
metabolites and metabolic pathways are involved in facilitating the distinct transfer mechanisms.
Complex I takes over electrons from NADH, complex II oxidizes succinate to fumarate, and ETFs
transfer reducing equivalents from acyl-CoA dehydrogenases [9,10]. ETFs are heterodimeric, FAD-
containing proteins, found in all kingdoms of life. The primary function of ETFs is to carry one or
two electrons from about 10 different flavoprotein-containing dehydrogenases to the respiratory
chain, by forming transient complexes with their interaction partners [11,12]. ETFs transfer electrons
to the membrane bound ETF-ubiquinone oxidoreductase (ETFDH) and from there, to the
mitochondrial ubiquinone pool [13]. Mutations in those proteins may cause severe symptoms, such
as multiple acyl-CoA dehydrogenase dysfunctional disease (MADD), underscoring the importance
of ETFs [14,15]. In essence, these considerations point to pivotal roles of the TCA cycle and β-
oxidation in fueling the ETC, with three metabolic pathways of major importance. Glycolysis
produces pyruvate, which enters the Krebs cycle as acetyl-CoA. Glutamine, via glutamate and
glutamate dehydrogenase, is converted into α-ketoglutarate to maintain the TCA cycle, while fatty
acid oxidation contributes to ETF-mediated electron transfer. Interestingly, under hypoxia, fatty acid
oxidation and the TCA cycle intermediate citrate are closely connected. The reductive carboxylation
of α-ketoglutarate produces citrate, which leaves mitochondria to be cleaved by ATP citrate lyase
(ACLY), with the resultant acetyl-CoA being consumed for fatty acid synthesis [16].
This study describes how electrons are channeled into the ETC under acute vs chronic hypoxia.
With the transition from acute to chronic hypoxia, cellular respiration shifted from being pyruvate-
centered, to fatty acid- and ETF-based electron flow, in parallel with enhanced glutamine oxidation.
A metabolic shift towards fatty acid oxidation was also noticed under conditions of impaired complex
I activity, showing the dynamic range of adjusting oxygen-dependent respiration under hypoxia.
2. Materials and Methods
2.1. Cell Culture
THP-1 cells (derived from a male donor) were purchased from ATCC and incubated at 37 °C
with 5% CO2 in RPMI medium (GE Healthcare, Munich, Germany), with the addition of 10% FCS,
1% pyruvate, 1% glutamine, and 1% penicillin/streptomycin (PAA Laboratories, Cölbe, Germany).
ETFDH knockdown was induced by transfecting 2 × 10⁶ THP-1 cells with 50 nM small interfering
RNAs (siRNAs) (ON-TARGETplus SMART pool, human ETFDH, Thermo Scientific, Karlsruhe,
Germany), using Hiperfect (Qiagen, Hilden, Germany). For clustered regulatory interspaced short
palindromic repeats (CRISPR)-mediated knockout of TMEM126B, THP-1 cells, stably transduced

Cells 2019, 8, 172 3 of 17
with a lentiviral vector containing Cas9 (pLentiCas9-Blast; Addgene #52962) and selected with 50
µg/mL blasticidine for 10 days, were again transduced with a lentivirus expressing the guide RNA
against TMEM126B (pLentiCRISPRv2 Cas9 (derivate of pLentiCRISPRv2; Addgene #52961)).
Afterwards, single-cell clones were created. For the experiments, five clones were selected, which
showed knockout at the protein level. For the control, a non-target guide RNA (sgC) was used. For
the metabolic studies, MDA-MB-231 cells (ATCC) were cultured in Dulbecco’s Modified Eagle’s
Medium (DMEM) medium (GE Healthcare), with the addition of 10% fetal calve serum (FCS), 1%
glutamine, and 1% penicillin/streptomycin (PAA Laboratories, Cölbe, Germany).
2.2. Hypoxic Incubation
Hypoxic incubations were performed in a SciTive Workstation (Baker Ruskinn, Leeds, UK) at
1% O2 and 5% CO2 for the times indicated. To ensure constant nutrient availability, equilibrated fresh
media was added to the cells after 24 h and 48 h.
2.3. Western Analysis
Cells were lysed in a buffer containing 4% sodium dodecyl sulfate (SDS), 150 mM NaCl, and 100
mM Tris/HCl, pH 7.4, and sonicated. Protein content was determined by a protein assay kit (Bio-Rad,
Munich, Germany), and 100 µg protein was loaded onto a 10% SDS gel. Gels were blotted by using a
Trans Blot Turbo blotting system (Bio-Rad).
Membranes were blocked in 5% milk in Tris-buffered saline with 0.05% tween 20 (TBS-T) for
tubulin (Sigma-Aldrich, Munich, Germany), or 5% bovine serum albumin (BSA) in TBS-T for
TMEM126B (Atlas Antibodies via Sigma-Aldrich, Munich, Germany), electron transferring
flavoprotein-ubiquinone oxidoreductase (ETFDH) (Abcam, Berlin, Germany), and oxidative
phosphorylation (OXPHOS) Western cocktail (abcam). Enhanced chemiluminescence on a C-DIGIT
scanner (Licor, Lincoln, USA), or fluorescence on an Odyssey scanner (Licor), were quantified with
Image Studio Digits 5.0 (Licor).
2.4. Real-Time PCR
RNA was isolated using peqGold (Peqlab, Erlangen, Germany) and measured by using a
Nanodrop ND-1000 spectrophotometer (Peqlab, Erlangen, Germany). Reverse transcription was
performed with the Maxima First Strand cDNA Synthesis Kit for RT-PCR (Thermo Fisher Scientific,
Waltham, USA). RNA expression was analyzed by using a SYBR green fluorescent mix (Thermo
Fischer Scientific) on a CFX96 Real Time PCR Detection System (Bio-Rad), and normalized to TATA
box binding protein (TBP). All primer sequences are listed in Table 1.
Table 1. List of primers.
Target Forward (5‘–3‘) Reverse (5‘–3‘)
ACC1 GCTTGCCTGACTTTTGATCCG ACGTTATCCCCAAACCCAGG
ACLY GATTTTGCGGGGTTCGTCG TTGCCCGTCTGCTCTGAAAT
ETFA ATTAGGTGACTGGCTGAGGC GAAATCGTAGCAATGAGGCCG
ETFDH GGAGTCCCTTATCTTTCCCTGG ATCACCTGCCGGAAAGCAA
FASN ATGAGCACCAACGACACGAT CTATAGGCCGCAGCCTTCTC
GLS1 TATGGACATGGAACAGCGGG CTGTCCTTGGGGAAAGGGTTT
GLS2 CTCCACCCACTAGAAAGCCAC AAAGCTGGCTCCAGGGTTAG
GLUD1 ACAGTGGGCTGAAAACATCC ATCACCAGGTTAAGCCATGC
GLUL CTCTCGCGGCCTAGCTTTAC CGGAGTTCACAGAGTAGGCG
GOT2 ATCCGTCCCATGTATTCCAA TTCACTTCTTGCAGCCATTG
TBP GGGCCGCCGGCTGTTTAACT GGGCCGCCGGCTGTTTAACT
2.5. Seahorse

Cells 2019, 8, 172 4 of 17
The cellular oxygen consumption rate (OCR) and the extracellular acidification rate (ECAR)
were analyzed using a Seahorse 96 extracellular flux analyzer (Agilent, Waldbronn, Germany). THP-
1 cells were plated in Seahorse 96-well cell culture plates one day prior to the measurements, and
equilibrated for 30 min before recordings were made in Krebs Henseleit buffer (111 mM NaCl, 4.7
mM KCl, 1.25 mM CaCl2, 2 mM MgSO4, 1.2 mM Na2HPO4) supplemented with 5 mM L-glucose and
1 mM L-glutamine. Cells were treated with 1 µM rotenone (Sigma-Aldrich, Munich, Germany), 50
µM etomoxir (Cayman Chemicals), 30 µM Bis-2-(5-phenylacetamido-1,3,4-thiadiazol-2-yl)ethyl
sulfide (BPTES, Sigma-Aldrich, Munich, Germany), 20 µM UK5099 (Sigma-Aldrich, Munich,
Germany), or 1 µM atpenin A5 (Cayman Chemicals).
2.6. Mitochondrial Membrane Potential
Cells were incubated with 1 µM of the mitochondrial membrane potential-sensitive dye JC-1
(Thermo Fischer Scientific) for 20 min at 37 °C, under hypoxia. Afterwards, cells were washed with
PBS and green (fluorescein , FITC) vs. red (PE 561-A) fluorescence was measured on an LSRFortessa
(BD, Heidelberg, Germany).
2.7. Quantification of Free Amino Acids in Cells and Cell Culture Media
Exactly 25 µL sample volumes were used for amino acid analysis. Sample preparation was
performed by using the EZ:faast LC-MS free amino acid analysis kit (Phenomenex, Aschaffenburg,
Germany) according to the manufacturer’s instructions, with minor modifications. Only 10 µL of the
internal standard mix were applied to all samples and to the standard curve. After processing, the
samples and standards were evaporated and resolved in 75 µL in 66.6% methanol containing 10 mM
ammonium formate. Analysis of metabolites was performed by LC-MS/MS, using the EZ:faast AAA-
MS HPLC column on an Agilent 1290 Infinity LC system (Agilent) coupled to a QTrap 5500 mass
spectrometer (Sciex, Darmstadt, Germany). The column temperature was set to 35 °C. Gradient
elution was performed with 10 mM ammonium formate in water (mobile phase A) and 10 mM
ammonium formate in methanol (mobile phase B). Conditions for the separation were a 13 min
gradient from 68% B to 83% B, followed by an equilibration step. The flow rate was set to 250 µL/min.
The injection volume was 1 µL. Electro spray ionization in positive mode was employed. The ion
source parameter was as follows, CUR 25 psi, IS 4000 °C, TEM 425 °C, GS1 40 psi, GS2 40 psi.
Calibration curves were performed with the authentic standards from the EZ:faast kit. The intensities
of the measured metabolite were normalized to internal standards. Analyst 1.6.2 and MultiQuant 3.0
(Sciex, Darmstadt, Germany), were used for data acquisition and analysis, respectively.
2.8. Quantification of TCA Cycle Metabolites
The cell homogenate (150 µL) or cell culture medium (100 µL) were mixed with 50 µL or 25 µL
isotope-labeled internal standard, respectively. Samples were evaporated in a vacuum concentrator
(Eppendorf, Hamburg, Germany) at 30 °C, resolved in 50 µL water, and subsequently transferred to
the LC-MS system. Cell culture medium samples were directly transferred to the LC-MS system.
Liquid chromatography mass spectrometry was performed on an Agilent 1290 Infinity LC
system (Agilent) coupled to a QTrap 5500 mass spectrometer (Sciex, Darmstadt, Germany). The
reversed-phase LC separation was performed using a Waters Acquity UPLC HSS T3 column (150
mm × 2.1 mm, 1.8 µm (Waters, Eschborn, Germany)) at 40 °C. Gradient elution was performed with
0.15% formic acid in water (mobile phase A) and 0.15% formic acid in acetonitrile (mobile phase B)
at a flow rate of 400 µL/min. Gradient conditions were 2% B for 1.5 min, followed by a 3 min gradient
to 100% B, followed by a cleaning and equilibration step, with 10 min of total LC run time. The
injection volume was 2.5 µL for all samples. The autosampler temperature was 6 °C. Electrospray
ionization at 400 °C, with 4500 V in negative ionization mode, was employed. The ion source gas
parameters were as follows, CUR 30 psi, GS1 45 psi, GS2 25 psi. The specific MRM transition for every
compound was normalized to the appropriate isotope-labeled internal standard. Calibration curves

Cells 2019, 8, 172 5 of 17
were performed with authentic standards. Analyst 1.6.2 and MultiQuant 3.0 (Sciex, Darmstadt,
Germany), were used for data acquisition and analysis, respectively.
2.9. Statistics
Data are expressed as mean values ± SEM. Statistically significant differences were calculated
after analysis of variance (ANOVA) and Bonferroni’s test or Students t-test; p < 0.05 was considered
as significant.
3. Results
3.1. A Metabolic Phenotype Change in THP-1 Cells Under Hypoxia
To explore the metabolic pathways that fuel the ETC under acute and chronic hypoxia, a
Seahorse flux analyzer was used to follow oxygen consumption in THP-1 monocytes, depending on
pyruvate, glutamine, or fatty acid ingestion (Figure 1A). Cells were incubated for 16 h (acute hypoxia)
or 72 h (chronic hypoxia) at 1% O2, compared to normoxic controls. These time points were
established in previous studies to reflect conditions of acute vs chronic hypoxia [5,8]. Measurements
were performed in Krebs Henseleit buffer supplemented with glutamine and glucose.
Figure 1. Mitochondrial substrate fuel under normoxia, and acute and chronic hypoxia. (A) Scheme
of the mitochondrial utilization of palmitate by carnitine O-palmitoyltransferase 1 (Cpt1A), pyruvate
by the mitochondrial pyruvate carrier (MPC), and glutamine by glutaminase 1 (Gls1), with

Cells 2019, 8, 172 6 of 17
corresponding inhibitors (blue). (B–G) THP-1 monocytes were incubated for 16 or 72 h under 1% O2
vs normoxia. The oxygen consumption rate (OCR) was measured using a Seahorse flux analyzer.
Fatty acid uptake was inhibited by etomoxir (eto), pyruvate import was antagonized by UK5099,
while glutamate synthesis was suppressed by Bis-2-(5-phenylacetamido-1,3,4-thiadiazol-2-yl)ethyl
sulfide (BPTES). (B, D, F) Fitted, representative OCR curves connecting rates of individual OCR rates,
with and without inhibitors, are shown by straight lines. Exemplified original traces are shown in
supplementary figure S1(B–D). (C, E, G) OCR is calculated as the ratio of oxygen consumption seen
with one inhibitor, compared to all inhibitors. Data are mean values ± SEM, n = 3, * p <0.05.
The dependency on a distinct substrate pathway was expressed as the ratio of interference with
one pathway, compared to blocking all pathways. The experimental protocol and data acquisition
are illustrated in figure S1. In general, cellular respiration was slightly reduced following incubations
under acute hypoxia for 16 h, compared to normoxia, which became more pronounced with chronic
hypoxic pre-treatments for 72 h (Figure 1B, D, and F). However, despite a prominently reduced
respiration under chronic hypoxia, a residual respiration of roughly 50 pmol/min/100,000 cells
remained. To capture oxygen consumption rates (OCR) demanding fatty acids, we used etomoxir to
block carnitine O-palmitoyltransferase 1 (Cpt1A), which imports long chain fatty acids into
mitochondria. Following OCR for roughly 30 min, we added UK5099 to block the mitochondrial
uptake of pyruvate and BPTES to inhibit glutaminase 1 (Gls1) (Figure 1B, S2A). Etomoxir, compared
to the combination UK5099/BPTES generated an OCR ratio of roughly 0.5, pointing to a balanced use
of electrons from fatty acid oxidation vs glutamate and pyruvate oxidation. An acute hypoxic
challenge decreased the ratio to a value of around 0.3, implying that inhibition by UK5099/BPTES
became more pronounced, while following chronic hypoxia, the ratio increased to roughly 0.7,
suggesting a more dominant role of fatty acid oxidation (Figures 1C and S2B). To analyze the OCR-
dependency on glutamine, Gls1 was inhibited using BPTES, followed by the addition of
UK5099/etomoxir (Figure 1D and S2C). The reliance on glutamine oxidation was modest under all
conditions, which was reflected by a low ratio of 0.1 to 0.2. However, glutamine oxidation became
more pronounced by the addition of UK5099/etomoxir (Figure 1E). After acute hypoxia, cells were
slightly more dependent on glutamine oxidation than normoxic cells, with this dependency
becoming significant following chronic hypoxic incubations. The role of pyruvate oxidation was
analyzed by using UK5099 to interfere with the mitochondrial pyruvate carrier (MPC), followed by
the addition of etomoxir/BPTES (Figure 1F). Under normoxia, the ratio of 0.25 implied a moderate
occurrence of pyruvate oxidation (Figure 1G). After acute hypoxia, the ratio unexpectedly increased
to values of around 0.4, pointing to the importance of pyruvate oxidation in monocytic cells under
acute hypoxia. When hypoxia became chronic, pyruvate consumption decreased to values of
normoxic incubations.
These results established pronounced differences in substrate usage underlying OCR,
comparing acute vs chronic hypoxia. Under prolonged periods of oxygen shortage, the dependence
on glutamate and fatty acid oxidation was striking. This provoked two questions: First, how does β-
oxidation fuel the respiratory chain under chronic hypoxia, and second, does glutamine enhance
electron transfer via complex II, or is it processed to citrate, to enhance fatty acid synthesis followed
by their β-oxidative destruction.
3.2. ETFs are Important for Allowing Oxygen Consumption under Chronic Hypoxia
The respiratory chain receives electrons via complex I, complex II, and ETFs. Figure 2A provides
an overview of these pathways, also indicating sites of interference by various pharmacological
agents. Based on the findings that fatty acid oxidation gains importance over other pathways under
chronic hypoxia to provide electrons for oxygen reduction, the ETF-system was focused upon. To
prove the importance of ETF-mediated electron transfer under chronic hypoxia, complex I was
inhibited with rotenone (rot), and complex II activity was compromised by atpenin A5 (AA5).
Thereby, the ETFs remained as possible electron carriers (Figure 2B). As expected, residual
respiration following complex I and complex II inhibition was significantly higher after chronic
hypoxia, compared to normoxia or acute hypoxia. Then, the hypoxic mRNA expression of ETFA and
Cells 2019, 8, 172 7 of 17
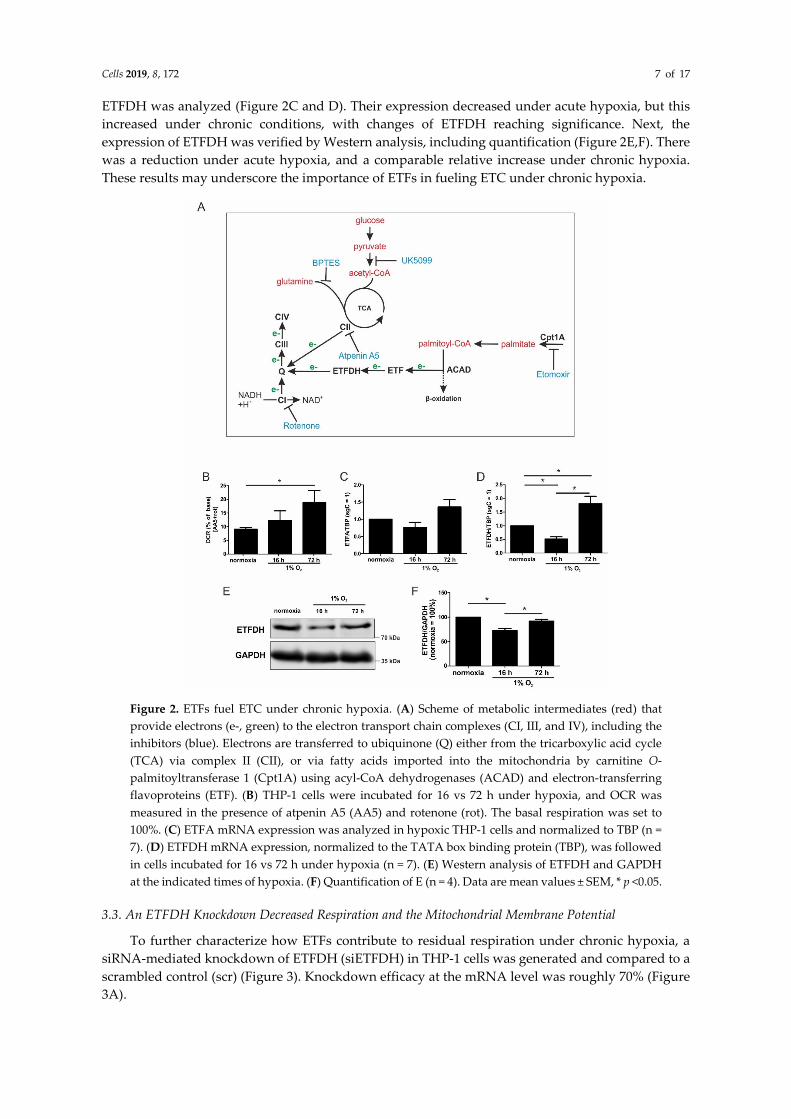
ETFDH was analyzed (Figure 2C and D). Their expression decreased under acute hypoxia, but this
increased under chronic conditions, with changes of ETFDH reaching significance. Next, the
expression of ETFDH was verified by Western analysis, including quantification (Figure 2E,F). There
was a reduction under acute hypoxia, and a comparable relative increase under chronic hypoxia.
These results may underscore the importance of ETFs in fueling ETC under chronic hypoxia.
Figure 2. ETFs fuel ETC under chronic hypoxia. (A) Scheme of metabolic intermediates (red) that
provide electrons (e-, green) to the electron transport chain complexes (CI, III, and IV), including the
inhibitors (blue). Electrons are transferred to ubiquinone (Q) either from the tricarboxylic acid cycle
(TCA) via complex II (CII), or via fatty acids imported into the mitochondria by carnitine O-
palmitoyltransferase 1 (Cpt1A) using acyl-CoA dehydrogenases (ACAD) and electron-transferring
flavoproteins (ETF). (B) THP-1 cells were incubated for 16 vs 72 h under hypoxia, and OCR was
measured in the presence of atpenin A5 (AA5) and rotenone (rot). The basal respiration was set to
100%. (C) ETFA mRNA expression was analyzed in hypoxic THP-1 cells and normalized to TBP (n =
7). (D) ETFDH mRNA expression, normalized to the TATA box binding protein (TBP), was followed
in cells incubated for 16 vs 72 h under hypoxia (n = 7). (E) Western analysis of ETFDH and GAPDH
at the indicated times of hypoxia. (F) Quantification of E (n = 4). Data are mean values ± SEM, * p <0.05.
3.3. An ETFDH Knockdown Decreased Respiration and the Mitochondrial Membrane Potential
To further characterize how ETFs contribute to residual respiration under chronic hypoxia, a
siRNA-mediated knockdown of ETFDH (siETFDH) in THP-1 cells was generated and compared to a
scrambled control (scr) (Figure 3). Knockdown efficacy at the mRNA level was roughly 70% (Figure
3A).

Cells 2019, 8, 172 8 of 17
Figure 3. OCR with a knockdown of ETFDH. (A) THP-1 cells were transfected with siRNA against
ETFDH (siETFDH) or a scrambled control (scr). mRNA expression of ETFDH was analyzed after three
days and normalized to TBP. (B) ETFDH protein was analyzed by Western analysis, with GAPDH
serving as a loading control. (C) OCR of chronic hypoxic scr and siETFDH cells were analyzed. The
buffer served as a negative control for non-cellular OCR. (D) The extracellular acidification rates
(ECAR) of chronic hypoxic scr and siETFDH cells were measured by a Seahorse flux analyzer. (E) Scr
and siETFDH cells were incubated for 72 h under hypoxia, stained with the mitochondrial dye JC-1,
and measured by fluorescence activated cell sorting (FACS). The graph shows the percentage of cells
with a low mitochondrial membrane potential (PE-low and FITC-high) under chronic hypoxia (n = 4).
Data are mean values ± SEM, * p <0.05.
A reduced protein amount was corroborated three days after inducing knockdown, as seen from
Western analysis (Figure 3B). Subsequently, oxygen consumption was measured in scrambled- and
siETFDH-transfected cells when incubated under hypoxia for 72 h (Figures 3C and S2D). Oxygen
consumption markedly declined when ETFDH was missing, with values as low as the buffer control.
As a potential compensatory mechanism, the rate of extracellular acidification increased in these cells
under all conditions (Figures 3D and S2E). Thus, ETFs appear to maintain electron flow through the
respiratory chain under chronic hypoxia, which is a prerequisite for preserving the mitochondrial
membrane potential (ΔΨm) and consequently, healthy mitochondria. To assess the impact of ETFs
on ΔΨm under chronic hypoxia, cells were transfected with siRNAs against ETFDH, and incubated
for 72 h under hypoxia. Afterwards, cells were stained with 1 µM JC-1, a dye, which is taken up by
mitochondria, and emits ΔΨm-sensitive fluorescence (Figures 3E and S2F). In control transfected
cells, about 8% of the cells showed a decreased ΔΨm, which was associated with a low red
fluorescence. In cells with a knockdown of ETFDH, this number increased significantly, to about 23%.
Taking a knockdown efficiency of roughly 70% into account, these data indicate that ETFs are
important for maintaining ΔΨm, and thus, to preserving mitochondrial integrity under chronic
hypoxia.
3.4. Glutamine Metabolism
During the transition from acute to chronic hypoxia, not only did fatty acid oxidation gain
importance, but also glutamine metabolism. Therefore, we analyzed metabolites that were
potentially derived from glutamine, with relevance for the TCA cycle in normoxia vs acute and
chronic hypoxia (Figure 4A). The analyses were performed in MD-MB-231 cells, since adherent
cancer cells are an established model to follow metabolic changes under hypoxia, which has not been
verified for monocytes so far.

Cells 2019, 8, 172 9 of 17
Figure 4. Pathways of glutamine metabolism. (A) MDA-MB-231 cells were incubated for the indicated
time points under hypoxia, and metabolites were measured by mass spectrometry, followed by
heatmap visualization. (B–G) Metabolite concentrations determined under acute and chronic
hypoxia. (H) Scheme linking glutamine processing by glutaminase (Gls), glutamate dehydrogenase
(Glud1), glutamine synthetase (Glul), and aspartate aminotransferase (Got2) to fatty acid metabolism
via ATP-citrate lyase (ACLY), acetyl-CoA carboxylase 1 (ACC1) fatty acid synthase (FASN), carnitine
O-palmitoyltransferase 1 (Cpt1A), and acyl-CoA dehydrogenase (ACAD) which transfers electrons
(e-, green) to ubiquinone (Q) via electron-transferring flavoproteins (ETF). The dashed arrow
indicates the conversion of α-ketoglutarate to citrate under hypoxic conditions. (I–P) THP-1 cells were
incubated for 16 vs 72 h under hypoxia. mRNA expression of Gls1 (I), Gls2 (J), Glud1 (K), Got2 (L),
Glul (M), ACLY (N), ACC1 (O), and FASN (P) was analyzed and normalized to TBP (n = 7). Data are
mean values ± SEM, * p <0.05.
Levels of glutamate, α-ketoglutarate, and isocitrate decreased after 16 and 72 h hypoxia (Figure
4B–D). Citrate significantly increased under chronic hypoxia (Figure 4E), which was also seen for
succinate (Figure 4F). In contrast, fumarate was reduced (Figure 4G), which suggests a diminished
degree of complex II (CII, SDH) activity under chronic hypoxic conditions. Previously, it was noticed
that α-ketoglutarate is converted to citrate under hypoxic conditions [16]. The decrease in α-

Cells 2019, 8, 172 10 of 17
ketoglutarate may indicate that it is metabolized in part to succinate and/or isocitrate, which in turn
accumulates as citrate, which then can be further processed for fatty acids. To substantiate these
considerations, we switched back to THP-1 cells and analyzed the mRNA levels of distinct enzymes
that may account for such alterations.
3.5. Chronic Hypoxia Increased Glutamine and Fatty Acid Metabolism
Since glutamine may contribute to fatty acid synthesis, the mRNA expression of crucial enzymes
involved in glutamine metabolism were analyzed (Figure 4H). Glutaminase (Gls) 1 and Gls2
remained at control level under acute hypoxia, but both were expressed under chronic hypoxic
conditions, with only Gls2 reaching significance (Figure 4I and J). Following the conversion of
glutamine to glutamate, the latter was further processed to α-ketoglutarate by glutamate
dehydrogenase 1 (Glud1), which remained unaltered under hypoxia (Figure 4K). Along those lines,
the expression of aspartate aminotransferase (Got2), which catalyzes the formation of glutamate from
α-ketoglutarate, decreased under chronic hypoxia, while glutamine synthetase (Glul) slightly
increased under acute hypoxia, which reached significance under chronic conditions (Figure 4L,M).
Since the mRNA expression of enzymes involved in α-ketoglutarate synthesis were increased under
chronic hypoxia, which is paralleled by an increase in citrate, the question arose as to whether citrate
might be used for fatty acid synthesis. Therefore, mRNAs of ATP–citrate lyase (ACLY), acetyl-CoA
carboxylase 1 (ACC1), and fatty acid synthase (FASN) were analyzed (Figure 4N–P). While ACLY
and FASN were elevated under chronic hypoxia without reaching significance, mRNA expression of
the rate limiting enzyme ACC1 was significantly increased. These considerations may suggest that
glutamine is used to produce α-ketoglutarate, with a further transformation to citrate. Citrate can be
used for the synthesis of fatty acids, with their breakdown resulting in electron delivery for the ETC,
and then channeled into the respiratory chain via ETFs.
3.6. Complex I Abundance and Oxygen Consumption are Reduced in sg126B Cells
Previous studies showed that the mitochondrial complex I assembly factor TMEM126B is
proteolytically degraded under chronic hypoxia and consequently, the abundance and activity of
complex I were decreased [8]. Here, these findings were corroborated in monocytic THP-1 cells
(Figure 5A,B). This provoked the question of whether cells lacking TMEM126B adapt under ambient
oxygen partial pressure in the ways described for chronic hypoxic cells.

Cells 2019, 8, 172 11 of 17
Figure 5. Characterization of a TMEM126B knockout. (A) Western analysis of TMEM126B vs tubulin,
under acute and chronic hypoxia. (B) Quantification of (A) (n = 3). (C) Knockout THP-1 cells were
generated via CRISPR/Cas9 gene editing using a single guide RNA against TMEM126B (sg126B) or
non-target control (sgC). Western analyses of the indicated clones were performed to validate the
knockout. (D) OCR was measured in sg126B clones compared to sgC controls. (E) Western analyses
of respiratory chain complexes in sgC and sg126B cells. (F) Quantification of (E). Mean values of four
independent experiments are depicted in the graph, * p <0.05.
To mimic the TMEM126B-induced phenotype and thus, a certain aspect of chronic hypoxia
under normoxia, we created a knockout of TMEM126B (sg126B), and a corresponding control (sgC)
in THP-1 cells, using the CRISPR-Cas9 technology. Since a pool of transduced cells showed residual
TMEM126B expression in Western analysis, single cell clones were created. Analysis of TMEM126B
expression in clones 15, 39, 13, 35, and 44 revealed a nearly-complete to complete loss of protein
(Figure 5C). As anticipated, basal respiration of all knockout clones was markedly decreased (Figure
5D). As depicted in Figure 5E and 5F, we verified that the knockout of TMEM126B indeed attenuated
complex I abundance, according to Western analysis of NDUFB8 (complex I). Furthermore, MTCO1
(complex IV), SDHB (complex II, SDH), UQCRC2 (complex III), and ATP5A (complex V) were
analyzed (Figure 5F). A reduced abundance of complex I and a severely compromised OCR
underscored the notion that a knockout of TMEM126B replicated conditions of chronic hypoxia,
although OCR was roughly two to three times higher compared to the OCR observed under chronic
hypoxia.
3.7. OCR in sg126B Cells Demands Fatty Acid Oxidation
The ratio of the OCR under etomoxir treatment, compared to the addition of all inhibitors
(etomoxir, UK5099, BPTES) increased in TMEM126B knockout cells, compared to the non-targeting
controls (Figure 6A). An increased OCR ratio during Cpt1 inhibition, compared to all inhibitors,
implies that the respiratory chain is predominantly fueled by fatty acids in cells when complex I is

Cells 2019, 8, 172 12 of 17
impaired (as seen in sg126B cells). Rates of oxygen consumption were analyzed in all five clones, and
each clone is represented by a different color.
Figure 6. Metabolic alterations in TMEM knockout (sg126B) clones. (A) The Ratio of OCR in sgC and
sg126B clones with the addition of etomoxir, and subsequent supplementation of UK5099, as well as
BPTES. (B–F) mRNA analyses of ETFDH (B), Gls2 (C), Got2 (D), Glul (E), and ACC1 (F) in sgC and
sg126B cells normalized to TBP. Mean values of five independent experiments for each clone are
depicted in the graph, * p <0.05. For individual expression profiles, see figure S3 .
The mRNA expression of ETFDH increased in sg126B clones, which parallels the observations
seen under chronic hypoxia (Figure 6B vs Figure 2D). Conclusively, metabolic adaptations occurring
in TMEM126B knockout cells reflect the conditions occurring under chronic hypoxia. The remaining
low rates of oxygen consumption (Figure 5D) and the residual complex I expression (Figure 5F) may
indicate/guarantee the operation of this fuel pathway at a low but persistent rate.
3.8. Increased Rates of Glutamine and Fatty Acid Metabolism in sg126B Cells
By analogy to chronic hypoxia, genes involved in glutamine metabolism were analyzed in
sg126B clones. Independent experiments were performed in each clone, with the mean values being
depicted in the graphs. Information on mRNA expression in each individual clone can be found in
Supplementary Figure 2. While Gls2 was not regulated, Got2 and Glul were significantly decreased
(Figure 6C–E), supporting the idea that glutamine metabolism is shifted towards α-ketoglutarate.
With relevance to fatty acid synthesis, ACC1 mRNA expression was increased in the sg126B clones
(Figure 6F). Of interest, ACC1, Got2, and ETFDH expression were significantly regulated as seen
under chronic hypoxia. Therefore, it seems advisable to conclude that metabolic alterations seen
under chronic hypoxia are mimicked by a genetic deletion of complex I, which is associated with a
drastically reduction in basal oxygen consumption.

Cells 2019, 8, 172 13 of 17
4. Discussion
While metabolic adaptations under acute hypoxia are reasonably well-studied, the metabolic
flexibility during long-term oxygen deprivation was less explored. Here, we examined the metabolic
changes in THP-1 monocytes during the transition from acute to chronic hypoxia. With prolonged
periods of hypoxia, cells show an increased demand for the oxidization of fatty acids to channel
electrons via ETFs into the respiratory chain. Cellular respiration demands oxygen, and logically, it
is impaired under hypoxia. It is generally accepted that pyruvate dehydrogenase is impaired due to
phosphorylation via PDK1 (pyruvate dehydrogenase kinase 1), which itself is a hypoxia inducible
gene. Therefore, the TCA cycle should be slowed down, and the generation of redox equivalents for
complex I are reduced. With a slower turnover of the TCA cycle, succinate dehydrogenase also may
face reduced substrate availability, and the delivery of electrons via complex II may be impaired.
Along these lines, fatty acids are stored in lipid droplets, making them inaccessible for mitochondrial
β-oxidation. Consequently, channeling electrons via ETFs into the ETC is attenuated. Besides the
generation of reducing equivalents, components of the respiratory chain themselves are also
subjected to hypoxic regulation. However, in this case, conflicting concepts exist. On one hand a
decreased activity of complex I had been noticed, while on the other hand, changes in the complex
formation of cytochrome c oxidase may occur, to maximize the limited usage of oxygen. Even if
respiration under acute hypoxia is reduced, cells continue to maintain some mitochondrial
respiratory activity, as this seems important for cancer cells to survive and to metastasize. The
situation even becomes more blurry if we move from acute to chronic hypoxia. Under chronic
hypoxia, expression of beta-transducin repeat-containing protein 1 (β-TrCP1) is upregulated, which
ubiquitinates and destroys the complex I assembly factor TMEM126B. Consequently, complex
abundance is drastically lowered, and its activity is severely impaired. Compared with acute hypoxia
showing an OCR of roughly 150 pmol/min/100,000 cells, oxygen consumption under chronic hypoxia
drops to values of below 50 pmol/min/100,000 cells. Addressing mitochondrial fuel usage under
chronic hypoxia, we assessed the flexibility of THP-1 cells in oxidizing three critical mitochondrial
fuels, such as glucose, glutamine, or long-chain fatty acids. With a Seahorse flux analyzer, we
followed the rates of substrate oxidation of each fuel, by measuring mitochondrial respiration.
Therefore, we initially inhibited one pathway, followed by blocking the remaining two. Using a
combination of etomoxir, which interferes with the transport of fatty acids into mitochondria,
UK5099, which blocks the transport of pyruvate into mitochondria, and BPTES, which inhibits the
conversion of glutamine to glutamate, the dependency of cells on different substrates can be explored.
Expressing the ratio of OCR with one inhibitor vs all inhibitors allows a standardized output value
and the comparison of data.
For chronically hypoxic THP-1 monocytes, we noticed an unexpected demand for the
oxidization of fatty acids and glutamine, while acutely hypoxic cells appeared to rely on pyruvate,
with a decreased importance of fatty acid oxidation. Also, liver cells attenuated β-oxidation under
acute hypoxia, mediated via HIF-2 [17,18]. Corroborating these findings, the Cpt1-facilitated
mitochondrial uptake of fatty acids is impaired under hypoxia [19]. Pyruvate-dependent respiration
under acute hypoxia is perplexing. However, monocytes, compared to fully differentiated
macrophages, only show a modest upregulation of hypoxic genes [20,21]. The expression of glycolytic
enzymes, as well as the secretion of lactate under hypoxia, was low compared to macrophages
exposed to hypoxia, and they only reached values already found in differentiated monocytes, i.e.,
macrophages under normoxia. Taking the minor regulation of hypoxic genes in monocytes into
consideration, it is no longer surprising that we do see a slight dependence on pyruvate under acute
hypoxia.
During the progression from acute to chronic hypoxia, we noticed a decline of HIF-1α, HIF-2α,
as well as HIF-target gene expression [5,22]. Reaching this new ‘set point’, which is apparently
distinct from acute hypoxic responses, cells may reset their metabolism accordingly. Since electrons
from β-oxidation are transferred via ETFs to ubiquinone, oxygen consumption was measured with
the inhibition of complex I and complex II, leaving ETFs as a possible electron source. Under these
conditions, we noticed an increase in respiration under chronic hypoxia compared to normoxia,
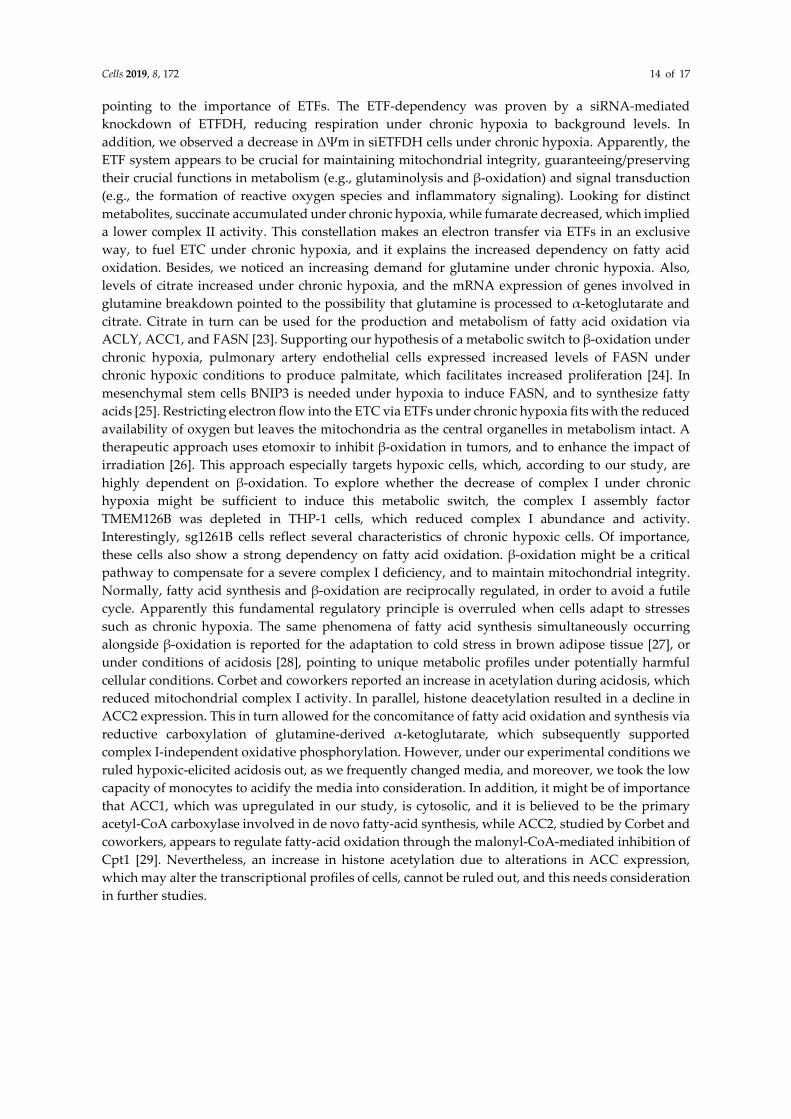
Cells 2019, 8, 172 14 of 17
pointing to the importance of ETFs. The ETF-dependency was proven by a siRNA-mediated
knockdown of ETFDH, reducing respiration under chronic hypoxia to background levels. In
addition, we observed a decrease in ΔΨm in siETFDH cells under chronic hypoxia. Apparently, the
ETF system appears to be crucial for maintaining mitochondrial integrity, guaranteeing/preserving
their crucial functions in metabolism (e.g., glutaminolysis and β-oxidation) and signal transduction
(e.g., the formation of reactive oxygen species and inflammatory signaling). Looking for distinct
metabolites, succinate accumulated under chronic hypoxia, while fumarate decreased, which implied
a lower complex II activity. This constellation makes an electron transfer via ETFs in an exclusive
way, to fuel ETC under chronic hypoxia, and it explains the increased dependency on fatty acid
oxidation. Besides, we noticed an increasing demand for glutamine under chronic hypoxia. Also,
levels of citrate increased under chronic hypoxia, and the mRNA expression of genes involved in
glutamine breakdown pointed to the possibility that glutamine is processed to α-ketoglutarate and
citrate. Citrate in turn can be used for the production and metabolism of fatty acid oxidation via
ACLY, ACC1, and FASN [23]. Supporting our hypothesis of a metabolic switch to β-oxidation under
chronic hypoxia, pulmonary artery endothelial cells expressed increased levels of FASN under
chronic hypoxic conditions to produce palmitate, which facilitates increased proliferation [24]. In
mesenchymal stem cells BNIP3 is needed under hypoxia to induce FASN, and to synthesize fatty
acids [25]. Restricting electron flow into the ETC via ETFs under chronic hypoxia fits with the reduced
availability of oxygen but leaves the mitochondria as the central organelles in metabolism intact. A
therapeutic approach uses etomoxir to inhibit β-oxidation in tumors, and to enhance the impact of
irradiation [26]. This approach especially targets hypoxic cells, which, according to our study, are
highly dependent on β-oxidation. To explore whether the decrease of complex I under chronic
hypoxia might be sufficient to induce this metabolic switch, the complex I assembly factor
TMEM126B was depleted in THP-1 cells, which reduced complex I abundance and activity.
Interestingly, sg1261B cells reflect several characteristics of chronic hypoxic cells. Of importance,
these cells also show a strong dependency on fatty acid oxidation. β-oxidation might be a critical
pathway to compensate for a severe complex I deficiency, and to maintain mitochondrial integrity.
Normally, fatty acid synthesis and β-oxidation are reciprocally regulated, in order to avoid a futile
cycle. Apparently this fundamental regulatory principle is overruled when cells adapt to stresses
such as chronic hypoxia. The same phenomena of fatty acid synthesis simultaneously occurring
alongside β-oxidation is reported for the adaptation to cold stress in brown adipose tissue [27], or
under conditions of acidosis [28], pointing to unique metabolic profiles under potentially harmful
cellular conditions. Corbet and coworkers reported an increase in acetylation during acidosis, which
reduced mitochondrial complex I activity. In parallel, histone deacetylation resulted in a decline in
ACC2 expression. This in turn allowed for the concomitance of fatty acid oxidation and synthesis via
reductive carboxylation of glutamine-derived α-ketoglutarate, which subsequently supported
complex I-independent oxidative phosphorylation. However, under our experimental conditions we
ruled hypoxic-elicited acidosis out, as we frequently changed media, and moreover, we took the low
capacity of monocytes to acidify the media into consideration. In addition, it might be of importance
that ACC1, which was upregulated in our study, is cytosolic, and it is believed to be the primary
acetyl-CoA carboxylase involved in de novo fatty-acid synthesis, while ACC2, studied by Corbet and
coworkers, appears to regulate fatty-acid oxidation through the malonyl-CoA-mediated inhibition of
Cpt1 [29]. Nevertheless, an increase in histone acetylation due to alterations in ACC expression,
which may alter the transcriptional profiles of cells, cannot be ruled out, and this needs consideration
in further studies.

Cells 2019, 8, 172 15 of 17
Figure 7. ETFs fuel the respiratory chain under chronic hypoxia. Under chronic hypoxia, glutamine
is converted to glutamate, and further processed via α-ketoglutarate to citrate. In turn, citrate is used
to produce fatty acids, which are imported into the mitochondria by carnitine O-palmitoyltransferase
1 (Cpt1). During fatty acid catabolism, electrons (e−) are transferred to electron-transferring
flavoproteins (ETFs) and ETF−ubiquinone oxidoreductase (ETFDH). ETFDH channels electrons to
ubiquinone (Q), and from there to complexes III and IV, which pump protons (H) into the
intermembrane space. Inhibitory interferences by etomoxir (Eto), ETFDH knockdown (siETFDH),
TMEM126B knockout (sg126B), and hypoxia are depicted in blue.
Large-scale metabolomic studies and enzyme expression, as well as activity assays, are needed
to further verify our hypothesis, and to generalize conclusions for cells others than monocytes.
Oxygen consumption and mitochondrial fuel analysis under chronic hypoxia, and metabolite
exploration, as well as mRNA expression regulation of glutamine and fatty acid-metabolizing
enzymes, favor electron flow via ETF, rather than complex I or complex II, to maintain mitochondrial
integrity (Figure 7).
Supplementary Materials: The following material is available online at www.mdpi.com/xxx/s1, Figure S1:
Calculation of OCR ratios, Figure S2: Seahorse analyses and membrane potentials of control and siETFDH THP-
1 cells, Figure S3: mRNA analyses of sg126B clones.
Author Contributions: Conceptualization, Dominik Fuhrmann and Bernhard Brüne; methodology, Dominik
Fuhrmann, Frank Schnütgen, Nina Kurrle, Sven Zukunft, and Catherine Olesch; software, Sven Zukunft;
validation, Dominik Fuhrmann, Frank Schnütgen and Catherine Olesch; formal analysis, Bernhard Brüne;
investigation, Dominik Fuhrmann and Catherine Olesch; resources, Bernhard Brüne; data curation, Dominik
Fuhrmann; writing—original draft preparation, Dominik Fuhrmann; writing—review and editing, Bernhard
Brüne and Ingrid Fleming; visualization, Dominik Fuhrmann; supervision, Bernhard Brüne; project
administration, Bernhard Brüne; funding acquisition, Bernhard Brüne.
Funding: This work was supported by the Deutsche Forschungsgemeinschaft [SFB815, projects A8 (B.B), A10
(N.K.), and A16 (I.F)].
Acknowledgments: We thank Tanja Keppler for excellent technical assistance.
Conflicts of Interest: The authors declare no conflict of interest.
References
1. Scholz, C.C.; Taylor, C.T. Targeting the HIF pathway in inflammation and immunity. Curr Opin Pharmacol.
2013, 13, 646–653, doi:10.1016/j.coph.2013.04.009.
2. Palazon, A.; Goldrath, A.W.; Nizet, V.; Johnson, R.S. HIF transcription factors, inflammation, and
immunity. Immunity. 2014, 41, 518–528, doi:10.1016/j.immuni.2014.09.008.

Cells 2019, 8, 172 16 of 17
3. Mucaj, V.; Shay, J.E.; Simon, M.C. Effects of hypoxia and HIFs on cancer metabolism. Int. J. Hematol. 2012,
95, 464–470, doi:10.1007/s12185-012-1070-5.
4. Catrina, S.B.; Okamoto, K.; Pereira, T.; Brismar, K.; Poellinger, L. Hyperglycemia regulates hypoxia-
inducible factor-1alpha protein stability and function. Diabetes. 2004, 53, 3226–3232.
5. Fuhrmann, D.C.; Wittig, I.; Heide, H.; Dehne, N.; Brune, B. Chronic hypoxia alters mitochondrial
composition in human macrophages. BBA-Proteins Proteom. 2013, 1834, 2750–2760,
doi:10.1016/j.bbapap.2013.09.023.
6. Semenza, G.L. Oxygen-dependent regulation of mitochondrial respiration by hypoxia-inducible factor 1.
Biochem. J. 2007, 405, 1–9, doi:10.1042/bj20070389.
7. Tello, D.; Balsa, E.; Acosta-Iborra, B.; Fuertes-Yebra, E.; Elorza, A.; Ordonez, A.; Corral-Escariz, M.; Soro, I.;
López-Bernardo, E.; Perales-Clemente, E. et al. Induction of the mitochondrial NDUFA4L2 protein by HIF-
1alpha decreases oxygen consumption by inhibiting Complex I activity. Cell Metab. 2011, 14, 768–779,
doi:10.1016/j.cmet.2011.10.008.
8. Fuhrmann, D.C.; Wittig, I.; Dröse, S.; Schmid, T.; Dehne, N.; Brüne, B. Degradation of the mitochondrial
complex I assembly factor TMEM126B under chronic hypoxia. Cell Mol. Life Sci. 2018, doi:10.1007/s00018-
018-2779-y.
9. Toogood, H.S.; Leys, D.; Scrutton, N.S. Dynamics driving function: New insights from electron transferring
flavoproteins and partner complexes. FEBS J. 2007, 274, 5481–5504, doi:10.1111/j.1742-4658.2007.06107.x.
10. Watmough, N.J.; Frerman, F.E. The electron transfer flavoprotein: Ubiquinone oxidoreductases. Biochim.
Biophys. Acta 2010, 1797, 1910–1916, doi:10.1016/j.bbabio.2010.10.007.
11. Chohan, K.K.; Jones, M.; Grossmann, J.G.; Frerman, F.E.; Scrutton, N.S.; Sutcliffe, M.J. Protein dynamics
enhance electronic coupling in electron transfer complexes. J. Biol. Chem. 2001, 276, 34142–34147,
doi:10.1074/jbc.M101341200.
12. Leys, D.; Basran, J.; Talfournier, F.; Sutcliffe, M.J.; Scrutton, N.S. Extensive conformational sampling in a
ternary electron transfer complex. Nat. Struct. Biol. 2003, 10, 219–225, doi:10.1038/nsb894.
13. Zhang, J.; Frerman, F.E.; Kim, J.-J.P. Structure of electron transfer flavoprotein-ubiquinone oxidoreductase
and electron transfer to the mitochondrial ubiquinone pool. In Proceedings of the National Academy of Sciences
of the United States of America, Washington DC, DC, USA; 103, 16212–16217, doi:10.1073/pnas.0604567103.
14. Henriques, B.J.; Bross, P.; Gomes, C.M. Mutational hotspots in electron transfer flavoprotein underlie
defective folding and function in multiple acyl-CoA dehydrogenase deficiency. Mol. Basis Dis. 2010, 1802,
1070–1077, doi:10.1016/j.bbadis.2010.07.015.
15. Cornelius, N.; Frerman, F.E.; Corydon, T.J.; Palmfeldt, J.; Bross, P.; Gregersen, N.; Olsen, R.K.J. Molecular
mechanisms of riboflavin responsiveness in patients with ETF-QO variations and multiple acyl-CoA
dehydrogenation deficiency. Hum. Mol. Genet. 2012, 21, 3435–3448, doi:10.1093/hmg/dds175.
16. Wise, D.R.; Ward, P.S.; Shay, J.E.; Cross, J.R.; Gruber, J.J.; Sachdeva, U.M.; Platt, J.M.; Dematteo, R.G.;
Simon, M.C.; Tompson, C.B. Hypoxia promotes isocitrate dehydrogenase-dependent carboxylation of
alpha-ketoglutarate to citrate to support cell growth and viability. In Proceedings of the National Academy of
Sciences of the United States of America, Washington DC, DC, USA, 2011, 108, 19611–19616,
doi:10.1073/pnas.1117773108.
17. Rankin, E.B.; Rha, J.; Selak, M.A.; Unger, T.L.; Keith, B.; Liu, Q.; Haase, V.H. Hypoxia-inducible factor 2
regulates hepatic lipid metabolism. Mol. Cell. Bio. 2009, 29, 4527–4538, doi:10.1128/MCB.00200-09.
18. Cao, R.; Zhao, X.; Li, S.; Zhou, H.; Chen, W.; Ren, L. Zhou, X.; Zhang, H.; Shi, R. Hypoxia induces
dysregulation of lipid metabolism in HepG2 cells via activation of HIF-2α. Cell Physiol. Biochem. 2014, 34,
1427–1441, doi:10.1159/000366348.
19. Du, W.; Zhang, L.; Brett-Morris, A.; Aguila, B.; Kerner, J.; Hoppel, C.L.; et al. HIF drives lipid deposition
and cancer in ccRCC via repression of fatty acid metabolism. Nat. Commun. 2017, 8, 1769,
doi:10.1038/s41467-017-01965-8.
20. Roiniotis, J.; Dinh, H.; Masendycz, P.; Turner, A.; Elsegood, C.L.; Scholz, G.M.; Hamilton, J.A. Hypoxia
prolongs monocyte/macrophage survival and enhanced glycolysis is associated with their maturation
under aerobic conditions. J. Immunol. 2009, 182:7974–7981.
21. Oda, T.; Hirota, K.; Nishi, K.; Takabuchi, S.; Oda, S.; Yamada, H. Activation of hypoxia-inducible factor 1
during macrophage differentiation. Am. J. Physiol. Cell Physiol. 2006, 291, 104–113,
doi:10.1152/ajpcell.00614.2005.

Cells 2019, 8, 172 17 of 17
22. Fuhrmann, D.C.; Tausendschon, M.; Wittig, I.; Steger, M.; Ding, M.G.; Schmid, T.; Dehne, N.; Brune, B.
Inactivation of tristetraprolin in chronic hypoxia provokes the expression of cathepsin B. Mol. Cell. Biol.
2015, 35, 619–630, doi:10.1128/mcb.01034-14.
23. Qian, X.; Yang, Z.; Mao, E.; Chen, E. Regulation of fatty acid synthesis in immune cells. Scand J. Immunol.
2018, 88, 12713, doi:10.1111/sji.12713.
24. Singh, N.; Singh, H.; Jagavelu, K.; Wahajuddin, M.; Hanif, K. Fatty acid synthase modulates proliferation,
metabolic functions and angiogenesis in hypoxic pulmonary artery endothelial cells. Eur. J Pharmacol. 2017,
815, 462–469, doi:10.1016/j.ejphar.2017.09.042.
25. Lee, H.J.; Jung, Y.H.; Choi, G.E.; Ko, S.H.; Lee, S.-J.; Lee, S.H.; Han, H.J. BNIP3 induction by hypoxia
stimulates FASN-dependent free fatty acid production enhancing therapeutic potential of umbilical cord
blood-derived human mesenchymal stem cells. Redox Biol. 2017, 13, 426–443,
doi:10.1016/j.redox.2017.07.004.
26. Dheeraj, A.; Agarwal, C.; Schlaepfer, I.R.; Raben, D.; Singh, R.; Agarwal, R.; Deep, G. A novel approach to
target hypoxic cancer cells via combining β-oxidation inhibitor etomoxir with radiation. Hypoxia. 2018, 6,
23–33, doi:10.2147/HP.S163115.
27. Yu, X.X.; Lewin, D.A.; Forrest, W.; Adams, S.H. Cold elicits the simultaneous induction of fatty acid
synthesis and beta-oxidation in murine brown adipose tissue: Prediction from differential gene expression
and confirmation in vivo. FASEB J. 2002, 16, 155–168, doi:10.1096/fj.01-0568com.
28. Corbet, C.; Pinto, A.; Martherus, R.; Santiago de Jesus, J.P.; Polet, F.; Feron, O. Acidosis Drives the
Reprogramming of Fatty Acid Metabolism in Cancer Cells through Changes in Mitochondrial and Histone
Acetylation. Cell Metab. 2016, 24, 311–323, doi:10.1016/j.cmet.2016.07.003.
29. Castle, J.C.; Hara, Y.; Raymond, C.K.; Garrett-Engele, P.; Ohwaki, K.; Kan, Z. ACC2 is expressed at high
levels in human white adipose and has an isoform with a novel N-terminus corrected. PLoS ONE 2009, 4,
e4369, doi:10.1371/journal.pone.0004369.
© 2018 by the authors. Licensee MDPI, Basel, Switzerland. This article is an open access
article distributed under the terms and conditions of the Creative Commons Attribution
(CC BY) license (http://creativecommons.org/licenses/by/4.0/).
Copyright © 2022 FDOKUMEN