Choosing between the EORTC QLQ-C30 and FACT-G for measuring health-related quality of life in cancer...
12
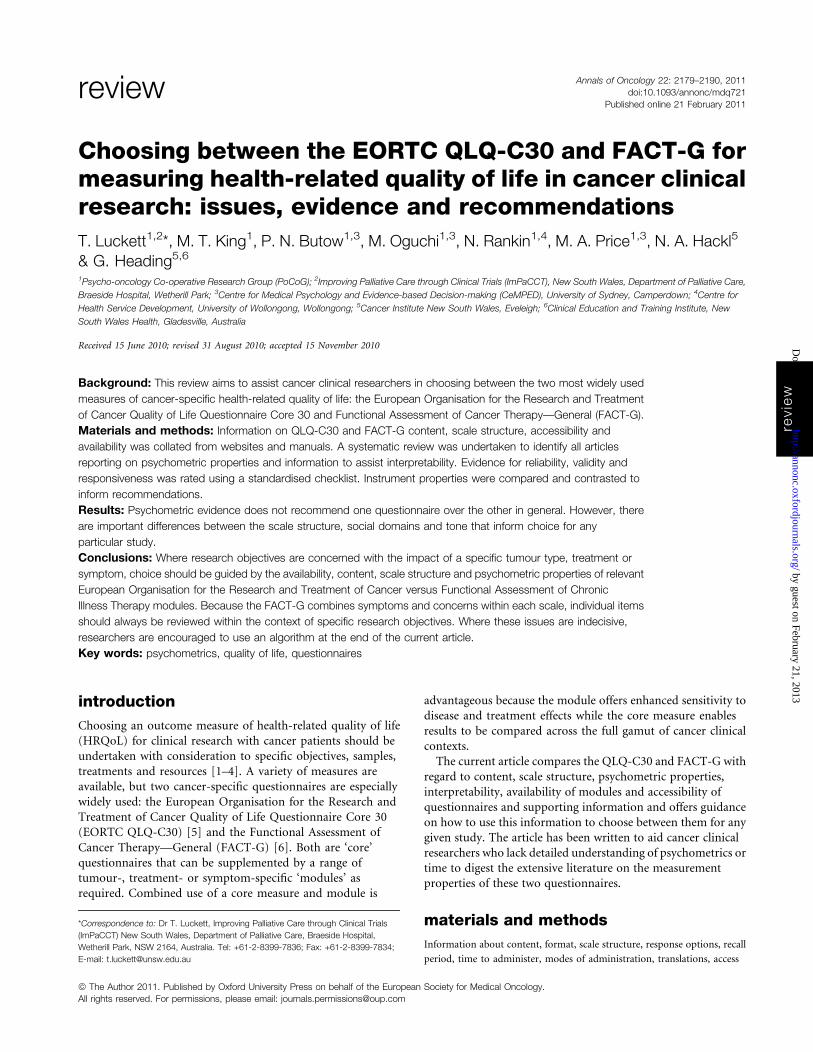
Annals of Oncology 22: 2179–2190, 2011 doi:10.1093/annonc/mdq721 Published online 21 February 2011 review Choosing between the EORTC QLQ-C30 and FACT-G for measuring health-related quality of life in cancer clinical research: issues, evidence and recommendations T. Luckett 1,2 *, M. T. King 1 , P. N. Butow 1,3 , M. Oguchi 1,3 , N. Rankin 1,4 , M. A. Price 1,3 , N. A. Hackl 5 & G. Heading 5,6 1 Psycho-oncology Co-operative Research Group (PoCoG); 2 Improving Palliative Care through Clinical Trials (ImPaCCT), New South Wales, Department of Palliative Care, Braeside Hospital, Wetherill Park; 3 Centre for Medical Psychology and Evidence-based Decision-making (CeMPED), University of Sydney, Camperdown; 4 Centre for Health Service Development, University of Wollongong, Wollongong; 5 Cancer Institute New South Wales, Eveleigh; 6 Clinical Education and Training Institute, New South Wales Health, Gladesville, Australia Received 15 June 2010; revised 31 August 2010; accepted 15 November 2010 Background: This review aims to assist cancer clinical researchers in choosing between the two most widely used measures of cancer-specific health-related quality of life: the European Organisation for the Research and Treatment of Cancer Quality of Life Questionnaire Core 30 and Functional Assessment of Cancer Therapy—General (FACT-G). Materials and methods: Information on QLQ-C30 and FACT-G content, scale structure, accessibility and availability was collated from websites and manuals. A systematic review was undertaken to identify all articles reporting on psychometric properties and information to assist interpretability. Evidence for reliability, validity and responsiveness was rated using a standardised checklist. Instrument properties were compared and contrasted to inform recommendations. Results: Psychometric evidence does not recommend one questionnaire over the other in general. However, there are important differences between the scale structure, social domains and tone that inform choice for any particular study. Conclusions: Where research objectives are concerned with the impact of a specific tumour type, treatment or symptom, choice should be guided by the availability, content, scale structure and psychometric properties of relevant European Organisation for the Research and Treatment of Cancer versus Functional Assessment of Chronic Illness Therapy modules. Because the FACT-G combines symptoms and concerns within each scale, individual items should always be reviewed within the context of specific research objectives. Where these issues are indecisive, researchers are encouraged to use an algorithm at the end of the current article. Key words: psychometrics, quality of life, questionnaires introduction Choosing an outcome measure of health-related quality of life (HRQoL) for clinical research with cancer patients should be undertaken with consideration to specific objectives, samples, treatments and resources [1–4]. A variety of measures are available, but two cancer-specific questionnaires are especially widely used: the European Organisation for the Research and Treatment of Cancer Quality of Life Questionnaire Core 30 (EORTC QLQ-C30) [5] and the Functional Assessment of Cancer Therapy—General (FACT-G) [6]. Both are ‘core’ questionnaires that can be supplemented by a range of tumour-, treatment- or symptom-specific ‘modules’ as required. Combined use of a core measure and module is advantageous because the module offers enhanced sensitivity to disease and treatment effects while the core measure enables results to be compared across the full gamut of cancer clinical contexts. The current article compares the QLQ-C30 and FACT-G with regard to content, scale structure, psychometric properties, interpretability, availability of modules and accessibility of questionnaires and supporting information and offers guidance on how to use this information to choose between them for any given study. The article has been written to aid cancer clinical researchers who lack detailed understanding of psychometrics or time to digest the extensive literature on the measurement properties of these two questionnaires. materials and methods Information about content, format, scale structure, response options, recall period, time to administer, modes of administration, translations, access review *Correspondence to: Dr T. Luckett, Improving Palliative Care through Clinical Trials (ImPaCCT) New South Wales, Department of Palliative Care, Braeside Hospital, Wetherill Park, NSW 2164, Australia. Tel: +61-2-8399-7836; Fax: +61-2-8399-7834; E-mail: [email protected] ª The Author 2011. Published by Oxford University Press on behalf of the European Society for Medical Oncology. All rights reserved. For permissions, please email: [email protected] by guest on February 21, 2013 http://annonc.oxfordjournals.org/ Downloaded from
-
Upload
independent -
Category
Documents
-
view
1 -
download
0
Transcript of Choosing between the EORTC QLQ-C30 and FACT-G for measuring health-related quality of life in cancer...
Annals of Oncology 22: 2179–2190, 2011
doi:10.1093/annonc/mdq721
Published online 21 February 2011review
Choosing between the EORTC QLQ-C30 and FACT-G formeasuring health-related quality of life in cancer clinicalresearch: issues, evidence and recommendations
T. Luckett1,2*, M. T. King1, P. N. Butow1,3, M. Oguchi1,3, N. Rankin1,4, M. A. Price1,3, N. A. Hackl5
& G. Heading5,6
1Psycho-oncology Co-operative Research Group (PoCoG); 2Improving Palliative Care through Clinical Trials (ImPaCCT), New South Wales, Department of Palliative Care,
Braeside Hospital, Wetherill Park; 3Centre for Medical Psychology and Evidence-based Decision-making (CeMPED), University of Sydney, Camperdown; 4Centre for
Health Service Development, University of Wollongong, Wollongong; 5Cancer Institute New South Wales, Eveleigh; 6Clinical Education and Training Institute, New
South Wales Health, Gladesville, Australia
Received 15 June 2010; revised 31 August 2010; accepted 15 November 2010
Background: This review aims to assist cancer clinical researchers in choosing between the two most widely used
measures of cancer-specific health-related quality of life: the European Organisation for the Research and Treatment
of Cancer Quality of Life Questionnaire Core 30 and Functional Assessment of Cancer Therapy—General (FACT-G).
Materials and methods: Information on QLQ-C30 and FACT-G content, scale structure, accessibility and
availability was collated from websites and manuals. A systematic review was undertaken to identify all articles
reporting on psychometric properties and information to assist interpretability. Evidence for reliability, validity and
responsiveness was rated using a standardised checklist. Instrument properties were compared and contrasted to
inform recommendations.
Results: Psychometric evidence does not recommend one questionnaire over the other in general. However, there
are important differences between the scale structure, social domains and tone that inform choice for any
particular study.
Conclusions: Where research objectives are concerned with the impact of a specific tumour type, treatment or
symptom, choice should be guided by the availability, content, scale structure and psychometric properties of relevant
European Organisation for the Research and Treatment of Cancer versus Functional Assessment of Chronic
Illness Therapy modules. Because the FACT-G combines symptoms and concerns within each scale, individual items
should always be reviewed within the context of specific research objectives. Where these issues are indecisive,
researchers are encouraged to use an algorithm at the end of the current article.
Key words: psychometrics, quality of life, questionnaires
introduction
Choosing an outcome measure of health-related quality of life(HRQoL) for clinical research with cancer patients should beundertaken with consideration to specific objectives, samples,treatments and resources [1–4]. A variety of measures areavailable, but two cancer-specific questionnaires are especiallywidely used: the European Organisation for the Research andTreatment of Cancer Quality of Life Questionnaire Core 30(EORTC QLQ-C30) [5] and the Functional Assessment ofCancer Therapy—General (FACT-G) [6]. Both are ‘core’questionnaires that can be supplemented by a range oftumour-, treatment- or symptom-specific ‘modules’ asrequired. Combined use of a core measure and module is
advantageous because the module offers enhanced sensitivity todisease and treatment effects while the core measure enablesresults to be compared across the full gamut of cancer clinicalcontexts.The current article compares the QLQ-C30 and FACT-G with
regard to content, scale structure, psychometric properties,interpretability, availability of modules and accessibility ofquestionnaires and supporting information and offers guidanceon how to use this information to choose between them for anygiven study. The article has been written to aid cancer clinicalresearchers who lack detailed understanding of psychometrics ortime to digest the extensive literature on the measurementproperties of these two questionnaires.
materials and methods
Information about content, format, scale structure, response options, recall
period, time to administer, modes of administration, translations, access
revie
w
*Correspondence to: Dr T. Luckett, Improving Palliative Care through Clinical Trials
(ImPaCCT) New South Wales, Department of Palliative Care, Braeside Hospital,
Wetherill Park, NSW 2164, Australia. Tel: +61-2-8399-7836; Fax: +61-2-8399-7834;
E-mail: [email protected]
ª The Author 2011. Published by Oxford University Press on behalf of the European Society for Medical Oncology.
All rights reserved. For permissions, please email: [email protected]
by guest on February 21, 2013http://annonc.oxfordjournals.org/
Dow
nloaded from
and available modules was extracted from the QLQ-C30 and FACT-G users’
manuals [5, 6] and websites (http://groups.eortc.be/qol/ and http://
www.facit.org/). A systematic review of the literature was undertaken to
identify all English-language articles reporting evidence for the
psychometric properties of the QLQ-C30 and FACT-G. Relevant articles
were identified via reference to manuals and websites and through searches
of Medline and PsycINFO. Databases were searched in May 2009 using the
name of each questionnaire as a keyword combined with the medical
subject heading (MeSH) term ‘psychometrics’ and the key word
‘psychometric$ OR valid$ OR reliab$’. Results were limited to articles
published since 1993, the year in which original validation articles for both
questionnaires were published [7, 8]. Further papers were identified
manually via the reference lists of returned articles.
We focused exclusively on reports that mentioned reliability, validity,
responsiveness or information useful in interpreting scores of the QLQ-C30
or FACT-G among the aims in their abstracts. Definitions of relevant
properties and the criteria used to evaluate these are given in Table 1. To be
included, an article had to report data on one or more of these properties
for either the QLQ-C30 or FACT-G, or both. Evidence for each property
was independently rated by two reviewers until interrater reliability of
kappa > 0.60 was achieved on at least 25 pairs of ratings. Disagreements
were resolved through discussion. Each reviewer rated a similar proportion
of articles concerned with the QLQ-C30 versus FACT-G.
Because evaluation of psychometric properties is influenced by
methodological and sample variables, special attention was paid to reports
that compared the QLQ-C30 and FACT-G within the same study. We were
also interested in studies that asked patients or health professionals about
their preferences for one instrument over the other. Results from studies
comparing the QLQ-C30 and FACT-G were summarised across reports
with a view to identifying a trend in favour of one or other instrument.
Correlations reported across studies were weighted by sample size and
averaged following a procedure designed to obtain average weighted effect
sizes (ESs) [11].
results
characteristics of the two questionnaires
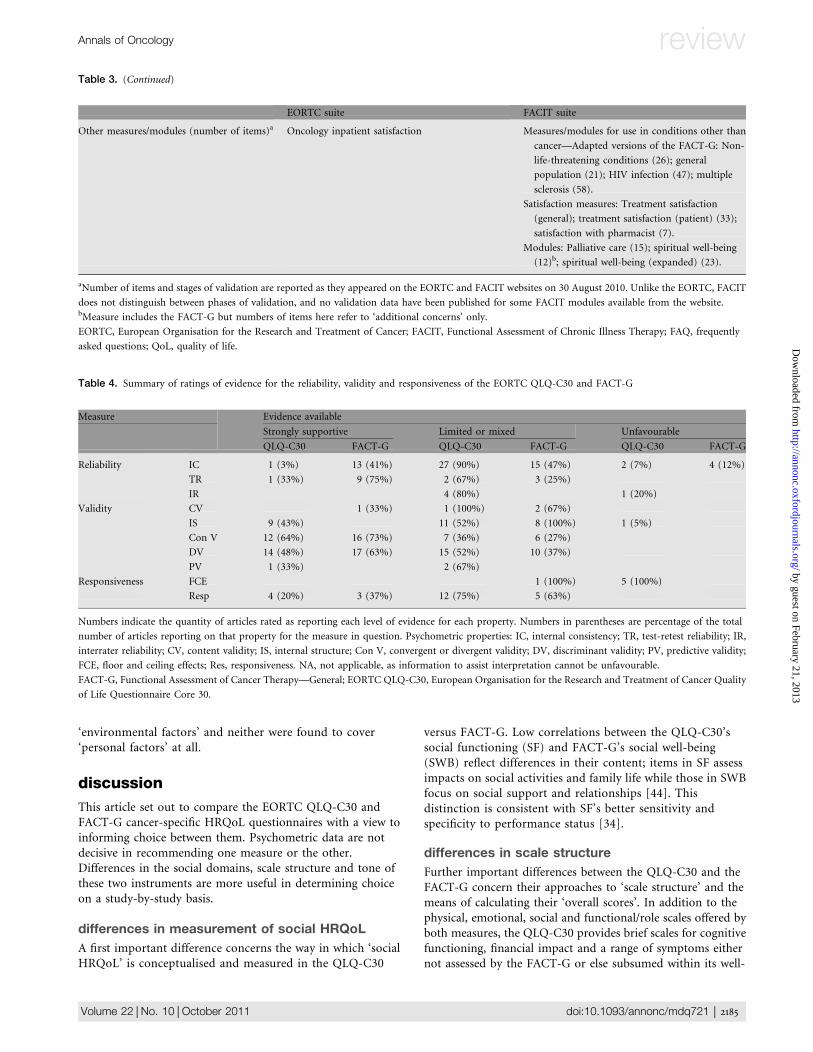
A comparison of QLQ-C30 and FACT-G characteristics ispresented in Table 2. A comparison of the EORTC andFunctional Assessment of Chronic Illness Therapy (FACIT)suites more generally is presented in Table 3.
ratings of evidence for psychometric properties
Database searches returned 382 articles reporting on theQLQ-C30 and 122 on the FACT-G. Of these, and articlesidentified in manuals, on websites and in reference lists, 80articles were found that reported psychometric data amenableto appraisal using our checklist: 46 articles reported data on theQLQ-C30, 32 on the FACT-G, and 2 on both. Interraterreliability of kappa >0.60 was achieved for ratings of internalconsistency (kappa = 0.71), internal structure (kappa = 0.80),convergent validity (kappa = 0.67) and information to assistinterpretation of scores (kappa = 0.63). Other properties werereported too infrequently for interrater reliability to be properlyassessed. In these cases, both reviewers continued to rate eachreport and consensus was reached via discussion. A summary ofratings is presented in Table 4. Details of evidence in specificlanguages and tumour and/or treatment contexts are availableon request.
With regard to ‘reliability’, evidence for internal consistencyand test–retest reliability is more substantial for the FACT-G.However, when comparing ratings for internal consistency, itshould be noted that these typically summarise Cronbach’salphas across nine multi-item scales for the QLQ-C30compared with just five scales for the FACT-G and thatcorresponding scales of the QLQ-C30 contain fewer items.Of the QLQ-C30’s scales, the two-item cognitive functioningscale has most often demonstrated low internal consistency(alpha < 0.70)—in one case, alpha 0.19 [13]. Interraterreliability between self- and proxy-reports has beenevaluated only for the QLQ-C30, with findings from fivestudies yielding mixed results depending on the domainsinvolved [14].Evidence for the ‘validity’ of the QLQ-C30 and FACT-G is
available from a similarly diverse range of populations andclinical settings. However, evidence for content validity isavailable for the QLQ-C30 only from its original validationwith European lung cancer patients [7], while the FACT-G hasundergone content validation in USA patients with mixedcancer diagnoses [8] and further, partial validation in Chinesepatients (cancer types not specified) [15] and Korean stage I–IIIbreast cancer patients [16]. While evidence for internalstructure has been more favourable for the QLQ-C30, this maybe due partly to the different analyses used for the QLQ-C30versus FACT-G: Multitrait scaling has been used most widelyfor the QLQ-C30 and factor and item response theory analysesfor the FACT-G. Numerous studies have provided strongsupport for convergent and discriminant validity of both theQLQ-C30 and FACT-G. Convergent validity for bothinstruments has usually been tested with reference to otherHRQoL measures and/or measures of anxiety, depression ormood. Discriminant validity has usually been tested bycomparing scores from patients grouped by performancestatus, disease stage or treatment status. Ratings of limited weremost often given for these properties due to authors’ lack ofhypotheses rather than failure to converge or discriminatewhere hypotheses had been made. At least some of theQLQ-C30 scales have also been found to predict survival inpatients with mesothelioma [17], prostate [18] and lung [19]cancers.Evidence for ‘responsiveness’ is similar across the QLQ-C30
and FACT-G. Floor and ceiling effects have only been analysedfor the QLQ-C30, with substantial effects of both kinds(particularly ceiling effects) found in most cases.While both questionnaires are available in a large number of
language translations, evidence for the psychometric propertiesof the QLQ-C30 exists for a greater range than for the FACT-G,which has been evaluated principally in American English andSpanish. This probably reflects the origins of the FACT-G in theUnited States and the QLQ-C30 in Europe.
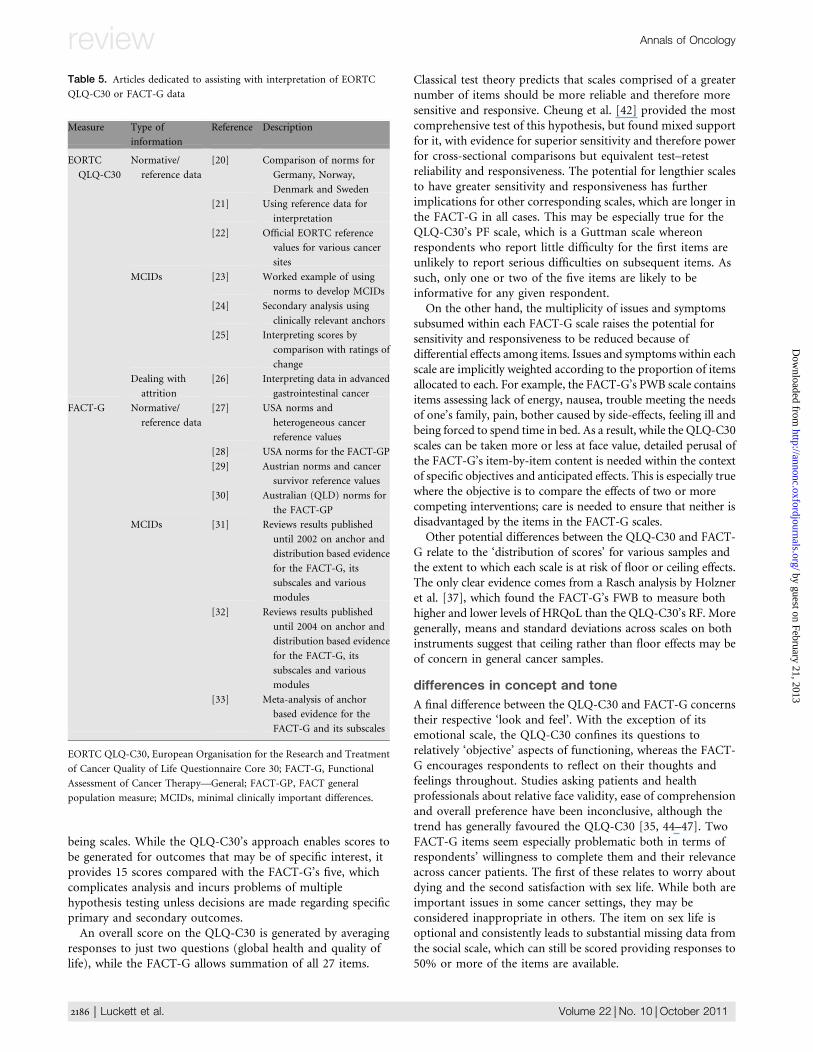
interpretability of scores
Fourteen articles focussed solely on interpreting data from theQLQ-C30 or FACT-G [20–33]. Of these, two [32, 33] werereviews that summarised results from a further eight articles forthe FACT-G and its modules. A summary of these articles ispresented in Table 5.
review Annals of Oncology
2180 | Luckett et al. Volume 22 |No. 10 |October 2011
by guest on February 21, 2013http://annonc.oxfordjournals.org/
Dow
nloaded from
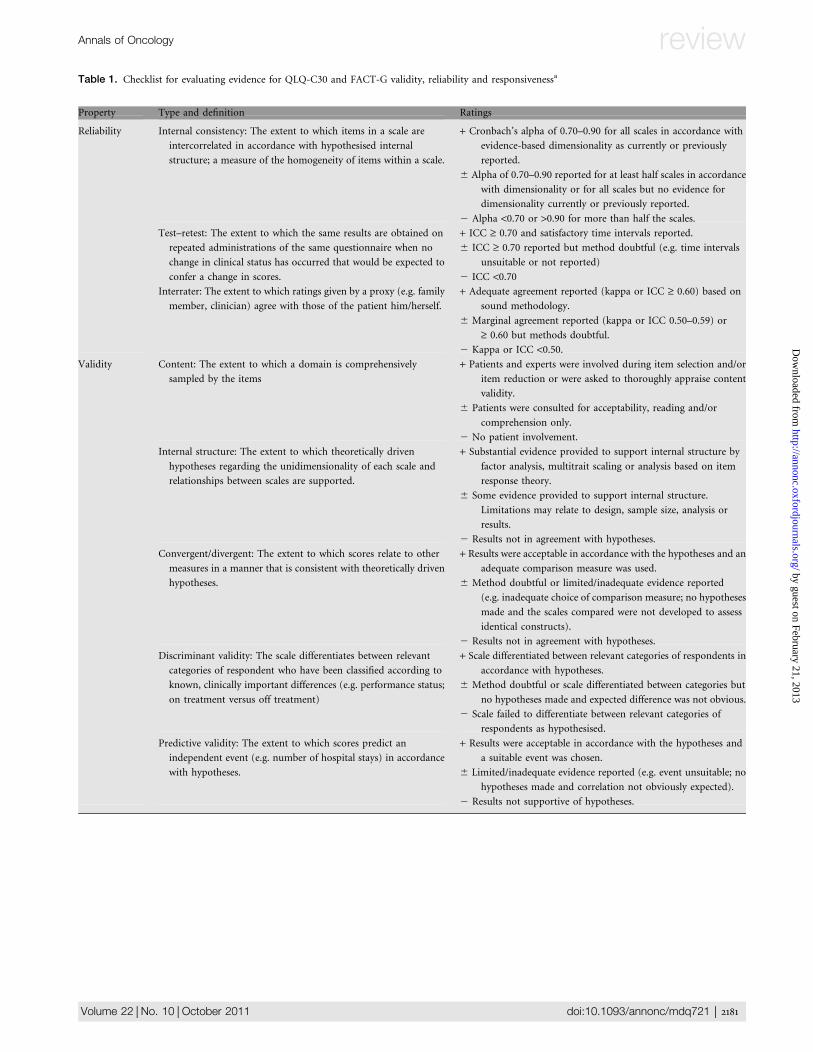
Table 1. Checklist for evaluating evidence for QLQ-C30 and FACT-G validity, reliability and responsivenessa
Property Type and definition Ratings
Reliability Internal consistency: The extent to which items in a scale are
intercorrelated in accordance with hypothesised internal
structure; a measure of the homogeneity of items within a scale.
+ Cronbach’s alpha of 0.70–0.90 for all scales in accordance with
evidence-based dimensionality as currently or previously
reported.
6 Alpha of 0.70–0.90 reported for at least half scales in accordance
with dimensionality or for all scales but no evidence for
dimensionality currently or previously reported.
2 Alpha <0.70 or >0.90 for more than half the scales.
Test–retest: The extent to which the same results are obtained on
repeated administrations of the same questionnaire when no
change in clinical status has occurred that would be expected to
confer a change in scores.
+ ICC ‡ 0.70 and satisfactory time intervals reported.
6 ICC ‡ 0.70 reported but method doubtful (e.g. time intervals
unsuitable or not reported)
2 ICC <0.70Interrater: The extent to which ratings given by a proxy (e.g. family
member, clinician) agree with those of the patient him/herself.
+ Adequate agreement reported (kappa or ICC ‡ 0.60) based on
sound methodology.
6 Marginal agreement reported (kappa or ICC 0.50–0.59) or
‡ 0.60 but methods doubtful.
2 Kappa or ICC <0.50.Validity Content: The extent to which a domain is comprehensively
sampled by the items
+ Patients and experts were involved during item selection and/or
item reduction or were asked to thoroughly appraise content
validity.
6 Patients were consulted for acceptability, reading and/or
comprehension only.
2 No patient involvement.
Internal structure: The extent to which theoretically driven
hypotheses regarding the unidimensionality of each scale and
relationships between scales are supported.
+ Substantial evidence provided to support internal structure by
factor analysis, multitrait scaling or analysis based on item
response theory.
6 Some evidence provided to support internal structure.
Limitations may relate to design, sample size, analysis or
results.
2 Results not in agreement with hypotheses.
Convergent/divergent: The extent to which scores relate to other
measures in a manner that is consistent with theoretically driven
hypotheses.
+ Results were acceptable in accordance with the hypotheses and an
adequate comparison measure was used.
6 Method doubtful or limited/inadequate evidence reported
(e.g. inadequate choice of comparison measure; no hypotheses
made and the scales compared were not developed to assess
identical constructs).
2 Results not in agreement with hypotheses.
Discriminant validity: The scale differentiates between relevant
categories of respondent who have been classified according to
known, clinically important differences (e.g. performance status;
on treatment versus off treatment)
+ Scale differentiated between relevant categories of respondents in
accordance with hypotheses.
6 Method doubtful or scale differentiated between categories but
no hypotheses made and expected difference was not obvious.
2 Scale failed to differentiate between relevant categories of
respondents as hypothesised.
Predictive validity: The extent to which scores predict an
independent event (e.g. number of hospital stays) in accordance
with hypotheses.
+ Results were acceptable in accordance with the hypotheses and
a suitable event was chosen.
6 Limited/inadequate evidence reported (e.g. event unsuitable; no
hypotheses made and correlation not obviously expected).
2 Results not supportive of hypotheses.
Annals of Oncology review
Volume 22 |No. 10 | October 2011 doi:10.1093/annonc/mdq721 | 2181
by guest on February 21, 2013http://annonc.oxfordjournals.org/
Dow
nloaded from
articles comparing the QLQ-C30 and FACT-G
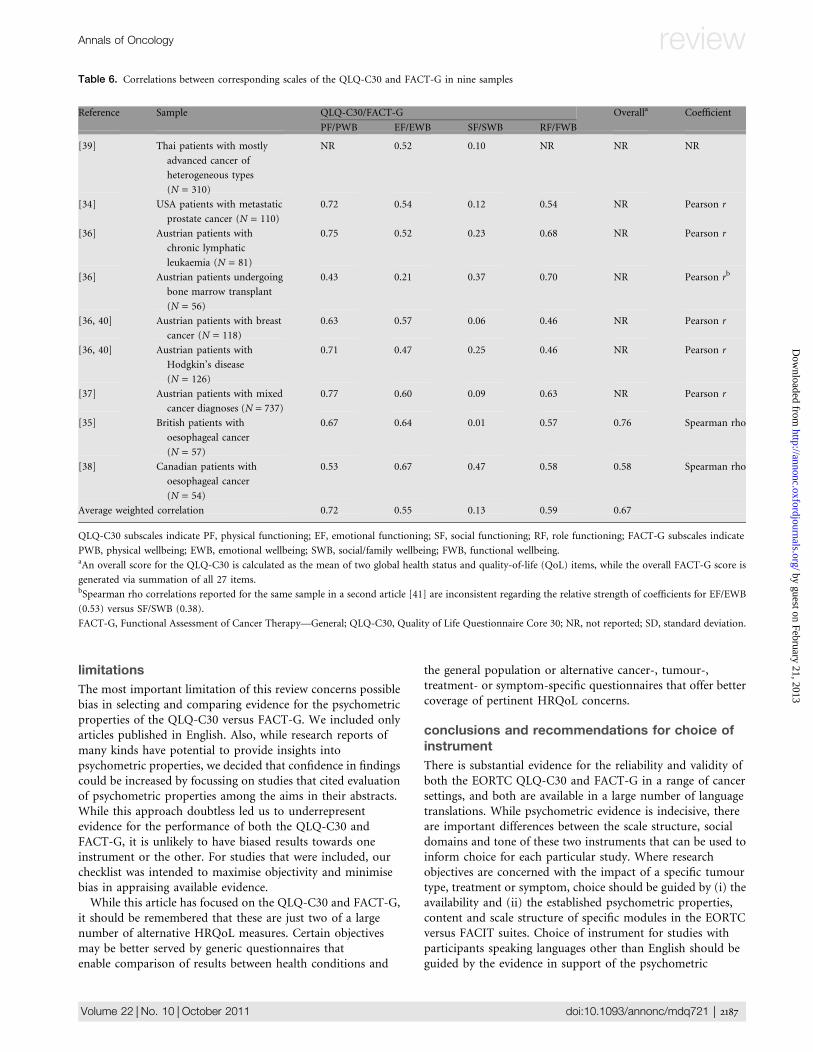
Fourteen articles compared the QLQ-C30 and FACT-Gwithin the same study [34–47]. Since comparisons of thiskind offer the most useful information about relativeperformance, findings from each are discussed in some detailbelow.
psychometric comparisons. direct comparisons. Eight articlesreported direct comparisons between the QLQ-C30 andFACT-G, either in the form of correlations or distribution ofscores. Correlations between corresponding scales in ninesamples have generally been moderate (0.30–0.49) to high(‡0.50), except for the social domain, in which correlationshave generally been low (<0.30) (Table 6).Two articles used Rasch analyses to compare scale structure
and distribution of scores on the QLQ-C30 and FACT-G [37,43]. Chang and Cella [43] found that the QLQ-C30 hadsuperior item efficiency [defined as person separation (an indexof the ability of items to discriminate participants) divided bythe square root of the number of items] while the FACT-Gshowed better precision (lower standard error of the mean) inmeasuring the HRQoL of participants with cancer and/or HIV(N = 1163) in the middle of the HRQoL range. Holzner et al.[37] compared the linearity of physical functioning (PF)/physical well-being (PWB), emotional functioning (EF)/emotional well-being (EWB) and role functioning (RF)/functional wellbeing (FWB) in patients with mixed cancerdiagnoses (N = 737) and found FACT-G’s FWB extended tomore extreme levels than QLQ-C30’s RF at both ends, leadingto greater ceiling effects (defined as a considerable proportionof observations at the maximum possible score) and (to a lesserextent) floor effects (a considerable proportion of observationsat the minimum possible score) on the QLQ-C30. Holzner
et al. attributed this finding to the fewer items in RF (twoitems) versus FWB (seven items).
indirect comparisons. Two articles compared scores on theQLQ-C30 and FACT-G in relation to a thirdmeasure—performance status [34, 42]. It should be noted thatperformance status is a clinician-rated construct different frompatient-reported HRQoL. As such, performance status does notprovide a gold standard but rather a context in which tointerpret HRQoL scores. Sharp et al. [34] compared eachquestionnaire’s sensitivity and specificity to high versus lowKarnofsky performance status (KPS) in men with metastaticprostate cancer (N = 110). They used the areas under thereceiver operating characteristic curve (AUC) as a measure ofhow accurately each instrument categorised patients’ KPS. Thevalue for AUC ranges from 0 to 1 and can be interpreted asfollows. A value of 1 represents perfect classification, 100%sensitivity (no false negatives) and 100% specificity (no falsepositives). A completely random guess would give a point alonga diagonal line, with AUC of 0.5. The values for the QLQ-C30and the FACT-G, respectively, were physical (PF = 0.71; PWB =0.80), emotional (EF = 0.64; EWB = 0.58), social (SF = 0.79;SWB = 0.59), functional/role (RF = 0.81; FWB = 0.82) andoverall quality of life (QoL) (QLQ-C30 global health status/QoL = 0.74; FACT-G total score = 0.72). Corresponding scalesof the two instruments thus performed similarly with theexception of the social, where the QLQ-C30 had a better ratioof true positives to false positives when identifying level of KPS.Cheung et al. [42] compared the ability of the QLQ-C30
global score and the FACT-G total score to discriminatebetween patients with mixed cancer diagnoses (N = 437)grouped according to Eastern Cooperative Oncology Group(ECOG) performance status of zero to one versus two to four at
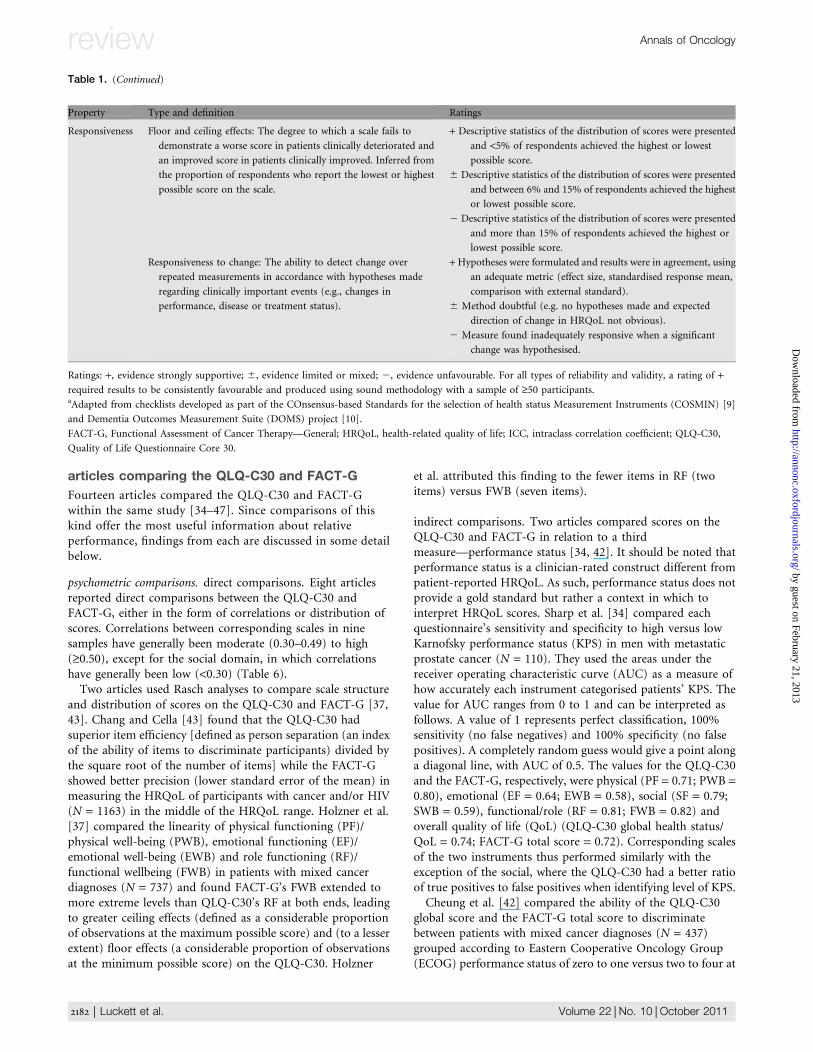
Table 1. (Continued)
Property Type and definition Ratings
Responsiveness Floor and ceiling effects: The degree to which a scale fails to
demonstrate a worse score in patients clinically deteriorated and
an improved score in patients clinically improved. Inferred from
the proportion of respondents who report the lowest or highest
possible score on the scale.
+ Descriptive statistics of the distribution of scores were presented
and <5% of respondents achieved the highest or lowest
possible score.
6 Descriptive statistics of the distribution of scores were presented
and between 6% and 15% of respondents achieved the highest
or lowest possible score.
2 Descriptive statistics of the distribution of scores were presented
and more than 15% of respondents achieved the highest or
lowest possible score.
Responsiveness to change: The ability to detect change over
repeated measurements in accordance with hypotheses made
regarding clinically important events (e.g., changes in
performance, disease or treatment status).
+Hypotheses were formulated and results were in agreement, using
an adequate metric (effect size, standardised response mean,
comparison with external standard).
6 Method doubtful (e.g. no hypotheses made and expected
direction of change in HRQoL not obvious).
2 Measure found inadequately responsive when a significant
change was hypothesised.
Ratings: +, evidence strongly supportive; 6, evidence limited or mixed; 2, evidence unfavourable. For all types of reliability and validity, a rating of +required results to be consistently favourable and produced using sound methodology with a sample of ‡50 participants.aAdapted from checklists developed as part of the COnsensus-based Standards for the selection of health status Measurement Instruments (COSMIN) [9]
and Dementia Outcomes Measurement Suite (DOMS) project [10].
FACT-G, Functional Assessment of Cancer Therapy—General; HRQoL, health-related quality of life; ICC, intraclass correlation coefficient; QLQ-C30,
Quality of Life Questionnaire Core 30.
review Annals of Oncology
2182 | Luckett et al. Volume 22 |No. 10 |October 2011
by guest on February 21, 2013http://annonc.oxfordjournals.org/
Dow
nloaded from
baseline and to detect changes in performance status at 4-weekfollow-up. They used two indices commonly used in samplesize calculation, ES and coefficient of variation (CV) tocompare the sample sizes that would be needed by eachmeasure to identify a similar effect. The ES is the ratio of themean difference to its standard deviation, and the CV is theratio of the standard deviation to the mean. Both ratios areunit-less because the numerator and denominator are in thesame measurement units. ES allows HRQoL effects measuredon different scales to be directly compared in terms of thevariability among individuals, or ‘standard deviation units’. ESvalues were 1.01 [95% confidence interval (CI) 0.84–1.20] forthe FACT-G and 0.80 (95% CI 0.64–0.96) for the QLQ-C30,giving a ratio of ES of 1.25 (95% CI 1.01–1.56). LongitudinalESs were calculated for the subgroup of patients whoseperformance status had improved or deteriorated from 0–1versus 2–4 over the same time period. ES values were 0.55 (95%CI 0.30–0.80) for the FACT-G and 0.54 (95% CI 0.31–0.77) forthe QLQ-C30, giving a ratio of ES of 1.03 (95% CI 0.57–1.96).The authors concluded from these findings that the QLQ-C30global QoL scale would need a sample size 57% larger than thatof the FACT-G total score to detect a difference between lowerversus higher ECOG performance status with a power of 80%.However, this interpretation did not take into account the factthat CV comprises both true variability and error variation, soshould be treated with caution. Cheung et al. found that the
test–retest reliability of the two measures was similar forpatients who did not change performance status (r = 0.73FACT-G, r = 0.64 QLQ-C30, P > 0.05).
content comparisons
Five studies asked patients to state their preferences aboutEORTC versus FACIT measures; one also asked healthprofessionals [35, 44–47] (Table 7). There was no clear patternin terms of preference, complicated by variation in the pools ofquestionnaires referred to and inconsistency in statisticalcomparison. However, the French version of the FACT-G wasreported to be inadequately worded and intrusive by abouta quarter of patients, considerably more than for the QLQ-C30[45]. Results from patients and health professionals werediscordant, with patients favouring the QLQ-C30 but healthprofessionals the FACT-G [47]. An important potentialconsequence of these issues is failure to complete all questions.Missing item rates, where reported, were low but tended to beslightly higher for the FACT-G.A further article [48] compared the content of the QLQ-
C30 and FACT-G and their respective modules for head andneck cancer against the International Classification ofFunctioning, Disability and Health [49]. The QLQ-C30 wasfound to offer more comprehensive coverage of conceptsrelating to ‘body functions’ and ‘activities and participation’.Each was found to offer similarly scant coverage of contextual
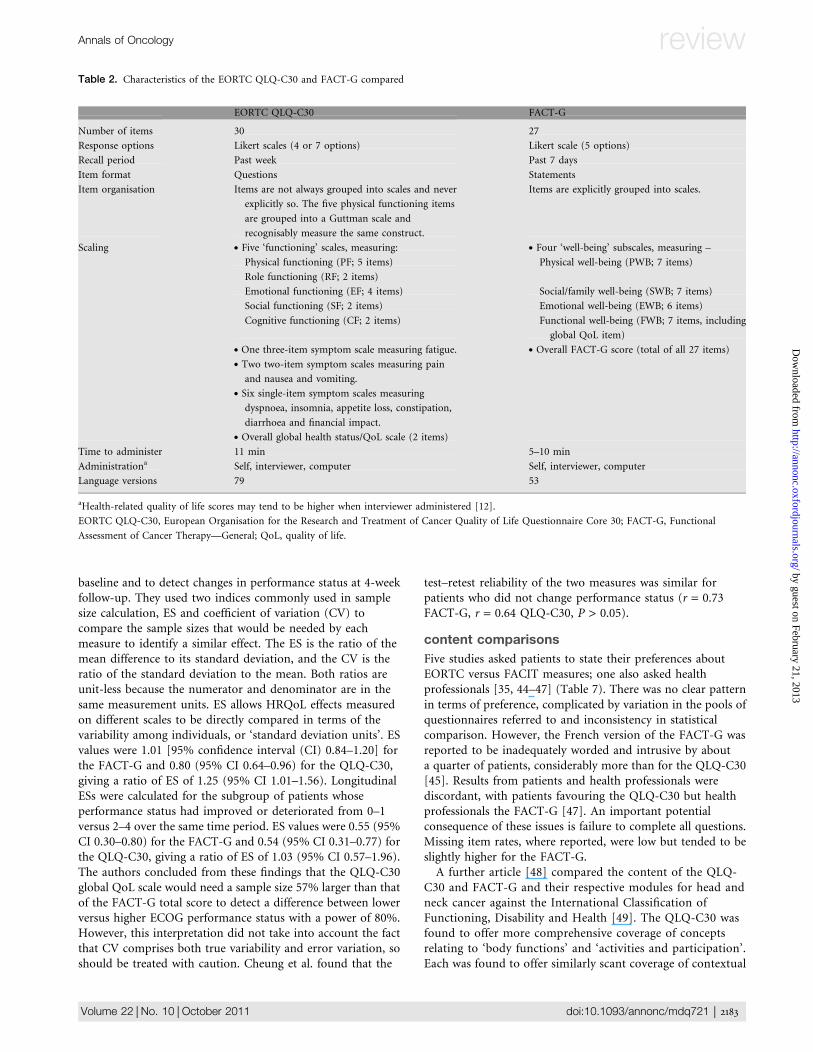
Table 2. Characteristics of the EORTC QLQ-C30 and FACT-G compared
EORTC QLQ-C30 FACT-G
Number of items 30 27
Response options Likert scales (4 or 7 options) Likert scale (5 options)
Recall period Past week Past 7 days
Item format Questions Statements
Item organisation Items are not always grouped into scales and never
explicitly so. The five physical functioning items
are grouped into a Guttman scale and
recognisably measure the same construct.
Items are explicitly grouped into scales.
Scaling d Five ‘functioning’ scales, measuring: d Four ‘well-being’ subscales, measuring –
Physical functioning (PF; 5 items) Physical well-being (PWB; 7 items)
Role functioning (RF; 2 items)
Emotional functioning (EF; 4 items) Social/family well-being (SWB; 7 items)
Social functioning (SF; 2 items) Emotional well-being (EWB; 6 items)
Cognitive functioning (CF; 2 items) Functional well-being (FWB; 7 items, including
global QoL item)
d One three-item symptom scale measuring fatigue. d Overall FACT-G score (total of all 27 items)
d Two two-item symptom scales measuring pain
and nausea and vomiting.
d Six single-item symptom scales measuring
dyspnoea, insomnia, appetite loss, constipation,
diarrhoea and financial impact.
d Overall global health status/QoL scale (2 items)
Time to administer 11 min 5–10 min
Administrationa Self, interviewer, computer Self, interviewer, computer
Language versions 79 53
aHealth-related quality of life scores may tend to be higher when interviewer administered [12].
EORTC QLQ-C30, European Organisation for the Research and Treatment of Cancer Quality of Life Questionnaire Core 30; FACT-G, Functional
Assessment of Cancer Therapy—General; QoL, quality of life.
Annals of Oncology review
Volume 22 |No. 10 | October 2011 doi:10.1093/annonc/mdq721 | 2183
by guest on February 21, 2013http://annonc.oxfordjournals.org/
Dow
nloaded from
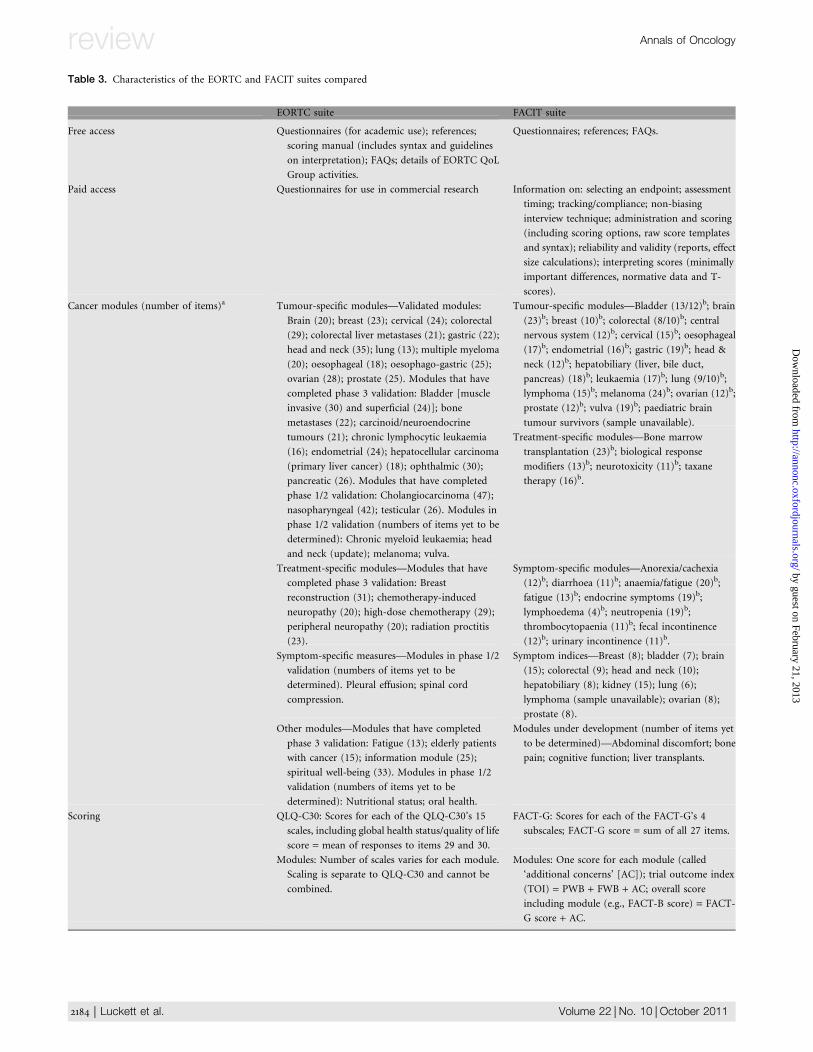
Table 3. Characteristics of the EORTC and FACIT suites compared
EORTC suite FACIT suite
Free access Questionnaires (for academic use); references;
scoring manual (includes syntax and guidelines
on interpretation); FAQs; details of EORTC QoL
Group activities.
Questionnaires; references; FAQs.
Paid access Questionnaires for use in commercial research Information on: selecting an endpoint; assessment
timing; tracking/compliance; non-biasing
interview technique; administration and scoring
(including scoring options, raw score templates
and syntax); reliability and validity (reports, effect
size calculations); interpreting scores (minimally
important differences, normative data and T-
scores).
Cancer modules (number of items)a Tumour-specific modules—Validated modules:
Brain (20); breast (23); cervical (24); colorectal
(29); colorectal liver metastases (21); gastric (22);
head and neck (35); lung (13); multiple myeloma
(20); oesophageal (18); oesophago-gastric (25);
ovarian (28); prostate (25). Modules that have
completed phase 3 validation: Bladder [muscle
invasive (30) and superficial (24)]; bone
metastases (22); carcinoid/neuroendocrine
tumours (21); chronic lymphocytic leukaemia
(16); endometrial (24); hepatocellular carcinoma
(primary liver cancer) (18); ophthalmic (30);
pancreatic (26). Modules that have completed
phase 1/2 validation: Cholangiocarcinoma (47);
nasopharyngeal (42); testicular (26). Modules in
phase 1/2 validation (numbers of items yet to be
determined): Chronic myeloid leukaemia; head
and neck (update); melanoma; vulva.
Tumour-specific modules—Bladder (13/12)b; brain
(23)b; breast (10)b; colorectal (8/10)b; central
nervous system (12)b; cervical (15)b; oesophageal
(17)b; endometrial (16)b; gastric (19)b; head &
neck (12)b; hepatobiliary (liver, bile duct,
pancreas) (18)b; leukaemia (17)b; lung (9/10)b;
lymphoma (15)b; melanoma (24)b; ovarian (12)b;
prostate (12)b; vulva (19)b; paediatric brain
tumour survivors (sample unavailable).
Treatment-specific modules—Bone marrow
transplantation (23)b; biological response
modifiers (13)b; neurotoxicity (11)b; taxane
therapy (16)b.
Treatment-specific modules—Modules that have
completed phase 3 validation: Breast
reconstruction (31); chemotherapy-induced
neuropathy (20); high-dose chemotherapy (29);
peripheral neuropathy (20); radiation proctitis
(23).
Symptom-specific modules—Anorexia/cachexia
(12)b; diarrhoea (11)b; anaemia/fatigue (20)b;
fatigue (13)b; endocrine symptoms (19)b;
lymphoedema (4)b; neutropenia (19)b;
thrombocytopaenia (11)b; fecal incontinence
(12)b; urinary incontinence (11)b.
Symptom-specific measures—Modules in phase 1/2
validation (numbers of items yet to be
determined). Pleural effusion; spinal cord
compression.
Symptom indices—Breast (8); bladder (7); brain
(15); colorectal (9); head and neck (10);
hepatobiliary (8); kidney (15); lung (6);
lymphoma (sample unavailable); ovarian (8);
prostate (8).
Other modules—Modules that have completed
phase 3 validation: Fatigue (13); elderly patients
with cancer (15); information module (25);
spiritual well-being (33). Modules in phase 1/2
validation (numbers of items yet to be
determined): Nutritional status; oral health.
Modules under development (number of items yet
to be determined)—Abdominal discomfort; bone
pain; cognitive function; liver transplants.
Scoring QLQ-C30: Scores for each of the QLQ-C30’s 15
scales, including global health status/quality of life
score = mean of responses to items 29 and 30.
FACT-G: Scores for each of the FACT-G’s 4
subscales; FACT-G score = sum of all 27 items.
Modules: Number of scales varies for each module.
Scaling is separate to QLQ-C30 and cannot be
combined.
Modules: One score for each module (called
‘additional concerns’ [AC]); trial outcome index
(TOI) = PWB + FWB + AC; overall score
including module (e.g., FACT-B score) = FACT-
G score + AC.
review Annals of Oncology
2184 | Luckett et al. Volume 22 |No. 10 |October 2011
by guest on February 21, 2013http://annonc.oxfordjournals.org/
Dow
nloaded from
‘environmental factors’ and neither were found to cover‘personal factors’ at all.
discussion
This article set out to compare the EORTC QLQ-C30 andFACT-G cancer-specific HRQoL questionnaires with a view toinforming choice between them. Psychometric data are notdecisive in recommending one measure or the other.Differences in the social domains, scale structure and tone ofthese two instruments are more useful in determining choiceon a study-by-study basis.
differences in measurement of social HRQoL
A first important difference concerns the way in which ‘socialHRQoL’ is conceptualised and measured in the QLQ-C30
versus FACT-G. Low correlations between the QLQ-C30’ssocial functioning (SF) and FACT-G’s social well-being(SWB) reflect differences in their content; items in SF assessimpacts on social activities and family life while those in SWBfocus on social support and relationships [44]. Thisdistinction is consistent with SF’s better sensitivity andspecificity to performance status [34].
differences in scale structure
Further important differences between the QLQ-C30 and theFACT-G concern their approaches to ‘scale structure’ and themeans of calculating their ‘overall scores’. In addition to thephysical, emotional, social and functional/role scales offered byboth measures, the QLQ-C30 provides brief scales for cognitivefunctioning, financial impact and a range of symptoms eithernot assessed by the FACT-G or else subsumed within its well-
Table 3. (Continued)
EORTC suite FACIT suite
Other measures/modules (number of items)a Oncology inpatient satisfaction Measures/modules for use in conditions other than
cancer—Adapted versions of the FACT-G: Non-
life-threatening conditions (26); general
population (21); HIV infection (47); multiple
sclerosis (58).
Satisfaction measures: Treatment satisfaction
(general); treatment satisfaction (patient) (33);
satisfaction with pharmacist (7).
Modules: Palliative care (15); spiritual well-being
(12)b; spiritual well-being (expanded) (23).
aNumber of items and stages of validation are reported as they appeared on the EORTC and FACIT websites on 30 August 2010. Unlike the EORTC, FACIT
does not distinguish between phases of validation, and no validation data have been published for some FACIT modules available from the website.bMeasure includes the FACT-G but numbers of items here refer to ‘additional concerns’ only.
EORTC, European Organisation for the Research and Treatment of Cancer; FACIT, Functional Assessment of Chronic Illness Therapy; FAQ, frequently
asked questions; QoL, quality of life.
Table 4. Summary of ratings of evidence for the reliability, validity and responsiveness of the EORTC QLQ-C30 and FACT-G
Measure Evidence available
Strongly supportive Limited or mixed Unfavourable
QLQ-C30 FACT-G QLQ-C30 FACT-G QLQ-C30 FACT-G
Reliability IC 1 (3%) 13 (41%) 27 (90%) 15 (47%) 2 (7%) 4 (12%)
TR 1 (33%) 9 (75%) 2 (67%) 3 (25%)
IR 4 (80%) 1 (20%)
Validity CV 1 (33%) 1 (100%) 2 (67%)
IS 9 (43%) 11 (52%) 8 (100%) 1 (5%)
Con V 12 (64%) 16 (73%) 7 (36%) 6 (27%)
DV 14 (48%) 17 (63%) 15 (52%) 10 (37%)
PV 1 (33%) 2 (67%)
Responsiveness FCE 1 (100%) 5 (100%)
Resp 4 (20%) 3 (37%) 12 (75%) 5 (63%)
Numbers indicate the quantity of articles rated as reporting each level of evidence for each property. Numbers in parentheses are percentage of the total
number of articles reporting on that property for the measure in question. Psychometric properties: IC, internal consistency; TR, test-retest reliability; IR,
interrater reliability; CV, content validity; IS, internal structure; Con V, convergent or divergent validity; DV, discriminant validity; PV, predictive validity;
FCE, floor and ceiling effects; Res, responsiveness. NA, not applicable, as information to assist interpretation cannot be unfavourable.
FACT-G, Functional Assessment of Cancer Therapy—General; EORTC QLQ-C30, European Organisation for the Research and Treatment of Cancer Quality
of Life Questionnaire Core 30.
Annals of Oncology review
Volume 22 |No. 10 | October 2011 doi:10.1093/annonc/mdq721 | 2185
by guest on February 21, 2013http://annonc.oxfordjournals.org/
Dow
nloaded from
being scales. While the QLQ-C30’s approach enables scores tobe generated for outcomes that may be of specific interest, itprovides 15 scores compared with the FACT-G’s five, whichcomplicates analysis and incurs problems of multiplehypothesis testing unless decisions are made regarding specificprimary and secondary outcomes.An overall score on the QLQ-C30 is generated by averaging
responses to just two questions (global health and quality oflife), while the FACT-G allows summation of all 27 items.
Classical test theory predicts that scales comprised of a greaternumber of items should be more reliable and therefore moresensitive and responsive. Cheung et al. [42] provided the mostcomprehensive test of this hypothesis, but found mixed supportfor it, with evidence for superior sensitivity and therefore powerfor cross-sectional comparisons but equivalent test–retestreliability and responsiveness. The potential for lengthier scalesto have greater sensitivity and responsiveness has furtherimplications for other corresponding scales, which are longer inthe FACT-G in all cases. This may be especially true for theQLQ-C30’s PF scale, which is a Guttman scale whereonrespondents who report little difficulty for the first items areunlikely to report serious difficulties on subsequent items. Assuch, only one or two of the five items are likely to beinformative for any given respondent.On the other hand, the multiplicity of issues and symptoms
subsumed within each FACT-G scale raises the potential forsensitivity and responsiveness to be reduced because ofdifferential effects among items. Issues and symptoms within eachscale are implicitly weighted according to the proportion of itemsallocated to each. For example, the FACT-G’s PWB scale containsitems assessing lack of energy, nausea, trouble meeting the needsof one’s family, pain, bother caused by side-effects, feeling ill andbeing forced to spend time in bed. As a result, while the QLQ-C30scales can be taken more or less at face value, detailed perusal ofthe FACT-G’s item-by-item content is needed within the contextof specific objectives and anticipated effects. This is especially truewhere the objective is to compare the effects of two or morecompeting interventions; care is needed to ensure that neither isdisadvantaged by the items in the FACT-G scales.Other potential differences between the QLQ-C30 and FACT-
G relate to the ‘distribution of scores’ for various samples andthe extent to which each scale is at risk of floor or ceiling effects.The only clear evidence comes from a Rasch analysis by Holzneret al. [37], which found the FACT-G’s FWB to measure bothhigher and lower levels of HRQoL than the QLQ-C30’s RF. Moregenerally, means and standard deviations across scales on bothinstruments suggest that ceiling rather than floor effects may beof concern in general cancer samples.
differences in concept and tone
A final difference between the QLQ-C30 and FACT-G concernstheir respective ‘look and feel’. With the exception of itsemotional scale, the QLQ-C30 confines its questions torelatively ‘objective’ aspects of functioning, whereas the FACT-G encourages respondents to reflect on their thoughts andfeelings throughout. Studies asking patients and healthprofessionals about relative face validity, ease of comprehensionand overall preference have been inconclusive, although thetrend has generally favoured the QLQ-C30 [35, 44–47]. TwoFACT-G items seem especially problematic both in terms ofrespondents’ willingness to complete them and their relevanceacross cancer patients. The first of these relates to worry aboutdying and the second satisfaction with sex life. While both areimportant issues in some cancer settings, they may beconsidered inappropriate in others. The item on sex life isoptional and consistently leads to substantial missing data fromthe social scale, which can still be scored providing responses to50% or more of the items are available.
Table 5. Articles dedicated to assisting with interpretation of EORTC
QLQ-C30 or FACT-G data
Measure Type of
information
Reference Description
EORTC
QLQ-C30
Normative/
reference data
[20] Comparison of norms for
Germany, Norway,
Denmark and Sweden
[21] Using reference data for
interpretation
[22] Official EORTC reference
values for various cancer
sites
MCIDs [23] Worked example of using
norms to develop MCIDs
[24] Secondary analysis using
clinically relevant anchors
[25] Interpreting scores by
comparison with ratings of
change
Dealing with
attrition
[26] Interpreting data in advanced
gastrointestinal cancer
FACT-G Normative/
reference data
[27] USA norms and
heterogeneous cancer
reference values
[28] USA norms for the FACT-GP
[29] Austrian norms and cancer
survivor reference values
[30] Australian (QLD) norms for
the FACT-GP
MCIDs [31] Reviews results published
until 2002 on anchor and
distribution based evidence
for the FACT-G, its
subscales and various
modules
[32] Reviews results published
until 2004 on anchor and
distribution based evidence
for the FACT-G, its
subscales and various
modules
[33] Meta-analysis of anchor
based evidence for the
FACT-G and its subscales
EORTC QLQ-C30, European Organisation for the Research and Treatment
of Cancer Quality of Life Questionnaire Core 30; FACT-G, Functional
Assessment of Cancer Therapy—General; FACT-GP, FACT general
population measure; MCIDs, minimal clinically important differences.
review Annals of Oncology
2186 | Luckett et al. Volume 22 |No. 10 |October 2011
by guest on February 21, 2013http://annonc.oxfordjournals.org/
Dow
nloaded from
limitations
The most important limitation of this review concerns possiblebias in selecting and comparing evidence for the psychometricproperties of the QLQ-C30 versus FACT-G. We included onlyarticles published in English. Also, while research reports ofmany kinds have potential to provide insights intopsychometric properties, we decided that confidence in findingscould be increased by focussing on studies that cited evaluationof psychometric properties among the aims in their abstracts.While this approach doubtless led us to underrepresentevidence for the performance of both the QLQ-C30 andFACT-G, it is unlikely to have biased results towards oneinstrument or the other. For studies that were included, ourchecklist was intended to maximise objectivity and minimisebias in appraising available evidence.While this article has focused on the QLQ-C30 and FACT-G,
it should be remembered that these are just two of a largenumber of alternative HRQoL measures. Certain objectivesmay be better served by generic questionnaires thatenable comparison of results between health conditions and
the general population or alternative cancer-, tumour-,treatment- or symptom-specific questionnaires that offer bettercoverage of pertinent HRQoL concerns.
conclusions and recommendations for choice ofinstrument
There is substantial evidence for the reliability and validity ofboth the EORTC QLQ-C30 and FACT-G in a range of cancersettings, and both are available in a large number of languagetranslations. While psychometric evidence is indecisive, thereare important differences between the scale structure, socialdomains and tone of these two instruments that can be used toinform choice for each particular study. Where researchobjectives are concerned with the impact of a specific tumourtype, treatment or symptom, choice should be guided by (i) theavailability and (ii) the established psychometric properties,content and scale structure of specific modules in the EORTCversus FACIT suites. Choice of instrument for studies withparticipants speaking languages other than English should beguided by the evidence in support of the psychometric
Table 6. Correlations between corresponding scales of the QLQ-C30 and FACT-G in nine samples
Reference Sample QLQ-C30/FACT-G Overalla Coefficient
PF/PWB EF/EWB SF/SWB RF/FWB
[39] Thai patients with mostly
advanced cancer of
heterogeneous types
(N = 310)
NR 0.52 0.10 NR NR NR
[34] USA patients with metastatic
prostate cancer (N = 110)
0.72 0.54 0.12 0.54 NR Pearson r
[36] Austrian patients with
chronic lymphatic
leukaemia (N = 81)
0.75 0.52 0.23 0.68 NR Pearson r
[36] Austrian patients undergoing
bone marrow transplant
(N = 56)
0.43 0.21 0.37 0.70 NR Pearson rb
[36, 40] Austrian patients with breast
cancer (N = 118)
0.63 0.57 0.06 0.46 NR Pearson r
[36, 40] Austrian patients with
Hodgkin’s disease
(N = 126)
0.71 0.47 0.25 0.46 NR Pearson r
[37] Austrian patients with mixed
cancer diagnoses (N = 737)
0.77 0.60 0.09 0.63 NR Pearson r
[35] British patients with
oesophageal cancer
(N = 57)
0.67 0.64 0.01 0.57 0.76 Spearman rho
[38] Canadian patients with
oesophageal cancer
(N = 54)
0.53 0.67 0.47 0.58 0.58 Spearman rho
Average weighted correlation 0.72 0.55 0.13 0.59 0.67
QLQ-C30 subscales indicate PF, physical functioning; EF, emotional functioning; SF, social functioning; RF, role functioning; FACT-G subscales indicate
PWB, physical wellbeing; EWB, emotional wellbeing; SWB, social/family wellbeing; FWB, functional wellbeing.aAn overall score for the QLQ-C30 is calculated as the mean of two global health status and quality-of-life (QoL) items, while the overall FACT-G score is
generated via summation of all 27 items.bSpearman rho correlations reported for the same sample in a second article [41] are inconsistent regarding the relative strength of coefficients for EF/EWB
(0.53) versus SF/SWB (0.38).
FACT-G, Functional Assessment of Cancer Therapy—General; QLQ-C30, Quality of Life Questionnaire Core 30; NR, not reported; SD, standard deviation.
Annals of Oncology review
Volume 22 |No. 10 | October 2011 doi:10.1093/annonc/mdq721 | 2187
by guest on February 21, 2013http://annonc.oxfordjournals.org/
Dow
nloaded from
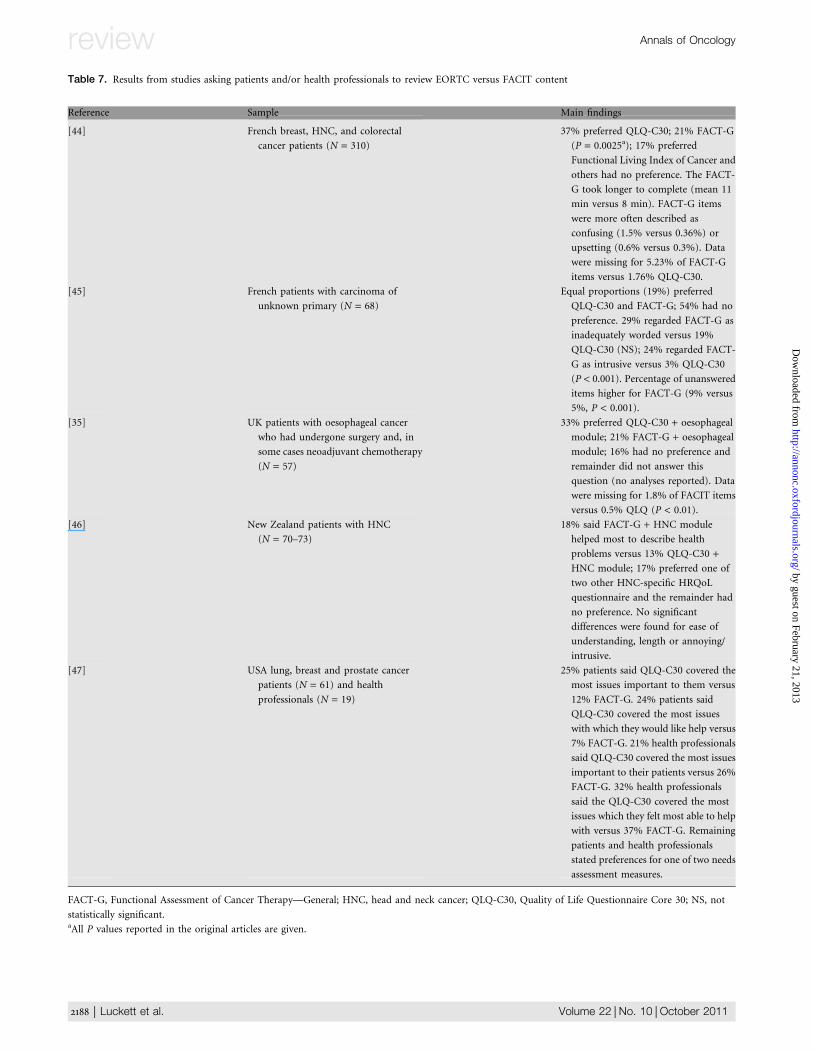
Table 7. Results from studies asking patients and/or health professionals to review EORTC versus FACIT content
Reference Sample Main findings
[44] French breast, HNC, and colorectal
cancer patients (N = 310)
37% preferred QLQ-C30; 21% FACT-G
(P = 0.0025a); 17% preferred
Functional Living Index of Cancer and
others had no preference. The FACT-
G took longer to complete (mean 11
min versus 8 min). FACT-G items
were more often described as
confusing (1.5% versus 0.36%) or
upsetting (0.6% versus 0.3%). Data
were missing for 5.23% of FACT-G
items versus 1.76% QLQ-C30.
[45] French patients with carcinoma of
unknown primary (N = 68)
Equal proportions (19%) preferred
QLQ-C30 and FACT-G; 54% had no
preference. 29% regarded FACT-G as
inadequately worded versus 19%
QLQ-C30 (NS); 24% regarded FACT-
G as intrusive versus 3% QLQ-C30
(P < 0.001). Percentage of unanswered
items higher for FACT-G (9% versus
5%, P < 0.001).
[35] UK patients with oesophageal cancer
who had undergone surgery and, in
some cases neoadjuvant chemotherapy
(N = 57)
33% preferred QLQ-C30 + oesophageal
module; 21% FACT-G + oesophageal
module; 16% had no preference and
remainder did not answer this
question (no analyses reported). Data
were missing for 1.8% of FACIT items
versus 0.5% QLQ (P < 0.01).
[46] New Zealand patients with HNC
(N = 70–73)
18% said FACT-G + HNC module
helped most to describe health
problems versus 13% QLQ-C30 +HNC module; 17% preferred one of
two other HNC-specific HRQoL
questionnaire and the remainder had
no preference. No significant
differences were found for ease of
understanding, length or annoying/
intrusive.
[47] USA lung, breast and prostate cancer
patients (N = 61) and health
professionals (N = 19)
25% patients said QLQ-C30 covered the
most issues important to them versus
12% FACT-G. 24% patients said
QLQ-C30 covered the most issues
with which they would like help versus
7% FACT-G. 21% health professionals
said QLQ-C30 covered the most issues
important to their patients versus 26%
FACT-G. 32% health professionals
said the QLQ-C30 covered the most
issues which they felt most able to help
with versus 37% FACT-G. Remaining
patients and health professionals
stated preferences for one of two needs
assessment measures.
FACT-G, Functional Assessment of Cancer Therapy—General; HNC, head and neck cancer; QLQ-C30, Quality of Life Questionnaire Core 30; NS, not
statistically significant.aAll P values reported in the original articles are given.
review Annals of Oncology
2188 | Luckett et al. Volume 22 |No. 10 |October 2011
by guest on February 21, 2013http://annonc.oxfordjournals.org/
Dow
nloaded from
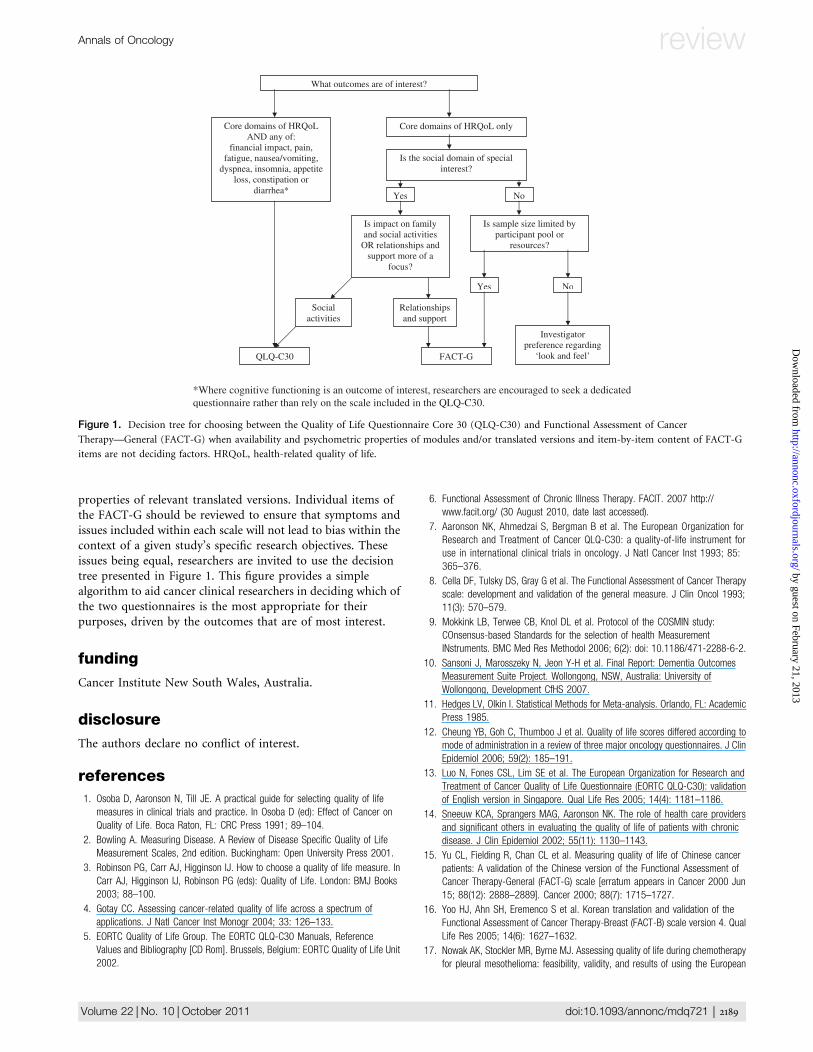
properties of relevant translated versions. Individual items ofthe FACT-G should be reviewed to ensure that symptoms andissues included within each scale will not lead to bias within thecontext of a given study’s specific research objectives. Theseissues being equal, researchers are invited to use the decisiontree presented in Figure 1. This figure provides a simplealgorithm to aid cancer clinical researchers in deciding which ofthe two questionnaires is the most appropriate for theirpurposes, driven by the outcomes that are of most interest.
funding
Cancer Institute New South Wales, Australia.
disclosure
The authors declare no conflict of interest.
references
1. Osoba D, Aaronson N, Till JE. A practical guide for selecting quality of life
measures in clinical trials and practice. In Osoba D (ed): Effect of Cancer on
Quality of Life. Boca Raton, FL: CRC Press 1991; 89–104.
2. Bowling A. Measuring Disease. A Review of Disease Specific Quality of Life
Measurement Scales, 2nd edition. Buckingham: Open University Press 2001.
3. Robinson PG, Carr AJ, Higginson IJ. How to choose a quality of life measure. In
Carr AJ, Higginson IJ, Robinson PG (eds): Quality of Life. London: BMJ Books
2003; 88–100.
4. Gotay CC. Assessing cancer-related quality of life across a spectrum of
applications. J Natl Cancer Inst Monogr 2004; 33: 126–133.
5. EORTC Quality of Life Group. The EORTC QLQ-C30 Manuals, Reference
Values and Bibliography [CD Rom]. Brussels, Belgium: EORTC Quality of Life Unit
2002.
6. Functional Assessment of Chronic Illness Therapy. FACIT. 2007 http://
www.facit.org/ (30 August 2010, date last accessed).
7. Aaronson NK, Ahmedzai S, Bergman B et al. The European Organization for
Research and Treatment of Cancer QLQ-C30: a quality-of-life instrument for
use in international clinical trials in oncology. J Natl Cancer Inst 1993; 85:
365–376.
8. Cella DF, Tulsky DS, Gray G et al. The Functional Assessment of Cancer Therapy
scale: development and validation of the general measure. J Clin Oncol 1993;
11(3): 570–579.
9. Mokkink LB, Terwee CB, Knol DL et al. Protocol of the COSMIN study:
COnsensus-based Standards for the selection of health Measurement
INstruments. BMC Med Res Methodol 2006; 6(2): doi: 10.1186/471-2288-6-2.
10. Sansoni J, Marosszeky N, Jeon Y-H et al. Final Report: Dementia Outcomes
Measurement Suite Project. Wollongong, NSW, Australia: University of
Wollongong, Development CfHS 2007.
11. Hedges LV, Olkin I. Statistical Methods for Meta-analysis. Orlando, FL: Academic
Press 1985.
12. Cheung YB, Goh C, Thumboo J et al. Quality of life scores differed according to
mode of administration in a review of three major oncology questionnaires. J Clin
Epidemiol 2006; 59(2): 185–191.
13. Luo N, Fones CSL, Lim SE et al. The European Organization for Research and
Treatment of Cancer Quality of Life Questionnaire (EORTC QLQ-C30): validation
of English version in Singapore. Qual Life Res 2005; 14(4): 1181–1186.
14. Sneeuw KCA, Sprangers MAG, Aaronson NK. The role of health care providers
and significant others in evaluating the quality of life of patients with chronic
disease. J Clin Epidemiol 2002; 55(11): 1130–1143.
15. Yu CL, Fielding R, Chan CL et al. Measuring quality of life of Chinese cancer
patients: A validation of the Chinese version of the Functional Assessment of
Cancer Therapy-General (FACT-G) scale [erratum appears in Cancer 2000 Jun
15; 88(12): 2888–2889]. Cancer 2000; 88(7): 1715–1727.
16. Yoo HJ, Ahn SH, Eremenco S et al. Korean translation and validation of the
Functional Assessment of Cancer Therapy-Breast (FACT-B) scale version 4. Qual
Life Res 2005; 14(6): 1627–1632.
17. Nowak AK, Stockler MR, Byrne MJ. Assessing quality of life during chemotherapy
for pleural mesothelioma: feasibility, validity, and results of using the European
*Where cognitive functioning is an outcome of interest, researchers are encouraged to seek a dedicatedquestionnaire rather than rely on the scale included in the QLQ-C30.
What outcomes are of interest?
Core domains of HRQoL only Core domains of HRQoL AND any of:
financial impact, pain, fatigue, nausea/vomiting,
dyspnea, insomnia, appetite loss, constipation or
diarrhea*
Is sample size limited by participant pool or
resources?
Yes No
FACT-G
Investigator preference regarding
‘look and feel’
Is the social domain of special interest?
Is impact on family and social activities
OR relationships and support more of a
focus?
Social activities
Relationships and support
QLQ-C30
Yes No
Figure 1. Decision tree for choosing between the Quality of Life Questionnaire Core 30 (QLQ-C30) and Functional Assessment of Cancer
Therapy—General (FACT-G) when availability and psychometric properties of modules and/or translated versions and item-by-item content of FACT-G
items are not deciding factors. HRQoL, health-related quality of life.
Annals of Oncology review
Volume 22 |No. 10 | October 2011 doi:10.1093/annonc/mdq721 | 2189
by guest on February 21, 2013http://annonc.oxfordjournals.org/
Dow
nloaded from
Organization for Research and Treatment of Cancer Core Quality of Life
Questionnaire and Lung Cancer Module. J Clin Oncol 2004; 22(15): 3172–3180.
18. Stockler MR, Osoba D, Corey P et al. Convergent discriminitive, and predictive
validity of the Prostate Cancer Specific Quality of Life Instrument (PROSQOLI)
assessment and comparison with analogous scales from the EORTC QLQ-C30
and a trial-specific module. J Clin Epidemiol 1999; 52(7): 653–666.
19. Nicklasson M, Bergman B. Validity, reliability and clinical relevance of EORTC
QLQ-C30 and LC13 in patients with chest malignancies in a palliative setting.
Qual Life Res 2007; 16(6): 1019–1028.
20. Fayers PM. Interpreting quality of life data: population-based reference data for
the EORTC QLQ-C30 [comment]. Eur J Cancer 2001; 37(11): 1331–1334.
21. Hjermstad MJ, Fayers PM, Bjordal K, Kaasa S. Using reference data on quality of
life—the importance of adjusting for age and gender, exemplified by the EORTC
QLQ-C30 (+3). Eur J Cancer 1998; 34(9): 1381–1389.
22. Scott NW, Fayers PM, Aaronson NK et al. EORTC QLQ-C30 reference values.
Brussels, Belgium: European Organisation for Research and Treatment of Cancer
2008.
23. Gulbrandsen N, Hjermstad MJ, Wisloff F. Nordic Myeloma Study G. Interpretation
of quality of life scores in multiple myeloma by comparison with a reference
population and assessment of the clinical importance of score differences. Eur J
Haematol 2004; 72(3): 172–180.
24. King MT. The interpretation of scores from the EORTC quality of life
questionnaire QLQ-C30. Qual Life Res 1996; 5(6): 555–567.
25. Osoba D, Rodrigues G, Myles J et al. Interpreting the significance of changes in
health-related quality-of-life scores. J Clin Oncol 1998; 16(1): 139–144.
26. Nordin K, Steel J, Hoffman K, Glimelius B. Alternative methods of interpreting
quality of life data in advanced gastrointestinal cancer patients. Br J Cancer
2001; 85(9): 1265–1272.
27. Brucker PS, Yost K, Cashy J et al. General population and cancer patients norms
for The Functional Assessment if Cancer Therapy-General (FACT-G). Eval Health
Prof 2005; 28(2): 192–211.
28. Cella D, Zagari MJ, Vandoros C et al. Epoetin alfa treatment results in clinically
significant improvements in quality of life in anemic cancer patients when
referenced to the general population. J Clin Oncol 2003; 21(2): 366–373.
29. Holzner B, Kemmler G, Cella D et al. Normative data for functional assessment of
cancer therapy–general scale and its use for the interpretation of quality of life
scores in cancer survivors. Acta Oncologica 2004; 43(2): 153–160.
30. Janda M, DiSipio T, Hurst C et al. The Queensland cancer risk study: general
population norms for the Functional Assessment of Cancer Therapy-General
(FACT-G). Psychooncology 2009; 18: 606–614.
31. Webster K, Cella D, Yost KJ. The Functional Assessment of Chronic Illness
Therapy (FACIT) Measurement System: properties, applications, and
interpretation. Health Qual Life Outcomes 2003; 1: 79 http://www.hqlo.com/
content/1/1/ (12 August 2010, date last accessed).
32. Yost KJ, Eton DT. Combining distribution- and anchor-based approaches to
determine minimally important differences: the FACIT experience. Eval Health
Prof 2005; 28(2): 172–191.
33. King MT, Stockler MS, Cella D. Meta-analysis provides evidence-based effect
sizes for a cancer-specific quality of life questionnaire, the FACT-G. J Clin
Epidemiol 2010; 63: 270–281.
34. Sharp LK, Knight S, Nadler R et al. Quality of life in low-income patients with
metastatic prostate cancer: divergent and convergent validity of three
instruments. Qual Life Res 1999; 8(5): 461–470.
35. Blazeby JM, Kavadas V, Vickery CW et al. A prospective comparison of quality of
life measures for patients with esophageal cancer. Qual Life Res 2005; 14(2):
387–393.
36. Holzner B, Kemmler G, Sperner-Unterweger B et al. Quality of life measurement
in oncology—a matter of the assessment instrument? Eur J Cancer 2001;
37(18): 2349–2356.
37. Holzner B, Bode RK, Hahn EA et al. Equating EORTC QLQ-C30 and FACT-G
scores and its use in oncological research. Eur J Cancer 2006; 42(18):
3169–3177.
38. Darling G, Eton DT, Sulman J et al. Validation of the functional assessment of
cancer therapy esophageal cancer subscale. Cancer 2006; 107(4): 854–863.
39. Silpakit C, Sirilerttrakul S, Jirajarus M et al. The European Organization for
Research and Treatment of Cancer Quality of Life Questionnaire (EORTC QLQ-
C30): validation study of the Thai version. Qual Life Res. 2006; 15(1):
167–172.
40. Kemmler G, Holzner B, Kopp M et al. Comparison of two quality-of-life
instruments for cancer patients: the functional assessment of cancer therapy-
general and the European Organization for Research and Treatment of Cancer
Quality of Life Questionnaire-C30. J Clin Oncol 1999; 17(9): 2932–2940.
41. Kopp M, Schweigkofler H, Holzner B et al. EORTC QLQ-C30 and FACT-BMT for
the measurement of quality of life in bone marrow transplant recipients:
a comparison. Eur J Haematol 2000; 65(2): 97–103.
42. Cheung Y-B, Goh C, Thumboo J et al. Variability and sample size requirements of
quality-of-life measures: a randomized study of three major questionnaires [see
comment]. J Clin Oncol 2005; 23(22): 4936–4944.
43. Chang CH, Cella D. Equating health-related quality of life instruments in
applied oncology settings. Physical Med Rehab: States Art Rev 1997; 11(2):
397–406.
44. Conroy T, Mercier M, Schraub S et al. Comparison of three quality of life
instruments for cancer patients: FACT-G, EORTC QLQ-C30 and FLIC. Qual Life
Res 2000; 9: 274.
45. Rodary C, Pezet-Langevin V, Garcia-Acosta S et al. Patient preference for either
the EORTC QLQ-C30 or the FACIT Quality Of Life (QOL) measures: a study
performed in patients suffering from carcinoma of an unknown primary site
(CUP). Eur J Cancer 2004; 40(4): 521–528.
46. Mehanna HM, Morton RP. Patients’ views on the utility of quality of life
questionnaires in head and neck cancer: a randomised trial. Clin Otolaryngol
2006; 31(4): 310–316.
47. Snyder CF, Dy SM, Hendricks DE et al. Asking the right questions: investigating
needs assessments and health-related quality-of-life questionnaires for use in
oncology clinical practice. Support Care Cancer 2007; 15: 1075–1085.
48. Tschiesner U, Rogers SN, Harreus U et al. Content comparison of quality of life
questionnaires used in head and neck cancer based on the international
classification of functioning, disability and health: a systematic review. Eur Arch
Otorhinolaryngol 2008; 265(6): 627–637.
49. World Health Organization. International Classification of Functioning, Disability
and Health: ICF. Geneva, Switzerland: WHO 2001.
review Annals of Oncology
2190 | Luckett et al. Volume 22 |No. 10 |October 2011
by guest on February 21, 2013http://annonc.oxfordjournals.org/
Dow
nloaded from