(Dutch) multinational companies and productive employment ...
CHL maps of the Dutch coastal zone: a case study within the REVAMP project
Steef W.M. Peters(1), Hans van der Woerd(1), Reinold Pasterkamp(1)
(1)Vrije Universiteit Amsterdam, Institute for Environmental Studies, De Boelelaan 1087, 1081 HV, Amsterdam,
The Netherlands. Email: [email protected], [email protected], [email protected].
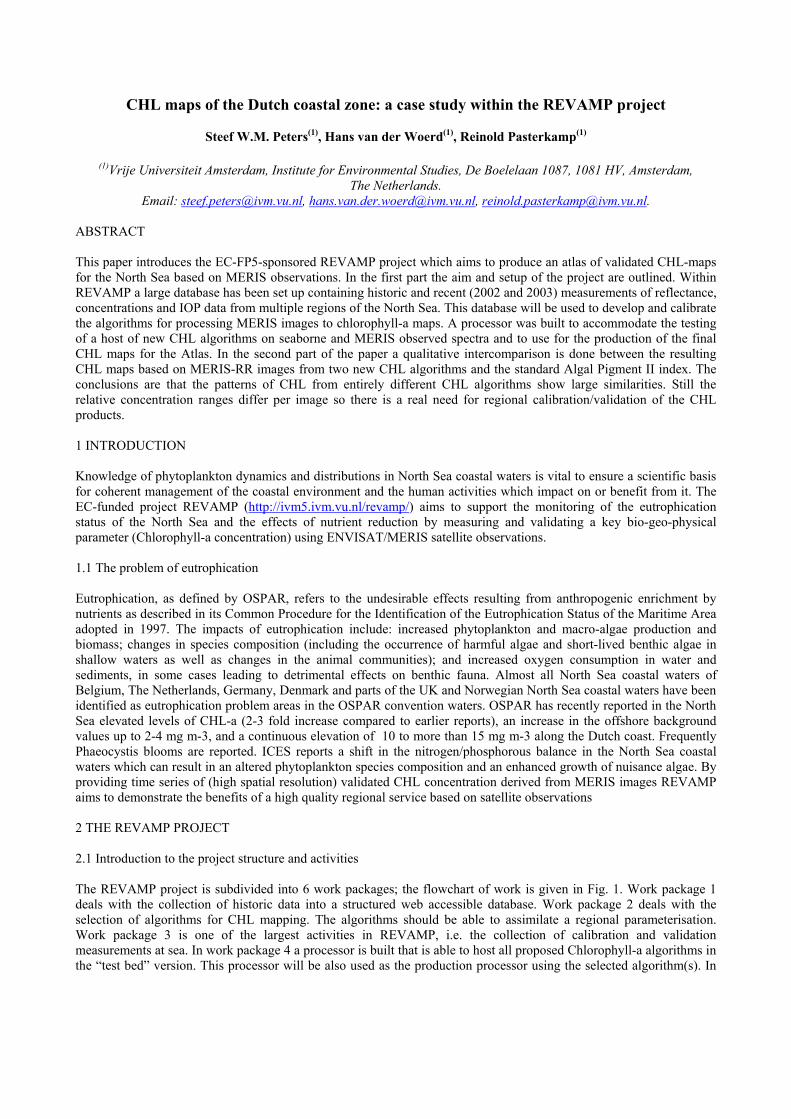
ABSTRACT This paper introduces the EC-FP5-sponsored REVAMP project which aims to produce an atlas of validated CHL-maps for the North Sea based on MERIS observations. In the first part the aim and setup of the project are outlined. Within REVAMP a large database has been set up containing historic and recent (2002 and 2003) measurements of reflectance, concentrations and IOP data from multiple regions of the North Sea. This database will be used to develop and calibrate the algorithms for processing MERIS images to chlorophyll-a maps. A processor was built to accommodate the testing of a host of new CHL algorithms on seaborne and MERIS observed spectra and to use for the production of the final CHL maps for the Atlas. In the second part of the paper a qualitative intercomparison is done between the resulting CHL maps based on MERIS-RR images from two new CHL algorithms and the standard Algal Pigment II index. The conclusions are that the patterns of CHL from entirely different CHL algorithms show large similarities. Still the relative concentration ranges differ per image so there is a real need for regional calibration/validation of the CHL products. 1 INTRODUCTION Knowledge of phytoplankton dynamics and distributions in North Sea coastal waters is vital to ensure a scientific basis for coherent management of the coastal environment and the human activities which impact on or benefit from it. The EC-funded project REVAMP (http://ivm5.ivm.vu.nl/revamp/) aims to support the monitoring of the eutrophication status of the North Sea and the effects of nutrient reduction by measuring and validating a key bio-geo-physical parameter (Chlorophyll-a concentration) using ENVISAT/MERIS satellite observations. 1.1 The problem of eutrophication Eutrophication, as defined by OSPAR, refers to the undesirable effects resulting from anthropogenic enrichment by nutrients as described in its Common Procedure for the Identification of the Eutrophication Status of the Maritime Area adopted in 1997. The impacts of eutrophication include: increased phytoplankton and macro-algae production and biomass; changes in species composition (including the occurrence of harmful algae and short-lived benthic algae in shallow waters as well as changes in the animal communities); and increased oxygen consumption in water and sediments, in some cases leading to detrimental effects on benthic fauna. Almost all North Sea coastal waters of Belgium, The Netherlands, Germany, Denmark and parts of the UK and Norwegian North Sea coastal waters have been identified as eutrophication problem areas in the OSPAR convention waters. OSPAR has recently reported in the North Sea elevated levels of CHL-a (2-3 fold increase compared to earlier reports), an increase in the offshore background values up to 2-4 mg m-3, and a continuous elevation of 10 to more than 15 mg m-3 along the Dutch coast. Frequently Phaeocystis blooms are reported. ICES reports a shift in the nitrogen/phosphorous balance in the North Sea coastal waters which can result in an altered phytoplankton species composition and an enhanced growth of nuisance algae. By providing time series of (high spatial resolution) validated CHL concentration derived from MERIS images REVAMP aims to demonstrate the benefits of a high quality regional service based on satellite observations 2 THE REVAMP PROJECT 2.1 Introduction to the project structure and activities The REVAMP project is subdivided into 6 work packages; the flowchart of work is given in Fig. 1. Work package 1 deals with the collection of historic data into a structured web accessible database. Work package 2 deals with the selection of algorithms for CHL mapping. The algorithms should be able to assimilate a regional parameterisation. Work package 3 is one of the largest activities in REVAMP, i.e. the collection of calibration and validation measurements at sea. In work package 4 a processor is built that is able to host all proposed Chlorophyll-a algorithms in the “test bed” version. This processor will be also used as the production processor using the selected algorithm(s). In
work package 5 and 6 prototype and final Chlorophyll-a maps will be produced and presented to and discussed with the end-users.
MERIS Processor
WP1:DataQualityControl
WP1:Historic Region
SpecificDatasets
WP2: Regional Algorithm
Selection andcalibration
WP2:RegionalATBD
WP1:Historic
CSIdata
WP4: MERISProcessor
development
WP4: Processor
verification
WP3: 2002CSI-data
WP3:2002 CSI-data
Collection+Quality control
WP4: CHL-Products
Quality Control
WP1 WP2
WP3
WP4
WP5 WP6
WP6:
Final CHL-ATLAS
Final Value Added Products
Products Dissemination
Workshop
Internet presentationWP5:Prototype
Value-addedProducts
WP5:User consultation
DemonstrationFinal User
Requirements
WP4:Prototype
CHL-ATLAS
MERIS Observations
WP2: Regional Algorithm Validation
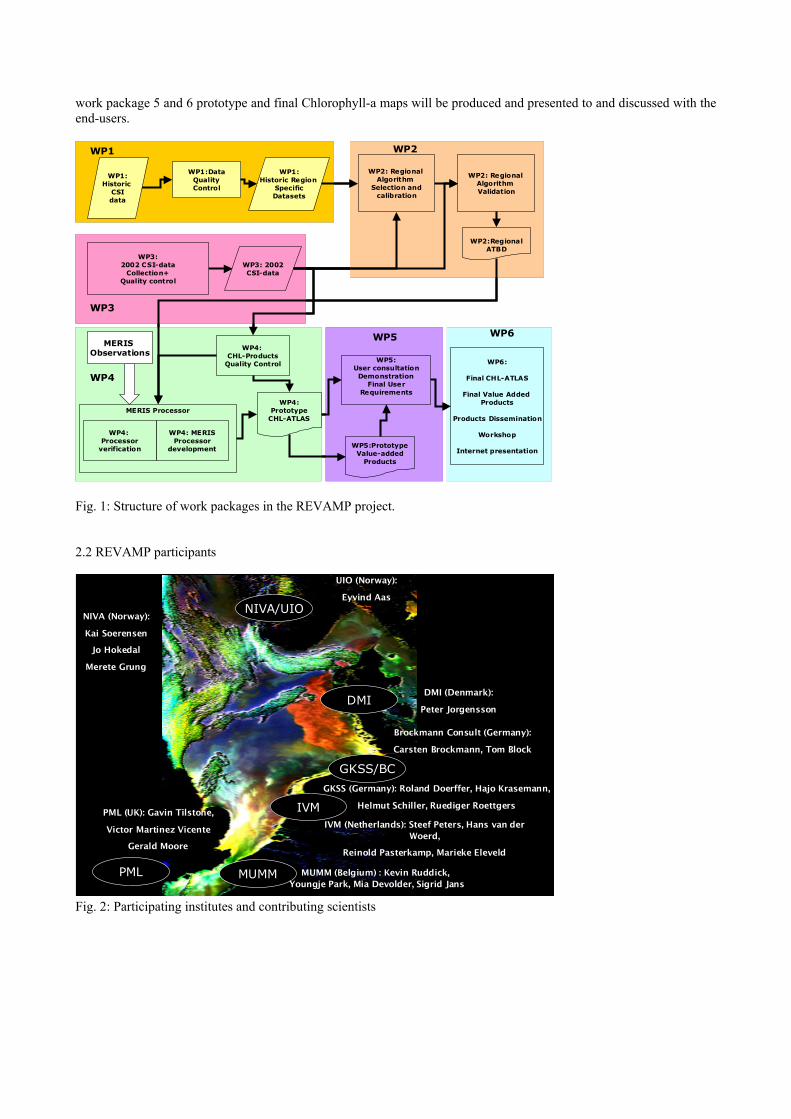
Fig. 1: Structure of work packages in the REVAMP project. 2.2 REVAMP participants
Plymouth Marine Laboratory (PML)
zzzzz
MUMMPML
DMI
IVM
NIVA/UIO
GKSS/BC
MUMM (Belgium) : Kevin Ruddick, Youngje Park, Mia Devolder, Sigrid Jans
IVM (Netherlands): Steef Peters, Hans van der Woerd,
Reinold Pasterkamp, Marieke Eleveld
Brockmann Consult (Germany):
Carsten Brockmann, Tom Block
GKSS (Germany): Roland Doerffer, Hajo Krasemann,
Helmut Schiller, Ruediger Roettgers
DMI (Denmark):
Peter Jorgensson
PML (UK): Gavin Tilstone,
Victor Martinez Vicente
Gerald Moore
NIVA (Norway):
Kai Soerensen
Jo Hokedal
Merete Grung
UIO (Norway):
Eyvind Aas
Plymouth Marine Laboratory (PML)
zzzzzzzzzz
MUMMPML
DMI
IVM
NIVA/UIO
GKSS/BC
MUMM (Belgium) : Kevin Ruddick, Youngje Park, Mia Devolder, Sigrid Jans
IVM (Netherlands): Steef Peters, Hans van der Woerd,
Reinold Pasterkamp, Marieke Eleveld
Brockmann Consult (Germany):
Carsten Brockmann, Tom Block
GKSS (Germany): Roland Doerffer, Hajo Krasemann,
Helmut Schiller, Ruediger Roettgers
DMI (Denmark):
Peter Jorgensson
PML (UK): Gavin Tilstone,
Victor Martinez Vicente
Gerald Moore
NIVA (Norway):
Kai Soerensen
Jo Hokedal
Merete Grung
UIO (Norway):
Eyvind Aas
Fig. 2: Participating institutes and contributing scientists

(0 ) ' * ( 750 )b b
b b
b bR f f at nma b a b
− = −+ +
2.3 REVAMP first results: Half way through the project the first achievements can be summarized as follows:
• The project aims to be user driven and has therefore started with the initial user requirements document [1] describing the information that must be included in the chlorophyll-a atlas of the North Sea.
• Protocols for the measurements of CSI (Concentration, Spectra and Inherent Optical properties) were reviewed
and updated [2]. • Historic CSI datasets from the North Sea were collected. Dedicated cruises in 2002 and 2003 were carried out
to collect more CSI data from multiple North Sea regions. These data and metadata have been stored in a web-accessible database at MUMM.
• Data collection in 2003 started in March and finished in September. A total of 22 cruises, with over 121 days
of ship time, were undertaken in 6 major areas of the North Sea, Western Channel and Celtic Sea.. The REVAMP database is now one of the largest datasets documenting the inherent optical properties of Case-2 European shelf seas and extends and complements data collected in previous EU projects; COLORS & COASTLOOC. It gives insight into the bio-optical variability in the Case-2 waters of the North Sea & Western Channel.
• A MERIS processor was built ( Java based software) that allows to “plug in” new algorithms easily by
algorithm providers themselves The processor gives full access to standard MERIS flags etc.)
• Regional algorithm requirements were defined in terms of output parameters (precise definition of CHL, possible higher-level products, quality indicators and flags), target accuracy and water types
• The derivation of reliable chlorophyll-a concentrations from spectra obtained over case-2 waters is still under
development. However, more than 10 new CHL algorithms were devised / (re)calibrated using the historic data set and implemented in the MERIS processor
• Criteria were determined to test and select the “best/most robust etc.” algorithm, initial tests were performed
using a separate selection of historic data
• Inherent optical properties were studied to determine the degree of regionality in the North Sea. The preliminary analysis of the historic data indicated that the variability per region is high. This makes it difficult to distinguish specific regions. Improved analysis of historic and recent data is under way.
3 CASE STUDY: CHL MAPS OF DUTCH COASTAL WATERS 3.1 Introduction In order to illustrate the quality of CHL maps that can be derived from MERIS reduced resolution images, two MERIS scenes were processed with the latest version of two different algorithms and compared with a standard product of MERIS. The purpose of this part of the paper is to merely show that complex algorithms converge in the observed ranges and patterns of CHL over the North Sea. Therefore the explanation of algorithms and calibration data is brief: the reader is referred to the original papers for more details. 3.2 An outline of used algorithms Algorithm 1: Uses an iterative analytical solution of the Gordon equation based on spectra that are set to zero at approximately 750 nm. If R(0-)’ at wavelength λ = the measured reflectance at wavelength λ – the measured reflectance at 750 nm then:
(1)

and:
(2) An iterative solution is required because of the interdependency of the parameters in the sub-algorithms and because different band settings are used in the sub-algorithms. TSM and CDOM are determined using Matrix Inversion Techniques [3] while CHL is determined using a series of band ratios [4]. No assumptions are made other than those underlying the Gordon equation. The algorithm is calibrated on historic observations of specific inherent optical properties in the Dutch coastal zone [5]. Algorithm2: Based on lookup tables generated from Hydrolight simulations, this algorithm solves first for a and b and then for the concentrations. It uses a series of differences of two spectral bands to compensate for offset errors. The algorithm is calibrated on the median IOP values present in the REVAMP database [6]. Algorithm 3 is the standard MERIS product: algal pigment index II. This index is calculated using a neural network algorithm which uses 8 MERIS bands as input. The outputs are the concentrations of 1) non absorbing suspended matter, 2) phytoplankton pigments and 3) the gelbstoff absorption at 440 nm. The table of water leaving radiance reflectances as a function of the concentrations and the three angles is produced by radiative transfer simulations using a Monte Carlo radiative transfer model [7]. Within REVAMP ample attention is given to the proper calibration and validation of algorithms and CHL products. An example is the validation of algorithm 1 using historic observations of reflectance spectra and Chlorophyll-a (see Fig. 3). The result for approximately 50 spectra measured in Belgian, Dutch, German and Danish coastal waters is given in Fig. 3 which shows that quite reasonable correlation coefficients can be obtained for this dataset. One should be aware that this dataset is not representative for “open North Sea and English Channel” water which is almost case 1 water.
y = 1.0934x + 0.7933R2 = 0.8436
n=50
0
5
10
15
20
25
30
35
40
0 5 10 15 20 25 30 35 40
Fig. 3: Performance of algorithm 1 on 50 historic reflectance measurements The results of the application of the three CHL algorithms to two selected MERIS images is shown in Fig. 4.1, 4.2, 4.2, 5.1, 5.2 and 5.3 at the end of this paper.
* * *w TCHL TSM CDOMa a a TCHL a TSM a CDOM= + ⋅ + ⋅ + ⋅ +a*CPC.CPC
TSMBbbb TSMwbb ⋅+= *,
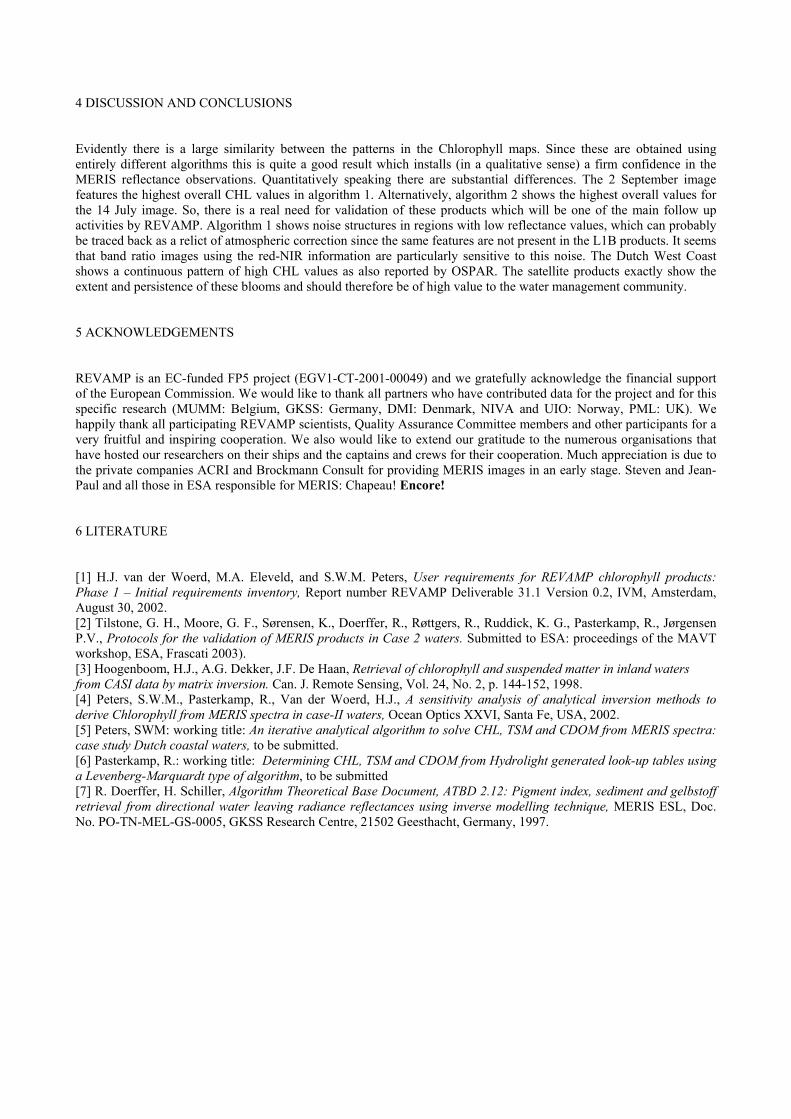
4 DISCUSSION AND CONCLUSIONS Evidently there is a large similarity between the patterns in the Chlorophyll maps. Since these are obtained using entirely different algorithms this is quite a good result which installs (in a qualitative sense) a firm confidence in the MERIS reflectance observations. Quantitatively speaking there are substantial differences. The 2 September image features the highest overall CHL values in algorithm 1. Alternatively, algorithm 2 shows the highest overall values for the 14 July image. So, there is a real need for validation of these products which will be one of the main follow up activities by REVAMP. Algorithm 1 shows noise structures in regions with low reflectance values, which can probably be traced back as a relict of atmospheric correction since the same features are not present in the L1B products. It seems that band ratio images using the red-NIR information are particularly sensitive to this noise. The Dutch West Coast shows a continuous pattern of high CHL values as also reported by OSPAR. The satellite products exactly show the extent and persistence of these blooms and should therefore be of high value to the water management community. 5 ACKNOWLEDGEMENTS REVAMP is an EC-funded FP5 project (EGV1-CT-2001-00049) and we gratefully acknowledge the financial support of the European Commission. We would like to thank all partners who have contributed data for the project and for this specific research (MUMM: Belgium, GKSS: Germany, DMI: Denmark, NIVA and UIO: Norway, PML: UK). We happily thank all participating REVAMP scientists, Quality Assurance Committee members and other participants for a very fruitful and inspiring cooperation. We also would like to extend our gratitude to the numerous organisations that have hosted our researchers on their ships and the captains and crews for their cooperation. Much appreciation is due to the private companies ACRI and Brockmann Consult for providing MERIS images in an early stage. Steven and Jean-Paul and all those in ESA responsible for MERIS: Chapeau! Encore! 6 LITERATURE [1] H.J. van der Woerd, M.A. Eleveld, and S.W.M. Peters, User requirements for REVAMP chlorophyll products: Phase 1 – Initial requirements inventory, Report number REVAMP Deliverable 31.1 Version 0.2, IVM, Amsterdam, August 30, 2002. [2] Tilstone, G. H., Moore, G. F., Sørensen, K., Doerffer, R., Røttgers, R., Ruddick, K. G., Pasterkamp, R., Jørgensen P.V., Protocols for the validation of MERIS products in Case 2 waters. Submitted to ESA: proceedings of the MAVT workshop, ESA, Frascati 2003). [3] Hoogenboom, H.J., A.G. Dekker, J.F. De Haan, Retrieval of chlorophyll and suspended matter in inland waters from CASI data by matrix inversion. Can. J. Remote Sensing, Vol. 24, No. 2, p. 144-152, 1998. [4] Peters, S.W.M., Pasterkamp, R., Van der Woerd, H.J., A sensitivity analysis of analytical inversion methods to derive Chlorophyll from MERIS spectra in case-II waters, Ocean Optics XXVI, Santa Fe, USA, 2002. [5] Peters, SWM: working title: An iterative analytical algorithm to solve CHL, TSM and CDOM from MERIS spectra: case study Dutch coastal waters, to be submitted. [6] Pasterkamp, R.: working title: Determining CHL, TSM and CDOM from Hydrolight generated look-up tables using a Levenberg-Marquardt type of algorithm, to be submitted [7] R. Doerffer, H. Schiller, Algorithm Theoretical Base Document, ATBD 2.12: Pigment index, sediment and gelbstoff retrieval from directional water leaving radiance reflectances using inverse modelling technique, MERIS ESL, Doc. No. PO-TN-MEL-GS-0005, GKSS Research Centre, 21502 Geesthacht, Germany, 1997.

Fig 4.1: CHL-map based on the results of algorithm 1 for 2 September 2003 (This image was processed according to the 0308 version of the MERIS L2 processor)
Fig 4.2: CHL-map based on the results of algorithm 2 for 2 September 2003
Fig 4.3: CHL-map based on the results of algorithm 3 for 2 September 2003
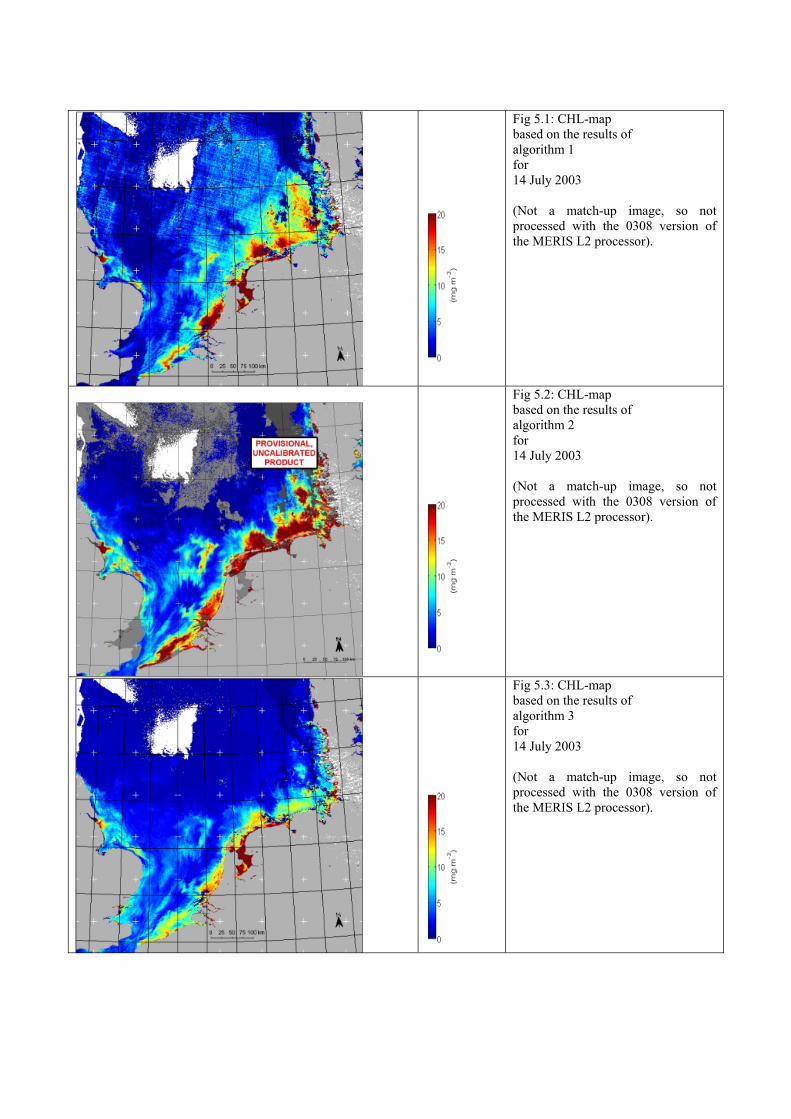
Fig 5.1: CHL-map based on the results of algorithm 1 for 14 July 2003 (Not a match-up image, so not processed with the 0308 version of the MERIS L2 processor).
Fig 5.2: CHL-map based on the results of algorithm 2 for 14 July 2003 (Not a match-up image, so not processed with the 0308 version of the MERIS L2 processor).
Fig 5.3: CHL-map based on the results of algorithm 3 for 14 July 2003 (Not a match-up image, so not processed with the 0308 version of the MERIS L2 processor).
Copyright © 2022 FDOKUMEN