
Child care quality: does it matter and does it need to be improved?
129
Institute for Research on Poverty Special Report no. 78 Child Care Quality: Does It Matter and Does It Need to Be Improved? Deborah Lowe Vandell Institute for Research on Poverty Department of Educational Psychology University of Wisconsin–Madison E-mail: [email protected] Barbara Wolfe Institute for Research on Poverty Department of Economics Department of Preventive Medicine University of Wisconsin–Madison E-mail: [email protected] November 2000 The authors gratefully thank the following for their contributions to this paper: Josephine Chung, Kim Pierce, Scott Scriver, and Elisabeth Boehnen for their research assistance and Dawn Duren, Jan Blakeslee, and Elizabeth Evanson for their editorial and typing assistance. IRP publications (discussion papers, special reports, and the newsletter Focus) are available on the Internet. The IRP Web site can be accessed at the following address: http://www.ssc.wisc.edu/irp/
Transcript of Child care quality: does it matter and does it need to be improved?
Institute for Research on PovertySpecial Report no. 78
Child Care Quality: Does It Matter and Does It Need to Be Improved?
Deborah Lowe VandellInstitute for Research on Poverty
Department of Educational PsychologyUniversity of Wisconsin–Madison
E-mail: [email protected]
Barbara WolfeInstitute for Research on Poverty
Department of EconomicsDepartment of Preventive MedicineUniversity of Wisconsin–MadisonE-mail: [email protected]
November 2000
The authors gratefully thank the following for their contributions to this paper: Josephine Chung, KimPierce, Scott Scriver, and Elisabeth Boehnen for their research assistance and Dawn Duren, Jan Blakeslee,and Elizabeth Evanson for their editorial and typing assistance.
IRP publications (discussion papers, special reports, and the newsletter Focus) are available on theInternet. The IRP Web site can be accessed at the following address: http://www.ssc.wisc.edu/irp/

Table of Contents
Executive Summary . . . . . . . . . . . . . . . . . . . . . . . . . . . . . . . . . . . . . . . . . . . . . . . . . . . . . . . . . . . . . . . . . . . i
How Is Child Care Quality Measured? . . . . . . . . . . . . . . . . . . . . . . . . . . . . . . . . . . . . . . . . . . . . . . . . . . . . 3
Process Quality . . . . . . . . . . . . . . . . . . . . . . . . . . . . . . . . . . . . . . . . . . . . . . . . . . . . . . . . . . . . . . . 4
Structural and Caregiver Characteristics . . . . . . . . . . . . . . . . . . . . . . . . . . . . . . . . . . . . . . . . . . . . 7
Health and Safety Indicators of Quality . . . . . . . . . . . . . . . . . . . . . . . . . . . . . . . . . . . . . . . . . . . . 16
Conclusions . . . . . . . . . . . . . . . . . . . . . . . . . . . . . . . . . . . . . . . . . . . . . . . . . . . . . . . . . . . . . . . . . 17
Does Quality of Child Care Have Meaningful Effects on Children’s Developmental Outcomes? . . . . . . 17
Methodological Challenges . . . . . . . . . . . . . . . . . . . . . . . . . . . . . . . . . . . . . . . . . . . . . . . . . . . . . 18
The Conceptual Model . . . . . . . . . . . . . . . . . . . . . . . . . . . . . . . . . . . . . . . . . . . . . . . . . . . . . . . . 21
Concurrent Associations between Structural and Caregiver Characteristics,and Child Outcomes . . . . . . . . . . . . . . . . . . . . . . . . . . . . . . . . . . . . . . . . . . . . . . . . . . . . . . . . . . 29
Longer-Term Associations between Process Quality and Child Developmental Outcomes . . . . 32
Longer-Term Associations between Structural and Caregiver Characteristicsand Child Outcomes . . . . . . . . . . . . . . . . . . . . . . . . . . . . . . . . . . . . . . . . . . . . . . . . . . . . . . . . . . 44
An Economist’s Interpretation of the Link between Child Care Quality and Child Outcomes . . 48
Other Outcomes . . . . . . . . . . . . . . . . . . . . . . . . . . . . . . . . . . . . . . . . . . . . . . . . . . . . . . . . . . . . . . 54
Does Child Care Quality Affect Maternal Employment? . . . . . . . . . . . . . . . . . . . . . . . . . . . . . . 56
What Is the Quality of Care in the United States? . . . . . . . . . . . . . . . . . . . . . . . . . . . . . . . . . . . . . . . . . . 66
Is There a Persuasive Economic Argument to Justify Public Intervention to Improve theQuality of Child Care? . . . . . . . . . . . . . . . . . . . . . . . . . . . . . . . . . . . . . . . . . . . . . . . . . . . . . . . . . . . . . . . 78
What Might Be Done to Improve the Quality of Child Care? . . . . . . . . . . . . . . . . . . . . . . . . . . . . . . . . . 87
Assessment of the Cost of Improving Quality . . . . . . . . . . . . . . . . . . . . . . . . . . . . . . . . . . . . . . . 93
Conclusions . . . . . . . . . . . . . . . . . . . . . . . . . . . . . . . . . . . . . . . . . . . . . . . . . . . . . . . . . . . . . . . . . . . . . . . 98
Does Child Care Quality Matter? . . . . . . . . . . . . . . . . . . . . . . . . . . . . . . . . . . . . . . . . . . . . . . . . 98
Does the Quality of Child Care Need to Be Improved, and Can It Be Improved? . . . . . . . . . . . 98
Is There an Economic Justification for Public Intervention to Improve the Qualityof Child Care, Especially for Children from Lower-Income Families? . . . . . . . . . . . . . . . . . . . . 99
References and Additional Resources . . . . . . . . . . . . . . . . . . . . . . . . . . . . . . . . . . . . . . . . . . . . . . . . . . 101
Executive Summary
This report aims to provide an answer to an important policy question: Is there an economic
justification for public intervention to improve the quality of nonparental child care, especially for
children from lower-income families? The bulk of the evidence argues that the answer is yes. In this
report we adduce evidence from large- and small-scale studies of the effects of child care on children’s
development, and set out the economic rationale that emerges from that evidence.
Nonparental child care is now the norm for young children in the United States. Nearly 60
percent of children 5 years old or younger are in child care on a regular basis, and 44 percent of infants
are in child care for more than 30 hours a week (1). With the implementation of welfare-to-work
programs in nearly all states, use of nonparental care is extending ever more widely among low-income
families. To assess the effects of this sea change in child-rearing upon children, upon families, and upon
society as a whole, we must begin with some quite specific questions: Does the quality of child care have
meaningful effects on children’s developmental outcomes and on the employment of mothers,
traditionally the primary caretakers? What is the quality of child care in the United States? How could it
be improved, and what might be the cost of doing so?
DOES THE QUALITY OF CHILD CARE HAVE MEANINGFUL EFFECTS ON CHILDREN’SDEVELOPMENTAL OUTCOMES?
An established view among child care researchers is that higher-quality care is associated with
better developmental outcomes, and lower-quality care with poorer developmental outcomes (2,3). Some
researchers, however, have recently argued that widely varying qualities of care have little or no
meaningful effects on children’s development (4,5). A major goal of the current report is to critically
evaluate the research evidence from which these divergent conclusions have been drawn.
The quality of child care has been measured in two main ways. The first is by observing what
actually occurs in child care settings—children’s interactions with caregivers and other children,

ii
particular activities such as language stimulation, and health and safety measures. These features are
described as indicators of process quality, which is scored by widely accepted rating scales. The second
set of indicators includes the structural characteristics of the child care setting and the quality of the
caregivers. These include, for example, the child:adult ratio, the size of each group of children, and the
formal education and training of the caregivers.
These two sets of indicators are consistently related. When child:adult ratios are lower, children
generally appear less apathetic and distressed; caregivers spend less time in managing their classrooms
and offer more stimulating, supportive care. When staff is more highly trained and better compensated,
children’s activities are of higher quality, and caregivers are more responsive and less restrictive. Higher-
quality settings are likely to have better health and safety practices, resulting in fewer respiratory and
other infections among the children, and to have fewer playground injuries (7–17).
Concurrent Associations
Research yields firsthand evidence about children’s responses to child care of varying quality, at
the time they are in care. In the short term, process and structural quality are both important. Taking into
account both the gender of the child and family factors, researchers find that children appear happier,
have closer and more secure attachments to caregivers, and perform better on standardized cognitive and
language tests in settings with higher process quality, that is, settings with developmentally appropriate
activities and caregivers who are emotionally supportive and responsive to their needs (13,18–27). In
contrast, poor process quality appears to predict heightened behavior problems (26,28).
Both correlational and quasi-experimental research has found relations between structural quality
and child performance. For example, children in classrooms with lower child:adult ratios were better able
to understand, initiate, and participate in conversations, had better general knowledge, were more
cooperative, and in their interactions with each other showed much less hostility and conflict than in
settings where there were more children to each adult. On average, preschoolers perform better on
iii
standardized cognitive tests when their caregivers are better educated and trained—for example, if they
have at least an associate arts degree in a child-related field. The children also have better language skills,
are more persistent in completing tasks, and in general are more ready for school (29–32).
Longer-Term Associations
Longer-run associations between process quality and children’s developmental outcomes also
have been studied. Several of these studies are methodologically strong, in that they included controls for
family selection differences and they assessed child care quality over time rather than relying on a single,
possibly nonrepresentative assessment (9,33,34). The National Institute of Child Health and Human
Development (NICHD) Study of Early Child Care has found that process quality during the first three
years is related to children’s preacademic skills of expressive language and receptive language at age 3,
even after controlling for particular child and family characteristics. The Cost, Quality, and Outcomes
Study reports that children enrolled in higher-quality child care classrooms as preschoolers display better
math skills through second grade, and the effect is greater for the children of less-educated mothers (the
differential effects on language skills are less persistent). Children whose caregivers are more involved
and invested in them during the preschool years have fewer behavior problems, according to their
kindergarten teachers (35).
The NICHD study also has asked whether the measured associations are large enough to be
meaningful. To address this issue, researchers conducted a parallel analysis of the relations between the
quality of the home environment and children’s developmental outcomes. Their results—showing that
effects associated with the quality of the home are roughly twice the size of those associated with the
quality of the child care—suggest that the effects of child care process quality for 3-year-olds are both
statistically significant and meaningful, but by no means as important as the family for young children
(36,37,38).

iv
Other dissenting studies have found little or no relation between child care quality and children’s
development over the longer term (4,40,41). These studies, however, tended to use less reliable
indicators, such as maternal reports of caregiver training or single observations of child care quality
obtained at one point in time. But child care arrangements are typically not stable, and over half of the
children in these studies had experienced more than three changes in their child care during the
intervening period. Stronger, more valid tests of the effects of child care quality require reliable and valid
measures over time.
An Economist’s Interpretation of the Link between Child Care Quality and Child Outcomes
The studies discussed above used the hierarchical regression models traditionally employed by
developmental psychologists. These findings were converted into statistical terms more familiar to
economists, thus allowing us to estimate how great a change we might expect in children’s developmental
outcomes if the quality of child care were to be systematically improved. These analyses applied standard
ordinary least squares (OLS) regressions to data regarding children’s cognitive and language development
that were reported by the NICHD study (25).
Controlling for a variety of parental and other influences, we estimated how much improvement
we might expect in children aged 15, 24, and 36 months if measures of caregivers’ quality and language
stimulation improved from one standard deviation below the mean level of quality to one standard
deviation above. We find statistically significant improvements (see Tables 7 and 8 in the full study). For
example, we estimate that a shift from the lowest rating to the highest rating for the caregiver would result
in an improvement (relative to the mean) of about 50 percent in measures of children’s school readiness,
expressive language skill, and verbal comprehension. We also find that the cumulative impact of child
care quality for 3-year-olds is significant and is rather greater than the concurrent impact, particularly for
measures of language and vocabulary.
v
The Very Long-Term Effects of Some Early Childhood Interventions
A small cluster of early childhood interventions offer evidence of potentially powerful and long-
lasting effects of enriched and intensive child care programs for low-income, “high-risk” preschool
children, though they were not strictly “child care” per se. The best-known studies are the Carolina
Abecedarian Project (42,43,44), the Perry Preschool Project (45), and the Chicago Child-Parent Centers
(46). All have involved random-assignment, intensive evaluations, have followed participating children
into early adulthood, and have examined such outcomes as educational achievement, earnings, criminal
activity, and the use of cash welfare assistance.
Children in the Carolina Abecedarian Project evinced long-term gains in IQ scores, reading, and
math. Follow-up reports at age 21 showed that they were on average older at the time their first child was
born and were more likely to have attended a four-year college than peers not in the program. By age 27,
children in the Perry Preschool Project were less likely to have ever been arrested, had mean monthly
earnings almost double those of control-group members—$1,219 versus $766—and were much less
likely to be receiving public assistance—15 versus 32 percent. Children in the Chicago Child-Parent
Centers study had significantly higher math and reading scores, and by age 20 were more likely to have
completed high school and to have lower rates of juvenile criminal activity than children not in the
program.
Child Care and Parental Employment
Clearly, higher-quality care is likely to be more expensive, and a parent facing that prospect may
elect to forgo or limit employment (47,48). That is no longer an option for women in welfare-to-work
programs.
Evidence on the relationship between child care quality and employment is limited, but it
suggests that among low-income women, higher-quality child care may increase the likelihood and
stability of employment and hours or work (49) and improve mothers’ later educational achievement

vi
(50,51). Mothers in an intervention program providing center-based care for low-birthweight infants, the
Infant Health and Development Program, were significantly more likely to be working than women in the
control group, and the effect was greater for less-educated than for better-educated women (52).
There is complementary evidence of the negative effects of poor quality care on labor force
participation. Nearly a third of teenage mothers participating in one experiment, the Teenage Parent
Demonstration, reported that unsatisfactory quality of child care led them to stop working or to change
hours or activities (53).
WHAT IS THE QUALITY OF CARE IN THE UNITED STATES?
Is high-quality care the norm or the exception? Unfortunately, there are no nationally
representative studies to help us answer this question, and we must rely upon suggestive data from
multisite studies.
Process Quality
In the Cost, Quality, and Outcome Study (54), 398 centers in four states that varied in child care
regulations were identified. Of the sites studied, 12 percent were rated “less than minimal” in quality and
15 percent “good.” The remaining sites were rather evenly distributed between those two end points. This
may represent a rather optimistic picture, for the sites that did not consent to the study seem likely to have
offered lower-quality care. Only 52 percent of the sites consented to the observational studies.
Perhaps the best available estimate for children 3 years old or younger is provided by the NICHD
Study of Early Child Care, which conducted observations of over 600 nonmaternal child care settings of
all kinds (grandparents, in-home care, child care homes, and centers) in nine states (9). In this study care
was most often judged to be only fair in quality; over all, only 11 percent of the settings were considered
excellent. Poor-quality care was most likely in centers serving infants and toddlers (10 percent) than in
centers serving older children (4 percent).

vii
The NICHD investigators extrapolated their findings to the distribution of American families in
the National Household Education Survey of 1995. Their estimate—8 percent of settings for children
under 3 poor, 53 percent fair, 30 percent good, and 9 percent excellent in process quality—led them to
conclude that care is neither outstanding nor terrible, but that plenty of room remains for improvement.
Structural and Caregiver Characteristics
Quality of child care in the United States can also be estimated by the degree of adherence to
recommended guidelines in areas such as child:adult ratio and caregiver training. Very few states
currently have child care regulations that meet the age-based guidelines established by such professional
organizations as the American Academy of Pediatrics and the American Public Health Association (55).
For example, only three states have standards as strict as the recommended 3:1 ratio for infants. Some
states are at substantial odds with recommended standards. Eight states, for example, permit ratios of 6:1
for infants (see Table 10 of the report).
Nationally representative surveys also indicate that recommended standards for structural
characteristics are often not met. The Profile of Child Care Settings (56) found that the average center and
child care home had child:adult ratios that did not meet standards that are linked to positive
developmental outcomes. In 1990, caregivers in centers, but not child care homes, did tend to be well-
educated and trained. Nearly half had completed college, and 90 percent had received at least 10 hours of
in-service training. Regulated home child care providers had less education and training: 34 percent had
no schooling beyond high school and only about two-thirds had received any in-service training.
More recent data from the NICHD study suggests there has been some decline in the educational
background and training of child care staff over the decade (Table 12 of the report). Just over half of
infant and toddler caregivers had received specialized training during the preceding year and about two-
thirds had more than a high school degree. The decline may well be related to the generally low wages in
the child care field, which did not improve during the 1990s. Teachers averaged between $13,125 and

viii
$18,988 for full-week, full-year employment, assistant teachers only $6–$7 an hour. It is not surprising
that turnover has been high, with 20 percent of centers losing half or more of their staff in the course of a
year (57).
IS THERE A CASE FOR PUBLIC INVESTMENT IN QUALITY CHILD CARE?
Economists define market failure as “a situation in which a market left on its own fails to allocate
resources efficiently.” In the child care sector, there are two primary reasons for market failure. The first
is lack of information. In part because the market is made up of small providers, it is difficult for parents
to acquire information about the comparative quality, cost, and availability of care, and they are unsure
how to evaluate the information they do acquire. Considerations of convenience, time, and access mean
that parents may limit their search to small geographic areas; these problems may be particularly acute for
low-income families and for those who need care for odd-hours employment (58).
A second cause of market failure in the child care sector is what economists call “externalities”
(effects beyond the primary consumers). The benefits of high-quality care accrue not just to the parent
and the child but to society generally. They include lower costs for later schooling, as children enter
school better prepared to achieve; future reductions in crime as juvenile delinquency diminishes; and
increased productivity and lower need for social services as working parents face fewer child-related
absences or terminations and remain more securely attached to the labor market. The family and social
costs of poor-quality, unsafe, and unhealthy child care are equally apparent.
To these major causes of market failure, we may add a third—an “imperfect capital market.”
Parents of young children tend to have low incomes relative to their permanent incomes, and may face
borrowing constraints that reduce their ability to pay for high-quality care.
When markets fail, public-sector intervention may improve the performance of that sector of the
economy. Such intervention may also be justified by the goal of equality of opportunity. If high-quality

ix
child care improves cognitive ability, school readiness, and social behavior, children in low-income
families should be given the same opportunity to benefit as children in high-income families. To
accomplish this, government subsidies or direct provision of care are necessary.
Research tells us that difficulty in obtaining high-quality care above all affects low-income
families, especially those with intermittent work or nontraditional work hours. One-third of working-poor
mothers (incomes below poverty) and more than a quarter of working-class mothers (incomes below
$25,000) work weekends, and half of working-poor parents work on a rotating schedule, yet only 10
percent of centers and 6 percent of family day care homes provide weekend care. As a result, such parents
are more likely to rely on a patchwork of providers, including flexible and often unstable arrangements
with relatives, friends, and neighbors (59,60). Lack of stability is itself a measure of poor-quality care.
Thus market failure perpetuates itself. Because the demand for high-quality care is too low,
compensation is too low, and the more highly trained seek employment in other spheres. As a result,
quality declines, unless intervention occurs. We believe that the compelling social arguments that justify
the role of government in providing or subsidizing schooling from the elementary grades through college
are equally applicable to the first five years. Many of the benefits of child care are like those of primary
schooling—child care is, at its best, early childhood education. Just as primary schooling prepares
children for secondary schooling, so good child care readies children for primary schooling. The
community at large benefits from the cognitive, linguistic, and behavioral competencies that are
associated with higher-quality child care.
A variety of public-sector interventions may be used to improve child care. They include the
provision of information, licensing requirements, placement activities, financial incentives, and training
programs for child care workers, tuition subsidies and tax credits for parents, incentives for employer-
provided care, and direct provision of care. At a minimum, the public sector should provide information
on available child care slots, hours of operation, structural quality, costs, and staff training. It might also
establish training programs and mandate certain minimum requirements to improve quality—for example,
x
reducing child:adult ratios and group sizes and establishing and enforcing safety regulations and
certification requirements.
More ambitiously, the public sector might seek to increase the pool of well-qualified individuals
who enter and remain in the field of early childhood education through the kinds of tuition subsidies and
incentives traditionally used for training nurses, physicians, and teachers when shortages appear. It seems
especially important to raise salaries for child care providers, given how low they are relative to other
occupations. Government might play a role by providing increased information or tax credits to parents,
by expanding subsidy programs, or by directly paying providers.
A universal, coordinated, high-quality child care system for preschool children of working
parents might combine direct provision of services as part of local school district and community-based
programs with vouchers that would be accepted by certified providers. Part of the costs could be offset by
eliminating current tax credits and subsidies for 3- and 4-year-olds.
Incentive and subsidy programs of many kinds exist, but they are not sufficiently widespread.
Although federal funds are available to improve the access of lower-income families to child care, in
October 1999 only about 1.5 million of the 14.7 million low-income children estimated to be eligible for
subsidies were receiving them. States have been slow in making these funds available or have set up
programs that have low take-up rates. If states were to expand eligibility criteria to the federal maximum
and establish better outreach programs, the demand for high-quality care would clearly increase. Given
the opportunity, parents receiving federal subsidies most frequently chose center-based care (61,62). Nor
do subsidies appear to result in a “two-track” system. A study of six community programs by the Urban
Institute (60) suggests that subsidy programs enabled parents to access care that was as high in quality as
that chosen by better-off, unsubsidized parents.
xi
The Cost of Improving Child Care Quality
What level of investment is necessary to improve the quality of nonparental child care in the
United States? This topic has received less attention than the relationship between quality of care and
child outcomes. Several existing studies do, however, provide some useful information on the relationship
between quality of care and cost, although they are limited in scope and somewhat out of date.
Two studies using data from a 1989 General Accounting Office survey of 265 accredited early
childhood education centers that included measures of structural quality were able to estimate the costs
associated with changing the child:adult ratio, the size of the group, and staff characteristics (average
education, average experience, and turnover rate) (63,64). In each case they found statistically significant
relationships. For example, decreasing the average child:adult ratio by one is associated with increased
costs of roughly 4.5 percent. Thus if the average center, with 50 children and an average annual per-child
cost of $6,500, were to reduce the child:staff ratio from 11:1 to 10:1, the annual cost per child would
increase by about $306. A one-year increase in the average educational level of the staff is associated with
a 3.4 percent increase in total costs, including a 5.8 percent increase in wages. A one-year increase in
average staff experience is associated with a reduction in costs of 0.6 percent—including a 2.3 percent
increase in the wage bill. Finally, the impact of high turnover rates is clear: the departure of an additional
20 percent of a center’s teaching staff increases costs by 6.8 percent.
These data include only accredited centers in the Midwest and South, accepting children aged 4
and 5. Moreover, neither study included a short-term, readily available approach to improving the quality
of child care: better training of caregivers, including in-service training. We must, therefore, be cautious
in applying these findings elsewhere and should bear in mind that the relationship between improving
quality and cost for centers that provide care for other age groups may vary. Future work that incorporates
current and nationally representative data will be crucial in evaluating public policy strategies designed to
improve the quality of child care. Researchers Richard Brandon of the University of Washington and
Sharon Lynn Kagan of Yale University are now conducting research that will make it possible to estimate
xii
the costs of improving child care using varied measures of quality; their results are expected by the end of
2000.
CONCLUSIONS
Child care quality matters, in terms of children’s everyday experiences, of their cognitive and
linguistic competencies and school readiness, and of their later school achievement and social
interactions.
Studies of child care quality in the United States suggest room for improvement. Process quality
on average is only “fair” or “minimal.” For structural quality, the evidence indicates that average group
sizes and child:adult ratios exceed recommended standards, and that the educational background of child
care workers has declined over the last decade. Both aspects can be improved, through additional public-
sector resources and the application of federal standards or higher state standards.
From an economist’s perspective, the clear evidence of market failure in the child care sector
indicates a need for public-sector intervention. The benefits of high-quality child care accrue not only to
the family and the child, but also to other members of society, including all children in schools with
children who attended child care; taxpayers who are likely to save in the costs of future schooling,
especially through reductions in special education and grade retention; and potentially citizens who gain
through reduced crime and public assistance costs. Subsidizing child care for low-income families is
consistent with the goals of the 1996 welfare reforms and with an ideology that seeks to encourage and
reward work. And in the interest of equality of opportunity, a strong argument can be made for extending
the benefits of high-quality child care to children in low-income families.

xiii
Executive Summary References
1) Hofferth, S. L., K. A. Shauman, R. R. Henke, and J. West. 1998. Characteristics of Children’s EarlyCare and Education Programs: Data from the 1995 National Household Education Survey(Report No. 98-128). Washington, DC: U.S. Department of Education, National Center forEducation Statistics.
2) Lamb, M. E. 1998. “Nonparental Child Care: Context, Quality, Correlates, and Consequences.” InHandbook of Child Psychology. Vol. 4: Child Psychology in Practice, ed. W. Damon, I. E. Sigel,and K. A. Renninger, pp. 73–133. New York: Wiley.
3) Phillips, D. A. (Ed.). 1987. Quality in Child Care: What Does Research Tell Us? Washington, DC:National Association for the Education of Young Children.
4) Blau, D. M. 1999c. “The Effects of Child Care Characteristics on Child Development.” Journal ofHuman Resources 34: 786–822.
5) Scarr, S. 1998. “American Child Care Today.” American Psychologist 53: 95–108.
6) Hofferth, S. L., A. Brayfield, S. Deich, and P. Holcomb. 1991. National Child Care Survey, 1990,Report 91-5. Washington, DC: The Urban Institute Press.
7) Clarke-Stewart, K. A, C. P. Gruber, and L. M. Fitzgerald. 1994. Children at Home and in Day Care.Hillsdale, NJ: Erlbaum.
8) Howes, C. 1983. “Caregiver Behavior in Center and Family Day Care.” Journal of AppliedDevelopmental Psychology 4: 99–107.
9) NICHD Early Child Care Research Network. 2000a. “Characteristics and Quality of Child Care forToddlers and Preschoolers.” Applied Developmental Sciences 4:116–135.
10) Phillipsen, L. C., M. R. Burchinal, C. Howes, and D. Cryer. 1997. “The Prediction of Process Qualityfrom Structural Features of Child Care.” Early Childhood Research Quarterly 12: 281–303.
11) Ruopp, R., J. Travers, F. Glantz, and C. Coelen. 1979. Children at the Center: Final Report of theNational Day Care Study. Cambridge, MA: Abt.
12) Volling, B. L., and L. V. Feagans. 1995. “Infant Day Care and Children’s Social Competence.” InfantBehavior and Development 18: 177–188.
13) Burchinal, M. R., J. E. Roberts, L. A. Nabors, and D. M. Bryant. 1996. “Quality of Center Child Careand Infant Cognitive and Language Development.” Child Development 67: 606–620.
14) Scarr, S., M. Eisenberg, and K. Deater-Deckard. 1994. “Measurement of Quality in Child CareCenters.” Early Childhood Research Quarterly 9: 131–151.
15) St. Sauver, J., M. Khurana, A. Kao, and B. Foxman. 1998. “Hygienic Practices and Acute RespiratoryIllness in Family and Group Day Care Homes.” Public Health Reports 111: 544–551.

xiv
16) Niffenegger, J. P. 1997. “Proper Handwashing Promotes Wellness in Child Care.” Journal ofPediatric Health Care 11:26–31.
17) Kotch, J, C. Guthrie. 1998. “Effect of a Smart Start Playground Improvement Grant on Child CarePlayground Hazards.” Smart Start Evaluation Report. Chapel Hill, NC: Frank Porter GrahamChild Development Center.
18) Hestenes, L. L., S. Kontos, and Y. Bryan. 1993. “Children’s Emotional Expression in Child CareCenters Varying in Quality.” Early Childhood Research Quarterly 8: 295–307.
19) Elicker, J., C. Fortner-Wood, and I. C. Noppe. 1999. “The Context of Infant Attachment in FamilyChild Care.” Journal of Applied Developmental Psychology 20: 319–336.
20) Howes, C., D. A. Phillips, and M. Whitebrook, M. 1992. “Thresholds of Quality: Implications for theSocial Development of Children in Center-Based Child Care.” Child Development 63: 449–460.
21) Howes, C., and E. W. Smith. 1995. “Relations among Child Care Quality, Teacher Behavior,Children’s Play Activities, Emotional Security, and Cognitive Activity in Child Care.” EarlyChildhood Research Quarterly 10: 381–404.
22) Dunn, L., S. A. Beach, and S. Kontos. 1994. “Quality of the Literacy Environment in Day Care andChildren’s Development.” Journal of Research in Childhood Education 9: 24–34.
23) Goelman, H. 1988. “The Relationship between Structure and Process Variables in Home and DayCare Settings on Children’s Language Development.” In The Practice of Ecological Research:From Concepts to Methodology, ed. A. Pence and H. Goelman, pp. 16–34.
24) McCartney, K. 1984. “Effect of Quality of Day-Care Environment on Children’s LanguageDevelopment.” Developmental Psychology 20: 244–260.
25) NICHD Early Child Care Research Network. 2000b. “The Relation of Child Care to Cognitive andLanguage Development.” Child Development 71:960–980.
26) Peisner-Feinberg, E. S., and M. R. Burchinal. 1997. “Relations between Preschool Children’s Child-Care Experiences and Concurrent Development: The Cost, Quality, and Outcomes Study.”Merrill-Palmer Quarterly 43: 451–477.
27) Schliecker, E., D. R. White, and E. Jacobs. 1991. “The Role of Day Care Quality in the Prediction ofChildren’s Vocabulary.” Canadian Journal of Behavioural Science 23: 12–24.
28) Hausfather, A., A. Toharia, C. LaRoche, and F. Engelsmann. 1997. “Effects of Age of Entry, Day-Care Quality, and Family Characteristics on Preschool Behavior.” Journal of Child Psychologyand Psychiatry and Allied Disciplines 38: 441–448.
29) Vernon-Feagans, L., D. C. Emanuel, and I. Blood. 1997. “The Effect of Otitis Media and QualityDaycare on Children’s Language Development.” Journal of Applied Developmental Psychology18: 395–409.
xv
30) Howes, C. 1997. “Children’s Experiences in Center-Based Child Care as a Function of TeacherBackground and Adult:Child Ratio.” Merrill-Palmer Quarterly 43: 404–425.
31) Dunn, L. 1993. “Proximal and Distal Features of Day Care Quality and Children’s Development.”Early Childhood Research Quarterly 8: 167–192.
32) Clarke-Stewart, K. A., D. L. Vandell, M. Burchinal, M, O’Brien, and K. McCartney. 2000. DoFeatures of Child Care Homes Affect Children’s Development? Unpublished paper. University ofCalifornia, Irvine.
33) Burchinal, M. R., J. E. Roberts, R. Riggins, S. A. Zeisel, E. Neebe, and D. Bryant. 2000. “RelatingQuality of Center Child Care to Early Cognitive and Language Development Longitudinally.”Child Development 71: 339–357.
34) Peisner-Feinberg, E. S., M. R. Burchinal, R. M. Clifford, M. L. Culkin, C. Howes, S. L. Kagan, N.Yazejian, P. Byler, J. Rustici, and J. Zelazo. 1999. The Children of the Cost, Quality, andOutcomes Study Go to School: Technical Report.
35) Howes, C. 1990. “Can the Age of Entry into Child Care and the Quality of Child Care PredictAdjustment in Kindergarten?” Developmental Psychology 26: 292–303.
36) NICHD Early Child Care Research Network. 1998. “Early Child Care and Self-Control, Compliance,and Problem Behaviors at Twenty-Four and Thirty-Six Months.” Child Development 69:1145–1170.
37) NICHD Early Child Care Research Network. 1999b. “Effect Sizes from the NICHD Study of EarlyChild Care.” Paper presented at the biennial meeting of the Society for Research in ChildDevelopment, Albuquerque, NM. April.
38) NICHD Early Child Care Research Network. 2000b. “The Relation of Child Care to Cognitive andLanguage Development.” Child Development 71: 960–980.
39) Howes, C. 1988. “Relations Between Early Child Care and Schooling.” Developmental Psychology24: 53–57.
40) Chin-Quee, D. S., and S. Scarr. 1994. “Lack of Early Child Care Effects on School-Age Children’sSocial Competence and Academic Achievement.” Early Development and Parenting 3: 103–112.
41) Deater-Deckard, K., R. Pinkerton, and S. Scarr. 1996. “Child Care Quality and Children’s BehavioralAdjustment: A Four-Year Longitudinal Study.” Journal of Child Psychology and Psychiatry andAllied Disciplines 37: 937–948.
42) Campbell, F. A., and C. T. Ramey. 1995. “Cognitive and School Outcomes for High Risk AfricanAmerican Students at Middle Adolescence: Positive Effects of Early Intervention.” AmericanEducational Research Journal 32: 743–772.
43) Ramey, C. T., F. A. Campbell, and C. Blair. 1998. “Enhancing the Life-Course for High-RiskChildren: Results from the Abecedarian Project.” In Social Programs That Really Work, ed. J.Crane, pp. 63–183. New York: Sage Publishing.

xvi
44) Ramey, C. T., F. A. Campbell, M. Burchinal, M. L. Skinner, D. M. Gardner, and S. L. Ramey. 2000.“Persistent Effects of Early Childhood Education on High-Risk Children and Their Mothers.”Applied Developmental Science 4: 2–14.
45) Schweinhart, L. J., H. V. Barnes, D. P. Weikart, et al. 1993. Signiticant Benefits: The High/ScopePerry Preschool Study through Age 27. Ypsilanti, MI: High/Scope Press.
46) Reynolds, A. J., J. A. Temple, D. L. Robertson, and E. A. Mann. 2000. “Long-Term Benefits ofParticipation in Title I Chicago Child-Parent Centers.” Paper presented at the biennial meeting ofthe Society for Research on Adolescence, Chicago, IL. March.
47) Maume, D. 1991. “Child Care Expenditures and Women’s Employment Turnover.” Social Forces 70:494–508.
48) Blau, D., and R. Philip. 1989. “Fertility, Employment and Child Care Costs.” Demography 26:287–299.
49) Meyers, M. 1993. “Child Care in Jobs Employment and Training Programs: What Difference DoesQuality Make?” Journal of Marriage and the Family 55: 767–783.
50) Benasich, April, J. Brooks-Gunn, and B. Clewell. 1992. “How Do Mothers Benefit from EarlyIntervention Programs?” Journal of Applied Developmental Psychology 13: 311–326.
51) Ross, C., and D. Paulsell. 1998. “Sustaining Employment among Low-Income Parents: The Role ofQuality in Child Care: A Research Review.” Final report. Princeton, NJ: MPR.
52) Brooks-Gunn, J., M. McCormick, S. Shapiro, A. Benasich, and G. Black. 1994. “The Effects of EarlyEducation Intervention on Maternal Employment, Public Assistance and Health Insurance: TheInfant Health and Development Program.” American Journal of Public Health 84: 924–931.
53) Ross, C., and D. Paulsell. 1998. “Sustaining Employment among Low-Income Parents: The Role ofQuality in Child Care: A Research Review.” Final report. Princeton, NJ: MPR.
54) Helburn, S., et al. 1995. Cost, Quality, and Child Outcomes in Child Care Centers. Public report.Denver: Economics Department, University of Colorado at Denver.
55) American Public Health Association, American Academy of Pediatrics. 1992. Caring for OurChildren: National Health and Safety Performance Standards. Standards for Out-of-Home ChildCare Programs. Ann Arbor, MI.: APHA.
56) Kisker, E. E., S. L. Hofferth, D. S. Phillips, and E. Farquhar. 1991. A Profile of Child Care Settings:Early Education and Care in 1990, Volume 1. Princeton, NJ: Mathematica Policy Research, Inc.
57) Whitebook, M., C. Howes, and D. Phillips. 1990. Who Cares? Child Care Teachers and the Qualityof Care in America. Final report. National Child Care Staffing Study. Oakland, CA: Child CareEmployee Project.
58) Vandell, D. L. 1998. “Child Care for Low-Income Families: Dreams and Real Life.” In Children andFamilies in an Era of Rapid Change: Creating a Shared Agenda for Researchers, Practitioners

xvii
and Policy Makers, ed. F. Lamb-Parker, J. Hagen, R. Robinson, and C. Clark, pp.61–68.Washington, DC: Department of Health and Human Services.
59) Hofferth, S. 1999. “Child Care, Maternal Employment and Public Policy.” Annals of the AmericanAcademy 563 (May): 20–38.
60) Phillips, D. A. (Ed.). 1995. Child Care for Low Income Families: Summary of Two Workshops.Washington, DC: National Academy Press. Report available on World Wide Web:http://nccic.org/research/nrc_care/c_care.html
61) “Access to Child Care for Low-Income Working Families,” released in October 1999,http://www.acf.dhhs.gov/news/press/1999/ccreport.htm
62) Council of Economic Advisers. 1997. The Economics of Child Care. December.http://www.whitehouse.gov/WH/EOP/CEA/html/childcare.html#econ
63) U.S. General Accounting Office. 1990. Early Childhood Education: What Are the Costs of HighQuality Programs? HRD-90-43BR. Washington DC: GAO.
64) Powell, I., and J. Cosgrove. 1992. “Quality and Cost in Early Childhood Education,” Journal ofHuman Resources 27: 472–484.

Child Care Quality: Does It Matter and Does It Need to Be Improved?
Child care has become the norm for young children in the United States. In 1995, 59 percent of
children 5 years old or younger were in nonparental care arrangements on a regular basis (Hofferth,
Shauman, Henke, and West, 1998). This care typically began at early ages and lasted many hours a week:
44 percent of infants (less than 1 year old) were in nonparental care for an average of 31 hours a week. In
the late preschool years, 84 percent of 4- to 5-year-olds were recorded as being in child care for an
average of 28 hours per week. The use of nonparental care in the United States is expected to grow even
further as welfare reform is fully implemented (Vandell, 1998).
It is within this framework of widespread and early-age use that questions about child care quality
have been raised. Among child care researchers, the established view is that child care quality contributes
to children’s developmental outcomes, higher-quality care being associated with better developmental
outcomes and poorer-quality care being associated with less favorable outcomes for children (Clarke-
Stewart and Fein, 1983; Phillips, 1987). This view is reflected in Michael Lamb’s (1998) comprehensive
critique of child care research in the Handbook of Child Psychology. Lamb concluded, based on extant
research, that:
Quality day care from infancy clearly has positive effects on children’s intellectual,verbal, and cognitive development, especially when children would otherwise experienceimpoverished and relatively unstimulating home environments. Care of unknown qualitymay have deleterious effects (p. 104).
A similar conclusion was drawn in a review prepared for the Rockefeller Foundation (Love, Schochet,
and Meckstroth, 1996):
The preponderance of evidence supports the conclusion of a substantial positiverelationship between child care quality and child well-being. Evidence for thisrelationship encompasses multiple dimensions of quality and diverse indicators ofchildren’s well-being (p. 3).
This view, however, is not uniformly held. Some researchers and policymakers have begun to question
the conventional wisdom regarding child care quality (Besharov, 2000; Blau, 1999c; Scarr, 1998). Sandra
Scarr (1998), for example, has concluded that:

2
Widely varying qualities of child care have been shown to have only small effects onchildren’s concurrent development and no demonstrated long term impact, except fordisadvantaged children (p. 95).
A major goal of the current report is to evaluate the research evidence from which these claims
and counterclaims are drawn. We then analyze the argument for public intervention to improve the
quality of child care, especially for children from lower-income families.
A careful review of the literature indicates that reviewers often draw on the same research studies,
but interpret findings differently. These different interpretations are based, in part, on where the reviewers
have “set the bar.” Some researchers place more weight on studies that include observational assessments
of child care quality and that measure psychological processes using multiple strategies (NICHD Early
Child Care Research Network, 1994). These same investigators tend to place less emphasis on the need
for large, nationally representative samples. Although the investigators believe that it is important to
assess and control for selection biases, they worry more about overcontrol than undercontrol in their
analyses. In contrast, others (see Besharov, 2000; Blau, 1999c, 2000) have emphasized the importance of
large, nationally representative samples and the need to have sufficient controls in the statistical analyses.
These investigators have placed greater credence on information obtained from nationally representative
surveys, even if studies lacked observational assessments of child care quality or objective measures of
child performance.
An additional factor contributing to different conclusions about child care quality is how heavily
reviewers weigh the importance of concurrent versus long-term findings. As can be seen in Tables 1, 2,
and 5, the research literature describing concurrent associations between child care quality and child
performance is larger and findings are more consistent than the research literature that tests for longer-
term effects. A number of factors may contribute to the more mixed picture for long-term effects,
including measurement problems and lack of control for experiences during the intervening period. A
better consensus about realistic and reasonable expectations about effect sizes also is needed (McCartney
and Rosenthal, 2000).

3
Thus, a variety of factors must be considered if we are to determine whether associations between
child care quality and children’s developmental outcomes are large enough for parents, researchers, and
policymakers to care about, and whether effects warrant public or private expenditures to improve
quality. In an effort to address these broad issues, we pose five specific questions:
(1) How is child care quality measured?
(2) Does quality of child care have meaningful effects on children’s developmentaloutcomes?
(3) Does child care quality affect maternal employment?
(4) What is the quality of care in the United States?
(5) Is there a persuasive economic argument to justify public intervention to improve thequality of child care?
HOW IS CHILD CARE QUALITY MEASURED?
A critical issue in evaluating the research evidence is consideration of how child care quality is
measured. Researchers have measured quality in various ways: by observing process, by recording
structural and caregiver characteristics, by assessing health and safety provisions. Child care processes
refer to actual experiences that occur in child care settings, including children’s interactions with
caregivers and peers and their participation in different activities. Sometimes process measures are global
scores that combine experiences across several areas including health and safety provisions, interactions
with caregivers, and age-appropriate materials. Other process measures target specific activities or
experiences, such as language stimulation by caregivers. Structural and caregiver characteristics refer to
features such as child:adult ratio, group class size, caregiver formal education, and caregiver specialized
training related to children. Structural and caregiver characteristics are conceptualized as more distal
indicators of child care quality. Health and safety provisions refer to both health-promoting practices
(such as hand-washing) and safety in the classroom and on playgrounds.

4
Process Quality
One well-known process measure is the Early Care Environment Rating Scale (ECERS, Harms
and Clifford, 1980). This measure is composed of 37 items that evaluate seven aspects of center-based
care for children aged 2.5 to 5 years. These areas are personal care routines, furnishings, language
reasoning experiences, motor activities, creative activities, social development, and staff needs. Detailed
descriptors are provided for each item and each item is rated as inadequate (1), minimal (3), good (5), and
excellent (7). The ratings, according to the scale developers, are based on a minimum of a 2-hour block of
observation in the classroom. The Infant/Toddler Environment Rating Scale (ITERS, Harms, Cryer, and
Clifford, 1990) is a related measure that assesses process quality in centers for children younger than 2.5
years. The 35 items of the ITERS also are organized under seven domains and are rated on 7-point scales.
These same investigators have developed a 32-item observational measure, the Family Day Care
Rating Scale (FDCRS), to assess process quality in child care homes (Harms and Clifford, 1989). Some
items parallel items on the ITERS and the ECERS, but other items are unique because the instrument
“tries to remain realistic for family day care home settings by not requiring that things be done as they are
in day care centers” (p. 1).
As can be seen on Tables 1, 2, and 5, these measures are used widely in child care research. The
measures have important strengths, including having good psychometric properties and being relatively
easy to use reliably. Their widespread use means that cross-study comparisons are possible. These
measures also have some limitations. The global composite score combines features of the physical
environment, social experiences, and working conditions for staff. Some of these areas may well have
greater influences on children’s intellectual functioning or social-emotional well-being than others. The
composite score may underestimate effects relative to more targeted scales. A second limitation is that
these measures are setting-specific. As a result, they cannot be used as interchangeable measures of
quality, meaning that it is not possible to make simple comparisons across types of care or to combine
5
scores in omnibus analyses that look at quality effects across different types of care. A third limitation is
that these measures are not appropriate for assessing in-home care given by nannies or grandparents.
The Observational Record of the Caregiving Environment (ORCE) was developed to address
these limitations (NICHD Early Child Care Research Network, 1996, 2000a). Because psychological
theory and research have indicated the central role of experiences with caring adults for children’s well-
being and development, the ORCE focuses on this domain. Both time-sampled behavioral counts of
caregiver actions (e.g., responds to vocalization, asks questions, speaks negatively) and qualitative ratings
of those behaviors over time to characterize caregivers’ behavior with individual children are collected
during a minimum of four 44-minute observation cycles spread over a 2-day period. At the end of each
44-minute cycle, observers record ratings from 1 = “not at all characteristic” to 4 = “highly characteristic”
to describe caregiver behavior. A positive caregiving composite score is created by obtaining a mean
score across scales over all of the ORCE cycles at a given age period. Higher scores indicate caregivers
who are more sensitive and responsive to a child’s needs, who are warm and positive, who are cognitively
stimulating, and who are not detached or hostile. Unlike the ECERS, ITERS, or FDCRS, the ORCE can
be used in all types of child care and with children across the first five years. Age-appropriate behavioral
descriptors for caregivers’ behaviors with infants, toddlers, and preschoolers are provided.
Another popular process measure is the Caregiver Interaction Scale (Arnett, 1989) that rates
teachers’ sensitivity during interactions with children. This 26-item measure yields three scores
(sensitivity—warm, attentive, engaged; harshness—critical, punitive; detachment—low levels of
interaction, interest, or supervision) which are combined to create an overall caregiver quality score. The
ratings are made after two 45-minute observations conducted on two separate occasions by two separate
observers.
The Assessment Profile (Abbott-Shim and Sibley, 1992a, 1992b) assesses different aspects of
quality, namely features related to health and safety, physical facilities, and individualized child services.
Different forms of the instrument are available for child care homes and centers. These forms list
6
individual items that are viewed as exemplars of (a) healthy, safe settings, (b) rich physical environments,
and (c) settings that meet the needs of adult staff. Individual items are scored using a yes/no format, with
“yes” designating items that were either observed or reported by staff. These items can be scored reliably
(see NICHD Early Child Care Research Network, 1996). Caregivers have been observed to offer more
positive caregiving in settings that receive higher Profile scores (NICHD Early Child Care Research
Network, 1996, 2000a).
The CC-HOME Inventory is a measure of process quality that employs a checklist approach to
create a quality score across multiple domains, including the health and safety of the physical
environment, variety of experiences, and materials (NICHD Early Child Care Research Network, 1996).
Derived from Bradley and Caldwell’s well-known assessment of the quality of the home environment, 45
items are scored on a yes/no basis and then summed (alpha = .81). In one study, children who attended
better-quality child care homes as measured by the CC-HOME Inventory obtained higher Bayley scores
at 24 months and higher school readiness and language comprehension scores at 36 months than did
children who attended poorer-quality child care homes (Clarke-Stewart et al., 2000).
Other measures have been less successful in providing reliable and valid assessments of process
quality. For example, Lamb and colleagues failed to find concurrent associations between child care
quality and child functioning in their study of child care in Sweden (Broberg et al., 1990). Problems with
their quality measure likely contributed to the lack of significant relations. The Belsky-Walker Checklist
(Broberg et al., 1990) asks observers to check off if 13 positive events (e.g., caregiver provides verbal
elaboration; caregiver gives heightened emotional display; signs of positive regard ) and seven negative
events (e.g., child cries; child aimless; caregivers in nonchild conversations) occur at least once during 3-
minute observation intervals. This 3-minute observation frame was substantially longer than the 10- to
30-second intervals recommended for recording social interactions (Yarrow and Zahn-Waxler, 1979).
Consequently, the checklist may have failed to detect meaningful distinctions in caregiver behavior
because the time interval was too long to detect meaningful differences. This checklist underscores the

7
challenge of designing and assessing process quality. Detecting relations between process quality and
child outcomes requires robust measures.
Structural and Caregiver Characteristics
A second approach to describing child care quality is in terms of structural and caregiver
characteristics. Characteristics such as child:adult ratio, group class size, caregiver formal education, and
caregiver specialized training are viewed as more distal contributors to quality environments. Structural
and caregiver characteristics are the only quality indicators obtained in survey studies such as the
National Child Care Survey (Hofferth et al., 1991), the National Household Education Survey (Hofferth
et al., 1998), and the National Longitudinal Survey of Youth (Blau, 1999c). Structural and caregiver
characteristics have been collected in addition to process-oriented measures in studies such as the Cost,
Quality, and Outcome Study, thereby permitting relations between these characteristics and process
quality to be evaluated.
Relations between structural and caregiver characteristics and process quality are well-
documented in the research literature. Table 1 is a compilation of the studies conducted in the United
States that have considered this issue. The table includes information regarding sample size, type of care
setting, structural and caregiver characteristics that were measured, process quality measures that were
collected, and findings that were obtained. As indicated in Table 1, some studies have considered
bivariate relations between structural and caregiver characteristics and process quality using Pearson
correlations and t-tests. Other studies (Blau, 2000; NICHD Early Child Care Research Network, 1996,
2000a; Phillipsen et al., 1997) employed multiple regression techniques in an effort to isolate the relative
impact of different characteristics. As documented in the table, the multivariate results are consistent with
the bivariate and global composite analyses. As seen in Table 1, studies have considered both global
composites of structural and caregiver characteristics and individual factors in relation to process quality
(Howes, 1990; Vandell and Powers, 1983).

TABLE 1 Relationship between Structural Variables and Process Variables
CITATIONa N TYPE OF CARE STRUCTURAL VARIABLES PROCESS VARIABLESb ANALYSIS FINDING
Arnett (1989) 59 Centers CG1 training: 1. no training, 2. two courses Bermuda college, 3. four- course training program, 4. four-year college degree in ECE2
Parental Modernity Scale, CIS (Positive Interaction, Punitiveness, Detachment, Permissiveness)
ANCOVA CG1 w/ half or all the Bermuda College training less authoritarian in childrearing attitudes than CG w/ no training, rated higher on positive interaction and lower on detachment in interactions w/ children. CG1 w/ 4-yr ECE2 degree differ from other 3 gps: childrearing attitudes less authoritarian, interact w/ children rated higher on Pos. Interact. and lower on Punitiveness and Detachment.
Berk (1985) 37 Centers CG formal education & CG specialized training
Observations of caregiver behavior
ANOVAs and correlations
College-educated caregivers had more encouraging behaviors, more suggestions, less restrictive actions.
Blau (2000) 548 classrooms (reanalysis of CQO data)
Centers Group size, ratio, CG experience, job tenure, ethnicity, formal education, specialized training
ECERS, ITERS Pearson correlations, regressions with and without a fixed effect control for center ID
Simple correlations and regressions that did not include the fixed effect center control found lower group size, lower C:A ratio, and more CG training to be related to better ECERS scores; these relations were substantially reduced when the center fixed effect control was added to the model
Burchinal, Howes, and Kontos (1999)
Total=244 Florida Child Care Study=144 California Licensing Study=100
Family Child Care CG1 education, formal and informal training experiences, experience as a child care provider, group size, business practices Points (sum of number or children, weighted by age of children)
FDCRS, CIS Pearson correlations Regression
CG1 education and experience better predictors of CC quality than C:A ratios. CG1 w/ more edÅmore sensitive and rated higher on global quality. More experienced CG1 slightly more detached and provide lower-quality care. CG w/ more education tended to have settings w/ higher global quality ratings. CG experience was negatively related to observed quality in the licensed Family Child Care Study. Group size or ratio not related to observed quality of care.
Burchinal, Roberts, Nabors, and Bryant (1996)
79 Centers Director & observer reports of group size & C:A ratio; teacher report of training & experience
ITERS Pearson correlations Higher observed and reported C:A ratios were associated with lower ITERS scores. Higher CG training was associated with higher ITERS scores.
Burchinal et al. (2000) 27 Centers C:A ratio3, CG1 education, group size
ITERS, ECERS Pearson Correlations Higher C:A ratios3 were related to lower global quality at 12 mos, 24 mos, and 36 mos. Higher group size was related to lower global quality at 24 mos and 36 mos. Higher teacher education was related to higher global quality at 12 mos and 36 mos.
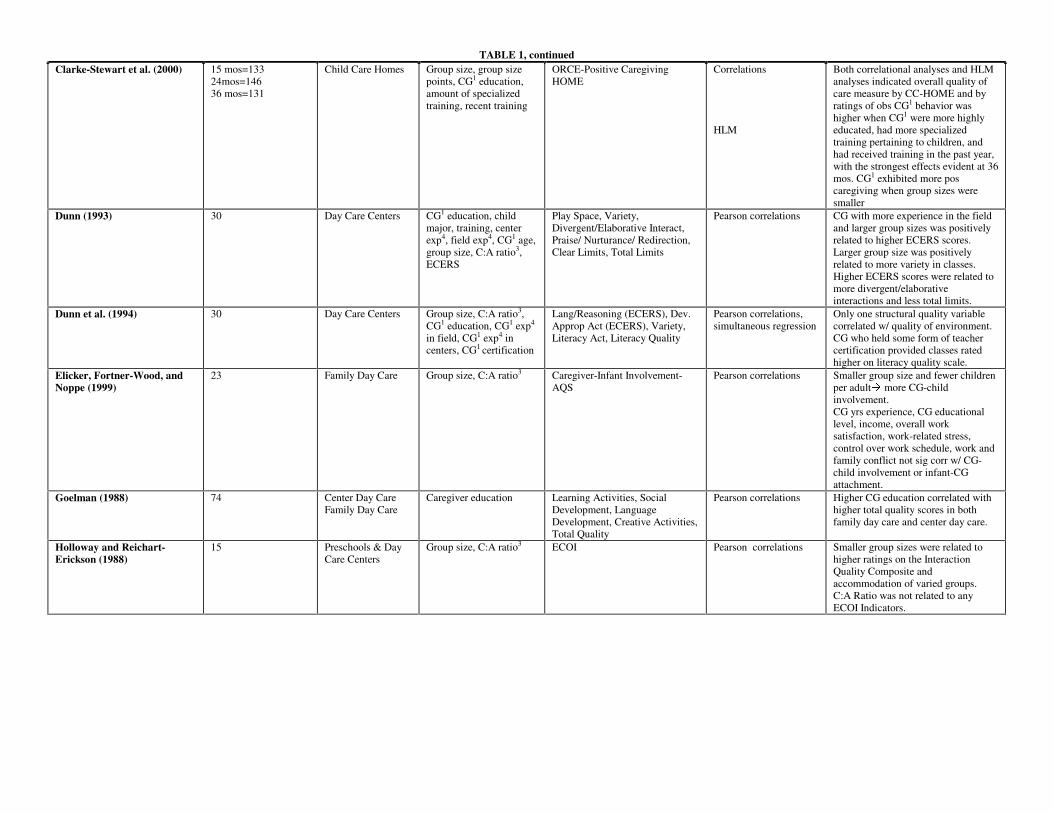
TABLE 1, continued Clarke-Stewart et al. (2000) 15 mos=133
24mos=146 36 mos=131
Child Care Homes Group size, group size points, CG1 education, amount of specialized training, recent training
ORCE-Positive Caregiving HOME
Correlations HLM
Both correlational analyses and HLM analyses indicated overall quality of care measure by CC-HOME and by ratings of obs CG1 behavior was higher when CG1 were more highly educated, had more specialized training pertaining to children, and had received training in the past year, with the strongest effects evident at 36 mos. CG1 exhibited more pos caregiving when group sizes were smaller
Dunn (1993) 30 Day Care Centers CG1 education, child major, training, center exp4, field exp4, CG1 age, group size, C:A ratio3, ECERS
Play Space, Variety, Divergent/Elaborative Interact, Praise/ Nurturance/ Redirection, Clear Limits, Total Limits
Pearson correlations CG with more experience in the field and larger group sizes was positively related to higher ECERS scores. Larger group size was positively related to more variety in classes. Higher ECERS scores were related to more divergent/elaborative interactions and less total limits.
Dunn et al. (1994) 30 Day Care Centers Group size, C:A ratio3, CG1 education, CG1 exp4 in field, CG1 exp4 in centers, CG1 certification
Lang/Reasoning (ECERS), Dev. Approp Act (ECERS), Variety, Literacy Act, Literacy Quality
Pearson correlations, simultaneous regression
Only one structural quality variable correlated w/ quality of environment. CG who held some form of teacher certification provided classes rated higher on literacy quality scale.
Elicker, Fortner-Wood, and Noppe (1999)
23 Family Day Care Group size, C:A ratio3 Caregiver-Infant Involvement-AQS
Pearson correlations Smaller group size and fewer children per adultÅ more CG-child involvement. CG yrs experience, CG educational level, income, overall work satisfaction, work-related stress, control over work schedule, work and family conflict not sig corr w/ CG-child involvement or infant-CG attachment.
Goelman (1988) 74 Center Day Care Family Day Care
Caregiver education Learning Activities, Social Development, Language Development, Creative Activities, Total Quality
Pearson correlations Higher CG education correlated with higher total quality scores in both family day care and center day care.
Holloway and Reichart-Erickson (1988)
15 Preschools & Day Care Centers
Group size, C:A ratio3 ECOI Pearson correlations Smaller group sizes were related to higher ratings on the Interaction Quality Composite and accommodation of varied groups. C:A Ratio was not related to any ECOI Indicators.

TABLE 1, continued Howes (1983) 40 Center Day Care &
Family Day Care C:A ratio3, group size, # adults, CG1 years experience, training child development
CG1 Behavior (facilitative social, express pos affect, neg affect, restrict, responsivity)
Pearson Correlations Caregivers in both settings w/ fewer children in their care, who worked shorter hours, w/ less housework responsibilities engaged in more facilitative social stimulation, expressed more positive affect, were more responsive, and less restrictive and negative. Family day care caregivers who worked in spaces specifically designed to be safe & appropriate for children were less restrictive of toddler activity.
Howes (1997) Total=1065 Cost, Quality, Outcome Study (CQOS) =655 Florida Quality Improvement Study (FQIS)=410
Child Care Centers C:A ratio3, CG1 education, CG1 ECE2 training
CIS, AIS ANOVA CQOS: CG1 w/ BA or beyond degrees in ECE2 rated more sensitive than CG w/ AA degrees in ECE2, who were more sensitive than CG1 w/ other bkgds. CG1 w/ at least AA degree less harsh than CG1 in other bkgds. CG1 in classes in compliance w/ ratio standards rated more sensitive, less harsh, and less detached. FQIS: CG1 w/ at least BA in ECE2 rated more sensitive than CG1 w/ CDA training who were rated as more sensitive than all other CGs1. Caregivers w/ most advanced educationÅmost effective
Howes, Phillips, and Whitebook (1992)
143 Child Care Centers C:A ratio3, group size Appropriate Caregiving, Developmentally Appropriate Activities
Chi-square Higher child:adult ratios were in classrooms rated as inadequate in caregiving and rated as inadequate in activities. Children in classes w/ better ratios than children in classes w/ worse (higher) ratios experienced both caregiving and activities rated as good or very good. Large group sizes were more likely to be rated as inadequate in caregiving and inadequate in activities. However, smaller group sizes were also rated as inadequate in activities. Children in classes w/ smaller group sizes were more likely than children in classrooms exceeding these standards to experience developmentally appropriate activities. No association between group size and appropriate caregiving.

TABLE 1, continued Howes and Rubenstein (1985) 50
Home=23 Center Daycare=11 Family Daycare=16
Home, Center Day Care, Family Day Care
C:A ratio3, group size
Caregiver-Child Interaction (Talk & Play, Restrict & Cry, Touch & Laugh)
Pearson correlations, one-way ANOVA
Lower C:A ratio predicted quality of CG1-child interaction (i.e., social interactions - talk & play, touch & laugh, & less restrict & cry). Children at home, in high C:A ratio3 FDC, and high C:A ratio3 CDC-->higher Restrict & Cry than in low C:A ratio3 FDC. Smaller group sizes and lower C:A ratiosÅhigher Talk & Play & higher Touch & Laugh, less Restrict & Cry than children in larger groups and higher C:A ratios
Howes and Smith (1995) 150 Child Care Centers CG1 char (yrs ed + specialized training in ECE2), C:A ratio3, group size
ITERS, ECERS Pearson correlations Classes w/ more educated and trained teachersÅhigher ITERS & ECERS scores. Infant-toddler classes w/ more educated & trained teachersÅsmaller group size. Preschool classes w/ more educated & trained teachersÅsmaller group size & fewer children per adult.
Howes, Whitebook, and Phillips (1992)
1300 Child Care Centers CC5 experience, specialized training, education
ECERS, ITERS, Arnett Teacher Sensitivity Measure
Pearson correlations, multiple regression
CG1 experience not good predictor of CG1 behavior. More formal education and more specialized child-related trainingÅCG1 behaviors. Formal education better predictor than specialized training. Infant/toddler CGs1 need more college-level specialized training than preschool teachers to be competent teachers.
Iutcovich et al. (1997) 675 Center=561 Group Home=70 Family=44
Center, group home, family
CG1 education, CG1 yrs in field, CG1 salary, CG1 long-term ed goal, training characteristics, organizational climate
ITERS, ECERS, FDCRS Pearson correlations Higher CG1 salaryÅhigher ITERS and ECERS scores Younger CG1, CG1 w/ more long-term educational goals, evaluating appropriateness, and evaluating usefulness Å higher FDCRS scores. CGs1 w/ higher long-term educational goals, more likely to evaluate appropriateness & usefulnessÅhigher FDCRS scores. CG1 higher ratings of professional growth, clarity, reward system, goal consensus, and task orientationÅhigher ECERS scores.
Kontos, Howes, and Galinsky (1996)
Training Group=130 Regulated Providers=112
Family Day Care CG1 training, C:A ratio3, group size
Process Quality: Arnett Scale of Provider Sensitivity, Adult Involvement Scale Global Quality: FDCRS
Chi square, t-test
Training group and comparison group were similar on structural, process, and global quality. Providers in comparison group cared for slightly more children per adult than training group. Effects of trainingÅno changes in process quality. Effects of trainingÅincreased global quality in two of three sites.
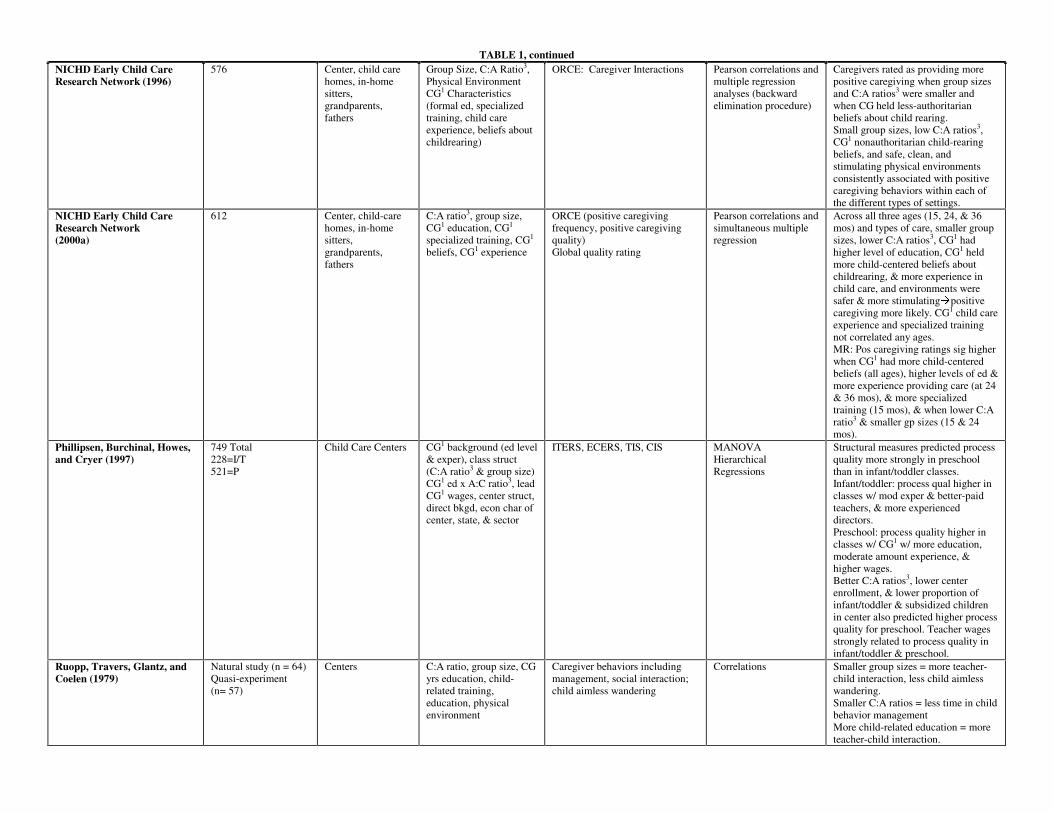
TABLE 1, continued NICHD Early Child Care Research Network (1996)
576 Center, child care homes, in-home sitters, grandparents, fathers
Group Size, C:A Ratio3, Physical Environment CG1 Characteristics (formal ed, specialized training, child care experience, beliefs about childrearing)
ORCE: Caregiver Interactions Pearson correlations and multiple regression analyses (backward elimination procedure)
Caregivers rated as providing more positive caregiving when group sizes and C:A ratios3 were smaller and when CG held less-authoritarian beliefs about child rearing. Small group sizes, low C:A ratios3, CG1 nonauthoritarian child-rearing beliefs, and safe, clean, and stimulating physical environments consistently associated with positive caregiving behaviors within each of the different types of settings.
NICHD Early Child Care Research Network (2000a)
612 Center, child-care homes, in-home sitters, grandparents, fathers
C:A ratio3, group size, CG1 education, CG1 specialized training, CG1 beliefs, CG1 experience
ORCE (positive caregiving frequency, positive caregiving quality) Global quality rating
Pearson correlations and simultaneous multiple regression
Across all three ages (15, 24, & 36 mos) and types of care, smaller group sizes, lower C:A ratios3, CG1 had higher level of education, CG1 held more child-centered beliefs about childrearing, & more experience in child care, and environments were safer & more stimulatingÅpositive caregiving more likely. CG1 child care experience and specialized training not correlated any ages. MR: Pos caregiving ratings sig higher when CG1 had more child-centered beliefs (all ages), higher levels of ed & more experience providing care (at 24 & 36 mos), & more specialized training (15 mos), & when lower C:A ratio3 & smaller gp sizes (15 & 24 mos).
Phillipsen, Burchinal, Howes, and Cryer (1997)
749 Total 228=I/T 521=P
Child Care Centers CG1 background (ed level & exper), class struct (C:A ratio3 & group size) CG1 ed x A:C ratio3, lead CG1 wages, center struct, direct bkgd, econ char of center, state, & sector
ITERS, ECERS, TIS, CIS MANOVA Hierarchical Regressions
Structural measures predicted process quality more strongly in preschool than in infant/toddler classes. Infant/toddler: process qual higher in classes w/ mod exper & better-paid teachers, & more experienced directors. Preschool: process quality higher in classes w/ CG1 w/ more education, moderate amount experience, & higher wages. Better C:A ratios3, lower center enrollment, & lower proportion of infant/toddler & subsidized children in center also predicted higher process quality for preschool. Teacher wages strongly related to process quality in infant/toddler & preschool.
Ruopp, Travers, Glantz, and Coelen (1979)
Natural study (n = 64) Quasi-experiment (n= 57)
Centers C:A ratio, group size, CG yrs education, child-related training, education, physical environment
Caregiver behaviors including management, social interaction; child aimless wandering
Correlations Smaller group sizes = more teacher-child interaction, less child aimless wandering. Smaller C:A ratios = less time in child behavior management More child-related education = more teacher-child interaction.

TABLE 1, continued Scarr, Eisenberg, and Deater-Deckard (1994)
363 Child Care Centers C:A ratio3, group size, CG1 training in child dev & child care, CG1 education, highest wage paid to a CG1 in the center, staff tunover
ITERS, ECERS, APECP Pearson Correlations Highest CG1 wages were highly correlated w/ process measures of quality (ITERS/ECERS & Profile Score). Lower C:A ratios3, more teacher education, and more teacher training were correlated w/ higher process measures of quality, however, less correlated w/ process quality criteria.
Stallings and Porter (1980) 303 Child-care homes, included sponsored, regulated, and unregulated homes
Observed C:A ratio, Specific caregiver behaviors including teaches, plays, directs, converses, comforts, tends to physical needs, housekeeping, not involved
Pearson correlations Multiple regressions
Larger child:adult ratios associated with less caregiver teaching, playing with child, and facilitating child activities; larger child:adult ratios associated with more efforts to control child behavior. These relations were stronger when focal children were less than 35 months old. Limited significant relations were found with caregiver education. The obtained associations indicated that less-educated caregivers were more directive.
Stith and Davis (1984) 30 Employed moms, substitute CG1 unemployed moms
Group size Yarrow, Rubenstein & Pedersen’s (1975) infant environment observational scale
Pearson correlations Larger group sizesÅ less expression of positive affect and less contingency of responses to distress.
Vandell and Powers (1983) 53 Center Structural composite (C:A ratio3 and toys accessible +CG1
education+space allotment per child)
Positive & Negative behavior w/ adults, total adult-directed behavior
ANOVA Better C:A ratio3, higher CG1 education, and more toy availabilityÅ more likely that children in low to moderate quality care to interact w/ adults (positive behavior, positive vocalizations, total behavior).
Volling and Feagans (1995) 36 Center Group size C:A ratio
Positive adult-child interaction Nonsocial activity, positive peer interaction, negative peer interaction
Pearson correlations Smaller group sizes and C:A ratios related to children having more time in positive staff-child interactions and less time in nonsocial activities. Larger C:A ratios related to more frequent negative interactions with peers.
aFull references available in References and Additional Resources section. bProcess quality measures alphabetized by acronym: AIS: Adult Involvement Scale; APECP: Assessment Profile for Early Childhood Programs; AQS: Attachment Q-Set; CIS: Caregiver Interaction Scale ECERS: Early Childhood Environment Rating Scale; ECOI: Early Childhood Environment Rating Scale; FDCRS: Family Day Care Rating Scale; HOME: Home Observation for Measurement of the Environment ITERS: Infant/Toddler Environment Rating Scale; ORCE: Observational Record of the Caregiving Environment; TIS: Teacher Involvement Scale 1CG=Caregiver 2ECE=Early Childhood Education 3C:A Ratio: Child:Adult Ratio 4Exp: Experience 5CC: Child Care
14
When child:adult ratios are lower, caregivers spend less time managing children in their
classrooms and children appear less apathetic and distressed (Ruopp et al., 1979). When child:adult ratios
are lower, caregivers offer more stimulating, responsive, warm, and supportive care (Clarke-Stewart,
Gruber, and Fitzgerald, 1994; Howes, 1983; NICHD Early Child Care Research Network, 1996, 2000a;
Phillipsen et al., 1997; Volling and Feagans, 1995). Ratios also are associated with global process quality
scores (Burchinal et al., 1996; Howes, Phillips, and Whitebook, 1992; McCartney, et al., 1997; Scarr,
Eisenberg, and Deater-Deckard, 1994; Whitebook, Howes, and Phillips, 1990). For example, in a study of
414 children residing in three states, Howes et al. (1992) determined that “good” and “very good” scores
on the ITERS and ECERS were more likely in infant classrooms with ratios of 3:1 or less, in toddler
classrooms with ratios of 4:1 or less, and in preschool classrooms with ratios of 9:1 or less. More than
half of the infant classrooms with ratios higher than 4:1 and preschool classrooms with ratios higher than
5:1 received scores categorized as “inadequate.”
Group size also has been considered in relation to process quality. In simultaneous multiple
regressions that included group size, ratio, caregiver education, and caregiver specialized training, the
NICHD Study of Early Child Care (1996, 2000a) determined group size to be uniquely associated with
positive caregiving. Similarly, Ruopp et al. (1979) found group size to predict caregiver behavior even
when child:adult ratio was controlled. In these studies, caregivers were more responsive, socially
stimulating, and less restrictive when there were fewer children in their classrooms. These relations also
are observed in child-care homes (Elicker, Fortner-Wood, and Noppe, 1999; Stith and Davis, 1984).
Caregivers’ formal education and specialized training also are related to quality of care.
Caregivers who have more formal education (NICHD Early Child Care Research Network, 1996;
Phillipsen et al., 1997) and more specialized training pertaining to children (Arnett, 1989; Berk, 1985;
Howes, 1983, 1997) offer care that is more stimulating, warm, and supportive. Highly educated and
specially trained caregivers also are more likely to organize materials and activities into more age-
appropriate environments for children (NICHD Early Child Care Research Network, 1996). These

15
settings are more likely to receive higher scores on the global quality scales such as the ECERS, ITERS,
ORCE, and CC-HOME (Clarke-Stewart et al., 2000; Howes and Smith, 1995; NICHD Early Child Care
Research Network, 1996, 2000a).
Repeated-measure analyses conducted for children in the NICHD Study of Early Child Care at
15, 24, and 36 months ascertained that group size and child:adult ratios were stronger predictors of
process quality for infants, whereas caregiver educational background and training were stronger
predictors of process quality for preschoolers (NICHD Study of Early Child Care, 2000a). These relations
do not appear to be an artifact of restricted ranges. The standard deviations for caregiver formal education
and caregiving training were similar at different assessment points. Standard deviations for ratio and
group size increased for older children. The differential patterns, then, suggest the merits of an age-related
strategy for improving process quality. Ratios and group size may be more critical for infant care;
caregiver training and education may be more critical for preschoolers.
Caregiver wages is another factor associated with process quality (Howes, Phillips, and
Whitebook, 1992; Scarr et al., 1994), as seen in Table 1. In the Three-State Study, Scarr et al. reported
teacher wages to be the single best predictor of process quality. In analyses of the Cost, Quality, and
Outcome data set, Phillipsen et al. (1997) determined lead teachers wages to significantly predict scores
on the ECERS and the Arnett sensitivity scales.
Although much of the research literature has reported significant relations between structural and
caregiver characteristics and process quality, Blau (2000) has cautioned that these associations may be the
result of uncontrolled factors that are confounded with the structural and caregiver characteristics. He
argues that these confounding factors might include center policies, curriculum, and directors’ leadership
skills. To address this perceived shortcoming, Blau conducted secondary analyses on 274 child care
centers that were part of the Cost, Quality, and Outcomes Study. In his first set of analyses, Blau
conducted regressions to determine if individual structural and caregiver characteristics were associated
with process quality when other factors (teacher, family, center characteristics) were controlled. His

16
findings were consistent with other reports. When child:adult ratios were larger, ITERS and ECERS
scores were lower. When caregivers had attended college or training workshops and when caregivers had
college degrees in fields related to child care, ECERS scores were higher.
Blau then tested relations between structural-regulable characteristics and process quality using a
more stringent fixed-effects model that included center as a control variable. This fixed-effects approach
was possible because two classrooms were typically observed in each center. In centers in which there
were both infants and preschoolers, one classroom of each type was observed. In centers serving only
preschoolers, two preschool classrooms were selected randomly. When center was controlled along with
type of classroom (infant vs. preschool), relations between structural and caregiver features and process
quality were reduced. Blau interprets this reduction to mean that unobserved center characteristics
account for the previously reported relations between structural factors and process quality. Our concern,
however, is that the center fixed-effect control is inappropriate. As Blau himself noted, this approach
requires within-center variability in the structural characteristics. It is unlikely that classrooms in the same
center are highly variable in terms of caregiver training, ratio, or group size, especially given that the
model also controlled for type of classroom (infant/toddler vs. preschool). The inclusion of the specific
center as a control variable resulted in an underestimation of effects.
Health and Safety Indicators of Quality
Global process quality measures such as the ECERS, CC-HOME, and Profile Assessment include
health and safety indicators as a component of process quality. Research conducted in the medical and
public health arenas has focused more exclusively on these indicators in relation to children’s physical
health and safety. More hygienic practices by staff and children (Niffenegger, 1997; St. Sauver et al.,
1998) are associated with fewer respiratory illnesses and other infectious diseases. These practices include
frequent handwashing after diapering, before meals, and after nose wiping. Child injuries in child care
settings are most likely to occur on playgrounds and are most due to falls from climbing equipment
17
(Briss, et al., 1995; Browning, Runyan, and Kotch, 1996). Height of the equipment and lack of an impact-
absorbing surface under the equipment have been consistently identified as the factors most highly
associated with injuries requiring medical treatment. The North Carolina Smart Start initiative was
successful in improving the safety of child care centers with playground improvement grants (Kotch and
Guthrie, 1998).
Conclusions
The weight of the research evidence demonstrates significant relationships between process
quality, structural and caregiver characteristics, and health and safety practices. The next section uses
process, structural, and caregiver measures to predict developmental outcomes for children.
DOES QUALITY OF CHILD CARE HAVE MEANINGFUL EFFECTS ON CHILDREN’SDEVELOPMENTAL OUTCOMES?
Researchers and policymakers who seek to answer questions about the effects of child care
quality on children’s development face substantial challenges. One well-acknowledged difficulty is the
absence of tightly controlled experiments in which children are randomly assigned to child care that
varies in quality. Instead, investigators have studied children whose families and child care settings are
willing to participate. This examination of naturally occurring child care, as opposed to more controlled
experiments, poses challenges for researchers and policymakers (Blau, 1999c; Lamb, 1998; NICHD Early
Child Care Research Network, 1994; Vandell and Corasaniti, 1990). These challenges are related to
family/child selection biases and to restricted variability in quality scores. Before reviewing research
findings pertaining to effects of quality, we briefly describe common strategies for addressing these
research challenges.
18
Methodological Challenges
Family/Child Selection Biases. The possibility that families differ in their child care choices is a
topic of interest in its own right (NICHD Early Child Care Research Network, 1997; Singer, et al., 1998).
It is also a critical issue for investigators interested in ascertaining the effects of child care on children
(Howes and Olenick, 1986; Vandell, 1997). The problem is that ostensible “effects” of child care quality
may be artifacts of family characteristics that are confounded with child care quality. As a result of this
concern, it has become standard practice for researchers to incorporate family selection factors into their
analyses. As seen in Tables 2 and 5, almost all studies conducted in recent years have included controls
for family characteristics.
As an example of this strategy, the NICHD Study of Early Child Care has used three criteria for
identifying family variables that are then used as selection controls in analyses: (1) the family
characteristic is significantly related to child care, (2) the family characteristic is related to the child
outcome of interest, and (3) the family characteristic is not highly related to other family factors. The
third criterion is applied to reduce collinearity among family characteristics.
At one level, concern about family selection bias is clearly merited. There is evidence, for
example, that type and quality of child care are related to parents’ education and income (see Figure 1).
Parents who have higher incomes and more education are more likely to place their children in centers
that have higher ECERS scores, lower child:adult ratios, and better-trained teachers (Blau, 1999c;
Peisner-Feinberg and Burchinal, 1997). Children with more sensitive mothers are more likely to be placed
in care arrangements that offer more positive caregiving experiences (NICHD Early Child Care Research
Network, 1997). Children whose home environments are more cognitively stimulating and more
emotionally supportive are more likely to be placed in child care settings that are stimulating and
supportive (NICHD Early Child Care Research Network, 2000b). These family factors, if not controlled,
may masquerade as child care effects.
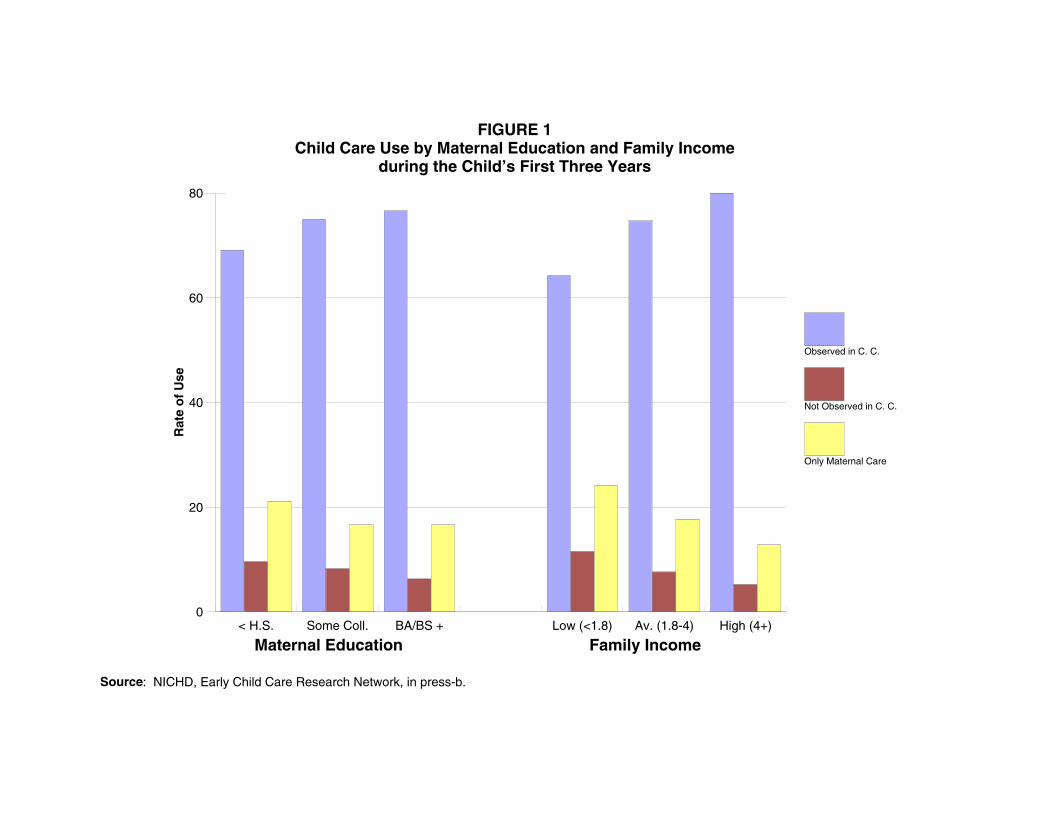
0
20
40
60
80R
ate
of
Use
< H.S. Some Coll. BA/BS + Low (<1.8) Av. (1.8-4) High (4+)
Observed in C. C.
Not Observed in C. C.
Only Maternal Care
Maternal Education Family Income
FIGURE 1Child Care Use by Maternal Education and Family Income
during the Child’s First Three Years
Source: NICHD, Early Child Care Research Network, in press-b.

20
At another level, however, selection effects do not appear to be as large as initially thought. In the
Cost, Quality, and Outcomes Study, for example, the correlation between maternal education and the
ECERS was .24; the correlation between family income and the ECERS was .09. In the NICHD Study of
Early Child Care, correlations between maternal education and ORCE positive caregiving ratings were
.11 at 6 months, .14 at 15 months, .22 at 24 months, and .19 at 36 months. Correlations between family
income and ORCE positive caregiving were typically lower than these figures. These relatively modest
associations between child care quality and family factors suggest that selection effects are not
substantial, at least within the range of studies that have been conducted. In the future, selection effects
may be greater as welfare reform is fully implemented and the numbers of children in child care increase.
Variability in Child Care Quality. The ability to detect child care quality effects also depends on
obtaining sufficient variability in quality scores. Obviously, if there is no variation in quality, it is not
possible to detect variations associated with quality. If quality is sampled within a truncated range, effects
associated with quality are reduced and larger samples are needed to detect differences. One reason that
the Swedish studies have not detected quality effects may be the restricted range of the quality scores that
were sampled, coupled with relatively small sample sizes (Broberg et al., 1997; Lamb et al., 1988). These
same issues are pertinent to child care research in the United States, when restricted ranges of quality are
sampled and sample sizes are small.
Control for Prior Child Adjustment. A third challenge is determining when and how to control
appropriately for prior child adjustment in examinations of child care effects. Some researchers have
argued that stronger tests of child care quality require controls for prior child adjustment. Such controls
could be used successfully in studies of after-school programs that control for children’s adjustment prior
to entry into the programs (Vandell and Posner, 1999). Controls for prior child adjustment in studies of
early child care quality are more difficult. Children typically begin child care during their first year of life,
before robust and reliable measures of child cognitive, language, and social adjustment can be
administered. Using measures of child adjustment collected at some later time, after substantial child care

21
experience has accrued, does not make sense because these measures may well be a reflection of the
effects of quality to that point. By controlling for child adjustment scores that were already affected by
quality, we may be eliminating (or at least minimizing) the very quality effects that are of interest. This
potential confounding of child care quality and child adjustment scores means that fixed-effects models
that control for prior (or concurrent) child adjustment must be applied with caution.
The Conceptual Model
With these methodological challenges in mind, we turn to the conceptual framework that guides
our evaluation of child care quality. This model is presented in Figure 2. A central feature in the model is
an awareness that children are not randomly assigned to child care. Child care quality is expected to be
related to family characteristics including demographic, psychological, and attitudinal differences.
Because these family characteristics—income, parental education, maternal sensitivity, stimulating and
supportive home environments—also can predict children’s developmental outcomes, it is necessary to
control for them. Otherwise, quality effects may be overestimated or underestimated. As shown in the
model, research also needs to take into account other child care parameters, such as amount of care and
type of care, that may be confounded with quality or that may contribute independently to child
outcomes.
Children’s developmental outcomes are considered in relation to process quality and in relation to
structural and caregiver characteristics. Specifically, the model posits that process quality is directly
related to child developmental outcomes. Structural and caregiver characteristics are posited to be
indirectly related to child outcomes, through their influence on process quality. It is expected that
structural and caregiver characteristics also directly influence child outcomes in ways that are not
mediated through the available measures of process quality. In the sections that follow, research findings
pertaining to this model are considered in terms of concurrent relations between child care quality and
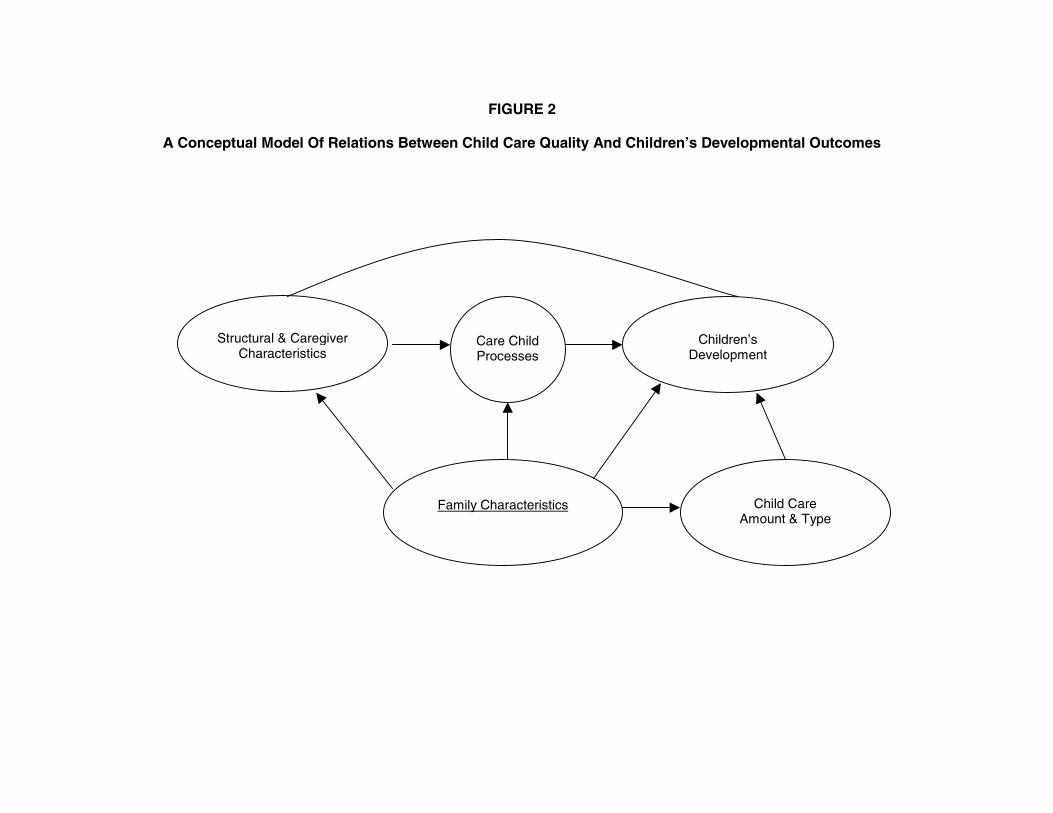
Structural & Caregiver Characteristics
Care Child Processes
Children’s
Development
Family Characteristics
Child Care
Amount & Type
FIGURE 2
A Conceptual Model Of Relations Between Child Care Quality And Children’s Developmental Outcomes

23
children’s development, and in terms of longer-term associations between child care quality and child
adjustment.
Concurrent Associations between Process Quality and Child Outcomes
Table 2 is a summary description of results from empirical studies that examined relations
between process quality and child developmental outcomes. The description includes sample size, child’s
age at the time of the concurrent assessments, the measures of process quality that were used, the
measures of structural quality that were used, the controls (if any) for family factors, the child
developmental domains that were considered, and a summary of findings.
As is evident is Table 2, some of the available research focuses on relations between process
quality measures and child behavior in the child care setting. This set of studies provides descriptions of
children’s immediate reactions to caregiving experiences that are emotionally supportive and cognitively
enriching versus experiences that are less supportive and enriching. These studies yield firsthand evidence
about children’s reactions to care of varying quality. Other research considers relations between process
quality and child behavior outside of child care. This set of studies considers whether reactions to quality
experiences are evident in children’s behavior in other settings.
Process Quality and Children’s Behavior in Child Care. Several investigators have delineated
systematic relations between process quality and children’s behavior in the child care setting (see Table
2). For example, controlling for child gender and family socioeconomic status, children appear happier in
child care settings where activities are developmentally appropriate and caregivers are more involved
(Hestenes, Kontos, and Bryan, 1993). Children show more intense negative affect when their caregivers
are less involved with them. Children display closer and more secure attachment relationships with their
caregivers when the caregivers are more positive and responsive to the children’s needs (Elicker et al.,
1999; Howes et al., 1992; Howes and Smith, 1995).
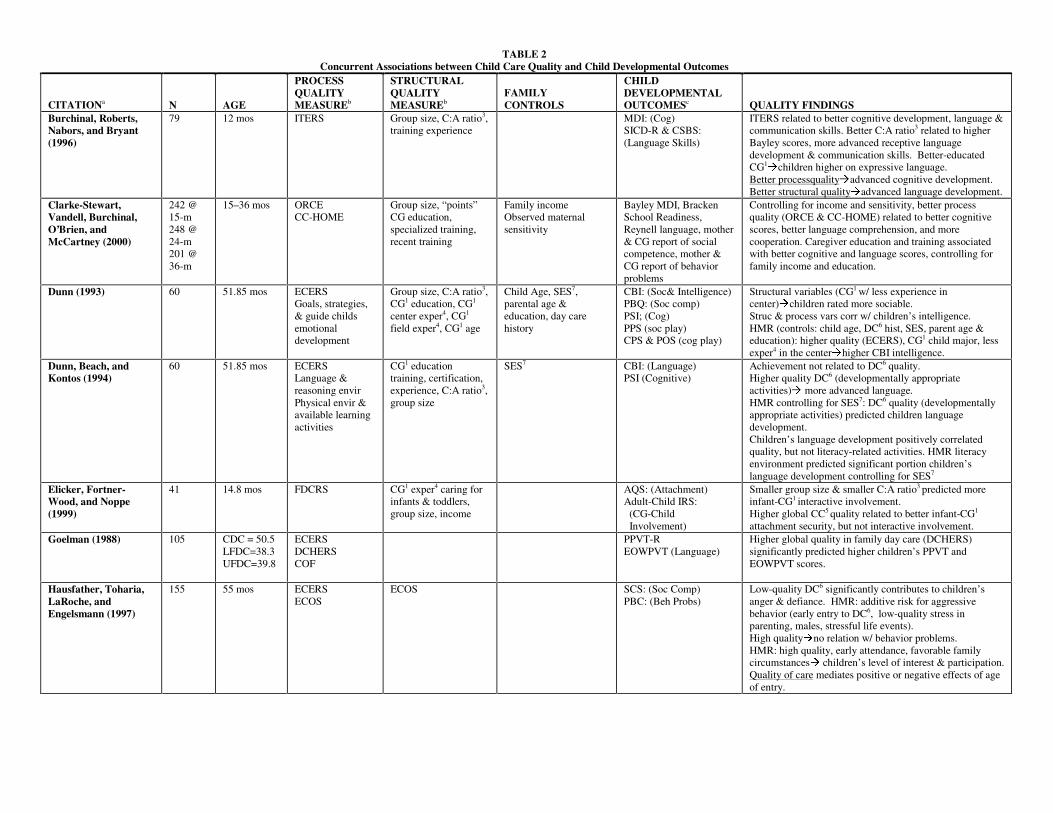
TABLE 2 Concurrent Associations between Child Care Quality and Child Developmental Outcomes
CITATIONa N AGE
PROCESS QUALITY MEASUREb
STRUCTURAL QUALITY MEASUREb
FAMILY CONTROLS
CHILD DEVELOPMENTAL OUTCOMESc QUALITY FINDINGS
Burchinal, Roberts, Nabors, and Bryant (1996)
79 12 mos ITERS Group size, C:A ratio3, training experience
MDI: (Cog) SICD-R & CSBS: (Language Skills)
ITERS related to better cognitive development, language & communication skills. Better C:A ratio3 related to higher Bayley scores, more advanced receptive language development & communication skills. Better-educated CG1Åchildren higher on expressive language.
Better processqualityÅadvanced cognitive development. Better structural qualityÅadvanced language development.
Clarke-Stewart, Vandell, Burchinal, O’Brien, and McCartney (2000)
242 @ 15-m 248 @ 24-m 201 @ 36-m
15–36 mos ORCE CC-HOME
Group size, “points” CG education, specialized training, recent training
Family income Observed maternal sensitivity
Bayley MDI, Bracken School Readiness, Reynell language, mother & CG report of social competence, mother & CG report of behavior problems
Controlling for income and sensitivity, better process quality (ORCE & CC-HOME) related to better cognitive scores, better language comprehension, and more cooperation. Caregiver education and training associated with better cognitive and language scores, controlling for family income and education.
Dunn (1993) 60 51.85 mos ECERS Goals, strategies, & guide childs emotional development
Group size, C:A ratio3, CG1 education, CG1 center exper4, CG1 field exper4, CG1 age
Child Age, SES7, parental age & education, day care history
CBI: (Soc& Intelligence) PBQ: (Soc comp) PSI; (Cog) PPS (soc play) CPS & POS (cog play)
Structural variables (CG1 w/ less experience in center)Åchildren rated more sociable. Struc & process vars corr w/ children’s intelligence. HMR (controls: child age, DC6 hist, SES, parent age & education): higher quality (ECERS), CG1 child major, less exper4 in the centerÅhigher CBI intelligence.
Dunn, Beach, and Kontos (1994)
60 51.85 mos ECERS Language & reasoning envir Physical envir & available learning activities
CG1 education training, certification, experience, C:A ratio3, group size
SES7 CBI: (Language) PSI (Cognitive)
Achievement not related to DC6 quality. Higher quality DC6 (developmentally appropriate activities)Å more advanced language. HMR controlling for SES7: DC6 quality (developmentally appropriate activities) predicted children language development. Children’s language development positively correlated quality, but not literacy-related activities. HMR literacy environment predicted significant portion children’s language development controlling for SES7
Elicker, Fortner-Wood, and Noppe (1999)
41 14.8 mos FDCRS CG1 exper4 caring for infants & toddlers, group size, income
AQS: (Attachment) Adult-Child IRS: (CG-Child Involvement)
Smaller group size & smaller C:A ratio3 predicted more infant-CG1 interactive involvement. Higher global CC5 quality related to better infant-CG1
attachment security, but not interactive involvement. Goelman (1988) 105 CDC = 50.5
LFDC=38.3 UFDC=39.8
ECERS DCHERS COF
PPVT-R EOWPVT (Language)
Higher global quality in family day care (DCHERS) significantly predicted higher children’s PPVT and EOWPVT scores.
Hausfather, Toharia, LaRoche, and Engelsmann (1997)
155 55 mos ECERS ECOS
ECOS SCS: (Soc Comp) PBC: (Beh Probs)
Low-quality DC6 significantly contributes to children’s anger & defiance. HMR: additive risk for aggressive behavior (early entry to DC6, low-quality stress in parenting, males, stressful life events). High qualityÅno relation w/ behavior problems. HMR: high quality, early attendance, favorable family circumstancesÅ children’s level of interest & participation. Quality of care mediates positive or negative effects of age of entry.
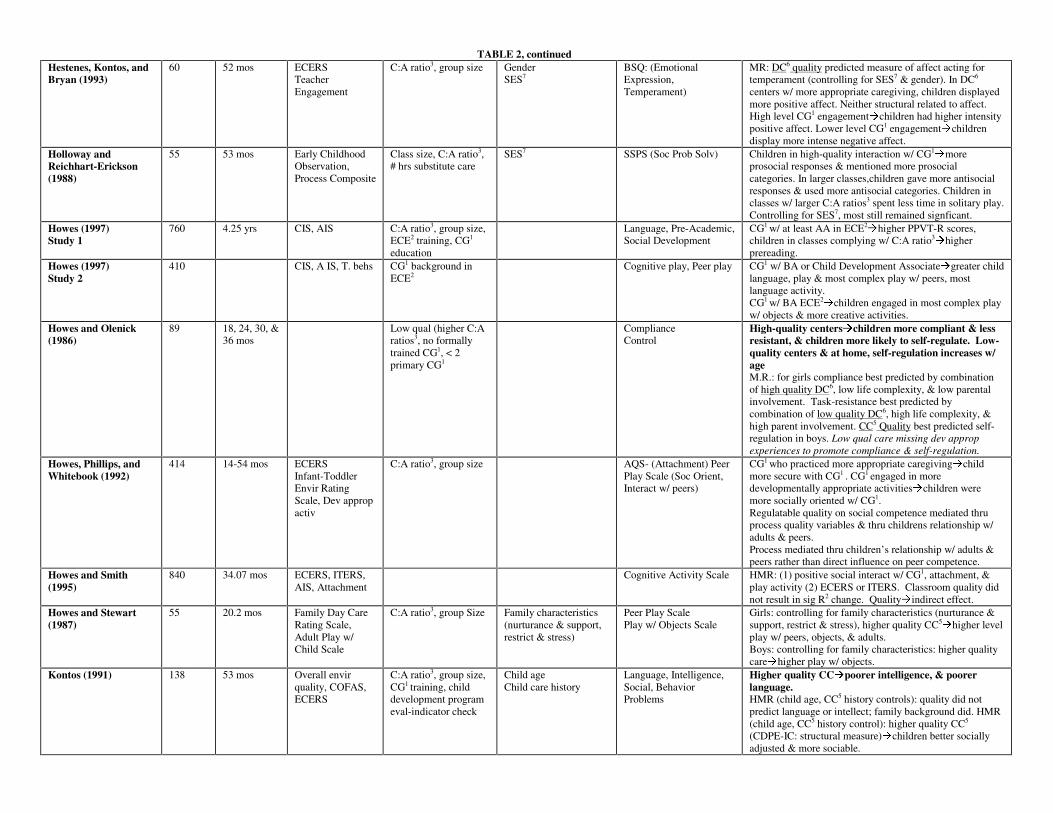
TABLE 2, continued Hestenes, Kontos, and Bryan (1993)
60 52 mos ECERS Teacher Engagement
C:A ratio3, group size Gender SES7
BSQ: (Emotional Expression, Temperament)
MR: DC6 quality predicted measure of affect acting for temperament (controlling for SES7 & gender). In DC6 centers w/ more appropriate caregiving, children displayed more positive affect. Neither structural related to affect. High level CG1 engagementÅchildren had higher intensity positive affect. Lower level CG1 engagementÅchildren display more intense negative affect.
Holloway and Reichhart-Erickson (1988)
55 53 mos Early Childhood Observation, Process Composite
Class size, C:A ratio3, # hrs substitute care
SES7 SSPS (Soc Prob Solv) Children in high-quality interaction w/ CG1Åmore
prosocial responses & mentioned more prosocial categories. In larger classes,children gave more antisocial responses & used more antisocial categories. Children in classes w/ larger C:A ratios3 spent less time in solitary play. Controlling for SES7, most still remained signficant.
Howes (1997) Study 1
760 4.25 yrs CIS, AIS C:A ratio3, group size, ECE2 training, CG1
education
Language, Pre-Academic, Social Development
CG1 w/ at least AA in ECE2Åhigher PPVT-R scores,
children in classes complying w/ C:A ratio3Åhigher
prereading. Howes (1997) Study 2
410 CIS, A IS, T. behs CG1 background in ECE2
Cognitive play, Peer play CG1 w/ BA or Child Development AssociateÅgreater child language, play & most complex play w/ peers, most language activity. CG1 w/ BA ECE2
Åchildren engaged in most complex play w/ objects & more creative activities.
Howes and Olenick (1986)
89 18, 24, 30, & 36 mos
Low qual (higher C:A ratios3, no formally trained CG1, < 2 primary CG1
Compliance Control
High-quality centersÅchildren more compliant & less resistant, & children more likely to self-regulate. Low-quality centers & at home, self-regulation increases w/ age M.R.: for girls compliance best predicted by combination of high quality DC6, low life complexity, & low parental involvement. Task-resistance best predicted by combination of low quality DC6, high life complexity, & high parent involvement. CC5 Quality best predicted self-regulation in boys. Low qual care missing dev approp experiences to promote compliance & self-regulation.
Howes, Phillips, and Whitebook (1992)
414 14-54 mos ECERS Infant-Toddler Envir Rating Scale, Dev approp activ
C:A ratio3, group size AQS- (Attachment) Peer Play Scale (Soc Orient, Interact w/ peers)
CG1 who practiced more appropriate caregivingÅchild more secure with CG1 . CG1 engaged in more developmentally appropriate activitiesÅchildren were more socially oriented w/ CG1. Regulatable quality on social competence mediated thru process quality variables & thru childrens relationship w/ adults & peers. Process mediated thru children’s relationship w/ adults & peers rather than direct influence on peer competence.
Howes and Smith (1995)
840 34.07 mos ECERS, ITERS, AIS, Attachment
Cognitive Activity Scale HMR: (1) positive social interact w/ CG1, attachment, & play activity (2) ECERS or ITERS. Classroom quality did not result in sig R2 change. QualityÅindirect effect.
Howes and Stewart (1987)
55 20.2 mos Family Day Care Rating Scale, Adult Play w/ Child Scale
C:A ratio3, group Size Family characteristics (nurturance & support, restrict & stress)
Peer Play Scale Play w/ Objects Scale
Girls: controlling for family characteristics (nurturance & support, restrict & stress), higher quality CC5
Åhigher level play w/ peers, objects, & adults. Boys: controlling for family characteristics: higher quality careÅhigher play w/ objects.
Kontos (1991) 138 53 mos Overall envir quality, COFAS, ECERS
C:A ratio3, group size, CG1 training, child development program eval-indicator check
Child age Child care history
Language, Intelligence, Social, Behavior Problems
Higher quality CCÅpoorer intelligence, & poorer language. HMR (child age, CC5 history controls): quality did not predict language or intellect; family background did. HMR (child age, CC5 history control): higher quality CC5 (CDPE-IC: structural measure)Åchildren better socially adjusted & more sociable.

TABLE 2, continued Kontos and Wilcox-Herzog (1997)
114 51.7 mos CG1 Responsive Involvement CG1 Verbal Stimulation
Child age Cognitive Competence Social Competence
Controlling for child age, more CG1 involvementÅlower cognitive competence, but not social competence even when controlling for age. MR: More contact w/ CG1 & more CG1 involvementÅhigher social competence. Less contact w/ CG1 & more involvement in high yield activitiesÅhigher cognitive competence.
McCartney (1984) 166 36-68 mos DCEI, ECERS Child age Parent as Educator interview (values conformity, values social)
PPVT-R, PLAI, ALI, Experimental Communication Task
HMR: Controlling for child age, values conformity, & values social, higher total quality of center care scores (ECERS)Åchildren had higher PPVT, PLAI, ALI scores & performed better on communication task. Quality of DC6 Åpositive effect on language development. Controlling for total # functional utterances by CG1 to child, family background & group care experience, more verbal interaction w/ CG1
Å higher PLAI, ALI scores & better performance on communication task.
McCartney, Scarr, Phillips, and Grajek (1985)
166 2 years ECERS, verbal interact w/ CG1
C:A ratio3 PPVT-R & ALI: (Intellect, Lang) CBI & PBQ: (Social Skills)
Intervention Center highest quality rating. Intervention Center higher language, IQ, & social ratings than other centers.
McCartney, Scarr, Rocheleau, Phillips, Abbott-Shim, et al. (1997)
718 Infant=14.7 mos Toddler=27 mos Preschool= 47.9 mos
ECERS, ITERS, CG1-C Interaction
Mothers education AQS & Separation-Reunion Quest: (Attachment) CBS Q-sort (Social Behavior, Behavior Problems; Harter: (Competence & Social Accept)
Partial correlations, controlling for mother’s education, more CG1-C interaction related to more social bids (toddlers & preschoolers), more solitary play (preschoolers) & fewer CG1 ratings of negative separation/reunion for toddlers. HMR: CG1-C interactions not related to child outcomes.
NICHD Early Child Care Research Network (1999a)
97 118 163 250
6 mos 15 mos 24 mos 36 mos
None C:A ratio3, observed group size, CG1 training, CG1 education
Income to needs, maternal education, concurr single –parent status, child gender, maternal sensitivity
Bayley MDI Bracken School Readiness Reynell Dev Lang CBCL, ASBI (Soc Beh)
Outcomes (cognitive, language, & social) better when children attended classes meeting recommended C:A ratio3 at 24 mos & CG1 training & CG1 education at 36 mos. More standards met, better school readiness, language comprehension, & less behavior problems at 36 mos. Older children more likely to be in classes meeting recommended standards.
Peisner-Feinberg, and Burchinal (1997)
757 M = 4.3 yrs ECERS, CIS, AIS, UCLA ECOF
Mothers education, ethnicity, & child gender
PPVT-R, WJ-R (prereading, pre-math), CBI (Social skills)
Controlling for child & family characteristics, the observed quality index & the STRS CG1-child closeness score related to better PPVT-R scores (both quality indices), better WJ-R prereading scores (individually, observed quality index), better CG1 ratings of child’s cognitive/attention skills on CBI (individually, CG1 rating of closeness), and fewer behavior problems (individually, CG1 rating of closeness), & higher sociability ratings. Higher quality CC5 Å better language, preacademic, sociability, & fewer behavior problems.
Phillips, McCartney, and Scarr (1987)
166 36-68 mos ECERS, DCEI C:A ratio3, director’s years experience
CBI, PBQ: (Social dev) Higher overall qualityÅ higher social competence ratings. Better C:A ratio3
Å higher social competence ratings, but lower social adjustment (anxious). More CG1-C interaction Å better social competence ratings.
Ruopp, Travers, Glantz, and Coelen (1979)
Natural Study = 64 centers Experiment = 57 centers
3 & 4 yr olds Observations of staff-child interactions; Observation of child behavior
C:A ratio, group size, staff education, training
Looked at changes in child performance over time as a function of systematic changes in ratio and staff training
Preschool Inventory (PSI), Peabody Picture Vocabulary Test (PPVT-Revised)
Children had larger gains on PSI and PPVT when groups were smaller. Centers with higher proportions of caregivers with child-related training had greater gains on the PSI.
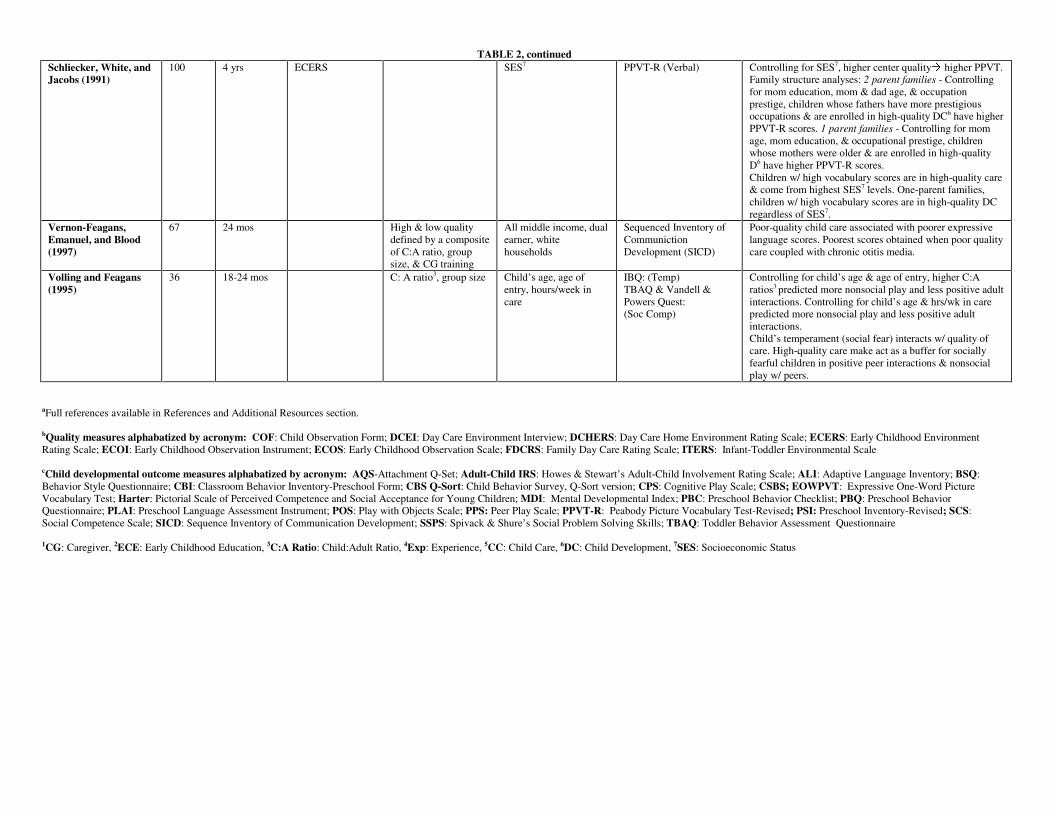
TABLE 2, continued Schliecker, White, and Jacobs (1991)
100 4 yrs ECERS SES7 PPVT-R (Verbal) Controlling for SES7, higher center qualityÅ higher PPVT. Family structure analyses: 2 parent families - Controlling for mom education, mom & dad age, & occupation prestige, children whose fathers have more prestigious occupations & are enrolled in high-quality DC6 have higher PPVT-R scores. 1 parent families - Controlling for mom age, mom education, & occupational prestige, children whose mothers were older & are enrolled in high-quality D6 have higher PPVT-R scores. Children w/ high vocabulary scores are in high-quality care & come from highest SES7 levels. One-parent families, children w/ high vocabulary scores are in high-quality DC regardless of SES7.
Vernon-Feagans, Emanuel, and Blood (1997)
67 24 mos High & low quality defined by a composite of C:A ratio, group size, & CG training
All middle income, dual earner, white households
Sequenced Inventory of Communiction Development (SICD)
Poor-quality child care associated with poorer expressive language scores. Poorest scores obtained when poor quality care coupled with chronic otitis media.
Volling and Feagans (1995)
36 18-24 mos C: A ratio3, group size
Child’s age, age of entry, hours/week in care
IBQ: (Temp) TBAQ & Vandell & Powers Quest: (Soc Comp)
Controlling for child’s age & age of entry, higher C:A ratios3 predicted more nonsocial play and less positive adult interactions. Controlling for child’s age & hrs/wk in care predicted more nonsocial play and less positive adult interactions. Child’s temperament (social fear) interacts w/ quality of care. High-quality care make act as a buffer for socially fearful children in positive peer interactions & nonsocial play w/ peers.
aFull references available in References and Additional Resources section. bQuality measures alphabatized by acronym: COF: Child Observation Form; DCEI: Day Care Environment Interview; DCHERS: Day Care Home Environment Rating Scale; ECERS: Early Childhood Environment Rating Scale; ECOI: Early Childhood Observation Instrument; ECOS: Early Childhood Observation Scale; FDCRS: Family Day Care Rating Scale; ITERS: Infant-Toddler Environmental Scale cChild developmental outcome measures alphabatized by acronym: AQS-Attachment Q-Set; Adult-Child IRS: Howes & Stewart’s Adult-Child Involvement Rating Scale; ALI: Adaptive Language Inventory; BSQ: Behavior Style Questionnaire; CBI: Classroom Behavior Inventory-Preschool Form; CBS Q-Sort: Child Behavior Survey, Q-Sort version; CPS: Cognitive Play Scale; CSBS; EOWPVT: Expressive One-Word Picture Vocabulary Test; Harter: Pictorial Scale of Perceived Competence and Social Acceptance for Young Children; MDI: Mental Developmental Index; PBC: Preschool Behavior Checklist; PBQ: Preschool Behavior Questionnaire; PLAI: Preschool Language Assessment Instrument; POS: Play with Objects Scale; PPS: Peer Play Scale; PPVT-R: Peabody Picture Vocabulary Test-Revised; PSI: Preschool Inventory-Revised; SCS: Social Competence Scale; SICD: Sequence Inventory of Communication Development; SSPS: Spivack & Shure’s Social Problem Solving Skills; TBAQ: Toddler Behavior Assessment Questionnaire
1CG: Caregiver, 2ECE: Early Childhood Education, 3C:A Ratio: Child:Adult Ratio, 4Exp: Experience, 5CC: Child Care, 6DC: Child Development, 7SES: Socioeconomic Status
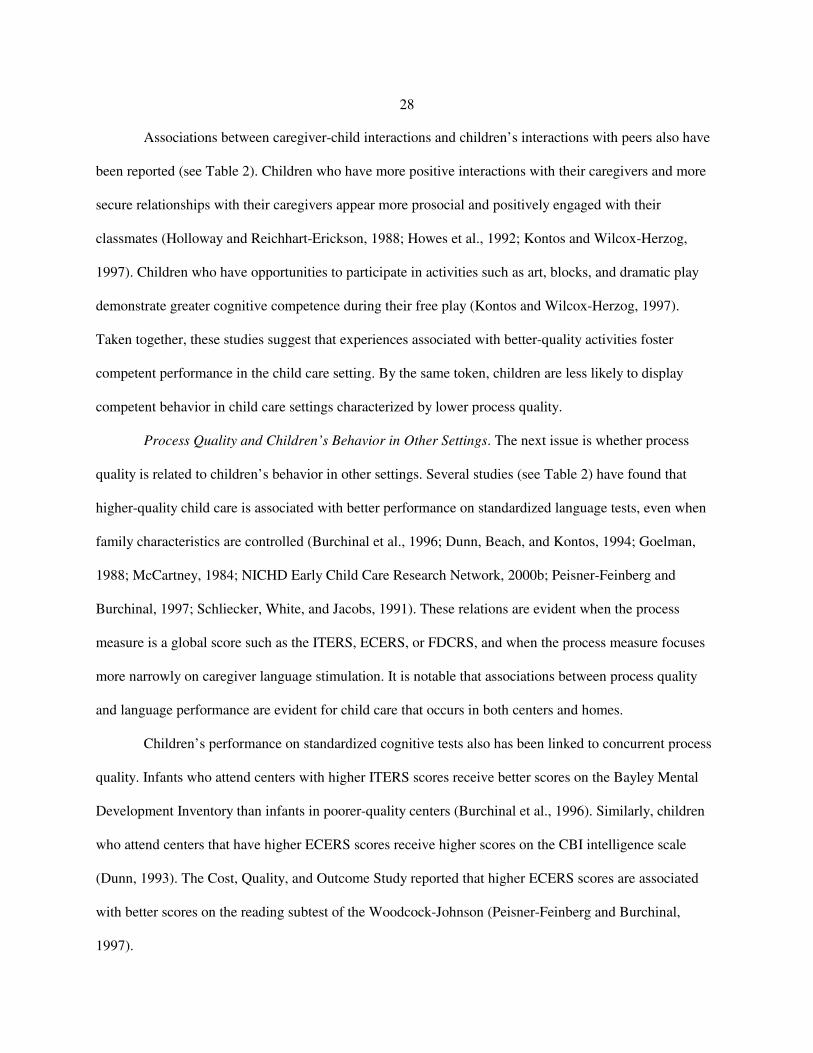
28
Associations between caregiver-child interactions and children’s interactions with peers also have
been reported (see Table 2). Children who have more positive interactions with their caregivers and more
secure relationships with their caregivers appear more prosocial and positively engaged with their
classmates (Holloway and Reichhart-Erickson, 1988; Howes et al., 1992; Kontos and Wilcox-Herzog,
1997). Children who have opportunities to participate in activities such as art, blocks, and dramatic play
demonstrate greater cognitive competence during their free play (Kontos and Wilcox-Herzog, 1997).
Taken together, these studies suggest that experiences associated with better-quality activities foster
competent performance in the child care setting. By the same token, children are less likely to display
competent behavior in child care settings characterized by lower process quality.
Process Quality and Children’s Behavior in Other Settings. The next issue is whether process
quality is related to children’s behavior in other settings. Several studies (see Table 2) have found that
higher-quality child care is associated with better performance on standardized language tests, even when
family characteristics are controlled (Burchinal et al., 1996; Dunn, Beach, and Kontos, 1994; Goelman,
1988; McCartney, 1984; NICHD Early Child Care Research Network, 2000b; Peisner-Feinberg and
Burchinal, 1997; Schliecker, White, and Jacobs, 1991). These relations are evident when the process
measure is a global score such as the ITERS, ECERS, or FDCRS, and when the process measure focuses
more narrowly on caregiver language stimulation. It is notable that associations between process quality
and language performance are evident for child care that occurs in both centers and homes.
Children’s performance on standardized cognitive tests also has been linked to concurrent process
quality. Infants who attend centers with higher ITERS scores receive better scores on the Bayley Mental
Development Inventory than infants in poorer-quality centers (Burchinal et al., 1996). Similarly, children
who attend centers that have higher ECERS scores receive higher scores on the CBI intelligence scale
(Dunn, 1993). The Cost, Quality, and Outcome Study reported that higher ECERS scores are associated
with better scores on the reading subtest of the Woodcock-Johnson (Peisner-Feinberg and Burchinal,
1997).

29
Finally, process quality is related to children’s social and emotional functioning. High-quality
care as measured by the ECERS is related to greater child interest and participation, whereas poorer
process quality is associated with heightened behavior problems (Hausfather et al., 1997; Peisner-
Feinberg and Burchinal, 1997). The Bermuda Study (Phillips, McCartney, and Scarr, 1987) found that
higher ECERS scores predict both caregiver and parent reports of children’s considerateness and
sociability, and caregiver reports of children’s higher intelligence and task orientation and less anxiety.
Although the majority of studies (see Table 2) have reported significant relations between process
measures of quality and concurrent child functioning, it should be noted that there are exceptions. Scarr
and colleagues did not find relations between process quality and children’s social outcomes (McCartney
et al., 1997). Measurement problems may have contributed to the lack of findings. For example, observers
were only moderately reliable on the measures of quality, with exact agreement of 55–58 percent between
sites on the ITERS/ECERS. Cross-site reliability in the classroom observations of children’s social
behavior (a key dependent variable) also was poor to moderate, with kappa coefficients ranging from .40
to .76. The likelihood of detecting associations may have been hampered by unreliable measurements.
Concurrent Associations between Structural and Caregiver Characteristics, and Child Outcomes
There has been a longstanding interest in structural and caregiver characteristics in relation to
children’s developmental outcomes, in part because the structural and caregiver characteristics are easier
to measure and to monitor than process quality. An early study—the National Day Care Study (Ruopp et
al., 1979)—included a clinical trial in which 3- and 4-year-olds were randomly assigned to 29 preschool
classrooms with different child:adult ratios and levels of staff education. Two levels of ratio (5.4:1 vs.
7.4:1) were contrasted along with three levels of staff education (B.A., Associate of Arts, or less than an
A.A. in early childhood education). Child behaviors were assessed at the beginning of the intervention
and 9 months later. Children assigned to classrooms with fewer children achieved greater gains on
measures of receptive language, general knowledge, cooperative behavior, and verbal initiations, and

30
exhibited less hostility and conflict in their interactions with others than did children assigned to
classrooms with larger numbers of children. Children whose assigned teachers had more education and
training achieved greater gains in cooperative behavior, task persistence, and school readiness than
children whose teachers had less education and training.
Correlational studies also have reported concurrent associations between child:adult ratio and
children’s language, cognitive, and social functioning. Infants who attend centers with smaller child:adult
ratios are found to have better receptive and expressive language skills than children who attend centers
with larger child:adult ratios (Burchinal et al., 1996; Vernon-Feagans, Emanuel, and Blood, 1997). Lower
child:adult ratios also are associated with higher Bayley scores (Burchinal et al., 1996) and with better
social knowledge and social behaviors (Holloway and Reichhart-Erickson, 1988).
Teachers’ education and training also are related concurrently to child performance and
adjustment. Burchinal et al. (1996) report that infants have better expressive language skills when their
caregivers are better educated. Preschoolers’ receptive language skills are higher when caregivers have at
least an Associate degree in a child-related field (Howes, 1997). Children whose caregivers have degrees
in child-related fields receive higher CBI intelligence scores than children with less-educated caregivers
(Dunn, 1993). Caregiver education and training in child care homes are similarly related to children’s
performance on standardized cognitive measures (Clarke-Stewart et al., 2000).
Observations of children’s experiences in classrooms and child care homes suggest why these
relations might occur. Children are more likely to engage in language activities, complex play with
objects, and creative activities in their classrooms when teachers have bachelor’s degrees in child-related
fields (Howes, 1997). Toddlers are more likely to talk with their caregivers and to engage in complex play
when classrooms have smaller child:adult ratios (Howes and Rubenstein, 1985). Toddlers are more likely
to cry and to have their actions restricted in classrooms in which group sizes are larger (Howes and
Rubenstein, 1985). In child care homes, positive caregiving is more likely when group sizes are smaller,

31
caregivers are more educated, and caregivers have more specialized training pertaining to children
(Clarke-Stewart et al., 2000).
An alternative research strategy has been to consider aggregated structural and caregiver
characteristics. For example, the NICHD Study of Early Child Care (NICHD Early Child Care Research
Network, 1999a) assessed four structural and caregiver characteristics (child:staff ratio, group size,
caregiver specialized training in child development or early childhood education, and caregiver formal
education) in terms of guidelines recommended by the American Public Health Association. The
investigators then summed the number of structural and caregiver characteristics that met recommended
guidelines, resulting in summed scores of 0 to 4. At 24 months, 10–12 percent of classrooms met all four
standards, whereas 34 percent of the classrooms did so at 36 months. At 24 months, 9 percent of the
observed centers met none of the recommended standards; 3 percent of the centers met none of the
standards at 36 months.
Associations between the number of child care standards that were met and child outcomes were
then tested, with family income and maternal sensitivity controlled (see Table 3). Children who attended
centers that met more recommended guidelines had fewer behavior problems at 24 and 36 months, and
higher school readiness and language comprehension scores at 36 months. There were significant linear
trends between the number of recommended standards that were met and children’s concurrent
adjustment.
Analyses also compared children who were enrolled in classrooms that met a given individual
standard with children whose classrooms did not meet that standard (see Table 4). At 24 months, children
displayed fewer behavior problems and more positive social behaviors when centers met the
recommended child:adult ratio. At 36 months, children whose caregivers had specialized training or who
had more formal education exhibited fewer behavior problems and obtained higher school readiness and
language comprehension scores.
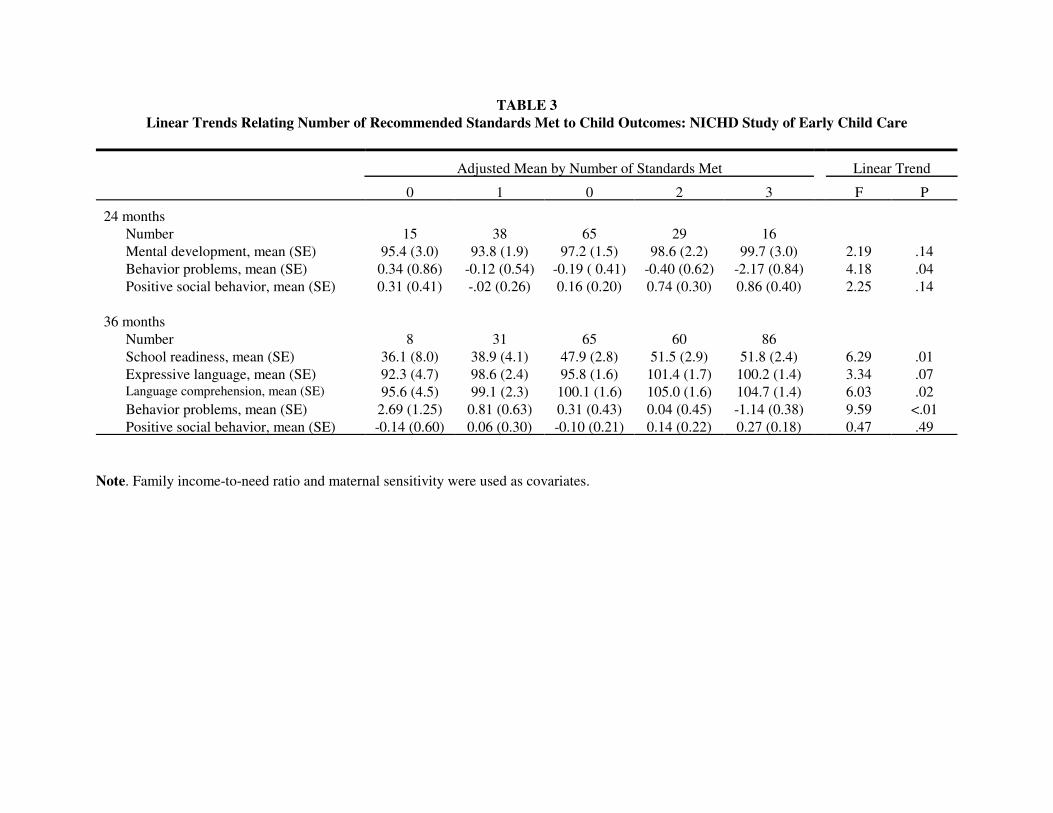
TABLE 3Linear Trends Relating Number of Recommended Standards Met to Child Outcomes: NICHD Study of Early Child Care
Adjusted Mean by Number of Standards Met Linear Trend
0 1 0 2 3 F P
24 monthsNumber 15 38 65 29 16Mental development, mean (SE) 95.4 (3.0) 93.8 (1.9) 97.2 (1.5) 98.6 (2.2) 99.7 (3.0) 2.19 .14Behavior problems, mean (SE) 0.34 (0.86) -0.12 (0.54) -0.19 ( 0.41) -0.40 (0.62) -2.17 (0.84) 4.18 .04Positive social behavior, mean (SE) 0.31 (0.41) -.02 (0.26) 0.16 (0.20) 0.74 (0.30) 0.86 (0.40) 2.25 .14
36 monthsNumber 8 31 65 60 86School readiness, mean (SE) 36.1 (8.0) 38.9 (4.1) 47.9 (2.8) 51.5 (2.9) 51.8 (2.4) 6.29 .01Expressive language, mean (SE) 92.3 (4.7) 98.6 (2.4) 95.8 (1.6) 101.4 (1.7) 100.2 (1.4) 3.34 .07Language comprehension, mean (SE) 95.6 (4.5) 99.1 (2.3) 100.1 (1.6) 105.0 (1.6) 104.7 (1.4) 6.03 .02Behavior problems, mean (SE) 2.69 (1.25) 0.81 (0.63) 0.31 (0.43) 0.04 (0.45) -1.14 (0.38) 9.59 <.01Positive social behavior, mean (SE) -0.14 (0.60) 0.06 (0.30) -0.10 (0.21) 0.14 (0.22) 0.27 (0.18) 0.47 .49
Note. Family income-to-need ratio and maternal sensitivity were used as covariates.
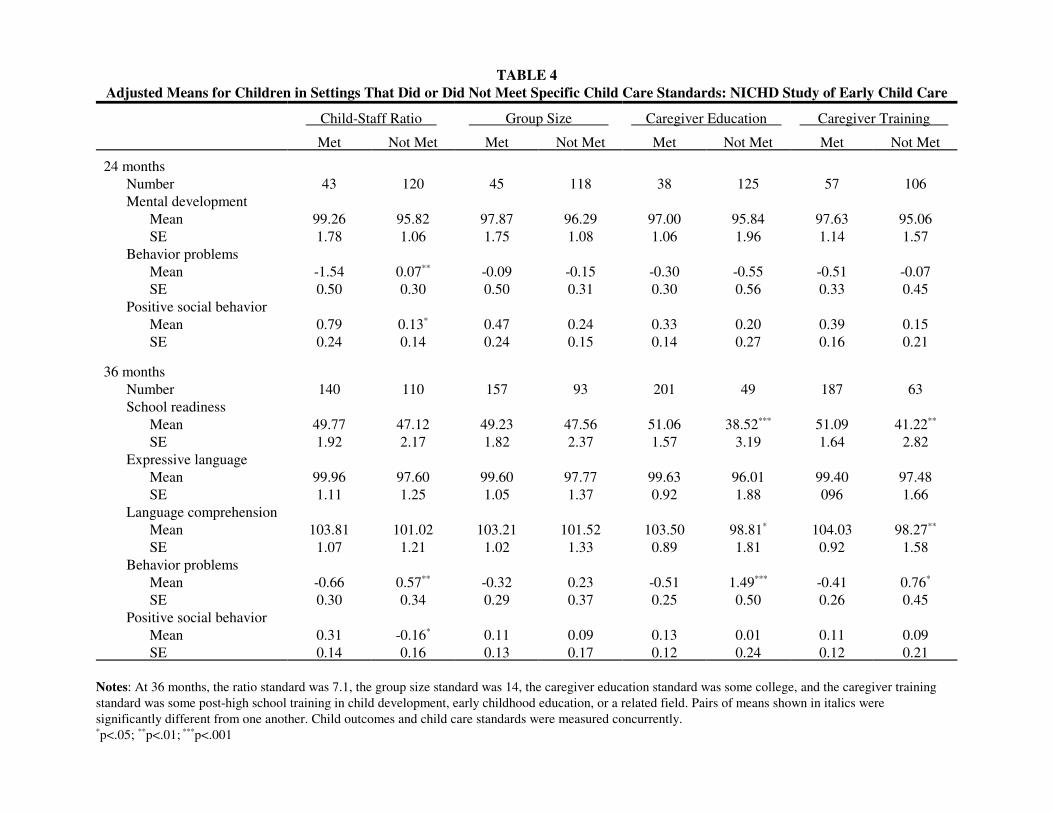
TABLE 4Adjusted Means for Children in Settings That Did or Did Not Meet Specific Child Care Standards: NICHD Study of Early Child Care
Child-Staff Ratio Group Size Caregiver Education Caregiver Training
Met Not Met Met Not Met Met Not Met Met Not Met
24 monthsNumber 43 120 45 118 38 125 57 106Mental development
Mean 99.26 95.82 97.87 96.29 97.00 95.84 97.63 95.06SE 1.78 1.06 1.75 1.08 1.06 1.96 1.14 1.57
Behavior problemsMean -1.54 0.07** -0.09 -0.15 -0.30 -0.55 -0.51 -0.07SE 0.50 0.30 0.50 0.31 0.30 0.56 0.33 0.45
Positive social behaviorMean 0.79 0.13* 0.47 0.24 0.33 0.20 0.39 0.15SE 0.24 0.14 0.24 0.15 0.14 0.27 0.16 0.21
36 monthsNumber 140 110 157 93 201 49 187 63School readiness
Mean 49.77 47.12 49.23 47.56 51.06 38.52*** 51.09 41.22**
SE 1.92 2.17 1.82 2.37 1.57 3.19 1.64 2.82Expressive language
Mean 99.96 97.60 99.60 97.77 99.63 96.01 99.40 97.48SE 1.11 1.25 1.05 1.37 0.92 1.88 096 1.66
Language comprehensionMean 103.81 101.02 103.21 101.52 103.50 98.81* 104.03 98.27**
SE 1.07 1.21 1.02 1.33 0.89 1.81 0.92 1.58Behavior problems
Mean -0.66 0.57** -0.32 0.23 -0.51 1.49*** -0.41 0.76*
SE 0.30 0.34 0.29 0.37 0.25 0.50 0.26 0.45Positive social behavior
Mean 0.31 -0.16* 0.11 0.09 0.13 0.01 0.11 0.09SE 0.14 0.16 0.13 0.17 0.12 0.24 0.12 0.21
Notes: At 36 months, the ratio standard was 7.1, the group size standard was 14, the caregiver education standard was some college, and the caregiver trainingstandard was some post-high school training in child development, early childhood education, or a related field. Pairs of means shown in italics weresignificantly different from one another. Child outcomes and child care standards were measured concurrently.*p<.05; **p<.01; ***p<.001
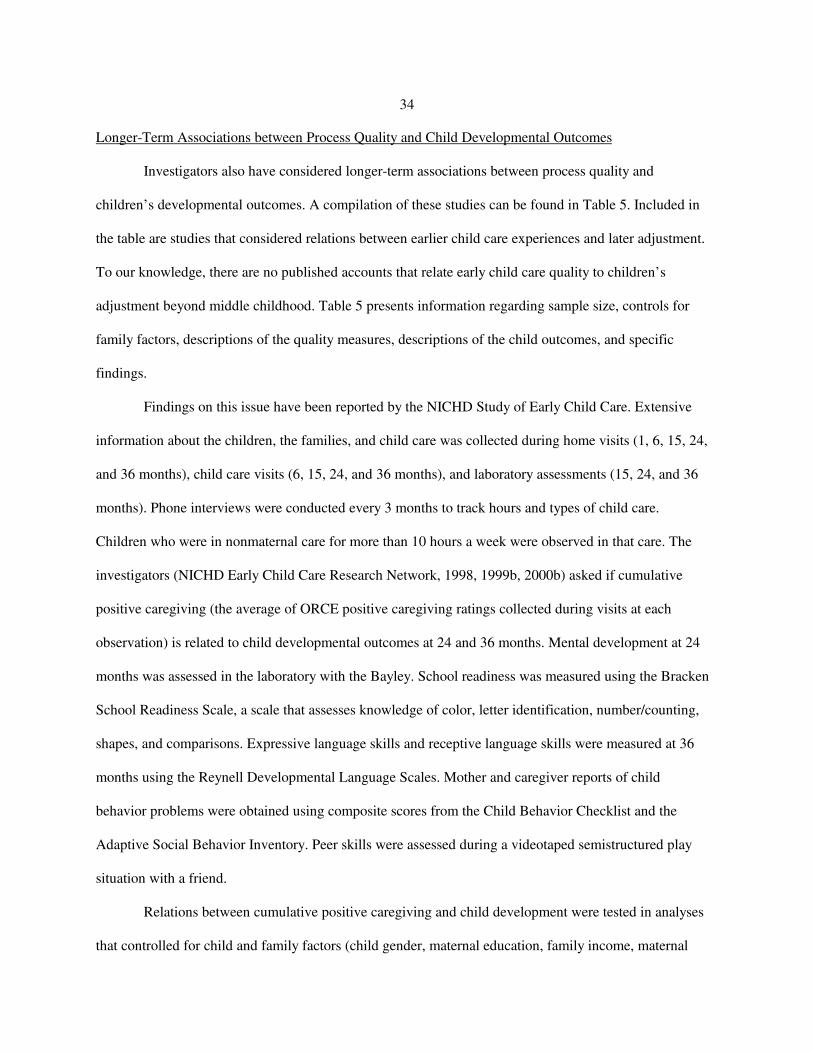
34
Longer-Term Associations between Process Quality and Child Developmental Outcomes
Investigators also have considered longer-term associations between process quality and
children’s developmental outcomes. A compilation of these studies can be found in Table 5. Included in
the table are studies that considered relations between earlier child care experiences and later adjustment.
To our knowledge, there are no published accounts that relate early child care quality to children’s
adjustment beyond middle childhood. Table 5 presents information regarding sample size, controls for
family factors, descriptions of the quality measures, descriptions of the child outcomes, and specific
findings.
Findings on this issue have been reported by the NICHD Study of Early Child Care. Extensive
information about the children, the families, and child care was collected during home visits (1, 6, 15, 24,
and 36 months), child care visits (6, 15, 24, and 36 months), and laboratory assessments (15, 24, and 36
months). Phone interviews were conducted every 3 months to track hours and types of child care.
Children who were in nonmaternal care for more than 10 hours a week were observed in that care. The
investigators (NICHD Early Child Care Research Network, 1998, 1999b, 2000b) asked if cumulative
positive caregiving (the average of ORCE positive caregiving ratings collected during visits at each
observation) is related to child developmental outcomes at 24 and 36 months. Mental development at 24
months was assessed in the laboratory with the Bayley. School readiness was measured using the Bracken
School Readiness Scale, a scale that assesses knowledge of color, letter identification, number/counting,
shapes, and comparisons. Expressive language skills and receptive language skills were measured at 36
months using the Reynell Developmental Language Scales. Mother and caregiver reports of child
behavior problems were obtained using composite scores from the Child Behavior Checklist and the
Adaptive Social Behavior Inventory. Peer skills were assessed during a videotaped semistructured play
situation with a friend.
Relations between cumulative positive caregiving and child development were tested in analyses
that controlled for child and family factors (child gender, maternal education, family income, maternal

TABLE 5 Long-Term Associations between Child Care Quality and Child Developmental Outcomes
CITATIONa N AGE
PROCESS QUALITY MEASURE
STRUCTURAL QUALITY MEASURE
OTHER CHILD CARE MEASURES
FAMILY CONTROLS
CHILD DEVELOPMENTAL OUTCOMESc QUALITY FINDINGS
Blau (1999c) Not specified
variable None Mother report of group size, C:A ratio,
CG training;
Type of care, no. of arrangements, hours, cost
Mode of Care (CC control)
BPI (Behavior Problems Index) PIAT (math & reading achievement) PPVT (language)
See text.
Broberg et al. (1990)
84 children in Sweden
Time 1 =prior to care; M age = 16 mos. Time 2 = 1 yr later; Time 3 = 2 years later
Pos & neg events (Belsky & Walker Spot observ checklist
None Type of Care Social status, quality home envir, parents perceived social support, child temperament, child sociability
Griffith’s Developmental Scales-Scale C (Verb/Ling ability at 28 mos and 40 mos)
ANOVA: no care group difference in verbal abilities at 28 or 40 months. PLS: no effect of child care quality nor type of care on verbal ability at 28 or 40 months.
Broberg et al. (1997)
Initial sample of 146 was recruited at 12- 24 mos. 123 assessed at 8 yrs. 123
Composite: Adult Child interact – 16, 28, 40 mos
Composite: C:A ratio3, # hrs in care per day: 16, 28, 49 mos
Time in child care Social status, inhibition, paternal involvement, home environment
Griffith’s Developmental Scales-(Lang Subscales) Standardized School Readiness Test (numerical subscales)
Struct qual related at 40 mos (.30*) & 80 mos (.22*) w/ math in 2nd grade. Verbal in 2nd predicted by (1) verbal at 40 & 80 mos, (2) # mos in CC, (3) consistent high paternal involvement. Math in 2nd predicted by (1) math at 80 mos, (2) struct qual, (3) inhib scores, (4) process qual. Not predicted by # sibs, gender, qual home. SES not entered in equation.
Burchinal et al. (2000)
89 Recruited in first yr; Reassessed at 12, 24, & 36 mos.
ITERS, ECERS
C:A ratio3, group size, teacher education
Child age, child Gender, poverty status, home environment
Bayley (Cog: 12, 24, 36 mos) Lang: Receptive & Express (vocab) Communic Skills (12, 24, 36 mos; Communicative, Social Affective, Symbolic Skills (12, 18, 24 mos)
Quality care increased linearly b/w 12 & 36 mos. 12 mos concurrent: process quality related to cognitive skills, receptive language, overall communication. C:A ratio3 & group sized related to overall communication. HOME related to cognitive & overall communication. 24 mos (concurrent): Process quality related to cognitive skills, receptive language, expressive language, & overall communication skills. Structural not related. HOME related to overall communication. 36 mos (concurrent): process qual related to cog, recept & express lang. Ratio & group size related to cog skill, expressive lang. Teacher ed related to express lang. HOME not related. HLM (separate for process qual, ratio, teacher ed) controlling for sex, poverty, HOME. Process qual: higher qual over time related to better cog, recept lang, express lang, & overall communic skills. Assoc w/ expressive lang increase w/ age. Ratio: related to higher scores over time on receptive lang & overall communic skills, & to rate at which express skills acquired. Teacher Educ: related to higher cog & receptive lang skills for girls only.

TABLE 5, continued Chin-Quee and Scarr (1994)
127 Recruited preschool, follow-up 5-9 yrs
ECERS Amount & Type of Verbal Interact b/w Child & CG1
Childs experiences in CC5, Age of entry into CC5, # Hrs. Attendance
Maternal Education & Maternal IQ (PPVT-R), Values Conform, Value Soc Skills
Report Cards (Social & Cog Dev) Teacher report peer relations, cooperative beh, Acad Achieve
HMR: (1) mat ed, mat IQ, values conform, values soc skills; (2) CC Exper: Age began care, total time in care; (3) Quality: ECERS. Quality of care in infant & preschool yrsÅNOT related to school-age outcomes. HMR: (1) same; (2) same; (3) Prop control utterances, prop expressive utterance. Quality indicators (prop control & express utter) failed to predict school-age outcomes.
Deater-Deckard et al. (1996)
141 Time 1 = toddler or preschoolerTime 2 = 4 yrs later
Composite of ITERS, ECERS, Profile, CG education, wages
C:A ratio SES, child sex, child age, parenting stress, harsh parental discipline
Composite scores of mother-reported behavior problems and social withdrawal and teacher-reported behavior problems and social withdrawal
No significant correlations between Time 1 process quality and Time 2 child outcomes or between Time 1 C:A ratio and Time 2 child outcomes Also Time 1 process quality and C:A ratio did not predict Time 2 outcomes in hierarchical regressions that controlled for Time 1 adjustment.
Field (1991) Study 1
28 5-8 yrs in full time care by 2
Not assessed All high qual
C:A ratio3 CG1 education CG1 stability
Amount time in care
Maternal extraversionÅ child outcome
BRS: (Sociability, Socioemot Adj) Piers-Harris (Self-Concept) Buck I/E scale
Partial correlations (maternal extraversion): amount time spent in high qual, stable care & later adjust (5-8) associated w/ all child outcomes.
Field (1991) Study 2
56 6th grade (M = 11.5) full time care by 2
Not assessed All high qual
C:A ratio3, CG1 education, CG1 turnover
Amount time in care
No family variables associated w/ time in care
BRS (socioem adjust & sociability) Piers-Harris (Self-Concept) Peer Interact Beh Acad Meas: gifted prog, lang arts, math grades
Simple correlations: amount of time in high quality programs. Stable care & later adjustment at 6th grade. Amount of time in high quality care associated with all child outcomes.
Hagekull and Bohlin (1995)
52 Swedish children
Recruited at 6 wks until 4 yrs
Stimulation Emotional Tone b/w Adults & Children
C:A ratio3, group size, CG1: child-oriented education & experience, security aspects, available space
Overall rating of quality of care includes both
SES7, overall quality of home, child gender, temperament (10, 15, 20 mos)
TBQ PBQ Hagekull & Bohlin: Ego Strength/ Effectance & Soc Comp
29 mos (concurr): Observed day care qualityÅ maternal report positive emotional expression. 4 yrs (long): observed day care quality --: aggregated reports internalizing problems & ego strength/effectance. HMR: 29 mos: Children from low quality homes, in good qual DC6
Åreduction in externalizing behaviors. Children from medium- or high-quality homes, DC6 quality not important in explaining externalizing behaviors 4 yrs: Children, low SES7, in good quality care Å less aggressive, no effect on higher SES7, (2) aggressiveness of easy children positively affected by high-quality DC6. Difficult children no decrease in aggressiveness in high-quality setting, (3) for boys, good qual care associated w/ less internalizing/social withdrawal problems & more ego strength/effectance.
Howes (1988) 87 45-57 mos followed for 2 yrs
CG1 training in child development, small group size, low C:A ratio3, planned & indiv educ prog, adeq physical space
Age of entry Length of day # diff arrangements
Maternal education, family struct maternal employ
Academic progress (1st grade CG1 report) CBP: (Behavior Problems, School Skill)
HMR: (1) family characteristics (2) CC5 char. Higher child care quality predicted: (1) better acad skills for boys only (2) better social skills for both girls & boys (3) fewer behavior problems both girls & boys Smaller # arrangementsÅbetter academic skills for boys & girls

TABLE 5, continued Howes (1990) 80 children 45 center care
b-4 1 yr other full time between 1 & 4
CG involvement/ investment in child compliance (toddler period: 18, 24, 30. 36 mos)
Composite: C:A ratio3, CG1 training, CG1 stability (toddler period)
Family social Family structure Child Age
CBCL CBI
Structural Quality – concurrent (toddler) M.E.: High qualityÅ more compliant at care, more self-regulation in lab. Longit (preschool): M.E.: high qualityÅ more social pretend play, more positive affect, less CG1 rated difficult. Longit (kindergarten): high qualityÅless CG1 rating of hostility Process Qual (Long), age partialled out: Preschool: CG1 involvement/investmentÅobserved social play, social pretend play, positive affect, less CG1 rate difficult & hesitant. Kindergarten: CG1 involvementÅ less parent ratings of internalizing & externalizing; less CG1 rate of distract, hostile, higher rate verbal IQ, consideration. See summary sheet for further analyses.
Jacobs and White (1994)
36 c Kind, 4 yrs at recruit 32 Kind, not enrolled
Kindergarten ECERS None SES7 PPVT-R: (Recept lang) SSC: (Social)
MANOVAs (same results w/ no covar & w/ SES & PPVT cov). Children in center care higher on interest-participation than children in no-care; no difference b/w high- & low-quality care. No care effect on cooperation-compliance children in high-quality center highest on receptive language, followed by no care & then low quality.
NICHD Early Child Care Research Network (1998)
1,085 1,041
24 & 36 mos
ORCE positive caregiving rating at 6, 15, 24, and 36 mos
Quantity, entry age, stability, group type
Income/needs, psych adjust, c. gender, c. temp
Mother reported behavior problems & social competence; caregiver report of problems; laboratory observations of compliance & negativity
Children in higher-qual child care during first 3 yrsÅ more compliant & cooperative during observations; CG reported fewer behavior problems.
NICHD Early Child Care Research Network (2000b)
6, 15, 24, 36 mos
Positive CG1 composite, Language stimulation
Quantity, type Maternal PPVT-R, child gender, HOME & maternal stimulation
Bayley MDI , Bracken School Readiness, Macarthur CDI; Reynell Dev Lang
Positive caregiving & language stimulation significantly related to cognitive & language outcomes at 24 & 36 mos. HMR: (1) selection variables, (2) child gender, (3) family envir, (4) quantity & type of care, (5) positive caregiving (PC), (6) frequency of language stimulation (LS) – see summary sheet. Cognitive & lang predicted by process qual at 15, 24, 36 mos. Lagged effects: Cog: at 24 mos only concurr LS predicted. Lang (express) at 24 & 36, children w/ higher LS earlier assess better scores. Lang (receptive) at 36 mos, predicted pos by earlier LS.
NICHD Early Child Care Research Network (submitted)
669 612
24 & 36 mos Positive Caregiving (ORCE)
Amt time in CC5 Available other Children
Maternal education, maternal attitude toward employment, child gender, cog/ ling perf at 24 & 36 mos, mat sens in play, mat psych adjus, fam struc # c in home)
Mother and caregiver report of peer competencies; observed peer interaction in child care and structured task.
24 mos: More positive caregivingÅchild more positive sociability at 24 mos, lower proportion negative interaction w/ peers observed.
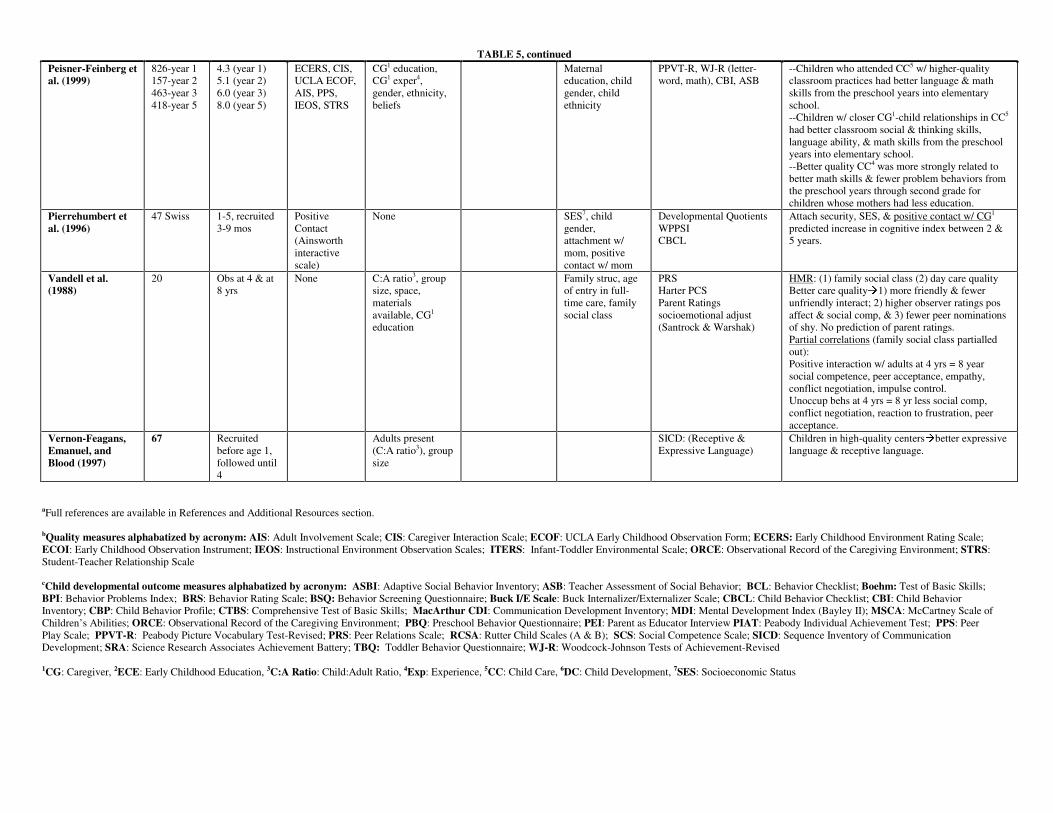
TABLE 5, continued Peisner-Feinberg et al. (1999)
826-year 1 157-year 2 463-year 3 418-year 5
4.3 (year 1) 5.1 (year 2) 6.0 (year 3) 8.0 (year 5)
ECERS, CIS, UCLA ECOF, AIS, PPS, IEOS, STRS
CG1 education, CG1 exper4, gender, ethnicity, beliefs
Maternal education, child gender, child ethnicity
PPVT-R, WJ-R (letter-word, math), CBI, ASB
--Children who attended CC5 w/ higher-quality classroom practices had better language & math skills from the preschool years into elementary school. --Children w/ closer CG1-child relationships in CC5 had better classroom social & thinking skills, language ability, & math skills from the preschool years into elementary school. --Better quality CC4 was more strongly related to better math skills & fewer problem behaviors from the preschool years through second grade for children whose mothers had less education.
Pierrehumbert et al. (1996)
47 Swiss 1-5, recruited 3-9 mos
Positive Contact (Ainsworth interactive scale)
None SES7, child gender, attachment w/ mom, positive contact w/ mom
Developmental Quotients WPPSI CBCL
Attach security, SES, & positive contact w/ CG1 predicted increase in cognitive index between 2 & 5 years.
Vandell et al. (1988)
20 Obs at 4 & at 8 yrs
None C:A ratio3, group size, space, materials available, CG1 education
Family struc, age of entry in full-time care, family social class
PRS Harter PCS Parent Ratings socioemotional adjust (Santrock & Warshak)
HMR: (1) family social class (2) day care quality Better care qualityÅ1) more friendly & fewer unfriendly interact; 2) higher observer ratings pos affect & social comp, & 3) fewer peer nominations of shy. No prediction of parent ratings. Partial correlations (family social class partialled out): Positive interaction w/ adults at 4 yrs = 8 year social competence, peer acceptance, empathy, conflict negotiation, impulse control. Unoccup behs at 4 yrs = 8 yr less social comp, conflict negotiation, reaction to frustration, peer acceptance.
Vernon-Feagans, Emanuel, and Blood (1997)
67 Recruited before age 1, followed until 4
Adults present (C:A ratio3), group size
SICD: (Receptive & Expressive Language)
Children in high-quality centersÅbetter expressive language & receptive language.
aFull references are available in References and Additional Resources section.
bQuality measures alphabatized by acronym: AIS: Adult Involvement Scale; CIS: Caregiver Interaction Scale; ECOF: UCLA Early Childhood Observation Form; ECERS: Early Childhood Environment Rating Scale; ECOI: Early Childhood Observation Instrument; IEOS: Instructional Environment Observation Scales; ITERS: Infant-Toddler Environmental Scale; ORCE: Observational Record of the Caregiving Environment; STRS: Student-Teacher Relationship Scale cChild developmental outcome measures alphabatized by acronym: ASBI: Adaptive Social Behavior Inventory; ASB: Teacher Assessment of Social Behavior; BCL: Behavior Checklist; Boehm: Test of Basic Skills; BPI: Behavior Problems Index; BRS: Behavior Rating Scale; BSQ: Behavior Screening Questionnaire; Buck I/E Scale: Buck Internalizer/Externalizer Scale; CBCL: Child Behavior Checklist; CBI: Child Behavior Inventory; CBP: Child Behavior Profile; CTBS: Comprehensive Test of Basic Skills; MacArthur CDI: Communication Development Inventory; MDI: Mental Development Index (Bayley II); MSCA: McCartney Scale of Children’s Abilities; ORCE: Observational Record of the Caregiving Environment; PBQ: Preschool Behavior Questionnaire; PEI: Parent as Educator Interview PIAT: Peabody Individual Achievement Test; PPS: Peer Play Scale; PPVT-R: Peabody Picture Vocabulary Test-Revised; PRS: Peer Relations Scale; RCSA: Rutter Child Scales (A & B); SCS: Social Competence Scale; SICD: Sequence Inventory of Communication Development; SRA: Science Research Associates Achievement Battery; TBQ: Toddler Behavior Questionnaire; WJ-R: Woodcock-Johnson Tests of Achievement-Revised 1CG: Caregiver, 2ECE: Early Childhood Education, 3C:A Ratio: Child:Adult Ratio, 4Exp: Experience, 5CC: Child Care, 6DC: Child Development, 7SES: Socioeconomic Status

39
psychological adjustment, home quality assessed by Bradley and Caldwell’s HOME scale, and videotaped
observations of mother-child interaction) and other aspects of child care (time in center and total hours in
care from 3 to 36 months). Table 6 summarizes findings from regression analyses and resultant partial r’s
that indicated effect sizes. As shown, the quality of child care during the first 3 years was related to
children’s school readiness, expressive language, and receptive language at 3 years. Also shown on Table
6 are comparisons of children in high-quality and low-quality child care (defined with quartile splits),
using the same covariates. This extreme group approach yielded d statistics. Effect sizes using this
extreme group approach were significant for measures of school readiness, expressive language, and
receptive language at 36 months.
To evaluate the magnitude of these findings, the NICHD investigators conducted parallel
analyses that tested relations between quality of the home environment during the first 3 years and child
developmental outcomes (using the same covariates), and relations between child care hours during the
first 3 years and child developmental outcomes (using the same covariates). Table 6 presents these effect
sizes as well. Effects associated with quality of the home environment (the cumulative composite scores
created from the Bradley and Caldwell HOME scale and mother-child interaction ratings) were roughly
twice the size of the child care quality score. Effects associated with child care hours were substantially
smaller than effects associated with child care quality. The NICHD investigators argued that these
findings suggest effects of child care quality assessed longitudinally to age 3 years were neither huge nor
trivial, but were large enough to be meaningful. It also should be noted that these effect sizes are likely to
be a conservative estimate because of the selective participation by higher-quality settings. If the poorest
quality child care settings refused to allow observations to be conducted, the range of quality scores
would be truncated, resulting in smaller effect sizes.
Longer-term findings obtained from the Otitis Media Study (Burchinal et al., 2000) are consistent
with those reported in the NICHD study. In that study, hierarchical linear models were tested.
Observations of classroom quality obtained annually over a 3-year period were used to predict children’s
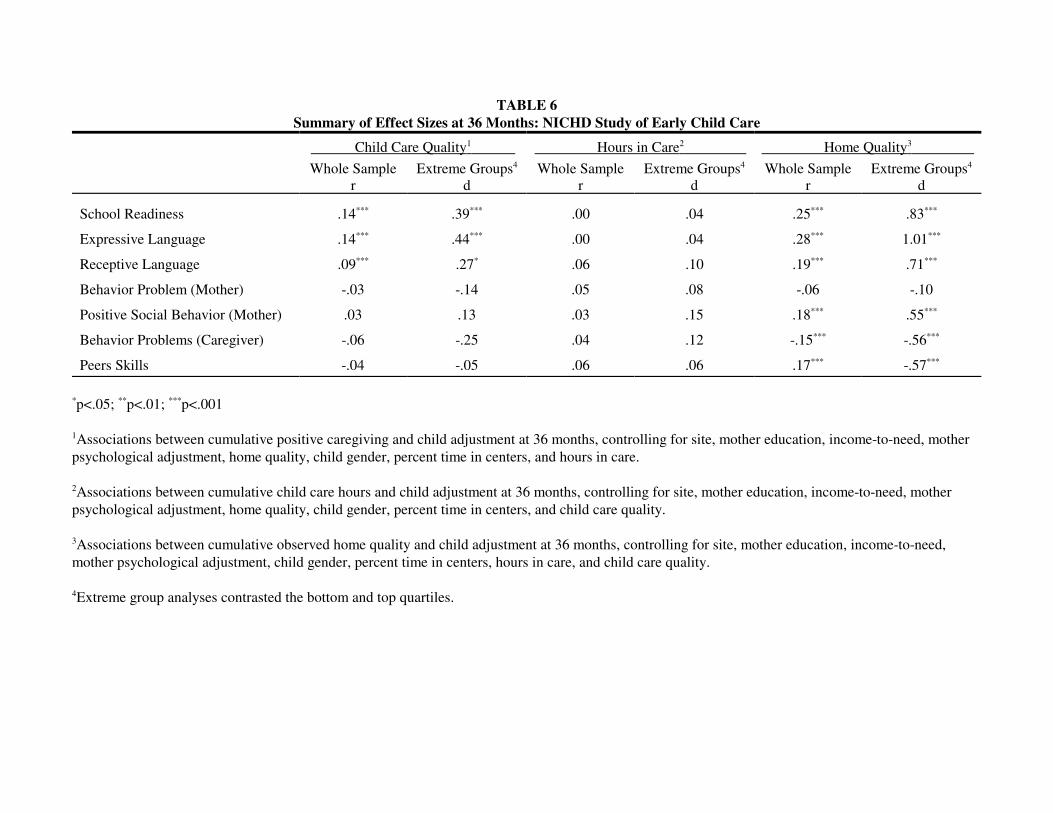
TABLE 6Summary of Effect Sizes at 36 Months: NICHD Study of Early Child Care
Child Care Quality1 Hours in Care2 Home Quality3
Whole Sample Extreme Groups4 Whole Sample Extreme Groups4 Whole Sample Extreme Groups4
r d r d r d
School Readiness .14*** .39*** .00 .04 .25*** .83***
Expressive Language .14*** .44*** .00 .04 .28*** 1.01***
Receptive Language .09*** .27* .06 .10 .19*** .71***
Behavior Problem (Mother) -.03 -.14 .05 .08 -.06 -.10
Positive Social Behavior (Mother) .03 .13 .03 .15 .18*** .55***
Behavior Problems (Caregiver) -.06 -.25 .04 .12 -.15*** -.56***
Peers Skills -.04 -.05 .06 .06 .17*** -.57***
*p<.05; **p<.01; ***p<.001
1Associations between cumulative positive caregiving and child adjustment at 36 months, controlling for site, mother education, income-to-need, motherpsychological adjustment, home quality, child gender, percent time in centers, and hours in care.
2Associations between cumulative child care hours and child adjustment at 36 months, controlling for site, mother education, income-to-need, motherpsychological adjustment, home quality, child gender, percent time in centers, and child care quality.
3Associations between cumulative observed home quality and child adjustment at 36 months, controlling for site, mother education, income-to-need,mother psychological adjustment, child gender, percent time in centers, hours in care, and child care quality.
4Extreme group analyses contrasted the bottom and top quartiles.
41
adjustment up to age 3 years. Higher-quality child care over time was associated with better cognitive
development, better receptive and expressive language skills, and better functional communication skills
over time, controlling for child gender, family poverty status, and home environment quality.
A limitation with both of these reports is that children were studied only to age 3. Thus, it cannot
be ascertained if early effects are harbingers of later differences or if these effects dissipate by the time
children enter grade school. As additional findings from these ongoing investigations become available,
they can be used to identify conditions under which early child care quality differences are maintained or
dissipate.
In the meantime, the Cost, Quality, and Outcomes Study has information that is relevant to this
issue (Peisner-Feinberg et al., 1999). Started in 1993, this study undertook observations in child care
centers located in four states—California, Colorado, Connecticut, and North Carolina—that varied in
licensing standards. Centers were evenly distributed in each state into nonprofit and for-profit programs.
Within the eligible programs, 509 preschool classrooms and 224 infant/toddler classrooms were studied.
Process quality was rated using the ECERS or ITERS, the Caregiver Interaction Scale (Arnett, 1989), and
the Teacher Involvement Scale (Howes and Stewart, 1987). Quality indicators were combined into a
single process quality composite.
A subsample of children was followed through 2 years of child care and the first 3 years of formal
schooling (kindergarten through second grade). Children were assessed for receptive language skills,
reading ability, and math skills. Child care and school teachers rated the children’s cognitive/attention
skills, sociability, and problem behaviors each year. Longitudinal hierarchical linear models examined
relations between the child care quality composite collected at age 4 (Time 1) and children’s
developmental outcomes through grade 2. In all analyses, selection factors (maternal education, child’s
gender and ethnicity) were controlled statistically.
Children enrolled in higher-quality child care classrooms as preschoolers were found to have
better receptive language skills. Effect sizes for receptive language were moderate for the preschool
42
period (.60 and .51 for the 2 years preceding school entry), more modest in kindergarten (.30), and not
significant in second grade. Child care quality also was related to children’s math skills. Children who
were enrolled in higher-quality child care had better math skills before entering school and during
kindergarten and second grade, with modest effect sizes across the years (.20–.29). The relation was
stronger for children whose mothers had less education. In further analyses that controlled for the quality
of the elementary school classroom, the relations between child care quality and children’s math skills
were maintained. It is notable that a similar finding was obtained in research conducted in Sweden.
Broberg et al. (1997) found that process quality assessed using the Belsky and Walker checklist at 16, 28,
and 40 months predicted better math skills at age 8, even after controlling for child and family factors.
Other research has considered longer-term associations between child care quality and children’s
social-emotional outcomes. Howes (1990) focused on one particular aspect of process quality—child care
socialization practices—in relation to children’s subsequent developmental outcomes. Caregivers’
involvement and investment in child compliance were measured during naturalistic observations in the
child care setting. Having a more involved and invested caregiver during the first 3 years was associated
with kindergarten teachers’ reports that the children had fewer behavior problems and better verbal IQs.
Alternative Views. As shown in Table 5, some investigators have not found relations between
child care quality and later developmental outcomes. For example, Chin-Quee and Scarr (1994) did not
find evidence of long-term effects in a longitudinal follow-up of the Bermuda study. In the initial study,
concurrent associations were reported between process quality as measured by the ECERS and child
developmental outcomes (McCartney, 1984; Phillips et al., 1987). In the follow-up study, teachers rated
social competence (peer relations and cooperative behavior) and academic achievement for 97 of the
original sample of 166, when children were in grades 1 and 2 (Time 2) and grades 3 and 4 (Time 3).
Associations between the quality indicators during the preschool years and competence at school were
tested with hierarchical regressions in which parental values, age of entry into care, and total amount of
child care before school entry were controlled. Neither the global quality score nor the specific measures

43
of caregiver language predicted children’s social competence and academic achievement at Time 2 or
Time 3.
A longitudinal follow-up of children who participated in the Three-State Study also failed to
detect long-term effects (Deater-Deckard, Pinkerton, and Scarr, 1996). In this project, assessments of
child care quality were first obtained in 363 classrooms located in 120 centers in three states (Georgia,
Virginia, Massachusetts) when 718 study children were infants, toddlers, and preschoolers. Process
quality ratings were obtained by pulling items pertaining to teacher-child interaction from the ECERS and
ITERS and the Assessment Profile (a process measure scored for presence or absence of specific items).
Four years later, follow-up assessments were conducted for 141 of the original sample. Multiple
regressions controlled for child (child adjustment at Time 1, age at Time 2, child gender) and family
characteristics (SES, a composite of parenting stress and low emotional support, maternal endorsement of
harsh discipline practices). The child care quality measure was a composite of the ITERS/ECERS, the
Assessment Profile that measures physical facilities, caregiver training and education, and caregiver
wages. In these analyses, the child care quality composite score at Time 1 did not predict changes in
children’s behavior problems or social withdrawal at Time 2.
Although Scarr (1998) has argued that these studies demonstrate that child care quality has little
or no long-term impact on children’s development, the findings must be interpreted with caution. Both
studies are based on the assumption that a quality assessment obtained at one point in time is an adequate
and accurate representation of child care quality. Single assessments might be sufficient if care
arrangements and quality are stable; however, a single observation is not adequate if care is unstable or
changing. In the Bermuda sample, Chin-Quee and Scarr (1994) reported that half the children
experienced one, two, or three changes in arrangements during the intervening period, and half
experienced more than three arrangement changes. In the Three-State study, no information about child
care quality in the intervening four years was collected. In both studies, it is difficult to interpret the
meaning of the null findings in light of no information about child care quality across early childhood.

44
Stronger, more valid tests of the effects of child care quality need to take into account cumulative quality
and the pattern of quality over time.
The lack of long-term relations in the Three-State Study may also reflect limitations in the
assessment of process quality. Only moderate interobserver agreement was reported across the three
research sites—.58 for the ECERS and .55 for the ITERS (McCartney et al., 1997). Lower relations
between process quality and child outcomes would be expected when process quality scores are less
reliable.
Longer-Term Associations between Structural and Caregiver Characteristics and Child Outcomes
Other studies have considered relations between structural and caregiver characteristics in relation
to children’s subsequent developmental outcomes (see Table 5). Howes (1988), for example, examined
structural and caregiver characteristics at 3 years in relation to children’s first-grade adjustment. Quality
in 81 centers was defined in terms of five areas: teacher training, child:adult ratio, group size, a planned
curriculum, and space. Higher-quality care met recognized standards in all five areas; medium-quality
care met standards on three or four dimensions, and low-quality care met three or fewer standards. During
the intervening period, the 87 children attended the same university lab school, meaning that they
experienced classes with the same or similar structural and caregiver characteristics.
In analyses that controlled for maternal work status, family structure, and maternal education,
Howes found that children who had attended higher-quality child care programs prior to enrollment in the
university school had fewer behavior problems and better work habits than children who had attended
lower-quality programs. Additionally, boys who had attended higher-quality centers received better first-
grade teacher ratings of academic performance than did other boys.
Using a different sample of 80 children enrolled in center-based care, Howes (1990) examined
relations between children’s kindergarten adjustment and a structural quality composite (child:adult ratio,
caregiver training, caregiver stability) measured at 18, 24, 30, and 36 months. High-quality care was
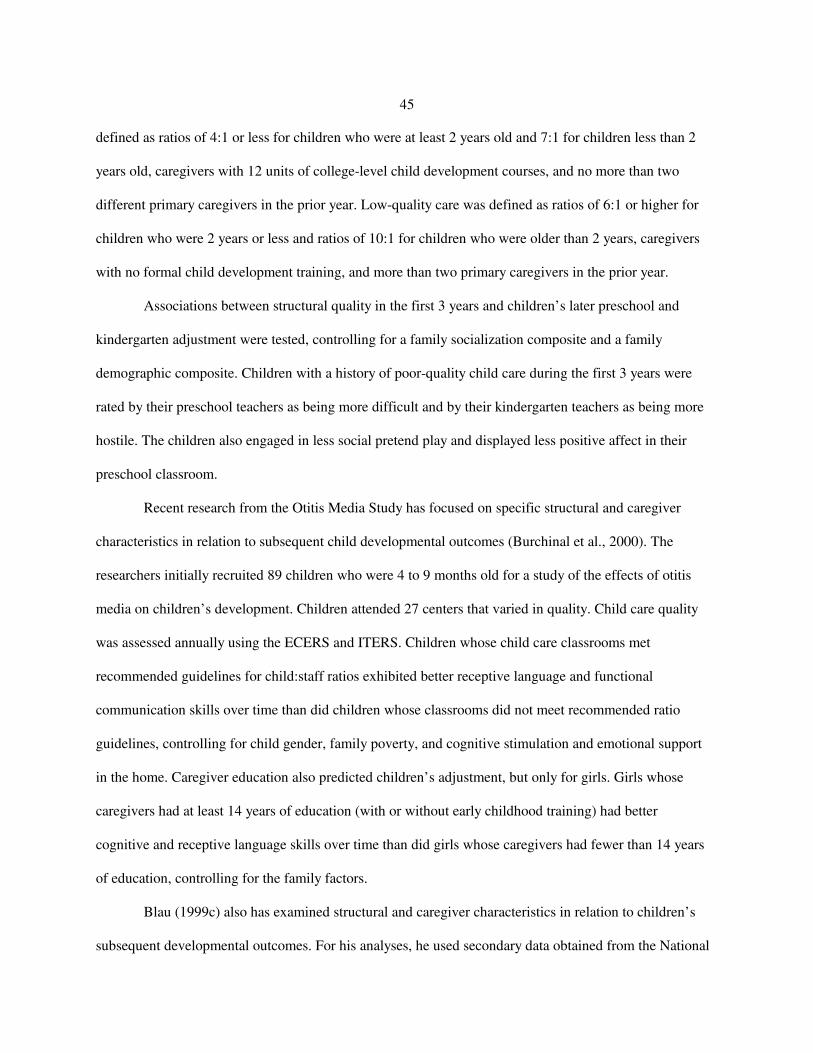
45
defined as ratios of 4:1 or less for children who were at least 2 years old and 7:1 for children less than 2
years old, caregivers with 12 units of college-level child development courses, and no more than two
different primary caregivers in the prior year. Low-quality care was defined as ratios of 6:1 or higher for
children who were 2 years or less and ratios of 10:1 for children who were older than 2 years, caregivers
with no formal child development training, and more than two primary caregivers in the prior year.
Associations between structural quality in the first 3 years and children’s later preschool and
kindergarten adjustment were tested, controlling for a family socialization composite and a family
demographic composite. Children with a history of poor-quality child care during the first 3 years were
rated by their preschool teachers as being more difficult and by their kindergarten teachers as being more
hostile. The children also engaged in less social pretend play and displayed less positive affect in their
preschool classroom.
Recent research from the Otitis Media Study has focused on specific structural and caregiver
characteristics in relation to subsequent child developmental outcomes (Burchinal et al., 2000). The
researchers initially recruited 89 children who were 4 to 9 months old for a study of the effects of otitis
media on children’s development. Children attended 27 centers that varied in quality. Child care quality
was assessed annually using the ECERS and ITERS. Children whose child care classrooms met
recommended guidelines for child:staff ratios exhibited better receptive language and functional
communication skills over time than did children whose classrooms did not meet recommended ratio
guidelines, controlling for child gender, family poverty, and cognitive stimulation and emotional support
in the home. Caregiver education also predicted children’s adjustment, but only for girls. Girls whose
caregivers had at least 14 years of education (with or without early childhood training) had better
cognitive and receptive language skills over time than did girls whose caregivers had fewer than 14 years
of education, controlling for the family factors.
Blau (1999c) also has examined structural and caregiver characteristics in relation to children’s
subsequent developmental outcomes. For his analyses, he used secondary data obtained from the National
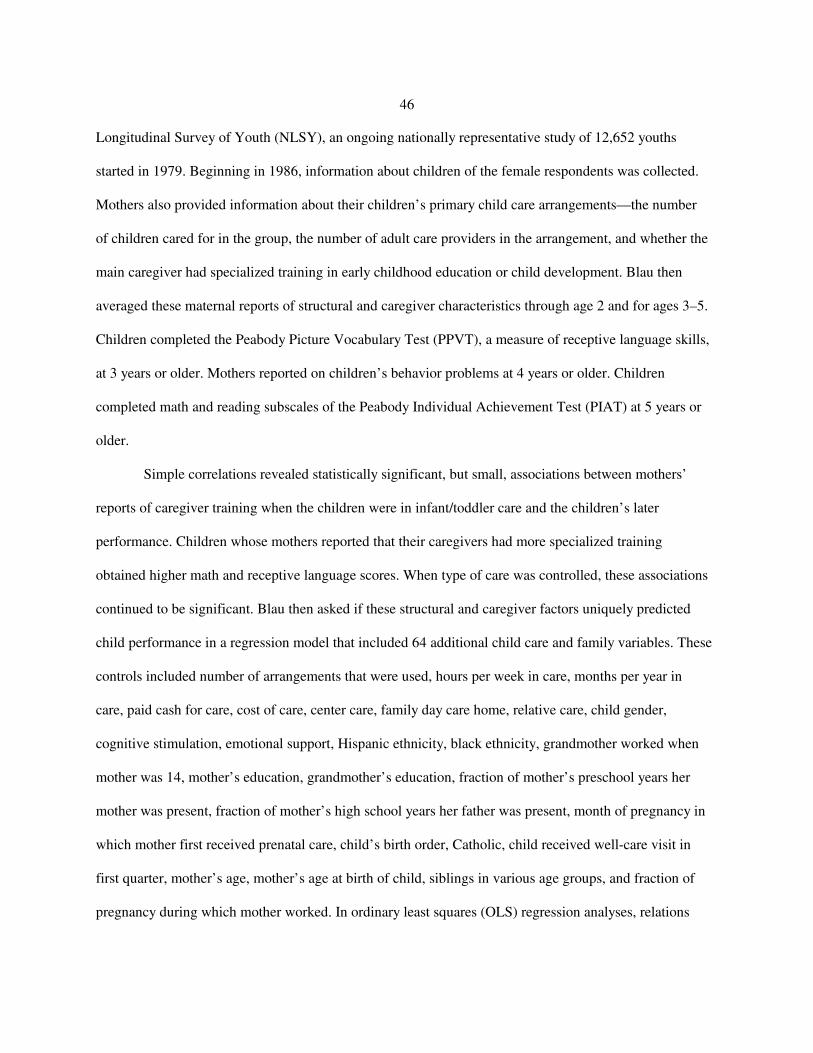
46
Longitudinal Survey of Youth (NLSY), an ongoing nationally representative study of 12,652 youths
started in 1979. Beginning in 1986, information about children of the female respondents was collected.
Mothers also provided information about their children’s primary child care arrangements—the number
of children cared for in the group, the number of adult care providers in the arrangement, and whether the
main caregiver had specialized training in early childhood education or child development. Blau then
averaged these maternal reports of structural and caregiver characteristics through age 2 and for ages 3–5.
Children completed the Peabody Picture Vocabulary Test (PPVT), a measure of receptive language skills,
at 3 years or older. Mothers reported on children’s behavior problems at 4 years or older. Children
completed math and reading subscales of the Peabody Individual Achievement Test (PIAT) at 5 years or
older.
Simple correlations revealed statistically significant, but small, associations between mothers’
reports of caregiver training when the children were in infant/toddler care and the children’s later
performance. Children whose mothers reported that their caregivers had more specialized training
obtained higher math and receptive language scores. When type of care was controlled, these associations
continued to be significant. Blau then asked if these structural and caregiver factors uniquely predicted
child performance in a regression model that included 64 additional child care and family variables. These
controls included number of arrangements that were used, hours per week in care, months per year in
care, paid cash for care, cost of care, center care, family day care home, relative care, child gender,
cognitive stimulation, emotional support, Hispanic ethnicity, black ethnicity, grandmother worked when
mother was 14, mother’s education, grandmother’s education, fraction of mother’s preschool years her
mother was present, fraction of mother’s high school years her father was present, month of pregnancy in
which mother first received prenatal care, child’s birth order, Catholic, child received well-care visit in
first quarter, mother’s age, mother’s age at birth of child, siblings in various age groups, and fraction of
pregnancy during which mother worked. In ordinary least squares (OLS) regression analyses, relations

47
between maternal reports of caregiver training and children’s math and receptive language scores were no
longer evident when these other variables were controlled. From these analyses, Blau concluded:
There seems to be little association on average between child care inputs experiencedduring the first three years of life and subsequent child development, controlling forfamily background and the home environment (p. 20).
Blau’s conclusion does not appear warranted, for several reasons. First, his analyses relied on
maternal reports of structural and caregiver characteristics. Questions can be raised about whether
mothers can provide this information accurately, especially retrospectively. Unfortunately, Blau provides
no evidence regarding the accuracy of these reports. To estimate the accuracy of mothers’ concurrent
reports of structural and caregiver characteristics, we turned to the NICHD Study of Early Child Care data
set, which included both mothers’ and caregivers’ reports of group size and child-adult ratio. These
reports were compared to observers’ independent counts of ratio and group size during 2-day visits. The
mean correlation between mothers’ and caregivers’ reports of group size for children in centers was .55
(range = .51 to .63). The mean correlation between maternal reports of child:adult ratio and observed
ratios was .33 (range = .27 to .42). These figures suggest that mother concurrent reports can be viewed as
moderately reliable. Maternal retrospective reports of group size and ratio appear to be considerably less
reliable. In other studies, near-zero correlations were obtained between observational assessments of
group size and child:adult ratio when children were 4 years old (Vandell and Powers, 1983) and maternal
retrospective reports of these same structural variables 4 years later (Vandell, Henderson, and Wilson,
1988).
To our knowledge, there are no data available from which the accuracy of maternal reports of
caregiver training can be evaluated. We suspect, based on our own personal experiences, that mothers are
less likely to know about caregiver training than about group size and ratio, which they can observe.
Taken together, we believe that the lack of precision in the mothers’ reports in the NLSY results in an
underestimation of effects associated with structural and caregiver characteristics.

48
Blau also adopted a stringent, perhaps unrealistic, test for long-term effects. Child outcomes were
assessed a minimum of 2 years after mothers reported structural and caregiver characteristics, and the lag
appears to have averaged 5 years or more because children were reported to be, on average, 8 years old
when outcomes were assessed. Interestingly, there was some evidence of longitudinal associations when
shorter time lags were considered (even though mothers’ reports were used). For example, significant
relations were found between maternal reports of child:adult ratios and caregiver training during the first
3 years and behavioral adjustment and math scores for children who were less than 9 years old. Relations
were not evident for a long time period, i.e., children who were older than 9 years. Smaller group sizes
during the preschool period (3–5 years) were associated with higher scores on math, reading, and
language performance. Lower child:staff ratios were associated with fewer behavior problems. The long
lag between the infant quality reports and the child outcome assessments is further complicated by the
omission of quality reports during the older preschool years, resulting in an underestimation of effects
associated with child care quality.
Conclusions. Structural and caregiver characteristics have been found to be associated with
children’s academic, cognitive, behavioral, and social development. Smaller group sizes, lower child-
caregiver ratios, and more caregiver training and education appear to have positive effects on these
important developmental outcomes. Future work might address threshold levels for these child care
characteristics, or the point at which further improvements in structural quality do not yield additional
developmental benefits for children.
An Economist’s Interpretation of the Link between Child Care Quality and Child Outcomes
The traditional approach of those working in the field of developmental psychology is to use
standardized regression coefficients in hierarchical regression models. These seem quite different from
the methods employed by economists, but the full model used is a standard OLS regression model, and
the standardized coefficients can be converted into the nonnormalized coefficients more traditional in the

49
economics discipline. Doing so allows us to address the question of the expected change in
developmental outcomes of children were quality to be improved based on standard OLS estimates (see
Hanushek and Jackson, 1977).
Using estimates based on NICHD data, we perceive that the quality of child care can indeed make
a difference. Table 7 reports on the cognitive and language results for the NICHD samples at ages 15, 24,
and 36 months (NICHD Early Child Care Research Network, 2000b). The outcome measures used are the
Bayley, CDI vocabulary production, and CDI vocabulary comprehension tests for the younger two ages,
and the Bracken school readiness and Reynell expressive language and Reynell verbal comprehension
tests for the oldest age group (36 months). (See above for a more detailed discussion of these tests.) In
addition to the measures of child care quality, the model includes measures of parental background,
quality of the home, the child care setting, and time spent in child care. These are an attempt to minimize
the role of parental selection of child care in order to capture the effects of child care quality differences
on measures of child development.
Two models are presented for each age group and outcome measure. The first tests for the effects
of the child care quality using a cumulative score of positive caregiving rating, while the second adds a
specific measure of language stimulation. Caregivers’ behaviors were assessed during four 44-minute
observations over two half-days at 6, 15, 24, and 36 months. These were combined into the cumulative
positive caregiving rating.
We converted the standardized coefficients reported in NICHD (2000b) into nonstandardized
coefficients. Table 7 only reports those for child care quality that are statistically significant at the 5
percent level. Combining these with the measures of quality and reinterpreting the standardized
coefficients yielded the following effects.
The expected improvement in the CDI vocabulary production test for toddlers aged 15 months,
when their care quality shifts from one standard deviation below the mean to one standard deviation
above, is nearly 7 points, or 24 percent; if the shift is from the minimum score (5) to the maximum (20) in

TABLE 7Regression Results and Simulated Change in Child Cognition and Language Skills
Simulation: Shift in Quality One Standard Deviation below the Meanto One Standard Deviation above the Mean
Positive Caregiving Rating† Language Stimulation‡ Quality Measure Coefficient Change Coefficient Change
15 months (N=595)Bayley 0.39 — 0.15* 4.79
CDI Vocab Production 1.21* 6.97 0.46* 14.53
CDI Vocab Comprehension 1.44* 8.30 0.32* 9.96
24 months (N=739)Bayley 0.78* 4.47 0.06* 3.91
CDI Vocab Production 0.70 — 0.21 13.28
CDI Sentence Comprehension 1.09 6.28 0.14* 8.37
36 months (N=856)Bracken 0.97* 6.39 0.08 —
Reynell Expressive Language 0.81* 5.30 0.12* 6.36
Reynell Verbal Comprehension 1.31* 8.62 0.06 —
Source: NICHD Early Child Care Research Network (in press-b).
Notes: Equations also include maternal ratings, income-to-need, gender, HOME total score, maternal stimulation,average hours per week in childcare, number times in center care, number times in child care home.
†Reported for model which does not include language stimulation.
‡Reported for model which includes positive caregiving rating.
*Statistically significant at 5% level

51
caregiver rating, the estimated gain is 18 points. (Note that the standard deviation is 2.9, within a range of
5–20.) For the vocabulary comprehension score, shifting from one standard deviation below the mean
leads to an expected increase of 8 points; and moving a child from the minimum score to the maximum
score in caregiver rating is expected to increase a child’s score by 21.6 points, or 55 percent of the mean.
At age 24 months, statistically significant changes are registered for the Bayley test and the sentence
comprehension test. The Bayley estimates produce an expected increase of about 4.5 points when the shift
is from one standard deviation below the mean to one above. The sentence comprehension results
produce an expected increase of 6.3 points. A shift from the lowest caregiver to the highest increases
expected performance on the vocabulary test by about 40 percent relative to the mean, but only about 13
percent in the case of the Bayley test. (Note that for the 24-month-olds the standard deviation is 2.9 as
well, and the range is the same as that for those 15 months old, 5–20.) The expected changes are larger for
those aged 36 months than for those aged 24 months.
For the Bracken school readiness test at age 36 months, a shift from one standard deviation below
the mean on the caregiving rating to one above is expected to lead to an increase of 6.4 points. (Note that
the caregiver rating has a larger range for those aged 36 months, 7–28, while the standard deviation is
3.3.) The same shift in caregiver quality is expected to lead to a 5.3-point increase in the expressive
language score and an 8.6-point increase in the verbal comprehension score, relative to the mean. A shift
from the lowest rating to the highest for caregiver rating is expected to result in a shift of about 50 percent
relative to the mean for each of these three outcomes. These estimates give us some sense of the
magnitude of the possible changes in children’s outcomes as a result of improvements in positive
caregiver rating.
We can do a similar exercise with the second measure of quality, language stimulation. This
measure is added to the regression in an alternative specification. In most cases the addition of this
measure reduces the estimated impact of positive caregiving. (Because language stimulation is a major
component of caregiving quality, this is not surprising.) We simulate the impact of language stimulation

52
only for ages 15 months and 24 months, where it is statistically significant for all three of the child
development outcome measures.
For children 15 and 24 months old, having a child care arrangement in which more language
stimulation is provided can play a small but significant role in improving all three of the outcome
measures. For children 15 months old, simulating an improvement in caregiver language stimulation from
one standard deviation below the mean to one above increases performance on the Bayley test by nearly 5
points, by 14.5 points on the CDI vocabulary production test, and by about 10 points on the CDI sentence
comprehension test. At age 24 months, a child exposed to a level of language stimulation one standard
deviation below the average is expected to gain about 4 points on the Bayley test, or about 4 percent
relative to the mean, were that child moved to an arrangement with a rating one standard deviation above
the norm, or by 61 units (about one-third of the full range of 0–180). The same child would be expected
to gain over 13 points on the CDI vocabulary production test and 8.4 points on the CDI sentence
comprehension test.
The NICHD group also estimated models with both concurrent and lagged quality measures
(NICHD, 2000b). Their results suggest that the cumulative impact of child care quality may be far greater
than the concurrent impact. In Table 8 we provide two examples, one for children aged 24 months using
caregiver quality measures at 6–15 and 24 months, and one for children aged 36 months using quality
measures from 15–24 months and 36 months. Only those quality measures which are statistically
significant at the 5 percent level are reported. Similar measures for language stimulation are chosen as the
cognitive outcome measure. Both sets of results suggest that there is a lagged effect of language
stimulation and that the cumulative effect of exposure to higher levels of language stimulation appears to
be greater than the concurrent impact alone. In the case of those aged 24 months, the converted results
suggest that a child who was in a child care arrangement over this entire period that was one standard
deviation below the mean (calculated at both 15 and 24 months) is simulated to gain about 26 points on a
CDI vocabulary production test if moved to one standard deviation above the mean. Looking at only the

TABLE 8Regression Results for Period and Cumulative Effects at 24 and 36 Months
Standard Coefficient Same Coefficients Impact- Impact-Mean Deviation Period Only Cumulative 1SD to +1 SD 1SD to +1 SD
CDI Vocabulary Production†24 mo.: language stimulation 58.62 30.92 0.336 0.27 20.78 16.7415 mo.: language stimulation 26.51 15.79 0.29 9.2424 mo.: positive caregiver rating 13.96 2.876–15 mo.: positive caregiver rating 14.63 2.89Total 20.78 25.97
Reynell Vocabulary Comprehension‡36 mo: language stimulation 50.56 27.09 -0.116 -5.9615–24 mo.: language stimulation 58.62 30.92 0.195 12.0736 mo.: positive caregiver rating 19.5 3.29 0.786 0.787 5.17 5.1815–24 mo.: positive caregiver rating 13.96 2.87Total 5.18 11.28
Source: NICHD, 1999b.
Note: Only variables that are statistically significant at the 5% level are reported.
† Mean = 46
‡ Mean = 48
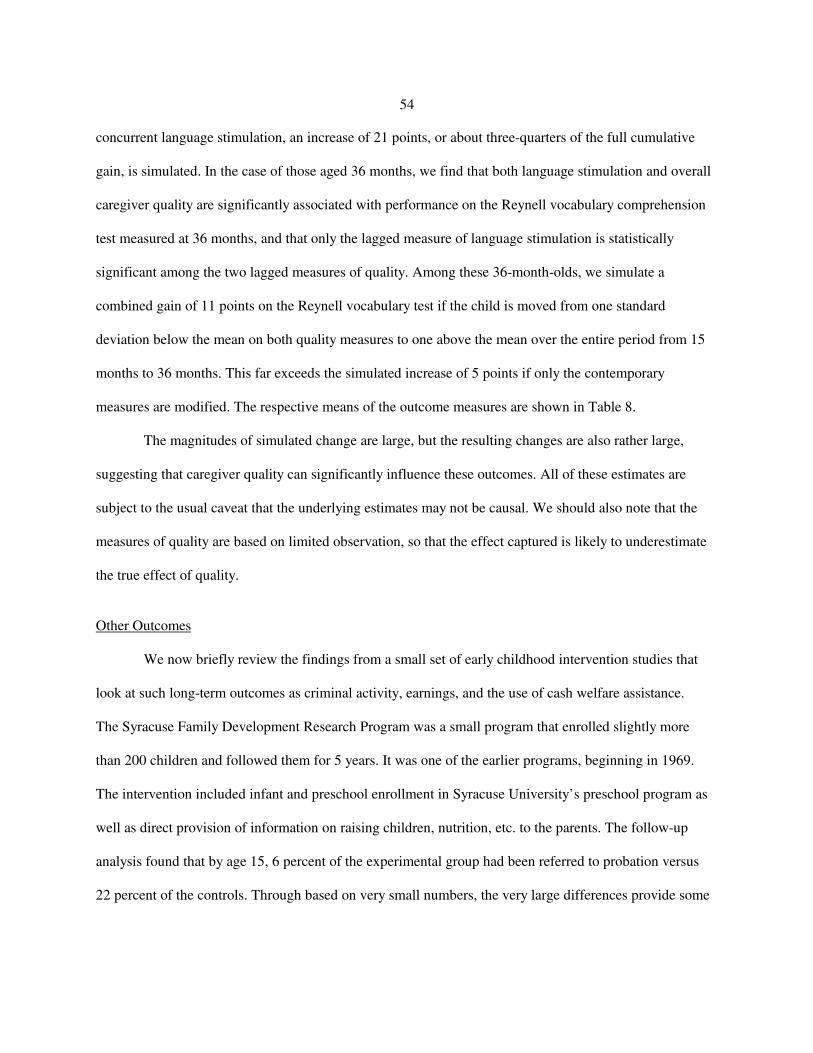
54
concurrent language stimulation, an increase of 21 points, or about three-quarters of the full cumulative
gain, is simulated. In the case of those aged 36 months, we find that both language stimulation and overall
caregiver quality are significantly associated with performance on the Reynell vocabulary comprehension
test measured at 36 months, and that only the lagged measure of language stimulation is statistically
significant among the two lagged measures of quality. Among these 36-month-olds, we simulate a
combined gain of 11 points on the Reynell vocabulary test if the child is moved from one standard
deviation below the mean on both quality measures to one above the mean over the entire period from 15
months to 36 months. This far exceeds the simulated increase of 5 points if only the contemporary
measures are modified. The respective means of the outcome measures are shown in Table 8.
The magnitudes of simulated change are large, but the resulting changes are also rather large,
suggesting that caregiver quality can significantly influence these outcomes. All of these estimates are
subject to the usual caveat that the underlying estimates may not be causal. We should also note that the
measures of quality are based on limited observation, so that the effect captured is likely to underestimate
the true effect of quality.
Other Outcomes
We now briefly review the findings from a small set of early childhood intervention studies that
look at such long-term outcomes as criminal activity, earnings, and the use of cash welfare assistance.
The Syracuse Family Development Research Program was a small program that enrolled slightly more
than 200 children and followed them for 5 years. It was one of the earlier programs, beginning in 1969.
The intervention included infant and preschool enrollment in Syracuse University’s preschool program as
well as direct provision of information on raising children, nutrition, etc. to the parents. The follow-up
analysis found that by age 15, 6 percent of the experimental group had been referred to probation versus
22 percent of the controls. Through based on very small numbers, the very large differences provide some

55
evidence that the combined interventions had a positive effect on the reduction of crime (Lally et al.,
1988).
Perhaps the best-known early intervention project is the Carolina Abecedarian Project (Campbell
and Ramey, 1995; Ramey, Campbell, and Blair, 1998; Ramey et al., 2000). This clinical trial began at 6
weeks postpartum and included (1) a randomized control group (n = 23) that received family support
social services, pediatric care, and child nutritional supplements, (2) an experimental group (n = 25) that
received the services of a high-quality, center-based intervention for the first 5 years and additional
educational support services from kindergarten to grade two, (3) an experimental group (n = 24) that
received only the early intervention, and (4) an experimental group (n = 24) that received only the K–2
educational support. IQ scores at 8 years and 12 years were significantly higher for preschool participants
than for other children. Furthermore, children who had participated in the preschool program had higher
scores on tests of reading and mathematics achievement at 8 and 12 years. They were less likely to be
retained a grade at ages 8, 12, and 15, and they were also less likely to be placed in special education. The
most recent follow-up report from this research team (Early Learning, Later Success: the Abecedarian
Study, 1999) included findings to 21 years. Intervention children were reported to be older, on average,
when their first child was born and to have been more likely to attend a four-year college.
The Perry Preschool Project (Schweinhart et al., 1993) involving 123 black children has reported
long-term follow-up to 27 years. The experimental group consisted of 45 children who entered the
preschool program at age 3 and an additional 13 who entered at age 4, attending a half-day center-based
program and receiving teacher home visits. The researchers report that the experimental group had a
somewhat lower probability of ever being arrested by age 27 (57 versus 69 percent), but a larger
difference in the average number of lifetime arrests by age 27 (2.3 versus 4.6). Differences in the
proportion receiving public assistance by age 27 were also large: 15 versus 32 percent. Mean earnings
were far higher for the experimental group than for the control group at age 27: monthly reported mean
earnings were $1,219 for experimentals, $766 for controls.

56
Participation in the Chicago Child-Parent Centers (CPC) also has been related to long-term
beneficial effects (Reynolds et al., 2000). This project has followed the educational and social
development of 1,539 African-American (93 percent) and Hispanic (7 percent) children as they grew up
in high-poverty neighborhoods in central-city Chicago. Some of the children (n = 989) participated in
government-funded (Title I) early childhood programs in 1985–1986, whereas others did not (n = 550). A
rich array of data, including surveys from teachers, parents, school administrative records, standardized
tests, and the children themselves, have been collected since that time. Children who participated in the
CPC preschool programs obtained significantly higher math and reading achievement test scores at 5, 8,
and 14 years, even after controlling for family risk status, child gender, and later program participation.
At age 20, participants in the CPC were more likely to have completed high school and to have low rates
of juvenile crime.
Even though only a few studies have followed children into adulthood, it is notable that all find
some evidence of long-term gains.
Does Child Care Quality Affect Maternal Employment?
In much of the existing literature linking parental employment and child care, the primary issue is
the affordability of care and the elasticity of response to child care costs. In this sense one can see the
potential for a trade-off between quality of care and labor force participation, in that higher-quality care is
likely to be more costly. A parent facing that higher cost may decide to forgo or limit employment or to
elect lower-quality and less costly care (Scarr, 1998). Maume (1991) found that a $10 increase in the
weekly cost of child care was associated with a 1.6 percent increase in the probability of exiting
employment within a year. A slightly earlier study by Blau and Philip (1989) also provided evidence that
an increase in the cost of care was associated with an increased probability of a mother leaving the labor
force.

57
Quality of care may influence employment in several ways. Parents may be reluctant to leave
their children in a low-quality, unsafe environment or with adults who do not provide a stimulating or
warm environment. This may be a particular problem for lower-income families, who have more limited
choices of providers. In contrast, a safe, warm, stimulating environment may encourage employment and
longer hours of work. Parents may also be more effective employees if they do not have concerns about
the environment in which their children spend a good part of each working day. Having well-cared-for
children may also lead to employees with higher productivity than those whose children are left in less
satisfactory environments. Parents may also be more likely to be on time to work and less likely to miss
time from work if their children are cared for in a safe, warm, and stimulating environment.
Evidence. There is limited evidence on whether higher-quality care has positive impacts on
parental employment, because there have been few studies. The available evidence suggests that among
low-income women, higher-quality child care may increase employment, stability of employment, and
hours of work. See Table 9 for detail on these studies.
Meyers (1993) has explored how a mother’s perception of the quality of her child’s care and the
convenience of the child care arrangement affected her labor market progress in the JOBS program. The
results show that a mother’s perception of the safety of her child’s care arrangement and the
trustworthiness of the provider were significant predictors of the mother’s continued participation in the
JOBS program and in labor force participation more generally. Mothers also responded to the ratio of
children to staff. Those mothers who reported that the ratio of children to adults in their care arrangement
exceeded professionally recommended standards were more than twice as likely to drop out of the
program than mothers who reported that their child’s care arrangement met the standard.
Additional evidence that quality plays a role in women’s labor force participation comes from
another experiment, the Teenage Parent Demonstration. As reported in Ross and Paulsell (1998), among
the group of first-time teenage welfare recipients whose members were randomly assigned to the
program—which required employment, job training, or schooling—nearly a third reported that the quality

TABLE 9Studies of Child Care and Parental Employment
CITATIONSTUDYDESIGN
ISSUEADDRESSED N AGE
QUALITYMEASURE
POSSIBLECONTROL FINDINGS
Does Employment Matter?
Blau and Robins(1988)
1980EmploymentOpportunityPilot Project(EOPP)
Mother does notwork versus fourcombination ofmother workingwith purchasedcare or not, otherrelatives workingor not.
Married andsinglemothers.
< 7 Average childcareexpendituresamongfamilies in thecommunitywhopurchasedcare.
The studyaverages childcareexpendituresacross familieswithin a givengeographicallocation.
Uses multinomial logit estimationprocedure.-0.38 (average price elasticity ofemployment over a range of examinedchild care costs) Significance cannot bedetermined from available information.
Blau and Robins(1989)
EmploymentOpportunityPilot Projects(EOPP)
An examinationof employment,child care costs,births rates, andpotentialbehavior effectsof child caresubsidies.
6170employedwomen and8940unemployedwomen
Empiricalanalysisbased onhazardfunctions fortransitionsamongvariousfertility-employmentstates.
Child care costs,wage rates,education, workexperience, age.
Child care costs are estimated to havesignificant effects on both birth andemployment transition. Higher child-carecosts are estimated to lower birth rates forunemployed women, but not for employedwomen. Higher child-care costs alsoincrease the rate of leaving employmentand reduce the rate of enteringemployment.
Brooks-Gunn, McCormick, Shapiro,et al. (1994)
Infant HealthandDevelopmentProgram
Employment ofmothers.
Mothers oflow-weightprematureinfantsofferedhome visits.
Randomassignmentintervention.
The provision of high-quality center-basedcare to low-income mothers of very youngchildren can increase employment rates andimprove the stability of employment overtime. Cumulative months of employmentfor less-educated black mothers were 14.2for the intervention group and 12.0 for thecontrol group.
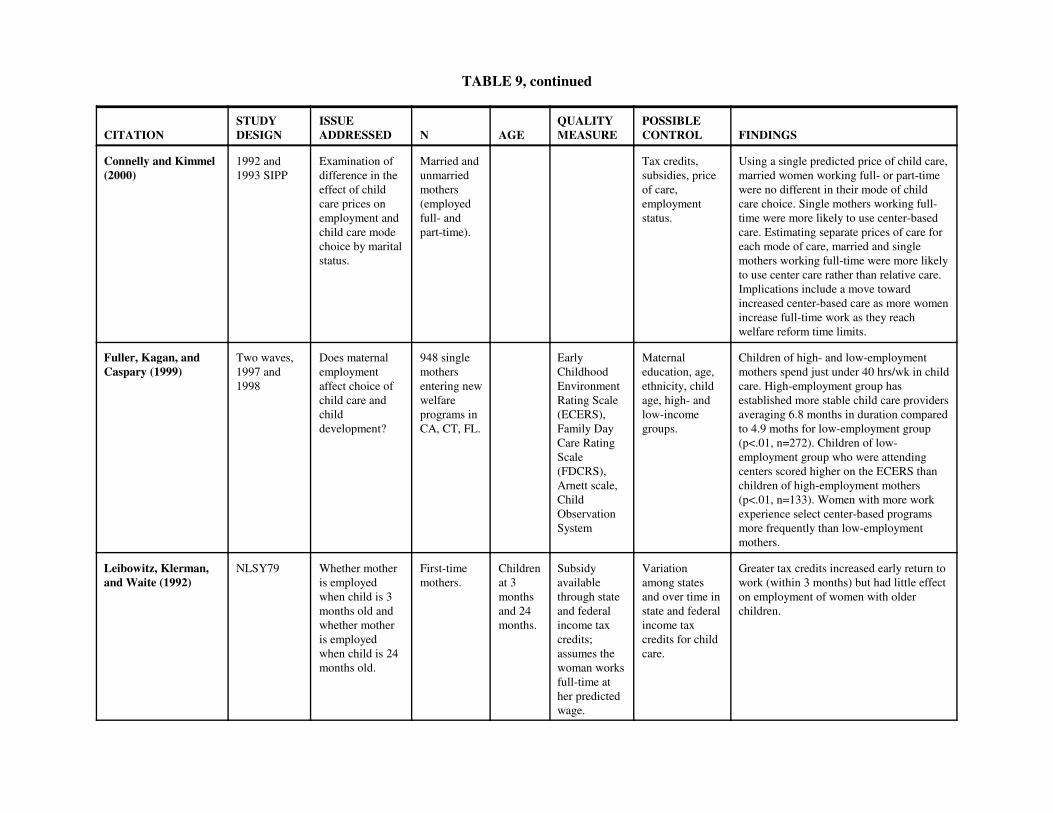
TABLE 9, continued
CITATIONSTUDYDESIGN
ISSUEADDRESSED N AGE
QUALITYMEASURE
POSSIBLECONTROL FINDINGS
Connelly and Kimmel(2000)
1992 and1993 SIPP
Examination ofdifference in theeffect of childcare prices onemployment andchild care modechoice by maritalstatus.
Married andunmarriedmothers(employedfull- andpart-time).
Tax credits,subsidies, priceof care,employmentstatus.
Using a single predicted price of child care,married women working full- or part-timewere no different in their mode of childcare choice. Single mothers working full-time were more likely to use center-basedcare. Estimating separate prices of care foreach mode of care, married and singlemothers working full-time were more likelyto use center care rather than relative care.Implications include a move towardincreased center-based care as more womenincrease full-time work as they reachwelfare reform time limits.
Fuller, Kagan, andCaspary (1999)
Two waves,1997 and1998
Does maternalemploymentaffect choice ofchild care andchilddevelopment?
948 singlemothersentering newwelfareprograms inCA, CT, FL.
EarlyChildhoodEnvironmentRating Scale(ECERS),Family DayCare RatingScale(FDCRS),Arnett scale,ChildObservationSystem
Maternaleducation, age,ethnicity, childage, high- andlow-incomegroups.
Children of high- and low-employmentmothers spend just under 40 hrs/wk in childcare. High-employment group hasestablished more stable child care providersaveraging 6.8 months in duration comparedto 4.9 moths for low-employment group(p<.01, n=272). Children of low-employment group who were attendingcenters scored higher on the ECERS thanchildren of high-employment mothers(p<.01, n=133). Women with more workexperience select center-based programsmore frequently than low-employmentmothers.
Leibowitz, Klerman,and Waite (1992)
NLSY79 Whether motheris employedwhen child is 3months old andwhether motheris employedwhen child is 24months old.
First-timemothers.
Childrenat 3monthsand 24months.
Subsidyavailablethrough stateand federalincome taxcredits;assumes thewoman worksfull-time ather predictedwage.
Variationamong statesand over time instate and federalincome taxcredits for childcare.
Greater tax credits increased early return towork (within 3 months) but had little effecton employment of women with olderchildren.
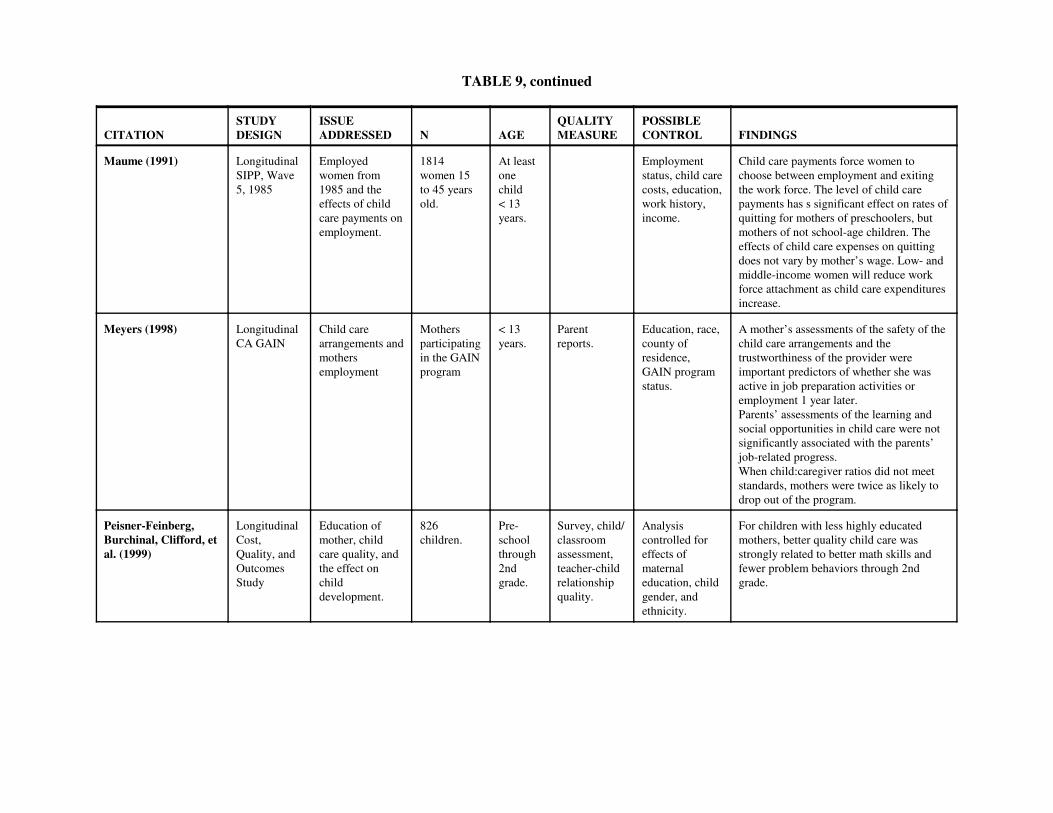
TABLE 9, continued
CITATIONSTUDYDESIGN
ISSUEADDRESSED N AGE
QUALITYMEASURE
POSSIBLECONTROL FINDINGS
Maume (1991) LongitudinalSIPP, Wave5, 1985
Employedwomen from1985 and theeffects of childcare payments onemployment.
1814women 15to 45 yearsold.
At leastonechild < 13years.
Employmentstatus, child carecosts, education,work history,income.
Child care payments force women tochoose between employment and exitingthe work force. The level of child carepayments has s significant effect on rates ofquitting for mothers of preschoolers, butmothers of not school-age children. Theeffects of child care expenses on quittingdoes not vary by mother’s wage. Low- andmiddle-income women will reduce workforce attachment as child care expendituresincrease.
Meyers (1998) LongitudinalCA GAIN
Child carearrangements andmothersemployment
Mothersparticipatingin the GAINprogram
< 13years.
Parentreports.
Education, race,county ofresidence,GAIN programstatus.
A mother’s assessments of the safety of thechild care arrangements and thetrustworthiness of the provider wereimportant predictors of whether she wasactive in job preparation activities oremployment 1 year later.Parents’ assessments of the learning andsocial opportunities in child care were notsignificantly associated with the parents’job-related progress.When child:caregiver ratios did not meetstandards, mothers were twice as likely todrop out of the program.
Peisner-Feinberg,Burchinal, Clifford, etal. (1999)
LongitudinalCost,Quality, andOutcomesStudy
Education ofmother, childcare quality, andthe effect onchilddevelopment.
826children.
Pre-schoolthrough2ndgrade.
Survey, child/classroomassessment,teacher-childrelationshipquality.
Analysiscontrolled foreffects ofmaternaleducation, childgender, andethnicity.
For children with less highly educatedmothers, better quality child care wasstrongly related to better math skills andfewer problem behaviors through 2ndgrade.

TABLE 9, continued
CITATIONSTUDYDESIGN
ISSUEADDRESSED N AGE
QUALITYMEASURE
POSSIBLECONTROL FINDINGS
U.S. GeneralAccounting Office(1994)
UrbanInstitute’s1990NationalChild CareSurvey andLow-IncomeSubstudy
Role of childcare costs in thelikelihood thatlow-incomemothers willwork.
NCCS -4392householdswithchildren.
LIS - 430households.Poor, nearpoor,nonpoormothers.
Developedempiricalmodel usingavailable datato estimatethe impact ofchild careexpenditureson a mother’sdecision towork.Measures ofpredictedwages andchild careexpenditures.
Calculating the elasticity of the probabilityof working due to a change in child careexpenditures provides a measure of thesensitivity of mothers’ decision to work tochild care expenditures. This priceelasticity of employment is -0.5 for poormothers, -0.34 for near-poor mothers, and -0.19 for nonpoor mothers (calculated atmeans). A 1 percent decrease in child careexpenditures results in a 0.50 percentincrease in the average probability ofworking for poor mothers.

TABLE 9, continued
CITATIONSTUDYDESIGN
ISSUEADDRESSED N AGE
QUALITYMEASURE
POSSIBLECONTROL FINDINGS
Does Income Matter?
Hofferth andWissoker (1992)
LongitudinalNLSY
Income andchoice of care.
971 motherswho usedsome formofnonmaternalcare as theprimaryarrangement.
< 6 years. Multinomiallogit (ML)anduniversal logit(UL) models.
Mothers who earn more per hour andfamilies who have higher incomes (otherthan mother’s earning) are more likely toselect center care over other mode.Reducing fees by 10% increases the use ofcenter-based programs by 39% (ML) and27% (UL). Reducing the price by 25%increases the use of center-based programsby 114% (ML) and 77% (UL). Increasingtax credits increases the use of center-basedprograms (all else equal).
Hofferth (1999) Longitudinal Low-incomefamilies andchoice of care.
< 6 years(subgroups <2 and 3–5years).
Type of care. Higher proportions of children of middle-income families use center care (38% of allchildren). Significant differences in centercare use between working poor (22%) andnonworking poor (35%)
Kontos et al.. (1995) Concurrent Income andchoice of care.
Child caresetting.
Mothers with a family income greater than$40,000 were the most likely to selectregulated family day care, and motherswith a family income of less than $20,000were the most likely to select relative care.

TABLE 9, continued
CITATIONSTUDYDESIGN
ISSUEADDRESSED N AGE
QUALITYMEASURE
POSSIBLECONTROL FINDINGS
NICHD Early ChildCare ResearchNetwork (1997a)
Longitudinal(NICHD )
Familyeconomic andpsychosocialfactors relatedto age ofinitiation,amount, type,and quality ofchild care.
1281children.
6 months, 15 months
Quality of caremeasured byHomeObservation forMeasurement oftheEnvironment(HOME)Inventory;positivecaregivingfrequency;positivecaregivingrating.
Ethnicity,sex, childrenin family,mother’seducation,income -to-need ratio
In some homelike settings, mother’seducation predicted some day care qualitymeasure, but income differences accountedfor the effects of education. In both in-home care and child care homes,children living in poverty received carethat scored significantly lower on mostquality measures than children withincomes above poverty. The pattern incenters showed a curvilinear relationbetween income and quality, with childrenfrom poor families receiving care thatscored higher than that received by childrenfrom near-poor families. Families living in poverty (income-to-needratio 1.0) were less likely to use centercare. Children in near poverty (income-to-need ratio 1.00–1.99) received lowerquality of center care than children inpoverty.Family economics accounted for theamount, the age of entry into care, and thetype and quality of care infants received.

TABLE 9, continued
CITATIONSTUDYDESIGN
ISSUEADDRESSED N AGE
QUALITYMEASURE
POSSIBLECONTROL FINDINGS
NICHD Early ChildCare ResearchNetwork (1997b)
Longitudinal(NICHD)
Entry into care,quantity ofcare, type ofcare, quality ofcare.
1281children.
< 15 months. ObservationalRecord ofCaregivingEnvironment(ORCE), HomeInventory,AssessmentProfile for EarlyChildhoodPrograms.
Families using in-home care had thehighest levels for maternal andnonmaternal income. The meannonmaternal income was $20,000 higherthan the means for families using any othertype of care. Family income was a significant predictorof both the age at which infants enteredcare and the number of hours per weekspent in care. Five groups were comparedbased on age of entry into nonmaternal care(0–2 months, 3–5 months, 6–11 months,12–15 months, not in care at 15 months).Families of infants who entered carebetween 3 and 5 months had the highestincomes. Maternal income was greatest inthis group. Infants who entered carebetween 0 and 2 months had families withlow nonmaternal incomes and were moredependent on maternal incomes. Familieswhose infants were not in care at 15months had relatively high nonmaternalincomes.
Phllips (1995) LongitudinalNICHDStudy, 1995
Low-incomefamilies andchoice of care.
1364mothers.
Datacollection atages 6, 15,24, 36, and42 monthsand at 7 yearbirthday
ECERS. Higher levels of nonmaternal incomeappear to be necessary for low-incomefamilies to purchase higher-quality care.

TABLE 9, continued
CITATIONSTUDYDESIGN
ISSUEADDRESSED N AGE
QUALITYMEASURE
POSSIBLECONTROL FINDINGS
Phllips (1995) LongitudinalNationalChild CareSurvey,1990
Low-incomefamilies andchoice of care.
4400householdswithincomes< $15,000.
children <13 years
Type of childcare setting.
48% low-income children cared for byparent. Use of nonparental care variedgreatly by household type and employmentstatus of mother. Care by a relative for low-income preschoolers with single mother(26%), employed mothers (28%), andmothers in education and training programs(23%). Children under 5 in families headedby employed single mothers rely heavilyon family day care (21%) and center-basedcare (27%).
Phllips (1995) LongitudinalNationalLow IncomeSubstudy ofthe ChildCare Survey,1993
Low-incomechildren andcontinuity ofcare.
430householdswithincomes< $15,000.
Preschool Stability(number ofarrangements).
24% of low-income children < 5 and 45%of low-income preschoolers in familiesheaded by an employed single mother werein more than one arrangement on a regularbasis.
Pugnello and Kurtz(1999)
LongitudinalNLSY,NICHD
Choice of caredetermined byvariousdemographiccharacteristicsof mother.
< 6 years. Theoreticalmodel includescharacteristicsof mother andchild,environmentalcontextvariables, andmaternal beliefsas processvariables.
Higher income, measured both as totalhousehold income and as mother’s hourlywage, are associated with a higherprobability of choosing center care oversitter, father, or relative care.
U.S. Department ofLabor, Bureau ofLabor Statistics(1992)
Longitudinal(NLSY)
Child carearrangementsbycharacteristicsof mother suchas income andeducation.
Women withyoungestchild < 5years.
Percentage ofchildren inrelative,nonrelative, andcenter car.
Mothers with earnings <$10,000 willprimarily use relative care (47.3%).Mothers with earnings >$30,000 usenonrelative care 46.8%.Families with total income <$10,000 use relative care 65.0%.Families with total income >$30,000 usenonrelative care 31.6%.

66
of child care was a problem that led them to stop working or to change hours and/or activities. Ross and
Paulsell interpret this to mean that “Mothers who are required to work as a condition of receiving welfare
benefits may try to manage with lower-quality child care than they would in the absence of such a
requirement, but this low-quality care may be the reason that mothers interrupt their employment
activities” (p. 40).
Brooks-Gunn et al. (1994) evaluated an early intervention program, the Infant Health and
Development Program, in terms of its impact on mothers’ employment. This experiment focused on low-
birthweight infants and used random assignment to an intervention program that provided center-based
child care when the child was 2 to 3 years old. The authors report that mothers in the intervention group
were significantly more likely to be working than women in the control group. Effects were particularly
pronounced for mothers with a high school degree or less schooling. Similar beneficial effects of high-
quality child care on mothers’ subsequent educational achievement were evident in the high-risk sample
that participated in the Abecedarian clinical trials (Ramey et al., 2000). Benasich, Brooks-Gunn, and
Clewell (1992) report qualitatively similar results for several other early intervention programs (pp.
41–42).
Other evidence (see Hofferth, 1999) that child care quality can influence labor market
participation can be found in research studies that differentiate formal from informal arrangements. These
analyses show that parents miss work more often and are late more often if they use informal
arrangements. The big difference seems to be the stability of the arrangement—an element of quality.
WHAT IS THE QUALITY OF CARE IN THE UNITED STATES?
The evidence reviewed above indicates that child care quality has meaningful effects on children
and their parents. Our next question considers the quality of the care available in the United States. One
part of this question is a determination of whether high-quality care (of the sort that fosters positive
67
developmental outcomes) is the norm or the exception. The flip side of this question is a determination of
the likelihood that children are in poor-quality care that can impair development. Unfortunately, at the
current time it is not possible to provide a definitive response to these questions because observations of
process quality have not been conducted for a nationally representative sample of children. In the absence
of such a report, we must reply on existing data from multisite studies that provide suggestions about the
distribution of quality of care in the United States.
The Cost, Quality, and Outcomes Study (Helburn et al., 1995) provides a perspective on center-
based care. ECERS assessments were conducted in 398 centers located in four states that varied in
economic health and child care regulations. In that study, 12 percent of the centers received ECERS
scores lower than 3, indicating care that was less than minimal quality, and 15 percent received ECERS
scores higher than 5, indicating good-quality care. The remainder of the centers were evenly divided
between those receiving scores in the 3s (37 percent) and in the 4s (37 percent). This distribution of
quality scores in the observed settings, however, may be an optimistic view. The observed centers
represented only 52 percent of the eligible centers; the remainder declined to participate. It seems likely
that the nonobserved settings offered care of lower quality.
The Relative and Family Day Care Study (Kontos et al., 1995) provides a perspective on quality
of care in homes. FDCRS scores were obtained in 226 child care homes and relative care settings in three
communities. Minority race, low-income, and nonregulated home settings were oversampled so that the
investigators could study the effects of these factors on observed quality. In the study, 34 percent of the
child care homes received FDCRS scores of less than 3 and were described as “inadequate,” 58 percent
were “adequate/custodial,” and 8 percent were “good.” These unadjusted quality estimates are probably
negatively biased, because two of the three states (Texas and North Carolina) have less stringent
regulations for child care homes than other states and because nonregulated and low-income settings were
oversampled.

68
Perhaps the best available estimate of process quality for children 3 years old or younger is
provided by the NICHD Study of Early Child Care. Observations were conducted in nine states
(Arkansas, California, Kansas, Massachusetts, North Carolina, Pennsylvania, Virginia, Washington, and
Wisconsin) and included urban, suburban, and rural communities. The distribution of child care
regulations in those states mirrored those in the United States. Observations were conducted in all types
of nonmaternal care settings, including grandparents, in-home caregivers, child care homes, and centers.
A total of 612 child care settings were assessed at 15 months, 630 child care settings at 24 months, and
674 child care settings at 36 months.
The study sample of 1,364 families was drawn from hospitals at the ten research sites and
included ethnic minorities (24 percent), mothers without a high school education (10 percent), and single-
parent households (14 percent) as well as white, middle-class, and two-parent households. At 15 months,
17 percent of the households had incomes below established poverty levels (income-to-needs ratio < 1.0).
An additional 18 percent of the sample had incomes near poverty (income-to-needs ratio 1.0 –1.99)
(NICHD Early Child Care Research Network, 1997). The sampling plan yielded a large and diverse
sample, but it is not nationally representative. The sampling plan also did not include adolescent mothers
(3.8 percent of the potential families in the hospitals), mothers who did not speak English (4.4 percent),
and infants of multiple births, with obvious disabilities, or extended hospital stays postpartum (7.7
percent of the births).
Results from the NICHD Study of Early Child Care observations (NICHD Early Child Care
Research Network, 2000a) are summarized in Table 10. ORCE ratings less than 2 indicate poor-quality
care. Scores of 2 to less than 3 indicate fair-quality care. Scores equal to 3 but less than 3.5 indicate good-
quality care, and scores of 3.5 or higher indicate excellent-quality care. Quality of care was most often
judged to be only fair. Relatively little care was observed at the extremes, with 6 percent of the settings
offering poor-quality care and 11 percent of the settings offering excellent care. Poor-quality care was

TABLE 10Ratings of Process Quality by Type of Care and Child Care: NICHD Study of Early Child Care
Distributions of Positive Caregiving Scores(percentages)
Poor Fair Good Excellent
15 MonthsChild care homes 7.0 43.5 33.5 16.0Centers 10.2 61.7 23.4 4.7All types 7.7 43.2 34.2 14.9Extrapolated U.S. care (nonparental) 9.0 44.4 34.9 11.7
24 MonthsChild care homes 8.5 50.2 27.5 13.7Centers 11.4 66.3 18.5 3.8All types 9.7 51.7 27.4 10.2Extrapolated U.S. care (nonparental) 10.9 52.3 28.3 8.5
36 MonthsChild care homes 2.4 63.1 29.2 5.4Centers 4.4 61.9 30.3 3.4All types 3.9 59.5 31.5 5.1Extrapolated U.S. care (nonparental) 4.3 60.6 30.2 5.0
15–36 Months (mean)All types imputed 7.2 52.7 30.6 9.5Extrapolated to U.S. 8.1 53.2 29.6 9.0
70
1The NHES survey included an early childhood program participation component in its 1995 survey.Parents of 14,000 children from birth through third grade were asked about their use of a wide variety of childcareand early education arrangements. http://nces.ed.gov/nhes/
more likely in centers serving infants and toddlers than in centers serving older children (10 percent
versus 4 percent).
An extrapolation to the quality of care in the United States was derived by applying NICHD
observational parameters, stratified by maternal education, child age, and care type to the distribution of
American families documented in the National Household Education Survey (1998).1 This stratification
was needed because the NICHD investigators determined that variations in process quality were
associated with these three factors. Based on the numbers of children of particular ages using specific
different types of care, positive caregiving was estimated to be of poor quality for 8 percent of children
under 3 years in the United States, fair quality for 53 percent, good quality for 30 percent, and excellent
quality for 9 percent. These distributions suggested to the investigators that care is “neither outstanding
nor terrible, but plenty of room for improvement [remains].”
The quality of child care in the United States also can be estimated based on reports of structural
and caregiver characteristics. Drawing on empirical research and advice from professionals in the field,
organizations such as the American Public Health Association and the American Academy of Pediatrics
(1992a) have established age-based guidelines for group size and child:adult ratio. For example, the
recommendations for child:adult ratios are 3:1 for children from birth to 24 months, 4:1 for children from
25 to 30 months, 5:1 for children from 31 to 35 months, 7:1 for 3-year-olds, and 8:1 for 4-year-olds.
Table 11 lists regulations for child:adult ratio and group size for each of the 50 states as compiled
by the Center for Career Development in Early Care and Education (1999). It is clear that very few states
have regulations as strict as those recommended by professional organizations. For example, only three
states have the recommended 3:1 ratio for infants, and only one state has the recommended 3:1 ratio for
18-month-olds. Two states have the recommended 5:1 ratio for 3-year-olds. Some states are at substantial

TABLE 11Requirements for Child: Staff Ratio and Group Size by State
Age of Children
9 months 18 months 3 years 4 yearsAlabama 6:1
68:18
12:112
20:120
Alaska 5:1NR
6:1NR
10:1NR
10:1NR
Arizona 5:1/11:2NR
6:1/13.2NR
13:1NR
15:1NR
Arkansas 6:1NR
9:1NR
12:1NR
15:1NR
California 4:1NR
6:112
12:1NR
12:1NR
Colorado 5:110
5:110
10:120
12:124
Connecticut 4:18
4:18
10:120
10:120
Delaware 4:1NR
7:1NR
12:1NR
15:1NR
District of Columbia 4:18
4:18
8:116
10:120
Florida 4:1NR
6:1NR
15:1NR
20:1NR
Georgia 6:112
8:116
15:130
18:136
Hawaii 4:1*8
6:1*12
12:1NR
16:1NR
Idaho 6:1NR
6:1NR
12:1NR
12:1NR
Illinois 4:112
5:115
10:120
10:120
Indiana 4:18
5:110
10:1NR
12:1NR
Iowa 4:1NR
4:1NR
8:1NR
12:1NR
Kansas 3:19
5:110
12:1*24
12:1*24
Kentucky 5:110
6:112
12:124
14:128

TABLE 11, continued
Age of Children
9 months 18 months 3 years 4 yearsLouisiana 6:1
NR8:1NR
14:1NR
16:1NR
Maine 4:112
5:115
10:130
10:130
Maryland 3:1*6
3:1*9
10:120
10:120
Massachusetts 3:1/7:27
4:1/9:29
10:1*20
10:1*30
Michigan 4:1NR
4:1NR
10:1NR
12:1NR
Minnesota 4:18
7:114
10:120
10:120
Mississippi 5:110
9:110
14:114
16:120
Missouri 4:18
4:18
10:1NR
10:1NR
Montana 4:1NR
4:1NR
8:1NR
10:1NR
Nebraska 4:1NR
6:1NR
10:1NR
12:1NR
Nevada 6:1NR
8:1NR
13:1*NR
13:1*NR
New Hampshire 4:112
5:115
8:124
12:124
New Jersey 4:120
7:120
10:120
15:120
New Mexico 6:1NR
6:1NR
12:1NR
12:1NR
New York 4:18
5:1*10
7:1*14
8:1*16
New York City 4:18
5:110
7.5:115
12:120
North Carolina 5:110
6:112
15:125
20:125
North Dakota 4:1NR
4:1NR
7:1NR
10:1NR
Ohio 5:112
7:114
12:124
12:128
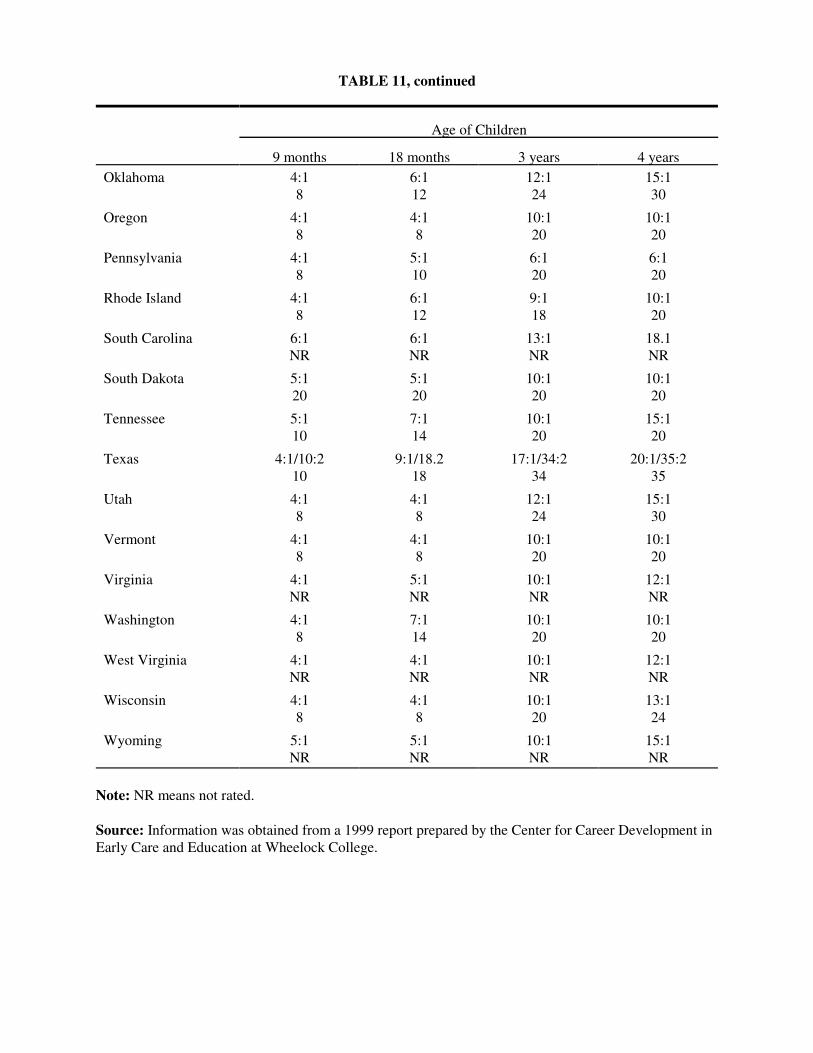
TABLE 11, continued
Age of Children
9 months 18 months 3 years 4 yearsOklahoma 4:1
86:112
12:124
15:130
Oregon 4:18
4:18
10:120
10:120
Pennsylvania 4:18
5:110
6:120
6:120
Rhode Island 4:18
6:112
9:118
10:120
South Carolina 6:1NR
6:1NR
13:1NR
18.1NR
South Dakota 5:120
5:120
10:120
10:120
Tennessee 5:110
7:114
10:120
15:120
Texas 4:1/10:210
9:1/18.218
17:1/34:234
20:1/35:235
Utah 4:18
4:18
12:124
15:130
Vermont 4:18
4:18
10:120
10:120
Virginia 4:1NR
5:1NR
10:1NR
12:1NR
Washington 4:18
7:114
10:120
10:120
West Virginia 4:1NR
4:1NR
10:1NR
12:1NR
Wisconsin 4:18
4:18
10:120
13:124
Wyoming 5:1NR
5:1NR
10:1NR
15:1NR
Note: NR means not rated.
Source: Information was obtained from a 1999 report prepared by the Center for Career Development inEarly Care and Education at Wheelock College.
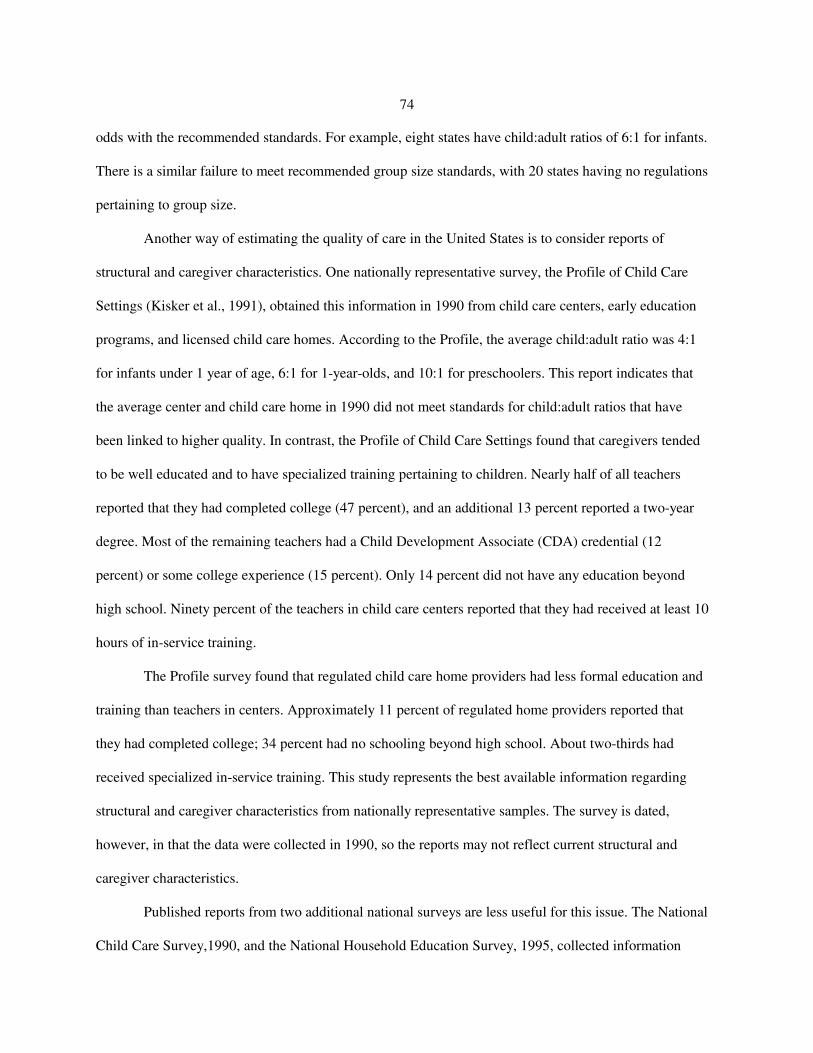
74
odds with the recommended standards. For example, eight states have child:adult ratios of 6:1 for infants.
There is a similar failure to meet recommended group size standards, with 20 states having no regulations
pertaining to group size.
Another way of estimating the quality of care in the United States is to consider reports of
structural and caregiver characteristics. One nationally representative survey, the Profile of Child Care
Settings (Kisker et al., 1991), obtained this information in 1990 from child care centers, early education
programs, and licensed child care homes. According to the Profile, the average child:adult ratio was 4:1
for infants under 1 year of age, 6:1 for 1-year-olds, and 10:1 for preschoolers. This report indicates that
the average center and child care home in 1990 did not meet standards for child:adult ratios that have
been linked to higher quality. In contrast, the Profile of Child Care Settings found that caregivers tended
to be well educated and to have specialized training pertaining to children. Nearly half of all teachers
reported that they had completed college (47 percent), and an additional 13 percent reported a two-year
degree. Most of the remaining teachers had a Child Development Associate (CDA) credential (12
percent) or some college experience (15 percent). Only 14 percent did not have any education beyond
high school. Ninety percent of the teachers in child care centers reported that they had received at least 10
hours of in-service training.
The Profile survey found that regulated child care home providers had less formal education and
training than teachers in centers. Approximately 11 percent of regulated home providers reported that
they had completed college; 34 percent had no schooling beyond high school. About two-thirds had
received specialized in-service training. This study represents the best available information regarding
structural and caregiver characteristics from nationally representative samples. The survey is dated,
however, in that the data were collected in 1990, so the reports may not reflect current structural and
caregiver characteristics.
Published reports from two additional national surveys are less useful for this issue. The National
Child Care Survey,1990, and the National Household Education Survey, 1995, collected information
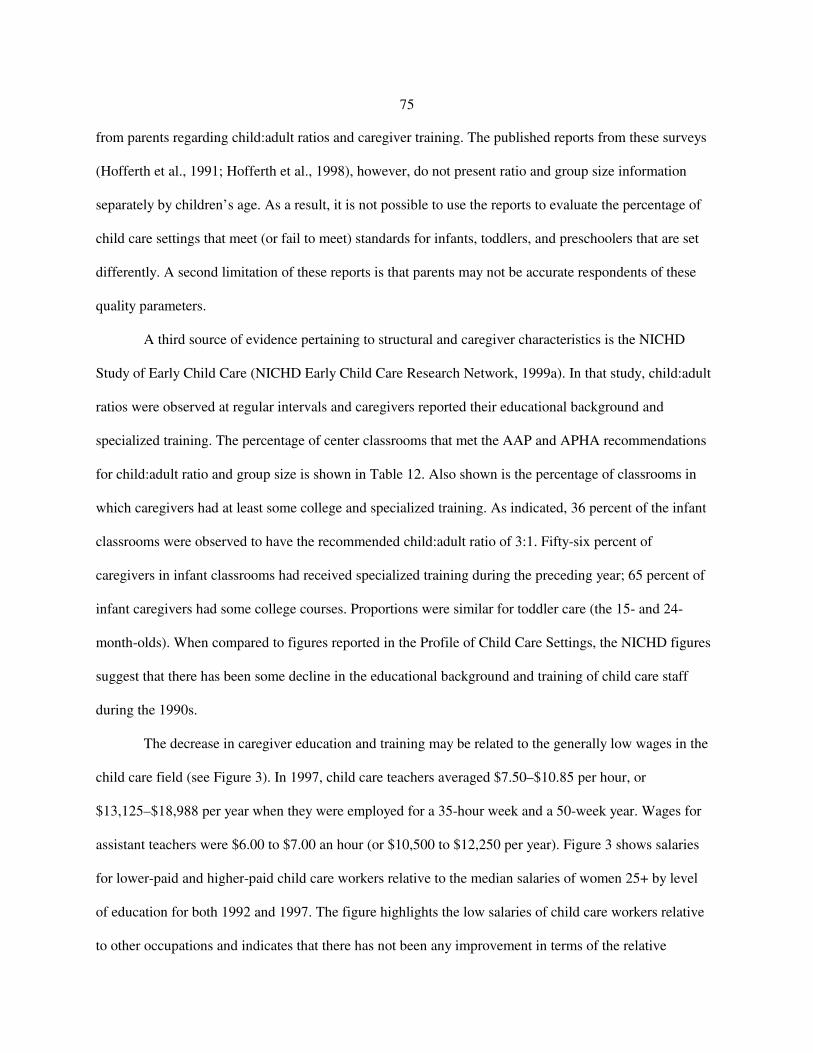
75
from parents regarding child:adult ratios and caregiver training. The published reports from these surveys
(Hofferth et al., 1991; Hofferth et al., 1998), however, do not present ratio and group size information
separately by children’s age. As a result, it is not possible to use the reports to evaluate the percentage of
child care settings that meet (or fail to meet) standards for infants, toddlers, and preschoolers that are set
differently. A second limitation of these reports is that parents may not be accurate respondents of these
quality parameters.
A third source of evidence pertaining to structural and caregiver characteristics is the NICHD
Study of Early Child Care (NICHD Early Child Care Research Network, 1999a). In that study, child:adult
ratios were observed at regular intervals and caregivers reported their educational background and
specialized training. The percentage of center classrooms that met the AAP and APHA recommendations
for child:adult ratio and group size is shown in Table 12. Also shown is the percentage of classrooms in
which caregivers had at least some college and specialized training. As indicated, 36 percent of the infant
classrooms were observed to have the recommended child:adult ratio of 3:1. Fifty-six percent of
caregivers in infant classrooms had received specialized training during the preceding year; 65 percent of
infant caregivers had some college courses. Proportions were similar for toddler care (the 15- and 24-
month-olds). When compared to figures reported in the Profile of Child Care Settings, the NICHD figures
suggest that there has been some decline in the educational background and training of child care staff
during the 1990s.
The decrease in caregiver education and training may be related to the generally low wages in the
child care field (see Figure 3). In 1997, child care teachers averaged $7.50–$10.85 per hour, or
$13,125–$18,988 per year when they were employed for a 35-hour week and a 50-week year. Wages for
assistant teachers were $6.00 to $7.00 an hour (or $10,500 to $12,250 per year). Figure 3 shows salaries
for lower-paid and higher-paid child care workers relative to the median salaries of women 25+ by level
of education for both 1992 and 1997. The figure highlights the low salaries of child care workers relative
to other occupations and indicates that there has not been any improvement in terms of the relative

TABLE 12Descriptive Statistics for Child Care Standards at Four Ages: NICHD Study of Early Child Care
Feature No. Mean SD Minimum MaximumRecommended
Level
Classes MeetingRecommended
Level, %
6 monthsChild-staff ratio 97 4.26 2.31 0.81 15.06 3 36
Observed group size 97 7.86 4.05 1.63 30.13 6 35
Caregiver training 97 1.70 1.55 0.00 4.00 2 56
Caregiver education 97 2.97 1.07 1.00 6.00 3 65
15 months
Child-staff ratio 118 4.14 1.30 1.50 7.88 3 20
Observed group size 118 8.53 3.28 2.38 23.38 6 25
Caregiver training 118 1.64 1.38 0.00 4.00 2 60
Caregiver education 118 2.89 0.89 1.00 5.00 3 69
24 months
Child-staff ratio 163 5.22 1.70 1.68 10.95 4 26
Observed group size 163 10.66 4.78 3.38 37.75 8 28
Caregiver training 163 1.84 1.37 0.00 4.00 2 65
Caregiver education 163 3.06 0.86 1.00 5.00 3 77
36 months
Child-staff ratio 250 6.98 2.32 1.92 14.90 7 56
Observed group size 250 13.20 4.63 3.50 32.63 14 63
Caregiver training 250 2.10 1.33 0.00 4.00 2 75
Caregiver education 250 3.24 0.91 1.00 6.00 3 80
Source. NICHD Early Child Care Research Network (1999a), Table 1.
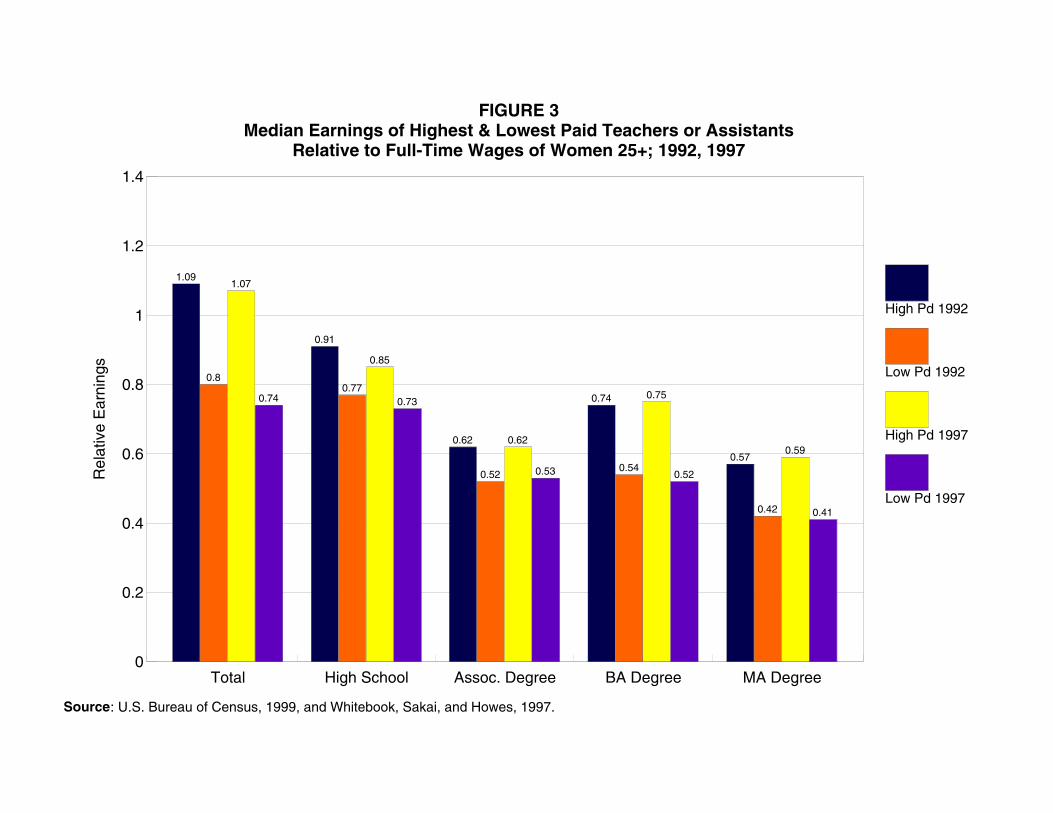
0
0.2
0.4
0.6
0.8
1
1.2
1.4
Rel
ativ
e E
arni
ngs
Total High School Assoc. Degree BA Degree MA Degree
1.09
0.91
0.62
0.74
0.57
0.80.77
0.520.54
0.42
1.07
0.85
0.62
0.75
0.59
0.74 0.73
0.53 0.52
0.41
High Pd 1992
Low Pd 1992
High Pd 1997
Low Pd 1997
FIGURE 3Median Earnings of Highest & Lowest Paid Teachers or Assistants
Relative to Full-Time Wages of Women 25+; 1992, 1997
Source: U.S. Bureau of Census, 1999, and Whitebook, Sakai, and Howes, 1997.

78
salaries over the 1992–1997 period for most levels of education. Though high school graduates who were
child care teachers or assistants could only earn between 73 and 85 percent of the salaries they might
expect to receive elsewhere, salaries were far lower relative to the median for women with more
schooling. A child care teacher with a bachelor’s degree could expect to earn between 52 and 75 percent
of the median salaries across all occupations. Current child care salaries are not consistent with attracting
and keeping providers who have the level of education and training that research suggests is needed to
structure emotionally supportive and cognitively stimulating learning environments.
The generally low salaries earned by child care staff also appear to be a factor contributing to
high staff turnover in the child care field (see Figure 4). In 1997, 27 percent of teachers and 39 percent of
assistants left their jobs during the previous year (Figure 5 and Whitebook, Howes, and Phillips, 1998).
Twenty percent of centers reported losing half or more of their staff. Centers that offer higher wages have
lower turnover rates than centers offering lower wages (Whitebook et al., 1998).
IS THERE A PERSUASIVE ECONOMIC ARGUMENT TO JUSTIFY PUBLIC INTERVENTION TOIMPROVE THE QUALITY OF CHILD CARE?
Market failure is defined as a “a situation in which a market left on its own fails to allocate
resources efficiently” (Mankiw, 1998, p. 10). Wherever market failure exists, public sector intervention
may improve the performance of that sector of the economy. In the child care sector, market failure stems
from two sources: lack of information and the existence of externalities (effects beyond the primary
consumers). Regarding the first source, parents lack information, including information on the quality of
child care, sometimes on the availability of care, and often on the net costs of alternative arrangements.
Related to this lack of information is the difficulty in capturing process quality by measuring observable
differences in structural quality. Even information on the structural quality differences is not easily
obtained a priori, and the cost of acquiring information can be high.

5
7
9
11
13
15
Remaining Departing Replacement
$12.85
$10.45
$11.00
FIGURE 4Staff Turnover by Prior Year’s Wages
Source: Whitebook, Sakai, and Howes, 1997.

0
10
20
30
40
50
60
70
Assistants Teachers Teacher-Directors Directors
59
51
3436
FIGURE 5Turnover Rates, All Staff, All Centers *
Source: Whitebook, Sakai, and Howes, 1997.* Rates derived from 2 visits, 20 months apart to centers.

81
One difficulty in providing information to parents is that much of this market is made up of small
providers. Parents may know something about the child care used by their neighbors, but very little about
other types or providers of care. Parents report being unsure about how to go about evaluating child care
quality. Child care convenience also is of considerable concern to parents, limiting their search to care in
particular small geographical areas. This way of thinking about market failure is quite similar to the
situation with medical providers. The problem may be particularly acute for lower-income families and
for families that need care for evening or weekend employment (Vandell, 1998).
The second major cause of market failure is the existence of externalities. The benefits of quality
care accrue not just to the parents but also to the children and to society more generally. Parents may take
all or part of the benefit to their children into account, but not benefits that are external to the family.
Such benefits include lower costs for subsequent schooling (reduced probability of grade retention and
special education, for example), future reductions in crime, increased productivity that results in higher
productivity for others, payment of higher taxes, and possibly lower costs for social services. Improving
child care quality may affect grade school classrooms by increasing the proportion of children in the class
who have strong language and cognitive skills. By the same token, poor-quality child care may undermine
grade school classrooms by increasing the numbers of children with academic and social deficits. Unsafe
and unhealthy child care may result in reduced productivity for others if parents are absent from their jobs
to care for injured or ill children. Adding these benefits to the parent’s demand for higher-quality care
should shift the demand curve for quality care to the right (that is, increase demand for higher-quality care
at every price).
There may also be a third cause of market failure, an imperfect capital market. Parents of young
children tend to have low incomes relative to their permanent income, but may face borrowing constraints
that reduce their ability to pay for high-quality care.
Justification for government intervention may also be based on distributional or equality-of-
opportunity goals. This may be especially relevant today, in view of the requirement that most low-

82
income single parents work. The core argument here is that if high-quality child care can provide gains in
cognitive ability, school readiness, and social behavior, children in low-income families should be given
an opportunity to benefit from such experiences just as high-income children benefit. Parents with limited
earnings do not have the private means to purchase high-quality child care for their children. Government
subsidies are necessary if equal opportunity for high-quality care is to be afforded children in low-income
families. The other side of this argument is that if subsidies are not provided, parents with limited
incomes will use poor-quality care, including multiple arrangements, which may be detrimental to the
safety of their children, may increase family stress, and may result in children with reduced opportunities.
A subsidy (or direct provision of care) for children in low-income families could also complement the
Earned Income Tax Credit and serve as an employment-related income subsidy (see Council of Economic
Advisers, 1997).
There are additional issues regarding availability of child care for families with very low incomes
and/or unusual and nonflexible hours of work. According to several studies:
The structure of low-wage work and its lack of fit with the structure of more formal childcare options restricts the access of low-income families to child care centers and manyfamily day care homes. Data from the National Child Care Survey indicate that one-thirdof working-poor mothers (incomes below poverty) and more than one-fourth of working-class mothers (incomes above poverty but below $25,000) worked weekends (Hofferth,1995).
Yet only 10 percent of centers and 6 percent of family day care homes reported providing weekend care.
Almost half of working-poor parents worked on a rotating or changing schedule, further restricting these
families’ child care options to more flexible arrangements made with relatives, friends, and neighbors.
The features of low-wage work appear to promote reliance on multiple providers as a way of
patching together child care to cover parents’ nonstandard and shifting work hours (Siegel and Loman,
1991). Meyers added that irregular and unpredictable work schedules led to disruptions in child care for
the families in her study of the California GAIN program (Meyers, 1993). Deborah Phillips (1995) wrote:
In sum, when selecting child care, many working-poor and low-income families mustchoose from a seriously constrained set of options. They face a set of obstacles that

83
2According to several studies, low-income families use more of certain types of child care and less of othersthan do families with more income or more education (see Figure 6). According to the study by the NationalAcademy of Sciences (Phillips, 1995), low-income families “are more likely to rely on relatives and less likely torely on center-based arrangements. . . . Grandparents are an especially prominent source of child care for low-income, preschool-age children: 17 percent are cared for mainly by grandparents; 29 percent get some care from agrandparent. The child care arrangements of low-income families also vary greatly by household type and parentalemployment status. . . . Single employed mothers rely to a much greater extent on non-relative arrangements(notably family day care homes and centers) than do other types of low-income families. In addition, among low-income families, about 24 percent of children under age 5 are in more than one supplemental arrangement on aregular basis (Brayfield et al., 1993). Reliance on multiple arrangements varies, however, from 14 percent of low-income preschoolers with two parents to 31 percent of those in single-mother families and 45 percent of those inemployed, single-mother families” (Phillips, 1995, Chapter 2).
Connelly and Kimmel (2000) use a merged sample from the 1992 and 1993 SIPP panels which includechild care questions from June through December 1994. They examine the choice of child care of full-time vs. part-time employed mothers, married and single. Table 13 shows their prediction, by marital status, of the marginaleffects of the included variables on the probability of choosing among the three modes of child care for singleemployed mothers. The first panel uses a single predicted price for child care and the second includes three predictedprices of care. For single mothers, the predicted conditional probability of full-time employment is a significantpredictor of child care. As has been suggested by earlier research, single mothers who are working full-time aremore likely to use center-based care. This also leads to the conclusion that as more mothers enter full-timeemployment after leaving welfare, the use of center-based care over other types of care will increase. The reportedresults also show that women with more education are more likely to use center-based care or home-based care andthat women on AFDC who receive more dollars are somewhat more likely to use center-based care and less likely touse relative care. Somewhat surprisingly, single mothers with higher predicted wages appear more likely to userelative care or home-based care than center care. The authors explain this by hypothesizing that higher-wage jobsare more likely to be positions that require more flexibility than center care can provide in terms of pick-up anddrop-off times and the care of sick children.
derive primarily from the structure of low-wage jobs and from the meager incomes thatthese jobs provide. Their low incomes enable them to afford only free care by relativesand friends or very inexpensive care; their nonstandard and often rotating work hoursrestrict them to arrangements with flexible and weekend or evening hours of operation.These factors may also lead to greater reliance on multiple providers and expose youngchildren to shifting child care arrangements.
This lack of stability and frequent changing is itself a measure of poor quality of care.2
The market failure components argue for government intervention in improving child care. They
all lead the authors of this report to believe that the demand for high-quality care is too low. And because
demand is too low, compensation is too low, resulting in better-trained providers tending to seek
employment in other spheres. This results in a decline in quality unless intervention occurs. Intervention
can take many forms.
The arguments behind the need for a role for government (including subsidies for child care) is
quite similar to those for primary schooling. Traditionally, the amount of schooling provided has heavily
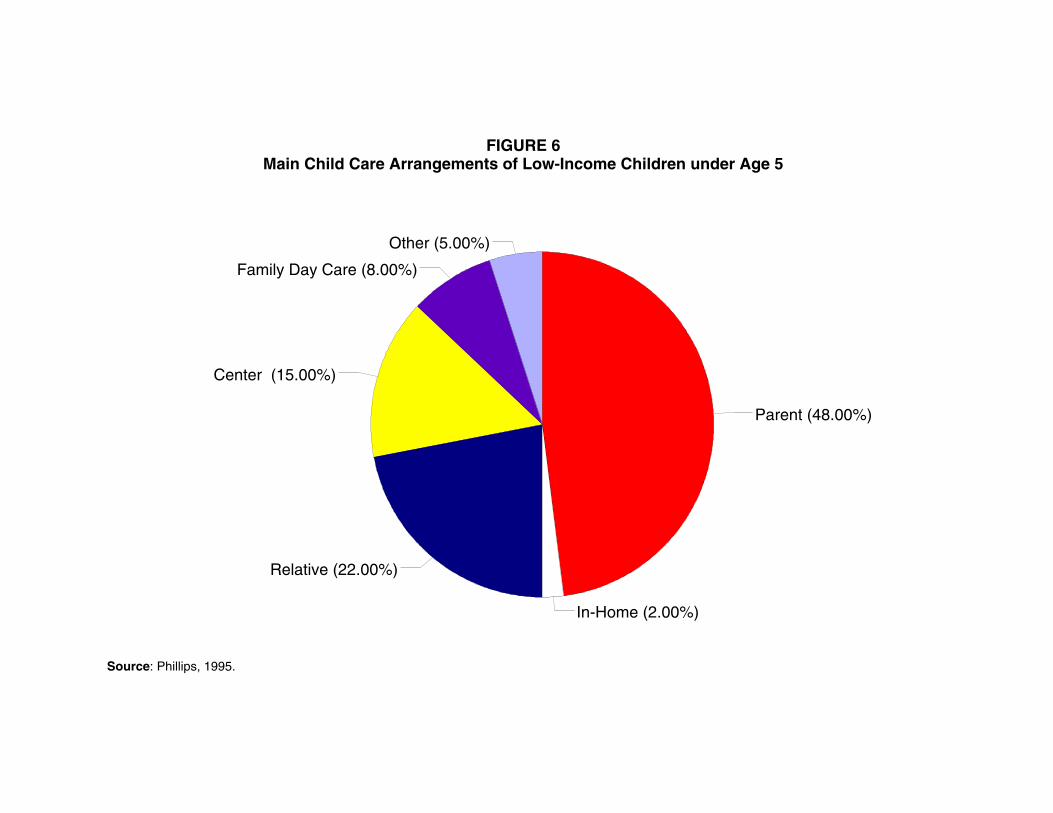
Parent (48.00%)
Center (15.00%)
Family Day Care (8.00%)
Other (5.00%)
In-Home (2.00%)
Relative (22.00%)
FIGURE 6Main Child Care Arrangements of Low-Income Children under Age 5
Source: Phillips, 1995.

TABLE 13
Marginal Effects of the Probability of Choosing among Modesof Care for the Youngest Child for Single Mothers
(Multinominal Logit Estimation)
Variable Relative Care Home-Based Care Center-Based Care
Predicted probability offull-time employment
-3.096* -2.951** 6.046***
(-1.91) (-2.27) (3.52)
Predicted wage 0.946* 1.000** -1.947***
(1.84) (2.42) (-3.60)
Education -0.050* -0.042* 0.093***
(-1.72) (-1.87) (3.05)
State’s average monthlyAFDC payment perfamily
-6.E-4* -2.E-4 9.E-4*
(-1.84) (-1.01) (2.51)
(Multinominal Logit Estimation Including Three Separate Predicted Prices of Child Care)
Variable Relative Care Home-based Care Center-Based Care
Predicted probability offull-time employment
-3.141*** -0.258 3.398***
(-3.17) (-0.37) (3.34)
Predicted wage 1.095*** 0.204 -1.299***
(2.66) (0.68) (-3.13)
Education -0.108*** 0.043 0.151***
(-2.81) (-1.55) (3.78)
State’s average monthlyAFDC payment perfamily
-6.E-4 3.E-4 3.E-4
(-1.57) (0.97) (0.86)
Significance levels: *10%, ** 5%, ***1%
Additional variables include: predicted price of care, predicted price of relative care, predicted price of home-care,predicted price of center-based care, age, nonwhite, nonlabor income, youngest child is an infant, presence of otherpreschoolers, presence of children aged 6–12, presence of children aged 13-17, presence of other adults, urbanresidence, and state’s average Medicaid expenditure per enrollee.
Source: Connelly and Kimmel (2000), Tables 5 and 6.

86
depended on the public sector. For children up to age 16, or older in some states, schooling is mandatory
and is provided by the public sector. In the cases of elementary and secondary education, as well as public
colleges and universities, the price charged tends to be far below the marginal cost of schooling.
Evaluation of the appropriate level of public investment in education requires an analysis of all returns to
schooling, including nonmarket and external effects. For example, greater education may lead to social
cohesion and may enable one to use new technologies; it may reduce the probability of criminal acts,
reduce the probability of application for and receipt of transfers, and increase savings rates. (For more on
this see Wolfe and Zuvekas, 1997, and Michael, 1982.)
Many of the benefits of child care are like those of primary schooling, because child care is early
childhood education. These early childhood educational experiences affect children’s readiness for
primary schooling in the same way that primary schooling affects children’s readiness for secondary
schooling. In both cases, many benefits are external to the child and family. The community at large
would benefit from the cognitive, language, and behavioral competencies that are associated with higher-
quality child care. The argument for equality of opportunity is similar as well.
A high-quality child care system also is needed if welfare reform is to succeed. The recent change
in welfare policy, establishing work requirements, means that more parents, particularly single parents,
are working, because work is their only potential source of income. Requiring work means that more
parents must find child care for their children. Given this increase in demand, the issue of child care
quality becomes even more important. Unfortunately, as described in earlier sections, much of the child
care in the United States is not of high quality. Over 60 percent of children under the age of 3 are
receiving care in which positive caregiving is not characteristic. Only 10 percent are in care settings that
are described as excellent.

87
WHAT MIGHT BE DONE TO IMPROVE THE QUALITY OF CHILD CARE?
A wide variety of approaches might be used to improve child care. Figure 7 provides a path
model that attempts to identify the various links between interventions and quality, taking into account
parents’ resources. The potential interventions include provision of information, licensing requirements,
placement activities, subsidies to compensate child care workers, training programs for providers, tuition
subsidies for students who enroll in early childhood education, increased tax credits to cover the cost of
care for lower- to middle-income families, incentive payments to individual teachers and assistants who
remain in the same center for a minimum of 3–4 years, and even direct provision of care. In the longer
run, we need research to help better identify those factors that best improve the quality of child care. In
essence, we need better understanding of the production of high-quality care, which may differ for
children of different backgrounds.
The minimum role for the public sector is as a provider of information on available slots, hours of
operation, structural quality features, costs of care and education, and training of personnel. The
government might also establish programs to certify and offer incentives to providers who meet certain
requirements. Minimum standards need to be strengthened in many states. Other government activities to
increase the availability of high-quality care could include operation of training programs and covering
the cost of instructors and facilities for these programs. Information on the successful completion of such
programs could be disseminated by the public sector as part of its information activities.
A more ambitious role designed to increase the pool of well-qualified individuals who enter (and
remain) in the field of early childhood education would be some form of tuition subsidy for those willing
to major in this field. There is a long tradition of such programs when shortages are anticipated; examples
include nursing education and medical school. An alternative might be a college loan forgiveness
program based on years spent as a child care provider following college or completion of an Associate
degree. Another approach to increasing the pool of qualified providers is to raise salaries. This seems
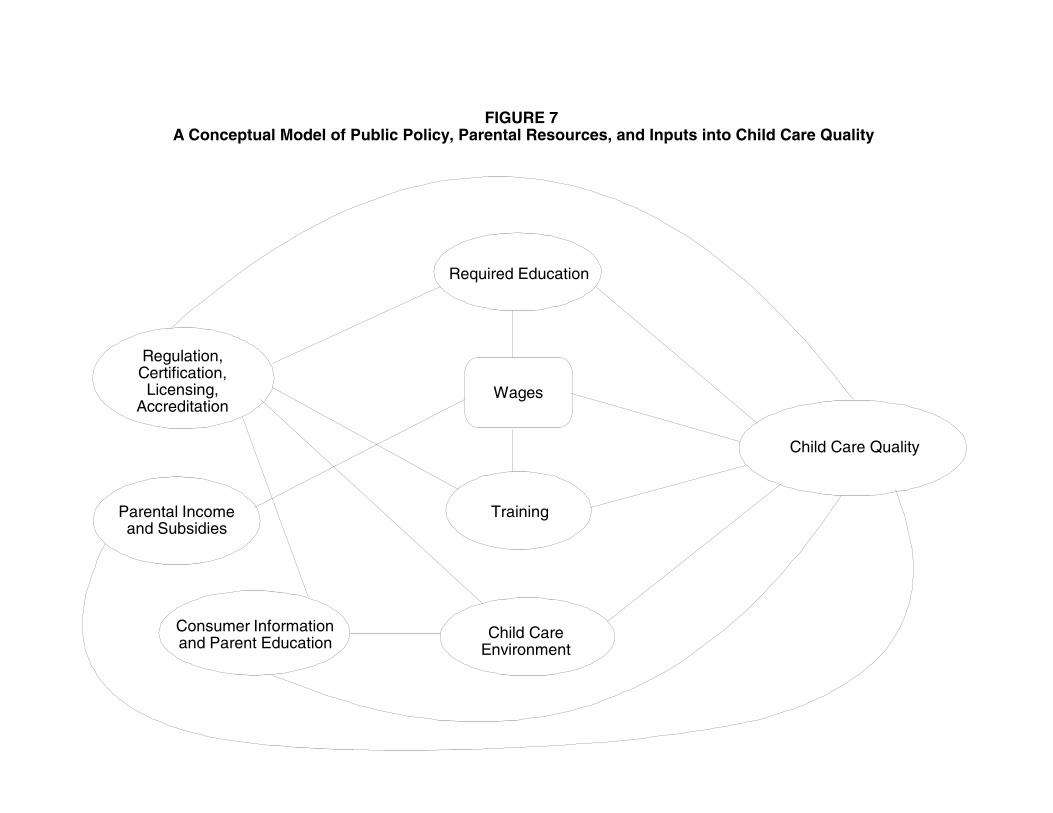
FIGURE 7A Conceptual Model of Public Policy, Parental Resources, and Inputs into Child Care Quality
Regulation,Certification,Licensing,
Accreditation
Required Education
Child Care Quality
Wages
Parental Incomeand Subsidies
Training
Consumer Informationand Parent Education
Child CareEnvironment

89
especially important given the relatively low salaries in child care compared to other occupations. Such
increases might result from increased information to parents, tax credits to parents, and the expansion of
subsidy programs or direct payment to providers by the public sector. An innovative program might
reward the stability of providers by paying a bonus after a specified number of years.
Current programs to improve child care quality exist and might be replicated or expanded. For
example, a broad-based community initiative in North Carolina (Smart Start) has been successful in
improving child care quality (Bryant, Maxwell, and Burchinal, 1999). This initiative, established by the
governor of North Carolina in 1993, is a partnership between state government, local communities,
service providers, and families. Twelve county partnerships were initially selected based on competitive
review to receive funds for new and improved child care services. Data to evaluate the effectiveness of
the initiative were obtained in 1994 and 1996 from over 180 child care centers in 12 counties. Local
quality improvement activities (in 1996) were distributed as follows: training workshops (83 percent),
funds to attend training activities (53 percent), on-site consultation or technical assistance (58 percent),
higher child care subsidy rates (35 percent), increased subsidies for meeting higher standards (29 percent),
funds to improve quality by purchasing new equipment (70 percent), funds to improve quality by
purchasing new educational materials (63 percent), funds to achieve higher licensing level (26 percent),
funds to achieve national accreditation (13 percent), funds to improve services for children with
disabilities (11 percent), teacher substitute pool (20 percent), transportation services (18 percent), lending
library (51 percent), and provider compensation programs (35 percent). The mean number of
improvement activities per center was 5.3 in 1994 and 5.8 in 1996, with a range of 0 to 14 activities each
year. In both years, ECERS scores were significantly related to the number of local quality improvement
activities in which individual centers participated. In addition, process quality was significantly higher in
1996 than in 1994. Only 14 percent of centers were rated as good quality in 1994; in 1996 this figure was
25 percent. Participation in the Smart Start initiative also was related to a significant increase in the
percentage of centers that obtained the higher-level Associate of Arts licensure credential.
90
Other efforts to improve quality might be to mandate certain minimum requirements. These can
take the form of reducing child:adult ratios, reducing group sizes, establishing and enforcing safety
regulations, and education and training. An example of such regulations is a model standard that applies
to small family home caregivers. The National Health and Safety Performance Standard (American Public
Health Association and American Academy of Pediatrics, 1992b) states that one small family caregiver
who does not have an assistant “shall not care for more than six children, including no more than two
children under age 2. These numbers include the caregiver’s own children under the age of six. If any
child under age 3 is in care, there shall be no more than four children, including the caregiver’s own
children under the age of six. If only children under age 2 are in care, there shall be no more than three
children, including those of the caregiver” (Chapter 1, Staffing).
Training programs for providers of child care are also offered. The Department of Labor, Bureau
of Apprenticeship and Training, West Virginia Child Care Development Specialist Registered
Apprenticeship Program offers child care apprentices 4,000 hours of supervised on-the-job training and
300 hours of classroom instruction. The child care providers earn their salaries while they are in the
program and receive incremental wage increases as their skill, ability, and knowledge increase. The DOL
reports that employers report almost no turnover among child care providers and that providers remain
highly satisfied with their careers (http://www.dol.gov/dol/wb/public/childcare/child3.pdf).
Private employers may sometimes directly or indirectly provide resource and referral services.
Some employers contract with private agencies to assist employees in learning about the range of child
care options. The government could encourage such activities by providing subsidies or tax credits to
firms if they provide such assistance. An example of this is the program at the Virginia Mason Medical
Center which offers child/family resource and referral services.
Recent reports suggest that although some federal funds are available to improve access to
higher-quality care among lower-income families, some states have not made these funds available or
have set up programs that result in low take-up rates. According to “Access to Child Care for Low-
91
Income Working Families” released in October 1999, 1.5 million children of 14.7 million (about 10
percent) in low-income households were receiving child care subsidies. The major source of funds is the
Child Care and Development Fund (CCDF), a federal program that provides funds to states to subsidize
child care. According to federal law, children living in families with incomes up to 85 percent of median
income in the state could be eligible, but states have set lower limits
(http://www.acf/dhhs.gov/news/ccreport.htm). The levels set and the take-up rates differ across states.
The report details coverage in each state and take-up rates. Expanding eligibility to the federal maximum
level and/or encouraging take-up of the existing subsidies through outreach are ways to increase the
demand for high-quality care.
Data aggregated from state agencies (see Figure 8) indicate that the child care arrangement most
frequently chosen by parents receiving direct federal subsidies is center-based care (Phillips, 1995). This
evidence indicates that families do respond to available subsidies. The profile of arrangements used by
these low-income parents is strikingly different from those used by all low-income families. Siegel and
Loman (1991) found, as well, that AFDC families in Illinois showed different distributions of child care
use based on whether they received a child care subsidy and which subsidy they received. Families
receiving a child care benefit that reimbursed them for their child care costs 30 to 60 days after they had
incurred these costs were discouraged from using child care options they could not afford with their
disposable income. Their patterns of use were similar to those of unsubsidized, low-income families. In
contrast, families who received subsidies through programs that either subsidized providers directly or
enabled the families to pay providers when fees were due showed substantially higher rates of reliance on
center-based and formal family day care arrangements.
Subsidies can help low-income families gain access to the same range of quality options that are
available to higher-income families. The Urban Institute’s survey of resource and referral agencies in six
communities provides evidence that the quality of care received by subsidized children was as high as that
for higher income, fee-paying children, as perceived by resource and referral staff (Phillips, 1995).

0
10
20
30
40
50
60
70
JOBS
AFDC
TCC
At-Risk
CCDBG
Child’s Home
Source: Phillips, 1995.
Group/Family Home Center Care
FIGURE 8Children Served, by Federal Program and Type of Provider

93
Another approach that could be combined with subsidies for very young children would be to provide
universal coverage for child care (or coverage for children whose parents worked more than 20 hours per
week) for preschool-age children. Such a program could expand existing prekindergarten programs to a
full day and include after-school care. These programs could be established for 3- and 4-year-olds
through a combination of direct provision through a local school district, existing community-based
programs, and vouchers that would be accepted by certified providers. Part of the costs of this care would
be offset by eliminating tax credits and current government subsidies for 3- and 4-year-olds. States and
local communities would decide on the details of the provision of care, and financing would be shared
across levels of government. Part of a coordinated, high-quality child care system for toddlers also might
include community- and school-based centers and family day care networks. Because of the need for low
child:adult ratios (and their attendant expense), part of a coordinated child care policy for infants might
include vouchers that would allow a parent to stay home and care for the infant during the first year.
Assessment of the Cost of Improving Quality
As we suggested, analyses that shed light on the developmental benefits of child care
characteristics for children constitute an important element of the answer to our question. A related task
involves determining the levels of investment necessary to achieve improved quality. Although this topic
has not received the same level of attention in the literature as the overall relationship between quality of
care and child outcomes, several studies consider the financial costs of increasing structural measures of
quality. Though subject to limitations that affect the extent to which one may apply these findings to the
current system of child care, this research provides useful information on the relationship between the
quality of child care and cost.
The U.S. General Accounting Office (GAO, 1990) report and Powell and Cosgrove’s (1992)
summary of and addendum to this GAO research include estimated cost functions for the provision of
child care as well as a model of the factors that affect wages of care providers. The modeled cost function

94
3The NAEYC accreditation criteria include guidelines for staff-child interaction, curriculum content, staffqualifications and training, group size and child:adult ratios, physical environment and safety, and nutrition.
4The other variables included in the model are average hourly wages for teachers and aids; rent; cost ofother supplies and services per child; indicators for whether a center is for-profit, serves infants, serves children withdisabilities, has operated for less than 2 years; and geographic location.
allows the authors to examine the direct influences of input prices; center characteristics, including
structural measures of quality; and geographical location on center total variable cost. This use of
multiple regression analysis allows the authors to estimate the effect of changing such factors as the
child:adult ratio on center total costs, after controlling for other relevant factors such as group size,
location, and average education of providers. By also modeling the elements of wage determination, the
authors capture the indirect effect of changes in child care characteristics on the wages of providers. The
results from both models are then combined to examine direct and indirect effects of quality changes on
total variable costs.
Data on child care centers from a 1989 GAO survey of 265 early childhood education centers
accredited by the National Associate for the Education of Young Children (NAEYC) were used in both
studies.3 The survey, administered to program directors via questionnaire, asked questions about center
characteristics, costs, value of in-kind donations received, staff characteristics, and compensation. The
survey includes several structural measures that allow the authors to estimate the costs associated with
changing the following quality measures: the average number of children per teaching staff member,
average number of children in groups of 4-year-olds, average education of staff in years, average
experience of staff in years, and staff turnover rate.4
The authors find statistically significant relationships between center total cost and structural
measures of child care quality. For the child:adult ratio, they find that an improvement in the quality of
care achieved by decreasing the average ratio by one, for example from 11:1 to 10:1, is associated with
increased costs of roughly 4.5 percent. The authors note that the average center in their data, one with 50
children and an annual per child cost of $6,500, which reduces the child:staff ratio from 11:1 to 10:1,

95
5These estimates are expressed in current dollars. The original estimates in 1988 dollars are $4,500 and$207, respectively.
6The authors do control for centers that provide infant care, but cost structures would nevertheless beexpected to differ, for example, in infant-care centers that do not provide care to 4- and 5-year-olds.
faces an increase in annual cost per child of $306.5 A related measure, average group size, had a small but
statistically insignificant effect on total costs.
Changes in cost resulting from improving staff education and experience are estimated using the
estimated cost and wage functions to capture total direct and indirect effects. The authors find that a one-
year increase in average education of the teaching staff is statistically significantly associated with a 3.4
percent increase in total costs, which includes a 5.8 percent increase in wages. Similarly, increasing
average teacher experience by one year is significantly associated with a reduction in center total costs of
0.6 percent, including an estimated increase in wages of 2.3 percent. This implies that increasing staff
experience is associated with an increase in quality as well as a slight reduction in average center total
costs. There is also evidence of a relationship between turnover rates and total costs—the departure of an
additional 10 percent of the center’s teaching staff increases costs by 6.8 percent.
These studies have several limitations. First, they rely on data that are more than 10 years old. If
the relationships estimated in their model have changed since 1989, these estimates will differ from what
we would expect to find using current data. Changes in quality made now may affect total costs in a
different manner.
Also, the data include only accredited centers. If these centers have cost functions that
systematically differ from unaccredited centers, the estimated results will not apply to those centers. If,
for example, one is most concerned with improving poor quality child care, and such care is more likely
to be found in unaccredited centers, these estimates may not provide an accurate depiction of the costs of
doing so. The sample also only includes data for care of 4- and 5-year-old children. Because of
differences in providing care for other age groups, the relationship between improving quality and costs
for centers that provide care for other age groups may vary.6 Finally, although the sample includes data

96
7The relationship between structural measures of quality and total variable costs are also tested, but there isno evidence of statistically significant relationships. The authors note that their index measure of quality may be atheoretically superior measure insofar as the structural characteristics capture only a portion of the “true” measure ofquality. They argue that this is the case if the unobserved center quality characteristics are correlated with otherindependent variables.
8These estimates are expressed in current dollars. The original estimates in 1994 dollars are $300 and$18,000 respectively.
from many states, 70 percent of the centers surveyed were in the South and the Midwest. The results
therefore may not be nationally representative.
Helburn (1995) estimates a similar cost function using data collected as a part of the Cost,
Quality, and Child Outcomes in Care Centers (CQO) study. The CQO study, conducted in 1993–94,
included data from 401 child care centers (749 classrooms) in four states. The data, collected through
classroom observation and interviews with program directors, include information on center
characteristics, program quality and staff qualifications, compensation, and turnover. Helburn estimates
center total costs as a function of staff wages at different education levels, hours of child care provided,
physical size of the center, volunteer hours, region of the country, for-profit status, and quality measures.7
This research also indicates statistically significant relationships between cost and quality.
Increasing center quality by 25 percent (from mediocre to good) is associated with increases in total
variable costs of approximately 10 percent, or $346 per child per year. The authors define quality using an
index similar to the ECERS measure of quality of care. Using the ECERS 7-point scale, the mean value of
this index in their sample is 4.0, which ranks between fair and good. They estimate that the increase in
total variable costs associated with increasing the measure of quality by 25 percent to 5.0, a rating of good
quality, will be approximately 10 percent. Given an average size of 60 children per center, the increase in
quality is expected to result in an increase in costs of approximately $20,700 per year.8
Helburn notes that this analysis assumes that wages are held constant during the quality-changing
process. The model specifically implies that wages for particular quality levels of staff (here measured by
years of education) are set in the labor market, and centers pay the going wage. If, however, high-quality
97
centers pay higher than market wages to attract the most qualified providers, or to increase productivity
and/or lessen the chance of turnover among existing workers, then estimated costs will understate true
costs.
Although this study considers all types of centers, not just accredited centers, it has similar
limitations to the GAO and Powell and Cosgrove studies. That is, the data are not as recent as would be
desired, and the results from the four-state sample are not nationally representative.
Although all three studies have limitations, the estimates do provide information on the nature of
the relationship between child care costs and quality. As such this research serves as a useful starting
point for further consideration of this topic. The need to develop cost estimates suggests that future work
incorporating current and nationally representative data will serve as an important source of information
for evaluating public policy strategies designed to improve the quality of child care. We have discovered
one likely source of such estimates in research currently being conducted by Richard Brandon at the
University of Washington and Lynn Kagan at Yale University. These authors are developing a detailed
simulation model to estimate costs of improving child care using varied measures of quality. This
research, which the authors estimate will be completed by the end of 2000, will provide valuable
additional information
None of these studies include the investment that is likely to be the least expensive approach to
improving quality: caregiver training, including in-service training. A variety of training programs have
been offered to formal and informal caregivers. The evidence above suggests that better-trained
caregivers give higher-quality care. We do not know enough about the content or length of these
programs to be able to definitively discuss their cost. Curriculum and materials are readily available (see
for example the materials available from Teaching Strategies, Inc.) One program suggests that a 12-
workshop series would enhance caregiver’s skills in areas that range from safety through cognitive
development and communication skills.

98
CONCLUSIONS
We conclude by returning to primary questions raised in the report: Does child care quality
matter? Does child care quality need to be improved, and can it be improved? Is there an economic
justification for public intervention to improve the quality of child care, especially for children from
lower-income families? Our answer to each of these questions is “yes.”
Does Child Care Quality Matter?
Our review of the research literature indicates that child care quality matters at several levels. In
terms of children’s everyday experiences, children appear happier and more cognitively engaged in
settings in which caregivers are interacting with them positively and in settings in which child:adult ratios
are lower. There also is evidence of concurrent relations between child care quality and children’s
performance in other settings. Children who attend higher-quality child care settings (measured by
caregiver behaviors, by physical facilities, by age-appropriate activities, and by structural and caregiver
characteristics) display better cognitive, language, and social competencies on standardized tests and
according to parents, teachers, and observers. Finally, there is evidence that child care quality is related to
children’s subsequent competencies. The relationship is more evident when cumulative measures of child
care quality are analyzed, rather than by one-time assessments, and when quality and child outcome
measures have strong psychometric properties.
Does the Quality of Child Care Need to Be Improved, and Can It Be Improved?
Two general approaches to measuring child care quality were described in this report. Process
quality refers to children’s experiences in child care settings. Some process measures focus specifically
on caregivers’ behaviors with children. Others include global ratings that incorporate physical facilities
and age-appropriate child activities as well as caregiver behavior into their evaluation. Multisite studies
suggest considerable need for improvement of process quality in the United States. Although less than 10

99
percent of process quality has been categorized as “inadequate” or “poor,” most settings have been
characterized as only “fair” or “minimal.” These observations indicate the need for systematic efforts to
improve a substantial portion of child care in the United States.
A second way of measuring child care quality is in terms of structural and caregiver
characteristics, such as child:adult ratio, group sizes, teacher formal education, and teacher specialized
training. There is an extensive research literature linking structural and caregiver characteristics to process
quality. A review of regulatory standards in the 50 states shows that few states have adopted standards
that are consistent with the recommendations of professional organizations. Furthermore, reports from
nationally representative surveys indicate that average group sizes and ratios exceed recommended
standards. Recent evidence suggests a decline in the educational background of staff during the 1990s,
perhaps as a result of low wages. Thus, it appears that child care structural and caregiver characteristics
are in need of improvement. They can be improved if additional resources are allocated. This could occur
through a combination of increased subsidies for care, especially to low-income families; federal
standards and/or increased state standards for both physical settings and caregiver training and child:staff
ratios; improved information to parents on the quality of providers; and/or direct provision or expansion
of child care in schools.
Is There an Economic Justification for Public Intervention to Improve the Quality of Child Care,Especially for Children from Lower-Income Families?
Market failure, the presence of externalities, and an argument for equality of opportunity all call
for public sector intervention in the child care market. The primary form of market failure is the lack of
information for parents regarding quality of care which is tied to the difficulty in measuring quality, the
lack of availability of high quality care, and the need for child care for irregular hours such as weekend
and late shifts.
Benefits of quality child care accrue to other members of society, including all children in schools
with children who had child care; taxpayers, who are likely to save in costs of future schooling by

100
reduction in special education and grade retention; employers, who benefit from more productive
employees; and citizens, who gain in terms of future reductions in crime and use of transfer programs.
Subsidizing child care for low-income families is also consistent with the goals of the 1996 welfare
reform and an ideology that wishes to encourage and reward work. Finally, to the extent that high-quality
child care provides benefits to children and their families, there is an argument for providing equal
opportunity for such programs to children in low-income families.

101
References and Additional Resources
Abbott-Shim, M., and A. Sibley. 1992a. Assessment Profile for Early Childhood Programs. Atlanta, GA:Quality Assist, Inc.
Abbott-Shim, M., and A. Sibley. 1992b. Assessment Profile for Family Day Care. Atlanta, GA: QualityAssist, Inc.
“Access to Child Care for Low-Income Working Families” released October 1999,<http://www.acf.dhhs.gov/news/press/1999/ccreport.htm>.
American Public Health Association and American Academy of Pediatrics. 1992a. National Health andSafety Performance Standards: Guidelines for Out-of-Home Child Care Programs. Arlington,VA: National Center for Education in Maternal and Child Health.
American Public Health Association and American Academy of Pediatrics. 1992b. Caring for OurChildren: National Health and Safety Performance Standards: Standards for Out-of-Home ChildCare Programs. Ann Arbor, MI.
Arnett, J. 1989. “Caregivers in Day-Care Centers: Does Training Matter?” Journal of AppliedDevelopmental Psychology 10: 541–552.
Barnett, W. S. 1993. “Benefit-Cost Analysis of Preschool Education: Findings from a 25-Year Follow-Up.” American Journal of Orthopsychiatry 63: 500–508.
Benasich, April, J. Brooks-Gunn, and B. Clewell. 1992. “How Do Mothers Benefit from EarlyIntervention Programs?” Journal of Applied Developmental Psychology 13: 311–326.
Berk, L. 1985. “Relationship of Educational Attainment, Child Oriented Attitude, Job Satisfaction, andCareer Commitment to Caregiver Behavior toward Children.” Child Care Quarterly 14: 103–129.
Besharov, D. 2000. “Possible CED Role in Early Child Care and Education.” Unpublished manuscript.
Blau, D. M. 1999a. “Does Nonrandom Assignment of Children to Child Care Arrangements Matter forEstimating the Effects of Child Care on Children?” Paper presented at the Biennial Meeting ofthe Society for Research in Child Development, Albuquerque, NM. April
Blau, D. M. 1999b. “The Effect of Income on Child Development.” Review of Economics and Statistics81(2): 261–276.
Blau, D. M. 1999c. “The Effects of Child Care Characteristics on Child Development.” Journal ofHuman Resources 34: 786–822.
Blau, D. M. 2000. “The Production of Quality in Child Care Centers: Another Look.” AppliedDevelopmental Science 4: 136–148.
Blau, D. M., and P. K. Robins. 1988. “Child Care Costs and Family Labor Supply.” Review of Economicsand Statistics 70: 374–381.
102
Blau, D. M., and P. K. Robins. 1989. “Fertility, Employment and Child Care Costs.” Demography 26:287–299.
Borge, A. I. H., and E. C. Melhuish. 1995. “A Longitudinal Study of Childhood Behavior Problems,Maternal Employment, and Day Care in a Rural Norwegian Community.” International Journalof Behavioral Development 18: 23–42.
Brayfield, A., S. G. Deich, and S. Hofferth. 1993. Caring for Children in Low-Income Families: ASubstudy of the National Child Care Survey, 1990. A National Association for the Education ofYoung Children Study conducted by the Urban Institute. Washington, DC: Urban Institute Press.
Briss, P. A., J. J. Sacks, D. G. Addiss, M. J. Kresnow, and J. O’Neil. 1995. “Injuries from Falls onPlaygrounds: Effects of Day Care Center Regulation and Enforcement.” Archives of Pediatricsand Adolescent Medicine 149: 906–911.
Broberg, A. G., C. P. Hwang, M. E. Lamb, and F. L. Bookstein. 1990. “Factors Related to VerbalAbilities in Swedish Preschoolers.” British Journal of Developmental Psychology 8: 335–349.
Broberg, A. G., H. Wessels, M. E. Lamb, and C. P. Hwang. 1997. “Effects of Day Care on theDevelopment of Cognitive Abilities in 8-Year-Olds: A Longitudinal Study.” DevelopmentalPsychology 33: 62–69.
Brooks-Gunn, J., M. C. McCormick, S. Shapiro, A. A. Benasich, and G. W. Black. 1994. “The Effects ofEarly Education Intervention on Maternal Employment, Public Assistance and Health Insurance:The Infant Health and Development Program.” American Journal of Public Health 84: 924–931.
Browning, K. S., C. W. Runyan, and J. B. Kotch. 1996. “A Statewide Survey of Hazards in Child CareCenters.” Journal of Injury Prevention 2: 202–207.
Bryant, D. M., K. L. Maxwell, and M. Burchinal. 1999. “Effects of a Community Initiative on the Qualityof Child Care.” Early Childhood Research Quarterly 14: 449–464.
Burchinal, M. R. 1999. “Child Care Experiences and Developmental Outcomes.” Annals of the AmericanAcademy of Political and Social Science 563: 73–97.
Burchinal, M. R., C. Howes, and S. Kontos. 1999. “Structural Predictors of Child Care Quality in ChildCare Homes.” Paper presented at the SEED Conference, Bethesda, MD.
Burchinal, M. R., J. E. Roberts, L. A. Nabors, and D. M. Bryant. 1996. “Quality of Center Child Care andInfant Cognitive and Language Development.” Child Development 67: 606–620.
Burchinal, M. R., J. E. Roberts, R. Riggins, S. A. Zeisel, E. Neebe, and D. Bryant. 2000. “RelatingQuality of Center Child Care to Early Cognitive and Language Development Longitudinally.”Child Development 71: 339–357.
Campbell, F. A., and C. T. Ramey. 1995. “Cognitive and School Outcomes for High Risk AfricanAmerican Students at Middle Adolescence: Positive Effects of Early Intervention.” AmericanEducational Research Journal 32: 743–772.

103
Center for Career Development in Early Care and Education. 1999. “Child Care Centers: Child StaffRatio and Group Size Requirements.” Boston, MA: Wheelock College.
Chin-Quee, D. S., and S. Scarr. 1994. “Lack of Early Child Care Effects on School-Age Children’s SocialCompetence and Academic Achievement.” Early Development and Parenting 3: 103–112.
Clarke-Stewart, K. A., and G. G. Fein. 1983. “Early Childhood Programs.” In Handbook of ChildPsychology, Volume II: Infancy and Developmental Psychobiology, edited by P. H. Mussen. NewYork: John Wiley and Sons.
Clarke-Stewart, K. A, C. P. Gruber, and L. M. Fitzgerald. 1994. Children at Home and in Day Care.Hillsdale, NJ: Erlbaum.
Clarke-Stewart, K. A., D. L. Vandell, M. Burchinal, M. O’Brien, and K. McCartney. 2000. “Do Featuresof Child Care Homes Affect Children’s Development?” Unpublished paper, University ofCalifornia, Irvine.
Connelly, R., and J. Kimmel. 2000. Marital Status and Full-Time/Part-time Work Status in Child CareChoices. Kalamazoo, MI: W.E. Upjohn Institute.
Council of Economic Advisers. 1997. The Economics of Child Care. December.<http://www.whitehouse.gov/WH/EOP/CEA/html/childcare.html#econ>.
Deater-Deckard, K., R. Pinkerton, and S. Scarr. 1996. “Child Care Quality and Children’s BehavioralAdjustment: A Four-Year Longitudinal Study.” Journal of Child Psychology and Psychiatry andAllied Disciplines 37: 937–948.
Dunn, L. 1993. “Proximal and Distal Features of Day Care Quality and Children’s Development.” EarlyChildhood Research Quarterly 8: 167–192.
Dunn, L., S. A. Beach, and S. Kontos. 1994. “Quality of the Literacy Environment in Day Care andChildren’s Development.” Journal of Research in Childhood Education 9: 24–34.
Early Learning, Later Success: The Abecedarian Study. 1999. Chapel Hill, NC.<http:www.fpg.unc.edu/~abc/embargoed/executive_summary.htm>.
Elicker, J., C. Fortner-Wood, and I. C. Noppe. 1999. “The Context of Infant Attachment in Family ChildCare.” Journal of Applied Developmental Psychology 20(2): 319–336.
Field, T. M. 1991. “Quality Infant Day-Care and Grade School Behavior and Performance.” ChildDevelopment 62: 863–870.
Fosburg, S. 1981. Family Day Care in the United States: National Day Care Home Study, Volume I:Summary of Findings. DHHS Publication No. OHDS 80-30282. Washington, DC: U.S.Department of Health and Human Services.
Fuller, B., S. L. Kagan, and G. Caspary. 1999. “Variation in Poor Children’s Home and Child CareSettings: Does Maternal Employment Matter?” Presented at the conference convened by the
104
Northwester and University of Chicago Joint Center for Poverty Research held in Washington,DC, September 1999.
Goelman, H. 1988. “The Relationship between Structure and Process Variables in Home and Day CareSettings on Children’s Language Development.” In The Practice of Ecological Research: FromConcepts to Methodology, edited by A. Pence and H. Goelman. New York: Teachers CollegePress
Goelman, H., and A. R. Pence. 1987. “Effects of Child Care, Family, and Individual Characteristics onChildren’s Language Development: The Victoria Day Care Research Project.” In Quality in ChildCare: What Does Research Tell Us? edited by D. Phillips. Washington, DC: National Associationfor the Education of Young Children.
Hagekull, B., and G. Bohlin. 1995. “Day Care Quality, Family and Child Characteristics andSocioemotional Development.” Early Childhood Research Quarterly 10: 505–526.
Hanushek, E., and J. Jackson. 1977. Statistical Methods for Social Scientists. New York: Academic Press.
Harms, T., and R. M. Clifford. 1980. Early Childhood Environment Rating Scale. New York: TeachersCollege Press.
Harms, T., and R. Clifford. 1989. Family Day Care Rating Scale. New York: Teachers College Press.
Harms, T., D. Cryer, and R. M. Clifford. 1990. Infant/Toddler Environment Rating Scale. New York:Teachers College Press.
Hausfather, A., A. Toharia, C. LaRoche, and F. Engelsmann. 1997. “Effects of Age of Entry, Day-CareQuality, and Family Characteristics on Preschool Behavior.” Journal of Child Psychology andPsychiatry and Allied Disciplines 38: 441–448.
Helburn, S., et al. 1995. Cost, Quality, and Child Outcomes in Child Care Centers. Public Report.Denver, CO: Dept of Economics, Center for Research in Economic and Social Policy, Universityof Colorado.
Helburn, S., ed. 1995. Cost, Quality and Child Outcomes in Child Care Centers: Technical Report.Denver, CO: Dept of Economics, Center for Research in Economic and Social Policy, Universityof Colorado.
Hestenes, L. L., S. Kontos, and Y. Bryan. 1993. “Children’s Emotional Expression in Child Care CentersVarying in Quality.” Early Childhood Research Quarterly 8: 295–307.
Hofferth, S. 1995. “Caring for Children at the Poverty Line.” Children and Youth Services Review17(1/2): 1–31,
Hofferth, S. 1999. “Child Care, Maternal Employment and Public Policy.” Annals of the AmericanAcademy 563: 20–38.
Hofferth, S. L., A. Brayfield, S. Deich, and P. Holcomb. 1991. National Child Care Survey, 1990, Report91-5. Washington, DC: Urban Institute Press.
105
Hofferth, S. L., K. A. Shauman, R. R. Henke, and J. West. 1998. Characteristics of Children’s EarlyCare and Education Programs: Data from the 1995 National Household Education Survey.Report No. 98-128. Washington, DC: U.S. Department of Education, National Center forEducation Statistics.
Hofferth, S. L., and D. A. Wissoker. 1992. “Price, Quality, and Income in Child Care Choice.” Journal ofHuman Resources 27: 70–111.
Holloway, S. D., and M. Reichhart-Erickson. 1988. “The Relationship of Day Care Quality to Children’sFree Play Behavior and Social Problem-Solving Skills.” Early Childhood Research Quarterly 3:39–53.
Howes, C. 1983. “Caregiver Behavior in Center and Family Day Care.” Journal of AppliedDevelopmental Psychology 4: 99–107.
Howes, C. 1988. “Relations between Early Child Care and Schooling.” Developmental Psychology 24:53–57.
Howes, C. 1990. “Can the Age of Entry into Child Care and the Quality of Child Care Predict Adjustmentin Kindergarten?” Developmental Psychology 26: 292–303.
Howes, C. 1997. “Children’s Experiences in Center-Based Child Care as a Function of TeacherBackground and Adult:Child Ratio.” Merrill-Palmer Quarterly 43: 404–425.
Howes, C., and M. Olenick. 1986. “Family and Child Care Influences on Toddlers’ Compliance.” ChildDevelopment 57: 202–216.
Howes, C., D. A. Phillips, and M. Whitebrook. 1992. “Thresholds of Quality: Implications for the SocialDevelopment of Children in Center-Based Child Care.” Child Development 63: 449–460.
Howes, C., and J. Rubenstein. 1985. “Determinants of Toddlers’ Experience in Day Care: Age of Entryand Quality of Setting.” Child Care Quarterly 42: 140–151.
Howes, C., and E. W. Smith. 1995. “Relations among Child Care Quality, Teacher Behavior, Children’sPlay Activities, Emotional Security, and Cognitive Activity in Child Care.” Early ChildhoodResearch Quarterly 10: 381–404.
Howes, C., and P. Stewart. 1987. “Child’s Play with Adults, Toys, and Peers: An Examination of Familyand Child Care Influences.” Developmental Psychology 23: 423–530.
Howes, C., M. Whitebook, and D. Phillips. 1992. “Teacher Characteristics and Effective Teaching inChild Care. Findings from the National Child Care Staffing Study.” Child and Youth Care Forum21: 399–414.
Iutcovich, J., R. Fiene, J. Johnson, R. Koppel, and Langan. 1997. Investing in Our Children’s Future: ThePath to Quality Child Care through the Pennsylvania Child Care/Early Childhood DevelopmentTraining System. Erie, PA: Keystone University Research Corporation.
106
Jacobs, E. V., and D. R. White. 1994. “The Relationship of Child-Care Quality and Play to SocialBehavior in the Kindergarten.” In Children’s Play in Child Care Settings, edited by H. Goelmanand E. V. Jacobs. Albany, NY: State University of New York Press.
Kisker, E. E., S. L. Hofferth, D. S. Phillips, and E. Farquhar. 1991. A Profile of Child Care Settings:Early Education and Care in 1990, Volume 1. Princeton, NJ: Mathematica Policy Research.
Kontos, S. J. 1991. “Child Care Quality, Family Background, and Children’s Development.” EarlyChildhood Research Quarterly 6: 249–262.
Kontos, S., C. Howes, and E. Galinsky. 1996. “Does Training Make a Difference to Quality in FamilyChild Care?” Early Childhood Research Quarterly 11: 427–445.
Kontos, S., C. Howes, M. Shinn, and E. Galinsky. 1995. Quality in Family Child Care and Relative Care.New York: Teachers College Press.
Kontos, S., and A. Wilcox-Herzog. 1997. “Influences on Children’s Competence in Early ChildhoodClassrooms.” Early Childhood Research Quarterly 12: 247–262.
Kotch, J., and C. Guthrie. 1998. “Effect of a Smart Start Playground Improvement Grant on Child CarePlayground Hazards.” Smart Start Evaluation Report. Chapel Hill, NC: Frank Porter GrahamChild Development Center.
Lally, J. R., P. L. Mangione, A. S. Honig, and D. S. Wittner. 1988. More Pride, Less Delinquency:Findings from the Ten-Year Follow-Up Study of the Syracuse University Family DevelopmentResearch Program.
Lamb, M. E. 1998. “Nonparental Child Care: Context, Quality, Correlates, and Consequences.” InHandbook of Child Psychology, Vol. 4: Child Psychology in Practice, edited by W. Damon, I. E.Sigel, and K. A. Renninger. New York: John Wiley.
Lamb, M. E., C. P. Hwang, A. Broberg, et al. 1988. “The Effects of Out-of-Home Care on theDevelopment of Social Competence in Sweden: A Longitudinal Study.” Early ChildhoodResearch Quarterly 3: 379–402.
Leibowitz, Arleen, J. A. Klerman, and L. Waite. 1992. “Employment of New Mothers and Child CareChoice: Differences by Children’s Age.” Journal of Human Resources 27: 112–133.
Love, J. M., P. Z. Schochet, and A. L. Meckstroth. 1996. “Are They in Any Real Danger? What ResearchDoes—and Doesn’t—Tell Us about Child Care Quality and Children’s Well-Being.” Report.Princeton, NJ: Mathematica Policy Research.
Mankiw, N. G. 1998. Principles of Economics. Fort Worth: Dryden Press.
Maume, D. 1991. “Child Care Expenditures and Women’s Employment Turnover.” Social Forces 70:494–508.
McCartney, K. 1984. “Effect of Quality of Day-Care Environment on Children’s LanguageDevelopment.” Developmental Psychology 20: 244–260.
107
McCartney, K., and R. Rosenthal. 2000. “Effect Size, Practical Importance, and Social Policy forChildren.” Child Development 71: 173–180.
McCartney, K., S. Scarr, D. Phillips, and S. Grajek. 1985. “Day Care as Intervention: Comparison ofVarying Quality Programs.” Journal of Applied Developmental Psychology 6: 247–260.
McCartney, K., S. Scarr, A. Rocheleau, D. Phillips, M. Abbott-Shim, M. Eisenberg, N. Keefe, S.Rosenthal, and J. Ruh. 1997. “Teacher-Child Interaction and Child-Care Auspices as Predictorsof Social Outcomes in Infants, Toddlers, and Preschoolers.” Merrill-Palmer Quarterly 43:426–450.
Meyers, M. K. 1993. “Child Care in Jobs Employment and Training Programs: What Difference DoesQuality Make?” Journal of Marriage and the Family 55: 767–783.
Michael, R. 1982. “Measuring Non-Monetary Benefits of Education: A Survey.” In Financing Education:Overcoming Inefficiency and Inequity, ed. W. McMahon and T. Geske. Urbana, IL: University ofIllinois Press.
National Household Education Survey. 1998. <http://nces.ed.gov/nhes/>.
NICHD Early Child Care Research Network. 1994. “Child Care and Child Development: The NICHDStudy of Early Child Care.” In Developmental Follow-Up: Concepts, Domains, and Methods,edited by S. L. Friedman and H. C. Haywood. New York: Academic Press.
NICHD Early Child Care Research Network. 1996. “Characteristics of Infant Child Care: FactorsContributing to Positive Caregiving.” Early Childhood Research Quarterly 11: 269–306.
NICHD Early Child Care Research Network. 1997a. “Familial Factors Associated with Characteristics ofNonmaternal Care for Infants.” Journal of Marriage and the Family 59: 389–408.
NICHD Early Child Care Research Network. 1997b. “Poverty and Patterns of Child Care.” InConsequences of Growing up Poor, edited by J. Brooks-Gunn and G. Duncan. New York:Russell-Sage. Pp. 100–131
NICHD Early Child Care Research Network. 1998. “Early Child Care and Self-Control, Compliance, andProblem Behaviors at Twenty-Four and Thirty-Six Months.” Child Development 69: 1145–1170.
NICHD Early Child Care Research Network. 1999a. “Child Outcomes When Child Care Center ClassesMeet Recommended Standards of Quality.” American Journal of Public Health 89: 1072–1077.
NICHD Early Child Care Research Network. 1999b. “Effect Sizes from the NICHD Study of Early ChildCare.” Paper presented at the biennial meeting of the Society for Research in Child Development,Albuquerque, NM. April.
NICHD Early Child Care Research Network. 2000a. “Characteristics and Quality of Child Care forToddlers and Preschoolers.” Applied Developmental Science 4: 116–135.
NICHD Early Child Care Research Network. 2000b. “The Relation of Child Care to Cognitive andLanguage Development.” Child Development 71: 960–980.

108
NICHD Early Child Care Research Network. Submitted for publication. “Early Child Care and Children’sPeer Relationships at 24 and 36 Months.”
Niffenegger, J. P. 1997. “Proper Handwashing Promotes Wellness in Child Care.” Journal of PediatricHealth Care 11: 26–31.
Peisner-Feinberg, E. S., and M. R. Burchinal. 1997. “Relations between Preschool Children’s Child-CareExperiences and Concurrent Development: The Cost, Quality, and Outcomes Study.” Merrill-Palmer Quarterly 43: 451–477.
Peisner-Feinberg, E. S., M. R. Burchinal, R. M. Clifford, M. L. Culkin, C. Howes, S. L. Kagan, N.Yazejian, P. Byler, J. Rustici, and J. Zelazo. 1999. The Children of the Cost, Quality, andOutcomes Study Go to School: Technical Report.
Phillips, D. A., ed. 1987. Quality in Child Care: What Does Research Tell Us? Washington, DC: NationalAssociation for the Education of Young Children.
Phillips, D. A., ed. 1995. Child Care for Low Income Families: Summary of Two Workshops.Washington, DC: National Academy Press. Report available at<http://nccic.org/research/nrc_care/c_care.html>.
Phillips, D. A., K. McCartney, and S. Scarr. 1987. “Child-Care Quality and Children’s SocialDevelopment.” Developmental Psychology 23: 537–544.
Phillipsen, L. C., M. R. Burchinal, C. Howes, and D. Cryer. 1997. “The Prediction of Process Qualityfrom Structural Features of Child Care.” Early Childhood Research Quarterly 12: 281–303.
Pierrehumbert, B., T. Ramstein, A. Karmaniola, and O. Halfon. 1996. “Child Care in the Preschool Years:Attachment, Behaviour Problems and Cognitive Development.” European Journal of Psychologyof Education 11: 201–214.
Powell, I., and J. Cosgrove. 1992. “Quality and Cost in Early Childhood Education.” Journal of HumanResources 27: 472–484.
Pungello, E. P., and B. Kurtz-Costes. 1999. “Why and How Working Women Choose Child Care: AReview with a Focus on Infancy.” Developmental Review 19: 31–96.
Ramey, C. T., F. A. Campbell, and C. Blair. 1998. “Enhancing the Life-Course for High-Risk Children:Results from the Abecedarian Project.” In Social Programs That Really Work, edited by J. Crane.New York: Sage Publishing.
Ramey, C. T., F. A. Campbell, M. Burchinal, M. L. Skinner, D. M. Gardner, and S. L. Ramey. 2000.“Persistent Effects of Early Childhood Education on High-Risk Children and Their Mothers.”Applied Developmental Science 4: 2–14.
Reynolds, A. J., J. A. Temple, D. L. Robertson, and E. A. Mann. 2000. “Long-Term Benefits ofParticipation in Title I Chicago Child-Parent Centers.” Paper presented at the biennial meeting ofthe Society for Research on Adolescence, Chicago, IL. March.

109
Ross, C., and D. Paulsell. 1998. “Sustaining Employment among Low-Income Parents: The Role ofQuality in Child Care: A Research Review.” Final Report. Princeton, NJ: Mathematica PolicyResearch.
Ruopp, R., J. Travers, F. Glantz, and C. Coelen. 1979. Children at the Center: Final Report of theNational Day Care Study. Cambridge, MA: Abt Associates.
Scarr, S. 1998. “American Child Care Today.” American Psychologist 53: 95–108.
Scarr, S., M. Eisenberg, and K. Deater-Deckard. 1994. “Measurement of Quality in Child Care Centers.”Early Childhood Research Quarterly 9: 131–151.
Schliecker, E., D. R. White, and E. Jacobs. 1991. “The Role of Day Care Quality in the Prediction ofChildren’s Vocabulary.” Canadian Journal of Behavioural Science 23: 12–24.
Schweinhart, L. J., H. V. Barnes, D. P. Weikart, et al. 1993. Significant Benefits: The High/Scope PerryPreschool Study through Age 27. Ypsilanti, MI: High/Scope Press.
Siegel, and Loman. 1991. Child Care and AFDC Recipients in Illinois: Patterns, Problems and Needs.Prepared for the Division of Family Support Services, Illinois Department of Public Aid. St.Louis, MO: Institute of Applied Research.
Singer, J. D., B. Fuller, M. K. Keiley, and A. Wolf. 1998. “Early Child-Care Selection: Variation byGeographic Location, Maternal Characteristics, and Family Structure.” DevelopmentalPsychology 34: 1129–1144.
Stallings, J., and A. Porter. 1980. National Day Care Home Study: Observation Component. Final Report,Volume III. Administration for Children, Youth, and Families. Department of Health and HumanServices, SRI Project 6903.
Stith, S. M., and A. J. Davis. 1984. “Employed Mothers and Family Day-Care Substitute Caregivers: AComparative Analysis of Infant Care.” Child Development 55: 1340–1348.
St. Sauver, J., M. Khurana, A. Kao, and B. Foxman. 1998. “Hygienic Practices and Acute RespiratoryIllness in Family and Group Day Care Homes.” Public Health Reports 111: 544-551.
Teaching Strategies. 2000. <www.teachingstrategies.com>.
U.S. Department of Labor Bureau of Labor Statistics. 1992. Work and Family: Child-Care Arrangementsof Young Working Mothers. Report 820, January. Washington, DC.
U.S. General Accounting Office (GAO). 1990. Early Childhood Education: What Are the Costs of HighQuality Programs? HRD-90-43BR. Washington, DC: GAO.
U.S. General Accounting Office (GAO). 1994. Child Care: Child Care Subsidies Increase LikelihoodThat Low-Income Mothers Will Work.” HEHS/95-20. Washington, DC: GAO.
Vandell, D. L. 1997. “Introduction: Child Care as a Developmental Context.” Merrill-Palmer Quarterly43: 333–339.
110
Vandell, D. L. 1998. “Child Care for Low-Income Families: Dreams and Real Life.” In Children andFamilies in an Era of Rapid Change: Creating a Shared Agenda for Researchers, Practitionersand Policy Makers, edited by F. Lamb-Parker, J. Hagen, R. Robinson, and C. Clark. Washington,DC: Department of Health and Human Services.
Vandell, D. L., and M. A. Corasaniti. 1990. “Variations in Early Child Care: Do They Predict SubsequentSocial, Emotional, and Cognitive Differences?” Early Childhood Research Quarterly 5: 55–72.
Vandell, D. L., V. K. Henderson, and K. S. Wilson. 1988. “A Longitudinal Study of Children with Day-Care Experiences of Varying Quality.” Child Development 59: 1286–1292.
Vandell, D. L., and J. K. Posner. 1999. “Conceptualization and Measurement of Children’s After-schoolEnvironments.” In Measuring Environments Across the Lifespan: Emerging Methods andConcepts, ed. S. L. Friedman and T. Wachs. Washington, DC: American PsychologicalAssociation Press.
Vandell, D. L., and C. Powers. 1983. “Daycare Quality and Children’s Free Play Activities.” AmericanJournal of Orthopsychiatry 53: 493–500.
Vernon-Feagans, L., D. C. Emanuel, and I. Blood. 1997. “The Effect of Otitis Media and Quality Daycareon Children’s Language Development.” Journal of Applied Developmental Psychology 18:395–409.
Volling, B. L., and L. V. Feagans. 1995. “Infant Day Care and Children’s Social Competence.” InfantBehavior and Development 18: 177–188.
Whitebook, M., C. Howes, and D. Phillips. 1990. “Who Cares? Child Care Teachers and the Quality ofCare in America.” Final Report, National Child Care Staffing Study. Oakland, CA: Child CareEmployee Project.
Whitebook, M., C. Howes, and D. Phillips. 1998. Worthy Work, Unlivable Wages: The National ChildCare Staffing Study, 1988–1997.
Whitebook, M., L. Sakai, and C. Howes. 1997. “NAEYC Accreditation as a Strategy for Improving ChildCare Quality: An Assessment.” Final Report, National Center for the Early Childhood WorkForce. Washington, DC.
Wolfe, B., and S. Zuvekas. 1997. “Nonmarket Outcomes of Schooling.” International Journal ofEducational Research 27: 491–502.
Yarrow, M. R., and C. Zahn-Waxler. 1979. “Observing Interaction: A Confrontation with Methodology.”In The Analysis of Social Interactions: Methods, Issues and Illustrations, edited by R. B. Cairns.Hillsdale, NJ: Lawrence Erlbaum.