
Carbon reporting: does it matter?
39
CARBON REPORTING: DOES IT MATTER? by Matthew Haigh^ and Matthew Shapiro ^Correspondence: Dr. Matthew Haigh, School of Oriental and African Studies, University of London Thornhaugh Street, London WC1H 0XG, United Kingdom. Email: [email protected]. Dr. Matthew A. Shapiro, Illinois Institute of Technology, 3301 S. Dearborn St., Siegel Hall 116 Chicago, IL 60616-3793, United States. Email: [email protected].
-
Upload
curtinsarawak -
Category
Documents
-
view
5 -
download
0
Transcript of Carbon reporting: does it matter?

CARBON REPORTING: DOES IT MATTER?
by Matthew Haigh^ and Matthew Shapiro
^Correspondence: Dr. Matthew Haigh, School of Oriental and African Studies, University of London Thornhaugh Street, London WC1H 0XG, United Kingdom. Email: [email protected]. Dr. Matthew A. Shapiro, Illinois Institute of Technology, 3301 S. Dearborn St., Siegel Hall 116 Chicago, IL 60616-3793, United States. Email: [email protected].
CARBON REPORTING: DOES IT MATTER?
ABSTRACT
Purposes—We assess the significance of carbon reporting for investment analysis.
Design/Methodology/Approach—Adopting a twinned perspective of signification and
decision-usefulness, the paper assesses the methods that firms have used to identify, measure
and report carbon emissions; identifies the interest of financial institutions with respect to
those reports; and appraises a recent proposal from a non-state actor for general-purpose
carbon emissions reporting.
Findings—‘Carbon considerations’ at financial institutions constitute a discourse of the
imaginary. Investors have used financialised constructs to represent heavier polluters as
superior ‘carbon performers’ and have ignored carbon in asset allocation decisions. The take-
up of environmental considerations in the investment process is couched by institutional
features including the potential of markets to provide various perspectives on firm value, the
diversity of methods used to calculate, measure and report carbon emissions, the venue for
carbon reports and the quantum of data contained therein. Carbon reports have had some use
in corporate governance assessment.
Keywords: environmental investing, signification, carbon, decision-usefulness, discourse of
the imaginary.
1
CARBON REPORTING: DOES IT MATTER?
INTRODUCTION
There is a growing literature on voluntary carbon reporting, much of it noting the
significance of reporting itself rather than performing detailed empirical investigation
or a careful assessment of different types of carbon emissions, carbon intensities, and
carbon reports. This literature has missed many of the variations and nuances of the
operation of carbon performance metrics, and we suggest it is this detail that
ultimately determines the ability of investors to assess environmental risks affecting
the portfolio. Responding to calls for research on the consistency of climate-risk
reporting (e.g., Mizuguchi, 2009), this article describes and assesses recent investor-
led initiatives that have analysed how companies managed their greenhouse gases
emissions.
It is plausible that the limited involvement of privately managed financial institutions
in environmental policy is related to issues surrounding the significance and quality of
data on firms’ greenhouse gas emissions. Investor groups in Europe and elsewhere
have noted an absence of metrics that might be used in portfolio construction
processes. Adopting a twinned perspective of signification and decision-usefulness,
the paper assesses the methods that firms have used to identify and measure carbon
emissions; identifies the interest of financial institutions with respect to carbon
reports; and appraises a recent proposal from a non-state actor for general-purpose
carbon accounting reports. We identify and examine the differences between signified
reporting and the actual uses of reporting. Using the concept of signification and the

2
theoretical lenses of semiotic studies, we concentrate our analysis on the signification
produced in analysing companies’ carbon reports. The criteria we use for assessment
are Barthes’ (1972) approach to signification, and the principles of portfolio
management (e.g., Sharpe, 1992) adapted to environmental risks as they might affect
the portfolio. Barthes’ (1974, p. 91) analysis of the power of the photograph “to
convert” is relevant for the imaginary of carbon reporting. Politicians seeking (re-
)election often “adorn their electoral prospectuses with a portrait”. The signification
produced by the placement, the content, and the style of content of the photograph,
Barthes argues, influences the political chances of electoral candidates. We use this
semiotic analysis to identify the significance for investors of the placement, content
and style of content of carbon reports.
The paper contributes to work on the participation of institutional investors in
environmental policy (e.g., Clark and Hebb, 2005; Hagerman, 2007; Okereke, 2007)
and establishes a foundation for future research in general-purpose reporting on
greenhouse gas emissions. Supplemented by desk research, we use a series of
interviews to provide insights into investors’ motivations for environmental investing,
and the ways they use company-issued carbon reports. A judgmental sample of thirty-
two professionals working in financial institutions and service organizations located in
North America, Europe, Japan and Australia is obtained for interview. Secondary data
are obtained from an exhaustive review of regulatory and industry pronouncements on
carbon reporting; company data collected and analysed by the Carbon Disclosure
Project; and public responses to an exposure draft on a general-purpose carbon
emissions reporting framework, issued in 2009 by the Climate Disclosure Standards
Board.
3
The article divides into four sections. In what immediately follows, a reasonable basis
for general-purpose carbon reporting is considered. A restriction is placed to forms of
reporting that would suit conventional portfolio selection processes but not other
purposes such as widened stakeholder reporting. In this sense, ‘general-purpose’ refers
to company reports made available to fund managers, equity analysts, and investment
brokerages. Interview data informs the utility of company carbon reports for investors’
decision-making processes. Following, selected pronouncements on carbon emissions
calculations and reporting are reviewed. A subsequent section adopts a case approach
to assess the ways in which the Carbon Disclosure Project has analysed firms’
reported greenhouse gas emissions. A concluding section summaries the analysis and
allows space for consideration of the received significance of carbon reporting, using a
case to highlight issues associated with the quantum, format and venue of carbon
reports.
TOWARDS A REASONABLE BASIS FOR CARBON REPORTING
The section begins by discussing investors’ information requirements. Interview data
are then used to discuss the significance of measurement and reporting issues. Barth et
al. (2004) suggest that government policies encouraging corporate control by the
private sector and emphasising accurate disclosure of information may be associated
with greater stability and, hence, lower levels of portfolio risk over investment
horizons. Although empirical support for these arguments has not surfaced,
environmental investing has the potential to challenge the theory of portfolio
management. Hence, the governance and technical processes, to use a distinction
brought by Lovell and Liverman (2010), by which an investor might identify and take
the characteristics of ‘carbon-sensitive’ assets into account deserve consideration.
4
Our decision to frame carbon reporting in terms of the utility of calculation and
measurement methods for the investment portfolio construction process follows a
combination of Jegadeesh et al. (2004), Schaltegger and Burritt (2000) and Lease et
al. (1976). Criticism might be made that our approach ignores the needs of multiple
stakeholders. Governance issues associated with ecological programs such as water
and climate management cannot be discounted (e.g., Friel et al., 2009; Füssel and
Klein, 2006); however, if reporting requirements of companies were to be widened to
address the interests of indirect stakeholders, the interest of the financial markets in
environmental remediation, mitigation and the like might be (further) dissipated[i
The Tobin-Markowitz portfolio theory on which capital markets are based (Elton and
Gruber, 1995) conceives of investor governance as consisting of the satisfaction of
short-term investment yield targets, and requiring little involvement with invested
companies provided that certain minimum information requirements are met
(Markowitz, 1952, 1971). Such a conceptualisation implies that financial institutions
are interested in the governance of individual companies only to the extent of
compliance with applicable laws and codes (Sharpe, 1992). Insofar as index-driven
investing approaches are concerned, this perspective accurately describes current
].
Lovell and Liverman (2010) are motivated in their review of carbon trading
mechanisms by the absence of widely used international standards or regulations. We
are similarly motivated by the absence of widely used international standards or
regulations for voluntary carbon reporting. Framing our analysis in terms of investors’
information requirements allows us to use a well-understood method to evaluate the
methods used to construct carbon reports, and considering also the social world of
financial services intermediaries, regulators and carbon consultancies.

5
practice. As such, the following might represent an institutional investor’s minimum
information requirements:
• Each company should disclose adequate information so that investors can calculate
the risk, return and value of each potential and actual investment asset.
• The investor needs to have enough information to assess how the company risk and
return makes a marginal contribution to the risk and return of the portfolio.
• The investor needs enough information on all assets to calculate the risk and return
of the overall portfolio, and to assess if full diversification benefits have been
achieved.
• This information should be sufficient to allow the investor to assess if the risk and
return of the portfolio matches or exceeds that of average portfolio values, the latter
being measured by that attainable in a benchmark portfolio.
It should be stated that the information needs of financial institutions that adopt
‘active’ management styles, which would include taking cognisance of ‘environmental
considerations’ in the portfolio construction process, would differ to those assumed by
the Tobin-Markowitz portfolio model (Clarkson et al., 2010). Since Lease et al.
(1974), scholars have noted that active-styled mutual fund investors seeking to
identify ‘mis-priced’ valuations of companies employ a range of decision criteria
wider than the information requirements of portfolio risk and investment return.
Dozens of studies since have challenged the assumption that an investor’s sole
objective is to achieve an appropriately balanced investment risk/return profile (e.g.,
Cochrane, 2000; Ferreira and Matos, 2008).
Climate-change researchers providing services to financial institutions may be able to
identify new unusual assets with unusual risk and return behaviours likely to emerge

6
in a carbon emissions-restricted world and which may persist over business cycles and
longer horizons. This kind of research can provide hints as to where new
diversification and value benefits might arise in carbon emissions-restricted
investment portfolios. These would include ‘passive’ diversified portfolios represented
in the world’s major stock exchanges, and ‘active’ thematic portfolios concentrated
on, e.g., sustainable energy stocks. Active-styled investors can be expected to direct
attention to attributes of individual stocks, such as qualitative information about
companies and their management and business models, including information on
company environmental programmes and how companies address identify and address
environmental and reputational risks (Holland, 2006).
We use the multi-attribute cognitive model offered in Capon et al. (1996) as a
conceptual basis for our analytical approach. Capon et al. (1996) studied a group of
3,386 retail investors in mutual funds offered in continental US in 1991, seeking to
determine the sources of information and the criteria that investors used to select
between mutual funds. The model offered in Capon et al. (1996) handles multi-
dimensional behavioural motivations and diverse inputs to decision-making, making it
useful for the present paper. In an initial information-gathering phase, investors
(consumers) source various information sources so as to construct a number of
product and service attributes that they rank as important when assessing alternative
product offerings. These information sources are referred to as selection criteria.
This allows us to present a set of selection criteria for environmentally responsive
investing. The following combines the information requirements of Sharpe (1992) as
set out above; Capon et al. (1996); and the environmental accounting requirements set
out in Schaltegger and Burritt (2000, pp. 52, 55, 211, 357, 361).
7
• The investor needs to have sufficient information to assess how company
sustainable development and environmental protection programmes are
operationalised in company business models.
• Each company should provide information on sustainable development sufficient to
allow investors to integrate economic and environmental performance indicators.
• This information should be sufficient to allow the investor to develop indicators
which can be used to determine the exposure of the environmental component of an
investor’s overall portfolio to movements in the portfolio return.
• This information, in turn, can be used to determine the investor's overall effective
asset mix.
Satisfaction of the above is expected to meet the requirements for environmental
investing.
Mandatory national reporting requirements have been brought and binding and non-
binding pronouncements have been issued by the United Nations’ Kyoto Protocol and
regulators in Japan, the UK, the EU, and some US states with respect to greenhouse
gas emissions trading systems and environmental management systems. Multiple non-
regulated reporting initiatives and frameworks were in issue at the time of writing
(June 2010)[ii]. It has been suggested that not more than one in ten financial
institutions has taken steps to measure its portfolio-level exposure to risks posed by
climate change and its attendant regulatory environment[iii]. Reliance in portfolio
construction on standardised data such as quoted asset prices and predetermined funds
inflows would preclude, in the usual case, the use of probability estimates on
contingent events such as those issued by the Intergovernmental Panel on Climate
Change. Furthermore, untested, exotic products such as trading in options on

8
greenhouse gas emissions rights with no guarantee of continuance beyond 2012,
catastrophe bonds, climate risk futures, and climate-related exchange traded contracts
are not in the standard purvey of trustee management[iv
The terms of reference for the Review are very broad and it is therefore difficult
for us to understand the specific information or evidence that could usefully
inform your work. Perhaps we could arrange to meet together with some of the
institutional investors active in this area at some point in the New Year to allow
us to better understand your requirements and how we may contribute to this
process.[
]. A level of disengagement of
the financial markets in climate policy can indeed be noted. The following quotation is
indicative. It forms part of a submission by the Institutional Investors Group on
Climate Change to the British inquiry on climate management (see, Stern Review,
2008).
v
To understand how investors take account of carbon-related issues and use company-
issued carbon reports, thirty interviews were conducted by the first-named author in
May through August of 2010 with chief executives and heads of investment functions
in selected financial institutions. The sample is constructed using professional
networks of the first-named author and suggestions from staffers at industry
conferences held in Europe, US and Australia attended by the first-named author. The
organizations represented by interviewees are located in the US, Japan, Australia, UK,
Italy, Germany, France, Norway and Denmark. By design, the sample captures the
main investment markets in which investors have been known to express interest in
company-supplied carbon data; both large investors (over US$500 million funds under
management and over 100 employees) and smaller investors; public-sector and
]
9
private-sector pension funds and insurance companies, as well as private equity firms
and mutual funds; the principal functions in investment decision processes, viz.,
trustees, portfolio managers, and analysts; and experienced users of company-supplied
environmental data (ten or more years of experience) and novice users.
Multiple approaches are used to ensuring quality of the interview data. One,
understanding of the issues of relevance to the participants was gained prior to
interview. Understanding is obtained from the first-named author’s prior research and
personal professional networks. Two, multiple methods of data collection are
deployed in order to check accuracy of interviewee statements. Observational data
found in written material issued by the represented organizations are combined with
interview data. Ensuring authentic input and access to full participation for all
participants in all aspects of research process and representation of findings is
achieved with member checking.
Imagining the future. Starting our analysis with the sphere of voluntary carbon
reporting, the concept of signification provides a framework for understanding the
complex motivations for investors’ interest carbon reporting. According to Barthes
(1964), the materials of semiotics include written myth and narrative; the spoken in
press, prospectus, interview and conversation; and possibility of the unspoken giving
an inner language ruled by the laws of imagination. It is the aspect of an imagined
signification which interests us. Imagination has arguably become a main focus of
regulatory and professional effort. For instance, the integrity of the voluntary
environmental reporting process has received criticism for the ideology brought by an
imaginary discourse of sustainable development (Milne et al., 2009).

10
Our examination of actors in managed investment is based on a claim that language,
and symbolic systems in general, is an agency that, by positioning human beings as
subjects, produces subjectivity. Institutional features blocking, for some interviewees,
their vision of a carbon-restricted world were absence of fungible (standardised)
markets trading at appropriate volumes, absence of carbon quantities in financial
reports, and isomorphic pressure, namely, that it could be observed that most financial
institutions had not invested according to environmental considerations. Lending
weight to the salience of a discourse of the imaginary, interviewees gave an
impression they were attempting to convince themselves and the interviewer that
environmental investing made sense simply because it was expected to be profitable.
All interviewees mentioned carbon prices as a motivator for environmental
investing—if they were to invest in the first place according to environmental
considerations: few did (another imaginary).
Most interviewees considered the price of carbon below its worth, complaining that
the absence of a fungible carbon trading market related to an untradable carbon price.
Possibly as outcome, differences between the causes and management of GHG
emissions between and within sectors are being glossed by investors due to the
absence of such matters in financial statements, e.g., GAAP precludes carbon
emissions as an asset or liability unless arising directly from a commercial transaction.
Another reason is that carbon emissions have not appeared in viable trading markets,
which is to say, trading in volumes that meet investors’ minimum investment
thresholds. Until these changes are effected, most financial institutions are unlikely to
include carbon considerations in their decision processes.

11
We characterise the imagination associated with strategising ‘carbon’ in investment
decision-making processes as an ideal constituted by a yearning for utopia, and by a
resigned frustration that this utopia is not in sight. This might be expected from the
option available to actors who face restrictions from organizational frameworks and
processes, as argued by Larrinaga-Gonzalez and Bebbington (2001). The following
interview extract gives of an anticipated world of environmentally responsive
investment managers, legislators, and companies.
Carbon reports currently don't allow us to make investment decisions, but we
anticipate that they will once we have a price. In the absence of a clear carbon
price, the impact of carbon emissions is really speculative. We don't want to go
there at the moment. (Interview, Corporate governance advisor of a US
education-sector pension fund)
The interviewee above explained that although his financial institution had collected
data on company carbon emissions, the exigencies of the investment process had not
permitted that data to be used for any purpose. Some interviewees cited social justice
and intergenerational equity as grounds to allocate funds towards ‘carbon-sensitive’
asset classes.
What really matters is having policies that are put in place in order to support
the creation of large-scale renewable energy facilities that reduce carbon
emissions around the world. It is about policies that are set up to help countries
that need help, especially China and India, about how they can be assisted to
choose green technologies. And it is those types of policies that will help us
(establish) these technologies. They are only just on a cost curve so with the
right sort of policies they will be mature and quality assets in their own right.

12
This is all strictly from a fiduciary basis. (Interview, Trustee of a European
public-sector insurance company)
Turning our analysis to the sphere of mandated carbon reporting, the discourse of the
imaginary appears again. Some interviewees hoped that legislators would mandate that
the scope of fiduciary duty would include investors to consider ‘long-term’ matters
such as the environment.
We are not going to do anything unless and until sustainable energy is given the
go-ahead from governments. (Interview, Research provider operating in the
French capital market)
The following extract indicates a conception of fiduciary responsibilities that includes
environmental welfare with private interests.
I think we should all ask ourselves why we should be doing this? Because it is
outside our fiduciary responsibilities to adopt any sort of messaging strategy
targeting to save the world or anything like that. We are here to make money for
the benefits of our organizations, our pensioners and our membership. That’s
what it’s all about. (Interview, Fiduciary of a European public-sector pension
fund)
The discourse of imaginary investing by reference to environmental considerations
seems to follows a path process involving relational processes between the state and
the financial markets, as a explains:
Regulation has to be tighter on companies if […] we’re going to see some kind
of results. At the moment we don’t have any evidence that we’re doing anything
13
to reduce carbon emissions. Governments [should] provide the right kind of
subsidies so that investors—long-term investors—will bring their acts and their
money to the table. (Interview, Advisor to a European public-sector insurance
company)
Investors are not short on the kinds of policies they expect to bring about ecological
improvements.
Effective climate regulation from an investor's perspective would be provision of
short and long-term performance targets, market-based practices that set up
robust carbon prices, and stimuluses to the renewable energy industry.
Comprehensive information disclosure on a standardised disclosure platform is
number two, and targeted governmental intervention for market development is
probably number three. (Interview, Chief investment officer of a US public-
sector pension fund)
An argument appearing in a significant proportion of interview extracts is that public
policies should treat privately managed capital flows as a public policy tool.
The number doesn’t matter. What really matters is that the bulk of the money
needed for carbon emissions reductions should come from private sources. Now
that doesn’t happen if not supported by very, very strong policies and very, very
committed targets and very, very ambitious policies set up by national
governments housed by international treaties. (Interview, Fiduciary of European
insurance company)
The interview data support the Capon et al. (1996) model of investment behaviour.
Investors are able to handle multi-dimensional behavioural motivations and diverse
14
inputs to decision-making. The next section turns to methods available to calculate,
measure and report industrial carbon emissions.
UNDERSTANDING CARBON REPORTING METHODS
The material for this section was identified in Agnolucci et al. (2009) and Busch and
Hoffman (2007) and from a review of pronouncements issued in the US, the EU,
Australia and Japan. The methods selected for review (see an appendix for references)
are those mandated in the UNFCCC’s Kyoto Protocol reference manual on accounting
of GHG emissions, and in European Directives; and four discretionary methods:
input-output analysis; decomposition analysis; British Standard PAS 2050; and the
Greenhouse Gas Protocol Standards. The latter are derived from standards issued by
the International Standards Organization.
The Kyoto Protocol and the European Directives have mechanisms to define carbon
emissions and carbon emissions reductions strictly. In contrast, the voluntary reporting
market is characterised by a variety of competing approaches, and the definitions and
calculation methods contained in these approaches differ. All the voluntary methods
recommend that emissions be reported as a function of intensity; the basis of an
intensity calculation is given as the volume of measured carbon-equivalent emissions
relative to a production or financial base. The idea is that carbon intensity indicates the
carbon performance of the emitter. Figure 1 below presents an analysis of the methods
reviewed.
[insert Figure 1 here]
15
We note that while there is a body of data on mandated carbon reporting
methodologies, there are few comparable data available in the voluntary carbon
reporting market. Our review notes that the averaging of GHG intensities across
industrial sectors as required in input-output analysis may have appeal to an
investment analyst concerned with deviations of portfolios from well-known stock
exchange indexes (Pope and Yadav, 1994). The utility of I/O analysis for portfolio
analysis is limited as the method is most suited to construction and resource
extraction; entails complex calculations for emissions which may not be possible
without modification to reporters’ information systems; and contains a number of non-
trivial limitations, such as ignoring reductions in emissions that should come with
economies of scale. The latter might skew investors’ analysis of, e.g., growth sectors.
PAS 2050 offers more appeal for portfolio analysis given the level of specification
called for, its extension to service industries (absent in other guidance), and its
flexibility with conventional management accounting systems. The other methods
reviewed cannot be considered suitable for (nor are they focused on) the purposes of
investment management. Kyoto and the EC pronouncements permit that “carbon
intensity” may be used as a policy tool with a proviso that the components part of the
calculation is correlated with the generation of CO2 emissions. At this point, it
becomes appropriate to consider a case of systematic, sector-specific carbon reporting
made to satisfy the information needs of institutional investors.
ASSESSING CARBON REPORTS
The data and reports analysed in this section are produced by the Carbon Disclosure
Project, which since 2003 has followed a practice of sending information requests to

16
companies appearing in the world’s most popular stock indexes. The CDP annual
information request addresses a company’s energy uses. CDP uses the data provided
to produce and rank carbon intensity scores. Additionally, the proportions of answered
questions on the information request are used to construct a performance measure
called the Carbon Disclosure Leaders Index. CDP issues the rankings produced to its
‘signatories’, numbering around 400 financial institutions spread around the world.
The CDP carbon intensity calculation involves summing a company’s direct emissions
and dividing the result by the company’s annualised operating revenue, expressed per
million USD. The conceptual basis for the calculation was given by two interviewees,
one working at CDP and the other a chartered accountant providing data quality
services to CDP, as an intention to monetise emissions and so attract the attention of
investment analysts familiar with performance measures based on accounting
revenues. An investigation of the intensity construct is useful.
The document selected for analysis is the 2008 FTSE 350 Report issued by the CDP.
The FTSE 350 index covers most of the industrial sectors and geographical regions of
the UK economy, as well as certain other transnational companies. The dominance of
the FTSE 350 in Europe makes it an important group of companies, highlighted by EU
requirement for companies to report and have verified their greenhouse gas emissions.
The 2008 FTSE 350 Report contains analyses of data received from 233 companies
which responded to a questionnaire sent by CDP in November 2007 to the Chair of the
Board of FTSE 350 companies.
CDP’s calculation and presentation of emissions intensity can be illustrated by Royal
Dutch Shell plc (ticker: RDS.A). Shell disclosed that in 2007 it had generated 92
million metric tonnes of carbon dioxide-equivalent emissions from its production
17
operations. Other emissions relating to consumption of electricity were not used for
purposes of the emissions intensity calculation (a treatment not permitted by any of
the methods reviewed in this paper). CDP divided Shell’s reported emissions by its
operational revenues made in 2007, giving a carbon intensity of 212. The intensity
figure was then shown against the FTSE 350 oil and gas sector’s average intensity of
435, giving a ratio of 0.4873. The latter was reported as indicating that Shell was
approximately half (48.73 percent) as ‘carbon-intense’ as its peers. In fact, Shell
exceeded the average emissions of companies in the oil and gas sector of the Global
Financial Times 500 index (33.8 million tonnes) by a factor of 2.7. (The Global FT
500 contains all of the companies in the FTSE 350.) Such a measure of emissions
intensity has obvious implications for portfolio construction. Risk assessment based
on such representation may be biased in favor of large polluters—exactly the opposite
effect that is intended.
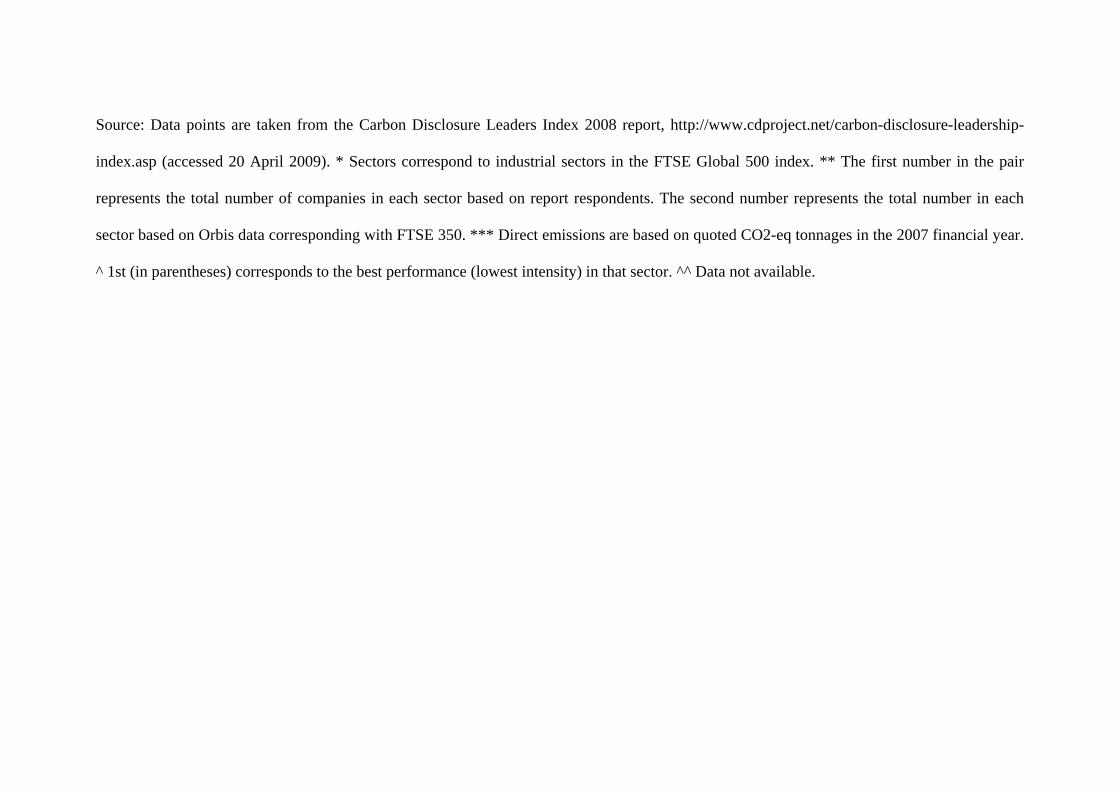
Other cases are given in Figure 2 below. The companies listed in Figure 2 relate to the
Carbon Disclosure Leadership Index (CDLI) ‘leaders’ in the nine industrial sectors
appearing in the 2008 FTSE 350 Report. Along with GHG emissions volumes and
intensities, CDLI scores account for an additional set of survey responses including a
company’s use of GHG reporting standards and the extent to which company directors
give consideration to GHG emissions management.
[Insert Figure 2 about here]
18
Rather than use the CDP report for further analysis, a dataset was procured from the
CDP containing all data the CDP had gathered in the period 2002-2009 (thus
representing the CDP’s entire set of activities).
Columns 4, 5, and 6 of Figure 2 above show, respectively, CDLI scores, emissions
volumes, and CDP-calculated emissions intensities. Inter-sector rankings of the nine
companies are shown in parentheses. If using the CDP methodology, we would expect
within-sector CDLI rankings (Column 4) to correspond with within-sector direct
emissions and intensity rankings (respectively, Column 5 and Column 6), but this
occurs in only two instances: Nissan Motor, and Suncor. These differences are also
not consistent. For three other companies, revenue-adjusted emissions intensities show
a superior ‘carbon performance’ than that suggested by GHG emissions alone (BASF,
Nissan Motor, and Tesco). For another three companies, revenue-adjusted emissions
intensities are worse (Suncor, Barclays, and EMC).
An implication following from these observations concerns CDP’s claim that its work
has contributed to the abilities of investment managers to gauge companies’ exposures
to climate-related risks. Investors would be justified, for example, in questioning a
revenues-based intensity measure that serves to divert attention from heavier emitters.
The relation between a company’s GHG emissions and its reported GHG emissions
performance appears tenuous. Below we identify the import for investment analysis of
emissions rankings and emissions intensity rankings. We devise three measures of
emissions intensity. Following Acquaye and Duffy (2010), each measure uses a
financial line item that represents a source of GHG emissions.
19
The items in balance sheets correlated most strongly with the production of GHG
direct and indirect emissions are fixed productive assets, e.g., property, plant and
machinery. The intensity measures we have created take GHG emissions divided
(deflated) by three balance sheet items: gross property, plant, and equipment;
depreciated (net) property, plant, and equipment; and depreciated plant and
machinery. The results are ranked, and the rankings are compared with rankings that
use CDP’s method of relating emissions volumes to accounting revenues.
Columns 7, 8, and 9 of Figure 2 above provide the new intensity scores and rankings
for the top CDLI scorers in the Global FT index[vi
Our first task is to compare the rankings of the CDP’s intensity scores with the
rankings of our assets-based intensity measures. We use a two-group mean
comparison. Figure 3 below gives the results.
]. Some companies exhibit greater
rankings-based gaps between the new intensity measures and the original revenue-
deflated intensity measure (column 6), e.g., BASF, Tesco and EMC. A fuller
comparison of these rankings will yield substantive results about revenue-deflation
and asset-deflation measurement techniques.
[Insert Figure 3 about here]
Figure 3 shows that the three assets-based ranking structures (columns 7-9) are
virtually identical with the revenue-deflated intensity measure (column 6).
20
We then divide the sample into two emissions intensity groups, in two different ways.
First, we apply the CDP’s categorisation of intensity by industrial sectors[vii
The differences are investigated using two-group mean-comparison tests of revenues-
based intensity rankings and the new asset-based intensity rankings, along emissions-
intensive and non-emissions-intensive strata. The results are shown in Figures 4 and 5
below, respectively.
]. Clear
differences exists in CDLI scores, emissions scores and emissions intensity scores
between emissions-intensive and non-emissions-intensive sectors, e.g., in terms of
CDLI scores, the means are significantly different (t(222) = 8.76, p < 0.001).
[Insert Figure 4 and Figure 5 about here]
For the non-emissions-intensive firm group, the mean of {emissions per net non-
current assets} is 8.3 rank positions lower than the mean according to CDP’s
revenues-based intensity measure. The converse appears for the emissions-intensive
firm group in two instances, where intensity measures using net non-current assets,
and net plant and machinery, yield means 6.3 and 17.1 rank positions higher,
respectively, than when applying a revenues-based intensity measure. We attribute
these results to the relative use of fixed assets in the emissions-intensive and non-
emissions-intensive groups.
We amend the CDP’s blanket classification by industrial sector, claiming that it is
entirely too crude a basis for whether a firm is to be deemed emissions-intensive or

21
non-emissions-intensive. We create a new measure of emissions intensity based on the
median level of GHG emissions across all 161 firms in the sample. Below the median
was designated non-intensive and above the median was designated as intensive.
Figure 6 below presents a graphical analysis.
[Insert Figure 6 about here]
Figure 6 shows that nearly three-quarters of the sampled firms are relatively low GHG
emitters, while firms in the fourth quarter of the distribution show an exponential
increase in emissions. Using a sector-based (CDP’s) approach, the non-emissions-
intensive group displays lower assets-based emissions intensities than revenues-based
intensities. A converse result is noted for the emissions-intensive group. For the new
median-based disaggregation measure, an opposite effect is noticed; the non-
emissions-intensive group displays higher assets-based emissions intensities than
revenues-based intensities[viii
Our analysis suggests that monetised emissions intensities should be used with caution
in sample-based analyses. The degree of subjective choice in intensity calculations is
perhaps endemic of wider uncertainties associated with GHG impact assessment
(Martin-Tapia et al., 2008). Further, our analysis can be viewed as support for a body
of literature finding that company reports have declining value relevance to investors
(which is not repeated here).
].
22
CONCLUDING REMARKS
Lovell and Liverman (2010) identify the tensions that arise between the governance of
reports prepared by entities for the purpose of claiming Certified Emissions
Reductions (CERs) and Voluntary Emissions Reductions (VERs). Reports prepared
for claiming CERs are technocratic in nature, and are given over to method,
refinement of techniques and reporting accuracy. Reports prepared for purposes of
claiming VERs, in contrast, focus on explaining the relations between the finance
provider and the project initiator and can be distinguished for their tendency to
narrative. Tensions between the two, these authors argue, may account for the limited
uptake of VERs. Analogously, the analyses presented in the three sections above point
to tensions between the exigencies of investment management and the utility of
carbon reporting.
The analyses presented above suggest several areas of concern. The interviews
suggest that additional investment decision criteria exist to those identified in Capon
et al. (1996), at least with respect to carbon considerations. These are institutional
features such as isomorphism; public policies requiring investors to disclose how they
go about making environmental considerations without provision of further guidance;
and the potential of fungible markets to provide shorter-term and long-term
perspectives for various types of investors. In addition, comparability is not furthered
necessarily by the variety of methods used by companies to report carbon emissions,
and by monetised carbon emissions performance measures that work to smooth out
differences between GHG emissions levels of firms. Counter-intuitively, emissions
intensities based on company revenues can be used to suggest that it is heavy polluters
that are better at GHG emissions management. This is not merely a possibility. CDP’s
23
Carbon Disclosure Leaders’ Index of 2008 correlated lower-quoted revenues-deflated
emissions intensities with higher profits relative to assets, yielding, quote, a
“win/win”[ix
In light of our application of the multi-attribute model of Capon et al. (1996) and the
minimum information requirements of Sharpe (1992), we contend that there is no
single formula dictating how sector-based carbon emissions information should be
utilised. An investor must engage in some form of meta-analysis, as we have done
here, to determine its effective asset mix.
]. Such representation is consonant with much of the discourse of climate
change, global warming, and corporate sustainability (e.g., Bumpus and Liverman,
2008; Leiserowitz, 2006; Milne et al., 2009).
A second area of concern is the subjectivity of carbon at firms and professional
investors. With the exception of the intensity measure produced in PAS 2050, the
other measures reviewed do not facilitate comparison and aggregations between firms
and within and between industrial sectors—a modus operandus of asset allocation
processes. The diversity of measurement and calculation approaches, the complexities
involved in some of them, and the subjective choice necessary to use any of them, all
make it likely that fund managers will restrict themselves to the types of data they
know best: company financial data supplied by data providers or gathered using direct
consultation with companies (Holland, 2009). An interviewee exasperated:
All I hear is ‘carbon, carbon, carbon’. What is carbon? Is it an asset class or a
risk premium? Is carbon just the next fad—or what? (Interview, European fund
manager)

24
Three, that governance arrangements concerning verification of GHG emissions
reports had not been determined at the time of writing (in any jurisdiction) leads to
consideration of the content and form of general-purpose carbon accounting reports.
This is the task of the remainder of this section.
Barthes (1974) rejects the idea that technologies such as reporting can play a role in
providing stability to discourse (Lovell and Liverman, 2010) as an artefact of
bourgeois ideology. The signifier is not always the stable partner of the signified. For
instance, the accounting literature has had much to say on the role of corporate
reporting in establishing organizational legitimacy (e.g., Owen et al., 1997). Taking up
the non-fixable aspect of voluntary reporting, consideration is given to the work of the
Climate Disclosure Standards Board, an initiative formed in 2009 by several non-state
actors (details, www.cdsb-global.org)[x
Although all respondents approved of the rigour of using principles of decision-
usefulness to guide carbon reports, some objected to the implications. The framework
]. Reporting principles based on the usual
hallmarks of financial information quality have not been formulated for carbon
reporting. Recognising the legitimacy accorded to financial reporting, the Climate
Disclosure Standards Board engaged the services of global accounting consultancies
in 2010 to prepare a framework for a ‘general purpose’ company carbon report using
the well-known concepts of reporting materiality, decision-usefulness and
comparability. A ‘draft’ document was issued in 2009 for public written comment,
and the comments warrant consideration here. The thirty respondents included
environmental and financial services consultancies in the US, Europe and Australia,
accounting bodies such as IFAC, ICAEW, ACCA and the Japanese Institute of
Certified Public Accountants, and the major global accounting consultancies.
25
document advocated a group reporting approach to define the scope of reportable
emissions. Most respondents objected to this on the basis that disclosures would be
made where currently they are not required. It seems that ‘borrowing’ a definition
from the principles used to prepare general-purpose financial statements can, for
some, destroy the imaginary immanent to carbon discourse. Carbon discourse at
investors is embodied in the imaginary. Barthes provides a useful analogy.
Considering the typical ‘three-quarter’ pose of the politician’s portrait, Barthes writes:
The gaze is lost nobly in the future, it does not confront, it soars, and fertilizes
some other domain, which is left chastely undefined. (Barthes, 1972, p. 93)
We identify a gap between commercial exigencies, and an imaginary, future carbon-
restricted world represented by collected but unused carbon reports and shadow
carbon prices used to suggest the shape of potential asset allocations. Unable to find a
ready use for company carbon reports, some interviewees had collected company
carbon reports for an imagined future.
‘Carbon emissions’ is a project. It’s on our agenda. We’ve got all the data. We
haven’t done much with it. We might in the future. (Company GHG emissions
data from) Bloomberg is in very early stages. It will take some time, but we
expect to be using Bloomberg of course. (Interview, US portfolio manager)
Plainly, the investment possibilities that might present from carbon reports have not
been realised. Some interviewees looked forward to the day where carbon reporting
would be mandatory for companies and would find a place in investors’ asset
allocation decisions. Interviewees thought this would happen if ‘the government’ were
pressured to come up with ‘the right sort of price signals’. All interviewees indicated
26
that carbon-sensitive asset allocation and the forward-looking perspective that such
allocation would entail had little to do with market exigencies. Ideally, there should be
little to no difference between reporting on greenhouse gas emissions and
environmental impacts compared to other types of reporting which report on the value
of the corporation. But as Barthes reminds us, the meaning of the text is not fixable
(e.g., Barthes, 1974, 5-6), and carbon reports have the potential to produce
mythologising, subjective meanings. A carbon intensity measure that moves, e.g., with
a company’s reported full-cost economic value would entail a different
conceptualisation of assets and liabilities to that holding sway today.
We have shown that carbon approximates a nebulous, imaginary quantity at financial
institutions. The enthusiasm of investors to take carbon into account in decision-
making processes is couched by isomorphism, the regulatory set-up, the potential of
markets to provide various perspectives on firm value, and the diversity of methods
used to calculate, measure and report carbon emissions. While issues such as the
reporting venue, the quantum of data, and the bases for comparability might be
material in asset allocation, the utility of voluntary carbon reports, and the diversity
displayed within and between such reports, might be their use in investors’ corporate
governance assessments. The potential value of this use is promoting principles of
longer-term share ownership in shareholder-company relations.
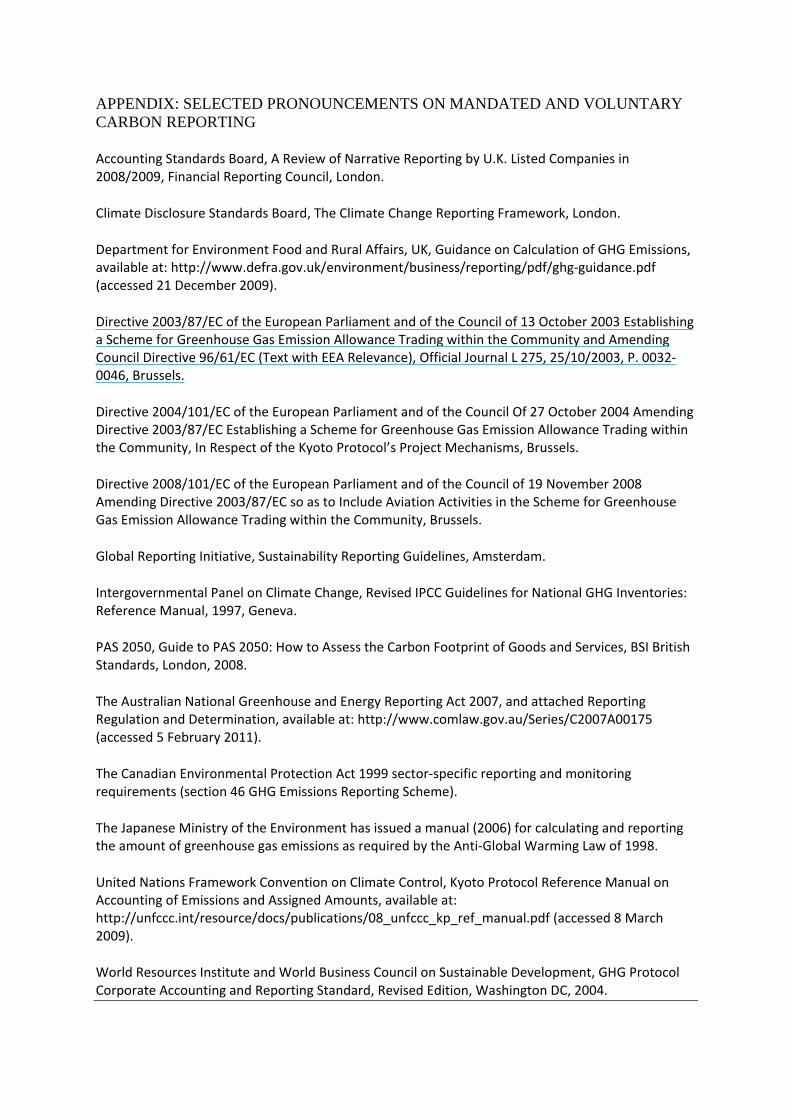
APPENDIX: SELECTED PRONOUNCEMENTS ON MANDATED AND VOLUNTARY CARBON REPORTING
Accounting Standards Board, A Review of Narrative Reporting by U.K. Listed Companies in 2008/2009, Financial Reporting Council, London.
Climate Disclosure Standards Board, The Climate Change Reporting Framework, London.
Department for Environment Food and Rural Affairs, UK, Guidance on Calculation of GHG Emissions, available at: http://www.defra.gov.uk/environment/business/reporting/pdf/ghg-guidance.pdf (accessed 21 December 2009).
Directive 2003/87/EC of the European Parliament and of the Council of 13 October 2003 Establishing a Scheme for Greenhouse Gas Emission Allowance Trading within the Community and Amending Council Directive 96/61/EC (Text with EEA Relevance), Official Journal L 275, 25/10/2003, P. 0032-0046, Brussels.
Directive 2004/101/EC of the European Parliament and of the Council Of 27 October 2004 Amending Directive 2003/87/EC Establishing a Scheme for Greenhouse Gas Emission Allowance Trading within the Community, In Respect of the Kyoto Protocol’s Project Mechanisms, Brussels.
Directive 2008/101/EC of the European Parliament and of the Council of 19 November 2008 Amending Directive 2003/87/EC so as to Include Aviation Activities in the Scheme for Greenhouse Gas Emission Allowance Trading within the Community, Brussels.
Global Reporting Initiative, Sustainability Reporting Guidelines, Amsterdam.
Intergovernmental Panel on Climate Change, Revised IPCC Guidelines for National GHG Inventories: Reference Manual, 1997, Geneva.
PAS 2050, Guide to PAS 2050: How to Assess the Carbon Footprint of Goods and Services, BSI British Standards, London, 2008.
The Australian National Greenhouse and Energy Reporting Act 2007, and attached Reporting Regulation and Determination, available at: http://www.comlaw.gov.au/Series/C2007A00175 (accessed 5 February 2011).
The Canadian Environmental Protection Act 1999 sector-specific reporting and monitoring requirements (section 46 GHG Emissions Reporting Scheme).
The Japanese Ministry of the Environment has issued a manual (2006) for calculating and reporting the amount of greenhouse gas emissions as required by the Anti-Global Warming Law of 1998.
United Nations Framework Convention on Climate Control, Kyoto Protocol Reference Manual on Accounting of Emissions and Assigned Amounts, available at: http://unfccc.int/resource/docs/publications/08_unfccc_kp_ref_manual.pdf (accessed 8 March 2009).
World Resources Institute and World Business Council on Sustainable Development, GHG Protocol Corporate Accounting and Reporting Standard, Revised Edition, Washington DC, 2004.

Acquaye, A.A. and Duffy, A.P. (2010), “Input–Output Analysis of Irish Construction Sector Greenhouse Gas Emissions”, Building and Environment, 45, 784-791.
Agnolucci, P., Ekins, P., Iacopini, G., Anderson, K., Bows, A., Mander, S. and Shackley, S. (2009), “Different Scenarios for Achieving Radical Reduction in Carbon Emissions: A Decomposition Analysis”, Ecological Economics, 68: 6, 1652-1666.
Barth, J.R., Caprio, G. and Levine, R. (2004), “Bank Regulation and Supervision: What Works Best?”, Journal of Financial Intermediation, 13, 205-248.
Barthes, R. (1964), Elements of Semiology, trans. A. Laver, Hill and Wang, New York.
Barthes, R. (1972), Mythologies, trans. A. Lavers, Hill and Wang, New York.
Barthes, R. (1974), S/Z, trans. R. Miller, Hill and Wang, New York.
Bazerman, M.H. (2001), “A Study of ‘Real’ Decision-making”, Journal of Behavioral Decision-making, 14, 353-384.
Bumpus, A.G. and Liverman, D. (2008), “Accumulation by Decarbonisation and the Governance of Carbon Offsets”, Economic Geography, 84:2, 127-156.
Busch, T. and Hoffmann, V.H. (2007), “Emerging Carbon Constraints for Corporate Risk Management”, Ecological Economics, 62, 518-528.
Clark, G.L. and Hebb, T. (2005), “Why Should They Care? The Role of Institutional Investors in the Market for Corporate Global Responsibility”, Environment and Planning A, 37: 11, 2015-2031.
Clarkson, P., Fang, X., Li, Y. and Richardson, G.D. (2010), “The Relevance of Environmental Disclosures for Investors and Other Stakeholder Groups: Are Such Disclosures Incrementally Informative?”, available at SSRN: http://ssrn.com/abstract=1687475.
Cochrane, J.H. (2000), “Portfolio Advice for a Multifactor World”, Economic Perspectives, Federal Reserve Bank of Chicago, 23:3, 59-78. Available at SSRN: http://ssrn.com/abstract=218871 or doi:10.2139/ssrn.218871.
Edwards, W. (1954), “The Theory of Decision-Making”, Psychological Bulletin, 51:4, 380-417.
Elton, E.J. and Gruber, M.J. (1995), Modern Portfolio Theory and Investment Analysis, 5th Edition, Wiley, New York.
Ferreira, M.A. and Matos, P. (2008), “The Colors of Investors’ Money: The Role of Institutional Investors around the World”, Journal of Financial Economics, 88, 499-533.
Friel, S., Marmot, M., McMichael, A.J., Kjellstrom, T. and Vågerö, D. (2008), “Global Health Equity and Climate Stabilisation: A Common Agenda”, The Lancet, 372: 9650, 1677-1683.
Füssel, H.-M. and Klein, R.J.T. (2006), “Climate Change Vulnerability Assessments: An Evolution of Conceptual Thinking”, Climatic Change, 75, 301-329.
Hagerman, L. (2007), “More Than a Profit? Measuring the Social and Green Outcomes of Urban Investments”, Working paper WP 07-17, Oxford University Centre for the Environment, Oxford, UK.
Holland, J. (2006), “Fund Management, Intellectual Capital, Intangibles and Private Disclosure”, Managerial Finance, 32: 4, 277-316.
Holland, J. (2009), “Behaviour and Investment Actions within Fund Managers and their Markets: A Grounded Theory of Fund Management”, Working paper, University of Glasgow.
Jegadeesh, H., Kim, J., Krische, S.D. and Lee, C.M. (2004), “Analyzing the Analysts: When Do Recommendations Add Value?”, Journal of Finance, 59: 1083-1124.
Larrinaga-Gonzalez, C. and Bebbington, J. (2001), “Accounting change or institutional appropriation?—A case study of the implementation of environmental accounting”, Critical Perspectives on Accounting, 12(3): 269-292.
Lease, R., Lewellen, W.G. and Schlarbaum, G. (1976), “Market Segmentation: Evidence on the Individual Investor”, Financial Analysts Journal, 32: 53-60.
Lease, R.G., Lewellen, W.G. and Schlarbaum, G.G. (1974), “The Individual Investor: Attributes and Attitudes”, The Journal of Finance, 29: 413-433.
Leiserowitz, A. (2006), “Climate Change Risk Perception and Policy Preferences: The Role of Affect, Imagery, and Values”, Climatic Change, 77: 45-72.
Lohmann, L. (2005), “Marketing and Making Carbon Dumps: Commodification, Calculation and Counterfactuals in Climate Change Mitigation”, Science as Culture, 14: 3, 203-235.
Lovell, H. and Liverman, D. (2010), “Understanding Carbon Offset Technologies”, New Political Economy, 15: 2, 255-273.
Markowitz, H. (1952), “Portfolio Selection”, Journal of Finance, 7, 77-91.
Markowitz, H. (1971), Portfolio Selection: Efficient Diversification of Investments, Wiley, New York.
Martin-Tapia, I., Aragon-Correa, J.A. and Senise-Barrio, M.E. (2008), “Being Green and Export Intensity of SMEs: The Moderating Influence of Perceived Uncertainty”, Ecological Economics, 68: 1-2, 56-67.
Milne, M.J., Tregidga, H. and Walton, S. (2009), “Words not actions! The ideological role of sustainable development reporting”, Accounting, Auditing & Accountability Journal, 22: 8, 1211-1257.
Mizuguchi, T. (2009), “The Need for Standardised Disclosure on Climate-Risk in Financial Reports: Implications of the JICPA Reports”, in S. Schaltegger, B. Bennett, R.L. Burritt and C. Jasch (eds.), Environmental Management Accounting for Cleaner Production, Springer, Netherlands, 353-364.
Owen, D., Gray, R. and Bebbington, J. (1997), “Green Accounting: Cosmetic Irrelevance or Radical Agenda for Change?”, Asia-Pacific Journal of Accounting, 4:2, 175-198.
Okereke, C. (2007), “An Exploration of Motivations, Drivers and Barriers to Carbon Management: The UK FTSE 100”, European Management Journal, 25: 6, 475-486.
Pope, P.F. and Yadav, P.K. (1994), “Discovering Errors in Tracking Error”, Journal of Portfolio Management, 20: 2, 27-32.
Richardson, B.J. (2009), “Climate Finance and its Governance: Moving to a Low Carbon Economy through Socially Responsible Financing?”, International and Comparative Law Quarterly, 58: 3, 597-626.
Schaltegger, S. and Burritt, R. (2000), Contemporary Environmental Accounting: Issues, Concepts, and Practice, Greenleaf Publishing, Sheffield UK.
Sharpe, W.F. (1992), “Asset Allocation: Management Style and Performance Evaluation”, Journal of Portfolio Management, Winter, 7-19.
Stern, N. (2008), Key Elements of a Global Deal on Climate Change, The London School of Economics and Political Science, London.
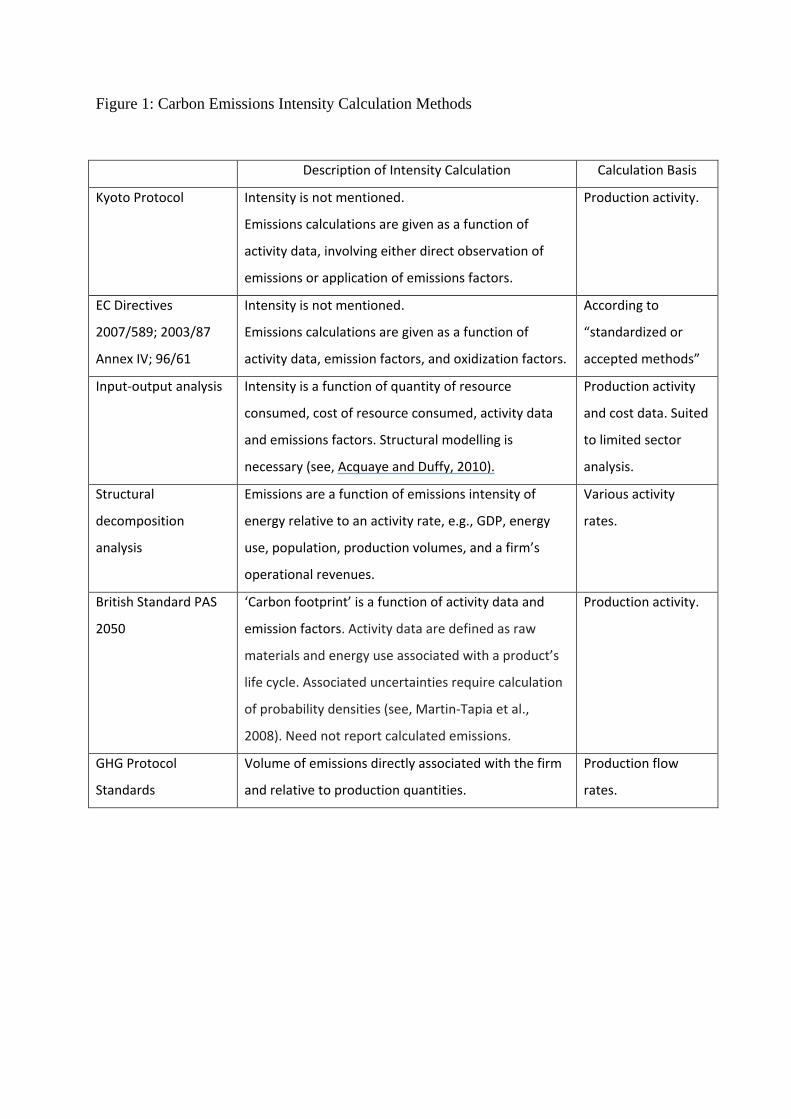
Figure 1: Carbon Emissions Intensity Calculation Methods
Description of Intensity Calculation Calculation Basis
Kyoto Protocol Intensity is not mentioned.
Emissions calculations are given as a function of
activity data, involving either direct observation of
emissions or application of emissions factors.
Production activity.
EC Directives
2007/589; 2003/87
Annex IV; 96/61
Intensity is not mentioned.
Emissions calculations are given as a function of
activity data, emission factors, and oxidization factors.
According to
“standardized or
accepted methods”
Input-output analysis Intensity is a function of quantity of resource
consumed, cost of resource consumed, activity data
and emissions factors. Structural modelling is
necessary (see, Acquaye and Duffy, 2010).
Production activity
and cost data. Suited
to limited sector
analysis.
Structural
decomposition
analysis
Emissions are a function of emissions intensity of
energy relative to an activity rate, e.g., GDP, energy
use, population, production volumes, and a firm’s
operational revenues.
Various activity
rates.
British Standard PAS
2050
‘Carbon footprint’ is a function of activity data and
emission factors. Activity data are defined as raw
materials and energy use associated with a product’s
life cycle. Associated uncertainties require calculation
of probability densities (see, Martin-Tapia et al.,
2008). Need not report calculated emissions.
Production activity.
GHG Protocol
Standards
Volume of emissions directly associated with the firm
and relative to production quantities.
Production flow
rates.

Figure 2: Intensity Rankings in the Sample of CDP Reporters
Intensity measures 1 2 3 4 5 6 7 8 9
Company Sector* No. companies
in sector**
CDLI (%) (rank)
Emissions by volume (rank)***
Revenue (rank)^
Gross noncurr assets (rank)
Net noncurr assets (rank)
Net plant & mach (rank)
BASF Chemicals 9/25 82 (1st) 23463 (8th) 346 (7th) 0.0001 (20th) 0.0013 (21st) 0.0005 (18th)
Nissan Motor Construct 4/9 78 (1st) 975 (2nd) 30 (1st) 0.00005 (5th) 0.00006 (1st) --**
Suncor Oil and gas 5/16 75 (1st) 10419 (1st) 588 (4th) 0.0005 (6th) 0.0005 (4th) 0.0008 (3rd)
BHP Billiton Mining 7/11 77 (1st) 21394 (4th) 1096 (4th) 0.0011 (8th) 0.0014 (8th) 0.0016 (5th)
Iberdrola Transport 9/20 82 (1st) 37769 (7th) 1616 (7th) 0.0005 (7th) 0.0008 (5th) 0.0006 (8th)
Barclays Financial 18/31 98 (1st) 31 (9th) 11 (13th) --^^ --^^ --^^
Taiwan Semiconductor
Hospitality 4/6 95 (1st) 2466 (3rd) 439 (3rd) 0.0004 (5th) 0.0006 (5th) 0.0002 (4th)
Tesco Retail 7/20 96 (1st) 1705 (5th) 42 (3rd) 0.00009 (17th) 0.0001 (10th) 0.0004 (18st)
EMC Media 5/22 98 (1st) 32 (2nd) 20 (4th) 0.00002 (10th) 0.0001 (11th) 0.00008 (8th)
Source: Data points are taken from the Carbon Disclosure Leaders Index 2008 report, http://www.cdproject.net/carbon-disclosure-leadership-
index.asp (accessed 20 April 2009). * Sectors correspond to industrial sectors in the FTSE Global 500 index. ** The first number in the pair
represents the total number of companies in each sector based on report respondents. The second number represents the total number in each
sector based on Orbis data corresponding with FTSE 350. *** Direct emissions are based on quoted CO2-eq tonnages in the 2007 financial year.
^ 1st (in parentheses) corresponds to the best performance (lowest intensity) in that sector. ^^ Data not available.
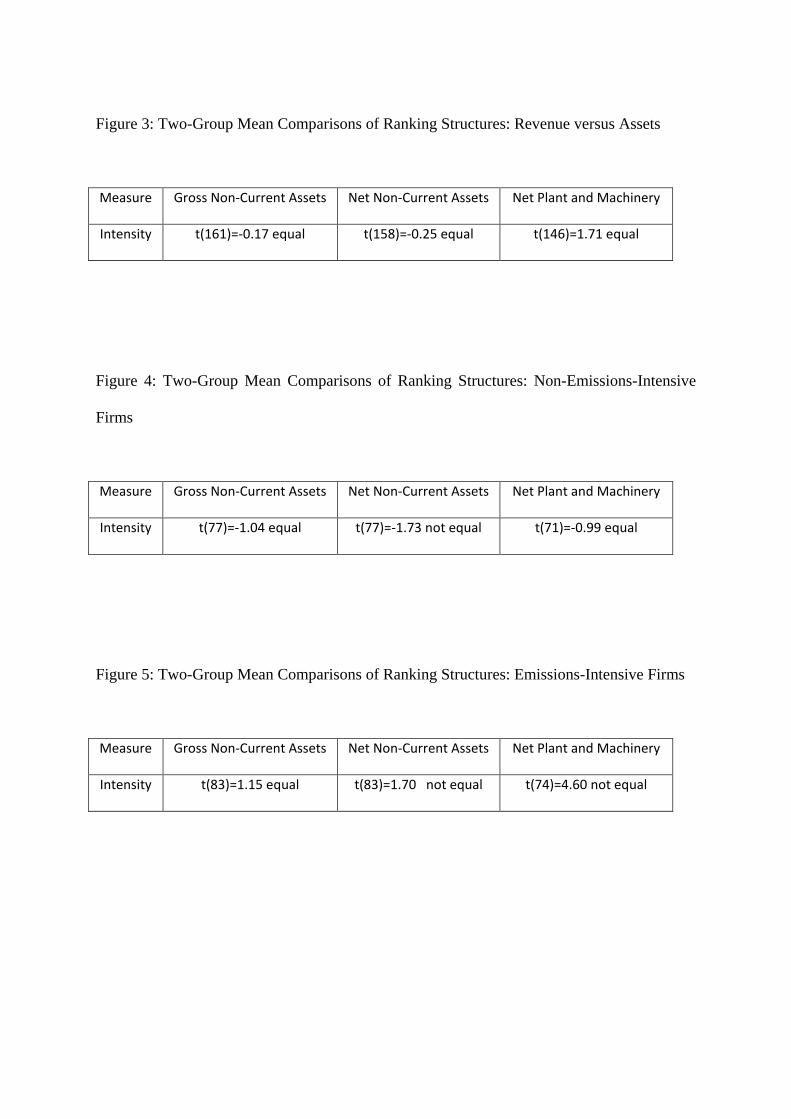
Figure 3: Two-Group Mean Comparisons of Ranking Structures: Revenue versus Assets
Measure Gross Non-Current Assets Net Non-Current Assets Net Plant and Machinery
Intensity t(161)=-0.17 equal t(158)=-0.25 equal t(146)=1.71 equal
Figure 4: Two-Group Mean Comparisons of Ranking Structures: Non-Emissions-Intensive
Firms
Measure Gross Non-Current Assets Net Non-Current Assets Net Plant and Machinery
Intensity t(77)=-1.04 equal t(77)=-1.73 not equal t(71)=-0.99 equal
Figure 5: Two-Group Mean Comparisons of Ranking Structures: Emissions-Intensive Firms
Measure Gross Non-Current Assets Net Non-Current Assets Net Plant and Machinery
Intensity t(83)=1.15 equal t(83)=1.70 not equal t(74)=4.60 not equal
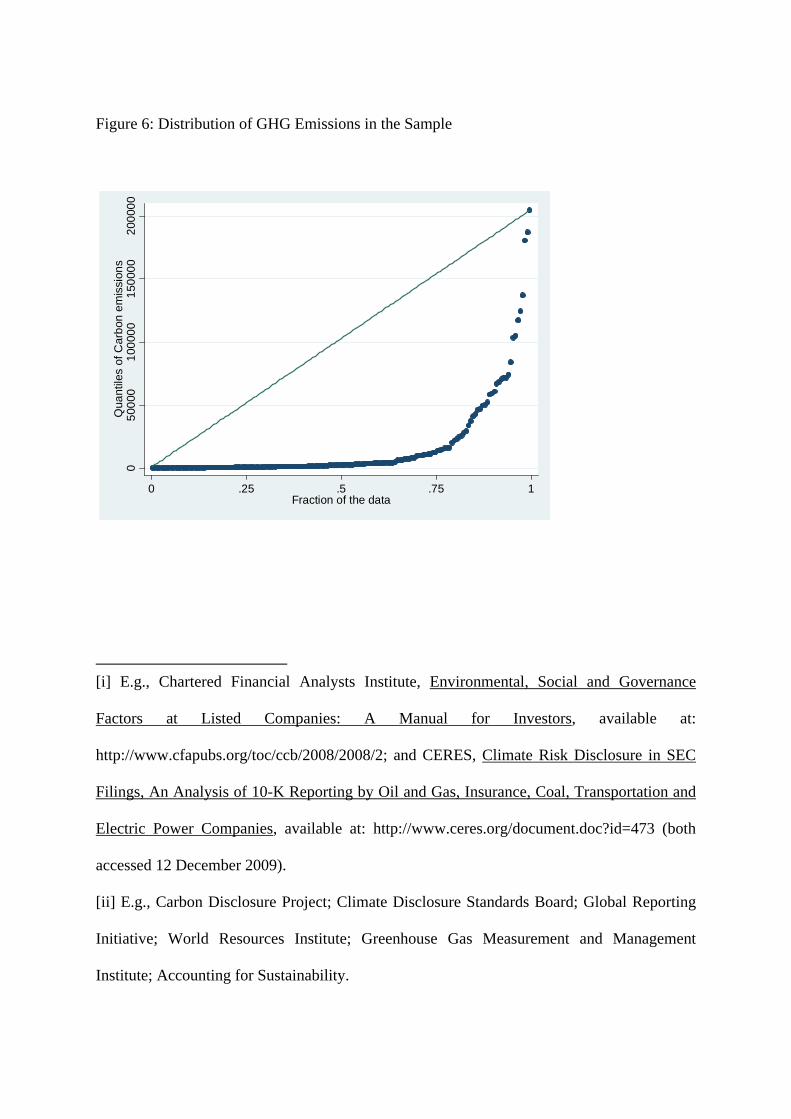
Figure 6: Distribution of GHG Emissions in the Sample
[i] E.g., Chartered Financial Analysts Institute, Environmental, Social and Governance
Factors at Listed Companies: A Manual for Investors, available at:
http://www.cfapubs.org/toc/ccb/2008/2008/2; and CERES, Climate Risk Disclosure in SEC
Filings, An Analysis of 10-K Reporting by Oil and Gas, Insurance, Coal, Transportation and
Electric Power Companies, available at: http://www.ceres.org/document.doc?id=473 (both
accessed 12 December 2009).
[ii] E.g., Carbon Disclosure Project; Climate Disclosure Standards Board; Global Reporting
Initiative; World Resources Institute; Greenhouse Gas Measurement and Management
Institute; Accounting for Sustainability.
050
000
1000
0015
0000
2000
00Q
uant
iles
of C
arbo
n em
issi
ons
0 .25 .5 .75 1Fraction of the data
[iii] Climate Institute, http://www.climateinstitute.org.au/images/supersurveyreport.pdf; also,
US-based National Association of Insurance Commissioners,
http://www.naic.org/documents/committees_ex_climate_climate_risk_disclosure_survey.pdf
(both accessed 23 March 2009).
[iv] Estimations of USD 9.5 billion in direct private investments in carbon emissions rights
and project-based mechanisms are a fraction of the USD74.3 trillion under private
management (0.7 percent) (World Bank, State and Trends of the Carbon Market 2008,
available at: http://wbcarbonfinance.org/docs/state_trends_finale.pdf.
[v] http://www.iigcc.org/docs/pdf/internal/iigccs_submissiontothesternreview.pdf (accessed
19 March 2009).
vi The sample used is based on the 233 companies mentioned above which responded to a
questionnaire sent by CDP in 2007 to the Chair of the Board of FTSE 350 companies. After
matching this data with available data extracted from the Orbis database, the final sample size
is 161 companies.
[vii] Seven sectors are treated as emissions-intensive: chemicals and pharmaceuticals;
construction and building products; manufacturing; oil and gas; raw materials, mining, paper
and packaging; transport and logistics; and utilities. Four sectors are designated as non-
emissions-intensive: financial services; retail and consumer; hospitality, leisure and business
services; and technology, media, and telecommunications.
[viii] Description and results of this group of tests are not presented for reasons of space.
They are available to the interested reader.
[ix] http://www.cdproject.net/carbon-disclosure-leadership-index.asp (accessed 19 March
2009).

[x] The World Economic Forum, the World Resources Institute, the Carbon Disclosure
Project, CERES, the Climate Group, the Climate Registry, and the International Emissions
Trading Association.