CHEMISTRY MANUAL.pdf - Directorate of Forensic Science ...
68
DIRECTORATE OF FORENSIC SCIENCE SERVICES, MINISTRY OF HOME AFFAIRS, GOI © NEW DELHI WORKING PROCEDURE MANUAL: CHEMISTRY 2021
-
Upload
khangminh22 -
Category
Documents
-
view
2 -
download
0
Transcript of CHEMISTRY MANUAL.pdf - Directorate of Forensic Science ...
DIRECTORATE OF FORENSIC SCIENCE SERVICES, MINISTRY
OF HOME AFFAIRS, GOI ©
NEW DELHI
WORKING PROCEDURE MANUAL: CHEMISTRY
2021


Page 1 of 62
INDEX
Section Name Page No.
1 Introduction 2
2 Common hydrocarbons in fire debris (Arson case examination) 3-7
3 Oils and fats 8-24
4 Gold examination in cheating cases 25-33
5 Soda-lye and acids 34-36
6 Trap case examination 37-45
7 Examination of liquor / alcoholic drinks and alcohol 46-51
8 Annexure – I 52-54
9 Annexure – II 55-62

Page 2 of 62
SECTION – 1
INTRODUCTION
The Central Forensic Science Laboratories under the Directorate of Forensic
Science Services are multi-disciplinary laboratories in which the chemistry division
receives samples for only chemical analysis. The analysts adopt procedures as
mentioned in the existing working procedure manual but where matrices of samples
vary, new methods of processing are adopted after due validation. To bring
uniformity in the analytical protocols among Central Forensic Science Laboratories
for each parameter, the Directorate desired to review the existing Working Procedure
Manual on Chemistry (WPM-Chem). The purpose of this manual/guidelines is to
help the analyst in carrying out standard analytical protocols, and to bring uniformity
in the working procedures for the examination of crime cases in the chemistry
division of the laboratories. These guidelines of test methods recommended in this
manual are based on certain scientific principles/facts/experiments and selected after
consulting the various books and publications etc. The purpose of the chemical
analysis is to examine the crime exhibits by chemical examination for its
identification to provide scientific evidence to the Criminal Justice System. Though
some of the test methods for the chemical examination for general routine cases have
been recommended in the manual but depending upon the situation and need, other
validated test methods/techniques available in the scientific literature can also be
referred/ followed for the examination of exhibits.
2. This manual suggests approaches that may help the forensic analyst to select
a technique appropriate to the sample being examined. Each method described here
can be expected to produce reliable analytical information with respect to the samples
to which they are applied.

Page 3 of 62
SECTION - 2
COMMON HYDROCARBONS IN FIRE
DEBRIS (ARSON CASE EXAMINATIONS)
INTRODUCTION
Arson means fire incident where a criminal intent is involved. The fire with criminal
intention is done for getting economic/financial gain, on dowry death or on mob
violence. The cause of fire may be either with the use of explosives material or fire
accelerants. The investigating officer /team collects various types of exhibits
involved in arson incidents and send to the laboratory for their examination.
Flammable petroleum products such as petrol, kerosene, diesel etc. are commonly
used as fire accelerants in arson cases. Sometimes, alcohol paints/thinner, industrial
solvent and other inflammable materials are also used in the incidents of arson. The
burnt exhibits or substances from the scene of crime are collected and sent to the
laboratory for examination.
Forensic Science Laboratories are frequently called upon to examine
partially burnt/charred clothing for the presence of traces of fire accelerants though
kerosene, is the most common fire accelerant frequently used, due to its ready
availability as domestic fuel. In order to establish the evidence of homicidal cases,
the material collected from the scene of offence such as carpet, pillow, mattress, bed
sheet etc. either partly burnt or unburnt, wiping of the floor, soil from the dwelling
require special treatment for extraction of fire accelerant & their analysis.
Title: Examination/Testing of arson cases
Scope: All the exhibits collected from the scene of crime & forwarded by the
investigating agencies to laboratories.
Purpose: Detection of common inflammable products like petrol, kerosene,
diesel etc. or their residues in the exhibits of arson cases.

Page 4 of 62
Methods:
Simultaneous detection of Petroleum Products and their residue by Gas
Chromatography4.
Extraction: Suspected portions of the samples from the exhibits, such as burnt
clothes, paper, wooden material etc. are taken in a suitable sized beaker and extracted
with appropriate amount of Di-ethyl Ether. Small exhibits may be extracted as such.
The extract is filtered through Filter Paper No.1 in an evaporating dish and allowed to
evaporate to concentrate at room temperature in fuming chamber. If direct extraction
of the exhibit is not possible, the swab of the exhibit with cotton piece can be used for
extraction. However, steam distillation is preferable as Di-ethyl ether extraction may
show some extra peaks due to presence of oils, colours and other unwanted
extractable things present in the exhibits. The continuation of burning depends upon
many factors. In the process of burning, the low-boiling point hydrocarbons of the
petroleum products burn first and high boiling point hydrocarbons may remain
partially unburnt in the exhibits of arson. The petrol, kerosene, diesel and their
residues can be identified and differentiated based on the pattern of the GC-
Chromatogram vis-a-vis the standard chromatogram for each of these products. The
residues of the above petroleum products in arson cases can be identified based on
the relevant portion of chromatogram, matching with that of standard sample of
petrol, kerosene and diesel analyzed along with the questioned exhibit.
Steam Distillation: Depending upon the nature (shape, size and state) of the exhibit,
the appropriate portion of the burnt or partially burnt exhibits such as paper, hair,
different types of clothes, wood etc. are made into small pieces and are steam
distilled1. Aproximately 50 ml of distillate is collected. Extract the distillate with
approximately 30 ml. of any of the organic solvents like benzene, diethyl ether, n-
heptane, n-hexane etc with 2-3 extractions. Combine the extracts and concentrate by
evaporating the extract at room temperature to a small volume (approx. 0.5-1 ml).
The standard samples of petrol, kerosene and diesel (by adding about 0.5 ml of each
in distillation flask) and blank sample are also prepared simultaneously in the same
way.
Page 5 of 62
(i) Gas Chromatography: The concentrated extract is again mixed with small
amount Diethylether and analyzed on packed coloumn with SE-30 (5%) with
following conditions:
Detector: Flame Ionization Detector (FID)
Carrier Gas: Nitrogen
Flow Rate: 30 ml/minute
Oven Temperature Programme:
Starts from 550C to 240
0C increased @ 8
0C per minute and isothermal for 10
minutes @ 2400C
Detector Temperature: 2500C
Injector Temperature: 2500C
(ii) Gas Chromatography2
Appropriate volume of the concentrated extracts of the exhibit, standards and blank
samples are injected into a gas chromatograph with the following conditions: -
Column: Pack SE – 30, Apiezon L or its equivalent column, which can be used for
the separation of petroleum products etc.
Detector: Flame Ionization Detector
Carrier Gas: Nitrogen
Flow Rate: 30 ml/minute
Oven Temperature Programme:
i) For petrol – Starts at 700C (isothermal for 5 minutes); increases with
50/minute upto 120
0C. (70-120
0C)
ii) For kerosene – Starts from 900C and continues at 10
0C/minute upto 220
0C
(90-2200C); hold for 5.5 minutes at 220
0C
iii) For diesel - Starts from 900C and continues at 10
0C/minute upto 240
0C (90-
2400C); hold for 10.5 minutes at 240
0C
Detector Temperature:
i) For petrol – 1700C
ii) For kerosene – 2300C
iii) For diesel - 2400C
Page 6 of 62
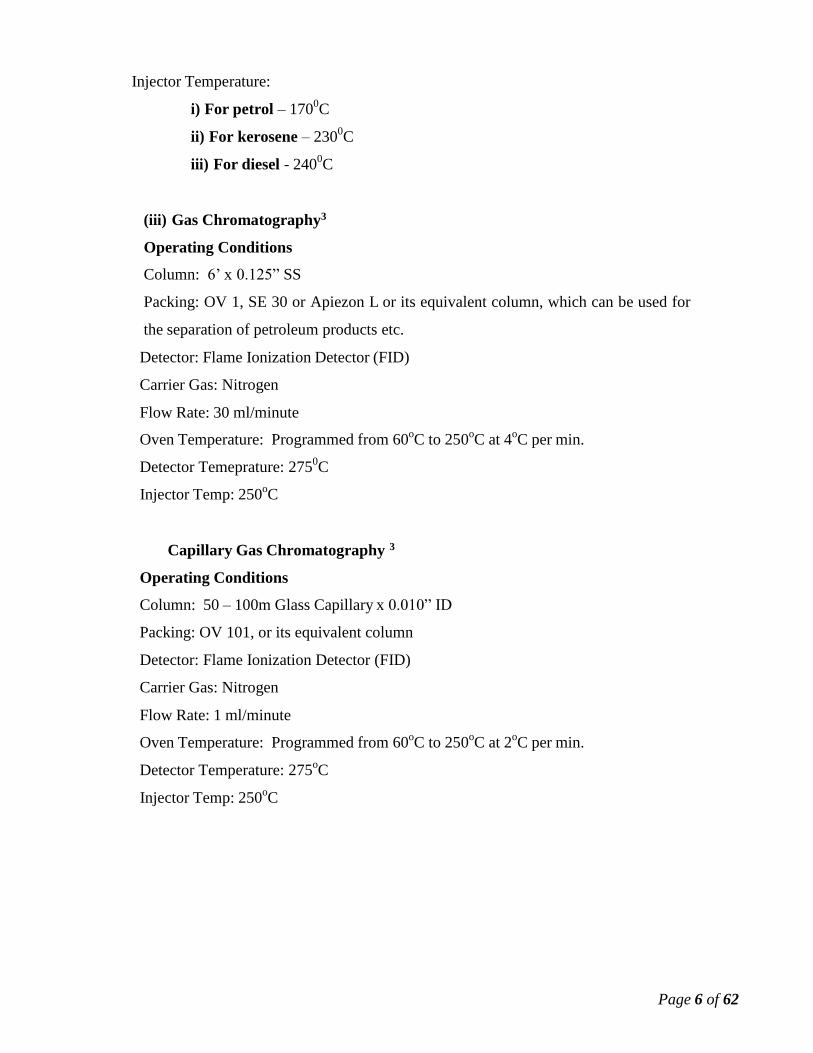
Injector Temperature:
i) For petrol – 1700C
ii) For kerosene – 2300C
iii) For diesel - 2400C
(iii) Gas Chromatography3
Operating Conditions
Column: 6’ x 0.125” SS
Packing: OV 1, SE 30 or Apiezon L or its equivalent column, which can be used for
the separation of petroleum products etc.
Detector: Flame Ionization Detector (FID)
Carrier Gas: Nitrogen
Flow Rate: 30 ml/minute
Oven Temperature: Programmed from 60oC to 250
oC at 4
oC per min.
Detector Temeprature: 2750C
Injector Temp: 250oC
Capillary Gas Chromatography 3
Operating Conditions
Column: 50 – 100m Glass Capillary x 0.010” ID
Packing: OV 101, or its equivalent column
Detector: Flame Ionization Detector (FID)
Carrier Gas: Nitrogen
Flow Rate: 1 ml/minute
Oven Temperature: Programmed from 60oC to 250
oC at 2
oC per min.
Detector Temperature: 275oC
Injector Temp: 250oC
Page 7 of 62
References:
1. Baggi TR, Murthy HRK, Prasad Veena A, Detection and characterization of
petroleum residues by Thin Layer Chromatography, J. Indian Acad. Forens.
Sci.,1987, vol.26 No.2, pp 36-38
2. Arora KK, Golani HC, Narayanswami K, Detection of adulteration in petroleum
products by gas liquid chromatography, J. Indian Acad. Forens. Sci. 1975;14: pp
4-13.
3. A unified scheme for the analysis of light petroleum products used as fire
accelerants by David Willson, Forensic Science, 1977, vol.10, pp 243-252.
4. Varshney K.M., and P. Sudhakar, Simultaneous detection of Petroleum Products
and their residues in Arson by Single Programming Gas Chromatography, The
Forensic Scientist Online Journal, Vol.9, July 2006.
Additional References:
1. AK, Bhat BS, Pandya VS, Detection of kerosene residue on TLC, J. Indian Acad.
Forens. Sci.,1977, vol.16 No.1, pp 54-56.
2. Chhabra KS, Rajvanshi AC, Narain Sri, Thin Layer Chromatography method for
identification of petrol as fire accelerants, Indian Journal of Forensic Sciences,
1991, vol.5, pp173-175.
3. Narayanswami K, Bami HL, Gas-chromatography in detection of kerosene
residues, International Criminal Police Review, 1971, No.251, pp 216-221.
4. Mattoo BN, Pai PP, Wani AK, Spectroscopic detection of kerosene residues in
forensic work, J. Indian Acad. Forens. Sci.,1970, vol.9, No.1, pp 4-8.
5 Arora BB, Transmission Electron Microscopic Studies of Morphology and
Crystallography of Particulate Emissions in Smokes, Forensic Science
International, 32, 1986, pp 185-192
Page 8 of 62
SECTION - 3
OILS AND FATS
INTRODUCTION
Oils and fats are normally sent to the laboratory in the context of any criminal activity
associated with them or in theft cases or in illegal possession cases (under Essential
Commodities Act). Principally they consist of mono- & di-glycerides of the higher
unsaturated fatty acids and free fatty acids in varying amounts, higher alcohols, resins
and small quantities of colouring matter. The fatty acids entering into the composition
of oils are numerous and hence oils and fats have a wide range of properties. The oils
obtained from the seeds of related species frequently show a close resemblance and in
some cases, however, oils from related species may be quite distinct. Oils and fats
find many uses in industry. They are used in large quantities for edible purposes and
in the manufacturing of soaps and cosmetics. Unsaturated oils are also of great
importance in the paint and varnish industries. Many oils are used in medicines
especially Ayurvedic and Unani medicine. Sometimes, oils like castor oils are also
used for lubricating purposes. It is rather very easy to study the parameters of a
known oil and to see whether they fall within the specifications laid down by Bureau
of Indian Standards for a particular oil or not. But it is certainly very difficult job to
identify an unknown oil by determining its analytical parameters as many of them
like refractive index, density is either very close or parameters like acid value, colour
etc. have a very wide range depending upon the grade. The only parameter, which has
important significance, is Iodine value, which is a measure of unsaturation and is a
valuable mean of identification. In forensic laboratories, the oil or fat has to be
identified from various types of crime exhibits where the sample may not be in liquid
form but a spillage on some material. Some times it has to be compared with standard
sample of oil or fat for which the control /standard sample of oil and fat may also
required for the comparison purpose. Therefore, depending upon the state of the
oil/fat, the method has to be used.
Title: Oils and Fats.
Scope: Profiling of various oils and fats of vegetable origin in crime case
exhibits.
Page 9 of 62
Purpose: To analyze the various types of oils and fats in various crime exhibits
received in the laboratory.
Methods:
SAMPLING FOR THE ANALYSIS:
Oils in liquid state:
Filter the oil sample through Whatmann filter paper no.1 to remove any unwanted
particle.
Oils in solid and semi solid-state:
Melt the solid or semi solid samples of oils and fats in an oven heated to 100c above
the melting point of the oil. Filter the melted oil through Whatmann filter paper no.1.
CHEMICAL TEST FOR IDENTIFICATION
3.4.2.1 Detection of Ground Nut oil: 1
Take one ml of the sample of oil in a conical flask, add 5 ml of 1.5 N alcoholic potash
and saponify completely on a boiling water bath using an air condenser to avoid loss
of alcohol. It takes about 10 minutes. During the saponification process, swirl the
flask many times, cool, add 0.1 ml of phenolphthalein indicator. Neutralize the
solution exactly by adding dil. Acetic acid (One volume of glacial acetic acid + two
volumes of distilled water) followed by an extra amount of 0.4 ml of acetic acid. Mix
50 ml of 70% alcohol, fix a thermometer into the flask with the help of a cork in such
a way that the bulb of thermometer is dipped in the liquid but does not touch the
bottom of the flask. Heat the flask on a water bath until the temperature reaches 500C
to become clear solution. Keep the flask for cooling in air with frequent shaking until
the temperature of the solution comes to 400C. Appearance of turbidity in between
39 to 400C indicates the presence pure groundnut oil. Cool the flask with constant
shaking in a cooling bath at 150+ 1
0 C in such a way that the temperature falls roughly
at the rate of 20C per minute. Note the turbidity temperature, which is the
temperature at which the first distinct turbidity appears. This turbidity temperature is
once again confirmed by a little further cooling which results in the deposition of
precipitate. Dissolve the precipitate by heating the contents at 500C on a water bath.
Again, cool as above and make an experiment for duplicate determination of turbidity
temperature. Duplicate shall agree with in + 0.50C.
Page 10 of 62
Reagents:
1. Alcoholic Potash (1.5 N):
Dissolve 8.4 g of potassium hydroxide in 100 ml purified rectified spirit.
The solution may be kept in dark colour bottle preferably.
2. Purified/ Rectified Spirit:
Reflux 1.2 litre of rectified spirit for half an hour in a distillation flask
containing 10g of caustic potash and 6 g of granulated aluminium or
aluminium foil pieces. Distil and collect one litre after discarding the first
50 ml, this is purified, rectified spirit used for reagents.
3. Phenolphthalein Indicator:
Take 0.5 g of phenolphthalein and dissolve in 50ml of purified rectified spirit and mix
the solution with 50ml of distilled water.
Detection of Sesame oil: 1
Take 5 ml of the oil sample or melted fat in a cylinder or test tube with a glass stopper
add 5 ml of hydrochloric acid and 0.5ml of furfural solution (2% freshly distilled
furfural in ethanol). Fit the glass stopper and shake vigorously for two minutes. Keep
the mixture separate. The appearance of pink or red colour in the lower acid layer
indicates the positive tests for the presence of sesame oil. Confirm it by adding 5 ml
of water and shake again. If the colour remains, the sesame oil is present but if colour
disappears, then sesame oil is absent.
Detection of Cotton seed oil:
Take about 5ml of the oil sample or melted fat in a test tube and add equal volume of
sulphur solution (1% w/v solution of sulphur in carbon disulphide and add an equal
volume of amyl alcohol). Shake thoroughly and heat it on a water bath (700 to 80
0C)
for few minutes with occasional shaking. To boil off carbon disulphide and stop
foaming, keep the test tube in an oil bath at 110-1150C for about two and a half hours.
Appearance of red colour at the end of the period indicates the positive test for the
presence of cottonseed oil.
Page 11 of 62
Detection of Palmolein in Ground Nut oil:
In this test, the cloud point of the oil is measured. Take 60-75 gms of samples and
heat it to 1300C before its testing. Add 45ml of the heated sample into an oil sample
bottle. Keep the bottle in water bath. Cool the bottle in water bath with stirring
using the thermometer to keep the temperature uniform. When the sample reaches a
temperature 100C above the cloud point, being stirring steadily and rapidly in a
circular motion so as to prevent super-cooling and solidification of fat crystals on the
sides or bottom of the bottle. Do not remove the thermometer from the sample at this
stage. The test bottle is maintained in such a position that the upper levels of the
sample in the bottle and the water in the bath are about the same. Remove the bottle
from the bath and read the temperature. The cloud point is that temperature at which
that portion of the thermometer immersed in the oil is no longer visible when viewed
horizontally through the bottle.
This test is useful for the detection of palmolein in groundnut oil. Presence of
palmolein over 10% in groundnut oil readily gives cloud at a higher temperature than
that of groundnut oil due to the presence of palmitic glycerides in higher amounts in
palmolein/palm oil.
Detection of Linseed oil:
Take one ml of the oil sample in a boiling tube of about 100 ml capacity. Add 5ml
chloroform and about one ml of bromine drop-wise till the mixture becomes deep red.
Cool the test-tube in an ice water-bath. Add to it 1.5ml of rectified spirit drop wise
with shaking the mixture until the precipitate which is first formed just dissolves and
then add 10ml of diethyl ether. Mix the contents and keep the tube in the ice water-
bath for half an hour. Appearance of precipitate indicates the positive test for the
presence of linseed oil.
Note: This test is not applicable for the detection of linseed oil in presence of
mohua oil.
Detection of Rice bran oil in other edible vegetable oil:
Take 20ml of oil sample in a 100ml separating funnel. Add to it equal volume of
aqueous potassium hydroxide solution (30%). Shake the content gently and

Page 12 of 62
constantly for 10 minutes. Allow the separating funnel to keep for about 45 minutes
for the separation of alkali layer. Take out the alkali layer and neutralize it with
dilute hydrochloric acid solution. Neutralization is confirmed with blue litmus paper.
Extract this solution with diethyl ether (20ml x 3 times). Wash the extract with
distilled water and dry on anhydrous sodium sulfate. Evaporate the solvent on hot
water bath and dissolve the residue in chloroform and use it for Thin Layer
Chromatography with following conditions.
Stationary phase: - Silica gel G, 0.25mm thickness.
Developing solvent: - benzene and acetic acid (100:1).
Development: – 15cm
Visualization: – Iodine fuming
Observation: - Rf value of Rice-bran oil – 0.70 to 0.75 (Use of control sample of
Rice-bran oil is recommended).
This spot is absent in all the commonly available eatable oils in the market. The Rice-
bran oil in other edible vegetable oils can be detected by this TLC method up to a
minimum of 5% level.
A. Detection of Castor oil in edible oils by Thin Layer Chromatography:
Stationary phase: - Silica gel G, 0.25mm thickness.
Developing solvent: - Petroleum ether (40-600C), diethyl ether and acetic acid
(60:40:2, v/v).
Development: – 10cm
Visualization: – Iodine vapours
Observations: - Rf value of castor oil – About 0.25
Sample preparation: – Chloroform
A prepared sample of an oil containing 1% added castor oil may be used as a control
sample for identifying the spot. The spot shall be noted in tank since it fades on
removing the plate. This method has a sensitivity of 1%.
This method is specific for castor oil but rancid or oxidized groundnut oil gives a
streak.

Page 13 of 62
B. Detection of castor oil and its differentiation from rancid oils: -
Take about 5ml of suspected rancid oil sample in a round bottom flask. Add to it
about 2 gms activated charcoal. Mix the content thoroughly and heat it on a boiling
water bath for about half an hour with constant shaking. The bleached oil is filtered
on a filter paper. The filtered oil may now be passed through a mini column made up
of neutral alumina –10 gms using 50ml hexane as eluent. This bleached and
neutralized oil is used for TLC as given in the detection of castor oil besides as
reference standard.
Detection of Argemone oil in edible oils: -
Method 1 – Ferric chloride test
Take about 5ml of filtered oil and dissolve in 5ml of toluene in a stoppered glass test
tube. Add to it 5 ml of concentrated hydrochloric acid. Shake vigorously and allow
the acid layer to separate. Separate the acid layer with the help of separating funnel
to a test tube. Add 1 ml of Ferric chloride solution (10 gm Ferric chloride in 10ml
concentrated hydrochloric acid and add 90 ml of water). If required, may be filtered
through the side wall of the test tube. Mix the reagent and acid layer well. This can
be achieved by gently rotating the test tube between the palms of the hand. Heat the
test tube in boiling water bath for about 10 minutes. Formation of needle shaped
(straight/curved) reddish brown crystals in clusters on cooling indicates the positive
test for the presence of Argemone oil. The method is not sensitive enough to detect
argemone oil in less than 0.1% level.
Method 2: -
Thin Layer Chromatography
Sample Preparation
Take about 5ml of suspected oil sample in about 5 ml of diethyl ether in a stoppered
flask. Add 5 ml of conc. HCl and shake the mixture vigorously for 10 minutes. Heat
the flask on a hot water bath having temperature 40oC for about 10 minutes. Separate
the acid layer using separating funnel in a 10ml beaker. Keep the beaker on a boiling
water bath and evaporate to dryness. Dissolve the residue in 1 ml of chloroform and
acetic acid mixture (9:1) and used for TLC with following conditions.
Page 14 of 62
Stationary phase: - Silica gel G, 0.25mm thickness.
Developing solvents: –
1. Butanol, acetic acid, and water (7:2:1).
2. Hexane and acetone (6:4)
3. Heptane
Development: – 10cm
Visualization: – U.V. Light
Observation: - Bright yellow spot at about Rf value 0.8 in system 1, 0.4 to 0.5 in
system 2. The plate shows spot of blue fluorescence if it is seen under UV Light after
sprayed with 20% aqueous Solution of sodium hydroxide. The above observations
indicate the positive test for the presence of argemone oil. The detection limit is up to
50 ppm.
Method 3:-
High Performance Liquid Chromatography2
DETECTION OF KARANJA OIL (Pongamia Glabra)
Sample Preparation: Take about 20 ml of suspected oil sample in a 100 ml
separating funnel and 10 ml of conc. HCl. Shake the mixture gently and constantly
for 15 minutes. Keep the funnel aside for about ½ hour to separate the acid layer.
Take out the acid layer in a beaker and keep it on a boiling water bath for the
evaporation to dryness. Dissolve the residue in about 0.5 ml of chloroform and use it
to carry out the TLC with following conditions.
Stationary phase: - Silica gel G, 0.25mm thickness.
Developing solvent: –
Petroleum ether (40-600C): diethyl ether: acetic acid (6:4:1).
Development: – 20 minutes
Visualization: – Dry the plate at room temp. and watch under U.V. Light
Observation: -
1. Appearance of 3 bluish green spots at about Rf values0.34, 0.22, and 0.17 on the
plate indicates the positive test for the presence of Karanja oil. The detection
limit is up to 0.01 %.
2. Development of a yellow color in the acid layer after extraction also indicates
the positive test for the presence of Karanja oil.

Page 15 of 62
3. Palm argemone oil does not interfere.
Method 4: The TLC may also be carried out directly on chloroform solution of the
oil instead of extracted solution but the test may not be sensitive.
Detection of Mineral oils in edible oils:
Method 1- Take 22 ml of the 0.5 N alcoholic KOH solution in a conical flask, add
1ml of the suspected oil sample. Boil it on a water bath using an air or water-cooled
condenser till the mixture becomes clear and free from any oil drops on the side wall
of the flask also. Take out the flask, transfer the contents to a wide mouthed warm test
tube, add 25 ml of boiling water along the side of the wall with care. Shake the tube
lightly from side to side while adding water. The appearance of turbidity indicates the
positive test for the presence of mineral oil.
Method 2 – Thin Layer Chromatography
Stationary phase: - Silica gel G, 0.25mm thickness.
Developing solvent: –
Petroleum ether (40-600C or 60-80
oC).
Development: – About 4 minutes, / 6 cm
Visualization: – Dry the plate in air at room temperature, spray with fluorescein
solution (2% soln. Of 2’,7’-dichloro-fluoresein in 96 % ethanol and watch under U.V.
Light
Observation: - Appearance of yellow fluorescent spots on the solvent front
indicates the positive test for the presence of mineral oil. The vegetable oil gives a
yellow streak about 2-3 cm long from the base.
Estimation of rancidity in edible oils:
Method 1- Kries Test:
Take about 5ml of suspected oil sample and shake vigorously with 5ml of 0.1%
Phlorogucinol solution in diethyl ether and 5 ml of conc. HCl acid for 20 seconds.
Appearance of pink color indicates the positive test for the presence of incipient
rancidity.
Page 16 of 62
Method 2 – UV Spectrophotometric method:
Take an accurately weighed amount of oil sample in a 25 ml volumetric flask so that
the absorbance of its solution in iso-octane lies between 0.2 to 0.8 using a 1 cm quartz
cell. Scan the sample by UV Spectrophotometer using iso-octane as blank/reference
between 220 to 320 nm. Sample gives three wavelength max. at 230,268, and 278
nm. For quantitation select the wavelength max. of maximum absoption near or/ at
230,268, and 278 nm, and the absorbance (A) at these points.
Specific Absorbance E1 1% cm ( max.) = Absobance (A)/C x d
Where C = concentration of the sample solution in gm/100ml
d = length of the cell in cm
Method 3 – FT-IR Spectroscopic method
Major peaks (cm-1) of some of the oils are given below
Mustard oil: 3007, 2924, 2854, 1747,1465, 1418, 1378, 1238, 1163, 1119, 968, 722.
Vegetable Fat: 3005, 2922, 2854, 1747, 1465, 1418, 1378, 1236, 1163, 1119, 1099,
967, 722
Groundnut oil: 3007, 2954, 2926, 2854, 1747, 1465, 1418, 1378, 1237, 1163,
1119,1099, 966, 722
Coconut oil: 2955, 2924, 2854, 1747, 1466, 1418, 1378, 1228, 1161, 962, 722.
DETECTION OF ACID AND COLORS IN EDIBLE OILS:
Detection of Hydrocyanic acid in edible oils:
It is present sometimes as an impurity in mustard oil. Take 15 –30 ml of suspected oil
sample in a 250 ml conical flask, add about 50 ml of water and mix well. Add to it 15
ml of 10% tartaric acid solution and mix. Put the stopper to the flask, with a velvet
cork from which hangs a picric acid paper (Soak the filter paper in a saturated aq.
solution of picric acid, draining the excess liquid and dry the paper in air) of about 75
mm long wetted with a drop of 5% sodium carbonate solution. The flask is kept on a
hot water bath by the side of the steam vent but not directly on the steam for 30to 45
min. The red colour on picric paper indicates the presence of hydrocyanic acid.
Ignore the pink or reddish hue, which may at times, appears at the periphery of the
picric acid paper.

Page 17 of 62
Detection of coal tar oil soluble colors in edible oils:
Take about 5 ml of suspected sample of oil in test tubes, add about 15 ml of
petroleum ether to each tube followed by 5ml of Hcl of different concentrations (4:1,
3:1, 2:1, and 1:1 HCl and water) to different tubes. Change in color indicates the
presence of coal tar oil soluble colors in the sample.
Isolation and detection of oil soluble colors:
Take about 5ml of suspected sample of oil stoppered conical flask, Add to it 25 ml of
hexane followed by 10 gms of silica gel of column chromatography grade and 2 gms
of anhydrous sodium sulphate. Stir the mixture and keep for 5 minutes. Decant the
solvent. Add another 25 ml of hexane and stir well and decant the solvent. Repeat the
process 3-4 times with 25 ml of hexane and draining out the solvent each time to
remove almost all the oil leaving behind the silica gel in the flask. Elute the coloring
matter absorbed by the silica gel in the flask by shaking with 20 ml of diethyl ether 2-
3 times. Collect the diethyl ether extract in a beaker. Evaporate the solvent on a hot
water bath to concentrate, which can used to carry out the TLC with following
conditions.
Stationary phase: - Silica gel G, 0.25mm thickness.
Developing solvent: –
Benzene, hexane and acetic acid (6:4:1).
Development: – 12-15 cm
Visualization: – Dry the plate at room temp. and heat the plate at 1000C in an oven
for 1 hour.
Observations: - Natural colors like carotenes fades away leaving oil soluble coal tar
colors.
DETERMINATION OF PHYSICAL PROPERTIES OF THE OILS:
Determination of moisture and volatile substances:
Carry out the determination of moisture and volatiles in duplicate.
Method-1 Weigh 5-10 gms of suspected sample of oil or fat in a tared metal dish of
about 7cm dia and 3-4 cm deep with lid. Mix the sample thoroughly by stirring.
Loose the lid and heat in an oven at 103+ 2 °C for 3 hours. Take out the dish from the
oven and close its lid. Cool it in desiccator having phosphorous pentoxide and
weigh.
Page 18 of 62
Heat once again for 1 hour and weigh. Repeat the process to get concurrent readings
with a difference of 2 mg
% age of moisture = Weight Loss/Weight of oil taken X 100
Method-2 Weigh about 10 gms but accurately of suspected sample of oil or fat in a
tared glass beaker with glass rod, cool it in a desiccator having phosphorous
pentoxide and weigh. Heat the beaker with sample on an electric hot plate with
continuous stirring by glass rod. The complete removal of moisture is indicated by the
cessation of the rising bubbles and by absence of foam, which can also be tested by
keeping a clean and dry watch glass on the top of the beaker and observe the water
vapours, if any. Cool the beaker to room temperature in the desiccator and weigh.
% age by Wt. of moisture and volatiles content = Wt. Loss/Wt.of sample taken X
100
3.4.4.2 Determination of Specific Gravity: - Determine the specific gravity of the
oil by specific gravity / density bottle or a pyknometer method at ambient temperature
by noting down the weight of specific gravity bottle with oil, with water and the
empty bottle.
Weight of bottle with oil - Weight empty bottle
Specific Gravity =
Weight bottle with water – Wt of empty bottle
CHEMICAL CHARACTERISTICS
Acid Value: It is the number of milligrams of potassium hydroxide required
to neutralise the free fatty acid present in one gm of the oil or fat. The acid value is
determined by directly titrating the material in an alcoholic medium with aqueous
sodium or potassium hydroxide solution.
Reagents:
a) Ethyl alcohol (95%v/v) or rectified spirit neutral to phenolphthalein indicator.
b) Phenolphthalein Indicator - Dissolve one gm of phenolphthalein powder in 100
ml of ethyl alcohol.
c) Standard aqueous alkali Solution – Aqueous potassium hydroxide or sodium
hydroxide solution of 0.1or 0.5 N.
Page 19 of 62
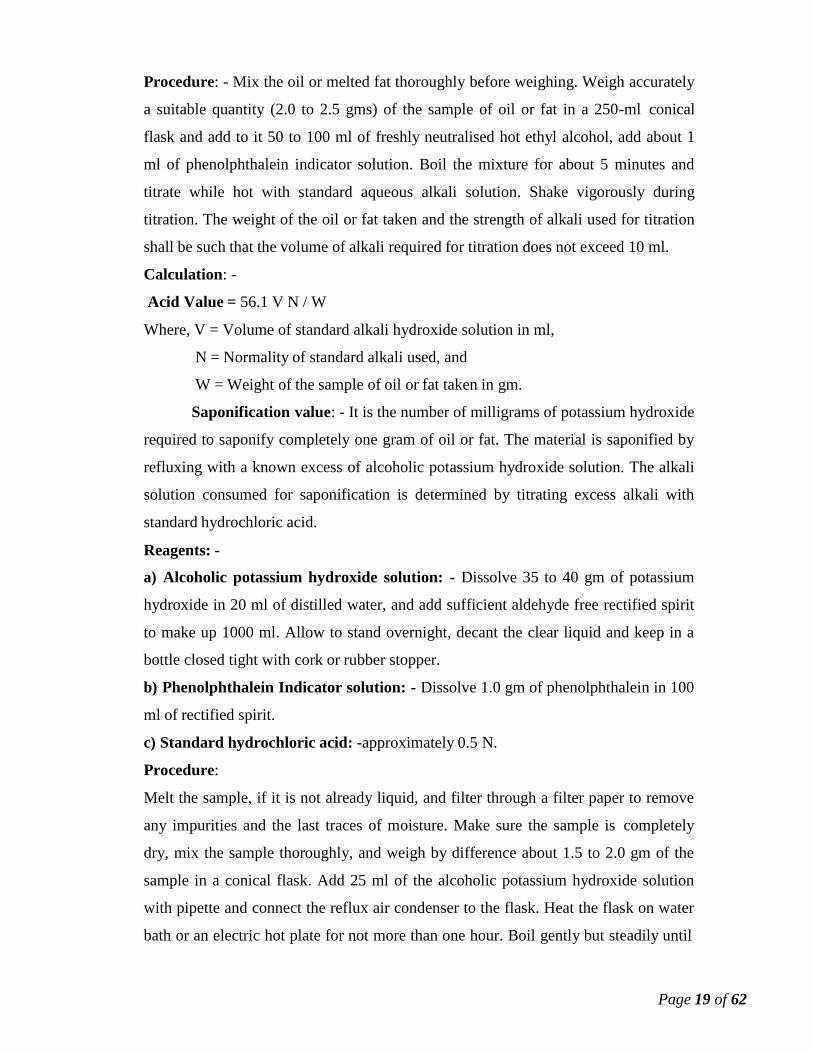
Procedure: - Mix the oil or melted fat thoroughly before weighing. Weigh accurately
a suitable quantity (2.0 to 2.5 gms) of the sample of oil or fat in a 250-ml conical
flask and add to it 50 to 100 ml of freshly neutralised hot ethyl alcohol, add about 1
ml of phenolphthalein indicator solution. Boil the mixture for about 5 minutes and
titrate while hot with standard aqueous alkali solution. Shake vigorously during
titration. The weight of the oil or fat taken and the strength of alkali used for titration
shall be such that the volume of alkali required for titration does not exceed 10 ml.
Calculation: -
Acid Value = 56.1 V N / W
Where, V = Volume of standard alkali hydroxide solution in ml,
N = Normality of standard alkali used, and
W = Weight of the sample of oil or fat taken in gm.
Saponification value: - It is the number of milligrams of potassium hydroxide
required to saponify completely one gram of oil or fat. The material is saponified by
refluxing with a known excess of alcoholic potassium hydroxide solution. The alkali
solution consumed for saponification is determined by titrating excess alkali with
standard hydrochloric acid.
Reagents: -
a) Alcoholic potassium hydroxide solution: - Dissolve 35 to 40 gm of potassium
hydroxide in 20 ml of distilled water, and add sufficient aldehyde free rectified spirit
to make up 1000 ml. Allow to stand overnight, decant the clear liquid and keep in a
bottle closed tight with cork or rubber stopper.
b) Phenolphthalein Indicator solution: - Dissolve 1.0 gm of phenolphthalein in 100
ml of rectified spirit.
c) Standard hydrochloric acid: -approximately 0.5 N.
Procedure:
Melt the sample, if it is not already liquid, and filter through a filter paper to remove
any impurities and the last traces of moisture. Make sure the sample is completely
dry, mix the sample thoroughly, and weigh by difference about 1.5 to 2.0 gm of the
sample in a conical flask. Add 25 ml of the alcoholic potassium hydroxide solution
with pipette and connect the reflux air condenser to the flask. Heat the flask on water
bath or an electric hot plate for not more than one hour. Boil gently but steadily until
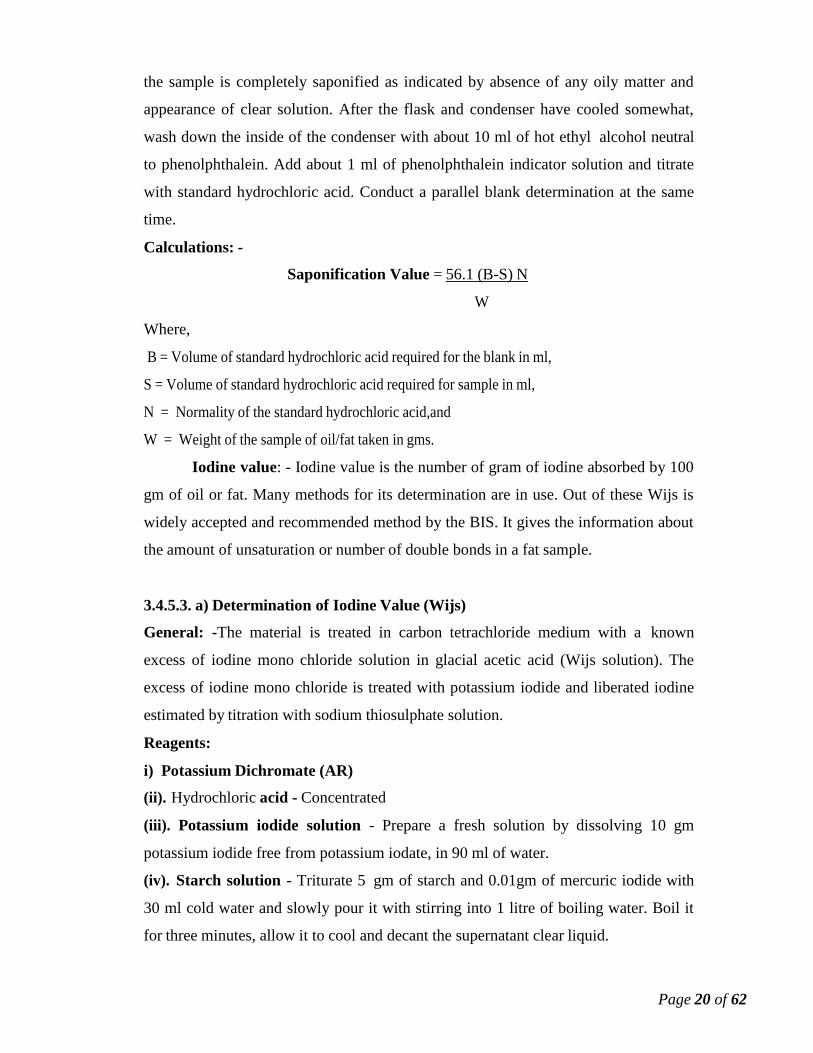
Page 20 of 62
the sample is completely saponified as indicated by absence of any oily matter and
appearance of clear solution. After the flask and condenser have cooled somewhat,
wash down the inside of the condenser with about 10 ml of hot ethyl alcohol neutral
to phenolphthalein. Add about 1 ml of phenolphthalein indicator solution and titrate
with standard hydrochloric acid. Conduct a parallel blank determination at the same
time.
Calculations: -
Where,
Saponification Value = 56.1 (B-S) N
W
B = Volume of standard hydrochloric acid required for the blank in ml,
S = Volume of standard hydrochloric acid required for sample in ml,
N = Normality of the standard hydrochloric acid,and
W = Weight of the sample of oil/fat taken in gms.
Iodine value: - Iodine value is the number of gram of iodine absorbed by 100
gm of oil or fat. Many methods for its determination are in use. Out of these Wijs is
widely accepted and recommended method by the BIS. It gives the information about
the amount of unsaturation or number of double bonds in a fat sample.
3.4.5.3. a) Determination of Iodine Value (Wijs)
General: -The material is treated in carbon tetrachloride medium with a known
excess of iodine mono chloride solution in glacial acetic acid (Wijs solution). The
excess of iodine mono chloride is treated with potassium iodide and liberated iodine
estimated by titration with sodium thiosulphate solution.
Reagents:
i) Potassium Dichromate (AR)
(ii). Hydrochloric acid - Concentrated
(iii). Potassium iodide solution - Prepare a fresh solution by dissolving 10 gm
potassium iodide free from potassium iodate, in 90 ml of water.
(iv). Starch solution - Triturate 5 gm of starch and 0.01gm of mercuric iodide with
30 ml cold water and slowly pour it with stirring into 1 litre of boiling water. Boil it
for three minutes, allow it to cool and decant the supernatant clear liquid.

Page 21 of 62
(v). Standard Sodium Thiosulphate solution (0.1N) – Dissolve approximately
24.8 gm of sodium thiosulphate (Na2S2O3.5H2O) in distilled water and make up to
1000 ml and standardise it as below.
Weigh accurately about 5.0 gm of previously dried to a constant weight at 105 + 2C
potassium dichromate into a clean one litre volumetric flask. Dissolve in water, make
up to mark, and shake thoroughly. Pipette out 25 ml of this solution into a clean 250
ml conical flask. Add 5 ml of conc. HCl and 15 ml of 10 % potassium iodide solution.
Allow it to stand in the dark for 5 minutes and titrate the mixture with solution of
sodium thiosulphate solution using starch solution as an internal indicator towards the
end. The end point is taken when the blue colour changes to green.
Calculate the normality (N) of the sodium thiosulphate solution as bellow
N = 25 W / 49.03V
Where,
W = Weight of the potassium dichromate in gm,
V = Volume of sodium thiosulphate solution required for the titration in ml
vi) Glacial acetic acid - Free from alcohol.
vii) Carbon tetrachloride
viii) Iodine Monochloride (ICl)
ix) Wij’s Iodine Monochloride Soution
Dissolve 10 ml of iodine monochloride in about 1800 ml of glacial acetic acid and
shake vigorously. Pipette 5 ml of this solution, add 10 ml of potassium iodide
solution and titrate with 0.1 N standard sodium thiosulphate solution using starch
solution as an indicator. Adjust the volume of the solution till it is approx. 0.2 N.
Procedure:
Melt the sample if it is not already completely liquid, and filter through a filter paper
to remove any impurities and the last traces of moisture. Use absolutely clean and dry
glassware. Weigh accurately by difference an approx. quantity of the oil or fat
between the limits indicated in col. 2 and 3 of Table-1 into a clean dry 250/500 ml
iodine flask or well ground glass stoppered bottle to which 25 ml of carbon tetra
chloride have been added and agitate to dissolve the contents. The weight of the
sample shall be such that there is an excess of 50 to 60 percent of Wij’s solution over
that actually needed. Add 25 ml of the Wij’s solution and replace the glass stopper
Page 22 of 62
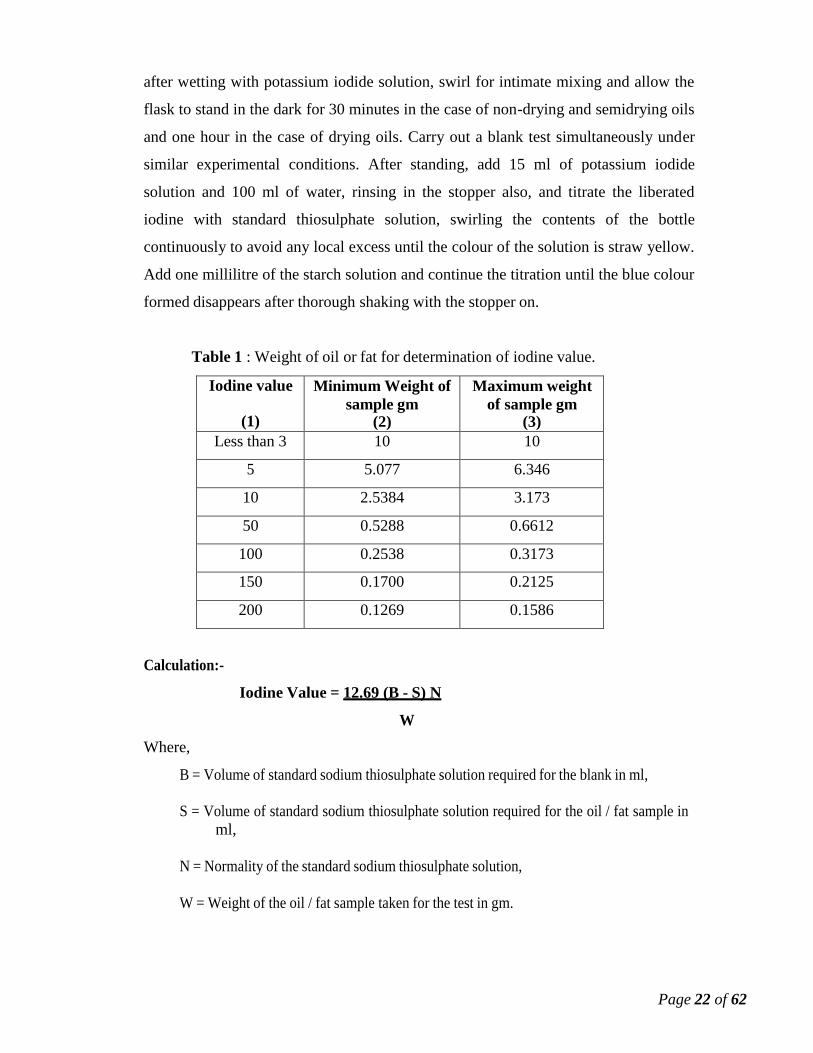
after wetting with potassium iodide solution, swirl for intimate mixing and allow the
flask to stand in the dark for 30 minutes in the case of non-drying and semidrying oils
and one hour in the case of drying oils. Carry out a blank test simultaneously under
similar experimental conditions. After standing, add 15 ml of potassium iodide
solution and 100 ml of water, rinsing in the stopper also, and titrate the liberated
iodine with standard thiosulphate solution, swirling the contents of the bottle
continuously to avoid any local excess until the colour of the solution is straw yellow.
Add one millilitre of the starch solution and continue the titration until the blue colour
formed disappears after thorough shaking with the stopper on.
Table 1 : Weight of oil or fat for determination of iodine value.
Iodine value
(1)
Minimum Weight of
sample gm (2)
Maximum weight
of sample gm (3)
Less than 3 10 10
5 5.077 6.346
10 2.5384 3.173
50 0.5288 0.6612
100 0.2538 0.3173
150 0.1700 0.2125
200 0.1269 0.1586
Calculation:-
Where,
Iodine Value = 12.69 (B - S) N
W
B = Volume of standard sodium thiosulphate solution required for the blank in ml,
S = Volume of standard sodium thiosulphate solution required for the oil / fat sample in
ml,
N = Normality of the standard sodium thiosulphate solution,
W = Weight of the oil / fat sample taken for the test in gm.

Page 23 of 62
Table 2: Properties of some commonly encountered Vegetable Oils.(5,6)
Veg. Oil Sp. Gravity
30 / 30C
Refractive Index
at 40C
Sap.
Value
Iodine Value
(Wij's)
Groundnut oil 0.909-0.913 1.4620-1.4640 188 –195 87 - 98
Coconut oil 0.915-0.920 1.4480-14490 245-260 7.5-10
Sesame oil 0.915-0.919 1.4645-1.4665 185-193 105-115
Mustard oil ------------- 1.4646-1.4666 169-177 98-110
Cottonseed oil 0.910-0.920 1.4630-1.4660 190-198 98-112
Soyabean oil ------------- 1.4650-14710 189-195 125-140
Sunflower oil ------------- 1.4640-14800 188-194 100-140
Mahua oil 0.862-0.875 1.4590-1.4610 187-196 58-70
Ricebran oil 0.910-0.920 1.4600-1.4700 180-195 90-105
Palm oil ------------- 1.4491-1.4552 195-205 45-56
Palmolein ------------- 1.4550-1.4610 195-205 54-62
Castor oil 0.954-0.960 1.4659-1.4730 177-183 82-89
Linseed oil 0.923-0.928 1.4720-1.4750 190-196 170-202
References:
1. Manual of Methods of Tests and Analysis for food (Oils and Fats), Directorate
General of Health Services, Ministry of Health and Family Welfare, Government of
India, New Delhi.
2. Sajid Husain, R. Narsimha, and R. Nageswara Rao, Separation, Identification and
determination of Sanguinarine in argemone and other adulterated edible oils by
reversed-phase high perfomance liquid chromatography, Journal of Chromatography
A, 863 (1999), pp.123 to126.
3. Methods of sampling and test for oil and fats, IS: 548 (Part I), 1964.
4. RS Verma, AK Dalela and ES Babu, FT-IR Spectrophotometric analysis of organic
explosive formulations, Proceedings of XIII All India Forensic Science Conference,
Ahmedabad, Gujrat, from 9 to 11, November, 2001 PP 117-146.
5). Indian Standard Institution's Specifications for respective vegetable oils.
Page 24 of 62
6). Merck Index. Eleventh edition.
OTHER REFERENCES:
1).Bulletins of Indian Industrial Research, No. 10 , Indian Vegetable Oils; by N.
Brodie , 1938.
2). IS: 548 (Part I) - 1964, Methods of Sampling and test for oils and fats.
3). IS: 548 (Part II) - Purity tests.
4). Indian Standard Institution's Specifications for respective vegetable oils.
5). Merck Index. Eleventh edition.

Page 25 of 62
SECTION - 4
GOLD EXAMINATION IN CHEATING CASES
INTRODUCTION
Gold is a precious and valuable metal to the human being. The human beings are
fascinated for their ornaments. These ornaments are sometimes polished for
maintenance. The criminals often polish the ornaments with polishing powder and by
using aquaregia solution. The gold is not soluble in most of the acids; it is soluble in
aqua-regia which is a mixture of one part of nitric acid and three parts of hydrochloric
acid. Generally, criminals fool the housewives in the name of cleaning and polishing
their ornament and dissolve the gold from their ornament in aqua-regia during the
process of cleaning/ polishing. This aqua-regia solution and gold etc. seized from the
scene of crime by the police are referred to forensic laboratory under IPC Section
420. Also, gold plated ornaments or even articles made of brass are sold to the
unassuming persons as original gold ornament. These exhibits are to be examined in
the laboratory for the analysis of gold and the purity as well. Colour test and modern
sophisticated analytical techniques/methods, depending upon the nature of samples
and examination, are used for the analysis of samples in the laboratory.
Title : Examination of Gold in cheating cases
Scope : Items received in the laboratory for detection of gold and purity.
Purpose : Analysis of gold in crime exhibits
Sampling:
The aqua-regia soln, about 250 ml from the crime scene should be sent in glass
bottle with plastic lid or plastic bottle.
Material such as polishing powders, about 250 gm from the crime scene should
be packed in polythene bag and sent to the laboratory.
The questionable ornament supposed to be original for proof of golden
ornament.
Methods:
Test for aqua-regia:
Test the aqua-regia soln for acidic nature, nitrate ions and chloride ions.
Page 26 of 62
Test for Acidic Nature:
a) pH Paper Test: Moist the pH paper with distilled water and impregnate it with
exhibit as such or its distilled water extract and observe the pH. pH less than 7
indicates the presence of acid and more than 7 indicates the presence of alkali.
Alternate Method
a) Litmus Paper Test: Moist the blue litmus paper with distilled water and
impregnate it with exhibit as such or its distilled water extract and observe the colour
change of the paper. Colour changing from blue to red indicates the presence of acid.
If red litmus paper changes to blue, then it is indicates the presence of alkali.
Test for Chloride1.2
:
a) Silver Nitrate Test 1,2: Take the appropriate portion of the exhibit in a test tube
and add few drops of 0.2 M silver nitrate solution. A white curdy precipitate is
obtained which is soluble in excess of ammonium hydroxide solution but insoluble in
water and dilute nitric acid. If no such phenomenon is observed, then repeat the test
by adding 1 drop of nitric acid before addition of silver nitrate solution.
b) Test with Sulphuric Acid3: Take the appropriate portion of the exhibit in a test
tube and add few drops of conc. Sulphuric acid if required warm it. Hydrogen
chloride gas is evolved, which can be tested by blue litmus paper turns to red or by
formation of white clouds of ammonium chloride when a glass rod moistened with
ammonia solution is brought near the mouth of test tube.
Test for Nitric Acid
Test for Acidic Nature:
a) pH Paper Test: Moist the pH paper with distilled water and impregnate it with
exhibit as such or its distilled water extract and observe the pH. pH less than 7
indicates the presence of acid.
Alternate Method
b) Litmus Paper Test: Moist the blue litmus paper with distilled water and
impregnate it with exhibit as such or it’s distilled water extract and observe the colour
change of the paper. Colour changing from blue to red indicates the presence of acid.
Test for Nitrate: Depending upon the nature of exhibits and availability of
resources, any one of the following methods can be used for the detection of nitrate.
Page 27 of 62
Take the appropriate portion of the exhibit in a beaker, add distilled water, shake well
and filter it. The filtrate may be used for performing the tests.
a) Ring Test3: (i) Add about 3 ml of a freshly prepared saturated solution of ferrous
sulphate to about 2 ml of the nitrate solution (filtrate of the exhibit) in a test tube and
pour 3-5 ml conc. sulphuric acid slowly down the side of the test tube so that acid
forms a layer beneath the mixture. A brown ring will form where the liquids meet
which indicates the positive test for the presence of nitrate.
(ii) Add about 4 ml of conc. sulphuric acid slowly to about 2 ml of the nitrate solution
(filtrate of the exhibit) in a test tube and mix the liquids thoroughly and cool the
mixture in tap water. Now a saturate solution of ferrous sulphate in added slowly
down the inner sidewall of the test tube to form a layer on the top of the liquid.
Formation of a brown ring at the junction of two liquids indicates the presence of
nitrate.3
b) Diphenylamine Reagent Test3: To a small amount of diphenylamine reagent
(dissolve 0.5 gm. Of diphenylamine in 85 ml conc. sulphuric acid and dilute to 100
ml with water) in a test tube add a small portion of the filtrate carefully to the side of
the test tube, a blue ring at the junction indicates the presence of nitrate.
c) Ferrous Sulphate Test4 : To a drop of filtrate on a spot plate, add a crystal of
ferrous sulphate (pin head), a drop of conc. sulphuric acid is allowed to run in at the
side. In the presence of nitrate, a brown ring is formed around the ferrous sulphate
crystal.
d) Brucine Test4 : To a few drop of filtrate, a solution of brucine (0.02% in sulphuric
acid, prepare immediately before use) is added on a spot plate, in the presence of
nitrate a red colour is developed, on standing it changes to yellowish red.
Analysis of Gold Polishing Powder
Generally, the gold polishing powder is reddish in color and shows the presence of
inorganic radicals such as copper, sodium, potassium, ammonium, iron, chloride,
sulphate, nitrate etc. the analysis of gold polishing powder is carried out by the
methods used for the analysis of inorganic qualitative analysis. The gold polishing
powder may also be tested for the presence of gold.
Extract the polishing powder with water and the water extract is tested for cations and
anions.
Page 28 of 62
Tests for ammonium ions:
a) Nessler Reagent Test 4:
Take one drop of test sample or extract, add one drop of conc. NaOH solution (5gms
in 5 ml water)3 on a watch glass or in a small test tube. Take out a micro drop from
this and kept on a filter paper and add to it one drop of Nessler reagent. Appearance
of a yellow or orange red stain or ring indicates the positive test for the presence of
ammonium ions.
Preparation of Nessler reagent 3:
Solution 1: Dissolve 10 gms of KI in 10 ml of water.
Solution 2: Dissolve 6 gms of mercury(II) chloride in 100 ml of water.
Solution 3: Dissolve 45 gms of NaOH in water and dilute to 80 ml.
Now add solution 2 to solution 1 drop wise until a slight permanent ppt. is formed
then add solution 3, mix and dilute with water to 200 ml. Keep it for overnight and
decant the clear solution. The solution may be used for one month.
b) Take an appropriate amount of the suspected sample, add to it few drop of NaOH
solution in a test tube and heat it. Smell of ammonia is observed. This can be
confirmed by bringing a glass rod dipped in HCl acid on the mouth of the test tube.
White fumes are produced.6
Test for Chloride1.2 :
a) Silver Nitrate Test: Take the appropriate portion of the exhibit in a beaker add
distilled water, shake well and filter it. Take few ml. of the filtrate in a test tube and
add 1 drop of nitric acid followed by few drops of 0.2 M silver nitrate solution. A
white curdy precipitate is obtained which is soluble in excess of ammonium but
insoluble in water and dilute nitric acid.
b) Test with Sulphuric Acid: As mentioned under section 5.5.1.2 b
Test for Sulphate3.5
:
a) Barium chloride Test: Take the appropriate portion of the exhibit in a beaker add
distilled water, shake well and filter it. Take few ml. of the filtrate in a test tube and
add few drops of dilute hydrochloric acid followed by 0.25 M barium chloride
solution.White precipitate, which is insoluble in water, indicates the presence of
sulphate.

Page 29 of 62
a)Rhodizonate Test3: Take a drop of barium chloride solution (0.25M – 61.1 g
barium chloride dihydrate diluted in 1 litre of water) on a filter paper and add a drop
of fresh solution of sodium rhodizonate (5%). Reddish brown colour spot appears.
Now add a drop of acid or alkaline test solution. Disappearance of colour spot
indicates the positive test for the presence of Sulphate.
Test for Sodium ions:
Color Test:
Uranyl Zinc Acetate Test 7:
Take a portion of the exhibit solution and neutralize it with acetic acid. Add few
drops of uranyl zinc acetate reagent, shake/ stir with glass rod. Formation of yellow
precipitate or cloudiness indicates positive test for the presence of sodium.
Preparation of uranyl zinc acetate 8:
Take 10 gms of uranyl acetate in 55ml of water, 30 gms of zinc acetate, and 9 ml of
acetic acid. Heat to dissolve and dilute with water to make up to 100 ml. Allow to
stand for 24 hours, and filter.
Alternate method for the preparation of uranyl zinc acetate reagent 9:
Solution A:
Take 10 grams uranyl acetate in 6 gms of 30% acetic acid. If necessary warm it, dilute
with distilled water to 50ml .
Solution B: 30 grams zinc acetate is stirred with 3gms 30% acetic acid and dilute it
with distilled water to 50 ml. Mix the above two solutions A and B. Warm if required.
Add a trace of sodium chloride, keep it for 24 hours and filter. Filtrate is used as
above reagent.
Alternate Methods for Sodium
Flame test 10:
Take appropriate portion of the exhibit as such or its water (distilled) extract
evaporate to dryness, moisten with a few drops of conc. Hydrochloric acid to make
past. Take a small portion of paste with the platinum wire and introduce into the non-
luminous flame of a semi-micro burner. A persistence golden yellow flame indicates
the presence of sodium.
Page 30 of 62
Alternate Method of Flame Test11
Take a platinum or Nichrome wire and wet it with conc. Hydrochloric acid and heat
it in the non-luminous flame of the burner until the yellow colour of the flame
disappears. Dip the wire into test exhibit solution as such or it’s distilled water
extract (or powder if exhibit is solid) and heat it in the non-luminous flame of the
burner. Observe the color of the flame as above. A persistent golden yellow flame
indicates the presence of sodium.
Test for Potassium ions:
i) Dipicrylamine Reagent Test 4:
Prepare a drop reaction paper by soaking the filter paper in sodium dipicrylaminate
reagent (0.2 g dipicrylamine in 2 ml of 2N sodium carbonate and 15 ml water) and
dry in a blast of heated air.
Place a drop of neutral test solution on the drop reaction paper, dry it in a cuurent of
hot air. Keep the paper in 0.1N nitric acid. Formation of red fleck or ring at site of the
spot indicates the positive test for the presence of Potassium.
ii) Flame Test: Potassium gives violet color when it is tested by flame test as
described in the testing of sodium.
Test for Copper:
i) Test with ammonium hydroxide
Take the test sample solution (dissolve the sample in water or dil HCl or conc. HCl or
dil/conc. HNO3 or aquaregia to form original solution) and add to it ammonium
hydroxide. Appearance of blue color indicates the positive test for the presence of
Copper.
ii) Test with Alizarin blue 4:
Take a drop of reagent (saturated solution of alizerin blue in pyridine) in a depression
spot plate and add to it a drop of test solution. Run a parallel blank test with water
also. Blue color appears in both the cases. Now add 1-2 drops of acetic anhydride, the
color in the blank test converts into yellow but remaining of blue-violet precipitate in
test sample indicates the positive test for the presence of Copper.

Page 31 of 62
Alternate Method:
Take 1-2 drops of test solution in depression spot plate and evaporate it to dryness.
Add a drop of the reagent and followed by a drop of glacial acetic acid. Appearance
of blue-violet color indicates the positive test for the presence of Copper.
iii) Flame Test: Copper gives bluish green color when it is tested by flame test as
described in the testing of sodium.
Test for Iron
i) Test with Potassium ferrocyanide:
Take few drops of test solution or original solution, add to it a drop of conc. Nitric
acid and boil for few minutes. Add Potassium ferrocyanide solution. Appearance of
blue color indicates the positive test for the presence of Iron.
ii) Test with thiocyanate 6:
Take few drops of test solution or original solution, add to it a drop of conc. Nitric
acid and boil for few minutes. Add ammonium or potassium thiocyanate solution.
Appearance of red color indicates the positive test for the presence of Iron.
The above tests can be performed on filter paper or spot tile as stated below.
Put a drop of test solution on a filter paper or spot plate; add to it a drop of Potassium
ferrocyanide solution. Appearance of blue color on paper or plate indicates the
positive test for the presence of Iron.
Put a drop of test solution on a spot plate; add to it a drop of potassium thiocyanate
solution (1%). Appearance of red color indicates the positive test for the presence of
Iron.
Test for Gold
i) Test with Rhodamine B4 :
Few drops of the exhibit solution is taken in a micro test tube and add one-two drops
of HCl and 1-2 drops of rhodamine B reagent solution and mix properly. The test
tube is shaken with about 8-10 drops of benzene. Appearance of red-violet to pink
colour in benzene layer indicates the presence of gold. After about 1-2 minutes it
displays an orange fluorescence if it is observed under quartz lamp.
Reagent:
1) 0.01 g. rhodamine B dye stuff in 100 ml water

Page 32 of 62
2) 0.2% aq. rhodamine B solution (given under detection of gold in alloys, coating
etc.) the sensitive and specific test for gold with rhodamine B.
ii) Test with Oxalic Acid5 : An appropriate portion of the exhibit is generally
heated till the NO2 fumes are removed. This solution is made alkaline by adding
sodium hydroxide solution. Solid oxalic acid was added and generally heated.
Brownish black precipitate indicates the presence of gold.
Quantitative estimation of gold in aqua-regia 14:
Treat 20 ml of aqua-regia solution with dil HCl and heat the resulting solution on
wire gauze. Make the solution nitrate free and test for nitrate ion by adding a drop on
spot tile, followed by conc. H2SO4 solution and then a pinch of brucine powder.
Nitrate ion gives orange colour. Continue the addition of dil HCl and heating with
bunsen burner on wire gauze till the solution is free from nitrate ions. Reduce the
nitrate free ion solution with 5% hydroquinone solution in water and warm on wire
gauze. Filter the resulting solution and the gold in precipitated form is washed with
warm water till it is chloride free, and then ignites in silica crucible in furnace at
850C for about 2 hrs. and then weigh the gold. This method estimates about 0.1
gm% (w/v) of gold in aqua-regia.
Alternate methods:
i) ICP-AES Method15 : This method/technique is used for the qualitative and
quantitative analysis of gold in various types of crime exhibits. It involves the
sample preparation followed by ICP-AES analysis. Appropriate amount of
solid/powder exhibit was dissolved in aqua-regia (3 parts Hydrochloric acid and 1part
of Nitric acid). Dilute it in appropriate volume with distilled water and analysed by
ICP-AES. Run a parallel blank sample along with the crime exhibit.
ii) Ion Chromatography
iii) Atomic Absorption Spectrophotometry (AAS)
iv) Atomic Emission Spectrography
v) Fluroscence-XRD etc.

Page 33 of 62
References :
1. A.I. Vogel, “A text book of macro and semi-micro quantitative inorganic analysis”, 1969,
p.363.
2. G.H. Jeffery, “Vogel’s text book of quantitative chemical analysis” 5th
edition, 1989,
p.480.
3. G. Svehla, “Vogel’s text book of macro and semi-micro qualitative inorganic analysis”, 5th
edition, 1979, p.334-335, 336, 324, 336, 585, 579, 346-347, 348
4. Fritz feigl, “Spot tests in inorganic analysis”, 5th
edition, 1959, p.326, 328-329, 128, 129,
238, 232, 93, 161, 164,.
5. Gurudeep & Harish, Practical Inorganic Chemistry, 6th
edition, 1988-89, pp.153.
6. Subhash-Satish, A hand book of analytical chemistry, 13th
edition, 1978-79, pp 92
7. Analytical Chemistry by S. Shapiro & Ya. Gurvich, MIR Publishers, Moscow, 1972, pp.63-
64
8. Analytical Chemistry by S. Shapiro & Ya. Gurvich, MIR Publishers, Moscow, 1972, pp.537
9. Spot test in inorganic analysis by Fritz Feigl, fifth edition, Elsevier Publishing Company,
Netherlands, 1958, pp. 230.
10. Vogel’s text book of macro and semi-micro qualitative inorganic analysis by G. Svehla, 5th
edition, Longman Group Limited, Great Britain, 1979, pp. 465-66.
11. Analytical Chemistry by S. Shapiro & Ya. Gurvich, MIR Publishers, Moscow, 1972, pp.65.
12. M.Thompson and J.N.Walsh, A hand book of Inductively Coupled Plasma Spectrometry,
1983
13. R.B. Pudale et. al. TLC method for the detection and Semiquantitative
determination of gold in forensic work, Proceeding of X th All India Forensic
Science conference, Bhubaneswar, 1997.
14. A textbook of Quantitative Inorganic Analysis by Vogel. 2nd edition ,1951.
15. M.Thompson and J.N.Walsh, A hand book of Inductively Coupled Plasma Spectrometry,
1983
16. P.L. Soni, Text Book of Inorganic Chemistry, 12th
edition (revised) 1980
17. Arthur I. Vogel, A Text Book of Macro and semi micro Qualitative Inorganic Analysis, 4th
edition
Page 34 of 62
SECTION - 5
SODA-LYE AND ACIDS
Title: Examination of corrosive chemicals like hydrochloric acid, sulphuric acid,
and nitric and alkalies in crime exhibits.
Scope: Acids, alkalis and other crime case samples having presence of strong acids &
alkalis.
Purpose : To detect the presence of hydrochloric acid, sulphuric acid, and nitric acid
and alkalies in crime exhibits received from various investigating and law enforcement
agencies
Methods: The following methods are to be used for the detection of the constituents of
the hydrochloric acid, sulphuric acid and nitric acid in the crime exhibits.
Test for Hydrochloric Acid
Test for Acidic Nature:
a) pH Paper Test : Moist the pH paper with distilled water and impregnate it with
exhibit as such or its distilled water extract and observe the pH. pH less than 7
indicates the presence of acid and more than 7 indicates the presence of alkali.
Alternate Method
b) Litmus Paper Test: Moist the blue litmus paper with distilled water and
impregnate it with exhibit as such or it’s distilled water extract and observe the
colour change of the paper. Colour changing from blue to red indicates the
presence of acid. If red litmus paper changes to blue, then it is indicates the
presence of alkali.
Test for Chloride1 : Take the appropriate portion of the exhibit in a beaker,
add distilled water, shake well and filter it. Take few ml. of the filtrate in a test tube
and add 1 drop of nitric acid followed by few drops of 0.2 M silver nitrate solution.
A white curdy precipitate is obtained which is soluble in excess of ammonium
hydroxide solution.
Page 35 of 62
Test for Sulphuric Acid
Test for Acidic Nature:
a) pH Paper Test: Moist the pH paper with distilled water and impregnate it with
exhibit as such or its distilled water extract and observe the pH. PH less than 7
indicates the presence of acid.
Alternate Method
b) Litmus Paper Test: Moist the blue litmus paper with distilled water and impregnate
it with exhibit as such or its distilled water extract and observe the colour change of
the paper. Colour changing from blue to red indicates the presence of acid.
Test for Sulphate1 : Take the appropriate portion of the exhibit in a beaker add
distilled water, shake well and filter it. Take few ml. of the filtrate in a test tube and
add few drops of concentrated hydrochloric acid followed by0.25 M barium chloride
solution. White precipitate indicates the presence of sulphate.
Test for Nitric Acid
Test for Acidic Nature :
a) pH Paper Test : Moist the pH paper with distilled water and impregnate it with
exhibit as such or its distilled water extract and observe the pH. PH less than 7
indicates the presence of acid.
Alternate Method
b) Litmus Paper Test : Moist the blue litmus paper with distilled water and
impregnate it with exhibit as such or its distilled water extract and observe the
colour change of the paper. Colour changing from blue to red indicates the
presence of acid.
Test for Nitrate : Depending upon the nature of exhibits and availability
of resources, any one of the following methods can be used for the detection of
nitrate. Take the appropriate portion of the exhibit in a beaker and add distilled
water, shake well and filter it. The filtrate may be used for performing the tests.
a) Ring Test2:
(i) Add about 3 ml of a freshly prepared saturated solution of ferrous sulphate to
about 2 ml of the nitrate solution (filtrate of the exhibit) in a test tube and pour 3-5 ml
conc. sulphuric acid slowly down the side of the test tube so that acid forms a layer

Page 36 of 62
beneath the mixture. A brown ring will form where the liquids meet which indicates
the positive test for the presence of nitrate.
(ii) Add about 4 ml of conc. sulphuric acid slowly to about 2 ml of the nitrate
solution (filtrate of the exhibit) in a test tube and mix the liquids thoroughly and
cool the mixture in tap water. Now a saturate solution of ferrous sulphate is added
slowly down the inner sidewall of the test tube to form a layer on the top of the
liquid. Formation of a brown ring at the junction of two liquids indicates the
presence of nitrate.
b) Diphenylamine Reagent Test2: To a small amount of diphenylamine reagent
(dissolve 0.5 gm. Of diphenylamine in 85 ml conc. sulphuric acid and dilute to 100
ml with water) in a test tube add a small portion of the filtrate carefully to the side
of the test tube, a blue ring at the junction indicates the presence of nitrate.
c) Ferrous Sulphate Test3 : To a drop of filtrate on a spot plate add a crystal of
ferrous sulphate (pin head), a drop of conc. sulphuric acid is allowed to run in at the
side. In the presence of nitrate, a brown ring is formed around the ferrous sulphate
crystal.
d) Brucine Test3 : To a few drop of filtrate, a solution of brucine (0.02% in sulphuric
acid, prepare immediately before use) is added on a spot plate, in the presence of
nitrate a red colour is developed, on standing it changes to yellowish red.
References:
1. G.H. Jeffery et al, “Vogel’s text book of quantitative inorganic analysis” 4th
edition, 1986, p.433, 504.
2. G. Svehla, “Vogel’s text book of macro and semi-micro qualitative inorganic
analysis”, 5th
edition, 1979, p.334-335, 346-347, 336.
3. Fritz feigl, “Spot tests in inorganic analysis”, 5th
edition, 1959, p.326, 328-329.
Page 37 of 62
SECTION - 6
TRAP CASES EXAMINATION
INTRODUCTION
Chemical indicators change color between acidic and alkaline solution. Law
Enforcement Agencies exploit this property of chemical indicators to lay trap for
illegal gratification in the form of transfer of cash between two persons. Indicators
like phenolphthalein or anthracene are very useful for their white color powdery
nature. Now-a-days phenolphthalein indicator is being used in most of the trap cases.
The currencies are laced with the phenolphthalein powder and when the cash is
exchanged between hands, by Locard’s principle, the indicator also get smudged in
the hands of the alleged money receiver. When the hands or any other belonging of
the receiver is washed with colorless sodium carbonate solution, the latter changes to
pink colour. These washings are collected and sent to the forensic laboratories along
with other relevant articles to establish the presence of phenolphthalein which can be
considered as vital evidence in the court. The pink color of this solution persists for
some days or months depending on the quantity of the phenolphthalein and strength
of the alkali solution. It gradually fades and sometimes becomes colorless at the time
of trial in the court. However, this phenomenon can be explained by the scientist on
scientific basis that the color of the phenolphthalein fades due to its breaking down
into 2(4 –hydroxy benzoyl) benzoic acid and phenol in alkali medium.
As mentioned earlier, anthracene powder is also rarely used for this purpose in
trap cases as it does not pose such problem of color fading and has an advantage
because of its fluorescence property. The hands, clothes etc of the suspect can be
immediately examined under u. v. light, violet/blue fluorescence1&2 can be clearly
seen. This proves direct contact of the suspect with currency notes. Pure anthracene
exhibits blue fluorescence but impure anthracene due to presence of tetracene,
naphthacene etc exhibits yellow with green fluorescence.
Title : Detection of Phenolpthalein indicator or Anthracene.
Scope: The washings and other exhibits involved in the trap are sent to the
laboratory for their examination for the detection of phenolphthalein and for the

Page 38 of 62
presence of sodium and carbonate ions. Sometimes, anthracene and Calcium
Hydroxide are also being asked to detect when they were used in trap cases.
Purpose: Detection of phenolphthalein, sodium ions, carbonate ions, calcium
ions, anthracene etc. depending upon the type of trap carried out.
Methods:
. When phenolphthalein powder is used:
The hand washings, bag washings, cloth washings etc of the suspect is collected in
dilute sodium carbonate-water solution or lime water along with other relevant articles
from the scene of crime such as currency notes, clothes, bags etc sent to the laboratory
for the chemical examination.
In case of untreated objects, ethyl alcoholic wash/ extract of the appropriate
portion of the exhibits can be taken for the examination for the detection of the
phenolphthalein. Alternatively, dilute solution of alkali (sodium carbonate) in water
can also be used for washing/extracting the exhibits. These washing shall be used
only for the detection of the phenolphthalein and not for the detection of the sodium
and carbonate ions.
In case of alkali treated objects, wash the appropriate portion of the exhibits
with water and used for the detection of the phenolphthalein, sodium and
carbonateions etc.
When anthracene powder is used:
Articles from the scene of crime such as currency notes, clothes, bags etc along with
traces of powder collected by carefully brushing the suspected area of contact of
accused shall be sent to the laboratory for the examination.
In case of the object of anthracene, the appropriate portion of the object/
exhibit (after examination under u.v. light) can be washed with ethyl alcohol for the
examination.
Details of the Methods of analysis:
The following methods can be used for the examination of the trap case for the
detection of required constituents depending upon the case history/ nature of the
examination of the case.
Test for Phenolphthalein:
Color Tests:

Page 39 of 62
pH Test2,3 :
Observe the pH of the solution exhibit with the pH paper. More than pH 9 (pH range
8.3-10) with pink /red color indicates the positive test for the presence of
phenolphthalein.
Acid –Alkali Test3, 4:
Take an appropriate portion of the exhibit solution. Add few drops dilute hydrochloric
acid. The pink color of the exhibit disappears. Now add few drops of dilute solution
of sodium hydroxide in water, the pink color reappears. If required, this test can also be
performed on residue obtained after evaporation of ethanol extract of the exhibit, but in
this case first add alkali solution and then acid. Appearing and disappearing of pink
color indicates the positive test for the presence of phenolphthalein.
Extraction5,6 :
Take appropriate amount of the exhibit solution. Make the solution acidic with the
addition of dilute hydrochloric acid drop wise with stirring till pH is about 4 to 5.
(Alternatively, till acidic to Congo red). Extract with 20-25ml of solvent ether two
times and evaporate to concentrate and used for other tests. The ether extract can also
be evaporated to dryness and the residue can be dissolved in ethanol, which can be used
for other tests.
Thin Layer Chromatography:
Stationary phase : TLC plate coated with silica gel G or silica gel G F254.
Mobile phase : Any one of the followings:-
1. Benzene, Dioxan and acetic acid (75:15:10)6
2. Chloroform and Acetone ( 80:20)7
3. Ethyl acetate, Methanol and Strong Ammonia (27 to 30%w/w)7
(8.5:1.0:0.5)
Visualization: 1. Spray with dilute sodium hydroxide solution
2.Acidified potassium permanganate solution7
(1% soln.of potassium permanganate in 0.25 M
sulphuric acid)
3. U.V. light.

Page 40 of 62
Instrumental techniques
Spectrophotometric examination5:
Take a portion of the exhibit solution, filtered and scan to note its max absorbance
value by spectrophotometer in appropriate dilution using a standard solution of
phenolphthalein in aqueous alkali (sodium carbonate) for comparison. The pink color
of phenolphthalein in aq. Sodium carbonate solution gives the lambda max in between
around 550-555 nm. Aqueous solution of sodium carbonate is used as blank solution
for the experiment.
Other instrumental techniques like HPLC, FTIR, GC-MS are also being used for the
detection of Phenolphthalein.
Alternate Test for Phenolphthalein:
Folin-Ciocalteu’s reagent test5:
Take about 1 ml of alcoholic extract of the exhibit obtained as per required extraction
procedure. Add 1 ml of folin –ciocalteu reagent followed by 2 ml of 20% sodium
carbonate solution. Blue color indicates the positive test for the presence of
phenolphthalein.
Test for Anthracene :
Color Test :
Observation under u.v. light – Violet/blue/green fluorescence.
Thin Layer Chromatography8: Sample
preparation : In ethyl alcohol
Stationary phase : Silica gel G
Mobile phase : (Any two)
1. Heptane
2.Hexane
3.Carbon tetrachloride
Visualization : 1. U.V. light
2. Formaldehyde-Sulphuric acid reagent
(0.2 ml of 37% formaldehyde solution in 10ml of conc. Sulphuric acid)
Page 41 of 62
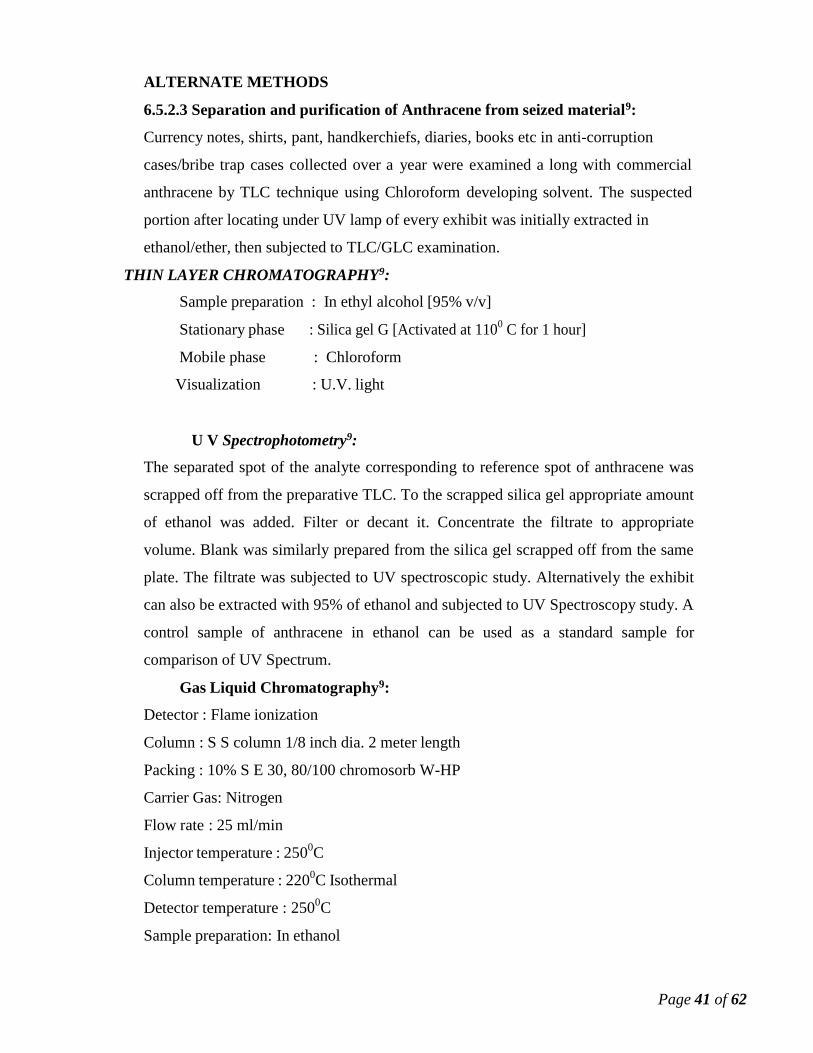
ALTERNATE METHODS
6.5.2.3 Separation and purification of Anthracene from seized material9:
Currency notes, shirts, pant, handkerchiefs, diaries, books etc in anti-corruption
cases/bribe trap cases collected over a year were examined a long with commercial
anthracene by TLC technique using Chloroform developing solvent. The suspected
portion after locating under UV lamp of every exhibit was initially extracted in
ethanol/ether, then subjected to TLC/GLC examination.
THIN LAYER CHROMATOGRAPHY9:
Sample preparation : In ethyl alcohol [95% v/v]
Stationary phase : Silica gel G [Activated at 1100 C for 1 hour]
Mobile phase : Chloroform
Visualization : U.V. light
U V Spectrophotometry9:
The separated spot of the analyte corresponding to reference spot of anthracene was
scrapped off from the preparative TLC. To the scrapped silica gel appropriate amount
of ethanol was added. Filter or decant it. Concentrate the filtrate to appropriate
volume. Blank was similarly prepared from the silica gel scrapped off from the same
plate. The filtrate was subjected to UV spectroscopic study. Alternatively the exhibit
can also be extracted with 95% of ethanol and subjected to UV Spectroscopy study. A
control sample of anthracene in ethanol can be used as a standard sample for
comparison of UV Spectrum.
Gas Liquid Chromatography9:
Detector : Flame ionization
Column : S S column 1/8 inch dia. 2 meter length
Packing : 10% S E 30, 80/100 chromosorb W-HP
Carrier Gas: Nitrogen
Flow rate : 25 ml/min
Injector temperature : 2500C
Column temperature : 2200C Isothermal
Detector temperature : 2500C
Sample preparation: In ethanol
Page 42 of 62
Test for Carbonate ions :
Color Tests :
Test with acid10 :
To a portion of the exhibit solution add few drops of dilute hydrochloric acid,
effervescence is observed. If needed, the resulting gas can be passed through baryata
water/ lime water. Turbidity/ curdy white precipitate appears. If the gas is passed for
long time, the precipitate or turbidity slowly disappears. The exhibit may be gently
heated with dilute hydrochloric acid to produce sufficient effervescence/ gas.
Barium Chloride Test 10:
To a portion of the exhibit solution add few drops of barium chloride solution (about 5-
6 % barium chloride in water. Formation of white precipitate, which is soluble in
mineral acids, indicates the positive test for the presence of carbonate ions. Bicarbonate
ions do not form white precipitate, as they do not react with barium chloride solution.
ALTERNATE METHODS:
Silver Nitrate Test10:
To a portion of the exhibit solution add few drops of silver nitrate solution (about 2 %
in water). Formation of white precipitate, which is soluble in ammonia solution,
indicates the positive test for the presence of carbonate ions.
Magnesium Sulphate Test10:
Take appropriate portion of the exhibit as such or its water (distilled) extract. Add
magnesium sulphate in the cold condition. If no precipitate is obtained then it indicates
the presence of bicarbonate. If a white precipitate is formed then it is a positive test for
the presence of carbonate.
Test for Sodium:
Color Test:
Uranyl Zinc Acetate Test11:
Take a portion of exhibit solution and make it neutral with acetic acid. Add few drops
of uranyl zinc acetate reagent, shake/ stir with glass rod. Formation of yellow
precipitate or cloudiness indicates positive test for the presence of sodium.
Page 43 of 62
Preparation of uranyl zinc acetate12:
Take 10 gms of uranyl acetate in 55ml of water, 30 gms of zinc acetate, and 9 ml of
acetic acid. Heat to dissolve and dilute with water to make up to 100 ml. Allow to stand
for 24 hours, and filter.
Alternate method for the preparation of uranyl zinc acetate reagent 13:
Solution A:
Take 10 grams uranyl acetate in 6 gms of 30% acetic acid. If necessary warm it, dilute
with distilled water to 50ml .
Solution B: 30 grams zinc acetate is stirred with 3gms 30% acetic acid and dilute it
with distilled water to 50 ml. Mix the above two solutions A and B. Warm if required.
Add a trace of sodium chloride, keep it for 24 hours and filtered. Filtrate is used as
above reagent.
Test for Calcium
Test with Sodium Rhodizonate14:
Take one drop of neutral or weakly acid test solution add a drop of freshly prepared
0.2% a sodium rhodizonate solution add one drop of 0.5 N sodium hydroxide solution,
a violet colour indicates the presence of calcium.
Alternate Methods for Sodium & Calcium:
Flame test15:
Take appropriate portion of the exhibit as such or its water (distilled) extract evaporate
to dryness, moisten with a few drops of conc. Hydrochloric acid to make past. Take a
small portion of paste with the platinum wire and introduce into the non-luminous
flame of a semi-micro burner. A persistence golden yellow flame indicates the
presence of sodium and a brick red (yellowish red) flame indicates the presence of
calcium.
Alternate Method of Flame Test16
Take a platinum or nichrome wire and wet it with conc. Hydrochloric acid and heat it in
the non-luminous flame of the burner until the yellow colour of the flame disappears.
Dip the wire into test exhibit solution as such or its distilled water extract (or powder if
exhibit is solid) and heat it in the non-luminous flame of the burner. Observe the colour
of the flame as above.
Page 44 of 62
References:
1. Organic Chemistry Volume 1 The Fundamental Principles by I.L. Finnar, 6th
edition, The English Language Book Society and Longman Group Limited,
London, 1973, pp. 814.
2. The Merck Index 11th
edition by Susan Budavari, Published by Merck & Co. Inc.,
Rahway, USA, 1989, pp.108 (Acc. No.3404).
3. Vogel’s Text Book of Quantitative Inorganic Analysis, 4th
edition, by J. Bassett,
R.C. Denney, G.H. Jeffery, J. Mendham, English Language Book Society /
Longman, Great Britain, 1986, pp. 241
4. The Merck Index 11th
edition by Susan Budavari, Published by Merck & Co. Inc.,
Rahway, USA, 1989, pp.1150 (Acc. No.3404)
5. Isolation and identification of drugs by E.G.C. Clarke, vol.1, The pharmaceutical
Press, London, 1974, pp.488 (Acc. No.1325).
6. Break down products of phenolphthalein in alkali media by K. Narayanswamy,
K.S. Chhavra, B. Mandal & H.L. Bami, Forensic Science (Journal), 1978, Vol.17
No.2, pp.92-94.
7. Clarke’s Isolation and Identification of Drugs by A.C. Moffat, second
edition, The pharmaceutical Press, London, 1986, pp. 885 & 168 (Acc. No.3981).
8. Thin Layer Chromatography by Egon Stahl, second edition, George Allen &
Unwin Ltd., London, 1969, pp.668-669 (Acc. No.598).
9. Forensic Examination of Anthracene Traces on Seizures in Anticorruption
Offence by TLC, UV and GLC Techniques by A G Bhoi and K A Ambade, Journal
of Indian Academy of Forensic Sciences (1991) Page no. 19 to 26.
10. Vogel’s text book of macro and semi-micro qualitative inorganic analysis by G.
Svehla, 5th
edition, Longman Group Limited, Great Britain, 1979, pp. 298-301
(Acc.No2357).
11. Analytical Chemistry by S. Shapiro & Ya. Gurvich, MIR Publishers, Moscow,
1972, pp.63-64
12. Analytical Chemistry by S. Shapiro & Ya. Gurvich, MIR Publishers, Moscow,
1972, pp.537
13. Spot test in inorganic analysis by Fritz Feigl, fifth edition, Elsevier Publishing
Company, Netherlands, 1958, pp. 230 (Acc.No.33).

Page 45 of 62
14. Spot test in inorganic analysis by Fritz Feigl, fifth edition, Elsevier Publishing
Company, Netherlands, 1958, pp. 222-223 (Acc. No. 33).
15. Vogel’s text book of macro and semi-micro qualitative inorganic analysis by G.
Svehla, 5th
edition, Longman Group Limited, Great Britain, 1979, pp. 465-66.
16. Analytical Chemistry by S. Shapiro & Ya. Gurvich, MIR Publishers, Moscow,
1972, pp.65.
Other alternate additional references for phenolphthalein detection:
1. N. Geeta & T.R. Baggi, Determination of Phenolpthalein by reverse Phase
High-Performance Liquid Chromatography, Micro Chemical Journal, 42,
1999, pp.170-175.
2. T.R. Baggi & H.R.K. Murthy, “A new Colour Test for Detection of
Phenolphthalein”, J. Inst. Chem. (India) 1986, 58.
Page 46 of 62
SECTION- 7
EXAMINATION OF LIQUOR/
ALCOHOLIC DRINKS AND ALCOHOL
INTRODUCTION
Liquor is normally a mixture of water and alcohol. The term alcohol is often used for
ethyl alcohol. The liquor is manufactured by the fermentation process in which
carbohydrates are fermented in presence of enzymes as per their specifications given
in Bureau of Indian Standards (BIS). Country made liquor is alcoholic product
usually prepared from fermentation of carbohydrates present in cereals, jaggery,
fruits, mahua, palm, molasses etc. The liquors are sold in the market in various
brands and covered under Excise Act. The possession, sale, transportation of liquor is
allowed only as per the Rules and Regulations of Excise and Prohibition. On many
occasions, these liquors are being smuggled from one State to another State, illegal
possession, transported without proper valid documents. These samples are seized by
the Police and submitted to the Forensic Laboratory for their examination. The liquor
is examined in the laboratory for two purposes; firstly, for Excise purpose where,
mainly the presence of alcohol plays an important role and accordingly the
examination of liquor samples for the qualitative and quantitative analysis is the main
purpose of the investigation. Secondly, the liquor is examined for quality
control/duplicate samples, which are being sold in the market in which the
examination is carried out for other parameters also apart from alcohol contents. The
alcohol contents are also reported in percentage of proof spirit, percentage of alcohol
(weight by volume) and percentage of alcohol (volume by volume).
Title : Testing of Alcoholic drinks/liquor/alcohol
Scope: Various types of alcoholic drinks/liquor in crime exhibits for excise and
checking of quality control/duplicity purposes.
Purpose : To analyze the various types of alcoholic drinks to detect the
presence and percentage of alcohol (ethyl alcohol)/percentage of proof spirit, and
other ingredients in liquor, if required, in the crime exhibits received from various
investigating and law enforcement agencies under Excise and Prohibition Act. This

Page 47 of 62
generally prescribes the methods for test of alcoholic drinks/alcohol in crime exhibits,
which is generally found in cases of illicit possession and preparation, smuggling,
spurious/duplicate liquor, excise and other crime cases etc.
Methods:
Qualitative Analysis of Liquor:
Test for Ethyl Alcohol: The following tests are to be carried out for the
detection of ethyl alcohol in the exhibits.
(a) Iodoform Test1 : Take about 1 ml or appropriate sample (distilled or as such
depending upon the nature of sample and concentration of ethanol) and add about 1
ml of 5% sodium hydroxide solution and then add iodine solution (20 gm Potassium
iodide + 10 gm Iodine in 100 ml water) drop-wise with shaking until the liquid
becomes persistent dark brown in colour. Keep it for 2-3 minutes. If the iodine
colour disappears add more drops of iodine solution until persistent brown colour of
iodine. Add few drops of dilute sodium hydroxide solution to remove extra iodine.
Add equal volume of water, keep it for ten minutes. Yellow crystalline precipitate
indicates the positive test for the presence of ethanol.
(b) Dichromate Test2 : To about 1 ml or appropriate amount of sample (distilled
or as such depending upon the nature of samples and concentration of ethanol) is
added about 0.2 ml of 2% potassium dichromate solution followed by about 1 ml of
concentrated sulphuric acid. The yellow colour of the dichromate changes to green
or blue indicates the presence of ethanol.
Test for Methanol3 : Take about 1 ml or appropriate amount of sample
(distilled or as such depending upon the nature of sample and concentration of
methanol) in a test tube add about 2 ml of potassium permanganate solution (3 gm
potassium permanganate and 15 ml of phosphoric/ortho phosphoric acid in 100 ml
distilled water) and shake well. Now add few crystals of sodium bisulphate with
shaking till disappearance of colour (potassium permanganate colour) of the solution.
Add about 1 ml of chromotropic acid (5% of aqueous solution of sodium salt of
chromotropic acid) and add concentrated sulphuric acid slowly with inner sidewall of
the test tube to the extent of 15 ml. Appearance of violet colour indicates the
presence of methanol.

Page 48 of 62
Test for Copper & Iron4 : Take about 5 ml or appropriate amount of
sample add 1 drop of Nitric acid and 1 ml of 0.025 M potassium Ferrocyanide
solution. Prussian blue colour indicates presence of iron and chocolate colour
indicates the presence of copper.
Test for Furfural3 : Take about 5 ml or appropriate amount of sample
(distilled or as such depending upon the nature of sample and concentration of
furfural) in a test tube, add about 1 ml aniline and about 0.5 ml hydrochloric acid and
keep it for 15 minutes. Appearance of red colour indicates the presence of furfural.
Alternative method for testing furfural :
a) Take about 2 ml or appropriate amount of the sample distilled or as such
depending upon the nature of sample in a test tube, add about 0.2 ml of aniline and
about 0.4 ml of glacial acetic acid. If the furfural is present in the sample, red colour
develops in a few seconds & reaches its maximum intensity in 5-10 minutes5.
b) Take about 2 ml or appropriate amount of the sample distilled or as such
depending upon the nature of sample in a test tube, add about 1 ml of aniline acetate
solution (10% V/V solution of aniline in glacial acetic acid). Appearance of red
colour indicates the presence of furfural. The colour develops at room temperature of
25-300C and reaches its maximum intensity in 1-5 minutes6.
Quantitative Analysis of Liquor:
Determination of Ethanol: Depending upon the nature of sample and
examination required and resources available any one of the following methods can
be used for the quantitative analysis of ethyl alcohol.
Determine the specific gravity of the distilled sample by specific gravity bottle and
apply the bottle correction and temperature correction for 600F as per the table
showing weight in gram of the spirit of temperatures 610 to 100
0 given under the
instructions for ascertaining the real alcoholic strength of drugs chemicals, medicines
dietetics and toilet preparations entered for test prepared by R.L. Jenks, F.I.C.,
Examiner for Customs and Excise, Calcutta (Central Board of Revenue) 1914-1928
Revised-1936 and find out the quantity of alcohol (% of proof spirit and % of alcohol
V/V) from the table showing the relation between the specific gravity of spirits at
600/60
0 F and the percentage of ethyl alcohol by weight and by volume with the

Page 49 of 62
corresponding percentage of proof spirit issued under the authority of the
Commissioner of Her Majesty’s Customs and Excise, London, Her Majesty’s
stationery office 1955, Reprinted 1971 (Annexure I & II).
Example of Calculation: At temperature of 760F (24.5
oC ) F=CX1.8+32=76.1oF
1. Weight of 50 ml specific gravity bottle : 26.6870 gm
2. Weight of bottle plus distilled water : 76.6720 gm
3. Weight of water : 76.6720-26.6870 = 49.9850 gm
4. Weight of 1000 ml water : 49.9850 x 20 = 999.7 gm
5. Temperature correction : 1.64 (to be added) at 76oF
6. Weight of 1 liter water : 999.7 + 1.64 = 1001.34
7. Bottle correction : 1001.34 – 1000 = 1.34
8. Weight of exhibit and bottle : 73.8250 gm
9. Weight of the exhibit : 73.8250 – 26.6870 = 47.138 gm
10. Weight of the 1000 ml exhibit : 47.138 x 20 = 942.76 gm
11. Weight of exhibits with bottle correction : 942.76 – 1.34 = 941.42 gm
12. Temperature correction : 6.00 (at 760F)
13. Corrected weight of the exhibit : 940.46 + 6.00= 946.46 gm
14. Specific gravity of the exhibit : 946.46/1000 = 0.94646
15. Percentage of proof spirit : 75.69
16. Percentage of alcohol V/V : 43.25
ALTERANATIVE METHODS FOR ETHYL ALCOHOL:
(a) Gas Chromatography1 :
Operating conditions :-
Column : Porapak polymer bead 80-100 mesh or its equivalent, which can
separate/resolve the ethanol
Column Temperature : 1600C
Carrier Gas : Nitrogen Gas
Rate of gas flow : 50 ml/min
Detector : FID (Flame Ionization Detector)
Page 50 of 62
Alternative Operating Conditions7 :
Column : 0.3% Carbowax 20 M on 80-100 mesh Carbopak C, 2m x 2mm ID or its
equivalent
Column Temperature : 350C for 2 minutes and then programmed at 5
0C per minute to
1750C and hold for at least 8 minutes
Carrier Gas : Nitrogen at 30 ml/min
(b) The percentage (contents) of the alcohol can also be found from the table given
in Official Methods of Analysis of the Association of Official Agricultural Chemists
(A.O.A.C.)8 after calculating the specific gravity of the liquor samples.
Determination of Methyl Alcohol :
Gas Chromatography1 :
Operating conditions :-
Column : Porapack polymer bead 80-100 mesh or its equivalent, which can
separate/resolve the ethanol
Column Temperature : 1600C
Carrier Gas : Nitrogen Gas
Rate of gas flow : 50 ml/min
Detector : FID (Flame Ionization Detector)
Alternative Operating Conditions7 :
Column : 0.3% Carbowax 20 M on 80-100 mesh Carbopak C or its equivalent
Column Temperature : 350 for 2 minutes and then programmed at 5
0 per minute to
1750 and hold for at least 8 minutes
Carrier Gas : Nitrogen at 30 ml/min
7.4.2.3 Other Determinations: The following determinations (some or all
depending upon the nature of examination and infrastructure available), if required,
may be carried out as per IS:3752:1988.
i) Determination of ash
ii) Determination of total acidity
iii) Determination of volatile acidity
iv) Determination of fixed acidity
v) Determination of residues on evaporation
Page 51 of 62
vi) Determination of esters
vii) Determination of higher alcohols
viii) Determination of aldehydes
ix) Determination of copper
x) Determination of furfural
References :
1. Arthor I Vogel, “A text book of practical organic chemistry”, 3rd
edition,
1956, page 1068-1069
2. Swarup Narain Tiwari, “Analytical Toxicology, Bureau of Police Research
& development” 1976, Page 20.
3. IS 3752 ; 1988 Indian Standard Alcoholic Drinks – Methods of Test, First
Revision.
4. G. Svehla, “Vogel’s text book of Macro and Semi-micro qualitative inorganic
analysis”, 5th
edition, 1979, Page 218 & 246
5. IS : 323 – 1959, Indian Standard specification for rectified spirit, Revised, 9th
Reprint December, 1989, page 28-29
6. P.S. Raju and S.M. Chatterjee, “A Spectrophotometric Method for
determining furfuraldehyde in illicit liquors”, Journal of Indian Academy of
Forensic Science, Vol.4, No.1, Jan., 1965
7. A.C. Moffat et.al, “Clarke’s Isolation and Identification of Drugs”. The
Pharmaceutical Press, London, 2nd
Edition, 1986.
8. William Horwitz, Official Methods of Analysis of the Association of Official
Agricultural Chemists (A.O.A.C.), 10th
edition, 1965, pp.854-72

Page 52 of 62
ANNEXURE- I
SOME OF THE IMPORTANT AND USEFUL REFERENCES OF
BOOKS/LITERATURE:
REFERENCES:
1. Clarks Isolation & Identification of Drugs. The pharmaceutical & press .
2. Food Inspection and analysis. Albert E. Leach. John willey & sons.
3. Adulteration and Analysis of Food & Drugs J. F. Levrseege. J.A. Churchill 1932.
4. Encyclopaedia of Industrial chemical analysis vol. 18, Foster Dee Snell, Inter
Science Publishers (1974).
5. B.N.Mattoo, P.P.Pai, & Miss R. Krishnamurthy, Caffeine its Basicity, Acidity
Hydrolysis & spectrophotometric Assay, Ind. J. Chem. of 15A, 1977,141.
6. Encyclopaedia of Industrial chemical analysis vol. 17, Foster Dee Snell, Inter
Science Publishers (1974).
7. Encyclopaedia of Industrial chemical analysis vol.19, Foster Dee Snell, Inter
Science Publishers (1974).
8. BIS Specifications of various substances/products
9. G. Svehla, “Vogel’s text book of Macro and Semi-micro qualitative inorganic
analysis”, 5th
edition, 1979
10. Swarup Narain Tiwari, “Analytical Toxicology, Bureau of Police Research &
development” 1976
11. Arthor I Vogel, “A text book of practical organic chemistry”, 3rd
edition, 1956,
12. Manuals of working procedures of varios organizations like Food laboratory,
National Institute of Nutrition, Geological Survey of India etc
13. Instrumental data for Drug Analysis by Mills et. al., 2nd
edition, CRC Press, New
York (series of books).
14. Mass Spectral and GC Data of Drugs, poisons and their metabolites by Karl
Pflegar/Hans Maurer/Armin Weber, Part-I, VCH Publishers, Federal Republic
of Germany, 1985.

Page 53 of 62
15. Mass Spectral and GC Data of Drugs, poisons and their metabolites by Karl
Pflegar/Hans Maurer/Armin Weber, Part-II, VCH Publishers, Federal Republic
of Germany, 1985.
16. Dictionary of Drugs Indexes by J Elks and C R Ganellin Chapman and Hall,
London, 1990.
17. Dictionary of Drugs Indexes by J Elks and C R Ganellin Chapman and Hall,
London, 1990.
18. Hand Book of Pharmaceutical Excipients, 2nd
edition by Ainley Wade and Paul J
Weller, the Pharmaceutical Press, London, 1994.
19. British Pharmacopoeia, Volume I, Stationery Officer, London, 2001.
20. British Pharmacopoeia, Volume II, Stationery Officer, London, 2001.
21. The Indian Pharmacopoeia, Volume I, Controller of Publications, Delhi, 1985.
22. The Indian Pharmacopoeia, Volume II, Controller of Publications, Delhi, 1985.
23. Official methods of analysis of the association of Official Analytical Chemists by
Kenneth Helrich, 15th
edition, Volume I & II, the Association of Official
Analytical Chemists Inc., Virginia, 1990.
24. Official methods of analysis of the association of Official Analytical Chemists by
Sidney Williams), 14th
edition, Volume I & II, the Association of Official
Analytical Chemists Inc., Virginia, 1984.
25. Official methods of analysis of the association of Official Analytical Chemists by
William Horwitz, 10th
edition, the Association of Official Agricultural
Chemists, Washington, 1965.
26. Official methods of analysis of the association of Official Analytical Chemists by
Keenneth Helrich, 12th
edition, Volume I & II, the Association of Official
Analytical Chemists Inc., Washington, 1975.
27. Official methods of Analysis of AOAC International, 16th
edition, Volume II by
Patricia Cunniff. Published by AOAC International, Virginia, USA.
28. Official methods of Analysis of AOAC International, 16th
edition, Volume I by
Patricia Cunniff. Published by AOAC International, Virginia, USA, 1995.
29. The Merck Index, 11th
edition by Susan Budavari, Published by Merck & Co.
Inc., Rahway, USA, 1989.
30. US Pharmacopoeia, Association by Tata Press, India, 1985.
Page 54 of 62
31. HPLC methods for Pharmaceutical Analysis, Volume III by George Lunn.
Published by John Wiley & Sons Inc., New York, 2000.
32. HPLC methods for Pharmaceutical Analysis, Volume III by George Lunn.
Published by John Wiley & Sons Inc., New York, 2000.
33. HPLC methods for Pharmaceutical Analysis, Volume IV by George Lunn.
Published by John Wiley & Sons Inc., New York, 2000.
34. HPLC methods for Pharmaceutical Analysis, Volume II by George Lunn.
Published by John Wiley & Sons Inc., New York, 2000.
35. Hand book of derivatization reactions for HPLC by George Lunn, Louise C
Hellwig John Wiley & Sons Inc., New York, 1998.
36 Chromatographic analysis of Pharmaceuticals by John A Adamovics, volume 49,
Merk Dekkar Inc., New York, 1990.
37. Pharmaceutical and Biomedical applications and Capillary Electrophoresis by
Susan M Lunte and Donna M Radzik, volume 2 by Biddles Ltd., Guilford,
1996.
38. Mass Spectrometry in Drug Metabolism by Alberto Frigerio and Emilio and
Ghisalberti, Plenium Press, New York, 1977 etc.
39. Thin Layer Chromatography by Egon Stahl, second edition, George Allen &
Unwin Ltd., London, 1969.
40. Analytical Chemistry by S. Shapiro & Ya. Gurvich, MIR Publishers, Moscow,
1972
41. Spot test in inorganic analysis by Fritz Feigl, fifth edition, Elsevier Publishing
Company, Netherlands, 1958 etc.
Page 55 of 62
1. Colour tests
IMPORTANT TECHNIQUES:
ANNEXURE- II
2. Thin Layer Chromatography (TLC)
3. High Performance Thin Layer Chromatography (HPTLC)
4.High Performance Liquid Chromatography (HPLC)
5.Gas Liquid Chromatography (GLC)
6.Gas Chromatography – Mass Spectrometry (GC-MS)
7.Liquid Chromatography – Mass Spectrometry (LC-MS)
8.Emission Spectrography
9. ICP-OES
10. AAS
11.X-Ray Diffractometer (XRD)
12.Ion-Mobility Spectroscopy
13.Microscopy
14.UV-Vis Spectrophotometry
15.IR/FTIR Spectroscopy, etc.
SOME OF THE IMPORTANT AND USEFUL TECHNIQUES /
INSTRUMENTAL METHODS:
1. High performance thin layer chromatography (HPTLC):
This technique is advancement of TLC, which is also called Modern TLC or
Instrumental thin layer chromatography or planar chromatography. In this technique
the sample solution is spotted on TLC/HPTLC plate with the help of automatic
sample applicator in band or spot form. The band wise application gives better
separation. The plate is developed in suitable developing system depending upon the
nature of the sample in appropriate developing chamber. The most commonly used
chamber is twin trough chamber. After the development of chromatogram, the plate is
scanned by scanner for getting densitogram followed by spectral scanning, if
required, in uv-vis regions. After the densitometric evaluation of the chromatogram
Page 56 of 62
and spectral scanning, the identity of the compound in test exhibit or mixture can be
confirmed based on Rf value, pattern and -max of the in-situ spectrum is matched
with control or standard sample. The quantitative analysis can also be carried out
based upon the peak area or peak height calculation. The technique can also be used
to know the purity (peak purity) of the compound qualitatively.
2. High performance liquid chromatography:
Principle-In this technique mixture of sample is separated on columns, filled with
small particles. (10 m in diameter) by elution with liquid under high pressure. The
two important types of chromatography are (1).Adsorption chromatography
(2).Partition chromatography.
In adsorption chromatography, column is packed with solid silica, Alumina that
retains the solute by adsorption. It is also called liquid solid chromatography. In
partition chromatography column is packed with thick layer of liquid & sample get
partitioned between two liquids, it is also called liquid-liquid chromatography. When
sample is injected to the column separation of sample to components takes place with
the help of mobile phase (a liquid phase). These components pass through detector
generally refractive index or ultra violet, which detects specific property of
component which is not possessed by mobile phase, signal produced are fed to the
integrator which records chromatogram. Preparation of sample is made by dissolving
solute in suitable solvent & injected to column, which is previously rinsed with
mobile phase. The sample gets partitioned between mobile phase & stationary phase
or get adsorbs on stationary phase, depending on type of chromatography and
separates into component. The separated component passes through detector where
signal is produced, signal is fed to integrator, that record chromatogram. H.P.L.C.
technique is generally used for substance, which are thermally labile such as
explosives, cannabinoids as it works at ambient temperature. It is also used for polar
drugs requiring derivatisation on GLC systems can be assayed directly on H.P.L.C.
3. Gas chromatography:
Gas chromatography, like other chromatography is method of separating mixture of
sample of analytical interest. Separation is performed on column containing

Page 57 of 62
stationary phase either solid or liquid, which is maintained at definite temp. in an
oven & has constant flow of carrier gas, a mobile phase. When mixture of sample is
injected at inlet each component is swept towards the detector & gets partitioned
between gas phase & stationary phase. The molecules having greatest affinity for
stationary phase spend more time in that phase & hence take longer time to reach the
detector. Detector produces a signal dependent on the mass of component passing
through it. This signal is processed and fed to a chart recorder and then to the
integrator. Each component passing through column will have characteristic retention
time at given conditions. There are two types of column generally used in gas
chromatography. (1) Capillary column. (2) Packed column. Capillary column has
superior resolution over packed column, but the choice of phases for capillary is
limited over packed column. In forensic context gas chromatography is applicable for
many compounds such as drugs, unknown chemicals, petroleum products, gases like
H2S, N2O & anaesthetics. Preparation of sample is made by dissolving solute into
suitable solvent & then injected to preheated column with micro syringe through
silicon rubber septum. Clean extract should be used to minimise contamination of
column. With the help of gas ( a mobile phase) the components of sample are swept
to detector. Chromatogram of sample along with standard markers helps in
identification & quantitation of the compound.
4. Gas chromatography mass spectrometry (GC / MS):
In this technique gas chromatography is coupled with mass spectrometer GC
separates the mixture into component, based on retention of analyte between two
phases (liquid stationary phase and mobile gas phase). The interface directs the GC
effluent into mass spectral detector. Where electron ionisation and subsequent
fragmentation of molecule take place. The ions of negative & positive charges are
produced, the mass filter quadruple sorts these ions based on mass/charge (m/z) ratio.
The functional group present in the molecule directs fragmentation in such way that
structure of original molecule can be predicted by fragmentation pattern. The detector
produces the signal, which is proportional to number of ions of particular m/z ratio
produced. Signal feeds to recorder that record chromatogram. Preparation of sample
is done by dissolving sample into suitable solvent. Clean extract is injected to column
Page 58 of 62
with microsyringe, splitless injections are most common in GC/MS analysis. With the
help of mobile phase (gas) component of sample are swept towards interface. From
interface component are directed to mass spectral detector (M.S.D.), where ions are
produced & signal obtained fed to the recorder, which records chromatogram for
separate component. Main advantage over gas chromatography is that GC/MS helps
in determination of molecular weight of component which are separated.
5. UV-VIS Spectrophotometry:
When monochromatic light beam passes through a transparent medium the rate of
decrease in intensity with increase of thickness of medium is proportional to the
intensity of the incident light (Beer-Lamart law). In other words the intensity of
emitted light decreases exponentially as the thickness of the absorbing medium
increase arithmetically. Application of the above principle to chemical analysis is
that, monochromatic light beam usually emitted by deuterium lamp for ultra violet
range and tungsten lamp for visible range along with quartz or silica cuvette of 1 cm
path length are used. The blank /solvent is run before the analysis of the
compound/exhibit. The wavelength at maximum absorbance i.e. -max of the
compound obtained and pattern of the spectrum are the characteristics of that
compound.
Limitation of this technique is the association or dissociation or ionization of the
compound in the solvent. If the compound forms complexes the composition on
which concentration depends changes and Beer-Lamart law is not valid for such
cases. This technique is very useful for the analysis of a pure compound but may not
be useful for the analysis of the mixture of the compounds. The derivative
spectrophotometry may be used for the analysis of the mixture of the compounds
where the second order spectrum gives an idea about the identity of the compounds in
a mixture.
6. Infra-red spectrophotometry:
Infra-red spectrophotometry is study of reflected, absorbed, and transmitted radiant
energy in the region of electromagnetic spectrum from wavenumber 125000 to 20/
cm. This electromagnetic spectrum is divided into three main regions;
1. wavenumber from 125000 to 4000/cm,

Page 59 of 62
2. wavenumber from 4000 to 400/cm,
3. wavenumber from 400 to 20/cm.
The middle region is known as main IR region and may be used for the analysis of
drug and pesticides. When the molecule of the compound is subjected to infra-red
radiation’s, transition takes place in rational and vibrational energy levels in ground
state of the electron within the molecule. These transitions give rise to the absorption
spectrum, which is the characteristic of the compound. This technique is also called
finger print technique of the chemical identification. The advance version of this
technique is FTIR spectrophotometry. Under the technique, a disc of potassium
bromide along with solid sample is prepared under high pressure and IR spectrum is
recorded after calibration of the equipment with polystyrene film. In case of liquid
sample, cells that are used, having two parallel windows separated by spacing gasket
and fitted with outlet and inlet ports. The reference spectrum of solvent is recorded
before scannining of the sample.
7. Emission Spectrography:
This technique is one of the analytical techniques used for the elemental screening in
the exhibit. It can be used for carrying out semi quantitative analysis of the inorganic
elements. The technique is based on the emission property of the elements. In this
technique the sample is made powder, mixed with carbon and filled in the graphite
electrode. The filled electrode is arced at high temperature. The atom of the elements
absorbed energy and get excited. The electron of the atoms jumps from lower enrgy
level to higher energy level by absorbing the energy. When excited electron comes
back to its lower states, it emits the energy in the form of line emission spectra. This
spectra is recorded on a photography plate. After development of the plate the spectra
can be seen in the form of various line at different wavelengths, which are the
characteristc lines of the elements.
In this technique the element can be identified with out the use of standard sample.
The lines are read with the help of comparator. The position / wavelength value of the
elements are given in literature, which can be considered as the standard value of
wavelength.
Page 60 of 62
3. Inductively coupled Plasma-Atomic Emission Spectrometer (ICP-
AES)
Atomic Emission Spectrometry (AES) is the oldest atomic spectrometric multi-
elemental technique. All elements can be made to emit characteristic spectra under
appropriate conditions. AES is divided into categories according to the source of
energy that causes the element excitation. In general, the same source is used to
atomize the sample and to excite (and possibly ionize) the atoms of the sample. The
technique using classical sources (flame, arc and spark) arc widely applied. During
the past quarter century, the plasma sources (new radiation source) have become
commercially available and leading to lot of innovations for the revival of emission
spectrometry.
Plasma is an electrically neutral, highly ionized gas composed of ions, electrons and
neutral particles. The commonly used plasma have significantly higher gas
termperatures and less reactive chemical environments then flames. The plasma gas
is usually a stream of argon, which is energized with high frequency electromagnetic
fields (r.f. or microwave energy) or with direct current when combined with a high
quality spectrometers , plasma sources provide many of the characteristics of the ideal
source. The r.f. inductively coupled plasma is to date the most frequenty-applied
plasma. Samples are usually introduced into plasma in the same way as into a flame.
The ICP-AES technique is an excellent tool having many features like a high
sensitivity towards most of the elements in the periodic table, speed, matrix effect
correction, etc.
In ICP-AES technique, the sample solution is first aspirated by a nebuliser into
micron size droplets before being introduced to the plasma where the sample is
ionized and excited. The excited electrons re-emit the energy they have acquired in
the form of electron magnetic radiation, which is composed of wavelengths
characteristic of the elements emitting the radiation. The discrimination of these
wavelengths is performed by an optical system which is then fed to a detector (photo

Page 61 of 62
multiplier tube). The detector transforms the radiation into electrical signals that are
captured by the data processing system.
Reference: Modern methods for trace elements determination by C.Vandecasteele
and C.B.Black, John Wiley and Sons, UK, 1993, pg.139-143.
4. X Ray diffraction.
X ray diffraction is a versatile, non-destructive analytical technique for identification
and quantitative determination of the various crystalline forms known as phases of
compounds present in powdered and solid samples. The diffraction of x-rays by
crystalline meaterials also helps in the study of internal defects in the atomic
arrangement. The powder method applies to the study of polycrystalline materials
whether they be in powder form, as supplied by nature or process or in compacted
form as pellets or metallic mass.
A crystal lattice is a regular three-dimensional distribution (cubic, rhombic, etc.) of
atoms in sparce. These are arranged so that they form a series of parallel planes
separated from one another by a distance d, which varies according to the nature of
material. For any crystal, planes exist in a number of different orientations- each with
its own d-spacing.
When a monochromatic x-ray beam with wavelengh. is incident on a lattice planes
in a crystal at an angle, x-ray diffraction occurs only when the distance traveled by
the rays reflected from successive planes differs by a complete number n of
wavelengths.
By varying the angle the Bragg’s law conditions are satisfied by different d-spacing
in polycrystalline materials.
(Bragg’s law) n = 2d Sin
Plotting the angular positions and intensities of the resultant diffraction peaks
produces a pattern which is characteristic of the sample. Where a mixture of different
phases is present, the diffractogram is formed by addition of the individual patterns.

Page 62 of 62
Qualitative analysis
Every crystalline powder produces a characteristic diffraction pattern. This is the
basis of qualitative analysis by powder diffraction. Identification is usually
accomplished by the systematic comparison of an unknown pattern with a catalogue
of standard data such as the Powder Diffraction File published by the International
Center for Diffraction Data (ICDD).
Diffraction patterns of mixtures consist of the superimposed patterns of the individual
components. There, powder diffraction is useful in analyzing mixtures as well as
pure materials. As the number of components increases interpretation depends on the
amount of prior knowledge available about the mixture.
Quantitative analysis
The x-ray diffraction pattern of a powdered mixture consists of the diffraction
patterns of its constituent compounds. Each compound contributes its own pattern,
with intensity proportional to the amount present in the mixture. Quantitative x-ray
diffraction analysis consists of determining the amount of a compound from
measurements of their corresponding intensity with that of the internal standards.
Advantages
An important advantage x-ray diffraction over other techniques is that the results
obtained give information about the materials as they occur in the sample, rather than
only about the individual elements or ions present. It is often the only satisfactory
method of distinguishing amount polymorphs or detecting a compound in the
presence of others containing the same elements.
Furthermore, the sample is not consumed in x-ray diffraction, so that it may be saved
or subsequently analysed by other techniques. The term “non-destructive” frequently
applied to x-ray analysis is not always appropriate here because crushing, grinding or
other manipulations are frequently required to prepare the sample for powder
diffraction.