ChemInform Abstract: Crystal Structure, Optical Properties and Coloring Performance of Karrooite...
25
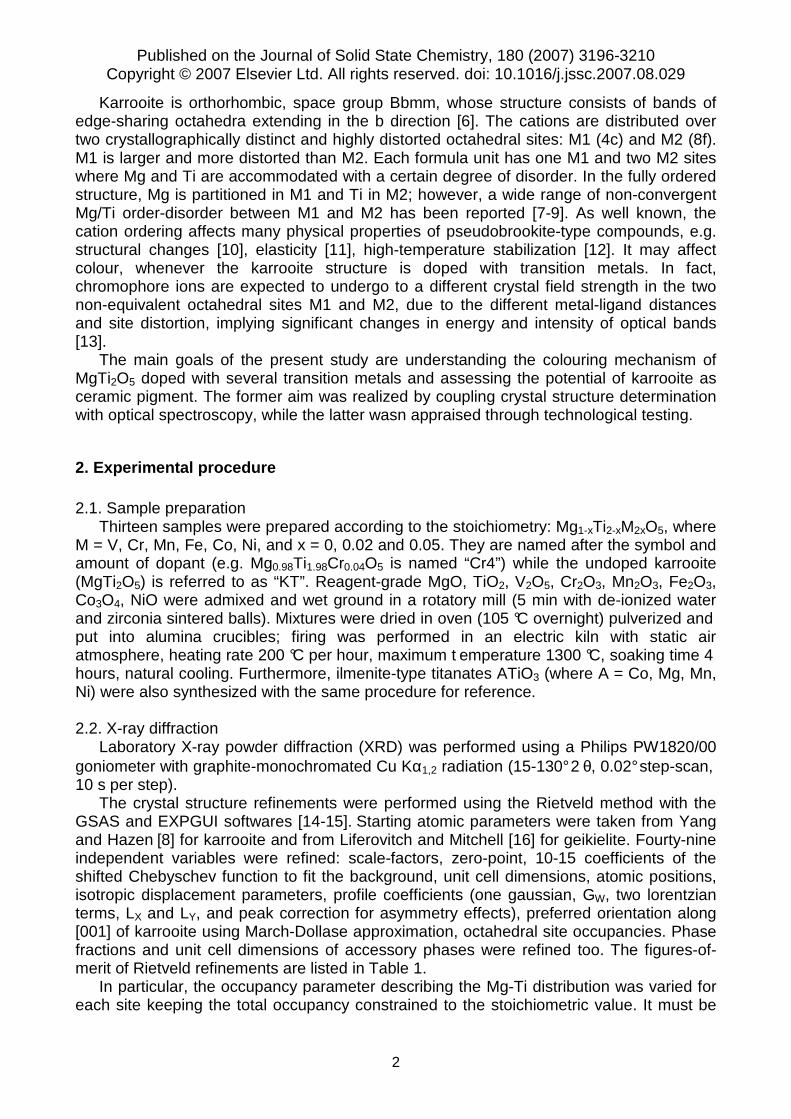
Published on the Journal of Solid State Chemistry, 180 (2007) 3196-3210 Copyright © 2007 Elsevier Ltd. All rights reserved. doi: 10.1016/j.jssc.2007.08.029 1 Crystal Structure, Optical Properties and Colouring Performance of Karrooite MgTi 2 O 5 Ceramic Pigments Francesco Matteucci a,1 , Giuseppe Cruciani b , Michele Dondi a , Giorgio Gasparotto c , David Maria Tobaldi c,2 a ISTEC-CNR, Institute of Science and Technology for Ceramics, Via Granarolo 64, 48018 Faenza, Italy b Department of Earth Sciences, University of Ferrara, Via Saragat 1, 44100 Ferrara, Italy c Department of Earth and Geo-Environmental Sciences, University of Bologna, Piazza di Porta San Donato 1, 40136 Bologna, Italy Abstract Karrooite, MgTi 2 O 5 , is a promising ceramic pigment due to its high refractoriness and refractive indices, as well as its ability to host transition metal ions in two crystallographically distinct octahedral sites. The colouring performance was investigated combining X-ray powder diffraction with UV-Vis-NIR spectroscopy on karrooite doped with V, Cr, Mn, Fe, Co or Ni (M) according to the formula Mg 1-x Ti 2-x M 2x O 5 , with x=0.02 and 0.05. Transition metals solubility in the karrooite lattice is not complete and a second phase is always present (geikielite or rutile). Structural data proved that incorporation of different chromophore ions into the karrooite structure affects unit cell parameters, bond length distances and angles, site occupancies and therefore cation order-disorder. Optical spectra exhibit broad absorbance bands of Co(II), Cr(IV), Fe(III), Mn(II), Mn(III), Ni (II), V(IV) with distinct contributions by cations in the M1 and M2 sites. Karrooite pigments have colours ranging from orange to brown-tan (Cr, Fe, Mn, V) to green (Co) and yellow (Ni) that are stable in low temperature (<1050 °C) ceramic glazes and glassy co atings. Keywords: Ceramic pigment, Colour, Crystal structure, Karrooite, Optical spectroscopy, Pseudobrookite 1. Introduction A new field of application for karrooite, MgTi 2 O 5 , the magnesium end-term of the pseudobrookite series, is that of ceramic pigments. They are inorganic structures containing chromophore ions, which impart colour to ceramic wares by forming a heterogeneous mixture with the body or glaze in which they are dispersed [1]. In terms of requirements, ceramic pigments must be highly refractory, capable to withstand the chemical corrosion of liquid phases formed during the firing of bodies or glazes, and of suitable optical characteristics [1-2]. From this viewpoint, karrooite can be considered a potential ceramic pigment due to its refractoriness (melting point ~1650 °C) and high refractive indices (a=2.35-2.42) though its stability is constrained by a strong thermal expansion anisotropy [3]. Moreover, it can host several transition metal ions in its octahedral coordination [4], thus enabling the development of different colours [5]. 1 Present address: Tozzi Renewable Energy S.p.A., via Zuccherificio 10, 48010 Mezzano, Italy 2 Present address: Centro Ceramico, via Martelli 26, 40138 Bologna, Italy
Transcript of ChemInform Abstract: Crystal Structure, Optical Properties and Coloring Performance of Karrooite...

Published on the Journal of Solid State Chemistry, 180 (2007) 3196-3210 Copyright © 2007 Elsevier Ltd. All rights reserved. doi: 10.1016/j.jssc.2007.08.029
1
Crystal Structure, Optical Properties and Colouring Performance of Karrooite MgTi2O5
Ceramic Pigments
Francesco Matteuccia,1, Giuseppe Crucianib, Michele Dondia, Giorgio Gasparottoc, David Maria Tobaldic,2
a ISTEC-CNR, Institute of Science and Technology for Ceramics, Via Granarolo 64, 48018 Faenza, Italy
b Department of Earth Sciences, University of Ferrara, Via Saragat 1, 44100 Ferrara, Italy c Department of Earth and Geo-Environmental Sciences, University of Bologna, Piazza di Porta San Donato
1, 40136 Bologna, Italy
Abstract Karrooite, MgTi2O5, is a promising ceramic pigment due to its high refractoriness and refractive indices, as well as its ability to host transition metal ions in two crystallographically distinct octahedral sites. The colouring performance was investigated combining X-ray powder diffraction with UV-Vis-NIR spectroscopy on karrooite doped with V, Cr, Mn, Fe, Co or Ni (M) according to the formula Mg1-xTi2-xM2xO5, with x=0.02 and 0.05. Transition metals solubility in the karrooite lattice is not complete and a second phase is always present (geikielite or rutile). Structural data proved that incorporation of different chromophore ions into the karrooite structure affects unit cell parameters, bond length distances and angles, site occupancies and therefore cation order-disorder. Optical spectra exhibit broad absorbance bands of Co(II), Cr(IV), Fe(III), Mn(II), Mn(III), Ni (II), V(IV) with distinct contributions by cations in the M1 and M2 sites. Karrooite pigments have colours ranging from orange to brown-tan (Cr, Fe, Mn, V) to green (Co) and yellow (Ni) that are stable in low temperature (<1050 °C) ceramic glazes and glassy co atings.
Keywords: Ceramic pigment, Colour, Crystal structure, Karrooite, Optical spectroscopy, Pseudobrookite
1. Introduction
A new field of application for karrooite, MgTi2O5, the magnesium end-term of the pseudobrookite series, is that of ceramic pigments. They are inorganic structures containing chromophore ions, which impart colour to ceramic wares by forming a heterogeneous mixture with the body or glaze in which they are dispersed [1]. In terms of requirements, ceramic pigments must be highly refractory, capable to withstand the chemical corrosion of liquid phases formed during the firing of bodies or glazes, and of suitable optical characteristics [1-2]. From this viewpoint, karrooite can be considered a potential ceramic pigment due to its refractoriness (melting point ~1650 °C) and high refractive indices (a=2.35-2.42) though its stability is constrained by a strong thermal expansion anisotropy [3]. Moreover, it can host several transition metal ions in its octahedral coordination [4], thus enabling the development of different colours [5].
1 Present address: Tozzi Renewable Energy S.p.A., via Zuccherificio 10, 48010 Mezzano, Italy 2 Present address: Centro Ceramico, via Martelli 26, 40138 Bologna, Italy
Published on the Journal of Solid State Chemistry, 180 (2007) 3196-3210 Copyright © 2007 Elsevier Ltd. All rights reserved. doi: 10.1016/j.jssc.2007.08.029
2
Karrooite is orthorhombic, space group Bbmm, whose structure consists of bands of edge-sharing octahedra extending in the b direction [6]. The cations are distributed over two crystallographically distinct and highly distorted octahedral sites: M1 (4c) and M2 (8f). M1 is larger and more distorted than M2. Each formula unit has one M1 and two M2 sites where Mg and Ti are accommodated with a certain degree of disorder. In the fully ordered structure, Mg is partitioned in M1 and Ti in M2; however, a wide range of non-convergent Mg/Ti order-disorder between M1 and M2 has been reported [7-9]. As well known, the cation ordering affects many physical properties of pseudobrookite-type compounds, e.g. structural changes [10], elasticity [11], high-temperature stabilization [12]. It may affect colour, whenever the karrooite structure is doped with transition metals. In fact, chromophore ions are expected to undergo to a different crystal field strength in the two non-equivalent octahedral sites M1 and M2, due to the different metal-ligand distances and site distortion, implying significant changes in energy and intensity of optical bands [13].
The main goals of the present study are understanding the colouring mechanism of MgTi2O5 doped with several transition metals and assessing the potential of karrooite as ceramic pigment. The former aim was realized by coupling crystal structure determination with optical spectroscopy, while the latter wasn appraised through technological testing.
2. Experimental procedure 2.1. Sample preparation
Thirteen samples were prepared according to the stoichiometry: Mg1-xTi2-xM2xO5, where M = V, Cr, Mn, Fe, Co, Ni, and x = 0, 0.02 and 0.05. They are named after the symbol and amount of dopant (e.g. Mg0.98Ti1.98Cr0.04O5 is named “Cr4”) while the undoped karrooite (MgTi2O5) is referred to as “KT”. Reagent-grade MgO, TiO2, V2O5, Cr2O3, Mn2O3, Fe2O3, Co3O4, NiO were admixed and wet ground in a rotatory mill (5 min with de-ionized water and zirconia sintered balls). Mixtures were dried in oven (105 °C overnight) pulverized and put into alumina crucibles; firing was performed in an electric kiln with static air atmosphere, heating rate 200 °C per hour, maximum t emperature 1300 °C, soaking time 4 hours, natural cooling. Furthermore, ilmenite-type titanates ATiO3 (where A = Co, Mg, Mn, Ni) were also synthesized with the same procedure for reference. 2.2. X-ray diffraction
Laboratory X-ray powder diffraction (XRD) was performed using a Philips PW1820/00 goniometer with graphite-monochromated Cu Kα1,2 radiation (15-130° 2 θ, 0.02° step-scan, 10 s per step).
The crystal structure refinements were performed using the Rietveld method with the GSAS and EXPGUI softwares [14-15]. Starting atomic parameters were taken from Yang and Hazen [8] for karrooite and from Liferovitch and Mitchell [16] for geikielite. Fourty-nine independent variables were refined: scale-factors, zero-point, 10-15 coefficients of the shifted Chebyschev function to fit the background, unit cell dimensions, atomic positions, isotropic displacement parameters, profile coefficients (one gaussian, GW, two lorentzian terms, LX and LY, and peak correction for asymmetry effects), preferred orientation along [001] of karrooite using March-Dollase approximation, octahedral site occupancies. Phase fractions and unit cell dimensions of accessory phases were refined too. The figures-of-merit of Rietveld refinements are listed in Table 1.
In particular, the occupancy parameter describing the Mg-Ti distribution was varied for each site keeping the total occupancy constrained to the stoichiometric value. It must be

Published on the Journal of Solid State Chemistry, 180 (2007) 3196-3210 Copyright © 2007 Elsevier Ltd. All rights reserved. doi: 10.1016/j.jssc.2007.08.029
3
pointed out that, despite the relatively large contrast between the scattering factor of Mg2+ and Ti4+, estimating the site occupancy fractions from XRD data is not free of errors. Furthermore, the refined titanium occupancy is actually the sum of Ti plus dopant, as the scattering factors of transition metals are closer to Ti than to Mg. The site distortion was evaluated considering both the Octahedral Angle Variance (OAV=σθ(oct)) and the Octahedral Quadratic Elongation (OQE=λoct) [18]. 2.3. Optical spectroscopy
Diffuse reflectance spectroscopy (DRS) was performed at room temperature with a Perkin Elmer λ35 spectrophotometer in the 300-1100 nm range, 0.03 nm step size, using an integrating sphere and a white reference material, both made of BaSO4. Reflectance (R∞) was converted to absorbance (K/S) by the Kubelka-Munk equation: K/S=2(1-R∞)⋅2R∞
-
1 [19]. The positions of the main absorbance peaks in the optical spectra were determined through a deconvolution procedure (PFM, OriginLab) that allowed to obtain averaged values of crystal field strength ∆o (by the Tanabe-Sugano diagrams and fitting spin-allowed transitions), band splitting δ (FWHM of the main optical band), crystal field stabilization energy CFSE (calculated by ∆o values [13]), interelectronic repulsion Racah B parameter (by spin-allowed transitions [19-21]) and nephelauxetic ratio β (i.e. B/B0, where B is experimental and B0 is the value of the free ion) [20].
2.3. Colouring performance
Colour was measured by diffuse reflectance spectroscopy in the visible range (HunterLab Miniscan MSXP4000, 400-700 nm, D65 standard illuminant, 10° observer, white glazed tile reference x=31.5, y=33.3) and expressed in the CIE-Lab colour coordinates: L* (100=white, 0=black), a* (+red, −green), b* (+yellow, −blue).
The technological behaviour was assessed for each chromophore on the sample that gave the best colour performance. Each pigment was added (5% wt.) into different ceramic glazes and glassy coatings that were fast fired in a roller kiln in industrial-like conditions. The chemical and physical characteristics of these ceramic coatings have been reported elsewhere [22].
3. Results 3.1. X-ray diffraction
The addition of transition metals induces significant changes in the phase composition, unit cell dimensions, ordering state, metal-oxygen distances and bond angles of MgTi2O5. Undoped karrooite exhibits values of cell parameters and cation ordering that are in between those of MgTi2O5 quenched at 800 and 1000 °C [10, 23]. Therefore, i t can be concluded that our natural cooling down from 1300 °C, performed in order to simulate the pigment manufacturing process, gave the same ordering state as quenching at approximately 900 °C.
3.1.1. Phase composition The samples are not monophasic: a solid solution phase close to geikielite (MgTiO3) is
almost ubiquitous. It occurs together with rutile in KT and Cr-doped samples, while in the V-doped ones only rutile is found as accessory phase. Although in most cases the karrooite amount is over 95 wt%, the amount of accessory phase is not negligible in the samples Co10, Mn10, Ni10 and V10 (Table 1).

Published on the Journal of Solid State Chemistry, 180 (2007) 3196-3210 Copyright © 2007 Elsevier Ltd. All rights reserved. doi: 10.1016/j.jssc.2007.08.029
4
The geikielite unit cell parameters vary depending on the doping ion and amount. It was assumed, according to the Vegard’s law, that the cell parameter variation along the MgTiO3-MTiO3 join is linear, so that the amount of M (i.e. Co, Cr, Fe, Mn, and Ni) in the solid solution may be estimated by the lever rule on the basis of the cell volumes of MgTiO3 and the MTiO3 end-member. This made it possible to calculate the transition metal solubilities in both karrooite and geikielite structures, with the former being fairly close to the expected amount of chromophore (Table 1).
3.1.2. Unit cell parameters The variation of the unit cell edge lengths and volume in karrooite likely arises as a
combination of two factors: i) the different ionic size of doping ions and ii) the order-disorder process among the two non-equivalent octahedral sites. In fact, while it is clear that a smaller ion substituting for a larger one will bring about a volume contraction, the same effect is also caused, with a fixed composition, for an increased degree of octahedral Mg/Ti ordering [6-8, 23]. A more recent study of cation ordering in karrooite by neutron powder diffraction [38] confirmed that disorder leads to increased values for a, c, and V but to a reduced b cell edge.The effect of Mg/Ti ordering will be discussed in a next section while the possible size effect are discussed here.
Doped karrooite samples exhibit significant structural changes that follow quite regular trends of the unit cell dimensions versus the cell volume (Table 2). Exceptions are the V-doped karrooite having shorter a and longer b with respect to the general trend and the Cr- and Ni-doped samples, which have a longer c dimension (Fig. 1). Since disorder is expected to shorten the b-edge, the negative trend defined by V10, Fe10, and KT in Figure 1 (middle) might be ascribed to this effect while the major positive trend (from Cr10 to Mn10) is more likely due to the size effect.
Overall, vanadium and chromium doping induced a contraction of the unit cell volume compared to the undoped karrooite; in contrast, an increased volume occurred in Mn-doped samples. Volume variations are small with Co, Fe and Ni doping (Fig. 1). Structural data of iron-bearing karrooite are consistent with those of armalcolite Mg0.5Fe0.5Ti2O5 [17, 24].
For every transition metal, except the Mn-bearing samples, an inverse relationship between the doping amount and the unit cell volume can be observed (Table 2).
3.1.3. Variation of bond distances and order-disorder in octahedral sites The distribution of Mg/Ti/dopant cations over the two non-equivalent octahedral sites
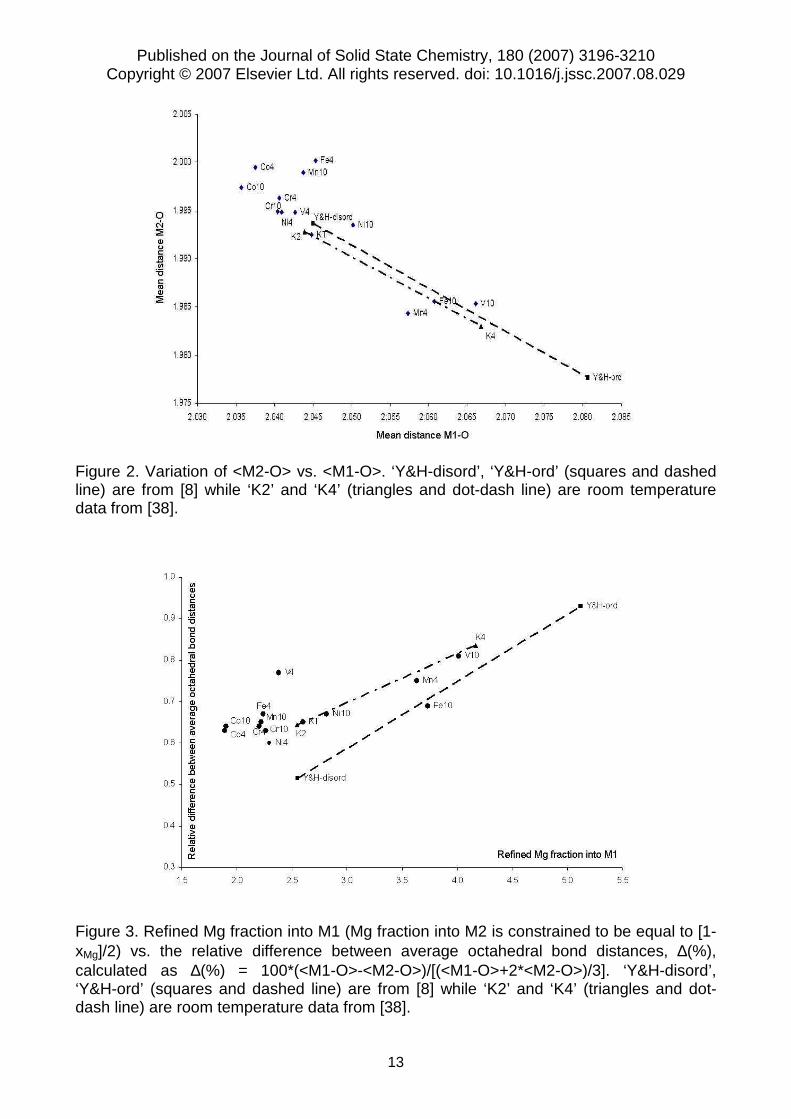
can be first evaluated by a plot of <M1-O> vs. <M2-O> (Fig. 2) as compared with results from Yang and Hazen [8] and Lennie et al. [38]. Figure 2 shows that, while our undoped karrooite sample (‘KT’) lies close to the structure with maximum degree of disorder reported by [8] (‘Y&H-disord’) and [38] (‘K2’), most of the doped samples are distributed along a trend which is consistent with the ‘Y&H-disord’-‘Y&H-ord’ and ‘K2’-‘K4’ tielines. From this plot it is clear that most of our doped karrooites are characterized by a larger degree of disorder compared to KT or Y&H-disord and K2. Exceptions to this behaviour are samples Mn4, Fe10, and V10 which show a noticeable degree of order.
Concerning the effect of order-disorder on the unit cell volume, a smaller value (363.53 Å3) has been reported for the ordered form of undoped karrooite with respect to its more disordered form (365.00 Å3) [8]. As previously noted (cf. Fig. 2), the cell volume contraction is actually accomplished by a lengthening of <M1-O> accompanied by a shortening of <M2-O>. Such an inverse correlation also explains the anisotropic variation of the unit cell edge lengths. In the case of doped karrooite the separation of size effect to the order-disorder effect is not a straightforward task. Samples Fe10, V10, Cr4, Cr10, and
Published on the Journal of Solid State Chemistry, 180 (2007) 3196-3210 Copyright © 2007 Elsevier Ltd. All rights reserved. doi: 10.1016/j.jssc.2007.08.029
5
V4 show a smaller cell volume compared to undoped karrooite. Among those samples only for the first two the volume contraction could be ascribed to order-disorder effects.
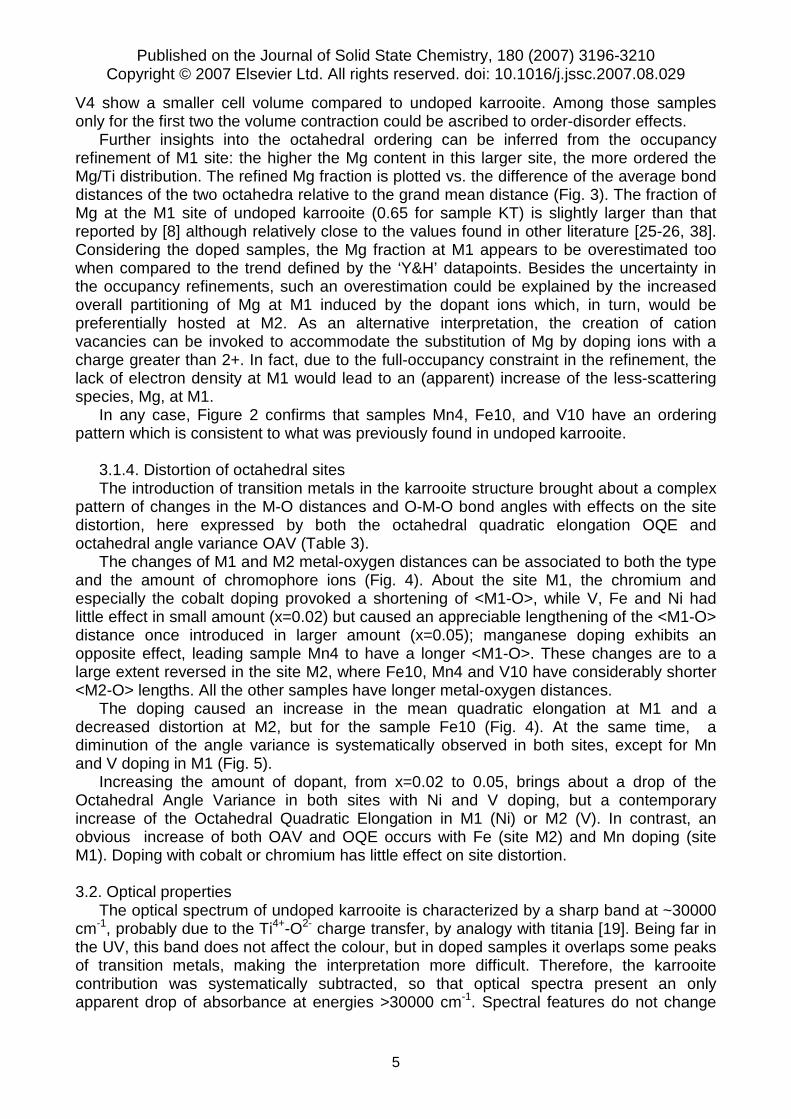
Further insights into the octahedral ordering can be inferred from the occupancy refinement of M1 site: the higher the Mg content in this larger site, the more ordered the Mg/Ti distribution. The refined Mg fraction is plotted vs. the difference of the average bond distances of the two octahedra relative to the grand mean distance (Fig. 3). The fraction of Mg at the M1 site of undoped karrooite (0.65 for sample KT) is slightly larger than that reported by [8] although relatively close to the values found in other literature [25-26, 38]. Considering the doped samples, the Mg fraction at M1 appears to be overestimated too when compared to the trend defined by the ‘Y&H’ datapoints. Besides the uncertainty in the occupancy refinements, such an overestimation could be explained by the increased overall partitioning of Mg at M1 induced by the dopant ions which, in turn, would be preferentially hosted at M2. As an alternative interpretation, the creation of cation vacancies can be invoked to accommodate the substitution of Mg by doping ions with a charge greater than 2+. In fact, due to the full-occupancy constraint in the refinement, the lack of electron density at M1 would lead to an (apparent) increase of the less-scattering species, Mg, at M1.
In any case, Figure 2 confirms that samples Mn4, Fe10, and V10 have an ordering pattern which is consistent to what was previously found in undoped karrooite.
3.1.4. Distortion of octahedral sites The introduction of transition metals in the karrooite structure brought about a complex
pattern of changes in the M-O distances and O-M-O bond angles with effects on the site distortion, here expressed by both the octahedral quadratic elongation OQE and octahedral angle variance OAV (Table 3).
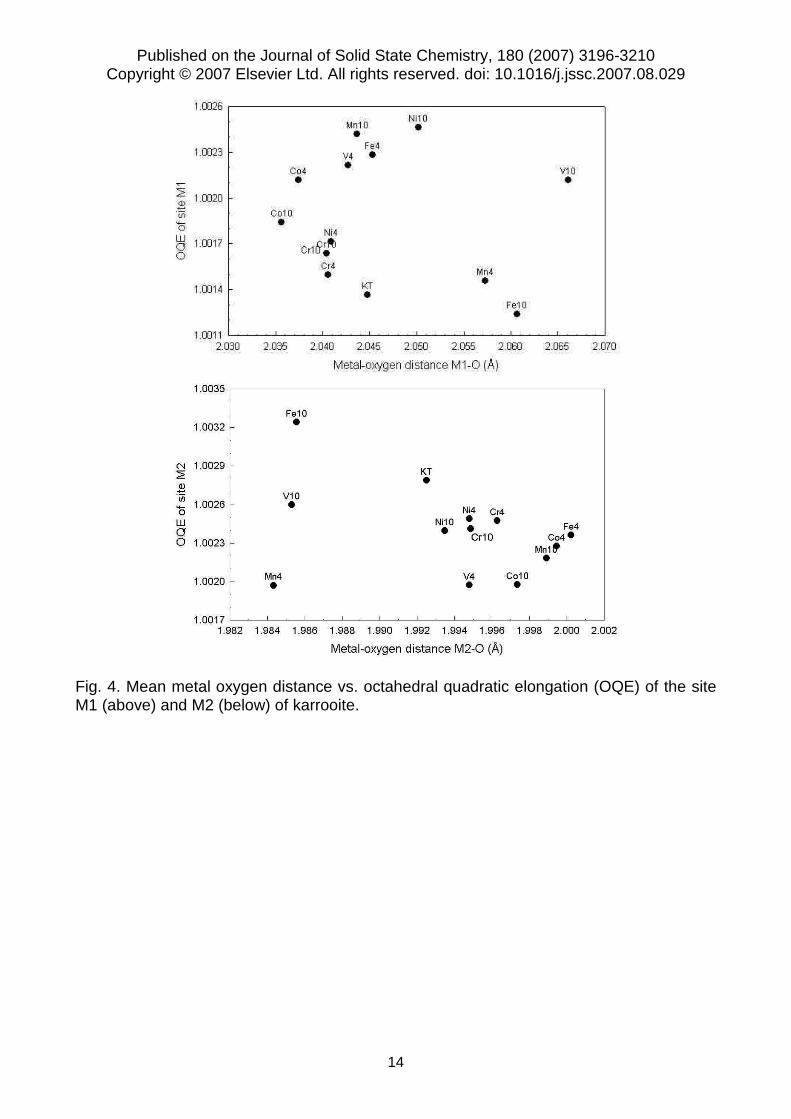
The changes of M1 and M2 metal-oxygen distances can be associated to both the type and the amount of chromophore ions (Fig. 4). About the site M1, the chromium and especially the cobalt doping provoked a shortening of <M1-O>, while V, Fe and Ni had little effect in small amount (x=0.02) but caused an appreciable lengthening of the <M1-O> distance once introduced in larger amount (x=0.05); manganese doping exhibits an opposite effect, leading sample Mn4 to have a longer <M1-O>. These changes are to a large extent reversed in the site M2, where Fe10, Mn4 and V10 have considerably shorter <M2-O> lengths. All the other samples have longer metal-oxygen distances.
The doping caused an increase in the mean quadratic elongation at M1 and a decreased distortion at M2, but for the sample Fe10 (Fig. 4). At the same time, a diminution of the angle variance is systematically observed in both sites, except for Mn and V doping in M1 (Fig. 5).
Increasing the amount of dopant, from x=0.02 to 0.05, brings about a drop of the Octahedral Angle Variance in both sites with Ni and V doping, but a contemporary increase of the Octahedral Quadratic Elongation in M1 (Ni) or M2 (V). In contrast, an obvious increase of both OAV and OQE occurs with Fe (site M2) and Mn doping (site M1). Doping with cobalt or chromium has little effect on site distortion. 3.2. Optical properties
The optical spectrum of undoped karrooite is characterized by a sharp band at ~30000 cm-1, probably due to the Ti4+-O2- charge transfer, by analogy with titania [19]. Being far in the UV, this band does not affect the colour, but in doped samples it overlaps some peaks of transition metals, making the interpretation more difficult. Therefore, the karrooite contribution was systematically subtracted, so that optical spectra present an only apparent drop of absorbance at energies >30000 cm-1. Spectral features do not change

Published on the Journal of Solid State Chemistry, 180 (2007) 3196-3210 Copyright © 2007 Elsevier Ltd. All rights reserved. doi: 10.1016/j.jssc.2007.08.029
6
significantly by increasing doping for every transition metal; the most important fact is a strong increase of absorbance passing from x=0.02 to x=0.05. Hence, the discussion of spectra will be the same for both loadings.
Discussing the relationships between crystal structural and spectroscopic data, any contribution from the accessory phase geikielite is neglected because it is considered to be to a large extent superimposed to that of karrooite. As a matter of fact, the site B of geikielite and the site M2 of karrooite have almost the same M-O distance (i.e. 2.01 Å) and the latter plays a major role determining the crystal field strength.
3.2.1. Vanadium doping The optical spectra of V-doped karrooite present a very wide hump absorbing intensely
every wavelength over 20000 cm-1 and gently dipping toward IR. Two maxima of absorbance at ~23000 and ~27000 cm-1 and two shoulders in the 12000-15000 cm-1 range can be appreciated (Fig. 6). These spectra exhibit typical features of V(IV), e.g. the weak bands at ~12000 and ~ 15000 cm-1 that are observed also in other ceramic pigments containing V(IV), such as ZrO2, ZrSiO4 and ZrTiO4 [27]. Besides, its electronic configuration d1, for which only a t2g
1→eg1 transition is expected, the V(IV) ion gives rise –
once in a distorted crystal site – to widely split transitions from the ground state 2Ag to 2B1g, 2B2g,
2B3g and 2Ag [28-29]. This splitting can explain the spectral features, taking into account a doubling of transitions due to the occurrence of V(IV) in both octahedral sites of karrooite (Fig. 6) with rather broad bands (δ=3000-5000 cm-1) for d-d transitions (Table 4). The crystal field strength is approximately 15600 and 14000 cm-1 for M1 and M2 sites, respectively (Table 5). Though the presence of V(III) cannot be ruled out in such complex spectra, the clear separation of its main 3T2g and 3T1g transitions is missing.
3.2.2. Chromium doping Cr-doped karrooite exhibits peculiar optical features: a strong absorbance all over the
spectra with two distinct maxima at ~13000 and ~25000 cm-1, plus a shoulder at ~19000 cm-1 (Fig. 7). These characteristics do not correspond to Cr(III) spectra [30], especially for the occurrence of an intense band below 15000 cm-1, being the minimum wavenumber of its 4T2g band 15100 cm-1 in the large octahedral site of zoisite [13]. Karrooite spectral features are attributable to Cr(IV) in octahedral coordination, where a d2 ion has a t2g
2 electronic configuration of the ground state 3T1g(
3F) and two main spin-allowed transitions to t2g
1eg1, i.e. ν1=
3T2g(3F) and ν2=
3T1g(3P); the further transition ν3=
3A2g(3F) is two electrons
eg2, then less probable. The main band at ∼13000 cm-1 can be attributed to 3T2g, the
shoulder at ∼19000 cm-1 to 3T1g and the broad band at ∼25000 cm-1 to 3A2g. A doubling of these transitions – due to the occurrence of Cr(IV) at both M1 and M2 sites – may account for the conspicuous peak broadening (Fig. 7 and Table 4). This interpretation reasonably fits the Tanabe-Sugano diagram of d2 ions, though peak energies are lower than expected and the intensity of the 3A2g band too high. The corresponding ∆o values are ∼22000 (M1) and ∼19000 cm-1 (M2) for Racah B ∼600 (M1) and ∼500 cm-1 (M2) so implying a possible difference in the covalent degree of Cr-O bonding in M2 (Table 5). ν1 is alternatively interpreted as the spin-forbidden 1T2g (
1G), ν2 =3T2g and ν3 =
3T1g, as in titanate pyrochlores [31-32], but in this case ν2 would not fit the Tanabe-Sugano diagram and some special effect would be invoked to account for the strong intensity of 1T2g.
3.2.3. Manganese doping The occurrence of manganese causes a strong absorbance in the high-energy part of
the spectrum with a maximum at ∼24000 cm-1 and two shoulders around 12000 and 18000 cm-1 (Fig. 8). These complex spectra are due to complementary contributions from both
Published on the Journal of Solid State Chemistry, 180 (2007) 3196-3210 Copyright © 2007 Elsevier Ltd. All rights reserved. doi: 10.1016/j.jssc.2007.08.029
7
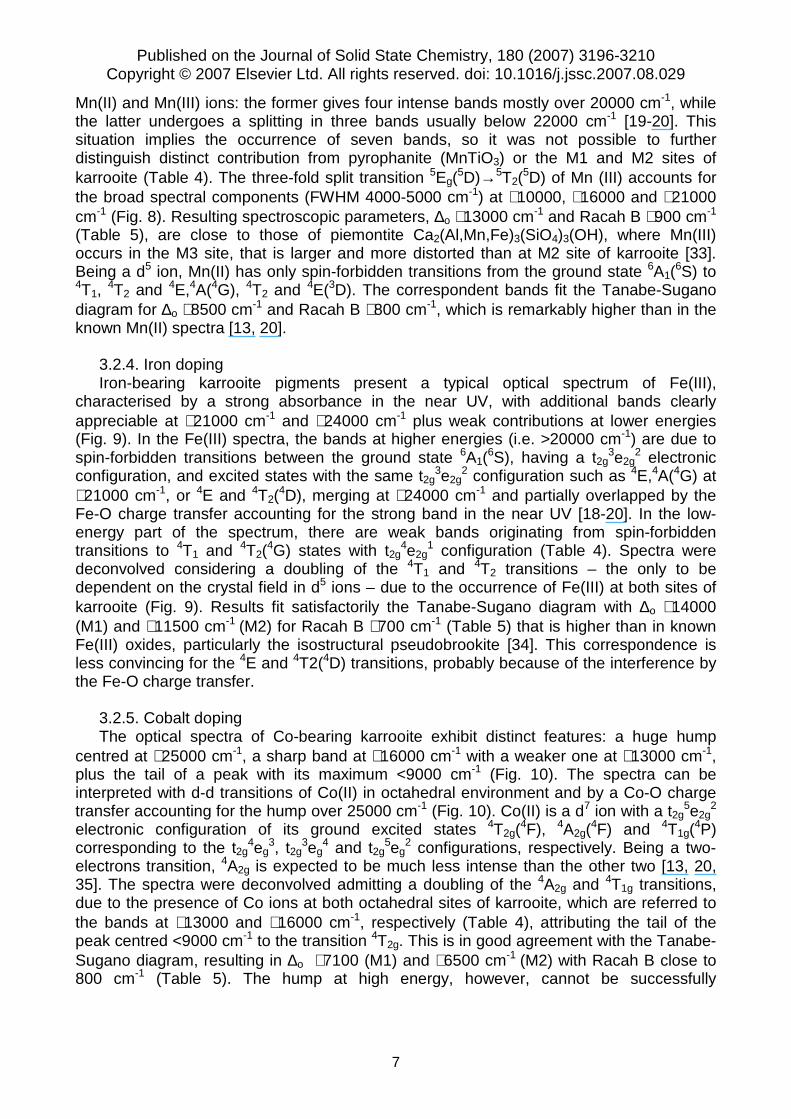
Mn(II) and Mn(III) ions: the former gives four intense bands mostly over 20000 cm-1, while the latter undergoes a splitting in three bands usually below 22000 cm-1 [19-20]. This situation implies the occurrence of seven bands, so it was not possible to further distinguish distinct contribution from pyrophanite (MnTiO3) or the M1 and M2 sites of karrooite (Table 4). The three-fold split transition 5Eg(
5D)→5T2(5D) of Mn (III) accounts for
the broad spectral components (FWHM 4000-5000 cm-1) at ∼10000, ∼16000 and ∼21000 cm-1 (Fig. 8). Resulting spectroscopic parameters, ∆o ∼13000 cm-1 and Racah B ∼900 cm-1 (Table 5), are close to those of piemontite Ca2(Al,Mn,Fe)3(SiO4)3(OH), where Mn(III) occurs in the M3 site, that is larger and more distorted than at M2 site of karrooite [33]. Being a d5 ion, Mn(II) has only spin-forbidden transitions from the ground state 6A1(
6S) to 4T1,
4T2 and 4E,4A(4G), 4T2 and 4E(3D). The correspondent bands fit the Tanabe-Sugano diagram for ∆o ∼8500 cm-1 and Racah B ∼800 cm-1, which is remarkably higher than in the known Mn(II) spectra [13, 20].
3.2.4. Iron doping Iron-bearing karrooite pigments present a typical optical spectrum of Fe(III),
characterised by a strong absorbance in the near UV, with additional bands clearly appreciable at ∼21000 cm-1 and ∼24000 cm-1 plus weak contributions at lower energies (Fig. 9). In the Fe(III) spectra, the bands at higher energies (i.e. >20000 cm-1) are due to spin-forbidden transitions between the ground state 6A1(
6S), having a t2g3e2g
2 electronic configuration, and excited states with the same t2g
3e2g2 configuration such as 4E,4A(4G) at
∼21000 cm-1, or 4E and 4T2(4D), merging at ∼24000 cm-1 and partially overlapped by the
Fe-O charge transfer accounting for the strong band in the near UV [18-20]. In the low-energy part of the spectrum, there are weak bands originating from spin-forbidden transitions to 4T1 and 4T2(
4G) states with t2g4e2g
1 configuration (Table 4). Spectra were deconvolved considering a doubling of the 4T1 and 4T2 transitions – the only to be dependent on the crystal field in d5 ions – due to the occurrence of Fe(III) at both sites of karrooite (Fig. 9). Results fit satisfactorily the Tanabe-Sugano diagram with ∆o ∼14000 (M1) and ∼11500 cm-1 (M2) for Racah B ∼700 cm-1 (Table 5) that is higher than in known Fe(III) oxides, particularly the isostructural pseudobrookite [34]. This correspondence is less convincing for the 4E and 4T2(4D) transitions, probably because of the interference by the Fe-O charge transfer.
3.2.5. Cobalt doping The optical spectra of Co-bearing karrooite exhibit distinct features: a huge hump
centred at ∼25000 cm-1, a sharp band at ∼16000 cm-1 with a weaker one at ∼13000 cm-1, plus the tail of a peak with its maximum <9000 cm-1 (Fig. 10). The spectra can be interpreted with d-d transitions of Co(II) in octahedral environment and by a Co-O charge transfer accounting for the hump over 25000 cm-1 (Fig. 10). Co(II) is a d7 ion with a t2g
5e2g2
electronic configuration of its ground excited states 4T2g(4F), 4A2g(
4F) and 4T1g(4P)
corresponding to the t2g4eg
3, t2g3eg
4 and t2g5eg
2 configurations, respectively. Being a two-electrons transition, 4A2g is expected to be much less intense than the other two [13, 20, 35]. The spectra were deconvolved admitting a doubling of the 4A2g and 4T1g transitions, due to the presence of Co ions at both octahedral sites of karrooite, which are referred to the bands at ∼13000 and ∼16000 cm-1, respectively (Table 4), attributing the tail of the peak centred <9000 cm-1 to the transition 4T2g. This is in good agreement with the Tanabe-Sugano diagram, resulting in ∆o ∼7100 (M1) and ∼6500 cm-1 (M2) with Racah B close to 800 cm-1 (Table 5). The hump at high energy, however, cannot be successfully

Published on the Journal of Solid State Chemistry, 180 (2007) 3196-3210 Copyright © 2007 Elsevier Ltd. All rights reserved. doi: 10.1016/j.jssc.2007.08.029
8
deconvolved without taking into account a weak contribution at ∼22500 cm-1, which may be attributed to the spin-forbidden transition 2A1g [18, 35].
3.2.6. Nickel doping The optical spectra of Ni-bearing karrooite exhibit three clearly appreciable absorbance
bands (Fig. 11): one in the near infrared (∼13000 cm-1), one in the blue (∼22000 cm-1) and one in the UV (∼28000 cm-1), with a shoulder in the green (∼19000 cm-1). These features match the effects of Ni(II) in octahedral field plus an important contribution by a Ni-O charge transfer in the near UV. Ni(II) is d8 ion with a ground state 3A2g(
3F) and t2g6eg
2 electronic configuration, which brings about three spin-allowed transitions: 3T2g(
3F) and 3T1g(
3F) to the t2g5eg
3 configuration and the two-electrons 3T1g(3P) to the t2g
4eg4; besides,
several weaker spin-forbidden transitions are possible as well [20, 36]. According to this picture, spectra were deconvolved using 8 bands for the d-d transitions, implying a doubling of the spin-allowed ones related to the occurrence of Ni(II) at both crystal sites of karrooite (Table 4). The main bands at ∼13000 and ∼22000 cm-1 were attributed to 3T1g(
3F) and 3T1g(
3P) respectively; a tail of the 3T2g is probably contributing below 10000 cm-1 (Fig. 11). This is in accordance with the Tanabe-Sugano diagram, implying ∆o as high as ∼9300 (M1) and ∼8100 cm-1 (M2) for a Racah B ∼670 cm-1 (Table 5). The shoulder at ∼22000 cm-
1is tentatively related to the spin-forbidden transition 1A1g(1G).
3.3. Colouring performance
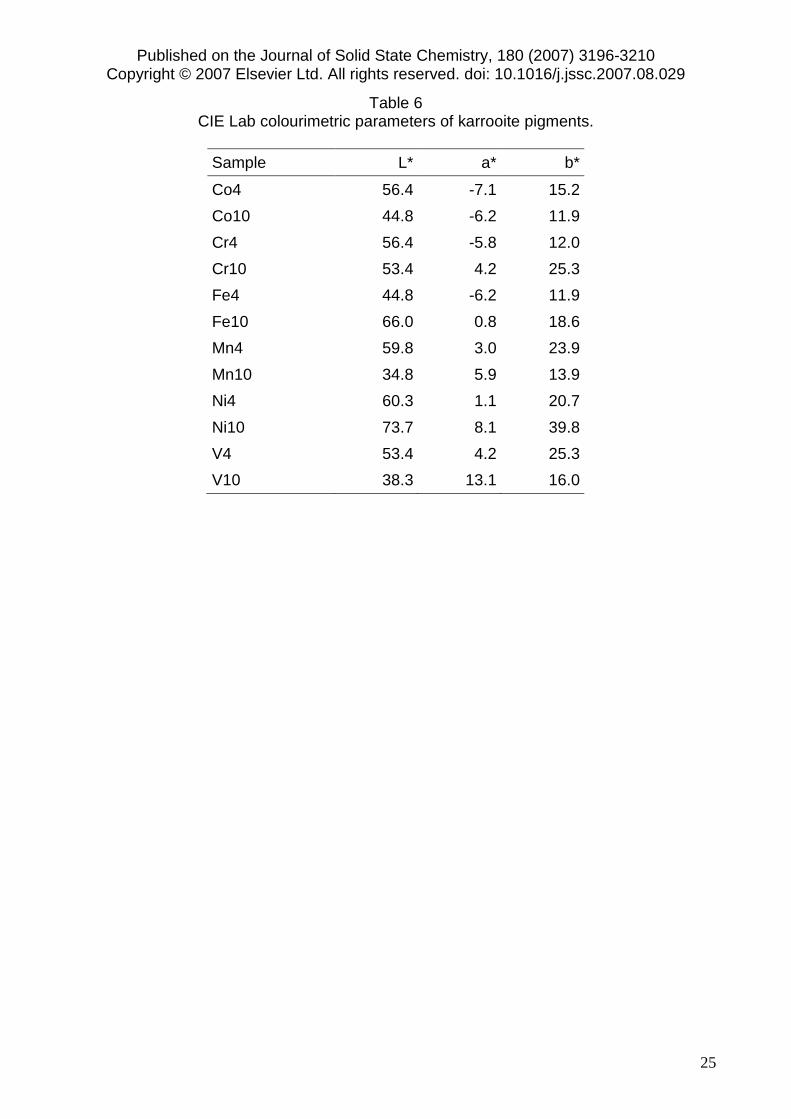
The colourimetric parameters of karrooite pigments are summarized in Table 6. The V-doped karrooite reflects the light essentially in the red-yellow window, so justifying, together with the strong absorbance in the visible range, being orange-brown colour. The chromium doping induces a maximum reflectance around 16000 cm-1, giving rise to an orange shade with a fair purity of colour, especially for the sample Cr10. In the case of manganese addition, the maximum reflectance is at the red-IR border (∼13500 cm-1) resulting in a brown colour with a more or less evident red cast. The iron-bearing karrooite has a wide reflectance window in the red-green region, so that its colour is brown-tan with a low purity or even with a green overtone in the sample Fe4, due to a further reflectance contribution at ∼19500 cm-1. Two reflectance windows, a stronger in the red (∼15000 cm-1) and a less intense in the green (∼20000 cm-1), make the Co-doped karrooite to be greenish, because the human eye is more sensitive to these wavelengths; a yellow cast is due to the complete absorption of the blue-violet component, while the red radiation dirties the green shade, so lowering colour purity. In the Ni-doped karrooite, a strong reflectance at ∼16500 cm-1 justifies the yellow shade with a certain orange cast.
The behaviour of karrooite pigments in ceramic glazes and glassy coatings is shown in Fig. 12. Their colouring performance is kept, or even significantly improved in the case of Cr and Mn dopings, in glassy coatings fired up to 1000 °C. Once dispersed in ceramic glazes, karrooite pigments exhibit a progressive colour change with increasing temperature, implying a loss of both colour saturation (increasing L*) and chroma (decreasing a* and b*). Such behaviour is likely related to chemical attack which karrooite undergoes by the aggressive liquid phase developed by glazes over 1100 °C, causing a gradual leaching of chromophores that dissolve into the glass imparting light brown (Cr, Fe, Mn, Ni, and V) or light blue (Co) shades.

Published on the Journal of Solid State Chemistry, 180 (2007) 3196-3210 Copyright © 2007 Elsevier Ltd. All rights reserved. doi: 10.1016/j.jssc.2007.08.029
9
4. Discussion
The doping of karrooite caused a complex pattern of structural changes, involving metal-oxygen distances, tetragonal and trigonal distortion of octahedral sites, and Mg-Ti ordering. Along with some general trends, occurring to most samples with very few exceptions, there are specific situations for each dopant.
With respect to undoped karrooite, whose unit cell volume is consistent with a highly disordered state of the octahedral cations, doping induced a net contraction of the unit cell volume in five karrooite samples (V10, V4, Cr10, Cr4, Fe10) while a cell expansion took place in the other seven samples. The effect in the first group of samples can be explained by a combination of an enhanced octahedral ordering (V10, Fe10) and the smaller ionic size of dopants. For the remaining samples, except Mn4, both the cell volume increase and the difference between the two non-equivalent octahedral bond distances suggest that doping promotes disordering of octahedral cations (including Mg and Ti) among the M1 and M2 sites.
In general, no obvious correlations appear to exist between the observed order-disorder behaviour and the increase in tetragonal elongation of M1 site and decrease of M2 site distortion which occurred, as a whole, in doped karrooites.
In terms of the ionic radii [37] variation with respect to Mg(II) (0.72 Å) and Ti(IV) (0.605 Å), it can be noted the V(IV) ( 0.58 Å) is the smallest ions while the other dopants have a ionic size comprised between that of Mg and Ti. Thus, it is not surprising that V(IV) promotes more significant structural variations (order-disorder and site distortion) while the other ions have a less conspicuous effect with an increasing trend in the series�Cr < Ni ��Co which is somewhat consistent with ionic radii.
In details, doping with Co, Cr and V gave a uniform pattern of metal-oxygen distances, site distortion and Mg-Ti ordering. Both cobalt and chromium doping had little effect on order-disorder, reduced the M-O lengths at the site M1, making it more tetragonally elongated, and increased the M-O distances at the site M2, rendering it less distorted. Even if a preference of Co(II) and Cr(IV) for the site M1, being tetragonally distorted, is expected on the basis of CFSE considerations [13], optical data indicate a disordered distribution of such cations in the two octahedral sites of karrooite. The vanadium doping causes a remarkable ordering, associated with both M-O mean distance and distortion, which are increased at site M1 and decreased at site M2. The occurrence of V(IV) would imply a preference for the more trigonally distorted site, i.e. M2, which is consistent with both ordering (more Mg in the site M1) and M-O length. On other hand, Fe-, Mn- and Ni-doped samples also exhibit a dependence on the amount of dopant, giving often contrasting results. Anyway, no preference for the octahedral sites is expected on the basis of size or distortion, as Fe(III) and Mn(II) have no CFSE, and Ni(II) has a CFSE independent on site geometry [13].
The disordered distribution of transition elements in the karrooite lattice has an important effect on optical properties. Since the two octahedral sites are significantly different for their mean M-O distances and tetragonal or trigonal distortion, the same cation shall undergo to a stronger crystal field interaction at M1 than at M2. In fact, distinct optical contributions from a chromophore ion at M1 and M2 have been recognized for every dopant but manganese. The correspondent ∆o values are consistent with the crystal field theory expectations for the mean M1-O and M2-O distances [13, 19, 21]. Thus optical spectra are characterized by two sets of electronic absorption lines, slightly shifting each other, due to the chromophore occurrence at both octahedral sites of karrooite. As a consequence, optical bands are broad and their light absorption much less selective than in high-performance pigments, resulting in a low purity of colour.

Published on the Journal of Solid State Chemistry, 180 (2007) 3196-3210 Copyright © 2007 Elsevier Ltd. All rights reserved. doi: 10.1016/j.jssc.2007.08.029
10
5. Conclusions
Karrooite can easily accommodate transition elements of the first row into its crystal structure, but in industrial-like synthesis conditions their solubility is limited: additions of as high as 0.1 a.p.f.u. bring about the formation of up to 10% wt. accessory phases (geikielite and/or rutile).
A relatively complex variation of the unit cell parameters in doped karrooites results from the interplay of two different factors: i) the different ionic size of doping ions and ii) the octahedral ordering.
Doping with Co, Cr, Fe, Mn, Ni or V induced a complex structural rearrangement of karrooite crystal lattice, involving Mg-Ti ordering as well as metal-oxygen bond lengths and angles. Transition elements are hosted at both the octahedral sites with no apparent ordering, but for vanadium that seems to be preferentially allocated at site M2.
Optical spectra are characterized by broad bands due to distinct contributions from Co(II), Cr(IV), Fe(III), Ni (II) or V(IV) at both M1 and M2 sites. Manganese appears in both (II) and (III) valencies. Crystal structural (metal-oxygen mean distance) and optical data (∆o) match to a large extent the predictions of the crystal field theory.
The resulting absorption of visible light is poorly selective and gives rise to low purity colours: orange-buff (Cr and V), brown-tan (Fe and Mn), yellow (Ni) and green (Co). Karrooite applied as ceramic pigment is stable in glassy coatings for firing temperatures of <1050 °C.

Published on the Journal of Solid State Chemistry, 180 (2007) 3196-3210 Copyright © 2007 Elsevier Ltd. All rights reserved. doi: 10.1016/j.jssc.2007.08.029
11
References
1] R.A Eppler, in: R.E. Kirk, D.F. Othmer (Ed.), Encyclopedia of Chemical Technology, Vol. 6, Interscience-New York, 1993, p.877.
2] A.L. Costa, G. Cruciani, M. Dondi, F. Matteucci, Ind. Ceram. 23 (2003) 1-11. 3] G. Bayer, J. Less-Common Met. 24 (1971) 129-138. 4] D. Xirouchakis, A. Smirnov, K. Woody, D.H Lindsley, D.J. Andersen, Am. Mineral. 87 (2002) 658-667. 5] G. Blasse, G.J. Dirksen, Chem. Phys. Lett. 77 (1981) 9-11. 6] B.A. Wechsler, A. Navrotsky, J. Solid State Chem. 55 (1984) 165-80. 7] B.A. Wechsler, R.B. Von Dreele, Acta Cryst. B45 (1989) 542-49. 8] H. Yang, R.M. Hazen, Am. Mineral. 84 (1999) 130-37. 9] M.S. Ghiorso, H. Yang, R.M. Hazen, Am. Mineral. 84 (1999) 1370-1374. 10] H. Yang, R.M. Hazen, J. Solid State Chem. 138 (1998) 238-44. 11] R.M. Hazen, H. Yang, Science 277 (1997) 1965-67. 12] A. Navrotsky, Am. Mineral. 60 (1975) 249-56. 13] R.G. Burns, Mineralogical applications of crystal field theory, Cambridge University Press, 2nd edition,
1993. 14] A.C. Larson, R.B. Von Dreele, Los Alamos National Laboratory Report LAUR. (2000) 86-748. 15] H. Toby H, J. Appl. Cryst. 34 (2001) 210-213. 16] R.P. Liferovitch, R.H. Mitchell, Acta Crist. B60 (2004) 496-501. 17] M.D. Lind, R.M. Housley, Science 175 (1972) 521-23. 18] K. Robinson, G.V. Gibbs, P.H. Ribbe, Science 172 (1971) 567–570. 19] S. Marfunin, Physics of Minerals and Inorganic Materials, Springer-Verlag Berlin Heidelberg New
York,1979. 20] A.B.P. Lever, Inorganic electronic spectroscopy, Amsterdam, Elsevier, 1984. 21] M. Wildner, M. Andrut, C.Z. Rudowicz, in: A. Beran, E. Libowitzky (Ed.), Optical absorption
spectroscopy in geosciences, Part I: Basic concepts of crystal field theory, EMU Notes in Mineralogy, Vol.6. Eotvos University Press, 2004, p.93.
22] F. Matteucci, C. Lepri Neto, M. Dondi, G. Cruciani, G. Baldi, A.O. Boschi, Adv. Appl. Ceram. 105 [2] (2006) 99-106.
23] N.E. Brown, A. Navrotsky, Am. Mineral. 74 (1989) 902-912. 24] B.A. Wechsler, Am. Mineral. 62 (1977) 913-920. 25] R.G. Teller, M.R. Antonio, A.E. Grau, M. Gueguin, E. Kostiner, J. Solid State Chem. 88 (1990) 334-350. 26] E. Grey, C. Li, I.C. Madsen, J. Solid State Chem. 113 (1994) 62-73. 27] M. Dondi, F. Matteucci, G. Cruciani, J. Solid State Chem. 179 (2006) 233-246. 28] A. Niesert, M. Hanrath, A. Siggel, M. Jansen, K. Langer, J. Solid State Chem. 169 (2002) 6-12. 29] M. Dondi, F. Matteucci, I. Zama, G. Cruciani, Mater. Res. Bull. 42 (2007) 64-79. 30] R.S. Pavlov, V.B. Marzá, J.B. Carda, J. Mater. Chem. 12 (2002) 2825–2832. 31] M. Dondi, F. Matteucci, G. Cruciani, G. Baldi, A. Barzanti, Acta Mater. 55 (2007) 2229-2238. 32] E. López-Navarrete, V.M. Orera, F.J. Lázaro, J.B. Carda, M. Ocaña, J. Am. Ceram. Soc. 87 [11] (2004)
2108–2113. 33] R.G. Burns, R.G.J. Strens, Mineral. Mag. 36 (1967) 204-226. 34] M. Dondi, F. Matteucci, G. Cruciani, G. Gasparotto, D.M. Tobaldi, Solid State Sci. (2007)
doi:10.1016/j.solidstatesciences.2007.03.001. 35] M. Wildner, K. Langer, Phys. Chem. Minerals 20 (1994) 460-468. 36] X. Hu, K. Langer, D. Boström, Eur. J. Mineral. 2 (1990) 29-41. 37] R.D. Shannon, Acta Crystallogr. A 32 (1976) 751–767. 38] A.R. Lennie, K.S. Knight, C.M.B. Henderson, Am. Mineral. 92 (2007) 1165-1180.

Published on the Journal of Solid State Chemistry, 180 (2007) 3196-3210 Copyright © 2007 Elsevier Ltd. All rights reserved. doi: 10.1016/j.jssc.2007.08.029
12
Fig. 1. Unit cell parameters vs. cell volume of karrooite samples.
Published on the Journal of Solid State Chemistry, 180 (2007) 3196-3210 Copyright © 2007 Elsevier Ltd. All rights reserved. doi: 10.1016/j.jssc.2007.08.029
13
Figure 2. Variation of <M2-O> vs. <M1-O>. ‘Y&H-disord’, ‘Y&H-ord’ (squares and dashed line) are from [8] while ‘K2’ and ‘K4’ (triangles and dot-dash line) are room temperature data from [38].
Figure 3. Refined Mg fraction into M1 (Mg fraction into M2 is constrained to be equal to [1-xMg]/2) vs. the relative difference between average octahedral bond distances, ∆(%), calculated as ∆(%) = 100*(<M1-O>-<M2-O>)/[(<M1-O>+2*<M2-O>)/3]. ‘Y&H-disord’, ‘Y&H-ord’ (squares and dashed line) are from [8] while ‘K2’ and ‘K4’ (triangles and dot-dash line) are room temperature data from [38].
Published on the Journal of Solid State Chemistry, 180 (2007) 3196-3210 Copyright © 2007 Elsevier Ltd. All rights reserved. doi: 10.1016/j.jssc.2007.08.029
14
Fig. 4. Mean metal oxygen distance vs. octahedral quadratic elongation (OQE) of the site M1 (above) and M2 (below) of karrooite.

Published on the Journal of Solid State Chemistry, 180 (2007) 3196-3210 Copyright © 2007 Elsevier Ltd. All rights reserved. doi: 10.1016/j.jssc.2007.08.029
15
Fig. 5. Mean metal oxygen distance vs. octahedral angle variance (OAV) of the site M1 (above) and M2 (below) of karrooite.

Published on the Journal of Solid State Chemistry, 180 (2007) 3196-3210 Copyright © 2007 Elsevier Ltd. All rights reserved. doi: 10.1016/j.jssc.2007.08.029
16
Fig. 6. Diffuse reflectance spectrum of sample V10 with deconvolution of optical bands.
Fig. 7. Diffuse reflectance spectrum of sample Cr10 with deconvolution of optical bands.

Published on the Journal of Solid State Chemistry, 180 (2007) 3196-3210 Copyright © 2007 Elsevier Ltd. All rights reserved. doi: 10.1016/j.jssc.2007.08.029
17
Fig. 8. Diffuse reflectance spectrum of sample Mn10 with deconvolution of optical bands.
Fig. 9. Diffuse reflectance spectrum of sample Fe10 with deconvolution of optical bands.

Published on the Journal of Solid State Chemistry, 180 (2007) 3196-3210 Copyright © 2007 Elsevier Ltd. All rights reserved. doi: 10.1016/j.jssc.2007.08.029
18
Fig. 10. Diffuse reflectance spectrum of sample Co10 with deconvolution of optical bands.
Fig. 11. Diffuse reflectance spectrum of sample Ni10 with deconvolution of optical bands.

Published on the Journal of Solid State Chemistry, 180 (2007) 3196-3210 Copyright © 2007 Elsevier Ltd. All rights reserved. doi: 10.1016/j.jssc.2007.08.029
19
-15
-5
5
15
25
35
45
-10 -6 -2 2 6 10 14 18
CIE a*
CIE
b*
A
Co4
Ni10
Mn4
1000 °C
1250 °C
1000 °C
1000 °C
1250 °C
-15
-5
5
15
25
35
45
-10 -6 -2 2 6 10 14 18
CIE a*
CIE
b*
B
Cr10
Fe10V10
1250 °C
1250 °C
1000 °C
1000 °C
Fig. 12. Colour plot of karrooite pigments applied in ceramic glazes and glassy coatings fired from 1000 to 1250 °C. A) Co-, Mn- and Ni-dope d samples. B) Cr-, Fe- and V-doped samples.
Published on the Journal of Solid State Chemistry, 180 (2007) 3196-3210 Copyright © 2007 Elsevier Ltd. All rights reserved. doi: 10.1016/j.jssc.2007.08.029
20
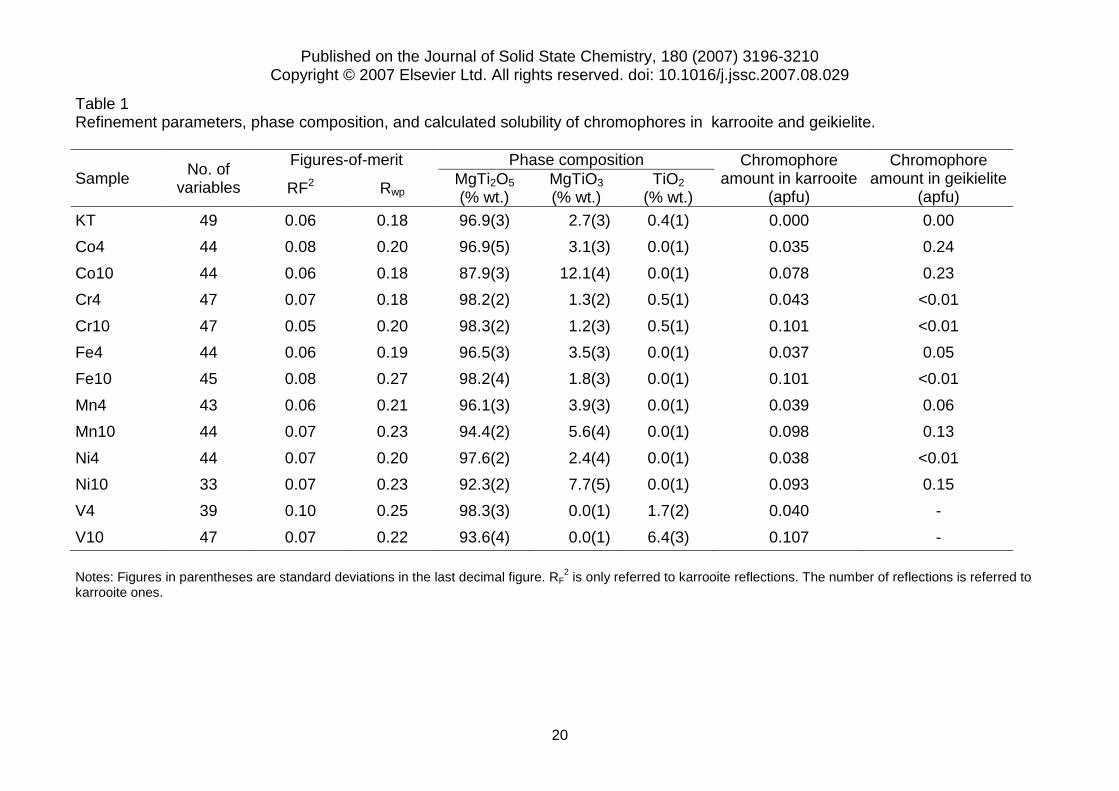
Table 1 Refinement parameters, phase composition, and calculated solubility of chromophores in karrooite and geikielite.
Sample No. of
variables
Figures-of-merit Phase composition Chromophore amount in karrooite
(apfu)
Chromophore amount in geikielite
(apfu) RF2 Rwp MgTi2O5 (% wt.)
MgTiO3 (% wt.)
TiO2 (% wt.)
KT 49 0.06 0.18 96.9(3) 2.7(3) 0.4(1) 0.000 0.00
Co4 44 0.08 0.20 96.9(5) 3.1(3) 0.0(1) 0.035 0.24
Co10 44 0.06 0.18 87.9(3) 12.1(4) 0.0(1) 0.078 0.23
Cr4 47 0.07 0.18 98.2(2) 1.3(2) 0.5(1) 0.043 <0.01
Cr10 47 0.05 0.20 98.3(2) 1.2(3) 0.5(1) 0.101 <0.01
Fe4 44 0.06 0.19 96.5(3) 3.5(3) 0.0(1) 0.037 0.05
Fe10 45 0.08 0.27 98.2(4) 1.8(3) 0.0(1) 0.101 <0.01
Mn4 43 0.06 0.21 96.1(3) 3.9(3) 0.0(1) 0.039 0.06
Mn10 44 0.07 0.23 94.4(2) 5.6(4) 0.0(1) 0.098 0.13
Ni4 44 0.07 0.20 97.6(2) 2.4(4) 0.0(1) 0.038 <0.01
Ni10 33 0.07 0.23 92.3(2) 7.7(5) 0.0(1) 0.093 0.15
V4 39 0.10 0.25 98.3(3) 0.0(1) 1.7(2) 0.040 -
V10 47 0.07 0.22 93.6(4) 0.0(1) 6.4(3) 0.107 - Notes: Figures in parentheses are standard deviations in the last decimal figure. RF
2 is only referred to karrooite reflections. The number of reflections is referred to karrooite ones.

Published on the Journal of Solid State Chemistry, 180 (2007) 3196-3210 Copyright © 2007 Elsevier Ltd. All rights reserved. doi: 10.1016/j.jssc.2007.08.029
21
Table 2 Karrooite unit cell parameters, atomic displacements parameters, and atomic positions
Sample Unit cell parameters Atomic displacement
parameter UISO*100 Atomic positions
a (Å) b (Å) c (Å) volume (Å3) Cation Anion y(Mg,Ti) x(O) y(O) z(O)
KT 9.7442(2) 9.9945(3) 3.74622) 364.84 2.0(1) 2.8(1) 0.2007(3) 0.2736(5) 0.3963(3) 0.4334(4)
Co4 9.7459(5) 9.9986(4) 3.7461(2) 365.04 3.0(1) 3.5(1) 0.2083(3) 0.2777(4) 0.3952(3) 0.4468(5) Co10 9.7439(4) 10.0010(3) 3.7452(2) 364.96 2.7(1) 3.5(1) 0.2043(2) 0.2729(3) 0.3945(5) 0.4440(4)
Cr4 9.7407(3) 9.9887(4) 3.7480(1) 364.67 3.1(1) 3.5(1) 0.2011(3) 0.2671(3) 0.3958(4) 0.4317(5) Cr10 9.7356(2) 9.9764(3) 3.7498(2) 364.21 2.7(1) 3.5(1) 0.2040(4) 0.2754(5) 0.3941(4) 0.4347(3)
Fe4 9.7470(3) 9.9970(3) 3.7465(1) 365.06 2.4(2) 2.7(1) 0.2022(4) 0.2745(5) 0.3873(3) 0.4357(4) Fe10 9.7413(5) 9.9964(4) 3.7438(3) 364.56 2.8(3) 3.5(1) 0.2009(4) 0.2706(5) 0.3957(4) 0.4354(3)
Mn4 9.7440(5) 10.0034(7) 3.7456(2) 365.10 3.0(2) 3.5(1) 0.2058(4) 0.2745(7) 0.3839(5) 0.4443(7) Mn10 9.7497(3) 10.0097(3) 3.7463(1) 365.61 2.3(2) 3.0(2) 0.2038(5) 0.2792(5) 0.3880(7) 0.4385(5)
Ni4 9.7442(3) 9.9917(3) 3.7480(2) 364.91 2.5(2) 2.9(3) 0.2011(4) 0.2760(4) 0.4023(4) 0.4379(6) Ni10 9.7406(4) 9.9888(4) 3.7500(2) 364.86 2.8(3) 3.5(3) 0.2047(5) 0.2703(5) 0.3987(6) 0.4342(4)
V4 9.7301(5) 10.0061(5) 3.7445(4) 364.57 2.7(3) 3.5(3) 0.2015(6) 0.2706(6) 0.3976(4) 0.4428(6) V10 9.7260(3) 10.0051(3) 3.7430(1) 364.23 3.0(2) 3.5(2) 0.2024(7) 0.2721(5) 0.3904(5) 0.4400(4) Figures in parentheses are standard deviations in the last decimal figure.

Published on the Journal of Solid State Chemistry, 180 (2007) 3196-3210 Copyright © 2007 Elsevier Ltd. All rights reserved. doi: 10.1016/j.jssc.2007.08.029
22
Table 3 Site occupancy and Mg-Ti ordering , average metal-oxygen distances, octahedral quadratic elongation and octahedral angle variance of karrooite
Sample Site occupancy of Mg (apfu) Average metal-oxygen
distance (Å) octahedral quadratic
elongation octahedral angle variance
M1 M2 M1-O M2-O M1 M2 M1 M2
KT 0.65 0.17 2.0448 1.9925 1.0014 1.0028 238.5 137.9 Co4 0.63 0.18 2.0375 1.9995 1.0021 1.0023 222.4 123.8 Co10 0.64 0.18 2.0357 1.9974 1.0018 1.0020 226.8 127.1 Cr4 0.64 0.18 2.0406 1.9963 1.0015 1.0025 214.3 122.1 Cr10 0.63 0.18 2.0404 1.9949 1.0016 1.0024 217.7 121.7 Fe4 0.67 0.17 2.0453 2.0002 1.0023 1.0024 226.0 112.7 Fe10 0.69 0.15 2.0607 1.9856 1.0012 1.0032 226.5 124.7 Mn4 0.75 0.13 2.0573 1.9843 1.0015 1.0020 244.0 135.0 Mn10 0.65 0.18 2.0437 1.9989 1.0024 1.0022 255.1 126.9 Ni4 0.60 0.20 2.0409 1.9948 1.0017 1.0025 231.9 129.9 Ni10 0.67 0.16 2.0502 1.9935 1.0025 1.0024 221.0 114.3 V4 0.77 0.11 2.0427 1.9948 1.0022 1.0020 252.2 123.8 V10 0.81 0.10 2.0661 1.9853 1.0021 1.0026 236.7 108.9
Standard deviation is (1) in the last decimal figure.
Published on the Journal of Solid State Chemistry, 180 (2007) 3196-3210 Copyright © 2007 Elsevier Ltd. All rights reserved. doi: 10.1016/j.jssc.2007.08.029
23
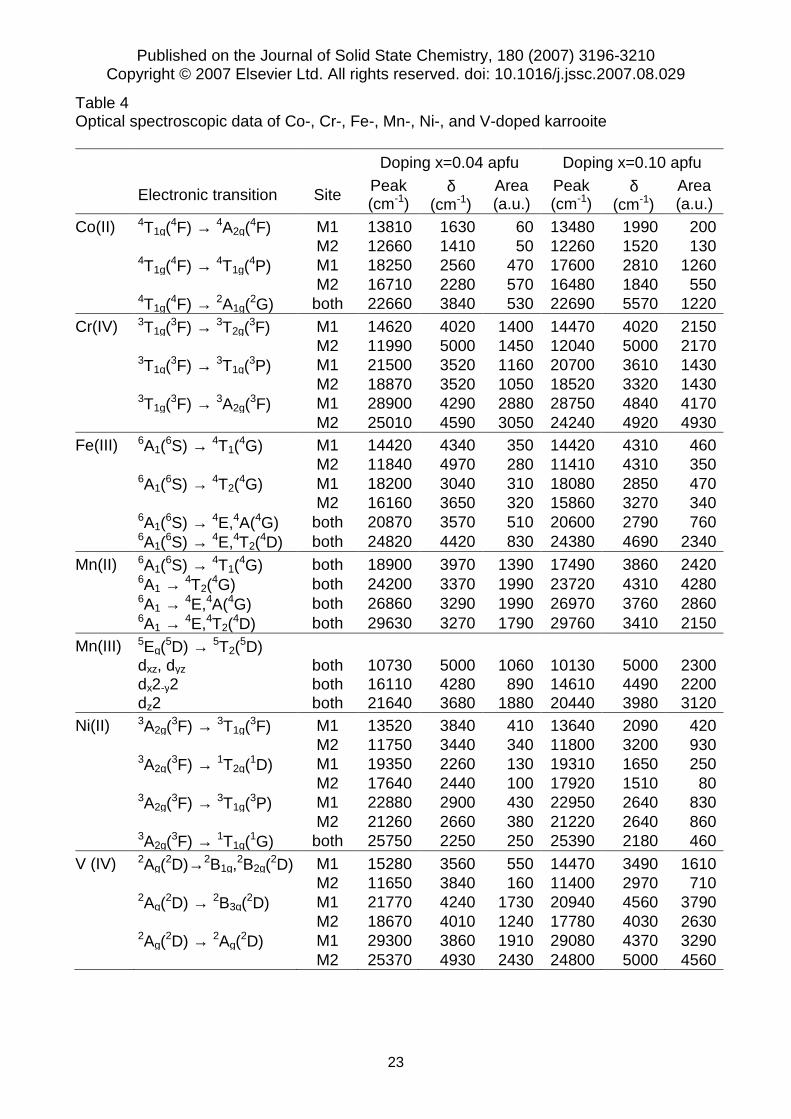
Table 4 Optical spectroscopic data of Co-, Cr-, Fe-, Mn-, Ni-, and V-doped karrooite Doping x=0.04 apfu Doping x=0.10 apfu
Electronic transition Site Peak (cm-1)
δ (cm-1)
Area (a.u.)
Peak (cm-1)
δ (cm-1)
Area (a.u.)
Co(II) 4T1g(4F) → 4A2g(
4F) M1 13810 1630 60 13480 1990 200 M2 12660 1410 50 12260 1520 130 4T1g(
4F) → 4T1g(4P) M1 18250 2560 470 17600 2810 1260
M2 16710 2280 570 16480 1840 550 4T1g(
4F) → 2A1g(2G) both 22660 3840 530 22690 5570 1220
Cr(IV) 3T1g(3F) → 3T2g(
3F) M1 14620 4020 1400 14470 4020 2150 M2 11990 5000 1450 12040 5000 2170 3T1g(
3F) → 3T1g(3P) M1 21500 3520 1160 20700 3610 1430
M2 18870 3520 1050 18520 3320 1430 3T1g(
3F) → 3A2g(3F) M1 28900 4290 2880 28750 4840 4170
M2 25010 4590 3050 24240 4920 4930 Fe(III) 6A1(
6S) → 4T1(4G) M1 14420 4340 350 14420 4310 460
M2 11840 4970 280 11410 4310 350 6A1(
6S) → 4T2(4G) M1 18200 3040 310 18080 2850 470
M2 16160 3650 320 15860 3270 340 6A1(
6S) → 4E,4A(4G) both 20870 3570 510 20600 2790 760 6A1(
6S) → 4E,4T2(4D) both 24820 4420 830 24380 4690 2340
Mn(II) 6A1(6S) → 4T1(
4G) both 18900 3970 1390 17490 3860 2420 6A1 → 4T2(
4G) both 24200 3370 1990 23720 4310 4280 6A1 → 4E,4A(4G) both 26860 3290 1990 26970 3760 2860 6A1 → 4E,4T2(
4D) both 29630 3270 1790 29760 3410 2150 Mn(III) 5Eg(
5D) → 5T2(5D)
dxz, dyz both 10730 5000 1060 10130 5000 2300
dx2-y2 both 16110 4280 890 14610 4490 2200
dz2 both 21640 3680 1880 20440 3980 3120
Ni(II) 3A2g(3F) → 3T1g(
3F) M1 13520 3840 410 13640 2090 420 M2 11750 3440 340 11800 3200 930 3A2g(
3F) → 1T2g(1D) M1 19350 2260 130 19310 1650 250
M2 17640 2440 100 17920 1510 80 3A2g(
3F) → 3T1g(3P) M1 22880 2900 430 22950 2640 830
M2 21260 2660 380 21220 2640 860 3A2g(
3F) → 1T1g(1G) both 25750 2250 250 25390 2180 460
V (IV) 2Ag(2D)→2B1g,
2B2g(2D) M1 15280 3560 550 14470 3490 1610
M2 11650 3840 160 11400 2970 710 2Ag(
2D) → 2B3g(2D) M1 21770 4240 1730 20940 4560 3790
M2 18670 4010 1240 17780 4030 2630 2Ag(
2D) → 2Ag(2D) M1 29300 3860 1910 29080 4370 3290
M2 25370 4930 2430 24800 5000 4560

Published on the Journal of Solid State Chemistry, 180 (2007) 3196-3210 Copyright © 2007 Elsevier Ltd. All rights reserved. doi: 10.1016/j.jssc.2007.08.029
24
Table 5 Crystal field strength (∆o), crystal field stabilization energy (CFSE), interelectronic repulsion Racah B parameter and nephelauxetic ratio β=B/B0 (B0 is the value of the free ion).
Sample Dopant
Site M1 Site M2 ∆o
(cm-1)
CFSE
(kJ⋅g/ion)
B
(cm-1)
β
(adim.)
∆o
(cm-1)
CFSE
(kJ⋅g/ion)
B
(cm-1)
β
(adim.)
Co4 Co(II) 7220 -69.1 830 0.85 6620 -63.4 760 0.78 Co10 7060 -67.6 795 0.82 6420 -61.5 755 0.78
Cr4 Cr(IV) 22240 -212.9 595 0.57 19510 -186.8 500 0.48
Cr10 21400 -204.9 635 0.61 19160 -183.4 470 0.45
Fe4 Fe(III) 13850 0 703 0.71 11390 0 703 0.71
Fe10 14700 0 694 0.70 11460 0 694 0.70
Ni4 Ni(II) 9310 -133.7 665 0.64 8080 -116.0 682 0.66
Ni10 9370 -134.5 665 0.64 8110 -116.5 676 0.65
V4 V(IV) 15650 -74.9 - - 14120 -67.6 - - V10 15590 -74.6 - - 13370 -64.0 - -
Published on the Journal of Solid State Chemistry, 180 (2007) 3196-3210 Copyright © 2007 Elsevier Ltd. All rights reserved. doi: 10.1016/j.jssc.2007.08.029
25
Table 6 CIE Lab colourimetric parameters of karrooite pigments.
Sample L* a* b*
Co4 56.4 -7.1 15.2
Co10 44.8 -6.2 11.9
Cr4 56.4 -5.8 12.0
Cr10 53.4 4.2 25.3
Fe4 44.8 -6.2 11.9
Fe10 66.0 0.8 18.6
Mn4 59.8 3.0 23.9
Mn10 34.8 5.9 13.9
Ni4 60.3 1.1 20.7
Ni10 73.7 8.1 39.8
V4 53.4 4.2 25.3
V10 38.3 13.1 16.0