Chemically surface-modified carbon nanoparticle carrier for phenolic pollutants: Extraction and...
9
This article appeared in a journal published by Elsevier. The attached copy is furnished to the author for internal non-commercial research and education use, including for instruction at the authors institution and sharing with colleagues. Other uses, including reproduction and distribution, or selling or licensing copies, or posting to personal, institutional or third party websites are prohibited. In most cases authors are permitted to post their version of the article (e.g. in Word or Tex form) to their personal website or institutional repository. Authors requiring further information regarding Elsevier’s archiving and manuscript policies are encouraged to visit: http://www.elsevier.com/copyright
-
Upload
independent -
Category
Documents
-
view
0 -
download
0
Transcript of Chemically surface-modified carbon nanoparticle carrier for phenolic pollutants: Extraction and...
This article appeared in a journal published by Elsevier. The attachedcopy is furnished to the author for internal non-commercial researchand education use, including for instruction at the authors institution
and sharing with colleagues.
Other uses, including reproduction and distribution, or selling orlicensing copies, or posting to personal, institutional or third party
websites are prohibited.
In most cases authors are permitted to post their version of thearticle (e.g. in Word or Tex form) to their personal website orinstitutional repository. Authors requiring further information
regarding Elsevier’s archiving and manuscript policies areencouraged to visit:
http://www.elsevier.com/copyright
Author's personal copy
a n a l y t i c a c h i m i c a a c t a 6 1 6 ( 2 0 0 8 ) 28–35
avai lab le at www.sc iencedi rec t .com
journa l homepage: www.e lsev ier .com/ locate /aca
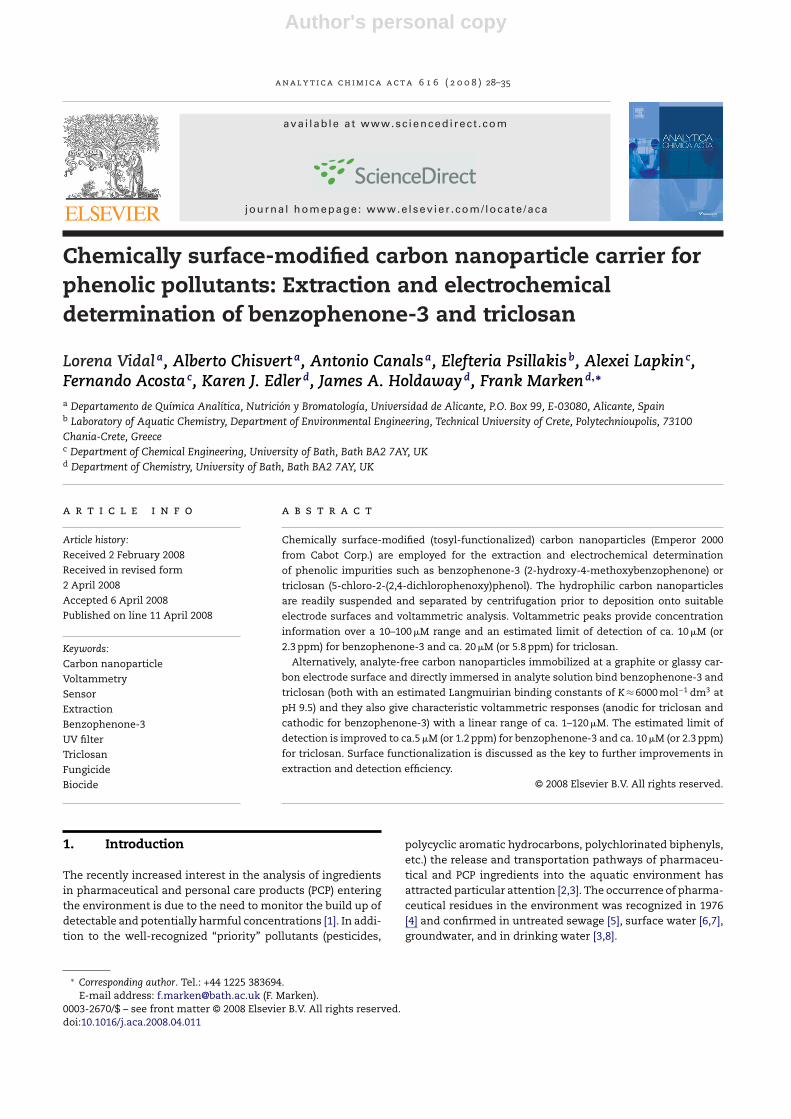
Chemically surface-modified carbon nanoparticle carrier forphenolic pollutants: Extraction and electrochemicaldetermination of benzophenone-3 and triclosan
Lorena Vidala, Alberto Chisverta, Antonio Canalsa, Elefteria Psillakisb, Alexei Lapkinc,Fernando Acostac, Karen J. Edlerd, James A. Holdawayd, Frank Markend,∗
a Departamento de Quımica Analıtica, Nutricion y Bromatologıa, Universidad de Alicante, P.O. Box 99, E-03080, Alicante, Spainb Laboratory of Aquatic Chemistry, Department of Environmental Engineering, Technical University of Crete, Polytechnioupolis, 73100Chania-Crete, Greecec Department of Chemical Engineering, University of Bath, Bath BA2 7AY, UKd Department of Chemistry, University of Bath, Bath BA2 7AY, UK
a r t i c l e i n f o
Article history:
Received 2 February 2008
Received in revised form
2 April 2008
Accepted 6 April 2008
Published on line 11 April 2008
Keywords:
Carbon nanoparticle
Voltammetry
Sensor
Extraction
Benzophenone-3
UV filter
Triclosan
Fungicide
Biocide
a b s t r a c t
Chemically surface-modified (tosyl-functionalized) carbon nanoparticles (Emperor 2000
from Cabot Corp.) are employed for the extraction and electrochemical determination
of phenolic impurities such as benzophenone-3 (2-hydroxy-4-methoxybenzophenone) or
triclosan (5-chloro-2-(2,4-dichlorophenoxy)phenol). The hydrophilic carbon nanoparticles
are readily suspended and separated by centrifugation prior to deposition onto suitable
electrode surfaces and voltammetric analysis. Voltammetric peaks provide concentration
information over a 10–100 �M range and an estimated limit of detection of ca. 10 �M (or
2.3 ppm) for benzophenone-3 and ca. 20 �M (or 5.8 ppm) for triclosan.
Alternatively, analyte-free carbon nanoparticles immobilized at a graphite or glassy car-
bon electrode surface and directly immersed in analyte solution bind benzophenone-3 and
triclosan (both with an estimated Langmuirian binding constants of K ≈ 6000 mol−1 dm3 at
pH 9.5) and they also give characteristic voltammetric responses (anodic for triclosan and
cathodic for benzophenone-3) with a linear range of ca. 1–120 �M. The estimated limit of
detection is improved to ca.5 �M (or 1.2 ppm) for benzophenone-3 and ca. 10 �M (or 2.3 ppm)
for triclosan. Surface functionalization is discussed as the key to further improvements in
extraction and detection efficiency.
© 2008 Elsevier B.V. All rights reserved.
1. Introduction
The recently increased interest in the analysis of ingredientsin pharmaceutical and personal care products (PCP) enteringthe environment is due to the need to monitor the build up ofdetectable and potentially harmful concentrations [1]. In addi-tion to the well-recognized “priority” pollutants (pesticides,
∗ Corresponding author. Tel.: +44 1225 383694.E-mail address: [email protected] (F. Marken).
polycyclic aromatic hydrocarbons, polychlorinated biphenyls,etc.) the release and transportation pathways of pharmaceu-tical and PCP ingredients into the aquatic environment hasattracted particular attention [2,3]. The occurrence of pharma-ceutical residues in the environment was recognized in 1976[4] and confirmed in untreated sewage [5], surface water [6,7],groundwater, and in drinking water [3,8].
0003-2670/$ – see front matter © 2008 Elsevier B.V. All rights reserved.doi:10.1016/j.aca.2008.04.011
Author's personal copy
a n a l y t i c a c h i m i c a a c t a 6 1 6 ( 2 0 0 8 ) 28–35 29
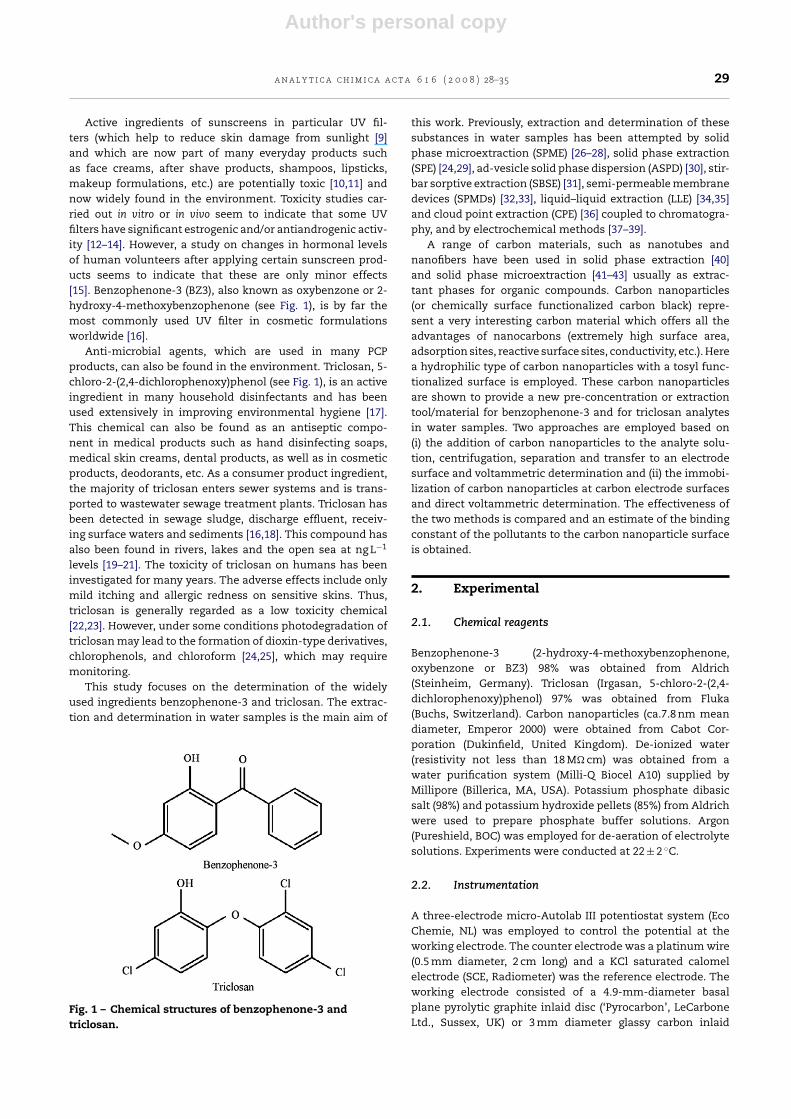
Active ingredients of sunscreens in particular UV fil-ters (which help to reduce skin damage from sunlight [9]and which are now part of many everyday products suchas face creams, after shave products, shampoos, lipsticks,makeup formulations, etc.) are potentially toxic [10,11] andnow widely found in the environment. Toxicity studies car-ried out in vitro or in vivo seem to indicate that some UVfilters have significant estrogenic and/or antiandrogenic activ-ity [12–14]. However, a study on changes in hormonal levelsof human volunteers after applying certain sunscreen prod-ucts seems to indicate that these are only minor effects[15]. Benzophenone-3 (BZ3), also known as oxybenzone or 2-hydroxy-4-methoxybenzophenone (see Fig. 1), is by far themost commonly used UV filter in cosmetic formulationsworldwide [16].
Anti-microbial agents, which are used in many PCPproducts, can also be found in the environment. Triclosan, 5-chloro-2-(2,4-dichlorophenoxy)phenol (see Fig. 1), is an activeingredient in many household disinfectants and has beenused extensively in improving environmental hygiene [17].This chemical can also be found as an antiseptic compo-nent in medical products such as hand disinfecting soaps,medical skin creams, dental products, as well as in cosmeticproducts, deodorants, etc. As a consumer product ingredient,the majority of triclosan enters sewer systems and is trans-ported to wastewater sewage treatment plants. Triclosan hasbeen detected in sewage sludge, discharge effluent, receiv-ing surface waters and sediments [16,18]. This compound hasalso been found in rivers, lakes and the open sea at ng L−1
levels [19–21]. The toxicity of triclosan on humans has beeninvestigated for many years. The adverse effects include onlymild itching and allergic redness on sensitive skins. Thus,triclosan is generally regarded as a low toxicity chemical[22,23]. However, under some conditions photodegradation oftriclosan may lead to the formation of dioxin-type derivatives,chlorophenols, and chloroform [24,25], which may requiremonitoring.
This study focuses on the determination of the widelyused ingredients benzophenone-3 and triclosan. The extrac-tion and determination in water samples is the main aim of
Fig. 1 – Chemical structures of benzophenone-3 andtriclosan.
this work. Previously, extraction and determination of thesesubstances in water samples has been attempted by solidphase microextraction (SPME) [26–28], solid phase extraction(SPE) [24,29], ad-vesicle solid phase dispersion (ASPD) [30], stir-bar sorptive extraction (SBSE) [31], semi-permeable membranedevices (SPMDs) [32,33], liquid–liquid extraction (LLE) [34,35]and cloud point extraction (CPE) [36] coupled to chromatogra-phy, and by electrochemical methods [37–39].
A range of carbon materials, such as nanotubes andnanofibers have been used in solid phase extraction [40]and solid phase microextraction [41–43] usually as extrac-tant phases for organic compounds. Carbon nanoparticles(or chemically surface functionalized carbon black) repre-sent a very interesting carbon material which offers all theadvantages of nanocarbons (extremely high surface area,adsorption sites, reactive surface sites, conductivity, etc.). Herea hydrophilic type of carbon nanoparticles with a tosyl func-tionalized surface is employed. These carbon nanoparticlesare shown to provide a new pre-concentration or extractiontool/material for benzophenone-3 and for triclosan analytesin water samples. Two approaches are employed based on(i) the addition of carbon nanoparticles to the analyte solu-tion, centrifugation, separation and transfer to an electrodesurface and voltammetric determination and (ii) the immobi-lization of carbon nanoparticles at carbon electrode surfacesand direct voltammetric determination. The effectiveness ofthe two methods is compared and an estimate of the bindingconstant of the pollutants to the carbon nanoparticle surfaceis obtained.
2. Experimental
2.1. Chemical reagents
Benzophenone-3 (2-hydroxy-4-methoxybenzophenone,oxybenzone or BZ3) 98% was obtained from Aldrich(Steinheim, Germany). Triclosan (Irgasan, 5-chloro-2-(2,4-dichlorophenoxy)phenol) 97% was obtained from Fluka(Buchs, Switzerland). Carbon nanoparticles (ca.7.8 nm meandiameter, Emperor 2000) were obtained from Cabot Cor-poration (Dukinfield, United Kingdom). De-ionized water(resistivity not less than 18 M� cm) was obtained from awater purification system (Milli-Q Biocel A10) supplied byMillipore (Billerica, MA, USA). Potassium phosphate dibasicsalt (98%) and potassium hydroxide pellets (85%) from Aldrichwere used to prepare phosphate buffer solutions. Argon(Pureshield, BOC) was employed for de-aeration of electrolytesolutions. Experiments were conducted at 22 ± 2 ◦C.
2.2. Instrumentation
A three-electrode micro-Autolab III potentiostat system (EcoChemie, NL) was employed to control the potential at theworking electrode. The counter electrode was a platinum wire(0.5 mm diameter, 2 cm long) and a KCl saturated calomelelectrode (SCE, Radiometer) was the reference electrode. Theworking electrode consisted of a 4.9-mm-diameter basalplane pyrolytic graphite inlaid disc (‘Pyrocarbon’, LeCarboneLtd., Sussex, UK) or 3 mm diameter glassy carbon inlaid
Author's personal copy
30 a n a l y t i c a c h i m i c a a c t a 6 1 6 ( 2 0 0 8 ) 28–35
disc (BAS Analytical). Working electrodes were polished onmicrocloth (Buehler) with 1 �m alumina abrasive after mea-surements and prior to surface modification. A Hydrus 300pH meter and FB 11012 ultrasonic bath (Fisher, UK) were usedfor the pH measurements and sample sonication, respec-tively. An Eppendorf (Hamburg, Germany) 5415D centrifugewas used to separate carbon nanoparticles from the analytesolution.
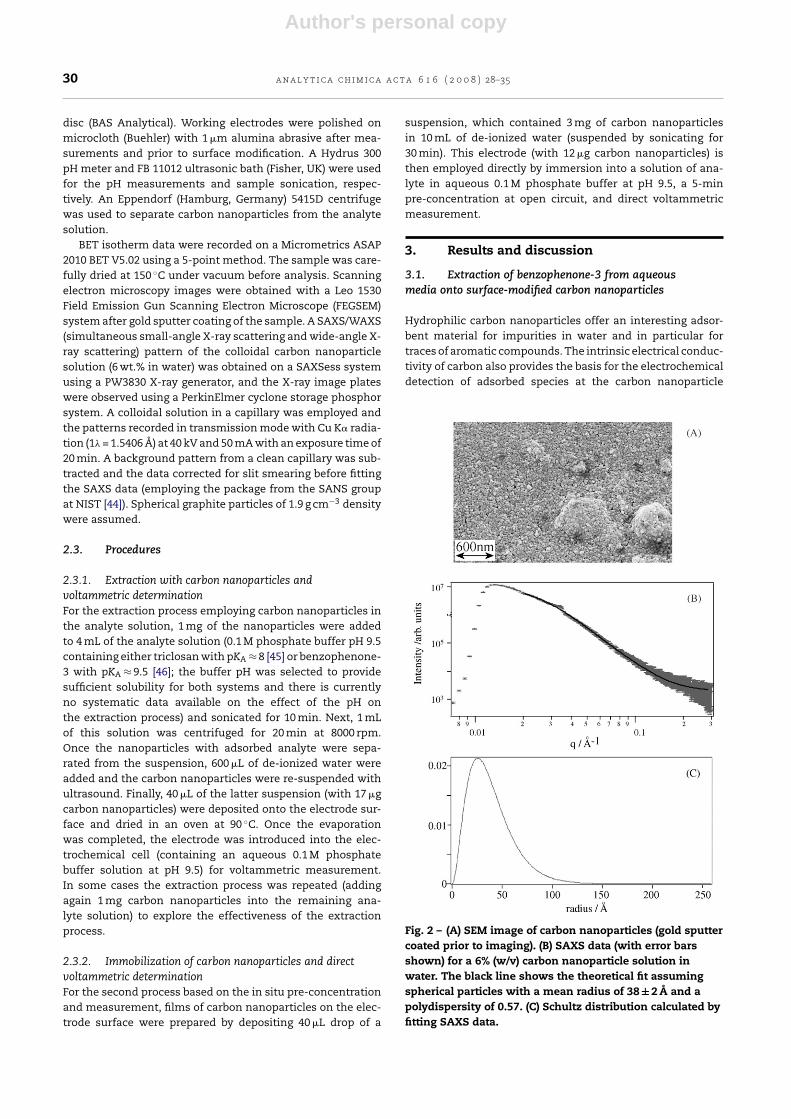
BET isotherm data were recorded on a Micrometrics ASAP2010 BET V5.02 using a 5-point method. The sample was care-fully dried at 150 ◦C under vacuum before analysis. Scanningelectron microscopy images were obtained with a Leo 1530Field Emission Gun Scanning Electron Microscope (FEGSEM)system after gold sputter coating of the sample. A SAXS/WAXS(simultaneous small-angle X-ray scattering and wide-angle X-ray scattering) pattern of the colloidal carbon nanoparticlesolution (6 wt.% in water) was obtained on a SAXSess systemusing a PW3830 X-ray generator, and the X-ray image plateswere observed using a PerkinElmer cyclone storage phosphorsystem. A colloidal solution in a capillary was employed andthe patterns recorded in transmission mode with Cu K� radia-tion (1� = 1.5406 A) at 40 kV and 50 mA with an exposure time of20 min. A background pattern from a clean capillary was sub-tracted and the data corrected for slit smearing before fittingthe SAXS data (employing the package from the SANS groupat NIST [44]). Spherical graphite particles of 1.9 g cm−3 densitywere assumed.
2.3. Procedures
2.3.1. Extraction with carbon nanoparticles andvoltammetric determinationFor the extraction process employing carbon nanoparticles inthe analyte solution, 1 mg of the nanoparticles were addedto 4 mL of the analyte solution (0.1 M phosphate buffer pH 9.5containing either triclosan with pKA ≈ 8 [45] or benzophenone-3 with pKA ≈ 9.5 [46]; the buffer pH was selected to providesufficient solubility for both systems and there is currentlyno systematic data available on the effect of the pH onthe extraction process) and sonicated for 10 min. Next, 1 mLof this solution was centrifuged for 20 min at 8000 rpm.Once the nanoparticles with adsorbed analyte were sepa-rated from the suspension, 600 �L of de-ionized water wereadded and the carbon nanoparticles were re-suspended withultrasound. Finally, 40 �L of the latter suspension (with 17 �gcarbon nanoparticles) were deposited onto the electrode sur-face and dried in an oven at 90 ◦C. Once the evaporationwas completed, the electrode was introduced into the elec-trochemical cell (containing an aqueous 0.1 M phosphatebuffer solution at pH 9.5) for voltammetric measurement.In some cases the extraction process was repeated (addingagain 1 mg carbon nanoparticles into the remaining ana-lyte solution) to explore the effectiveness of the extractionprocess.
2.3.2. Immobilization of carbon nanoparticles and directvoltammetric determinationFor the second process based on the in situ pre-concentrationand measurement, films of carbon nanoparticles on the elec-trode surface were prepared by depositing 40 �L drop of a
suspension, which contained 3 mg of carbon nanoparticlesin 10 mL of de-ionized water (suspended by sonicating for30 min). This electrode (with 12 �g carbon nanoparticles) isthen employed directly by immersion into a solution of ana-lyte in aqueous 0.1 M phosphate buffer at pH 9.5, a 5-minpre-concentration at open circuit, and direct voltammetricmeasurement.
3. Results and discussion
3.1. Extraction of benzophenone-3 from aqueousmedia onto surface-modified carbon nanoparticles
Hydrophilic carbon nanoparticles offer an interesting adsor-bent material for impurities in water and in particular fortraces of aromatic compounds. The intrinsic electrical conduc-tivity of carbon also provides the basis for the electrochemicaldetection of adsorbed species at the carbon nanoparticle
Fig. 2 – (A) SEM image of carbon nanoparticles (gold sputtercoated prior to imaging). (B) SAXS data (with error barsshown) for a 6% (w/v) carbon nanoparticle solution inwater. The black line shows the theoretical fit assumingspherical particles with a mean radius of 38 ± 2 A and apolydispersity of 0.57. (C) Schultz distribution calculated byfitting SAXS data.
Author's personal copy
a n a l y t i c a c h i m i c a a c t a 6 1 6 ( 2 0 0 8 ) 28–35 31
surface. Due to the surface functionalization of these nanopar-ticles with anionic tosyl groups they are readily dispersed(with ultrasound) and they offer a considerable surface areafor extraction purposes.
Analysis of the surface area of the dry carbon nanoparti-cle powder gives a BET isotherm area of 346 m2 g−1 (5-pointBET, see Section 2). When assuming spherical carbon parti-cles with the density of graphite a radius of ca. 3.9 nm can bepredicted based on this BET surface area. Scanning electronmicrographs (see Fig. 2A) of the carbon nanoparticle materialconfirm a particle size in the order of 5 nm radius. Next, small-angle X-ray scattering experiments were carried out with acolloidal solution of 6% (w/v) carbon nanoparticles in waterin order to further quantify the particle radius (see Fig. 2B).The mean particle radius 3.8 nm obtained by fitting the modelof spherical particles is in excellent agreement with the BETprediction and the Schultz distribution shown in Fig. 2C rep-resents a measure of the range of particle sizes encounteredin this material.
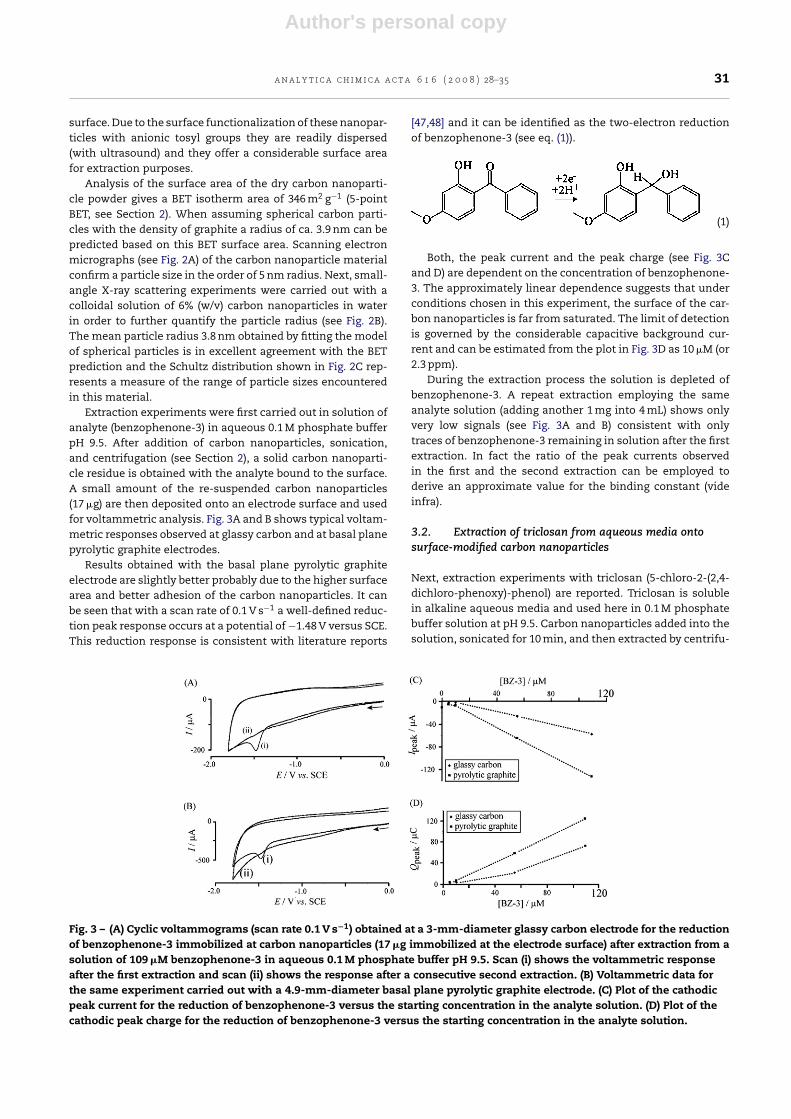
Extraction experiments were first carried out in solution ofanalyte (benzophenone-3) in aqueous 0.1 M phosphate bufferpH 9.5. After addition of carbon nanoparticles, sonication,and centrifugation (see Section 2), a solid carbon nanoparti-cle residue is obtained with the analyte bound to the surface.A small amount of the re-suspended carbon nanoparticles(17 �g) are then deposited onto an electrode surface and usedfor voltammetric analysis. Fig. 3A and B shows typical voltam-metric responses observed at glassy carbon and at basal planepyrolytic graphite electrodes.
Results obtained with the basal plane pyrolytic graphiteelectrode are slightly better probably due to the higher surfacearea and better adhesion of the carbon nanoparticles. It canbe seen that with a scan rate of 0.1 V s−1 a well-defined reduc-tion peak response occurs at a potential of −1.48 V versus SCE.This reduction response is consistent with literature reports
[47,48] and it can be identified as the two-electron reductionof benzophenone-3 (see eq. (1)).
(1)
Both, the peak current and the peak charge (see Fig. 3Cand D) are dependent on the concentration of benzophenone-3. The approximately linear dependence suggests that underconditions chosen in this experiment, the surface of the car-bon nanoparticles is far from saturated. The limit of detectionis governed by the considerable capacitive background cur-rent and can be estimated from the plot in Fig. 3D as 10 �M (or2.3 ppm).
During the extraction process the solution is depleted ofbenzophenone-3. A repeat extraction employing the sameanalyte solution (adding another 1 mg into 4 mL) shows onlyvery low signals (see Fig. 3A and B) consistent with onlytraces of benzophenone-3 remaining in solution after the firstextraction. In fact the ratio of the peak currents observedin the first and the second extraction can be employed toderive an approximate value for the binding constant (videinfra).
3.2. Extraction of triclosan from aqueous media ontosurface-modified carbon nanoparticles
Next, extraction experiments with triclosan (5-chloro-2-(2,4-dichloro-phenoxy)-phenol) are reported. Triclosan is solublein alkaline aqueous media and used here in 0.1 M phosphatebuffer solution at pH 9.5. Carbon nanoparticles added into thesolution, sonicated for 10 min, and then extracted by centrifu-
Fig. 3 – (A) Cyclic voltammograms (scan rate 0.1 V s−1) obtained at a 3-mm-diameter glassy carbon electrode for the reductionof benzophenone-3 immobilized at carbon nanoparticles (17 �g immobilized at the electrode surface) after extraction from asolution of 109 �M benzophenone-3 in aqueous 0.1 M phosphate buffer pH 9.5. Scan (i) shows the voltammetric responseafter the first extraction and scan (ii) shows the response after a consecutive second extraction. (B) Voltammetric data forthe same experiment carried out with a 4.9-mm-diameter basal plane pyrolytic graphite electrode. (C) Plot of the cathodicpeak current for the reduction of benzophenone-3 versus the starting concentration in the analyte solution. (D) Plot of thecathodic peak charge for the reduction of benzophenone-3 versus the starting concentration in the analyte solution.
Author's personal copy
32 a n a l y t i c a c h i m i c a a c t a 6 1 6 ( 2 0 0 8 ) 28–35
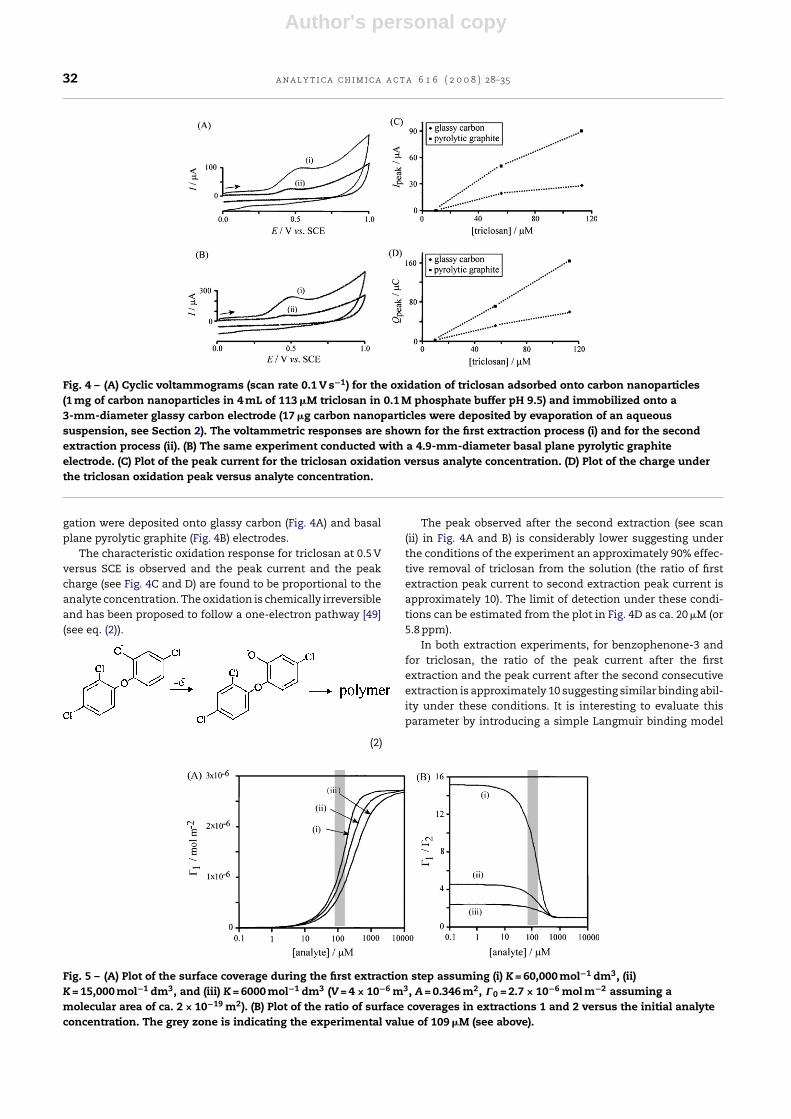
Fig. 4 – (A) Cyclic voltammograms (scan rate 0.1 V s−1) for the oxidation of triclosan adsorbed onto carbon nanoparticles(1 mg of carbon nanoparticles in 4 mL of 113 �M triclosan in 0.1 M phosphate buffer pH 9.5) and immobilized onto a3-mm-diameter glassy carbon electrode (17 �g carbon nanoparticles were deposited by evaporation of an aqueoussuspension, see Section 2). The voltammetric responses are shown for the first extraction process (i) and for the secondextraction process (ii). (B) The same experiment conducted with a 4.9-mm-diameter basal plane pyrolytic graphiteelectrode. (C) Plot of the peak current for the triclosan oxidation versus analyte concentration. (D) Plot of the charge underthe triclosan oxidation peak versus analyte concentration.
gation were deposited onto glassy carbon (Fig. 4A) and basalplane pyrolytic graphite (Fig. 4B) electrodes.
The characteristic oxidation response for triclosan at 0.5 Vversus SCE is observed and the peak current and the peakcharge (see Fig. 4C and D) are found to be proportional to theanalyte concentration. The oxidation is chemically irreversibleand has been proposed to follow a one-electron pathway [49](see eq. (2)).
(2)
The peak observed after the second extraction (see scan(ii) in Fig. 4A and B) is considerably lower suggesting underthe conditions of the experiment an approximately 90% effec-tive removal of triclosan from the solution (the ratio of firstextraction peak current to second extraction peak current isapproximately 10). The limit of detection under these condi-tions can be estimated from the plot in Fig. 4D as ca. 20 �M (or5.8 ppm).
In both extraction experiments, for benzophenone-3 andfor triclosan, the ratio of the peak current after the firstextraction and the peak current after the second consecutiveextraction is approximately 10 suggesting similar binding abil-ity under these conditions. It is interesting to evaluate thisparameter by introducing a simple Langmuir binding model
Fig. 5 – (A) Plot of the surface coverage during the first extraction step assuming (i) K = 60,000 mol−1 dm3, (ii)K = 15,000 mol−1 dm3, and (iii) K = 6000 mol−1 dm3 (V = 4 × 10⁻⁶ m3, A = 0.346 m2, � 0 = 2.7 × 10⁻⁶ mol m−2 assuming amolecular area of ca. 2 × 10⁻¹⁹ m2). (B) Plot of the ratio of surface coverages in extractions 1 and 2 versus the initial analyteconcentration. The grey zone is indicating the experimental value of 109 �M (see above).

Author's personal copy
a n a l y t i c a c h i m i c a a c t a 6 1 6 ( 2 0 0 8 ) 28–35 33
(eq. (3)).
�1
�0= Kc1
1 + Kc1(3)
In this equation the surface coverage, � 1, is given by theavailable surface sites, � 0, the binding constant, K, and thesolution concentration after the first extraction, c1. After equi-libration the concentration c1 = c0 − (� 1A/V) will be lower thanthe initial concentration c0 due to the surface coverage � 1 mul-tiplied by the carbon nanoparticle area A and divided by thesolution volume V. The parameter c1 in eq. (3) is substitutedand the expression resolved for � 1. The resulting expressionfor the coverage (which is assumed to be proportional to thepeak current) as a function of the initial concentration is aquadratic expression (see eq. (4)).
�1 =(
c0V
2A+ V
2AK+ �0
2
)−
√(c0V
2A+ V
2AK+ �0
2
)2− c0�0V
A
(4)
Fig. 5A shows a plot of the surface coverage predicted underthe experimental conditions (V = 4 × 10⁻⁶ m3, A = 0.346 m2,� 0 = 2.7 × 10⁻⁶ mol m−2 assuming a molecular area of ca.2 × 10−19 m2) and for three different binding constants. Anexpression similar to eq. (4) but for the second extraction(using c2 = c0 − (� 1A/V) − (� 2A/V)) can be employed similarly toexpress the surface coverage � 2. The plot in Fig. 5B shows theratio of coverage for the first and second extraction (whichis assumed to be approximately equivalent to the ratio of thepeak currents observed for the first and second extraction). Asexpected, at very high analyte concentration the ratio is unitybut at very low concentration the ratio becomes constant andproportional to the binding constant.
Based on the ratio of the peak currents for the firstand second extraction of approximately 10 for an analyteconcentration of 109 �M (see Figs. 3A and B and 4A andB), the binding constant can be estimated from Fig. 5B asK ≈ 60,000 mol−1 dm3 (curve (i)). However, this value has to beregarded only as a higher limit due to considerable uncertaintyin the peak current data. It can be seen that plots in Figs. 4C andD and 3C and D do not go through the origin, and therefore, lowconcentration peaks are smaller than predicted from a simplelinear relationship. Also, the charge under the voltammetricpeaks is lower than that expected based on the simple Lang-muir model. It seems, therefore, likely that after immersionof the modified electrode into the analyte-free buffer solutiongradual loss of analyte or loss of some carbon material fromthe surface occurs. In the next section an alternative approachto quantitative analysis of analyte binding is investigated.
3.3. Voltammetric determination of benzophenone-3 atcarbon nanoparticle modified electrodes
Next, voltammetric experiments were conducted with thecarbon nanoparticles directly immobilized at the electrodesurface which is then immersed directly into the analyte solu-tion (see Section 2). In this way, the carbon nanoparticles act asthe adsorption medium and enhanced voltammetric signalsare observed without changing the solution. In stagnant solu-
tion, carbon nanoparticles were found to remain immobilizedat the electrode surface and a typical set of voltammograms forthe reduction of benzophenone-3 is shown in Fig. 6A. A well-defined chemically irreversible reduction response is observedin the presence of 12 �g carbon nanoparticles and for concen-trations of 5, 10, 55, and 109 �M benzophenone-3 in aqueous0.1 M phosphate buffer pH 9.5. In the absence of the carbonnanoparticles a much smaller reduction response is detected.
The amount of carbon nanoparticles employed in theseexperiments is crucial, and therefore, several sets of exper-iments were conducted to optimize this parameter. Data inFig. 6B shows the normalized peak current (the peak currentdivided by the capacitive current) for the benzophenone-3 reduction. Perhaps surprisingly, this value is reduced forhigher loading which suggests an increased capacitive back-ground with only little improvement in the faradic signal. Itseems possible that for a higher loading with carbon nanopar-ticles the time for uptake of analyte increases significantly
Fig. 6 – (A) Cyclic voltammograms (scan rate 0.1 V s−1)for the reduction of benzophenone-3 at a 4.9-mm-diameterbasal plane pyrolytic graphite electrode with 12 �g carbonnanoparticles immobilized and immersed in (i) 5 �M, (ii)10 �M, (iii) 55 �M, and (iv) 109 �M benzophenone-3 in 0.1 Mphosphate buffer pH 9.5. (B) Plot of the normalized peakcurrent (peak current/capacitive current) for the reductionof 10 �M benzophenone-3 in 0.1 M phosphate buffer pH 9.5versus the amount of carbon nanoparticles deposited at theelectrode surface. (C) Plot of the normalized peak current(peak current/capacitive current) for the oxidation of 10 �Mtriclosan in 0.1 M phosphate buffer pH 9.5 versus the amountof carbon nanoparticles deposited at the electrode surface.

Author's personal copy
34 a n a l y t i c a c h i m i c a a c t a 6 1 6 ( 2 0 0 8 ) 28–35
Fig. 7 – (A) Plot of the voltammetric peak current (scan rate 0.1 V s−1) for the reduction of benzophenone-3 at a3-mm-diameter glassy carbon electrode with 12 �g carbon nanoparticles versus concentration in aqueous 0.1 M phosphatebuffer pH 9.5. (B) Plot for data obtained at a 4.9-mm-diameter basal plane pyrolytic graphite electrode. The line is indicatinga Langmuir isotherm trend line with K ≈ 6000 mol−1 dm3. (C) Plot of the voltammetric peak current (scan rate 0.1 V s−1) forthe oxidation of triclosan at a 3-mm-diameter glassy carbon electrode with 12 �g carbon nanoparticles versus concentrationin aqueous phosphate buffer pH 9.5. (D) Plot for data obtained at a 4.9-mm-diameter basal plane pyrolytic graphiteelectrode. The line is indicating a Langmuir isotherm trend line with K ≈ 6000 mol−1 dm3.
and only the capacitive current is increased. Therefore, underconditions of the experiment a carbon nanoparticle deposit of12 �g was chosen as a compromise to provide good sensitivityfor both glassy carbon and basal plane pyrolytic graphite atlow concentration of analyte.
Next, the effect of the benzophenone-3 concentration onthe reduction response is investigated. Data in Fig. 7A andB demonstrate a systematic change in the peak current withconcentration for both glassy carbon and graphite electrodes.
It is possible to obtain information about the bindingconstant (at least approximate) of benzophenone-3 onto thecarbon nanoparticle substrate by fitting a Langmuir isothermmodel into the data point in Fig. 7B. For a binding constantof K ≈ 60000 mol−1 dm3 (vide supra) the deviation in all datapoints is considerable but for K ≈ 6000 mol−1 dm3 a reason-able agreement between theory and experiment is achieved.The higher binding constant obtained above with the centrifu-gation procedure appears less accurate due to non-linearityat low analyte concentration (vide supra), and therefore,K ≈ 6000 mol−1 dm3 appears to be the more accurate result. Inorder to improve the considerable uncertainty in this estimatea more extensive data set (over a wider concentration rangeand for different carbon loadings) would be required. For ana-lytical purposes, for this experiment the limit of detection canbe estimated from the plot in Fig. 7B as ca. 5 �M (or 1.2 ppm).
3.4. Voltammetric determination of triclosan at carbonnanoparticle modified electrodes
The adsorption of triclosan from 0.1 M phosphate solution (pH9.5) onto carbon nanoparticles is also observed when carbon
nanoparticles are immobilized at the electrode surface andmeasurements are conducted in stagnant solution. Data inFig. 6C suggest that good results are obtained with a 12 �g car-bon nanoparticle deposit for both glassy carbon and for basalplane pyrolytic graphite electrodes. Fig. 7C and D gives concen-tration dependent peak currents which suggest close to lineardependence and an approximate limit of detection at 10 �M(or 2.3 ppm, estimated from the plot in Fig. 7D). The bindingconstant K ≈ 6000 mol−1 dm3 is very similar for triclosan andfor benzophenone-3.
4. Summary
It has been shown that 7.8 nm diameter carbon nanopar-ticles (surface functionalized with tosyl groups) effectivelybind polyaromatic phenols from aqueous media. Two experi-mental approaches have been investigated: (i) the extractionof aromatic phenols onto carbon nanoparticles followed bydeposition onto electrodes and (ii) the adsorption of aromaticphenols directly onto carbon nanoparticles immobilized atelectrodes. The extraction process has been demonstratedto be highly effective. However, details of the adsorptionmechanism and the molecular interaction between analyteand carbon nanoparticles are currently not fully understood.In both cases the limit of detection is in the 5–20 �M (or2–6 ppm) range, but the detection with carbon nanoparti-cles immobilized at basal plane pyrolytic graphite is themethod of choice for both triclosan and benzophenone-3analytes. In future, the surface functionalization of the car-bon nanoparticles could be improved to further enhance

Author's personal copy
a n a l y t i c a c h i m i c a a c t a 6 1 6 ( 2 0 0 8 ) 28–35 35
the binding effects or the binding specificity. For example,naphthylsulfonate functionalization or introducing furthercationic components could dramatically change the extrac-tion behavior of the carbon nanoparticle material. Therefore,surface-modified/functionalized carbon nanoparticle basedmaterials are promising reagents for the removal and thedetection of redox active aromatics.
Acknowledgements
The authors thank the COST network (Action D32, workinggroup D32/005/04 ”Microwave and Ultrasound Activation inChemical Analysis) for support of this work. We thank CabotCorporation for generous supply with carbon nanomaterials.L.V. thanks “Vicerrectorado de Investigacion, Desarollo e Ino-vacion” (University of Alicante) for the financial support
r e f e r e n c e s
[1] D. Barcelo, P. Grathwohl, K. Jones, K.U. Totsche, Identificationof priority compound classes. SOVA Report 1: Integrated Soiland Water Protection (2003) p. 5.
[2] C.G. Daughton, T.A. Ternes, Environ. Health Persp. 107 (1999)907.
[3] M.E. Lindsey, M. Meyer, E.M. Thurman, Anal. Chem. 73 (2001)4640.
[4] A.W. Garrison, J.D. Pope, F.R. Allen, in: C.H. Keith (Ed.),Identification and Analysis of Organic Pollutants in Water,Ann Arbor Science Publication, Ann Arbor, MI, 1976, p. pp.517.
[5] R. Hirsch, T.A. Ternes, K. Haberer, K.-L. Kratz, Sci. TotalEnviron. 225 (1999) 109.
[6] H. Buser, T. Poiger, M.D. Muller, Environ. Sci. Technol. 32(1998) 3449.
[7] T.A. Ternes, Water Res. 32 (1998) 3245.[8] C. Potera, Environ. Health Persp. 108 (2000) A446.[9] A. Chisvert, A. Salvador, UV Filters in Sunscreens and Other
Cosmetics. Regulatory Aspects and Analytical Methods, inAnalysis of Cosmetic Products, Elsevier, Amsterdam, 2007.
[10] L.G. Dimosthenis, A. Salvador, A. Chisvert, TRAC TrendsAnal. Chem. 26 (2006) 360.
[11] S.D. Richardson, Anal. Chem. 79 (2007) 4295.[12] T. Suzuki, S. Kitamura, R. Khota, K. Sugihara, N. Fujimoto, S.
Ohta, Toxicol. Appl. Pharmacol. 203 (2005) 9.[13] M. Schlumpf, P. Schmid, S. Durrer, M. Conscience, K.
Maerkel, M. Henseler, M. Gruetter, I. Herzog, S. Reolon, R.Ceccatelli, O. Faass, E. Stutz, H. Jarry, W. Wuttke, W.Lichtensteiger, Toxicology 205 (2004) 113.
[14] T. Hayashi, Y. Okamoto, K. Ueda, N. Kojima, Toxicol. Lett. 167(2006) 1.
[15] N.R. Janjua, B. Mogensen, A.M. Andersson, J.H. Petersen, M.Henriksen, N.E. Skakkebæk, H.C. Wulf, J. Invest. Dermatol.123 (2004) 57.
[16] A.M. Peck, Anal. Bioanal. Chem. 386 (2006) 907.[17] T. Okumura, Y. Nishikawa, Anal. Chim. Acta 325 (1996) 175.[18] W. Hua, E.R. Bennett, R.J. Letcher, Environ. Int. 31 (2005) 621.
[19] D.W. Kolpin, M. Skopec, M.T. Meyer, E.T. Furlong, S.D. Zaugg,Sci. Total Environ. 328 (2004) 119.
[20] P.M. Thomas, G.D. Foster, J. Environ. Sci. Health A 39 (2004)1969.
[21] D.W. Kolpin, E.T. Furlong, M.T. Meyer, E.M. Thurman, S.D.Zaugg, L.B. Barber, H.T. Buxton, Environ. Sci. Technol. 36(2002) 1202.
[22] A. Lindstrom, I.J. Buerge, T. Poiger, P. Bergqvist, M.D. Muller,H. Buser, Environ. Sci. Technol. 36 (2002) 2322.
[23] C. Tixier, H. Singer, S. Canonica, S. Muller, Environ. Sci.Technol. 36 (2002) 3482.
[24] L. Sanchez-Prado, M. Llompart, M. Lores, M.Fernandez-Alvarez, C. Garcia-Jares, R. Cela, Anal. Bioanal.Chem. 384 (2006) 1548.
[25] D.E. Latch, J.L. Packer, W.A. Arnold, K. McNeill, J. Photochem.Photobiol. A 158 (2003) 63.
[26] T. Felix, B.J. Hall, J.S. Brodbelt, Anal. Chim. Acta 371 (1998)195.
[27] D.A. Lambropoulou, D.L. Giokas, V.A. Sakkas, T.A. Albanis,M.I. Karayannis, J. Chromatogr. A 967 (2002) 243.
[28] P. Canosa, I. Rodriguez, E. Rubi, R. Cela, Anal. Chem. 79(2007) 1675.
[29] R. Gibson, E. Becerril-Bravo, V. Silva-Castro, B. Jimenez, J.Chromatogr. A 1169 (2007) 31.
[30] N.A. Parisis, D.L. Giokas, A.G. Vlessidis, N.P. Evmiridis, J.Chromatogr. A 1097 (2005) 17.
[31] M. Kawaguchi, R. Ito, N. Endo, N. Sakui, N. Okanouchi, K.Saito, N. Sato, T. Shiozaki, H. Nakazawa, Anal. Chim. Acta557 (2006) 272.
[32] M.E. Balmer, H.R. Buser, M.D. Muller, T. Poiger, Environ. Sci.Technol. 39 (2005) 953.
[33] A. Lindstrom, I.J. Buerge, T. Poiger, P.A. Bergqvist, M.D.Muller, H.R. Buser, Environ. Sci. Technol. 36 (2002)2322.
[34] L. Vidal, A. Chisvert, A. Canals, A. Salvador, J. Chromatogr. A1174 (2007) 95.
[35] H.K. Jeon, Y. Chung, J.C. Ryu, J. Chromatogr. A 1131 (2006) 192.[36] D.L. Giokas, V.A. Sakkas, T.A. Albanis, D.A. Lambropoulou, J.
Chromatogr. A 1077 (2005) 19.[37] M. Amiri, S. Shahrokhian, E. Psillakis, F. Marken, Anal. Chim.
Acta 593 (2007) 117.[38] M.A. Ghanem, R.G. Compton, B.A. Coles, E. Psillakis, M.A.
Kulandainathan, F. Marken, Electrochim. Acta 53 (2007) 1092.[39] L.-H. Wang, Electroanalysis 14 (2002) 773.[40] Q. Zhou, W. Wang, J. Xiao, Anal. Chim. Acta 559 (2006) 200.[41] X. Liu, Y. Ji, Y. Zhang, H. Zhang, M. Liu, J. Chromatogr. A 1165
(2007) 10.[42] T. Sun, J. Jia, N. Fang, Y. Wang, Anal. Chim. Acta 530 (2005) 33.[43] J.-X. Wang, D.-Q. Jiang, Z.-Y. Gu, X.-P. Yan, J. Chromatogr. A
1137 (2006) 8.[44] S.R. Kline, J. Appl. Cryst. 39 (2006) 895.[45] A. Safavi, N. Maleki, H.R. Shahbaazia, Bull. Electrochem. 21
(2005) 229.[46] G.T. Castro, O.S. Giordano, S.E. Blanco, J. Mol. Struc.
-Theochem. 626 (2003) 167.[47] A.P. da Silva, M.A.G. Trindade, V.S. Ferreira, Talanta 68 (2006)
679.[48] M. Chandrasekaran, M. Noel, V. Krishnan, Collect. Czech.
Chem. Commun. 56 (1991) 2055.[49] R.M. Pemberton, J.P. Hart, Anal. Chim. Acta 390 (1999) 107.