Chemical composition of water from roofs in Gdansk, Poland
8
Chemical composition of water from roofs in Gdansk, Poland Stefan Tsakovski a, * , Marek Tobiszewski b , Vasil Simeonov c , _ Zaneta Polkowska b , Jacek Namie snik b a Chair of Physical Chemistry, Faculty of Chemistry, University of Sofia, J Bourchier Blvd.1, 1164 Sofia, Bulgaria b Department of Analytical Chemistry, Chemical Faculty, Gdan ´sk University of Technology (GUT), 11/12 G. Narutowicza St., 80-952 Gdan ´sk, Poland c Chair of Analytical Chemistry, Faculty of Chemistry, University of Sofia,1164 Sofia, Bulgaria Identification of the urban roof runoff water quality factors and ‘‘roof’’ impact by self-organizing map classification. article info Article history: Received 17 March 2009 Received in revised form 29 June 2009 Accepted 28 July 2009 Keywords: Roof runoff Chemical composition Self-organizing maps PAHs PCBs abstract This study deals with the assessment of roof runoff waters from the region of Gdansk collected during the winter season (2007/2008). The chemical analysis includes 16 chemical variables: major ions, PAHs and PCBs measured at 3 sampling sites for 6–14 rain events. Although the data set is of limited volume the statistical data treatment using self-organizing maps (SOM) reveals the main factors controlling roof runoff water quality even for a data set with small dimension. This effort for explanation of the identified factors by the possible emission sources of the urban environment and air-particulate formation seems to be very reliable. Additionally to the roof runoff water quality factors the rain events patterns are found: ‘‘background’’ group of events and groups formally named ‘‘PAHs’’, ‘‘PCBs’’ and ‘‘air-borne particles’’ – dominated events. The SOM classification results give an opportunity to uncover the role of roof ‘‘impact’’ on the runoff waters. Rain runoff water quality is described by four latent factors and the ‘‘roof’’ impact is uncovered. Ó 2009 Elsevier Ltd. All rights reserved. 1. Introduction In the urban environment, there are many impervious surfaces present, such as pavements and roads (Krein and Schorer, 2000), roofs of the buildings (Chang et al., 2004). Impervious surfaces in low-density areas cover up to 10% of the surface, whereas in some high-density urban areas they cover more than 80% of the surface (Kaye et al., 2006). As runoff water washes impervious surfaces, the enrichment of many pollutants takes in the water (Davis et al., 2001). Since runoff waters are often discharged into water bodies, they can affect the quality of surface waters (Go ¨bel et al., 2007). Roofing can be the nonpoint source of pollution (may be also treated as a set of point sources) with concentration of pollutants depending on the composition of rainwater, type (Chang et al., 2004) and age of the roof (Wallinder et al., 2001), inclination, location (Wallinder et al., 2000) and meteorological factors (Chang et al., 2004; Evans et al., 2006). Pollution may originate from precipitation, dry deposition, with strong influence of dry period duration length before precipitation. Also leaching of some compounds from roofing material may occur (Forster, 1999). The pollutants present in roof runoff waters are inorganic ions (Polkowska et al., 2002), metals (Heijerick et al., 2002), PAHs, PCBs, pesticides (Polkowska et al., 2000), hydrocarbons (Polkowska et al., 2002). The runoff quality is complex phenomenon and the concentration of pollutants depends on many factors. Analysis of roof runoff water samples can provide information about the state of atmosphere quality. During the dry period some atmospheric pollutants are deposited on the roof surface and are washed out by the precipitation. Since the analysis of roof runoff water samples gives information about quality of air during ante- cedent precipitation-free period, this is an approach to indirect monitoring of atmosphere quality. The previous runoff studies in the region of Gdansk including analytical determination of inorganic and organic pollutants proved that the roof runoff water is toxic (Polkowska et al., 2002). Other studies (Grynkiewicz et al., 2002; Polkowska et al., 2000) have shown that the main source of PAHs in the region is the use of coal stoves and that PAHs present in the precipitation water have concentration strongly depending on the sampling site location. Grynkiewicz et al., 2001 detected also pesticides in the runoff water (in ng dm 3 ) and Astel et al., 2004 made an attempt to interpret chemometrically many of the precipitation results using time series and principal component analysis. Although SOM is well-known approach in atmospheric chem- istry (Kolehmainen et al., 2000, 2001), it is has been relatively rarely used for interpretation of atmospheric monitoring data (Ambroise et al., 2000; Lu et al., 2006; Ersoy et al., 2007; Nishiyama * Corresponding author. Tel.: þ359 2 8161426. E-mail addresses: [email protected]fia.bg (S. Tsakovski), vsimeonov@ chem.uni-sofia.bg (V. Simeonov), [email protected] (J. Namie snik). Contents lists available at ScienceDirect Environmental Pollution journal homepage: www.elsevier.com/locate/envpol 0269-7491/$ – see front matter Ó 2009 Elsevier Ltd. All rights reserved. doi:10.1016/j.envpol.2009.07.037 Environmental Pollution 158 (2010) 84–91
Transcript of Chemical composition of water from roofs in Gdansk, Poland

lable at ScienceDirect
Environmental Pollution 158 (2010) 84–91
Contents lists avai
Environmental Pollution
journal homepage: www.elsevier .com/locate/envpol
Chemical composition of water from roofs in Gdansk, Poland
Stefan Tsakovski a,*, Marek Tobiszewski b, Vasil Simeonov c, _Zaneta Polkowska b, Jacek Namie�snik b
a Chair of Physical Chemistry, Faculty of Chemistry, University of Sofia, J Bourchier Blvd. 1, 1164 Sofia, Bulgariab Department of Analytical Chemistry, Chemical Faculty, Gdansk University of Technology (GUT), 11/12 G. Narutowicza St., 80-952 Gdansk, Polandc Chair of Analytical Chemistry, Faculty of Chemistry, University of Sofia, 1164 Sofia, Bulgaria
Identification of the urban roof runoff water quality factors and ‘‘roof
’’ impact by self-organizing map classification.a r t i c l e i n f o
Article history:Received 17 March 2009Received in revised form29 June 2009Accepted 28 July 2009
Keywords:Roof runoffChemical compositionSelf-organizing mapsPAHsPCBs
* Corresponding author. Tel.: þ359 2 8161426.E-mail addresses: [email protected]
chem.uni-sofia.bg (V. Simeonov), [email protected]
0269-7491/$ – see front matter � 2009 Elsevier Ltd.doi:10.1016/j.envpol.2009.07.037
a b s t r a c t
This study deals with the assessment of roof runoff waters from the region of Gdansk collected duringthe winter season (2007/2008). The chemical analysis includes 16 chemical variables: major ions, PAHsand PCBs measured at 3 sampling sites for 6–14 rain events. Although the data set is of limited volumethe statistical data treatment using self-organizing maps (SOM) reveals the main factors controlling roofrunoff water quality even for a data set with small dimension. This effort for explanation of the identifiedfactors by the possible emission sources of the urban environment and air-particulate formation seemsto be very reliable. Additionally to the roof runoff water quality factors the rain events patterns arefound: ‘‘background’’ group of events and groups formally named ‘‘PAHs’’, ‘‘PCBs’’ and ‘‘air-borneparticles’’ – dominated events. The SOM classification results give an opportunity to uncover the role ofroof ‘‘impact’’ on the runoff waters.
Rain runoff water quality is described by four latent factors and the ‘‘roof’’ impact is uncovered.� 2009 Elsevier Ltd. All rights reserved.
1. Introduction
In the urban environment, there are many impervious surfacespresent, such as pavements and roads (Krein and Schorer, 2000),roofs of the buildings (Chang et al., 2004). Impervious surfaces inlow-density areas cover up to 10% of the surface, whereas in somehigh-density urban areas they cover more than 80% of the surface(Kaye et al., 2006). As runoff water washes impervious surfaces, theenrichment of many pollutants takes in the water (Davis et al.,2001). Since runoff waters are often discharged into water bodies,they can affect the quality of surface waters (Gobel et al., 2007).
Roofing can be the nonpoint source of pollution (may be alsotreated as a set of point sources) with concentration of pollutantsdepending on the composition of rainwater, type (Chang et al.,2004) and age of the roof (Wallinder et al., 2001), inclination,location (Wallinder et al., 2000) and meteorological factors (Changet al., 2004; Evans et al., 2006). Pollution may originate fromprecipitation, dry deposition, with strong influence of dry periodduration length before precipitation. Also leaching of somecompounds from roofing material may occur (Forster, 1999).The pollutants present in roof runoff waters are inorganic ions
(S. Tsakovski), vsimeonov@l (J. Namie�snik).
All rights reserved.
(Polkowska et al., 2002), metals (Heijerick et al., 2002), PAHs, PCBs,pesticides (Polkowska et al., 2000), hydrocarbons (Polkowska et al.,2002). The runoff quality is complex phenomenon and theconcentration of pollutants depends on many factors.
Analysis of roof runoff water samples can provide informationabout the state of atmosphere quality. During the dry period someatmospheric pollutants are deposited on the roof surface and arewashed out by the precipitation. Since the analysis of roof runoffwater samples gives information about quality of air during ante-cedent precipitation-free period, this is an approach to indirectmonitoring of atmosphere quality.
The previous runoff studies in the region of Gdansk includinganalytical determination of inorganic and organic pollutantsproved that the roof runoff water is toxic (Polkowska et al., 2002).Other studies (Grynkiewicz et al., 2002; Polkowska et al., 2000)have shown that the main source of PAHs in the region is the use ofcoal stoves and that PAHs present in the precipitation water haveconcentration strongly depending on the sampling site location.Grynkiewicz et al., 2001 detected also pesticides in the runoff water(in ng dm�3) and Astel et al., 2004 made an attempt to interpretchemometrically many of the precipitation results using time seriesand principal component analysis.
Although SOM is well-known approach in atmospheric chem-istry (Kolehmainen et al., 2000, 2001), it is has been relativelyrarely used for interpretation of atmospheric monitoring data(Ambroise et al., 2000; Lu et al., 2006; Ersoy et al., 2007; Nishiyama

S. Tsakovski et al. / Environmental Pollution 158 (2010) 84–91 85
et al., 2007; Astel and Malek, 2008) and practically no records couldbe found for roof runoff water interpretation. That is why the aim ofthe present paper is to use the data exploratory potential of SOM inorder to assess the roof runoff water quality.
2. Experimental
2.1. Sampling site
The Gdansk city is located at the seashore of Baltic Sea near the mouth of VistulaRiver. The most frequent annual wind direction is west wind, however in wintereastern winds often blow. Gdansk is industrious city, the main areas of industriousactivities are shipping and shipbuilding, metallurgy, chemistry, food processing.There is also seaport that handles coal and crude oil loading. The city has somehighly urbanized areas and some high traffic density parts. Transport of some long-distance pollutants from distant sources also takes place. There are agriculturalactivities around the city and the highway in the neighborhood.
Fig. 1. Sampling l
Samples were collected from three roofs of the buildings situated in the suburbof Gdansk city (Fig. 1). They were buildings situated at the distance smaller than100 m of each other. Abbreviation ZN means zinc roof, CT1 and CT2 are two kinds ofceramic tile roofs. All three roofs are four years old, with similar inclination of 30� .The sampling sites represented non-industrious, low-density urban area, with someagricultural activity, located at the distance of 1 km from highway. Some uncon-trolled biomass burning takes place at the neighboring allotments, there were alsoconstruction sites around.
2.2. Sampling procedure
Thirty roof runoff water samples were collected from November 2007 toFebruary 2008. They were all collected during first flush event (within first 10 min ofevent). Collecting single sample was done by filling sampler with water running outof the end of the gutter. To avoid losses of analytes to headspace, samplers werefilled without bubble of air. Then samples were transported to the laboratory and
ocation map.
S. Tsakovski et al. / Environmental Pollution 158 (2010) 84–9186
stored prior to analysis in the temperature of 4 �C. To minimize the storage time theanalysis was performed at the day of sample collection or following day.
2.3. Analytical procedure
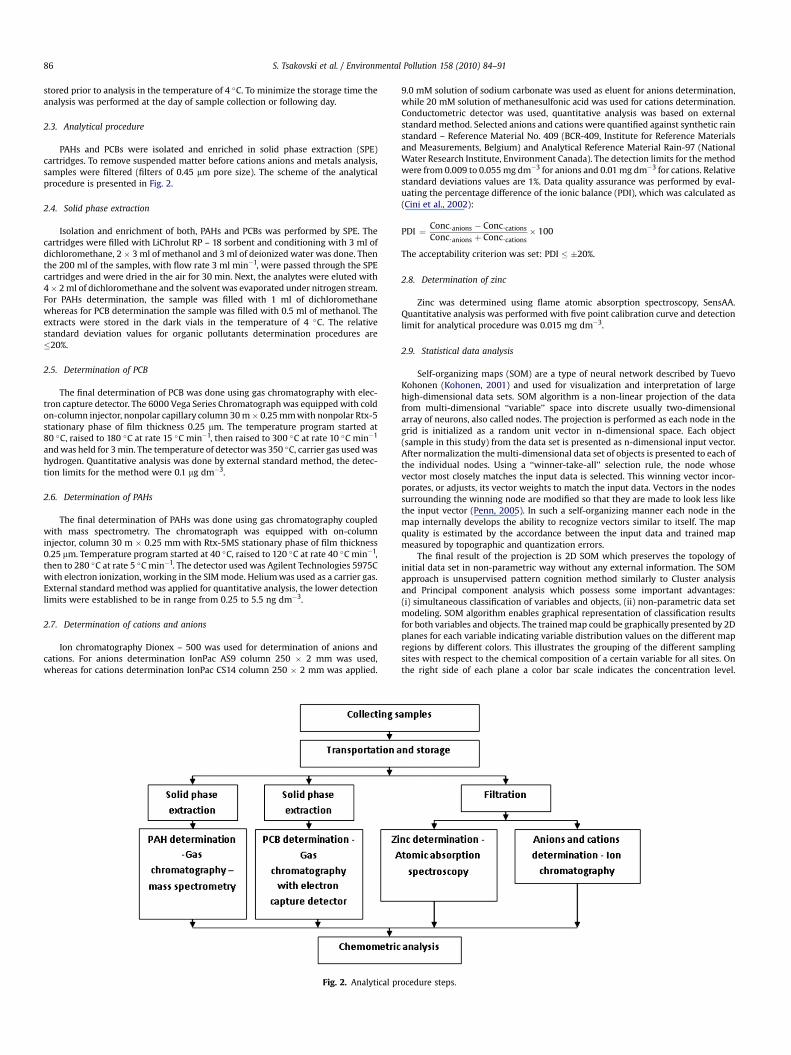
PAHs and PCBs were isolated and enriched in solid phase extraction (SPE)cartridges. To remove suspended matter before cations anions and metals analysis,samples were filtered (filters of 0.45 mm pore size). The scheme of the analyticalprocedure is presented in Fig. 2.
2.4. Solid phase extraction
Isolation and enrichment of both, PAHs and PCBs was performed by SPE. Thecartridges were filled with LiChrolut RP – 18 sorbent and conditioning with 3 ml ofdichloromethane, 2� 3 ml of methanol and 3 ml of deionized water was done. Thenthe 200 ml of the samples, with flow rate 3 ml min�1, were passed through the SPEcartridges and were dried in the air for 30 min. Next, the analytes were eluted with4� 2 ml of dichloromethane and the solvent was evaporated under nitrogen stream.For PAHs determination, the sample was filled with 1 ml of dichloromethanewhereas for PCB determination the sample was filled with 0.5 ml of methanol. Theextracts were stored in the dark vials in the temperature of 4 �C. The relativestandard deviation values for organic pollutants determination procedures are�20%.
2.5. Determination of PCB
The final determination of PCB was done using gas chromatography with elec-tron capture detector. The 6000 Vega Series Chromatograph was equipped with coldon-column injector, nonpolar capillary column 30 m� 0.25 mm with nonpolar Rtx-5stationary phase of film thickness 0.25 mm. The temperature program started at80 �C, raised to 180 �C at rate 15 �C min�1, then raised to 300 �C at rate 10 �C min�1
and was held for 3 min. The temperature of detector was 350 �C, carrier gas used washydrogen. Quantitative analysis was done by external standard method, the detec-tion limits for the method were 0.1 mg dm�3.
2.6. Determination of PAHs
The final determination of PAHs was done using gas chromatography coupledwith mass spectrometry. The chromatograph was equipped with on-columninjector, column 30 m � 0.25 mm with Rtx-5MS stationary phase of film thickness0.25 mm. Temperature program started at 40 �C, raised to 120 �C at rate 40 �C min�1,then to 280 �C at rate 5 �C min�1. The detector used was Agilent Technologies 5975Cwith electron ionization, working in the SIM mode. Helium was used as a carrier gas.External standard method was applied for quantitative analysis, the lower detectionlimits were established to be in range from 0.25 to 5.5 ng dm�3.
2.7. Determination of cations and anions
Ion chromatography Dionex – 500 was used for determination of anions andcations. For anions determination IonPac AS9 column 250 � 2 mm was used,whereas for cations determination IonPac CS14 column 250 � 2 mm was applied.
Fig. 2. Analytical pr
9.0 mM solution of sodium carbonate was used as eluent for anions determination,while 20 mM solution of methanesulfonic acid was used for cations determination.Conductometric detector was used, quantitative analysis was based on externalstandard method. Selected anions and cations were quantified against synthetic rainstandard – Reference Material No. 409 (BCR-409, Institute for Reference Materialsand Measurements, Belgium) and Analytical Reference Material Rain-97 (NationalWater Research Institute, Environment Canada). The detection limits for the methodwere from 0.009 to 0.055 mg dm�3 for anions and 0.01 mg dm�3 for cations. Relativestandard deviations values are 1%. Data quality assurance was performed by eval-uating the percentage difference of the ionic balance (PDI), which was calculated as(Cini et al., 2002):
PDI ¼ Conc:anions � Conc:cations
Conc:anions þ Conc:cations� 100
The acceptability criterion was set: PDI � �20%.
2.8. Determination of zinc
Zinc was determined using flame atomic absorption spectroscopy, SensAA.Quantitative analysis was performed with five point calibration curve and detectionlimit for analytical procedure was 0.015 mg dm�3.
2.9. Statistical data analysis
Self-organizing maps (SOM) are a type of neural network described by TuevoKohonen (Kohonen, 2001) and used for visualization and interpretation of largehigh-dimensional data sets. SOM algorithm is a non-linear projection of the datafrom multi-dimensional ‘‘variable’’ space into discrete usually two-dimensionalarray of neurons, also called nodes. The projection is performed as each node in thegrid is initialized as a random unit vector in n-dimensional space. Each object(sample in this study) from the data set is presented as n-dimensional input vector.After normalization the multi-dimensional data set of objects is presented to each ofthe individual nodes. Using a ‘‘winner-take-all’’ selection rule, the node whosevector most closely matches the input data is selected. This winning vector incor-porates, or adjusts, its vector weights to match the input data. Vectors in the nodessurrounding the winning node are modified so that they are made to look less likethe input vector (Penn, 2005). In such a self-organizing manner each node in themap internally develops the ability to recognize vectors similar to itself. The mapquality is estimated by the accordance between the input data and trained mapmeasured by topographic and quantization errors.
The final result of the projection is 2D SOM which preserves the topology ofinitial data set in non-parametric way without any external information. The SOMapproach is unsupervised pattern cognition method similarly to Cluster analysisand Principal component analysis which possess some important advantages:(i) simultaneous classification of variables and objects, (ii) non-parametric data setmodeling. SOM algorithm enables graphical representation of classification resultsfor both variables and objects. The trained map could be graphically presented by 2Dplanes for each variable indicating variable distribution values on the different mapregions by different colors. This illustrates the grouping of the different samplingsites with respect to the chemical composition of a certain variable for all sites. Onthe right side of each plane a color bar scale indicates the concentration level.
ocedure steps.

S. Tsakovski et al. / Environmental Pollution 158 (2010) 84–91 87
Additionally the nodes, respectively the objects attracted by them, could be clus-tered by non-hierarchical K-means classification algorithm. The SOM classificationgives one more useful output, namely U matrix plane. It visualizes distancesbetween the nodes in the grid and helps to identify above mentioned clusterstructure of the map. The high values in the U-matrix plane indicate a cluster borderand areas of low values indicate clusters themselves. The details about SOMimplementation are thoroughly described elsewhere (Vesanto, 2000).
All calculations concerning SOM classification were performed by a free TeuvoKohonen toolbox (SOM Toolbox 2.0), which can be downloaded together withdocumentation (Vesanto et al., 2000) from http://www.cis.hut.fi/projects/somtoolbox/. Matlab 6.5 software as an environment was used. The statisticaltests were performed by the use of software package STATISTICA 6.0.
3. Results and discussion
The basic statistics of the data set (30 samples � 16 chemicalvariables) for all sampling sites is shown in Table 1.
Chemical variables with analytical concentration below the LODwere treated as presented in concentrations LOD/2 (nearly 10%).Since the detection frequency is higher then 80% the simplesubstitution is done according to (Gibbons and Coleman, 2001). Thedata set was normalized across the variable in order to be used forSOM calculation.
In Fig. 3 the U-matrix and all chemical variable planes for inputdata set are shown. Using color scale the distribution of each vari-able on the SOM map and distances between nodes in U-matrixplane could be easily found. For example, the samples with highPAHs (except ACY) contents are located in the upper left part of theSOM plane; the samples with high PCB 180 content are located inthe down left part of the map while samples rich in nitrates andsulphates are placed dominantly in the upper right part of the plane.
The ordering of the component planes (Fig. 4) shows four well-defined groups of variables. The first group includes PAHs – phen-anthrene, fluoranthene, chryzene, benzo[a]anthracene and pyrene.Members of this group are anthropogenic pollutants originatingmainly from combustion processes. Their possible sources could beprocesses of incomplete biomass combustion (Dunbara et al., 2001),coke ovens burning, diesel, and gasoline engine fuels (Khalili et al.,1995). Additional PAHs sources are oil leakages, tyre and asphaltwearing (Zhang et al., 2008). The second group reveals a typicalconnection between sulphates and nitrates, which is a result offormation of secondary aerosols. The secondary pollutantsformation comes from NOx and SO2 emissions, which originatefrom local traffic, industry activities and long-range transport.High similarity between zinc and calcium (the third group) could
Table 1Basis statistics and acronyms of chemical variables.
Compound Acronym Units CT1 (n ¼ 14)
Med Min Max
Zinc Zn mg dm�3 0.066 0.008 0.1Chlorides Cl 1.31 0.36 5.6Nitrates NO3 1.565 0.08 4.7Sulphates SO4 1.33 0.31 3.2Sodium Na 0.62 0.04 3.4Ammonium NH4 0.85 0.01 1.8Potassium K 0.14 0.01 0.2Calcium Ca 0.31 0.005 0.9
Acenaphtylene ACY ng dm�3 7.9 1.3 22.9Phenanthrene PHE 86 30 216Fluoranthene FLO 49 19 256Pyrene PYR 37 15 206Benzo[a]anthracene BaA 3.4 1.3 62Chryzene CHR 13.4 1.4 112.5
PCB 52 PCB 52 mg dm�3 320 10 2411PCB 180 PCB 180 107 10 269
Note: Chemical variables with analytical concentration below the LOD were treated as p
come from road and erosion dusts. Very high similarity in sodiumand chlorides forms the fourth group, obviously originating fromsea sprays and secondary emission from de-icing agents. The closeproximity of the ‘‘salt’’ group (Naþ, Cl�) and the ‘‘dust’’ group(Ca2þ, Zn) is an evidence for a common source – probably air-borne particles. Acenaphthylene, ammonium, potassium, PCB 52and PCB 180 have a specific ordering position in the componentplane plot probably due to their complex origin engaging variety ofsources. Usually, the emission of ammonia (ammonium precursor),is related to agricultural activities. The position of the ammonium(outside of the ‘‘secondary aerosol’’ group) is an indication for thelocal origin of the ammonium emissions. The agricultural activityand wood (biomass) burning seem to be the reasons for thespecific disposition of potassium on the components plane. Thedisposition of acenaphthylene (away from well-defined group ofPAHs) could be sought in its different emission profile dominatedby wood combustion. It could be concluded that in some extentthe position of all three variables is related to agriculture activities.The positions of PCB 52 and 180 is an evidence for the existence ofsources different from those discussed above. PCBs are releasedmainly from PCBs containing products used in the industry and inthe industrial combustion processes. It should be mentioned thatthe correlation between Kþ and PCB 180 is negative, so differentorigin of these pollutants is expected.
The similarity/dissimilarity between the samples (samplingevents) will be discussed in two directions. Firstly, the chemicalcomposition of the roof runoff waters will be discussed and secondly,the ‘‘impact’’ of the different roof patterns will be emphasized.
This interpretation was performed by classification of samplesaccording to their position on the map (Fig. 5). For SOM classifi-cation of samples five-cluster optimal configuration was chosenaccording to the lowest Davies-Bouldin index value (Fig. 5) (Daviesand Bouldin, 1979). Detailed analysis of each cluster could be donewhen the input data are compared. A reasonable interpretation ofthe clusters obtained was based also on the mean values of thechemical variables for each one of the clusters (Fig. 6) and thestatistically significant differences between them (Table 2).
Cluster 1 includes 3 samples with the highest PAHs concen-trations and relatively high concentrations of inorganic species. It iseasily seen (Fig. 5) that two of the samples belonging to this clustermark the rain event of 08.01 as ‘‘PAHs polluted’’. Cluster 2 consistsof 4 samples that are characterized by the highest concentration ofpotassium. All other pollutants have moderate levels. It may be
ZN (n ¼ 10) CT2 (n ¼ 6)
Med Min Max Med Min Max
14 0.112 0.008 0.529 0.038 0.008 0.1771.13 0.43 6.32 1.45 0.53 2.76
8 1.29 0.05 5.94 1.14 0.007 5.182 1.29 0.31 4.04 1.04 0.21 5.634 0.46 0.27 2.64 0.46 0.29 0.838 0.64 0.23 2.08 0.85 0.44 2.39 0.15 0.03 0.35 0.1 0.05 0.26 0.435 0.005 1.48 0.005 0.005 0.79
9.5 1.3 44.8 6.9 3.5 36.189 28 240 90 43 13264 28 210 54 21 31355 18 143 40 17 162
3.5 1.3 40.2 1.4 1.3 2311.6 1.4 63 7.9 1.4 40.3
196 10 622 205 77 46375 10 262 96 38 185
resenting in concentrations LOD/2.

Fig. 3. Visualization of the distribution of chemical variables.
S. Tsakovski et al. / Environmental Pollution 158 (2010) 84–9188
concluded that the samples belonging to this cluster representa ‘‘moderate pollution’’ pattern caused by combustion processesdominantly emitting PAHs and potassium. In the third cluster zinc,chlorides, nitrates, sulphates, sodium, ammonium and calciumconcentrations have their highest levels. It seems that the 7samples belonging to this cluster are seriously affected by air-borneparticles formed by the interactions between ‘‘dust’’, ‘‘salt’’ and‘‘secondary aerosol’’ emissions. The rain water samples at samplinglocations CT1 and ZN on 22.11 determine this rain event as ‘‘air-borne-particles polluted’’. The fourth cluster consists of 7 sampleswhich are characterized by the highest PCBs contents, followedrespectively by PAHs and inorganic pollutants concentration levels.The cluster represents a PCBs pollution pattern caused mainly bythe industrial utility of PCBs containing products. It seems that theimpact of burning processes to the samples belonging to this
Fig. 4. Classification of
cluster is negligible because of the lower concentrations of PAHs.The fifth cluster incorporates one third of the samples (10 out of30). The cluster is characterized by low values of all chemicalvariables and could be treated as ‘‘unpolluted’’ pattern presentingthe background level for the region under investigation. In thissense the rain events on 13.11 and 25.01 could be treated asunpolluted.
A closer look to the position of the samples on the hit diagramsgives an idea about the role of roof pattern (specificity) on the rainwater chemistry. Different locations of samples at differentsampling sites for one and the same event could be an indication for‘‘roof’’ impact. If the sampling events are close on the map then noroof runoff impact should be considered. The events of 29.11, 02.12and 26.11 could not be taken into consideration since they weremonitored only at station CT1.
chemical variables.

Fig. 5. SOM clustering of samples and sampling station hit diagrams.
Fig. 6. Cluster mean values of chemical variables.
S. Tsakovski et al. / Environmental Pollution 158 (2010) 84–91 89

Table 2Statistical assessment of differences between cluster mean values of variables (statistical level of significance lower than p < 0.01 was marked as ‘‘þþ’’, while lower thanp < 0.05 as ‘‘þ’’).
Variables Mean values K–W test Mann–Whitney U test
1 2 3 4 5 1–2 1–3 1–4 1–5 2–3 2–4 2–5 3–4 3–5 4–5
Zn 0.05 0.09 0.25 0.05 0.06 þ þCl 1.58 1.49 3.28 0.82 1.67 þ þ þNO3 2.41 1.71 4.11 0.93 1.13 þ þ þ þSO4 1.88 1.26 3.11 0.93 1.08 þ þ þ þNa 0.46 0.74 1.56 0.41 0.56NH4 1.23 0.72 1.43 0.54 0.66 þ þK 0.1 0.24 0.17 0.1 0.13 þCa 0.38 0.23 0.85 0.16 0.31 þ þ þ þAcenaphtylene 17.26 13.07 16.89 13.02 4.29 þ þ þPhenantrene 221.54 129.27 73.98 103.45 52.57 þþ þ þ þ þ þ þ þfluorantene 238.71 156.73 84.72 60.16 32.07 þþ þ þ þ þ þ þ þPyrene 180.64 95.64 69.06 45.41 25.94 þþ þ þ þ þ þ þ þBenzo[a]anthracene 52.20 13.21 7.67 3.14 2.3 þ þ þ þ þ þChryzene 86.42 22.74 16.13 8.54 4.96 þ þ þ þ þ þ þ þPCB 52 352.96 177.15 191.92 661.5 453.69PCB 180 137.13 70.82 63.31 201.94 84.65 þ þ þ þ
Note: K–W test means Kruskal–Wallis test.
S. Tsakovski et al. / Environmental Pollution 158 (2010) 84–9190
Except the above mentioned events where all samples repre-senting a certain event are in one and the same cluster the samplesof some events are located in different clusters but close on theclassification map. Such kinds of events are 07.11, 15.11, 17.11, 27.11and 24.01. These events represent mainly wet and dry precipitationrather than a specific roof runoff.
The event of 23.11 at station CT1 is in the first cluster, while thesamples from ZN and CT2 are placed in the third cluster. Thediscriminators for this separation are all PAHs except acenaph-thylene. The higher PAHs concentrations in CT1, as compared to theother sampling stations, can be explained by the presence ofa chimney on the CT1 roof. The samples presenting rain event of31.12 are placed in three different clusters – CT1 in the fifth cluster,ZN in the second cluster and CT2 in the fourth cluster. Again, PAHsconcentrations discriminate samples locations connected with thisevent. The reason for different PAHs contents could be found in thetwo weeks of dry period before the precipitation event. This situ-ation may give information about the adsorption capability of theroofs. The particles rich in PAHs tend to be adsorbed on the roofingmaterials in the following order: zinc sheeting > ceramic tile2 > ceramic tile 1. Ceramic tile 1 is smoother than ceramic tile 2, soPAHs tend to be slightly more adsorbed on the second ceramic tile.
4. Conclusions
The roof runoff water quality assessment carried out by SOMindicated that the relatively small monitored data should be esti-mated in multivariate way in order to reveal the factors controllingatmospheric pollution. Thus, combustion, road dust, secondary andsalt aerosol formation were outlined as main pollution sources forregion of Gdansk during winter. Clustering results resemble thebackground pattern of the events and also some polluted patternsrelated to ‘‘PAHs’’, ‘‘PCBs’’ and ‘‘air-borne particles’’. The simulta-neous consideration of chemical variables and samples classifica-tions gives not only the relation between main pollution sourcesand events but also reveals the roof ‘‘impact’’ on the roof runoffwater quality.
References
Ambroise, C., Seze, G., Badran, F., Thiria, S., 2000. Hierarchical clustering of self-organizing maps for cloud classification. Neurocomputing 30, 47–52.
Astel, A., Mazerski, J., Polkowska, _Z., Namie�snik, J., 2004. Application of PCA andtime series analysis in studies of precipitation in Tricity (Poland). Advances inEnvironmental Research 8, 337–349.
Astel, A., Malek, S., 2008. Multivariate modeling and classification of environmentaln-way data from bulk precipitation quality control. Journal of. Chemometrics22, 738–746.
Chang, M., McBroom, M.W., Beasley, R.S., 2004. Roofing as a source of nonpointwater pollution. Journal of Environmental Management 73, 307–315.
Cini, R., Prodi, F., Santachiara, G., Porcu, F., Bellandi, S., Stortini, A.M., Oppo, C.,Udisti, R., Pantani, F., 2002. Chemical characterization of cloud episodes ata ridge in Tuscan Appenines, Italy. Atmospheric Research 61, 311–334.
Davies, D.L., Bouldin, D.W., 1979. A cluster separation measure. Proceeding of theIEEE Transactions on Pattern Recognition and Machine Intelligence 1,224–227.
Davis, A.P., Shokouhian, M., Ni, S., 2001. Loading estimates of lead, copper,cadmium and zinc in urban runoff from specific sources. Chemosphere 44,997–1009.
Dunbara, J., Lina, C., Verguchta, I., Wonga, J., Durant, J.L., 2001. Estimating thecontributions of mobile sources of PAHs to urban air using real-time PAHsmonitoring. Science of the Total Environment 279, 1–19.
Ersoy, O., Aydar, E., Gourgaud, A., Artuner, H., Bayhan, H., 2007. Clustering ofvolcanic ash arising from different fragmentation mechanisms using Kohonenself-organizing maps. Computers and Geosciences 33, 821–828.
Evans, C.A., Coombes, P.J., Dunstan, R.H., 2006. Wind, rain and bacteria: the effect ofweather on the microbial composition of roof-harvested rainwater. WaterResources 40, 37–44.
Forster, J., 1999. Variability of roof runoff quality. Water Science and Technology 39,137–144.
Gibbons, R.D., Coleman, D.E., 2001. Statistical Methods for Detection and Quantifi-cation of Environmental Contamination. John Willey & Sons, New York, p. 139.
Gobel, P., Dierkes, C., Coldewey, W.G., 2007. Storm water runoff concentrationmatrix for urban areas. Journal of Contamination and Hydrology 91, 26–42.
Grynkiewicz, M., Polkowska, _Z., Gorecki, T., Namie�snik, J., 2001. Pesticides inprecipitation in the Gdansk region (Poland). Chemosphere 43, 303–312.
Grynkiewicz, M., Polkowska, _Z., Namie�snik, J., 2002. Determination of polycyclicaromatic hydrocarbons in bulk precipitation and runoff waters in an urbanregion (Poland). Atmospheric Environment 36, 361–369.
Heijerick, D.G., Janssen, C.R., Karlen, C., Wallinder, I.O., Leygraf, C., 2002.Bioavailability of zinc in runoff water from roofing materials. Chemosphere 47,1073–1080.
Kaye, J., Groffman, P., Grimm, N., Baker, L., Pouyat, R., 2006. A distinct urbanbiogeochemistry? Trends in Ecology and Evolution 21, 192–199.
Khalili, N., Scheff, P., Holsen, T., 1995. PAH source fingerprints for coke ovens, dieseland gasoline engines, highway tunnels and wood combustion emissions.Atmospheric Environment 29, 533–542.
Kohonen, T., 2001. Self-organizing Maps, third ed.. Springer, Berlin.Kolehmainen, M., Martikainen, H., Hiltunen, T., Ruuskanen, J., 2000. Forecasting air
quality using hybrid neural network modelling. Environmental Monitoring andAssessment 65, 277–286.
Kolehmainen, M., Martikainen, H., Ruuskanen, J., 2001. Neural networks and peri-odic components used in air quality forecasting. Atmospheric Environment 35,815–825.
Krein, A., Schorer, M., 2000. Road runoff pollution by polycyclic aromatichydrocarbons and its contributuin to river sediments. Water Resources 34,4110–4115.
Lu, H., Chang, C., Hsieh, J., 2006. Classification of PM10 distributions in Taiwan.Atmospheric Environment 40, 1452–1463.
Nishiyama, K., Endo, S., Jinno, K., Bertacchi, U.C., Olsson, J., Berndtsson, R.,2007. Identification of typical synoptic patterns causing heavy rainfall inthe rainy season in Japan by a self-organizing map. Atmospheric Research83, 185–200.

S. Tsakovski et al. / Environmental Pollution 158 (2010) 84–91 91
Penn, B.S., 2005. Using self-organizing maps to visualize high-dimensional data.Computers and Geoscience 31, 531–544.
Polkowska, _Z., Kot, A., Wiergowski, M., Wolska, L., Wo1owska, K., Namie�snik, J.,2000. Organic pollutants in precipitation: determination of pesticides andpolycyclic aromatic hydrocarbons in Gdansk, Poland. Atmospheric Environment34, 1233–1245.
Polkowska, _Z., Gorecki, T., Namie�snik, J., 2002. Quality of roof runoff waters from anurban region (Gdansk, Poland). Chemosphere 49, 1275–1283.
Vesanto, J., 2000. Neural network tool data mining: SOM toolbox. In: Proceedings ofSymposium on Tool Environments and Development Methods for IntelligentSystems (TOOL-MET2000), Oulun yliopistopaino, Finland, Oulu, pp. 184–196.
Vesanto, J., Himberg, J., Alhoniemi, E., Parhankagas, J., 2000. SOM Toolbox for Matlab5 Report A57, visited 03.12.2008. http://www.cis.hut.fi/projects/somtoolbox/.
Wallinder, I.O., Verbiest, P., He, W., Leygraf, C., 2000. Effects of exposure directionand inclination on the runoff rates of zinc and copper roofs. Corrosion Science42, 1471–1487.
Wallinder, I.O., Leygraf, C., Karlen, C., Heijerick, D., Janssen, C.R., 2001. Atmosphericcorrosion of zinc based materials: runoff rates, chemical speciation andecotoxicity effects. Corrosion Science 43, 809–816.
Zhang, W., Zhang, S., Wan, C., Yue, D., Ye, Y., Wang, X., 2008. Source diagnostics ofpolycyclic aromatic hydrocarbons in urban road runoff, dust, rain and canopythroughfall. Environmental Pollution 153, 594–601.