Charger-Surfing: Exploiting a Power Line Side ... - USENIX
18
Charger-Surfing: Exploiting a Power Line Side-Channel for Smartphone Information Leakage Patrick Cronin University of Delaware [email protected] Xing Gao University of Delaware [email protected] Chengmo Yang University of Delaware [email protected] Haining Wang Virginia Tech [email protected] Abstract Touchscreen-based mobile devices such as smartphones and tablets are used daily by billions of people for productivity and entertainment. This paper uncovers a new security threat posed by a side-channel leakage through the power line, called Charger-Surfing, which targets these touchscreen devices. We reveal that while a smartphone is charging, its power trace, which can be measured via the USB charging cable, leaks information about the dynamic content on its screen. This information can be utilized to determine the location on the touchscreen where an animation is played by the mobile OS to indicate, for instance, that a button press has been regis- tered. We develop a portable, low cost power trace collection system for the side-channel construction. This leakage chan- nel is thoroughly evaluated on various smartphones running Android or iOS, equipped with the two most commonly used screen technologies (LCD and OLED). We validate the ef- fectiveness of Charger-Surfing by conducting a case study on a passcode unlock screen. Our experiments show that an adversary can exploit Charger-Surfing across a wide range of smartphone models to achieve an average accuracy of 98.7% for single button inference, and an average of 95.1% or 92.8% accuracy on the first attempt when cracking a victim’s 4-digit or 6-digit passcode, respectively. The inference accuracy in- creases to 99.3% (4-digit) or 96.9% (6-digit) within five trials. We further demonstrate the robustness of Charger-Surfing in realistic settings and discuss countermeasures against it. 1 Introduction Touchscreen devices such as smartphones and tablets have become a daily tool for a variety of business and entertainment activities, including mailing, banking, browsing, gaming, and photography. While these devices have ushered in an era of great convenience, their rich functionality has lead to ever- increasing usage, draining batteries faster, and necessitating that users seek out areas to charge their smartphones. One study suggests that city dwellers charge their phones multi- ple times per day [6]. To allow users to conveniently charge their devices, facilities such as USB power lines and charging stations have been widely deployed in public areas, including airports [10], parks [2, 11], hotels [3], and hospitals [1]. The market for shareable power banks is also thriving [7], allow- ing users to simply scan a QR code to rent a public power bank and charge their devices. Despite their convenience, USB charging interfaces and stations also introduce a number of security threats, as the USB interface in a public area is not under the user’s con- trol [8]. A typical USB interface is composed of one or more (depending on the protocol) differential data lines for data transmission and a 5V and ground line for delivering power. Previously it has been demonstrated that the data transmitted over the data line can be sniffed [45] or monitored through the crosstalk leakage on the power line [54]. Adversaries can also extract power consumption information from the power line to infer coarse-grained information, such as internet browsing history [25] or password length [65]. These disclosed secu- rity threats, however, do not stop users from heavily utilizing USB charging facilities in public areas, since charging usually involves no data transfer over the USB data line. In this work, we reveal that USB charging in public areas can pose far more serious threats than previously believed. We show, for the first time, that the signals on the power line form a side channel and leak far more fine-grained information than previously believed. Specifically, the power consump- tion information is highly correlated with the activities on the touchscreen. Leveraging this side channel, built on the dynamic power signals, adversaries can precisely identify the location of virtual button presses on the touchscreen, with which they can steal extremely sensitive data such as a user’s passcode. We call this security threat Charger-Surfing. We conduct a series of experiments to demonstrate the existence of fine-grained information leakage tied to smartphone touch- screen activity. For the construction of the Charger-Surfing channel, we develop a wireless, low cost, and portable power trace capture system using commercial-off-the-shelf (COTS) hardware. To further demonstrate that Charger-Surfing is a real threat, we perform a case study on a numeric passcode un- lock screen and show that Charger-Surfing is able to extract a
-
Upload
khangminh22 -
Category
Documents
-
view
5 -
download
0
Transcript of Charger-Surfing: Exploiting a Power Line Side ... - USENIX

Charger-Surfing: Exploiting a Power Line Side-Channel for Smartphone
Information Leakage
Patrick CroninUniversity of Delaware
Xing GaoUniversity of Delaware
Chengmo YangUniversity of Delaware
Haining WangVirginia Tech
Abstract
Touchscreen-based mobile devices such as smartphones andtablets are used daily by billions of people for productivityand entertainment. This paper uncovers a new security threatposed by a side-channel leakage through the power line, calledCharger-Surfing, which targets these touchscreen devices. Wereveal that while a smartphone is charging, its power trace,which can be measured via the USB charging cable, leaksinformation about the dynamic content on its screen. Thisinformation can be utilized to determine the location on thetouchscreen where an animation is played by the mobile OSto indicate, for instance, that a button press has been regis-tered. We develop a portable, low cost power trace collectionsystem for the side-channel construction. This leakage chan-nel is thoroughly evaluated on various smartphones runningAndroid or iOS, equipped with the two most commonly usedscreen technologies (LCD and OLED). We validate the ef-fectiveness of Charger-Surfing by conducting a case studyon a passcode unlock screen. Our experiments show that anadversary can exploit Charger-Surfing across a wide range ofsmartphone models to achieve an average accuracy of 98.7%for single button inference, and an average of 95.1% or 92.8%accuracy on the first attempt when cracking a victim’s 4-digitor 6-digit passcode, respectively. The inference accuracy in-creases to 99.3% (4-digit) or 96.9% (6-digit) within five trials.We further demonstrate the robustness of Charger-Surfing inrealistic settings and discuss countermeasures against it.
1 Introduction
Touchscreen devices such as smartphones and tablets havebecome a daily tool for a variety of business and entertainmentactivities, including mailing, banking, browsing, gaming, andphotography. While these devices have ushered in an era ofgreat convenience, their rich functionality has lead to ever-increasing usage, draining batteries faster, and necessitatingthat users seek out areas to charge their smartphones. Onestudy suggests that city dwellers charge their phones multi-ple times per day [6]. To allow users to conveniently chargetheir devices, facilities such as USB power lines and charging
stations have been widely deployed in public areas, includingairports [10], parks [2, 11], hotels [3], and hospitals [1]. Themarket for shareable power banks is also thriving [7], allow-ing users to simply scan a QR code to rent a public powerbank and charge their devices.
Despite their convenience, USB charging interfaces andstations also introduce a number of security threats, as theUSB interface in a public area is not under the user’s con-trol [8]. A typical USB interface is composed of one or more(depending on the protocol) differential data lines for datatransmission and a 5V and ground line for delivering power.Previously it has been demonstrated that the data transmittedover the data line can be sniffed [45] or monitored through thecrosstalk leakage on the power line [54]. Adversaries can alsoextract power consumption information from the power lineto infer coarse-grained information, such as internet browsinghistory [25] or password length [65]. These disclosed secu-rity threats, however, do not stop users from heavily utilizingUSB charging facilities in public areas, since charging usuallyinvolves no data transfer over the USB data line.
In this work, we reveal that USB charging in public areascan pose far more serious threats than previously believed. Weshow, for the first time, that the signals on the power line forma side channel and leak far more fine-grained informationthan previously believed. Specifically, the power consump-tion information is highly correlated with the activities onthe touchscreen. Leveraging this side channel, built on thedynamic power signals, adversaries can precisely identify thelocation of virtual button presses on the touchscreen, withwhich they can steal extremely sensitive data such as a user’spasscode. We call this security threat Charger-Surfing. Weconduct a series of experiments to demonstrate the existenceof fine-grained information leakage tied to smartphone touch-screen activity. For the construction of the Charger-Surfingchannel, we develop a wireless, low cost, and portable powertrace capture system using commercial-off-the-shelf (COTS)hardware. To further demonstrate that Charger-Surfing is areal threat, we perform a case study on a numeric passcode un-lock screen and show that Charger-Surfing is able to extract a

passcode on both Android and iOS devices by leveraging sig-nal processing and neural network techniques. We thoroughlyassess this security threat on different types of smartphones,multiple phones of the same model, and across different users.Our results show that Charger-Surfing can achieve an aver-age accuracy of 98.7% for single button inference on all thetested smartphones. For an unknown user1, Charger-Surfinghas, on average, a 95.1% or 92.8% chance to accurately cracka 4-digit or 6-digit passcode on its first attempt, respectively,and a 99.3% (4-digit) or 96.9% (6-digit) success rate withinfive trials.
In a nutshell, this is the first work that demonstrates fine-grained information leakage over the power line of the USBcharging cable regarding the content of the touchscreen. Moreimportantly, our studies show that the effectiveness of Charger-Surfing is victim-independent, meaning that adversaries cantrain the neural network using touchscreen data on their ownsmartphones with different configurations without any priorknowledge of a victim. The major contributions of this workinclude:
• A comprehensive study on the dynamic power usage ofthe touchscreen to demonstrate the location, causes, andgranularity of information leakage over the USB powerline. To the best of our knowledge, this is the first work toexplore the classification of dynamic screen animationsand induced information leakage.
• A new security threat, Charger-Surfing, which exploits aside channel through the USB power line to infer userinteractions with the content on the touchscreen. Thetechniques used by Charger-Surfing for signal processingand model learning are given.
• A portable microcontroller-based power trace capturesystem using COTS hardware, which demonstrates thefeasibility of exploiting the disclosed leakage channel ata low cost.
• A thorough evaluation on multiple smartphones, show-ing high accuracy in inferring a victim’s private informa-tion, such as their passcode, without any prior knowledgeof the victim, and that this leakage vulnerability is nottied to a specific smartphone or mobile OS.
The rest of this paper is organized as follows. Section 2presents our threat model and a brief primer on USB charging,touchscreen technology, and touchscreen animations. Theexistence of fine-grained information leakage over the USBpower line is demonstrated in Section 3. The security threatposed by Charger-Surfing is detailed in Section 4, followedby an in-depth case study in Section 5. Section 6 discussesthe attack practicality of Charger-Surfing. Section 7 describes
1To show the effectiveness of Charger-Surfing, the model of a targetdevice is trained with the data created by an adversary and tested with victimusers whose data were not used to train the model.
countermeasures against Charger-Surfing. Section 8 surveysrelated work, and finally, Section 9 concludes the paper.
2 Threat Model and Background
This section first presents the threat model, and then dis-cusses the various components of a smart device involved inthe new side channel, including (1) USB charging, (2) touch-screen technology, focusing on the dynamic power consumedwhen displaying different colors, and (3) the dynamic contentof the touchscreen that could be potentially leaked.
2.1 Threat Model
The objective of this work is to highlight the vulnerabilitiesof the power line side-channel in smartphones which, if ex-ploited, can lead to serious information leakage. We considera realistic scenario in public places, where users charge theirsmartphones with a USB charger that is not owned/controlledby themselves. The USB charger could be a charging sta-tion in a public area, such as airports (Figure 1a), or simplyan interface where users bring their own USB cables (Fig-ure 1b). It could also be a shareable power bank rented froma third-party (Figure 1c), or the USB outlets provided in ahotel (Figure 1d). The USB charger provides the standardfunctionality (i.e., charging) and looks ordinary.
However, since these chargers are controlled by third-parties, the power consumption of the connected device couldbe monitored by a device hidden inside the packaging or be-hind the charging interface. The voltage monitor would notcause any adverse impact to the charging speed, and wouldthus be quite stealthy. With a low power microcontroller con-cealed inside the packaging, power traces can be recorded, orstreamed wirelessly, for analysis.
Finally, we assume that adversaries have no prior knowl-edge of a specific victim, and have no need or have never hadthe chance to collect the power trace of the victim’s smart-phone. However, we assume that adversaries can easily profilethe power dynamics of most popular smartphone models be-forehand, enabling them to attack a wide range of smartphoneusers.
Security Threats Posed by Leakage. We observe that thedynamic power trace of a smartphone is highly correlatedto the animation played on the touchscreen. Unfortunately,leaking the animations played on the touchscreen could causesevere security threats. The owner of such a specialized “surf-ing” charger can steal a victim’s private data entered throughthe touchscreen, such as passcode, credit card number, andbanking information. To expose such threats, we demonstrateCharger-Surfing’s capability in inferring a numeric passcode.
While there are a myriad of potential biometric lock mecha-nisms available (fingerprints, faceID, etc.), many of these canbe deceived [5, 9] and require a backup PIN (personal identi-fication number) code if they are unavailable (gloves, sweat,etc.). Other authentication mechanisms such as Android’s

pattern-based lock are not available on all phones and havebeen shown to be less secure than a PIN code [12]. Thus, wefocus on the passcode-based lock as it is the most widely usedprimary or secondary authentication mechanism to unlocktouchscreen devices, and it acts as one of the only barriers togain complete control of a smartphone.
A passcode is extremely valuable to a dedicated adversary.When a victim can be easily identified (e.g., using a USBport at a hotel room), knowledge of the passcode would besufficient for an adversary with physical access (e.g., evil
maid attack [4]) to the victim’s smartphone to steal privateinformation or even reset other online passwords (e.g., AppleID and iCloud passwords). Even for an adversary withoutphysical access (e.g., a shareable power bank), a compromisedpasscode could still lead to severe consequences, as userstend to reuse their passcodes (recent studies show that eachpasscode is reused around 5 times [31]) and a smartphone’spasscode may be reused as the PIN code of a credit/debitcard or online payment system (e.g., Apple Pay or Alipay).Overall, there are many possible real scenarios, where thistype of information would be very useful to law enforcementor an adversary for espionage, fraud, identity theft, etc.
2.2 USB Charging
USB has become a standard interface for charging portabledevices such as smartphones, while enabling serial commu-nications at the same time. Standard USB plugs contain fourpins and a shield: one pin delivers +5VDC [51], one pinconnects to the shield forming the ground, while the othertwo pins are used for differential data transmission and carrynegligible current when charging the battery. Newer USBprotocols include more differential data pairs, but leave the+5VDC and ground pins the same. When charging a device,its battery enters the charging state, and the device’s poweris supplied not from the battery but from the power sourceconnected by the USB power line.
2.3 LCD/OLED Touchscreen Technology
The two major touchscreen technologies are Liquid Crys-tal Display (LCD) and Organic Light Emitting Diodes(OLED). Both technologies have many improvements orextensions, such as Active-Matrix Organic Light-EmittingDiode (AMOLED), Super AMOLED, and In-Plane Switching(IPS) LCD. The power consumption profile of these touch-screen technologies is reviewed below [21].
LCD has three major components, a backlight that is al-ways on, vertically polarized filters, and liquid crystals. Theliquid crystals are charged to different voltages to displaydifferent colors. Specifically, to display a black pixel, the crys-tals are charged with the highest voltage. This voltage alignsthe crystals horizontally, allowing only horizontally polarizedlight through. As the filter layer is vertically polarized, nolight can shine through and a black pixel is produced. To dis-play a white pixel, the crystal layer voltage is relaxed, aligning
(a) USB charging station (b) USB charging interface
(c) Shareable Power Bank (d) USB charging in hotel
Figure 1: USB charging in public or shareable environments.
it vertically, allowing light to pass through the filter. OLED
displays utilize organic molecules to produce holes and elec-trons to create light in an emissive layer. Individual OLEDsare used to produce each pixel. To display a black pixel, theOLED must enter a low power state, while displaying a whitepixel requires the OLED to enter a high power state.
As LCDs and OLEDs use dissimilar mechanisms to pro-duce an image on a screen, they generate vastly differentpower traces to produce the same image. Specifically, to cre-ate an animation of a white dot, most pixels will be black. Theblack LCD pixels will be in a high power state, and the pixelsthat make up the white dot in a low power state. OLEDs, onthe other hand, will have their black pixels in a low powerstate, and their white pixels in a high power state. Thus, if itwere possible to observe the voltages applied to the individualpixels, the two screen technologies should have inverse valueswhen they are utilized to display an identical image.
2.4 Animations on the Touchscreen
Smartphones with touchscreen technology always providegraphical interfaces (e.g., the lock screen, the telephone dialpad, and the text entry keyboard in applications) for users toinput data, and also use real-time animations to inform theusers that their inputs have been registered. Most of theseanimations occur on a static screen (i.e., no other animationis playing) and always at the same location on the screen (i.e.,the digit/letter does not move around). As reviewed before,displaying lighter or darker pixels consumes different amountsof power in LCD and OLED technologies. Furthermore, LCDand OLED screens refresh from left to right, row by row,leading to the potential that the dynamic power consumption,which can be measured through the USB charging cable, mayleak the location on the touchscreen where a virtual button ispressed.

1 2 3 4
Time (S)
0
0.05
0.1
0.15
0.2
Volt
age
(V)
Screen Off
Screen On
Enter Lock Screen
Tap Pin Code
1st
Button
2nd
Button
Figure 2: Power leakage on the USB powerline when charging a Motorola G4. Sam-pling rate is 125 KHz. The signal is filteredwith a moving mean filter to increase clarity.
0 1 2
Time (ms)
0.1
0.11
0.12
Voltage (
V)
Left
Mid-Col
Right
Top
Mid-Row
Bottom
(a)
0 1 2
Time (ms)
0.15
0.17
0.19
0.21
Voltage (
V)
Left
Mid-Col
Right
Top
Mid-Row
Bottom
(b)
Figure 3: Averaged voltage readings for (a) Motorola G4 with LCD screen and(b) Samsung Galaxy Nexus with AMOLED screen, when displaying flickeringwhite bars on the top, middle, and bottom rows, as well as left, middle, andright columns, of a black screen.
3 Power Line Leakage Exploration
Smartphones are sophisticated computing platforms with acomplex multi-core System-on-a-Chip (SoC) handling vari-ous device drivers for touchscreens, cameras, sensors, etc.Previous research has shown that the display (i.e., touch-screen) and CPU/GPU are among the top contributors tothe overall power consumption in a smartphone [20]. Whileprevious work has shown that the power consumption of asmartphone leaks information regarding the activities on thetouchscreen [64, 65], such information leakage is of coarsegranularity (e.g., internet browsing history [65] or passwordlength [64]). In comparison, the goal of this work is to demon-strate fine-grained information leakage, specifically, the abil-ity to identify the exact locations of button presses and extracta user’s input (e.g., a passcode) with dynamic power traces.
To examine the power leakage, we conduct a series of exper-iments utilizing a Motorola G4 connected to a USB chargingcable in which the ground cable has been cut and spliced witha small resistor. An oscilloscope is used to monitor the voltageacross this resistor and thereby the current utilization of thedevice. This section presents our experimental findings, high-lights the leakage patterns, and further shows that the stateof the smartphone’s battery will not cause any attenuationeffects on the side channel.
3.1 Button Press Detection
To explore the potential for identifying button presses, ourfirst study observes the signal on the USB cable while charg-ing a smartphone, utilizing the aforementioned oscilloscopeand charging cable setup. The dynamic power signal is highlycorrelated with device activity, as illustrated in Figure 2. Whenthe smartphone is asleep, there is a steady current utilizationwith minimal noise. Once the phone is perturbed from thesleep state, there is an immediate increase in its current uti-lization. When the phone enters the lock screen, the signalshows large spikes at different intervals. Finally, when theuser starts to tap the screen and enter a passcode, the signalexhibits a clear rise and fall upon each button press.
This experiment not only demonstrates the informationleakage on the power line, but furthermore illustrates twoimportant properties underpinning our following studies: (1)from the signal measured on the USB power line, one canclearly detect the powering-on of the screen and the exactstarting point of the button-press sequence; (2) in the lockscreen mode, each button press made by a user is clearlyobservable and separable.
3.2 Button Press Location Identification
The power usage in Figure 2 shows a significant elevationwhen a button is pressed. This elevated usage is caused bythe activities of the mobile OS. Specifically, once the mobileOS has captured an input action from the user, it providesvisual feedback by rendering and drawing an animation on thescreen, causing pixels to rapidly change colors and inducingtwo significantly different voltage states. On the lock screen,the animation for each button press is similar, albeit in adifferent location. These similar animations cause the powerleakage to exhibit similar signals for different buttons, as theblue and grey areas in Figure 2 depict.
The unique contribution of this work is to discriminatethe “similar-looking” signals and extract the location of theanimation via power leakage. To examine this potential, wehave designed a custom Android application running on twosmartphones with different screen technologies: the MotorolaG4 with an LCD screen, and the Samsung Galaxy Nexuswith an AMOLED screen. The application divides the screeninto six portions (i.e., top, middle, and bottom rows, as wellas left, middle, and right columns) and displays, on a blackbackground, flickering white bars that fill each portion of thescreen in their respective tests. To mimic the way the AndroidOS renders user interface elements and the lock screen, weset the hardwareAccelerated developer flag to ensure thatthe GPU is involved in image rendering.
The gathered signal exhibits a steady 60Hz signal that de-notes the beginning and end of a refresh cycle2. We isolate
2The screen constantly refreshes all pixels with a specific rate (typically

(a)
Vo
lta
ge
(V
)
(b)
200 400 6000
2
410
-3
Fully Charged
200 400 600
Frequency (Hz)
0
2
410
-3
ChargingHigh Pass Filter
High Pass Filter
60
60
(c)
Figure 4: Comparison of voltage readings when pressing buttons on the lock screen of a Motorola G4 in two cases: fully chargedvs charging. Sampling rate is 125 KHz. (a) depicts the raw unfiltered signal. (b) utilizes a high pass filter with a cutoff frequencyof 60 Hz to remove the offset. (c) presents the Fourier transform of the filtered signal, demonstrating that the charging status ofthe phone does not affect the signal integrity.
the 60Hz signal within the sample stream and average all ofthe frames to reduce noise for better visual effects. The resultsare presented in Figure 3, which zooms in on a 2ms portion ofthe signals to better display the subtle differences. As can beseen, the voltage readings show that in both LCD and OLEDtechnologies, there is an appreciable difference in the powerusage of displaying the same image on different portions ofthe screen. These experiments demonstrate the great poten-tial for inferring the location of the animation played on thescreen when a user presses a virtual button, by exploiting thepower leakage on the USB power line.
3.3 Impact of Battery Charging
One important question is whether the state of the smart-phone’s battery will cause any attenuation effects on the powerside channel. This is critical as the smartphones charged atpublic USB charging facilities will likely have arbitrary bat-tery levels. Once plugged into a charger, the smartphone drawsits power from the charger and uses any excess power tocharge its battery. Not only will a charging battery lead to ahigher power draw than a fully charged battery, but the batterycharging circuitry might attenuate the power leakage informa-tion, since high frequency signals contained in current spikesmight be filtered by the reactive components of the batterycharging controller.
To study the difference between a fully charged phone anda charging phone, we collect the power traces under the sameworkload, i.e., when entering a single digit on the virtual key-pad repeatedly. The power traces are presented in Figure 4a.The figure shows a positive offset for the “charging” case,demonstrating that a larger base amount of current is beingdrawn by the phone to perform its tasks and additionallycharge the battery. However, upon applying a high-pass filterto remove all frequencies under 60Hz that correspond to the
60Hz), in a manner from left to right, and from top to bottom. This phe-nomenon can be observed with a slow motion camera, such as the one on aniPhone, which films at 240 frames per second.
DC offset in the signal, the filtered signals of the two phonesmatch each other quite well, as shown in Figure 4b. We alsoconduct a Fourier transform on both signals, and display theresulting frequency spectrum in Figure 4c. In the figure, thehigh-band frequency signals still exist in both cases, preserv-ing the high speed dynamic fluctuations attributed to the usertouching the screen. Although the charging battery illustratesa slightly smoothed frequency signal, there is no obvious vi-sual difference in the frequency spectrum between a chargingphone and a fully charged phone.
4 Sensitive Information Inference
This section presents the method with which Charger-Surfing exploits the fine-grained power line leakage describedabove to infer button presses made by a smartphone user.
Figure 5 presents the working mechanism of Charger-Surfing. An adversary first acquires raw signals from a “surf-ing" charger with a hidden voltage monitor (provided instep ❶). The raw signal is searched to detect a button se-quence (step ❷), which is further isolated to individual but-tons (step ❸). Next, a neural network processes the signal todetermines the target device model (step ❹). This informationis used to select the exact model for button identification froma set of pre-trained neural networks. The button press signalis preprocessed (step ❺) for the phone model specific neuralnetwork, which finally infers the virtual buttons pressed bythe user on the touchscreen (step ❻). The rest of this sectiondetails the techniques used in each step of Charger-Surfing.
4.1 Raw Signal Acquisition
The prerequisite for sensitive information inference is tocovertly and comprehensively capture the power trace of theuser’s smartphone without losing any useful information. InCharger-Surfing, this is performed at step ❶, as shown inFigure 5, via a hidden voltage monitor that is attached to thecharger without a user’s knowledge.

Figure 5: Overview of Charger-Surfing’s working flow.
The voltage monitor should be able to collect the raw signalof the charging device at a sampling frequency that is care-fully determined. Utilizing a very high frequency will result inunnecessarily large and cumbersome data, while sampling tooslowly will miss key information. There are two factors thataffect the sampling frequency: the refresh cycle of the screenand the resolution of the screen. As mentioned in Section 3.2,screens typically refresh pixel by pixel, from left to right andfrom top to bottom. To observe both the row and columnportion of an animation, it is preferable to sample at a ratethat is slightly greater (or less) than the per row update speed,so that (1) the power utilization can be monitored on a per rowbasis, and (2) samples can be taken in different columns asthe refresh moves down the screen. Most of today’s flagshipsmartphones use a screen resolution between 1920×1080 and2960×1440 and have a refresh rate of 60 Hz. A single sampleper row would require a sample rate in the range of 115–178KHz. Our design uses a sample rate at 125 KHz, which takesone sample per every 0.9 – 1.4 rows on many flagship smart-phones. This rate ensures that consecutive samples are nottaken on the same vertical line, thus providing more usefullocation information.
4.2 Button Sequence Detection
Step ❷ of Charger-Surfing processes the captured powertrace and isolates the portions of the signal corresponding tothe sequence of button presses.
When the user presses a virtual button on the touchscreen,the mobile OS determines the location of the input and ac-knowledges the user by lighting up the button (or playingan animation around it). With a text or numeric entry, it alsodisplays the corresponding letter or number on the screen.
Each of these activities increases the power consumption,collectively generating a visible spike in the captured rawpower utilization signal, as shown in Figure 2. To detect thesesignals, Charger-Surfing utilizes a moving mean filter and alevel detector. The filter removes noise from signals, allowingthe level detector to isolate portions of the signal belonging toa button press sequence once the level is above an empiricallydetermined threshold.
4.3 Individual Button Isolation
Upon detecting a sequence of button presses, Charger-Surfing moves to step ❸ which detects and isolates eachindividual button press. Since users press buttons at differentrates, inferring individual button signals is much easier andmore practical than blindly classifying the entire sequencewith button presses possibly occurring at any arbitrary speed.
The process of detecting individual presses also utilizesa combination of a moving average filter and a level detec-tor. When passed through a moving average filter, the buttonsequence displays spikes, each of which corresponds to thebeginning of a button press, as shown in Figure 6.
Depending on the button press rate, the raw power signal(e.g., the top picture in Figure 6) may show either a singleand isolated press, or multiple overlapping button presses.In the latter case, it is important to select the signal portion
containing the most distinctive information. The lower pic-ture of Figure 6 shows the pattern of a single button press,wherein the biggest changes occur at the beginning of thesignal. This trend is consistent with the typical behavior ofthe screen, which is usually static but comes alive as soonas a button is pressed. Accordingly, for overlapping buttonpresses, Charger-Surfing discards the end of the signal andkeeps the beginning, which is the most important, distinctive,and potentially identifiable portion.
4.4 Phone Detection
In the envisioned threat model, adversaries can profile thepower charging dynamics of most popular smartphone modelsbeforehand, and pre-train a neural network model for eachof these popular phones. A victim’s signal collected over theUSB power line can be fed into the pre-trained model, oncethe phone type is determined.
While the steps ❶–❸ performed up to this point are gener-ally applicable to all smartphones, step ❹ of Charger-Surfingfocuses on detecting the phone type. This task is much eas-ier than classifying individual button presses as the screentechnology, the screen resolution, and different componentswithin the phone (CPU, GPU, screen driver, etc.) lead to vastlydifferent power trace patterns, as demonstrated in Figure 3. Toaccomplish this identification task, we utilize a neural networkthat is trained with the isolated button press signals. The rawsignal is passed through a high-pass filter to preserve the high-frequency components, which are highly correlated to thephone model, while removing the less informative DC offsetsthat can be a result of brightness changes, charging/charged,or different charging rates.
As the victim’s phone model may not belong to the setthat the attacker utilized to train Charger-Surfing, the systemfurther examines the confidence values of each output classwhen inferring the phone model. If the confidence valuesare all low, it will not pass the samples to the phone-specificneural networks for classification.

Figure 6: The top displays the raw signal of multiple over-lapping button presses. The bottom demonstrates how peakdetection can be utilized to determine non-overlapping por-tions of individual button presses. The signal is collected fromMotorola G4 and filtered for clarity.
4.5 Signal Preprocessing
After determining the phone model, Charger-Surfing thenscales and standardizes the power signal in step ❺ followingthe characteristics of the specific phone model. The signalsgathered from the USB power line are commonly between 0and 100 mV. After passing through the high-pass filter, thesignal is mostly distributed between -50 mV and 50 mV. Wepreprocess the data with a scaler designed for the target phonemodel, which is created by pre-training with a few samplesfrom the adversary’s own device. The resultant signal’s rangeis between -1 and 1, which typically leads to the best inferenceresults for most neural networks.
4.6 Animation Inference
In the final step (i.e., step ❻ in Figure 6), the preprocessedpower signal is sent to a neural network trained for that spe-cific type of device, to reconstruct the multi-press sequencethat the victim types into the device.
As the collected signal is a one-dimensional time seriesof voltage measurements, Charger-Surfing utilizes a one-dimensional convolutional neural network (CNN). The net-work includes a repeated series of convolutional and max-pooling layers, followed by a softmax regression layer, whichclassifies the input signal into one of the possible buttons andprovides a confidence value associated with each class.
Why Utilize a CNN? CNNs are known for their high ac-curacy when processing data with spatial correlation and clas-sifying time series data [36]. Furthermore, as discussed inSection 4.1, Charger-Surfing uses a single sampling rate forall the phones and the sampling rate (125KHz) is chosen tomodulate around the screen rather than continually samplingthe same pixels. This implies that for phones with different
screen resolutions, features of button presses appear at dif-ferent locations of the power signal. CNNs are well suited torecognize features that can be found in any area of a signal.
Model Classifier Configuration. An important consider-ation of any CNN is the size of the convolutional kernels.Small kernels may not be able to recognize features that man-ifest themselves over a large portion of the input signal, whilelarge kernels may be too coarse, missing the fine details andfeatures of an input signal.
The ideal size of the convolutional kernels depends on thesize of the features in the power trace, which in turn dependson the sampling rate, screen layout, and size of the animation
to be detected. If one desires to classify individual keys on thedevice text entry keyboard, for example, it would be necessaryto calculate the size of the key press animation with respectto the screen size and modify the kernel size accordingly.This allows the first layer of the network to capture featuresthat are large enough to identify a button press, while notbeing so large as to oversimplify or miss a feature, and notbeing so small as to only capture noise. Furthermore, ourCNN design adopts a typical architecture consisting of setsof a convolutional layer followed by a max-pooling layer,which potentially increases the receptive field3 of the network.This allows the subsequent layers of the network to leveragethe highlighted features and correlate their location acrossmultiple frames of the signal when inferring the key press.
5 Case Study: Passcode Inference
To demonstrate that Charger-Surfing poses a genuine secu-rity threat, we conduct a case study of passcode inference. Wedivide our evaluation into two major sections. This sectiondetails the experimental evaluation for a broader range of de-vices, including data collection, single button inference, 4- and6-digit passcode inference, and impact of sampling frequencyupon inference accuracy, demonstrating the wide applicabil-ity of Charger-Surfing. Section 6 tightens the scope of ourevaluations, focusing on a low-cost hardware implementa-tion of the Charger-Surfing attack, its insensitivity to differentsmartphone configuration variables (wallpapers, brightness,vibration, charging status), and the transferability of the attackbetween different smartphones of the same model. In total,we gather data from 33 volunteers4 and on 6 different devices.Our participants are about 30% female, including members ofvaried races, heights, and weights. The age of our participantsranges from 20 to 60 years old. This section utilizes the dataof 15 volunteers and four devices, while Section 6 uses anadditional set of 18 volunteers and two devices.
3The receptive field is the portion of the input signal affecting the currentconvolutional layer.
4The human-user-involved experiments have been filed and approvedby the Institutional Review Board (IRB) to ensure participants are treatedethically.

5.1 Data Collection
To ensure that Charger-Surfing is not tied to a specificphone model, screen technology, or mobile OS, we collectdata from a spectrum of smartphones running both iOS andAndroid OS, listed in Table 9 in Appendix A. For Androiddevices, the Galaxy Nexus represents smartphones with aginghardware, while the Motorola G4 provides an example of amore recent and advanced smartphone. A similar strategy isapplied in selecting the iOS devices. The iPhone 6+ representsan aging but still widely used device, while the iPhone 8+provides an example of a more recent smartphone that sharesa large amount of hardware with the current iPhone SE 2ndgeneration released in 2020.
To assess the impact that individual users might have on theaccuracy of Charger-Surfing, we collected input data from 15volunteers who regularly use passcode based authentication insmartphones. Our participants have diverse backgrounds andare varied in height, weight, gender, race, and age. The goalis to demonstrate that Charger-Surfing is victim-independent,as the different users likely interact with the same smart-phone differently (e.g., placing their finger on different areasof the button or holding their finger on the screen for differ-ent amounts of time), which could lead to variations in theduration of the animations played on the smartphones tested.Each user was tasked to input a pre-determined sequence of200+ buttons on the numerical lock screen. The sequence wasdesigned to gather a uniform distribution of button pressessuch that no button had a disproportionate amount of samples.
Our data collection utilizes a modified charging cable anda Tektronix MDO4024C oscilloscope. The charging cableis modified by cutting the ground wire and inserting a 0.3Ω
resistor. The oscilloscope is used to measure the voltage dropacross the resistor, providing a fine-grained and repeatablemethod of observation. It is configured to sample at a rate of125,000 samples per second.
5.2 Classifier Configuration and Training
As discussed in Section 4.6, for the best performance, it isnecessary to tune the kernel sizes of the CNN based on thescreen layouts and animations that are being classified.
Figure 7 presents the typical lock screen layouts imple-mented by Android and iOS systems as well as the anima-tions on the lock screen. As shown, the animations caused bya button press range from about 1/10 of the vertical screenheight on iPhones (button 5 in Figure 7a) to about 1/5 of thevertical screen height on Android phones (button 5 in Fig-ure 7b). With a sampling rate of 2,083 samples per frame5, themost pertinent features for button identification are within 208(iPhone) - 416 (Android) samples. Thus, when considering
5The power trace signal is sampled at 125KHz, and the lock screen re-freshes at a rate of 60Hz. Under this configuration, 2,083 samples are gatheredwithin each refresh cycle. Each sample contains information about the con-tent of the screen progressing vertically, as the screen refreshes from top tobottom.
(a) iPhone (b) Android
Figure 7: Passcode lock screen layout and animation.
the receptive field of the network, we choose an initial kernelsize of 50 for the iPhone network and 100 for the Androidnetwork. This sizing configuration ensures that we capturethe smaller features of the signal in the initial layers of thenetwork while still considering both the larger features of thesignal in intermediate layers and the location on the screenacross multiple frames of animation in the final layer. De-tailed network configurations are listed in Tables 10 and 11in Appendix A.
Our threat model assumes that adversaries are unable toobtain the victim’s data before training the system, and thuscan only train the classifier using their own collected data. Toemulate this scenario, we divide the users into two separatesets: one set for training (i.e., adversary) and the other setfor testing (i.e., victim). To examine the robustness of thenetwork to the composition of the training data, we randomlyselect five users to create the training set. The remaining 10users form the testing set, ensuring that there is no overlapbetween the training and testing users. We train five neuralnetworks for each device such that the ith (1 ≤ i ≤ 5) networkis trained with the data from i different users. In testing, eachnetwork’s performance is evaluated on the 10 testing users,and the average accuracy is reported.
5.3 Phone Identification
Our experimental steps closely follow the process in Fig-ure 5. After the signal is acquired, it is passed through buttonisolation (as described in Section 4.3). The next step is tocorrectly identify the target phone model so that the signalcan be processed by the appropriate preprocessing system(Section 4.5) and classifier.
We train a primary neural network using high-pass filtereddata from a subset of the collected users and test on the datafrom the remaining users. Our results show that the networkcan determine the correct phone model 100% of the time.This identification step is also applicable to phones that mightrun multiple OS versions. Different OS versions would bedetected and classified at this step before being passed to themore specific secondary neural networks.

Table 1: Single Button Accuracy
# ofTraining
Users
PhoneMotorola
G4GalaxyNexus
iPhone 6+ iPhone 8+
1 82.0% 50.0% 23.8% 44.6%2 90.0% 95.0% 93.3% 67.1%3 99.6% 99.1% 96.9% 88.7%4 99.7% 99.4% 98.5% 94.5%5 99.9% 99.6% 99.5% 95.8%
(a) Press button on the left side. (b) Press button on the right side.
Figure 8: Android’s animation on touching different parts ofa button.
5.4 Single Button Inference
We first evaluate the accuracy for inferring a single buttonpress, which is the most fundamental aspect of the system, as,without the ability to robustly classify a single button, it isimpossible to accurately infer the entire passcode.
Table 1 lists the accuracy of a single button inference foreach smartphone. When the training data was collected fromonly one user, we observe divergent accuracy results for differ-ent phones, ranging from 23.8% for iPhone 6+ to 82.0% forMotorola G4. Once we increase the training data size to twousers, however, there is a significant accuracy improvementfor single button inference: 67% for iPhone 8+ and more than90% for all the other phones. The increasing accuracy trendis mainly attributed to the differences in user behavior wheninteracting with touchscreens, which can have direct effectson the power usage of the screen. More specifically, Androiddevices demonstrate spatial and temporal variations whileiOS devices demonstrate temporal and processing variations.On the Android lock screen, the screen plays an animationthat depends on where users place their finger. An exampleof this scenario is shown in Figure 8, where a user placingthe finger on the left or right side of the button can createdifferent animations. Furthermore, the longer the user holdstheir finger in this position, the larger the darker white circlegrows. On iOS devices, when users press a button on thelock screen, no matter where exactly they press it, the entirebutton lights up completely and immediately. This animationdoes not end until the user removes their finger, impartingtemporal variations to the recorded power trace. Furthermore,devices newer than the iPhone 6S (such as the tested iPhone
Figure 9: Breakdown of actual and predicted button classifi-cations for the Galaxy Nexus when trained with one user’sdata. An entry on row i and column j corresponds to button i
being classified as j.
8+) make use of so-called “3D-Touch” to measure the forceof the screen press. This extra processing and informationfurther introduces subtle noise or processing variations intothe measured signals.
The aforementioned user-oriented uncertainties and ran-domness can be dramatically mitigated by integrating moreusers into the training process. Once the neural network ispresented with a robust dataset demonstrating diverse userbehaviors, these abnormalities can be recognized and classi-fied correctly. Table 1 confirms that by training on four users’data, Charger-Surfing can achieve more than 94% accuracywhen classifying the single button presses of new users (i.e.,the victims) for all devices. The average accuracy across allfour test phones for single button inference further reaches98.7% when there are five training users. By this point, theimprovements demonstrate diminishing returns as more usersare included. This indicates that our system only requires afew users’ training data to achieve near optimal accuracy.
5.5 Misclassification Analysis
To further evaluate the effectiveness of Charger-Surfing, weexamine how the neural networks perform when they guessincorrectly. Figure 9 presents the confusion matrix of theinference results of the Galaxy Nexus, when trained on onlyone user’s data. The figure shows the actual pressed buttonsas rows and predicted buttons as columns. An entry on row i
and column j corresponds to button i being classified as j.Figure 9 shows the highest prediction rate in the diagonal
for all buttons except for button 7, which can be classifiedas 7 or 8 with equal probability of 0.45. Five buttons (0, 1,6, 7, 9) demonstrate performance lower than 50%, however,usually the incorrect inference is only off by a single row orcolumn, indicating that the screen region it guessed is correct.Excellent examples of this phenomenon are the pairs (0,9)
(a) 1st Trial (b) 5th Trial (c) 10th Trial
Figure 10: Accuracy of 4-digit passcode inference.
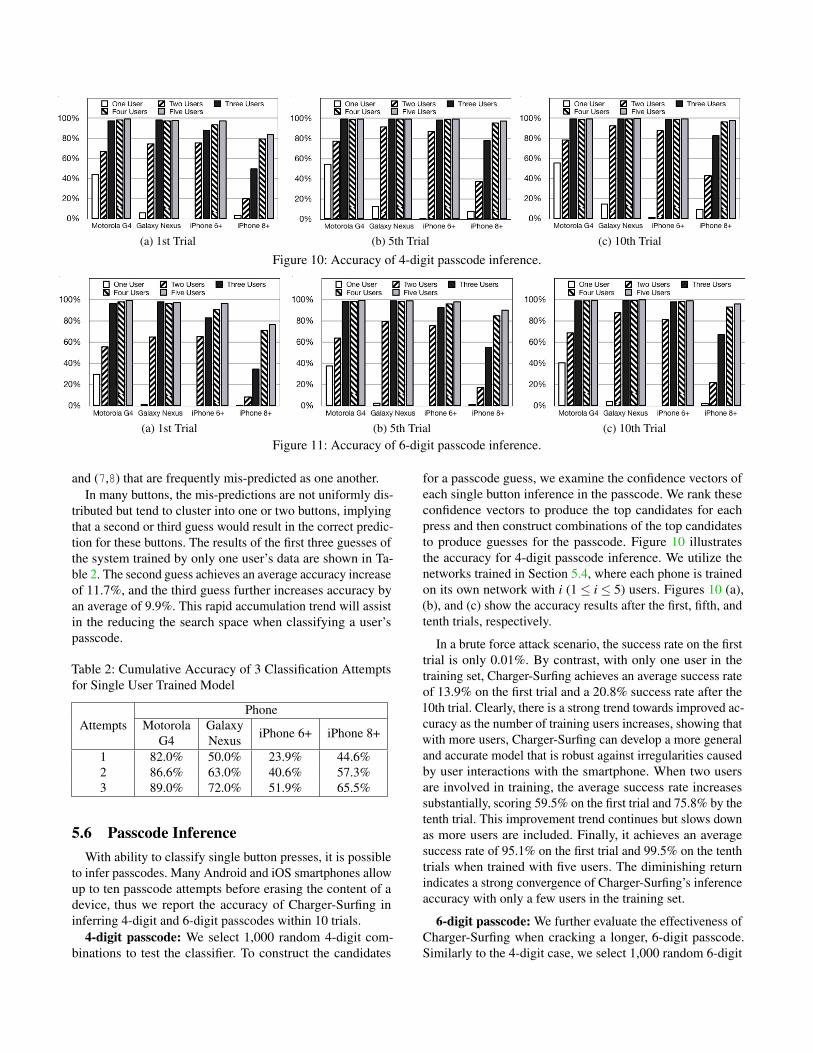
(a) 1st Trial (b) 5th Trial (c) 10th Trial
Figure 11: Accuracy of 6-digit passcode inference.
and (7,8) that are frequently mis-predicted as one another.In many buttons, the mis-predictions are not uniformly dis-
tributed but tend to cluster into one or two buttons, implyingthat a second or third guess would result in the correct predic-tion for these buttons. The results of the first three guesses ofthe system trained by only one user’s data are shown in Ta-ble 2. The second guess achieves an average accuracy increaseof 11.7%, and the third guess further increases accuracy byan average of 9.9%. This rapid accumulation trend will assistin the reducing the search space when classifying a user’spasscode.
Table 2: Cumulative Accuracy of 3 Classification Attemptsfor Single User Trained Model
AttemptsPhone
MotorolaG4
GalaxyNexus
iPhone 6+ iPhone 8+
1 82.0% 50.0% 23.9% 44.6%2 86.6% 63.0% 40.6% 57.3%3 89.0% 72.0% 51.9% 65.5%
5.6 Passcode Inference
With ability to classify single button presses, it is possibleto infer passcodes. Many Android and iOS smartphones allowup to ten passcode attempts before erasing the content of adevice, thus we report the accuracy of Charger-Surfing ininferring 4-digit and 6-digit passcodes within 10 trials.
4-digit passcode: We select 1,000 random 4-digit com-binations to test the classifier. To construct the candidates
for a passcode guess, we examine the confidence vectors ofeach single button inference in the passcode. We rank theseconfidence vectors to produce the top candidates for eachpress and then construct combinations of the top candidatesto produce guesses for the passcode. Figure 10 illustratesthe accuracy for 4-digit passcode inference. We utilize thenetworks trained in Section 5.4, where each phone is trainedon its own network with i (1 ≤ i ≤ 5) users. Figures 10 (a),(b), and (c) show the accuracy results after the first, fifth, andtenth trials, respectively.
In a brute force attack scenario, the success rate on the firsttrial is only 0.01%. By contrast, with only one user in thetraining set, Charger-Surfing achieves an average success rateof 13.9% on the first trial and a 20.8% success rate after the10th trial. Clearly, there is a strong trend towards improved ac-curacy as the number of training users increases, showing thatwith more users, Charger-Surfing can develop a more generaland accurate model that is robust against irregularities causedby user interactions with the smartphone. When two usersare involved in training, the average success rate increasessubstantially, scoring 59.5% on the first trial and 75.8% by thetenth trial. This improvement trend continues but slows downas more users are included. Finally, it achieves an averagesuccess rate of 95.1% on the first trial and 99.5% on the tenthtrials when trained with five users. The diminishing returnindicates a strong convergence of Charger-Surfing’s inferenceaccuracy with only a few users in the training set.
6-digit passcode: We further evaluate the effectiveness ofCharger-Surfing when cracking a longer, 6-digit passcode.Similarly to the 4-digit case, we select 1,000 random 6-digit

Sin
gle
Bu
tto
n
Accu
racy
0%
25%
50%
75%
100%
125%
Frequency (KHz)
125.0 62.5 31.3 15.6 10.4 7.8 6.3 3.9
Figure 12: Impact of different sampling rates on single buttonaccuracy, based on 3-user data of Motorola G4.
combinations and test them against our inference system. Fig-ures 11 (a), (b), and (c) illustrate the accuracy after the first,fifth, and tenth trials, respectively. Although the search spacefor a 6-digit passcode is much larger (a 6-digit passcode has1,000,000 combinations), Charger-Surfing demonstrates highsuccess rates similar to those achieved when cracking a 4-digit passcode. When trained on five users, the success rateof the first trial is greater than 90% for all phones except theiPhone 8+, which has an accuracy of 77.0%. Even for iPhone8+, the success rate then increases to 90.3% after the fifthtrial; and the accuracy for all phones is more than 96% by thetenth trial. In comparison to a brute force approach that has asuccess rate of 0.001% within ten trials, Charger-Surfing ismore than 96,000 times more effective.
5.7 Impact of Sampling Frequency
As mentioned in Section 4.1, Charger-Surfing utilizes asampling rate of 125 KHz, which takes about 1 sample ev-ery 0.9–1.4 rows on many flagship smartphone screens. Assampling at a higher frequency requires more expensive andpowerful equipment, we examine the impact of sampling atlower frequencies on single button inference accuracy. Wedownsample the raw signal to different frequencies, and pre-process the signal in the manner described in Section 4.5. Theneural networks are resized and retrained to work with thedata collected at reduced sampling rates.
Figure 12 illustrates the accuracy of single button inferenceon a Motorola G4 using networks trained with three users. Adecreasing trend in accuracy can be seen when lowering thesampling frequency. The drop is slow at first: when the sam-pling rate decreases to 31.3 KHz, the accuracy degrades from99.6% to 99.5%, a drop of only 0.1%. When the samplingrate is reduced to 15.6 KHz, there is a larger drop in accuracybut it still remains above 90%. However, further decreases inthe sampling rate leads to dramatic losses in accuracy.
To better understand the reason for the accuracy drop, wefurther examine the row and column accuracy degradation6 as
6Row (column) accuracy is defined as the percentage of classificationsthat fall within the correct row (column) (e.g., a ‘1’ that is misclassified as a‘2’ is still in the correct row).
Table 3: Impact of sampling frequency on row, column, andoverall classification accuracy, based on 3-user data of Mo-torola G4.
AccuracyFrequency
(KHz)Row Column Overall
62.5 99.4% 99.4% 99.3%31.3 99.8% 99.6% 99.5%15.6 98.5% 92.4% 92.3%10.4 94.1% 62.3% 61.3%7.8 85.3% 46.9% 43.0%6.3 59.5% 38.5% 26.0%3.9 30.8% 33.4% 9.9%
(a) iOS Keyboard (b) Android Keyboard
Figure 13: Android and iOS keyboards. Each keyboard has asimilar layout, with 4 rows of buttons. Each keyboard containsa maximum of 10 buttons per row (top row).
the sampling rate decreases. The results are listed in Table 3.It turns out that the column accuracy is the limiting factor.While the row accuracy remains above 94% even at 10.4KHz,the column accuracy degrades from 99.5% at 31.3KHz to62.3% at 10.4KHz. Such a result is consistent with the screenrefresh behavior: as the screen refreshes row by row and fromleft to right on each row, the row signal changes much slowerthan the column signal. Thus, a decreased sampling rate canstill capture the row signal, but becomes incapable of fullycapturing the column signal.
5.8 Detection Granularity Analysis
So far we have demonstrated that by monitoring the powerusage of a charging smartphone, an adversary can extract thelocation of animations on the touch screen, compromising auser’s passcode. Another particularly enticing target is theonscreen virtual keyboard. Each press of the keyboard pro-vides feedback to the user by either displaying an enlargedversion of the pressed character or by darkening the pressedkey. Thus, an adversary with a voltage monitoring setup mightattempt to infer a user’s input by locating and classifying theanimations of the onscreen keyboard. However, one importantquestion remains: is Charger-Surfing able to achieve sufficientprecision for classifying smaller animations on the screen?

To gain a better understanding of the achievable precisionof Charger-Surfing, we examine the relationship among an-imation positioning, animation size, and inference accuracyat different sampling rates. Specifically, the results in Table 3show that the column accuracy is the limiting factor in classifi-cation accuracy. Using the examples of the onscreen keyboardin Figure 13, we can see that both iOS and Android keyboardshave a maximum of 10 columns (top row) that must be clas-sified accurately. Table 3 shows that a sampling rate of 31.3KHz is required to accurately classify 3 columns. Thus, toclassify 10 columns, the sampling rate should be increased byat least 10/3 times to around 105 KHz.
While this sampling rate ensures that the signal containsenough information, it is equally important to tune the filtersize in the neural network for identifying the patterns presentin the data. As previously discussed in Section 5.2, the con-volutional kernels must be sized such that they are smallerthan the number of samples that encompass the animation.For example, in the iOS keyboard presented in Figure 13a,each key takes up about 1/17th of the vertical space on thescreen. Using the sampling rate determined above, of 105KHz, 1,750 samples are taken during each screen refresh.Thus, each keypress animation can be recorded in about 103samples. Leveraging our experience in training the CNN forpasscode inference (a kernel size of 50 for 208 samples, asdescribed in Section 5.2), a kernel size close to 25 shouldprovide an adequate starting point for tuning the network todetect keyboard press animations.
6 Attack Practicality
The analysis on sampling rate shows the potential of devel-oping a low-cost data acquisition system with cheap and com-pact commercial off-the-self (COTS) hardware, which can beeasily integrated and hidden inside shared power banks or pub-lic USB charging facilities, making the Charger-Surfing attackmore practical. In this section, we demonstrate the practicalityof Charger-Surfing by (1) detailing a portable, low-cost powertrace collection system, and (2) testing the system under dif-ferent smartphone settings and across different devices of thesame model.
6.1 A Portable Data Collection System
We design and develop a portable, low-cost microcontroller-based system for data acquisition, as shown in Figure 14. Itconsists of an Espressif ESP32 chip with a dual-core TensilicaExtensa LX6 processor, built-in WiFi, and Bluetooth radio. Inthe system, the microcontroller is connected to a 10-bit analog-to-digital converter (ADC) manufactured by Analog Devices(AD7813). One of the ESP32 cores is dedicated to gatheringsamples from the ADC, while the other core handles all WiFicommunication and data storage needs. The sampling rate isconfigurable (up to 62.5KHz) and, as each sample is only 10bits, the maximum data rate is quite low, at only 78.125KBps.The cost of the whole data collection system is less than $20.
Figure 14: The portable, low-cost data collection setup. AWiFi enabled microcontroller can send acquired data to acustom webserver in real-time.
Table 4: Single Button and Passcode Inference Accuracy (5training users / 15 testing users).
Single ButtonPress
PasscodeAttempt Trial 4-Digit 6-Digit
1 98.6% 1 94.9% 92.4%2 99.4% 5 97.4% 94.9%3 99.6% 10 97.5% 96.3%
A Motorola G4 is used to test the accuracy and effective-ness of this portable, low-cost data collection system. We setthe sampling rate to 62.5KHz, and collect button press datafrom 20 different users. Based on the studies in Section 5, werandomly select five users to train the network and validatewith the remaining 15 users. The results are shown in Table 4.We can see that even with a low-end (less than $20) dataacquisition setup, an adversary can correctly identify singlebutton presses with 98.6% accuracy on the first attempt: adrop of only 1.3% compared to a much more expensive, fastersampling and bulky setup (e.g., an oscilloscope). For crackinga 4-digit passcode, the system achieves an average accuracyof 94.9% in the first attempt and 97.4% by the fifth attempt.The results of cracking a 6-digit passcode are also promising:an average accuracy of 92.4% in the first attempt and 96.3%by the tenth attempt.
6.2 Testing of Varied Device Settings
In an attack scenario, it is unlikely that a victim’s deviceis configured exactly like the attacker’s training device. Forexample, it is likely that a victim has a different screen back-ground, brightness setting, etc. To examine how these con-
Table 5: Single Button Inference Accuracy (5 training users /1 testing user) with Varied Configurations.
ConfigurationStatic Wallpaper Brightness
Charge Haptics1 2 0% 50% 100%
Accuracy(1st Attempt)
99.3% 98.0% 98.0% 97.3% 100% 99.2% 100%

Table 6: Cross-device training and testing configurations.
Training Testing
Phone A Phone BUsers: 1,2 Users: 3-12
Wallpaper: 1,2,3 ⇒ Wallpaper: 4100 Presses of
each buttonBalanced 200
button sequenceTotal: 6,000 Presses Total: 2,000 Presses
Table 7: iPhone 6+ cross device testing classification results.2 training users on an iPhone 6+ and 10 testing users on adifferent iPhone 6+.
Single ButtonPress
PasscodeAttempt Trial 4-Digit 6-Digit
1 99.1% 1 96.5% 94.6%2 99.4% 5 97.4% 95.6%3 99.4% 10 97.4% 96.2%
figuration variations may affect the accuracy of the attackernetwork, we test the network on a victim with different con-figurations. We gather data from a Motorola G4 in which we,one at a time, change the wallpaper (two different wallpapers),modify the brightness (0%, 50%, 100%), use an unchargedphone, and enable haptic feedback. We then test the dataagainst the network trained with 5 users in Section 6.1. Theresults listed in Table 5 indicate that the configuration differ-ence has very little impact upon the inference accuracy, whichremains above 97% for single button inference in all cases.This demonstrates that Charger-Surfing is quite robust againstdevice configuration changes.
6.3 Cross Device Testing
To further demonstrate that Charger-Surfing poses a realthreat, we launch attacks under a more strict cross-devicescenario wherein attackers can only train the classifiers ontheir own phone and then test them against a different phone(i.e., a victim’s phone). Also, while attackers can collect datafrom multiple different wallpapers during training, they mightnot know the exact wallpaper used by the victim. This set of‘cross-device’ experiments are conducted given two phonemodels, iPhone 6+ (iOS 12.4) and iPhone 8+ (iOS 13.4). Un-der each model, there are two phones (e.g., two iPhone 6+phones) used separately for training and testing. For eachtraining phone at the attacker side, we have two users whogather 100 presses for each button. We then train the model us-ing three different wallpapers: black, white, and multi-colored.For each testing phone at the victim side, we gather 200 testpresses from 10 users (different from the two users at the at-tacker side), with wallpapers that are not used in training. Theexact training and testing configurations are listed in Table 6.
The obtained accuracy results of the two phone models,iPhone 6+ and iPhone 8+, are presented in Tables 7 and 8, re-spectively, demonstrating that both cross-device tests achieve
Table 8: iPhone 8+ cross device testing classification results.2 training users on an iPhone 8+ and 10 testing users on a dif-ferent iPhone 8+. High initial accuracy meant that subsequentattempts realized minimal improvement.
Single ButtonPress
PasscodeAttempt Trial 4-Digit 6-Digit
1 99.7% 1 99.0% 98.6%2 99.8% 5 99.1% 98.6%3 99.8% 10 99.1% 98.7%
greater than 99% accuracy on the first attempt when classi-fying single buttons and greater than 94% accuracy whenclassifying 6-digit passcodes. Note that the accuracy resultshere are slightly higher than those in the oscilloscope-basedexperiments shown in Section 5. This slight difference couldbe caused by the different iOS versions (the oscilloscopeexperiments are performed on older iOS versions), or oscillo-scope vs ADC quantization at low voltages.
Overall, this set of experiments clearly indicate thatCharger-Surfing works well not only across different usersbut across different devices of the same model, posing a realsecurity threat.
7 Countermeasures
Our experiments show that on different smartphones,Charger-Surfing is highly effective at locating the buttonpresses on a touchscreen and inferring sensitive informa-tion such as a user’s passcode. While it would be difficultto completely fix the leakage channel, which is related toUSB charging and hardware, there exist some possible coun-termeasures.
The side channel exploited by Charger-Surfing leaks in-formation about dynamic motion on the touchscreen. Thisattack is so effective as the layout of the lock screen is fixed:the buttons for a passcode are in the same positions everytime the screen is activated. On the contrary, randomizing anumber’s position on the keypad for code entry would likelyhamper Charger-Surfing’s ability to detect a user’s sensitiveinformation. However, this position randomization may incon-venience users as it will take more time for them to locate eachbutton. Furthermore, this approach scales poorly; randomiz-ing a keyboard layout, for example, would be highly undesir-able to users. Likewise, it is possible for smartphone vendorsto remove button input animations, a change that would sig-nificantly reduce the information leakage in the power line,but provide minimal feedback to users as to whether they havecorrectly pressed the intended button. While both features areavailable in some customized versions of Android, they arenot widely deployed in currently available devices.
At first glance, one likely solution is not to eliminate theleakage, but to drown it out via noise. One such option wouldbe to utilize a moving background such as the readily availablelive/dynamic wallpapers on Android/iOS, which act similarly

to videos and constantly animate the screen. While this ideaseems initially attractive, it has a few major drawbacks: 1)the live wallpaper only works on the lock or home screen andwould not prevent similar attacks against onscreen keyboardsin applications, and 2) the noise generated by this system israndom and can be filtered out with sufficient samples. In apreliminary study of this defense technique, we built a neuralnetwork trained with 100 samples per button taken with twolive wallpapers and tested on another live wallpaper. Thenetwork was able to realize greater than 98% single buttonaccuracy, demonstrating that with sufficient samples of livewallpapers, Charger-Surfing can discern the true user inputsignal from the noise signal of the moving background.
To fully address the leakage channel exploited by Charger-Surfing, one solution is to eliminate the leakage channel byinserting a low pass filter in the charging circuitry of thedevice. This modification will remove the informative highfrequency component from the signal. In a preliminary testing,we applied a low-pass filter with a cutoff of 60Hz to the col-lected iPhone 6+ cross-device data and the accuracy droppedto 10% (expected accuracy of random guessing). This resultdemonstrates that this approach can effectively mitigate theinformation leakage that Charger-Surfing relies upon.
Until an effective countermeasure is widely adopted, it isimportant for users to be increasingly aware of the securitythreats associated with USB charging. Users should avoid in-putting a passcode or other sensitive information while charg-ing their smartphones in public or shared environments.
8 Related Work
In this section, we briefly survey the research efforts thatinspire our work and highlight the differences between ourwork and previous research. We mainly discuss research workin the following four areas:
Smartphone authentication. Smartphones are commonlyequipped with two popular authentication methods: numeric-based passcodes or pattern-based passcodes. Both methods,however, are vulnerable to various types of attacks, includ-ing shoulder surfing [50], smudges [13], and keyloggers [19].Previous work has demonstrated that sensory data (e.g, ac-celerometer, gyroscope, and orientation) can be used to extracta user’s input on the touchscreen [43, 46, 63]. In addition toin-device sensors, attackers can also utilize acoustic signalsto infer keystroke information on physical keyboards [17, 73].Recently, Zhou et al. [72] proposed PatternListener to crackAndroid’s pattern lock password through the acoustic signalsgathered by a malicious application accessing the in-devicemicrophone. Unlike these works, our work does not requiremalicious apps to be installed on the target smartphone.
Another type of keystroke inference on smartphone de-vices leverages video recording [66], where attackers use acamera to record finger behaviors [49, 62, 67] or the users’movements [55]. The reflections off of an eyeball, capturedby special equipment, can also be exploited to leak device
passwords [14,15,26]. Our work differs from these in that ourapproach does not require attackers to be in close physicalproximity to the victim.
Other authentication methods utilize physiological biomet-rics (e.g., face [56]) and behavioral biometrics for authentica-tion, including touch patterns [71], gait [40, 61], hand move-ments, and grasp features [38,52]. However, these approachescan suffer from replay attacks and insufficient accuracy anddo not satisfy industry requirements.
Power analysis. Extensive efforts have been devoted to ana-lyzing the power consumption of smartphones [18,39,47,48].Carroll et al. [20] presented a detailed analysis showing thatthe touchscreen is one of the major consumers of power in asmartphone. Furthermore, many works [24, 29, 68] attempt tounderstand the energy consumed by the touchscreen.
The power consumption of a smartphone could be exploitedas a side channel to extract information such as mobile appli-cation usage [25] or password length [64]. Yang et al. demon-strated that public USB charging stations allow attackers toidentify the webpages being loaded when a smartphone isbeing charged [65]. Michalevsky et al. [42] demonstrated thatpower consumption could be used to infer the location of mo-bile devices. Spolaor et al. [53] showed that the USB chargingcable can be used to build a covert channel on smartphonesby controlling a CPU-intensive app over 20 minutes. To thebest of our knowledge, we are the first to show that the powerconsumption of a smartphone can be used to infer animationson a touchscreen and steal sensitive data, such as a user’spasscode.
Other side channel attacks. Chen [23] demonstrated thatthe shared procfs in the Linux system could be exploitedto infer an Android device’s activities and launch UI infer-ence attacks. Without procfs (e.g., iOS devices), attackers canstill infer sensitive information and private data by exploitingexposed APIs [69]. Genkin et al. [32] acquired secret-keyinformation from electromagnetic signals by attaching a mag-netic probe to a smartphone. Radiated RF signals can alsobe used to eavesdrop screen contents remotely [41]. Recentresearch [33] has also shown the possibility to infer broadinformation on large computer monitors via acoustic emana-tions from the voltage regulator. Similar to traditional comput-ers, smartphones are also vulnerable to classical cache-basedside-channel attacks [70]. Our work differs from these priorworks by showing much finer grained information leakage ofscreen animation locations through the power line.
USB and other power vulnerabilities. As modern smart-phones rely on USB to charge their batteries, multiple vulner-abilities have been found in the USB interface [60], includingtraffic monitoring [45], crosstalk leakage [54], keyloggingside channels [44], malicious command execution [58], andtrust exploitation [16]. While prior research has tried to fil-ter malicious USB actions [57, 59], our work demonstratesthat, even without any data transmission over the USB cable,

the power consumed can be exploited to extract fine-grainedinformation such as user passcodes.
While ethernet over power line techniques have been uti-lized in both homes and data centers [22], Guri et al. demon-strated the possibilities of building covert channels over apower line [35]. Prior research has also shown that powerconsumption information can lead to various privacy issues,including key extraction on cryptographic systems [37] andlaptops [34], state inference of home appliances [30], web-page identification of computers [27] and laptop user recog-nition [28]. Unlike these attacks, our work classifies ten on-screen animations in real time, directly exposing precise userinput over the charging port.
9 Conclusion
This paper reveals a serious security threat, called Charger-Surfing, which exploits the power leakage of smartphones toinfer the location of animations played on the touchscreenand steal sensitive information such as a user’s passcode. Thebasic mechanism of Charger-Surfing monitors the power traceof a charging smartphone and extract button presses by lever-aging signal processing and neural network techniques onthe acquired signals. To assess the security risk of Charger-Surfing, we conduct a comprehensive evaluation of differenttypes of smartphones and different users. Our evaluation re-sults indicate that Charger-Surfing is victim-independent andachieves high accuracy when inferring a smartphone passcode(an average of 99.3% and 96.9% success rates when crackinga 4-digit and 6-digit passcode in five attempts, respectively).Furthermore, we build and test a portable, low-cost powertrace collection system to launch a Charger-Surfing attackin practice. We then utilize this system to demonstrate thatCharger-Surfing works well in real settings across differentuser configurations and devices. Finally, we present differentcountermeasures to thwart Charger-Surfing and discuss theirfeasibility.
Acknowledgement
We would like to thank the anonymous reviewers for theirinsightful and detailed comments, which helped us to improvethe quality of this work. This work was supported in part bythe US ONR grant N00014-20-1-2153, ARO grant W911NF-19-1-0049, NSF grants CNS-2054657 and CPS-1739390.
References
[1] Behind The Charge: A Big Challenge for Hos-pitals. http://www.mkelements.com/blog/
behind-charge-big-challenge-hospitals.
[2] Briant Park Blog: Solar-Powered Charging Stations Landin Bryant Park. http://blog.bryantpark.org/2014/07/solar-powered-charging-stations-land-in.html.
[3] Chargeport Hotel Charging Station. http://www.teleadapt.com/hospitality-products/powercharging/
chargeport.
[4] Evil Maid Attack. https://en.wikipedia.org/wiki/
Evil_maid_attack.
[5] Hackers Claim ‘Any’ Smartphone FingerprintLock Can Be Broken In 20 Minutes. https:
//www.forbes.com/sites/daveywinder/2019/11/02/
smartphone-security-alert-as-hackers-claim-any-
fingerprint-lock-broken-in-20-minutes/.
[6] Phone Battery Statistics Across Major US Cities. https://veloxity.us/phone-battery-statistics/.
[7] Phone Chargers: China’s Latest Sharing EconomyFad. http://www.sixthtone.com/news/2182/
phone-chargers-chinas-latest-sharing-economy-fad.
[8] Please Stop Charging Your Phone in Public Ports.https://money.cnn.com/2017/02/15/technology/
public-ports-charging-bad-stop/index.html.
[9] Politician’s Fingerprint ’Cloned from Photos’ by Hacker.https://www.bbc.com/news/technology-30623611.
[10] Power Up: A Guide to US Airport Charging Sta-tions. http://www.cheapflights.com/news/
power-up-a-guide-to-us-airport-charging-stations/
#ewr.
[11] Solar-Powered Phone Charging Stations Launch inUnion Square. https://www.dnainfo.com/new-york/
20130620/union-square/solar-powered-phone-
chargingstations-launch-union-squarer.
[12] Adam Aviv, John Davin, Flynn Wolf, and Ravi Kuber. TowardsBaselines for Shoulder Surfing on Mobile Authentication. InProceedings of the 33rd Annual Computer Security Applica-
tions Conference, 2017.
[13] Adam Aviv, Katherine Gibson, Evan Mossop, Matt Blaze, andJonathan M Smith. Smudge Attacks on Smartphone TouchScreens. Proceedings of 4th USENIX Workshop on Offensive
Technologies, 2010.
[14] Michael Backes, Tongbo Chen, Markus Duermuth, HendrikLensch, and Martin Welk. Tempest in a Teapot: Compromis-ing Reflections Revisited. In Proceedings of the 30th IEEE
Symposium on Security and Privacy, 2009.
[15] Michael Backes, Markus Dürmuth, and Dominique Unruh.Compromising Reflections-or-How to Read LCD monitorsaround the Corner. In Proceedings of the 29th IEEE Sympo-
sium on Security and Privacy, 2008.
[16] Darrin Barrall and David Dewey. Plug and Root, the USB Keyto the Kingdom. Presentation at Black Hat Briefings, 2005.
[17] Yigael Berger, Avishai Wool, and Arie Yeredor. DictionaryAttacks Using Keyboard Acoustic Emanations. In Proceedings
of the 13th ACM conference on Computer and Communications
Security, 2006.
[18] Niels Brouwers, Marco Zuniga, and Koen Langendoen. NEAT:a Novel Energy Analysis Toolkit for Free-Roaming Smart-phones. In Proceedings of the 12th ACM Conference on Em-
bedded Network Sensor Systems, 2014.
[19] Liang Cai and Hao Chen. TouchLogger: Inferring Keystrokeson Touch Screen from Smartphone Motion. Proceedings of
the USENIX HotSec, 2011.

[20] Aaron Carroll and Gernot Heiser. An Analysis of Power Con-sumption in a Smartphone. In Proceedings of the USENIX
Annual Technical Conference, 2010.
[21] Hai-Wei Chen, Jiun-Haw Lee, Bo-Yen Lin, Stanley Chen, andShin-Tson Wu. Liquid Crystal Display and Organic Light-Emitting Diode Display: Present Status and Future Perspec-tives. Light: Science & Applications, 2018.
[22] Li Chen, Jiacheng Xia, Bairen Yi, and Kai Chen. PowerMan:An Out-of-Band Management Network for Datacenters Us-ing Power Line Communication. In Proceedings of the 15th
USENIX Symposium on Networked Systems Design and Imple-
mentation, 2018.
[23] Qi Alfred Chen, Zhiyun Qian, and Zhuoqing Morley Mao.Peeking into Your App without Actually Seeing It: UI StateInference and Novel Android Attacks. In Proceedings of the
23rd USENIX Security Symposium, 2014.
[24] Xiang Chen, Yiran Chen, Zhan Ma, and Felix Fernandes. Howis Energy Consumed in Smartphone Display Applications? InProceedings of the 14th ACM Workshop on Mobile Computing
Systems and Applications, 2013.
[25] Yimin Chen, Xiaocong Jin, Jingchao Sun, Rui Zhang, andYanchao Zhang. POWERFUL: Mobile App Fingerprinting viaPower Analysis. In Proceedings of the IEEE Conference on
Computer Communications, 2017.
[26] Yimin Chen, Tao Li, Rui Zhang, Yanchao Zhang, and TerriHedgpeth. EyeTell: Video-Assisted Touchscreen KeystrokeInference from Eye Movements. In Proceedings of the 2018
IEEE Symposium on Security and Privacy, 2018.
[27] Shane Clark, Hossen Mustafa, Benjamin Ransford, Jacob Sor-ber, Kevin Fu, and Wenyuan Xu. Current Events: IdentifyingWebpages by Tapping the Electrical Outlet. In European Sym-
posium on Research in Computer Security. Springer, 2013.
[28] Mauro Conti, Michele Nati, Enrico Rotundo, and Riccardo Spo-laor. Mind the Plug! Laptop-User Recognition Through PowerConsumption. In Proceedings of the 2nd ACM International
Workshop on IoT Privacy, Trust, and Security, 2016.
[29] Mian Dong and Lin Zhong. Chameleon: a Color-Adaptive WebBrowser for Mobile OLED Displays. In Proceedings of the
9th International Conference on Mobile Systems, Applications,
and Services, 2011.
[30] Jingyao Fan, Qinghua Li, and Guohong Cao. Privacy Disclo-sure Through Smart Meters: Reactive Power Based Attack andDefense. In Proceedings of the 47th Annual IEEE/IFIP Inter-
national Conference on Dependable Systems and Networks,2017.
[31] Dinei Florencio and Cormac Herley. A Large-Scale Study ofWeb Password Habits. In Proceedings of the 16th International
Conference on World Wide Web. ACM, 2007.
[32] Daniel Genkin, Lev Pachmanov, Itamar Pipman, Eran Tromer,and Yuval Yarom. ECDSA Key Extraction from Mobile De-vices via Nonintrusive Physical Side Channels. In Proceedings
of the 2016 ACM SIGSAC Conference on Computer and Com-
munications Security, 2016.
[33] Daniel Genkin, Mihir Pattani, Roei Schuster, and Eran Tromer.Synesthesia: Detecting screen content via remote acoustic side
channels. In IEEE Symposium on Security and Privacy (SP),2019.
[34] Daniel Genkin, Itamar Pipman, and Eran Tromer. Get YourHands off My Laptop: Physical Side-Channel Key-ExtractionAttacks on PCs. Journal of Cryptographic Engineering, 2015.
[35] Mordechai Guri, Boris Zadov, Dima Bykhovsky, and YuvalElovici. PowerHammer: Exfiltrating Data from Air-GappedComputers through Power Lines. IEEE Transactions on Infor-
mation Forensics and Security, 2020.
[36] Hassan Ismail Fawaz, Germain Forestier, Jonathan Weber,Lhassane Idoumghar, and Pierre-Alain Muller. Deep Learningfor Time Series Classification: A Review. Data Mining and
Knowledge Discovery, 2019.
[37] Paul Kocher, Joshua Jaffe, and Benjamin Jun. DifferentialPower Analysis. In Proceedings of the Annual International
Cryptology Conference. Springer, 1999.
[38] Lingjun Li, Xinxin Zhao, and Guoliang Xue. Unobservable Re-Authentication for Smartphones. In Proceedings of the 20th
Network and Distributed System Security Symposium, 2013.
[39] Xiao Ma, Peng Huang, Xinxin Jin, Pei Wang, Soyeon Park,Dongcai Shen, Yuanyuan Zhou, Lawrence Saul, and GeoffreyVoelker. Edoctor: Automatically Diagnosing Abnormal Bat-tery Drain Issues on Smartphones. In Proceedings of the 10th
USENIX Symposium on Networked Systems Design and Imple-
mentation, 2013.
[40] Jani Mantyjarvi, Mikko Lindholm, Elena Vildjiounaite, S-MMakela, and HA Ailisto. Identifying Users of Portable De-vices from Gait Pattern with Accelerometers. In Proceedings
of IEEE International Conference on Acoustics, Speech, and
Signal Processing, 2005.
[41] Martin Marinov. TempestSDR. https://github.com/
martinmarinov/TempestSDR, 2013.
[42] Yan Michalevsky, Aaron Schulman, Gunaa Arumugam Veera-pandian, Dan Boneh, and Gabi Nakibly. PowerSpy: LocationTracking Using Mobile Device Power Analysis. In Proceed-
ings of the 24th USENIX Security Symposium, 2015.
[43] Emiliano Miluzzo, Alexander Varshavsky, Suhrid Balakrish-nan, and Romit Roy Choudhury. Tapprints: Your Finger TapsHave Fingerprints. In Proceedings of the 10th ACM Inter-
national Conference on Mobile Systems, Applications, and
Services, 2012.
[44] John Monaco. SoK: Keylogging Side Channels. In Proceed-
ings of the 2018 IEEE Symposium on Security and Privacy.IEEE, 2018.
[45] Matthias Neugschwandtner, Anton Beitler, and Anil Kurmus.A Transparent Defense Against USB Eavesdropping Attacks.In Proceedings of the 9th ACM European Workshop on System
Security, 2016.
[46] Emmanuel Owusu, Jun Han, Sauvik Das, Adrian Perrig, andJoy Zhang. ACCessory: Password Inference Using Accelerom-eters on Smartphones. In Proceedings of the 12th ACM Work-
shop on Mobile Computing Systems and Applications, 2012.
[47] Abhinav Pathak, Charlie Hu, and Ming Zhang. Where is theEnergy Spent Inside My App?: Fine Grained Energy Account-ing on Smartphones with eprof. In Proceedings of the 7th ACM
European Conference on Computer Systems, 2012.

[48] Abhinav Pathak, Charlie Hu, Ming Zhang, Paramvir Bahl, andYi-Min Wang. Fine-Grained Power Modeling for SmartphonesUsing System Call Tracing. In Proceedings of the 6th ACM
Conference on Computer Systems, 2011.
[49] Rahul Raguram, Andrew White, Dibyendusekhar Goswami,Fabian Monrose, and Jan-Michael Frahm. iSpy: Automatic Re-construction of Typed Input from Compromising Reflections.In Proceedings of the 18th ACM Conference on Computer and
Communications Security, 2011.
[50] J Rogers. Please Enter Your Four-Digit Pin. Financial Services
Technology, US Edition, 2007.
[51] Len Sherman. The Basics of USB Battery Charging: A Sur-vival Guide. Maxim Integrated Products, Inc, 2010.
[52] Zdenka Sitová, Jaroslav Šedenka, Qing Yang, Ge Peng, GangZhou, Paolo Gasti, and Kiran Balagani. HMOG: New Be-havioral Biometric Features for Continuous Authentication ofSmartphone Users. IEEE Transactions on Information Foren-
sics and Security, 2016.
[53] Riccardo Spolaor, Laila Abudahi, Veelasha Moonsamy, MauroConti, and Radha Poovendran. No Free Charge Theorem: ACovert Channel via USB Charging Cable on Mobile Devices.In International Conference on Applied Cryptography and
Network Security. Springer, 2017.
[54] Yang Su, Daniel Genkin, Damith Ranasinghe, and Yuval Yarom.USB Snooping Made Easy: Crosstalk Leakage Attacks on USBHubs. In Proceedings of the 26th USENIX Security Symposium,2017.
[55] Jingchao Sun, Xiaocong Jin, Yimin Chen, Jinxue Zhang, Yan-chao Zhang, and Rui Zhang. VISIBLE: Video-AssistedKeystroke Inference from Tablet Backside Motion. In Pro-
ceedings of the 23rd Network and Distributed System Security
Symposium, 2016.
[56] Di Tang, Zhe Zhou, Yinqian Zhang, and Kehuan Zhang. FaceFlashing: a Secure Liveness Detection Protocol based on LightReflections. Proceedings of the 25th Network and Distributed
System Security Symposium, 2018.
[57] Dave Jing Tian, Adam Bates, and Kevin Butler. DefendingAgainst Malicious USB Firmware with GoodUSB. In Pro-
ceedings of the 31st Annual Computer Security Applications
Conference, 2015.
[58] Dave (Jing) Tian, Grant Hernandez, Joseph I. Choi, VanessaFrost, Christie Raules, Patrick Traynor, Hayawardh Vijayaku-mar, Lee Harrison, Amir Rahmati, Michael Grace, and KevinButler. ATtention Spanned: Comprehensive Vulnerability Anal-ysis of AT Commands Within the Android Ecosystem. InProceedings of the 27th USENIX Security Symposium, 2018.
[59] Dave (Jing) Tian, Nolen Scaife, Adam Bates, Kevin Butler, andPatrick Traynor. Making USB Great Again with USBFILTER.In Proceedings of the 25th USENIX Security Symposium, 2016.
[60] J. Tian, N. Scaife, D. Kumar, M. Bailey, A. Bates, and K. Butler.SoK: "Plug Pray" Today – Understanding USB Insecurity inVersions 1 Through C. In 2018 IEEE Symposium on Security
and Privacy, May 2018.
[61] Weitao Xu, Guohao Lan, Qi Lin, Sara Khalifa, Neil Bergmann,Mahbub Hassan, and Wen Hu. Keh-Gait: Towards a Mobile
Healthcare User Authentication System by Kinetic Energy Har-vesting. In Proceedings of the 24th Network and Distributed
System Security Symposium, 2017.
[62] Yi Xu, Jared Heinly, Andrew White, Fabian Monrose, and Jan-Michael Frahm. Seeing Double: Reconstructing ObscuredTyped Input from Repeated Compromising Reflections. InProceedings of the 2013 ACM SIGSAC conference on Com-
puter and communications security, 2013.
[63] Zhi Xu, Kun Bai, and Sencun Zhu. Taplogger: Inferring UserInputs on Smartphone Touchscreens Using On-Board MotionSensors. In Proceedings of the 5th ACM Conference on Secu-
rity and Privacy in Wireless and Mobile Networks, 2012.
[64] Lin Yan, Yao Guo, Xiangqun Chen, and Hong Mei. A Studyon Power Side Channels on Mobile Devices. In Proceedings
of the 7th Asia-Pacific Symposium on Internetware, 2015.
[65] Qing Yang, Paolo Gasti, Gang Zhou, Aydin Farajidavar, and Ki-ran Balagani. On Inferring Browsing Activity on Smartphonesvia USB Power Analysis Side-Channel. IEEE Transactions on
Information Forensics and Security, 2017.
[66] Guixin Ye, Zhanyong Tang, Dingyi Fang, Xiaojiang Chen,Kwang In Kim, Ben Taylor, and Zheng Wang. Cracking An-droid Pattern Lock in Five Attempts. In Proceedings of the 24th
Network and Distributed System Security Symposium, 2017.
[67] Qinggang Yue, Zhen Ling, Xinwen Fu, Benyuan Liu, Kui Ren,and Wei Zhao. Blind Recognition of Touched Keys on MobileDevices. In Proceedings of the 2014 ACM SIGSAC Conference
on Computer and Communications Security, 2014.
[68] Lide Zhang, Birjodh Tiwana, Zhiyun Qian, Zhaoguang Wang,Robert Dick, Morley Mao, and Lei Yang. Accurate OnlinePower Estimation and Automatic Battery Behavior BasedPower Model Generation for Smartphones. In Proceedings of
the 8th IEEE/ACM/IFIP International Conference on Hard-
ware/Software Codesign and System Synthesis, 2010.
[69] Xiaokuan Zhang, Xueqiang Wang, Xiaolong Bai, YinqianZhang, and XiaoFeng Wang. OS-level Side Channels withoutProcfs: Exploring Cross-App Information Leakage on iOS.In Proceedings of the 25th Network and Distributed System
Security Symposium, 2018.
[70] Xiaokuan Zhang, Yuan Xiao, and Yinqian Zhang. Return-Oriented Flush-Reload Side Channels on ARM and their Im-plications for Android Devices. In Proceedings of the 2016
ACM SIGSAC Conference on Computer and Communications
Security, 2016.
[71] Nan Zheng, Kun Bai, Hai Huang, and Haining Wang. You AreHow You Touch: User Verification on Smartphones via Tap-ping Behaviors. In Proceedings of the IEEE 22nd International
Conference on Network Protocols, 2014.
[72] Man Zhou, Qian Wang, Jingxiao Yang, Qi Li, Feng Xiao, ZhiboWang, and Xiaofen Chen. PatternListener: Cracking AndroidPattern Lock Using Acoustic Signals. In Proceedings of the
2018 ACM SIGSAC Conference on Computer and Communi-
cations Security, 2018.
[73] Li Zhuang, Feng Zhou, and Doug Tygar. Keyboard AcousticEmanations Revisited. ACM Transactions on Information and
System Security, 2009.

Appendices
A Additional Figures and Tables
Table 9: Smartphones Used For Evaluation
Phone (Release Year) OS Processor GPUScreen
Resolution Technology
Motorola G4 (2016) Android 6.0.14 x 1.5 GHz A-534 x 1.2 GHz A-53
Adreno 405 1920x1080 LCD
Samsung Galaxy Nexus(2012)
Android 6.0.1 2 x 1.2 GHz A-9 PowerVR SGX540 1280x720 Super AMOLED
Apple iPhone 6+ (2014) iOS 12.1 2 x 1.4 GHz Typhoon PowerVR GX6450 1920x1080 LCD
Apple iPhone 8+ (2017) iOS 12.1.22 x 2.3 GHz Monsoon4 x 1.4 GHz Mistral
Apple GPU 1920x1080 LCD
Table 10: Classification Network Used for iPhone
iPhone Classification NetworkLayer Operation Kernel Size
1 Input 100000x12 Convolution 50x503 MaxPool 54 Convolution 50x505 MaxPool 56 Convolution 50x507 MaxPool 58 Convolution 50x509 GlobalAveragePool -10 Dropout 0.511 Dense 10
Table 11: Classification Network Used for Android
Android Classification NetworkLayer Operation Kernel Size
1 Input 800000x12 Convolution 100x1003 MaxPool 54 Convolution 50x755 MaxPool 56 Convolution 50x757 MaxPool 58 Convolution 50x759 GlobalAveragePool -
10 Dropout 0.511 Dense 10