Characterization of the cation-exchanged bentonites by XRPD, ATR, DTA/TG analyses and BET...
7
Chemical Engineering Journal 149 (2009) 242–248 Contents lists available at ScienceDirect Chemical Engineering Journal journal homepage: www.elsevier.com/locate/cej Characterization of the cation-exchanged bentonites by XRPD, ATR, DTA/TG analyses and BET measurement B. Caglar, B. Afsin ∗ , A. Tabak, E. Eren Department of Chemistry, Faculty of Arts and Sciences, Ondokuz Mayis University, Kurupelit, Samsun 55139 Turkey article info Article history: Received 23 July 2008 Received in revised form 15 October 2008 Accepted 30 October 2008 Keywords: Bentonite Cation exchange XRPD ATR Thermal analysis Surface area abstract X-ray powder diffraction (XRPD) analysis demonstrated that the main montmorillonite component of Unye bentonite was more effective in the Pb 2+ , Cu 2+ , Ni 2+ , Co 2+ , Zn 2+ , Al 3+ and Fe 3+ fixation processes in the interlayer space of the mineral than the nonclay fractions. All cation-exchanged bentonites experienced slight shifts in non-lattice bands whereas the features emerged at ∼3400 and 3200 cm −1 are unique to the newly inserted cations. The clay dehydration up to 150 ◦ C and then the release of the water of the cation hydration shell in the temperature range of 150–300 ◦ C were followed by dehydroxilation between 300 and 700 ◦ C, after which no water remains in the bentonite structure. Additional features observed at elevated temperatures were assigned to the cation migration and the collapse of the clay framework. The surface areas of the Zn- and Fe-bentonites and those of the Pb-, Cu-, Ni-, Co- and Al-bentonites were found to be much higher and lower than that of raw bentonite, respectively, which were explained by the emergence of the micropores and medium mesopores in the interlayer spacings of the samples, respectively. © 2008 Elsevier B.V. All rights reserved. 1. Introduction Clay minerals, a large family of alumino-silicate structures with a range of chemical composition, structure and surface properties, are very reactive materials due to their small grain size, large sur- face area, adsorption properties and chemical variability. Therefore, they are of considerable recognition in all the physical, chemical and environmental processes in soils and sediments, and frequently control them [1–5]. The industrial application of clays is enormous and grows with our ability to engineer their properties and use them in the production of composite materials [6–10]. In addition, clays are able to retain inorganic and organic pollutants, and to stop the circulation of contaminated fluids in both aquatic and soil environments [11–13]. Montmorillonite, a dioctahedral clay with the 2:1 layer link- age, has a high cation-exchange capacity (CEC) ranging from 70 to 130 meq/100 g, most of which is due to the isomorphous substi- tution of its main cations, Si 4+ and Al 3+ within the structure with cations of lower valency, but a lesser amount is due to the charges at the edge of the sheets [14,15]. The cation substitutions mainly take place in the octahedral sheets and may induce an enormous change in the physicochemical properties of clay minerals [16–20]. ∗ Corresponding author. Tel.: +90 362 3121919; fax: +90 362 4576081. E-mail address: [email protected] (B. Afsin). The use of modified clays with traditional clays as low-cost, effec- tive catalyst materials for the removal of metal ions from industrial effluents and wastewaters through ion exchange or surface com- plexation has been of great relevance for both applications and our understanding of natural processes [21–27]. In present work, X-ray powder diffraction (XRPD), attenuated total reflection (ATR) spectroscopy, thermal analysis (DTA/TG) and surface area measurement (BET) techniques were employed to characterise Pb-, Cu-, Ni-, Co-, Zn-, Al- and Fe-bentonites, which were derived from Ca-exchanged bentonite samples. 2. Experimental 2.1. Materials NaCl (Sigma, 99.5%), CaCl 2 ·6H 2 O (Merck, 99.0%), CoCl 2 ·6H 2 O (Merck, 98.0%), CuCl 2 ·2H 2 O (Merck, 99.9%), NiCl 2 ·6H 2 O (Merck, 99.9%), FeCl 3 ·6H 2 O (Merck, 98.0%), AlCl 3 ·6H 2 O (Merck, 99%), PbCl 2 (Merck, 99.9%) and ZnCl 2 (Merck, 99.9%) were used for preparing the cation-exchanged Unye bentonite samples. 2.2. Preparation of Na- and Ca-bentonite samples Chemical composition of Unye bentonite (UB) which is an important mineral resource of Turkey was given in Table 1. 5 g of raw UB was washed with deionized water several times and dried at 1385-8947/$ – see front matter © 2008 Elsevier B.V. All rights reserved. doi:10.1016/j.cej.2008.10.028
Transcript of Characterization of the cation-exchanged bentonites by XRPD, ATR, DTA/TG analyses and BET...
Cb
BD
a
ARRA
KBCXATS
1
aaftacatcse
attcatc
1d
Chemical Engineering Journal 149 (2009) 242–248
Contents lists available at ScienceDirect
Chemical Engineering Journal
journa l homepage: www.e lsev ier .com/ locate /ce j
haracterization of the cation-exchanged bentonitesy XRPD, ATR, DTA/TG analyses and BET measurement
. Caglar, B. Afsin ∗, A. Tabak, E. Erenepartment of Chemistry, Faculty of Arts and Sciences, Ondokuz Mayis University, Kurupelit, Samsun 55139 Turkey
r t i c l e i n f o
rticle history:eceived 23 July 2008eceived in revised form 15 October 2008ccepted 30 October 2008
eywords:
a b s t r a c t
X-ray powder diffraction (XRPD) analysis demonstrated that the main montmorillonite component ofUnye bentonite was more effective in the Pb2+, Cu2+, Ni2+, Co2+, Zn2+, Al3+ and Fe3+ fixation processes in theinterlayer space of the mineral than the nonclay fractions. All cation-exchanged bentonites experiencedslight shifts in non-lattice bands whereas the features emerged at ∼3400 and 3200 cm−1 are unique tothe newly inserted cations. The clay dehydration up to 150 ◦C and then the release of the water of the
◦
entoniteation exchangeRPDTRhermal analysisurface areacation hydration shell in the temperature range of 150–300 C were followed by dehydroxilation between300 and 700 ◦C, after which no water remains in the bentonite structure. Additional features observedat elevated temperatures were assigned to the cation migration and the collapse of the clay framework.The surface areas of the Zn- and Fe-bentonites and those of the Pb-, Cu-, Ni-, Co- and Al-bentoniteswere found to be much higher and lower than that of raw bentonite, respectively, which were explainedby the emergence of the micropores and medium mesopores in the interlayer spacings of the samples,
Ttepu
tscw
2
2
(9
respectively.
. Introduction
Clay minerals, a large family of alumino-silicate structures withrange of chemical composition, structure and surface properties,re very reactive materials due to their small grain size, large sur-ace area, adsorption properties and chemical variability. Therefore,hey are of considerable recognition in all the physical, chemicalnd environmental processes in soils and sediments, and frequentlyontrol them [1–5]. The industrial application of clays is enormousnd grows with our ability to engineer their properties and usehem in the production of composite materials [6–10]. In addition,lays are able to retain inorganic and organic pollutants, and totop the circulation of contaminated fluids in both aquatic and soilnvironments [11–13].
Montmorillonite, a dioctahedral clay with the 2:1 layer link-ge, has a high cation-exchange capacity (CEC) ranging from 70o 130 meq/100 g, most of which is due to the isomorphous substi-ution of its main cations, Si4+ and Al3+ within the structure with
ations of lower valency, but a lesser amount is due to the chargest the edge of the sheets [14,15]. The cation substitutions mainlyake place in the octahedral sheets and may induce an enormoushange in the physicochemical properties of clay minerals [16–20].∗ Corresponding author. Tel.: +90 362 3121919; fax: +90 362 4576081.E-mail address: [email protected] (B. Afsin).
(t
2
ir
385-8947/$ – see front matter © 2008 Elsevier B.V. All rights reserved.oi:10.1016/j.cej.2008.10.028
© 2008 Elsevier B.V. All rights reserved.
he use of modified clays with traditional clays as low-cost, effec-ive catalyst materials for the removal of metal ions from industrialffluents and wastewaters through ion exchange or surface com-lexation has been of great relevance for both applications and ournderstanding of natural processes [21–27].
In present work, X-ray powder diffraction (XRPD), attenuatedotal reflection (ATR) spectroscopy, thermal analysis (DTA/TG) andurface area measurement (BET) techniques were employed toharacterise Pb-, Cu-, Ni-, Co-, Zn-, Al- and Fe-bentonites, whichere derived from Ca-exchanged bentonite samples.
. Experimental
.1. Materials
NaCl (Sigma, 99.5%), CaCl2·6H2O (Merck, 99.0%), CoCl2·6H2OMerck, 98.0%), CuCl2·2H2O (Merck, 99.9%), NiCl2·6H2O (Merck,9.9%), FeCl3·6H2O (Merck, 98.0%), AlCl3·6H2O (Merck, 99%), PbCl2Merck, 99.9%) and ZnCl2 (Merck, 99.9%) were used for preparinghe cation-exchanged Unye bentonite samples.
.2. Preparation of Na- and Ca-bentonite samples
Chemical composition of Unye bentonite (UB) which is anmportant mineral resource of Turkey was given in Table 1. 5 g ofaw UB was washed with deionized water several times and dried at
B. Caglar et al. / Chemical Engineerin
Table 1Chemical analysis results of raw Unye bentonite.
CC
1isde7
2
tCuit
utm
2
pwtbfilgaTatmosphere at a heating rate of 10 ◦C min−1. Calcinated �-alumina
FA
onstituent SiO2 Al2O3 Fe2O3 CaO MgO Na2O K2Oonstituent (%) 62.0 20.10 2.16 2.29 3.64 0.27 2.53
05 ◦C and then centrifuged. The bentonite sample was homoion-zed by treating with 100 ml of 0.1 M NaCl and CaCl2 solutionseparately. The Na- and Ca-bentonite products thus obtained wereried at 105 ◦C and sieved to 38–108 �m and then kept for otherxperimental procedures. The CEC value of UB was determined as4 meq/100 g clay by methylene blue adsorption technique [28].
.3. Preparation of cation-exchanged bentonites
The Ca-bentonite sample prepared as described above was2+ 2+ 2+
reated with 100 ml of 0.1 M MClx·nH2O (M:Pb , Cu , Ni ,o2+, Zn2+, Al3+, Fe3+) solutions at room temperature for 24 hnder vigorous stirring. The products were washed with deion-
zed water thoroughly and the supernatants were filtered off andhe solid parts were washed with deionized water repeatedly
wtQ2
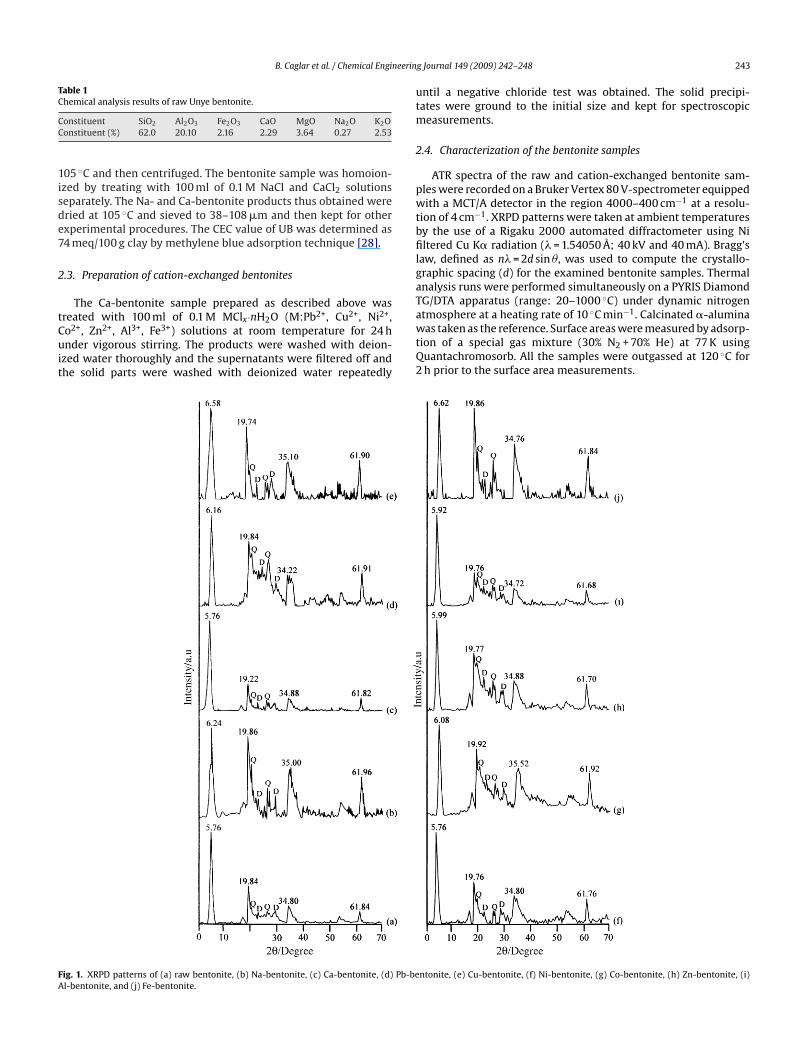
ig. 1. XRPD patterns of (a) raw bentonite, (b) Na-bentonite, (c) Ca-bentonite, (d) Pb-bel-bentonite, and (j) Fe-bentonite.
g Journal 149 (2009) 242–248 243
ntil a negative chloride test was obtained. The solid precipi-ates were ground to the initial size and kept for spectroscopic
easurements.
.4. Characterization of the bentonite samples
ATR spectra of the raw and cation-exchanged bentonite sam-les were recorded on a Bruker Vertex 80 V-spectrometer equippedith a MCT/A detector in the region 4000–400 cm−1 at a resolu-
ion of 4 cm−1. XRPD patterns were taken at ambient temperaturesy the use of a Rigaku 2000 automated diffractometer using Niltered Cu K� radiation (� = 1.54050 Å; 40 kV and 40 mA). Bragg’s
aw, defined as n� = 2d sin �, was used to compute the crystallo-raphic spacing (d) for the examined bentonite samples. Thermalnalysis runs were performed simultaneously on a PYRIS DiamondG/DTA apparatus (range: 20–1000 ◦C) under dynamic nitrogen
as taken as the reference. Surface areas were measured by adsorp-ion of a special gas mixture (30% N2 + 70% He) at 77 K usinguantachromosorb. All the samples were outgassed at 120 ◦C forh prior to the surface area measurements.
ntonite, (e) Cu-bentonite, (f) Ni-bentonite, (g) Co-bentonite, (h) Zn-bentonite, (i)

244 B. Caglar et al. / Chemical Engineerin
Table 2XRPD data of raw Unye bentonite.
Diffraction plane 2� d (Å) Intensity(%)
Peak area(%)
0 0 1 5.76 15.33 100 1000 0 3 17.60 5.03 7.2 8.30 2 0–1 1 0 19.84 4.47 43.1 37.8Quartz (1 0 0) 20.88 4.25 2.6 0.4Dolomite (1 0 2) 23.43 3.79 6.1 1.8Quartz (1 0 1) 26.81 3.32 5.2 3.8D10
3
3
m14o(vacrmatai(sbtarifib[st
6atamttdtrp6sbnb1a
twdtT2o(aarad4aoanmontmorillonite which is weaker than the (0 2 0) diffraction peakand it is observed at 6.62(2�) with a distance of 13.10 Å (Fig. 1j).The minimum d0 0 1 value is unique for Fe-bentonite among all thecation-exchanged samples studied here. The variations and differ-
olomite (1 0 4) 29.83 2.99 6.5 6.13 0–2 0 0 34.80 2.58 20.2 27.56 0–0 3 3 61.84 1.50 11.1 7.5
. Results and discussion
.1. XRPD data of raw and cation-exchanged bentonites
The d0 0 1, d0 0 3, d0 2 0–1 1 0, d1 3 0–2 0 0 and d0 6 0 diffractions of theain montmorillonite (M) component of raw UB are seen at 5.76,
7.60, 19.84, 34.80 and 61.84(2�) with the distances of 15.33, 5.03,.47, 2.58 and 1.50 Å, respectively (Fig. 1a and Table 2). The peaksriginating from the nonclay components (quartz (Q) and dolomiteD)) are observed at 20.88 and 26.81(2�) with the d1 0 0 and d1 0 1alues of 4.25 and 3.32 Å and at 23.43 and 29.83(2�) with the d1 0 2nd d1 0 4 values of 3.79 and 2.99 Å, respectively. It may be con-luded from the comparison of the intensities of the d0 0 1 peak ofaw UB and the diffractions of the nonclay components that theain component of bentonite is montmorillonite and the quartz
nd dolomite fractions are small. The high Mg and Ca contents ofhe raw bentonite (Table 1) illustrate the significant amount of Mg2+
nd Ca2+ contribution from dolomite to the framework Mg andnterlayer Ca cations whereas the higher d0 0 1 distance of raw UB15.33 Å) than that of Na-montmorillonite (12.04 Å) and the basalpacing values varying in the range 14.45–15.40 Å may be explainedy the presence of a calcium-rich bentonite sample [29]. However,he absence of the d0 0 1 peak at 9.98 Å in the XRPD pattern (Fig. 1a)nd the lack of characteristic illite vibrations in the ATR spectrum ofaw UB (Fig. 2a) rule out the presence of illite in the structure despitets low sodium content [30]. The d0 6 0 peak which is an importanteature used for identifying the type of smectites is located at 1.50 Ån the XRPD pattern of raw UB (Fig. 1a and Table 1) revealing that theentonite sample is an Al-rich 2:1 dioctahedral montmorillonite31]. In addition, it may be concluded referring to the highly inten-ive d0 2 0–1 1 0 features of the sample that Al is highly available inhe octahedral centres of UB [32].
The d0 0 1 peak of 15.33 Å at 5.76(2�) of raw bentonite shifts to.16(2�) (the distance: 14.34 Å) and d0 0 3 peak of 5.03 Å at 17.60(2�)ppears at 18.31(2�) with the distance of 4.84 Å in the XRPD pat-ern of Pb-bentonite (Fig. 1d). In addition, the d0 0 4 peak of 3.60 Åt 24.73(2�) is seen and the d0 2 0, d1 3 0–2 0 0 and d0 6 0 peaks ofontmorillonite are observed at 19.84, 34.22 and 61.91(2�) with
he distances of 4.47, 2.61 and 1.50 Å, respectively. Furthermore,he peaks from quartz are located at 20.97 and 27.20(2�) with theistances of 4.23 and 3.28 Å and the peaks of dolomite are posi-ioned at 23.44 and 29.85(2�) with the distances of 3.79 and 2.99 Å,espectively. The d0 0 1 peak of Cu-bentonite is quite weak and a neweak of nearly the equivalent intensity with the d0 2 0 peak arises at.58(2�) with the d value of 13.38 Å (Fig. 1e). Because of this inten-ity decrease, the peaks of the quartz and dolomite componentsecome prominent in the range from 30 to 70(2�). The insertion of
ickel cations does not seem to affect the d0 0 1 distance of the rawentonite and the diffraction peaks of montmorillonite emerge at7.92, 19.76, 34.80 and 61.76(2�) and those of quartz and dolomitere seen at 20.80 and 26.63(2�) and 23.38 and 29.64(2�), respec-FbA
g Journal 149 (2009) 242–248
ively (Fig. 1f). The d0 0 1 peak of Co-bentonite is located at 6.08(2�)ith a distance of 14.53 Å and the d0 0 3, d0 2 0–1 1 0, d1 3 0–2 0 0 and d0 6 0iffractions are observed at 18.16, 19.92, 35.52 and 61.92(2�) withhe distances of 4.88, 4.45, 2.53 and 1.50 Å, respectively (Fig. 1g).he peaks of the quartz and dolomite components are detected at1.04, 23.60(2�) and 26.96, 29.92(2�), respectively. The d0 0 1 peakf Zn-bentonite is observed at 5.99(2�) with a distance of 14.72 ÅFig. 1h) and the other diffraction peaks of bentonite are positionedt 18.08, 19.77, 34.88 and 61.70(2�). The diffraction peaks of quartznd dolomite are placed at 20.89, 26.88(2�) and 23.37, 29.76(2�),espectively. The d0 0 1 peak is observed as an intensified featuret 5.92(2�) with a distance of 14.91 Å when Al3+ cation is intro-uced into the interlayer of the clay and the distances of 4.86..49. 2.58 and 1.50 Å correspond to the d0 0 3, d0 2 0–1 1 0, d1 3 0–2 0 0,nd d0 6 0 diffractions, respectively (Fig. 1i). Furthermore, the peaksf quartz are seen at 20.96 and 26.73(2�) and those of dolomitere located at 23.38 and 29.83(2�). The peaks of nonclay compo-ents become prominent for Fe-bentonite due to the d0 0 1 peak of
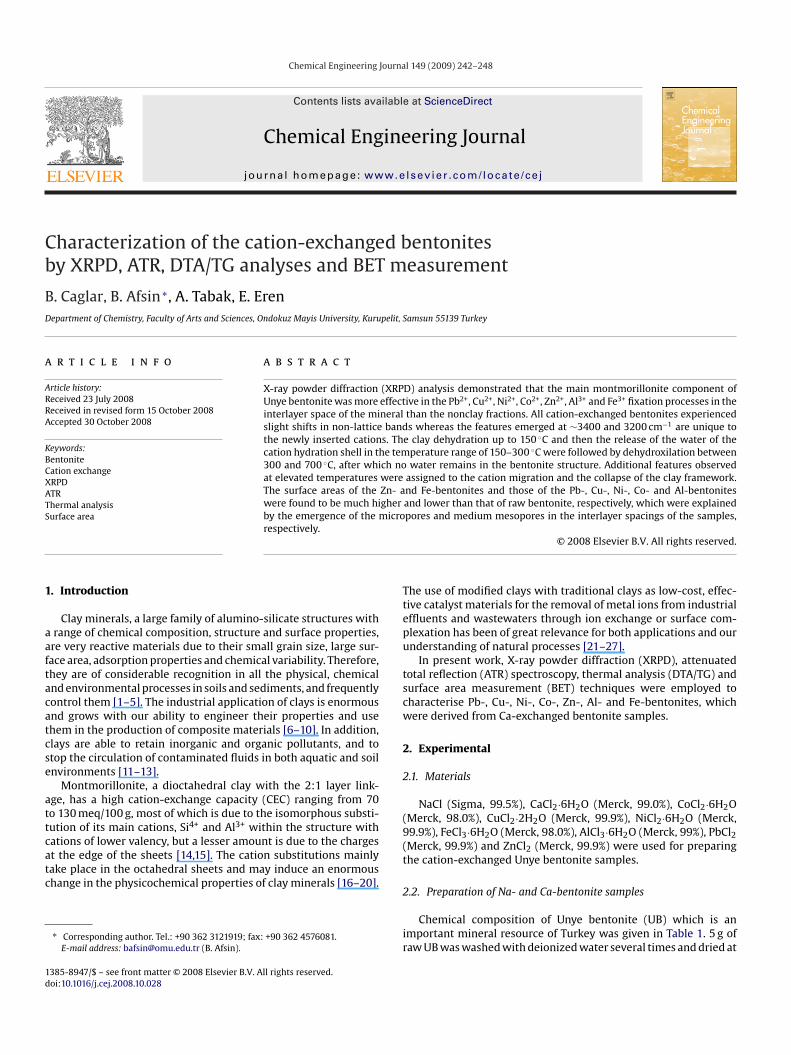
ig. 2. ATR spectra of (a) raw bentonite, (b) Na-bentonite, (c) Ca-bentonite, (d) Pb-entonite, (e) Cu-bentonite, (f) Ni-bentonite, (g) Co-bentonite, (h) Zn-bentonite, (i)l-bentonite, and (j) Fe-bentonite.
B. Caglar et al. / Chemical Engineerin
Table 3d0 0 1 values of raw and cation-exchanged Unye bentonite samples.
Sample Ionic radii (Å) d0 0 1 (Å)
Raw bentonite – 15.33Na-bentonite 0.95 14.15Ca-bentonite 1.00 15.33Pb-bentonite 1.20 14.34Cu-bentonite 0.70 13.38Ni-bentonite 0.69 15.33Co-bentonite 0.74 14.53ZAF
edapicoda
3
t1(oadbbhososot3700–3000 cm−1 region, as the remaining part of the spectra is
FA
n-bentonite 0.74 14.72l-bentonite 0.50 14.91e-bentonite 0.56 13.10
nces in the position and the intensity of the main (0 0 1) peakrawn by the cation-exchange processes (Table 3) affected the rel-tive intensities of the other diffraction peaks as well as nonclayeaks. This outcome which signifies that a small fraction of iron
ons penetrates into the octahedral vacancies from the hexagonal
avities [13] has to be in connection with the ratio of the amountf the cation inserted inside the interlayer of bentonite and coor-inated water and the electrostatic attraction between the cationsnd the interlayer surface planes.asaA
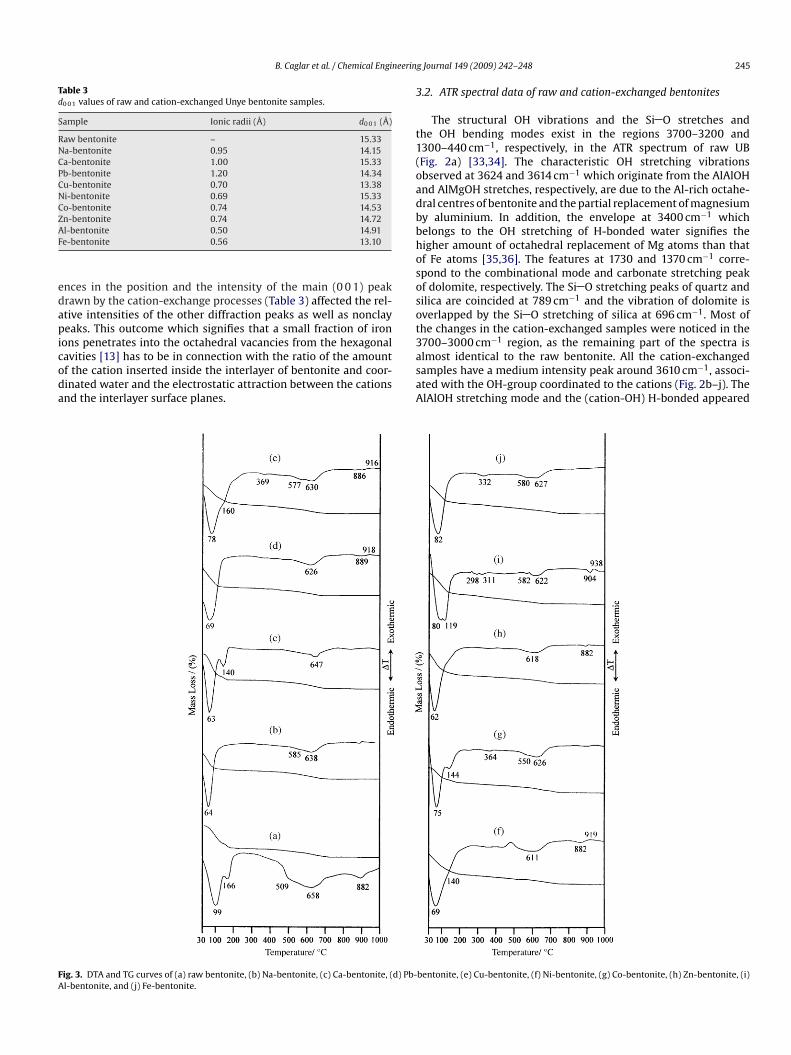
ig. 3. DTA and TG curves of (a) raw bentonite, (b) Na-bentonite, (c) Ca-bentonite, (d) Pb-l-bentonite, and (j) Fe-bentonite.
g Journal 149 (2009) 242–248 245
.2. ATR spectral data of raw and cation-exchanged bentonites
The structural OH vibrations and the Si O stretches andhe OH bending modes exist in the regions 3700–3200 and300–440 cm−1, respectively, in the ATR spectrum of raw UBFig. 2a) [33,34]. The characteristic OH stretching vibrationsbserved at 3624 and 3614 cm−1 which originate from the AlAlOHnd AlMgOH stretches, respectively, are due to the Al-rich octahe-ral centres of bentonite and the partial replacement of magnesiumy aluminium. In addition, the envelope at 3400 cm−1 whichelongs to the OH stretching of H-bonded water signifies theigher amount of octahedral replacement of Mg atoms than thatf Fe atoms [35,36]. The features at 1730 and 1370 cm−1 corre-pond to the combinational mode and carbonate stretching peakf dolomite, respectively. The Si O stretching peaks of quartz andilica are coincided at 789 cm−1 and the vibration of dolomite isverlapped by the Si O stretching of silica at 696 cm−1. Most ofhe changes in the cation-exchanged samples were noticed in the
lmost identical to the raw bentonite. All the cation-exchangedamples have a medium intensity peak around 3610 cm−1, associ-ted with the OH-group coordinated to the cations (Fig. 2b–j). ThelAlOH stretching mode and the (cation-OH) H-bonded appeared
bentonite, (e) Cu-bentonite, (f) Ni-bentonite, (g) Co-bentonite, (h) Zn-bentonite, (i)
2 eering Journal 149 (2009) 242–248
abt
dgbHsw3i
3ihtctPOaSaa9btcT5aadtstislv
3b
trwafbsamdmoiocwTia
Table 4Thermal analysis data of raw and cation-exchanged bentonites.
Sample Temperature range (◦C) Mass loss (%) DTAmax (endo)
Raw bentonite 25–129 8.1 99129–220 3.1 166300–720 4.3 509, 658720–950 0.0 910 (exo)
Na-bentonite 30–290 8.9 64290–830 4.3 638
Ca-bentonite 28–115 9.9 63115–174 2.9 140290–770 4.1 647
Pb-bentonite 30–290 10.0 69290–780 3.9 626
Cu-bentonite 30–300 10.7 78300–460 1.1 369460–600 1.6 577600–870 1.7 630
Ni-bentonite 30–370 12.6 69370–870 3.9 611
Co-bentonite 30–120 6.1 75120–230 2.1 144230–420 1.4 364420–880 3.7 626
Zn-bentonite 30–280 12.4 62280–850 4.2 618
Al-bentonite 30–105 5.8 80105–180 6.4 119200–400 1.5 298, 311400–750 5.2 582, 622
Fe-bentonite 30–250 10.2 82
oowiecbta22t5tbios3smt
d
46 B. Caglar et al. / Chemical Engin
t 3614 and 3400 cm−1, respectively. The (cation-OH) H-bondedand has shifted by 5–20 cm−1 slightly downwards depending onhe type of the exchanging cation.
A very broad envelope in the range 3500–3000 cm−1 consists ofifferent features [37]. OH-groups involved in H2O–H2O H-bondsive rise to the vibrations around 3400 cm−1, while the shoulderetween 3200 and 3400 cm−1 is ascribed to an overtone of the2O bending vibration. Since H2O molecules coordinated to the
trongly polarising cations such as Al3+ form stronger H-bonds toater species in outer spheres of coordination, vibrations below200 cm−1 which are probably due to the M2+–OH vibration are
ntensified (Fig. 2i) [7,34].What appears to be important is the ratio of the peaks at
610 and 3400–3000 cm−1, as different type of cation exchanges applied. As the cations are exchanged with Ca in UB, theydration peak intensity decreases in consistent with the facthat Ca coordinates higher amount of water than the exchangedations (Fig. 2c–j) [38,39]. However, we refer to the new fea-ures, unique to the newly inserted cation, especially in that ofb-bentonite, emerged at 3392 and 3200 cm−1 (Fig. 2d) as (cation-H) H-stabilized species [40]. The H2O bending mode is observedround 1630 cm−1, together with the most intense peaks due to thei O Si stretching modes around 990 cm−1 in the ATR spectra ofll cation-exchanged bentonite samples (Fig. 2b–j). The (AlAlOH)nd (MgAlOH) deformation peaks are found for the raw clay at15 and 840 cm−1, respectively, and at a slightly higher wavenum-ers for the Na- and Ca-bentonites. It may be concluded based onhe peaks above that the Al atoms are dominant in the octahedralentres of raw bentonite with a significant amount of Mg atoms.here are only minor changes in the Si O bending vibrations at14 cm−1, due to Si O Al, and at 467 cm−1, due to Si O Si, forll the samples. This is also true for the H2O-bending mode atpproximately 1630 cm−1, which in all spectra consists of a shoul-er which is probably due to a difference in coordination withinhe structure and the hydration shell [41–43]. Therefore, it is pos-ible to provide some insight into the distinctions observed inhe OH vibrational region based upon the different binding abil-ties of the metal cations towards the interlayer water speciesince the water molecule is preferably coordinated to the inter-ayer cations [44] and the residual water entrapped by the interlayeracancies.
.3. Thermal analysis data of raw and cation-exchangedentonites
Two dehydration stages with a total mass loss of 11.2% over theemperature range of 25–220 ◦C are noticeable on the TG curve ofaw bentonite (Fig. 3a and Table 4). The removal of adsorbed waterith a mass loss of 8.1% in the first stage 25–130 ◦C gives rise to
n endothermic DTA peak centred at 99 ◦C and the endothermiceature at 166 ◦C in the range of 130–220 ◦C which is accompaniedy a mass loss of 3.1% corresponds to the elimination of the waterpecies coordinated to the interlayer cations. The endothermic peakt 658 ◦C and the shoulder at 509 ◦C which are associated with theass loss by 4.3% in the range of 300–720 ◦C originate from the
ehydroxilation of amorphous smectites [2,33]. The endothermicaximum at 886 ◦C that screens the classical phase transition peak
f bentonite at 910 ◦C represents the decomposition of dolomitempurity. The dehydration of Na-bentonite occurs with a mass lossf 8.9% in the temperature range of 30–290 ◦C as a single-step pro-
ess which gives rise to an endothermic maximum at 64 ◦C (Fig. 3b)hereas this same process happens in two stages for raw bentonite.he dehydroxilation process results in two endothermic DTA peaksn the range of 290–830 ◦C; a strong one at 638 ◦C and a shouldert 585 ◦C with a mass loss of 4.3%.
hroa3
250–450 2.0 332450–600 1.8 580600–840 1.5 627
The endothermic maxima at 69 and 626 ◦C in the DTA curvef Pb-bentonite (Fig. 3d and Table 4) correspond to the removalf moisture and hydroxyl species, respectively. The amount ofater removed (10.0%) is more than that of Na-bentonite and it
s observed at a higher temperature whereas the hydroxyl speciesvolve at a lower temperature. The evolution of adsorbed andation-coordinated water species from Cu-bentonite is representedy an endothermic peak at 78 ◦C and a shoulder at 160 ◦C, respec-ively, in the range of 30–300 ◦C with a mass loss by 10.7% (Fig. 3end Table 4). Many researchers agree that for temperatures up to00 ◦C, Cu species migrate into hexagonal cavities [13] and above00 ◦C, they penetrate the octahedral sheets where they saturatehe charge of the sheet [17,41,43]. Three endothermic peaks at 369,77 and 630 ◦C which are accompanied by a total mass loss of 4.4% inhe range of 300–870 ◦C signify the dehydroxilation process of Cu-entonite [8,33]. Above 900 ◦C major structural changes resulting
n the development of cristobalite and mullite in montmorilloniteccur [15,16,42]. The removal of adsorbed and coordinated waterpecies with a mass loss of 12.6% in the temperature interval of0–370 ◦C from Ni-bentonite gives rise to a DTA peak at 69 ◦C and ahoulder at 140 ◦C (Fig. 3f and Table 4). Furthermore, the endother-ic maximum at 611 ◦C and the shoulder at 509 ◦C are attributed
o the dehydroxilation process.It is clearly seen that Ni-bentonite is the sample of the minimum
ehydroxilation temperature. Similar to Cu-bentonite, water and
ydroxyl species desorb from Co-bentonite in two and three stages,espectively (Fig. 3g and Table 4). The adsorbed water species des-rb at 75 ◦C; the coordinated water species are released at 144 ◦C,nd the final dehydroxilation stage is accompanied by a peak at64 ◦C, a shoulder at 550 ◦C and a shallow endotherm at about
B. Caglar et al. / Chemical Engineerin
Table 5Surface areas of raw and cation-exchanged bentonites.
Sample Surface area (m2 g−1) Ionic radius (Å)
Raw bentonite 35.0 ± 1.1 –Na-bentonite 22.0 ± 0.7 0.95Ca-bentonite 31.0 ± 0.9 1.00Pb-bentonite 20.0 ± 0.6 1.20Cu-bentonite 24.0 ± 0.7 0.70Ni-bentonite 27.0 ± 0.8 0.69Co-bentonite 28.0 ± 0.8 0.74ZAF
6pmo(ib(tdtba
3b
NcmtsAeisTopaaiwalctigob[imillesa
titttUc
4
rTottodcatarcobocmtallfcTmgn
A
eN
R
n-bentonite 48.0 ± 1.4 0.74l-bentonite 29.0 ± 0.9 0.50e-bentonite 38.0 ± 1.1 0.56
26 ◦C. The mass losses by 12.4 and 4.2% detected in the tem-erature ranges of 30–290 and 290–850 ◦C with the endothermicaxima of 62 and 618 ◦C, respectively, correspond to the removal
f moisture and hydroxile species, respectively, from Zn-bentoniteFig. 3h and Table 4). The mass losses by 10.2 and 5.3% determinedn the ranges of 30–250 and 250–840 ◦C which are accompaniedy the peaks centred at 82 and 332, 580 and 627 ◦C, respectivelyFig. 3i and Table 4) are attributed to the elimination of the struc-ural water and the hydration shells around iron cations as a 3-stepehydroxilation process, respectively [45,46]. It is clearly seen thathe type of exchanged cation influenced significantly the thermalehavior of the bentonite samples with regard to their dehydrationnd dehydroxilation capacities.
.4. Surface area measurements of raw and cation-exchangedentonites
Higher surface area of Ca-bentonite in comparison to that ofa-bentonite (Table 5) suggests that the latter sample may haveonsiderable amount of the trapped pores in the range of small andedium mesopores (20–400 Å) [47] and the ion valence is expected
o be more important in determining the textural properties of theamples in this case. The surface areas of Pb-, Cu-, Ni-, Co- andl-bentonite samples are interrrelated at the level of stacking oflementary layers with respect to the Fe- and Zn-samples (Table 5)n that the adsorption by reaction with the planar sites and the con-equent formation of outer-sphere complexes is likely to occur [48].he insertion of iron and zinc cations into UB reduces the numberf medium and large mesopores (>100 Å) and thus, the exchangerocess results in significant increase in the surface areas of Fe-nd Zn-bentonites with respect to the raw bentonite sample. Themount of the trapped pores in both Zn- and Fe-bentonite sampless lower than those of the Pb-, Cu-, Ni-, Co-, and Al-exchanged ones
hich can be explained by the emergence of micropores (<20 Å) asresult of the arrangement of zinc and iron cations in the inter-
ayer spacing of these sample [7]. Obviously, lead, copper, nickel,obalt and aluminium cations are subjected to compact packing inhe interlamellar layer resulting in more serious pore blocking thatnhibits the passage of nitrogen molecules [49]. These findings sug-est that the zinc and iron ions are introduced inside the interlayerf the clay mineral not only by cation exchange at the planar sites,ut also through the interaction with the aluminosilicate sheets41]. Accordingly, the increase of the surface area induced by thencorporation of zinc and iron ions between the silicate layers is
ainly caused by the presence of the micropores produced in thenterlayer spaces. However, the diffuse negative charge which is
ess accessible in the octahedral sheets than the tetrahedral oneseads to the greater capacity to form inner-sphere complexes at thedge sites for iron species [47]. Hence, a smaller increase in theurface area of Fe-bentonite is closely related to the arrangementnd amount of iron cation in the interlayer of bentonite rather thang Journal 149 (2009) 242–248 247
he ionic radius [25]. The above results indicate that the exchangedons affect the surface characteristics of bentonite in some mannerhat appears to be related to the size and interlayer arrangement ofhe exchanged ion in the clay [50]. It may be concluded thereforehat the order of the surface area increase of the cation-exchangedBs is directed by the features of the clay minerals rather than thehemical properties of the metal ions [11,49].
. Conclusions
Both the XRPD pattern and the ATR spectrum prove that theaw bentonite sample is an Al-rich dioctahedral montmorillonite.he d0 0 1 distances of cation-exchanged bentonites fall in the rangef 13.10–15.33 Å. There appeared significant differences betweenhe surface characteristics of the different cation-exchanged ben-onites. It is generally seen from the thermal analysis (DTA/TG) dataf raw and cation-exchanged UB samples that the distinct dehy-ration stages of low temperatures associated with adsorbed andation-coordinated water species are followed by dehydroxylationt intermediate temperatures which ceased around 700 ◦C and thenhe phase transition occurs. Furthermore, external clay componentsnd impurities may also be exposed to thermal decomposition atelatively high temperatures. In general, the surface areas of theation-exchanged bentonites are found to be smaller than thatf raw bentonite. However, the surface area increase of the Fe-entonite and in particular that of Zn-bentonite comparing to thatf raw bentonite is of significance and the changes in the surfaceharacteristics of the samples are closely related to the arrange-ent of the cations in the interlayer. Considerable percentage of
he surface area is associated with mesopores in Pb-, Cu-, Ni-, Co-nd Al-bentonite samples whereas Fe3+ and Zn2+ cations generatearge number of micropores and thus, induce the shrinkage of inter-amellar cavities. The outcoming results of this study may be usefulor predicting the potential of Unye bentonite in view of its appli-ation for the removal of metal ions from contaminated effluents.he results of such studies can also be of use in order to acquireore information on the surface properties of clay minerals and to
ain insight into the behavior of cation-exchanged clay minerals inatural systems.
cknowledgment
Research Foundation of Ondokuz Mayis University is acknowl-dged for the financial support to this work under the Projectumber F467.
eferences
[1] P.L. Hall, Clays: their significance, properties, origins and uses, in: M.J. Wil-son (Ed.), A Handbook of Determinative Methods in Clay Mineralogy, Blackie,Glasgow, 1987, pp. 1–25.
[2] M.S. Hassan, N.A. Abdel-Khalek, Benefication and applications of an Egyptianbentonite, Appl. Clay Sci. 13 (1998) 99–115.
[3] R.J. Morris, D.E. Williams, H.A. Luu, C.F.B. Holmes, R.J. Andersen, S.E. Calvert,The adsorption of microcystin-LR by natural clay particles, Toxicon 38 (2000)303–308.
[4] G.J. Churchman, Formation of complexes between bentonite and differentcationic polyelectrolytes and their use as sorbents for non-ionic and anionicpollutants, Appl. Clay Sci. 21 (2002) 177–189.
[5] Y. Huang, X. Ma, G. Liang, H. Yan, Adsorption of phenol with modified rectoritefrom aqueous solution, Chem. Eng. J. 141 (2008) 1–8.
[6] I.E. Odom, Smectite clay minerals: properties and uses, Philos. Trans. R. Soc.Lond. A 311 (1984) 391–409.
[7] C.C. Wang, L.C. Juang, C.K. Lee, T.C. Hsu, J.F. Lee, H.P. Chao, Effect of exchanged
surfactant cations on the pore structure and adsorption characteristics of mont-morillonite, J. Colloid Interface Sci. 280 (2004) 27–35.[8] A. Tabak, B. Afsin, S.F. Aygun, H. Icbudak, Phenanthroline Cu(II)-bentonite com-posite characterization, J. Therm. Anal. Cal. 81 (2005) 311–314.
[9] B. Caglar, B. Afsin, A. Tabak, Benzamide species retained by DMSO compositesat a kaolinite surface, J. Therm. Anal. Cal. 87 (2007) 429–432.
2 eerin
[
[
[
[
[
[
[
[
[
[
[
[
[
[
[
[
[
[
[
[
[
[
[
[
[
[
[
[
[
[
[
[
[
[
[
[
[
[
[
48 B. Caglar et al. / Chemical Engin
10] J. Cuadros, Clay as sealing material in nuclear waste repositories, Geol. Today24 (2008) 99–103.
11] S.E. Bailey, T.J. Olin, R.M. Bricka, D.D. Adrian, A review of potentially low-costsorbents for heavy metals, Water Res. 33 (1999) 2469–2479.
12] S.M. Shevchenko, G.W. Bailey, L.G. Akim, The conformational dynamics of humicpolyanions in model organic and organo-mineral aggregates, J. Mol. Struct.:Theochem. 460 (1999) 179–190.
13] H.P. He, J.G. Guo, X.D. Xie, J.L. Peng, Location and migration of cations in Cu2+-adsorbed montmorillonite, Environ. Int. 26 (2001) 347–352.
14] G. Brown, Crystal structures of clay minerals and related phyllosilicates, Philos.Trans. R. Soc. Lond. A 311 (1984) 221–240.
15] M.F. Brigatti, E. Galan, Structures and mineralogy of clay minerals, in: F. Bergaya,B.K.G. Theng, G. Lagaly (Eds.), Handbook of Clay Science, Developments in ClayScience, vol. 1, Elsevier, Amsterdam, 2006, pp. 19–86.
16] M.L. Occelli, R.M. Tindwa, Physicochemical properties of montmorillonite inter-layered with catonic oxyaluminum pillars, Clays Clay Miner. 39 (1983) 22–28.
17] M. Stadler, P.W. Schindler, Modeling of H (super +) and Cu (super 2+) adsorptionon calcium-montmorillonite, Clays Clay Miner. 41 (1993) 288–296.
18] J. Comets, L. Kevan, Adsorption of ammonia and pyridine on copper(II)-dopedmagnesium-exchanged smectite clays studied by electron spin resonance, J.Phys. Chem. 97 (1993) 466–469.
19] R. Van Bladel, H. Halen, P. Cloos, Calcium–zinc and calcium–cadmium exchangein suspensions of various types of clays, Clay Miner. 28 (1993) 33–38.
20] T. Matsuda, K. Yogo, C. Pantawong, E. Kikuchi, Catalytic properties of copper-exchanged clays for the dehydrogenation of methanol to methyl formate, Appl.Catal. A 126 (1995) 177–186.
21] J. Wagner, H. Chen, B.J. Brownawell, J.C. Westall, Use of cationic surfactants tomodify soil surfaces to promote sorption and retard migration of hydrophobicorganic compounds, Environ. Sci. Technol. 28 (1994) 231–237.
22] M.F. Brigatti, F. Corradini, G.C. Franchini, S. Mazzoni, L. Medici, L. Poppi, Inter-action between montmorillonite and pollutants from industrial waste-waters:Exchange of Zn2+ and Pb2+ from aqueous solutions, Appl. Clay Sci. 9 (1995)383–395.
23] M. Auboiroux, P. Bailif, J.C. Touray, F. Bergaya, Fixation of Zn2+ and Pb2+ by aCa-montmorillonite in brines and dilute solutions: preliminary results, Appl.Clay Sci. 11 (1996) 117–126.
24] G. Sheng, S. Xu, S.A. Boyd, Mechanism(s) controlling sorption of neutral organiccontaminants by surfactant-derived and natural organic matter, Environ. Sci.Technol. 30 (1996) 1553–1557.
25] E.Á. Ayuso, A.G. Sánchez, Removal of heavy metals from waste waters by naturaland Na-exchanged bentonites, Clays Clay Miner. 51 (2003) 475–480.
26] O. Abollino, A. Giacomino, M. Malandrino, E. Mentasti, Interaction of metal ionswith montmorillonite and vermiculite, Appl. Clay Sci. 38 (2008) 227–236.
27] K.G. Bhattacharyya, S.S. Gupta, Adsorption of a few heavy metals on naturaland modified kaolinite and montmorillonite: a review, Adv. Colloid InterfaceSci. 140 (2008) 114–131.
28] G. Kahr, F.T. Madsen, Determination of the cation exchange capacity and the
surface area of bentonite, illite and kaolinite by methylene blue adsorption,Appl. Clay Sci. 9 (1995) 327–336.29] S.J. Chipera, D.L. Bish, Baseline studies of the clay minerals society source clays:powder X-ray diffraction analyses, Clays Clay Miner. 49 (2001) 398–409.
30] M. Jaboyedoff, F. Bussy, B. Kübler, P. Thelin, Illite “crystallinity” revisited, ClaysClay Miner. 49 (2001) 156–167.
[
[
g Journal 149 (2009) 242–248
31] J. Srodon, V.A. Drits, D.K. McCarty, J.C.C. Hsieh, D.D. Eberl, Quantitative X-raydiffraction analysis of clay-bearing rocks from random preparations, Clays ClayMiner. 49 (2001) 514–528.
32] A.R. Mermut, G. Lagaly, Baseline studies of the clay minerals society sourceclays: layer-charge determination and characteristics of those minerals con-taining 2:1 layers, Clays Clay Miner. 49 (2001) 393–397.
33] C.G. Olson, M.L. Thompson, M.A. Wilson, Phyllosilicates, in: M.E.Sumner (Ed.), Handbook of Soil Science, CRC, Boca Raton, 2000,pp. F77–F168.
34] W. Xu, C.T. Johnston, P. Parker, S.F. Agnew, Infrared study of water sorption onNa-, Li-, Ca-, and Mg-exchanged (SWy-1 and SAz-1) montmorillonite, Clays ClayMiner. 48 (2000) 120–131.
35] J.T. Kloprogge, R. Evans, L. Hickey, R.L. Frost, Characterisation and Al-pillaringof smectites from Miles, Queensland (Australia), Appl. Clay Sci. 20 (2002) 157–163.
36] J. Madejová, FTIR techniques in clay mineral studies, Vib. Spectros. 31 (2003)1–10.
37] B. Afsin, M. Gokdere, N. Tinkilic, Stability of hydroxy-formate species at aPb(1 1 0) surface, Spectrochim. Acta, Part B 55 (2000) 985–990.
38] L. Heller-Kallai, C. Mosser, Migration of Cu ions in Cu montmorillonite heatedwith and without alkali halides, Clays Clay Miner. 43 (1995) 738–743.
39] J. Madejová, B. Arvaiová, P. Komadel, FTIR spectroscopic characterization ofthermally treated Cu2+, Cd2+, and Li+ montmorillonites, Spectrochim. Acta, PartA 55 (1999) 2467–2476.
40] B. Afsin, M.W. Roberts, Surface structure and the instability of the formateoverlayer at a Pb(1 1 0) surface, Catal. Lett. 13 (1992) 277–282.
41] C. Mosser, L.J. Michot, F. Villieras, M. Romeo, Migration of cations in copper(II);exchanged montmorillonite and laponite upon heating, Clays Clay Miner. 45(1997) 789–802.
42] A. Neaman, M. Pelletier, F. Villieras, The effects of exchanged cation, compres-sion, heating and hydration on textural properties of bulk bentonite and itscorresponding purified montmorillonite, Appl. Clay Sci. 22 (2003) 153–168.
43] J.T. Kloprogge, E. Mahmutagic, R.L. Frost, Mid-infrared and infrared emissionspectroscopy of Cu-exchanged montmorillonite, J. Colloid Interface Sci. 296(2006) 640–646.
44] A.M.L. Kraepiel, K. Keller, F.M.M. Morel, A model for metal adsorption on mont-morillonite, J. Colloid Interface Sci. 210 (1999) 43–54.
45] P.W. Schindler, P. Liechti, J.C. Westall, J. Neth, Adsorption of copper, cadmiumand lead from aqueous solution to the kaolinite/water interface, Agric. Sci. 35(1997) 219–230.
46] T. Undabeytia, S. Nir, G. Rytwo, C. Serban, E. Morillo, C. Maqueda, Modelingadsorption-desorption processes of Cu on edge and planar sites of montmoril-lonite, Environ. Sci. Technol. 36 (2002) 2677–2683.
47] J.F. Lee, C.K. Lee, L.C. Juang, Size effects of exchange cation on the pore structureand surface fractality of montmorillonite, J. Colloid Interface Sci. 217 (1999)172–176.
48] M. Auboiroux, F. Melou, F. Bergaya, J.C. Touray, Hard and soft acid-base model
applied to bivalent cation selectivity on a 2:1 clay mineral, Clays Clay Miner. 46(1998) 546–555.49] T. Vengris, R. Binkiene, A. Sveikauskaite, Nickel, copper and zinc removal fromwater by a modified clay sorbent, Appl. Clay Sci. 18 (2001) 183–190.
50] P.G. Slade, P.A. Stone, E.W. Radoslovich, Interlayer structures of the two-layerhydrates of Na- and Ca-vermiculites, Clays Clay Miner. 33 (1985) 51–61.