Mineralogy, geochemistry and genesis of bentonites of the Ordu area, NE Turkey
21
Transcript of Mineralogy, geochemistry and genesis of bentonites of the Ordu area, NE Turkey

Mineralogy, geochemistry and genesis of
bentonites of the Ordu area, NE Turkey
E. ABDIÇOGÆ LU AND M. ARSLAN*
Department of Geological Engineering, Karadeniz Technical University, 61080 Trabzon, Turkey
(Received 17 May 2004; revised 4 September 2004)
ABSTRACT: A number of bentonitic clay deposits from the Ordu area (NE Turkey) have been
investigated by optical and electron microscopy, X-ray diffraction and chemical analysis. The clays
are the alteration products of Late Cretaceous trachytic and trachyandesitic pyroclastic rocks. They
contain volcanogenic sanidine, plagioclase, biotite and pumice, along with the diagenetic minerals
opal-CT, cristobalite and rare calcite and zeolite (clinoptilolite). Ca-smectite (montmorillonite) is the
dominant clay mineral. The rare earth element patterns of all the bentonitic clays are generally
similar, although there are variations in the Eu anomaly indicating formation from different types of
pyroclastic rocks. Oxygen and hydrogen stable isotope values suggest that the smectite was formed at
20ÿ40ëC in pore water of mixed meteoric and marine origin during argillization. These features,
together with mass-balance calculations, indicate the enhanced MgO and Sr content of the smectite
resulted from formation at shallow burial depths within a dominantly marine environment.
KEYWORDS: clay, smectite, montmorillonite, bentonite, O and H stable isotopes, marine
alteration, Turkey.
The Eastern Pontides (NE Turkey), a palaeo-island
arc, displays three major volcanic cycles of Liassic,
Upper Cretaceous and Tertiary age (Arslan et al.,
1997). The alteration products of these volcanics,
especially those of Upper Cretaceous age, are very
common. Hydrothermal alteration associated with
volcanogenic massive sulphide deposits is wide-
spread. Clay occurrences (e.g. bentonite, kaolinite
and illite), some of them economic, developed in
the alteration zones of the ore deposits in different
parts of the region.
Since 1978, several researchers, especially from
the General Directorate of Mineral Research and
Exploration of Turkey, have examined the
economic potential of these clay occurrences.
There is, however, little information about the
mineralogical and geochemical characteristics and
origin of the clay deposits (e.g. CË elik et al., 1999;
YalcËõn & GuÈmuÈs° er, 2000; Arslan et al., 2002;
AbdiogÆlu et al., 2004). In the Ordu area, bentonitic
clay deposits are distributed over a 110 km2area
(Fig. 1).
This study describes the bentonitic clay deposits
of the Ordu area, presents systematic analyses of
their mineralogy, geochemistry and stable isotope
signatures, and evaluates the environment of
formation. We demonstrate that despite their
apparent association with hydrothermal ore
deposits, the bentonites are in fact of a low-
temperature origin, formed by the influx of
marine waters.
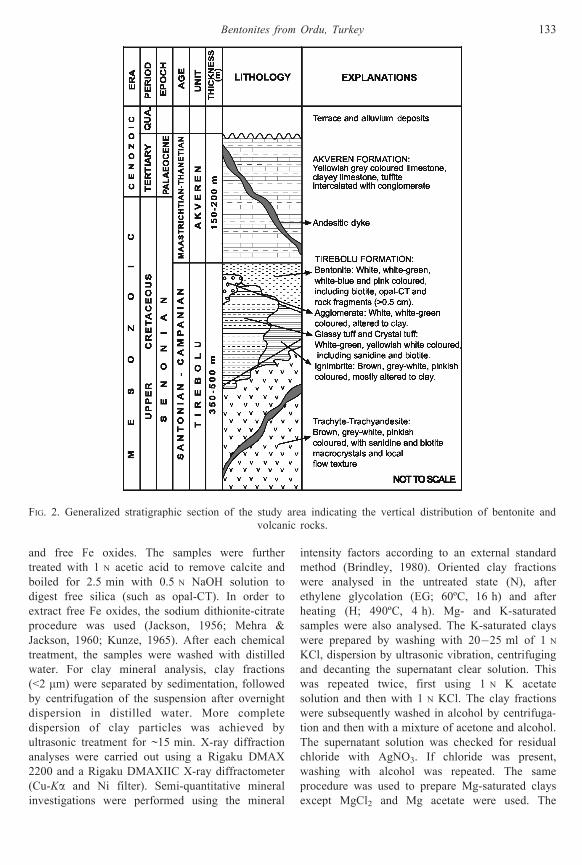
STRAT IGRAPHY AND LITHOLOGY
The area of our study is located in the west of the
Eastern Pontides, NE Turkey (Fig. 1). Here the
Upper Cretaceous Tirebolu Formation, consisting of
trachyte, trachyandesite, hyalo-trachyte and pyro-
clastics of similar composition, as well as
associated bentonite deposits, make up the base-
ment rocks of the area. The Upper Cretaceous±
Palaeocene Akveren Formation, consisting mainly
of limestone, clayey limestone, tuffite and conglom-
erate, conformably overlies the basement. Both
* E-mail: [email protected]
DOI: 10.1180/0009855054010161
ClayMinerals (2005) 40, 131±151
# 2005 The Mineralogical Society

formations are cut by andesite dykes of Tertiary age
and are uncomformably overlain by terraces and
alluvial deposits of Quaternary age (Fig. 2). Within
the bentonite deposits, there are no marine fossils or
sediments, but the overlying Upper Cretaceous-
Palaeocene Akveren Formation does show evidence
of marine deposition. The age of the bentonites can
be constrained as Upper Cretaceous±Palaeocene, or
older.
Seven separate clay deposits were studied
(Fig. 1), the most extensive located in the
Kavaklar area. The thickness of bentonites in this
area ranges from 0 to 25 m and these have been
exploited from four inactive open pits and one
which is still active. The bentonites range in colour
from white, yellow, pink, yellowish white to
greenish blue. They have a soapy, `popcorn'
texture and are waxy in appearance. Unaltered
biotite, volcanic rock fragments and opal-CT are
commonly observed with the bentonite, and partly
altered ignimbrites characterize the lower part of
the deposits.
Other small bentonite deposits are present in the
areas of Asarkaya, GoÈlcuÈgÆez, YuÈceler, Yedikapõ and
Tavkutlu, which show a range of volcanic-related
features. Flow textures are observed in the Tavkutlu
clay deposit with remnants of ignimbritic tuff, and
volcanic rock fragments characterize the clays in
the Asarkaya and Cevizdere areas in the contrast to
the deposits of the Yedikapõ area formed largely as
alteration products of volcanic agglomerate.
MATER IAL AND METHODS
140 samples were collected from open bentonite
pits of the Tirebolu Formation (Fig. 1). From these,
18 whole-rock and 14 clay-fraction samples were
analysed for major, trace and rare earth element
(REE) analysis. Thirty six samples were selected
for whole rock and oriented X-ray diffraction
(XRD) studies, and six smectite separates were
analysed for oxygen and hydrogen stable isotopes.
Optical microscope studies were carried out on
pyroclastic and partly altered rocks. Scanning
electron microscopy (SEM) studies were conducted
at the Laboratories of Gebze Technology Institute
and Karadeniz Technical University using Philips
XL30 SFEG and Jeol JSM 6400 scanning electron
microscopes.
Selected samples for geochemical and XRD
analyses were ground using an agate mortar and
pestle. In order to obtain clay fractions (<2 mm) for
analysis, chemical treatments (Jackson, 1956) were
carried out to remove carbonates, amorphous silica
FIG. 1. Simplified geological map of the Ordu (UÈ nye-Fatsa) area in NE Turkey showing the location of bentonites
and volcanic rocks across the region.
132 E. AbdiogÆlu and M. Arslan
and free Fe oxides. The samples were further
treated with 1 N acetic acid to remove calcite and
boiled for 2.5 min with 0.5 N NaOH solution to
digest free silica (such as opal-CT). In order to
extract free Fe oxides, the sodium dithionite-citrate
procedure was used (Jackson, 1956; Mehra &
Jackson, 1960; Kunze, 1965). After each chemical
treatment, the samples were washed with distilled
water. For clay mineral analysis, clay fractions
(<2 mm) were separated by sedimentation, followed
by centrifugation of the suspension after overnight
dispersion in distilled water. More complete
dispersion of clay particles was achieved by
ultrasonic treatment for ~15 min. X-ray diffraction
analyses were carried out using a Rigaku DMAX
2200 and a Rigaku DMAXIIC X-ray diffractometer
(Cu-Ka and Ni filter). Semi-quantitative mineral
investigations were performed using the mineral
intensity factors according to an external standard
method (Brindley, 1980). Oriented clay fractions
were analysed in the untreated state (N), after
ethylene glycolation (EG; 60ëC, 16 h) and after
heating (H; 490ëC, 4 h). Mg- and K-saturated
samples were also analysed. The K-saturated clays
were prepared by washing with 20ÿ25 ml of 1 N
KCl, dispersion by ultrasonic vibration, centrifuging
and decanting the supernatant clear solution. This
was repeated twice, first using 1 N K acetate
solution and then with 1 N KCl. The clay fractions
were subsequently washed in alcohol by centrifuga-
tion and then with a mixture of acetone and alcohol.
The supernatant solution was checked for residual
chloride with AgNO3. If chloride was present,
washing with alcohol was repeated. The same
procedure was used to prepare Mg-saturated clays
except MgCl2 and Mg acetate were used. The
FIG. 2. Generalized stratigraphic section of the study area indicating the vertical distribution of bentonite and
volcanic rocks.
Bentonites from Ordu, Turkey 133

K-saturated clays were analysed by XRD in the
untreated state, and after heating at 350ëC and
490ëC. The Mg-saturated clays were analysed in the
untreated state and following glycolation. The di- or
trioctahedral structure of the clays was determined
from the position of the 060 reflection as a measure
of the b dimension using random powder samples
(Velde, 1992). Here, the 211 reflection of quartz
was used as a reference standard. The Green-Kelly
Test (Greene-Kelly, 1953) as modified by Bystrom-
Brusewitz (1976) was used to differentiate between
montmorillonite and beidellite.
Differential thermal analysis (DTA) was carried
out on the clay-sized fraction (<2 mm) using a
Netzch 404 DT Analyser. Analyses were performed
in air atmosphere over the temperature range
20ÿ1100ëC using a heating rate of 5ëC minÿ1.
Chemical analysis of whole-rock and clay
fractions were carried out by ACME Analytical
Laboratories Ltd. (Canada); ICP-AES was used for
the major and trace elements and ICP-MS for the
REE. Samples used for the calculation of mineral
formulae were selected from purified clay samples
containing entirely smectite. Detection limits range
0.01 to 0.1 wt.% for major elements, 0.1 to 5 ppm
for trace elements and 0.01 to 0.5 ppm for the REE.
Six samples of pure montmorillonite (<2 mm)
from open pit 1 in the Kavaklar deposit were
analysed for their O and H isotope values at the
Scottish Universities Environmental Research
Centre (East Kilbride, Scotland). The oxygen
isotopic composition was determined by a modifica-
tion of the laser-fluorination method of Sharp
(1990), which has been described by Macaulay et
al. (2000). Samples were heated at 200ëC under
high vacuum overnight to remove interlayer and
adsorbed surface water. Approximately 1 mg was
reacted with ClF3 whilst heating with a CO2 laser.
The resultant oxygen was purified, converted to
CO2 and the reaction yield determined. The oxygen
isotope composition of the CO2 was measured on
an in-line VG PRISM 3 dual-inlet mass spectro-
meter with a working standard gas calibrated
against international reference materials. The
precision and accuracy of measurement are Ô0.2s
(sigma) for isotopically homogeneous material.
Hydrogen was extracted by heating samples under
vacuum to release bound hydrogen, mostly as water
vapour. Water was then converted to hydrogen by
reaction with hot uranium. Samples were placed
into platinum crucibles that had previously been
heated under vacuum to 1500ëC for >3 h. The
hydrogen produced was delivered to a mercury
manometer by a Toepler pump and the yield
determined by comparing the starting weight of
mineral with micromoles of gas produced. The
extracted hydrogen was analysed using a VG
Micromass 602B mass spectrometer, with a
working standard calibrated against international
standards.
RESULTS AND INTERPRETAT ION
Petrography
The volcanic rocks in the studied area consist of
trachyte, trachyandesite and hyalo-trachyte, and
show microlitic porphyric, hyalo-microlitic
porphyric, glomeroporphyric and flow textures.
FIG. 3. Representative XRD patterns of untreated and
air-dried random powder bulk samples from the Ordu
area bentonites.
134 E. AbdiogÆlu and M. Arslan

Hyalo-trachytes sometimes show perlitic, snowflake
and spherulitic devitrification textures. The rocks
contain phenocrystals of mainly sanidine
(Or55ÿ64Ab32ÿ34An4-8), andesine plagioclase
(Ab55ÿ68An26ÿ42Or4-8), biotite (Mg-number =
0.58ÿ0.61), titanomagnetite, rarely pyrite, horn-
blende and apatite.
The pyroclastic rocks, the precursor materials of
bentonites are agglomerates, crystal tuffs, vitric
crystal tuffs and ignimbrites. Crystal constituents
are sanidine, biotite, rare plagioclase, primary and
secondary quartz, opaque minerals and clay
minerals. Rock fragments are trachytic in composi-
tion. Ignimbrites contain crystals, glass shards,
glassy pumice fragments and some rare rock
fragments. In most cases, eutaxitic fabrics with
intense welding, compaction and alignment of
flattened glassy pumice fragments and elongated-
curved glass shards are very characteristic. Some of
the biotites exhibit deformation textures due to
compaction of the rocks.
Mineralogy and mineral chemistry
In all bentonite samples, smectite is the most
abundant mineral. Other constituents are opal-CT,
cristobalite (opal-C), K-feldspar (sanidine), plagio-
clase and biotite. The terminology used to describe
the silica polymorphs follows Jones & Segnit
(1971). Calcite and zeolite (clinoptilolite) are
scarcely present. Representative XRD patterns of
bulk samples are shown in Fig. 3.
The major smectite mineral is a dioctahedral Ca-
variety; the deposit from Kavaklar is mineralogi-
cally homogeneous and consists almost entirely of
this mineral. The Asarkaya, Cevizdere, YuÈceler,
Yedikapõ locations are also characterized by Ca-
smectites whereas GoÈlcuÈgÆez has a Na-Ca variety.
Although it is difficult to distinguish Ca-smectite
from Mg-smectite because of their similar d values,
chemical analysis of purified clay fractions clearly
indicate that the dominant cation in the interlayer
region is Ca. The basal spacing (001) of the
untreated Ca-smectite is between 14.2 and 15.1 AÊ
and that of Na-Ca smectite ranges between 14.6 and
12.5 AÊ at 54% relative humidity. Second, third,
fourth and fifth order basal spacing can be
identified in the XRD patterns of the untreated
and glycolated samples; in the heated samples only
the first, second and third order spacing are present
(Fig. 4). The glycolation of Mg-saturated samples
caused a shift of the smectite peak from 14.0 to
17 AÊ . The absence of mixed-layer illite-smectite
minerals is inferred from the width of the 17 AÊ
peak (ethylene glycol-solvated) and the existence of
rational d spacing of the remaining basal reflec-
tions. All the treatments such as K and Mg indicate
pure smectites. K saturation and heating at 350 and
490ëC results in a collapsed smectite peak at 12.07
and 9.91 AÊ respectively. The basal d spacing of
FIG. 4. XRD patterns of oriented clay fractions (<2 mm) from the Ordu area bentonites.
Bentonites from Ordu, Turkey 135

12.07 AÊ after heating at 350ëC is due to rehydration
and corresponds to a monolayer of H2O in the
interlayer.
The d060 peak of smectites ranges from 1.488 to
1.500 AÊ (average 1.493 AÊ ) indicating a dioctahedral
layer, typical of montmorillonite and beidellite
(Wilson, 1987).
The Greene-Kelly test indicates that the smectite
is montmorillonite because the basal peak did not
expand after treatment with ethylene glycol
(Fig. 4); it is however acknowledged that this test
does not distinguish between all montmorillonites
and beidellites (Wilson, 1987).
The DTA curves of the samples show three
endothermic peaks (Fig. 5). The first endothermic
peak occurs at 140ÿ170ëC and corresponds to the
loss of adsorbed water. The second peak at
690ÿ720ëC reflects the loss of hydroxyl water,
and the third endothermic peak at 820ÿ900ëC
indicates collapse of the montmorillonite structure.
A sharp exothermic peak at 990ëC is taken to
reflect the crystallization of a new mineral phase,
probably b-quartz (Grim & Kulbicki, 1961). These
DTA curves are similar to those of Cheto-type
montmorillonite described by Grim & Kulbicki
(1961).
When viewed by the SEM, all the clay samples
display honeycomb texture with platy smectite
particles showing edge-to-edge, and edge-to-face
contacts (Fig. 6). Our SEM studies also reveal
information about the alteration process. Alteration
commonly begins perpendicular to micro-fractures
within volcanic glass (Fig. 7a,d), and then rapidly
alters the glass to form a spongy pseudomorphic
texture (Fig. 7b) of smectite and opal-CT (Fig. 7c).
Such alteration textures are common in the
Asarkaya, Tavkutlu, Cevizdere, GoÈ lcuÈ gÆ ez,
Yedikapõ and YuÈceler areas and in the lower parts
of the Kavaklar open pits.
Major, trace and REE concentrations of smectite
(<2 mm) and their structural formulae calculated on
the basis of 11 oxygen atoms (Weaver & Pollard,
1973) are given in Table 1 and Table 2, respec-
tively. The dioctahedral smectites are rich in Al2O3
FIG. 5. Differential thermal analysis curves of smectites from various locations (Is° 1 2/1-3, Kavaklar; Cev,
Cevizdere; As, Asarkaya; 18, Yedikapõ; T, Tavkutlu; Y, YuÈceler).
FIG. 6. Honeycomb texture of the Ordu area smectites
folded and loosely packed.
136 E. AbdiogÆlu and M. Arslan

that ranges between 18 and 21 wt.%. The K2O
content of the clay fractions is 0.68ÿ2.40 wt.% and
K as interlayer cation is 0.03ÿ0.21 per unit
formulae. These values may not be consistent
with general smectite compositions but Tsipursky
& Drits (1984) proposed that smectites close to the
montmorillonite/beidellite boundary could contain
0.27 K atoms. Another possibility is that the
interlayer composition may have been modified by
ion exchange at a later stage, after bentonite
formation.
When the octahedral composition of these
smectites is plotted on a Mg-Al-Fe triangular
diagram (Fig. 8; GuÈven, 1988), Kavaklar samples
plot in the Tatatilla field (TA) of montmorillonite,
whereas smectites from the other locations plot in
the beidellite field. However, based on the
tetrahedral charge/octahedral charge ratio of the
smectites (0.39ÿ0.67) they show more typical
characteristics of montmorillonites (GuÈven, 1988).
Christidis & Dunham (1993) suggested that
bentonites derived from intermediate (dacitic-
andesitic) precursors are extremely heterogeneous,
as far as their composition is concerned, and are in
compositional transition between beidellite and
Tatatilla-type montmorillonite, with probable solid
solution between the two species.
Geochemistry
Volcanic rocks of the study area are generally
medium alkaline to tholeiitic-alkaline transitional in
character and have high K, Rb, Th and light REE
and low Sr, Ba, P, Ti and Eu contents.
FIG. 7. SEM images of the Ordu area bentonite samples; (a) micro-fractured volcanic glass, (b) spongy
pseudomorphic texture in glass shard, (c) spongy glass shards and smectite + opal-CT forming from the glass,
(d) smectite forming along the microfractures in glass.
FIG. 8. Ternary diagram of the main octahedral cations
for the Ordu area smectites (GuÈven, 1988). Key to the
abbreviations: TA = Tatatilla montmorillonite, OT =
Otay montmorillonite, CH = Cheto montmorillonite,
WY = Wyoming montmorillonite, Fe-M = Fe-rich
montmorillonite, BI = beidellite, Fe-BI = Fe-rich
beidellite. The dashed line separates the Fe-rich
smectites.
Bentonites from Ordu, Turkey 137

TABLE 1. Major (wt.%), trace and REE composition of the dioctahedral smectites from the Ordu area, NE Turkey.
Sample Is° 1 2/1 Is° 1 2/2 Is° 1 2/3 Is° 1 2/4 Is° 1 2/5 Is° 1 2/6 Is° 1 2/7 Is° 1 2/8 Is° 1 2/9
location Kavaklar area open pit 1
SiO2 55.76 54.77 55.19 55.68 57.04 54.61 54.86 56.72 54.51
Al2O3 19.27 19.34 18.86 18.94 18.37 20.02 19.67 18.60 18.00
Fe2O3* 1.19 1.14 1.01 1.01 1.17 1.27 1.18 1.30 1.20
MgO 4.39 4.22 3.92 3.91 3.95 4.59 4.53 3.85 4.10
CaO 2.55 2.57 2.51 2.55 2.69 2.68 2.52 2.47 2.90
Na2O 0.34 0.37 0.34 0.36 0.39 0.49 0.46 0.39 0.33
K2O 0.62 0.89 0.83 0.96 0.86 1.07 0.69 0.82 0.67
TiO2 0.11 0.11 0.11 0.12 0.11 0.12 0.12 0.11 0.12
MnO 0.04 0.02 0.03 0.03 0.03 0.03 0.02 0.02 0.11
LOI 17.40 18.10 18.90 18.00 16.80 16.60 17.20 17.40 18.00
Sum 101.66 101.53 101.70 101.56 101.41 101.47 101.24 101.67 99.94
CaO/Na2O 7.50 6.95 7.38 7.08 6.90 5.47 5.48 6.33 8.79
Trace elements (ppm)
Co 0.6 0.7 0.7 0.5 0.6 0.6 0.8 0.7 0.9
Cs 4 4.2 4.2 4.1 4.3 3.5 4.3 3.7 3.8
Ga 14.1 14.1 13.1 12.7 11.5 14.1 13.3 13 11.4
Hf 4.1 4.1 3.2 4.2 3.7 4.3 4 3.6 3.2
Nb 7.2 8.4 6 9.5 7.5 8.2 9.9 9.3 10.4
Rb 42.4 53.3 49.8 52 65.5 54.2 53.3 41.1 45.3
Sn 2 2 2 2 2 2 2 2 2
Sr 102.2 105.6 94.8 110.5 90.4 114.7 112.6 99 119.2
Ta 0.9 1.1 1 1.1 1 1.1 1.2 1.1 1.1
Th 32.6 31.2 27.5 29.8 36.8 32.8 32.5 28.4 25.1
Tl 0.3 0.2 0.2 0.3 0.1 0.1 0.2 0.2 0.4
U 0.5 0.7 0.5 1.1 0.9 1.2 1.2 0.6 1.1
V 12 13 11 9 8 <5 6 7 9
W 2 2 1 2 2 3 3 2 3
Zr 88.6 81.4 68.1 105.2 80.4 96.6 89.5 78.2 76.8
Y 18.9 24.9 14.4 15.3 17.7 18.6 14.2 13.6 21.8
Cu 2 2 1 2 2 1 2 2 1
Pb 15 13 12 11 12 13 13 8 24
Zn 20 14 11 12 12 15 14 11 13
Ni 2 3 1 6 1 1 <1 3 1
Ba 15 6 <5 13 9 7 9 14 11
Sc 1 1 1 2 2 1 2 1 1
REE (ppm)
La 42 41.3 30.5 31.1 50.5 34.9 32.5 29 33.6
Ce 73.5 64.1 56.1 52.4 87 65.5 60 51.6 56.5
Pr 7.3 6.44 4.67 5.21 8.34 5.96 5.68 5.03 5.29
Nd 23 20.7 15.1 16.1 27.2 19.4 17.6 15.2 16.9
Sm 3.8 3.6 2.4 2.9 4.7 3.4 3 2.9 2.8
Eu 0.34 0.38 0.2 0.3 0.49 0.33 0.3 0.31 0.32
Gd 2.8 2.97 1.6 2.16 2.94 2.25 2.07 1.79 2.51
Tb 0.53 0.5 0.27 0.4 0.57 0.41 0.35 0.31 0.43
Dy 3.01 3.57 2.36 2.49 2.86 2.79 2.71 2.06 2.88
Ho 0.62 0.67 0.4 0.49 0.53 0.6 0.45 0.42 0.58
Er 2.16 2.45 1.53 1.55 1.88 2.22 1.78 1.6 1.98
Tm 0.33 0.35 0.22 0.26 0.26 0.33 0.25 0.23 0.31
Yb 2.91 2.92 1.94 2.21 1.92 2.66 1.98 1.84 2.5
Lu 0.48 0.46 0.33 0.33 0.38 0.46 0.33 0.29 0.41
138 E. AbdiogÆlu and M. Arslan

Table 1 (contd.)
Sample Average Cev4 Y1 G6 T1 As 5
location Kavaklar Cevizdere YuÈceler GoÈlcuÈgÆez Tavkutlu Asarkaya
SiO2 55.46 56.91 55.68 56.71 61.01 59.10
Al2O3 19.01 21.00 21.34 20.82 20.16 19.74
Fe2O3* 1.16 1.11 1.50 1.79 1.19 1.02
MgO 4.16 2.76 3.18 2.74 2.09 3.21
CaO 2.60 2.65 2.27 1.02 3.11 1.54
Na2O 0.39 0.66 0.77 1.48 0.83 0.92
K2O 0.82 1.99 1.26 2.40 1.49 0.59
TiO2 0.11 0.13 0.13 0.17 0.13 0.10
MnO 0.04 0.02 0.01 0.03 0.01 <0.01
LOI 17.60 14.00 15.20 12.80 11.90 14.80
Sum 101.35 101.23 101.34 99.97 101.93 101.03
CaO/Na2O 6.88 4.02 2.95 0.69 3.75 1.67
Trace elements (ppm)
Co 0.68 2.9 3.6 2.9 1.1 < .5
Cs 4.01 5.4 5.3 5.4 5.5 4.1
Ga 13.03 13.2 13.7 13.9 13.2 13.7
Hf 3.82 3.2 3.6 3.3 3.3 3.5
Nb 8.49 34.1 39.1 36.4 13.3 34.9
Rb 50.77 133.5 91.2 220.9 103.2 41.5
Sn 2.00 3 3 3 2 3
Sr 105.44 126.2 103 70.1 234.4 137.4
Ta 1.07 4.3 4.9 4.2 1.3 4.4
Th 30.74 19.9 24.7 26.4 34.5 15.8
Tl 0.22 0.4 0.5 1.5 0.7 0.1
U 0.87 8.6 1.5 5.5 2.4 0.6
V 8.33 10 13 14 6 <5
W 2.22 2 2 4 7 1
Zr 84.98 80.9 74.4 92.9 79.8 65.6
Y 17.71 14.6 18.5 18 11 13.4
Cu 1.67 4 3 4 3 1
Pb 13.44 13 7 6 7 <3
Zn 13.56 7 10 13 7 6
Ni 2.00 2 3 4 1 1
Ba 9.33 36 31 79 15 11
Sc 1.33 1 2 2 1 <1
REE (ppm)
La 36.16 32.3 43.2 38.4 39.2 26
Ce 62.97 53.4 76.1 58.8 81 24.7
Pr 5.99 4.9 6.73 6.13 6.86 3.64
Nd 19.02 15.1 21.8 19.6 22.1 11.2
Sm 3.28 2.6 3.2 3.7 3.3 1.9
Eu 0.33 0.25 0.3 0.34 0.36 0.11
Gd 2.34 2.01 2.58 2.26 2.34 1.86
Tb 0.42 0.37 0.47 0.48 0.38 0.33
Dy 2.75 2.44 3.07 3.16 2.29 2
Ho 0.53 0.49 0.58 0.59 0.34 0.43
Er 1.91 1.62 2.04 1.98 1.13 1.29
Tm 0.28 0.19 0.28 0.28 0.17 0.18
Yb 2.32 1.68 2.25 2.1 1.3 1.61
Lu 0.39 0.29 0.37 0.38 0.22 0.28
All Fe as Fe2O3
Bentonites from Ordu, Turkey 139

Major and trace elements of 18 samples from all
bentonite deposits are shown in Table 3. The loss-
on-ignition for this suite ranges between 8.9 and
15.4 wt.%. The silica contents, representing rocks
of intermediate-acidic composition, range from 62
to 70 wt.% in the Kavaklar area (average
65.3 wt.%) and from 69 to 75 wt.% (average
72.5 wt.%) in the other areas.
As there is evidence for the mobility of major
elements during the argilization of the parent rock,
the chemical discrimination diagram of Winchester
& Floyd (1977) was used, based on the concentra-
tions of immobile elements (Zr/TiO2, Nb/Y)
(Fig. 9).
Samples from the Kavaklar and Yedikapõ areas
plot in the trachyandesite field close to the rhyolite/
trachyandesite boundary, whereas samples from
Cevizdere, Asarkaya, YuÈceler and Tavkutlu plot
entirely in the trachyte field. However, there may
be some bias here towards a more alkaline character
during bentonite formation (e.g. Christidis, 1998)
because Y is known to be more mobile than Nb,
whereas Ti and Al are very immobile elements.
In general, the bentonites have low contents of
Sr, Ba, Ti and P and high contents of K, Rb and Th,
and are therefore similar in composition to the
surrounding volcanics (Fig. 10). The whole-rock
REE contents of the bentonites have been normal-
ized to that of North American Shale Composite
(NASC) (Gromet et al., 1984). The patterns
(Fig. 11) are similar overall but there are notable
differences in the Eu content, with anomalies
suggesting clay formation from a variety of
pyroclastic products. Normalized ratios of Eu/Eu*
TABLE 2. Structural formulae of the dioctahedral smectites from the Ordu area.
Sample Is° 1 2/1 Is° 1 2/2 Is° 1 2/3 Is° 1 2/4 Is° 1 2/5 Is° 1 2/6 Is° 1 2/7 Is° 1 2/8 Is° 1 2/9 cev4 Y1 G6 T1 As 5
no.
Tetrahedral
Si 3.91 3.89 3.93 3.93 3.98 3.82 3.86 3.96 3.93 3.88 3.83 3.88 4.01 4.01IVAl 0.09 0.11 0.07 0.07 0.02 0.18 0.14 0.04 0.07 0.12 0.17 0.12 0.00 0.00
OctahedralVIAl 1.5 1.51 1.51 1.51 1.49 1.47 1.49 1.49 1.46 1.57 1.56 1.56 1.56 1.58
Ti 0.01 0.01 0.01 0.01 0 0.01 0.01 0.01 0.01 0.01 0.01 0.01 0.01 0.01
Fe3+
0.06 0.06 0.05 0.05 0.06 0.07 0.06 0.07 0.07 0.06 0.08 0.09 0.06 0.05
Mg 0.43 0.42 0.42 0.41 0.41 0.45 0.44 0.4 0.44 0.28 0.33 0.28 0.21 0.33
Mn 0 0 0 0 0 0 0 0 0.01 0 0 0 0 0
TOC 2.00 2.00 1.99 1.98 1.96 2.00 2.00 1.97 1.99 1.92 1.98 1.94 1.84 1.97
OC 0.42 0.41 0.44 0.46 0.53 0.44 0.43 0.48 0.47 0.51 0.38 0.45 0.68 0.41
Interlayer
Mg 0.03 0.03 0.00 0.00 0.00 0.03 0.04 0.00 0.00 0.00 0.00 0.00 0.00 0.00
Ca 0.19 0.2 0.18 0.19 0.2 0.2 0.19 0.18 0.22 0.19 0.17 0.07 0.22 0.11
Na 0.05 0.05 0.05 0.05 0.05 0.07 0.06 0.05 0.05 0.09 0.1 0.19 0.1 0.12
K 0.03 0.08 0.08 0.09 0.08 0.1 0.06 0.07 0.06 0.17 0.11 0.21 0.13 0.05
ILC 0.52 0.59 0.49 0.52 0.53 0.63 0.58 0.48 0.55 0.64 0.55 0.54 0.67 0.39
TLC 0.51 0.52 0.51 0.53 0.55 0.62 0.57 0.52 0.54 0.63 0.55 0.57 0.68 0.41
TOC: total octahedral cations, OC: octahedral charge, ILC: interlayer charge, TLC: total layer charge
FIG. 9. Discrimination of the Ordu area smectite-rich
bentonite samples using a Nb/Y-Zr/TiO2 immobile
element diagram (Winchester & Floyd, 1977).
140 E. AbdiogÆlu and M. Arslan

with values of 0.19ÿ0.56 are considered to be
negative anomalies and probably reflect crystal
fractionation of plagioclase during the magmatic
evolution of the precursor rocks.
Any mineral formed in equilibrium with oxic
marine waters is likely to be characterized by a
negative Ce anomaly (Jeans et al., 2000), whereas
under suboxic and anoxic marine conditions, Ce
precipitation is reversed and has little or no
negative anomaly (German & Elderfield, 1990).
As none of the bentonite samples studied here has
negative Ce anomalies the alteration in considered
here to have occurred primarily under poorly
oxygenated marine conditions.
During alteration, some elements are mobile
whereas others are relatively immobile and
become enriched in the residual rock (e.g.
Christidis & Dunham, 1993, 1997; Christidis,
1998). The extent of element mobility during
alteration of pyroclastic/volcanic parent material
of the bentonites can be estimated using the method
of MacLean & Kranidiotis (1987). Although the
method does not take into account either possible
change in the density of the parent and daughter
rock or changes in the rock volume (MacLean,
1990), the mass-balance calculations can be used to
indicate relative gains or losses of elements during
bentonite formation. Zircon is the most immobile
element and shows high correlation coefficients
with the other elements (Table 4). All samples have
been grouped according to their locations and
degree of alteration (Table 5). The parent material
used in the calculations is the anhydrous hyalo-
trachyte Y3. The equation used can be written for
SiO2 as follows (MacLean & Kranidiotis, 1987):
SiO2 �
SiO2�wt:%�
Zr�ppm�(alt. rock)� Zr(ppm. hyl. tr.)
Using the above equation, calculations were
performed for each element and the values subtracted
from sample Y3 concentrations in order to determine
mass gains and losses (Table 6). Figure 12a,b shows
graphically the elemental loss and gain that has
occurred during the alteration of the parent material.
The Si, Na and K have been depleted in almost all
deposits whereas Mg and Ca are enriched. The
increases in Mg and Ca may be relative but the gains
in Mg probably reflect the circulation of seawater
through the precursor material of the bentonites
during its alteration (Fisher & Schmincke, 1984;
Christidis & Dunham, 1997; Christidis, 2001). This is
supported by trace element loss and enrichment in Sr.
For example; dolomites forming in a marine
environment are known to have high Sr content
(Land & Hoops, 1973). At the beginning of the
alteration, K increased and then depleted during more
advanced alteration. Other changes in elemental
concentrations are reflected in the mineral assem-
blage of the samples; the excess silica precipitated as
opal-CT and/or zeolite and the loss of the Rb may be
related to breakdown of biotite (Fig. 12b).
STABLE ISOTOPE GEOCHEMISTRY
OF SMECT ITES
The isotopic compositions of the montmorillonite
clay fractions (<2 mm) from the open pit 1 in the
FIG. 10. Spider diagram of the Ordu area bentonic clay
samples normalized to N-type MORB (the shaded field
represents trace element compositions of the surround-
ing volcanic rocks and bentonites; normalizing values
from Sun & McDonough, 1989).
FIG. 11. REE patterns of the Ordu area bentonite
samples normalized to North American Shale Compo-
site (NASC, Gromet et al., 1984).
Bentonites from Ordu, Turkey 141

TABLE 3. Major (wt.%), trace and REE concentrations of the bentonites from the Ordu area.
Sample Is° 1 2/1 Is° 1 2/2 Is° 1 2/3 Is° 1 2/4 Is° 1 2/5 Is° 1 2/6 Is° 1 2/8 Is° 1 2/9 Is° 1 2/10
location Kavaklar open pits
Open pit 1
SiO2 64.17 65.62 65.55 66.13 64.07 62.08 61.55 62.32 67.56
TiO2 0.12 0.13 0.12 0.13 0.13 0.13 0.14 0.13 0.13
Al2O3 13.76 14.39 13.69 14.2 14.13 14.47 15.39 15.34 14.72
Fe2O3* 1.01 0.76 0.75 0.79 1.02 0.96 0.88 0.89 0.83
MnO 0.07 0.03 0.03 0.08 0.03 0.03 0.03 0.02 0.02
MgO 3.45 2.90 2.70 2.80 2.58 3.42 3.69 3.60 2.94
CaO 1.67 1.71 1.51 1.54 1.52 1.62 1.66 1.65 0.99
Na2O 0.55 0.79 0.72 0.81 0.9 0.77 0.83 0.81 1.34
K2O 0.68 1.48 1.05 1.29 1.43 1.04 0.95 0.78 0.9
P2O5 <0.01 0.01 <0.01 <0.01 <0.01 0.01 0.01 <0.01 0.02
LOI 14.3 12.1 13.7 12.2 14 15.4 14.8 14.3 10.5
Sum 99.78 99.92 99.82 99.97 99.81 99.93 99.93 99.84 99.95
Trace elements (ppm)
Zr 116.4 115.6 100.4 104 103.4 108.2 129.4 118.3 139.4
Y 21.2 31.6 15.4 16.9 24.3 18 16.6 13.7 22
Sr 139 259.6 177.8 207.4 138.6 145.5 150.2 148.8 153
Rb 50.8 84.6 69.3 77.2 120.2 57.9 54 55.1 68.9
Th 29.4 34.7 29.1 27.2 48.7 30.4 31.3 28.6 31.9
Ta 1.1 1.4 1.7 1.4 1.4 1.2 1.4 1.4 1.3
Zn 9 7 7 7 7 10 9 10 6
Sn 1 2 2 1 2 2 2 2 2
Pb 11 10 10 8 8 9 9 10 8
Co 0.7 0.8 0.7 0.5 0.6 0.6 0.7 0.7 0.9
Cr 100 80 100 90 70 100 70 70 30
Ba 29 22 14 29 17 21 17 15 16
Nb 12.8 21.2 14.4 14.6 15.6 12.6 15.4 14.7 17.4
Y 21.2 31.6 15.4 16.9 24.3 18 16.6 13.7 22
Cs 3.1 4 4.2 4.2 5.5 3.4 3.3 3.5 6.8
Ga 14.2 15.4 13.9 12.8 13.2 14.7 15.5 16.3 16.9
Hf 3.9 3.9 3.6 3.4 3.8 3.7 4 4.2 4
Sc 2 2 2 2 4 2 2 1 2
W 3 4 3 3 5 4 5 5 6
REE (ppm)
La 34.4 48.9 33.9 29.8 81.8 32 27.5 24.8 26.6
Ce 65.8 79.6 60 50.2 138.7 63 55.1 50.6 67.7
Pr 5.89 7.43 4.96 4.73 12.69 5.33 4.82 4.46 4.66
Nd 19 23.9 15.7 15.3 41.2 16.4 14.8 14.3 14.1
Sm 3.1 3.9 2.4 2.5 6.9 2.7 2.3 2.5 2.4
Eu 0.38 0.50 0.35 0.34 0.84 0.38 0.32 0.32 0.36
Gd 2.17 3.28 1.87 1.91 5.15 2.05 1.91 1.62 2.01
Tb 0.38 0.52 0.31 0.32 0.64 0.34 0.32 0.27 0.33
Dy 2.77 3.59 2.06 2.31 3.71 2.38 2.22 1.92 2.57
Ho 0.68 0.86 0.48 0.56 0.76 0.57 0.54 0.47 0.68
Er 2.4 3.04 1.61 1.98 2.26 2.07 1.91 1.59 2.41
Tm 0.4 0.47 0.25 0.33 0.3 0.33 0.3 0.25 0.4
Yb 3.36 3.65 2.06 2.65 2.41 2.76 2.56 2.12 3.11
Lu 0.54 0.59 0.31 0.4 0.36 0.45 0.4 0.33 0.5
La/Lu 6.61 8.60 11.35 7.73 23.59 7.38 7.14 7.80 5.52
(EuN/Eu{) 0.42 0.42 0.49 0.46 0.41 0.47 0.45 0.46 0.49
142 E. AbdiogÆlu and M. Arslan

Table 3 (contd.)
Sample Is° 2.4 Is° 5.2 Is° 4.2 Is° 3.2 Average Y1 T1 As5 18 Cev4
location Kavaklar YuÈceler Tavkutlu Asarkaya Yedikapõ Cevizdere
Pit no: 2 5 4 3
SiO2 66.85 61.67 69.51 66.83 65.28 72.76 73.11 74.51 68.58 73.6
TiO2 0.13 0.14 0.1 0.14 0.13 0.14 0.11 0.09 0.15 0.10
Al2O3 13.42 15.32 11.01 15.53 14.13 11.71 12.23 10.75 12.81 11.67
Fe2O3* 0.83 0.91 0.84 1 0.89 0.99 0.64 0.66 1.2 0.67
MnO 0.02 0.01 0.02 <0.01 0.02 0.01 0.01 <0.01 0.05 0.01
MgO 2.79 3.5 2.8 1.98 2.95 0.88 0.7 1.57 0.95 1.12
CaO 1.14 1.59 1.08 1.41 1.43 1.14 2.13 1.05 0.98 1.12
Na2O 1.15 0.71 0.73 1 0.87 1.38 0.34 1.26 2.27 0.88
K2O 1.1 0.81 0.6 1.72 1.06 1.74 1.53 1.2 3.92 1.87
P2O5 <0.01 0.01 <0.01 <0.01 0.00 <0.01 <0.01 <0.01 <0.01 <0.01
LOI 12.4 15.4 13.3 10.3 13.17 9.2 9 9.4 9 8.9
Sum 99.83 100.07 99.99 99.91 99.92 99.95 99.8 100.49 99.91 99.94
Trace elements (ppm)
Zr 111.6 120.5 101.7 109 112.86 138.3 117.6 83.2 124.9 111.9
Y 19.4 23.2 14.2 9 18.21 19.3 10.4 14.4 15.7 15.7
Sr 167.9 170.6 134.2 177.1 165.67 113.5 395.7 159.9 101.1 108.3
Rb 56.8 45.7 48.2 63.4 62.21 134.3 114.8 51.6 195.2 185.6
Th 32.3 36.8 20.1 20.9 29.95 30.1 29.9 19.3 35 23.8
Ta 1.6 1.5 1.1 1.3 1.38 4.7 1.2 4.5 1.2 4.9
Zn 7 9 11 7 8.25 4 2 6 8 6
Sn 1 2 1 2 1.64 2 1 2 2 3
Pb 11 7 9 8 8.99 8 6 <3 6 <3
Co 0.7 0.7 0.8 0.9 0.74 3 1.1 0.5 1.9 0.7
Cr 80 110 100 70 84.45 110 110 110 140 130
Ba 33 23 48 40 28. 42 27 16 61 22
Nb 15 17.9 12.9 15.4 15.36 44.6 14.4 44 13.3 45.9
Y 19.4 23.2 14.2 9 18.21 19.3 10.4 14.4 15.7 15.7
Cs 3.6 3.3 4 3.8 3.95 5.4 5.6 4.4 6.9 7.5
Ga 16.1 18 13.6 16.2 15.38 15.3 13.8 15.2 13.6 16.3
Hf 3.5 4.2 3.7 3.7 3.81 4 3.7 3.3 3.7 3.7
Sc 2 1 1 2 1.81 1 1 1 2 1
W 3 4 3 4 3.86 2 6 1 5 1
REE (ppm)
La 44.00 38.30 22.1 30.4 35.72 44.3 32.2 30.6 40.7 28
Ce 80.10 71.80 37.50 50.40 65.01 80.00 68.30 34.10 70.90 42.30
Pr 7.16 6.12 3.82 4.81 5.80 6.96 5.77 4.16 6.36 4.25
Nd 22.3 19.7 11.5 15 18.27 21.7 18.3 12.3 19.4 13.2
Sm 3.50 3.10 2.00 2.40 2.97 3.50 2.80 2.30 2.70 2.30
Eu 0.49 0.44 0.27 0.37 0.41 0.36 0.42 0.13 0.46 0.15
Gd 2.6 2.61 1.57 1.61 2.27 2.75 1.87 1.83 2.2 1.63
Tb 0.41 0.45 0.24 0.25 0.36 0.43 0.28 0.29 0.34 0.3
Dy 2.74 3.08 1.78 1.46 2.44 2.74 1.57 1.99 2.12 1.97
Ho 0.63 0.75 0.41 0.34 0.58 0.61 0.34 0.44 0.51 0.5
Er 2.12 2.61 1.52 1.01 1.98 2.04 1.05 1.39 1.83 1.6
Tm 0.34 0.42 0.24 0.15 0.33 0.32 0.17 0.22 0.3 0.26
Yb 2.7 3.26 1.96 1.31 2.52 2.54 1.33 1.77 2.5 1.97
Lu 0.4 0.49 0.29 0.2 0.39 0.38 0.19 0.29 0.44 0.31
La/Lu 11.42 8.11 7.91 15.78 10.17 12.10 17.59 10.95 9.60 9.38
(EuN/Eu{) 0.48 0.46 0.45 0.54 0.46 0.34 0.53 0.19 0.56 0.22
* All Fe as Fe2O3
Eu{= (SmNGdN)/2
Bentonites from Ordu, Turkey 143

Kavaklar area are given in Table 7. The O and H
isotopic values vary within narrow limits from +22
to +22.4% and ÿ75 to ÿ96%, respectively.
When the isotopic values of the montmorillonites
are plotted in a dD/d18O diagram (Fig. 13), they fall
near the smectite (SM) line, which represents the
isotopic compositions of smectites in equilibrium
with meteoric water at 20ëC. The Ml field
represents the isotopic compositions of the
Archidona montmorillonite Deep Sea Drilling
Project (DSDP) samples described by Andrews
(1980) and Lawrence & Drever (1981), which
formed by seawater-basalt interaction at tempera-
tures between 30 and 55ëC. In Fig. 13, the
TABLE 4. Correlation coefficient of Al, Ti, Hf, Nb, Zr
and Y for the volcanics and bentonite occurrences of
the Ordu area. The shaded fields are meaningful values
at p <0.0500.
Al Ti Hf Nb Zr Y
Al 1.00 0.49 0.56 ÿ0.48 0.53 0.22
Ti 0.49 1.00 0.26 ÿ0.30 0.58 0.11
Hf 0.56 0.26 1.00 ÿ0.20 0.81 0.35
Nb ÿ0.48 ÿ0.30 ÿ0.20 1.00 ÿ0.42 ÿ0.18
Zr 0.53 0.58 0.81 ÿ0.42 1.00 0.33
Y 0.22 0.11 0.35 ÿ0.18 0.33 1.00
TABLE 5. Grouped anhydrous samples based on 100 g from the Ordu area (REE indicate average REE
content).
Fresh rock Partly
(Y3) altered Kavaklar YuÈceler Tavkutlu Asarkaya Cevizdere Yedikapõ
Major oxides (wt.%)
SiO2 79.26 72.52 74.49 80.16 80.50 81.77 80.83 75.42
Al2O3 11.39 14.73 16.77 12.90 13.47 11.80 12.82 14.09
Fe2O3* 0.93 0.97 1.02 1.09 0.70 0.72 0.74 1.32
MgO 0.05 0.39 3.50 0.97 0.77 1.72 1.23 1.04
CaO 0.40 0.53 1.73 1.26 2.35 1.15 1.23 1.08
Na2O 3.51 1.70 1.00 1.52 0.37 1.38 0.97 2.50
K2O 4.31 8.70 1.27 1.92 1.68 1.32 2.05 4.31
TiO2 0.10 0.40 0.15 0.15 0.12 0.10 0.11 0.16
P2O5 0.01 0.01 0.01 0.01 0.01 0.01 0.01 0.01
MnO 0.02 0.03 0.04 0.01 0.01 0.01 0.01 0.05
Cr2O3 0.01 0.01 0.01 0.01 0.01 0.01 0.01 0.02
Sum 100.00 100.00 100.00 100.00 100.00 100.00 100.00 100.00
Trace elements (ppm)
Sc 1.00 4.33 2.00 1.00 1.00 1.00 1.00 1.00
Co 1.20 1.40 0.71 3.00 1.10 0.50 0.70 1.90
Cs 3.90 3.67 4.06 5.40 5.60 4.40 7.50 6.90
Ga 15.40 11.13 15.27 15.30 13.80 15.20 16.30 13.60
Hf 3.30 3.50 3.83 4.00 3.70 3.30 3.70 3.70
Nb 41.50 11.13 15.58 44.60 14.40 44.00 45.90 13.30
Rb 209.90 224.93 66.99 134.30 114.80 51.60 185.60 195.20
Sn 3.00 2.00 1.75 2.00 1.00 2.00 3.00 2.00
Sr 22.20 117.07 169.63 113.50 395.70 159.90 108.30 101.10
Ta 4.90 1.00 1.39 4.70 1.20 4.50 4.90 1.20
Th 28.00 22.30 31.78 30.10 29.90 19.30 23.80 35.00
Tl 1.20 1.33 0.35 1.60 0.80 0.30 0.60 0.50
U 5.50 6.30 2.79 3.80 2.10 0.90 14.70 11.00
W 5.00 4.00 4.08 2.00 6.00 1.00 1.00 5.00
Zr 82.20 125.60 114.68 138.30 117.60 83.20 111.90 124.90
Y 12.90 15.07 19.28 19.30 10.40 14.40 15.70 15.70
Aver. REE 8.92 8.34 10.54 12.05 9.61 6.56 7.05 10.77
* All Fe as Fe2O3
144 E. AbdiogÆlu and M. Arslan

supergene/hypogene (SH) line described by
Sheppard et al. (1969) and the lines for kaolinite
and montmorillonite are from Savin & Epstein
(1970). Sheppard et al. (1969) showed that
hypogene and supergene clays that equilibrated at
surface temperatures can be distinguished from each
other because the isotopic compositions of hypo-
gene clays plot closer to the meteoric water line.
TABLE 6. Mass gains and losses from the Ordu area samples in g and ppm (based on 100 g of
freshest rock Y3 and constant Zr).
Partly Kavaklar YuÈceler Tavkutlu Asarkaya Cevizdere Yedikapõ
altered
Major oxides (g)
SiO2 ÿ31.80 ÿ25.87 ÿ31.62 ÿ22.99 1.53 ÿ19.89 ÿ29.63
Al2O3 ÿ1.76 0.63 ÿ3.73 ÿ1.98 0.26 ÿ1.98 ÿ2.12
Fe2O3* ÿ0.29 ÿ0.20 ÿ0.28 ÿ0.44 ÿ0.21 ÿ0.39 ÿ0.06
MgO 0.21 2.46 0.53 0.49 1.65 0.85 0.64
CaO ÿ0.05 0.84 0.34 1.24 0.73 0.50 0.31
Na2O ÿ2.40 ÿ2.80 ÿ2.61 ÿ3.25 ÿ2.15 ÿ2.80 ÿ1.87
K2O 1.39 ÿ3.40 ÿ3.17 ÿ3.13 ÿ3.01 ÿ2.80 ÿ1.47
TiO2 0.16 0.01 ÿ0.01 ÿ0.02 0.00 ÿ0.02 0.01
P2O5 0.00 0.00 0.00 0.00 0.00 0.00 0.00
MnO 0.00 0.01 ÿ0.01 ÿ0.01 ÿ0.01 ÿ0.01 0.02
Cr2O3 0.00 0.00 0.00 0.00 0.00 0.00 0.00
Sum ÿ34.55 ÿ28.32 ÿ40.56 ÿ30.10 ÿ1.20 ÿ26.54 ÿ34.19
Trace elements (ppm)
Sc 1.84 0.43 ÿ0.41 ÿ0.30 ÿ0.01 ÿ0.27 ÿ0.34
Co ÿ0.28 ÿ0.69 0.58 ÿ0.43 ÿ0.71 ÿ0.69 0.05
Cs ÿ1.50 ÿ0.99 ÿ0.69 0.01 0.45 1.61 0.64
Ga ÿ8.11 ÿ4.46 ÿ6.31 ÿ5.75 ÿ0.38 ÿ3.43 ÿ6.45
Hf ÿ1.01 ÿ0.56 ÿ0.92 ÿ0.71 ÿ0.04 ÿ0.58 ÿ0.86
Nb ÿ34.21 ÿ30.33 ÿ14.99 ÿ31.43 1.97 ÿ7.78 ÿ32.75
Rb ÿ62.69 ÿ161.88 ÿ130.08 ÿ129.66 ÿ158.92 ÿ73.56 ÿ81.43
Sn ÿ1.69 ÿ1.75 ÿ1.81 ÿ2.30 ÿ1.02 ÿ0.80 ÿ1.68
Sr 54.42 99.38 45.26 254.39 135.78 57.36 44.34
Ta ÿ4.25 ÿ3.90 ÿ2.11 ÿ4.06 ÿ0.45 ÿ1.30 ÿ4.11
Th ÿ13.41 ÿ5.23 ÿ10.11 ÿ7.10 ÿ8.93 ÿ10.52 ÿ4.97
Tl ÿ0.33 ÿ0.95 ÿ0.25 ÿ0.64 ÿ0.90 ÿ0.76 ÿ0.87
U ÿ1.38 ÿ3.50 ÿ3.24 ÿ4.03 ÿ4.61 5.30 1.74
W ÿ2.38 ÿ2.07 ÿ3.81 ÿ0.81 ÿ4.01 ÿ4.27 ÿ1.71
Zr 0.00 0.00 0.00 0.00 0.00 0.00 0.00
Y ÿ3.04 0.92 ÿ1.43 ÿ5.63 1.33 ÿ1.37 ÿ2.57
Aver. REE ÿ3.47 ÿ1.37 ÿ1.77 ÿ2.20 ÿ2.45 ÿ3.74 ÿ1.84
* All Fe as Fe2O3
TABLE 7. Oxygen and hydrogen isotopic composition of smectites from the Kavaklar area
(samples from open pit 1).
Sample Is° 1 2/2 Is° 1 2/3 Is° 1 2/4 Is° 1 2/5 Is° 1 2/6 Is° 1 2/8
d18OV-SMOW (%) 22.0 22.0 22.2 22.4 22.0 22.2
dDV-SMOW (%) ÿ77 ÿ96 ÿ89 ÿ8 ÿ75 ÿ87
Water content (wt.%) 4.5 5.4 4.14 4.86 5.04 4.68
Bentonites from Ordu, Turkey 145

Adopting this approach, the isotopic composition of
the Kavaklar montmorillonite can be observed to
overlap with the field of low-temperature mont-
morillonite (MI) thus indicating formation at low
temperature rather than at higher temperatures
within a hydrothermal environment.
The isotopic composition of clays depends on the
conditions of formation such as temperature, and the
isotopic composition of the fluids responsible for
their formation (e.g. Yui & Chang, 1999). In order to
deduce such conditions of formation, the degree of
isotopic fractionation between the fluid and mineral
phases needs to be known as a function of
temperature (e.g. Yui & Chang, 1999). In this
study, we have determined and plotted (Fig. 14) the
O- and H-isotopic compositions of the fluid, the H-
FIG. 12. (a) Mass change in grams of the major elements, and (b) (facing page) mass change in ppm of the trace
elements during bentonite formation in the studied area.
146 E. AbdiogÆlu and M. Arslan

isotope fractionation relationship between mont-
morillonite and water (Yeh, 1980), and the
O-isotope fraction relationship between smectite and
water (Sheppard & Gilg, 1996). The equation of Yeh
(1980) is valid for formation temperatures between
29 and 120ëC, and was selected here because the
formation temperature of montmorillonite in the
studied area is considered to be low. Assuming the
isotopic compositions of the analysed montmorillo-
nites have retained their isotopic compositions from
the time of formation, the isotopic compositions of
the fluid can be calculated for various temperatures
using the equations mentioned. The results for the
Ordu area bentonites are shown in Fig. 14.
Since the precursor materials of bentonites
formed in shallow marine environments in the
Eastern Pontide volcanic arc, the fluids for mont-
morillonite formation can be considered to have
been seawater and/or meteoric water. The present-
day d18O and dD isotopic compositions of the
Black Sea are ÿ3% and ÿ25%, respectively,
(Balderer, 1999) and of meteoric water, ÿ12.2%
and ÿ13.73% (GuÈltekin, 1999), respectively. If
these two components played an active role in the
formation of the montmorillonites, the calculated
isotopic composition of fluid should lie between
these two extremes. The isotopic relationships of
Fig. 14 indicate that the montmorillonite probably
Bentonites from Ordu, Turkey 147

formed from a mixture of seawater and lesser
amounts of meteoric water at a temperature of
20ÿ40ëC.
These suggestions are based on the assumption
that the water/rock ratio during the water-rock
interaction was high, otherwise O-isotope values
from smectite samples are not indicative of the O
isotope values of ambient fluid (Yui & Chang,
1999).
Water/rock ratio calculations were based upon
the equation proposed by Ohmoto (1986), where
d18Orock
initialwas taken as 6.5Ô1%, which is the
general value for basaltic and andesitic rocks
(Taylor, 1979). As feldspar was thought to be the
best mineral for indicating the isotopic composition
of the water, d18OinitialH2O
was calculated at equili-
brium temperature from 350 to 700ëC using the
feldspar-water equation of O'Neil & Taylor (1967)
proposed for a closed system. For the d18OfinalH2O
value, the smectite-water equation of Savin & Lee
(1988) was used. The result of these calculations
indicate a water/rock ratio of >1 for montmorillon-
ite formation, with temperatures between 20 and
50ëC and an equilibrium temperature between
plagioclase-water of 350ÿ700ëC.
FIG. 13. dD vs. d18O plot showing the isotopic
compositions of the Kavaklar area smectites. MWL,
meteoric water line; the lines for kaolinite and
montmorillonite are from Savin & Epstein (1970);
SH, supergene/hypogene line of Sheppard et al. (1969)
and SM, smectite line representing isotopic composi-
tions of smectite in equilibrium with meteoric waters
at 20ëC. Mh and Ml, isotopic compositional ranges of
high-temperature and low-temperature montmorillon-
ites. Black Sea, the isotopic composition of its present-
day seawater (Balderer, 1999).
FIG. 14. dD vs. d18O plot showing calculated isotopic compositions of fluids in equilibrium with the Kavaklar
smectites at different temperatures. The shaded area represents the isotopic compositions of the present-day meteoric
water of Black Sea region. Equations used in calculations are as follows: 1000 Ina(O)(smectite-water)= +2.55(106/T
2) ±
4.05 (Sheppard & Gilg, 1996) and 1000 Ina(H)(montmorillonite-water)= ÿ19.6(103/T) + 25 (Yeh, 1980).
148 E. AbdiogÆlu and M. Arslan

SUMMARY AND CONCLUS IONS
Earlier researchers (e.g. Kamitani, 1978; CË elik et al.,
1999) considered the bentonitic clays in the Eastern
Pontides to be of hydrothermal origin because of
their association with massive sulphide deposits and
young intrusive rocks. However, the bentonites we
investigated provide evidence of having been formed
by the in situ alteration of pyroclastic materials in a
shallow marine environment.
Our findings are as follows:
(1) The bentonites contain a range of residual
minerals and textures derived from a variety of
pyroclastic parent rocks.
(2) The bentonites are essentially monomineralic
smectite and display no vertical or lateral zoning as
described for hydrothermal alteration (Inoue, 1995).
(3) H and O stable isotope data from the smectite
indicate precipitation from mixed marine/meteoric
waters at 20ÿ40ëC.
(4) Mass-balance calculations on the develop-
ment of the bentonites from their parent pyroclastic
rock show relative enhancement in Mg and Sr,
features that are typical of alteration in a marine
environment.
(5) Lack of zeolites and extensive loss of SiO2
during argillization suggest a well-flushed system of
alteration (e.g. Christidis & Dunham, 1997).
(6) The various bentonite deposits occur within a
formation of volcanics and pyroclastics (Tirebolu
Formation) and were probably deposited subaerially
as there is no evidence of associated marine or
other sediments. However, the pore waters from the
overlying marine sediments (Akveren Formation)
are suggested to have penetrated the underlying
non-marine sediments and to have played an
important role in the formation of bentonites by
argillization of pyroclastic rocks.
ACKNOWLEDGMENTS
This study is partly supported by Karadeniz Technical
University Research Funds (Project 20.112.005.9). The
authors thank Prof. A. E. Fallick at the Scottish
Universities Environmental Research Centre (East
Kilbride, Scotland) for performing stable isotope
analyses and reviewing an earlier version of the
manuscript, and Professor L. Warr for his editorial
comments and suggestions. Comments and helpful
suggestions by C.V. Jeans and an anonymous reviewer
are greatly appreciated.
REFERENCES
AbdiogÆlu E., Arslan M., Kolaylõ H. & Kadir S. (2004)
Mineralogical and geochemical characteristics of the
Tirebolu (Giresun) bentonite deposits, NE Turkey.
Geochimica et Cosmochimica Acta, Goldschmidt
Conference, Copenhagen, A416.
Andrews A.J. (1980) Saponite and celadonite in layer 2
basalts, DSDP Leg 37. Contributions to Mineralogy
and Petrology, 73, 323ÿ340.
Arslan M., TuÈysuÈz N., Korkmaz S. & Kurt H. (1997)
Geochemistry and petrogenesis of the Eastern
Pontide volcanic rocks, Northeast Turkey. Chemie
Der Erde, 57, 157ÿ187.
Arslan M., Kolaylõ H. & AbdiogÆlu E. (2002) Tirebolu
(Giresun) yoÈ resindeki kil yataklarõnõn jeolojik,
mineralojik, jenetik ve ekonomik oÈzelliklerinin
incelenmesi. Karadeniz Technical University
Scientific Research Project: 2002.112.005.4.
(Continuing).
Balderer W. (1999) Application of Isotope Techniques.
Hydrogeology Short Course Notes, Istanbul.
Brindley G.W. (1980) Quantitative X-ray mineral
analysis of clays. Pp. 411ÿ438 in: Crystal
Structures of Clay Minerals and their X-ray
Identification (G. W. Brindley & G. Brown, editors).
Monograph 5, Mineralogical Society, London.
Bystrom-Brusewitz A.M. (1976) Studies on the Li test to
distinguish between beidellite and montmorillonite.
Pp. 419ÿ428 in: Proceedings of the International
Clay Conference, Mexico City (S.W. Bailey, editor).
Applied Publishing Ltd. Wilmettei, Illinois.
CË elik M., Karakaya N. & Temel A. (1999) Clay
minerals in hydrothermally altered volcanic rocks,
Eastern Pontides, Turkey. Clays and Clay Minerals,
47, 708ÿ717.
Christidis G. (1998) Comparative study of the mobility
of major and trace elements during alteration of an
andesite and a rhyolite to bentonite, in the islands of
Milos and Kimolos, Aegean, Greece. Clays and Clay
Minerals, 46, 379ÿ399.
Christidis G. (2001) Formation and growth of smectites
in bentonites: A case study from Kimolos Island,
Aegean, Greece. Clays and Clay Minerals, 49,
204ÿ215.
Christidis G. & Dunham A.C. (1993) Compositional
variations in smectites Part I. Alteration of inter-
mediate volcanic rocks. A case study from Milos
Island, Greece. Clay Minerals, 28, 255ÿ273.
Christidis G. & Dunham A.C. (1997) Compositional
variations in smectites Part II: Alteration of acidic
precursors, a case study from Milos Island, Greece.
Clay Minerals, 32, 253ÿ270.
Fisher R.V. & Schmicke H.U. (1984) Pyroclastic Rocks.
Springer-Verlag, New York, 472 pp.
German C.R. & Elderfield H. (1990) Application of the
Ce anomaly as paleoredox indicator: the ground
Bentonites from Ordu, Turkey 149

rules. Paleoceanography, 5, 823ÿ833.
Greene-Kelly, R. (1953) The identification of montmor-
illonoids in clays. Journal of Soil Sciences, 4,
233ÿ237.
Grim R.E. & Kulbicki G. (1961) Montmorillonites: High
temperature reactions and classifications. American
Mineralogist, 46, 1329ÿ1369.
Gromet L.P., Dymek R.F., Haskin L.A. & Korotev R.L.
(1984) The `North American Shale Composite': its
compilation, major and trace element characteristics.
Geochimica et Cosmochimica Acta, 48, 2469ÿ2482.
GuÈltekin F. (1999) GuÈmuÈs° hane ve Bayburt yoÈresi
mineralli su kaynaklarõnõn hidrokimyasõ ve izotopik
oÈ zell ikleri . PhD thesis, Trabzon, Turkey
(unpublished).
GuÈven N. (1988) Smectites. Pp. 497ÿ559 in: Hydrous
Phyllosilicates (S.W. Bailey, editor). Reviews in
Mineralogy, Vol. 19. Mineralogical Society of
America, Washington, D.C.
Inoue A. (1995) Formation of Clay Minerals in
Hydrothermal Environments. Pp. 268ÿ329 in:
Origin and Mineralogy of Clay Minerals (B.
Velde, editor). Springer-Verlag.
Jackson M.L. (1956) Soil Chemical Analysis ÿ
Advanced Course. Department of Soil Science,
University of Wisconsin, Madison.
Jeans C.V., Wray D.S., Merriman R.J. & Fisher M.J.
(2000) Volcanogenic clays in Jurassic and
Cretaceous strata of England and the North Sea
Basin, Clay Minerals, 35, 25ÿ55.
Jones J.B. & Segnit E.R. (1971) The nature of opal: I.
nomenclature and constituent phases. Journal of the
Geological Society of Australia, 18, 57ÿ68.
Kamitani M. (1978) DogÆu Karadeniz boÈlgesi'ndeki
kaolin, serisit ve montmorillonit kil yataklarõ.
M.T.A. Genel MuÈduÈrluÈgÆuÈ, Ankara (unpublished).
Kunze G.W. (1965) Pretreatments for mineralogical
analysis. Pp. 568ÿ577 in: Methods of Soil Analysis
Part I. Physical and mineralogical properties
including statistics of measurement and sampling
(C.A. Black, editor). Agronomy Society of America
Inc., Madison, Wisconsin.
Land L.S. & Hoops G.K. (1973) Sodium in carbonate
sediments and rocks: A possible index to salinity of
diagenetic solutions, Journal of Sedimentary
Petrology, 43, 614ÿ617.
Lawrence J.R. & Drever J.I. (1981) Evidence for cold
water circulation at DSDP Site 395: Isotopes and
chemistry of alteration products. Journal of
Geophysical Research, 86, 5123ÿ5133.
Macaulay C.I., Fallick A.E., Haszeldine R.S. & Graham
C.M. (2000) Methods of laser based stable isotope
measurement applied to diagenetic cement and
hydrocarbon reservoir quality. Clay Minerals, 35,
313ÿ322.
MacLean W.H. (1990) Mass change calculations in
altered rock series.Mineralium Deposita, 25, 44ÿ49.
MacLean W.H. & Kranidiotis P. (1987) Immobile
elements as monitors of mass transfer in hydro-
thermal alteration: Phelps Dodge massive sulfide
deposits, Matagami, Quebec. Economic Geology, 2,
951ÿ962.
Mehra O.P. & Jackson M.L. (1960) Iron oxide removal
from soils and clays by a dithionite-citrate system
buffered by sodium bicarbonate. Clays and Clay
Minerals, Proceedings of the 7th Conference,
National Academy of Science, National Research
Council Publication, pp. 317ÿ327.
O'Neil J.R. & Taylor H.P. (1967) The oxygen isotope
and cation exchange chemistry of feldspars.
American Mineralogist, 52, 1414ÿ1437.
Ohmoto H. (1986) Stable isotope geochemistry of ore
deposits. Pp. 491ÿ559 in: Stable Isotopes in High
Temperature Geological Processes (J.W. Valley &
J.R. O'Neil, editors). Rewiews in Mineralogy, 16.
Mineralogical Society of America, Washington, D.C.
Savin S.M. & Epstein S. (1970) The oxygen and
hydrogen isotope geochemistry of clay minerals.
Geochimica et Cosmochimica Acta, 34, 25ÿ42.
Savin S.M. & Lee M. (1988) Isotopic studies of
phyllosilicates. Pp. 189ÿ223 in: Hydrous
Phyllosilicates (S.W. Bailey, editor). Rewiews in
Mineralogy, 19. Mineralogical Society of America,
Washington, D.C.
Sharp Z.D. (1990) A laser based microanalytical method
for the in-situ determination of oxygen isotope ratios
of silicates and oxides. Geochimica et Cosmochimica
Acta, 54, 1353ÿ1357.
Sheppard S.M.F. & Gilg H.A. (1996) Stable isotope
geochemistry of clay minerals. Clay Minerals, 31,
1ÿ24.
Sheppard S.M.F., Nielsen R.L. & Taylor H.P. (1969)
Oxygen and hydrogen isotope ratios of clay minerals
from porphyry copper deposits. Economic Geology,
64, 755ÿ777.
Sun S.S. & McDonough W.F. (1989) Chemical and
isotopic systematics of oceanic basalts: implications
for mantle composition and processes. Pp. 313ÿ345
in: Magmatism in Ocean Basins (A.D. Saunders &
M.J. Norry, editors). Special Publication 42,
Geological Society of London.
Taylor H.P. (1979) Oxygen and hydrogen isotope
relationships in hydrothermal mineral deposits. Pp.
236ÿ277 in: Geochemistry of Hydrothermal Ore
Deposits (H.L. Barnes, editor), Wiley Interscience,
New York.
Tsipursky S.I. & Drits V.A. (1984) The distribution of
octahedral cations in the 2:1 layers of dioctahedral
smectites studied by oblique-texture electron diffrac-
tion. Clay Minerals, 19, 177ÿ193.
Velde B. (1992) Introduction to Clay Minerals,
Chemistry, Origins, Uses and Environmental
Significance. Chapman & Hall, London, 198 pp.
Weaver C.E. & Pollard L.D. (1973) The Chemistry of
150 E. AbdiogÆlu and M. Arslan

Clay Minerals. Developments in Sedimentology, 15,
Elsevier Science Publishing Co., Amsterdam,
213 pp.
Wilson M.J. (1987) X-ray powder diffraction methods.
Pp. 26ÿ98 in: A Handbook of Determinative
Methods in Clay Mineralogy (M.J. Wilson, editor).
Blackie and Sons Ltd, Glasgow, UK.
Winchester J.A. & Floyd P.A. (1977) Geochemical
discrimination of different magma series and their
differentiation products using immobile elements.
Chemical Geology, 20, 245ÿ252.
YalcËõn H. & GuÈmuÈs° er G. (2000) Mineralogical and
geochemical characteristics of Late Cretaceous
bentonite deposits of the Kelkit Valley Region,
Northern Turkey. Clay Minerals, 35, 807ÿ825.
Yeh H.W. (1980) D/H ratios and late stage dehydration
of shales dur ing bur ia l . Geochimica et
Cosmochimica Acta, 44, 341ÿ352.
Yui T.F. & Chang S.S. (1999) Formation conditions of
vesicle/fissure-filling smectites in Penghu basalts: a
stable-isotope assessment. Clay Minerals, 34,
381ÿ393.
Bentonites from Ordu, Turkey 151