Characterization of molten globule state of fetuin at low pH
7
Characterization of molten globule state of fetuin at low pH Farah Naseem, Rizwan Hasan Khan * , Soghra Khatun Haq, Aabgeena Naeem Interdisciplinary Biotechnology Unit, Aligarh Muslim University, Aligarh 202002, India Received 28 October 2002; received in revised form 13 February 2003; accepted 25 April 2003 Abstract Effect of pH over a range of 0.8 – 10 on bovine serum fetuin (BSF) was observed by far and near-UV circular dichroism (CD) spectroscopy, intrinsic tryptophan fluorescence and ANS fluorescence measurements. It has been reported earlier by our group that a molten globule (MG) state exists in a-chymotrypsinogen [Biochim. Biophys Acta 1481 (2000) 229] and stem bromelain [Eur. J. Biochem. 269 (2002) 47] at low pH. In this paper we have shown the presence of an MG form of fetuin at low pH. The far-UV CD spectra showed the regain of secondary structure at pH 1.8 as compared to the complete loss of secondary structure in presence of 6 M GnHCl. Near-UV CD spectra showed disruption of tertiary structure at pH 1.8. Tryptophan fluorescence studies indicated that there is only a slight red shift in the wavelength emission maxima (k max ) of fetuin at low pH as compared to a significantly red-shifted spectrum of the completely unfolded state in 6 M GnHCl, indicating that the tryptophan environment of fetuin at low pH resembles more the native form. ANS binding experiments also showed an enhancement in ANS binding with decrease in pH up to 1.8. ANS binding was absent at pH 7 and in the presence of 6 M GnHCl. Fluorescence quenching experiments were also performed with acrylamide, cesium chloride and potassium iodide. The quenching of tryptophan fluorescence by the three different quenchers indicates that low pH induces a conformational change in protein, making the tryptophan residue less accessible to solvent. This suggests that a more compact structure exists at low pH. The results, being in accordance with far-UV CD and fluorescence studies, imply the presence of MG state of fetuin at low pH. As studied by fluorescence spectroscopy, denaturation of fetuin at low pH was found to be reversible. D 2003 Elsevier B.V. All rights reserved. Keywords: Fetuin; MG state; Circular dichroism; pH 1. Introduction Fetuin is a glycoprotein abundant in calf serum. It is a protein found predominantly during fetal stage. Experiments with serum from calves of different ages have shown that the amount of this globulin has its highest value in newly born calves and decreases with time. The name fetuin is derived from the Latin name for foetus, namely fetus. It is associated with the period when the greatest building and development of the animal takes place. Fetuin is thought to play an important role in fetal brain development [1,2]. Bovine serum fetuin (BSF) comes under the category of acute phase reactants. Acute phase reactants are proteins usually synthe- sized by liver cells, although other cells such as macro- phages can also participate in their production. The synthesis of these proteins is dramatically modified by infection, inflammation and malignancy. Equivalent of fetuin in other mammalian species is alpha 2-HS glycoprotein (AHSG), which is a negative acute phase reactant synthesized by liver [3]. The carbohydrate portion of fetuin is made up of three branched heteropolysaccharide units. These units have been shown to have a similar monosaccharide composition. The peptide portion consists of a single chain with six intrachain disulfide bonds. The carbohydrate chains comprise 24% of the total molecular weight 48,000 [4]. Proteins may unfold through intermediate(s) which retain(s) a substantially high content of secondary structure but little or no tertiary structure known as molten globules (MG) [5,6]. The MG state attracts special attention; it may have some features of the native fold. However, this state differs from native state by the absence of close packing throughout the molecule and by a substantial increase of 1570-9639/03/$ - see front matter D 2003 Elsevier B.V. All rights reserved. doi:10.1016/S1570-9639(03)00169-9 Abbreviations: MG, molten globule; CD, circular dichroism * Corresponding author. Tel.: +91-571-2720388; fax: +91-571- 2721776. E-mail addresses: [email protected], [email protected] (R. Hasan Khan). www.bba-direct.com Biochimica et Biophysica Acta 1649 (2003) 164 – 170
-
Upload
independent -
Category
Documents
-
view
0 -
download
0
Transcript of Characterization of molten globule state of fetuin at low pH
www.bba-direct.com
Biochimica et Biophysica Acta 1649 (2003) 164–170
Characterization of molten globule state of fetuin at low pH
Farah Naseem, Rizwan Hasan Khan*, Soghra Khatun Haq, Aabgeena Naeem
Interdisciplinary Biotechnology Unit, Aligarh Muslim University, Aligarh 202002, India
Received 28 October 2002; received in revised form 13 February 2003; accepted 25 April 2003
Abstract
Effect of pH over a range of 0.8–10 on bovine serum fetuin (BSF) was observed by far and near-UV circular dichroism (CD) spectroscopy,
intrinsic tryptophan fluorescence and ANS fluorescence measurements. It has been reported earlier by our group that a molten globule (MG)
state exists in a-chymotrypsinogen [Biochim. Biophys Acta 1481 (2000) 229] and stem bromelain [Eur. J. Biochem. 269 (2002) 47] at low pH.
In this paper we have shown the presence of an MG form of fetuin at low pH. The far-UV CD spectra showed the regain of secondary structure
at pH 1.8 as compared to the complete loss of secondary structure in presence of 6 M GnHCl. Near-UV CD spectra showed disruption of
tertiary structure at pH 1.8. Tryptophan fluorescence studies indicated that there is only a slight red shift in the wavelength emission maxima
(kmax) of fetuin at low pH as compared to a significantly red-shifted spectrum of the completely unfolded state in 6 M GnHCl, indicating that
the tryptophan environment of fetuin at low pH resembles more the native form. ANS binding experiments also showed an enhancement in
ANS binding with decrease in pH up to 1.8. ANS binding was absent at pH 7 and in the presence of 6 M GnHCl. Fluorescence quenching
experiments were also performed with acrylamide, cesium chloride and potassium iodide. The quenching of tryptophan fluorescence by the
three different quenchers indicates that low pH induces a conformational change in protein, making the tryptophan residue less accessible to
solvent. This suggests that a more compact structure exists at low pH. The results, being in accordance with far-UV CD and fluorescence
studies, imply the presence of MG state of fetuin at low pH. As studied by fluorescence spectroscopy, denaturation of fetuin at low pH was
found to be reversible.
D 2003 Elsevier B.V. All rights reserved.
Keywords: Fetuin; MG state; Circular dichroism; pH
1. Introduction
Fetuin is a glycoprotein abundant in calf serum. It is a
protein found predominantly during fetal stage. Experiments
with serum from calves of different ages have shown that the
amount of this globulin has its highest value in newly born
calves and decreases with time. The name fetuin is derived
from the Latin name for foetus, namely fetus. It is associated
with the period when the greatest building and development
of the animal takes place. Fetuin is thought to play an
important role in fetal brain development [1,2]. Bovine
serum fetuin (BSF) comes under the category of acute phase
reactants. Acute phase reactants are proteins usually synthe-
1570-9639/03/$ - see front matter D 2003 Elsevier B.V. All rights reserved.
doi:10.1016/S1570-9639(03)00169-9
Abbreviations: MG, molten globule; CD, circular dichroism
* Corresponding author. Tel.: +91-571-2720388; fax: +91-571-
2721776.
E-mail addresses: [email protected],
[email protected] (R. Hasan Khan).
sized by liver cells, although other cells such as macro-
phages can also participate in their production. The synthesis
of these proteins is dramatically modified by infection,
inflammation and malignancy. Equivalent of fetuin in other
mammalian species is alpha 2-HS glycoprotein (AHSG),
which is a negative acute phase reactant synthesized by liver
[3].
The carbohydrate portion of fetuin is made up of three
branched heteropolysaccharide units. These units have been
shown to have a similar monosaccharide composition. The
peptide portion consists of a single chain with six intrachain
disulfide bonds. The carbohydrate chains comprise 24% of
the total molecular weight 48,000 [4].
Proteins may unfold through intermediate(s) which
retain(s) a substantially high content of secondary structure
but little or no tertiary structure known as molten globules
(MG) [5,6]. The MG state attracts special attention; it may
have some features of the native fold. However, this state
differs from native state by the absence of close packing
throughout the molecule and by a substantial increase of
F. Naseem et al. / Biochimica et Biophysica Acta 1649 (2003) 164–170 165
fluctuations in side chains as well as of larger parts of the
molecules [7–9]. Several studies from our lab and others
have shown that the compactness and the amount of secon-
dary structure of the intermediate state formed in the folding
pathway of proteins are not necessarily close to those of the
native state but vary greatly depending upon the protein
species and experimental conditions [5,10,15]. Molten glob-
ules are likely to play a significant role in the folding of
proteins in vivo. The functional role of these intermediate
states has been discussed [11].
It has been demonstrated that a transient intermediate
which accumulates during refolding of bovine carbonic
anhydrase, human a-lactalbumin, bovine lactoglobulin,
yeast phosphoglycerate kinase, h-lactamase from Staph-
ylococcus aureus and recombinant human interleukin 1hhas the properties of the MG state [12]. Recently, there has
been considerable interest in whether a new type of
intermediate state might be located between the native
state and MG state or the MG state and the unfolded state
[13,14]. Such a partially unfolded state of stem bromelain
has been characterized at low pH [15]. Effect of salts and
alcohols on acid induced states of different proteins like
cytochrome c, myoglobin, papain and a-chymotrypsino-
gen-A has also been studied and a partially folded inter-
mediate of a-chymotrypsinogen-A has been characterized
[16]. In general, certain proteins under conditions of low
pH have the characteristics of MG state, they have compact
dimension, abundant secondary structure and largely dis-
ordered tertiary structure [5,12]. Recently, increasing evi-
dences support the idea that the MG state besides having
secondary structure may posses well defined tertiary con-
tacts as well [17–20]. Thus, the structural similarity
between the MG and native protein may have a significant
bearing in understanding the protein folding problem [21].
Studies conducted by Wang et al. [22] show that BSF is
unfolded through an MG state on heating and on treatment
with GnHCl. In our studies we have shown the MG state of
fetuin at low pH. Low pH acts as a mild denaturant and
results in intermediate states which are less unfolded and
nearer to native structure as compared to unfolded state
obtained on treating the protein with strong denaturant like
GnHCl. Reversibility studies by spectrofluorometry showed
that fetuin was completely reversible in the pH range 2–7
while it was found to be partially irreversible from pH 1.8 to
pH 7. As already stated, fetuin plays a vital role in
development during fetal stages especially in brain devel-
opment and also has homology with AHSG which is said
to be its mammalian counterpart. So studies were carried
out to prove the conformational alterations in the structure
of this protein and its application to clinical biochemistry
and its related protein AHSG. Fetuin (AHSG) has a role in
postnatal bone growth and remodeling [23]. It contributes
to insulin resistance during normal pregnancy and gesta-
tional diabetes. It also regulates neonatal skeletal develop-
ment [24]. Moreover, fetuin is involved in the fetal brain
development. It has been shown that fetuin and various
cytokines have a developmentally regulated appearance
and expression in the developing neocortex [1,2]. A short
19-amino-acid sequence of fetuin shows a degree of
homology to an 18-amino-acid sequence of the transform-
ing growth factors-beta (TGF-beta) type-II receptor, and in
vitro fetuin binds to members of the TGF-beta family of
cytokines. It has been suggested that fetuin is the bio-
logically significant antagonist of these cytokines [2]. Thus,
fetuin has a very important role in the overall development
of the fetus. Any misfolding in this protein can have
adverse effects on its functioning and its interaction with
cells and other molecules, leading to general development
as well as brain development anomalies. Attempts can be
made to correct the misfolding if the folding pathway is
well understood. Folding studies conducted on fetuin may
prove to be useful in understanding the pathway by which
the protein attains its native conformation. Knowledge of
MG or partially unfolded states is also very important
because they are the starting points of the process by
which folding to the active form of protein is achieved
following biosynthesis.
2. Materials and methods
2.1. Materials
Fetuin from fetal calf serum type IV (lot 63 F-9555) and
GnHCl were purchased from Sigma Chemical Co. (St.
Louis, MO, USA). Acrylamide was purchased from Quali-
gens Fine Chemicals (India). All other reagents and buffer
compounds used were of analytical grade.
2.2. Methods
A stock solution of 10 mg ml� 1 protein was prepared in
distilled water and it was dialysed for 4 h at low temperature
(4 jC) and the respective solutions were made in different-
pH buffers. GnHCl solution (6 M) was prepared in 10 mM
sodium phosphate buffer, pH 7.
2.2.1. Protein concentration determination
Protein concentrations were determined spectrophotomet-
rically using an extinction coefficient = 5.3 [25] on a Hitachi
U-1500 spectrophotometer or alternatively by the method of
Lowry et al. [26]. pH measurements were carried out on an
Elico digital pH meter (model LI610).
2.2.2. Circular dichroism (CD) measurements
CD measurements were carried out with a Jasco spectro-
polarimeter, model J-720, equipped with a micro-computer.
The instrument was calibrated with D-10-camphorsulfonic
acid. All the CD measurements were carried out at 25 jCwith a thermostatically controlled cell holder attached to a
Neslab RTE-110 water bath with an accuracy of F 0.1 jC.Far-UV CD spectra were measured at a protein concentration
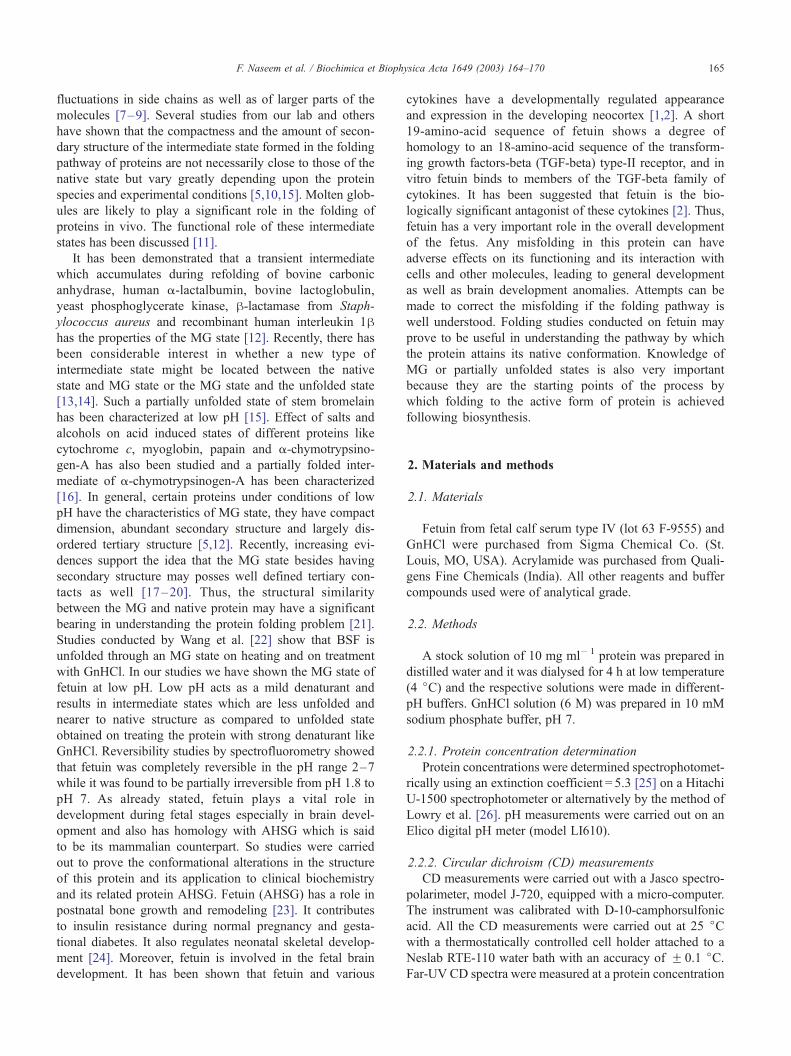
Fig. 1. pH transition curve in the near-UV region (A). Near-UV CD
spectrum of fetuin at pH 7 (—) ; pH 1.8 (– – ) and in the presence of 6 M
GnHCl (- - -) (B). Spectra were measured in the wavelength region 250 to
300 nm and the signals were quantified at 256 nm. Protein concentration was
2 mgml� 1. Experiments were carried out in 20 mM of the following buffers:
pH 0.8–2.8, glycine-HCl buffer; pH 3–5, sodium-acetate buffer; pH 6–8,
sodium-phosphate buffer.
F. Naseem et al. / Biochimica et Biophysica Acta 1649 (2003) 164–170166
of 0.15 mg ml� 1 and near-UV CD spectra were measured at
protein concentration of 2 mg ml� 1. The pathlengths were 1
mm and 1 cm, respectively. The results are expressed as
mean residue ellipticity (MRE) in deg cm2 dmol� 1 defined
as
MRE ¼ hobs ðmdegÞ=10� n� Cp� l:
where hobs is the CD in millidegree; n = 309 is the number of
amino acid residues; l is the pathlength of the cell in
centimeters and Cp is the molar fraction. The a-helical
content of fetuin was calculated from the MRE value at
222 nm using the following equation as described by Chen et
al. [27].
% a � helix ¼ MRE222 � 2340=30300� 100:
For thermal-transition studies, a water-jacketed 1-mm-path-
length cell was used for far-UV CD, and a water-jacketed 10-
mm-pathlength cell was used for near-UV CD attached to the
RTE-110 waterbath interfaced with a microcomputer. A
protein concentration of 2 mg ml� 1 was used for near-UV
CD measurements and 0.15 mg ml� 1 was used for far-UV
CD measurements.
2.2.3. Fluorescence measurements
Fluorescence measurements were performed on a Shi-
madzu spectrofluorometer, model RF-540. The fluorescence
spectra were measured at a protein concentration of 0.15 mg
ml� 1. Solutions were prepared in buffers 20 mM each of
different pH values ranging from pH 0.6 to 10 [pH 0.6–2.8,
Gly-HCl buffer; pH 3–5, Na-Ac buffer; pH 6–8, Na-PO4;
pH 9–10, Gly-NaOH buffer]. Before making measurements
the solutions were incubated overnight at 4 jC. Intrinsicspectra were recorded between 300 and 400 nm with
excitation wavelength of 280 nm. For ANS fluorescence
in the ANS binding experiments, the excitation was set at
380 nm and the emission spectra were taken in the range of
400–600 nm.
2.2.4. Quenching experiments
In the quenching experiments, aliquots of 5 M quencher
stock solution were added to a protein stock solution (1 mg
ml� 1) to achieve the desired range of quencher concentra-
tion (0.1–1 M). Excitation was set at 295 nm in order to
excite tryptophan residues only and the emission spectrum
was recorded in the range 300–400 nm. The decrease in
fluorescence intensity at Emax was analyzed according to the
Stern–Volmer equation [28].
F0=F ¼ 1þ Ksv½Q�
where F0 and F are the fluorescence intensities at an
appropriate wavelength in the absence and presence of
quencher, respectively; Ksv is the Stern–Volmer constant;
and [Q] is concentration of the quencher.
3. Results and discussion
3.1. CD studies
As can be seen from Fig. 1A, there is a rapid loss of
tertiary structure shown by the decrease in negative MRE at
256 nm with decreasing pH (up to 1.8); beyond this pH the
ellipticity is found to increase. Fig. 1B shows the near-UV
CD spectrum of fetuin at pH 7 (curve 1), pH 1.8 (curve 2)
and in presence of 6 M GnHCl (curve 3). At pH 7 protein
shows two maxima at 256 and 289 nm and one minima at
F. Naseem et al. / Biochimica et Biophysica Acta 1649 (2003) 164–170 167
266 nm. Fetuin at pH 1.8 shows a significant decrease in the
band intensities. Near-UV CD spectra show that the spec-
trum at pH 1.8 resembles more that of fetuin in the presence
of 6 M GnHCl, reflective of less-ordered tertiary structure.
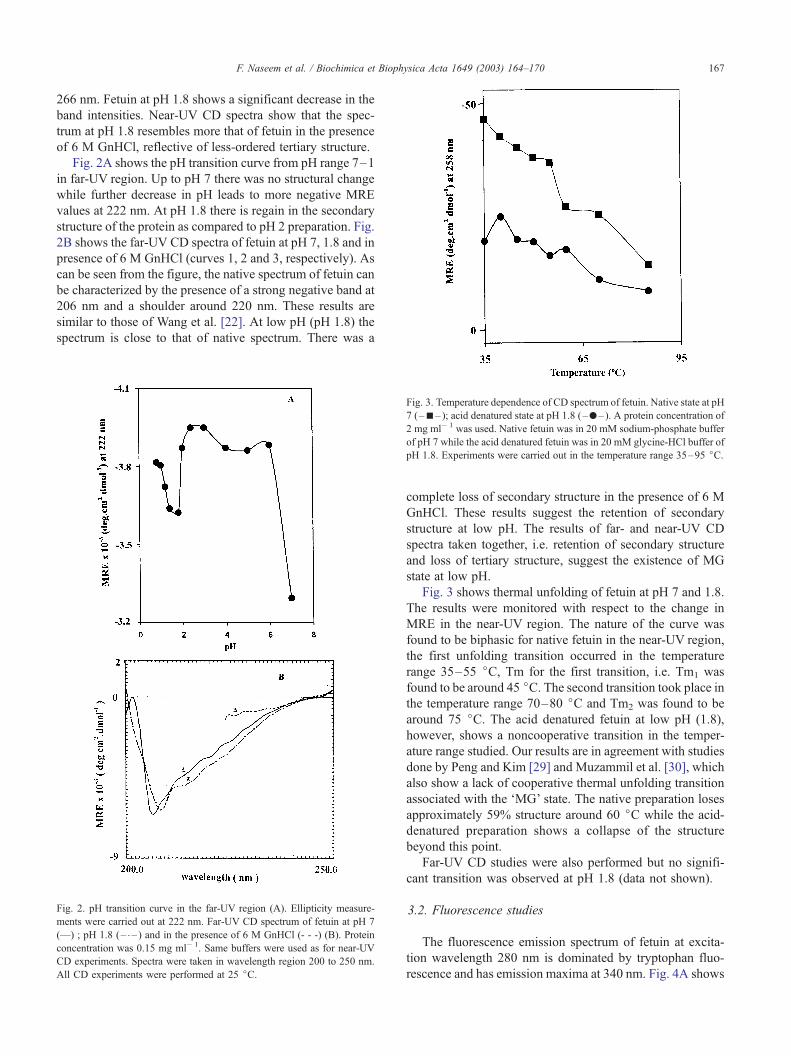
Fig. 2A shows the pH transition curve from pH range 7–1
in far-UV region. Up to pH 7 there was no structural change
while further decrease in pH leads to more negative MRE
values at 222 nm. At pH 1.8 there is regain in the secondary
structure of the protein as compared to pH 2 preparation. Fig.
2B shows the far-UV CD spectra of fetuin at pH 7, 1.8 and in
presence of 6 M GnHCl (curves 1, 2 and 3, respectively). As
can be seen from the figure, the native spectrum of fetuin can
be characterized by the presence of a strong negative band at
206 nm and a shoulder around 220 nm. These results are
similar to those of Wang et al. [22]. At low pH (pH 1.8) the
spectrum is close to that of native spectrum. There was a
Fig. 3. Temperature dependence of CD spectrum of fetuin. Native state at pH
7 (–n– ); acid denatured state at pH 1.8 (–.– ). A protein concentration of
2 mg ml� 1 was used. Native fetuin was in 20 mM sodium-phosphate buffer
of pH 7 while the acid denatured fetuin was in 20 mM glycine-HCl buffer of
pH 1.8. Experiments were carried out in the temperature range 35–95 jC.
Fig. 2. pH transition curve in the far-UV region (A). Ellipticity measure-
ments were carried out at 222 nm. Far-UV CD spectrum of fetuin at pH 7
(—) ; pH 1.8 (– – ) and in the presence of 6 M GnHCl (- - -) (B). Protein
concentration was 0.15 mg ml� 1. Same buffers were used as for near-UV
CD experiments. Spectra were taken in wavelength region 200 to 250 nm.
All CD experiments were performed at 25 jC.
complete loss of secondary structure in the presence of 6 M
GnHCl. These results suggest the retention of secondary
structure at low pH. The results of far- and near-UV CD
spectra taken together, i.e. retention of secondary structure
and loss of tertiary structure, suggest the existence of MG
state at low pH.
Fig. 3 shows thermal unfolding of fetuin at pH 7 and 1.8.
The results were monitored with respect to the change in
MRE in the near-UV region. The nature of the curve was
found to be biphasic for native fetuin in the near-UV region,
the first unfolding transition occurred in the temperature
range 35–55 jC, Tm for the first transition, i.e. Tm1 was
found to be around 45 jC. The second transition took place inthe temperature range 70–80 jC and Tm2 was found to be
around 75 jC. The acid denatured fetuin at low pH (1.8),
however, shows a noncooperative transition in the temper-
ature range studied. Our results are in agreement with studies
done by Peng and Kim [29] and Muzammil et al. [30], which
also show a lack of cooperative thermal unfolding transition
associated with the ‘MG’ state. The native preparation loses
approximately 59% structure around 60 jC while the acid-
denatured preparation shows a collapse of the structure
beyond this point.
Far-UV CD studies were also performed but no signifi-
cant transition was observed at pH 1.8 (data not shown).
3.2. Fluorescence studies
The fluorescence emission spectrum of fetuin at excita-
tion wavelength 280 nm is dominated by tryptophan fluo-
rescence and has emission maxima at 340 nm. Fig. 4A shows
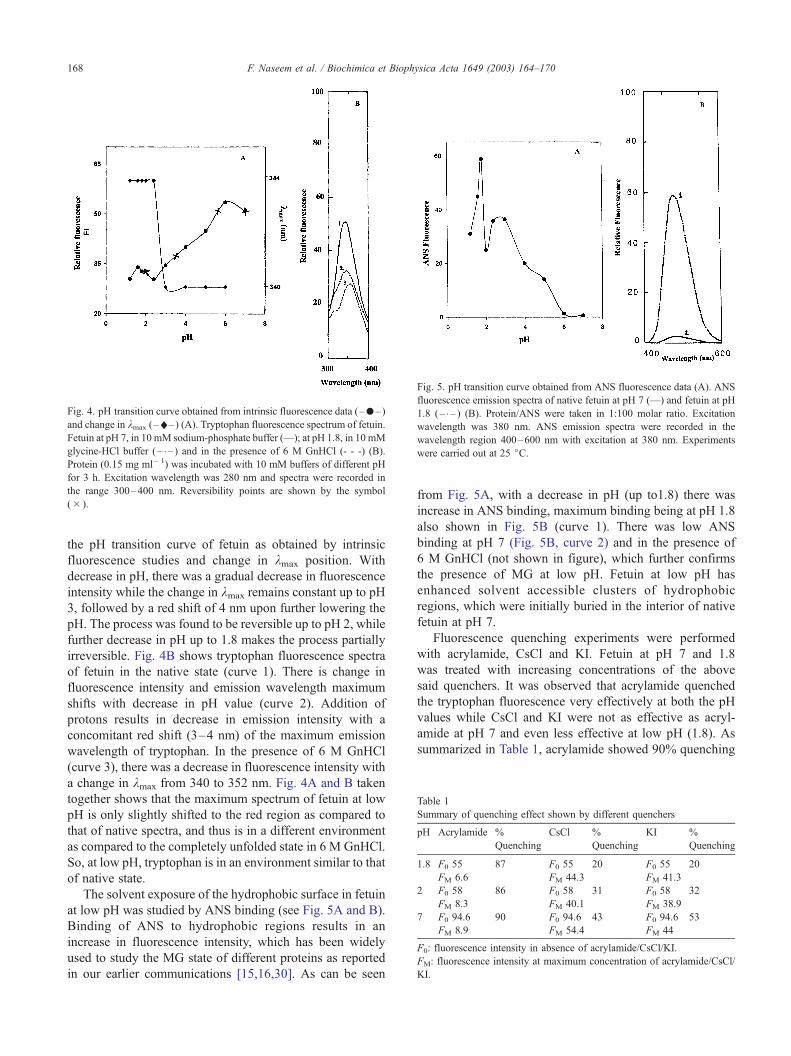
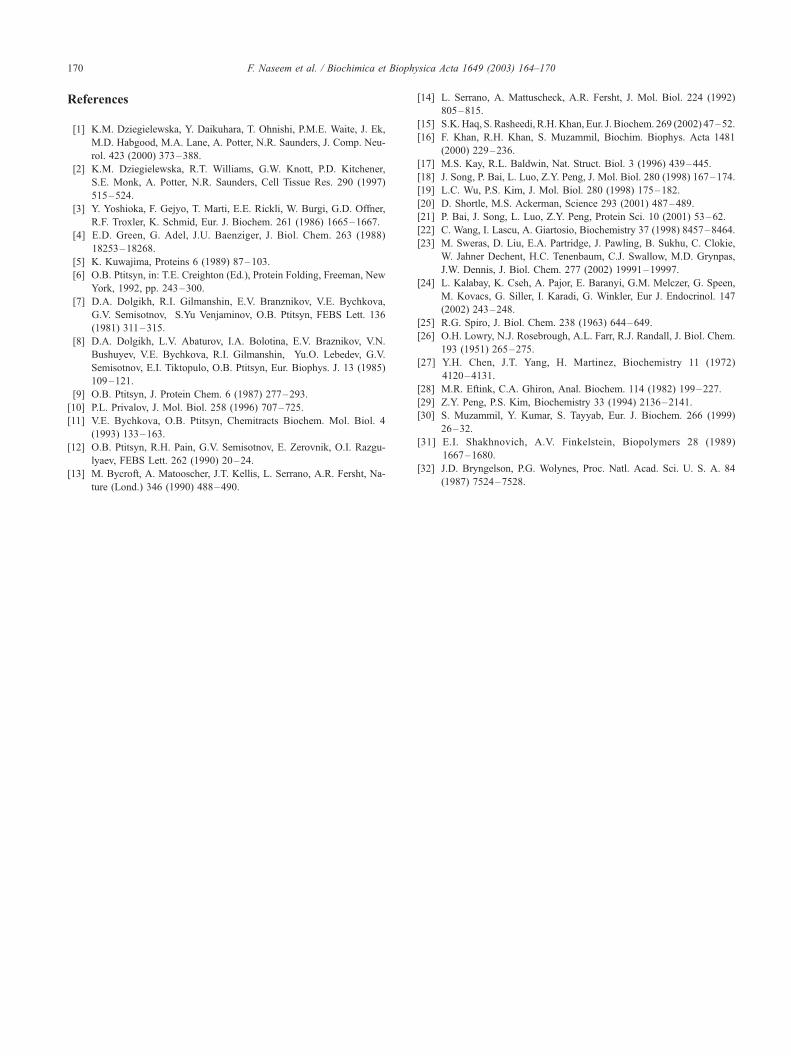
Fig. 5. pH transition curve obtained from ANS fluorescence data (A). ANS
fluorescence emission spectra of native fetuin at pH 7 (—) and fetuin at pH
1.8 (– – ) (B). Protein/ANS were taken in 1:100 molar ratio. Excitation
wavelength was 380 nm. ANS emission spectra were recorded in the
wavelength region 400–600 nm with excitation at 380 nm. Experiments
were carried out at 25 jC.
Table 1
Summary of quenching effect shown by different quenchers
pH Acrylamide %
Quenching
CsCl %
Quenching
KI %
Quenching
1.8 F0 55 87 F0 55 20 F0 55 20
FM 6.6 FM 44.3 FM 41.3
2 F0 58 86 F0 58 31 F0 58 32
FM 8.3 FM 40.1 FM 38.9
7 F0 94.6 90 F0 94.6 43 F0 94.6 53
FM 8.9 FM 54.4 FM 44
F0: fluorescence intensity in absence of acrylamide/CsCl/KI.
FM: fluorescence intensity at maximum concentration of acrylamide/CsCl/
KI.
Fig. 4. pH transition curve obtained from intrinsic fluorescence data (–.–)
and change in kmax (–x–) (A). Tryptophan fluorescence spectrum of fetuin.
Fetuin at pH 7, in 10 mM sodium-phosphate buffer (—); at pH 1.8, in 10 mM
glycine-HCl buffer (– – ) and in the presence of 6 M GnHCl (- - -) (B).
Protein (0.15 mg ml� 1) was incubated with 10 mM buffers of different pH
for 3 h. Excitation wavelength was 280 nm and spectra were recorded in
the range 300–400 nm. Reversibility points are shown by the symbol
(� ).
F. Naseem et al. / Biochimica et Biophysica Acta 1649 (2003) 164–170168
the pH transition curve of fetuin as obtained by intrinsic
fluorescence studies and change in kmax position. With
decrease in pH, there was a gradual decrease in fluorescence
intensity while the change in kmax remains constant up to pH
3, followed by a red shift of 4 nm upon further lowering the
pH. The process was found to be reversible up to pH 2, while
further decrease in pH up to 1.8 makes the process partially
irreversible. Fig. 4B shows tryptophan fluorescence spectra
of fetuin in the native state (curve 1). There is change in
fluorescence intensity and emission wavelength maximum
shifts with decrease in pH value (curve 2). Addition of
protons results in decrease in emission intensity with a
concomitant red shift (3–4 nm) of the maximum emission
wavelength of tryptophan. In the presence of 6 M GnHCl
(curve 3), there was a decrease in fluorescence intensity with
a change in kmax from 340 to 352 nm. Fig. 4A and B taken
together shows that the maximum spectrum of fetuin at low
pH is only slightly shifted to the red region as compared to
that of native spectra, and thus is in a different environment
as compared to the completely unfolded state in 6 M GnHCl.
So, at low pH, tryptophan is in an environment similar to that
of native state.
The solvent exposure of the hydrophobic surface in fetuin
at low pH was studied by ANS binding (see Fig. 5A and B).
Binding of ANS to hydrophobic regions results in an
increase in fluorescence intensity, which has been widely
used to study the MG state of different proteins as reported
in our earlier communications [15,16,30]. As can be seen
from Fig. 5A, with a decrease in pH (up to1.8) there was
increase in ANS binding, maximum binding being at pH 1.8
also shown in Fig. 5B (curve 1). There was low ANS
binding at pH 7 (Fig. 5B, curve 2) and in the presence of
6 M GnHCl (not shown in figure), which further confirms
the presence of MG at low pH. Fetuin at low pH has
enhanced solvent accessible clusters of hydrophobic
regions, which were initially buried in the interior of native
fetuin at pH 7.
Fluorescence quenching experiments were performed
with acrylamide, CsCl and KI. Fetuin at pH 7 and 1.8
was treated with increasing concentrations of the above
said quenchers. It was observed that acrylamide quenched
the tryptophan fluorescence very effectively at both the pH
values while CsCl and KI were not as effective as acryl-
amide at pH 7 and even less effective at low pH (1.8). As
summarized in Table 1, acrylamide showed 90% quenching
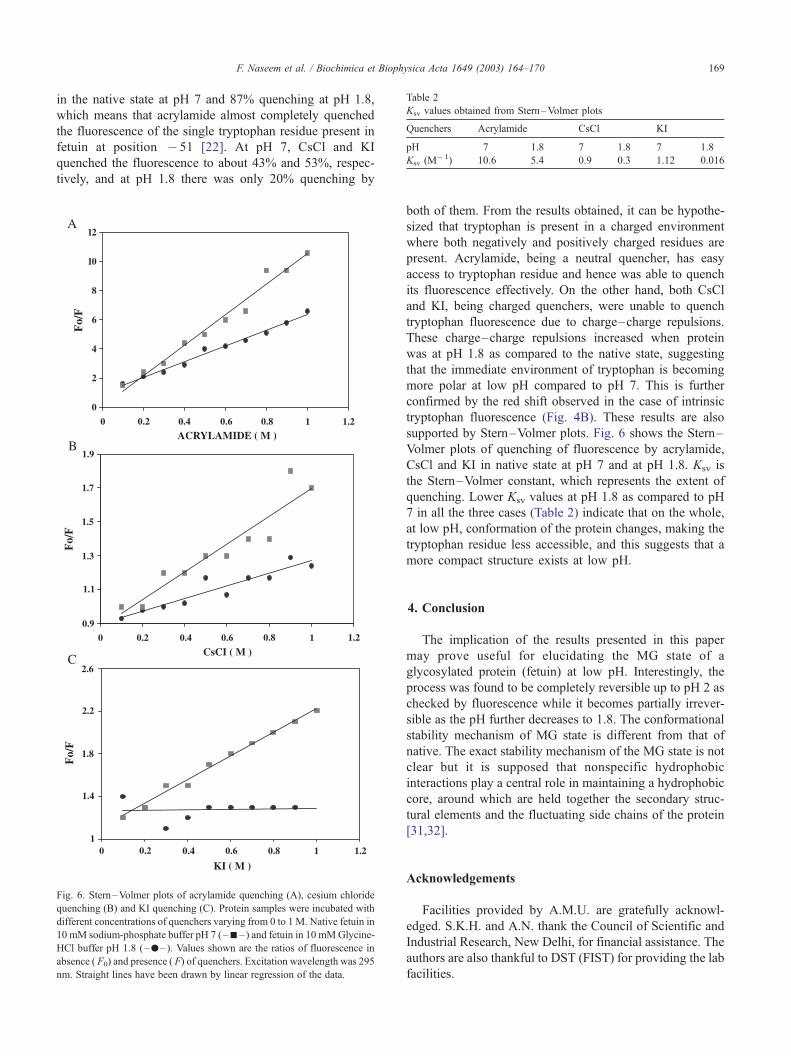
Table 2
Ksv values obtained from Stern–Volmer plots
Quenchers Acrylamide CsCl KI
pH 7 1.8 7 1.8 7 1.8
Ksv (M� 1) 10.6 5.4 0.9 0.3 1.12 0.016
F. Naseem et al. / Biochimica et Biophysica Acta 1649 (2003) 164–170 169
in the native state at pH 7 and 87% quenching at pH 1.8,
which means that acrylamide almost completely quenched
the fluorescence of the single tryptophan residue present in
fetuin at position � 51 [22]. At pH 7, CsCl and KI
quenched the fluorescence to about 43% and 53%, respec-
tively, and at pH 1.8 there was only 20% quenching by
Fig. 6. Stern–Volmer plots of acrylamide quenching (A), cesium chloride
quenching (B) and KI quenching (C). Protein samples were incubated with
different concentrations of quenchers varying from 0 to 1M. Native fetuin in
10 mM sodium-phosphate buffer pH 7 (–n– ) and fetuin in 10 mMGlycine-
HCl buffer pH 1.8 (–.–). Values shown are the ratios of fluorescence in
absence ( F0) and presence ( F) of quenchers. Excitation wavelength was 295
nm. Straight lines have been drawn by linear regression of the data.
both of them. From the results obtained, it can be hypothe-
sized that tryptophan is present in a charged environment
where both negatively and positively charged residues are
present. Acrylamide, being a neutral quencher, has easy
access to tryptophan residue and hence was able to quench
its fluorescence effectively. On the other hand, both CsCl
and KI, being charged quenchers, were unable to quench
tryptophan fluorescence due to charge–charge repulsions.
These charge–charge repulsions increased when protein
was at pH 1.8 as compared to the native state, suggesting
that the immediate environment of tryptophan is becoming
more polar at low pH compared to pH 7. This is further
confirmed by the red shift observed in the case of intrinsic
tryptophan fluorescence (Fig. 4B). These results are also
supported by Stern–Volmer plots. Fig. 6 shows the Stern–
Volmer plots of quenching of fluorescence by acrylamide,
CsCl and KI in native state at pH 7 and at pH 1.8. Ksv is
the Stern–Volmer constant, which represents the extent of
quenching. Lower Ksv values at pH 1.8 as compared to pH
7 in all the three cases (Table 2) indicate that on the whole,
at low pH, conformation of the protein changes, making the
tryptophan residue less accessible, and this suggests that a
more compact structure exists at low pH.
4. Conclusion
The implication of the results presented in this paper
may prove useful for elucidating the MG state of a
glycosylated protein (fetuin) at low pH. Interestingly, the
process was found to be completely reversible up to pH 2 as
checked by fluorescence while it becomes partially irrever-
sible as the pH further decreases to 1.8. The conformational
stability mechanism of MG state is different from that of
native. The exact stability mechanism of the MG state is not
clear but it is supposed that nonspecific hydrophobic
interactions play a central role in maintaining a hydrophobic
core, around which are held together the secondary struc-
tural elements and the fluctuating side chains of the protein
[31,32].
Acknowledgements
Facilities provided by A.M.U. are gratefully acknowl-
edged. S.K.H. and A.N. thank the Council of Scientific and
Industrial Research, New Delhi, for financial assistance. The
authors are also thankful to DST (FIST) for providing the lab
facilities.
F. Naseem et al. / Biochimica et Biophysica Acta 1649 (2003) 164–170170
References
[1] K.M. Dziegielewska, Y. Daikuhara, T. Ohnishi, P.M.E. Waite, J. Ek,
M.D. Habgood, M.A. Lane, A. Potter, N.R. Saunders, J. Comp. Neu-
rol. 423 (2000) 373–388.
[2] K.M. Dziegielewska, R.T. Williams, G.W. Knott, P.D. Kitchener,
S.E. Monk, A. Potter, N.R. Saunders, Cell Tissue Res. 290 (1997)
515–524.
[3] Y. Yoshioka, F. Gejyo, T. Marti, E.E. Rickli, W. Burgi, G.D. Offner,
R.F. Troxler, K. Schmid, Eur. J. Biochem. 261 (1986) 1665–1667.
[4] E.D. Green, G. Adel, J.U. Baenziger, J. Biol. Chem. 263 (1988)
18253–18268.
[5] K. Kuwajima, Proteins 6 (1989) 87–103.
[6] O.B. Ptitsyn, in: T.E. Creighton (Ed.), Protein Folding, Freeman, New
York, 1992, pp. 243–300.
[7] D.A. Dolgikh, R.I. Gilmanshin, E.V. Branznikov, V.E. Bychkova,
G.V. Semisotnov, S.Yu Venjaminov, O.B. Ptitsyn, FEBS Lett. 136
(1981) 311–315.
[8] D.A. Dolgikh, L.V. Abaturov, I.A. Bolotina, E.V. Braznikov, V.N.
Bushuyev, V.E. Bychkova, R.I. Gilmanshin, Yu.O. Lebedev, G.V.
Semisotnov, E.I. Tiktopulo, O.B. Ptitsyn, Eur. Biophys. J. 13 (1985)
109–121.
[9] O.B. Ptitsyn, J. Protein Chem. 6 (1987) 277–293.
[10] P.L. Privalov, J. Mol. Biol. 258 (1996) 707–725.
[11] V.E. Bychkova, O.B. Ptitsyn, Chemitracts Biochem. Mol. Biol. 4
(1993) 133–163.
[12] O.B. Ptitsyn, R.H. Pain, G.V. Semisotnov, E. Zerovnik, O.I. Razgu-
lyaev, FEBS Lett. 262 (1990) 20–24.
[13] M. Bycroft, A. Matooscher, J.T. Kellis, L. Serrano, A.R. Fersht, Na-
ture (Lond.) 346 (1990) 488–490.
[14] L. Serrano, A. Mattuscheck, A.R. Fersht, J. Mol. Biol. 224 (1992)
805–815.
[15] S.K. Haq, S. Rasheedi, R.H. Khan, Eur. J. Biochem. 269 (2002) 47–52.
[16] F. Khan, R.H. Khan, S. Muzammil, Biochim. Biophys. Acta 1481
(2000) 229–236.
[17] M.S. Kay, R.L. Baldwin, Nat. Struct. Biol. 3 (1996) 439–445.
[18] J. Song, P. Bai, L. Luo, Z.Y. Peng, J. Mol. Biol. 280 (1998) 167–174.
[19] L.C. Wu, P.S. Kim, J. Mol. Biol. 280 (1998) 175–182.
[20] D. Shortle, M.S. Ackerman, Science 293 (2001) 487–489.
[21] P. Bai, J. Song, L. Luo, Z.Y. Peng, Protein Sci. 10 (2001) 53–62.
[22] C. Wang, I. Lascu, A. Giartosio, Biochemistry 37 (1998) 8457–8464.
[23] M. Sweras, D. Liu, E.A. Partridge, J. Pawling, B. Sukhu, C. Clokie,
W. Jahner Dechent, H.C. Tenenbaum, C.J. Swallow, M.D. Grynpas,
J.W. Dennis, J. Biol. Chem. 277 (2002) 19991–19997.
[24] L. Kalabay, K. Cseh, A. Pajor, E. Baranyi, G.M. Melczer, G. Speen,
M. Kovacs, G. Siller, I. Karadi, G. Winkler, Eur J. Endocrinol. 147
(2002) 243–248.
[25] R.G. Spiro, J. Biol. Chem. 238 (1963) 644–649.
[26] O.H. Lowry, N.J. Rosebrough, A.L. Farr, R.J. Randall, J. Biol. Chem.
193 (1951) 265–275.
[27] Y.H. Chen, J.T. Yang, H. Martinez, Biochemistry 11 (1972)
4120–4131.
[28] M.R. Eftink, C.A. Ghiron, Anal. Biochem. 114 (1982) 199–227.
[29] Z.Y. Peng, P.S. Kim, Biochemistry 33 (1994) 2136–2141.
[30] S. Muzammil, Y. Kumar, S. Tayyab, Eur. J. Biochem. 266 (1999)
26–32.
[31] E.I. Shakhnovich, A.V. Finkelstein, Biopolymers 28 (1989)
1667–1680.
[32] J.D. Bryngelson, P.G. Wolynes, Proc. Natl. Acad. Sci. U. S. A. 84
(1987) 7524–7528.


![A chemically modified [alpha]-amylase with a molten-globule state has entropically driven enhanced thermal stability](https://static.fdokumen.com/doc/165x107/631965ccbc8291e22e0f1555/a-chemically-modified-alpha-amylase-with-a-molten-globule-state-has-entropically.jpg)