CHARACTERIZATION OF MATERIALS
27
CHARACTERIZATION OF MATERIALS characterization of the various materials used in this study ( i.e., fly ash, lime and gypsum) is aimed at determining not only the actual physical, chemical, mineralogical and nlorphological properties of the above materials, but also, to ascertain the extent of variability in the above properties, even when they are obtained a single source and used in the experimental investigations. In this chapter, the experimental methods and procedures adopted in the laboratory investigations for the characterization of the above materials are presented and the results discussed. Most of the testing methods adopted conform to Bureau of Indian standards (BIS). However, only where BIS methods are not available, detailed descripti~n of the procedure based on other standards is presented, for the sake of completeness and proper understanding. A minimum of three trials were performed for all the tests and in case, the experimental values varied more than 15% of the Id.4eh.e 1 average, another set of three trials for that particular test3 performed. 3.2 SAMPLE COLLECTION 3.2.1 Fly ash Source and Collection Methods Fly ash from the nearest thermal power plant of Neyveli Lignite Corporation ( NLC) and located at Neyvcli, Tamil Nadu, India, was collected for the present study. There are two thermal power stations in the above plant, namely TS - I and '1's - I1 . In both the above stations fly ash is collected by electro - static precipitators (ESPs). Studies ? conducted at CARD ( Center for Applied Research and Development - NLC), on the physical and chemical properties of fly ash samples collected over a period of one year and with a higher frequency of sampling have revealed higher silica, iron and 1 calcium oxide (CaO) contents in the fly ash from TS - I1 than in TS - I [Kuppusamy and others (199 1) and Julia Banurnathi and others (1996)l. Hence, it was decided to collect fly ash samples from TS - I1 of NLC. In TS - 11, the ESPs have six fields, the percentage of precipitation in the different fields decreasing with the higher field 7a
-
Upload
independent -
Category
Documents
-
view
3 -
download
0
Transcript of CHARACTERIZATION OF MATERIALS
CHARACTERIZATION OF MATERIALS
characterization of the various materials used in this study ( i.e., fly ash, lime and
gypsum) is aimed at determining not only the actual physical, chemical,
mineralogical and nlorphological properties of the above materials, but also, to
ascertain the extent of variability in the above properties, even when they are obtained
a single source and used in the experimental investigations.
In this chapter, the experimental methods and procedures adopted in the laboratory
investigations for the characterization of the above materials are presented and the
results discussed. Most of the testing methods adopted conform to Bureau of Indian
standards (BIS). However, only where BIS methods are not available, detailed
descripti~n of the procedure based on other standards is presented, for the sake of
completeness and proper understanding. A minimum of three trials were performed
for all the tests and in case, the experimental values varied more than 15% of the Id.4eh.e 1
average, another set of three trials for that particular test3 performed.
3.2 SAMPLE COLLECTION
3.2.1 Fly ash Source and Collection Methods
Fly ash from the nearest thermal power plant of Neyveli Lignite Corporation ( NLC)
and located at Neyvcli, Tamil Nadu, India, was collected for the present study. There
are two thermal power stations in the above plant, namely TS - I and '1's - I1 . In both
the above stations fly ash is collected by electro - static precipitators (ESPs). Studies ?
conducted at CARD ( Center for Applied Research and Development - NLC), on the
physical and chemical properties of fly ash samples collected over a period of one
year and with a higher frequency of sampling have revealed higher silica, iron and 1 calcium oxide (CaO) contents in the fly ash from TS - I1 than in TS - I [Kuppusamy
and others (199 1) and Julia Banurnathi and others (1996)l. Hence, it was decided to
collect fly ash samples from TS - I1 of NLC. In TS - 11, the ESPs have six fields, the
percentage of precipitation in the different fields decreasing with the higher field
7a
number of the ESPs. Abo~lt 15% of the total ash produced from TS - 11, is removed as
bottol-tl ash.
3.2.2 Fly ash
Dry fly ash was collected from the first three fields of the ESPs of the TS - TI (thermal
power station 11) of NLC, blended and stored in air tight containers. Samples were
collected at different periods of time, spanning over six months for analyzing their
physical and chemical properties.
3.2.3 Gypsum
Gypsum was collected as f l o ~ ~ r o - gypsum, an industrial waste from Tamil Nadu
Fluorides and Chem~cals (TANFAC), located along the East coast road, near
Cuddalore, Tamil Nadu, India, with the collection period spread-over six months. At
TANFAC, gypsum is disposed-off at a temperature of about 200 O C in powder form.
It is collected, air cooled to normal temperature and stored in air tight containers, for
use in the present study.
3.2.4 Lime
Well burnt lime stone is available locally at Sethurapettu, located near Pondicherry,
India. The required quantity was handpicked as a single lot, well hydrated under
controlled conditions in the laboratory and then stored under water to prevent
carbonation.
3.2.5 Samples Selected for the Study
The first set of samples of fly ash and gypsum were collected in large quantities as a
single lot and hence they were used throughout the present study. The other set of
samples collected were used mainly to study the variability in the physical
characteristics etc.
3.3 PHYSICAL CHARACTERIS'TICS OF FLY ASH, LIME AND GYPSUM
3.3.1 General
Grain size analysis ( i.e. granulometric analysis), specific gravity were the physical
characteristics studied for fly ash, lime and gypsum samples, where as, fineness and
lime reactivity studies werc carried out only for fly ash samples.
3.3.2 Specific Gravity of Fly ash, Lime and Gypsum
The standard Le-Chaterlier flask conforming to IS: 1727-1 967 was used for the
determination of specific gravity of fly ash, lime and gypsum samples. The results of
the above tests are presented in Table 3.1. The specific gravity values for fly ash range
between 2.52 to 2.63; for gypsum between 2.70 to 2.86. In general, the specific
gravity values recorded did not show significant variation.
It is to be noted that the range of specific gravity of fly ash samples in the present
study are slightly higher than the range of values reported by Sharrna (1990) based on
25 samples of various Indian fly ashes and it is less than the reported maximum
specific value for fly ashes i.e. 2.98 for an iron-rich bituminous ash reported by
Wesche ( 199 1) and Malhotra and Ramezanionpour ( 1994).
3.3.3 Granulometric Analysis
Particle Size Distribution of Fly ash, Lime and Gypsum
Wet sieve analysis followed by hydrometer analysis were carried out as per the
relevant T.S. codes on the various samples of fly ash, lime and gypsum to understand
their particle size distribution. The results of the above analysis are presented in
Tables 3.2 and 3.3 and in Fig. 3.1.
Discussion on Particle Size Distribution of Fly ash
The fly ash particles predominantly range from 150 pm to finer than 10 pm. More
than 80% are finer than 75pm and 65 - 75% are finer than 45pm. There is significant
quantity of particles below 20pm to 10pm. The presence of particles below 45pm and
more specifically below 10 to 20 pm, are expected to contribute to the pozzolanic
:ffect and enhancement in compressive strength[Frohnsdrof and Clifton (1981) and
Ranganatb ( ! (!?5'' 11,
The fly ash sample i n the present study falls under category P3( i.e. particles below
10pm are in the range of 20 - 35 %), based on the categorization of the amount of
particles (%) below 10prn, for the Indian fly ashes, as reported by Shanna (1990). It is
to be noted that the above observation is in contrast with the corresponding values
reported by Mehta for US fly ashes, wherein, the particles below 10pm were 38 -
50% (Sharma - 1990). Even though, the maximum residue ( i.e. retained ) on 45 pm
sieve is not specified in the Indian code, various Intemational codes have such a
stipulation, which ranges from 12.5% ( in UK standard) to as high as 50% (in
Germany and Australian standards). The fly ash sample in this study satisfies the
above Intemational stipulation. A comparison between the particle size distribution of
25 samples of fly ashes located in different parts of India, produced from the
combustion of bituminous or sub-bituminous coals and considered to be of low-
calcium content and used for the investigations by Sharma (1990), with that of the fly
ash sample considered in this study, are given in Table 3.4.
It can be seen that the particle size distribution of the fly ash studied generally has the
same trend and that it is coarser than other Indian fly ashes, as investigated and
reported by Shanna (1990).
Discussiorz on Particle Size Distribution of Lime and Gypsum
From the particle size distribution presented in the Table 3.3, it is observed that the
gypsum used in this study, has substantial amount of fine-grained particles with more
than about 70% of the particles finer than 0.075 mm. This indicates that the gypsum is
likely to undergo vigorous chemical reaction with the reactive components of fly ash.
Lime also has substantial quantity of fines, i.e. 72 % finer than 0.075 mm, and hence,
it is likely to react vigorously with the fly ash.
3.3.4 Fineness of Fly ash
General
'Fineness' is quantified by the specific surface of a material. The specific surface is
defined as the 'number of units of surface area' contained in a 'unit weight' of a
miterial. The specific surface or fineness of fly ash (as determined by the Blaine's
method), generally varies from 250 to 550 m2 / kg (i.e. 2500 to 5500 crn2 ig) [Wesche
- 19911. The most commonly used method to determine the specific surface area, is
the Blaine's method, which is based on the resistance offered by pulverized materials
to an air flow. Particle-size analysis can also be used for the determination of the
specific surface area of fly ash; a laser particle-size analyzer is usually used for the
measurement. Another method of determining specific surface is the BET (Brunaur-
Emmet-Teller) technique, in which nitrogen adsorption isotherms are measured.
However, data obtained by this method differ from those of the Blaine's method and
that 3 to 4 times greater than the Blaine's values have been noted even for ordinary
fly ashes, because, BET method measures the totality of voids existing in the surface
of particles. A study of granulometric curves also provide an indication of fly ash
specific surface. However, values are commonly 30 % lower than those obtained from
Blaine's method, as not all fly ash particles are spherical in shape [Wesche (1991) and
Malhotra and Ramezamianpour (l994)l.
Determir~ation of Fineness
In this study the fineness of fly ash was determined using Blaine's air permeability 7
method as per IS: 1727 - 1967. The results of the above test are presented in Table 3.5.
It is observed that the fineness of fly ash samples varies between 365 to 440 m2 I kg,
with an average value of 387.5 m2 I kg. The fineness of all the samples satisfy the
minimum requirement specified in 1.S: 3812.
Comparison of Fineness Values
The average value of fineness for the fly ash samples studied was observed to be very
nearly equal to the average fineness (of about 400 - 450 m2 1 kg) reported by Chopra
and others (1964) for the Indian fly ashes investigated by them. However, the fineness
of the sample actually used In the study (440 m2 1 kg) is within the range of the
averslge fir~cncss of ' indiail fly ashes, ,is i.-tj\jG~;! by C(i-!iip;~ and .:,thcrs (1\)04). i t ;>
observed that the average valuc of fineness and the fineness of the various fly ash
~amples are within the range of Blaine's fineness values (i.e. 341 to 534 m2 / kg) as
by Sharma (1990) based on 25 samples of Indian fly ashes. It is expected that
the fineness of the fly ash sample will result in a good pozzolanic activity.
3.3.5 Lime Reactivity of Fly ash
Classificatiotl of Evaluatiorz of Pozzolarlic Activity
Currently, evaluation of pozzolanic activity is classified under three categories,
namely, chemical methods, mechanical methods and instrumental methods I
techniques. Many investigators have attempted to devise simple chemical methods to
evaluate pozzolanic activity of fly ashes, as these would consume less time than
pozzolanic activity tests based on strength development. However, no single method
has been definitely established. Most researchers agree that it is not yet possible to
predict the reactivity or pozzolanic activity from any known combination of physical
and chemical measurements on the fly ash alone. The need for rapid methods to
evaluate the reactivity of fly ashes and the developments that have taken place in
Material Science have introduced many modem analytical methods, such as, X - ray
diffraction analysis (XRD), differential thermal analysis (DTA) etc., and most of them
result in qualitative analysis. In view of the above limitations, direct test of strength
with lime is still necessary to evaluate fly ashes. In Indian codes, lime reactivity test
(IS:3812 - 1981; Specifications for fly ash for use as pozzolanic and admixture) is
specified for evaluating fly ashes, and hence adopted in this study.
Determinatiorl of Lime Reactivity
The reactivity of fly ash samples were determined from lime reactivity test as per 1.S :
1727 - 1967. A laboratory reagent grade lime and fly ash were mixed with standard
sand conforming to 1.S : 650 -1966 in the ratio I:2M:9 (lime: fly ash : standard sand,
by weight) respectively, where 'My is the ratio between the specific gravity of the
aozzolan (i.e. fly ash) and lime. Sufficient water was added to obtain a flow of 70 k
5%. Standard 50 mm cubc specimens were used to cast the specimens. Casting was
' doni i i i two !ayels, h i i k t ~ ~ h i , ? y ~ ~ of morIar iciiilpcd 25 iirrlcs ~lsillg a ia,rlijillg 1.03.
Specimens thus cast were cured in a humidity chamber for 48 hours at 2712' C and at
not less than 90 % RH (relative humidity). After 48 hours, the cubes were de-moulded
and kept in a controlled chamber at 50' C and not less than 90 % RH for 8 days.
Specimens were removed at the end of the above curing period (i.e. a total of 10 days)
and tested for their compressive strength and the average compressive strength based
on three specimens is reported as the lime reactivity in MPa. The results of the above
test are also shown in Table 3.5. The values range between 6.9 - 7.3 MPa with an
average of 7.1 MPa.
Comparison of Lirne Reactivity Values
Studies carried out by several investigators on Indian fly ashes from several sources
have reported the lime - reactivity values, in the range of 33 - 76 kg /cm2 (i.e. app.
3.3 - 7.6 MPa) [(Chopra and others (1979); Ahluwalia and others (1985); CRI
(1984); Sharma (1985); Bose (1985); CRI (1977); Sharma (1989); and Sharma
(1990)l. The highest value of lime - reactivity (i.e. 76 kg !cm2 or 7.6 MPa) has been
reported by Sharma (1990) for Indian fly ashes. The average lime - reactivity obtained
for the fly ash samples studied and the sample used in the present study is very close
to the above highest value reported by Sharma (1990). Based on the lime - reactivity
values of Indian fly ashes, Sharma (1990) has classified them into three groups( highly
reactive, medium reactive and low reactive) [Details of the above classification are
give in Appendix A2]. The lime - reactivity of fly ash used in this study can be
classified as 'highly reactive or H - typeq based on the classification proposed by
Sharma (1990). The high lime - reactivity values of the fly ash sample can be
correlated to the substantial quantity of fly ash particles below 45 prn and higher
quantity of fly ash particles below 20pm. The presence of fine particles have
contributed to the higher pozzolanic activity, confirming the phenomenon established
*by several investigators [Frohnsdroff and others (1 98 1); Sharma (1 990); Puri (1 975)
and (1971); Davis (1937); Watt and Thorn (1966); Abdun Nur (1961); Mehta (1985);
Ranganath (1 995)l.
3.4.1 General
The properties of saw lignite - the source for the ash used in this study, which are
based on a study carried out by Neyvcli Lignite Corporation (NLC), Tamil Nadu,
India, is presented in Table 3.6. It can be seen that the lignite contains nearly 50 %
moisture and that the ash content ranges from 3 - 13%, with substantial amounts of
volatile matter. These characteristics and compositions of raw lignite are expected to
influence the chemical composition of the lignite based fly ash used i n this study.
All the tests to deter~ninc the chemical con~position of the fly ash samples were
carried out at the Center for Applied Research and Development (CARD), NLC, on
all the samples collected for the present study. The results filmished by NLC are
presented in Table 3.7. Apart from silica, alumina and various other oxides, fly ash
may contain some highly toxic metals (for e.g. molybdenum (Mb), mercury (Hg),
selenium (Se), cadmium (Cd), in trace quantities, say 1 mg to 100 rng / kg of ash.
However, in this study, determination and discussion is restricted only to the major
chemical composition of fly ash.
3.4.2 Loss on Ignition
General
Loss on ignition (LOI) which represents the un-burnt carbon present in fly ash, is one
of the important parameters for assessing the quality of fly ash. Carbon acts as a
'dilutant' of the active po?.rolanic matter ~ n d hence, it is considered as an undesirable
constituent. LO1 also incl~~dcs insoluble residues in fly ash sample. Carbon content in
fly ashes is 'decisive in determining the water requirement for concrete and mortar
applications and it can be an important parameter for classifying fly ashes into three
groups, namely, G r o u p A (0 - 5%); G r o u p B (5 - 10 %); and G r o u p C (8 - 15 %)
wesche (1991)l.
The 1,01 o f the fly ash samplcs In thc study, range between 1 - 4 %, tndicating that the
quantity of un-burnt carbon is not vcry significant and that the above range is much
lower than the maximun~ limit of 12 % prescribed in I.S:3812 - 1981. In f ~ t , it IS
even lower by International standards, which IS 3 - 6% ( maximum), in most of the
well developed countries [Wesche ( I 99 1); Ranganath ( I 99.5)).
Based on LO1 content, the fly ash sample falls under Group - A, i.e. containing a 'low
range' of LO1 [Wesche - 1991) and under Group - 11, i.e. containing a 'low - medium
range' of LOI, based on the study of Indian fly ashes by Sharma(l990). Due to the
lower carbon content, it is not expected to affect the strength of concrete [Ranganath -
19951.
3.4.3 Oxide Compositions
General
Fly ashes are particularly rich in silica (SO2) , alumina (A1203) and ferric oxide
(Fe203) and calcium oxide (CaO). They also contain other oxides, such as, magnesium
oxide ( MgO), manganese oxide (MnO), potassium oxide (K20), sodium oxide (N20),
titanium oxide (Ti02), phosphorus penta oxide (P2O5), sulphur trioxide (SO3), etc., in
smaller quantities. Although, these constituents are reported as oxides they occur in
ash as a mixture of silicates, oxides and sulphates with small quantities of phosphates
and other compounds [Wesche (1991); Selvig and Gibson (1956); Abernethy and
others (1 969)l.
Cornpurisorr with I.S. Code
From the chemical composition presented in the Table 3.7, it is observed that the total
oxide content, including silica, alumina and iron, is in the range of about 70 % - 94%.
Total silica content varies between 32 - 47% and alumina content is in the range of 21
- 25 %. A significant quantity of iron oxide, i.e. 10 - 14 % is also present. Magnesium
content is slightly. higher, but, less than the maximum allowable limit of 5 % as
stipulated in 1.S: 3612 - 1981. Calcium oxide (CaO) is present in significant quantities
and it varies between 11 - 17 %. In general, the fly ash sample satisfies the
requirements of 1.S: 3812. As the CaO co~ltent in the fly ash obtained from N I X I S
more thiin I0 'h, ~t i s c:iper:id 10 have ccmcnt~t~ous c~lld p u i z c i a ~ ~ i ~ prupt;,ilzs i:\h*riii
: C618 -- 1085 and Wesche - I O O l ] .
The chemical compositional ranges of the fly ash In this study were compared with
those of the rcportcd chemical colnpositional ranges of fly ashes of other countries,
Indian fly ashes and two lignite - based U.S. ashes and presented i n Table 3.8. It can
be seen that the silica and alumina contents of the fly ash considered in this study are
comparable with those of fly ashes from other countries and other Indian fly ashes.
However, the alumina content is slightly lower than that reported for fly ash from
other countries and it is higher than the reported alumina content of lignite-based fly
ash of U.S.A. Hence, the higher contents of silica and alumina is likely to have a
greater influence on the pozzolanic potential of the fly ash [Watt and Thome (1966);
Thorne and Watt (1965); Cabrcra and others (1986)l.
The range of iron oxide in the fly ash is comparable with that of lignite based fly ash
of U.S.A. However, the iron oxide range of the fly ash is substantially lower ( say
nearly halt] of the reported values of Indian fly ashes and that of other countries.
Hence, it is not expected to cause deleterious effect on the compressive strength
values [Joshi and Rasauer (1973)l.
CaO content of the tly ash is much higher than the reported values for Indian fly ashes
and that of other t suntries. It is much lower than the range of values for lignite ash of
U.S.A. However, fly ashes with a high content of CaO are not considered desirable as
they are capable of causing unsoundness in mortars and concrete [Wesche (1991)l.
Even though MgO content of the fly ash, is higher than the reported values for Indian
fly ashes, it is comparable to the range of reported values of fly ash of other countries
and that of lignite fly ash of U.S.A. As the MgO content is less than S%, it is not
expected to be deleterious [Davis (1 949)l.
~enerally, Indian fly ashes have a lower total alkall (Na2 O+ K 2 0 ) content than f ly
of (-)the; :w01::?t:!~:2 ;;3:!2Q:zg t!ie ligi;ite fly ~ s r , :rr:,'.S ,A, ' i ' i i i tc;ta] aika]i cciiterli
in the f ly ash is 0.05%, which is very small and hence, their presence is 'not expected
to have any adverse effect' on durability of concrete. If at all there is any effect, 'they
may act as activators' during the early stages of reaction.
3.5 CHEMICAL COMPOSITION OF LIME AND GYPSUM
3.5.1 Lime
Salient chemical composition of the lime sample was determined based on the IS: 712
- 1984 (Specification for building limes) and the results are given in Table 3.9. The
lime used in the present study contains chemically active compounds (i.e. about 80 %
of oxides of calcium, magnesium, silica, alumina and iron) which have the potential to
contribute to the strength. From the results obtained, it can be seen that the chemical
composition of the lime sample is closer to that of Class 'E' type of lime.
3.5.2 Gypsum
The chemical composition of gypsum was determined by TANFAC in their Research
and Development laboratory and the test results as obtained from them are given in
Table 3.10. The results are indicative of the bulk property (i.e. the chemical
composition) of gypsum.
The properties of the gypsum sample were compared with the requirements of mineral
gypsum as per 1.S : 1290 - 1973 (given in Appendix - C). It is seen that the waste
gypsum does not confonn to any of the four types of classification i.e. Type 1 to 4, of
1,s : 1290.
The gypsum sample contains about 95% of CaS04. With about 0.2% of free moisture,
it is expected to be in a di-hydrate state (CaS04 .2H20). In this state, the gypsum is
expected to be less reactive. Hence, it becomes necessary to induce higher reactivity
in the gypsum. Studies carried out and reported by Central Building Research Institute
(CBRI), Roorkee, have suggested an 'open pan' method of calcination of gypsum (i.e.
upto1 80 - 200" C) to remove about one and a half molecule of water, which makes the
gypsum hemi-hydrate (CaS04 .%H20) and enhance its reactivity.
In ger.ers!, f!~r!$e IS kn9wn t,2 czwe rctardaticln of si~ng:!: ir: cnnc:c:c. sat t l i i V6i-v
low fluoride content (0.3%) as calcium fluoride present in the gypsum, is unlikely to
cause significant influence on the strength. As the gypsum contains small quantities of
acidic impurities as HZ SOj, it is not likely to affect the pH value of concrete
significantly, when it is used in smaller quantities. However, this may hamper the
hydration process when gypsum is used in large quantities.
3.6 pH OF FLY ASH, LIME AND GYPSUM
Concentration of hydroxyl ions, measured as pH, plays a very important role in the
formation of hydrated compounds in concrete. High alkaline environment will
enhance the hydration process. It was experienced that normally a pH value of about
13 prevails in the systems comprising of OPC. Hence, pH of the materials used in the
present study were evaluated based on the method detailed in IS:2720(Pt-XXV1)-
1976 (Method of tests for soils: Determination of pH value) and presented in Table
3.11. From the results obtained it was observed that pH values of fly ash, lime and
gypsum are: 11.4, 12.9 and 9.7, respectively. The higher value of pH for the fly ash is
due to its high-lime content and it is almost as alkaline as lime. This value of pH is
considered as enough, to induce the hydration process in the presence of water. On the
other hand, gypsum has a lower value of pH when compared to fly ash, which may be
attributed to its acidic impurities. However, it is also alkaline, but, may not be
sufficient to induce hydration with the same vigor as that of lime. Lime with the
highest value of pH among the above three materials, can create a conducive
cnvironmcnt for hydration process.
3.7 REACTIVE SILICA IN FLY ASH
3.7.1 General
Many researchers are of the opinion that the significance of fly ash is only due to it
being a source of 'reactive silica' or 'soluble silica' which represents both the acid
soluble silica and alkaline soluble silica. Some researchers [Cabrera and others (1986)
h d Richartz (1984)l are of the opinion that silica and alumina that are soluble in an
alkaline environment take part in the pozzolanic reaction, whereas, some other
[Joshi and A \ a , u ~ l n---..- (1973) ; !j'c3il:aa.s (!'>86!], have f m n d c~rrziatiorl
between pozzolanic activity and the total amount of soluble silica and alumina. The
soluble silica takes part in the chemical reaction with calcium hydroxide in lime - fly
ash I cement - fly ash systems and produces calcium - silicate - hydrate (C-S-H).
Thus, the percentage of soluble silica contained in fly ash can be a characteristic
criteria for the potential reactivity of fly ash. The above silica is more particularly
present in amorphous and mostly in the vitreous part of the ash. RILEM, FAB - 1
recommendations of test methods [as given in TC-67-FAB, RILEM report and
reported by Wesche (1991)], for determining the properties of fly ash includes the
determination of soluble silica which contains both acid and alkaline soluble silica,
which in turn, can be correlated to the glass content [Ranganath (1995)l. Sharma
(1990) has used a similar method for determining the soluble silica content as one of
the measures of the reactivity of fly ash.
3.7.2 Selection of the Method
Surna and Joshi (1 998) have suggested spectro-photometric methods to determine the
alkali-soluble silica. Subsequently, they have suggested conductometic technique for
estimating the reactivity of pozzolanic materials. [Surna and Joshi (1990)l. Further,
they have carried out experiments to demonstrate the applicability of the above
conductometric technique [Surna and Joshi, (1995)l. The above technique is very
simple, reliable and yield quick results. In the present study, soluble - silica content
was determined using the conductometric technique, as proposed by Surna and Joshi
(1990 and 1995).
3.7.3 Procedure to Determine the Soluble Silica Content
Following is a brief description of the procedure to determine the soluble silica
content:
a) Prepare 0.7% Hydrofluoric acid (HFI) (i.e. add 3.5 ml of HFl to 500 ml of distilled
water).
b) Collect five samples of amorphous silica gel, each weighing 25 mg.
c) Collect 200 mg of fly ash sarnple passlng through 45 micron sleve.
d i ( ajjbrste the ~or;duttrv~ty li;ctcr w!ij; r-espcct t3 317t!l!t3~! 3:;atrr.
e) Take 100 ml of the dlluted HFI solutlon ( prepared as above), in a glass beaker and
dip the electrode into the solution and read the conductivity.
f) Remove the electrode from the solution and add 25 mg of amorphous silica gel and
stir the solution for 30 minutes and then read the conductivity.
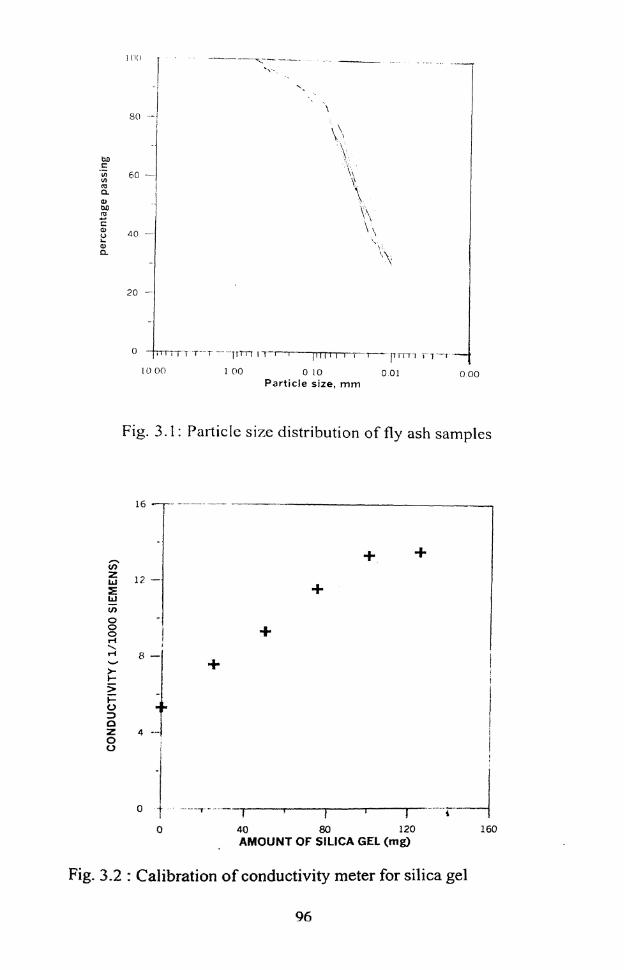
g) Repeat the above step (0 five times, each time, adding 25 mg of silica gel to the
same solution. Plot the percentage weight of amorphous sllica gel (on X- axis) and
the corresponding values of conductivity (along the Y- axis) and fit a straight line,
to represent the calibration chart.
h) Take 100ml of diluted HFI solution in a glass beaker and add 200 mg of fly ash and
stir the solution for 30 minutes. Read the conductivity of the solution.
i) Knowing the conductivity value of the fly ash sample under consideration, the
percentage of reactive silica present can be read from the above calibrated chart.
3.7.4 Soluble Silica Content of the Fly ash Sample
Using the procedure detailed above ( i.e. Sec. 3.7.3), soluble silica of fly ash used in
the study was determined and the results obtained are presented in this section. The
conductivity meter was calibrated first using silica gel. The results of the above
calibration are presented in Table 3.12 and in Fig. 3.2. The above calibration chart is
then used to determine the conductivity values for each of the fifteen samples of fly
ash. The average of the above fifteen samples is 8.74 x 10" Siemens. Corresponding
to the average conductivity of fly ash, it is estimated that 32 mg of silica is present in
the fly ash solution, contaming 200 mg of fly ash and hence, the percentage of
amorphous silica present in fly ash sample is 16 %.
3.7.5 Comparison of Soluble Silica Content Values
Sharma (1990) has reported that the soluble silica of most of the Indian fly ashes are
in the range of 27 - 34 %, but the total range of the results varied from 8.5 to 38.02
for the fly ashes studied by him. Of the various parameters investigated by Sharma
(1990), either independently or in combination to correlate lime reactivity, the
combined effect of only fincness and soluble silica contcnt have yielded satisfactory
preclictio~l of ! i n x rcact1liity values. kvcn though, the tlneness of the tly ash samples
is within the range of values reported by him, the empirical relationship proposed by
him couldn't reliably predict the lime-reactivity of the fly ash sample used in this
study.
3.8 X - RAY DIFFRACTION STUDIES ON FLY ASH
3.8.1 General
Mineralogy of fly ash is important in understanding its utilization. Ash reactivity
during hydration results in interaction between the crystalline and glassy phases that
make up the ash and the matrix into which it is placed. Quartz (SiOz), mullite (2 Si02
A1203), magnetite (Fez03 ), hematite (Fe304) form the major portion of the crystalline
matter [Wesche (1991) and Shanna (1991)l and other minerals like pyrite, calcite,
anhydrate and periclase, ranges from traces to 2.5%. [Wesche (1991)l.
3.8.2 XRD Studies
Shimadzu X-Ray diffraction unit (Potential 3 KV, 20mA, Theta =10 mm, Scale=2000
cps and =1.5405 degrees) available at Materials Science and Research Center
(MSRC), Indian Institute of Technology (I.I.T), Chennai, India, was used for the XRD
studies. The powdered sample of fly ash passing through 45 micron sieve was pressed
into the aluminium holder and subjected to Cu-K radiation between 10 -70" (2 ).
The diffraction angIes were chosen based on the work carried out by earlier
investigators on fly ash. A scanning speed of 1" / min was maintained throughout and
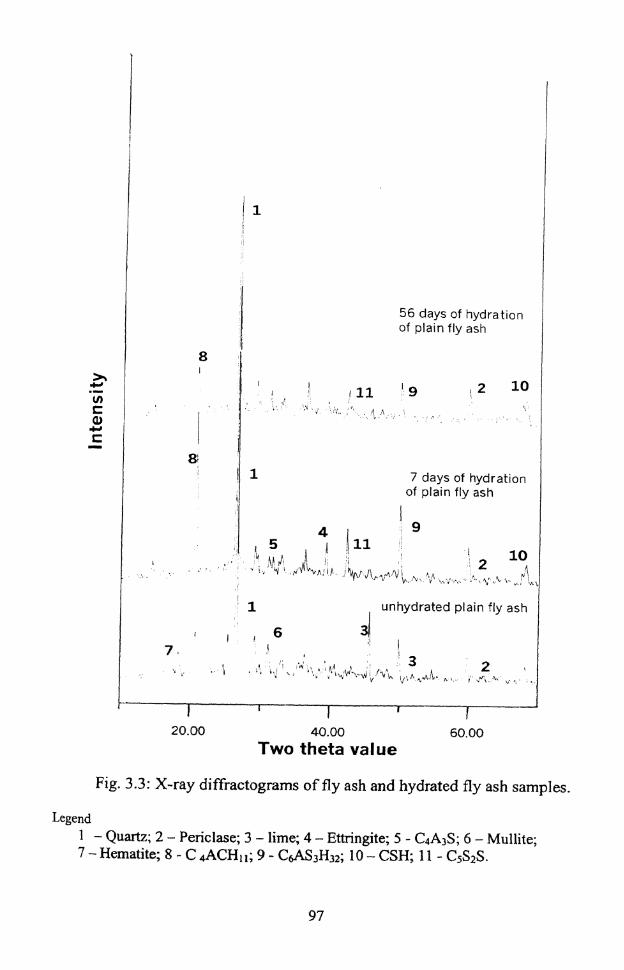
the resulting X - ray diffractogram of fly ash sample obtained is shown in Fig. 3.3. It
is observed that quartz, mullite, crystalline CaO, hematite (Fe304), and periclase
(MgO) are the minerals that could be identified.
Based on the peaks observed in the diffractogram, it is expected that the fly ash under
consideration may contain major quantities of amorphous /glassy constituents, and
hence, a higher reactivity with significant proportion of calcium, aluminium and iron
in the glassy phase [Minnick (1959 and 196 1); Davis (1 937); Watt and Thorne (1 965);
lhorne and Watt (1 966); Simmons and Jeffrey (1960)l.
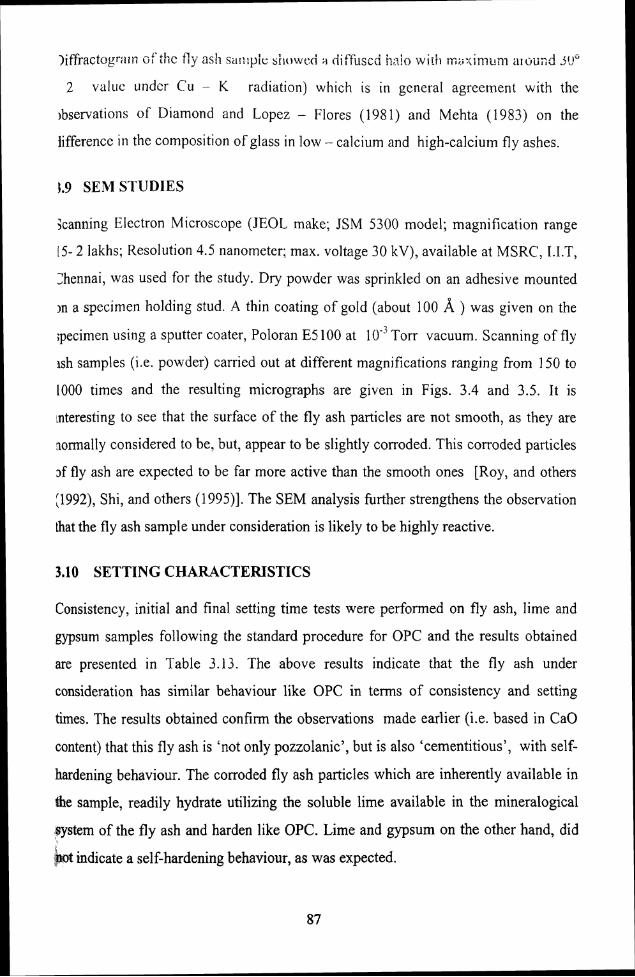
)iffractogt?itfi of the: fly ash sil8t:pit; si\owt:d a diffused hnio tvitit mii:<imbm aloi;;;d 2 ~ "
2 value under CLI - K radiation) which is in general agreement with the
~bservations of Diamond and Lopez - Flores (1981) and Mehta (1983) on the
Jifference in the composition of glass in low - calcium and high-calcium fly ashes.
J.9 SEM STUDIES
scanning Electron Microscope (JEOL make; JSM 5300 model; magnification range
!5- 2 lakhs; Resolution 4.5 nanometer; max. voltage 30 kV), available at MSRC, I.I.T,
Zhennai, was used for the study. Dry powder was sprinkled on an adhesive mounted
In a specimen holding stud. A thin coating of gold (about 100 A ) was given on the
specimen using a sputter coater, Poloran E5 100 at 10.' Torr vacuum. Scanning of fly
ish samples (i.e. powder) carried out at different magnifications ranging from 150 to
1000 times and the resulting micrographs are given in Figs. 3.4 and 3.5. It is
nteresting to see that the surface of the fly ash particles are not smooth, as they are
normally considered to be, but, appear to be slightly corroded. This corroded particles
3f fly ash are expected to be far more active than the smooth ones [Roy, and others
[1992), Shi, and others (1995)l. The SEM analysis further strengthens the observation
that the fly ash sample under consideration is likely to be highly reactive.
3.10 SETTING CHARACTERISTICS
Consistency, initial and final setting time tests were performed on fly ash, lime and
gypsum samples following the standard procedure for OPC and the results obtained
are presented in Table 3.13. The above results indicate that the fly ash under
consideration has similar behaviour like OPC in terms of consistency and setting
times. The results obtained confirm the observations made earlier (i.e. based in CaO
content) that this fly ash is 'not only pozzolanic', but is aIso 'cementitious', with self-
hardening behaviour. The corroded fly ash particles which are inherently available in
&e sample, readily hydrate utilizing the soluble lime available in the mineralogical
Pystem of the fly ash and harden like OPC. Lime and gypsum on the other hand, did
kid indicate a self-hardening behaviour, as was expected.
he results of the pllysical characteristics of fly ash samples, such as, specific gravity,
gadation, fineness and lime reactivity did not show any variation with time. In terms
of gradation, thc fly ash salnple has substantial quantities of fine material (i.e. particles
below 75 microns and particles below 45 microns). The fineness of the fly ash sample
is within the rcportcd values of fineness for Indian fly ashes. The results of the
analysis have shown that the fly ash composed mainly of silica, alumina,
iron oxides and CaO. The presence of CaO exceeding 10% makes this fly ash unique
in behavior and that it can be categorized as Class 'C' fly ash. Hence, the fly ash is
expected to possess both cementitious and pozzolanic properties. The presence of
soluble silica, gradation and fineness have all contributed to the lime-reactivity of the
fly ash and that the lime-reactivity value obtained almost equals the highest value
reported for Indian fly ashes, by various investigators. The mineralogical studies have
indicated that the fly ash sample contains quartz, mullite, as the major constituents,
along with hematite and ferrite. Morphology of this ash is very interesting with
partially corroded particles. The setting behaviour of the fly ash confinns that it has
self-hardening property. Gypsum is not cementitious by itself and that the chemical
analysis indicates that it can be classified as a di-hydrate with minor acidic impurities.
These acidic impurities may retard the hydration process when used in excess
quantities. Based on the properties evaluated, lime used, is classified as Class 'C' lime
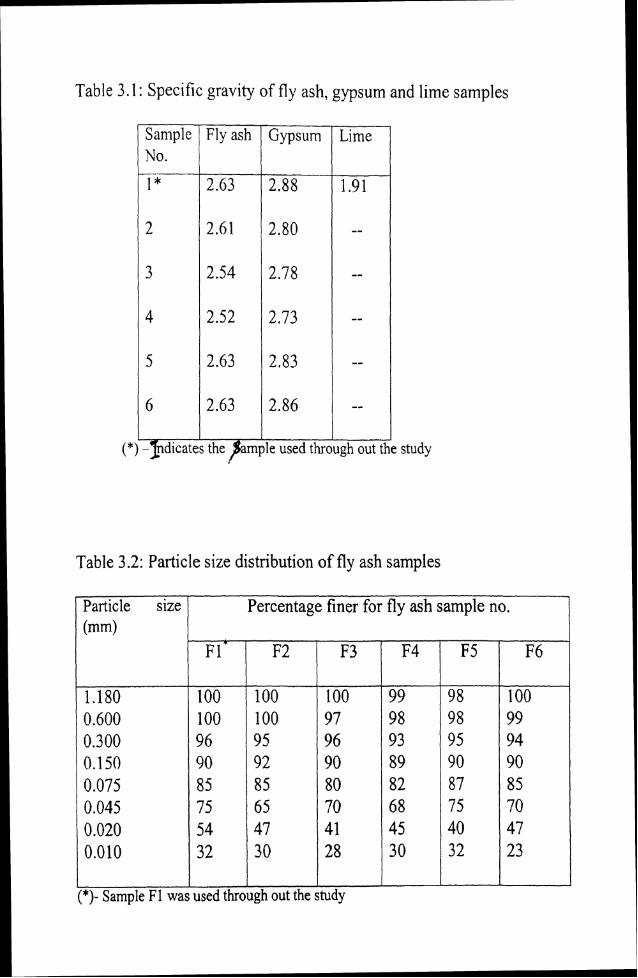
Table 3.1 : Specific gravity of fly ash, gypsum and lime samples
/ Sample 1 Fly ash / Gypsum I Lime 1
study
Table 3.2: Particle size distribution of fly ash samples
Particle size (mm)
1.180 0.600 0.300 0.151) 0.075 0.045 0.020 0.010
(*)- Sample F1 was used through out the study
Percentage finer for fly ash sample no.
F l*
100 100 96 90 85 75 54 3 2
F 5
98 98 9 5 9 0 8 7 7 5 40 3 2
F6
100 99 94 90 8 5 70 47 23
F2
100 100 95 92 85 65 47 30
F3
100 97 96 90 80 70 4 1 2 8
F4
99 9 8 93 89 82 6 8 45 30
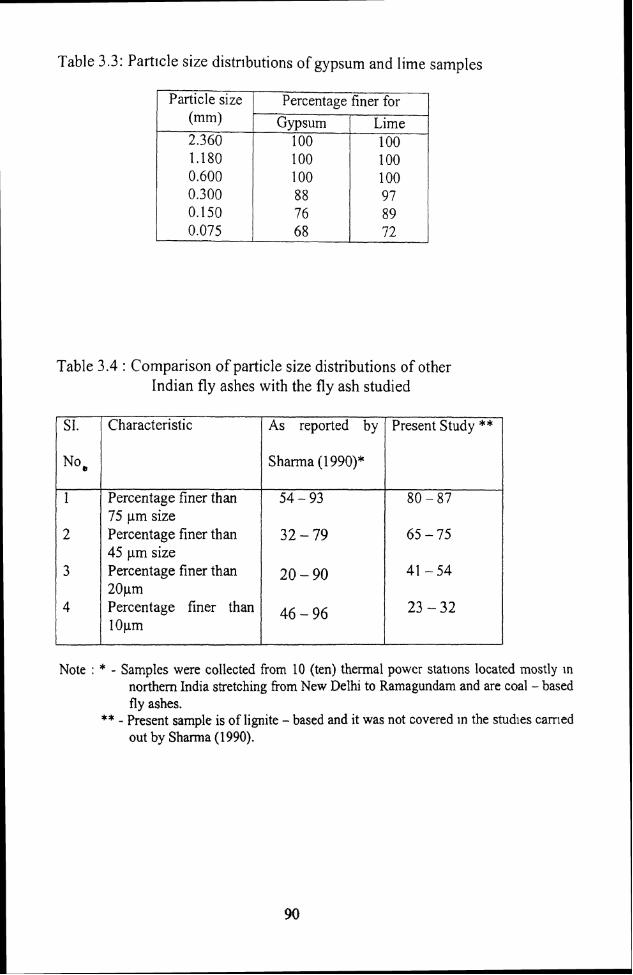
Table 3.3: Part~cle size distr~butions of gypsum and lime samples
Table 3.4 : Comparison of particle size distributions of other Indian fly ashes with the fly ash studied
Particle size (mm) 2.360 1.180 0.600 0.300 0.150 0.075
Percentage finer for
SI.
Gypsum 100 100 100 88 76 68
NO@ I
finer than 46 - 96
Lime 100 100 100 97 8 9 72
Characteristic
Sharma (1 990)*
Note : * - Samples were collected from 10 (ten) thermal power statlons located mostly In northern India stretching from New Delhi to Ramagundam and are coal - based fly ashes.
** - Present sample is of lignite -based and it was not covered in the stud~es canled out by Sharma (1990).
80 - 87
65 - 75
41 - 54
1
2
3
As reported by Present Study **
Percentage finer than 75 pm size Percentage finer than 45 pm size Percentage finer than 20pm
54 - 93
32 - 79
20 - 90
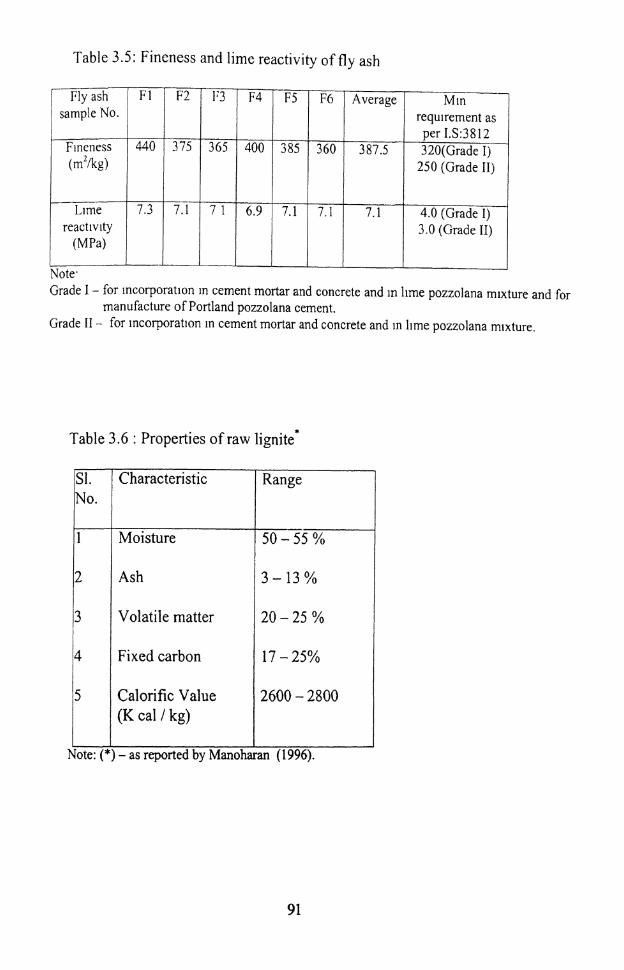
Table 3.5: Fineness and lime reactivity of fly ash
Grade I - for incorporation in cement mortar and concrete and In llme pozzolana mixture and for manufacture of Portland pozzolana cement.
Grade I1 - for ~ncorporatlon In cement mortar and concrete and in lime pozzolana mlxture.
I Fly ash
I No' Fineness (m21kg)
L ~ m e react~v~ty
(MPa)
Table 3.6 : Properties of raw lignite*
SI. / Characteristic 1 Range
Note.
F1
440
7#3
Moisture
1 - j r57
3 / Volatile matter / 20 - 25 % !
F2
375
1'3
365
I
I Fixed carbon I
I I I J
Note: (*) - as reported by Manoharan (1996).
7.1 ) 7 1
17 - 25%
5
F4
400
6.9
I
Calorific Value (K cal / kg)
F5
385
2600 - 2800
7.1
F6
360
7 - 1
Average
387.5
Mln requirement as
per I.S:3812 320(GradeI) '
250 (Grade 11)
7.1 4.0 (Grade I) 3.0 (Grade 11)
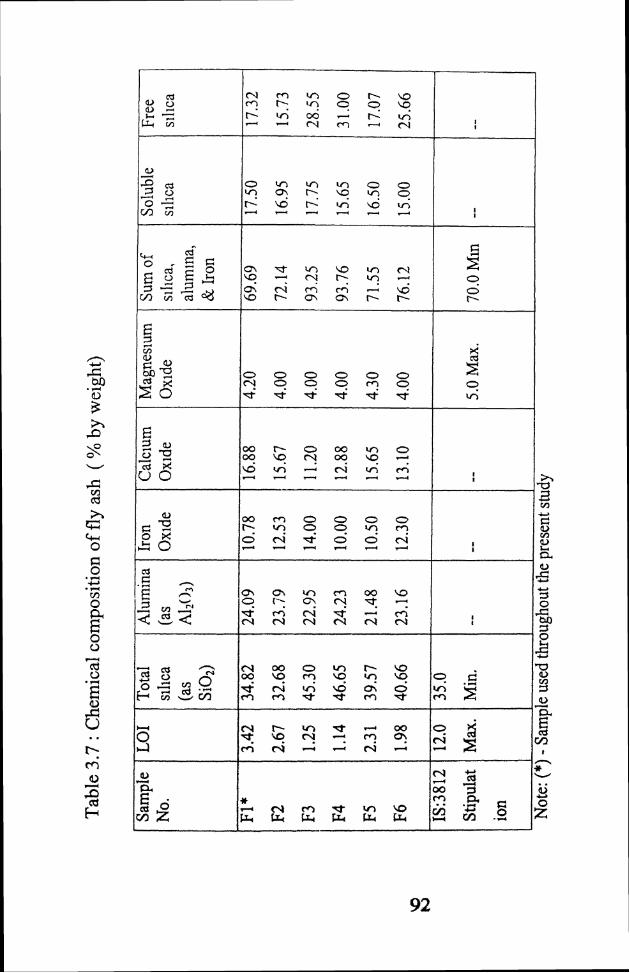
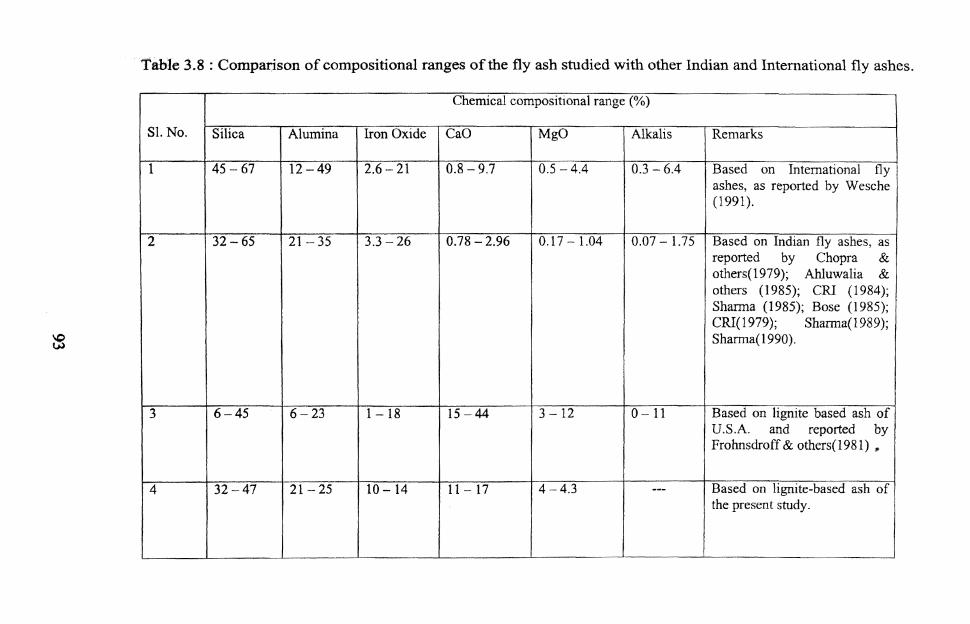
Table 3.8 : Comparison of compositional ranges of the fly ash studied with other Indian and International fly ashes.
Chemical compositional range (%)
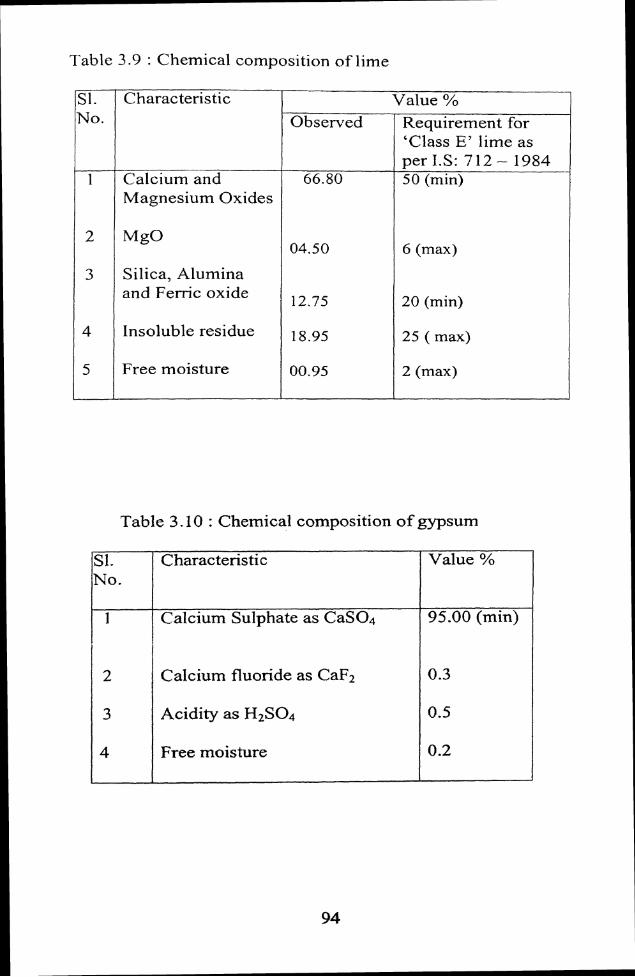
Table 3.9 : Chemical composition of lime
Characteristic
Calcium and Magnesium Oxides
Silica, Alumina and Ferric oxide
Free moisture I 00.95
Value %
12.75
Insoluble residue
6 (max)
Observed
66.80
18.95
1 20 (min)
Requirement for 'Class E' lime as per 1.S: 712 - 1984 50 (min)
25 ( max)
2 (max)
Table 3.10 : Chemical composition of gypsum
Value %
95.00 (min)
S1. No.
I
I 2
Characteristic
Calcium Sulphate as CaS04
Calcium fluoride as CaF2 0.3
0.5
0.2
3
4
Acidity as H2SO4
Free moisture
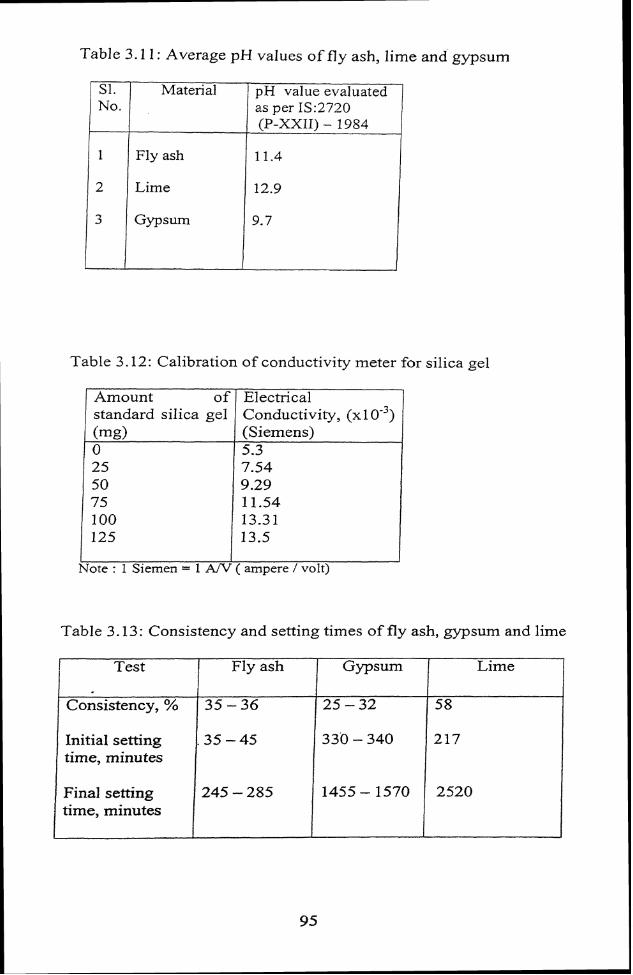
Table 3.1 1 : Average pH values of fl y ash, lime and gypsum
2 ~ i m e 1 12.9 I
Table 3.12: Calibration of conductivity meter for silica gel
L I
Note : 1 Siemen = 1 AN ( ampere / volt)
Table 3.13: Consistency and setting times of fly ash, gypsum and lime
Test
Consistency, %
Initial setting time, minutes
Final setting time, minutes
Fly ash
35 - 36
. 3 5 - 45
245 - 285
Gypsum
25 - 32
330 - 340
1455 - 1570
Lime
58
217
2520
I o on I oo o 1 0 o 01 0 00 Particle size, mm
Fig. 3.1 : Pal-ticle size distribution of fly ash samples
40 8Q 120 160 AMOUNT OF SILICA GEL (mg)
Fig. 3.2 : Calibration of conductivity meter for silica gel
1 unhydrated plain fly ash
I , 1 6 7 I a / /
' 3 8 , , x , . , , 4 , b ~ s ' . , . . I . . . , . ' , ' . . , , ,.,,iq -3.. ,d 8, I%&;, 2
!,!',,t".dIb. A , . , .d, b.,, % ,
56 days of hydrat~on of plaln fly ash
20.00 40.00 60.00
Two theta value
8 1
Fig. 3.3: X-ray diffractograms of fly ash and hydrated fly ash samples.
I 1
Ill '9 2 10 \
Legend I - Quartz; 2 - Periclase; 3 - lime; 4 - Ettringite; 5 - C4A3S; 6 - Mullite; 7 - Hematite; 8 - C 4ACHI 1; 9 - C&AS3H32; 10 - CSH; 11 - C S S ~ S .
t I " ,.
8 I
1
11 7 days of hydrat~on of plain fly ash
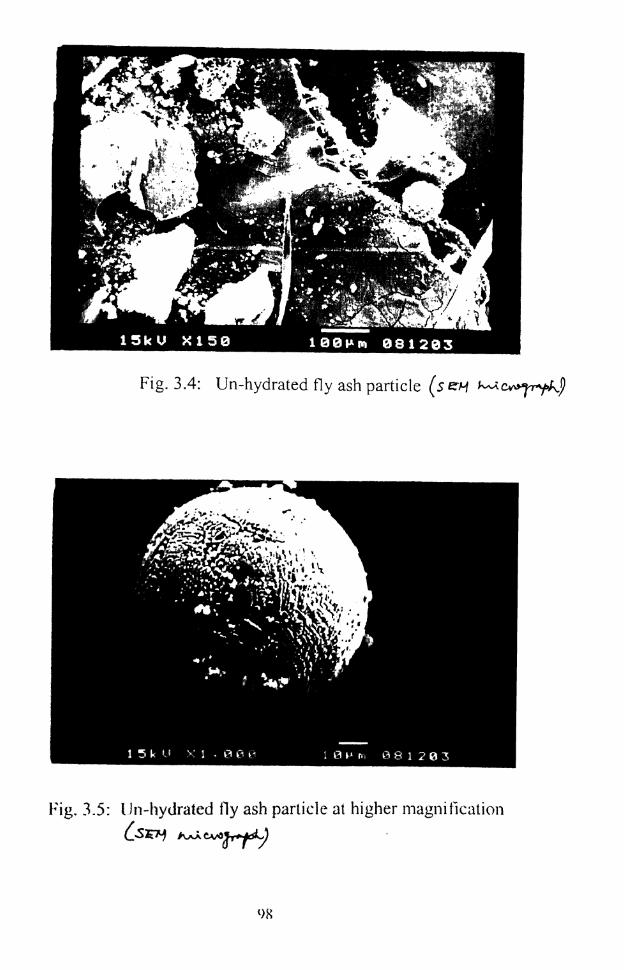
Fig. 3.4: Un-hydrated fly ash particle (s r r ~ ~ c + + p + i )
Fig. 3.5: [In-hydrated fly ash particle at highel- magniiication Ism4 hjwW)