Manufacturer Brand Style Length (mm's) Circ (mm's) Flavor ...
ORIGINAL ARTICLE
Characterization of Encapsulated Flavor Systems by NIRand Low-field TD-NMR: A Chemometric Approach
Leticia Andrade & Imad A. Farhat & Kasia Aeberhardt &Valery Normand & Søren B. Engelsen
Received: 22 June 2007 /Accepted: 12 October 2007 /Published online: 9 November 2007# Springer Science + Business Media, LLC 2007
Abstract A quantitative method for measuring simulta-neously the flavor and water contents in model spray-driedflavor delivery systems was developed using spectroscopictechniques and chemometrics. Nine encapsulated systemswere prepared, consisting of a solid carrier (maltodextrin andgum arabic) and varying the amounts of water and flavor.The model flavors used in this work were a hydrophobic(limonene) and a more hydrophilic (2,5-dimethylpyrazine)single components. Near-infrared (NIR) and low-field time-domain nuclear magnetic resonance (low field TD-NMR)data were acquired on each system and analyzed usingmultivariate chemometric techniques to develop optimalprediction models. Partial least squares regression modelsshowed good predictive ability, with coefficients of deter-mination (R2) between 0.81 and 1.00 and low root meansquare error of cross-validation values compared to the rangeof concentrations. The predictive ability of the chemometricmodels computed using the NIR spectra improved signifi-cantly when data were pre-processed using multiplicativesignal correction. The development of good predictionmodels
(i.e., robust models resulting in accurate predictions forwater and flavor content) from the NMR relaxation dataspectra was successful only for the hydrophobic limonenesystems, yielding prediction models whose performance wasbetter than the models obtained using the NIR data. Overall,NIR spectroscopy and NMR relaxometry were identified ascomplementary techniques rather than competitive methodsin the characterization of encapsulated flavor systems.
Keywords Flavor delivery systems . NIR .
Low-field TD-NMR . Chemometrics . PCA . PLS
Introduction
Flavor encapsulation is increasingly gaining importance asit offers several advantages, the principal one being thephysical and chemical protection of the flavor duringstorage and handling (and during critical stages of the foodmanufacturing process in the case of some encapsulationtechnologies). Indeed, the loss of some components of aflavor, for example, because of the evaporation of the mostvolatile species or the oxidation of the most susceptibleones, leads to major deterioration of flavor quality andauthenticity. Encapsulation also allows a controlled releaseof the flavor to modulate its perception.1 Other advantagesinclude the ease of handling and dosing when using a solidpowder vs a liquid, the ability to combine liquids and solids(e.g., acids, taste enhancers, sweeteners, etc.), and creationof visual effects depending on the encapsulation technologyused.
Flavor encapsulation, which typically consists ofentrapping flavor inside a solid carrier or capsule, can beachieved by using different approaches. Whereas spray dryingremains the most widely used technology, many approaches
Food Biophysics (2008) 3:33–47DOI 10.1007/s11483-007-9046-3
L. AndradeSchool of Biosciences, Division of Food Sciences,The University of Nottingham,Sutton Bonington Campus,Loughborough LE12 5RD, UK
I. A. Farhat :K. Aeberhardt :V. NormandFirmenich SA,Route de la Bergère 7,1217 Meyrin, Switzerland
L. Andrade (*) : S. B. EngelsenFaculty of Life Sciences, Department of Food Science,Quality, and Technology, The University of Copenhagen,Rolighedsvej 30,1958 Frederiksberg C, Denmarke-mail: [email protected]
exist and are used commercially (for example, extrusion,granulation, coacervation, cell encapsulation, etc.).2,3
The main components of solid flavor delivery systems,such as those produced by spray drying, are a carrier (typi-cally a carbohydrate in the glassy state), a flavor (usuallya liquid), and a residual amount of water. The knowledgeof the exact composition is paramount in optimizing theencapsulation process and understanding the role of thecarrier and surface active ingredients (e.g., emulsifiers) aswell as in estimating dosage in the final application, moni-toring change in storage, etc. Currently, the analysis offlavor content is mostly based on distillation or solventextraction, whereas Karl–Fisher is the most reliable methodfor the determination of the residual amount of water.4
These approaches are very time-consuming (hours) andinvolve the use of a range of solvents and therefore requirebulky air extraction installations and the handling of chemi-cal wastes. To overcome some of these drawbacks, a newtechnique to characterize flavor volatiles has been devel-oped, the so-called solid phase microextraction (SPME),which provides a quick and solventless technique for theisolation of analytes in a sample matrix.5 Many works havebeen reported in which flavors are analyzed by SPMEcoupled with gas chromatography-mass spectrometry (GC-MS).6–10 However, when compared to spectroscopic tech-niques (which are the focus of this work), this approachpresents some drawbacks. For example, (1) SPME is basedon the adsorption of analytes onto a coated fused silicafiber. The selection of the appropriate fiber is crucial, as thesuccess of the method depends on the different affinities ofthe compounds for the fiber; (2) SPME is more recommendedfor highly volatile analytes, as the low volatility of largermolecules may decrease the mass transfer from the sample tothe headspace giving rise to long extraction times.5
The non-invasive quantitative analysis of such composi-tion should be feasible using spectroscopic techniques suchas near-infrared (NIR) and low-field time-domain nuclearmagnetic resonance (TD-NMR).
NIR is widely used in determining a variety of qualityparameters in food11 and pharma.12 It is used both in thelaboratory and as an on-line analysis technique applieddirectly in the process stream.13 NIR spectroscopy measuresover- and combination tones of molecular vibrations, whichcan be transmitted through quartz-based optical fibers,enabling simple and flexible sampling at the process line.14
The greatest advantages of NIR over other spectroscopictechniques are that it requires little or no sample preparationand that it yields real-time data. Unlike most conventionalanalytical methods, NIR spectroscopy is rapid, non-destructive, and does not use chemicals or generate chemicalwastes requiring disposal. NIR analysis may simultaneouslydetermine numerous constituents or parameters. With NIRanalysis, the useful features in a spectrum consist of over-
tones and combination tones, which are much more subtlethan the distinct fundamental absorption bands found inmid-IR spectra. However, recent developments in off-the-shelf chemometrics software and powerful computershave made NIR analysis the practical choice for manyapplications, mainly because the absorbances in the NIRregion are lower than in neighboring regions and generallyobey Beer’s Law. This is because NIR absorptions aregenerally 10–100 times weaker in intensity than thefundamental mid-IR absorption bands. The weakness ofthe absorptions is a benefit, providing direct analysis ofsamples without dilution.
The main disadvantage of NIR lies in the fact that it isnot a stand-alone technology. Separate calibrations arerequired for each constituent or parameter and a portionof well-characterized samples must periodically be ana-lyzed by the reference method to ensure reliability of thecalibration. It may be necessary to update calibrations sev-eral times during the initial phases of use to incorporatenew samples, until the calibration is acceptable. Despite theintuitive disadvantage of broad and overlapping absorptionbands, sophisticated chemometric techniques can extractmeaningful information from the complex NIR spectra. Theinformation about samples in the NIR spectra could noteasily be assessed until the advent of sufficiently powerfulcomputers that allowed the development of complexmathematical relationships between the multivariate andco-linear spectral data and constituents or parameters (e.g.,functional properties) determined by conventional techniques.
NMR relaxometry has been proposed as an alternative toNIR for measurements of water and lipid contents.15,16 Thecomposition of several food products can be determinedbased on the differences of the post-pulse magnetizationdecay of each component. NMR does not suffer from someof the shortcomings associated with NIR, for instance, highabsorption of water in the NIR region and optical scatteringeffects. Another advantage of NMR over NIR is that thelatter technique only provides information about the surfacelayer of the sample, whereas NMR is able to measure thevolume of the sample. This is important in the characteri-zation of inhomogeneous systems such as flavor deliverysystems. The two main drawbacks of NMR compared toNIR are (1) NMR instruments have not, until recently, beenportable because of the size and weight of the magnets and(2) the need to sub-sample because of the limited size ofsample that can be practically analyzed while a signal ofsufficient intensity and decay characteristic is recorded.17,18
The aim of this work was to develop a rapid method forthe simultaneous analysis of flavor content and residualwater in typical solid flavor delivery systems (prepared byspray drying). To this end, two spectroscopic techniques,NIR and NMR, were compared, and advanced chemometricmodels to quantify flavor and water content were devel-
34 Food Biophysics (2008) 3:33–47
oped. The model flavor compounds, limonene and 2,5-dimethylpyrazine, were selected to address the additionalchallenge of flavor hydrophilicity and affinity with theencapsulating carrier.
Materials and methods
Materials
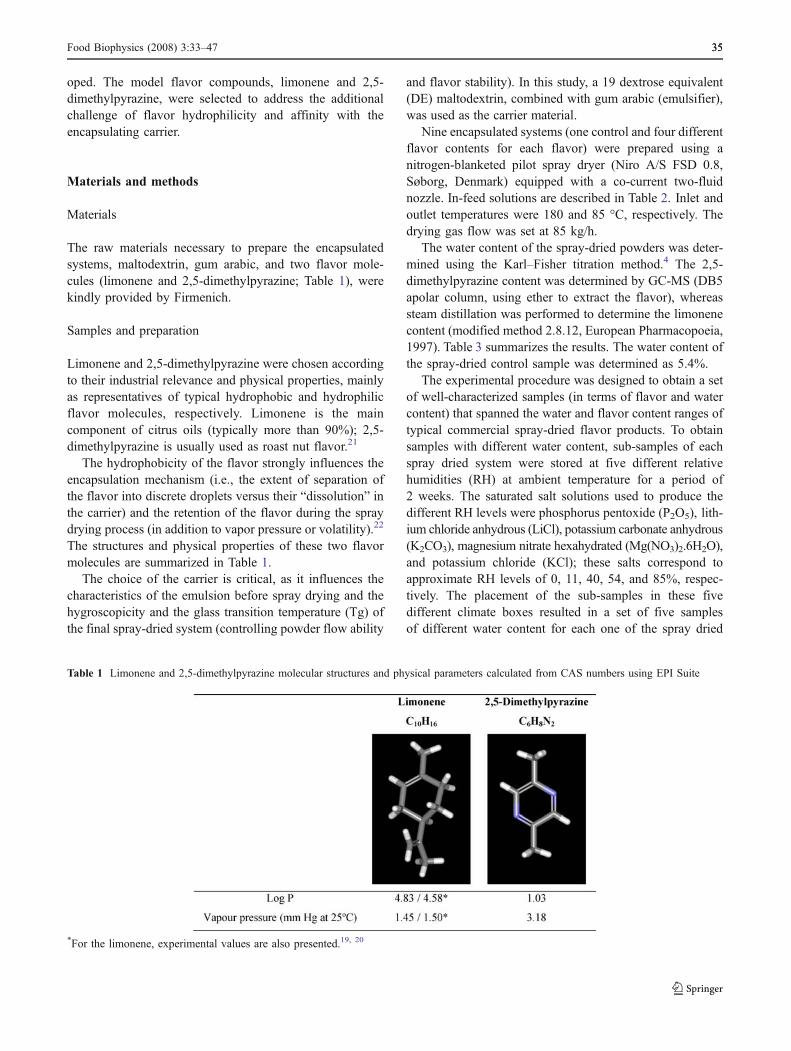
The raw materials necessary to prepare the encapsulatedsystems, maltodextrin, gum arabic, and two flavor mole-cules (limonene and 2,5-dimethylpyrazine; Table 1), werekindly provided by Firmenich.
Samples and preparation
Limonene and 2,5-dimethylpyrazine were chosen accordingto their industrial relevance and physical properties, mainlyas representatives of typical hydrophobic and hydrophilicflavor molecules, respectively. Limonene is the maincomponent of citrus oils (typically more than 90%); 2,5-dimethylpyrazine is usually used as roast nut flavor.21
The hydrophobicity of the flavor strongly influences theencapsulation mechanism (i.e., the extent of separation ofthe flavor into discrete droplets versus their “dissolution” inthe carrier) and the retention of the flavor during the spraydrying process (in addition to vapor pressure or volatility).22
The structures and physical properties of these two flavormolecules are summarized in Table 1.
The choice of the carrier is critical, as it influences thecharacteristics of the emulsion before spray drying and thehygroscopicity and the glass transition temperature (Tg) ofthe final spray-dried system (controlling powder flow ability
and flavor stability). In this study, a 19 dextrose equivalent(DE) maltodextrin, combined with gum arabic (emulsifier),was used as the carrier material.
Nine encapsulated systems (one control and four differentflavor contents for each flavor) were prepared using anitrogen-blanketed pilot spray dryer (Niro A/S FSD 0.8,Søborg, Denmark) equipped with a co-current two-fluidnozzle. In-feed solutions are described in Table 2. Inlet andoutlet temperatures were 180 and 85 °C, respectively. Thedrying gas flow was set at 85 kg/h.
The water content of the spray-dried powders was deter-mined using the Karl–Fisher titration method.4 The 2,5-dimethylpyrazine content was determined by GC-MS (DB5apolar column, using ether to extract the flavor), whereassteam distillation was performed to determine the limonenecontent (modified method 2.8.12, European Pharmacopoeia,1997). Table 3 summarizes the results. The water content ofthe spray-dried control sample was determined as 5.4%.
The experimental procedure was designed to obtain a setof well-characterized samples (in terms of flavor and watercontent) that spanned the water and flavor content ranges oftypical commercial spray-dried flavor products. To obtainsamples with different water content, sub-samples of eachspray dried system were stored at five different relativehumidities (RH) at ambient temperature for a period of2 weeks. The saturated salt solutions used to produce thedifferent RH levels were phosphorus pentoxide (P2O5), lith-ium chloride anhydrous (LiCl), potassium carbonate anhydrous(K2CO3), magnesium nitrate hexahydrated (Mg(NO3)2.6H2O),and potassium chloride (KCl); these salts correspond toapproximate RH levels of 0, 11, 40, 54, and 85%, respec-tively. The placement of the sub-samples in these fivedifferent climate boxes resulted in a set of five samplesof different water content for each one of the spray dried
Table 1 Limonene and 2,5-dimethylpyrazine molecular structures and physical parameters calculated from CAS numbers using EPI Suite
*For the limonene, experimental values are also presented.19, 20
Food Biophysics (2008) 3:33–47 3535
systems—for the limonene system, the water content rangewas 2.8 to 7.1%, whereas for the 2,5-dimethylpyrazinesystem, the water content range was 0.9 to 10.2%.
The overall sample set was 5 flavor contents (1 control+4 encapsulated systems)×5 (water content levels)=25samples for each flavor.
NIR measurements
Dispersive NIR data were collected using a NIRSystemsspectrophotometer 6500 (NIRSystems, Silver Spring, MD,USA). The range 1,100–2,498 nm, with a sampling frequen-cy of 2 nm, was acquired using a halogen light source anda lead sulfide detector. The angle of the incident light was180°, and reflectance was measured at an angle of 45°. TheNIR reflectance spectra were recorded at room temperature ina rotating sample cell through a quartz window, designed forpowder samples. The NIR spectra were converted to log(1/R)units before data analysis using an internal ceramic ref-erence. All samples and raw materials (maltodextrin, gumarabic, water, and flavors: 2,5-dimethylpyrazine and limo-nene) were analyzed in duplicate measurements.
NMR measurements
The NMR analysis was performed using a 23.2 MHz Maranbenchtop pulsed 1H-NMR spectrometer (Oxford Instruments,
UK) equipped with an 18mm diameter variable temperatureprobe head.
For the samples containing limonene, the free inductiondecays (FIDs) acquired after a single 90° pulse showed, inaddition to the rapid decaying component, a very slow de-caying signal associated with limonene relaxation. To reliablycapture the behavior of these two components, with extreme-ly different relaxation times, a combined FIDCPMG23,24
pulse sequence was used. The advantages of this pulsesequence were discussed elsewhere.18 A total of 128 FIDpoints were acquired along with 1024 spin-echoes in theCPMG, with a 90–180° pulse spacing (τ) value of 3.5 ms tofully record the slowly decaying limonene signal.
The FIDs of the samples containing 2,5-dimethylpyrazineshowed that the mobile component decayed much morerapidly (total relaxation within ~0.8 ms), and thus, for thesesamples, only the FID signals (2,048 points) were acquiredand used.
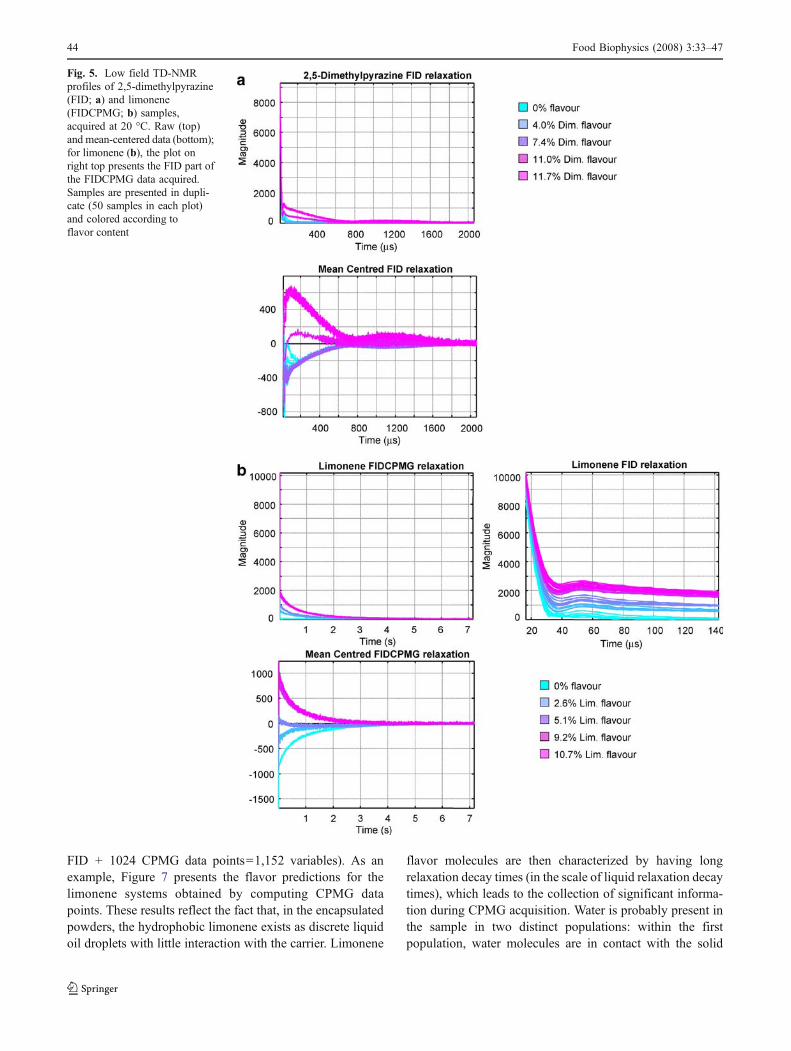
The difference in the FID behavior between the twoflavor molecules reflects the fact that, in the encapsulatedpowders, the hydrophobic limonene exists as discrete liquidoil droplets (typically of the order of 1 μm) with littleinteraction with the carrier, whereas the more polar 2,5-dimethylpyrazine partitions/dissolves in the carrier, andthus its relaxation is coupled with that of the rigid carrier.These two extreme behaviors were intentionally selectedto cover the typical range of flavor hydrophobicity andchallenge the spectroscopic analytical protocols.
The following parameters were kept constant for all theNMR experiments. The relaxation delay between consecu-tive scans was set to 5 s, and 16 scans were accumulated.The receiver gain (RG) was separately optimized for thelimonene and 2,5-dimethylpyrazine systems and kept con-stant for all FIDCPMG and FID measurements, respectively.The FID dwell time was 1 μs.
For each sample (i.e., for a given flavor and water con-tent), duplicate sub-samples (~2.5 g) were analyzed. Theexact mass was recorded and used to normalize theacquired data. In total, 90 samples were analyzed—40 limo-nene samples (FIDCPMG), 40 2,5-dimethylpyrazine sam-ples (FID), and 10 control samples (FIDCPMG and FIDsignals). All NMR measurements were performed at 20 °C.
Chemometrics
To handle the large amount of co-linear data pointsacquired, the traditional univariate linear or multipleregression methods are of limited value. Multivariate dataanalysis techniques, applied in chemistry since the 1970sunder the name of “chemometrics,” include algorithms that,with advantage, can handle large co-linear data structures.In this context, the main advantage of chemometric tools isthat they are able to deal with spectral information, such as
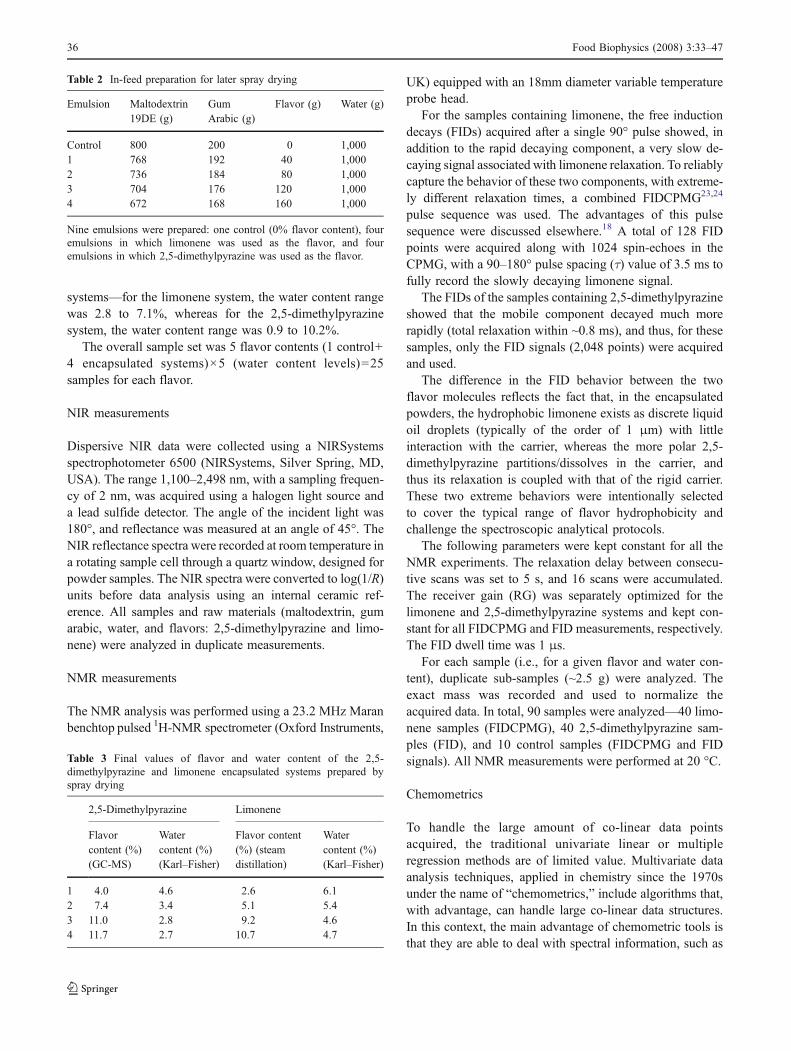
Table 2 In-feed preparation for later spray drying
Emulsion Maltodextrin19DE (g)
GumArabic (g)
Flavor (g) Water (g)
Control 800 200 0 1,0001 768 192 40 1,0002 736 184 80 1,0003 704 176 120 1,0004 672 168 160 1,000
Nine emulsions were prepared: one control (0% flavor content), fouremulsions in which limonene was used as the flavor, and fouremulsions in which 2,5-dimethylpyrazine was used as the flavor.
Table 3 Final values of flavor and water content of the 2,5-dimethylpyrazine and limonene encapsulated systems prepared byspray drying
2,5-Dimethylpyrazine Limonene
Flavorcontent (%)(GC-MS)
Watercontent (%)(Karl–Fisher)
Flavor content(%) (steamdistillation)
Watercontent (%)(Karl–Fisher)
1 4.0 4.6 2.6 6.12 7.4 3.4 5.1 5.43 11.0 2.8 9.2 4.64 11.7 2.7 10.7 4.7
36 Food Biophysics (2008) 3:33–47
NIR and NMR (multivariate co-linear data) by reducingdata into a few functional or latent factors, displayed in agraphical interface. This facilitates the possibility of under-taking an explorative inductive investigation.25 Principalcomponents analysis (PCA)26,27 is particularly adapted fordata compression and information extraction. PCA findscombinations of variables or factors that describe majortrends in the data. Mathematically, PCA relies upon aneigenvector decomposition of the covariance or correlationmatrix of the spectral variables.
Regression models
In this study, partial least squares (PLS)28,29 regression wasused to correlate the NIR and NMR data to chemicalcomposition reference data, generating multivariate linearregression models.
For modeling purposes, data pre-processing, outlier detec-tion, variable selection, and calibration are all interdependentphenomena. Therefore, an iterative procedure, where allaspects were continually revised, was performed and severalmodels were computed. The prediction models were mainlyevaluated and compared on the basis of the validation parame-ters: root mean square error of cross validation (RMSECV),correlation coefficient (R), and the optimal number of PLScomponents as determined by cross-validation.
PLS was applied to both NIR and NMR data sets to com-pute models to predict flavor and water content. For each dataset, an initial global model, including 2,5-dimethylpyrazineand limonene samples data, was performed. Furthermore,local models for each flavor were computed. The bilineardata matrices used for the computation of the global andlocal models, for 2,5-dimethylpyrazine (DMP) and limonene(LIM) samples, computed on the NIR data, are presentedbelow (recall that samples were measured in duplicate):
X samplesDMPþLIM � l� � ! X 90; 700ð Þ ð1:1Þ
X samplesDMP � lð Þ ! X 50; 700ð Þ ð1:2Þ
X samplesLIM � lð Þ ! X 50; 700ð Þ ð1:3Þwith l being the wavelength.
Similar models were computed using the NMR data withthe resulting matrices for the global and local models being:
X samplesDMPþLIM � time� � ! X 90; 128ð Þ ð2:1Þ
with 128 being the number of “common” FID data pointsacquired for both 2,5-dimethylpyrazine (DMP) and limo-nene (LIM) samples.
X samplesDMP � timeð Þ ! X 50; 2048ð Þ ð2:2Þ
X samplesLIM � timeð Þ ! X 50; 1152ð Þ ð2:3Þ
Multiplicative signal correction
Multiplicative signal correction (MSC)30,31 is a techniquefor removing the physical scatter components in spectrathat arise when measuring directly on powder samples. InMSC, the average spectrum of all samples is calculated, andsimple linear univariate regression between this spectrumand all other individual spectra is performed. The individ-ually estimated offset and slope is then subtracted from anddivided by each individual spectrum, thereby yielding acorrected spectrum.14
Validation
In the computation of the global (both flavor systems andcontrol samples) and local (single flavor systems and controlsamples) models, 90 or 50 samples were used, respectively.The validation method adopted was systematic cross-validation in which 45 or 25 segments were computed(duplicates in each segment). PLS models for each chemicalresponse variable were calculated, and the robustness of themodels was further examined by systematic cross-validationusing segments including flavor or water content levels. Allresults reported are based on systematic cross-validationusing 45 or 25 segments.
Models were computed in LatentiX version 1.00 (Latent5,www.latentix.com, Copenhagen, Denmark).
Results and discussion
NIR spectroscopy
Data exploration—PCA models
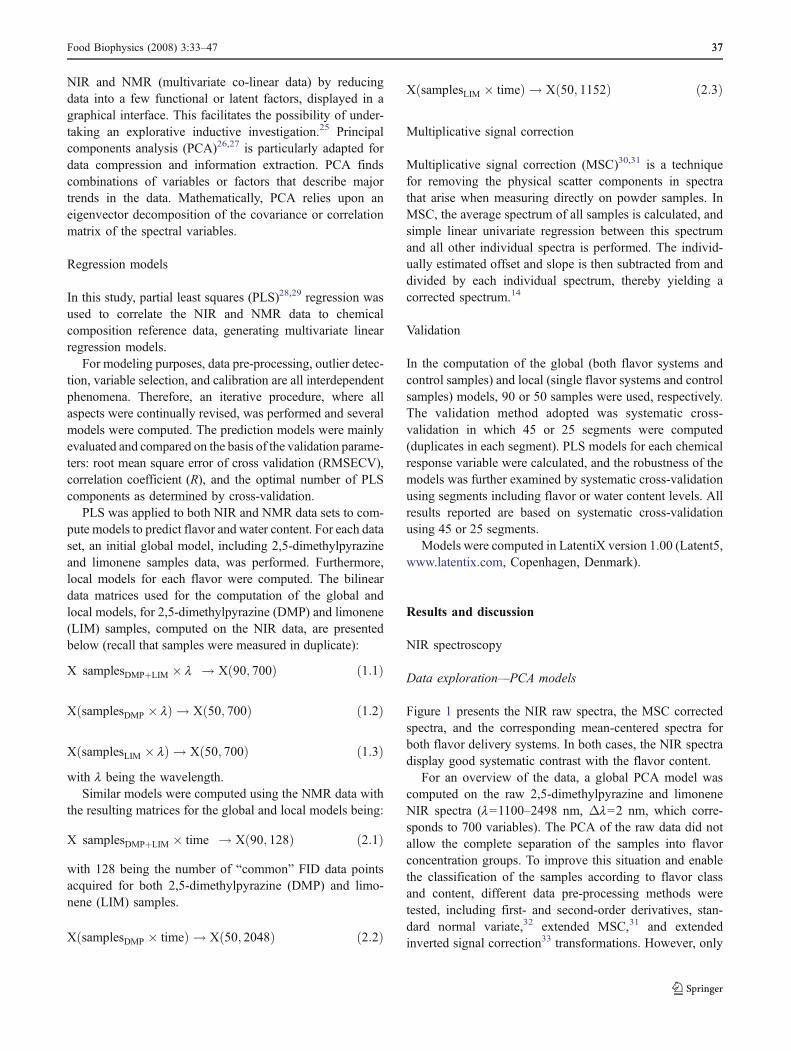
Figure 1 presents the NIR raw spectra, the MSC correctedspectra, and the corresponding mean-centered spectra forboth flavor delivery systems. In both cases, the NIR spectradisplay good systematic contrast with the flavor content.
For an overview of the data, a global PCA model wascomputed on the raw 2,5-dimethylpyrazine and limoneneNIR spectra (l=1100–2498 nm, Δl=2 nm, which corre-sponds to 700 variables). The PCA of the raw data did notallow the complete separation of the samples into flavorconcentration groups. To improve this situation and enablethe classification of the samples according to flavor classand content, different data pre-processing methods weretested, including first- and second-order derivatives, stan-dard normal variate,32 extended MSC,31 and extendedinverted signal correction33 transformations. However, only
Food Biophysics (2008) 3:33–47 3737
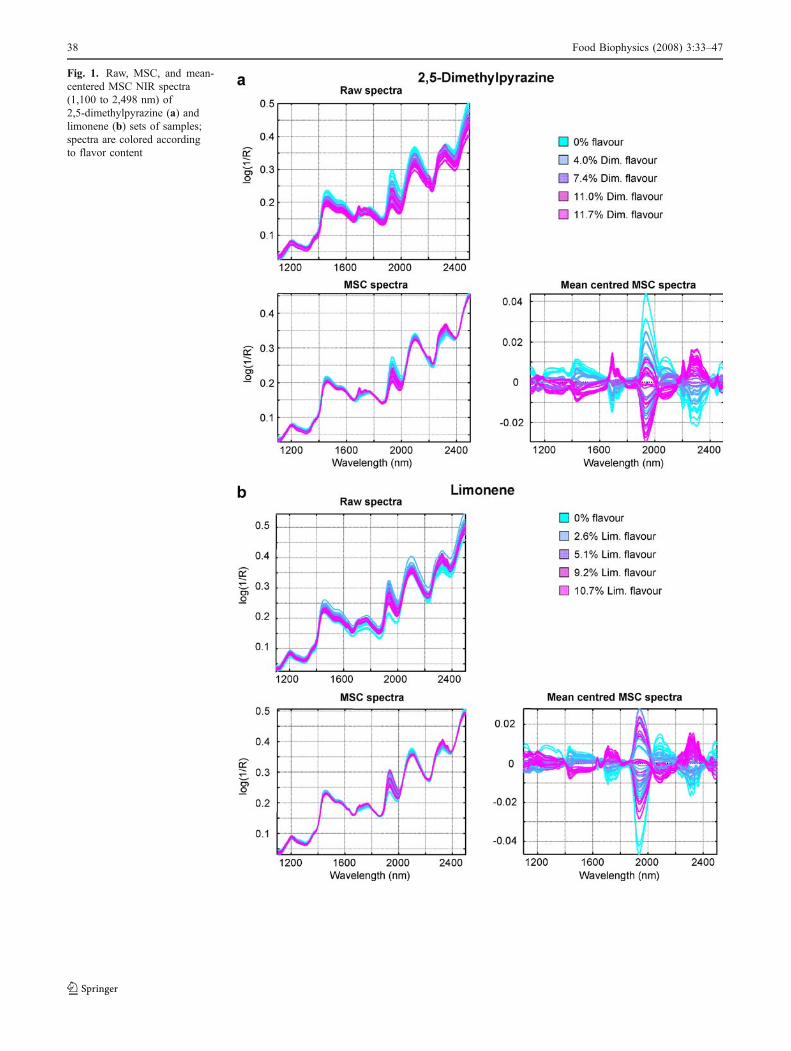
Fig. 1. Raw, MSC, and mean-centered MSC NIR spectra(1,100 to 2,498 nm) of2,5-dimethylpyrazine (a) andlimonene (b) sets of samples;spectra are colored accordingto flavor content
38 Food Biophysics (2008) 3:33–47
when the variations caused by optical/physical properties ofthe samples were removed through the MSC correction,clear separation of the samples was achieved. The PCAscores plot of the MSC-corrected NIR spectra is shown inFigure 2a. The distinct sample separation (according toflavor class) indicates that the spectral technique providesinformation that is highly relevant to the composition of thesamples. Inspection of the loading plot (Figure 2b) revealsthe NIR spectral regions responsible for the observed sam-
ple classification. For example, PC1, which is the primaryresponsible for the flavor classification (refer to Figure 2a,in which 2,5-dimethylpyrazine and limonene samples aremainly separated in the PC1 direction), shows a major peakaround 1,920 nm, which can be associated to a differentwater profile for the two flavor systems. The first threePCs, which explain 98.0% of the data variation, not onlyaccounted for sample separation according to flavor classbut also modeled the flavor and water content variations—
Fig. 2. Global PCA scoresplot (a) and loadings plot(b) based on MSC-transformedNIR spectra recorded on 2,5-dimethylpyrazine and limonenesamples showing the three firstprincipal components (PCs),which explain 98.0% of the datavariation. In the score plot (a),samples are colored according totype (encapsulated flavor)
Food Biophysics (2008) 3:33–47 3939
samples could also be grouped according to flavor andwater content. The second PC is associated to the limoneneflavor (compare the global loadings in Figure 2b with theloadings in Figure 3c, which represents the first two com-
ponents obtained by PCA only on the limonene data set).Moreover, PC3 in Figure 2b shows sharp peaks in thewavelength ranges from 1,600 to 1,800 and 2,100 to2,300 nm that can be associated to the first overtone and
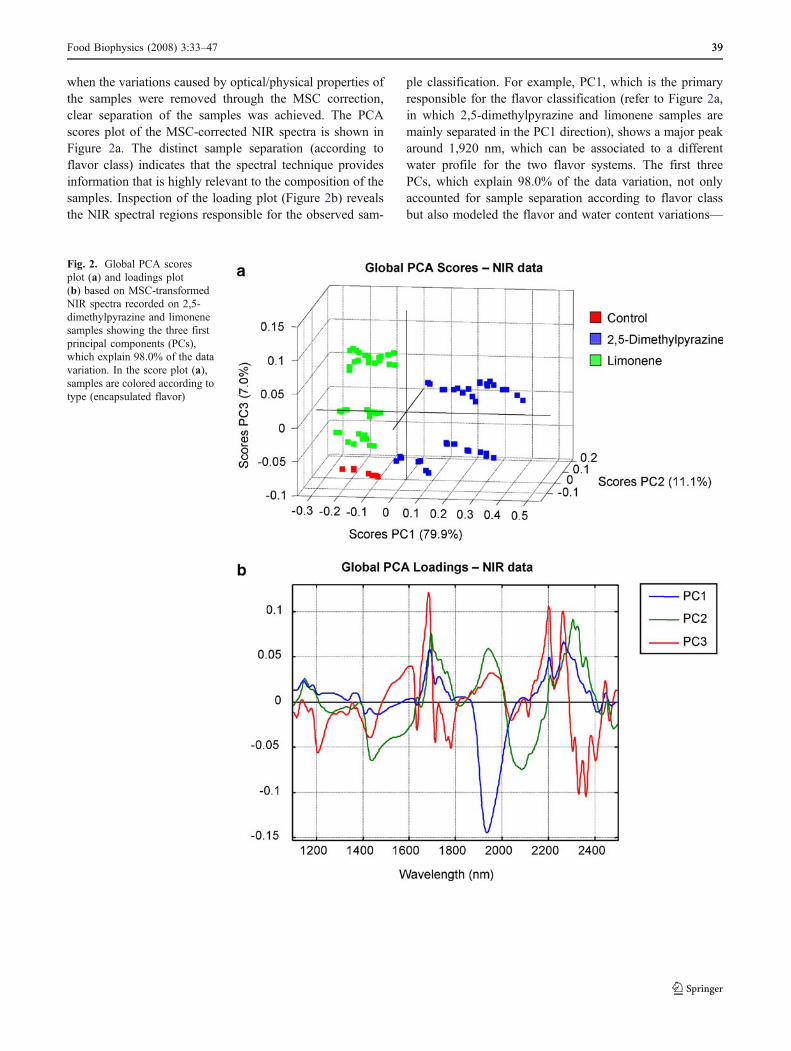
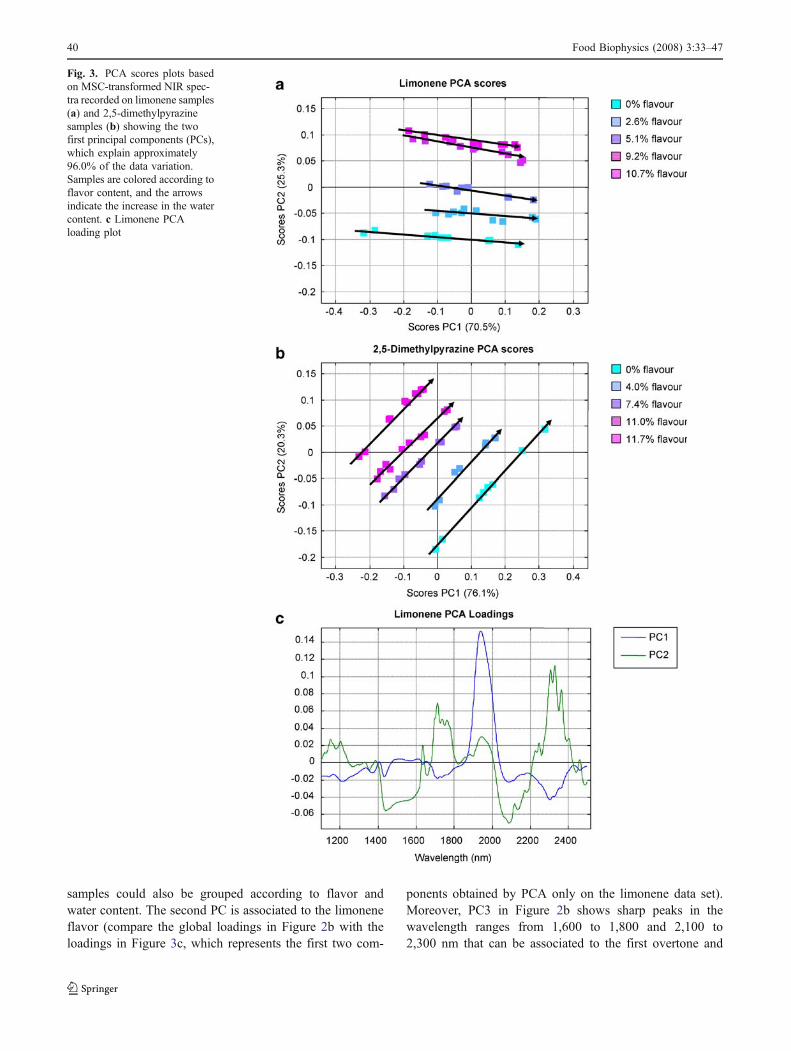
Fig. 3. PCA scores plots basedon MSC-transformed NIR spec-tra recorded on limonene samples(a) and 2,5-dimethylpyrazinesamples (b) showing the twofirst principal components (PCs),which explain approximately96.0% of the data variation.Samples are colored according toflavor content, and the arrowsindicate the increase in the watercontent. c Limonene PCAloading plot
40 Food Biophysics (2008) 3:33–47
combination absorption bands of C–H stretching vibrations.However, no clear break-down could be identified betweenthe different levels of flavor and water content.
To inspect each data set, local models for the two flavors,limonene and 2,5-dimethylpyrazine, were computed on theMSC-corrected NIR data. Figure 3a and b present therespective PCA scores in which a distinct separation ofthe samples according to flavor content can be visualized.For both flavors, PC1 together with PC2 are able to dis-tinguish the flavor content variation, taking into accountalso the effect of water content (increasing water levels areindicated with arrows). The systematic separation of thedifferent flavor concentrations (especially evident in the2,5-dimethylpyrazine score plot; Figure 3b) indicatesparticularly robust 2,5-dimethylpyrazine information. Thecomparison between Figure 3a and b shows that waterplays a major role in the limonene systems (it characterizesthe primary variation along PC1), whereas for the 2,5-dimethylpyrazine systems, flavor behavior seems to beequally important. Inspection of the PCA loadings of thelimonene systems, Figure 3c, emphasizes this result becauseof the clear separation of the water and the flavor infor-mation into the two PC directions—PC1 shows high loadingsin the NIR spectral region around 1,920 nm, characteristic ofwater presence, whereas PC2 shows high loadings in thewavelength region from 1,600 to 1,800 and 2,100 to 2,300that may be related to the first overtone and combinationabsorption bands of the C–H groups present in the limoneneflavor structure.
Regression models—PLS models for the prediction of flavorand water content
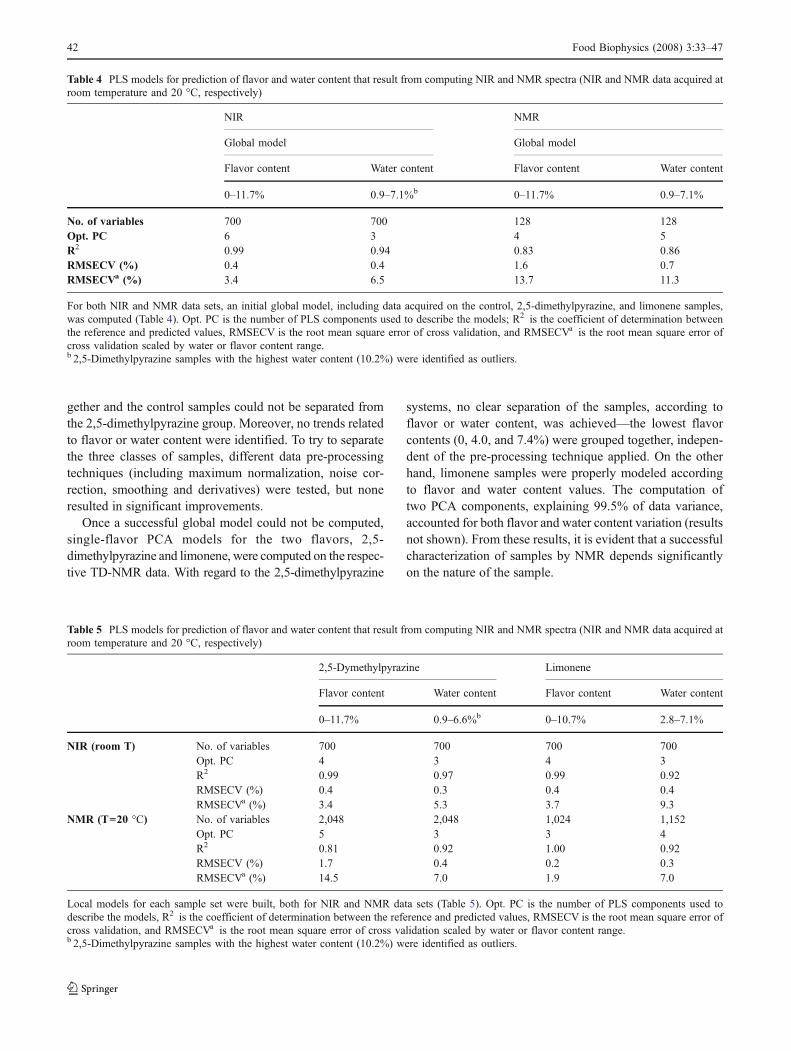
The best prediction models for flavor and water content,obtained by computing the entire NIR spectra (700 vari-ables), are listed in Tables 4 and 5 (global models in Table 4and local flavor models in Table 5). As an example, Figure 4presents the PLS results for the prediction of the 2,5-dimethylpyrazine flavor content (local flavor model).
From Table 5, it can be seen that three to four PLScomponents were used to describe the local predictionmodels. As the calibration samples set can be regarded as afour-component mixture (maltodextrin + gum arabic + water +flavor) and considering the fact that data were pre-processedand mean-centered before model computation, three PLScomponents should be sufficient to describe the compositionof these systems. In the computation of the water predictionmodels, three components were used; however, to modelthe flavor content, one extra component was required (fourPCs). Although this component describes small data vari-ances (0.5 and 1.4% for 2,5-dimethylpyrazine and limonenemodels, respectively), it improves the prediction ability ofthe models. The analysis of regression coefficient plots led
to the same conclusions. As an example, note Figure 4b, inwhich the regression coefficients of the PLS model com-puted on the 2,5-dimethylpyrazine data are presented; therelevance of PC4 is clear in the prediction model. Besides,the occurrence of one additional PLS component has a logicalphysical meaning, as it can be associated with the interactionbetween the flavor and the carrier. Indeed, 2,5-dimethylpyr-azine was specifically selected, as it is relatively polar andable to dissolve in the carrier and interact with it (evidencedby the very short NMR relaxation time of the 2,5-dimethylpyrazine compared to limonene, Figure 5).
Local flavor regression models, computed for 2,5-dimethylpyrazine and limonene samples, showed goodprediction ability for both flavor and water content, illus-trated by low prediction errors (RMSECV values) whencompared to the flavor and water content ranges (refer torow 8 in Table 5).
The addition of two components enabled the computa-tion of a global model with comparable flavor predictionability—computing six PCs, it was possible to build a modelthat predicted the flavor content of the samples, independentof the encapsulated flavor (Table 4). Moreover, the com-putation of a global model to predict the water content wasvery successful, once, with the same number of components(three PCs), the prediction error was comparable to theone obtained when models were computed for the 2,5-dimethylpyrazine and limonene individually (Table 4 vs 5).
TD-NMR relaxometry
Data exploration—PCA models
The TD-NMR profiles of the 2,5-dimethylpyrazine (2,048FID points) and limonene (1,152 FIDCPMG points: 128FID points + 1024 CPMG points) samples are shown inFigure 5. Fifty samples are represented in each plot (20flavor encapsulated systems + 5 control samples, induplicate). Because of the different time scales betweenFID and CPMG measurements, an extra plot for thelimonene set of samples (Figure 5b), showing the FIDpart of the FIDCPMG data acquired, is presented.
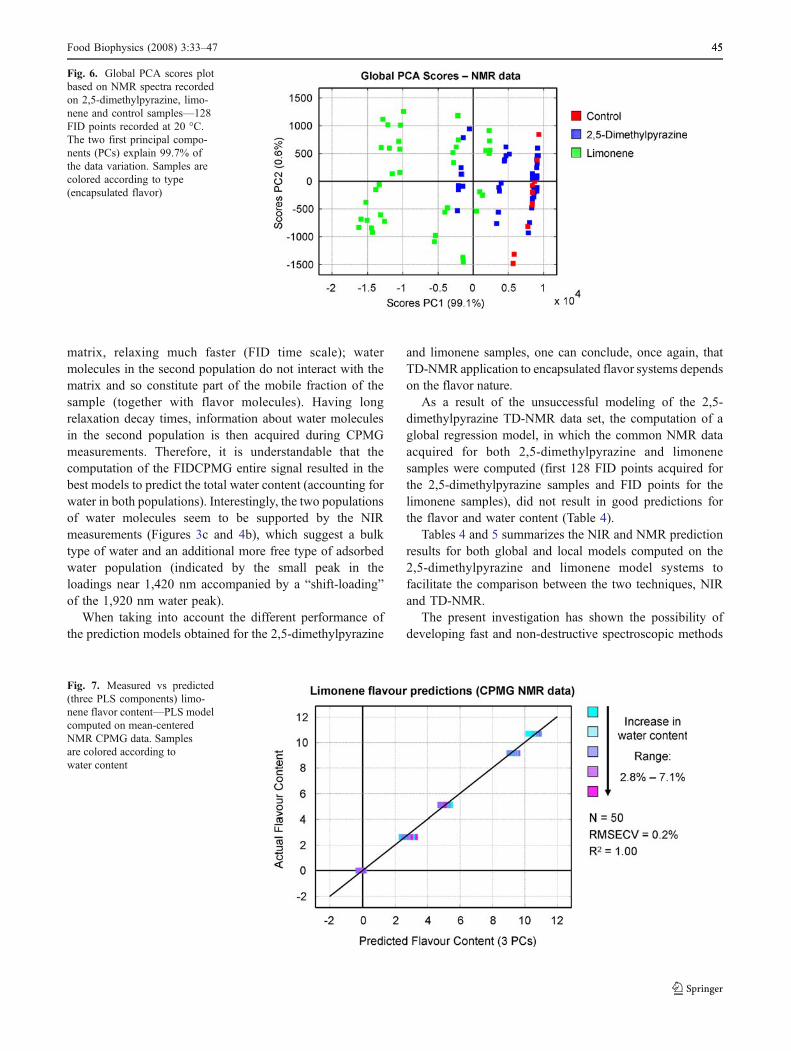
Initially, a global PCA model was computed on the raw2,5-dimethylpyrazine and limonene TD-NMR relaxationdata. Once data points acquired for the two samples setswere different, this model was performed computing thecommon data, first 128 points acquired for the 2,5-dimethylpyrazine samples and the FID part of theFIDCPMG signal acquired for the limonene samples. ThePCA of these data did not allow the complete separation ofthe two different flavor systems (Figure 6)—plot of thescores on the two first principal components, which explain99.7% of the data variation. The two groups representing2,5-dimethylpyrazine and limonene samples merged to-
Food Biophysics (2008) 3:33–47 4141
gether and the control samples could not be separated fromthe 2,5-dimethylpyrazine group. Moreover, no trends relatedto flavor or water content were identified. To try to separatethe three classes of samples, different data pre-processingtechniques (including maximum normalization, noise cor-rection, smoothing and derivatives) were tested, but noneresulted in significant improvements.
Once a successful global model could not be computed,single-flavor PCA models for the two flavors, 2,5-dimethylpyrazine and limonene, were computed on the respec-tive TD-NMR data. With regard to the 2,5-dimethylpyrazine
systems, no clear separation of the samples, according toflavor or water content, was achieved—the lowest flavorcontents (0, 4.0, and 7.4%) were grouped together, indepen-dent of the pre-processing technique applied. On the otherhand, limonene samples were properly modeled accordingto flavor and water content values. The computation oftwo PCA components, explaining 99.5% of data variance,accounted for both flavor and water content variation (resultsnot shown). From these results, it is evident that a successfulcharacterization of samples by NMR depends significantlyon the nature of the sample.
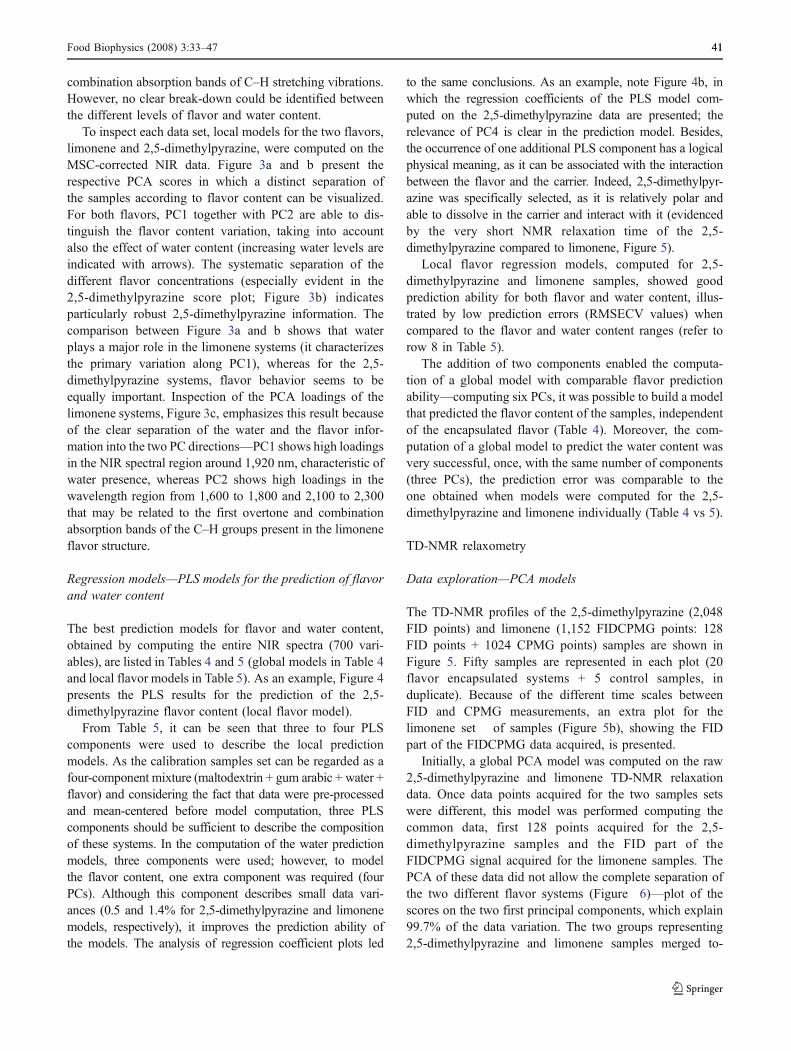
Table 5 PLS models for prediction of flavor and water content that result from computing NIR and NMR spectra (NIR and NMR data acquired atroom temperature and 20 °C, respectively)
2,5-Dymethylpyrazine Limonene
Flavor content Water content Flavor content Water content
0–11.7% 0.9–6.6%b 0–10.7% 2.8–7.1%
NIR (room T) No. of variables 700 700 700 700Opt. PC 4 3 4 3R2 0.99 0.97 0.99 0.92RMSECV (%) 0.4 0.3 0.4 0.4RMSECVa (%) 3.4 5.3 3.7 9.3
NMR (T=20 °C) No. of variables 2,048 2,048 1,024 1,152Opt. PC 5 3 3 4R2 0.81 0.92 1.00 0.92RMSECV (%) 1.7 0.4 0.2 0.3RMSECVa (%) 14.5 7.0 1.9 7.0
Local models for each sample set were built, both for NIR and NMR data sets (Table 5). Opt. PC is the number of PLS components used todescribe the models, R2 is the coefficient of determination between the reference and predicted values, RMSECV is the root mean square error ofcross validation, and RMSECVa is the root mean square error of cross validation scaled by water or flavor content range.b 2,5-Dimethylpyrazine samples with the highest water content (10.2%) were identified as outliers.
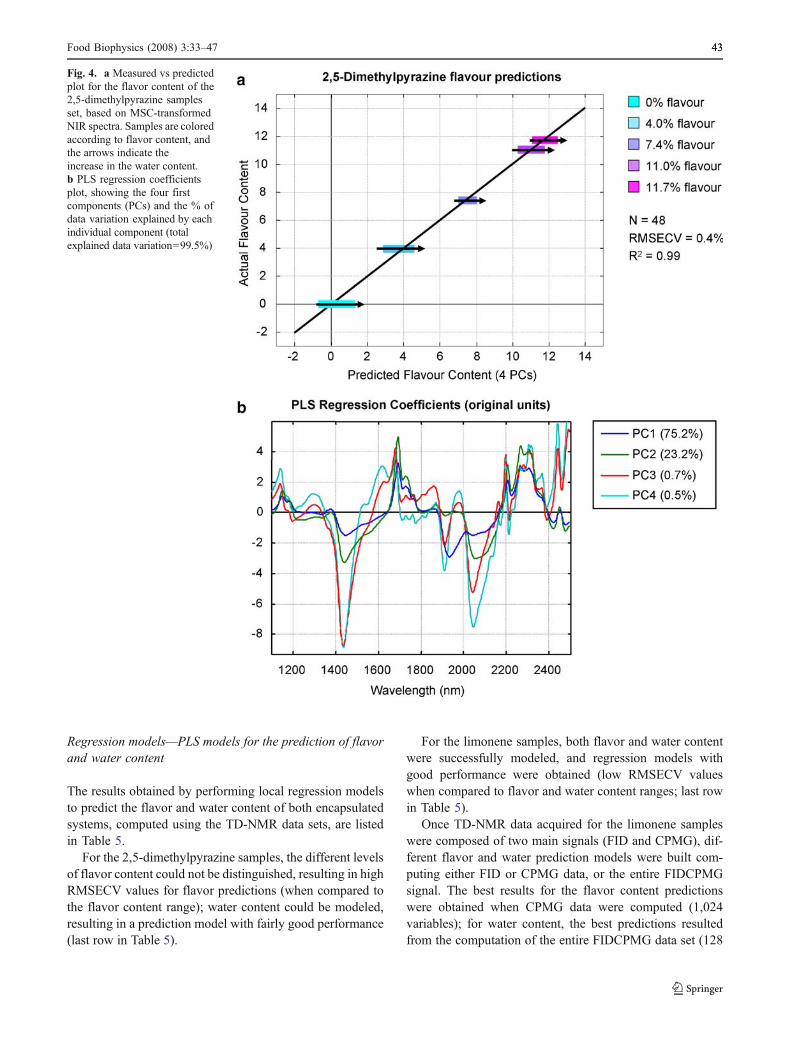
Table 4 PLS models for prediction of flavor and water content that result from computing NIR and NMR spectra (NIR and NMR data acquired atroom temperature and 20 °C, respectively)
NIR NMR
Global model Global model
Flavor content Water content Flavor content Water content
0–11.7% 0.9–7.1%b 0–11.7% 0.9–7.1%
No. of variables 700 700 128 128Opt. PC 6 3 4 5R2 0.99 0.94 0.83 0.86RMSECV (%) 0.4 0.4 1.6 0.7RMSECVa (%) 3.4 6.5 13.7 11.3
For both NIR and NMR data sets, an initial global model, including data acquired on the control, 2,5-dimethylpyrazine, and limonene samples,was computed (Table 4). Opt. PC is the number of PLS components used to describe the models; R2 is the coefficient of determination betweenthe reference and predicted values, RMSECV is the root mean square error of cross validation, and RMSECVa is the root mean square error ofcross validation scaled by water or flavor content range.b 2,5-Dimethylpyrazine samples with the highest water content (10.2%) were identified as outliers.
42 Food Biophysics (2008) 3:33–47
Regression models—PLS models for the prediction of flavorand water content
The results obtained by performing local regression modelsto predict the flavor and water content of both encapsulatedsystems, computed using the TD-NMR data sets, are listedin Table 5.
For the 2,5-dimethylpyrazine samples, the different levelsof flavor content could not be distinguished, resulting in highRMSECV values for flavor predictions (when compared tothe flavor content range); water content could be modeled,resulting in a prediction model with fairly good performance(last row in Table 5).
For the limonene samples, both flavor and water contentwere successfully modeled, and regression models withgood performance were obtained (low RMSECV valueswhen compared to flavor and water content ranges; last rowin Table 5).
Once TD-NMR data acquired for the limonene sampleswere composed of two main signals (FID and CPMG), dif-ferent flavor and water prediction models were built com-puting either FID or CPMG data, or the entire FIDCPMGsignal. The best results for the flavor content predictionswere obtained when CPMG data were computed (1,024variables); for water content, the best predictions resultedfrom the computation of the entire FIDCPMG data set (128
Fig. 4. a Measured vs predictedplot for the flavor content of the2,5-dimethylpyrazine samplesset, based on MSC-transformedNIR spectra. Samples are coloredaccording to flavor content, andthe arrows indicate theincrease in the water content.b PLS regression coefficientsplot, showing the four firstcomponents (PCs) and the % ofdata variation explained by eachindividual component (totalexplained data variation=99.5%)
Food Biophysics (2008) 3:33–47 4343
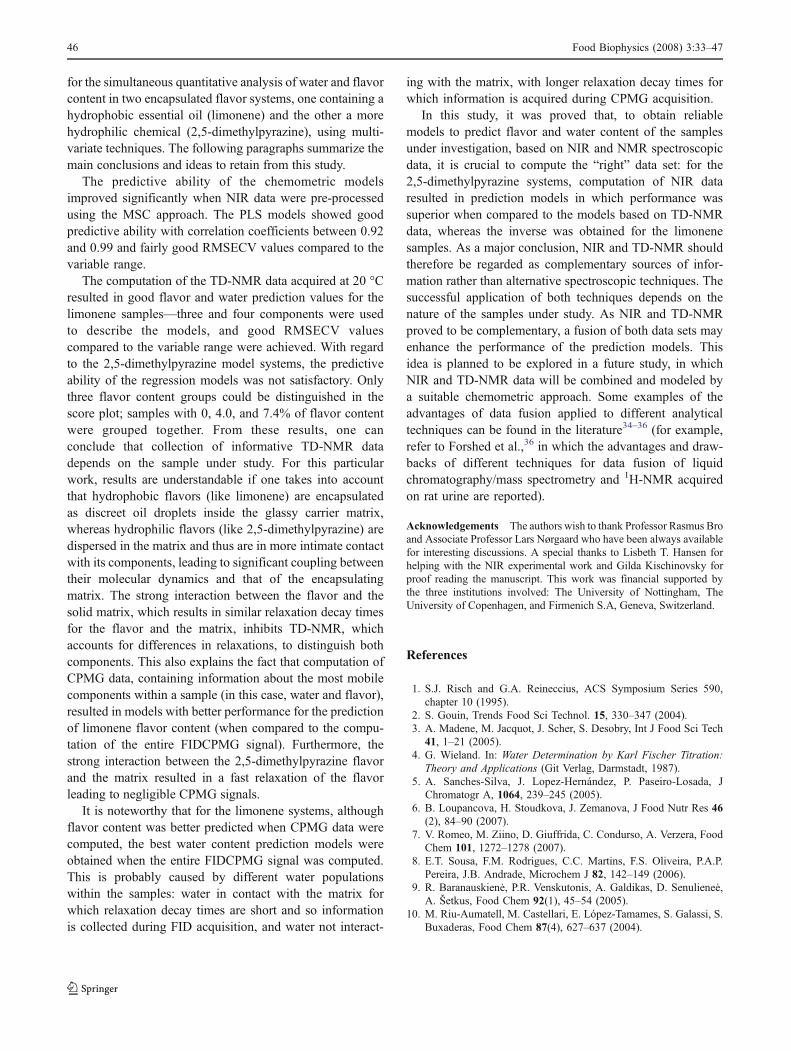
FID + 1024 CPMG data points=1,152 variables). As anexample, Figure 7 presents the flavor predictions for thelimonene systems obtained by computing CPMG datapoints. These results reflect the fact that, in the encapsulatedpowders, the hydrophobic limonene exists as discrete liquidoil droplets with little interaction with the carrier. Limonene
flavor molecules are then characterized by having longrelaxation decay times (in the scale of liquid relaxation decaytimes), which leads to the collection of significant informa-tion during CPMG acquisition. Water is probably present inthe sample in two distinct populations: within the firstpopulation, water molecules are in contact with the solid
Fig. 5. Low field TD-NMRprofiles of 2,5-dimethylpyrazine(FID; a) and limonene(FIDCPMG; b) samples,acquired at 20 °C. Raw (top)and mean-centered data (bottom);for limonene (b), the plot onright top presents the FID part ofthe FIDCPMG data acquired.Samples are presented in dupli-cate (50 samples in each plot)and colored according toflavor content
44 Food Biophysics (2008) 3:33–47
matrix, relaxing much faster (FID time scale); watermolecules in the second population do not interact with thematrix and so constitute part of the mobile fraction of thesample (together with flavor molecules). Having longrelaxation decay times, information about water moleculesin the second population is then acquired during CPMGmeasurements. Therefore, it is understandable that thecomputation of the FIDCPMG entire signal resulted in thebest models to predict the total water content (accounting forwater in both populations). Interestingly, the two populationsof water molecules seem to be supported by the NIRmeasurements (Figures 3c and 4b), which suggest a bulktype of water and an additional more free type of adsorbedwater population (indicated by the small peak in theloadings near 1,420 nm accompanied by a “shift-loading”of the 1,920 nm water peak).
When taking into account the different performance ofthe prediction models obtained for the 2,5-dimethylpyrazine
and limonene samples, one can conclude, once again, thatTD-NMR application to encapsulated flavor systems dependson the flavor nature.
As a result of the unsuccessful modeling of the 2,5-dimethylpyrazine TD-NMR data set, the computation of aglobal regression model, in which the common NMR dataacquired for both 2,5-dimethylpyrazine and limonenesamples were computed (first 128 FID points acquired forthe 2,5-dimethylpyrazine samples and FID points for thelimonene samples), did not result in good predictions forthe flavor and water content (Table 4).
Tables 4 and 5 summarizes the NIR and NMR predictionresults for both global and local models computed on the2,5-dimethylpyrazine and limonene model systems tofacilitate the comparison between the two techniques, NIRand TD-NMR.
The present investigation has shown the possibility ofdeveloping fast and non-destructive spectroscopic methods
Fig. 6. Global PCA scores plotbased on NMR spectra recordedon 2,5-dimethylpyrazine, limo-nene and control samples—128FID points recorded at 20 °C.The two first principal compo-nents (PCs) explain 99.7% ofthe data variation. Samples arecolored according to type(encapsulated flavor)
Fig. 7. Measured vs predicted(three PLS components) limo-nene flavor content—PLS modelcomputed on mean-centeredNMR CPMG data. Samplesare colored according towater content
Food Biophysics (2008) 3:33–47 4545
for the simultaneous quantitative analysis of water and flavorcontent in two encapsulated flavor systems, one containing ahydrophobic essential oil (limonene) and the other a morehydrophilic chemical (2,5-dimethylpyrazine), using multi-variate techniques. The following paragraphs summarize themain conclusions and ideas to retain from this study.
The predictive ability of the chemometric modelsimproved significantly when NIR data were pre-processedusing the MSC approach. The PLS models showed goodpredictive ability with correlation coefficients between 0.92and 0.99 and fairly good RMSECV values compared to thevariable range.
The computation of the TD-NMR data acquired at 20 °Cresulted in good flavor and water prediction values for thelimonene samples—three and four components were usedto describe the models, and good RMSECV valuescompared to the variable range were achieved. With regardto the 2,5-dimethylpyrazine model systems, the predictiveability of the regression models was not satisfactory. Onlythree flavor content groups could be distinguished in thescore plot; samples with 0, 4.0, and 7.4% of flavor contentwere grouped together. From these results, one canconclude that collection of informative TD-NMR datadepends on the sample under study. For this particularwork, results are understandable if one takes into accountthat hydrophobic flavors (like limonene) are encapsulatedas discreet oil droplets inside the glassy carrier matrix,whereas hydrophilic flavors (like 2,5-dimethylpyrazine) aredispersed in the matrix and thus are in more intimate contactwith its components, leading to significant coupling betweentheir molecular dynamics and that of the encapsulatingmatrix. The strong interaction between the flavor and thesolid matrix, which results in similar relaxation decay timesfor the flavor and the matrix, inhibits TD-NMR, whichaccounts for differences in relaxations, to distinguish bothcomponents. This also explains the fact that computation ofCPMG data, containing information about the most mobilecomponents within a sample (in this case, water and flavor),resulted in models with better performance for the predictionof limonene flavor content (when compared to the compu-tation of the entire FIDCPMG signal). Furthermore, thestrong interaction between the 2,5-dimethylpyrazine flavorand the matrix resulted in a fast relaxation of the flavorleading to negligible CPMG signals.
It is noteworthy that for the limonene systems, althoughflavor content was better predicted when CPMG data werecomputed, the best water content prediction models wereobtained when the entire FIDCPMG signal was computed.This is probably caused by different water populationswithin the samples: water in contact with the matrix forwhich relaxation decay times are short and so informationis collected during FID acquisition, and water not interact-
ing with the matrix, with longer relaxation decay times forwhich information is acquired during CPMG acquisition.
In this study, it was proved that, to obtain reliablemodels to predict flavor and water content of the samplesunder investigation, based on NIR and NMR spectroscopicdata, it is crucial to compute the “right” data set: for the2,5-dimethylpyrazine systems, computation of NIR dataresulted in prediction models in which performance wassuperior when compared to the models based on TD-NMRdata, whereas the inverse was obtained for the limonenesamples. As a major conclusion, NIR and TD-NMR shouldtherefore be regarded as complementary sources of infor-mation rather than alternative spectroscopic techniques. Thesuccessful application of both techniques depends on thenature of the samples under study. As NIR and TD-NMRproved to be complementary, a fusion of both data sets mayenhance the performance of the prediction models. Thisidea is planned to be explored in a future study, in whichNIR and TD-NMR data will be combined and modeled bya suitable chemometric approach. Some examples of theadvantages of data fusion applied to different analyticaltechniques can be found in the literature34–36 (for example,refer to Forshed et al.,36 in which the advantages and draw-backs of different techniques for data fusion of liquidchromatography/mass spectrometry and 1H-NMR acquiredon rat urine are reported).
Acknowledgements The authors wish to thank Professor Rasmus Broand Associate Professor Lars Nørgaard who have been always availablefor interesting discussions. A special thanks to Lisbeth T. Hansen forhelping with the NIR experimental work and Gilda Kischinovsky forproof reading the manuscript. This work was financial supported bythe three institutions involved: The University of Nottingham, TheUniversity of Copenhagen, and Firmenich S.A, Geneva, Switzerland.
References
1. S.J. Risch and G.A. Reineccius, ACS Symposium Series 590,chapter 10 (1995).
2. S. Gouin, Trends Food Sci Technol. 15, 330–347 (2004).3. A. Madene, M. Jacquot, J. Scher, S. Desobry, Int J Food Sci Tech
41, 1–21 (2005).4. G. Wieland. In: Water Determination by Karl Fischer Titration:
Theory and Applications (Git Verlag, Darmstadt, 1987).5. A. Sanches-Silva, J. Lopez-Hernández, P. Paseiro-Losada, J
Chromatogr A, 1064, 239–245 (2005).6. B. Loupancova, H. Stoudkova, J. Zemanova, J Food Nutr Res 46
(2), 84–90 (2007).7. V. Romeo, M. Ziino, D. Giuffrida, C. Condurso, A. Verzera, Food
Chem 101, 1272–1278 (2007).8. E.T. Sousa, F.M. Rodrigues, C.C. Martins, F.S. Oliveira, P.A.P.
Pereira, J.B. Andrade, Microchem J 82, 142–149 (2006).9. R. Baranauskienė, P.R. Venskutonis, A. Galdikas, D. Senulieneė,
A. Šetkus, Food Chem 92(1), 45–54 (2005).10. M. Riu-Aumatell, M. Castellari, E. López-Tamames, S. Galassi, S.
Buxaderas, Food Chem 87(4), 627–637 (2004).
46 Food Biophysics (2008) 3:33–47
11. H. Cen, Y. He, Trends Food Sci Tech 18, 72–83 (2007).12. M. Dyrby, S.B. Engelsen, L. Nørgaard, M. Bruhn, L. Lundsberg-
Nielsen, Appl Spectrosc 56, 579–585 (2002).13. C.B. Zachariassen, J. Larsen, F. van den Berg, S.B. Engelsen,
Chemometr Intell Lab Syst 76(2), 149–161 (2005).14. L. Nørgaard, M.T. Hahn, L.B. Knudsen, I.A. Farhat, S.B.
Engelsen, Int Dairy J 15, 1261–1270 (2005).15. S.M. Jepsen, H.T. Pedersen, S.B. Engelsen, J Sci Food Agric 79,
1793–1802 (1999).16. C.A. Toussaint, F. Médale, A. Davanel, B. Fauconneau, P. Haffray,
S. Akoka, J Sci Food Agric 82, 173–178 (2001).17. D. Nielsen, G. Hyldig, J. Nielsen, H.H. Nielsen, Food Sci
Technol-LEB 38, 537–548 (2004).18. L. Andrade, B. MacNaughtan, and I.A. Farhat, An investigation into
the practical aspects of the quantitative analysis of solid-liquidsystems using low-field NMR. In: Magnetic Resonance in FoodScience: From Molecules to Man, edited by I.A. Farhat, P.S. Belton,and G.A. Webb (Royal Society of Chemistry, London, 2007).
19. M.A.E. Diaz, T. Guetachew, P. Landy, J. Jose, A. Voilley, FluidPhase Equilib 157(2), 257–270 (1999).
20. A.F. El-Kattan, C.S. Asbill, N. Kim, B.B. Michniak, Int J Pharm215(1), 229–240 (2001).
21. K. Bauer, D. Garbe, and H. Surburg. In: Common Fragrance andFlavour Material (VCH, Weinheim, Germany, 1997).
22. G.A. Reineccius, Dry Technol 22(6), 1289–1324 (2004).
23. H.Y. Carr, E.M. Purcell, Phys Rev 94, 630–638 (1954).24. S. Meiboom, D. Gill, Rev Sci Instrum 29, 688–691 (1958).25. L. Munck, L. Nørgaard, S.B. Engelsen, R. Bro, C.A. Andersson,
Chemometr Intell Lab Syst 44, 31–60 (1998).26. H. Hotelling, J Educ Psychol 24, 417–441 (1933).27. J.E. Jackson, J Qual Technol 13(1) (1981).28. S. Wold, H. Martens, and H. Wold. In: Lecture Notes in
Mathematics 1983. Proceedings of the Conference Matrix Pencils,edited by A. Ruhe and B. Kågström (Springer, Heidelberg, 1983),pp. 286–293, March 1982.
29. P. Geladi, B.R. Kowalski, Anal Chim Acta 185, 1–17 (1987).30. P. Geladi, D. McDougall, H. Martens, Appl Spectrosc 39, 491–
500 (1985).31. H. Martens, J.P. Nielsen, S.B. Engelsen, Anal Chem 75, 394–404
(2003).32. R.J. Barnes, M.S. Dhanoa, S.J. Lister, Appl Spectrosc 43, 772–
777 (1989).33. D.K. Pedersen, H. Martens, J.P. Nielsen, S.B. Engelsen, Appl
Spectrosc 56, 1206–1214 (2002).34. S. Roussel, V. Bellon-Maurel, J.M. Roger, P. Grenier, Chemom
Intell Lab Syst 65, 209–219 (2003).35. V. Steinmetz, F. Sevila, V. Bellon-Maurel, J Agric Eng Res 74,
21–31 (1999).36. J. Forshed, H. Idborg, S.P. Jacobsson, Chemom Intell Lab Syst 85,
102–109 (2007).
Food Biophysics (2008) 3:33–47 4747
Copyright © 2022 FDOKUMEN