Fracture of porcelain-veneered gold-alloy and zirconia molar ...

ie
n
n
ed on thele region.e 425–475
Solid State Sciences 5 (2003) 1369–1376www.elsevier.com/locate/sssc
Characterization of cubic ceria–zirconia powders by X-ray diffractioand vibrational and electronic spectroscopy
Vicente Sánchez Escribanoa,∗, Enrique Fernández Lópeza, Marta Panizzab, Carlo Resinib,c,José Manuel Gallardo Amoresd, Guido Buscab,c
a Departamento de Química Inorgánica, Facultad de Ciencias Químicas, Pa. de la Merced s/n, 37008 Salamanca, Spainb Dipartimento di Ingegneria Chimica e di Processo, Università di Genova, P.le J.F. Kennedy, 16129 Genova, Italy
c INFM, c/o Dipartimento di Fisica, Università di Genova Via Dodecaneso 33, 16146 Genova, Italyd Laboratorio Complutense de Altas Presiones, Dpto. Química Inorgánica I, Fa Química, U. Complutense, 28040-Ciudad Universitaria, Madrid, Spain
Received 18 March 2003; received in revised form 13 July 2003; accepted 25 July 2003
Abstract
The X-ray diffraction (XRD) patterns and the Infrared, Raman and UV–visible spectra of CeO2–ZrO2 powders prepared by co-precipitatioare presented. Raman spectra provide evidence for the largely predominant cubic structure of the powders with CeO2 molar compositionhigher than 25%. Also skeletal IR spectra allow to distinguish cubic from tetragonal phases which are instead not easily distinguishbasis of the XRD patterns. All mixed oxides including pure ceria are strong UV absorbers although also absorb in the violet visibBy carefully selecting their composition and treatment temperature, the onset of the radiation that they cut off can be chosen in thnm interval. Although they are likely metastable, the cubic phases are still pure even after heating at 1173 K for 4 h. 2003 Éditions scientifiques et médicales Elsevier SAS. All rights reserved.
tutend
heyter-teaslsoothowncu-ily
ev-
lid
inru-oz-
ghtodce-ce-lyticonspro-V-ars,l ofre-
op-foralsncedoveniclec-19].sur-ge,pec-ort
1. Introduction
The oxides of tetravalent transition elements constirelevant products for the inorganic chemical industry aobject of research in relation to several applications. Tare at least partially mutually soluble and present also inesting properties from the point of view of their solid stachemistry. Zirconia is found in nature in small quantitiesthe mineral Baddeleyite (monoclinic zirconia) and can aexist as tetragonal and cubic fluorite-like polymorphs, bstable at higher temperature but stabilized by doping dto room temperature [1]. Cerium dioxide only presents abic fluorite-type polymorph. However, it loses oxygen easbecoming largely nonstoichiometric and giving rise to seral suboxides up to the sesquioxide Ce2O3 [2]. Due to thecommon fluorite-like structure, they are able to form sosolution phases in a broad compositional range [3].
Zirconia ceramics are utilized as refractory materialsfurnace construction, in the manufacture of melting ccibles, and in the steel industry for continuous casting n
* Corresponding author.
E-mail address: [email protected] (V. Sánchez Escribano).1293-2558/$ – see front matter 2003 Éditions scientifiques et médicales Eldoi:10.1016/j.solidstatesciences.2003.07.001
zles [1,4]. Due to the total transparency to the visible liand the high index of refraction (2.1–2.2), zirconia is a gowhite pigment, and a good opacifier [5]. Ce oxide basedramics present different applications, i.e., in the fields oframic superconductors [6,7], gas sensors [8] and catamaterials [9]. Of particular interest are also the applicatiof the optical properties of ceria-based materials for theduction of thin film optical devices [10,11] and as a Ublocking agent for cosmetics [12]. In the last several yeceria–zirconia mixed oxides have attracted a great deaattention in catalysis, because they combine the highlyfractory properties of zirconia with the oxygen-storage prerties of ceria [13]. They are also promising materialsSolid Oxide Fuel Cell Technology [14]. These materishow good thermal resistance [15,16] as well as enharedox properties. It is evident that their yields for the abmentioned applications depend critically on their electroproperties. Deep investigations on the vibrational and etronic spectra of pure zirconia have been performed [17–Additionally, detailed studies have been reported on theface properties of ceria–zirconia [20,21]. To our knowledless attention has been paid yet to investigate the bulk stroscopic properties of the Ce–Zr mixed oxides. We rep
here a study on the spectroscopic properties of which dealssevier SAS. All rights reserved.
1370 V. Sánchez Escribano et al. / Solid State Sciences 5 (2003) 1369–1376
ctraitha ofl is
si-1)y-
ec.)
gedthylof
873
a
romhodoteuit-
00–s-T-(Ndthepecsur-metm-
esnalheir
1.riteizes, inles
osed
ose
si-
wingin-
nalcallyum
h
f them-ctra
mofks,
,
dered
in
with both theoretical and experimental aspects of the speof ceria–zirconia materials prepared by coprecipitation, wparticular emphasis on the modifications that the spectrthe cubic fluorite-like oxides undergo when their unit celtetragonally distorted upon increasing the Zr content.
2. Experimental
Cerium–zirconium mixed oxides with nominal compotions CexZr(1−x)O2 (x = 0, 0.1, 0.25, 0.5, 0.75, 0.9 andwere prepared by coprecipitation from zirconyl nitrate hdrate (ZrO(NO3)·xH2O) and ammonium cerium (IV) nitrat(both of them provided by Aldrich Chemical Company, Inby adding ammonium hydroxide until pH= 9 under gentleheating and continuous stirring. The precipitates were afor one day, then washed with deionised water and dieether and dried overnight in a muffle furnace. Portionseach material were milled and calcined for 4 h at 673,and 1173 K in a Hobersal mod. PR/300 “PAD” furnace.
Powder X-ray diffraction patterns were recorded onSiemens D500 diffractometer (Cu-Kα radiation, 40 kV,30 mA). Crystallographic parameters were calculated fthe original diffraction data according to the Scherrer metusing dedicated least square software (Checkcell V4). Nthat although this procedure neglects strain effects, it is sable to describe the trends of crystallite size changes.
The FT-IR spectra have been recorded in the 8300 cm−1 range with a Perkin-Elmer 1600 Fourier Tranform instrument using the KBr dilution technique. The FRaman spectra were recorded using a Brucker FTS100YAG laser) instrument. Diffuse reflectance spectra in2500–200 nm range were obtained with a Jasco V-570 strophotometer operating at room temperature. The BETface areas have been measured with a conventional voluric instrument by nitrogen adsorption at liquid nitrogen teperature (77 K).
3. Results and discussion
3.1. X-ray diffraction
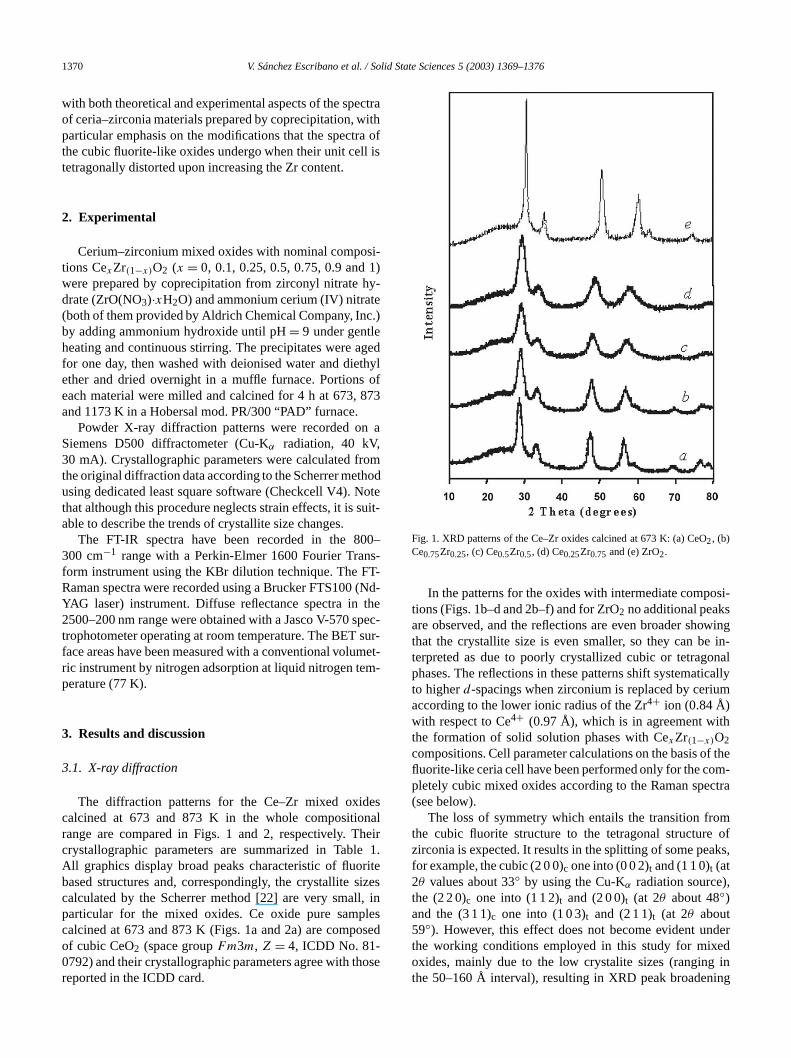
The diffraction patterns for the Ce–Zr mixed oxidcalcined at 673 and 873 K in the whole compositiorange are compared in Figs. 1 and 2, respectively. Tcrystallographic parameters are summarized in TableAll graphics display broad peaks characteristic of fluobased structures and, correspondingly, the crystallite scalculated by the Scherrer method [22] are very smallparticular for the mixed oxides. Ce oxide pure sampcalcined at 673 and 873 K (Figs. 1a and 2a) are compof cubic CeO2 (space groupFm3m, Z = 4, ICDD No. 81-0792) and their crystallographic parameters agree with th
reported in the ICDD card.-
-
-
Fig. 1. XRD patterns of the Ce–Zr oxides calcined at 673 K: (a) CeO2, (b)Ce0.75Zr0.25, (c) Ce0.5Zr0.5, (d) Ce0.25Zr0.75 and (e) ZrO2.
In the patterns for the oxides with intermediate compotions (Figs. 1b–d and 2b–f) and for ZrO2 no additional peaksare observed, and the reflections are even broader shothat the crystallite size is even smaller, so they can beterpreted as due to poorly crystallized cubic or tetragophases. The reflections in these patterns shift systematito higherd-spacings when zirconium is replaced by ceriaccording to the lower ionic radius of the Zr4+ ion (0.84 Å)with respect to Ce4+ (0.97 Å), which is in agreement witthe formation of solid solution phases with CexZr(1−x)O2
compositions. Cell parameter calculations on the basis ofluorite-like ceria cell have been performed only for the copletely cubic mixed oxides according to the Raman spe(see below).
The loss of symmetry which entails the transition frothe cubic fluorite structure to the tetragonal structurezirconia is expected. It results in the splitting of some peafor example, the cubic (2 0 0)c one into (0 0 2)t and (1 1 0)t (at2θ values about 33◦ by using the Cu-Kα radiation source)the (2 2 0)c one into (1 1 2)t and (2 0 0)t (at 2θ about 48◦)and the (3 1 1)c one into (1 0 3)t and (2 1 1)t (at 2θ about59◦). However, this effect does not become evident unthe working conditions employed in this study for mixoxides, mainly due to the low crystalite sizes (ranging
the 50–160 Å interval), resulting in XRD peak broadening
V. Sánchez Escribano et al. / Solid State Sciences 5 (2003) 1369–1376 1371
pectroscop
ia cell.
Table 1Crystallographic parameters of the Ce–Zr mixed oxides (the table has been constructed on the base of the results provided by XRD and Raman sy)
Sample T (K) Phases Cell parameters (Å)a Volume (Å3) Crystallite size (Å)
Ce1Zr0 673 CeO2 5.4115 (4) 158.5 78Ce0.75Zr0.25 Cubic s.s. 5.3824 (5) 155.9 57Ce0.5Zr0.5 Cubic s.s. 5.3375 (3) 152.0 44Ce0.25Zr0.75 Cubic s.s. 49
Tetr. s.s.Ce0Zr1 t-ZrO2 105Ce1Zr0 873 CeO2 5.4102 (2) 158.4 119Ce0.9Zr0.1 Cubic s.s. 5.3894 (3) 156.6 68Ce0.75Zr0.25 Cubic s.s. 5.3779 (4) 155.5 61Ce0.5Zr0.5 Cubic s.s. 5.3308 (1) 151.5 57Ce0.25Zr0.75 Cubic s.s. 49
Tetr. s.s.Ce0.1Zr0.9 Tetr. s.s. 87Ce0Zr1 t-ZrO2 130Ce1Zr0 1173 CeO2 5.4124 (2) 158.5 523Ce0.9Zr0.1 Cubic s.s. 5.3922 (1) 156.8 362Ce0.75Zr0.25 Cubic s.s. 5.3697 (3) 154.8 219Ce0.5Zr0.5 Cubic s.s. 5.3250 (2) 151.0 154Ce0.25Zr0.75 Cubic s.s. 136
Tetr. s.s.
CeO2 (ICDD file No. 81-0792):a = b = c = 5.4120 Å (cubic). Cubic s.s.: Cubic solid solution, crystallographic data calculated with reference to cerTetr. s.s.: Tetragonal solid solution.t-ZrO2 (ICDD file No. 42-1164):a = b = 3.5921 Å,c = 5.1792 Å (tetragonal).e.s.d. is given in brackets next the cellparameter value.
K:
the
s ors inintythethe
antons,antual
nia-are
erialylow
acerednlyrsee,
ted
ons
Fig. 2. XRD patterns of the Ce–Zr oxides calcined at 873(a) CeO2, (b) Ce0.9Zr0.1, (c) Ce0.75Zr0.25, (d) Ce0.5Zr0.5, (e) Ce0.25Zr0.75,(f) Ce0.1Zr0.9 and (g) ZrO2 (the insert shows two expanded regions ofpattern for ZrO2).
and therefore the symmetry of the solid solution phasethe co-presence of minor amounts of tetragonal phasethe Ce-rich materials cannot be determined with certaby using XRD. Nonetheless, a detailed inspection ofpatterns of the Zr oxide (see the insert in Fig. 2) andZr-rich materials calcined at 873 K shows a significbroadening of the reflection peaks in the above cited regiwhich might suggest some multiplicity. Moreover, we cmention here that, according to Duvez and Odell, the musolubility of ZrO2 and CeO2 is very limited below 1273 Kand, based on thermodynamics, mixtures of a zircorich tetragonal phase and a ceria-rich cubic phaseexpected in the compositional range above molar 20% c[23]. In conclusion, powder X-ray diffraction can harddiscriminate the presence of the tetragonal phase forcrystallite size samples.
3.2. Vibrational spectra (FT-IR and FT-Raman)
Factor group analyses for the fluorite structure (spgroup Fm3m) and for the tetragonal zirconia structu(space groupP42/nmc) have been previously performe[17,19,24] and indicate that for the cubic structure one otriply degenerate IR active mode, split into a TransveOptical mode (TO) and a Longitudinal Optical (LO) modis expected. Also a single Raman active mode (F2g) isexpected. The symmetry of the optical modes is indicaby:
Γopt = F1u(IR) + F2g(R).
The vibrational modes arise from three equivalent moti
of oxygen atoms on the three axes (F2 symmetry for the
1372 V. Sánchez Escribano et al. / Solid State Sciences 5 (2003) 1369–1376
en
ndfan-
hingy totionwerubic
insare
oms
msfourfourensthehemthethe
inedhenlyheture
e–O4a)out
thened
inaodeure
g),.allyourhenal
e)
K:
O
Td site symmetry). Due to the presence of two oxygatoms in the Bravais cell and to theOh factor group,the F2 mode splits into one symmetric componentF2g ,which only involves movements of the oxygen atoms, aanother asymmetricF1u one which involves movements oboth the oxygen and cerium atoms. The former is Ramactive and corresponds to a symmetric O–Zr–O stretcand the latter is IR-active and corresponds accordinglcoupled Zr–O–Zr asymmetric stretching and deformamodes. Therefore, the IR mode is expected to fall at lowavenumbers than the Raman mode (as reported for czirconia [17]).
In tetragonal zirconia, the smallest Bravais cell conta4 oxygen ions and the tetrahedra surrounding oxygendeformed, i.e., they are expanded along thez-axis (C2v
site symmetry). Therefore, each movement of oxygen atundergoes threefold splitting (A1 + B1 + B2 in theC2v sitesymmetry). Finally, the movements of the four oxygen atocombine giving rise to four nondegenerate modes and todoubly degenerate ones, four of which are IR active andRaman active. By combining the movements of oxygwith the movements of zirconium ions and subtractingacoustical modes, it results three IR bands (each of tundergoing TO-LO splitting) and six Raman bands forspectrum of tetragonal zirconia. In fact, the symmetry ofoptical modes for tetragonal zirconia is indicated by:
Γopt = A2u(IR) + B2u(inactive) + 2Eu(IR) + A1g(R)
+ 2B1g(R) + 3Eg(R).
The Raman and IR spectra of the Ce–Zr oxides calcat 873 K are shown in Figs. 3 and 4, respectively. TRaman spectrum for pure ceria (Fig. 3a) displays oone peak at 465 cm−1, as expected on the basis of tfactor group analysis and in agreement with the litera[25–27]. This peak corresponds to the fundamental withF2g
symmetry, which can be regarded as a symmetric O–Cstretching. The IR spectrum for the same sample (Fig.displays a broad absorption with a maximum at ab360 cm−1 and a shoulder at 540 cm−1. According to theprevious discussion on the vibrational active modes influorite structure, the main maximum is reasonably assigto the transverse mode (TO) of the triply-degeneratedF1u
fundamental and the shoulder is assigned to the longitudcomponent (LO) of the same fundamental. The IR mfalls at lower wavenumbers than the Raman mode in pceria, as expected.
In the Raman spectrum of the zirconia sample (Fig. 3peaks at 145, 265, 313, 460, 600 and 645 cm−1 are detectedThose are the six Raman bands predicted theoreticfor tetragonal zirconia. The present results agree withprevious ones [17] and with others in Refs. [19,20]. Tpresence of monoclinic zirconia is excluded as no additiobands are detected, in particular, in the 170–200 cm−1
interval. The IR spectrum for tetragonal zirconia (Fig. 4−1
displays an intense absorption with a maximum at 475 cml
Fig. 3. Raman spectra of the Ce–Zr oxides calcined at 873(a) CeO2, (b) Ce0.9Zr0.1, (c) Ce0.75Zr0.25, (d) Ce0.5Zr0.5, (e) Ce0.25Zr0.75,(f) Ce0.1Zr0.9 and (g) ZrO2.
Fig. 4. FT–IR spectra of the Ce–Zr oxides calcined at 873 K: (a) Ce2,(b) Ce Zr , (c) Ce Zr , (d) Ce Zr and (e) ZrO.
0.75 0.25 0.5 0.5 0.25 0.75 2
V. Sánchez Escribano et al. / Solid State Sciences 5 (2003) 1369–1376 1373
usly
opyym-opyades.
50%at
ely,ains thetry
-e, ao-hase
tentatout
aintheum
ione ofebersions ae–
ndolidated
ofhaseg u
The5.ord-allyesspat-arder-
(a)
ys-thecesue towithhee sys-
si-ntsyedions aion
edtra
e
ularce
ate–Zra or
and components at 360, 576 and 670 cm−1. This spectrumis closely similar to that observed and described previo(see Fig. 2 in Ref. [17]).
As for the Ce–Zr mixed oxides, Raman spectroscproves as a valuable tool in order to determine their smetry whereas the information provided by IR spectroscis less relevant as it is less sensitive (because of the broof the peaks and LO-TO splitting) to unit cell distortionThe Raman spectra for the samples containing up toZr (Fig. 3b–d) do not vary significantly with respect to thof pure ceria (Fig. 3a) and show an only peak at 465 cm−1
characteristic of the cubic fluorite-like structure. Converswhen the Zr content rises above 50% (Fig. 3e–g), the mpeak in the Raman spectra decreases in intensity whereasix predicted bands characteristic of the tetragonal symmoccur at about 140, 260, 309, 454, 600 and 630 cm−1. Thespectrum for the composition Ce0.25Zr0.75 suggests the copresence of a tetragonal and a cubic solid solution phasthe band at 460 cm−1 is observed together with the compnents typical of the tetragonal phase, though the cubic pis still largely predominant.
The IR spectra of the Ce rich samples (Ce conup to 50%) do not vary too much with respect to thof pure ceria and only one peak is observed at ab360 cm−1 with a weaker component at 540 cm−1. However,when the Zr content rises above the molar 50%, the mpeak shifts systematically to higher energies. Thus, inspectrum of the 75% Zr containing sample, the maximappears at approximately 460 cm−1. It should be notedthat in the samples richer in Zr, a tetragonal solid solutphase becomes predominant. Therefore, the occurrencmaximum at 360 cm−1 indicates the formation of a fluoritlike phase whereas if it appears at higher wavenumevidences for the formation of a tetragonal solid solutphase. In this way, the shift of the maximum proves ameasure of the tetragonal distortion on the unit cell in a CZr mixed oxide.
Bringing together the results provided by XRD athe vibrational spectroscopies, the symmetry of the ssolution phases which make up our samples are evaluas reported in Table 1.
3.3. X-ray diffraction (oxides calcined at 1173 K)
In order to deep on the study on the structural stabilitythe mainly cubic samples and to evaluate hypothetical psegregations and transformations, the samples containinto 25% Zr were calcined at 1173 K and characterized.corresponding diffraction patterns are compared in Fig.
First of all, the sharpness of the XRD peaks and, accingly, the crystal size (see Table 1) increase dramaticfor every composition, evidencing a strong sintering procwhich has taken place between 873 and 1173 K. Thetern for pure ceria (Fig. 5a) fits perfectly the reference cand is practically identical to those treated at lower temp
atures but with a significant crystallinity improvement. Atn
e
s
a
p
Fig. 5. XRD patterns of the cubic Ce–Zr oxides calcined at 1173 K:CeO2, (b) Ce0.9Zr0.1, (c) Ce0.75Zr0.25, (d) Ce0.5Zr0.5 and (e) Ce0.25Zr0.75.
1173 K, the 10% Zr containing sample is also highly crtalline, as proves the well-resolved pattern (Fig. 5b). Inmixed oxides with higher Zr concentrations, no evidenfor phase segregations are found and the samples continbe composed of apparently cubic solid solution phasesCexZr(1−x)O2 compositions. The cell parameters follow tsame trend as at lower temperatures, i.e., they decreastematically when Zr replaces Ce in the structure.
The plots of thea parameter versus the nominal compotion (see Fig. 6a–c) follow a linear correlation for Zr conteup to molar 50%. This evidences that Vegard’s law is obein the thermal range 673–1173 K for the cubic solid solutphases and therefore thea parameter can be considered ameasure of the composition of a fluorite like solid solutphase.
3.4. RD–UV–vis spectroscopy
The electronic spectra of the mixed oxides calcinat 873 K are compared in Fig. 7. None of the specevidences ford–d crystal field transitions in the visiblregion according to thed0 configuration of the Zr4+ andCe4+ ions. The spectra for the pure samples, in particthat for pure zirconia, display a very low absorbanin comparison to those for the oxides with intermedicompositions, i.e., the UV absorption capacity of the Cemixed oxides is notably higher than those of pure zirconi
ceria.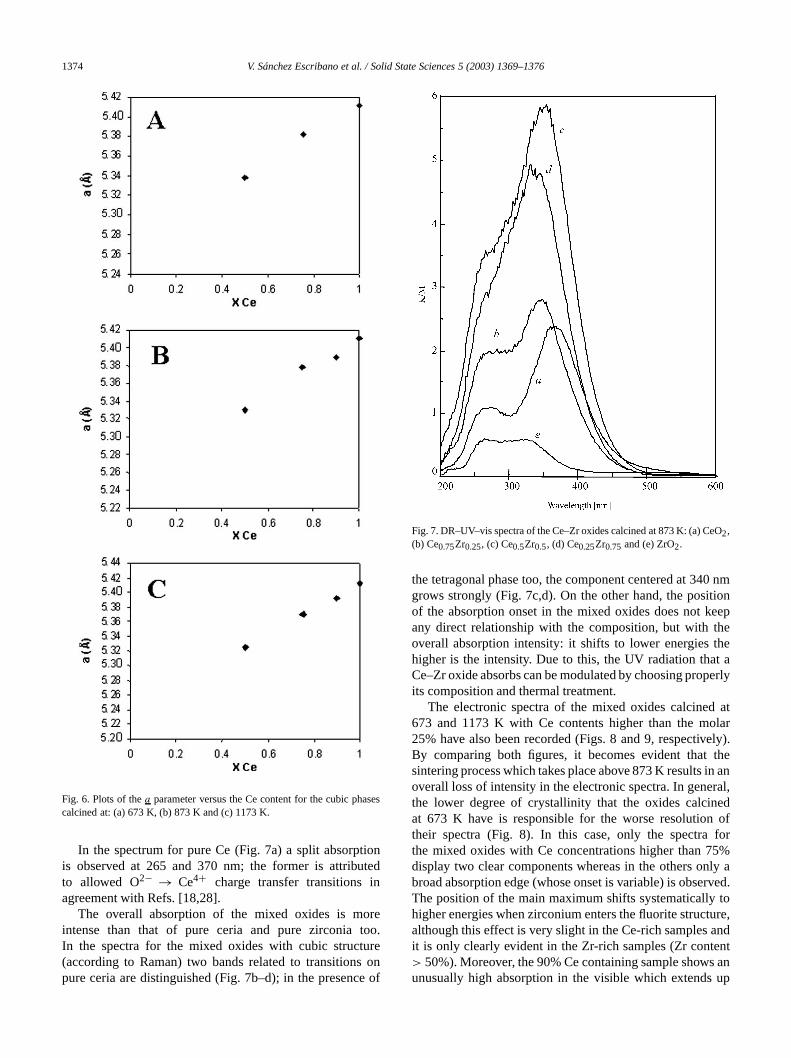
1374 V. Sánchez Escribano et al. / Solid State Sciences 5 (2003) 1369–1376
ses
ionted
in
retoo.ure
on
O
0 nmtioneephethet aerly
atlarely).thein anral,edof
for5%ly arved.to
ure,andnt
s an
Fig. 6. Plots of thea parameter versus the Ce content for the cubic phacalcined at: (a) 673 K, (b) 873 K and (c) 1173 K.
In the spectrum for pure Ce (Fig. 7a) a split absorptis observed at 265 and 370 nm; the former is attributo allowed O2− → Ce4+ charge transfer transitionsagreement with Refs. [18,28].
The overall absorption of the mixed oxides is mointense than that of pure ceria and pure zirconiaIn the spectra for the mixed oxides with cubic struct(according to Raman) two bands related to transitions
pure ceria are distinguished (Fig. 7b–d); in the presence ofFig. 7. DR–UV–vis spectra of the Ce–Zr oxides calcined at 873 K: (a) Ce2,(b) Ce0.75Zr0.25, (c) Ce0.5Zr0.5, (d) Ce0.25Zr0.75 and (e) ZrO2.
the tetragonal phase too, the component centered at 34grows strongly (Fig. 7c,d). On the other hand, the posiof the absorption onset in the mixed oxides does not kany direct relationship with the composition, but with toverall absorption intensity: it shifts to lower energieshigher is the intensity. Due to this, the UV radiation thaCe–Zr oxide absorbs can be modulated by choosing propits composition and thermal treatment.
The electronic spectra of the mixed oxides calcined673 and 1173 K with Ce contents higher than the mo25% have also been recorded (Figs. 8 and 9, respectivBy comparing both figures, it becomes evident thatsintering process which takes place above 873 K resultsoverall loss of intensity in the electronic spectra. In genethe lower degree of crystallinity that the oxides calcinat 673 K have is responsible for the worse resolutiontheir spectra (Fig. 8). In this case, only the spectrathe mixed oxides with Ce concentrations higher than 7display two clear components whereas in the others onbroad absorption edge (whose onset is variable) is obseThe position of the main maximum shifts systematicallyhigher energies when zirconium enters the fluorite structalthough this effect is very slight in the Ce-rich samplesit is only clearly evident in the Zr-rich samples (Zr conte> 50%). Moreover, the 90% Ce containing sample show
unusually high absorption in the visible which extends up
V. Sánchez Escribano et al. / Solid State Sciences 5 (2003) 1369–1376 1375
(the
areullybe
3 Kentsande
turesn-
itionis-hever,thereatUVctedhifto the
them-
3 K
87350–Dam-maneendis-IRin-heyct-nset25–
thelab-ELla y
Fig. 8. DR–UV–vis spectra of the cubic Ce–Zr oxides calcined at 673 Kcompositions are indicated in the figure).
to 600 nm. The Ce–Zr mixed oxides calcined at 673 Kthe most effective UV absorbers and by choosing carefthe composition all the radiation below 425–450 nm caneliminated.
Conversely, the spectra for the oxides calcined at 117(Fig. 9) display a well resolved aspect and two componcan be distinguished for Ce contents higher than 75%only one below that limit. The main maximum follows thsame trend that in the systems treated at lower temperai.e., it shifts slightly to higher energies when the Zr cotent increases. However, the spectrum for the composCe0.9Zr0.1 shows a surprisingly intense absorption in the vible region which extends beyond the detection limit. Treasons of this behavior are to be investigated. Moreothe position of the edge onset is slightly higher than foroxides treated at lower temperatures, which allows a gnumber of possibilities in order to use these materials asabsorbers as the radiation that they cut off can be seleprecisely within the 425–475 nm interval. Probably, the sto lower energies of the absorption onset is associated thigher crystal size of the oxides calcined at 1173 K.
4. Conclusions
The co-precipitation method described here allowspreparation of cubic ceria–zirconia mixed oxides with co
positions equal or higher than 25% of ceria on molar bases.,
Fig. 9. DR–UV–vis spectra of the cubic Ce–Zr oxides calcined at 117(the compositions are indicated in the figure).
These materials, when calcined at temperatures ofK, display relatively high surface areas (in the range120 m2 g−1 for the mixed oxides) and low crystal size. XRhardly distinguishes the tetragonal structure for those sples. The cubic structure can be determined better by Raspectroscopy, which allows a very clear distinction betwcubic and tetragonal structure. However, the tetragonaltortion of the mixed oxides can be also followed in thespectra by the shift of the maximum. All mixed oxidescluding pure ceria are strong UV absorbers although talso absorb in the violet visible region. By carefully seleing their composition and treatment temperature, the oof the radiation that they cut off can be chosen in the 4475 nm interval.
Acknowledgements
The authors acknowledge the financial support fromSpanish Ministerio de Ciencia y Tecnología and the coloration of Leonardo Hernández Delgado—SALA DIES(Spain). E.F.L. and M.P. acknowledge Junta de Castil
León (Spain) and University of Genoa (Italy) for FPI grants.
1376 V. Sánchez Escribano et al. / Solid State Sciences 5 (2003) 1369–1376
dia
als,
io,m.
nic
oft,
an,
ns.
0.45
ter.
n,
ita,
ate
ch.
c.,
.M.
aday
01.tal.
G.
ch-
ndley,
8.97)
01)
ato,
References
[1] R. Nielsen, in: B. Elvers, S. Hawkins (Eds.), Ullmann’s Enciclopeof Industrial Chemistry, Vol. A28, 5th ed., 1996, p. 543.
[2] E. Schweda, in: Rare Earth Oxides in Key Engineering MateriVol. 68, 1992, pp. 187–216.
[3] G. Colón, M. Pijolat, F. Valdivieso, H. Vidal, J. Kaspar, E. FinocchM. Daturi, C. Binet, J.C. Lavalley, R.T. Baker, S. Bernal, J. CheSoc., Faraday Trans. 94 (1998) 3717.
[4] W. Buchner, R. Schliebs, G. Winter, K.H. Buchel, Industrial InorgaChemistry, VCH, Weoinheim, 1989, p. 442.
[5] P.A. Lewis, Pigment Handbook, Vol. I, Wiolrey, 1988, p. 67.[6] J.M. Tranquada, S.M. Heald, A.R. Moodenbaugh, G. Liang, M. Cr
Nature 337 (1989) 720.[7] P. Merchant, R.D. Jacowitz, K. Tibbs, R.C. Taber, S.S. Landerm
Appl. Phys. Lett. 60 (1992) 763.[8] N. Buttà, L. Chinquegrani, E. Mugno, A. Tagliente, S. Pizzini, Se
Actuators B 6 (1992) 253.[9] A. Trovarelli, Catal. Rev.—Sci. Eng. 38 (1996) 439.
[10] M.S. Al-Robae, K.N. Rao, S. Mohan, J. Appl. Phys. 71 (1992) 238[11] Z.T. Al-Dhan, C.A. Hogarth, N. Riddleston, Phys. Status Solidi B 1
(1998) 145.[12] T. Masui, T. Yamamoto, H. Sakata, G. Mori, J. Adachi, J. Ma
Chem. 10 (2000) 353.[13] M. Daturi, E. Finocchio, C. Binet, J.C. Lavalley, F. Fally, V. Perricho
J. Phys. Chem. B 103 (1999) 4884.[14] N. Sakai, T. Hashimoto, T. Katsube, K. Yamai, H. Negishi, T. Hor
H. Yokokawa, Y. Ping Xiong, M. Nakagawa, Y. Takahashi, Solid StIonics 143 (2001) 151.
[15] J. Cuif, G. Blanchard, O. Touret, M. Marczi, E. Quémeré, SAE TePap. Ser. 969106, 1996.
[16] M. Pijolat, M. Prin, M. Soustelle, O. Touret, P. Nortier, J. Chem. SoFaraday Trans. 91 (1995) 3491.
[17] E. Fernández López, V. Sánchez Escribano, M. Panizza, MCarnasciali, G. Busca, J. Mater. Chem. 11 (2001) 1891.
[18] A. Bensalem, J.C. Muller, F. Bozon-Verduraz, J. Chem. Soc., FarTrans. 88 (1) (1992) 153.
[19] T. Hirata, E. Asari, M. Kitajima, J. Solid State Chem. 110 (1994) 2[20] E. Finocchio, M. Daturi, C. Binet, J.C. Lavalley, G. Blanchard, Ca
Today 52 (1999) 53.[21] P. Fornasiero, G. Balducci, R. di Monte, J. Kaspar, V. Sergo,
Gubitosa, M. Graziani, J. Catal. 151 (1995) 168.[22] A.J. West, Solid State Chemistry and Its Applications, Wiley, Chi
ester, 1996, p. 174.[23] P. Duwez, F. Odell, J. Am. Ceram. Soc. 33 (9) (1950) 280.[24] W.G. Fateley, F.R. Dollish, N.T. McDevitt, F.F. Bentley, Infrared a
Raman Selection Rules for Molecular and Lattice Vibrations, WiNew York, 1972.
[25] W.H. Weber, K.C. Hass, J.R. McBride, Phys. Rev. B 48 (1993) 17[26] S. Kanakaraju, S. Mohan, A.K. Sood, Thin Solid Films 305 (19
191.[27] S. Wang, W. Wang, J. Zuo, Y. Qian, Mater. Chem. Phys. 68 (20
246.[28] R. Li, S. Yabe, M. Yamashita, S. Momose, S. Yoshida, S. Yin, T. S
Mater. Chem. Phys. 75 (2002) 39.
Copyright © 2022 FDOKUMEN