Characterization of copper complexation with natural dissolved organic matter (DOM)—link to acidic...
19
Water Research 36 (2002) 5083–5101 Characterization of copper complexation with natural dissolved organic matter (DOM)—link to acidic moieties of DOM and competition by Ca and Mg Yuefeng Lu 1 , Herbert E. Allen* Department of Civil and Environmental Engineering, University of Delaware, Newark, DE 19716, USA Received 1 March 2001; accepted 1 May 2002 Abstract We investigated Cu complexation by three dissolved organic matters (DOMs) collected by reverse osmosis (RO). Alkalimetric titration, pH-stat Cu and Ca titrations, pH edges of Cu–DOM complexation, and Ca/Mg–Cu exchange experiments were investigated at I ¼ 10 2 M for DOM samples of 10 mg C/L. The proton and Cu binding characteristics indicated similarity for all three DOMs. All Cu titrations employed ion selective electrode measurement and indicated the presence of relatively small amounts of strong Cu-binding sites. Four distinct classes of Cu binding sites are required for FITEQL 4.0 to provide good fits to the entire curves. The estimated total Cu binding site density is 4.55 mmol/g C, much less than the total acidity but very close to the phenolic site content. Cu–DOM complexation increases approximately 10-fold per pH unit, even at relatively high pH (>8). We suggest that sites characterized as phenolic based on alkalimetric titration, not carboxyl sites, account for the majority of Cu complexation under natural water conditions, and Cu–DOM complexation is principally through the replacement of H + by Cu 2+ at the phenolic binding sites. The Cu–H exchange ratio is 1:1 for the first three sites and about 1:2 for the 4th site. This 4-site model describes well the pH dependency of Cu–DOM complexation and provides good estimates of free Cu concentrations throughout wide total copper (Cu T ) and pH ranges. Comparison between Ca–DOM and Cu–DOM complexation demonstrated that (i) Ca–DOM complexation increases much less than an order of magnitude per pH unit and decreases at higher Ca concentration, different from that of Cu–DOM complexation; and (ii) Cu–DOM complexation is highly non-linear, in contrast to the much reduced extent of non-linearity of Ca–DOM complexation. Ca/Mg–Cu exchange experiments showed small competition effect, less than expected by a simple competition model, and the competition tended to reduce with increasing Ca or Mg concentrations. The extent of the competition by Mg and Ca are essentially comparable. Put all together, it suggests that Ca and Mg are preferably bound by carboxyl sites, especially at relatively high concentrations, resulting in a weakened apparent competition effect. r 2002 Elsevier Science Ltd. All rights reserved. Keywords: Dissolved organic matter (DOM); Complexation; Copper; Ion selective electrode (ISE); Calcium; Magnesium; Competition 1. Introduction In natural waters, complexation by natural dissolved organic matter (DOM) can dominate the speciation of trace metals and thus control the metal toxicity and bioavailability (e.g., [1–5]). Humic substances that constitute the majority of the DOM consist of a mixture of non-identical large molecules bearing various kinds of *Corresponding author. Tel.: +1-302-831-8449; fax: +1- 302-831-3640. E-mail address: [email protected] (H.E. Allen). 1 Present address: Connecticut Agricultural Experiment Sta- tion, Department of Soil and Water, New Haven, CT 06511, USA. 0043-1354/02/$ - see front matter r 2002 Elsevier Science Ltd. All rights reserved. PII:S0043-1354(02)00240-3
Transcript of Characterization of copper complexation with natural dissolved organic matter (DOM)—link to acidic...

Water Research 36 (2002) 5083–5101
Characterization of copper complexation with naturaldissolved organic matter (DOM)—link to acidic moieties of
DOM and competition by Ca and Mg
Yuefeng Lu1, Herbert E. Allen*
Department of Civil and Environmental Engineering, University of Delaware, Newark, DE 19716, USA
Received 1 March 2001; accepted 1 May 2002
Abstract
We investigated Cu complexation by three dissolved organic matters (DOMs) collected by reverse osmosis (RO).
Alkalimetric titration, pH-stat Cu and Ca titrations, pH edges of Cu–DOM complexation, and Ca/Mg–Cu exchange
experiments were investigated at I ¼ 10�2 M for DOM samples of 10mg C/L. The proton and Cu binding
characteristics indicated similarity for all three DOMs. All Cu titrations employed ion selective electrode measurement
and indicated the presence of relatively small amounts of strong Cu-binding sites. Four distinct classes of Cu binding
sites are required for FITEQL 4.0 to provide good fits to the entire curves. The estimated total Cu binding site density is
4.55mmol/g C, much less than the total acidity but very close to the phenolic site content. Cu–DOM complexation
increases approximately 10-fold per pH unit, even at relatively high pH (>8). We suggest that sites characterized as
phenolic based on alkalimetric titration, not carboxyl sites, account for the majority of Cu complexation under natural
water conditions, and Cu–DOM complexation is principally through the replacement of H+ by Cu2+ at the phenolic
binding sites. The Cu–H exchange ratio is 1:1 for the first three sites and about 1:2 for the 4th site. This 4-site model
describes well the pH dependency of Cu–DOM complexation and provides good estimates of free Cu concentrations
throughout wide total copper (CuT) and pH ranges. Comparison between Ca–DOM and Cu–DOM complexation
demonstrated that (i) Ca–DOM complexation increases much less than an order of magnitude per pH unit and
decreases at higher Ca concentration, different from that of Cu–DOM complexation; and (ii) Cu–DOM complexation
is highly non-linear, in contrast to the much reduced extent of non-linearity of Ca–DOM complexation. Ca/Mg–Cu
exchange experiments showed small competition effect, less than expected by a simple competition model, and the
competition tended to reduce with increasing Ca or Mg concentrations. The extent of the competition by Mg and Ca
are essentially comparable. Put all together, it suggests that Ca and Mg are preferably bound by carboxyl sites,
especially at relatively high concentrations, resulting in a weakened apparent competition effect. r 2002 Elsevier
Science Ltd. All rights reserved.
Keywords: Dissolved organic matter (DOM); Complexation; Copper; Ion selective electrode (ISE); Calcium; Magnesium; Competition
1. Introduction
In natural waters, complexation by natural dissolved
organic matter (DOM) can dominate the speciation of
trace metals and thus control the metal toxicity and
bioavailability (e.g., [1–5]). Humic substances that
constitute the majority of the DOM consist of a mixture
of non-identical large molecules bearing various kinds of
*Corresponding author. Tel.: +1-302-831-8449; fax: +1-
302-831-3640.
E-mail address: [email protected] (H.E. Allen).1Present address: Connecticut Agricultural Experiment Sta-
tion, Department of Soil and Water, New Haven, CT 06511,
USA.
0043-1354/02/$ - see front matter r 2002 Elsevier Science Ltd. All rights reserved.
PII: S 0 0 4 3 - 1 3 5 4 ( 0 2 ) 0 0 2 4 0 - 3
complexing functional groups that exhibit in total a wide
range of affinities for metal ions [6]. Two major types of
functional groups are usually indicated as being of the
greatest importance: carboxyl and phenolic groups, for
which the average pKa’s are estimated to be around 4.5
and 10, respectively [7]. The sites characterized as
phenolic can also include other functionalities, for
example, amines and amides.
Numerous investigations have been conducted of
complexation of metal ions by natural organic matter
and a number of model interpretations have been
developed (e.g., [8–11,6,1,12–20]). Most current models
incorporate multi-ligand representation, divided into
two categories: discrete ligand models and continuous
distribution ligand models. However, most models are
curve-fitting exercises; stability constants attained are
dependent on pH, ionic strength and the presence of
competing metal ions, etc. [21,11,22,23], thus lacking
capability of prediction. Recently, Smith and Kramer
[24] have employed fluorescence quenching to define
stability constants and site concentrations for five
domains involved in the binding of Cu to fulvic acid.
Among those models, WHAM [5] based on Humic Ion-
Binding Model V by Tipping and coworkers [14–17]
probably represents the most comprehensive model that
describes proton and metal ions binding by humic
substances. It assumes two major classes of binding sites,
carboxyl and phenolic; however, Model V simply
assumes that metal ion affinities are directly related to
the proton affinities and the possibility that different
metal ions may not have the same heterogeneity was not
considered [25]. Model VI [20] moved forward with two
main advances: (i) the ‘‘parallelism’’ between proton
binding and metal binding affinities were relaxed and (ii)
greater ranges of binding strength was taken into
account (e.g., by allowing tridentate sites).
In addition, natural waters contain a variety of ions
that may compete to a greater or a lesser extent for the
available binding sites. Although the binding affinities of
the major metal ions Ca and Mg are much weaker than
that of Cu [1,26], the effect of Ca and Mg may be an
important aspect to consider when characterizing Cu–
DOM complexation due to the abundance of Ca and
Mg ions in most natural waters. The simplest models to
describe the competition assume simple competition for
the same binding sites. However, lack of extensive
competition effects by Ca and Mg for Cu–DOM
complexation has been reported in several studies
[11,26] Hering and Morel [1]; [25,27,23]. Tipping [15]
applied Model V to fit the competition between alkaline
earth cations and trace metal with literature data, but
found that in some cases, the competition calculated by
Model V was more substantial than the observations.
This might result from the ‘‘fully coupled’’ nature of
metal ion specific binding affinities assumed in the
model.
Despite the variety of studies on Cu complexation
with DOM that have been reported, there is still a need
to conduct comprehensive sets of experiments, including
proton binding, copper binding and competition studies,
etc. for the same DOM, to obtain systematic informa-
tion on complexation characteristics of DOM, and
therefore evaluate and refine the existing models. There
exists discrepancies regarding how to relate metal–DOM
complexation behavior with acidic moieties of DOMs
and which types of functional groups play most
important roles in Cu complexation in natural waters.
The Cu binding sites are usually much less than the total
proton association sites [28], resulting in difficulties to
model Cu–DOM complexation based on proton binding
characteristics [29].
The present study systematically characterized the
acid–base, Cu complexation, Ca complexation and Ca/
Mg–Cu competition characteristics of DOMs collected
from three sources. The study is an extension of previous
studies conducted by group (e.g., [30]), and emphasized
(I) linking Cu–DOM complexation characteristics with
the acidic characteristics of DOMs, and (II) evaluating
whether DOMs from different origins are of significant
difference with respect to acidic and Cu complexation
properties. The effect of the presence of major metal
ions on Cu–DOM complexation was evaluated by
quantitatively analyzing Cu–DOM complexation, Ca–
DOM complexation and the displacement of Cu ions by
Ca/Mg all together. The Ca/Mg–Cu exchange experi-
ments were carried out by measuring the displacement of
Cu ions by the addition of Ca or Mg ions to DOM
solutions pre-equilibrated with Cu ions, which is
different from the methods employed in most studies
[11,1], in which Cu titrations at different fixed Ca or Mg
backgrounds were compared. The advantage of this
method is the obtaining of more systematic information
for modeling competition.
2. Experimental
2.1. Isolation, treatment and basic characterization of
DOM
DOMs were isolated from 0.45 mm filtered natural
waters employing a portable reverse osmosis (RO)
system (Model PROS/2S, RealSoft, Norcross, GA)
[31,32]. Three DOMs were collected from the Suwannee
River, GA, Drummond Lake in the Great Dismal
Swamp, VA, and the Newport River, NC (referred to
GA-DOM, VA-DOM and NC-DOM). Further details
of the collection and characterization are presented in
Ma et al. [30]. The concentrated DOM samples were
passed through a H+-saturated cation-exchange resin
(Dowex 50WX8, Fluka Chemical Co, Milwaukee, WI)
column to remove both trace metals and major cations.
Y. Lu, H.E. Allen / Water Research 36 (2002) 5083–51015084

To avoid losing humic acid (HA) on the resin due to the
strongly acidic condition, HA was separated in advance
by acidic precipitation (pHE1) and was later recom-
bined with the material that passed through the cation-
exchange column. Concentrations of metal ions were
determined by ICPOES (Spectro Analytical Instru-
ments, Kleve, Germany). Dissolved organic carbon
(DOC) was determined using a Tekmar-Dohrmann
DC-190 TOC analyzer (Rosemount Analytical Inc.,
Dohrmann Division, Cincinnati, OH). DOMs were also
analytically fractionated to quantify the fractions of
humic acids (HA), fulvic acids (FA) and hydrophilic
fraction (HyI) by an acidic precipitation�XAD-8 resin
sorption method [33]. Basic characterizations of the
three DOMs are shown in Table 1.
2.2. Titration
The Cu–DOM complexation reactions were investi-
gated by titration employing a cupric ion selective
electrode (Cu-ISE, Model 94-29, Orion Research,
Boston, MA) to measure free Cu2+ concentrations.
pH was determined by a PerpHect Rose Sure-Flow
combination electrode (Model 8272BN, Orion Re-
search, Boston, MA). In all titrations, the reactor was
thermostated at 2570.11C. The DOM solution was
purged with N2 (Grade 5.0) before and during the
titration period to eliminate the interference of carbo-
nate. Ca titrations followed analogous procedures and
free Ca2+ was detected by a Ca-ISE (Model 9320BN,
Orion Research, Boston, MA). The total Cu back-
ground in diluted DOM samples (usually DOC=10mg/
L) was lower than 10�8M and the Ca and Mg
backgrounds were much lower than 10�6M (see Table
1).
The Cu-ISE was calibrated with a Cu-ethylenedia-
mine (EN) buffer method [34] in the same ionic strength
electrolyte solution (NaNO3) immediately preceding
each sample titration. The Nernstian response was
maintained at [Cu2+] as low as 10�17M and multiple
calibrations showed stable slopes, 29.070.5mV/pCu.
The performance of the Cu-ISE was also tested by a Cu
titration of a 10�4M EN solution following the same
procedures as for DOM samples. The measured titration
curve was consistent with the calculated curve by
MINEQL+ throughout the total Cu range 10�7–
5� 10�5M (figure not shown), indicating the Cu-ISE
is a reliable technique for free Cu2+ measurements. No
‘‘memory effect’’ was found for the Cu-ISE working
with either EN buffer or DOM samples.
2.2.1. Alkalimetric titrations of DOM
An aliquot of 100ml of concentrated DOM sample
was acidified with HNO3 to bring the pH to around 2.5.
The acidified sample was then titrated by addition of
0.1M carbonate-free NaOH automatically in increments
of 0.010–0.050mL, until the pH increased to 11. For
most titrations about 60–70 additions were made and 2–
5min between additions were allowed for reaction. The
pH usually became stable (o0.01 pH unit/2min) in less
than 2min. It is necessary to carry out the titration
rapidly to limit the possibility of errors arising from
base-catalyzed side reactions [35,7].
2.2.2. pH-stat Cu titrations of DOM
pH-stat Cu titrations were performed at pH 6.0, 7.0
and 8.0 to encompass the typical pH range in natural
freshwaters. The DOM samples were prepared by
dilution of the concentrated DOM with DI-water and
ionic strength was adjusted to 10�2M with NaNO3.
DOC of most of the diluted samples was 10mg/L. A 50
or 100mL portion of the DOM sample was transferred
into the acid pre-cleaned cell and titrated with
5� 10�4M and 10�2M Cu(NO3)2, CuT ranging from
10�7M up to 2� 10�4M. The titrant was added every
5–30min, which resulted in stable potential readings
(o0.5mV/5min). The pH was kept constant (70.02
pH) by addition of 0.1M HNO3 and NaOH as
necessary. An alternative way to control pH is utilizing
‘‘Better’’ buffers, which are claimed not to complex
metal ions [36]. Two ‘‘Better’’ buffers, MES (for pH 5.5–
6.5) and MOPS (for pH 6.5–7.5), have been tested for
Table 1
Characterization of DOM samples after removal of metal ions by cation-exchange
DOC (mg/L) Metal ions Ionic strength (M)a Fractions of DOC (%)b
Cu2+ Ca2+ Mg2+ Na+ K+ HA FA Hydrophilic
(mg/L) (mg/L)
GA-DOM 1046716.3 10.2 6.6 0 1500 1.17 0.065 5.1 83.5 11.4
VA-DOM 775.978.2 14.4 292 170 3370 3.50 0.147 9.8 73.2 17.0
NC-DOM 905.1711.5 15.9 484 231 3680 2.12 0.16 20.4 65.3 14.3
a Ionic strength was estimated from the cation and anion concentrations.bThe fractions were estimated by an analytical fractionation method of XAD-8 sorption combined with acid precipitation [33]. The
percentages of the fractions are based on OC content.
Y. Lu, H.E. Allen / Water Research 36 (2002) 5083–5101 5085

their applicability in metal–DOM systems. The Cu
titration curves with and without the buffers overlap
each other in the entire Cu concentration range,
indicating that no observable Cu complexation by the
buffers was found.
2.2.3. pH edges of Cu–DOM complexation
pH edges of Cu binding were performed following the
same procedure as the potentiometric titrations except
that (1) a known concentration of Cu2+ was added
before the titration and (2) diluted DOM was used
(DOC=10mg/L). Both pH and free Cu2+ were
monitored. The titrations were conducted at three
constant CuT (1� 10�6, 3� 10�6, and 9� 10�6M).
2.2.4. pH-stat Ca titrations of DOM
The Ca–DOM complexation was investigated by
titration of GA-DOM with CaCl2 solution at pH 6, 7
and 8 as were the titrations employing Cu as titrant. The
ionic strength was adjusted to 10�2M by addition of
4M KCl. Practically, the Ca-ISE method has a
Nernstian response limit around 10�6M. Therefore,
the Ca titrations were conducted in the CaT range from
4� 10�6 to 1� 10�4M.
2.2.5. Ca or Mg–Cu exchange on DOM binding sites
Competition of Ca and Mg with Cu at reactive
functional groups of DOM was investigated by a Ca or
Mg–Cu exchange method, that is, examining the change
of free Cu2+ concentration resulting from incremental
addition of Ca2+ or Mg2+ to the DOM solution
(DOC=10mg/L, ionic strength=10�2M) that has been
pre-equilibrated with fixed concentration of added Cu.
After pH adjustment (6.0 or 7.0), and the addition of Cu
([Cu]T=2� 10�6 or 5� 10�6M), the DOM sample was
equilibrated for approximately 1 h and then titrated with
incremental addition of Ca2+ or Mg2+ from 10�6 to
10�3M. Free Cu2+ concentration was monitored by the
Cu-ISE and the amount of Cu displaced from DOM by
each of the cations was thus determined.
2.3. Discrete-site model fitting
Alkalimetric, Cu and Ca titration curves were fitted
with multiple discrete-site model with FITEQL 4.0,
which permits the site densities ðLT;iÞ and conditional
stability constants to be obtained simultaneously.
3. Results and discussion
3.1. Proton binding of DOM—alkalimetric titrations
Fig. 1(a) shows that the shapes of the alkalimetric
titration curves for the three DOMs are similar and the
acid neutralizing capacities (ANC) are approximately
proportional to their DOC levels, implying a similar
distribution of proton binding groups exists for the three
DOMs. It is believed that their acidity is primarily due
to the presence of carboxyl and phenolic functional
groups. Perdue [7] found that the frequency of the
carboxyl groups is approximately a Gaussian distribu-
tion with a mean pKa of about 4.5, and pKa values of
99% of the carboxyl groups fall in the range of 1–8; the
2
4
6
8
10
12
pH
0
5
10
15
20
25
30
35
2 8pH
0.0 0.5 1.0 1.5 2.0
Volume of 1N NaOH, ml
∆pH
/ ∆m
l
4 6 10 12(a) (b)
Fig. 1. Titration of 100mL aliquots of GA-DOM (1046mg DOC/L), NC-DOM (776mg DOC/L), VA-DOM (905mg DOC/L). (a)
Alkalimetric titration curves showing lines fitted by a 4-site model with constants determined using FITEQL 4.0. (b) Differential plots
of alkalimetric titrations. The endpoint of carboxyl groups was determined [37] to be pH=8.0. I ¼ 10�2M; T ¼ 251C. J GA-DOM;
& VA-DOM; } NC-DOM.
Y. Lu, H.E. Allen / Water Research 36 (2002) 5083–51015086

phenolic groups are similarly distributed around a mean
pKa of about 10, and the pKa values of 98% of the
phenolic carboxyl groups fall in the range of 7–13. The
transformed differential plots in Fig. 1(b) show that the
maximum DpH/DmL values, which may represent the
endpoint of carboxyl groups, occurred sharply at
pHB8.0 for all the three DOMs, in agreement with
Thurman [37] and Perdue [7]. The proton binding site
densities of carboxyl and phenolic groups were esti-
mated by the calculation of ANC (Table 2). pH 8.0 was
designated as the endpoint of carboxyl groups, and
phenolic content was estimated as twice the base
consumption by DOM between pH 8.0 and 10.0 [35,7].
Our estimation for carboxyl and phenolic contents are
about 93% and 86%, respectively, of their total contents
based on the pKa distributions described by Perdue [7].
Here, we have termed them ‘‘carboxyl’’ and ‘‘phenolic’’
groups, but they do not necessarily represent actual
entities. The operational nature of such functional group
methodology should not be confused with the represen-
tation of reality. All three DOM have similar acidic
groups content and carboxyl/phenolic ratios: the aver-
age total, carboxyl and phenolic groups are 13.5970.45,
9.5070.63 and 4.0970.19mmol/g C, respectively
(equivalent to 6.80, 4.75 and 2.05mmol/g OM, if
assuming C comprises 50% of DOM, which is usually
valid); carboxyl and phenolic groups comprise about
70% and 30% of total acidic sites, respectively.
Leenheer et al. [38] reported carboxylic site densities
between 4.15 and 6.8mmol/g of Suwannee River fulvic
acid; whereas, Smith and Kramer [39] reported
6.0mmol/g for the same fulvic acid. Our study’s
carboxyl site density of 4.75mmol/g OM falls in the
same range.
3.1.1. Proton binding site densities and pKa: discrete-site
model fits with FITEQL
Fitting with monoprotic discrete-site models by
FITEQL 4.0 indicated that at least 3 sites were required
to fit the curves well, and a 4-site model gave a better fit.
The fitted curves by the 4-site model are compared with
the measurements in Fig. 1(a). LT;i and pKa;i distribu-
tions obtained by the 4-site model are shown in Fig. 2
and demonstrate that the proton binding sites and pKa
Table 2
Estimated contents of carboxyl and phenolic groups by the ANC method
Carboxylic
(mmol/g C)
Phenolic (mmol/g C) Total acidic
groups (mmol/C)
Fraction of
carboxylic
groups
Fraction of
phenolic groups
GA-DOM 9.37 4.21 13.58 0.69 0.31
VA-DOM 10.18 3.87 14.05 0.72 0.28
NC-DOM 8.95 4.20 13.15 0.68 0.32
Avg.7SD 9.5070.63 4.0970.19 13.5970.45 0.7070.02 0.3070.02
0
1
2
3
4
5
6
7
8
0
1
2
3
4
5
6
7
8
0
1
2
3
4
5
6
7
8
0 2 8
GA-DOM
Site
Den
sity
, mol
/kg
CSi
te D
ensi
ty, m
ol/k
g C VA-DOM
Site
Den
sity
, mol
/kg
C NC-DOM
4 6 141210
pKa
pKa
pKa
0 2 84 6 141210
0 2 84 6 141210(a)
(b)
(c)
Fig. 2. pKa spectra of proton binding sites determined by
FITEQL 4.0 with a monoprotic discrete 4-site model for the
titration of (a) GA-DOM, (b) VA-DOM and (c) NC-DOM
samples shown in Fig. 1.
Y. Lu, H.E. Allen / Water Research 36 (2002) 5083–5101 5087

distributions for the three DOMs are analogous.
Average total acidic site densities obtained by 3-site
and 4-site models are 12.21 and 12.54mmol/g C,
respectively, slightly smaller than the ANC estimates.
For the 4-site model, pKa peaks are divided into 4
groups corresponding to pKa of 3.3, 4.8, 6.8 and 9.6,
compared with Smith and Kramer [39] using DISI
technique, in which the acidity constants were grouped
into four classes: strong ðpKao5Þ; intermediate strong
ð5:1opKao7:5Þ; intermediate weak ð7:6opKao9:2Þ;and weak ðpKa > 9:3Þ: According to Perdue [7] of the
pKa values for model organic ligands in NOM, the first
two classes of acidic groups (pKa 3.3 and 4.8) should be
categorized as carboxyl with total site densities of
8.17mmol/g C; the weakest acidic sites can be approxi-
mately considered as phenolic groups and are around
2.8mmol/g C, a little less than that obtained by ANC
estimation. This is primarily due to the fact that the
titration curves terminated at pH around 11, resulting in
underestimation of the weakest acidic groups.
3.2. Cu complexation by DOM
3.2.1. pH-stat Cu titration of DOM
The pH-stat Cu titration curves of DOMs at pH 6.0,
7.0 and 8.0 are shown in Fig. 3. The comparison of the
Cu binding by DOMs from different sources at pH 7.0
(Fig. 4) indicates the similarity of Cu binding affinities
among the three DOMs although minor deviations exist,
and all titration curves show the presence of relatively
small amounts of very strong Cu-binding sites evidenced
by the deviation from the prediction by WHAM Model
V. Such strong binding was accompanied by a slow
approaching to equilibrium observed at very low Cu
loading. The similarity of Cu binding we found
here provides the possibility to predict Cu–DOM
GA-DOM
[Cu2+
] = [Cu]T
VA-DOM
[Cu2+
] = [Cu]T
10−7
10−6 10
−5 10−4
10−3
[Cu]T, M
10−7
10−6 10
−5 10−4
10−3
[Cu]T, M
10−7
10−6 10
−5 10−4
10−3
[Cu]T, M
10−15
10−13
10−11
10−9
10−7
10−5
[Cu2+
], M
[Cu2+
] = [Cu]T
NC-DOM
10−15
10−13
10−11
10−9
10−7
10−5
[Cu2+
], M
10−15
10−13
10−11
10−9
10−7
10−5
[Cu2+
], M
(a) (b)
(c)
Fig. 3. Comparison of the 4-site model (Eq. (4)) predictions with the pH-stat Cu titration curves for (a) GA-DOM, (b) VA-DOM, and
(c) NC-DOM. DOC=10mg/L; I ¼ 10�2 M; T ¼ 251C. Points are experimental data and lines are model predictions. Dashed line is
[Cu2+]=[Cu]T. J pH=6; & pH=7; } pH=8.
Y. Lu, H.E. Allen / Water Research 36 (2002) 5083–51015088

complexation behavior and speciation for different
natural waters. On the other hand, the binding affinities
are of slight difference among three DOMs following the
sequence GA-DOMoVA-DOMoNC-DOM, which
may be explained by the differences in humic to fulvic
ratios (HA/FA) among these DOMs (GA-DOMoVA-
DOMoNC-DOM, refer to Table 1), as it is believed
that humic acid has stronger Cu binding affinity than
fulvic acid [16].
Cu bound by DOM (mol Cu/kg C) was calculated by
subtracting inorganic complexes (mainly hydroxide
complexes) from CuT and plotted vs. [Cu2+] in Fig. 5.
The Cu complexation is strongly enhanced by increasing
pH. For all three DOMs, plots of pCu vs. logCuL
(figures not shown) superimposed fairly at different pHs
except at the very low end representing the small amount
of strongest sites, implying an overall pH dependence of
approximate 1. In addition to the Cu titrations at 10mg/
L DOC, a Cu titration was also conducted at 100mg/L
DOC to examine if the Cu binding site densities are
DOM concentration dependent. The overlap of the
normalized CuL (mol Cu/kg OC) vs. [Cu2+] plots at
different DOCs (Fig. 5) indicated DOM binding site
densities are independent of DOC, which is in agreement
with Cabaniss and Shuman [11].
3.2.2. pH edges of Cu–DOM complexation
Consistent with the 1:1 pH dependence observed in
pH-stat Cu titrations, Fig. 6 shows that, for all three
CuT, logCu2+ can be roughly described by a linear
relationship with pH with a downward slope of 1 when
pH>6, where the complexation by DOM is dominant.
This observed 1:1 pH dependence does not agree with
10−7
10−6
10−5 10
−4 10−3
[Cu]T, M
[Cu2+
] = [Cu]T
10−15
10−13
10−11
10−9
10−7
10−5
[Cu2+
], M
GA-DOM
VA-DOM
NC-DOM
Fig. 4. Comparison of Cu titration curves for DOMs from
different sources at pH 7.0. Points are experimental values and
lines are predictions using WHAM Model V. DOC=10mg/L;
I ¼ 10�2 M; T ¼ 251C.
10−13
10−11 10
−910
−710
−5
[Cu2+
], M
10−3
10−2
10−1
100
101
Cu
boun
d, m
ol/k
g O
C
Fig. 5. Effect of DOM concentration on Cu complexation of
GA-DOM at pH 7.0. DOC=10mg/L; I ¼ 10�2 M; T ¼ 251C.
J DOC=10mg/L, without Better buffer; & 10mg/L, with
Better buffer; } 100mg/L, without Better buffer.
3 5 7 9
pH
4 6 8 1010−12
10−11
10−10
10−9
10−8
10−7
10−6
10−5
10−4
[Cu2+
], M
Fig. 6. Comparison of the 4-site model (Eq. (4)) predictions
with the experimental pH edge curves at different CuT for GA-
DOM. DOC=10mg/L; I ¼ 10�2 M; T ¼ 251C. Points are
experimental data and lines are model predictions. J
[Cu]T=1� 10�6M; & [Cu]T=3� 10�6M; }[Cu]T=9� 10�6M.
Y. Lu, H.E. Allen / Water Research 36 (2002) 5083–5101 5089

Cabaniss and Shuman [11], who modeled Cu–DOM
complexation as Cu binding to a mixture of zero- and
1st-order sites at lower pH and a mixture of 1st- and
2nd-order sites at higher pH. When pH is low, the lines
bend downward and free Cu2+ concentration ap-
proaches CuT, as protons tend to compete for the
DOM binding sites. For the lowest CuT of the three,
1� 10�6M, the linear relationship occurs even at pH as
low as 4. Dissociation kinetics were also examined by
instantly lowering the pH back to 4 after a forward
titration of a sample containing CuT 3� 10�6M. Free
Cu2+ increased sharply in the first few minutes, and then
the increase became much slower with time (figure not
shown). Even after 1 h, the [Cu2+] was stillo40% of the
[Cu2+] initially equilibrated at the same pH (4.0) at the
beginning of the titration. The very slow kinetics of
Cu2+ dissociation from DOM sites through H+
exchange suggests that a substantial portion of Cu2+
is complexed by very strong binding sites that have slow
dissociation kinetics. Our observation is consistent with
Rate and McLaren [40] on Cu-humic acid dissociation
kinetics that indicated substantial portions of slowly
dissociated Cu (CuS) and non-dissociated Cu (CuN)
under various conditions.
3.2.3. Multi-site model fitting of Cu–DOM complexation
by FITEQL 4.0
Our fitting indicated that four classes of Cu binding
sites are required to fit well the whole curves, especially,
to cover the lowest Cu concentration end that represents
the strong binding affinity zone. The obtained site
densities ðLT;iÞ and conditional stability constants ðKcCuLÞ
for the 4-site model are listed in Table 3. The total
ligands are categorized into distinctive classes from
larger amounts of weaker Cu binding sites to smaller
amounts of stronger sites. The conditional stability
constants for the 4th site—the strongest site obtained by
the present study are high, from 1011.5 to 1013.5 at pH 8.
This confirms Xue and Sigg’s finding [42] by ligand
exchange—DPCSV technique. Such strong Cu binding
sites have been suggested by some researchers to be
contributed by nitrogen and sulfur containing sites in
DOM [43,44,28]. Although the estimated LT’s are
slightly different from curve to curve, the site distribu-
tions demonstrated similarity for all the titrations
among all three DOMs. The total site densities estimated
by the 3-site and the 4-site models are 4.1671.17 and
4.5670.91mmol/g C, respectively. The average ratios of
Li;T=LT are 0.772:0.186:0.042 by the 3-site model and
0.742:0.198:0.060:0.020 by the 4-site model, which are
very close to each other except for the very small amount
of the strongest site that accounts for 2% of LT included
in the 4-site model. The similarity made the normal-
ization of Cu binding sites for all the DOMs possible.
The heterogeneity of DOM ligands precludes a definitive
determination of the binding properties of the ligands.
3.2.4. Discussion of pH dependence—carboxyl or
phenolic?
The complexation by DOM can be modeled by
discrete-site model, as demonstrated in Eq. (1), based
on the following assumptions: (1) the formation of Cu–
DOM complexation is only through free Cu2+, and
hydrolyzed Cu is not considered to be complexed by
DOM binding sites; (2) Cu2+ ions compete with H+ for
binding sites, and monoprotic sites are usually assumed
but polyprotic sites may apply in some cases; (3) only 1:1
binding stoichiometry (CuL) is considered.
CuL ¼XN
i¼1
CuLi ¼XN
i¼1
LT;iKCuLi½Cu2þ�
1þ KH;i½Hþ� þ KCuLi½Cu2þ�
¼XN
i¼1
LT;iKCuHLi½Cu2þ�
1=KH;i þ ½Hþ� þ KCuHLi½Cu2þ�
; ð1Þ
KH;i ¼½HLi�
½Hþ�½L�i �; KCuLi
¼½CuLi�
½Cu2þ�½L�i �
and
KCuHLi¼
½CuLi�½Hþ�
½Cu2þ�½HLi�¼
KCuLi
KH;i;
where LT;i (mol/L) is the total site density of the ith site,
CuLi (mol/L) is Cu bound by the ith DOM binding site,
N is the number of types of sites. The denominator of
the equation represents the total site densities, and the
three terms of the denominator represent deprotonated
sites (L�), protonated sites (HLi), and Cu bound sites
(CuLi), respectively.
Due to the complicated characteristics of DOM,
typically conditional stability constants are employed
to quantify metal complexation with DOM. In our
study, most of environmental variables such as ionic
strength, temperature were constant and other metal
ions have been removed, the conditional stability
constants can be considered to be mainly functions of
pH, which is assumed to be due to the competition of Cu
and protons for the binding sites. One can express the
conditional stability constants at a fixed pH as follows:
Cu2þ þ Li ¼ CuLi; KcCuLi
¼½CuLi�
½Cu2þ�½Li�; ð2Þ
where KcCuLi
is the conditional stability constant, Li is
the apparent free binding site (unoccupied by Cu2+) and
may be protonated or deprotonated (Li ¼ L�i þHLi).
Therefore, the following relationship can be derived:
KcCuLi
¼KCuLi
1þ KH;i½Hþ�¼
KCuHLi
1=KH;i þ ½Hþ�: ð3Þ
When pH > log KH; the protonated [HLi]{ deproto-
nated ½L�i �; so that Cu complexation is independent of
pH: KcCuLi
¼ KCuLi¼ KH;iKCuHLi
¼ constant; when
pHologKH; deprotonated [L�]{protonated [HLi], so
that KcCuLi
¼ KCuLi=KH;i½Hþ� ¼ KCuHLi
=½Hþ�; and in this
Y. Lu, H.E. Allen / Water Research 36 (2002) 5083–51015090

Table3
Conditionalstabilityconstantsandsitedensities
ofCu–DOM
complexationobtained
bythe4-sitemodelfitwithFITEQL4.0(D
OC=10mg/L;
I¼10�2M;
T¼251C)
Sample
pH
No.of
data
Upper
range(M
)log
K1
log
K2
log
K3
log
K4
L1;T
L2;T
L3;T
L4;T
WSOS/
DFa
LT
Ratioof
Li;T=L
T
CuT
Cu2+
(mmol/gC)
(mmol/gC)
12
34
GA-D
OM
7.0
18
3.9E-05
3.6E-06
5.373
6.916
8.388
10.440
4.556
1.021
0.320
0.090
0.00367
5.897
0.773
0.173
0.054
0.015
7.0
buffer
19
2.9E-05
2.85E-06
5.530
6.921
8.483
10.579
2.871
0.932
0.251
0.054
0.00078
4.054
0.708
0.223
0.062
0.013
8.0
17
2.3E-05
9.88E-08
6.865
8.330
9.609
12.049
3.432
0.598
0.253
0.069
0.00139
4.283
0.801
0.140
0.059
0.016
VA-D
OM
6.0
19
7E-05
3.23E-05
4.616
6.058
7.527
9.470
3.708
1.226
0.384
0.098
0.00464
5.318
0.697
0.231
0.072
0.018
7.0
18
3.8E-05
3.96E-06
5.487
7.039
8.687
11.507
3.682
1.055
0.312
0.084
0.00612
5.049
0.729
0.209
0.062
0.017
8.0
17
2.3E-05
1.02E-07
6.946
8.572
10.069
12.975
3.197
0.562
0.184
0.083
0.00274
3.943
0.811
0.142
0.047
0.021
NC-D
OM
6.0
18
3.5E-05
5.97E-06
5.130
6.604
8.067
9.891
3.203
1.072
0.332
0.080
0.00208
4.607
0.695
0.233
0.072
0.017
7.0
21
3.9E-05
2.18E-06
5.803
7.331
8.938
11.637
3.486
1.225
0.369
0.096
0.00974
5.080
0.686
0.241
0.073
0.019
8.0
15
2E-05
1.93E-08
7.850
9.420
11.113
13.197
2.181
0.522
0.101
0.109
0.00086
2.804
0.778
0.186
0.036
0.039
Avg.
3.368
0.913
0.278
0.085
4.559
0.742
0.198
0.060
0.020
SD
0.648
0.28
0.0916
0.016
0.913
0.049
0.040
0.013
0.008
RelativeSD
(%)
19.2
30.7
32.9
19.2
20.0
6.59
19.9
21.0
38.7
aWSOS/D
Fisanindicatorofgoodnessoffit.Usuallyvalues
between0.1and20are
commonforareasonablygoodfit[41].
Y. Lu, H.E. Allen / Water Research 36 (2002) 5083–5101 5091

case log KcCuL is linearly pH dependent with a slope of
�1. As has been discussed earlier for pH-stat titrations
and pH edge data, Cu–DOM complexation is roughly
1:1 pH dependent (log [Cu2+] vs. pH), and the binding
still increases at the highest pH measured (pH 9).
Therefore, the majority of the Cu binding sites should
still be protonated so there has to be an average log KH
greater than 9. It is well known that phenolic sites have
an average log KH around 10–10.5, whereas, carboxyl
sites have an average log KH around 3.5–4.5 [7,37]. At
the pH of most natural waters, most carboxyl groups are
dissociated. If carboxyl sites are responsible for the
majority of Cu binding, such pH dependency should not
be observed. Based on the above analysis, we suggest
that phenolic sites account for the majority of Cu
complexation throughout the pH range of interest (pH
5–9) except at very high Cu concentrations, whereas Cu
bound by carboxyl groups, which have much weaker Cu
binding affinities, is small compared with phenolic
groups. In this case, the Cu complexation is mainly
through Cu–H exchange at the phenolic sites. This
should be valid under typical natural water conditions
(low Cu concentration and not too low pH) without
losing accuracy significantly. For example, even at CuTas high as 10�5M, >99% of Cu was bound by DOM
sites at pH 7 (refer to Fig. 4). Carboxyl sites are not
expected to be so strong. In addition, the slow
dissociation kinetics described earlier is usually asso-
ciated with strong binding sites, but the dissociation
from carboxyl sites should be very fast.
The hypothesis is supported by Hansen et al. [45] that
protons released per Cu bound was close to 1 for three
lagoon samples at pH 6 and 7. Our finding is also in
good agreement with Benedetti and coworkers’ NICA
model studies [10,19,25], which indicated that (i) the
contribution of phenolic sites to Cu binding is sub-
stantial over the whole pH and Cu concentration range
except at very high Cu concentrations (pCu2+o6) and
low pH, (ii) phenolic sites still dominate at lower pH if
the free Cu concentration is low, and (iii) based on the
model fitting to data for H, Ca, Cd, Cu and Pb binding
by a peat humic acid, with the exception of Ca, the
binding constants for those metal ions are considerably
greater for the phenolic sites than for the carboxylic
sites. It was indicated by some researchers [46,26] that
metal ions are bound by simultaneous action of acidic
carboxyl groups and phenolic hydroxyl groups.
Although it is possible that trace metals may be bound
to some of the carboxyl groups having a favorable steric
location (e.g., forming a chelate by a carboxyl site
associated with an adjacent phenolic site [37]), this kind
of reaction will not be distinguished by the model
formulation described here.
It is not possible to model Cu–DOM complexation by
directly relating Cu binding sites with total proton
association sites, due to the fact that fitted Cu binding
site densities are usually much less than the H site
densities [28]. We found that the estimated LT for Cu
binding is 4.16 (the 3-site model) or 4.55mmol/g C (the
4-site model), much less than the average total acidic
sites 12.5mmol/g C but are very close to the average
phenolic-site density, 4.1mmol/g C. This fact appears
consistent with our argument that phenolic-sites account
for the majority of Cu complexation. If true, it will
considerably simplify modeling without much loss of
accuracy. Based on this hypothesis, we performed
normalized fits by assigning LT of 4.5mmol/g C
(phenolic-sites only) and the site distribution of
0.75:0.20:0.05:0.02 for the four classes of sites. Plots of
log Kci vs. pH for the three DOMs in Fig. 7 indicate that
log Kci is linearly pH dependent with slopes of close to 1
(0.83–1.25) for K1; K2 and K3; and much greater (1.26–
1.87) for K4: This verifies the 1:1 Cu–H exchange
stoichiometry for the ith site (i ¼ 1; 2 and 3); however,
the 4th site (strongest site) needs to be described by a
stoichiometry other than 1:1 for a better fit. In the
present study we chose 1:2. Cu–H exchange constants
(KCuHLi) were then calculated (Table 4), with the
somewhat arbitrary assumption that pKa of the Cu
binding site is around 10 so that deprotonated sites are
negligible ðL�i {HLi þ CuLiÞ: The KCuHLi
values at each
pH (6, 7, or 8) for the different DOMs agree well. The
minor differences existing among the DOMs might
reflect the effect of HA% of DOMs.
Therefore, a 4-site discrete model can be established in
this study to describe Cu–DOM complexation. In this,
four classes of Cu binding sites are distinguished, with
1:1 Cu–H exchange ratio for the first three sites and 1:2
for the 4th site. The model assumes that only phenolic
sites account for the majority of Cu binding, whereas
more acidic carboxyl sites do not. The model implies
that the Cu–DOM complexation is primarily through
the replacement of H+ by Cu2+ at the phenolic binding
sites. Within the pH range of interest, deprotonated sites
are negligible ð½L�i �{½HLi�Þ so that the model formula-
tion is as follows:
CuL ¼X
i
CuLi ¼XN¼3
i¼1
LT;iKCuHLi½Cu2þ�
½Hþ� þ KCuHLi½Cu2þ�
!
þLT;4KCuH2L4 ½Cu
2þ�
½Hþ�2 þ KCuH2L4 ½Cu2þ�
: ð4Þ
Figs. 3 and 6 compared the model simulations of
[Cu2+] with the experimental pH-stat titrations and the
pH edges. The Cu–H exchange constants in Table 4 were
employed. The results indicate that the model describes
well the Cu–DOM complexation behavior over wide
total Cu concentration and pH ranges for natural
waters.
Takacs et al. [28] argued that the carboxyl groups
contributed the majority of Cu complexation sites but
have not provided experimental evidence. In their data
Y. Lu, H.E. Allen / Water Research 36 (2002) 5083–51015092

there was no correlation of Cu binding sites (A1) with
proton binding sites TO1 (representing carboxyl sites)
for nine DOMs (refer to Fig. 3 in reference). We
compared A1 with both proton binding sites, TO1
(carboxyl sites) and TO3 (phenolic sites) for their data,
which is shown in Fig. 8. Even though some systematic
errors may exist among different DOM samples, which
often happens in titration data fitting, it is still evident in
Fig. 8 that A1 correlates much better with TO3
(phenolic sites)—the variances of A1 and TO3 follow
the same trend in most cases, in contrast, they are rather
randomly related with TO1 (carboxyl sites).
3.3. Ca–DOM complexation and comparison with Cu–
DOM complexation
The results of Ca–DOM complexation are compared
with Cu titrations in Fig. 9. The results show that
although both Ca–DOM and Cu–DOM complexation
are pH dependent, the pH dependence of Ca–DOM
complexation is much less than that of Cu–DOM
complexation (o1). The latter has a pH dependency of
approximately 1:1 and remains fairly constant through-
out the whole concentration range. In addition, the Ca–
DOM complexation curves at different pHs (Fig. 9(d))
tend to come closer with increasing CaT, indicating the
pH dependence decreases at higher Ca concentration.
Conditional stability constants ðlog KidÞ and site den-
sities ðLT;iÞ for Ca–DOM complexation obtained by N-
site (N ¼ 1; 2 and 3) models are given in Table 5.
Essentially the total binding site densities by different
methods are in good agreement. For the 3-site model
fits, the increases of log Kid with increasing pH are much
less than 1, moreover, the variation with pH is minimum
for the 1st type of sites (weakest sites), e.g., only 0.033
from pH 7 to 8, while larger for the 2nd and 3rd sites
4
5
6
7
8
9
10
5 7 8 9
pH
4
5
6
7
8
9
10
6
7
8
9
10
11
12
8
9
10
11
12
13
14
6 5 7 8 9
pH6
5 7 8 9
pH6
log
K4
log
K2
log
K1
log
K3
5 7 8 9
pH
6
(a) (b)
(d)(c)
Fig. 7. Conditional stability constants for copper complexation obtained by normalized 4-site model fit for three DOMs vs. pH. J
GA-DOM; & VA-DOM; } NC-DOM.
Y. Lu, H.E. Allen / Water Research 36 (2002) 5083–5101 5093

(stronger sites), both of which are about 0.45. This
quantitatively confirms the above observations about
the titration curves. An additional observation was that
Ca–DOM complexation reached apparent equilibrium
usually in no more than a few minutes, much faster than
Cu–DOM complexation. The latter takes usually 10–
30min, or even longer at low Cu loading and high pH,
to reach apparent equilibrium. The slow association
kinetics for Cu, as have previously discussed, is believed
to be due to binding with strong binding sites [47].
Likewise, the fast kinetics for Ca may imply interaction
with relatively weak binding sites, e.g. carboxyl-type
sites.
We have postulated that the majority of Cu com-
plexation by DOM under natural water conditions is
attributed to phenolic sites instead of more acidic
carboxyl sites. Therefore, the difference in pH depen-
dency for Ca–DOM complexation compared with that
for Cu–DOM complexation may imply that, although a
portion of Ca ions may be bound by phenolic sites at
low Ca concentration and relatively high pH, the
majority of DOM complexed Ca tends to be bound by
carboxyl sites, especially at high Ca concentrations and
low pH.
3.3.1. Non-linearity of metal–DOM interaction
Non-linearity of sorption processes arises from site-
specific interactions, and may occur because of hetero-
geneity of site energies [48]. The Freundlich model has
been extensively used to describe the non-ideal sorption
behavior of organic compounds to soil organic matter
[49,48]. The log–log plots for both Cu–DOM and
Table 4
Conditional Cu–H exchange stability constants of Cu–DOM obtained from the 4-site model. log KHLiassumed to be 10
Sample pH KCuHL1 KCuHL2 KCuHL3 KCuH2L4a
GA-DOM 7 �1.30 0.09 1.66 �3.658 �1.27 0.09 1.62 �4.44
Average �1.29 0.09 1.64 �4.05
VA-DOM 6 -1.06 0.49 1.87 �2.517 �1.32 0.28 1.87 �2.648 �1.30 0.14 1.94 �3.15
Average �1.23 0.30 1.89 �2.77
NC-DOM 6 �0.76 0.90 2.20 �2.277 �0.89 0.76 2.27 �2.308 �0.77 0.82 2.69 �2.53
Average �0.81 0.83 2.39 �2.37
aDefinition:
KCuHLi¼
½CuLi�½Hþ�
½Cu2þ�½HLi�for i¼ 1; 2; and 3;
KCuH2Li¼
½CuLi �½Hþ�2
½Cu2þ�½H2Li �for i¼ 4:
Fig. 8. Comparison of Cu binding site densities with carboxyl
and phenolic site densities for 9 DOM samples reported by
Takacs et al. [28] for samples collected from Norwegian lakes.
Sample numbers are those used in Takacs et al.’s paper.
Y. Lu, H.E. Allen / Water Research 36 (2002) 5083–51015094

Ca–DOM show that the complexation appears to be
able to be described by Freundlich Equation (Eq. 5) with
the exception of a deviation for Cu occurring in the
lowest concentration range (Fig. 9):
½ML� ¼KF½M2þ�n; ð5Þ
where KF is termed Freundlich coefficient, and n (slopes
of the log–log plots, usually 0onp1) may represent an
overall measure of both the relative magnitude and
diversity of site energies. The fitted n values are given in
Table 6.
It is noticeable from Fig. 9 that, for Cu–DOM
isotherms, the deviation of the fitted lines from the data
occurred due to the deviation at the low ends of Cu–
DOM curves, and thus caused the underestimation of n
values, especially at higher pHs. Therefore, we also re-
fitted the results by ignoring a few data points at the low
ends that represent the 4th site in our 4-site model. As a
result, the re-fitted lines came closer to the trends of data
and gave less variation among different pH. The results
demonstrate that: (i) Cu–DOM complexation is highly
non-linear; by contrast, the extent of non-linearity of
Ca–DOM complexation is much less; n values for Cu–
DOM range 0.39–0.32 corresponding to pH 8–6, which
are comparable with the literature [25], whereas for
Ca–DOM the n values range 1.0–0.61; (ii) n values of
Cu–DOM isotherms for three DOMs are fairly constant;
(iii) the non-linearity of both Ca–DOM and Cu–DOM
isotherms tend to increase with increasing pH; however,
the variation is small for Cu (e.g., for VA-DOM,
−14
Cu-GA-DOM
−12 −10 −8 −6 −4
log ([Cu2+], M)
−14 −12 −10 −8 −6 −4
log ([Cu2+], M)
−14 −12 −10 −8 −6 −4
log ([Cu2+], M)
1.0
0.5
0.0
−0.5
−1.0
−1.5
−2.0
−2.5
−3.0
log
(CuL
, mol
Cu
/kg
OC
)
1.0
0.5
0.0
−0.5
−1.0
−1.5
−2.0
−2.5
−3.0
log
(CuL
, mol
Cu
/kg
OC
)
1.0
0.5
0.0
−0.5
−1.0
−1.5
−2.0
−2.5
−3.0
log
(CuL
, mol
Cu
/kg
OC
)
Cu-VA-DOM
Ca-GA-DOMCu-NC-DOM
1.0
0.5
0.0
−0.5
−1.0
−1.5
−2.0
log
(CaL
, mol
Ca/
kg O
C)
(a) (b)
(c) (d)
−6.0 −5.5 −5.0 −4.5 −4.0
log ([Cu2+], M)
Fig. 9. Comparison of Cu–DOM and Ca–DOM complexation at pH 6, 7 and 8 by OC normalized binding. (a)–(c) Cu–DOM
complexation isotherms for GA-DOM, VA-DOM and NC-DOM, respectively, and (d) Ca–DOM complexation for GA-DOM.
DOC=10mg/L; I ¼ 10�2 M; T ¼ 251C. J pH=6; & pH=7; } pH=8. Solid lines are Freundlich fits. Slope n values are listed in
Table 6.
Y. Lu, H.E. Allen / Water Research 36 (2002) 5083–5101 5095
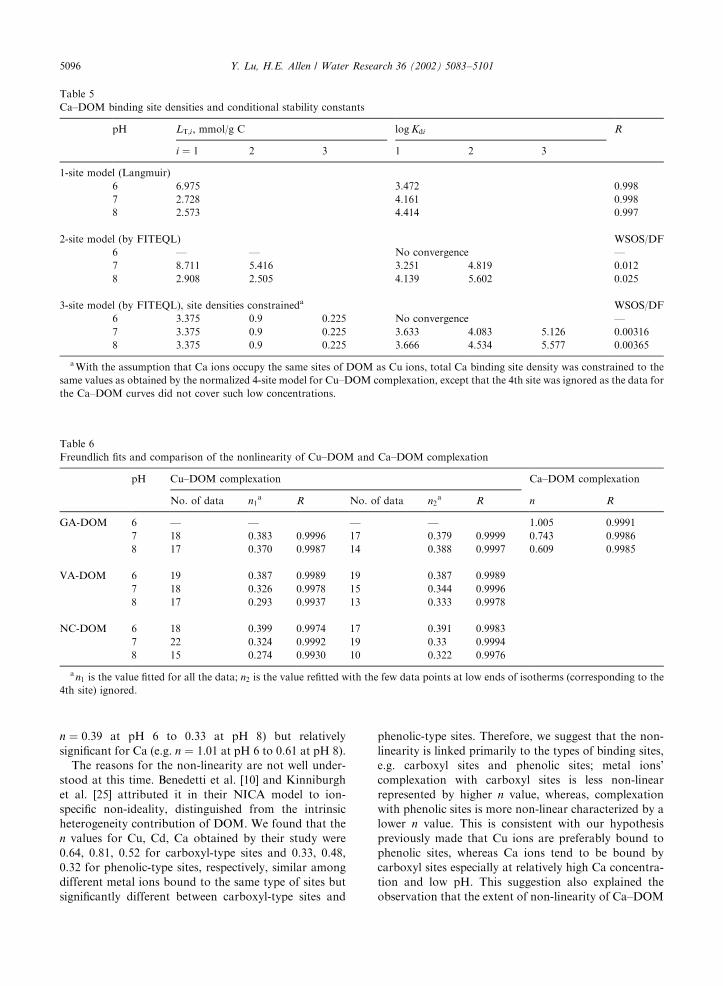
n ¼ 0:39 at pH 6 to 0.33 at pH 8) but relatively
significant for Ca (e.g. n ¼ 1:01 at pH 6 to 0.61 at pH 8).
The reasons for the non-linearity are not well under-
stood at this time. Benedetti et al. [10] and Kinniburgh
et al. [25] attributed it in their NICA model to ion-
specific non-ideality, distinguished from the intrinsic
heterogeneity contribution of DOM. We found that the
n values for Cu, Cd, Ca obtained by their study were
0.64, 0.81, 0.52 for carboxyl-type sites and 0.33, 0.48,
0.32 for phenolic-type sites, respectively, similar among
different metal ions bound to the same type of sites but
significantly different between carboxyl-type sites and
phenolic-type sites. Therefore, we suggest that the non-
linearity is linked primarily to the types of binding sites,
e.g. carboxyl sites and phenolic sites; metal ions’
complexation with carboxyl sites is less non-linear
represented by higher n value, whereas, complexation
with phenolic sites is more non-linear characterized by a
lower n value. This is consistent with our hypothesis
previously made that Cu ions are preferably bound to
phenolic sites, whereas Ca ions tend to be bound by
carboxyl sites especially at relatively high Ca concentra-
tion and low pH. This suggestion also explained the
observation that the extent of non-linearity of Ca–DOM
Table 5
Ca–DOM binding site densities and conditional stability constants
pH LT;i; mmol/g C logKdi R
i ¼ 1 2 3 1 2 3
1-site model (Langmuir)
6 6.975 3.472 0.998
7 2.728 4.161 0.998
8 2.573 4.414 0.997
2-site model (by FITEQL) WSOS/DF
6 — — No convergence —
7 8.711 5.416 3.251 4.819 0.012
8 2.908 2.505 4.139 5.602 0.025
3-site model (by FITEQL), site densities constraineda WSOS/DF
6 3.375 0.9 0.225 No convergence —
7 3.375 0.9 0.225 3.633 4.083 5.126 0.00316
8 3.375 0.9 0.225 3.666 4.534 5.577 0.00365
aWith the assumption that Ca ions occupy the same sites of DOM as Cu ions, total Ca binding site density was constrained to the
same values as obtained by the normalized 4-site model for Cu–DOM complexation, except that the 4th site was ignored as the data for
the Ca–DOM curves did not cover such low concentrations.
Table 6
Freundlich fits and comparison of the nonlinearity of Cu–DOM and Ca–DOM complexation
pH Cu–DOM complexation Ca–DOM complexation
No. of data n1a R No. of data n2
a R n R
GA-DOM 6 — — — — 1.005 0.9991
7 18 0.383 0.9996 17 0.379 0.9999 0.743 0.9986
8 17 0.370 0.9987 14 0.388 0.9997 0.609 0.9985
VA-DOM 6 19 0.387 0.9989 19 0.387 0.9989
7 18 0.326 0.9978 15 0.344 0.9996
8 17 0.293 0.9937 13 0.333 0.9978
NC-DOM 6 18 0.399 0.9974 17 0.391 0.9983
7 22 0.324 0.9992 19 0.33 0.9994
8 15 0.274 0.9930 10 0.322 0.9976
an1 is the value fitted for all the data; n2 is the value refitted with the few data points at low ends of isotherms (corresponding to the
4th site) ignored.
Y. Lu, H.E. Allen / Water Research 36 (2002) 5083–51015096

and Cu–DOM complexation both tend to decrease with
decreasing pH and that the variation is only subtle for
Cu but relatively significant for Ca, because our
hypothesis does not exclude the possibility that some
Cu ions can be bound to carboxyl sites (especially, low
pH, and high Cu loading relative to DOM) and that a
small portion of Ca ions can be bound to phenolic sites
especially at low Ca loading and high pH. In fact, for
both ions the binding to carboxyl sites is enhanced at
lower pH and the binding to phenolic sites is enhanced
at higher pH, so that the non-linearity is correspond-
ingly reduced with decreasing pH. The point is that at
pH as low as 6, Cu binding to phenolic sites is still
dominant so that the decrease of non-linearity for Cu–
DOM complexation is only minimal.
3.4. Ca/Mg competition with Cu for DOM binding sites
The results of Ca–Cu competition for three DOMs at
two [Cu]T, 2� 10�6 and 5� 10�6M, and two pH values,
6.0 and 7.0, are shown in Fig. 10. Small but detectable
competition was observed under all conditions. The
results demonstrate that (i) for all three DOMs, there is
a similar tendency of Cu displacement by the addition of
Ca2+ shown at both pH 6 and 7 and at both [Cu]T; (ii)
the increases of [Cu2+] when Ca concentration increased
from background levels ({10�6M) to 10�3M are all
less than one order of magnitude (Dlog [Cu2+]=0.35–
0.82); (iii) the displacement of Cu2+ by addition of Ca
for GA-DOM is somewhat less than for VA- and NC-
DOM; and (iv) the Ca effect on the Cu2+ displacement
is a little greater at lower [Cu]T than at higher [Cu]T, and
likewise it is greater at pH 7 than at pH 6. In addition,
the linear plots of [Cu2+] vs. [Ca]T (Fig. 10(d)) showed
that the displacement of Cu2+ continuously becomes
less with increasing [Ca]T, indicating the overall compe-
tition of Ca is stronger at lower [Ca]T and is weakened
with increasing [Ca]T. The effect of Mg2+ on Cu–DOM
complexation is compared with that of Ca2+ for both
VA-DOM and NC-DOM at [Cu]T=2� 10�6M and pH
7.0 (figure not shown).
The extent of competition of Ca or Mg with Cu
observed in our experiments is somewhat greater than
literature has reported ([11,26]; Hering and Morel [1];
[25,23]). Sunda and Hanson [26] found only minor
competition effects by Ca/Mg—at 1 mM [Cu]T and pH
7.7, log [Cu2+] increased by 0.12 units when [Ca2+]
increasing from 0.26 to 2.7mM, and increased by 0.2
units when [Mg2+] increased from 0.04 to 0.94mM,
which is probably due to the fact that the [Ca2+] they
started from was high. Hering and Morel [1] performed
Cu titrations of Suwannee humic acid at pH 8.2–8.3 and
found little or no effect of Ca at 10�2M. Cabaniss and
Shuman [11] performed acid–base titrations of Cu-
Suwannee fulvic acid (1 mM [Cu]T, 5mg/L FA) over a
4.4–9.0 pH range and increases in log [Cu2+] of up to 0.3
units at 1.0mM Ca or Mg and up to 0.6 units at 10mM
Ca or Mg were observed at high pH.
A simple competition model that assumes competitive
binding by H+ and other cations M2+ such as Ca2+
with Cu2+ for the same binding sites can be expressed as
in Eq. (6), and if for a fixed pH, can be simplified by
employing conditional stability constants (Eq. 7).
CuLi ¼LT;iKCuLi
½Cu2þ�
1þ KH;i½Hþ� þ KCa;i½Ca2þ� þ KCuLi
½Cu2þ�; ð6Þ
CuLi ¼LT;iK
cCuLi
½Cu2þ�
1þ KcCaLi
½Ca2þ� þ KcCuLi
½Cu2þ�: ð7Þ
We examined the simple competition model by
performing a simulation of Ca–Cu competition for
GA-DOM with MINEQL+ using the 4-site discrete site
model described earlier. The constrained binding site
densities and corresponding conditional stability con-
stants for Cu and Ca obtained separately from Cu–
DOM complexation and Ca–DOM complexation (see
Tables 3 and 5) were employed. The simulations were
conducted under the same conditions as the experi-
ments, and the results are shown in Fig. 11. Disregard-
ing the initial minor gaps between simulation and
measured [Cu2+], the MINEQL+ simulation is con-
sistent with measurements at low Ca concentrations.
However, it tremendously overestimates the displaced
Cu2+ when [Ca]T is higher than about 10�5M (roughly
the beginning of binding with the 1st type of sites). The
discrepancy of [Cu2+] is up to nearly one order of
magnitude, and this discrepancy is exacerbated at lower
total Cu concentration. Therefore, Ca and Mg do not
simply compete with Cu for the same binding sites on
DOM, especially at high Ca or Mg concentrations.
Although the lack of competition has been reported in
literature as discussed earlier, no satisfactory explana-
tion has been offered so far. McKnight and Wershaw
[23] suggested Ca ions compete with Cu for some part of
binding sites but not for other sites, but they did not
specify which part of the binding sites allowed competi-
tion. Based on the above experimental observations and
discussion, we propose that the lack of comprehensive
competition is because the majority of Ca and Mg tends
to be bound by carboxyl sites; by contrast, Cu tends to
be bound principally by phenolic sites. At a low Ca and
Mg concentrations, Ca and Mg compete weakly with Cu
for the phenolic-type binding as Ca and Mg have a
much weaker stability constant than that of Cu; when
the Ca or Mg concentration is higher, the excess Ca or
Mg tends to be bound principally by carboxylic-type
sites, resulting in a weakened apparent competition
effect on the Cu–DOM complexation since there is no
substantial competition for the carboxylic sites between
Cu and Ca or Mg.
Y. Lu, H.E. Allen / Water Research 36 (2002) 5083–5101 5097

Our findings are essentially in agreement with
Kinniburgh et al. [25] applying the NICA-Donnan
Model that reported the relative strength of binding is
in the following sequences: for carboxylic-type sites
H+cPb2+>Cu2+>Cd2+>Ca2+ and for phenolic-
type sites H+cCu2+>Pb2+cCd2+cCa2+. With the
exception of Ca, the stability constant values for the
metal ions, especially for Cu, are considerably greater
for the phenolic-type sites than for the carboxylic-type
sites. When fitting the competition between alkaline
earth cations and trace metal with Model V, Tipping [15]
also found that the larger is the assumed value of pKMHB
for Ca2+, i.e., the weaker is Ca binding at the type B
sites (phenolic sites), the less competition is predicted;
whereas, variations in pKMHA have much less effect.
This is also consistent with our findings.
10−7 10−6 10−5 10−4 10−3
[Ca]T, M10−7 10−6 10−5 10−4 10−3
[Ca]T, M
10−7 10−6 10−5 10−4 10−3
[Ca]T, M
0 100 5 10−4 1 10−3 2 10−3
[Ca]T, M
0.0
1.0 10−7
2.0 10−7
3.0 10−7
4.0 10−7
5.0 10−7
VA-DOM
[Cu2+
], M
10−10
10−9
10−8
10−7
10−6
NC-DOM
[Cu2+
], M
10−10
10−9
10−8
10−7
10−6
[Cu2+
], M
10−10
10−9
10−8
10−7
10−6
[Cu2+
], M
VA-DOMGA-DOM
(a) (b)
(c) (d)
Fig. 10. Effect of Ca concentration on Cu–DOM complexation. (a)–(c) Log–log scale plots for GA-DOM, VA-DOM, and NC-DOM,
and (d) a linear plot for VA-DOM. DOC=10mg/L; I ¼ 10�2 M; T ¼ 251C. J [Cu]T=2� 10�6M, pH=6; & [Cu]T=5� 10�6M,
pH=6, K [Cu]T=2� 10�6M, pH=7; ’ [Cu]T=5� 10�6M, pH=7.
Y. Lu, H.E. Allen / Water Research 36 (2002) 5083–51015098

4. Summary
In this study, the Cu complexation, acid–base, Ca/Mg
complexation and their competition with Cu character-
istics of DOMs collected from three sources were
systematically investigated by employing an ISE techni-
que. Alkalimetric and Cu titrations indicated similar
distributions of proton and Cu binding sites for all three
DOMs. The slight differences of Cu binding affinities
among three DOMs may be partly attributed to
different HA/FA ratios. All DOMs showed the presence
of small amounts of very strong Cu-binding sites. The
Cu–DOM complexation has an overall pH dependence
for log [Cu2+] of approximately 1 even at relatively high
pH (>8), whereas the pH dependence for Ca–DOM
complexation is much less than 1. Cu–DOM complexa-
tion isotherms are highly non-linear; in contrast, the
extent of non-linearity of Ca–DOM complexation is
much less. Ca/Mg compete weakly with Cu for DOM
sites, and the competition continuously becomes weaker
with increasing Ca/Mg concentrations.
Putting together all the results, we suggest that sites
characterized as phenolic based on alkalimetric titra-
tions, rather than more acidic carboxyl sites, account for
the majority of Cu–DOM complexation under natural
water conditions, and the complexation is principally
through the replacement of H+ by Cu2+ at the phenolic
binding sites; in contrast, the majority of Ca and Mg
tends to be bound by carboxyl sites, especially at high
Ca and Mg concentrations. This explains the lack of
comprehensive competition of Ca/Mg with Cu for DOM
complexation. Based on the above assumption, a 4-site
model was constructed to describe Cu–DOM complexa-
tion. The Cu–H exchange ratio is 1:1 for the first three
sites and 1:2 for the 4th site. This model describes well
the pH dependency of Cu–DOM complexation and
provides good estimates of free Cu2+ concentrations
throughout wide CuT and pH ranges. Our conclusions
are supported by (i) different characteristics with respect
to pH dependency, non-linearity, association–dissocia-
tion kinetics and binding strength demonstrated by Cu–
DOM and Ca–DOM complexation, (ii) analysis of the
correlation between model-fitted acidic sites and Cu
binding sites, and (iii) interpretation of the results of Cu
ion displacement from DOM sites by Ca or Mg.
Acknowledgements
We gratefully thank the International Copper Asso-
ciation, the US Environmental Protection Agency, and
the Water Environment Research Foundation for
support of the research. We thank Dr. James R. Kramer
of McMaster University for his thoughtful comments on
the paper.
References
[1] Hering JG, Morel FMM. Humic acid complexation of
calcium and copper. Environ Sci Technol 1988;22:1234–7.
[2] Ma H, Kim SD, Cha DK, Allen HE. Effect of kinetics of
complexation by humic acid on the toxicity of copper to
Ceriodaphnia dubia. Environ Toxicol Chem 1999;18:
828–37.
[3] Mantoura RFC, Dickson A, Riley JP. The complexation
of metals with humic materials in natural waters. Estuarine
Coastal Mar Sci 1978;6:386–408.
[4] McKnight DM, Feder GL, Thurman EM, Wershaw RL,
Westall JC. Complexation of copper by aquatic humic
substances from different environments. Sci Total Environ
1983;28:65–76.
[5] Tipping E. WHAM-A chemical equilibrium model and
computer code for waters, sediments, and soils incorpor-
ating a discrete site electrostatic model of ion-binding by
humic substances. Comput Geosci 1994;20:973–1023.
[6] Dzombak DA, Fish W, Morel FMM. Metal–humate
interactions. 1. Discrete ligand and continuous distribution
models. Environ Sci Technol 1986;20:669–75.
[7] Perdue EM. Acidic functional groups of humic substances.
In: Aiken GR, McKnight DM, Wershaw RL, MacCarthy
P, editors. Humic substances in soil, sediment and water.,
Vol. 1. New York: Wiley, 1985 (Chapter 20).
[8] Allison JD, Perdue EM. Modeling metal–humic interac-
tions with MINTEQA2. In: Senesi N, Miano TM, editors.
Humic substances in the global environment and implica-
tions on human health. Amsterdam: Elsevier, 1994.
p. 927–42.
10−7
10−6
10−5 10
−410
−3
[Cu]T, M
10−10
10−9
10−8
10−7
10−6
[Cu2+
], M
Fig. 11. MINEQL simulation of Ca–Cu competition for GA-
DOM with the normalized 4-site model. Points are experi-
mental data; dashed and solid lines are MINEQL simulations
for [Cu]T=2� 10�6 and 5� 10�6M, respectively.
DOC=10mg/L; I ¼ 10�2 M; T ¼ 251C; pH=7.0. J
CuT=2� 10�6M and & CuT=5� 10�6M.
Y. Lu, H.E. Allen / Water Research 36 (2002) 5083–5101 5099

[9] Bartschat BM, Cabaniss SE, Morel FMM. Oligoelectro-
lyte model for cation binding by humic substances.
Environ Sci Technol 1992;26:284–94.
[10] Benedetti MF, Milne CJ, Kinniburgh DG, van Riemsdijk
WH, Koopal LK. Metal ion binding to humic substances:
application of the non-ideal competitive adsorption model.
Environ Sci Technol 1995;29:446–57.
[11] Cabaniss SE, Shuman MS. Copper binding by dissolved
organic matter: I. Suwannee river fulvic acid equilibria.
Geochim Cosmochim Acta 1988;52:185–93.
[12] Perdue EM, Lytle CR. Distribution model for binding of
protons and metal ions by humic substances. Environ Sci
Technol 1983;17:654–60.
[13] Sunda WG, Huntsman SA. The use of chemiluminescence
and ligand competition with EDTA to measure copper
concentration and speciation in seawater. Mar Chem
1991;36:137–63.
[14] Tipping E, Hurley MA. A unifying model of cation
binding by humic substances. Geochim Cosmochim Acta
1992;56:3627–41.
[15] Tipping E. Modeling the competition between alkaline
earth cations and trace metal species for binding by humic
substances. Environ Sci Technol 1993;27:520–9.
[16] Tipping E. Modelling ion binding by humic acids. Colloids
Surf. A: Physicochem Eng Aspects 1993;73:117–31.
[17] Tipping E, Fitch A, Stevenson FJ. Proton and copper
binding by humic acid: application of a discrete-site/
electrostatic ion-binding model. Eur J Soil Sci 1995;46:
95–101.
[18] Westall JC, Jones JD, Turner GD, Zachara JM. Models
for association of metal ions with heterogeneous environ-
mental sorbents. 1. Complexation of Co(II) by leonardite
humic acid as a function of pH and NaClO4 concentration.
Environ Sci Technol 1995;29:951–9.
[19] Benedetti MF, van Riemsdijk WH, Koopal LK, Kinni-
burgh DG, Gooddy DC, Milne CJ. Metal-ion binding by
natural organic matter: from the model to the field.
Geochim Cosmochim Acta 1996;60:2503–13.
[20] Tipping E. Humic ion-binding model VI: an improved
description of the interactions of protons and metal
ions with humic substances. Aquat Geochem 1998;4:
3–48.
[21] Buffle I, Tessier A, Haerdi W. Interpretation of trace metal
complexation by aquatic organic matter. In: Kramer CJM,
Duinker JC, editors. Complexation of trace metals in
natural waters. The Hague, The Netherlands: Martimus
Nijhoff/Dr W. Junk, 1984. p. 301–16.
[22] Gamble DS, Underdown AW, Langford CH. Copper (II)
titration of fulvic acid ligand sites with theoretical,
potentiometric and spectrophotometric analysis. Anal
Chem 1980;52:1901–8.
[23] McKnight DM, Wershaw RL. Complexation of copper by
fulvic acid from the Suwannee River-effect of counter-ion
concentration. In: Averett RC, Leenheer JA, McKnight
DM, Thorn KA, editors. Humic substances in the
Suwannee River, Georgia: interactions, properties, and
proposed structures, USGS Water-supply Paper 2373,
1994. p. 33–44.
[24] Smith DS, Kramer JR. Multi-site metal binding to fulvic
acid determined using multiresponse fluorescence. Anal
Chim Acta 2000;416:211–20.
[25] Kinniburgh DG, Milne CJ, Benedetti MF, Pinheiro JP,
Filius J, Koopal LK, van Riemsdijk WH. Metal ion
binding by humic acid: application of the NICA-Donnan
model. Environ Sci Technol 1996;30:1687–98.
[26] Sunda WG, Hanson PJ. Chemical speciation of copper
in river water: effect of total copper, pH, carbonate,
and dissolved organic matter. In: Jenne EA, editor.
Chemical modeling in aqueous systems. Speciation, sorp-
tion, solubility, and kinetics, ACS Symposium Series 93.
Washington, DC: American Chemical Society, 1979.
p. 147–80.
[27] MacRae RK, Maest AS, Meyer JS. Selection of an
organic acid analogue of dissolved organic matter for
use in toxicity testing can. J Fish Aquat Sci 1995;56:
1484–93.
[28] Takacs M, Alberts JJ, Egeberg PK. Characterization of
natural organic matter from eight Norwegian surface
waters: proton and copper binding. Environ Int
1999;25:315–23.
[29] Fish W, Dzombak DA, Morel FMM. Metal–humate
interactions. 2. Application and comparison of models.
Environ Sci Technol 1986;20:676–83.
[30] Ma H, Allen HE, Yin Y. Characterization of isolated
fractions of dissolved organic matter from natural waters
and a wastewater effluent. Wat Res 2001;35:985–96.
[31] Serkiz SM, Perdue EM. Isolation of dissolved organic
matter from the Suwannee River using reverse osmosis.
Water Res 1990;24:911–6.
[32] Sun L, Perdue EM, McCarthy JF. Using reverse osmosis
to obtain organic matter from surface and ground waters.
Water Res 1995;29:1471–7.
[33] Lu Y. Copper complexation with natural dissolved organic
matter and partitioning onto suspended particulate matter
in river waters. Ph.D. thesis, University of Delaware,
Newark, 2000.
[34] Avdeef A, Zabronsky J, Stuting HH. Calibration of copper
ion selective electrode response to pCu 19. Anal Chem
1983;55:298–304.
[35] Bowles EC, Antweiler RC, MacCarthy P. Acid–base
titration and hydrolysis of fulvic acid from the Suwannee
River. In: Averett RC, Leenheer JA, McKnight DM,
Thorn KA, editors. Humic substances in the Suwannee
River, Georgia: interactions, properties, and proposed
structures. USGS Water-supply Paper 2373, 1994.
p. 115–27.
[36] Kandegedara A, Rorabacher DB. Noncomplexing tertiary
amines as ‘‘better’’ buffers covering the range of pH 3–11.
Temperature dependence of their acid dissociation con-
stants. Anal Chem 1999;71:3140–4.
[37] Thurman EM. Organic geochemistry of natural waters.
Boston, MA: Kluwer Academic, 1985.
[38] Leenheer JA, Wershaw RL, Reddy MM. Strong-acid,
carboxyl-group structures in fulvic acid from the Suwan-
nee River, Georgia. 1 Minor structures. Environ Sci
Technol 1995;29:393–8.
[39] Smith DS, Kramer JR. Multi-site proton interactions with
natural organic matter. Environ Int 1999;25:307–14.
[40] Rate AW, McLaren RG. Response of Copper(II)–humic
acid dissociation kinetics to factors influencing complex
stability and macromolecular conformation. Environ Sci
Technol 1993;27:1408–14.
Y. Lu, H.E. Allen / Water Research 36 (2002) 5083–51015100

[41] Herbelin AL, Westall JC. FITEQL. A computer program
for determination of chemical equilibrium constants from
experimental data, version 4.0, Report 99-01. Department
of Chemistry, Oregon State University, Corvallis, OR,
1999.
[42] Xue H, Sigg L. Free cupric ion concentration and Cu(II)
speciation in a eutrophic lake. Limnol Oceanogr 1993;38:
1200–13.
[43] Alberts JJ, Filip Z. Metal binding in estuarine humic and
fulvic acids: FTIR analysis of humic acid–metal com-
plexes. Environ Technol 1998;19:923–31.
[44] Senesi N, Sposito G, Martin JP. Copper (II) and iron (III)
complexation by humic acid-like polymers (melanins) from
soil fungi. Sci Total Environ 1987;62:351–62.
[45] Hansen AM, Leckie JO, Mandelli EF, Altmann RS. Study
of Copper(II) association with dissolved organic matter in
surface waters of three Mexican coastal lagoons. Environ
Sci Technol 1990;24:683–7.
[46] Schnitzer M, Skinner SIM. Organo-metallic interactions in
soils. 4. Carboxyl and hydroxyl groups in organic matter
and metal retention. Soil Sci 1965;99:278–84.
[47] Hering JG, Morel FMM. Slow coordination reactions in
seawater. Geochim Cosmochim Acta 1989;53:611–8.
[48] Xing B, Pignatello J, Gigliotti B. Competitive sorption
between atrazine and other organic compounds in soils
and model sorbents. Environ Sci Technol 1996;30:
2432–40.
[49] Weber Jr WJ, Huang W. A distributed reactivity model
for sorption by soils and sediments. 4. Intraparticle
heterogeneity and phase-distribution relationships under
nonequilibrium conditions. Environ Sci Technol 1996;30:
881–8.
Y. Lu, H.E. Allen / Water Research 36 (2002) 5083–5101 5101