Letscher & Moore 2015 non-Redfield DOM bgc
16
Preferential remineralization of dissolved organic phosphorus and non-Redfield DOM dynamics in the global ocean: Impacts on marine productivity, nitrogen fixation, and carbon export Robert T. Letscher 1 and J. Keith Moore 1 1 Earth System Science, University of California, Irvine, California, USA Abstract Selective removal of nitrogen (N) and phosphorus (P) from the marine dissolved organic matter (DOM) pool has been reported in several regional studies. Because DOM is an important advective/mixing pathway of carbon (C) export from the ocean surface layer and its non-Redfieldian stoichiometry would affect estimates of marine export production per unit N and P, we investigated the stoichiometry of marine DOM and its remineralization globally using a compiled DOM data set. Marine DOM is enriched in C and N compared to Redfield stoichiometry, averaging 317:39:1 and 810:48:1 for C:N:P within the degradable and total bulk pools, respectively. Dissolved organic phosphorus (DOP) is found to be preferentially remineralized about twice as rapidly with respect to the enriched C:N stoichiometry of marine DOM. Biogeochemical simulations with the Biogeochemical Elemental Cycling model using Redfield and variable DOM stoichiometry corroborate the need for non-Redfield dynamics to match the observed DOM stoichiometry. From our model simulations, preferential DOP remineralization is found to increase the strength of the biological pump by ~9% versus the case of Redfield DOM cycling. Global net primary productivity increases ~10% including an increase in marine nitrogen fixation of ~26% when preferential DOP remineralization and direct utilization of DOP by phytoplankton are included. The largest increases in marine nitrogen fixation, net primary productivity, and carbon export are observed within the western subtropical gyres, suggesting the lateral transfer of P in the form of DOP from the productive eastern and poleward gyre margins may be important for sustaining these processes downstream in the subtropical gyres. 1. Introduction Marine geochemists have long used the Redfield ratio to link nutrient cycles of nitrogen (N) and phosphorus (P) to fixed carbon (C), allowing quantification of carbon export by applying a fixed ratio of C:N:P for organic matter over regional to global scales. Thus, the Redfield ratio underlies assumptions regarding current estimates of the strength and resiliency of the ocean’ s biological pump to future perturbations. Dissolved organic matter (DOM) is an important pool within the biological pump, providing an advective/mixing pathway for removal of ~20–25% of global export production [Hansell et al., 2009; Letscher et al., 2015]. Biological production and decomposition of particulate organic matter (POM; size >0.7 μm) in the ocean is thought to largely follow the canonical Redfield ratio of 106:16:1 for C:N:P; however, regional deviations from this stoichiometry have recently been documented for both POM [i.e., Martiny et al., 2013a, 2013b] as well as the smaller-sized (<0.7 μm) DOM pool [Clark et al., 1998; Abell et al., 2000; Loh and Bauer , 2000; Aminot and Kérouel, 2004; Hopkinson and Vallino, 2005]. These studies have observed DOM to be depleted in P (and N) relative to Redfield proportions in the regions studied (North Pacific, Mediterranean Sea, and North Atlantic), suggesting possible preferential removal of dissolved organic phosphorus (DOP) and nitrogen (DON) during microbial remineralization. Marine DOM depleted in N and P also implies more efficient export of C within DOM compared to POM [Hopkinson and Vallino, 2005]. However, the bulk pools of DOM contain both a fraction that is refractory and uniformly mixed throughout the water column and a nonrefractory (degradable) fraction which is labile on some timescale relevant to the timescale of ocean ventilation and overturning circulation [Carlson, 2002]. Because these two fractions have very different stoichiometry and lifetimes, Aminot and Kérouel [2004] note that the apparent selective removal of N and P with depth could simply be explained by the decreasing proportion of the nonrefractory LETSCHER AND MOORE ©2015. American Geophysical Union. All Rights Reserved. 325 PUBLICATION S Global Biogeochemical Cycles RESEARCH ARTICLE 10.1002/2014GB004904 Key Points: • Marine DOM and its remineralization exhibit non-Redfield C:N:P stoichiometry • Preferential remineralization of DOP increases marine N2-fixation by 26% • Marine DOC export increases global export production by 24% Supporting Information: • Tables S1 and S2 and Figure S1 Correspondence to: R. T. Letscher, [email protected] Citation: Letscher, R. T., and J. K. Moore (2015), Preferential remineralization of dissolved organic phosphorus and non-Redfield DOM dynamics in the global ocean: Impacts on marine productivity, nitrogen fixation, and carbon export, Global Biogeochem. Cycles, 29, 325–340, doi:10.1002/2014GB004904. Received 27 MAY 2014 Accepted 9 FEB 2015 Accepted article online 13 FEB 2015 Published online 24 MAR 2015
Transcript of Letscher & Moore 2015 non-Redfield DOM bgc
Preferential remineralization of dissolved organicphosphorus and non-Redfield DOM dynamics inthe global ocean: Impacts on marine productivity,nitrogen fixation, and carbon exportRobert T. Letscher1 and J. Keith Moore1
1Earth System Science, University of California, Irvine, California, USA
Abstract Selective removal of nitrogen (N) and phosphorus (P) from the marine dissolved organic matter(DOM) pool has been reported in several regional studies. Because DOM is an important advective/mixingpathway of carbon (C) export from the ocean surface layer and its non-Redfieldian stoichiometry would affectestimates of marine export production per unit N and P, we investigated the stoichiometry of marine DOM andits remineralization globally using a compiled DOM data set. Marine DOM is enriched in C and N compared toRedfield stoichiometry, averaging 317:39:1 and 810:48:1 for C:N:P within the degradable and total bulk pools,respectively. Dissolved organic phosphorus (DOP) is found to be preferentially remineralized about twice asrapidly with respect to the enriched C:N stoichiometry of marine DOM. Biogeochemical simulations with theBiogeochemical Elemental Cyclingmodel using Redfield and variable DOM stoichiometry corroborate the needfor non-Redfield dynamics tomatch the observedDOM stoichiometry. Fromourmodel simulations, preferentialDOP remineralization is found to increase the strength of the biological pump by ~9% versus the case ofRedfield DOM cycling. Global net primary productivity increases ~10% including an increase in marine nitrogenfixation of ~26% when preferential DOP remineralization and direct utilization of DOP by phytoplankton areincluded. The largest increases in marine nitrogen fixation, net primary productivity, and carbon export areobserved within the western subtropical gyres, suggesting the lateral transfer of P in the form of DOP from theproductive eastern and poleward gyremarginsmay be important for sustaining these processes downstream inthe subtropical gyres.
1. Introduction
Marine geochemists have long used the Redfield ratio to link nutrient cycles of nitrogen (N) and phosphorus (P)to fixed carbon (C), allowing quantification of carbon export by applying a fixed ratio of C:N:P for organic matterover regional to global scales. Thus, the Redfield ratio underlies assumptions regarding current estimates ofthe strength and resiliency of the ocean’s biological pump to future perturbations. Dissolved organic matter(DOM) is an important pool within the biological pump, providing an advective/mixing pathway for removal of~20–25% of global export production [Hansell et al., 2009; Letscher et al., 2015]. Biological production anddecomposition of particulate organic matter (POM; size >0.7μm) in the ocean is thought to largely follow thecanonical Redfield ratio of 106:16:1 for C:N:P; however, regional deviations from this stoichiometry have recentlybeen documented for both POM [i.e., Martiny et al., 2013a, 2013b] as well as the smaller-sized (<0.7 μm)DOM pool [Clark et al., 1998; Abell et al., 2000; Loh and Bauer, 2000; Aminot and Kérouel, 2004; Hopkinson andVallino, 2005]. These studies have observed DOM to be depleted in P (and N) relative to Redfield proportions inthe regions studied (North Pacific, Mediterranean Sea, and North Atlantic), suggesting possible preferentialremoval of dissolved organic phosphorus (DOP) and nitrogen (DON) during microbial remineralization.Marine DOM depleted in N and P also implies more efficient export of C within DOM compared to POM[Hopkinson and Vallino, 2005].
However, the bulk pools of DOM contain both a fraction that is refractory and uniformly mixed throughoutthe water column and a nonrefractory (degradable) fraction which is labile on some timescale relevant to thetimescale of ocean ventilation and overturning circulation [Carlson, 2002]. Because these two fractions havevery different stoichiometry and lifetimes, Aminot and Kérouel [2004] note that the apparent selectiveremoval of N and P with depth could simply be explained by the decreasing proportion of the nonrefractory
LETSCHER AND MOORE ©2015. American Geophysical Union. All Rights Reserved. 325
PUBLICATIONSGlobal Biogeochemical Cycles
RESEARCH ARTICLE10.1002/2014GB004904
Key Points:• Marine DOM and its remineralizationexhibit non-Redfield C:N:P stoichiometry
• Preferential remineralization of DOPincreases marine N2-fixation by 26%
• Marine DOC export increases globalexport production by 24%
Supporting Information:• Tables S1 and S2 and Figure S1
Correspondence to:R. T. Letscher,[email protected]
Citation:Letscher, R. T., and J. K. Moore (2015),Preferential remineralization of dissolvedorganic phosphorus and non-RedfieldDOM dynamics in the global ocean:Impacts on marine productivity, nitrogenfixation, and carbon export, GlobalBiogeochem. Cycles, 29, 325–340,doi:10.1002/2014GB004904.
Received 27 MAY 2014Accepted 9 FEB 2015Accepted article online 13 FEB 2015Published online 24 MAR 2015
fraction as it is degraded with depth. In order to examine the stoichiometry of DOM and assess if preferentialP remineralization is a global phenomenon, we compiled open ocean observations of marine DOM andcalculated molar C:N:P stoichiometries of the DOM pool and its remineralization. This is followed bybiogeochemical modeling simulations with the Biogeochemical Elemental Cycling model of the oceancomponent of the Community Earth SystemModel that corroborate the need for non-Redfield stoichiometryof DOM cycling to match the observed stoichiometry, thus confirming the preferential remineralization ofDOP within the ocean’s thermocline at the global scale. Lastly, we discuss the implications of these findingson the magnitude and spatial distribution of marine primary productivity, nitrogen fixation, and thebiological pump.
2. Methods2.1. Data Set and Calculations
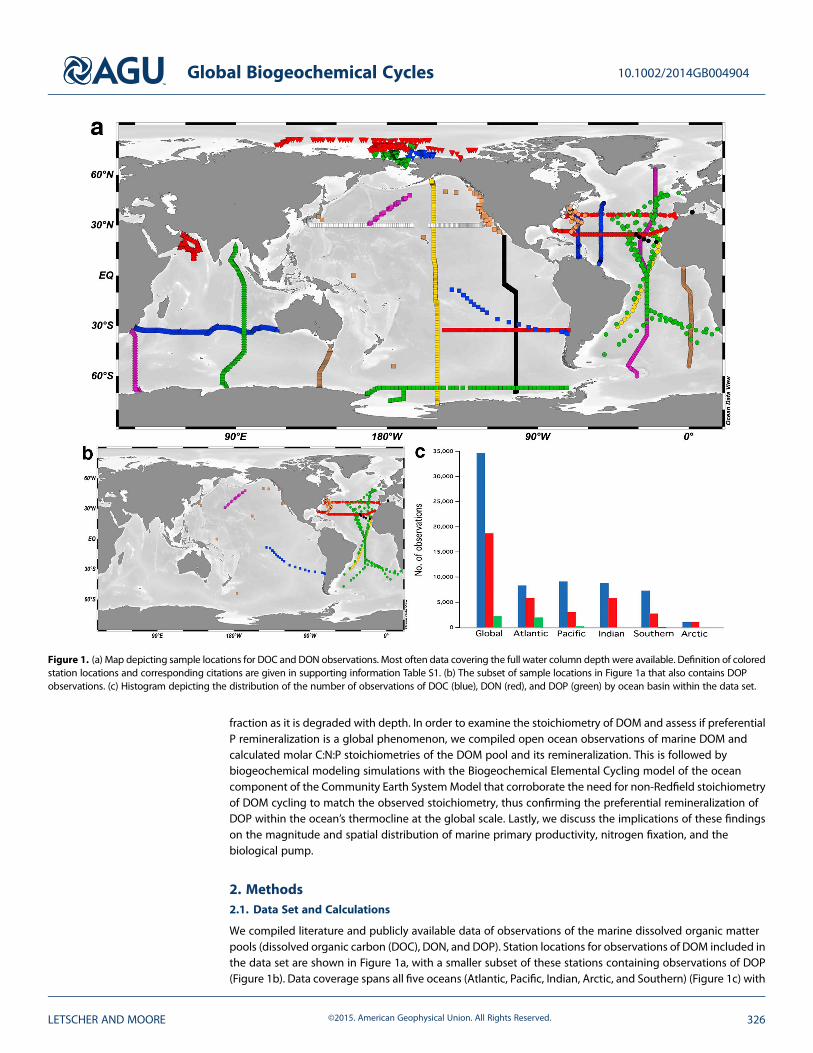
We compiled literature and publicly available data of observations of the marine dissolved organic matterpools (dissolved organic carbon (DOC), DON, and DOP). Station locations for observations of DOM included inthe data set are shown in Figure 1a, with a smaller subset of these stations containing observations of DOP(Figure 1b). Data coverage spans all five oceans (Atlantic, Pacific, Indian, Arctic, and Southern) (Figure 1c) with
Figure 1. (a) Map depicting sample locations for DOC and DON observations. Most often data covering the full water column depth were available. Definition of coloredstation locations and corresponding citations are given in supporting information Table S1. (b) The subset of sample locations in Figure 1a that also contains DOPobservations. (c) Histogram depicting the distribution of the number of observations of DOC (blue), DON (red), and DOP (green) by ocean basin within the data set.
Global Biogeochemical Cycles 10.1002/2014GB004904
LETSCHER AND MOORE ©2015. American Geophysical Union. All Rights Reserved. 326
the largest spatial coverage in the Atlantic Ocean (Figure 1a). Observations of DOC and DON are well distributedacross the ocean basins; however, DOP observations are concentrated in the Atlantic Ocean (Figures 1b and 1c)and are completely lacking in the Indian, Arctic, and Southern Oceans owing to its omission from many openocean biogeochemical studies. Notable data gaps for all DOM pools include the Mediterranean Sea and thewestern Pacific Ocean. Included in the data set are observations of DOM at two ocean time series stations—the Hawaii Ocean Time-series (HOT) in the North Pacific and the Bermuda Atlantic Time-series Station (BATS) inthe North Atlantic. Eight continuous years of DOMdata were selected from each time series (1993–2000 at HOT;2001–2008 at BATS) and averaged into eight annual profiles of DOC, DON, and DOP at both stations.
The DOM data are discussed in terms of the characteristics of the bulk pools of DOC, DON, and DOP as well asthe nonrefractory (nrDOM) pools. The nrDOM is calculated as the total observed DOM concentration less theconcentration of refractory DOM (rDOM) for each pool. As such, our definition of nrDOM contains both thesemilabile (lifetime=months to years) and semirefractory (lifetime=decades) fractions of DOM [Hansell, 2013].Histograms for observations of DOM concentrations below 1000m were found to be normally distributed(supporting information Figure S1); as such the rDOM concentrationswere determined by the asymptoticmeanconcentration of each DOM pool found in the bathypelagic (>1000m). Deep ocean DOC concentrations werefound to vary by basin [e.g., Hansell and Carlson, 1998] in the range 38.5–47μM, while no differences in deepocean DON (1.8± 0.4μM) and DOP (0.03± 0.02μM) concentrations were discerned, likely due to the largeranalytical error of deep ocean DON and DOP determinations [Hansell, 1993; Karl and Björkman, 2002]. Themeanand ±1 standard deviation (SD) of the rDOC concentrations for each basin calculated using normal distributionstatistics are reported in supporting information Table S2.
Marine DOM is advected throughout the ocean interior largely along isopycnal surfaces such that depth can bea poor proxy of the extent of aging and accumulated remineralization processes when comparing across oceanbasins. Thus, we found it appropriate to bin the DOM data set by neutral density (γn) for further analysis oftrends in DOM stoichiometry with greater density and along the flow path of interior water masses. Calculationof neutral density requires knowledge of the temperature, salinity, pressure, and geographic location of thewater sample [Jackett and McDougall, 1997]; however, our compiled DOM data set lacks temperature andsalinity data for many of the data. To overcome this limitation, we assigned the climatological monthly averagetemperature and salinity for each DOM data from the World Ocean Atlas [Locarnini et al., 2013; Zweng et al.,2013] and calculated its neutral density. Neutral density bins had a size of 0.5 kgm�3 density units aboveγn=26.0, decreasing to 0.2 kgm�3 units between γn=26.0 and 27.6. Below γn=27.5 (~1000 m), data coveragefor DON and DOP was sparse; therefore, only the trends in DOM stoichiometry on neutral density surfaceslighter than γn=27.5 are included in our analysis.
The stoichiometric ratio of C:N, N:P, and C:P (±1 SD) were calculated using normal distribution statistics followinga natural logarithm transformation of the data for both bulk DOM and nrDOM concentrations in each neutraldensity bin. Additionally, we calculated the Model II reduced major axis regression slope [Legendre andLegendre, 1998] between element-element plots of DOC versus DON, DON versus DOP, and DOC versus DOP fornrDOM in each neutral density bin. The slope of the regression between two DOM pools yields informationabout the net stoichiometry between production and remineralization of each element with respect to theother over the density horizon and environment investigated [Hopkinson and Vallino, 2005]. The associatederror for each Model II slope is reported as the 95% confidence interval surrounding the calculated slope and isa function of both the residuals variance and the number of data points in each regression.
2.2. Binary Mixing of Thermocline Waters
Following analysis of the global DOM stoichiometry and its remineralization, the data set was subdivided intofour ocean basin domains (North/South Atlantic and North/South Pacific) for further investigation of theregional variability in DOM preferential remineralization patterns. At this scale it is necessary to identifythe net stoichiometry of DOM remineralization processes that occur within defined water masses, whileremoving the contribution from mixing of preformed concentrations (inherited from the water massformation regions) along isopycnal surfaces. We have adopted an approach similar to that found in Carlsonet al. [2010] in which they applied a binary mixing model of northern and southern component mixingof thermocline waters across the North Atlantic to the investigation of DOC remineralization rates in themesopelagic realm. For each of the four ocean basins studied we defined neutral density layers for upperthermocline, subtropical mode waters, and lower thermocline water masses and identified end-member or
Global Biogeochemical Cycles 10.1002/2014GB004904
LETSCHER AND MOORE ©2015. American Geophysical Union. All Rights Reserved. 327
preformed quantities for potential temperature, salinity, [DOC], [DON], and [DOP] within the source regionsfor a northern component and a southern component (Table 1). The North Atlantic and North Pacific arebounded by the equator to the south with the southern component source region being defined as ±5°N/Sof the equator and the northern component source regions defined as the latitudes where the isopycnalsof the respective water masses outcrop at midlatitudes. The South Atlantic and South Pacific are similarlybounded to the north by the equator with the northern component defined at ±5°N/S and the southerncomponent defined at the midlatitude outcrop region. Water mass neutral density ranges for the Atlanticbasin are adopted from Carlson et al. [2010]; Pacific water mass neutral densities are from Talley et al. [2011].
The northern and southern components are most clearly distinguished by differences in potential temperature(θ) for a respective water mass (Table 1), and θ was used in our binary mixing analysis to calculate the fractionof northern versus southern component water in a given thermocline water parcel. The fractions of southern(Fs) and northern (Fn) component water can be calculated as follows:
Fs ¼ θºn � θobsð Þ= θºn � θºsð Þ (1)
Fn ¼ 1� Fs (2)
where θ°n and θ°s are the end-member θ for the northern and southern components and θobs is the observed θfor the water parcel. Fn and Fs can be combined with the preformed DOM concentrations for each watermass and component (Table 1) to calculate the preformed concentration (C°) for each observation within thethermocline as follows:
Cº ¼ FnCºn þ FsCºs (3)
where C°n and C°s are the preformedDOM concentration for the northern and southern components within thewater mass of interest. Lastly, the quantity of interest to our analysis, Cremin, is the change in DOM concentrationdue to remineralization processes after removing the contribution from mixing and is calculated as follows:
Cremin ¼ Cobs � Cº (4)
where Cobs is the observed DOM concentration for the water parcel. For the four ocean basin analysis wecalculate the Model II reduced major axis regression slopes using Cremin (Cremin versus Nremin; Nremin versusPremin; Cremin versus Premin) for each defined thermocline water mass. Also calculated are Model II regressionslopes for surface waters (defined as waters with γn< the top of the upper thermocline layer and/or< 100mdepth) and intermediate water masses (γn=27.0–27.5; Antarctic Intermediate Water in South Pacific northto 15°N, in South Atlantic north to 25°N; North Pacific Intermediate Water in the North Pacific; and SubpolarMode Water in the North Atlantic).
2.3. Biogeochemical Modeling With the BEC
Model simulations were performed using the Biogeochemical Elemental Cycling (BEC) model, of the oceancomponent of the Community Earth System Model version 1.2.1 (~3° × ~3° horizontal resolution; 60 verticallevels), which tracks six DOM pools: refractory and semilabile pools for each of DOC, DON, and DOP. DOMcycling in the model has been recently optimized including the fraction of primary productivity thataccumulates as DOM, the proportion of this production that is refractory, and the DOM lifetimes based on adata assimilation of, and validation against, the observational DOM data set compiled here [Letscher et al., 2015].DOM is produced within the ecosystem model by phytoplankton growth and grazing at a ratio of ~7% of netprimary productivity with a slightly modified Redfield C:N:P ratio of 117:16:1 [Anderson and Sarmiento, 1994].DOM remineralization by bacteria is parameterized by assigned lifetimes for each tracer, which differs betweenthe twomodel simulations employed in this study. Simulation REDFIELD assigns the optimized DOC parametersto all DOM tracers, routing 1% of DOM production to the refractory DOM pools while assigning the samelifetime (15 years in the euphotic zone, 5.5 years in the mesopelagic) to all semilabile pools; thus, DOMdecomposition follows the same 117:16:1 stoichiometry of production. Simulation VAR DOM employs variablestoichiometry for DOM production and remineralization. The fraction of refractory DOM varies as 1% forDOC, 1.15% for DON, and 0.3% for DOP. Semilabile tracers are assigned longer lifetimes (DOC=15 years;DON=15 years; DOP=60 year) in the model’s euphotic zone (< ~100m) and shorter lifetimes (DOC=5.5 years;DON=5 years; DOP=4 years) below. Each phytoplankton group in the BEC model can directly utilize the DOPpool as a P source when phosphate concentrations are low, in line with numerous studies documenting thisphenomenon [e.g., Björkman and Karl, 2003; Sohm and Capone, 2006; Orchard et al., 2010]. This process, which
Global Biogeochemical Cycles 10.1002/2014GB004904
LETSCHER AND MOORE ©2015. American Geophysical Union. All Rights Reserved. 328
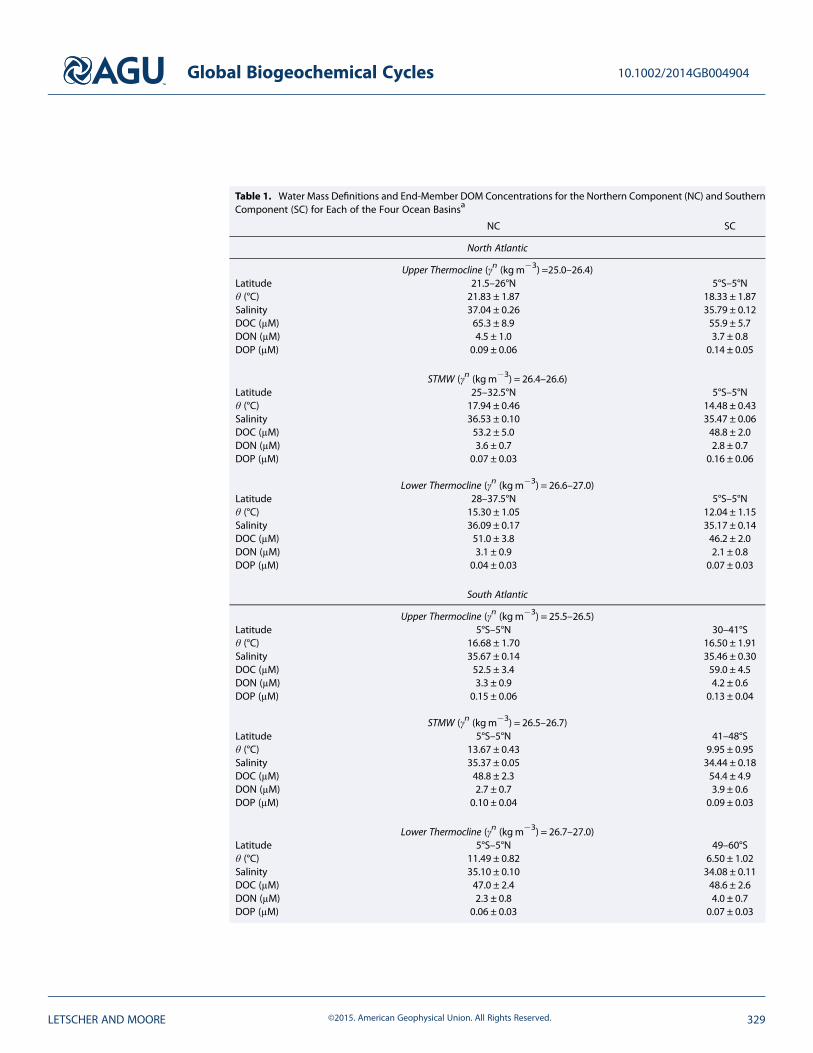
Table 1. Water Mass Definitions and End-Member DOM Concentrations for the Northern Component (NC) and SouthernComponent (SC) for Each of the Four Ocean Basinsa
NC SC
North Atlantic
Upper Thermocline (γn (kgm�3) =25.0–26.4)Latitude 21.5–26°N 5°S–5°Nθ (°C) 21.83 ± 1.87 18.33 ± 1.87Salinity 37.04 ± 0.26 35.79 ± 0.12DOC (μM) 65.3 ± 8.9 55.9 ± 5.7DON (μM) 4.5 ± 1.0 3.7 ± 0.8DOP (μM) 0.09 ± 0.06 0.14 ± 0.05
STMW (γn (kgm�3) = 26.4–26.6)Latitude 25–32.5°N 5°S–5°Nθ (°C) 17.94 ± 0.46 14.48 ± 0.43Salinity 36.53 ± 0.10 35.47 ± 0.06DOC (μM) 53.2 ± 5.0 48.8 ± 2.0DON (μM) 3.6 ± 0.7 2.8 ± 0.7DOP (μM) 0.07 ± 0.03 0.16 ± 0.06
Lower Thermocline (γn (kgm�3) = 26.6–27.0)Latitude 28–37.5°N 5°S–5°Nθ (°C) 15.30 ± 1.05 12.04 ± 1.15Salinity 36.09 ± 0.17 35.17 ± 0.14DOC (μM) 51.0 ± 3.8 46.2 ± 2.0DON (μM) 3.1 ± 0.9 2.1 ± 0.8DOP (μM) 0.04 ± 0.03 0.07 ± 0.03
South Atlantic
Upper Thermocline (γn (kgm�3) = 25.5–26.5)Latitude 5°S–5°N 30–41°Sθ (°C) 16.68 ± 1.70 16.50 ± 1.91Salinity 35.67 ± 0.14 35.46 ± 0.30DOC (μM) 52.5 ± 3.4 59.0 ± 4.5DON (μM) 3.3 ± 0.9 4.2 ± 0.6DOP (μM) 0.15 ± 0.06 0.13 ± 0.04
STMW (γn (kgm�3) = 26.5–26.7)Latitude 5°S–5°N 41–48°Sθ (°C) 13.67 ± 0.43 9.95 ± 0.95Salinity 35.37 ± 0.05 34.44 ± 0.18DOC (μM) 48.8 ± 2.3 54.4 ± 4.9DON (μM) 2.7 ± 0.7 3.9 ± 0.6DOP (μM) 0.10 ± 0.04 0.09 ± 0.03
Lower Thermocline (γn (kgm�3) = 26.7–27.0)Latitude 5°S–5°N 49–60°Sθ (°C) 11.49 ± 0.82 6.50 ± 1.02Salinity 35.10 ± 0.10 34.08 ± 0.11DOC (μM) 47.0 ± 2.4 48.6 ± 2.6DON (μM) 2.3 ± 0.8 4.0 ± 0.7DOP (μM) 0.06 ± 0.03 0.07 ± 0.03
Global Biogeochemical Cycles 10.1002/2014GB004904
LETSCHER AND MOORE ©2015. American Geophysical Union. All Rights Reserved. 329
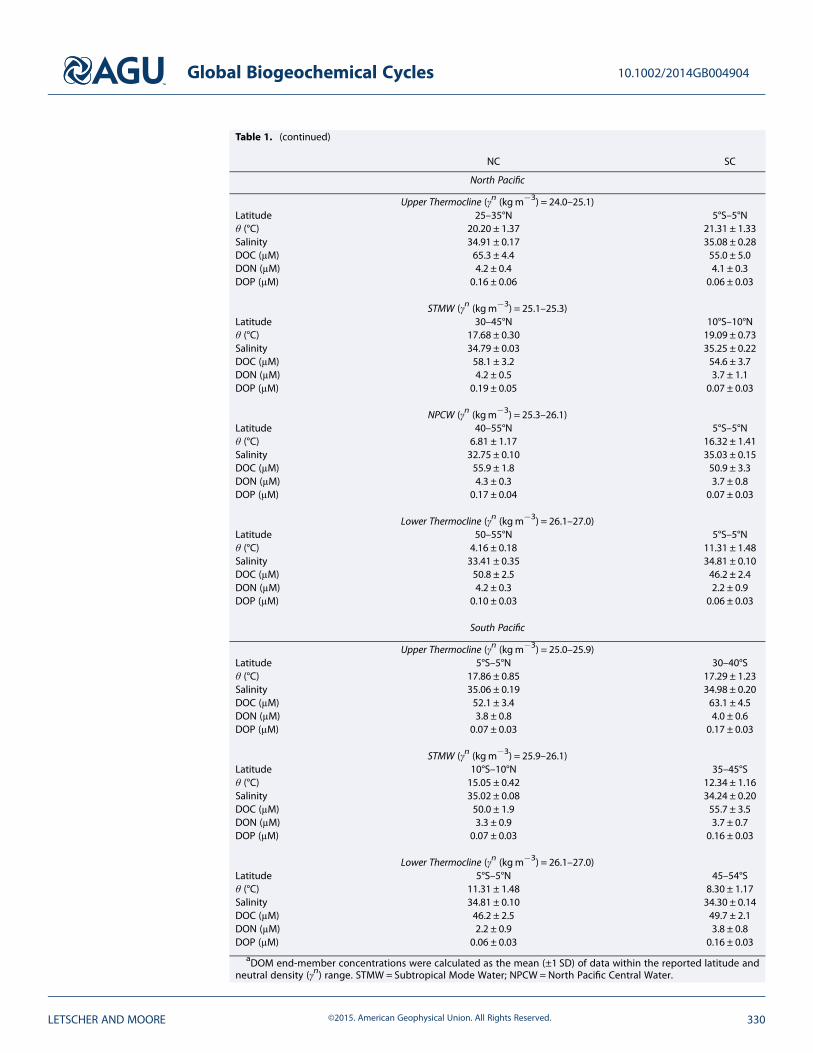
Table 1. (continued)
NC SC
North Pacific
Upper Thermocline (γn (kgm�3) = 24.0–25.1)Latitude 25–35°N 5°S–5°Nθ (°C) 20.20 ± 1.37 21.31 ± 1.33Salinity 34.91 ± 0.17 35.08 ± 0.28DOC (μM) 65.3 ± 4.4 55.0 ± 5.0DON (μM) 4.2 ± 0.4 4.1 ± 0.3DOP (μM) 0.16 ± 0.06 0.06 ± 0.03
STMW (γn (kgm�3) = 25.1–25.3)Latitude 30–45°N 10°S–10°Nθ (°C) 17.68 ± 0.30 19.09 ± 0.73Salinity 34.79 ± 0.03 35.25 ± 0.22DOC (μM) 58.1 ± 3.2 54.6 ± 3.7DON (μM) 4.2 ± 0.5 3.7 ± 1.1DOP (μM) 0.19 ± 0.05 0.07 ± 0.03
NPCW (γn (kgm�3) = 25.3–26.1)Latitude 40–55°N 5°S–5°Nθ (°C) 6.81 ± 1.17 16.32 ± 1.41Salinity 32.75 ± 0.10 35.03 ± 0.15DOC (μM) 55.9 ± 1.8 50.9 ± 3.3DON (μM) 4.3 ± 0.3 3.7 ± 0.8DOP (μM) 0.17 ± 0.04 0.07 ± 0.03
Lower Thermocline (γn (kgm�3) = 26.1–27.0)Latitude 50–55°N 5°S–5°Nθ (°C) 4.16 ± 0.18 11.31 ± 1.48Salinity 33.41 ± 0.35 34.81 ± 0.10DOC (μM) 50.8 ± 2.5 46.2 ± 2.4DON (μM) 4.2 ± 0.3 2.2 ± 0.9DOP (μM) 0.10 ± 0.03 0.06 ± 0.03
South Pacific
Upper Thermocline (γn (kgm�3) = 25.0–25.9)Latitude 5°S–5°N 30–40°Sθ (°C) 17.86 ± 0.85 17.29 ± 1.23Salinity 35.06 ± 0.19 34.98 ± 0.20DOC (μM) 52.1 ± 3.4 63.1 ± 4.5DON (μM) 3.8 ± 0.8 4.0 ± 0.6DOP (μM) 0.07 ± 0.03 0.17 ± 0.03
STMW (γn (kgm�3) = 25.9–26.1)Latitude 10°S–10°N 35–45°Sθ (°C) 15.05 ± 0.42 12.34 ± 1.16Salinity 35.02 ± 0.08 34.24 ± 0.20DOC (μM) 50.0 ± 1.9 55.7 ± 3.5DON (μM) 3.3 ± 0.9 3.7 ± 0.7DOP (μM) 0.07 ± 0.03 0.16 ± 0.03
Lower Thermocline (γn (kgm�3) = 26.1–27.0)Latitude 5°S–5°N 45–54°Sθ (°C) 11.31 ± 1.48 8.30 ± 1.17Salinity 34.81 ± 0.10 34.30 ± 0.14DOC (μM) 46.2 ± 2.5 49.7 ± 2.1DON (μM) 2.2 ± 0.9 3.8 ± 0.8DOP (μM) 0.06 ± 0.03 0.16 ± 0.03
aDOM end-member concentrations were calculated as the mean (±1 SD) of data within the reported latitude andneutral density (γn) range. STMW = Subtropical Mode Water; NPCW = North Pacific Central Water.
Global Biogeochemical Cycles 10.1002/2014GB004904
LETSCHER AND MOORE ©2015. American Geophysical Union. All Rights Reserved. 330
represents a formof preferential utilization of DOP relative to DOC andDON, is allowed in the VARDOM simulationbut is turned off for the REDFIELD simulation. We perform a third simulation, NO DOPup, which is identicalto VAR DOM except that the ability of phytoplankton to directly utilize the DOP pool as a P source is turnedoff in order to isolate this form of preferential DOP utilization from preferential remineralization by bacteria.A fourth simulation, NO DOM, is also included in which all primary productivity is routed to production ofparticulate organic matter, eliminating DOM cycling from the ecosystem. Optimization of the DOM parametersand validation of the VAR DOM simulation against observations is detailed elsewhere [Letscher et al., 2015]. BECsimulated semilabile DOM should be considered equivalent to the calculated nrDOM from the observations.
3. Results3.1. DOM Stoichiometry
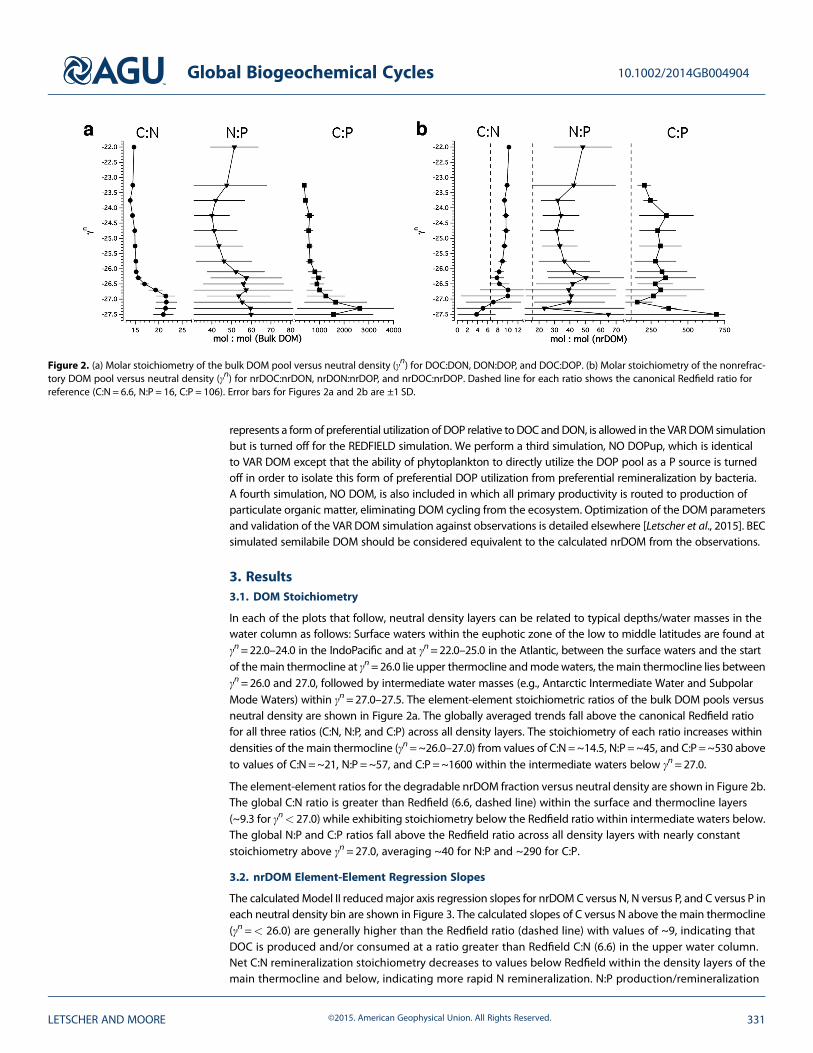
In each of the plots that follow, neutral density layers can be related to typical depths/water masses in thewater column as follows: Surface waters within the euphotic zone of the low to middle latitudes are found atγn=22.0–24.0 in the IndoPacific and at γn=22.0–25.0 in the Atlantic, between the surface waters and the startof themain thermocline at γn=26.0 lie upper thermocline andmodewaters, themain thermocline lies betweenγn=26.0 and 27.0, followed by intermediate water masses (e.g., Antarctic Intermediate Water and SubpolarMode Waters) within γn=27.0–27.5. The element-element stoichiometric ratios of the bulk DOM pools versusneutral density are shown in Figure 2a. The globally averaged trends fall above the canonical Redfield ratiofor all three ratios (C:N, N:P, and C:P) across all density layers. The stoichiometry of each ratio increases withindensities of the main thermocline (γn=~26.0–27.0) from values of C:N=~14.5, N:P=~45, and C:P=~530 aboveto values of C:N=~21, N:P =~57, and C:P=~1600 within the intermediate waters below γn=27.0.
The element-element ratios for the degradable nrDOM fraction versus neutral density are shown in Figure 2b.The global C:N ratio is greater than Redfield (6.6, dashed line) within the surface and thermocline layers(~9.3 for γn< 27.0) while exhibiting stoichiometry below the Redfield ratio within intermediate waters below.The global N:P and C:P ratios fall above the Redfield ratio across all density layers with nearly constantstoichiometry above γn=27.0, averaging ~40 for N:P and ~290 for C:P.
3.2. nrDOM Element-Element Regression Slopes
The calculated Model II reducedmajor axis regression slopes for nrDOM C versus N, N versus P, and C versus P ineach neutral density bin are shown in Figure 3. The calculated slopes of C versus N above the main thermocline(γn=< 26.0) are generally higher than the Redfield ratio (dashed line) with values of ~9, indicating thatDOC is produced and/or consumed at a ratio greater than Redfield C:N (6.6) in the upper water column.Net C:N remineralization stoichiometry decreases to values below Redfield within the density layers of themain thermocline and below, indicating more rapid N remineralization. N:P production/remineralization
Figure 2. (a) Molar stoichiometry of the bulk DOM pool versus neutral density (γn) for DOC:DON, DON:DOP, and DOC:DOP. (b) Molar stoichiometry of the nonrefrac-tory DOM pool versus neutral density (γn) for nrDOC:nrDON, nrDON:nrDOP, and nrDOC:nrDOP. Dashed line for each ratio shows the canonical Redfield ratio forreference (C:N = 6.6, N:P = 16, C:P = 106). Error bars for Figures 2a and 2b are ±1 SD.
Global Biogeochemical Cycles 10.1002/2014GB004904
LETSCHER AND MOORE ©2015. American Geophysical Union. All Rights Reserved. 331
stoichiometry closely matches Redfieldproportions above the main thermoclinewith an increase toward more rapidN recycling at deeper densities. Similarto the trend with neutral densityobserved for C versus N, the slopes ofC versus P are elevated with respect toRedfield above the main thermocline(average = ~200 for γn =< 26.0),switching to lower ratios below,indicative of faster P remineralization.
3.3. Preferential RemineralizationPatterns of the nrDOM Pool
In order to examine the topic ofpreferential remineralization (or netproduction/remineralization processesif within the surface euphotic layer) ofone element with respect to another itis necessary to compare the slope ofnrDOM element-element regressionswith the corresponding in situ nrDOMstoichiometry within each density layer.
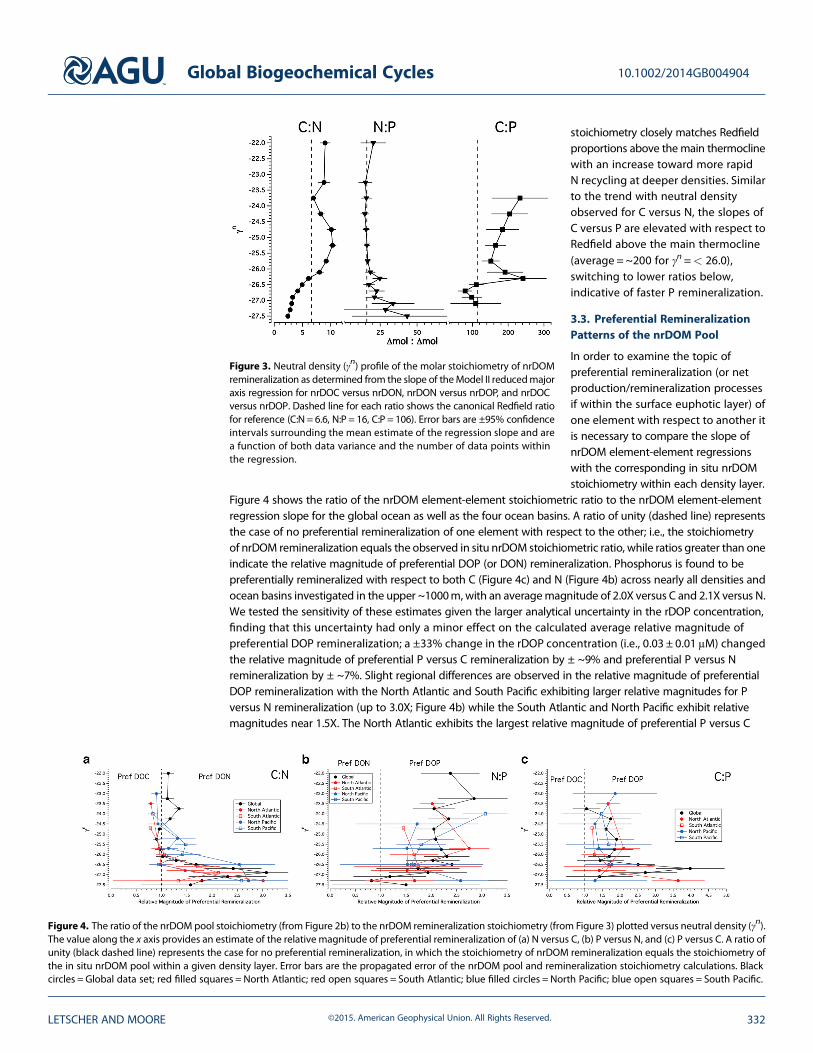
Figure 4 shows the ratio of the nrDOM element-element stoichiometric ratio to the nrDOM element-elementregression slope for the global ocean as well as the four ocean basins. A ratio of unity (dashed line) representsthe case of no preferential remineralization of one element with respect to the other; i.e., the stoichiometryof nrDOM remineralization equals the observed in situ nrDOM stoichiometric ratio, while ratios greater than oneindicate the relative magnitude of preferential DOP (or DON) remineralization. Phosphorus is found to bepreferentially remineralized with respect to both C (Figure 4c) and N (Figure 4b) across nearly all densities andocean basins investigated in the upper ~1000m, with an averagemagnitude of 2.0X versus C and 2.1X versus N.We tested the sensitivity of these estimates given the larger analytical uncertainty in the rDOP concentration,finding that this uncertainty had only a minor effect on the calculated average relative magnitude ofpreferential DOP remineralization; a ±33% change in the rDOP concentration (i.e., 0.03 ± 0.01 μM) changedthe relative magnitude of preferential P versus C remineralization by ± ~9% and preferential P versus Nremineralization by ± ~7%. Slight regional differences are observed in the relative magnitude of preferentialDOP remineralization with the North Atlantic and South Pacific exhibiting larger relative magnitudes for Pversus N remineralization (up to 3.0X; Figure 4b) while the South Atlantic and North Pacific exhibit relativemagnitudes near 1.5X. The North Atlantic exhibits the largest relative magnitude of preferential P versus C
Figure 4. The ratio of the nrDOM pool stoichiometry (from Figure 2b) to the nrDOM remineralization stoichiometry (from Figure 3) plotted versus neutral density (γn).The value along the x axis provides an estimate of the relative magnitude of preferential remineralization of (a) N versus C, (b) P versus N, and (c) P versus C. A ratio ofunity (black dashed line) represents the case for no preferential remineralization, in which the stoichiometry of nrDOM remineralization equals the stoichiometry ofthe in situ nrDOM pool within a given density layer. Error bars are the propagated error of the nrDOM pool and remineralization stoichiometry calculations. Blackcircles = Global data set; red filled squares = North Atlantic; red open squares = South Atlantic; blue filled circles = North Pacific; blue open squares = South Pacific.
Figure 3. Neutral density (γn) profile of the molar stoichiometry of nrDOMremineralization as determined from the slope of theModel II reducedmajoraxis regression for nrDOC versus nrDON, nrDON versus nrDOP, and nrDOCversus nrDOP. Dashed line for each ratio shows the canonical Redfield ratiofor reference (C:N = 6.6, N:P = 16, C:P = 106). Error bars are ±95% confidenceintervals surrounding the mean estimate of the regression slope and area function of both data variance and the number of data points withinthe regression.
Global Biogeochemical Cycles 10.1002/2014GB004904
LETSCHER AND MOORE ©2015. American Geophysical Union. All Rights Reserved. 332
remineralization (up to 3.5X; Figure 4c), with the other three ocean basins having values near 1.5X. DOCand DON are remineralized in proportions approximately equal to the C:N stoichiometry above the mainthermocline (γn< 26.0; Figure 4a), with evidence for preferential remineralization of DONwithin the thermoclineand intermediate layers (γn=26.0–27.5: Figure 4a) that is common to all four ocean basins investigated.
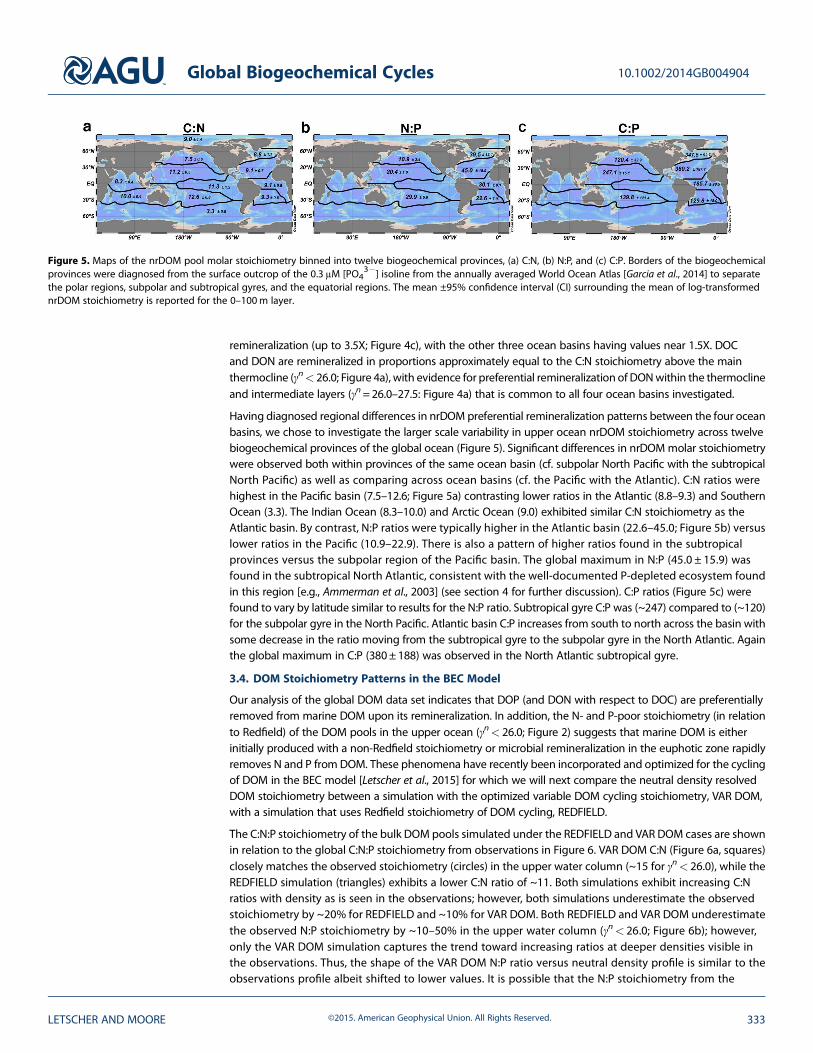
Having diagnosed regional differences in nrDOM preferential remineralization patterns between the four oceanbasins, we chose to investigate the larger scale variability in upper ocean nrDOM stoichiometry across twelvebiogeochemical provinces of the global ocean (Figure 5). Significant differences in nrDOMmolar stoichiometrywere observed both within provinces of the same ocean basin (cf. subpolar North Pacific with the subtropicalNorth Pacific) as well as comparing across ocean basins (cf. the Pacific with the Atlantic). C:N ratios werehighest in the Pacific basin (7.5–12.6; Figure 5a) contrasting lower ratios in the Atlantic (8.8–9.3) and SouthernOcean (3.3). The Indian Ocean (8.3–10.0) and Arctic Ocean (9.0) exhibited similar C:N stoichiometry as theAtlantic basin. By contrast, N:P ratios were typically higher in the Atlantic basin (22.6–45.0; Figure 5b) versuslower ratios in the Pacific (10.9–22.9). There is also a pattern of higher ratios found in the subtropicalprovinces versus the subpolar region of the Pacific basin. The global maximum in N:P (45.0 ± 15.9) wasfound in the subtropical North Atlantic, consistent with the well-documented P-depleted ecosystem foundin this region [e.g., Ammerman et al., 2003] (see section 4 for further discussion). C:P ratios (Figure 5c) werefound to vary by latitude similar to results for the N:P ratio. Subtropical gyre C:P was (~247) compared to (~120)for the subpolar gyre in the North Pacific. Atlantic basin C:P increases from south to north across the basin withsome decrease in the ratio moving from the subtropical gyre to the subpolar gyre in the North Atlantic. Againthe global maximum in C:P (380±188) was observed in the North Atlantic subtropical gyre.
3.4. DOM Stoichiometry Patterns in the BEC Model
Our analysis of the global DOM data set indicates that DOP (and DON with respect to DOC) are preferentiallyremoved from marine DOM upon its remineralization. In addition, the N- and P-poor stoichiometry (in relationto Redfield) of the DOM pools in the upper ocean (γn< 26.0; Figure 2) suggests that marine DOM is eitherinitially produced with a non-Redfield stoichiometry or microbial remineralization in the euphotic zone rapidlyremoves N and P from DOM. These phenomena have recently been incorporated and optimized for the cyclingof DOM in the BEC model [Letscher et al., 2015] for which we will next compare the neutral density resolvedDOM stoichiometry between a simulation with the optimized variable DOM cycling stoichiometry, VAR DOM,with a simulation that uses Redfield stoichiometry of DOM cycling, REDFIELD.
The C:N:P stoichiometry of the bulk DOM pools simulated under the REDFIELD and VAR DOM cases are shownin relation to the global C:N:P stoichiometry from observations in Figure 6. VAR DOM C:N (Figure 6a, squares)closely matches the observed stoichiometry (circles) in the upper water column (~15 for γn< 26.0), while theREDFIELD simulation (triangles) exhibits a lower C:N ratio of ~11. Both simulations exhibit increasing C:Nratios with density as is seen in the observations; however, both simulations underestimate the observedstoichiometry by ~20% for REDFIELD and ~10% for VAR DOM. Both REDFIELD and VAR DOM underestimatethe observed N:P stoichiometry by ~10–50% in the upper water column (γn< 26.0; Figure 6b); however,only the VAR DOM simulation captures the trend toward increasing ratios at deeper densities visible inthe observations. Thus, the shape of the VAR DOM N:P ratio versus neutral density profile is similar to theobservations profile albeit shifted to lower values. It is possible that the N:P stoichiometry from the
Figure 5. Maps of the nrDOM pool molar stoichiometry binned into twelve biogeochemical provinces, (a) C:N, (b) N:P, and (c) C:P. Borders of the biogeochemicalprovinces were diagnosed from the surface outcrop of the 0.3 μM [PO4
3�] isoline from the annually averaged World Ocean Atlas [Garcia et al., 2014] to separatethe polar regions, subpolar and subtropical gyres, and the equatorial regions. The mean ±95% confidence interval (CI) surrounding the mean of log-transformednrDOM stoichiometry is reported for the 0–100m layer.
Global Biogeochemical Cycles 10.1002/2014GB004904
LETSCHER AND MOORE ©2015. American Geophysical Union. All Rights Reserved. 333
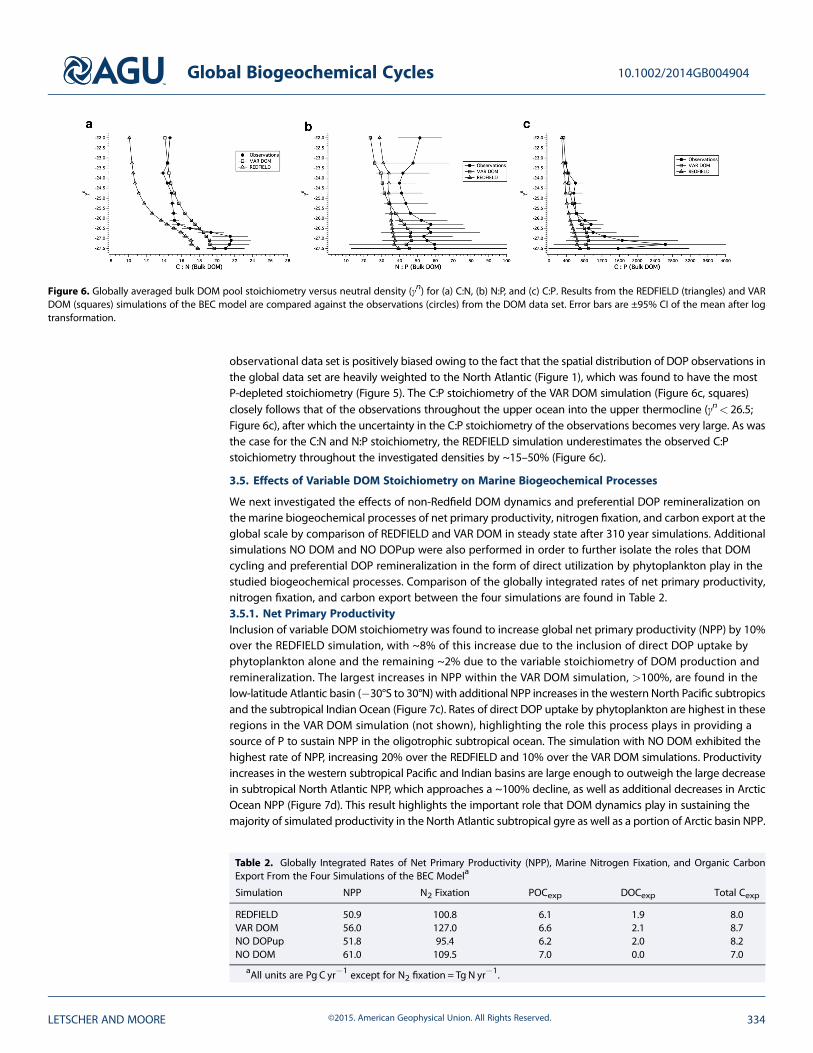
observational data set is positively biased owing to the fact that the spatial distribution of DOP observations inthe global data set are heavily weighted to the North Atlantic (Figure 1), which was found to have the mostP-depleted stoichiometry (Figure 5). The C:P stoichiometry of the VAR DOM simulation (Figure 6c, squares)closely follows that of the observations throughout the upper ocean into the upper thermocline (γn< 26.5;Figure 6c), after which the uncertainty in the C:P stoichiometry of the observations becomes very large. As wasthe case for the C:N and N:P stoichiometry, the REDFIELD simulation underestimates the observed C:Pstoichiometry throughout the investigated densities by ~15–50% (Figure 6c).
3.5. Effects of Variable DOM Stoichiometry on Marine Biogeochemical Processes
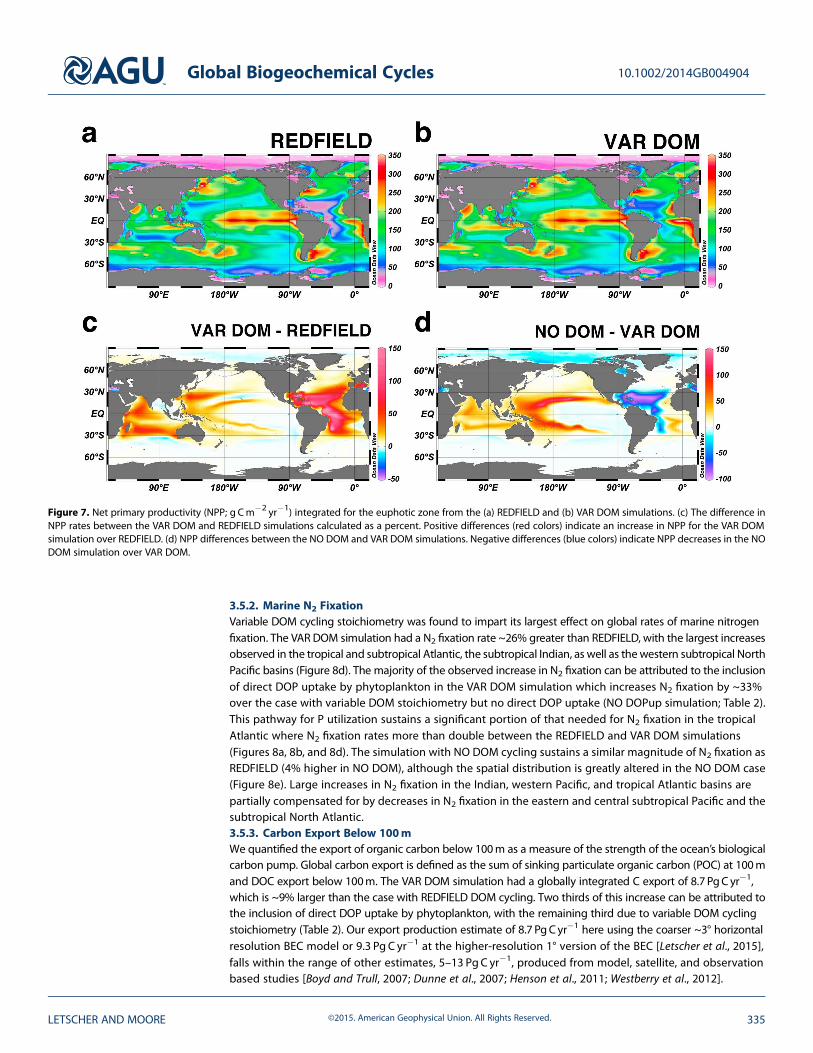
We next investigated the effects of non-Redfield DOM dynamics and preferential DOP remineralization onthe marine biogeochemical processes of net primary productivity, nitrogen fixation, and carbon export at theglobal scale by comparison of REDFIELD and VAR DOM in steady state after 310 year simulations. Additionalsimulations NO DOM and NO DOPup were also performed in order to further isolate the roles that DOMcycling and preferential DOP remineralization in the form of direct utilization by phytoplankton play in thestudied biogeochemical processes. Comparison of the globally integrated rates of net primary productivity,nitrogen fixation, and carbon export between the four simulations are found in Table 2.3.5.1. Net Primary ProductivityInclusion of variable DOM stoichiometry was found to increase global net primary productivity (NPP) by 10%over the REDFIELD simulation, with ~8% of this increase due to the inclusion of direct DOP uptake byphytoplankton alone and the remaining ~2% due to the variable stoichiometry of DOM production andremineralization. The largest increases in NPP within the VAR DOM simulation, >100%, are found in thelow-latitude Atlantic basin (�30°S to 30°N) with additional NPP increases in the western North Pacific subtropicsand the subtropical Indian Ocean (Figure 7c). Rates of direct DOP uptake by phytoplankton are highest in theseregions in the VAR DOM simulation (not shown), highlighting the role this process plays in providing asource of P to sustain NPP in the oligotrophic subtropical ocean. The simulation with NO DOM exhibited thehighest rate of NPP, increasing 20% over the REDFIELD and 10% over the VAR DOM simulations. Productivityincreases in the western subtropical Pacific and Indian basins are large enough to outweigh the large decreasein subtropical North Atlantic NPP, which approaches a ~100% decline, as well as additional decreases in ArcticOcean NPP (Figure 7d). This result highlights the important role that DOM dynamics play in sustaining themajority of simulated productivity in the North Atlantic subtropical gyre as well as a portion of Arctic basin NPP.
Table 2. Globally Integrated Rates of Net Primary Productivity (NPP), Marine Nitrogen Fixation, and Organic CarbonExport From the Four Simulations of the BEC Modela
Simulation NPP N2 Fixation POCexp DOCexp Total Cexp
REDFIELD 50.9 100.8 6.1 1.9 8.0VAR DOM 56.0 127.0 6.6 2.1 8.7NO DOPup 51.8 95.4 6.2 2.0 8.2NO DOM 61.0 109.5 7.0 0.0 7.0
aAll units are Pg C yr�1 except for N2 fixation = Tg N yr�1.
Figure 6. Globally averaged bulk DOM pool stoichiometry versus neutral density (γn) for (a) C:N, (b) N:P, and (c) C:P. Results from the REDFIELD (triangles) and VARDOM (squares) simulations of the BEC model are compared against the observations (circles) from the DOM data set. Error bars are ±95% CI of the mean after logtransformation.
Global Biogeochemical Cycles 10.1002/2014GB004904
LETSCHER AND MOORE ©2015. American Geophysical Union. All Rights Reserved. 334
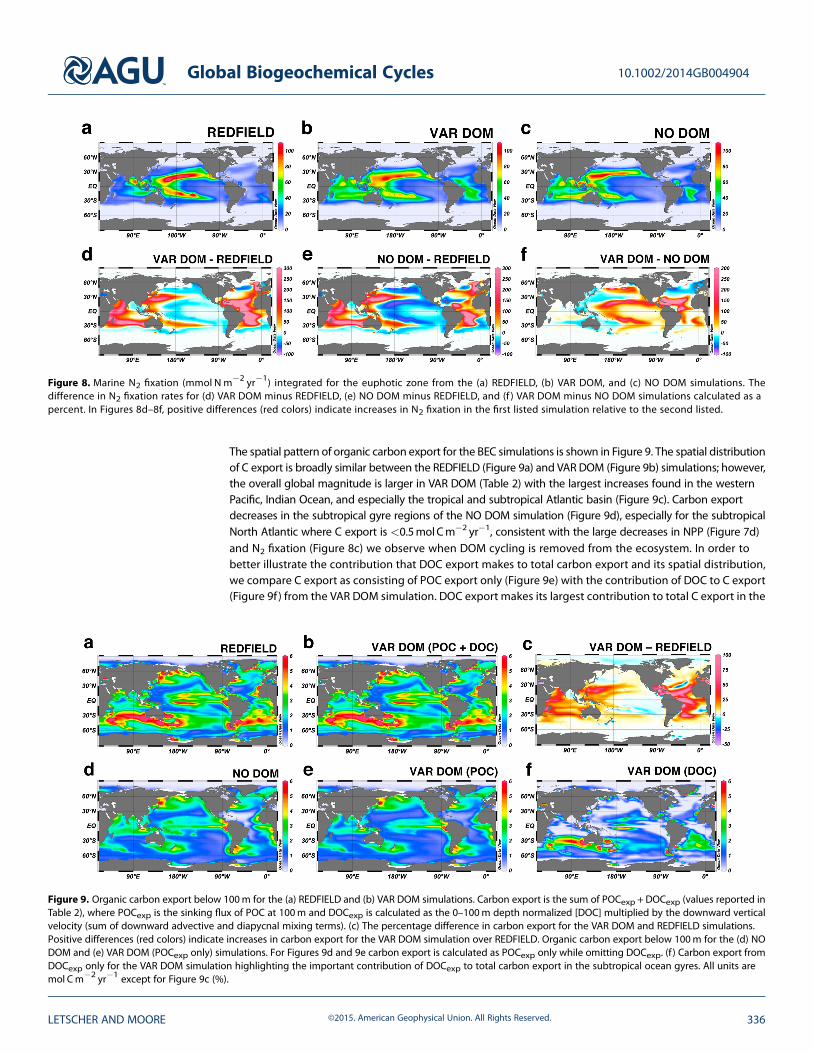
3.5.2. Marine N2 FixationVariable DOM cycling stoichiometry was found to impart its largest effect on global rates of marine nitrogenfixation. The VAR DOM simulation had a N2 fixation rate ~26% greater than REDFIELD, with the largest increasesobserved in the tropical and subtropical Atlantic, the subtropical Indian, as well as thewestern subtropical NorthPacific basins (Figure 8d). The majority of the observed increase in N2 fixation can be attributed to the inclusionof direct DOP uptake by phytoplankton in the VAR DOM simulation which increases N2 fixation by ~33%over the case with variable DOM stoichiometry but no direct DOP uptake (NO DOPup simulation; Table 2).This pathway for P utilization sustains a significant portion of that needed for N2 fixation in the tropicalAtlantic where N2 fixation rates more than double between the REDFIELD and VAR DOM simulations(Figures 8a, 8b, and 8d). The simulation with NO DOM cycling sustains a similar magnitude of N2 fixation asREDFIELD (4% higher in NO DOM), although the spatial distribution is greatly altered in the NO DOM case(Figure 8e). Large increases in N2 fixation in the Indian, western Pacific, and tropical Atlantic basins arepartially compensated for by decreases in N2 fixation in the eastern and central subtropical Pacific and thesubtropical North Atlantic.3.5.3. Carbon Export Below 100mWe quantified the export of organic carbon below 100m as a measure of the strength of the ocean’s biologicalcarbon pump. Global carbon export is defined as the sum of sinking particulate organic carbon (POC) at 100mand DOC export below 100m. The VAR DOM simulation had a globally integrated C export of 8.7 PgC yr�1,which is ~9% larger than the case with REDFIELD DOM cycling. Two thirds of this increase can be attributed tothe inclusion of direct DOP uptake by phytoplankton, with the remaining third due to variable DOM cyclingstoichiometry (Table 2). Our export production estimate of 8.7 PgC yr�1 here using the coarser ~3° horizontalresolution BEC model or 9.3 Pg C yr�1 at the higher-resolution 1° version of the BEC [Letscher et al., 2015],falls within the range of other estimates, 5–13 Pg C yr�1, produced from model, satellite, and observationbased studies [Boyd and Trull, 2007; Dunne et al., 2007; Henson et al., 2011; Westberry et al., 2012].
Figure 7. Net primary productivity (NPP; g Cm�2 yr�1) integrated for the euphotic zone from the (a) REDFIELD and (b) VAR DOM simulations. (c) The difference inNPP rates between the VAR DOM and REDFIELD simulations calculated as a percent. Positive differences (red colors) indicate an increase in NPP for the VAR DOMsimulation over REDFIELD. (d) NPP differences between the NO DOM and VAR DOM simulations. Negative differences (blue colors) indicate NPP decreases in the NODOM simulation over VAR DOM.
Global Biogeochemical Cycles 10.1002/2014GB004904
LETSCHER AND MOORE ©2015. American Geophysical Union. All Rights Reserved. 335
The spatial pattern of organic carbon export for the BEC simulations is shown in Figure 9. The spatial distributionof C export is broadly similar between the REDFIELD (Figure 9a) and VAR DOM (Figure 9b) simulations; however,the overall global magnitude is larger in VAR DOM (Table 2) with the largest increases found in the westernPacific, Indian Ocean, and especially the tropical and subtropical Atlantic basin (Figure 9c). Carbon exportdecreases in the subtropical gyre regions of the NO DOM simulation (Figure 9d), especially for the subtropicalNorth Atlantic where C export is <0.5molCm�2 yr�1, consistent with the large decreases in NPP (Figure 7d)and N2 fixation (Figure 8c) we observe when DOM cycling is removed from the ecosystem. In order tobetter illustrate the contribution that DOC export makes to total carbon export and its spatial distribution,we compare C export as consisting of POC export only (Figure 9e) with the contribution of DOC to C export(Figure 9f ) from the VAR DOM simulation. DOC export makes its largest contribution to total C export in the
Figure 9. Organic carbon export below 100m for the (a) REDFIELD and (b) VAR DOM simulations. Carbon export is the sum of POCexp + DOCexp (values reported inTable 2), where POCexp is the sinking flux of POC at 100m and DOCexp is calculated as the 0–100m depth normalized [DOC] multiplied by the downward verticalvelocity (sum of downward advective and diapycnal mixing terms). (c) The percentage difference in carbon export for the VAR DOM and REDFIELD simulations.Positive differences (red colors) indicate increases in carbon export for the VAR DOM simulation over REDFIELD. Organic carbon export below 100m for the (d) NODOM and (e) VAR DOM (POCexp only) simulations. For Figures 9d and 9e carbon export is calculated as POCexp only while omitting DOCexp. (f ) Carbon export fromDOCexp only for the VAR DOM simulation highlighting the important contribution of DOCexp to total carbon export in the subtropical ocean gyres. All units aremol Cm�2 yr�1 except for Figure 9c (%).
Figure 8. Marine N2 fixation (mmol N m�2 yr�1) integrated for the euphotic zone from the (a) REDFIELD, (b) VAR DOM, and (c) NO DOM simulations. Thedifference in N2 fixation rates for (d) VAR DOM minus REDFIELD, (e) NO DOM minus REDFIELD, and (f ) VAR DOM minus NO DOM simulations calculated as apercent. In Figures 8d–8f, positive differences (red colors) indicate increases in N2 fixation in the first listed simulation relative to the second listed.
Global Biogeochemical Cycles 10.1002/2014GB004904
LETSCHER AND MOORE ©2015. American Geophysical Union. All Rights Reserved. 336
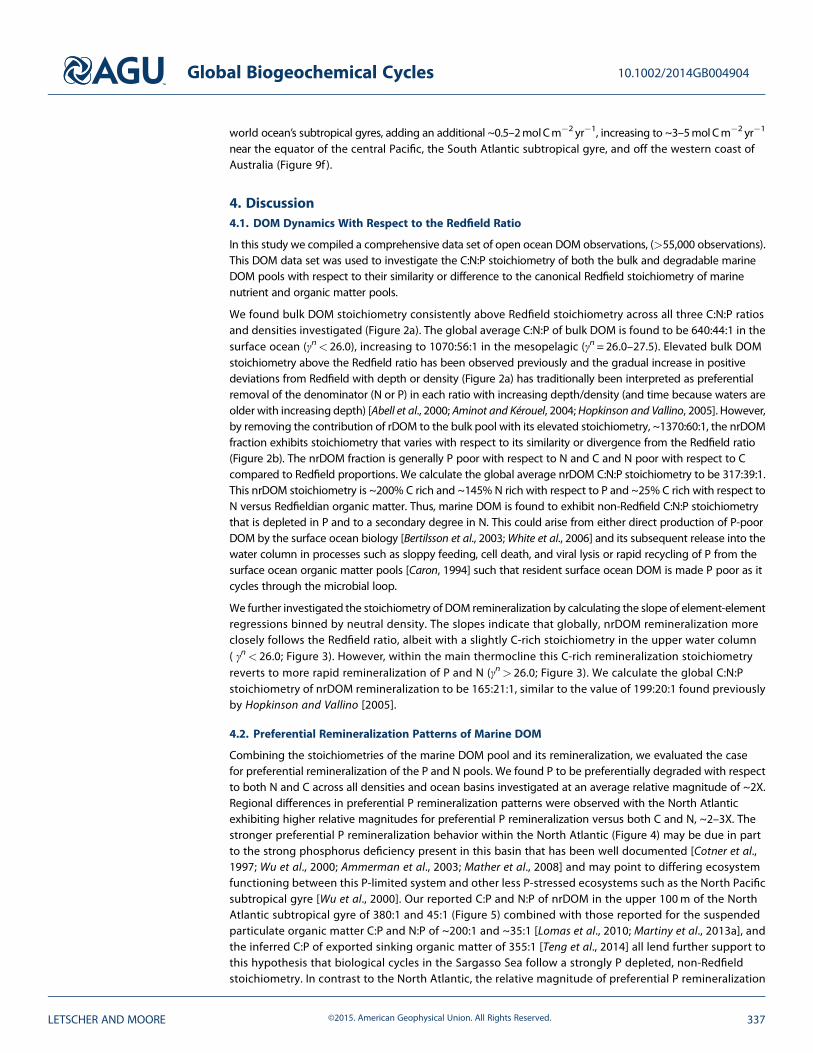
world ocean’s subtropical gyres, adding an additional ~0.5–2molCm�2 yr�1, increasing to ~3–5mol Cm�2 yr�1
near the equator of the central Pacific, the South Atlantic subtropical gyre, and off the western coast ofAustralia (Figure 9f ).
4. Discussion4.1. DOM Dynamics With Respect to the Redfield Ratio
In this study we compiled a comprehensive data set of open ocean DOM observations, (>55,000 observations).This DOM data set was used to investigate the C:N:P stoichiometry of both the bulk and degradable marineDOM pools with respect to their similarity or difference to the canonical Redfield stoichiometry of marinenutrient and organic matter pools.
We found bulk DOM stoichiometry consistently above Redfield stoichiometry across all three C:N:P ratiosand densities investigated (Figure 2a). The global average C:N:P of bulk DOM is found to be 640:44:1 in thesurface ocean (γn< 26.0), increasing to 1070:56:1 in the mesopelagic (γn= 26.0–27.5). Elevated bulk DOMstoichiometry above the Redfield ratio has been observed previously and the gradual increase in positivedeviations from Redfield with depth or density (Figure 2a) has traditionally been interpreted as preferentialremoval of the denominator (N or P) in each ratio with increasing depth/density (and time because waters areolder with increasing depth) [Abell et al., 2000; Aminot and Kérouel, 2004; Hopkinson and Vallino, 2005]. However,by removing the contribution of rDOM to the bulk pool with its elevated stoichiometry, ~1370:60:1, the nrDOMfraction exhibits stoichiometry that varies with respect to its similarity or divergence from the Redfield ratio(Figure 2b). The nrDOM fraction is generally P poor with respect to N and C and N poor with respect to Ccompared to Redfield proportions. We calculate the global average nrDOM C:N:P stoichiometry to be 317:39:1.This nrDOM stoichiometry is ~200% C rich and ~145% N rich with respect to P and ~25% C rich with respect toN versus Redfieldian organic matter. Thus, marine DOM is found to exhibit non-Redfield C:N:P stoichiometrythat is depleted in P and to a secondary degree in N. This could arise from either direct production of P-poorDOM by the surface ocean biology [Bertilsson et al., 2003;White et al., 2006] and its subsequent release into thewater column in processes such as sloppy feeding, cell death, and viral lysis or rapid recycling of P from thesurface ocean organic matter pools [Caron, 1994] such that resident surface ocean DOM is made P poor as itcycles through the microbial loop.
We further investigated the stoichiometry of DOM remineralization by calculating the slope of element-elementregressions binned by neutral density. The slopes indicate that globally, nrDOM remineralization moreclosely follows the Redfield ratio, albeit with a slightly C-rich stoichiometry in the upper water column( γn< 26.0; Figure 3). However, within the main thermocline this C-rich remineralization stoichiometryreverts to more rapid remineralization of P and N (γn> 26.0; Figure 3). We calculate the global C:N:Pstoichiometry of nrDOM remineralization to be 165:21:1, similar to the value of 199:20:1 found previouslyby Hopkinson and Vallino [2005].
4.2. Preferential Remineralization Patterns of Marine DOM
Combining the stoichiometries of the marine DOM pool and its remineralization, we evaluated the casefor preferential remineralization of the P and N pools. We found P to be preferentially degraded with respectto both N and C across all densities and ocean basins investigated at an average relative magnitude of ~2X.Regional differences in preferential P remineralization patterns were observed with the North Atlanticexhibiting higher relative magnitudes for preferential P remineralization versus both C and N, ~2–3X. Thestronger preferential P remineralization behavior within the North Atlantic (Figure 4) may be due in partto the strong phosphorus deficiency present in this basin that has been well documented [Cotner et al.,1997; Wu et al., 2000; Ammerman et al., 2003; Mather et al., 2008] and may point to differing ecosystemfunctioning between this P-limited system and other less P-stressed ecosystems such as the North Pacificsubtropical gyre [Wu et al., 2000]. Our reported C:P and N:P of nrDOM in the upper 100m of the NorthAtlantic subtropical gyre of 380:1 and 45:1 (Figure 5) combined with those reported for the suspendedparticulate organic matter C:P and N:P of ~200:1 and ~35:1 [Lomas et al., 2010; Martiny et al., 2013a], andthe inferred C:P of exported sinking organic matter of 355:1 [Teng et al., 2014] all lend further support tothis hypothesis that biological cycles in the Sargasso Sea follow a strongly P depleted, non-Redfieldstoichiometry. In contrast to the North Atlantic, the relative magnitude of preferential P remineralization
Global Biogeochemical Cycles 10.1002/2014GB004904
LETSCHER AND MOORE ©2015. American Geophysical Union. All Rights Reserved. 337
in the other three studied ocean basins is generally lower with values of ~1.5X (Figures 4b and 4c). Thissuggests less P stress in these ecosystems that is in accord with other observations of gradients in DOPconcentrations and alkaline phosphatase activity (a proxy for P stress and DOP utilization) across theAtlantic [Mather et al., 2008] and Pacific basins [Duhamel et al., 2011].
Carbon was found to be remineralized with a stoichiometry greater than Redfield C:N above the mainthermocline (Figure 3); however, the in situ nrC:N molar stoichiometry in the upper ocean is similarly C-rich(Figure 2b) such that no preferential remineralization of C or N occurs (Figure 4a). The C-rich nrDOM andremineralization stoichiometry found at lighter densities possibly point toward an enhanced role for removal ofdissolved combined neutral sugars [Goldberg et al., 2011], which have been shown to constitute a significantfraction of the DOM preferentially consumed in the upper water column (<300m) in the North Atlantic andNorth Pacific. The situation shifts in favor of preferential remineralization of N versus C in the main thermoclineand below (Figure 4a). Regional differences among the case for preferential remineralization of N versusC are much smaller than the case for preferential P remineralization although the Pacific basins exhibitthe shift toward preferential N remineralization at lighter densities (γn>~25.0) than is observed in theAtlantic basins (γn>~26.0).
We hypothesized that regional differences in preferential remineralization patterns should manifest asregional differences in upper ocean nrDOM molar stoichiometry. There is a general trend toward higherN:P and C:P ratios for the low latitudes and subtropical gyres compared with the higher latitudes, whichmay be related to the tendency for marine microbes to become C/N rich and P poor at higher temperatures[Cotner et al., 2006]. N:P and C:P ratios were also found to be higher (more P depleted) in the Atlanticbasin compared to the Pacific (Figure 5). The apparent increase in N:P and C:P ratios from the SouthernHemisphere into the northern Atlantic basin coincide with the northward flow of surface waters in thereturn flow of the Atlantic meridional overturning circulation, suggesting surface waters gradually becomemore P depleted as they traverse the Atlantic Ocean, especially through the P-depleted North Atlanticsubtropical gyre. C:N ratios were generally higher (more C rich) in the Pacific than in the Atlantic and Indianbasins. There is also a trend of higher C:N, N:P, and C:P ratios in the subtropical gyres of the Pacific basinthan in the subpolar and polar regions. The anomalously low C:N ratios observed in the Southern Oceancan be attributed to low concentrations of nrDOC in this region as nrDON concentrations were notsignificantly different in the Southern Ocean compared to other regions.
4.3. Variable Versus Redfield DOM Cycling Stoichiometry in the BEC Model
We tested our findings of preferential remineralization of DOP and DON within simulations of the BECbiogeochemical/ecosystem ocean general circulation model. Comparing simulations with DOM cyclingoccurring at Redfield and variable stoichiometries, we found that preferential remineralization of DOP andDON were needed to match the observed DOM stoichiometry above γn= 27.5 (i.e., the upper ~1000m).The observed C:N:P stoichiometry of DOM is relatively constant at the lighter densities of the upper oceanthen rapidly increases in the main thermocline and intermediate water masses (γn> 26.0; Figure 6, circles),which can be partially attributed to the finding that DOP and DON are preferentially remineralized withrespect to C (from Figure 4). As N is preferentially remineralized with respect to C, and P is preferentiallyremineralized with respect to both N and C, the faster turnover of P and N results in increasing ratios of C:N,N:P, and C:P within and below the ocean’s thermocline. The VAR DOM simulation which contains fasterturnover for DOP and DON than DOC is able to capture the increasing C:N:P stoichiometry with density trend(Figure 6; squares). On the other hand, although DOM cycling following Redfield stoichiometry also exhibitedincreasing ratios with density, the REDFIELD simulation consistently underestimated the observed DOMstoichiometry across all densities and all three ratios of C:N:P (Figure 6; triangles). This finding confirms thesupposition held by Aminot and Kérouel [2004] that the decreasing proportion of nrDOM and increasingproportion of rDOM (with its greatly N and P depleted stoichiometry, ~1370:60:1) to the total DOM poolwith depth (density) can lead to increasing C:N:P stoichiometry, which can wrongfully be interpreted aspreferential remineralization of DON and DOP. Only the combination of the decreasing proportion ofnrDOM with depth (density) and faster turnover of DOP and DON than DOC can match the observed DOMC:N:P stoichiometry; i.e., the VAR DOM simulation (Figure 6).
Next, we investigated the effects that variable DOM cycling stoichiometry and preferential DOP and DONremineralization have on the magnitude and spatial pattern of global scale biogeochemical processes. Net
Global Biogeochemical Cycles 10.1002/2014GB004904
LETSCHER AND MOORE ©2015. American Geophysical Union. All Rights Reserved. 338
primary productivity was found to increase by 10% when variable DOM cycling is included, with the largestincreases observed in the subtropical Atlantic, western Pacific, and western Indian basins. This spatial patternsuggests the lateral supply of N and P from the more productive eastern and poleward sides of the basins aswell as the ability of phytoplankton to directly utilize DOP as a P source in the VAR DOM scenario are importantnutrient supply mechanisms supporting elevated rates of NPP downstream in the gyre. This processappears to be of particular importance in the subtropical North Atlantic, where in the NO DOM simulation,NPP nearly ceases in this region when the role of DOM as an advective nutrient supply mechanism to theregion is turned off, consistent with field studies suggesting a key role for DOP in this ecosystem [e.g.,Lomas et al., 2010; Sohm and Capone, 2010].
Global marine N2 fixation is 26% greater when variable DOM cycling stoichiometry is considered over thecase of Redfield. The spatial pattern of observed increases mirrors that found for NPP, demonstrating thatmuch of the increases to NPP in these regions are due to increases in N2 fixation. Therefore, preferentialremineralization of DOP acts to increase the niche of diazotrophs by decreasing the N:P ratio of the inorganicnutrient pools as P is remineralized at a more rapid rate than N. Preferential remineralization of P in the formof direct utilization of DOP by phytoplankton further decrease the N:P ratio of surface waters. This processis especially important in the Atlantic basin where even though elevated concentrations of dissolved Fe existin surface waters, significant rates of N2 fixation are only observed when variable DOM cycling stoichiometryis considered in our simulations versus the cases of Redfield or no DOM cycling.
Including the contribution of organic carbon export due to DOC export increases the strength of the ocean’sbiological carbon pump by ~14% if DOM cycling follows Redfield stoichiometry. Including our finding ofvariable DOM stoichiometry increases the strength of the biological pump further by an additional ~9%; thus,DOC export contributes ~24% of global export production. The largest changes in carbon export when DOCexport is considered are found within the subtropical ocean gyres, highlighting the dual importance of theseregions acting as large reservoirs for surface accumulated DOC and sites of downwelling circulation forthe advective removal of surface ocean-accumulated DOC. We observe the percentage of total carbon exportcontributed by DOC export to be larger near the HOT time series station in the North Pacific than at the BATSstation in the North Atlantic (Figure 9f), in agreement with a recent analysis of the relative contributions ofsinking POC and DOC export at these sites [Emerson, 2014].
5. Conclusion
Many of our current estimates of the strength of the biological carbon pump rely on models that assumeorganic matter and its export to follow the Redfield ratio. However, our study demonstrates that marine DOMdoes not follow this stoichiometry and instead P and N are selectively degraded yielding a C-rich compositionof the remaining DOM relative to Redfield. Including these processes in the BEC ocean biogeochemistrymodel, we find a ~9% larger estimate of global C export (8.7 Pg C yr�1) over the case for DOM cycling atRedfield proportions. Preferential remineralization of DOP also increases the niche for diazotrophs,stimulating elevated rates of nitrogen fixation. Future studies examining the strength and resiliency of theocean’s biological pump and other biogeochemical processes to climate change need to consider theeffects of non-Redfield stoichiometry in the organic matter pools, including a reevaluation of particulateorganic matter stoichiometry given its larger importance to C export.
ReferencesAbell, J., S. Emerson, and P. Renaud (2000), Distributions of TOP, TON and TOC in the North Pacific subtropical gyre: Implications for nutrient
supply in the surface ocean and remineralization in the upper thermocline, J. Mar. Res., 58(2), 203–222, doi:10.1357/002224000321511142.Aminot, A., and R. Kérouel (2004), Dissolved organic carbon, nitrogen and phosphorus in the NE Atlantic and the NW Mediterranean with
particular reference to non-refractory fractions and degradation, Deep Sea Res., Part I, 51(12), 1975–1999, doi:10.1016/j.dsr.2004.07.016.Ammerman, J. W., R. R. Hood, D. A. Case, and J. B. Cotner (2003), Phosphorus deficiency in the Atlantic: An emerging paradigm in
oceanography, Eos Trans. AGU, 84(18), 165–170, doi:10.1029/2003EO180001.Anderson, L. A., and J. L. Sarmiento (1994), Redfield ratios of remineralization determined by nutrient data analysis, Global Biogeochem.
Cycles, 8(1), 65–80, doi:10.1029/93GB03318.Bertilsson, S., O. Berglund, D. M. Karl, and S. W. Chisholm (2003), Elemental composition of marine Prochlorococcus and Synechococcus:
Implications for the ecological stoichiometry of the sea, Limnol. Oceanogr., 48(5), 1721–1731.Björkman, K. M., and D. M. Karl (2003), Bioavailability of dissolved organic phosphorus in the euphotic zone at Station ALOHA, North Pacific
Subtropical Gyre, Limnol. Oceanogr., 48(3), 1049–1057.
AcknowledgmentsThe authors would like to thank thetireless efforts of the international teamof scientists, crew, and funding agenciesinvolved in the collection, analysis,and production of the DOM observationsused in our analysis. We are especiallygrateful for the sharing of DOP data fromthe British Oceanographic Data Centreand all of the PIs involved including ClaireMahaffey, Sinhue Torres-Valdés, Xi Pan,Malcolm Woodward, Rhiannon Mather,Angela Landolfi, and Richard Sanders. Thecollated DOM data set can be accessedupon request from the correspondingauthor ([email protected]), alsorequiring a separate license for selectAtlantic Ocean DOM data from the BODC(http://www.bodc.ac.uk/). This workwas supported by grant ER65358 fromthe U.S. Department of Energy Office ofBiological and Environmental Researchto J.K.M. J.K.M. also acknowledgessupport from the National ScienceFoundation grants AGS-1021776 andAGS-1048890.
Global Biogeochemical Cycles 10.1002/2014GB004904
LETSCHER AND MOORE ©2015. American Geophysical Union. All Rights Reserved. 339
Boyd, P. W., and T. W. Trull (2007), Understanding the export of biogenic particles in oceanic waters: Is there consensus?, Prog. Oceanogr.,72(4), 276–312, doi:10.1016/j.pocean.2006.10.007.
Carlson, C. A. (2002), Production and removal processes, in Biogeochemistry of Marine Dissolved Organic Matter, 1st ed., edited by D. A. Hanselland C. A. Carlson, pp. 91–151, Academic Press, San Diego, Calif., doi:10.1016/B978-012323841-2/50007-5.
Carlson, C. A., D. A. Hansell, N. B. Nelson, D. A. Siegel, W. M. Smethie, S. Khatiwala, M. M. Meyers, and E. Halewood (2010), Dissolved organiccarbon export and subsequent remineralization in the mesopelagic and bathypelagic realms of the North Atlantic basin, Deep Sea Res.,Part II, 57, 1433–1445.
Caron, D. A. (1994), Inorganic nutrients, bacteria, and the microbial loop, Microb. Ecol., 28(2), 295–298, doi:10.1007/BF00166820.Clark, L. L., E. D. Ingall, and R. Benner (1998), Marine phosphorus is selectively remineralized, Nature, 393(6684), 426–426, doi:10.1038/30881.Cotner, J. B., J. W. Ammerman, E. R. Peele, and E. Bentzen (1997), Phosphorus-limited bacterioplankton growth in the Sargasso Sea, Aquat.
Microb. Ecol., 13(2), 141–149, doi:10.3354/ame013141.Cotner, J. B., W. Makino, and B. A. Biddanda (2006), Temperature affects stoichiometry and biochemical composition of Escherichia coli,
Microb. Ecol., 52(1), 26–33.Duhamel, S., K. M. Björkman, F. Van Wambeke, T. Moutin, and D. M. Karl (2011), Characterization of alkaline phosphatase activity
in the North and South Pacific Subtropical Gyres: Implications for phosphorus cycling, Limnol. Oceanogr., 56(4), 1244–1254,doi:10.4319/lo.2011.56.4.1244.
Dunne, J. P., J. L. Sarmiento, and A. Gnanadesikan (2007), A synthesis of global particle export from the surface ocean and cycling throughthe ocean interior and on the seafloor, Global Biogeochem. Cycles, 21, GB4006, doi:10.1029/2006GB002907.
Emerson, S. (2014), Annual net community production and the biological carbon flux in the ocean, Global Biogeochem. Cycles, 28, 14–28,doi:10.1002/2013GB004680.
Garcia, H. E., R. A. Locarnini, T. P. Boyer, J. I. Antonov, O. K. Baranova, M. M. Zweng, J. Reagan, and D. R. Johnson (2014),World Ocean Atlas 2013,Volume 4: Dissolved Inorganic Nutrients (Phosphate, Nitrate, Silicate), NOAA Atlas NESDIS, vol. 76, edited by S. Levitus, 25 pp., U.S. Gov. Print. Off.,Washington, D. C.
Goldberg, S. J., C. A. Carlson, M. Brzezinski, N. B. Nelson, and D. A. Siegel (2011), Systematic removal of neutral sugars within dissolved organicmatter across ocean basins, Geophys. Res. Lett., 38, L17606, doi:10.1029/2011GL048620.
Hansell, D. A. (1993), Results and observations from the measurement of DOC and DON in seawater using a high-temperature catalyticoxidation technique, Mar. Chem., 41(1), 195–202, doi:10.1016/0304-4203(93)90119-9.
Hansell, D. A. (2013), Recalcitrant dissolved organic carbon fractions, Annu. Rev. Mar. Sci., 5, 421–445, doi:10.1146/annurev-marine-120710-100757.Hansell, D. A., and C. A. Carlson (1998), Deep-ocean gradients in the concentration of dissolved organic carbon, Nature, 395(6699), 263–266,
doi:10.1038/26200.Hansell, D. A., C. A. Carlson, D. J. Repeta, and R. Schlitzer (2009), Dissolved organic matter in the ocean: A controversy stimulates new insights,
Oceanography, 22(4), 202–211, doi:10.5670/oceanog.2009.109.Henson, S. A., R. Sanders, E. Madsen, P. J. Morris, F. Le Moigne, and G. D. Quartly (2011), A reduced estimate of the strength of the ocean’s
biological carbon pump, Geophys. Res. Lett., 38, L04606, doi:10.1029/2011GL046735.Hopkinson, C. S., and J. J. Vallino (2005), Efficient export of carbon to the deep ocean through dissolved organic matter, Nature, 433(7022),
142–145, doi:10.1038/nature03191.Jackett, D. R., and T. J. McDougall (1997), A neutral density variable for the world’s oceans, J. Phys. Oceanogr., 27, 237–263.Karl, D. M., and K. M. Björkman (2002), Dynamics of DOP, in Biogeochemistry of Marine Dissolved Organic Matter, 1st ed., edited by D. A. Hansell
and C. A. Carlson, pp. 249–366, Academic Press, San Diego, Calif., doi:10.1016/B978-012323841-2/50007-5.Legendre, P., and L. Legendre (1998), Number 20 in Developments in environmentalmodelling, inNumerical Ecology, 2nd ed., Elsevier, Amsterdam.Letscher, R. T., J. K. Moore, Y. C. Teng, and F. Primeau (2015), Variable C:N:P stoichiometry of dissolved organic matter cycling in the
Community Earth System Model, Biogeosciences, 12, 209–221, doi:10.5194/bg-12-209-2015.Locarnini, R. A., et al. (2013),World Ocean Atlas 2013, Volume 1: Temperature, NOAA Atlas NESDIS, vol. 73, edited by S. Levitus, 40 pp., U.S. Gov. Print.
Off., Washington, D. C.Loh, A. N., and J. E. Bauer (2000), Distribution, partitioning and fluxes of dissolved and particulate organic C, N and P in the eastern North
Pacific and Southern Oceans, Deep Sea Res., Part I, 47(12), 2287–2316, doi:10.1016/S0967-0637(00)00027-3.Lomas, M. W., A. L. Burke, D. A. Lomas, D. W. Bell, C. Shen, S. T. Dyhrman, and J. W. Ammerman (2010), Sargasso Sea phosphorus
biogeochemistry: An important role for dissolved organic phosphorus (DOP), Biogeosciences, 7(2), 695–710.Martiny, A. C., C. T. Pham, F. W. Primeau, J. A. Vrugt, J. K. Moore, S. A. Levin, and M. W. Lomas (2013a), Strong latitudinal patterns in the
elemental ratios of marine plankton and organic matter, Nat. Geosci., 6(4), 279–283, doi:10.1038/ngeo1757.Martiny, A. C., J. A. Vrugt, F. W. Primeau, and M. W. Lomas (2013b), Regional variation in the particulate organic carbon to nitrogen ratio in the
surface ocean, Global Biogeochem. Cycles, 27, 723–731, doi:10.1002/gbc.20061.Mather, R. L., S. E. Reynolds, G. A.Wolff, R. G.Williams, S. Torres-Valdes, E. M. S.Woodward, A. Landolfi, X. Pan, R. Sanders, and E. P. Achterberg (2008),
Phosphorus cycling in the North and South Atlantic Ocean subtropical gyres, Nat. Geosci., 1(7), 439–443, doi:10.1038/ngeo232.Orchard, E. D., J. W. Ammerman, M. W. Lomas, and S. T. Dyhrman (2010), Dissolved inorganic and organic phosphorus uptake in Trichodesmium
and the microbial community: The importance of phosphorus ester in the Sargasso Sea, Limnol. Oceanogr., 55(3), 1390–1399.Sohm, J. A., and D. G. Capone (2006), Phosphorus dynamics of the tropical and subtropical north Atlantic: Trichodesmium spp. versus bulk
plankton, Mar. Ecol. Prog. Ser., 317, 21.Sohm, J. A., and D. G. Capone (2010), Zonal differences in phosphorus pools, turnover and deficiency across the tropical North Atlantic
Ocean, Global Biogeochem. Cycles, 24, GB2008, doi:10.1029/2008GB003414.Talley, L. D., G. L. Pickard, W. J. Emery, and J. H. Swift (2011), Pacific Ocean, in Descriptive Physical Oceanography An Introduction, 6th ed., edited by
L. D. Talley et al., pp. 303–362, Elsevier, San Diego, Calif.Teng, Y. C., F. W. Primeau, J. K. Moore, M. W. Lomas, and A. C. Martiny (2014), Global-scale variations of the ratios of carbon to phosphorus in
exported marine organic matter, Nat. Geosci., doi:10.1038/ngeo2303, in press.Westberry, T. K., P. J. L. B. Williams, and M. J. Behrenfeld (2012), Global net community production and the putative net heterotrophy of the
oligotrophic oceans, Global Biogeochem. Cycles, 26, GB4019, doi:10.1029/2011GB004094.White, A. E., Y. Spitz, D. Karl, and R. M. Letelier (2006), Flexible elemental stoichiometry in Trichodesmium spp. and its ecological implications,
Limnol. Oceanogr., 51(4), 1777–1790.Wu, J., W. Sunda, E. A. Boyle, and D. M. Karl (2000), Phosphate depletion in the western North Atlantic Ocean, Science, 289(5480), 759–762,
doi:10.1126/science.289.5480.759.Zweng, M. M., et al. (2013),World Ocean Atlas 2013, Volume 2: Salinity, NOAA Atlas NESDIS, vol. 74, edited by S. Levitus, 39 pp., U.S. Gov. Print. Off.,
Washington, D. C.
Global Biogeochemical Cycles 10.1002/2014GB004904
LETSCHER AND MOORE ©2015. American Geophysical Union. All Rights Reserved. 340