Characterization of atmospheric aerosols across Canada from a ground‐based sunphotometer network:...
28
Characterization of Atmospheric Aerosols across Canada from a Ground-based Sunphotometer Network: AEROCAN A.I. Bokoye 1* , A. Royer 1 , N.T. O’Neil1 l , P. Cliche 1 , G. Fedosejevs 2 , P.M. Teillet 2 and L.J.B. McArthur 3 1 CARTEL, Université de Sherbrooke, Sherbrooke QC J1K 2R1 2 Canada Centre for Remote Sensing, Ottawa ON 3 Meteorological Service of Canada, Downsview ON [Original manuscript received 12 October 2000; in revised form 2 April 2001] ABSTRACT Ground-based sunphotometry measurements acquired under clear sky conditions can be used to inves- tigate atmospheric aerosol optical properties. Such measurements are not only important in their own right as a technique for monitoring generic aerosol dynamics, but also represent a direct means of evaluating the contribution of aerosol induced radiative forcing in the modelling of climate change. In this paper we analyze derived aerosol optical properties using datasets from the Canadian AEROCAN (AERosol CANada) sunphotometer network. The AEROCAN network currently includes eight sunphotometers distributed across Canada at sites chosen in order to obtain a diverse sampling of continental, maritime and arctic aerosols. Some of these sites have been operational since 1993 as part of the Boreal Ecosystem-Atmosphere Study (BOREAS). These instruments permit standard and automatic multi-wavelength measurements of solar extinction radiance centred on the solar disk as well as sky radiance scans off the solar disk. These data yields aerosol optical depth, the Ångström exponent, aerosol particle volume size distribution, refractive index, column-averaged single scattering albedo, and pre- cipitable water vapour content. Spatial and temporal trends of these parameters as well as observed inter-correlations are discussed. The results demonstrate the utility and significance of these types of measurements and illustrate the potential appli- cations of networked sunphotometry data. RÉSUMÉ La radiométrie solaire au sol par temps de ciel clair peut être utilisée pour étudier les propriétés optiques des aérosols atmosphériques. Par essence, de telles mesures sont importantes pour surveiller la dynamique des masses d’aérosols mais elles représentent aussi un moyen direct de réduire l’incertitude due au forçage radiatif induit par ces aérosols dans les modèles climatiques. Dans cet article, nous analysons les propriétés optiques des aérosols en utilisant une base de données du réseau de photomètres solaires canadien AEROCAN (AERosol CANada). Le réseau AEROCAN comprend actuellement huit photomètres répartis à travers le Canada sur des sites choisis afin d’obtenir un prélèvement des divers types d’aérosols: continental, maritime et arctique. Certains de ces sites sont opérationnels depuis 1993 dans le cadre de la campagne de mesure “Boreal Ecosystem-Atmosphere Study” (BOREAS). Ces instruments prennent des mesures standard et automatique de l’atténuation du rayonnement solaire direct à des longueurs d’onde discrètes et ont la capacité de réaliser un balayage angulaire autour du disque solaire pour mesurer la luminance du ciel. De telles mesures permettent de déterminer l’épaisseur optique des aérosols, le coefficient d’Ångström, la distribution volumique en tailles des aérosols, l’indice de réfraction, l’albédo de diffusion simple et le contenu de vapeur d’eau de l’atmosphère intégrés sur toute la colonne atmosphérique. Les variations spatiale et temporelle de ces paramètres ainsi que des corrélations sont discutées dans cet article. Les observations montrent l’utilité d’un tel réseau en dépit des difficultés techniques inhérentes à l’acquisition automatique des données, à la transmission de données par satellite et à la rigueur du climat canadien. ATMOSPHERE-OCEAN 39 (4) 2001, 429–456 © Canadian Meteorological and Oceanographic Society *Corresponding author’s e-mail: [email protected] 1 Introduction Atmospheric aerosols have a considerable influence on the Earth’s surface radiative balance and ultimately can affect cli- mate change because of direct radiative forcing brought about by the attenuation and backscattering of direct solar radiation and indirect radiative forcing caused by variations in the nature and quantity of aerosols acting as condensation nuclei for clouds. Aerosols generated by anthropogenic sources also contribute to increases in atmospheric turbidity and urban pollution in particular. The impact of aerosols on climate forcing has been inves- tigated by numerous authors: Blanchet and Girard (1984), Blanchet (1989), Charlson et al. (1992), Taylor and Penner
-
Upload
independent -
Category
Documents
-
view
1 -
download
0
Transcript of Characterization of atmospheric aerosols across Canada from a ground‐based sunphotometer network:...
Characterization of Atmospheric Aerosols across Canada froma Ground-based Sunphotometer Network: AEROCAN
A.I. Bokoye1*, A. Royer1, N.T. O’Neil1l, P. Cliche1, G. Fedosejevs2, P.M. Teillet2 and L.J.B. McArthur3
1CARTEL, Université de Sherbrooke, Sherbrooke QC J1K 2R12Canada Centre for Remote Sensing, Ottawa ON
3Meteorological Service of Canada, Downsview ON
[Original manuscript received 12 October 2000; in revised form 2 April 2001]
ABSTRACT Ground-based sunphotometry measurements acquired under clear sky conditions can be used to inves-tigate atmospheric aerosol optical properties. Such measurements are not only important in their own right as atechnique for monitoring generic aerosol dynamics, but also represent a direct means of evaluating the contributionof aerosol induced radiative forcing in the modelling of climate change. In this paper we analyze derived aerosoloptical properties using datasets from the Canadian AEROCAN (AERosol CANada) sunphotometer network.
The AEROCAN network currently includes eight sunphotometers distributed across Canada at sites chosen inorder to obtain a diverse sampling of continental, maritime and arctic aerosols. Some of these sites have beenoperational since 1993 as part of the Boreal Ecosystem-Atmosphere Study (BOREAS). These instruments permitstandard and automatic multi-wavelength measurements of solar extinction radiance centred on the solar disk aswell as sky radiance scans off the solar disk. These data yields aerosol optical depth, the Ångström exponent,aerosol particle volume size distribution, refractive index, column-averaged single scattering albedo, and pre-cipitable water vapour content.
Spatial and temporal trends of these parameters as well as observed inter-correlations are discussed. Theresults demonstrate the utility and significance of these types of measurements and illustrate the potential appli-cations of networked sunphotometry data.
RÉSUMÉ La radiométrie solaire au sol par temps de ciel clair peut être utilisée pour étudier les propriétésoptiques des aérosols atmosphériques. Par essence, de telles mesures sont importantes pour surveiller ladynamique des masses d’aérosols mais elles représentent aussi un moyen direct de réduire l’incertitude due auforçage radiatif induit par ces aérosols dans les modèles climatiques. Dans cet article, nous analysons les propriétés optiques des aérosols en utilisant une base de données du réseau de photomètres solaires canadienAEROCAN (AERosol CANada).
Le réseau AEROCAN comprend actuellement huit photomètres répartis à travers le Canada sur des sites choisisafin d’obtenir un prélèvement des divers types d’aérosols: continental, maritime et arctique. Certains de ces sitessont opérationnels depuis 1993 dans le cadre de la campagne de mesure “Boreal Ecosystem-Atmosphere Study”(BOREAS). Ces instruments prennent des mesures standard et automatique de l’atténuation du rayonnement solairedirect à des longueurs d’onde discrètes et ont la capacité de réaliser un balayage angulaire autour du disquesolaire pour mesurer la luminance du ciel. De telles mesures permettent de déterminer l’épaisseur optique desaérosols, le coefficient d’Ångström, la distribution volumique en tailles des aérosols, l’indice de réfraction, l’albédode diffusion simple et le contenu de vapeur d’eau de l’atmosphère intégrés sur toute la colonne atmosphérique.
Les variations spatiale et temporelle de ces paramètres ainsi que des corrélations sont discutées dans cet article.Les observations montrent l’utilité d’un tel réseau en dépit des difficultés techniques inhérentes à l’acquisitionautomatique des données, à la transmission de données par satellite et à la rigueur du climat canadien.
ATMOSPHERE-OCEAN 39 (4) 2001, 429–456© Canadian Meteorological and Oceanographic Society
*Corresponding author’s e-mail: [email protected]
1 IntroductionAtmospheric aerosols have a considerable influence on theEarth’s surface radiative balance and ultimately can affect cli-mate change because of direct radiative forcing brought aboutby the attenuation and backscattering of direct solar radiationand indirect radiative forcing caused by variations in thenature and quantity of aerosols acting as condensation nuclei
for clouds. Aerosols generated by anthropogenic sources alsocontribute to increases in atmospheric turbidity and urbanpollution in particular.
The impact of aerosols on climate forcing has been inves-tigated by numerous authors: Blanchet and Girard (1984),Blanchet (1989), Charlson et al. (1992), Taylor and Penner
(1994), Haywood and Shine (1995), IPCC (1995), Chylekand Wong (1995), Boucher and Anderson (1996), Schwartz(1996), Nemesure et al. (1996), IPCC (1996). Despite theadvancement of modelling techniques, our understanding ofmeteorological effects such as aerosol forcing and the role ofaerosols as a mechanism of climate change is imperfect. Thislack of understanding is true even for relatively well charac-terized sulfate aerosols (Boucher et al., 1998). The climatechange research community is, as a consequence, focusingattention on developing aerosol models to improve climatemodels. In Canada, the Canadian Aerosol Model (CAM) hasbeen added to the Canadian General Circulation Model(CGCM) in order to address more realistically the dynamicsof aerosol-induced feedback mechanisms (Gong et al., 1997a,1997b; Lohmann et al., 1999).
Satellite-based measurements are a useful tool for the studyof aerosol optical properties on a large scale (Long andStowe, 1994; Stowe et al., 1997; Tanré et al., 1997). This hasbeen demonstrated in numerous applications that include, forexample, the National Aeronautics and Space Administration(NASA) Global Aerosol Climatology Project (GACP) as partof the Global Energy and Water cycle EXperiment (GEWEX)project. The Aerosol Optical Depth (AOD) can also beinferred from spectro-radiometric measurements acquired bythe newer generation of space sensors such as the MODerate-resolution Imaging Spectroradiometer (MODIS), theMEdium-Resolution Imaging Spectrometer (MERIS) and theFrench POLarization and Directionality of the Earth’sReflectance (POLDER) sensor.
The characterization of aerosol optical properties is also nec-essary for the atmospheric correction of remotely sensed sur-face imagery. Atmospheric correction models like 6S (Vermoteet al., 1997) and the Simplified Method for AtmosphericCorrection of Satellite Measurements in the Solar Spectrum(SMAC) (Rahman and Dedieu, 1994) require aerosol opticalparameters (notably AOD) as inputs. Ground-based passive opti-cal sounding of the atmosphere in the visible and near infraredhas traditionally been one of the most common methods forderiving information on aerosol properties (Kaufman et al., 1997).
The optical monitoring of aerosols in Canada is the mandateof the AEROCAN (AERosol CANada) sunphotometer network.This network is part of the federated international AERONETnetwork run out of NASA’s Goddard Space Flight Center(GSFC) (Holben et al., 1998). Several sunphotometer (orshadowband radiometer) networks of continental or nationalscope are currently operational: for example the WorldMeteorological Organization Global Atmosphere Watch(WMO/GAW) (GAW, 1993), the Multi-Filter RotatingShadow-band Radiometer (MFRSR) (Harrison and Michalsky,1994), the Baseline Surface Radiation Network (BSRN)(WRCP, 1991), the U.S. Department of Energy’s AtmosphericRadiation Measurement (ARM) network (Stokes andSchwartz, 1994), the Australian Continental IntegratedGround-truth Site Network (CIGSN) (Prata et al., 1995) andthe U.S. Department of Agriculture’s USDA/UVB radiationmonitoring network (Bigelow et al., 1998).
Sunphotometer observations have been made in Canadaover a period that significantly predates the deployment of theAEROCAN network. Reference can be made to the works ofPolavarapu (1978), Freund (1983), Uboegbulam and Davies(1983), Davies et al. (1988), Hay and Darby (1984), O’Neilland Miller (1984), O’Neill et al. (1993), Ahern et al. (1991)and Smirnov et al. (1994, 1996). This last study was per-formed using SONOTEK™ hand-held sunphotometers.These instruments were employed in a Canadian sunpho-tometer network operated by the Meteorological Service ofCanada (MSC) (formerly the Atmospheric EnvironmentService (AES)), which in turn was part of the WMOBackground Air Pollution MONitoring (BAPMON) network.
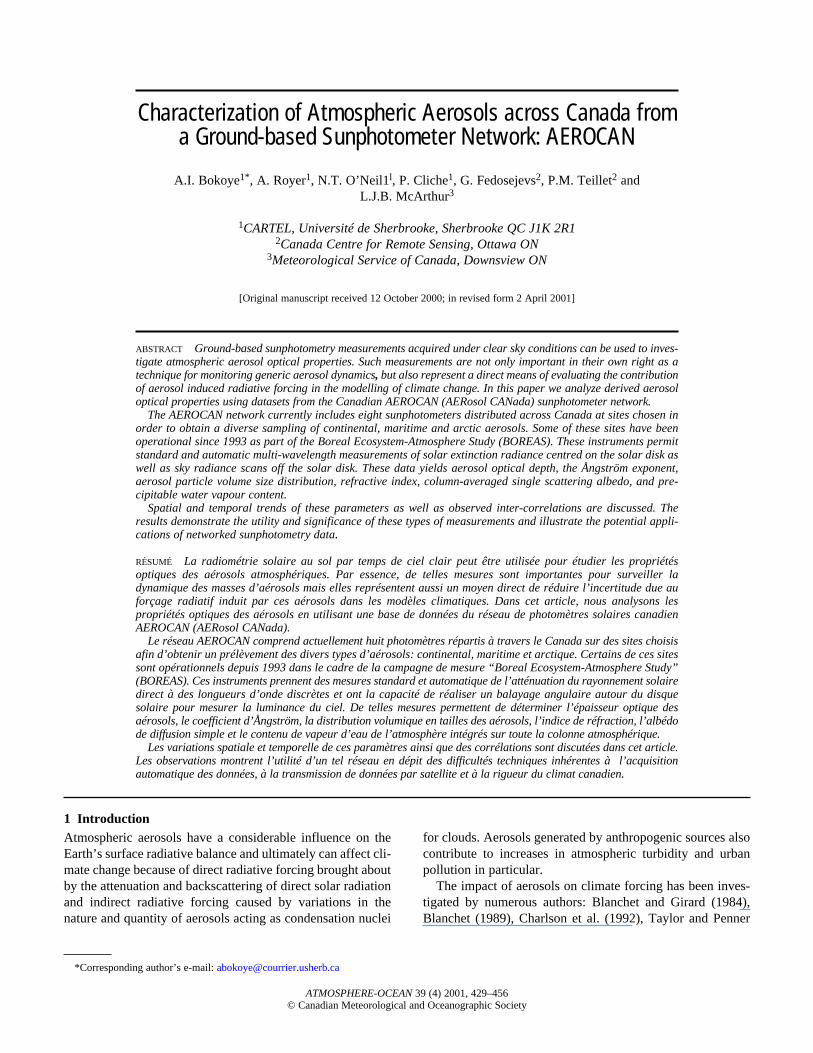
The AEROCAN network, which was extended thanks tothe Canada Centre for Remote Sensing (CCRS) of NaturalResources Canada, represents, to a certain extent, a continua-tion of the hand-held SONOTEK™ network. Its creation wasmotivated by the earlier deployment of the AERONET world-wide sunphotometer network. Currently, the network consistsof eight sunphotometers deployed across Canada (Fig. 1 andTable 1). Although spatially sparse, the network sites werechosen so as to permit a representative sampling of the great-est variety of aerosol types. The Churchill site on Hudson’sBay began collecting data in the spring of 2000. The datadescribed in this paper are limited to seven sites (see Table 4in the Appendix B).
The goal of this paper is to present a statistical database ofparameters derived from optical measurements made at dif-ferent member sites of the AEROCAN network. We also pre-sent results from the synthesis of various sources of AOD inorder to illustrate the potential of sunphotometry for studyingmulti-year trends. Such multi-year data are of interest in cli-mate studies, pollution monitoring and satellite data analysis.
In Section 2, we describe the network, data acquisition andprocessing protocol. In Sections 3 to 5, we present an analy-sis of spatial and temporal trends for the key optical parame-ters and comparisons with other independant measurements.An investigation of certain inter-parameter correlations is alsoreviewed. All acronyms are presented in the Glossary ofTerms (Appendix A).
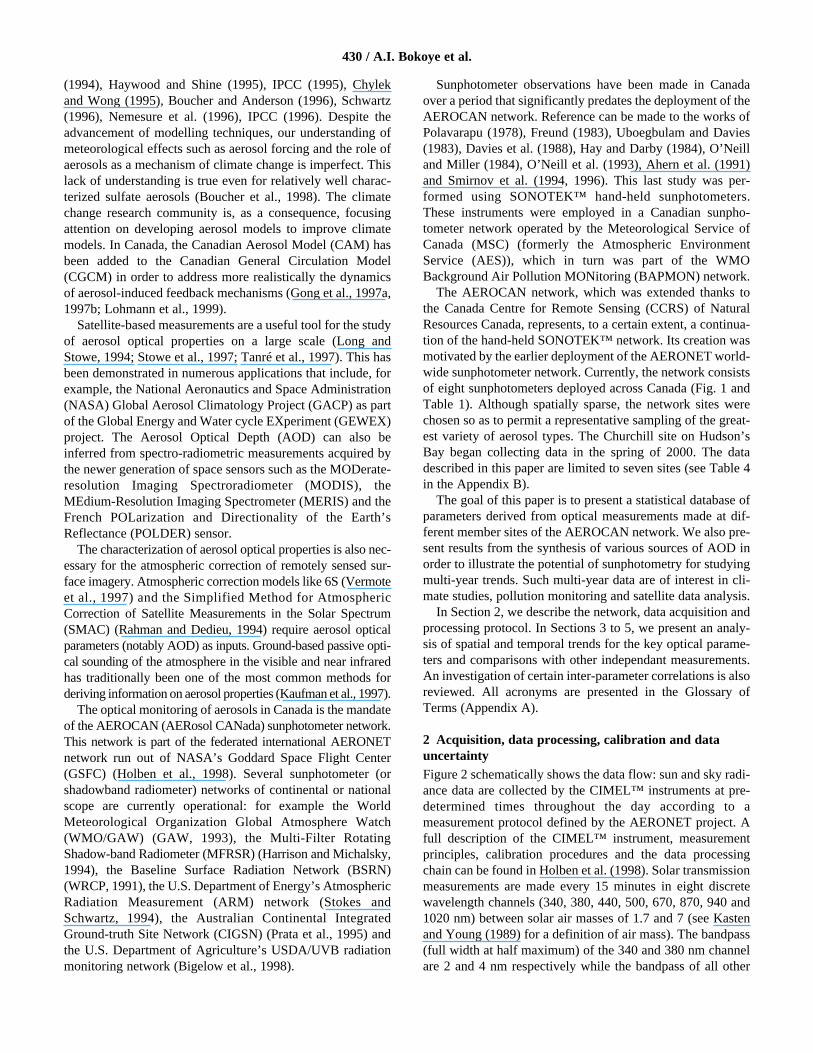
2 Acquisition, data processing, calibration and datauncertaintyFigure 2 schematically shows the data flow: sun and sky radi-ance data are collected by the CIMEL™ instruments at pre-determined times throughout the day according to ameasurement protocol defined by the AERONET project. Afull description of the CIMEL™ instrument, measurementprinciples, calibration procedures and the data processingchain can be found in Holben et al. (1998). Solar transmissionmeasurements are made every 15 minutes in eight discretewavelength channels (340, 380, 440, 500, 670, 870, 940 and1020 nm) between solar air masses of 1.7 and 7 (see Kastenand Young (1989) for a definition of air mass). The bandpass(full width at half maximum) of the 340 and 380 nm channelare 2 and 4 nm respectively while the bandpass of all other
430 / A.I. Bokoye et al.
channels is 10 nm. The spectral accuracy is ± 1 nm accordingto CIMEL Inc. Sky measurements are made in four of theabove eight channels (440, 670, 870 and 1020 nm) every hourand at specific air mass values (4, 3, 2 and 1.7). The solartransmission is measured by continuously tracking the sunand acquiring radiance data through a 1.2° field-of-view(FOV) collimator designed for 10–5 straylight rejection formeasurements at 3° scattering angle from the sun. The skycollimator, which is identical in length (33 cm) to the suncollimator, is characterized by an order of magnitude largeraperture lens system than the sun collimator to allow better
dynamic range for the sky radiances. A four-quadrant detec-tor permits tracking precision of better than 0.1°. A humiditysensor disables measurements in rainy conditions. The skymeasurements include horizontal scans in the almucantar andvertical scans in the principal plane (solar plane). An almucan-tar scan is made with a fixed observer elevation angle whilethe observer azimuthal angle varies between 0° and 360°.
Data are sent from the autonomous CIMEL™ instrumentsat hourly intervals via a VITEL™ Data Collection Platform(DCP) transmitter to a Geostationary Operational EnvironmentalSatellite (GOES) (Fig. 2). The DCP data are then relayed by
Assessment from a Ground-Based Sunphotometer Network: AEROCAN / 431
Fig. 1 AEROCAN (Canadian sunphotometry network) site location map.
TABLE 1. Location and description of the AEROCAN sites (see map in Fig. 1) and their affiliation: Université de Sherbrooke; Meteorological Service ofCanada (MSC); Centre for Atmospheric Research Experiments (CARE) of the MSC; Boreal ecosystem-atmosphere study program associated withthe NASA aerosol robotic network (AERONET); the Canadian baseline surface radiation network observatory (BSRN); Churchill Northern StudiesCentre (CNSC).
Site name Station affiliation Environment Geographic coordinates Start date of operation
Sherbrooke Université de Sherbrooke Small town (pop. 85,000) 45° 22′ N 71° 55′ W Alt. 300 m 1995in agro-forest area
Egbert CARE, MSC Rural, 100 km from Toronto 44° 13′ N 79° 45′ W Alt. 264 m 1996Waskesiu BOREAS (AERONET) Boreal Forest area 53° 55′ N W 106°04′Alt. 550 m 1994Thompson BOREAS (AERONET) Taiga 55° 47′ N 97° 50′ W Alt. 218 m 1994Saturna Island MSC Maritime 48° 46′ N 123° 07′ W Alt. 200 m 1997Bratt’s Lake BSRN, MSC Prairie 50° 16′ N 104° 42′ W Alt. 586 m 1996Kejimkujik MSC Maritime 44° 22′ N 65° 16′ W Alt. 154 m 1998Churchill CNSC Sub-arctic 58° 43′ N 94° 7′ W Alt. 15 m 2000
the GOES Data Collection System (DCS) to a ground receiv-ing station at Wallops Island in Virginia (U.S.A). There, thedata are acquired and processed by the Advanced DCSAutomatic Processing System (ADAPS). The data are finallyretrieved via Internet from ADAPS by the NASA/GSFCAERONET facility where they are processed and archivedaccording to a standardized procedure for the retrieval ofaerosol optical and physical properties (Holben et al., 1998;Nakajima et al., 1983, 1996; Dubovik and King, 2000;Dubovik et al., 2000). These data are made available to theresearch community via an Internet browser in qualityassured format.
To guarantee data quality assurance (QA), the AEROCANinstruments are sent periodically (at least once per year) toNASA/GSFC for calibration and instrument checks (Holbenet al., 1998). This calibration includes the accurate determina-tion of the CIMEL™ solar calibration constants (generallydenoted V0(λ) for a given wavelength λ) and the sky channelcalibration coefficients. V0(λ) is the direct solar beam signaloutput that the sunphotometer would read in the absence of anattenuating atmosphere. The solar channels of the AEROCANinstruments are calibrated relative to a reference master instru-ment, which itself is frequently calibrated at the Mauna Loahigh altitude observatory (Holben et al., 1998). The calibra-tion logistics that include shipment to GSFC for intercalibra-tion, and re-installation at the home site were a source ofconcern in terms of the radiometric fidelity of the instrumentsin the early stages of the network. However, in the past fewyears the total calibration process has become more automatedand refined and system calibration checks (which can beapplied retroactively) have been developed to providearchived indicators of calibration quality.
A major concern relating to an automatic sunphotometernetwork is the capacity for discriminating between aerosol
parameters acquired in cloud free conditions and those thatare contaminated by thin cirrus clouds. The automatic flag-ging and elimination of potentially cloud contaminated data isperformed by applying the cloud screening and quality con-trol algorithm developed by Smirnov et al. (2000) to the rawAERONET database. Three levels of data are actually available from the AERONET Internet web site (http://aeronet.gsfc.nasa.gov): level 1.0 (unscreened), level 1.5 (cloud-screened), and level 2.0 (cloud-screened and quality-assured).The last category basically incorporates data obtained from amanual screening of level 1.5 data. In order to refine the level1.5 data further, we added an additional screening step whichis tied to the values of the Ångström exponent and its associ-ated error. The Ångström exponent (α) is computed as theslope of the log(AOD) versus log(wavelength) linear regres-sion applied to each optical depth spectrum (at wavelengthsof 440, 500, 670, 870 nm). Our additional criterion was toreject α values corresponding to an rms linear regression error> 30% in Ångström coefficient α.
The CIMEL™ sunphotometer permits an estimation of theAOD at seven or more wavelengths depending on the filterconfiguration of each device. The atmospheric precipitablewater vapour content is also evaluated from direct solar radi-ation measurements in the 940-nm wavelength band. Themicrophysical and radiative properties of the aerosol retrievedfrom sky radiance measurements are discussed in Section 3b.
Sunphotometer measurements may be affected by severaltypes of error which lead to some uncertainties in the parame-ters retrieved. Potential sources of error include V0(λ) calibra-tion, electronic failure, filter degradation, solar misalignment,detector temperature-dependence and pressure variationeffects on the assumed values of Rayleigh optical depths.Significant effort has been made in sunphotometry to quantifyand analyze these errors. The principal source of error is,
432 / A.I. Bokoye et al.
Fig. 2 The AERONET (NASA Aerosol robotic network program)/AEROCAN (Canadian sunphotometry network) data flow diagram.
ADAPSCIMEL DCP ANT.
Acquisition systemSunphotometersystem
AEROCAN
management
AEROCAN
office
Workstation
GOES-E
Modem
Internet
NASA/GSFC
arguably, the inaccuracy in the determination of the V0(λ)coefficients (Soufflet et al., 1992; Forgan, 1994; Schmid andWehrli, 1995; Reagan et al., 1986; Schmid et al., 1998;Bigelow and Slusser, 2000; Slusser et al., 2000; Porter et al.2000). The V0(λ) calibration errors depend mainly on the sta-bility of the atmosphere during the acquisition of Langley plotdata. For example a 4% calibration error yields an uncertaintyof 0.02 in AOD at a solar airmass of 2. The uncertainties relat-ing to the calibration and the reference data used to constrainthe algorithms, inputs/outputs, corrections and models in com-puting AOD, Precipitable Water Vapour Content (PWVC)and sky radiance inversions are reported in Holben et al.(1998). The variations of V0(λ) from calibration to calibrationcan often be linked to aging of the optical train components(most notably the degradation of filters). The AERONET ref-erence sunphotometers are checked on a regular basis as partof the calibration methodology (an example of V0(λ) variationfor one of these devices during a one-year period can befound in Holben et al. (2001)). The average coefficient ofvariation of V0(λ) (standard deviation/mean) varies from 0.3%to 0.5% for the aerosol channels and from 2% to 4% for the940-nm channel. The spectral variation of the AOD accuracyof the solar channels is nominally ± 0.01 or better for λ > 440 nmand ± 0.02 or better for the two ultraviolet (UV) channels at380 and 340 nm. Eck et al. (1999) computed the combinationof calibration uncertainties and uncertainty in ozone (due toseasonality and atmospheric dynamics) and Rayleigh opticaldepth (due to the variability in air pressure), for optical airmass 1, in the manner of Russell et al. (1993). The resultingestimated total AOD uncertainty is 0.01–0.02 for field instru-ments (spectrally dependent with the higher errors in the UV),and approximately 0.002 to 0.009 for reference instruments.Schmid et al. (1999) compared AOD values derived from 4different solar radiometers (including an AERONET sun/skysunphotometer) operating simulaneously in a field campaignand found that the AOD values from 380 to 1020 nm agreedto within 0.015 (rms). This is similar to the estimated level ofuncertainty in AOD retrieval for field instruments. The1020 nm band showed a significant temperature variation(0.25% per °C ± 0.05% per °C) warranting a correction to areference temperature in the processing. The sky channels ofthe instruments are calibrated using an absolutely calibratedintegrating sphere to a radiance accuracy of ± 5% or better(Holben et al., 1998). A dark current subtraction is applied toeach channel before processing the data records. About fiveyears of AOD QA experience with the calibration procedureprovides reasonable confidence that the error budget is large-ly maintained at the nominal values for newly calibratedinstruments and that for field instruments the AOD error isbetter than ± 0.02 in the visible wavelength region.
The mean uncertainty of the Ångström coefficient (α),computed from the linear regressions applied to each AODspectrum (assuming no error in AOD) and using all theinstantaneous data for each AEROCAN site, ranges between± 0.13 and ± 0.18 depending on the site. A discussion on thedetermination of the atmospheric PWVC using the CIMEL™
sunphotometer and its associated errors can be found inHalthore et al. (1997). These authors found that the 940-nmwavelength (10-nm bandwidth) generally used for PWVCretrieval yielded results with less than 1% variability undervarious atmospheric conditions. The PWVC precision dependsstrongly on the water vapour transmittance model consideredin the above spectral band (Bruegge et al., 1992; Schmidet al., 1996). The influence of measurement errors on aerosolmicrophysical properties retrieved from extinction and skyradiance data are discussed in Dubovik et al. (2000).
3 Observations a Spatial and Temporal Variation of the Measured ParametersTotal, yearly and monthly mean values of AOD500 (AOD at500 nm), α and PWVC are presented in Table 2, Table 3(summer) and Appendix B, respectively. The AOD500 meanvalues are computed using the geometric mean (g.m.) insteadof the arithmetic mean (a.m.). The g.m. is less influenced byepisodic high values not representative of the mean back-ground. If σ is the AOD500 standard deviation on a log scale(i.e., computed from a frequency distribution on a log scale)then the log scale standard deviation limits on a linear scaleare simply (g.m.)×η and (g.m.) ÷η where η = 10+σ. TheÅngström coefficient and the PWVC mean values are com-puted using the arithmetic mean (O’Neill et al., 2001). Thedaily, monthly and yearly means are computed from the dis-tribution of instantaneous values. The total mean values persite and for all of Canada are computed from yearly meansusing the g.m. for AOD500 and the a.m. for the Ångströmcoefficient and the PWVC. Only those monthly means whichrepresented at least a population of thirty instantaneous valueswere retained.
1 AEROSOL OPTICAL DEPTH AT 500 NM
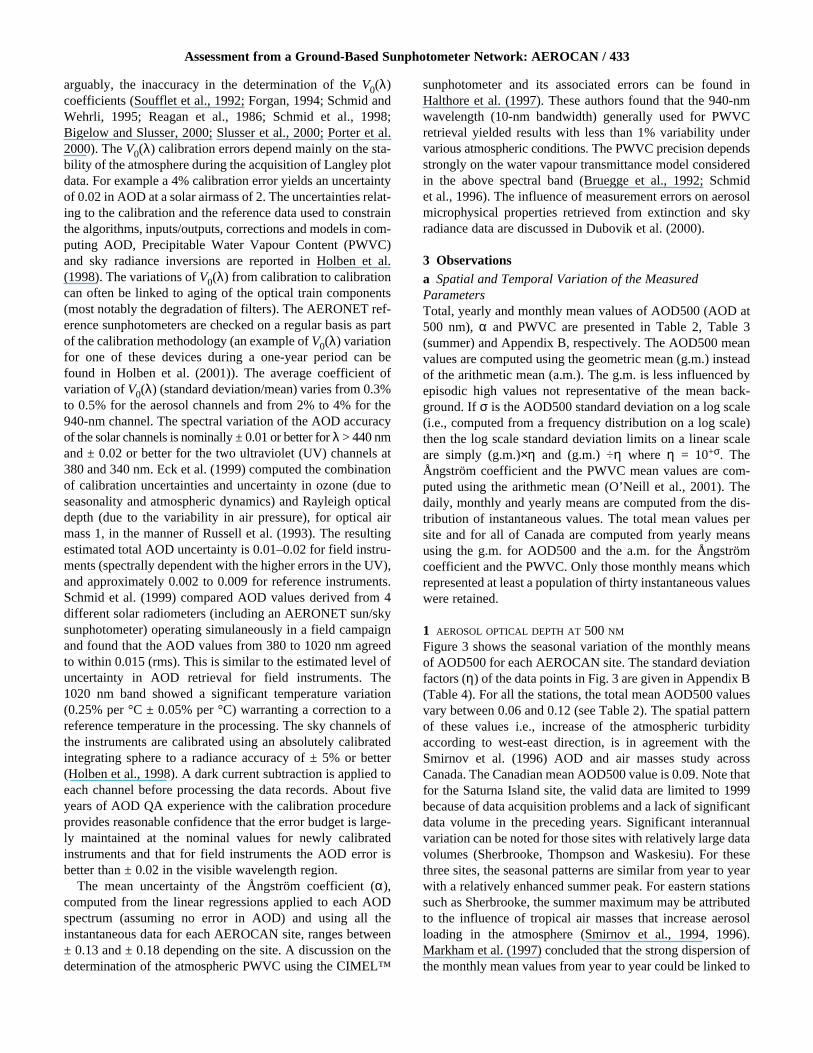
Figure 3 shows the seasonal variation of the monthly meansof AOD500 for each AEROCAN site. The standard deviationfactors (η) of the data points in Fig. 3 are given in Appendix B(Table 4). For all the stations, the total mean AOD500 valuesvary between 0.06 and 0.12 (see Table 2). The spatial patternof these values i.e., increase of the atmospheric turbidityaccording to west-east direction, is in agreement with theSmirnov et al. (1996) AOD and air masses study acrossCanada. The Canadian mean AOD500 value is 0.09. Note thatfor the Saturna Island site, the valid data are limited to 1999because of data acquisition problems and a lack of significantdata volume in the preceding years. Significant interannualvariation can be noted for those sites with relatively large datavolumes (Sherbrooke, Thompson and Waskesiu). For thesethree sites, the seasonal patterns are similar from year to yearwith a relatively enhanced summer peak. For eastern stationssuch as Sherbrooke, the summer maximum may be attributedto the influence of tropical air masses that increase aerosolloading in the atmosphere (Smirnov et al., 1994, 1996).Markham et al. (1997) concluded that the strong dispersion ofthe monthly mean values from year to year could be linked to
Assessment from a Ground-Based Sunphotometer Network: AEROCAN / 433
434 / A.I. Bokoye et al.
Fig. 3 Time series of monthly geometric mean values of aerosol optical depth at 500 nm (AOD500) for each AEROCAN site and for each year of screenedmeasurements.
the variable occurrence of forest fires and associated smokeover the western Canadian sunphotometer sites. In point offact, the AOD data of Fig. 3 are largest for the record forestfire years of 1994 and 1995 and very small during 1997 whenthere were relatively few fires.
2 ÅNGSTRÖM COEFFICIENT
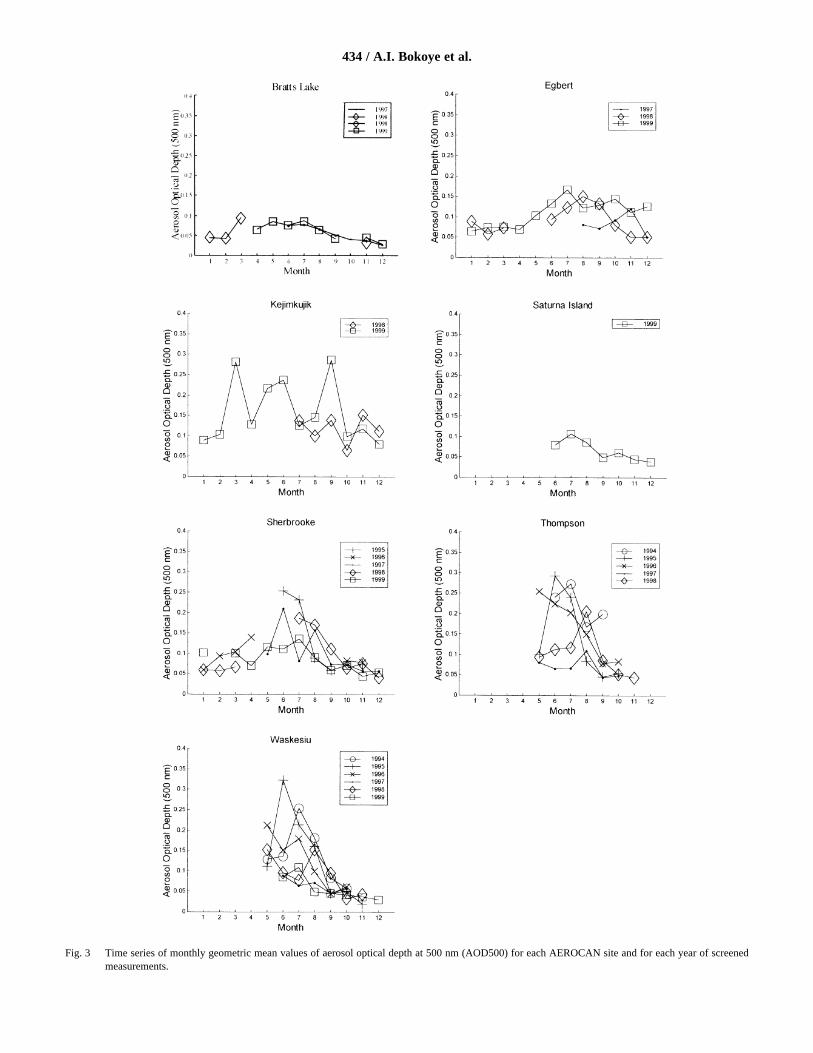
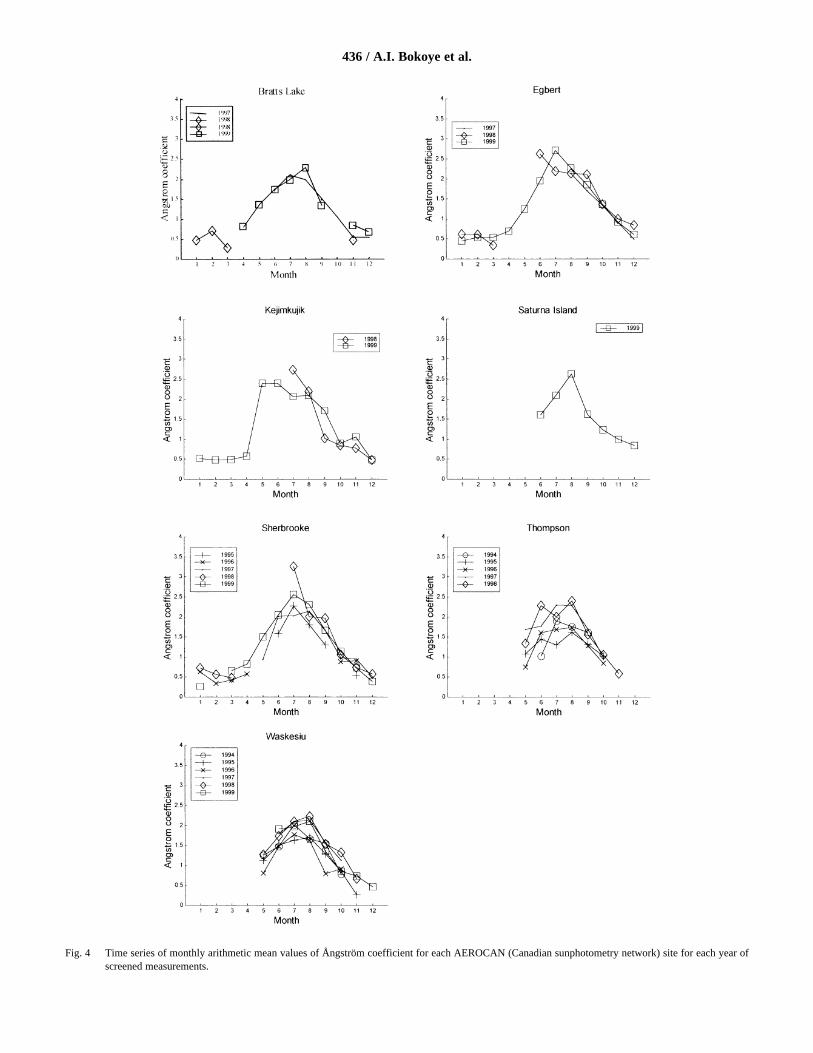
Optical depth spectra are linear (Ångström-like) on a log-logscale in the case of a (Junge) power law size distribution. It isgenerally known that the spectral dependence of AOD is onlyapproximately governed by the Ångström power law inas-much as the particle size distribution is multi-modal (seeO’Neill et al., 2001) rather than Junge. Tomasi et al. (1983)found that the Junge particle size distribution is valid only forα values close to 1. Some dependence on refractive index isalso expected. Nevertheless, the Ångström power law doesprovide standard, easily reproducible and robust informationon the particle size distribution: a decrease in α is associatedwith a general increase in the average particle size. In thisstudy, we consider this parameter as a first-order indicator ofaerosol type (see Section 5a).
Figure 4 shows the temporal variation of arithmetic meansof α values for each AEROCAN site. The station to stationarithmetic mean of all observations of α varies between 1.3and 1.7 typical of continental aerosol types (Holben et al.,2001). For all years and all stations, α variations reveal a sys-tematic seasonal trend with a high summer maximum around2 to 2.5.
3 MONTHLY MEAN PRECIPITABLE WATER VAPOUR
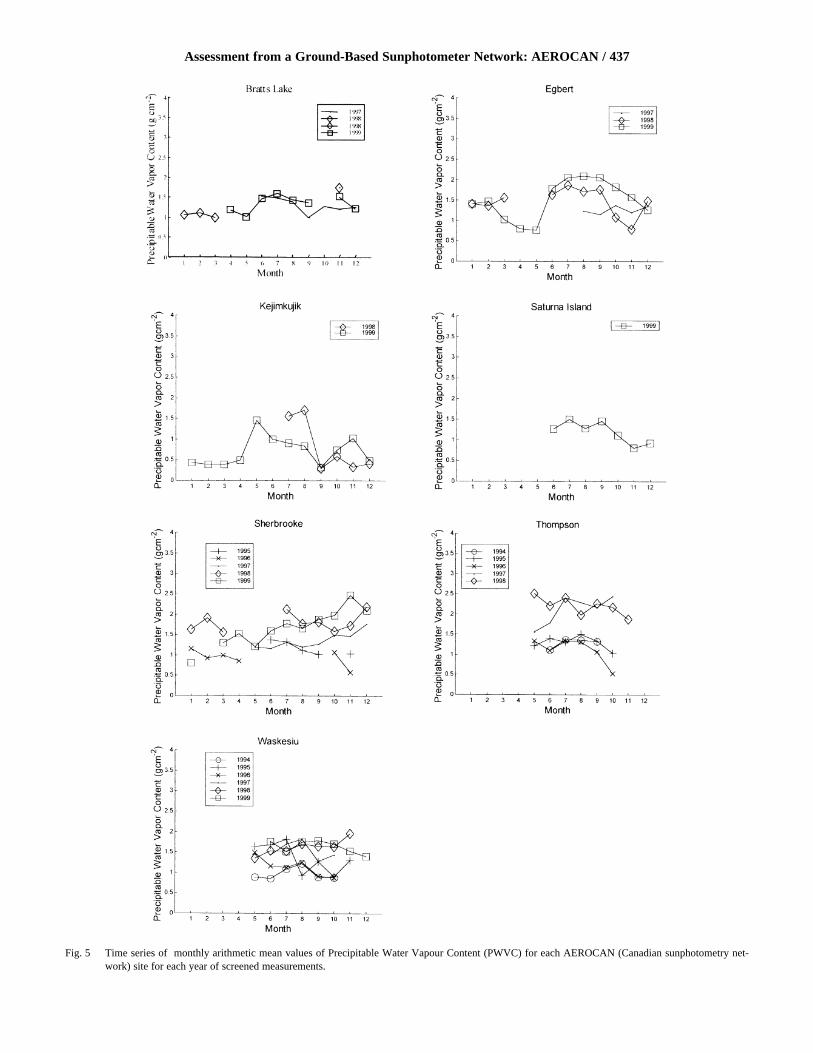
The CIMEL™ sunphotometer permits the retrieval of thePWVC from atmospheric absorption measurements in the940-nm channel (Halthore et al., 1997). Figure 5 shows variations in monthly atmospheric water vapour content forall stations in the AEROCAN network. The yearly pattern inmonthly PWVC means is characterized by relatively low values in winter (~ 0.5 g cm–2) and high values in summer(1.5 to 2 g cm–2). These seasonal values are similar to theresults of Gueymard (1994) for stations in Canada and thenorthern United States. The yearly and monthly values of this parameter for all the AEROCAN stations are given in the Appendix. A preliminary validation analysis with radiosondedata is discussed in Section 4b.
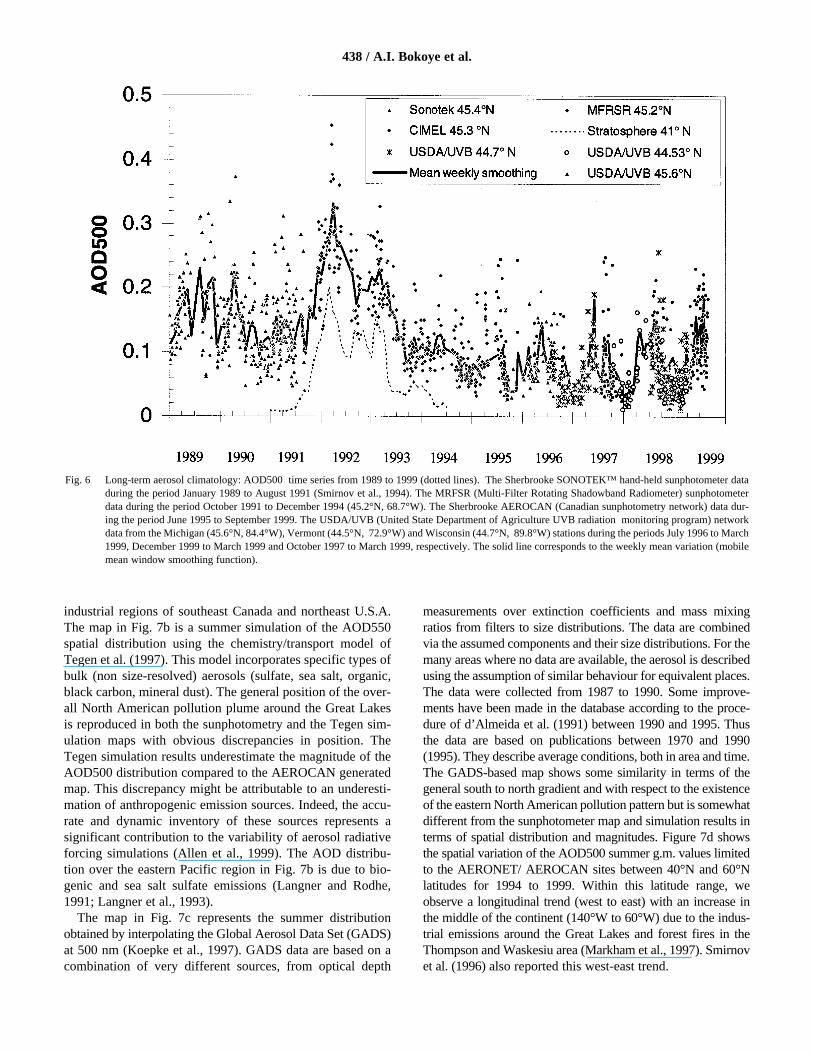
4 LONG-TERM VARIATION: CASE OF AOD500Long-term in situ measurements are required for models usedin the assessment and monitoring of climate change. In situmeasurements for the validation of these models over longtime periods are often sparse in terms of temporal and spatialsampling frequency. In this section, we provide an illustrationof a time series that could be employed for analysing back-ground aerosol loading and that could serve as validation datafor long-term model runs. Figure 6 shows a ten-year compi-lation of daily AOD500 data acquired at Sherbrooke using theSONOTEK™ and CIMEL™ instruments and data from anearby site in the MFRSR network. This time series clearlyshows the effect of the June 1991 Pinatubo eruption, the mostimportant aerosol event that has occurred over the last decade.The associated peaking in AOD500 during the winter of1991/92 is readily observable in the MFRSR data of Fig. 6 aswell as in the lower magnitude stratospheric data (Rosenet al., 1994). The AOD500 values decreased progressivelyfrom this peak during 1992 and 1993 to a background meanof around 0.1 between 1994 and 1999. The AOD valuesbefore the eruption are slightly higher than post-eruption val-ues. This may be attributed to a natural trend or a systematiccalibration error between SONOTEK™ and other instru-ments used to retrieve the AOD.
5 BACKGROUND AOD500 FOR THE SUMMER SEASON
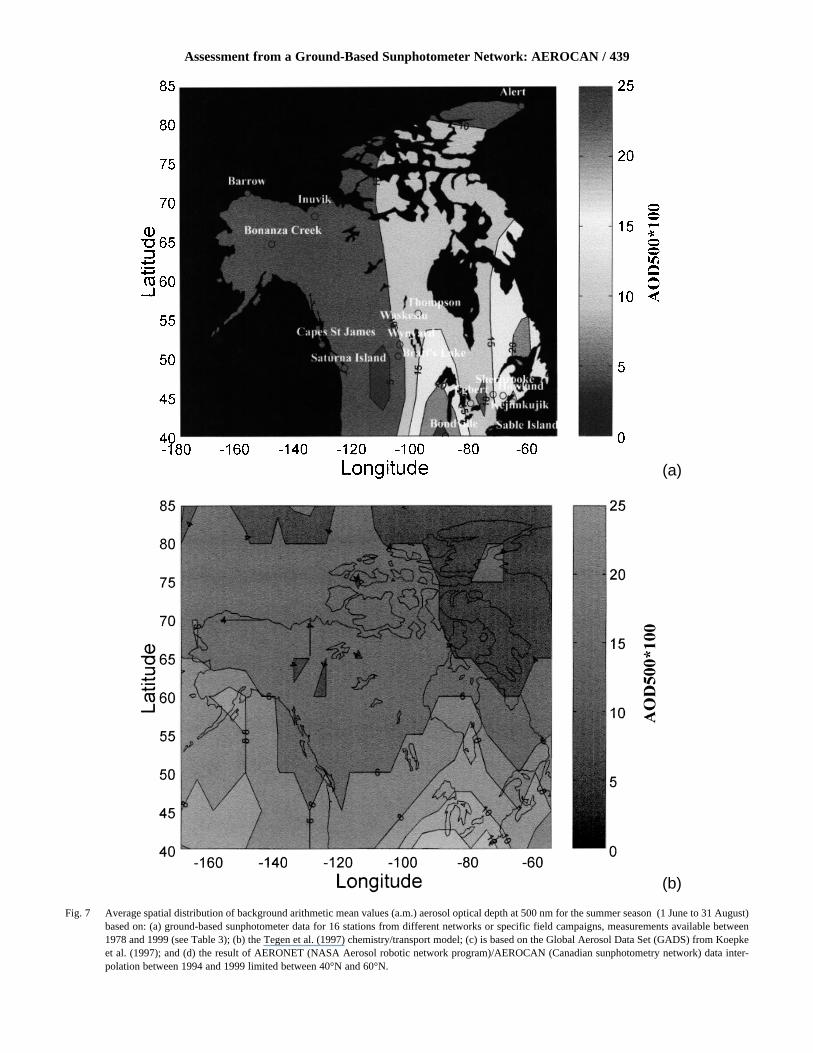
Figure 7a and Table 3 illustrate a preliminary spatial resam-pling and mapping of AOD500 arithmetic means during thesummer period (1 June to 31 August) acquired at sixteen sitesbetween 1978 and 1999 (Table 3) because these sites had thegreatest number of observations. In spite of the low density ofstations on a continental scale, the map does show spatial trendsthat are similar to the coarser type climatologies illustrated inFigs 7b and 7c. The a.m. was employed in Table 3 rather thanthe g.m. in order to facilitate comparisons with historical data.The four maps shown in Fig. 7 were generated by a spatialinterpolation method based on Matlab software Delaunay tri-angulation (Delaunay, 1934). The spatial resolution of the mapsis 5° in latitude by 5° in longitude.
The map in Fig. 7 highlights the general trends of the meanAOD500 for a continental background on a Canada-widescale. Results show a south to north gradient that is consistentwith the well-established influence of pollution sources in the
Assessment from a Ground-Based Sunphotometer Network: AEROCAN / 435
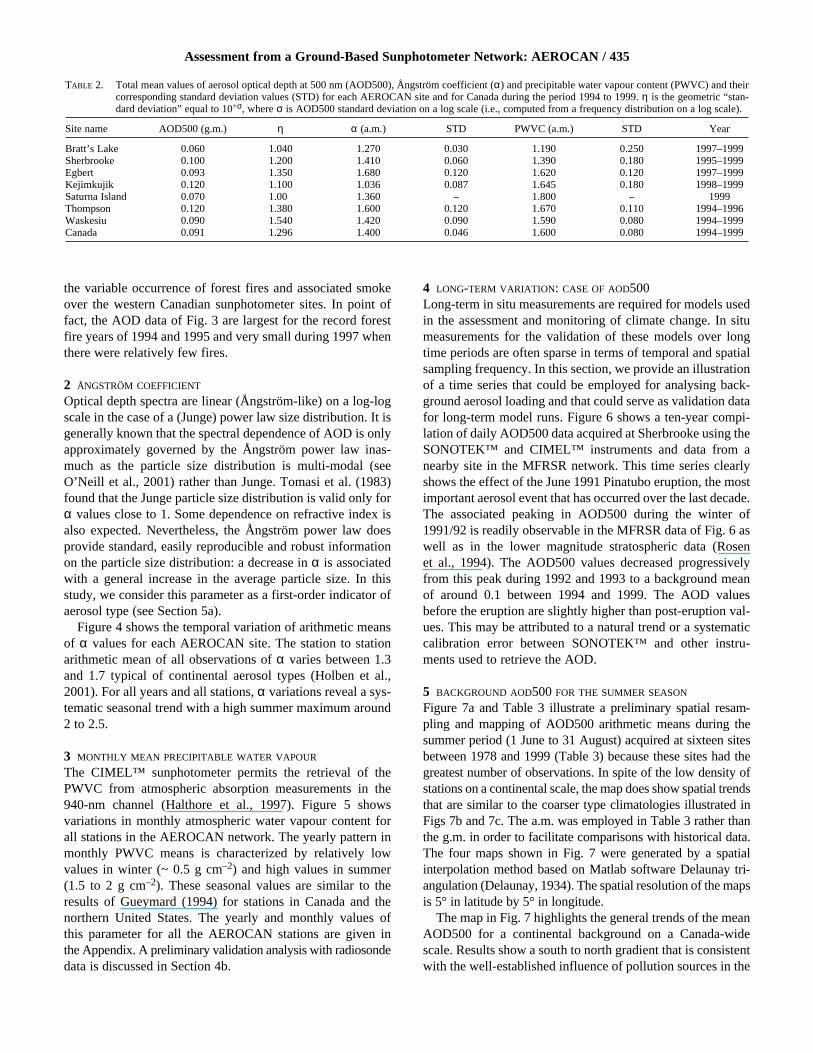
TABLE 2. Total mean values of aerosol optical depth at 500 nm (AOD500), Ångström coefficient (α) and precipitable water vapour content (PWVC) and theircorresponding standard deviation values (STD) for each AEROCAN site and for Canada during the period 1994 to 1999. η is the geometric “stan-dard deviation” equal to 10+σ, where σ is AOD500 standard deviation on a log scale (i.e., computed from a frequency distribution on a log scale).
Site name AOD500 (g.m.) η α (a.m.) STD PWVC (a.m.) STD Year
Bratt’s Lake 0.060 1.040 1.270 0.030 1.190 0.250 1997–1999Sherbrooke 0.100 1.200 1.410 0.060 1.390 0.180 1995–1999Egbert 0.093 1.350 1.680 0.120 1.620 0.120 1997–1999Kejimkujik 0.120 1.100 1.036 0.087 1.645 0.180 1998–1999Saturna Island 0.070 1.00 1.360 – 1.800 – 1999Thompson 0.120 1.380 1.600 0.120 1.670 0.110 1994–1996Waskesiu 0.090 1.540 1.420 0.090 1.590 0.080 1994–1999Canada 0.091 1.296 1.400 0.046 1.600 0.080 1994–1999
436 / A.I. Bokoye et al.
Fig. 4 Time series of monthly arithmetic mean values of Ångström coefficient for each AEROCAN (Canadian sunphotometry network) site for each year ofscreened measurements.
Assessment from a Ground-Based Sunphotometer Network: AEROCAN / 437
Fig. 5 Time series of monthly arithmetic mean values of Precipitable Water Vapour Content (PWVC) for each AEROCAN (Canadian sunphotometry net-work) site for each year of screened measurements.
industrial regions of southeast Canada and northeast U.S.A.The map in Fig. 7b is a summer simulation of the AOD550spatial distribution using the chemistry/transport model ofTegen et al. (1997). This model incorporates specific types ofbulk (non size-resolved) aerosols (sulfate, sea salt, organic,black carbon, mineral dust). The general position of the over-all North American pollution plume around the Great Lakesis reproduced in both the sunphotometry and the Tegen sim-ulation maps with obvious discrepancies in position. TheTegen simulation results underestimate the magnitude of theAOD500 distribution compared to the AEROCAN generatedmap. This discrepancy might be attributable to an underesti-mation of anthropogenic emission sources. Indeed, the accu-rate and dynamic inventory of these sources represents asignificant contribution to the variability of aerosol radiativeforcing simulations (Allen et al., 1999). The AOD distribu-tion over the eastern Pacific region in Fig. 7b is due to bio-genic and sea salt sulfate emissions (Langner and Rodhe,1991; Langner et al., 1993).
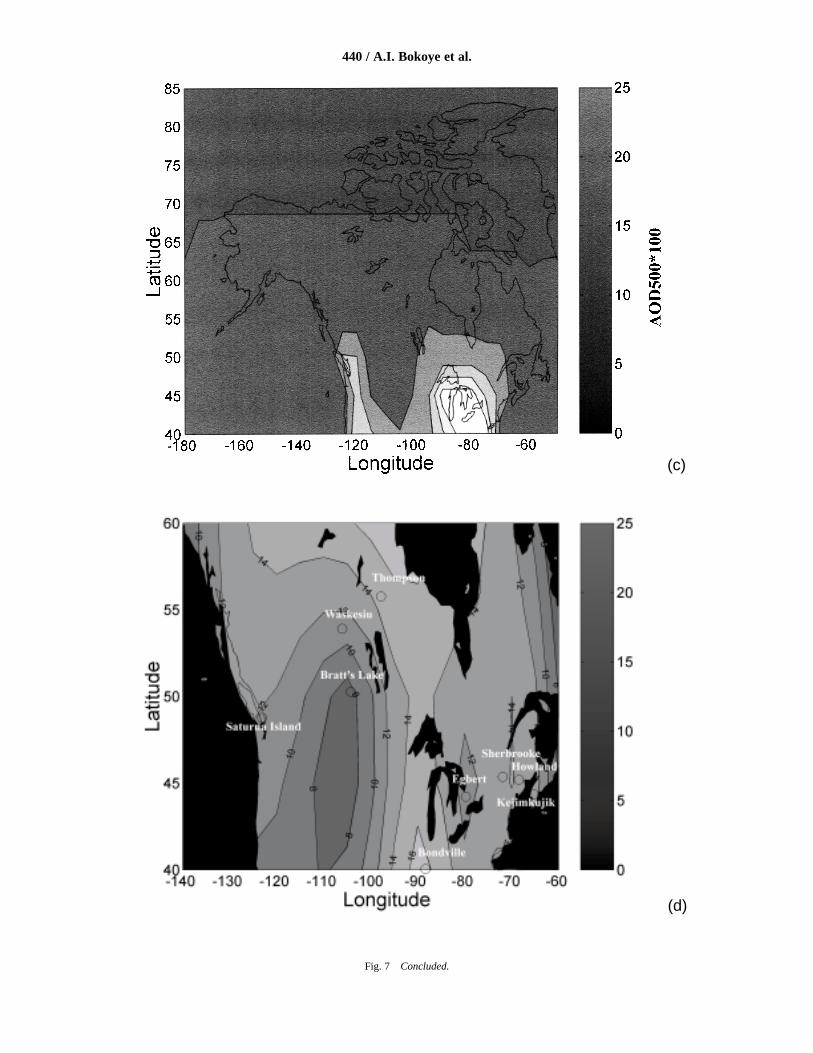
The map in Fig. 7c represents the summer distributionobtained by interpolating the Global Aerosol Data Set (GADS)at 500 nm (Koepke et al., 1997). GADS data are based on acombination of very different sources, from optical depth
measurements over extinction coefficients and mass mixingratios from filters to size distributions. The data are combinedvia the assumed components and their size distributions. For themany areas where no data are available, the aerosol is describedusing the assumption of similar behaviour for equivalent places.The data were collected from 1987 to 1990. Some improve-ments have been made in the database according to the proce-dure of d’Almeida et al. (1991) between 1990 and 1995. Thusthe data are based on publications between 1970 and 1990(1995). They describe average conditions, both in area and time.The GADS-based map shows some similarity in terms of thegeneral south to north gradient and with respect to the existenceof the eastern North American pollution pattern but is somewhatdifferent from the sunphotometer map and simulation results interms of spatial distribution and magnitudes. Figure 7d showsthe spatial variation of the AOD500 summer g.m. values limitedto the AERONET/ AEROCAN sites between 40°N and 60°Nlatitudes for 1994 to 1999. Within this latitude range, weobserve a longitudinal trend (west to east) with an increase inthe middle of the continent (140°W to 60°W) due to the indus-trial emissions around the Great Lakes and forest fires in theThompson and Waskesiu area (Markham et al., 1997). Smirnovet al. (1996) also reported this west-east trend.
438 / A.I. Bokoye et al.
Fig. 6 Long-term aerosol climatology: AOD500 time series from 1989 to 1999 (dotted lines). The Sherbrooke SONOTEK™ hand-held sunphotometer dataduring the period January 1989 to August 1991 (Smirnov et al., 1994). The MRFSR (Multi-Filter Rotating Shadowband Radiometer) sunphotometerdata during the period October 1991 to December 1994 (45.2°N, 68.7°W). The Sherbrooke AEROCAN (Canadian sunphotometry network) data dur-ing the period June 1995 to September 1999. The USDA/UVB (United State Department of Agriculture UVB radiation monitoring program) networkdata from the Michigan (45.6°N, 84.4°W), Vermont (44.5°N, 72.9°W) and Wisconsin (44.7°N, 89.8°W) stations during the periods July 1996 to March1999, December 1999 to March 1999 and October 1997 to March 1999, respectively. The solid line corresponds to the weekly mean variation (mobilemean window smoothing function).
Assessment from a Ground-Based Sunphotometer Network: AEROCAN / 439
Fig. 7 Average spatial distribution of background arithmetic mean values (a.m.) aerosol optical depth at 500 nm for the summer season (1 June to 31 August)based on: (a) ground-based sunphotometer data for 16 stations from different networks or specific field campaigns, measurements available between1978 and 1999 (see Table 3); (b) the Tegen et al. (1997) chemistry/transport model; (c) is based on the Global Aerosol Data Set (GADS) from Koepkeet al. (1997); and (d) the result of AERONET (NASA Aerosol robotic network program)/AEROCAN (Canadian sunphotometry network) data inter-polation between 1994 and 1999 limited between 40°N and 60°N.
(a)
(b)
440 / A.I. Bokoye et al.
Fig. 7 Concluded.
(c)
(d)
Significant differences in position and magnitude of AODwere also reported by Tegen et al. (1997) for comparisonsbetween model results, sunphotometer measurements andsatellite retrievals. The differences in the comparisons ofFig. 7 suggest that aerosol forcing simulations will in turnrequire further investigation to assimilate AEROCAN in situdata better, satellite inversions (Kaufman et al., 1997) andAOD modelling on a national scale. In addition to improvedmodelling and assimilation techniques, useful effort could beexpended on measurement methodologies and logistics. Forexample, cloud contamination can still be problematic fortemporally stable large-valued AOD data since the currentcloud screening algorithm only accounts for high frequencyexcursions in time. Improvement in instrumentation to endurebetter the rigorous conditions of winter would allow the estab-lishment of seasonal AOD contour maps. Such maps wouldbe useful as a source of validation for general climate modelsthat incorporate aerosol chemistry/transport dynamics.
b Derived Optical Parameters: Volume Size Distribution,Real and Imaginary Part of the Refractive Index and SingleScattering Albedo Near-simultaneous measurements of direct solar intensity andsky radiance permit the retrieval of certain optical and physi-cal aerosol parameters. These parameters are needed to char-acterize aerosol type and can play an important role in aerosolmodelling. Two inversion algorithms are currently used in theAERONET standard data processing chain to infer aerosolmicrophysical and radiative properties: one by Nakajima et al.(1983, 1996) and another developed for the AERONET net-work by Dubovik and King (2000), Dubovik et al. (2000).The latter inversion has become the operational AERONETinversion routine. It, like the Nakijima inversion, is based onan assumption of homogeneous spheres but also, yields channel-
dependent values of the real and imaginary part of the refrac-tive index and the single scattering albedo in addition to par-ticle size distribution. The AERONET code outputs thevolume size distribution in the 0.05 to 15 µm range. Someexamples of this inversion are shown in the next section.
These derived parameters can be employed as input para-meters to radiative transfer models. However, retrievals ofsuch parameters are very sensitive to measurement errors andthe assumptions employed in the inversion algorithms(O’Neill and Miller, 1984; Wendisch and Von Heuningen-Heune, 1994; Dubovik et al., 1998; Romanov et al., 1999).Uncertainties in the algorithm increase in the presence ofsun/sky measurement errors (angular pointing, miscalibra-tion, etc.), spatial inhomogeneities such as small clouds in thescanning hemisphere, and non-spherical aerosols. The latteryield Mie theory and phase function inconsistancies in theradiative transfer kernel of the inversion process. The system-atic exploitation of this type of data on a routine basis requiresa thorough analysis of the raw data (Smirnov et al., 2000) anda rigorous analysis of sunphotometer calibration (Romanovet al., 1999). The general accuracies expected for the derivedparameters as well as the recommended constraints on opera-tional parameters are discussed by Dubovik et al. (2000).
4 Intercomparison of parameters with other methodsIn this section parameters from the AEROCAN network arecompared to those derived from lidar and particle countingmeasurements carried out during specific field campaigns.Comparison between PWVC derived from CIMEL™ sun-photometer and radiosonde data are also discussed.
a Aerosol Optical DepthAn independent comparison between CIMEL™ derivedAODs and optical depths derived from Neodymium:Yttrium-
Assessment from a Ground-Based Sunphotometer Network: AEROCAN / 441
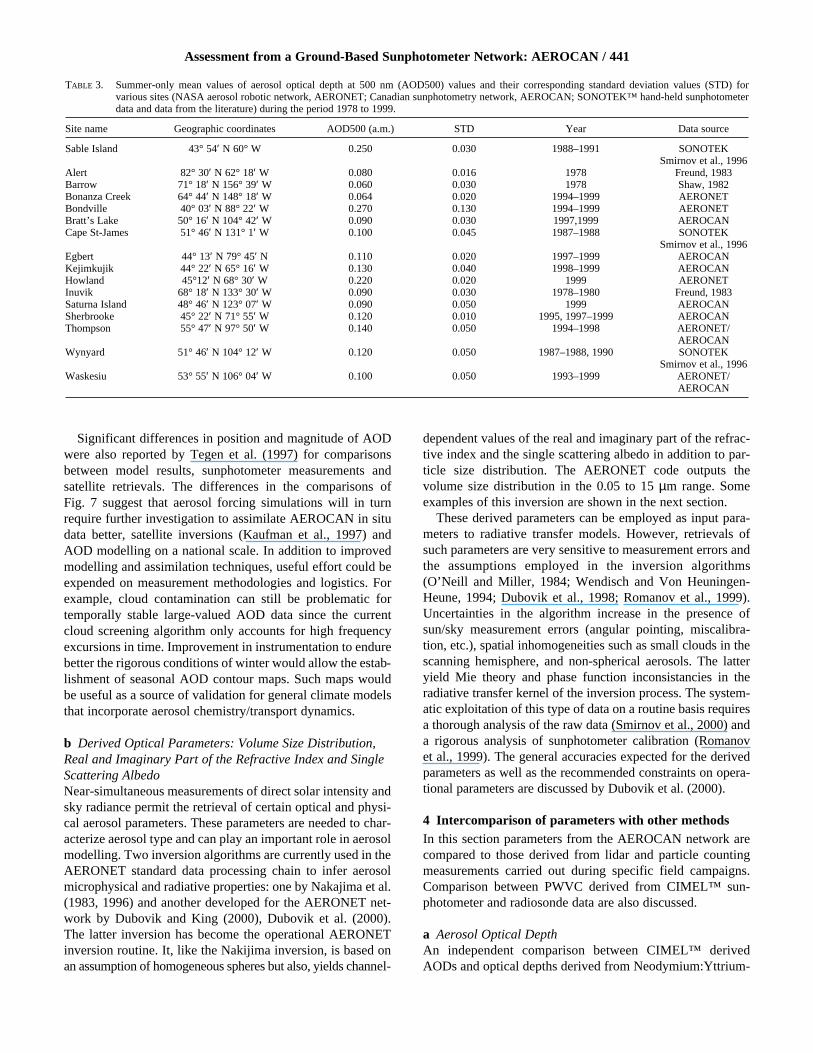
TABLE 3. Summer-only mean values of aerosol optical depth at 500 nm (AOD500) values and their corresponding standard deviation values (STD) for various sites (NASA aerosol robotic network, AERONET; Canadian sunphotometry network, AEROCAN; SONOTEK™ hand-held sunphotometerdata and data from the literature) during the period 1978 to 1999.
Site name Geographic coordinates AOD500 (a.m.) STD Year Data source
Sable Island 43° 54′ N 60° W 0.250 0.030 1988–1991 SONOTEK Smirnov et al., 1996
Alert 82° 30′ N 62° 18′ W 0.080 0.016 1978 Freund, 1983Barrow 71° 18′ N 156° 39′ W 0.060 0.030 1978 Shaw, 1982Bonanza Creek 64° 44′ N 148° 18′ W 0.064 0.020 1994–1999 AERONETBondville 40° 03′ N 88° 22′ W 0.270 0.130 1994–1999 AERONETBratt’s Lake 50° 16′ N 104° 42′ W 0.090 0.030 1997,1999 AEROCANCape St-James 51° 46′ N 131° 1′ W 0.100 0.045 1987–1988 SONOTEK
Smirnov et al., 1996Egbert 44° 13′ N 79° 45′ N 0.110 0.020 1997–1999 AEROCANKejimkujik 44° 22′ N 65° 16′ W 0.130 0.040 1998–1999 AEROCANHowland 45°12′ N 68° 30′ W 0.220 0.020 1999 AERONETInuvik 68° 18′ N 133° 30′ W 0.090 0.030 1978–1980 Freund, 1983Saturna Island 48° 46′ N 123° 07′ W 0.090 0.050 1999 AEROCANSherbrooke 45° 22′ N 71° 55′ W 0.120 0.010 1995, 1997–1999 AEROCANThompson 55° 47′ N 97° 50′ W 0.140 0.050 1994–1998 AERONET/
AEROCANWynyard 51° 46′ N 104° 12′ W 0.120 0.050 1987–1988, 1990 SONOTEK
Smirnov et al., 1996Waskesiu 53° 55′ N 106° 04′ W 0.100 0.050 1993–1999 AERONET/
AEROCAN
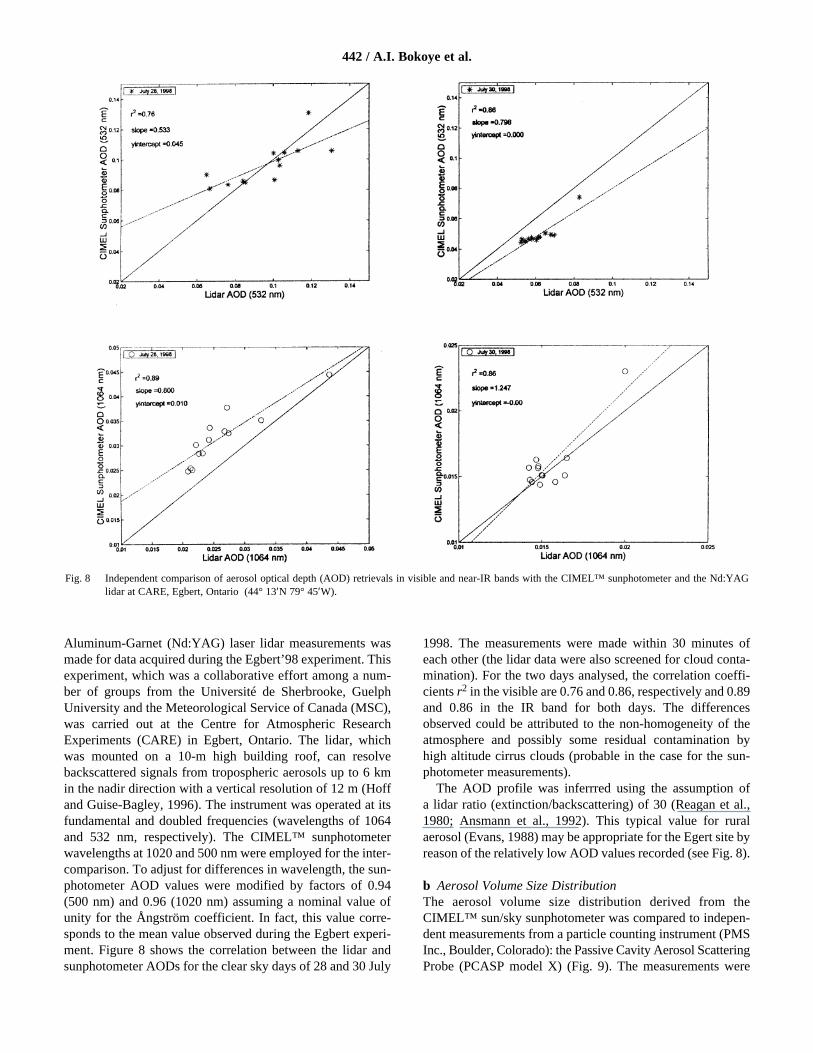
Aluminum-Garnet (Nd:YAG) laser lidar measurements wasmade for data acquired during the Egbert’98 experiment. Thisexperiment, which was a collaborative effort among a num-ber of groups from the Université de Sherbrooke, GuelphUniversity and the Meteorological Service of Canada (MSC),was carried out at the Centre for Atmospheric ResearchExperiments (CARE) in Egbert, Ontario. The lidar, whichwas mounted on a 10-m high building roof, can resolvebackscattered signals from tropospheric aerosols up to 6 kmin the nadir direction with a vertical resolution of 12 m (Hoffand Guise-Bagley, 1996). The instrument was operated at itsfundamental and doubled frequencies (wavelengths of 1064and 532 nm, respectively). The CIMEL™ sunphotometerwavelengths at 1020 and 500 nm were employed for the inter-comparison. To adjust for differences in wavelength, the sun-photometer AOD values were modified by factors of 0.94(500 nm) and 0.96 (1020 nm) assuming a nominal value ofunity for the Ångström coefficient. In fact, this value corre-sponds to the mean value observed during the Egbert experi-ment. Figure 8 shows the correlation between the lidar andsunphotometer AODs for the clear sky days of 28 and 30 July
1998. The measurements were made within 30 minutes ofeach other (the lidar data were also screened for cloud conta-mination). For the two days analysed, the correlation coeffi-cients r2 in the visible are 0.76 and 0.86, respectively and 0.89and 0.86 in the IR band for both days. The differencesobserved could be attributed to the non-homogeneity of theatmosphere and possibly some residual contamination byhigh altitude cirrus clouds (probable in the case for the sun-photometer measurements).
The AOD profile was inferrred using the assumption of a lidar ratio (extinction/backscattering) of 30 (Reagan et al.,1980; Ansmann et al., 1992). This typical value for ruralaerosol (Evans, 1988) may be appropriate for the Egert site byreason of the relatively low AOD values recorded (see Fig. 8).
b Aerosol Volume Size Distribution The aerosol volume size distribution derived from theCIMEL™ sun/sky sunphotometer was compared to indepen-dent measurements from a particle counting instrument (PMSInc., Boulder, Colorado): the Passive Cavity Aerosol ScatteringProbe (PCASP model X) (Fig. 9). The measurements were
442 / A.I. Bokoye et al.
Fig. 8 Independent comparison of aerosol optical depth (AOD) retrievals in visible and near-IR bands with the CIMEL™ sunphotometer and the Nd:YAGlidar at CARE, Egbert, Ontario (44° 13′N 79° 45′W).
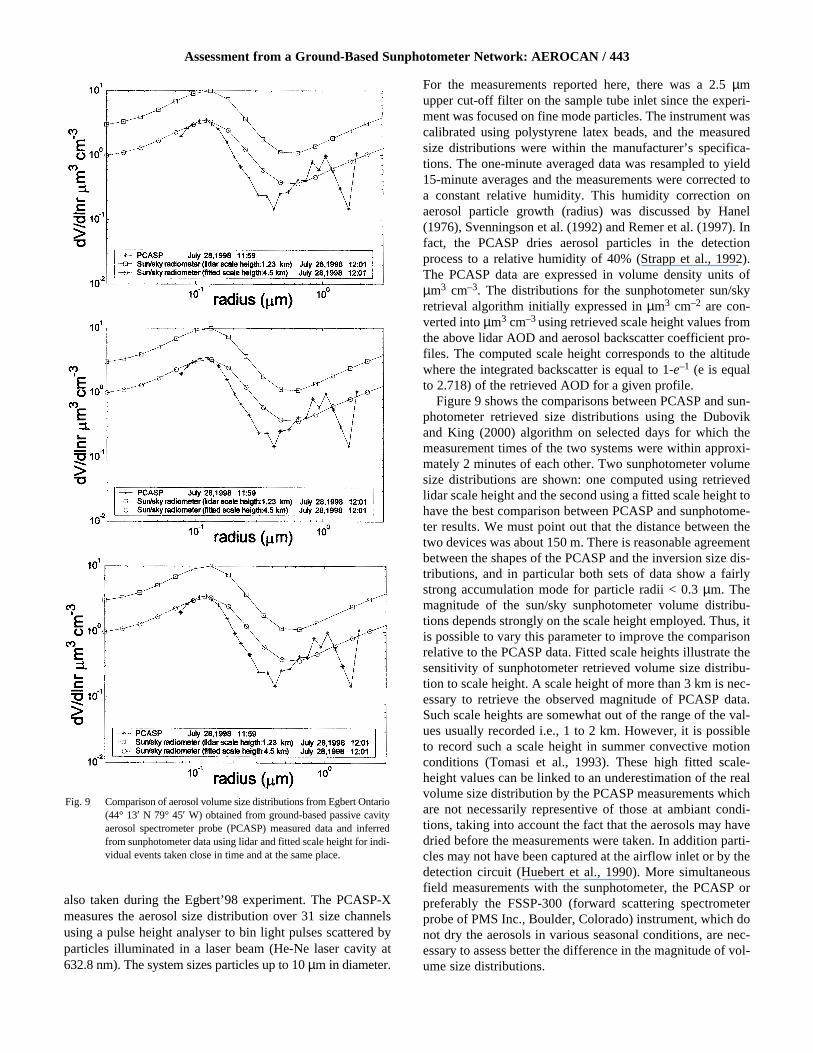
also taken during the Egbert’98 experiment. The PCASP-Xmeasures the aerosol size distribution over 31 size channelsusing a pulse height analyser to bin light pulses scattered byparticles illuminated in a laser beam (He-Ne laser cavity at632.8 nm). The system sizes particles up to 10 µm in diameter.
For the measurements reported here, there was a 2.5 µmupper cut-off filter on the sample tube inlet since the experi-ment was focused on fine mode particles. The instrument wascalibrated using polystyrene latex beads, and the measuredsize distributions were within the manufacturer’s specifica-tions. The one-minute averaged data was resampled to yield15-minute averages and the measurements were corrected toa constant relative humidity. This humidity correction onaerosol particle growth (radius) was discussed by Hanel(1976), Svenningson et al. (1992) and Remer et al. (1997). Infact, the PCASP dries aerosol particles in the detectionprocess to a relative humidity of 40% (Strapp et al., 1992).The PCASP data are expressed in volume density units ofµm3 cm–3. The distributions for the sunphotometer sun/skyretrieval algorithm initially expressed in µm3 cm–2 are con-verted into µm3 cm–3 using retrieved scale height values fromthe above lidar AOD and aerosol backscatter coefficient pro-files. The computed scale height corresponds to the altitudewhere the integrated backscatter is equal to 1-e–1 (e is equalto 2.718) of the retrieved AOD for a given profile.
Figure 9 shows the comparisons between PCASP and sun-photometer retrieved size distributions using the Dubovikand King (2000) algorithm on selected days for which themeasurement times of the two systems were within approxi-mately 2 minutes of each other. Two sunphotometer volumesize distributions are shown: one computed using retrievedlidar scale height and the second using a fitted scale height tohave the best comparison between PCASP and sunphotome-ter results. We must point out that the distance between thetwo devices was about 150 m. There is reasonable agreementbetween the shapes of the PCASP and the inversion size dis-tributions, and in particular both sets of data show a fairlystrong accumulation mode for particle radii < 0.3 µm. Themagnitude of the sun/sky sunphotometer volume distribu-tions depends strongly on the scale height employed. Thus, itis possible to vary this parameter to improve the comparisonrelative to the PCASP data. Fitted scale heights illustrate thesensitivity of sunphotometer retrieved volume size distribu-tion to scale height. A scale height of more than 3 km is nec-essary to retrieve the observed magnitude of PCASP data.Such scale heights are somewhat out of the range of the val-ues usually recorded i.e., 1 to 2 km. However, it is possibleto record such a scale height in summer convective motionconditions (Tomasi et al., 1993). These high fitted scale-height values can be linked to an underestimation of the realvolume size distribution by the PCASP measurements whichare not necessarily representive of those at ambiant condi-tions, taking into account the fact that the aerosols may havedried before the measurements were taken. In addition parti-cles may not have been captured at the airflow inlet or by thedetection circuit (Huebert et al., 1990). More simultaneousfield measurements with the sunphotometer, the PCASP orpreferably the FSSP-300 (forward scattering spectrometerprobe of PMS Inc., Boulder, Colorado) instrument, which donot dry the aerosols in various seasonal conditions, are nec-essary to assess better the difference in the magnitude of vol-ume size distributions.
Assessment from a Ground-Based Sunphotometer Network: AEROCAN / 443
Fig. 9 Comparison of aerosol volume size distributions from Egbert Ontario(44° 13′ N 79° 45′ W) obtained from ground-based passive cavityaerosol spectrometer probe (PCASP) measured data and inferredfrom sunphotometer data using lidar and fitted scale height for indi-vidual events taken close in time and at the same place.
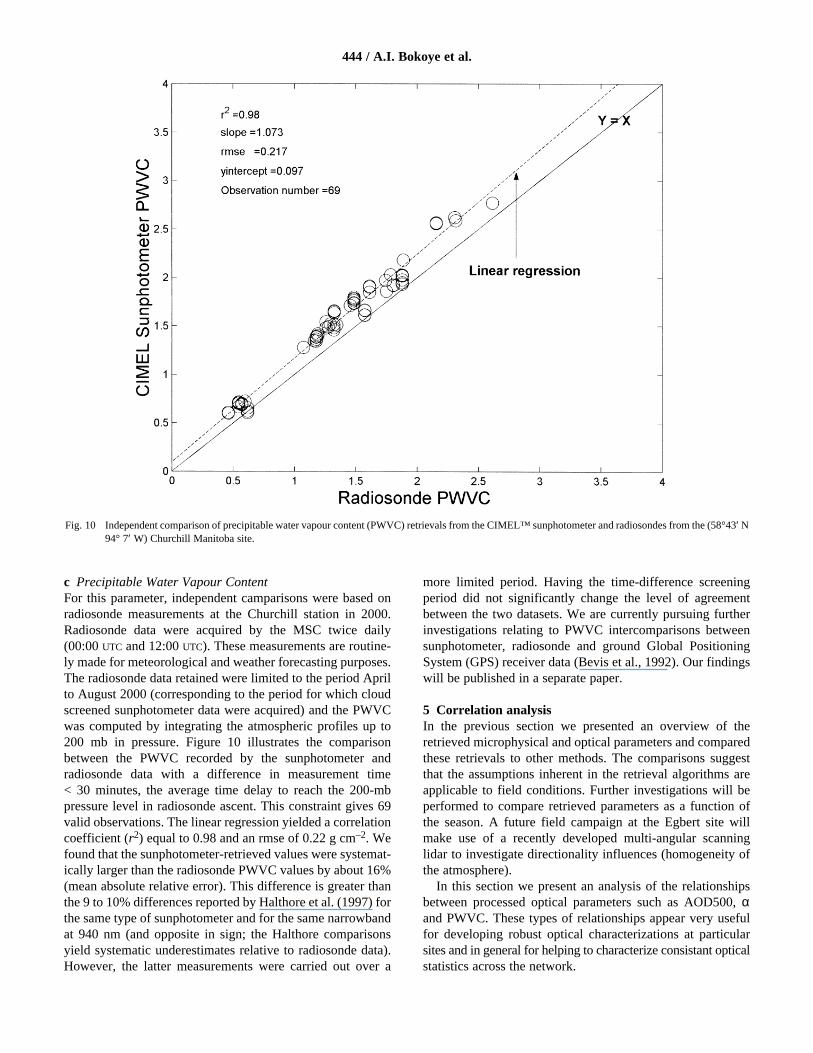
c Precipitable Water Vapour Content For this parameter, independent camparisons were based onradiosonde measurements at the Churchill station in 2000.Radiosonde data were acquired by the MSC twice daily(00:00 UTC and 12:00 UTC). These measurements are routine-ly made for meteorological and weather forecasting purposes.The radiosonde data retained were limited to the period Aprilto August 2000 (corresponding to the period for which cloudscreened sunphotometer data were acquired) and the PWVCwas computed by integrating the atmospheric profiles up to200 mb in pressure. Figure 10 illustrates the comparisonbetween the PWVC recorded by the sunphotometer andradiosonde data with a difference in measurement time< 30 minutes, the average time delay to reach the 200-mbpressure level in radiosonde ascent. This constraint gives 69valid observations. The linear regression yielded a correlationcoefficient (r2) equal to 0.98 and an rmse of 0.22 g cm–2. Wefound that the sunphotometer-retrieved values were systemat-ically larger than the radiosonde PWVC values by about 16%(mean absolute relative error). This difference is greater thanthe 9 to 10% differences reported by Halthore et al. (1997) forthe same type of sunphotometer and for the same narrowbandat 940 nm (and opposite in sign; the Halthore comparisonsyield systematic underestimates relative to radiosonde data).However, the latter measurements were carried out over a
more limited period. Having the time-difference screeningperiod did not significantly change the level of agreementbetween the two datasets. We are currently pursuing furtherinvestigations relating to PWVC intercomparisons betweensunphotometer, radiosonde and ground Global PositioningSystem (GPS) receiver data (Bevis et al., 1992). Our findingswill be published in a separate paper.
5 Correlation analysisIn the previous section we presented an overview of theretrieved microphysical and optical parameters and comparedthese retrievals to other methods. The comparisons suggestthat the assumptions inherent in the retrieval algorithms areapplicable to field conditions. Further investigations will beperformed to compare retrieved parameters as a function ofthe season. A future field campaign at the Egbert site willmake use of a recently developed multi-angular scanninglidar to investigate directionality influences (homogeneity ofthe atmosphere).
In this section we present an analysis of the relationshipsbetween processed optical parameters such as AOD500, αand PWVC. These types of relationships appear very usefulfor developing robust optical characterizations at particularsites and in general for helping to characterize consistant opticalstatistics across the network.
444 / A.I. Bokoye et al.
Fig. 10 Independent comparison of precipitable water vapour content (PWVC) retrievals from the CIMEL™ sunphotometer and radiosondes from the (58°43′ N94° 7′ W) Churchill Manitoba site.
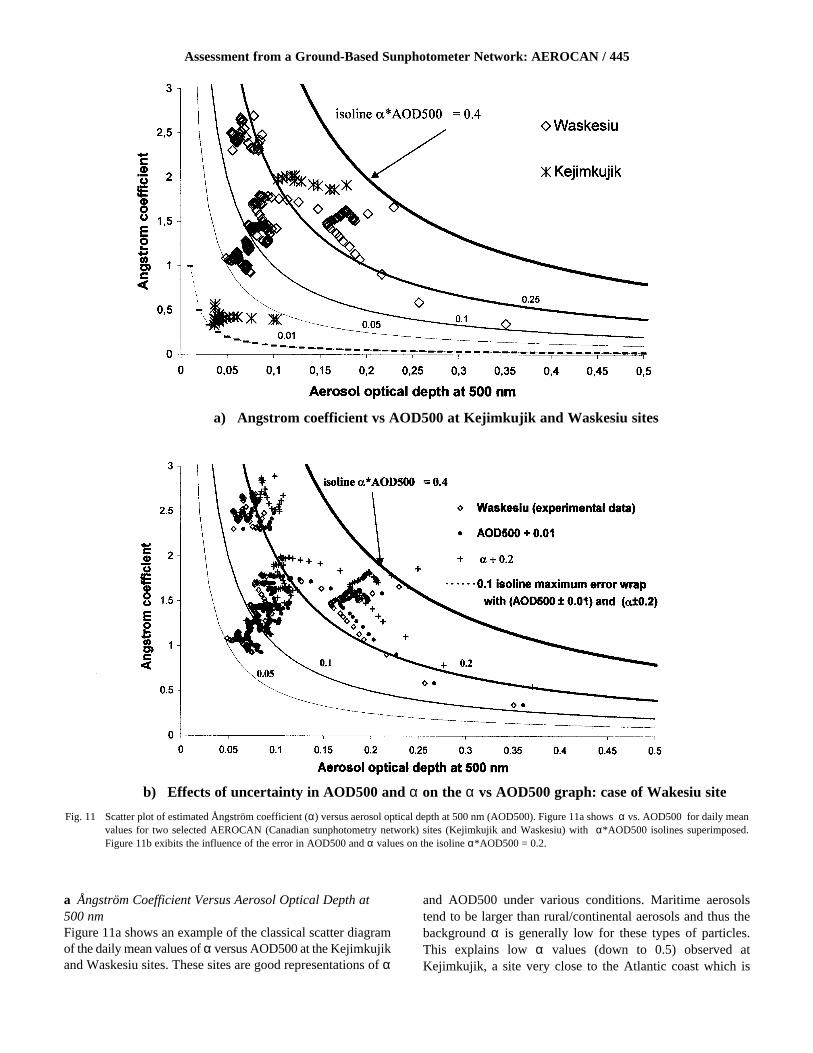
a Ångström Coefficient Versus Aerosol Optical Depth at 500 nmFigure 11a shows an example of the classical scatter diagramof the daily mean values of α versus AOD500 at the Kejimkujikand Waskesiu sites. These sites are good representations of α
and AOD500 under various conditions. Maritime aerosolstend to be larger than rural/continental aerosols and thus thebackground α is generally low for these types of particles.This explains low α values (down to 0.5) observed atKejimkujik, a site very close to the Atlantic coast which is
Assessment from a Ground-Based Sunphotometer Network: AEROCAN / 445
Fig. 11 Scatter plot of estimated Ångström coefficient (α) versus aerosol optical depth at 500 nm (AOD500). Figure 11a shows α vs. AOD500 for daily meanvalues for two selected AEROCAN (Canadian sunphotometry network) sites (Kejimkujik and Waskesiu) with α*AOD500 isolines superimposed.Figure 11b exibits the influence of the error in AOD500 and α values on the isoline α*AOD500 = 0.2.
a) Angstrom coefficient vs AOD500 at Kejimkujik and Waskesiu sites
b) Effects of uncertainty in AOD500 and α on the α vs AOD500 graph: case of Wakesiu site
regulary under a maritime air mass (O’Dowd et al., 1997). Infact, this locale is very close to the Atlantic coast. The graph does not reveal any systematic spatial trend if we compare the station to station results. This allows us to simplify Fig. 11 by limiting the stations to two. Also the αversus AOD500 graphs reported by (Holben et al., 2001) forvarious AERONET sites do not reveal any systematic spatialtrend. This type of scatter diagram is interesting because itpermits a characterization of aerosol type based on discrimi-nant (α, AOD) boundaries between different types ofaerosols (Smirnov et al., 1994; Guzzi et al., 1997; Hess et al.,1998; Dubovik et al., 1998; Yamasoe et al., 1998). The linesin Fig. 11a represent isolines of the product α*AOD500.These are used as an indicator of both the cumulative (totalnumber concentration) aerosol contributions and aerosoltype (size). This parameter, which is sometimes labelled asan aerosol index (Deuzé et al., 2001), can be used as a first-order check on the radiative efficiency i.e., the ability to rep-resent the absorption, scattering and the size of aerosols inthe atmosphere because aerosol backscattering (radiance)depends (in a single scattering sense) on the product of theAOD and the phase function. This product, in turn, is relatedto α*AOD500 since an increase in the backscattering phasefunction corresponds to a decrease in particle size and hencean increase in α. The coarse link with radiance thus meansthat α*AOD500 is a rough measure of aerosol forcing for cli-matological applications.
In Fig. 11a, the observed daily mean values span different(α, AOD) isolines of the product α*AOD500 (i.e., 0.05, 0.1,0.25 and 0.4), but do not cluster in similar regions for the twostations. This clustering is consistent with the idea that dailyvalues include different types of air masses (Smirnov et al.,1994, 1996) which in turn are associated with major regionalaerosol species distinguished by their size distribution andchemical nature (William and Sisler, 2000). The combinationof aeosol loading and type information implicit inα*AOD500 thus contributes to the segmentation of points in(α, AOD) space. The values of α*AOD500 at the Waskesiusite seem to fall between the 0.05 and 0.4 isolines while theKejimkujik site shows two modes respectively between the0.01 to 0.05 and the 0.25 to 0.4 isolines. This apparent sys-tematic difference between stations suggests a general way ofclassifying aerosols according to their optical behaviour on anα versus AOD500 graph segregated by α*AOD500 isolines.Figure 11b shows the simulated influences of errors in α,AOD and their influence on real data. The dotted lines repre-sent the maximum error wrap for isoline 0.2 if the absoluteerrors of ±0.01 and ±0.2 are introduced respectively on α andAOD500. The scatter diagrams in (α, AOD) space representWaskesiu site daily averages data, the markers ✧ and + cor-respond to an absolute error of 0.01 in AOD and 0.2 in αrespectively whereas the symbol ● represents the real data.The scatter diagrams at the Waskesiu site for example showthat the above absolute uncertainties at the upper limitsadmissible for α and AOD500 do not significantly affect theclassification of atmospheric aerosols in function of (α,AOD500) isolines.
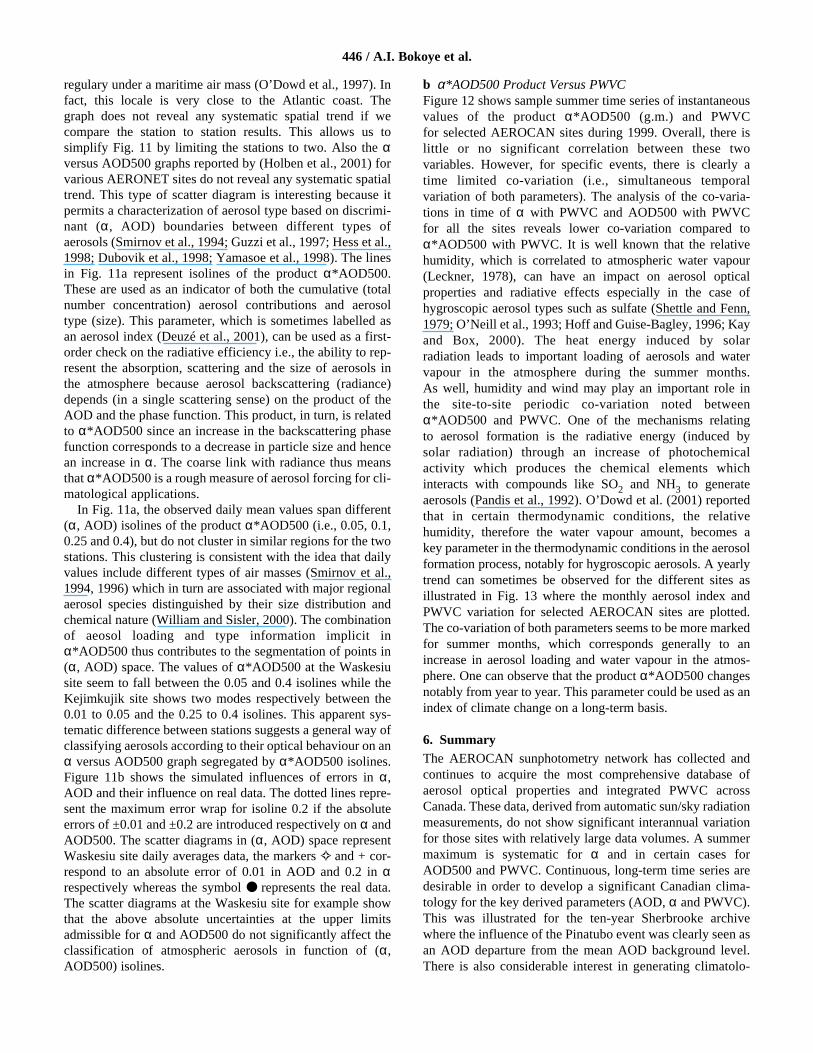
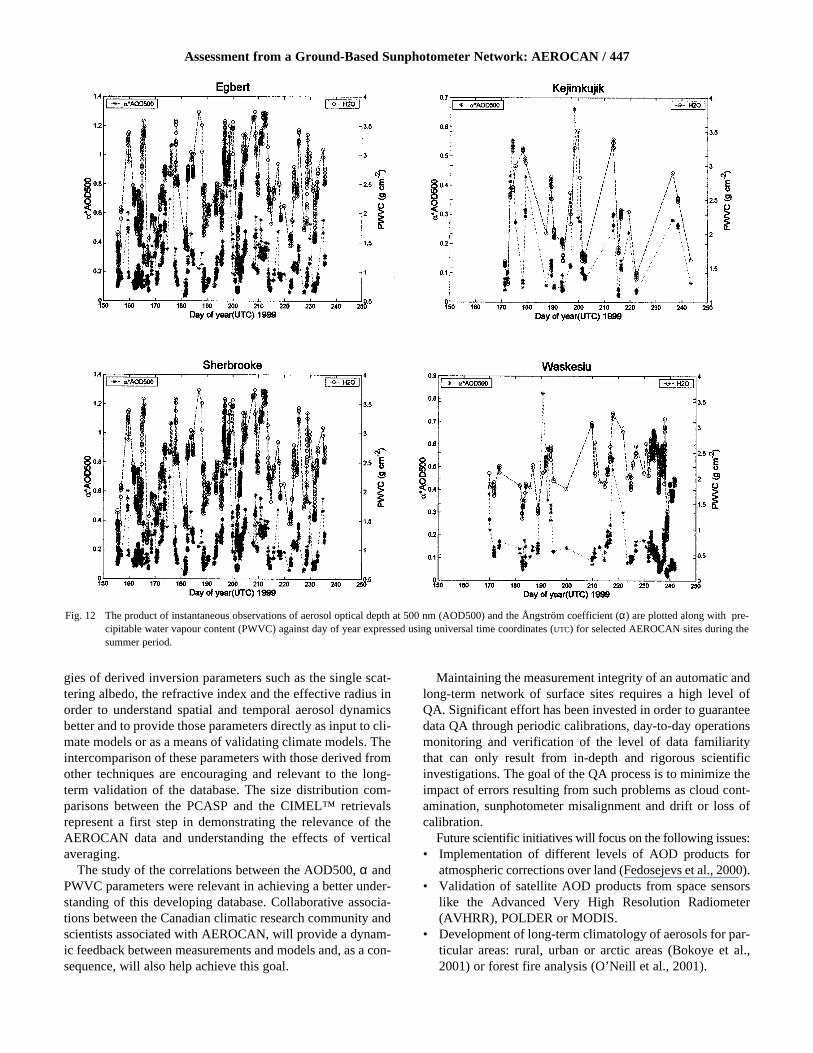
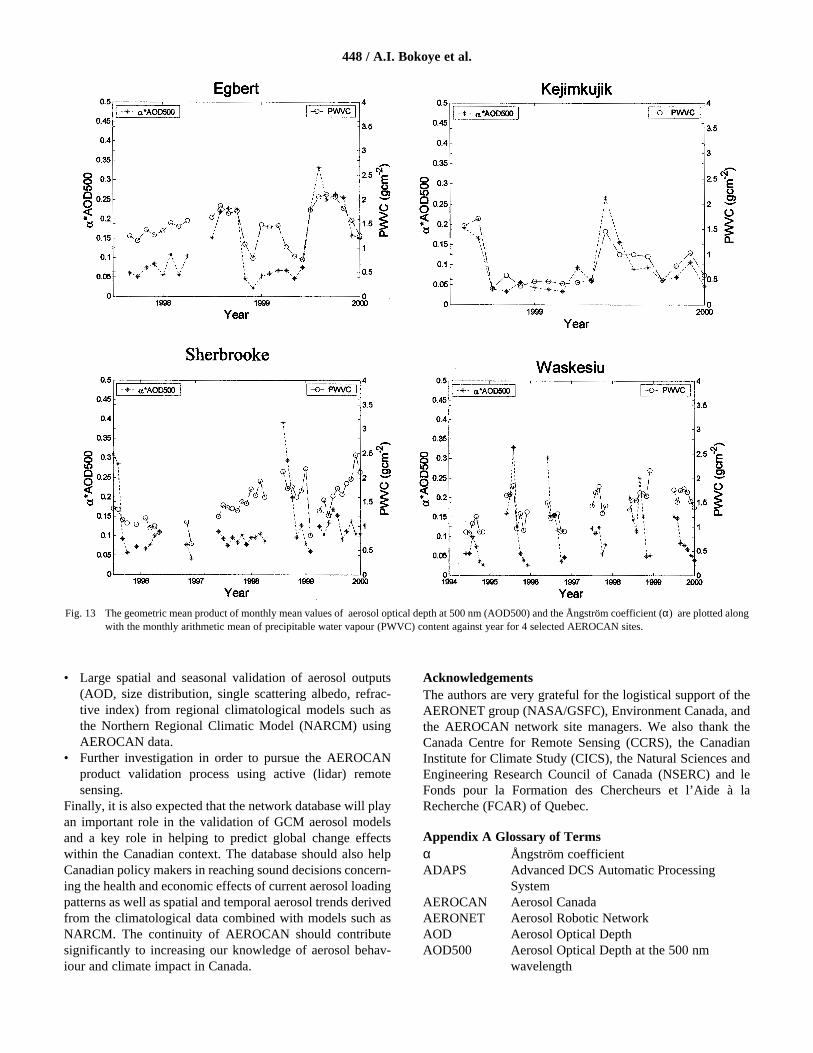
b α*AOD500 Product Versus PWVC Figure 12 shows sample summer time series of instantaneousvalues of the product α*AOD500 (g.m.) and PWVC for selected AEROCAN sites during 1999. Overall, there islittle or no significant correlation between these two variables. However, for specific events, there is clearly a time limited co-variation (i.e., simultaneous temporal variation of both parameters). The analysis of the co-varia-tions in time of α with PWVC and AOD500 with PWVC for all the sites reveals lower co-variation compared toα*AOD500 with PWVC. It is well known that the relativehumidity, which is correlated to atmospheric water vapour(Leckner, 1978), can have an impact on aerosol optical properties and radiative effects especially in the case ofhygroscopic aerosol types such as sulfate (Shettle and Fenn,1979; O’Neill et al., 1993; Hoff and Guise-Bagley, 1996; Kayand Box, 2000). The heat energy induced by solar radiation leads to important loading of aerosols and watervapour in the atmosphere during the summer months. As well, humidity and wind may play an important role in the site-to-site periodic co-variation noted betweenα*AOD500 and PWVC. One of the mechanisms relating to aerosol formation is the radiative energy (induced by solar radiation) through an increase of photochemical activity which produces the chemical elements which interacts with compounds like SO2 and NH3 to generateaerosols (Pandis et al., 1992). O’Dowd et al. (2001) reportedthat in certain thermodynamic conditions, the relative humidity, therefore the water vapour amount, becomes a key parameter in the thermodynamic conditions in the aerosolformation process, notably for hygroscopic aerosols. A yearlytrend can sometimes be observed for the different sites asillustrated in Fig. 13 where the monthly aerosol index andPWVC variation for selected AEROCAN sites are plotted.The co-variation of both parameters seems to be more markedfor summer months, which corresponds generally to anincrease in aerosol loading and water vapour in the atmos-phere. One can observe that the product α*AOD500 changesnotably from year to year. This parameter could be used as anindex of climate change on a long-term basis.
6. SummaryThe AEROCAN sunphotometry network has collected andcontinues to acquire the most comprehensive database ofaerosol optical properties and integrated PWVC acrossCanada. These data, derived from automatic sun/sky radiationmeasurements, do not show significant interannual variationfor those sites with relatively large data volumes. A summermaximum is systematic for α and in certain cases forAOD500 and PWVC. Continuous, long-term time series aredesirable in order to develop a significant Canadian clima-tology for the key derived parameters (AOD, α and PWVC).This was illustrated for the ten-year Sherbrooke archivewhere the influence of the Pinatubo event was clearly seen asan AOD departure from the mean AOD background level.There is also considerable interest in generating climatolo-
446 / A.I. Bokoye et al.
gies of derived inversion parameters such as the single scat-tering albedo, the refractive index and the effective radius inorder to understand spatial and temporal aerosol dynamicsbetter and to provide those parameters directly as input to cli-mate models or as a means of validating climate models. Theintercomparison of these parameters with those derived fromother techniques are encouraging and relevant to the long-term validation of the database. The size distribution com-parisons between the PCASP and the CIMEL™ retrievalsrepresent a first step in demonstrating the relevance of theAEROCAN data and understanding the effects of verticalaveraging.
The study of the correlations between the AOD500, α andPWVC parameters were relevant in achieving a better under-standing of this developing database. Collaborative associa-tions between the Canadian climatic research community andscientists associated with AEROCAN, will provide a dynam-ic feedback between measurements and models and, as a con-sequence, will also help achieve this goal.
Maintaining the measurement integrity of an automatic andlong-term network of surface sites requires a high level ofQA. Significant effort has been invested in order to guaranteedata QA through periodic calibrations, day-to-day operationsmonitoring and verification of the level of data familiaritythat can only result from in-depth and rigorous scientificinvestigations. The goal of the QA process is to minimize theimpact of errors resulting from such problems as cloud cont-amination, sunphotometer misalignment and drift or loss ofcalibration.
Future scientific initiatives will focus on the following issues:• Implementation of different levels of AOD products for
atmospheric corrections over land (Fedosejevs et al., 2000).• Validation of satellite AOD products from space sensors
like the Advanced Very High Resolution Radiometer(AVHRR), POLDER or MODIS.
• Development of long-term climatology of aerosols for par-ticular areas: rural, urban or arctic areas (Bokoye et al.,2001) or forest fire analysis (O’Neill et al., 2001).
Assessment from a Ground-Based Sunphotometer Network: AEROCAN / 447
Fig. 12 The product of instantaneous observations of aerosol optical depth at 500 nm (AOD500) and the Ångström coefficient (α) are plotted along with pre-cipitable water vapour content (PWVC) against day of year expressed using universal time coordinates (UTC) for selected AEROCAN sites during thesummer period.
• Large spatial and seasonal validation of aerosol outputs(AOD, size distribution, single scattering albedo, refrac-tive index) from regional climatological models such asthe Northern Regional Climatic Model (NARCM) usingAEROCAN data.
• Further investigation in order to pursue the AEROCANproduct validation process using active (lidar) remotesensing.
Finally, it is also expected that the network database will playan important role in the validation of GCM aerosol modelsand a key role in helping to predict global change effectswithin the Canadian context. The database should also helpCanadian policy makers in reaching sound decisions concern-ing the health and economic effects of current aerosol loadingpatterns as well as spatial and temporal aerosol trends derivedfrom the climatological data combined with models such asNARCM. The continuity of AEROCAN should contributesignificantly to increasing our knowledge of aerosol behav-iour and climate impact in Canada.
AcknowledgementsThe authors are very grateful for the logistical support of theAERONET group (NASA/GSFC), Environment Canada, andthe AEROCAN network site managers. We also thank theCanada Centre for Remote Sensing (CCRS), the CanadianInstitute for Climate Study (CICS), the Natural Sciences andEngineering Research Council of Canada (NSERC) and leFonds pour la Formation des Chercheurs et l’Aide à laRecherche (FCAR) of Quebec.
Appendix A Glossary of Termsα Ångström coefficientADAPS Advanced DCS Automatic Processing
SystemAEROCAN Aerosol CanadaAERONET Aerosol Robotic NetworkAOD Aerosol Optical DepthAOD500 Aerosol Optical Depth at the 500 nm
wavelength
448 / A.I. Bokoye et al.
Fig. 13 The geometric mean product of monthly mean values of aerosol optical depth at 500 nm (AOD500) and the Ångström coefficient (α) are plotted alongwith the monthly arithmetic mean of precipitable water vapour (PWVC) content against year for 4 selected AEROCAN sites.
a.m. Arithmetic meanAlt. Altitude of a given siteARM Atmospheric Radiation MeasurementAVHRR Advanced Very High Resolution
RadiometerBAPMON Baseline Air Pollution Monitoring NetworkBOREAS Boreal Ecosystem-Atmosphere StudyBSRN Baseline Surface Radiation NetworkCAM Canadian Aerosol ModelCARE Centre for Atmospheric Research
ExperimentsCCRS Canada Centre for Remote SensingCGCM Canadian General Circulation ModelCICS Canadian Institute for Climate StudyCIGSN Australia’s Continental Integrated Ground
Site NetworkCIMEL™ Type of sun/sky sunphotometer of CIMEL
Inc.CNSC Churchill Northern Studies CentreDCP Data Collection PlatformDCS Data Collection SystemdV(r)/dlog(r) Volume size distributionFCAR Fonds pour la Formation des chercheurs et
l’aide à la recherche du QuébecFOV Field of ViewGACP Global Aerosol Climatology ProjectGADS Global Aerosol Data SetGAW Global Atmosphere WatchGCM General Circulation ModelGEWEX Global Energy and Water Cycle Experimentg.m. Geometric meanGSFC Goddard Space Flight CenterIR InfraredMERIS Medium-resolution imaging spectrometerMFRSR Multi-Filter Rotating Shadow Band
RadiometerMODIS Moderate-resolution imaging
spectroradiometerMSC Meteorological Service of Canada
NARCM Northern Aerosol Regional Climatic ModelND Number of Days of observation for a given
siteNOBS Number of Observations for a given siteNSERC National Sciences and Engineering Research
Council of Canadaη Term equal to 10+σ, where σ is the standard
deviation of the log-normal vector of AOD500
PCASP Passive cavity aerosol scattering probePOLDER Polarization and directionality of Earth’s
reflectancePWVC Integrated Atmospheric Precipitable Water
Vapour Content r Aerosol particle radiusr2 Square of linear regression correlation
coefficientrms Root mean square errorSMAC Simplified method for atmospheric
correction of satellite measurements in the solar spectrum
SONOTEK™ Type of hand-held sunphotometer of SONOTEK Inc.
STD Standard DeviationQA Quality AssuranceUSDA United States Department of AgricultureUTC Universal time coordinatedUVB Ultraviolet BV0(λ) Sunphotometer calibration constant for a
given wavelengthVITEL™ Type of data transmission system via
environmental satellite of VITEL Inc.WMO World Meteorological Organization
Assessment from a Ground-Based Sunphotometer Network: AEROCAN / 449
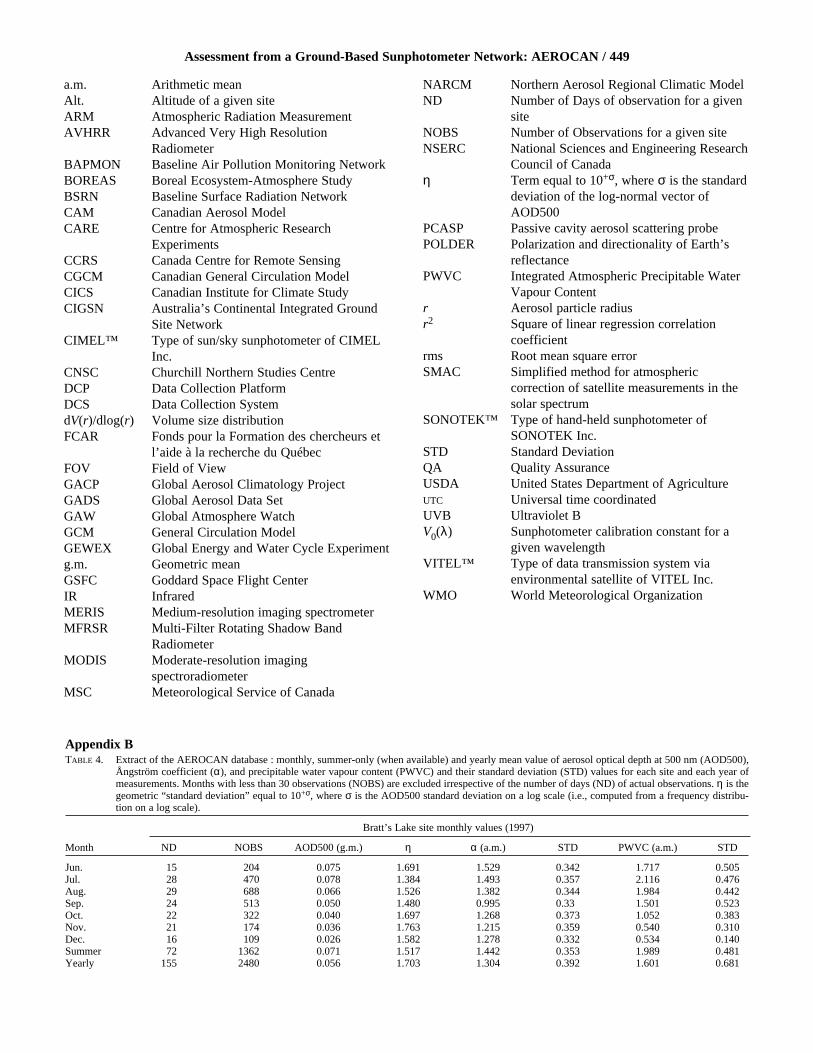
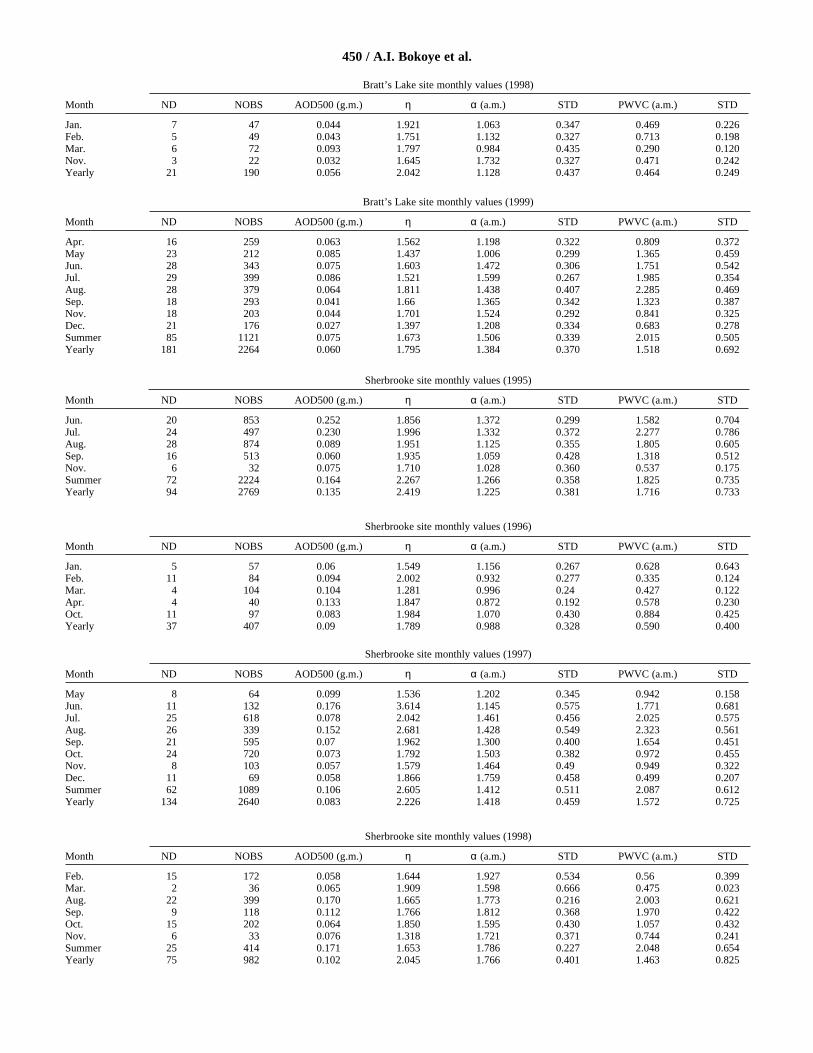
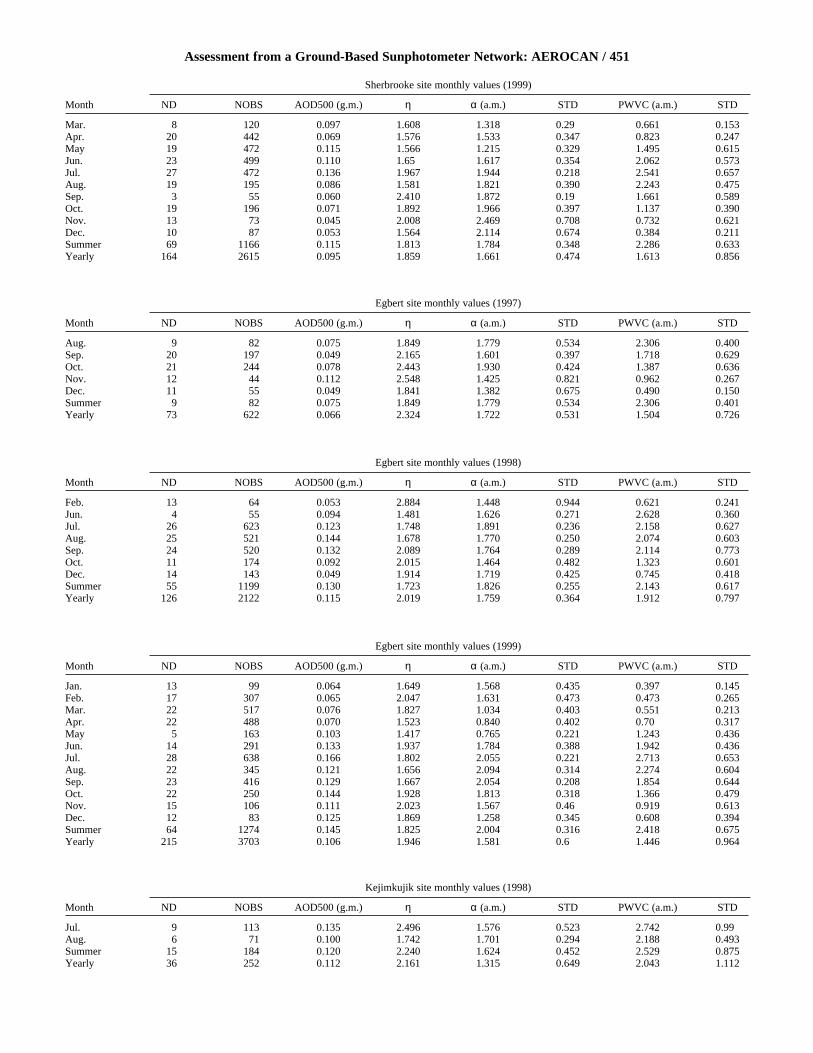
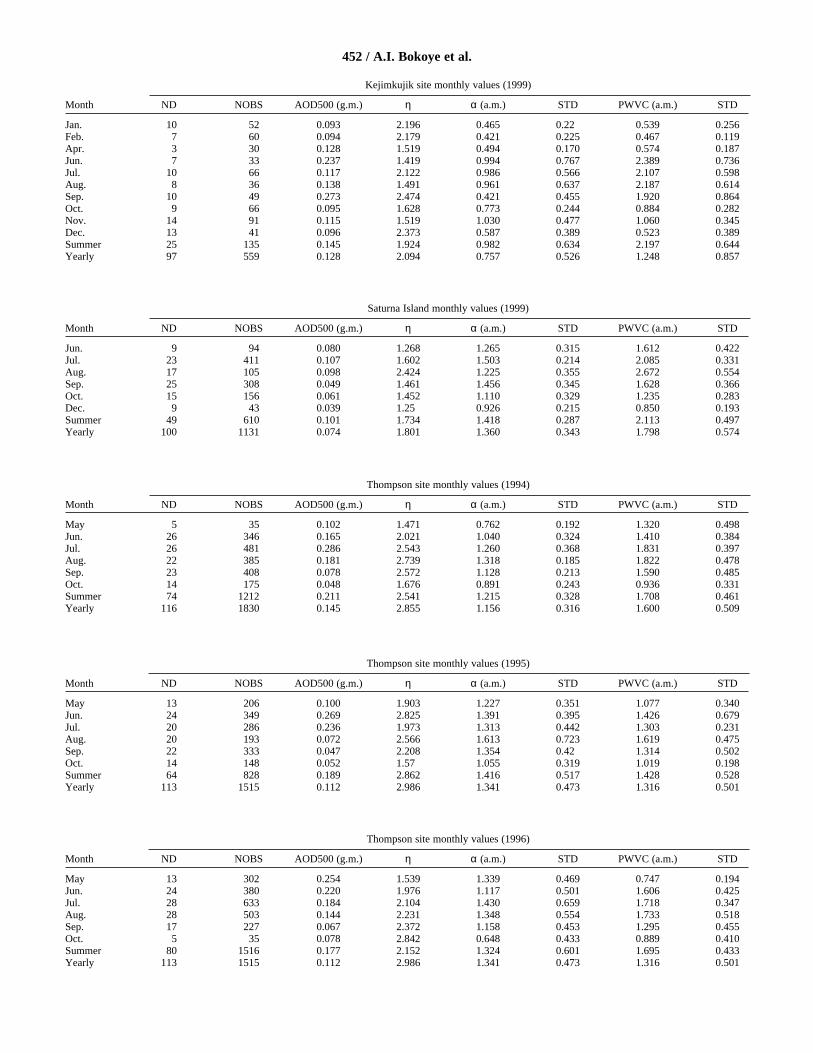
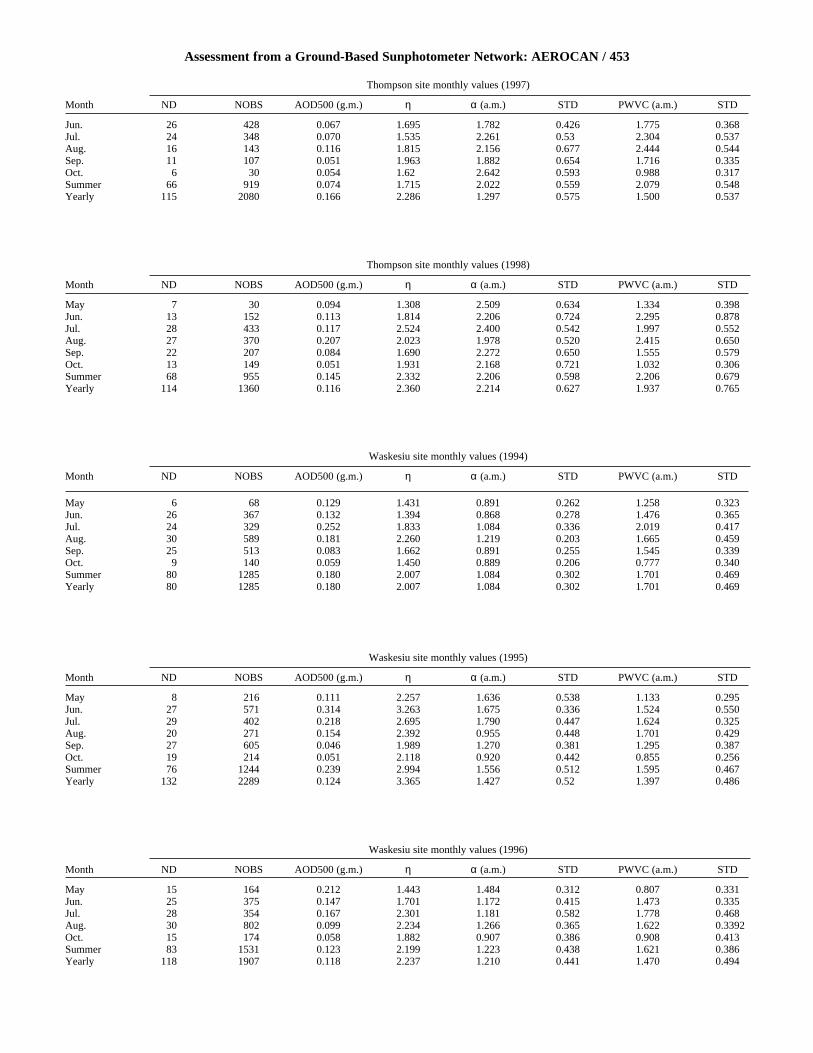
Appendix BTABLE 4. Extract of the AEROCAN database : monthly, summer-only (when available) and yearly mean value of aerosol optical depth at 500 nm (AOD500),
Ångström coefficient (α), and precipitable water vapour content (PWVC) and their standard deviation (STD) values for each site and each year ofmeasurements. Months with less than 30 observations (NOBS) are excluded irrespective of the number of days (ND) of actual observations. η is thegeometric “standard deviation” equal to 10+σ, where σ is the AOD500 standard deviation on a log scale (i.e., computed from a frequency distribu-tion on a log scale).
Bratt’s Lake site monthly values (1997)
Month ND NOBS AOD500 (g.m.) η α (a.m.) STD PWVC (a.m.) STD
Jun. 15 204 0.075 1.691 1.529 0.342 1.717 0.505Jul. 28 470 0.078 1.384 1.493 0.357 2.116 0.476Aug. 29 688 0.066 1.526 1.382 0.344 1.984 0.442Sep. 24 513 0.050 1.480 0.995 0.33 1.501 0.523Oct. 22 322 0.040 1.697 1.268 0.373 1.052 0.383Nov. 21 174 0.036 1.763 1.215 0.359 0.540 0.310Dec. 16 109 0.026 1.582 1.278 0.332 0.534 0.140Summer 72 1362 0.071 1.517 1.442 0.353 1.989 0.481Yearly 155 2480 0.056 1.703 1.304 0.392 1.601 0.681
450 / A.I. Bokoye et al.
Sherbrooke site monthly values (1998)
Month ND NOBS AOD500 (g.m.) η α (a.m.) STD PWVC (a.m.) STD
Feb. 15 172 0.058 1.644 1.927 0.534 0.56 0.399Mar. 2 36 0.065 1.909 1.598 0.666 0.475 0.023Aug. 22 399 0.170 1.665 1.773 0.216 2.003 0.621Sep. 9 118 0.112 1.766 1.812 0.368 1.970 0.422Oct. 15 202 0.064 1.850 1.595 0.430 1.057 0.432Nov. 6 33 0.076 1.318 1.721 0.371 0.744 0.241Summer 25 414 0.171 1.653 1.786 0.227 2.048 0.654Yearly 75 982 0.102 2.045 1.766 0.401 1.463 0.825
Sherbrooke site monthly values (1997)
Month ND NOBS AOD500 (g.m.) η α (a.m.) STD PWVC (a.m.) STD
May 8 64 0.099 1.536 1.202 0.345 0.942 0.158Jun. 11 132 0.176 3.614 1.145 0.575 1.771 0.681Jul. 25 618 0.078 2.042 1.461 0.456 2.025 0.575Aug. 26 339 0.152 2.681 1.428 0.549 2.323 0.561Sep. 21 595 0.07 1.962 1.300 0.400 1.654 0.451Oct. 24 720 0.073 1.792 1.503 0.382 0.972 0.455Nov. 8 103 0.057 1.579 1.464 0.49 0.949 0.322Dec. 11 69 0.058 1.866 1.759 0.458 0.499 0.207Summer 62 1089 0.106 2.605 1.412 0.511 2.087 0.612Yearly 134 2640 0.083 2.226 1.418 0.459 1.572 0.725
Bratt’s Lake site monthly values (1998)
Month ND NOBS AOD500 (g.m.) η α (a.m.) STD PWVC (a.m.) STD
Jan. 7 47 0.044 1.921 1.063 0.347 0.469 0.226Feb. 5 49 0.043 1.751 1.132 0.327 0.713 0.198Mar. 6 72 0.093 1.797 0.984 0.435 0.290 0.120Nov. 3 22 0.032 1.645 1.732 0.327 0.471 0.242Yearly 21 190 0.056 2.042 1.128 0.437 0.464 0.249
Bratt’s Lake site monthly values (1999)
Month ND NOBS AOD500 (g.m.) η α (a.m.) STD PWVC (a.m.) STD
Apr. 16 259 0.063 1.562 1.198 0.322 0.809 0.372May 23 212 0.085 1.437 1.006 0.299 1.365 0.459Jun. 28 343 0.075 1.603 1.472 0.306 1.751 0.542Jul. 29 399 0.086 1.521 1.599 0.267 1.985 0.354Aug. 28 379 0.064 1.811 1.438 0.407 2.285 0.469Sep. 18 293 0.041 1.66 1.365 0.342 1.323 0.387Nov. 18 203 0.044 1.701 1.524 0.292 0.841 0.325Dec. 21 176 0.027 1.397 1.208 0.334 0.683 0.278Summer 85 1121 0.075 1.673 1.506 0.339 2.015 0.505Yearly 181 2264 0.060 1.795 1.384 0.370 1.518 0.692
Sherbrooke site monthly values (1995)
Month ND NOBS AOD500 (g.m.) η α (a.m.) STD PWVC (a.m.) STD
Jun. 20 853 0.252 1.856 1.372 0.299 1.582 0.704Jul. 24 497 0.230 1.996 1.332 0.372 2.277 0.786Aug. 28 874 0.089 1.951 1.125 0.355 1.805 0.605Sep. 16 513 0.060 1.935 1.059 0.428 1.318 0.512Nov. 6 32 0.075 1.710 1.028 0.360 0.537 0.175Summer 72 2224 0.164 2.267 1.266 0.358 1.825 0.735Yearly 94 2769 0.135 2.419 1.225 0.381 1.716 0.733
Sherbrooke site monthly values (1996)
Month ND NOBS AOD500 (g.m.) η α (a.m.) STD PWVC (a.m.) STD
Jan. 5 57 0.06 1.549 1.156 0.267 0.628 0.643Feb. 11 84 0.094 2.002 0.932 0.277 0.335 0.124Mar. 4 104 0.104 1.281 0.996 0.24 0.427 0.122Apr. 4 40 0.133 1.847 0.872 0.192 0.578 0.230Oct. 11 97 0.083 1.984 1.070 0.430 0.884 0.425Yearly 37 407 0.09 1.789 0.988 0.328 0.590 0.400
Assessment from a Ground-Based Sunphotometer Network: AEROCAN / 451
Sherbrooke site monthly values (1999)
Month ND NOBS AOD500 (g.m.) η α (a.m.) STD PWVC (a.m.) STD
Mar. 8 120 0.097 1.608 1.318 0.29 0.661 0.153Apr. 20 442 0.069 1.576 1.533 0.347 0.823 0.247May 19 472 0.115 1.566 1.215 0.329 1.495 0.615Jun. 23 499 0.110 1.65 1.617 0.354 2.062 0.573Jul. 27 472 0.136 1.967 1.944 0.218 2.541 0.657Aug. 19 195 0.086 1.581 1.821 0.390 2.243 0.475Sep. 3 55 0.060 2.410 1.872 0.19 1.661 0.589Oct. 19 196 0.071 1.892 1.966 0.397 1.137 0.390Nov. 13 73 0.045 2.008 2.469 0.708 0.732 0.621Dec. 10 87 0.053 1.564 2.114 0.674 0.384 0.211Summer 69 1166 0.115 1.813 1.784 0.348 2.286 0.633Yearly 164 2615 0.095 1.859 1.661 0.474 1.613 0.856
Egbert site monthly values (1997)
Month ND NOBS AOD500 (g.m.) η α (a.m.) STD PWVC (a.m.) STD
Aug. 9 82 0.075 1.849 1.779 0.534 2.306 0.400Sep. 20 197 0.049 2.165 1.601 0.397 1.718 0.629Oct. 21 244 0.078 2.443 1.930 0.424 1.387 0.636Nov. 12 44 0.112 2.548 1.425 0.821 0.962 0.267Dec. 11 55 0.049 1.841 1.382 0.675 0.490 0.150Summer 9 82 0.075 1.849 1.779 0.534 2.306 0.401Yearly 73 622 0.066 2.324 1.722 0.531 1.504 0.726
Egbert site monthly values (1998)
Month ND NOBS AOD500 (g.m.) η α (a.m.) STD PWVC (a.m.) STD
Feb. 13 64 0.053 2.884 1.448 0.944 0.621 0.241Jun. 4 55 0.094 1.481 1.626 0.271 2.628 0.360Jul. 26 623 0.123 1.748 1.891 0.236 2.158 0.627Aug. 25 521 0.144 1.678 1.770 0.250 2.074 0.603Sep. 24 520 0.132 2.089 1.764 0.289 2.114 0.773Oct. 11 174 0.092 2.015 1.464 0.482 1.323 0.601Dec. 14 143 0.049 1.914 1.719 0.425 0.745 0.418Summer 55 1199 0.130 1.723 1.826 0.255 2.143 0.617Yearly 126 2122 0.115 2.019 1.759 0.364 1.912 0.797
Egbert site monthly values (1999)
Month ND NOBS AOD500 (g.m.) η α (a.m.) STD PWVC (a.m.) STD
Jan. 13 99 0.064 1.649 1.568 0.435 0.397 0.145Feb. 17 307 0.065 2.047 1.631 0.473 0.473 0.265Mar. 22 517 0.076 1.827 1.034 0.403 0.551 0.213Apr. 22 488 0.070 1.523 0.840 0.402 0.70 0.317May 5 163 0.103 1.417 0.765 0.221 1.243 0.436Jun. 14 291 0.133 1.937 1.784 0.388 1.942 0.436Jul. 28 638 0.166 1.802 2.055 0.221 2.713 0.653Aug. 22 345 0.121 1.656 2.094 0.314 2.274 0.604Sep. 23 416 0.129 1.667 2.054 0.208 1.854 0.644Oct. 22 250 0.144 1.928 1.813 0.318 1.366 0.479Nov. 15 106 0.111 2.023 1.567 0.46 0.919 0.613Dec. 12 83 0.125 1.869 1.258 0.345 0.608 0.394Summer 64 1274 0.145 1.825 2.004 0.316 2.418 0.675Yearly 215 3703 0.106 1.946 1.581 0.6 1.446 0.964
Kejimkujik site monthly values (1998)
Month ND NOBS AOD500 (g.m.) η α (a.m.) STD PWVC (a.m.) STD
Jul. 9 113 0.135 2.496 1.576 0.523 2.742 0.99Aug. 6 71 0.100 1.742 1.701 0.294 2.188 0.493Summer 15 184 0.120 2.240 1.624 0.452 2.529 0.875Yearly 36 252 0.112 2.161 1.315 0.649 2.043 1.112
452 / A.I. Bokoye et al.
Thompson site monthly values (1995)
Month ND NOBS AOD500 (g.m.) η α (a.m.) STD PWVC (a.m.) STD
May 13 206 0.100 1.903 1.227 0.351 1.077 0.340Jun. 24 349 0.269 2.825 1.391 0.395 1.426 0.679Jul. 20 286 0.236 1.973 1.313 0.442 1.303 0.231Aug. 20 193 0.072 2.566 1.613 0.723 1.619 0.475Sep. 22 333 0.047 2.208 1.354 0.42 1.314 0.502Oct. 14 148 0.052 1.57 1.055 0.319 1.019 0.198Summer 64 828 0.189 2.862 1.416 0.517 1.428 0.528Yearly 113 1515 0.112 2.986 1.341 0.473 1.316 0.501
Thompson site monthly values (1996)
Month ND NOBS AOD500 (g.m.) η α (a.m.) STD PWVC (a.m.) STD
May 13 302 0.254 1.539 1.339 0.469 0.747 0.194Jun. 24 380 0.220 1.976 1.117 0.501 1.606 0.425Jul. 28 633 0.184 2.104 1.430 0.659 1.718 0.347Aug. 28 503 0.144 2.231 1.348 0.554 1.733 0.518Sep. 17 227 0.067 2.372 1.158 0.453 1.295 0.455Oct. 5 35 0.078 2.842 0.648 0.433 0.889 0.410Summer 80 1516 0.177 2.152 1.324 0.601 1.695 0.433Yearly 113 1515 0.112 2.986 1.341 0.473 1.316 0.501
Kejimkujik site monthly values (1999)
Month ND NOBS AOD500 (g.m.) η α (a.m.) STD PWVC (a.m.) STD
Jan. 10 52 0.093 2.196 0.465 0.22 0.539 0.256Feb. 7 60 0.094 2.179 0.421 0.225 0.467 0.119Apr. 3 30 0.128 1.519 0.494 0.170 0.574 0.187Jun. 7 33 0.237 1.419 0.994 0.767 2.389 0.736Jul. 10 66 0.117 2.122 0.986 0.566 2.107 0.598Aug. 8 36 0.138 1.491 0.961 0.637 2.187 0.614Sep. 10 49 0.273 2.474 0.421 0.455 1.920 0.864Oct. 9 66 0.095 1.628 0.773 0.244 0.884 0.282Nov. 14 91 0.115 1.519 1.030 0.477 1.060 0.345Dec. 13 41 0.096 2.373 0.587 0.389 0.523 0.389Summer 25 135 0.145 1.924 0.982 0.634 2.197 0.644Yearly 97 559 0.128 2.094 0.757 0.526 1.248 0.857
Saturna Island monthly values (1999)
Month ND NOBS AOD500 (g.m.) η α (a.m.) STD PWVC (a.m.) STD
Jun. 9 94 0.080 1.268 1.265 0.315 1.612 0.422Jul. 23 411 0.107 1.602 1.503 0.214 2.085 0.331Aug. 17 105 0.098 2.424 1.225 0.355 2.672 0.554Sep. 25 308 0.049 1.461 1.456 0.345 1.628 0.366Oct. 15 156 0.061 1.452 1.110 0.329 1.235 0.283Dec. 9 43 0.039 1.25 0.926 0.215 0.850 0.193Summer 49 610 0.101 1.734 1.418 0.287 2.113 0.497Yearly 100 1131 0.074 1.801 1.360 0.343 1.798 0.574
Thompson site monthly values (1994)
Month ND NOBS AOD500 (g.m.) η α (a.m.) STD PWVC (a.m.) STD
May 5 35 0.102 1.471 0.762 0.192 1.320 0.498Jun. 26 346 0.165 2.021 1.040 0.324 1.410 0.384Jul. 26 481 0.286 2.543 1.260 0.368 1.831 0.397Aug. 22 385 0.181 2.739 1.318 0.185 1.822 0.478Sep. 23 408 0.078 2.572 1.128 0.213 1.590 0.485Oct. 14 175 0.048 1.676 0.891 0.243 0.936 0.331Summer 74 1212 0.211 2.541 1.215 0.328 1.708 0.461Yearly 116 1830 0.145 2.855 1.156 0.316 1.600 0.509
Assessment from a Ground-Based Sunphotometer Network: AEROCAN / 453
Thompson site monthly values (1998)
Month ND NOBS AOD500 (g.m.) η α (a.m.) STD PWVC (a.m.) STD
May 7 30 0.094 1.308 2.509 0.634 1.334 0.398Jun. 13 152 0.113 1.814 2.206 0.724 2.295 0.878Jul. 28 433 0.117 2.524 2.400 0.542 1.997 0.552Aug. 27 370 0.207 2.023 1.978 0.520 2.415 0.650Sep. 22 207 0.084 1.690 2.272 0.650 1.555 0.579Oct. 13 149 0.051 1.931 2.168 0.721 1.032 0.306Summer 68 955 0.145 2.332 2.206 0.598 2.206 0.679Yearly 114 1360 0.116 2.360 2.214 0.627 1.937 0.765
Waskesiu site monthly values (1994)
Month ND NOBS AOD500 (g.m.) η α (a.m.) STD PWVC (a.m.) STD
May 6 68 0.129 1.431 0.891 0.262 1.258 0.323Jun. 26 367 0.132 1.394 0.868 0.278 1.476 0.365Jul. 24 329 0.252 1.833 1.084 0.336 2.019 0.417Aug. 30 589 0.181 2.260 1.219 0.203 1.665 0.459Sep. 25 513 0.083 1.662 0.891 0.255 1.545 0.339Oct. 9 140 0.059 1.450 0.889 0.206 0.777 0.340Summer 80 1285 0.180 2.007 1.084 0.302 1.701 0.469Yearly 80 1285 0.180 2.007 1.084 0.302 1.701 0.469
Waskesiu site monthly values (1995)
Month ND NOBS AOD500 (g.m.) η α (a.m.) STD PWVC (a.m.) STD
May 8 216 0.111 2.257 1.636 0.538 1.133 0.295Jun. 27 571 0.314 3.263 1.675 0.336 1.524 0.550Jul. 29 402 0.218 2.695 1.790 0.447 1.624 0.325Aug. 20 271 0.154 2.392 0.955 0.448 1.701 0.429Sep. 27 605 0.046 1.989 1.270 0.381 1.295 0.387Oct. 19 214 0.051 2.118 0.920 0.442 0.855 0.256Summer 76 1244 0.239 2.994 1.556 0.512 1.595 0.467Yearly 132 2289 0.124 3.365 1.427 0.52 1.397 0.486
Waskesiu site monthly values (1996)
Month ND NOBS AOD500 (g.m.) η α (a.m.) STD PWVC (a.m.) STD
May 15 164 0.212 1.443 1.484 0.312 0.807 0.331Jun. 25 375 0.147 1.701 1.172 0.415 1.473 0.335Jul. 28 354 0.167 2.301 1.181 0.582 1.778 0.468Aug. 30 802 0.099 2.234 1.266 0.365 1.622 0.3392Oct. 15 174 0.058 1.882 0.907 0.386 0.908 0.413Summer 83 1531 0.123 2.199 1.223 0.438 1.621 0.386Yearly 118 1907 0.118 2.237 1.210 0.441 1.470 0.494
Thompson site monthly values (1997)
Month ND NOBS AOD500 (g.m.) η α (a.m.) STD PWVC (a.m.) STD
Jun. 26 428 0.067 1.695 1.782 0.426 1.775 0.368Jul. 24 348 0.070 1.535 2.261 0.53 2.304 0.537Aug. 16 143 0.116 1.815 2.156 0.677 2.444 0.544Sep. 11 107 0.051 1.963 1.882 0.654 1.716 0.335Oct. 6 30 0.054 1.62 2.642 0.593 0.988 0.317Summer 66 919 0.074 1.715 2.022 0.559 2.079 0.548Yearly 115 2080 0.166 2.286 1.297 0.575 1.500 0.537
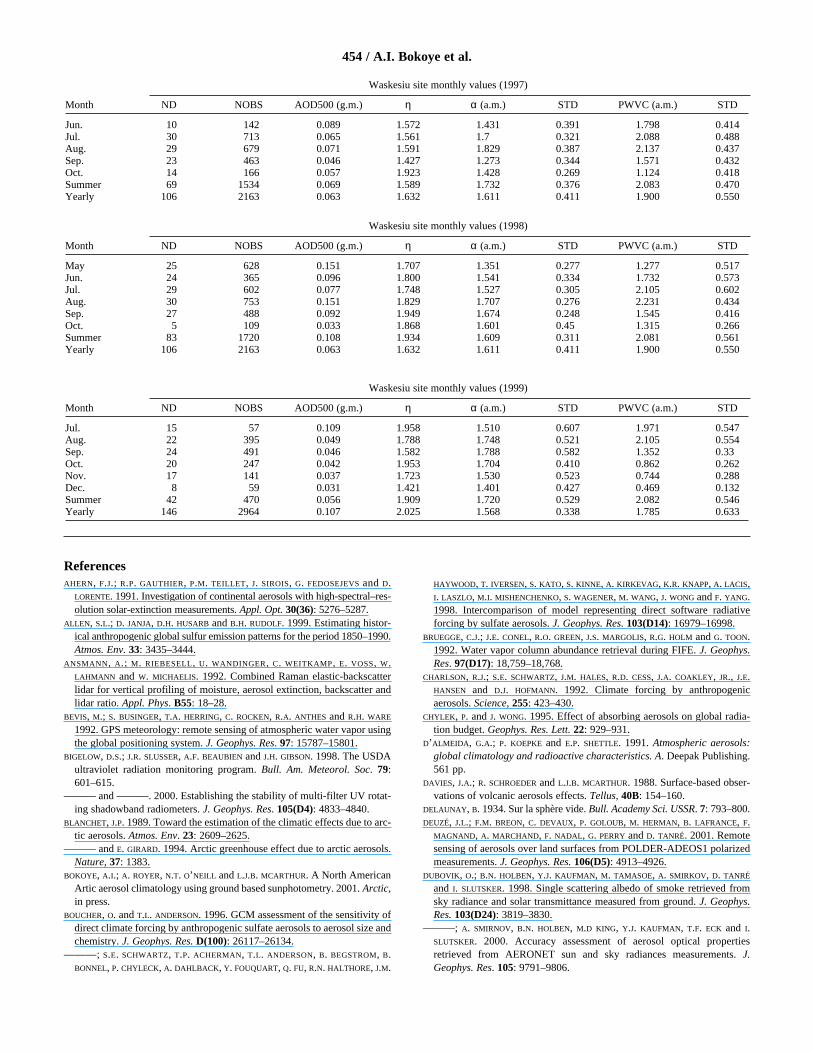
454 / A.I. Bokoye et al.
ReferencesAHERN, F.J.; R.P. GAUTHIER, P.M. TEILLET, J. SIROIS, G. FEDOSEJEVS and D.
LORENTE. 1991. Investigation of continental aerosols with high-spectral–res-olution solar-extinction measurements. Appl. Opt. 30(36): 5276–5287.
ALLEN, S.L.; D. JANJA, D.H. HUSARB and B.H. RUDOLF. 1999. Estimating histor-ical anthropogenic global sulfur emission patterns for the period 1850–1990.Atmos. Env. 33: 3435–3444.
ANSMANN, A.; M. RIEBESELL, U. WANDINGER, C. WEITKAMP, E. VOSS, W.LAHMANN and W. MICHAELIS. 1992. Combined Raman elastic-backscatterlidar for vertical profiling of moisture, aerosol extinction, backscatter andlidar ratio. Appl. Phys. B55: 18–28.
BEVIS, M.; S. BUSINGER, T.A. HERRING, C. ROCKEN, R.A. ANTHES and R.H. WARE
1992. GPS meteorology: remote sensing of atmospheric water vapor usingthe global positioning system. J. Geophys. Res. 97: 15787–15801.
BIGELOW, D.S.; J.R. SLUSSER, A.F. BEAUBIEN and J.H. GIBSON. 1998. The USDAultraviolet radiation monitoring program. Bull. Am. Meteorol. Soc. 79:601–615.
——— and ———. 2000. Establishing the stability of multi-filter UV rotat-ing shadowband radiometers. J. Geophys. Res. 105(D4): 4833–4840.
BLANCHET, J.P. 1989. Toward the estimation of the climatic effects due to arc-tic aerosols. Atmos. Env. 23: 2609–2625.
——— and E. GIRARD. 1994. Arctic greenhouse effect due to arctic aerosols.Nature, 37: 1383.
BOKOYE, A.I.; A. ROYER, N.T. O’NEILL and L.J.B. MCARTHUR. A North AmericanArtic aerosol climatology using ground based sunphotometry. 2001. Arctic,in press.
BOUCHER, O. and T.L. ANDERSON. 1996. GCM assessment of the sensitivity ofdirect climate forcing by anthropogenic sulfate aerosols to aerosol size andchemistry. J. Geophys. Res. D(100): 26117–26134.
———; S.E. SCHWARTZ, T.P. ACHERMAN, T.L. ANDERSON, B. BEGSTROM, B.BONNEL, P. CHYLECK, A. DAHLBACK, Y. FOUQUART, Q. FU, R.N. HALTHORE, J.M.
HAYWOOD, T. IVERSEN, S. KATO, S. KINNE, A. KIRKEVAG, K.R. KNAPP, A. LACIS,I. LASZLO, M.I. MISHENCHENKO, S. WAGENER, M. WANG, J. WONG and F. YANG.1998. Intercomparison of model representing direct software radiativeforcing by sulfate aerosols. J. Geophys. Res. 103(D14): 16979–16998.
BRUEGGE, C.J.; J.E. CONEL, R.O. GREEN, J.S. MARGOLIS, R.G. HOLM and G. TOON.1992. Water vapor column abundance retrieval during FIFE. J. Geophys.Res. 97(D17): 18,759–18,768.
CHARLSON, R.J.; S.E. SCHWARTZ, J.M. HALES, R.D. CESS, J.A. COAKLEY, JR., J.E.HANSEN and D.J. HOFMANN. 1992. Climate forcing by anthropogenicaerosols. Science, 255: 423–430.
CHYLEK, P. and J. WONG. 1995. Effect of absorbing aerosols on global radia-tion budget. Geophys. Res. Lett. 22: 929–931.
D’ALMEIDA, G.A.; P. KOEPKE and E.P. SHETTLE. 1991. Atmospheric aerosols:global climatology and radioactive characteristics. A. Deepak Publishing.561 pp.
DAVIES, J.A.; R. SCHROEDER and L.J.B. MCARTHUR. 1988. Surface-based obser-vations of volcanic aerosols effects. Tellus, 40B: 154–160.
DELAUNAY, B. 1934. Sur la sphère vide. Bull. Academy Sci. USSR. 7: 793–800.DEUZÉ, J.L.; F.M. BREON, C. DEVAUX, P. GOLOUB, M. HERMAN, B. LAFRANCE, F.
MAGNAND, A. MARCHAND, F. NADAL, G. PERRY and D. TANRÉ. 2001. Remotesensing of aerosols over land surfaces from POLDER-ADEOS1 polarizedmeasurements. J. Geophys. Res. 106(D5): 4913–4926.
DUBOVIK, O.; B.N. HOLBEN, Y.J. KAUFMAN, M. TAMASOE, A. SMIRKOV, D. TANRÉ
and I. SLUTSKER. 1998. Single scattering albedo of smoke retrieved fromsky radiance and solar transmittance measured from ground. J. Geophys.Res. 103(D24): 3819–3830.
———; A. SMIRNOV, B.N. HOLBEN, M.D KING, Y.J. KAUFMAN, T.F. ECK and I.SLUTSKER. 2000. Accuracy assessment of aerosol optical propertiesretrieved from AERONET sun and sky radiances measurements. J.Geophys. Res. 105: 9791–9806.
Waskesiu site monthly values (1998)
Month ND NOBS AOD500 (g.m.) η α (a.m.) STD PWVC (a.m.) STD
May 25 628 0.151 1.707 1.351 0.277 1.277 0.517Jun. 24 365 0.096 1.800 1.541 0.334 1.732 0.573Jul. 29 602 0.077 1.748 1.527 0.305 2.105 0.602Aug. 30 753 0.151 1.829 1.707 0.276 2.231 0.434Sep. 27 488 0.092 1.949 1.674 0.248 1.545 0.416Oct. 5 109 0.033 1.868 1.601 0.45 1.315 0.266Summer 83 1720 0.108 1.934 1.609 0.311 2.081 0.561Yearly 106 2163 0.063 1.632 1.611 0.411 1.900 0.550
Waskesiu site monthly values (1999)
Month ND NOBS AOD500 (g.m.) η α (a.m.) STD PWVC (a.m.) STD
Jul. 15 57 0.109 1.958 1.510 0.607 1.971 0.547Aug. 22 395 0.049 1.788 1.748 0.521 2.105 0.554Sep. 24 491 0.046 1.582 1.788 0.582 1.352 0.33Oct. 20 247 0.042 1.953 1.704 0.410 0.862 0.262Nov. 17 141 0.037 1.723 1.530 0.523 0.744 0.288Dec. 8 59 0.031 1.421 1.401 0.427 0.469 0.132Summer 42 470 0.056 1.909 1.720 0.529 2.082 0.546Yearly 146 2964 0.107 2.025 1.568 0.338 1.785 0.633
Waskesiu site monthly values (1997)
Month ND NOBS AOD500 (g.m.) η α (a.m.) STD PWVC (a.m.) STD
Jun. 10 142 0.089 1.572 1.431 0.391 1.798 0.414Jul. 30 713 0.065 1.561 1.7 0.321 2.088 0.488Aug. 29 679 0.071 1.591 1.829 0.387 2.137 0.437Sep. 23 463 0.046 1.427 1.273 0.344 1.571 0.432Oct. 14 166 0.057 1.923 1.428 0.269 1.124 0.418Summer 69 1534 0.069 1.589 1.732 0.376 2.083 0.470Yearly 106 2163 0.063 1.632 1.611 0.411 1.900 0.550
——— and M. KING. 2000. A flexible inversion algorithm for retrieval ofaerosol optical properties from sun and sky measurements. J. Geophys.Res. 105(20): 20673–20696.
ECK, T.F.; B.N. HOLBEN, D.E. WARD, O. DUBOVIK, J.S. REID, A. SMIRNOV, M.M.MUKALABAI, N.C. HSU, N.T. O’NEILL and I. SLUTSKER. 1999. Characterizationof the optical properties of biomass burning aerosols in Zambia during1997 ZIBBEE experiment. J. Geophys. Res. 104(31): 31333–31350.
EVANS, B.T.N. 1988. Sensitivity of the backscatter / extinction ratio to changesin aerosol properties: implication for lidar. Appl. Opt. 27: 3299–3305.
FEDOSEJEVS, G.; A. ROYER, N.T. O’NEILL, P.M. TEILLET and A.I. BOKOYE. 2000.Aerosol optical depth at 500 nm for atmospheric correction of AVHRRcomposite data. Res. note. Can. J. Rem. Sens. 26(4): 273–284.
FORGAN, B. 1994. General method for calibrating sunphotometers. Appl. Opt.33(21): 4841–4850.
FREUND, J. 1983. Aerosol optical depth in the Canadian Arctic. ATMOSPHERE-OCEAN, 21(2): 158–167.
GAW GUIDE. 1993. Global atmospheric background monitoring for selectedenvironmental parameters WMO/GAW data for 1993. Volume I.Atmospheric aerosol optical depth. GAW – Report No. 86, WMO/TD-No.553, World Meteorological Organization, Geneva.
GONG, S.L.; L.A. BARRIE and J-P. BLANCHET. 1997a. Modeling sea salt aerosolsin the atmosphere - I, model development. J. Geophys. Res. 1024D(3):3805–3818.
———; ———, J. PROSPERO and D. SAVOIE. 1997b. Modeling sea-saltaerosols in the atmosphere - II, Atmospheric concentration and fluxes. J.Geophys. Res. 102(D3): 3819–3830.
GUEYMARD, C. 1994. Analysis of monthly average atmospheric precipitablewater and turbidity in Canada and Northern United States. Solar Energy,53(1): 57–71.
GUZZI, R.; E. CATTANI, M. CERVINO, C. LEVONI and F. TORRICELLA. 1997.Aerosol optical depth from GOME data. Meteorological approach and preliminary results. In: Proc. 3rd ERS Symposium, Space at the service of our environment. T.-D. Guyenne and D. Danesy (Eds). Florence,Italy, 17–21 March 1997. ESTEC Noordwijk. The Netherlands. European Space Agency, ESA publications division, ESA-SP 414(2), pp687–694.
HALTHORE, R.N.; T.F. ECK, B.N. HOLBEN and B. MARKHAM. 1997. Sunphoto-metric measurement of atmospheric water vapor column abundance in the940-nm band. J. Geophys. Res. 102(D2): 4343–4352.
HANEL, G. 1976. The properties of atmospheric aerosol particles as functionsof the relative humidity at thermodynamic equilibrium with the surround-ing most air. Adv. Geophys. 19: 73–188.
HARRISON, L. and J. MICHALSKY. 1994. Automated multifilter rotating shadow-band radiometer: an instrument for optical depth and radiation measure-ments. Appl. Opt. 33(22): 5118–5125.
HAY, J.E. and R. DARBY. 1984. El Chichon-influence of aerosol optical depthand direct, diffuse and total solar irradiances at Vancouver, B.C. ATMOS-PHERE-OCEAN, 22: 354–368.
HAYWOOD, J.M. and K.P. SHINE. 1995. The effect of anthropogenic sulfate andsoot aerosols on the clear sky planetary budget. Geophys. Res. Lett. 22:603–606.
HESS, M.; P. KOEPKE and I. SCHULT. 1998. Optical properties of aerosols andclouds: The software package OPAC. Bull. Am. Meteorol. Soc. 79: 831–844.
HOFF, R.M. and L. GUISE-BAGLEY. 1996. Lidar, nephelometer, and in situaerosol experiments in southern Ontario. J. Geophys. Res. 101(D14):19199–19209.
HOLBEN, B.N.; T.F. ECK, I. SLUTSKER, D. TANRÉ, J.P. BUIS, A. SETZER, E. VERMOTE,J.A. REAGAN, Y.J. KAUFMAN, T. NAKAJIMA, F. LAVENU, I. JANKOWIAK and A.SMIRNOV. 1998. AERONET- A federated instrument network and dataarchive for aerosol characterization. Remote Sens. Env. 66: 1–16.
———; D. TANRÉ, A. SMIRNOV, T.F. ECK, I. SLUTSKER, N. ABUHASSAN, W.W. NEWCOMB, J. SCHAFER, B. CHATENET, F. LAVENUE, Y.J. KAUFMAN, J.VANDE CASTLE, A. SETZER, B. MARKHAM, D. CLARK, R. FROUIN, R. HALTHORE,A. KARNIELI, N.T. O’NEILL, C. PIETRAS, R.T. PINKER, K. VOSS and G. ZIBORDI.2001. An emerging ground-based aerosol climatology: Aerosol opticaldepth from AERONET. J. Geophys. Res. 100(D12): 12067–12097.
HUEBERT, B.J.; G. LEE and W.L. WARREN. 1990. Airborne aerosol inlet passingefficiency measurement. J. Geophys. Res. 95: 16369–16381.
IPCC. 1995. Climate change 1996: radiative forcing of climate change and an evaluation of the IPCC IS92 emission scenarios. In: Climate Change1994. J.T.T. Houghton; L.G. Meira Filho, J. Bruce, H. Lee, B.A.Callander, E. Haites, N. Harris and K. Maskell (Eds). Cambridge Univ.Press. 339 pp.
———. 1996. The Science of Climate Change Contribution of WorkingGroup I to the 2nd Assessment of the Intergovernmental Panel on ClimateChange. J.T. Houghton, L.G. Meira Filho, B.A. Callander, N. Harris, A.Kattenberg and K. Maskell (Eds). Cambridge Univ. Press. U.K. 572 pp.
KASTEN, F. and A.T. YOUNG. 1989. Revised optical air mass tables. Appl. Opt.28(22): 4735–4738.
KAUFMAN, Y.J.; D. TANRÉ, H.R. GORDON, T. NAKAJIMA, J. LENOBLE, R. FROIN, H.GRASSL, B.M. HERMAN, M.D. KING and P.M. TEILLET. 1997. Passive remotesensing of tropospheric aerosol and atmospheric correction for the aerosoleffect. J. Geophys. Res. 102(D14): 16,815–16,830.
KAY, M.J. AND M. BOX. 2000. Aerosols and clouds - radiative effects of absorb-ing aerosols and the impact of water vapor. J. Geophys. Res. 105(D10):12221–12235.
KOEPKE, P.; M. HESS, I. SCHULT and E.P. SHETTLE. 1997. Global aerosol data set.Report No. 243, Max-Planck-Institut für Meteorologie, Hamburg,Germany. 44 pp.
LANGER, J. and H. RODHE. 1991. A global three–dimensional model of the tro-pospheric sulfate cycle. J. Atmos. Chem. 13: 225–263.
———; TS. BATES, R.J. CHARLSON, A.D. CLARKE, P.A. DURKEE, J. HEINTZEN-BERG, D.J. HOFMANN, B. HUEBERT, C. LECK, J. LELIEVED, J.A. OGREN, J. PROS-PERO, P.K. QUINN, H. RODHE and A.G. RYABOSHAPKO. 1993. The globalatmospheric sulfur cycle: An evaluation of model predictions and obser-vations. Report CM-81, Department of Meteorology. Stockholm. University,28 pp.
LECKNER, B. 1978. The spectral distribution of solar radiation at the earth‘ssurface. Elements of a model. Sol. Energy, 20(2): 143–150.
LOHMANN, U.; N. MCFARLANE, K. VON SALZEN, H. LEIGHTON and J. FEITCHER.1999. Sensivity of the tropospheric sulfur cycle in the Canadian generalcirculation model to different physical processes. J. Geophys. Res.104(21): 26833–26858.
LONG, C.S. and L.L. STOWE. 1994. Using the NOAA AVHRR data to studystratospheric aerosol optical depth following the Mt Pinatubo eruption.Geophys. Res. Lett. 21(10): 2115–2218.
MARKHAM, B.L.; J.S. SCHAFER, B.N. HOLBEN and R.N. HALTHORE. 1997.Atmospheric aerosol and water vapor characteristics over north centralCanada over BOREAS. J. Geophys. Res. 102(D24): 29737–29745.
NAKAJIMA, T.; M. TANAKA and T. YAMAUCHI. 1983. Retrieval of the opticalproperties of aerosols from aureole and extinction data. Appl. Opt. 22(19):2951–2959.
———; G. TONNA, R. RAO, P. BOI, Y. KAUFMAN and B. HOLBEN. 1996. Use ofthe sky brightness measurements from ground for remote sensing of par-ticulate polydispersions. Appl. Opt. 35: 2672–2686.
NEMESURE, S.; R. WAGENER and S.E. SCHWARTZ. 1996. Direct software forcingof climate by anthropogenic aerosols. J. Aerosol Sci. 27: 359–382.
O’DOWD, C.D. 2001. Biogenic coastal aerosol production and its influence onaerosol radiative Properties. J. Geophys. Res. 106(2): 1545–1550.
———; M.H. SMITH, I.E. CONSTERDINE and J.A. LOWE. 1997. Marine aerosol,sea-salt and the marine sulphur cycle: A short review. Atmos. Environ. 31:73–80.
O’NEILL, N.T. and J.R. MILLER. 1984. Combined solar aureole and solar beamextinction measurements, 2. Studies of the inferred aerosol size distribu-tions. Appl. Opt. 23: 3697–3704.
———; A. ROYER, P. COTÉ and L.J.B. MCARTHUR. 1993. Relations betweenoptically derived aerosols parameters, humidity, and air-quality data in anurban atmosphere. J. Appl. Meteorol. 32(9): 1484–1497.
———; T.F. ECK, B.N. HOLBEN, A SMIRNOV, O. DUBOVIK and A. ROYER. 2001.Bi-modal size distribution influences on the variation of Ångström deriva-tives in spectral and optical depth space. J. Geophys. Res. 106(D9):9787–9806.
PANDIS, S.N.; R.A. HARLEY, G.R. CASS and J.H. SEINFELD. 1992. SecondaryOrganic Aerosol Formation and Transport. Atmos. Env. 26A(13):2269–2282.
POLAVARAPU, R.J. 1978. Atmospheric turbidity over Canada. J. Appl. Meteorol.
Assessment from a Ground-Based Sunphotometer Network: AEROCAN / 455
17: 1368–1374.PORTER, J.N.; M. MILLER, C. PIETRAS and C. MOTELL. 2000. Ship based sunpho-
tometer measurements using MICROTOPS sunphotometers. J. Atmos.Tech. 18(5): 765–774.
PRATA, A.J.; R.P. CECHET, G.F. RUTTER and J. KINGWELL. 1995. The AustralianContinental Integrated Ground Site Network - CIGSN. In: Technical Proc.8th International TOVS Study Conference. Queenstown, New Zealand,4–12 April 1995. J.R. Eyre (Ed.). European Centre for Medium-RangeWeather Forecasts. Reading, U.K. pp. 387–394.
RAHMAN, H. and G. DEDIEU. 1994. SMAC: A simplified method of atmos-pheric correction of satellite measurements in the solar spectrum. Int. J.Remote Sens. 15: 123–143.
REAGAN, J.A.; D.M. BYRNE, M.D. KING, J.D. SPINHIRNE and B.M. HERMAN. 1980.Determination of the complex refractive index and size distribution ofatmospheric particulates from bistatic-monostatic lidar and solar radiometermeasurements. J. Geophys. Res. 85: 1591–1599.
———; L.W. THOMASON, B.M. HERMAN and J.M. PALMER. 1986. Assessment ofatmospheric limitations on the determination of the solar spectral constantfrom ground-based spectroradiometer measurements. IEEE Trans. Geosci.Remote Sens. 24: 258–266.
REMER, L.A.; S. GASSO, D.A. HEGG, Y.J. KAUFMAN and B.N. HOLBEN. 1997.Urban/industrial aerosol: ground-based sun/sky radiometer and airborne insitu measurements. J. Geophys. Res. 102(D14): 16849–16859.
ROMANOV, P.; N.T. O’NEILL, A. ROYER and L.J.B. MCARTHUR. 1999. Simultaneousretrieval of aerosol refractive index and particle size distribution fromground-based measurements of direct and scattered radiation. Appl. Opt.38(2): 7305–7320.
ROSEN, J.M.; N.T. KJOME, R.L. MCKENZIE and J.B. LILEY. 1994. Decay of mountPinatubo aerosol at midlatitudes in the northern and southern hemispheres.J. Geophys. Res. 99(D12): 25733–25739.
RUSSELL, P.B.; J.M. LIVINGSTON, E.G. DUTTON, R.F. PUESCHEL, J.A. REAGAN, T.E.DEFOOR, M.A. BOX, D. ALLEN, P. PILEWSKIE, B.M. HERMAN, S.A. KINNE and D.J.HOFMAN. 1993. Pinatubo and pre-Pinatubo optical deph spectra: MaunaLoa measurements, comparisons, inferred particle size distributions, radia-tive effects and relationship to lidar data. J. Geophys. Res. 98: 22969–22985.
SCHMID, B. and C. WEHRLI. 1995. Comparison of sunphotometer calibration byuse of the Langley technique and the standard lamp. Appl. Opt. 34(21):4500–4512.
———; K.J. THOME, P. DEMOULIN, R. PETER, C. MATZLER and J. SEKLER. 1996.Comparison of modeled and empirical approaches for retrieving columnarwater vapor from solar transmittance measurements in 0.94-nm region. J.Geophys. Res. 101(D5): 9345–9358.
———; P.R. SPYAK, S.F. BIGGAR, C. WEHRLI, J. SEKLER, T. INGOLD, C. MATZLER
and N. KAMPFER. 1998. Evaluation of the applicability of solar and lampradiometric calibrations of a precision Sun photometer operating between300 and 1025 nm. Appl. Opt. 37: 3923–3941.
———; J. MICHALSKY, R. HALTHORE, M. BEAUHARNOIS, L. HARISSON, J.LIVINGSTON, P. RUSSELL, B. HOLBEN, T. ECK and A. SMIRNOV. 1999.Comparison of aerosol optical depth from four solar radiometers duringthe fall 1997 ARM intensive observation period. Geophys. Res. Lett. 26:2725–2728.
SCHWARTZ, S.E. 1996. The whitehouse effect - shortwave radiative forcing ofclimate by anthropogenic aerosols. J. Aerosol Sci. 27: 359–382.
SHAW, G.E. 1982. Atmospheric turbidity in the polar regions. J. Appl. Meteorol.21: 1080–1088.
SHETTLE, E.P. and R.W. FENN. 1979. Models for the aerosols of the loweratmosphere and the effects of humidity variations on their optical proper-ties. Air Force Geophysics Laboratory, Hanscom Air Force Base, Mass.U.S.A., 94 pp.
SMIRNOV, A.; A. ROYER, N.T. O’NEILL and A. TARUSSOV. 1994. A study of thelink between synoptic air mass type and atmospheric optical parameters. J.
Geophys. Res. 99(D10): 20967–20982.———; N.T. O’NEILL, A. ROYER and A. TARUSSOV. 1996. Aerosol optical depth
over Canada and the link with synoptic air mass types. J. Geophys. Res.101(D14): 19299–19318.
———; B.N. HOLBEN. T.F. ECK, O. DUBOVICK and I. SLUTSKER. 2000. Cloudscreening and quality control algorithms for the AERONET data base.Rem. Sens. Environ. 73: 337–349.
SLUSSER, J.; J. GIBSON, D. BIGELOW, D. KOLINSKI, P. DISTERHOFT, K. LANTZ andA. BEAUBIEN. 2000. Langley method of calibrating UV filter radiometers.J. Geophys. Res. 105(D4): 4841–4849.
SOUFFLET, V.; C. DEVAUX and D. TANRÉ. 1992. Modified Langley plot methodfor measuring the spectral aerosol optical thickness and its daily variations.Appl. Opt. 31(12): 2154–2161.
STOKES, G.M. and S.E. SCHWARTZ. 1994. The Atmospheric radiation measure-ment (ARM) Program: programmatic background and design of the cloudand radiation test bed. Bull. Am. Meteorol. Soc. 75: 1201–1221.
STOWE, L.L.; A.M. IGNATOV and R.R. SINGH. 1997. Development, validation, andpotential enhancements to the second-generation operational aerosol productat the National Environmental Satellite, Data and Information Service ofthe National Oceanic and Atmospheric Administration. J. Geophys. Res.102(D14): 16923–16934.
STRAPP, J.W.; W.R. LEAITCH and P.S.K. LIU. 1992. Hydrated and dried aerosol-size-distribution measurements from the particle measuring systemsFSSP-300 probe and the deiced PCASP-100X Probe. J. Atmos. Ocean.Technol. 9: 548–555.
SVENNINGSON, I.B.; H.C. HANSSON, A. WIEDENSOHLER, J.A. OGREN, K.J. NOONE
and A. HALLBERG. 1992. Hygroscopic growth of aerosol particles in the PoValley. Tellus, 44: 556–569.
TANRÉ, D.; Y.J. KAUFMAN, M. HERMAN and S. MATTOO. 1997. Remote sensingof aerosol properties over oceans using the MODIS/EOS spectral radi-ances. J. Geophys. Res. 102(D14): 16971–16988.
TAYLOR, K.E. and J.E. PENNER. 1994. Response of the climate system to atmos-pheric aerosols and greenhouse gases. Nature, 369: 734–737.
TEGEN, I.; P. HOLLRIG, M. CHIN, I. FUNG, D. JACOB and J. PENNER. 1997.Contribution of different aerosol species to the global aerosol extinctionoptical thickness: Estimates from model results. J. Geophys. Res. 102:23895–23915.
TOMASI, C. 1982. Features of the scale height for particulate extinction in hazyatmospheres. J. Appl. Meteorol. 2: 931–944.
———; E. CAROLI and V. VITALE. 1983. Study of the relationship betweenAngstrom’s wavelength exponent and Junge particle size distributionexponent. J. Appl. Meteorol. 22: 1707–1716.
UBOEGBULAM, T.C. and J.A. DAVIES. 1983. Turbidity in Eastern Canada. J.Clim. Appl. Meteorol. 22: 1384–1392.
VERMOTE, E.F.; D. TANRÉ, J.L. DEUZÉ, M. HERMAN and J.J. MOCRETTE. 1997.Second simulation of the satellite signal in the solar spectrum, 6S: anoverview. IEEE Trans. Geosci. Rem. Sens. 35: 675–686.
YAMASOE, M.A.; Y.J. KAUFMAN, O. DUBOVIK, L.A. REMER, B.N. HOLBEN and P.ARTAXO. 1998. Retrieval of the real part of the refractive index of smokeparticles from Sun/sky measurements during SCAR-B. J. Geophys. Res.103(D24): 31893–31902.
WCRP. 1991. Radiation and Climate. Workshop on Implementation of theBaseline Surface Radiation Network. Washington, DC, U.S.A., 3–5 December1990. WCRP-54, report no. 406, World Meteorological Organization.Geneva, Switzerland.
WENDISCH, M. and W. VON HEUNINGEN-HEUNE. 1994. Possibility of refractiveindex determination of atmospheric aerosol particles by ground-basedsolar extinction and scattering measurements. Atmos. Env. 28(5): 785–792.
WILLIAM, C.M. and J.F. SISLER. 2000. Spatial patterns of major aerosol speciesand selected heavy metals in the United States. Fuel Process. Technol.65-66: 473–501.
456 / A.I. Bokoye et al.