National Action Plan for Antimicrobial Resistance (2020-2024)
Upload
khangminh22Category
view
3download
0
i
CHARACTERIZATION OF ANTIMICROBIAL RESISTANCE GENES OF AEROMONAS SPP. ISOLATED FROM FISH AND INVESTIGATION OF PHYTOCHEMICAL TREATMENT EFFICACY AGAINST RESISTANT
ISOLATES
by
Chinenye Adaku Okolie
Submitted in fulfilment of the academic requirements for the degree of Master of Science in the School of Life Sciences, University of KwaZulu-Natal Durban
April 2015
As the candidate’s supervisor I have/have not approved this thesis/dissertation for submission. Signed: _____________ Name: _____________ Date: ____

ii
COLLEGE OF AGRICULTURE, ENGINEERING AND SCIENCE
DECLARATION 1 - PLAGIARISM
I, ……………………………………….………………………., declare that 1. The research reported in this thesis, except where otherwise indicated, is my original
research. 2. This thesis has not been submitted for any degree or examination at any other university. 3. This thesis does not contain other persons’ data, pictures, graphs or other information,
unless specifically acknowledged as being sourced from other persons. 4. This thesis does not contain other persons' writing, unless specifically acknowledged as
being sourced from other researchers. Where other written sources have been quoted, then: a. Their words have been re-written but the general information attributed to them
has been referenced b. Where their exact words have been used, then their writing has been placed in
italics and inside quotation marks, and referenced. 5. This thesis does not contain text, graphics or tables copied and pasted from the Internet,
unless specifically acknowledged, and the source being detailed in the thesis and in the References sections.
Signed ………………

iii
DECLARATION
I, the undersigned, hereby declare that the work contained in this thesis is my own, unaided
work. It has been submitted for the degree Master of Science to the College of Agriculture,
Engineering and Science, School of Life Sciences, Discipline of Microbiology at the University
of KwaZulu-Natal, Durban, South Africa. It has not been submitted previously, in its entirety or
in part, at any other university.
Signature: ________________ Date: __________________
Supervisor: _________________ Date: __________________

iv
ACKNOWLEDGEMENTS
The author records her appreciation to:
Dr. H.Y Chenia, University of KwaZulu-Natal (Westville Campus), for her supervision of this
project and support and guidance during the course of this project;
Staff and post-graduate students of the Department of Microbiology, University of KwaZulu-
Natal (Westville Campus), for their motivation and moral support; and
Her family and friends for their love, patience, moral and financial support during her student
years.

v
ABSTRACT
The dissemination of resistance determinants, associated with mobile genetic elements, by
horizontal gene transfer is responsible for the increasing antimicrobial resistance of Aeromonas
spp. Phytochemicals are thus being explored as alternatives to the use of antimicrobial agents
since they have antimicrobial, anti-virulence and immuno-stimulating properties. Aeromonads
from fish and aquatic sources were examined for some of their resistance gene array and the
antimicrobial and anti-biofilm effects of phytochemicals were assessed as an alternative
therapeutic avenue. The presence of β-lactam resistance genes (blaTEM 1 and 2), extended
spectrum β-lactam resistance genes (blaSHV-1, blaCTX-M-15 and blaCTX-II) and integron-associated
genes in multi-drug resistant Aeromonas spp. isolates was investigated using polymerase chain
reaction (PCR). The antimicrobial effect of three phytochemicals, viz; cinnamaldehyde, vanillin
and crude Kigelia africana fruit extracts on multi-drug resistant Aeromonas spp. isolates was
assessed using disk diffusion assays. Anti-biofilm effect of cinnamaldehyde, vanillin, 10%
ethanolic K. africana extract and crude K. africana fruit extracts against A. bestiarum isolates
was investigated using microtiter plate assays. Amongst test isolates, 17.1% (17/99) and 29.2%
(29/99) were positive for blaTEM (1) and blaTEM (2), respectively. None of the test isolates were
positive for the extended spectrum β-lactamase SHV gene while three isolates (3.03%; 3/99)
were positive for both CTX-M-I5 and CTX-M genes. The intI gene was found in 10.1% (10/99)
of test isolates, while 23.2% (23/99) had the intII gene, and this was correlated to amplification
of their variable regions CS 10.1% (10/99) and Hep 19.1% (19/99), respectively. The qac, sulI
and sulII genes were found in 64.6% (64/99), 29.2% (29/99), and 17.1% (17/99) of test isolates,
respectively. None of the study isolates displayed zones of inhibition with 1 mg/ml
cinnamaldehyde, 100µg/ml hexane K. africana extract as well as with all concentrations of
vanillin. Cinnamaldehyde (all concentrations) and K. africana 10 mg/ml methanol extract proved
bactericidal for study isolates. Sub-inhibitory concentrations of cinnamaldehyde (50 and 100
µg/ml) were most effective against A. bestiarum biofilms in the initial attachment and mature
biofilm assays. The blaTEM was the most prevalent of the β-lactamases and extended spectrum β-
lactamases genes amongst test isolates. Cinnamaldehyde and K. africana fruit extracts appear to
be promising and sustainable phytochemicals that may be used as alternatives to antimicrobial
agents in aquaculture against Aeromonas spp. and A. bestiarum biofilms.

vi
LIST OF FIGURES
Figure 1.1: Representation of various mechanisms of bacterial resistance (Levy and Marshal,
2004) ………………………………………………………………………………………….…5
Figure 1.2: General organization of an integron and gene cassette (GC) recombination
mechanism. TheIntI1protein catalyzes the insertion (A) and excision (B) of the GC in the
integron, with GC integration occurring at the attI recombination site. In example (A), the
circularized GC3 is integrated in linear form inside the integron platform via a specific
recombination mechanism between the attI site and the attC3 site of the GC3. GC excision
preferentially occurs between two attC sites. In example (B), the GC1 is excised following there
combination between the two attC1 and attC3 sites. Pc: gene cassette promoter; attI: integron
recombination site; attC1, attC2, and attC3: attC GC recombination sites; intI: the integrase
gene; GC1, GC2, GC3 are the gene cassettes, and arrows indicate the direction of coding
sequences. (Stalder et al., 2012) ……………………………………………………………….8
Figure 1.3: Proposed-biofilm associated resistance mechanisms: (1) antimicrobial agents may
fail to penetrate beyond the surface layers of the biofilm. Outer layers of biofilm cells absorb
damage. Antimicrobial agent action may be impaired in areas of waste accumulation or altered
environment (pH, pCO2, pO2, etc). (2) Antimicrobial agents may be trapped and destroyed by
enzymes in the biofilm matrix. (3) Altered growth rate inside the biofilm. Antimicrobial agents
may not be active against non-growing microorganisms (persister cells). (4) Expression of
biofilm-specific resistance genes (e.g., efflux pumps). (5) Stress response to hostile
environmental conditions (Del Pozo and Patel, 2007) …………………………………………16
Figure 1.4: Schematic outlining of the stages in biofilm development and listing the strategies
aimed at inhibiting and/or disrupting biofilm formation at specific stages (Kostakioti et al., 2013)
………………………………………………………………………...…………………..……..19
Figure 2.1: Agarose gel (1.5%) electrophoresis picture of a typical example of 503 bp blaTEM
type gene amplicons obtained using primer set (1). Lane 1 was O’GeneRulerTM 100bp DNA
Ladder Plus (Fermentas, Canada); Lane 2 was negative control E. coli ATCC 25922; Lane 3 was

vii
positive control E. coli ATCC 35218; Lane 4 was M63; Lane 5 was M64; Lane 6 was M65; Lane
7 was M66…………………………...………………………………………....…...….....……...32
Figure 2.2: Agarose gel (1.5%) electrophoresis picture of a typical example of 857 bp blaTEM
type gene amplicons obtained using primer set (2). Lane 1 was positive control E. coli ATCC
35218; Lane 2 was M1; Lane 3 was O’GeneRulerTM 100bp DNA ladder (Fermentas, Canada);
Lane 4 was negative control E. coli ATCC 25922; Lane 5 was M6; Lane 6 was
M9……………………………………………...………………………………………………...32
Figure 2.3: Agarose gel (1.5%) electrophoresis picture of a typical example of 1008 bp blaSHV
type gene amplicon obtained using primer set blaSHV-1. Lane 1 was O’GeneRulerTM 100 bp DNA
Ladder (Fermentas, Canada); Lane 2 was negative control E. coli 25922; Lane 3 was positive
control K. pneumoniae ATCC 700603; Lanes 4 – 11 were eight ESBL producers (M10, M13,
M27, M37, M81, M87, M94, M95) …..........................................................................................37
Figure 2.4: Agarose gel (1.5%) electrophoresis picture of a typical example of 925 bp blaCTX-M-15
and 585 bp blaCTX-M gene amplicons obtained using primer sets blaCTX-M-15 and blaCTX-II. Lane 1
was positive control Salmonella typhimurium; lane 2 was M81; lane 3 was M82; lane 4 was
M88; lane 5 was O’GeneRulerTM 1kb DNA ladder plus (Fermentas, Canada); lane 6 was positive
control Salmonella typhimurium; lane 7 was M81; lane 8 was M82; lane 9 was
M88………………………………………………..……………………………………………..37
Figure 3.1: Classic integron structure diagram showing gene cassette (cassette 1), capture and
integration by integrase gene intI at attI site (Gonzalez et al., 2004) ………………………..…41
Figure 3.2: Agarose gel (1.5%) electrophoresis picture of a typical example of 892 bp intI gene
amplicon obtained using intI primer. Lanes 1-3 were M42 – M44, lane 4 was M45, lanes 5 – 12
were M46 – M53 and lane 13 was O’GeneRulerTM 100 bp DNA Ladder (Fermentas, Canada)..45
Figure 3.3: Agarose gel (1.5%) electrophoresis picture of a typical of 892 bp intI gene amplicon
obtained using intI primer. Lanes 1 was O’GeneRulerTM 100 bp DNA Ladder (Fermentas,

viii
Canada); lane 2 was E. coli ATCC 25922; lane 3 was E. coli ATCC 35218; Lane 4 was M1; lane
5 was M2 ………………………..….………………………………………………....................45
Figure 3.4: Agarose gel (1.5%) electrophoresis picture of a typical of 467 bp intII gene amplicon
obtained using intII primer. Lane 1 was O’GeneRulerTM 100 bp DNA Ladder (Fermentas,
Canada); lane 2 was A. hydrophila ATCC 7966T; lane 3 was A. caviae ATCC 15468T; lane 4 was
M63; lane 5 was M64; lane 6 was M65; Lane 7 was M66; Lanes 8 – 13 were M67 –
M73………………………………………………………………………………………………45
Figure 3.5: Agarose gel (1.5%) electrophoresis picture of a typical of 417 bp sulI gene
amplicons obtained using sulI primer. Lane 1 was O’GeneRulerTM 100 bp DNA Ladder
(Fermentas, Canada); Lane 2 was M85; lane 3 was M86; lane 4 was M87; lane 5 was M88; lane
6 was M89; lane 7 was M90; lane 8 was M91; lane 9 was M92; lane 10 was M93; lane 11 was
M94………………………………………………………………………………………………49
Figure 3.6: Agarose gel (1.5%) electrophoresis picture of a typical of 722 bp sulII gene
amplicons obtained using sulII primer. Lane 1 was O’GeneRulerTM 100 bp DNA Ladder Plus
(Fermentas, Canada); lane 2 was A. hydrophila ATCC 7966T; lane 3 was A. caviae ATCC
15468T; lane 4 was E. coli ATCC 25922; lane 5 was E. coli ATCC 35218; lane 6 was P.
aeruginosa ATCC 27853; lane 7 was P. aeruginosa ATCC 35032; lane 8 was K. pneumoniae
ATCC 700603; lane 9 was M1; lane 10 was M2……..……………………….............................49
Figure 3.7: Agarose gel (1.5%) electrophoresis picture of a typical of 230 bp qacEΔ1 gene
amplicons obtained using Qac primer. Lane 1 was O’GeneRulerTM 100 bp DNA Ladder
(Fermentas, Canada); lane 2 was M54; lane 3 was M55; lanes 4 – 6 were M56 – M58; lane 7 was
M59; lane 8 was M60; lane 9 was M61………………………………………………….…........50
Figure 3.8: Agarose gel (1.5%) electrophoresis of CS variable regions of ten intI positives. Lane
1 was A. caviae ATCC 15468T; lane 2 was E. coli ATCC 35218; lane 3 was M26; lane 4 was
M28; lane 5 was M30; lane 6 was M31; lane 7 was M45; lane 8 was O’GeneRulerTM 100 bp
DNA Ladder Plus (Fermentas, Canada); lane 9 was M57; lane 10 was M62; lane 11 was M63;
lane 12 was M76; lane 13 was M98……………………………………………………………...53

ix
Figure 3.9: Agarose gel (1.5%) electrophoresis of HEP variable regions of intII positives. Lane
1 was M1; lane 2 was M6; lane 3 was M8; lane 4 was M11; lane 5 was M14; lane 6 was M17;
lane 7 was M19; lane 8 was M26; lane 9 was M41; lane 10 was M53; lane 11 was M62; lane 12
was M65; lane 13 was O’GeneRulerTM 100 bp DNA Ladder Plus (Fermentas, Canada); lane 14
was M66; lane 15 was M74; lane 16 was M75; lane 17 was M76; and lane 18 was M83.……...53
Figure 4.1: Kigelia africana fruit (lam.) Benth. (Saini et al., 2009) ………………………..…..59
Figure 5.1: Effect of 50 and 100 µg/ml of cinnamaldehyde on initial attachment of A. bestiarum
isolates following addition at the time of inoculation, using micro-titre plate assays. Data
represents the mean standard deviations of three replicates on three separate occasions……….78
Figure 5.2: Effect of 100 and 250 µg/ml of vanillin on initial attachment of A. bestiarum isolates
following addition at the time of inoculation, using micro-titre plate assays. Data represents the
mean standard deviations of three replicates on three separate occasions……………………….79
Figure 5.3: Effect of 150 and 300 µg/ml 10% ethanol K. africana (PhytoForce) extract in initial
attachment of a. bestiarum isolates following addition at the time of inoculation, using the micro-
titre plate assays……………………………………………………………………….................80
Figure 5.4: Effect of 0.5, 1, 2 and 4 mg/ml ethyl acetate EX1 K. africana fruit extract on initial
attachment of A. bestiarum isolates following addition at the time of inoculation, using micro-
titre plate assays. Data represents the mean standard deviations of three replicates on three
separate occasions……………………………………………………………………………......81
Figure 5.5: Effect of 0.5, 1, 2 and 4 mg/ml dichloromethane EX2 K. africana fruit extract on
initial attachment of A. bestiarum isolates following addition at the time of inoculation, using
micro-titre plate assays. Data represents the mean standard deviations of three replicates on three
separate occasions……………………………………………………………………………......82

x
Figure 5.6: Effect of 0.5, 1, 2 and 4 mg/ml methanol EX3 K. africana fruit extract on initial
attachment of A. bestiarum isolates following addition at the time of inoculation, using micro-
titre plate assays. Data represents the mean standard deviations of three replicates on three
separate occasions……………………………………………………………………………......83
Figure 5.7: Effect of 0.5, 1, 2 and 4 mg/ml hexane EX4 K. africana fruit extract on initial
attachment of A. bestiarum isolates following addition at the time of inoculation, using micro-
titre plate assays. Data represents the mean standard deviations of three replicates on three
separate occasions……………………………………………………………………………......84
Figure 5.8: Effect of 50 and 100 µg/ml cinnamaldehyde on pre-formed biofilm of A. bestiarum
isolates following addition to 24H biofilm, using micro-titre plate assays. Data represents the
mean standard deviations of three replicates on three separate occasions…………………..…...88
Figure 5.9: Effect of 100 and 250 µg/ml vanillin on pre-formed biofilm of A. bestiarum isolates
following addition to 24H biofilm, using micro-titre plate assays. Data represents the mean
standard deviations of three replicates on three separate occasions…………………………......89
Figure 5.10: Effect of 150 and 300 µg/ml commercial ethanol K. africana extract (PhytoForce)
on pre-formed biofilm of A. bestiarum isolates following addition to 24H biofilm, using micro-
titre plate assays. Data represents the mean standard deviations of three replicates on three
separate occasions……………………………………………………………………………......90
Figure 5.11: Effect of 0.5, 1, 2 and 4 mg/ml ethyl acetate EX1 K. africana fruit extract on pre-
formed biofilm of A. bestiarum isolates following addition to 24H biofilm, using micro-titre
plate assays. Data represents the mean standard deviations of three replicates on three separate
occasions…………………………………………………………………………………………91
Figure 5.12: Effect of 0.5, 1, 2 and 4 mg/ml dichloromethane EX2 K. africana fruit extract on
pre-formed biofilm of A. bestiarum isolates following addition to 24H biofilm, using micro-titre
plate assays. Data represents the mean standard deviations of three replicates on three separate
occasions………………………………………………………………………………………....92

xi
Figure 5.13: Effect of 0.5, 1, 2 and 4 mg/ml methanol EX3 K. africana fruit extract on pre-
formed biofilm of A. bestiarum isolates following addition to 24H biofilm, using micro-titre
plate assays. Data represents the mean standard deviations of three replicates on three separate
occasions…………………………………………………………………………………………93
Figure 5.14: Effect of 0.5, 1, 2 and 4 mg/ml hexane EX4 K. africana fruit extract on pre-formed
biofilm of A. bestiarum isolates following addition to 24H biofilm, using micro-titre plate assays.
Data represents the mean standard deviations of three replicates on three separate occasions.....94

xii
LIST OF TABLES
Table 2.1: Antimicrobial agent resistance profiles displayed by Aeromonas spp. isolates
obtained from South African seawater and fish sources (Duma, 2012) …………………….…..26
Table 2.2: Primers used in beta-lactamase and extended spectrum beta-lactamase detection….30
Table 2.3: Beta-lactamase resistance phenotypes and amplification of blaTEM gene using primer
sets blaTEM (1) and blaTEM (2) from Aeromonas spp. isolated from fish and seawater……….....33
Table 2.4: Species designation analysis of Aeromonas spp. blaTEM gene positives using primer
sets blaTEM (1) and blaTEM (2) …………………………………………………………………...36
Table 2.5: Percentages analysis of Aeromonas spp. blaTEM gene positives using primer sets
blaTEM (1) and blaTEM (2) based on source of isolation…………………………………..............36
Table 3.1: Primers used in detection of integrons and integron-associated genes. …………....43
Table 3.2: Characterisation of Aeromonas spp. from fish and seawater isolates based on PCR
amplification of integron and associated integron genes content and their resistance
phenotypes……………………………………………………………………………………….46
.
Table 3.3: Species designation-based analysis of amplified integron genes…………………....51
Table 3.4: Source of isolation-based analysis of amplified integron genes………………….....52
Table 4.1: Susceptibility analysis of ninety-three Aeromonas and Plesiomonas spp. study
isolates to phytochemical extracts and standard antimicrobial agents…………………………...63
Table 4.2: Analysis of percentage resistance of test isolates to phytochemicals used based on
species designation………………………………………………………………………………65

xiii
Table 4.3: Analysis of percentage resistance of test isolates to phytochemicals used based on
source of isolation……………………………………………………………………………….65
Table 4.4: Percentage of isolates with cinnamaldehyde and K. africana extracts activity indices
≥ 1, relative to ampicillin (AMP10) and tetracycline (TE30) ………………………………….66
Table 5.1: Aeromonas bestiarum strains selected for anti-biofilm study of phytochemicals and
crude extracts of K. africana fruit extracts………………………………….…………………..74
Table 5.2: Effect of phytochemicals and K. africana extracts on initial attachment and pre-
formed biofilm of A. bestiarum strains………………………………………………………......95
Table 5.3: Percentage biofilm reduction in the presence of phytochemicals and K. africana fruit
extracts on initial attachment (IA) and mature biofilms (MB) of A. bestiarum multidrug
resistance isolates………………………………………………………………………………...97

xiv
TABLE OF CONTENTS
DECLARATION………………………………………………………………………………...ii
ACKNOWDGEMENTS…..………………………………………………………………….…iv
ABSTRACT……………………………………………………………………………………....v
LIST OF FIGURES……………………………………………………………………………..vi
LIST OF TABLES……………………………………………………………………………...xii
CHAPTER 1 INTRODUCTION AND LITERATURE REVIEW…………………………...1
1.1. The genus Aeromonas …………………...…….....……...……………………......………1
1.1.1. Aeromonas species in aquatic environments……………………......……...……..2
1.1.2. Aeromonas species in aquaculture……………………......……....……...………..3
1.1.3. Aeromonas species infections in humans……………......……....……....……..…4
1.2. Bacterial antimicrobial resistance……………………………………………...……….....5
1.2.1. Antimicrobial resistance in Aeromonas spp. ………......……....……..………......6
1.2.2. Mobile genetic elements associated with antimicrobial resistance in Aeromonas
spp.……………………………………………...………..……....……………......7
1.2.2.1. Plasmid-associated antimicrobial resistance in Aeromonas spp.....7
1.2.2.2. Integron-associated antimicrobial resistance in Aeromonas spp...9
1.2.3. Beta-lactam resistance in Aeromonas spp. ……………......……....……......……11
1.2.3.1. Penicillin resistance in Aeromonas spp……...…………………...12
1.2.3.2. Extended spectrum Beta-lactam resistance in Aeromonas spp.....12
1.2.3.3. Metallo-Beta-lactam resistance in Aeromonas spp..............……13
1.3. Bacterial biofilm development …………………………………………………………..14
1.3.1. Role of biofilms in antimicrobial resistance……………………………………..15
1.3.2. Biofilm formation by Aeromonas spp.…….………………....................…...…...17
1.3.3. Control of biofilms……………….………..……………….……….…...….........17
1.3.3.1. The use of phytochemicals in biofilm control……..…......….......19
1.3.3.2. Antimicrobial potential of phytochemicals…….…...…....…......20
1.3.3.3. Anti-biofilm potential of phytochemicals…….…...…...….....…..21
1.4. Rationale of the study……………………………………………………….....…...........21
1.5. Objectives……………………………………………………………………………......22
1.6. Aims of study……………………………………………………………………….........22

xv
CHAPTER 2 CHARACTERISATION OF BETA-LACTAMASE RESISTANCE GENE OF
Aeromonas spp. ISOLATED FROM FISH AND AQUATIC SOURCES...............................38
2.1. Introduction……………………………………………………………………………...24
2.2. Materials and Methods………………………………………………………………......26
2.2.1. Maintenance of bacterial isolates……………………………………………......26
2.2.2. Genomic DNA isolation and analysis …………………………………………...29
2.2.3. Detection of TEM type beta-lactamase resistance genes …………………….....29
2.2.4. Detection of extended spectrum beta-lactamase resistance genes …………......31
2.3. Results…………………………………………………………………………………....31
2.3.1. Identification of TEM type beta-lactamase resistance genes……………………35
2.3.2. Analysis of TEM type gene content of Aeromonas spp. based on species
designation and source of isolation……………………………………………....35
2.3.3. Identification of extended spectrum beta-lactamase resistance genes……….……37
2.4. Discussion……………………………………………………………………………......38
CHAPTER 3 IDENTIFICATION OF INTEGRONS ASSOCIATED WITH FISH AND
AQUATIC Aeromonas spp.…………………………………………………………………….40
3.1. Introduction………………………………………………………………………………40
3.2. Materials and Methods…………………………………………………………………...43
3.2.1. Detection of integron and integron-associated components…………………......43
3.2.2. Detection of conserved regions CS and HEP…………………………………....44
3.3. Results…………………………………………………………………………………....44
3.3.1. Identification of integron-associated components…………………………….....44
3.3.2. Analysis of integron gene content based on species designation and source of
isolation…………………………………………………………………………..50
3.3.3. Identification of conserved regions for class 1 and 2 integron
positives…………….…………………………………………………………....52
3.4. Discussion………………………………………………………………………..…........54

xvi
CHAPTER 4 CHARACTERISATION OF AQUATIC Aeromonas spp. ISOLATES’
SUSCEPTIBILITY TO PHYTOCHEMICAL COMPOUNDS: CINNAMALDEHYDE,
Kigelia africana AND VANILLIN……………………………………………………………..57
4.1. Introduction……………………………………………………………………………...57
4.2. Materials and Methods………………………………………………………………......60
4.2.1. Maintenance of bacterial isolates…………………………..……………..…......60
4.2.2. Preparation of crude K. africana fruit extracts………………….…….…….…...61
4.2.3. Phytochemical antimicrobial activity test against study isolates………………...61
4.3. Results…………………………………………………………………………………....62
4.3.1. Effect of phytochemicals on study isolates………………………………….......62
4.3.2. Analysis of phytochemical effects on Aeromonas spp.……………………........63
4.4. Discussion……………………………………………………………………………......66
CHAPTER 5 ANTIBIOFILM EFFECT OF CINNAMALDEHYDE, VANILLIN AND
CRUDE Kigelia africana FRUIT EXTRACTS AGAINST RESISTANT AQUATIC A.
bestiarum ISOLATES…………………………………………………………………………..70
5.1. Introduction……………………………………………………………………………...70
5.2. Materials and Methods…………………………………………………………………..72
5.2.1. Bacterial isolates………………………………………...…………………….....72
5.2.2. Effect of phytochemicals on initial attachment (IA) and mature biofilms (MB) of
A. bestiarum isolates……………………………………………..………………72
5.2.3. Statistical analyses…………………………………………………………….....73
5.3. Results………………………………………………………………………………........73
5.3.1. Effect of phytochemicals on initial attachment (IA) of A. bestiarum isolates
biofilms…………………………………………………………………………..75
5.3.2. Effect of phytochemicals on mature biofilms (MB) of A. bestiarum isolates...85
5.3.3. Analysis of percentage biofilm reduction data of A. bestiarum isolates in presence
of phytochemicals/extracts for initial attachment (IA) and mature biofilm (MB)
assays…………………………………………………………………………….95
5.4. Discussion………………………………………………………………………………102
CHAPTER 6 CONCLUSIONS…….…………………………………………………………105

xvii
REFERENCES………………………………………………………………………………..107
APPENDIX……………………………………………………………………………………126

1
CHAPTER ONE
INTRODUCTION AND LITERATURE REVIEW
1.1 The genus Aeromonas
Aeromonas species are Gram-negative bacteria, found in aquatic environments including sewage,
polluted and un-polluted water, sea-water and potable water (Fontes et al., 2011; Igbinosa et al.,
2012). They have even been isolated from raw milk, ice-cream, meat, poultry, vegetables, sea
foods, sediments and soil (Janda and Abbott, 2010; Xanthopoulos et al., 2010 ; Zaky et al.,
2010). This genus belongs to the family Aeromonadaceae along with other genera, viz:,
Oceanimonas, Oceanisphaera and Tolumonas (Igbinosa et al., 2012). Members of the genus
Aeromonas are biochemically characterised into three groups, viz:, Aeromonas hydrophila,
Aeromonas caviae and Aeromonas sobria, which contain a variety of genomospecies (Janda and
Abbott, 2010). The taxonomy of the genus Aeromonas has undergone continual change, due to
extended description of existing species and the addition of newly described taxa (Igbinosa et al.,
2013). The current classification of the genus Aeromonas is based on DNA-DNA hybridization
and 16S ribosomal DNA relatedness (Fontes et al., 2011). Currently there are 26 phenospecies
names that have been described in the genus Aeromonas (Beaz-Hidalgo et al., 2013). This list of
species comprises of twelve new species added to the 14 that are already known, i.e., A. tecta, A.
aquariorum, A. bivalvium, A. pisicola, A. fluvialis, A. taiwanensis, A. sanarellii, A. rivuli, A.
simiae, A. molluscorum, A. diversa and A. dhakensis, which was recently proposed to designate
Aeromonas spp. HG13 (Enteric Group 501) (Fontes et al., 2011).
Aeromonads are straight, cocco-bacillary to bacillary, non-sporing bacteria with rounded
ends measuring 0.3 - 1.0 × 1.0 - 3.5 μm across (Parker and Shaw, 2011). Aeromonas species
have an optimum pH range of 5.5 - 9 and optimum sodium chloride concentration range of 0 -
4% (Igbinosa et al., 2012). Many motile strains produce a single polar flagellum, while
peritrichous or lateral flagella may be formed on solid media in some species (Parker and Shaw,
2011). Aeromonas species are divided into two broad groups according to their optimum
temperatures and motility, the mesophilic, motile species with optimum temperatures of 35 – 37
°C typified by A. hydrophila and the psychrophilic non-motile species with optimum
temperatures of 22 - 25 °C typified by A. salmonicida (Janda and Abbott, 2010). However, there
are some species that can grow at temperature range of 40 - 45 °C (Janda and Abbott, 2010). The
mesophilic motile species such as A. hydrophila, A. caviae and A. veronii bv sobria are

2
associated with human infections while the psychrophilic non-motile species such as A.
salmonicida are associated with fish diseases (Janda and Abbott, 2010; Chuang et al., 2011). A.
hydrophila and A. veronii have also been implicated in various fish diseases (Janda and Abbott,
2010).
Aeromonas species are facultatively anaerobic, oxidase-positive, catalase-positive,
indole-positive, glucose-fermenting bacteria that are resistant to the 0/129 vibriostatic agent and
are chemoorganotrophic (Parker and Shaw, 2011; Igbinosa et al., 2012). These microorganisms
produce different extracellular hydrolytic enzymes such as arylamidases, esterases, elastase,
amylases, deoxyribonucleases, chitinases, peptidases and lipases (Igbinosa et al., 2012).
Members of the genus Aeromonas have the ability to utilize urease, pectinase, ornithine
decarboxylase, tryptophan and phenylalanine deaminases (Parker and Shaw, 2011). While some
members of this genus have the ability to ferment D-mannitol and sucrose, important
distinguishing qualities from other genera such as Plesiomonas include their inability to grow in
the presence of 6.5% sodium chloride, inability to ferment i-inositol, inability to grow on
thiosulphate citrate bile salts sucrose agar, variable presence of ornithine decarboxylase activities
and the ability to liquefy gelatine (USEPA, 2006).
1.1.1 Aeromonas species in aquatic environments
Members of the genus Aeromonas are known to be autochthonous to aquatic environments, since
they may be isolated from all types of water environments, e.g. rivers, lakes, ponds, seawater,
estuaries, chlorinated drinking water and non-chlorinated drinking water, ground water, waste
water and sewage (Janda and Abbott, 2010). Calhau et al. (2010) detected the presence of A.
media, A. molluscorum, A. sobria, A. veronii, A. salmonicida, A. hydrophila, A. bivalvium, A.
caviae, A. bestiarum, A. popoffii, A. allosaccharophila, A. tecta and A. encheleia in
environmental waters. Carvalho et al. (2012) observed that A. media, A. veronii, A. salmonicida,
A. hydrophila, A. caviae, A. bestiarum, A. popoffii, A. allosaccharophila, A. eucrenophila, A.
tecta and A. encheleia are prevalent in surface waters in Portugal. Aeromonas allosaccharophila,
A. aquariorum, A. enteropelogenes, A. eucrenophila, A. hydrophila, A. jandaei, A. media, A.
punctata, A. sanarellii, A. taiwanensis and A. veronii were detected in raw surface water, ground
water, chlorinated and ozonated drinking water (Figueira et al., 2011). In Brazil, A. encheleia, A.
allosaccharophila, A. hydrophila and A. jandaei were detected in wells and collective reservoir
waters used for human consumption (Razzolini et al., 2010). In South Africa, Igbinosa and Okoh

3
(2013) detected the presence of A. hydrophila and A. caviae in fresh and waste waters in the
Eastern Cape Province.
1.1.2 Aeromonas species in aquaculture
Aeromonads are ubiquitous in water environments and as a result form part of the normal micro-
flora of fish and other aquatic animals (Shayo et al., 2012). Aeromonas species are etiological
agents of a variety of infections in fish and their diversity in isolated species from aquaculture
has been studied (Adeleye et al., 2010; Kadlec et al., 2011; Nagar et al., 2011; Sarria-Guzmàn et
al., 2013; Ye et al., 2013; Vega-Sanchez et al., 2014). A. hydrophila has been reported to be the
species with highest incidence in fish and aquaculture (Adeleye et al., 2010; Kadlec et al., 2011;
Nagar et al., 2011; Sarria-Guzmàn et al., 2013; Ye et al., 2013; Vega-Sanchez et al., 2014). This
can be correlated with the increased isolation of A. hydrophila from clinical samples (Shayo et
al., 2012; Ye et al., 2013; Vega-Sanchez et al., 2014). Fish hemorrhagic diseases due to A.
hydrophila are responsible for huge economic losses in aquaculture every year in China (Ye et
al., 2013). Sarria-Guzmàn et al. (2013) reported the presence of A. veronii, A. hydrophila, A.
salmonicida, A. media, A. punctata, A. sobria, A. caviae and A. allosaccharophila in moribund
cultured Cyprinus carpio. Multidrug resistant A. hydrophila were isolated from commercialized
seafood in Lagos, Nigeria (Adeleye et al., 2010). Vega-Sanchez et al. (2014) observed that A.
hydrophila, A. bestiarum and A. veronii biovar biovar sobria were implicated in hemorrhagic
septicemia and furunculosis of farmed rainbow trout under stress conditions in Mexico. Other
species identified were A. allosaccharophila, A. popoffi, A. salmonicida, A. media and A.
encheleia. Nonmotile A. salmonicida was implicated in a typical furunculosis among salmonids
(Salmo salar) and goldfish ulcers in non-salmonids and have been identified with A. hydrophila
in cultured fish for consumption and ornamental fish in Germany (Godoy et al., 2010; Kadlec et
al., 2011). Dias et al. (2012) observed the prevalence of A. caviae, A. hydrophila, A. veronii, A.
jandaei, A. media and A. aquariorum in ornamental fish from Portugal. Shayo et al. (2012)
observed that motile Aeromonas species A. caviae, A. hydrophila, A. punctata, A. ichthiosmia
and A. veronii were responsible for motile aeromonad septicemia (MAS) in tilapia subjected to
elevated water temperatures, decreased oxygen concentration and increased ammonia and carbon
dioxide concentrations. Outbreaks of hemorrhagic diseases in China have been associated with
A. bestiarum, A. hydrophila, A. salmonicida, A. sobria and A. piscicola (Beaz-Hidalgo et al.,
2010).

4
Nagar et al. (2011) reported the predominance of A. salmonicida and A. veronii bv sobria
among A. hydrophila, A. caviae, A. jandaei, A. trota and A. eucrenophila identified in
commercialised cultured fresh water and marine water fishes from India. Similarly in Brazil A.
allosaccharophila, A. caviae, A. veronii bv sobria, A. hydrophila and Aeromonas spp. were
detected in reared and commercial Thunnus spp., Oncorynchus spp., Centropomus spp.,
Paralichthys spp., and Mycteroperca spp., farmed for human consumption (Da Silva et al.,
2010). Biological films of cultured adult and juvenile abalone (Haliotis discus hannoi) have been
shown to harbour Aeromonas species among other Gram-negative bacteria (Choresca et al.,
2010). Aeromonas spp. were detected in mucus of farmed adult abalone (Haliotis discus hannai)
(Choresca et al., 2010).
1.1.3 Aeromonas species infections in humans
Aeromonads are responsible for gastrointestinal and extraintestinal infections such as
septicaemia and wound infections in healthy and immunocompromised humans (Janda and
Abbott, 2010). Humans usually get infected with aeromonads via contact or consumption of
contaminated water or food (Khajanchi et al., 2010). The role of aeromonads in waterborne
infections has been established with A. caviae and A. media being the most prevalent (Khajanchi
et al., 2010; Pablos et al., 2010). Aeromonas species that are associated with human
gastroenteritis are A. caviae, A. hydrophila, A. media, A. bestiarum and A. veronii (biovars
veronii and sobria) (Pablos et al., 2010). Mesophilic species A. hydrophila, A. caviae and A.
veronii were reported to be responsible for monobacterial bacteremias in humans (Chuang et al.,
2011). Aeromonas trota, A. sobria and A. jandaei have been implicated in gastroenteritis in
humans (Igbinosa et al., 2012). Aeromonas hydrophila, A. caviae and A. veronii biovars veronii
and sobria), A. jandaei and A. schubertii are associated with peritonitis, meningitis, and various
infections of the eye, joint and bone in humans (Janda and Abbott, 2010). Aeromonas caviae, A.
hydrophila, and A. veronii biotype sobria have been associated with opportunistic infections of
humans such as food-borne gastroenteritis, diarrhoea and wound infections (Naviner et al.,
2011). These infections are usually treated with antimicrobial agents, in both humans and
animals, although increasing frequency of occurrences of antimicrobial resistance have been
reported (Janda and Abbott, 2010).

5
1.2 Bacterial antimicrobial resistance
Antimicrobial resistance is largely the consequence of drug overuse in human medicine and
animal agriculture and is of great public health concern (WHO, 2004). The abuse of
antimicrobial agents in animal, plant and fish farms has contributed immensely to the emergence
of resistant pathogenic and non-pathogenic bacteria (Kűmmerer, 2009). Antimicrobial resistance
is facilitated by the presence of antimicrobial resistance genes (ARG), and it is established that
these genes usually have environmental origins (Lupo et al., 2012; Marti et al., 2013). In
addition to food and animal production farms, hospital effluents have been identified as a source
of these ARGs that eventually get transported and transferred by horizontal gene transfer in
aquatic environments (Picào et al., 2013). Mobilization of these ARGs by genetic elements and
mobile genetic elements (MGE) such as integrons, transposons and plasmids, means that they
can arrive at drinking water supplies, food products and eventually humans (Kűmmerer, 2009;
Lupo et al., 2012; Marti et al., 2013).
Figure 1.1: Representation of various mechanisms of bacterial resistance (Levy and Marshal, 2004).
There are four main mechanisms of antimicrobial resistance in bacteria, (Fig. 1.1) viz.;
the innate hydrolysing activities of enzymes, e.g., beta-lactamases against antimicrobial agents,
the activities of efflux pumps that expel antimicrobials from cells, the use of DE novo metabolic

6
pathways which provides altered cell walls that do not possess active binding sites for
antimicrobials, and a plethora of mutations that lead limitation of antimicrobials to target sites
(Tenover, 2006).
1.2.1 Antimicrobial resistance in Aeromonas spp.
World-wide reports of the members of Aeromonas spp. suggests that aeromonads are readily
developing single or multiple antimicrobial resistance phenotypes (Janda and Abbott, 2010).
Aeromonas spp. are known to be resistant to β-lactams, tetracyclines, quinolones, and second-
and third-generation cephalosporins (Jacobs and Chenia, 2007; Jun et al., 2010; Surek et al.,
2010; Igbinosa and Okoh, 2012).
Matyar et al. (2010) observed that aquatic environments are possible reservoirs of
antimicrobial resistant Aeromonas spp strains. This increases the risk of contamination of surface
waters and ground water (Gõni-Urriza, 2000; Huddleston et al 2006; Hoa et al., 2011), which in-
turn highlights the fact that potable water can be contaminated by these waters and will indeed
transfer antimicrobial resistance to humans and human pathogens (Xi et al., 2009; Pablos et al.,
2010). Figueira et al. (2011) observed that aeromonads were relevant in the dissemination of
antimicrobial resistance in water environments and A. media and A. punctata were important
environmental reservoirs of quinolone resistance. Figueira et al. (2011) observed antimicrobial
resistance in aquatic A. caviae, A. hydrophila, A. veronii, A. jandaei and A. allosaccharophila
from Portugal to beta-lactams, cephalosporins and nalidixic acids. Similarly in the Eastern Cape
Province of South Africa, Aeromonas spp. isolated from waste water treatment plants were
observed to be multidrug resistant to beta-lactams, tetracycline, trimethoprim,
sulphamethoxazole and trimethoprim-sulfamethoxazole (Igbinosa and Okoh, 2012).
Jun et al. (2010) observed multi-resistance to amoxicillin/clavulanic acid, ampicillin,
chloramphenicol, tetracycline and trimethoprim-sulfamethoxazole in A. hydrophila isolated from
farmed Korean Misgurnus anguillicaudautus. Ornamental koi carp (Cyprinus carpio koi) and
common carp (Cyprinus carpio) from Czech Republic were observed to possess A. hydrophila,
A. sobria and A. veronii sub-species sobria exhibiting resistance to oxytetracycline,
ciprofloxacin, chloramphenicol, spectomycin, oxolinic, streptomycin, florfenicol and
trimethoprim (Čižek et al., 2010).
In Brazil ampicillin, cephalothin and cefazolin resistance was detected in clinical strains
of A. caviae, A. hydrophila, A. veronii bv sobria and Aeromonas spp. from humans with

7
diarrhoea (Surek et al., 2010). Obi et al. (2007) also detected multi-drug resistance in A. caviae,
A. hydrophila and A. sobria isolated from clinical samples in the Limpopo Province of South
Africa.
1.2.2 Mobile genetic elements associated with antimicrobial resistance in
Aeromonas spp.
Antimicrobial resistance genes are elements that encode resistance to antimicrobials and may be
passed on to members of the same species through vertical transfer or to different species of
bacteria through horizontal gene transfer via MGEs. Thus antibiotic resistance genes can be
transferred between bacteria in the environment through different MGEs, viz.; plasmids,
integrons and transposons (Akinbowale et al., 2007). Horizontal gene transfer often involves
plasmids, and in Aeromonas spp. antimicrobial resistance has been correlated with the possession
of plasmids and integrons (Palu et al., 2006; Ndi and Barton, 2011).
1.2.2.1 Plasmid-associated antimicrobial resistance in Aeromonas spp.
Plasmid-associated resistance genes have been found to encode for multidrug resistance in
bacteria including quinolone, aminoglycoside and trimethoprim-sulfamethoxazole resistance
(Samaha-Kfoury and Araj, 2003; Poole, 2004). Plasmids with varying molecular weights have
been reported in several strains of Aeromonas spp. High molecular weight plasmids are
responsible for multiple drug resistance in A. salmonicida (Sorum et al., 2003) and A. hydrophila
(Majumbar et al., 2006) and this resistance could be transferred along with the transfer of
plasmid (Sorum et al., 2003; Casas et al., 2005). In Brazil, human and food aeromonad isolates
have been shown to harbour plasmids (Palu et al., 2006), while a high prevalence of small (2.3
kb) plasmids has been observed in Malaysian retailed fish (Radu et al., 2003). These plasmids
offer the greatest source and route of dissemination of antimicrobial resistance genes and their
determinants such as integrons. A. caviae isolated in Brazil displayed resistance to tetracycline
which was associated with presence of a 15 kb plasmid (Palu et al., 2006). A. salmonicida
isolates possessing multi-resistance plasmids have been described globally (Najimi et al., 2008).
A broad-host range plasmid pRAS1, first isolated from an atypical A. salmonicida, encoded
phenotypic resistance to sulphonamides, trimethoprim, and tetracycline, which were determined
by sul1, dfr16 and tetA genes (L’Abee-Lund and Sorum, 2001; Balassiano et al., 2007).
McIntosh et al. (2008) reported the occurrence of A. salmonicida harbouring a large transferable

8
IncA/C plasmid, and nucleotide sequence analysis revealed that the genes encoding the
resistance phenotypes were organized into three separate resistance cassettes. These cassettes
were a class I integron containing an aadA7 gene encoding for an aminoglycoside-3′-
adenyltransferase, a cassette with 99% nucleotide sequence homology to a cassette previously
identified in the Salmonella enterica IncA/C plasmid pSN254, containing floR, tetA, sulII and
strA/strB sequences and a third cassette showed 100% nucleotide sequence similarity to a
transposon-like element, containing a blaCMY-2 β-lactamase in association with sugE and blc
sequences.
Figure 1.2: General organization of an integron and gene cassette (GC) recombination mechanism. TheIntI1protein catalyzes the insertion (A) and excision (B) of the GC in the integron, with GC integration occurring at the attI recombination site. In example (A), the circularized GC3 is integrated in linear form inside the integron platform via a specific recombination mechanism between the attI site and the attC3 site of the GC3. GC excision preferentially occurs between two attC sites. In example (B), the GC1 is excised following there combination between the two attC1 and attC3 sites. Pc: gene cassette promoter; attI: integron recombination site; attC1, attC2, and attC3: attC GC recombination sites; intI: the integrase gene; GC1, GC2, GC3 are the gene cassettes, and arrows indicate the direction of coding sequences (Stalder et al., 2012).
1.2.2.2 Integron-associated antimicrobial resistance in Aeromonas spp.
Integrons are defined as genetic elements that play a key role in the dissemination of resistance
determinants in the environment (Stalder et al., 2012). They do this through encoding a site-

9
specific recombination system that recognises and captures mobile genetic cassettes (Ma et al.,
2011). The integron structure consists of a functional platform (Fig. 1.2) viz.; 5’conserved
segments (CS) and 3’CS, an intI gene encoding an integrase protein, a specific recombination
site attI, and a promoter, Pc (Stalder et al., 2012). Gene cassettes are non-replicable mobile
elements which consist of a 59-base element known as the attC recombination site and an open
reading frame (orf) but lacking a promoter (Chang et al., 2007; Stalder et al., 2012). The gene
cassettes are usually located between the 5’CS and 3’CS (Fig. 1.2) within the functional platform
and they consist of one or more antimicrobial resistance genes which leads to the multi-drug
resistance that integrons confer to bacteria (Ma et al., 2011; Lupo et al., 2013). There are over
130 known gene cassettes and most encode antimicrobial resistance (Stalder et al., 2012).
Although not mobile, integrons are often associated with MGEs such as plasmids and
transposons that disseminate them in the environment and among bacteria (Ma et al., 2011; Ndi
and Barton, 2011).
There are five different classes of mobile integrons currently from classes 1 to class 5,
with the class 1 integrons being more prevalent than other classes (Ma et al., 2011; Stalder et al.,
2012). Class 1 integrons are ubiquitous elements occurring naturally in aquatic and land
environments, and are the most widely distributed among Gram-negative bacteria (Chang et al.,
2007; Stalder et al., 2012). They have been associated with the evolution and spread of
antimicrobial resistance in clinical Gram-negative bacteria (Chang et al., 2007; Lupo et al.,
2012). The classic structure of class 1 integrons includes the intI gene, the attI integration site,
the common promoter in the 5’CS and the qacEΔ1 and sulI genes in the 3’CS region conferring
resistance to quaternary ammonium compounds and sulphonamides, respectively (Chang et al.,
2007). Clinical isolates containing class 1 integrons are usually similar in gene cassette content
and structure, while those found in environmental isolates are usually varied in terms of gene
cassettes and structure (Stalder et al., 2012). Class 1 integrons are associated with the Tn402-
transposons and it has been established that they originated from environmental bacterial
communities (Lupo et al., 2012).
Class 2 integrons are less prevalent than the class 1 integrons and also have low incidence
in aquatic environments (Stalder et al., 2012). Their basic structure is truncated, as the intII gene
has a stop codon which means that the class 2 integrons lacks the 5’CS and 3’CS regions (Stalder
et al., 2012). However, their gene cassette area is more stable than the class 1 integrons and
usually consists of dfrΔ1, aadA1, sat2 and an unknown orfx. Their presence may lead to

10
trimethoprim, spectinomycin, streptomycin and streptothricin resistances in bacteria that carry
them. They are associated with Tn7 transposons, which ensure their dissemination (Stalder et al.,
2012).
Class 3 integrons are suggested to be involved in the dissemination of antibiotic
resistance in both clinical and environmental settings and also participating in exchange of
antibiotic resistance gene cassettes (GC) between these two ecosystems (Stalder et al., 2012).
This class of integrons are abundant in aquatic environments, and are usually resistance integrons
(Stalder et al., 2012). In literature only five classes of integrons have been characterised; the
first was detected in a clinical sample, the second was identified in an Enterobacteriaceae strain,
the third and the fourth were both detected in environmental Delftia strains and the fifth was
detected in an Enterobacter cloacae isolate from a hospital effluent (Stalder et al., 2012). In
South Africa Jacobs and Chenia (2007) detected the presence of intI3 gene in an A. veronii
biovar sobria isolate from aquaculture systems. Wen et al. (2012) also detected the presence of
the intI3 gene in Flexneri spp. clinical isolates. Class 3 integrons are characterised as frequently
as class 1 integrons, however when identified, it mediates IMP-1 Metallo-Beta-lactamase
(Stalder et al., 2012).
Class 4 integrons are called super integrons as they contain hundreds of gene cassettes
that encode antimicrobial resistance and adaptations (Stalder et al., 2012). The presence of class
4 integrons in bacterial chromosomes has been traced back to pre-antibiotics times and in recent
years intISXT has been characterized among Vibrionaceae and Pseudomonas spp. (Stalder et al.,
2012). Class 5 integrons are rarely characterised, and in literature the intIHS has only been
detected once in a Vibrio spp. (Stalder et al., 2012)
In Aeromonas spp., class 1 integrons are most prevalent (Chang et al., 2007; Lee et al.,
2008; Sarria-Guzmàn et al., 2013) although class 2 have been detected in members of this genus
from different geographical regions (Jacobs and Chenia, 2007; Carvalho et al., 2012; Maravic et
al., 2013). Chang et al. (2007) observed that many Aeromonas spp. that were integron-positive
were multi-drug resistant to three or more commonly used antimicrobial agents. Sarria-Guzmàn
et al. (2013) detected the presence of class 1 integrons in A. caviae, A. hydrophila, A. veronii, A.
media, A. salmonicida, A. sobria, A. punctata and A. allosaccharophila isolated from
commercialised fresh fish in Mexico with antimicrobial gene arrays of aadA2, aadA5, dhfrA17,
dhfrA1, oxa2, blaOXA-10 and catB3 conferring resistance to adenylyl transferase, dihydrofolate
reductases, beta-lactamase, oxacillinase and chloramphenicol, respectively. In Portugal,

11
Carvalho et al. (2012) detected the presence of both class 1 and 2 integrons from raw water, both
with similar antimicrobial resistance gene arrays, viz.; aadA1, aadA2, dhfrA12, dhfrA1, sat2,
catB8. Jacobs and Chenia (2007) observed that Aeromonas spp. isolates from tilapia, trout and
koi aquaculture systems in South Africa harboured class 1 integrons with gene cassettes
ant(3’’)Ia, aac(6’)Ia, dhfr1, oxa2a and/or pse1. Lee et al. (2008) observed that dhfrA1 and
aadA2 were the most common integron-associated genes encountered in clinical isolates of A.
caviae, A. hydrophila, A. veronii, and A. sobria in Taiwan. The most commonly found genes
among class 1 integrons are the aadA genes (Chang et al., 2007; Sarria-Guzmàn et al., 2013),
which accounts for the prevalent aminoglycoside resistance observed among Aeromonas spp.
isolates. In a study of the occurrence and diversity of integrons and β - lactamase genes among
ampicillin-resistant isolates from estuarine waters, Henriques et al. (2006) detected the presence
of blaTEM, blaSHV, blaCphA and blaOXA-B in Aeromonas strains.
1.2.3 Beta-lactam resistance in Aeromonas spp.
Bacterial resistance to β-lactams by the expression of β-lactamases is one of the most common
mechanisms of resistance in bacteria. Antimicrobial resistance in Aeromonas species is usually
chromosomally mediated, but β-lactamase production by Aeromonas may occasionally be
encoded by plasmids or integrons (Aravena-Romàn et al., 2011). The β-lactamase genes and the
enzymes they encode continuously undergo mutations as a strategy to beat the diversity of β-
lactams in use (Samaha-Kfoury and Araj, 2003). These continuous mutations are due to heavy
antimicrobial agent use which has led to the emergence of extended spectrum β-lactamase
enzymes (Samaha-Kfoury and Araj, 2003; Poole, 2004).
Aeromonas spp. isolates are resistant to many β-lactams as a result of multiple inducible,
chromosomally-encoded β-lactamases which are under a single mechanism of coordinate
expression (Goni-Urriza et al., 2000). These organisms are able to produce three different β–
lactamases including group 1 molecular class C cephalosporinase, a group 2d molecular class D
penicillinase and a group 3 molecular class B metallo-β–lactamases (Fosse et al., 2003; Talavera
et al., 2006; Libisch et al., 2008). Different strains of β–lactamase producing Aeromonas spp.
have been grouped into five major classes viz.; A. hydrophila complex strains expressing class B,
C and D β-lactamases, A. caviae strains expressing class C and D β-lactamases, A. veronii group
strains containing class B and D β-lactamases, A. schubertii strains harbouring class D β-
lactamases, and A. trota strains with class C β-lactamases. Aeromonas spp. are among the few

12
microorganisms harbouring different chromosomal β–lactamase genes including cphA, cepH,
and ampH, encoding for classes B, C and D β-lactamases (Carminato et al., 2007).
1.2.3.1 Penicillin resistance in Aeromonas spp.
In aeromonads, resistance to penicillins are encoded for by blaTEM native genes, which express
class D penicillinases (Balsalobre et al., 2010). In China, Deng et al. (2014) observed the
presence of blaTEM gene in A. hydrophila isolated from cultured fresh water fish. The intrinsic
occurrence of blaTEM genes in Aeromonas spp. from aquatic environments (Carminato et al.,
2010) points to the possibility of the aquatic environment being the reservoir of these β–
lactamase genes (Henriques et al., 2006; Hernould et al., 2008). The blaTEM family β–lactamases
are plasmid-mediated and common among environmental Gram-negative bacteria, particularly
Aeromonas spp. This Bush group 2d penicillinase of β–lactamases confers resistance to narrow
and broad spectrum penicillin resistance penicillin and ampicillin (Janda and Abbott, 2010). The
blaTEM genes are contained in ampicillin resistance transposons (TnA), and are associated with
the prevalent Tn1, Tn2 and Tn3 transposons (Tristram et al., 2005; Tristram et al., 2012).
TEM-I β-lactamases have been noted to be the progenitor of TEM-type extended β-
lactamases (ESBL) due to diverse point mutations in the blaTEM-I gene (Tristram et al., 2005).
Single base mutations are responsible for amino acid substitutions such as glutamate to serine at
position 104, arginine to serine or histidine at position 164, glycine to serine at position 238 and
glutamate to lysine at position 240 which produces the ESBL phenotype in TEM-type genes
(Chroma and Kolar, 2010). These diverse point mutations in the TEM β–lactamases genes has
given rise to enzymes with extended activity against first, second and third generation
cephalosporins in addition to penicillins.
1.2.3.2 Extended spectrum beta–lactam resistance in Aeromonas spp.
The production of extended spectrum β–lactamase (ESBL) genes in Aeromonas species has been
reported (Marchandin et al., 2003; Fosse et al., 2004; Picào et al., 2008; Lu et al., 2010; Girlich
et al., 2011). ESBLs belong to the class A β–lactamases and confer resistance to penicillins,
aztreonam and first, second and third-generation cephalosporins but are susceptible to
clavulanate and tazobactams (Chikwendu et al., 2011; Chen et al., 2012). Environmental isolates
of A. media and A. hydrophila harbouring ESBLs genes has been described (Picào et al., 2008;
Lu et al., 2010; Girlich et al., 2011) and A. allosaccharophila, a non-clinical important species,

13
was observed to harbour the PER-6 extended spectrum gene (Girlich et al., 2010). Even though
production of ESBLs is not an intrinsic feature of aeromonads (Janda and Abbott, 2010), studies
suggest that environmental Aeromonas spp. could be important reservoirs for ESBL
dissemination (Girlich et al., 2010; Carminato et al., 2010).
In recent years ESBLs derived from the TEM and SHV families are gradually being
replaced by the blaCTX-M. The CTX-M enzymes are class A β–lactamases that are able to
hydrolyse cefotaxime more than ceftazidime (Chen et al., 2012). The genus Kluyvera has been
identified as the reservoir of these blaCTX-M genes and is known to contain the progenitor of these
ESBLs in their chromosome (Lupo et al., 2011). Kluyvera spp. are known environmental
bacteria, hence the reason why these blaCTX-M genes are increasingly described from
environmental and aquatic isolates (Lupo et al., 2011). The blaCTX-M genes are classified into five
groups based on aminoacid homology viz.; blaCTX-M-1 blaCTX-M-2 blaCTX-M-8 blaCTX-M-9 and blaCTX-
M-25. The blaCTX-M-15 gene is the most disseminated ESBLs among Gram-negative bacteria and
have also been detected in fish pathogenic Aeromonas spp. (Ye et al., 2010; Gomez-Garces et
al., 2011). Gõmez-garcés detected the presence of blaCTX-M-15 in a clinical isolate of A.
hydrophila in Spain and in China clinical isolates of A. caviae was observed to be a CTX-M-3
producer (Ye et al., 2010). In Croatia Maravic et al. (2013) detected the presence of blaCTX-M-15
gene in aquatic isolates of A. caviae and A. hydrophila. In Aeromonas spp. these ESBLs are
usually acquired through horizontal gene transfer mediated by MGEs (Chen et al., 2012). The
transferability of these extended spectrum β–lactamases genes via horizontal gene transfer is of
public health importance (Ye et al., 2010; Gomez-Garces et al., 2011). Therefore, the prevalence
of these ESBL genes amongst aquatic aeromonads suggests that Aeromonas spp. are possible
agents of dissemination of β–lactamases and ESBLs (Girlich et al., 2011).
1.2.3.3 Metallo-beta–lactam resistance in Aeromonas spp.
Under selective pressure of certain antimicrobials, emergence of β–lactamase over-expressing
carbapenem resistant Aeromonas spp. has been observed (Libisch et al., 2008). These
carbapenemases are metallo-β–lactamases (MBL), and are located chromosomally in
aeromonads (Sànchez-Cespedes et al., 2009; Chen et al., 2012). They hydrolyze oxyimino-
cephalosporins, cephamycins, carbapenems and monobactams to a lesser extent. They are not
readily inhibited by clavulanate acids (Sànchez-Cespedes et al., 2009). Amongst Aeromonas
spp., the CphA is the most widely described MBL (Chen et al., 2012). The CphA

14
carbapenemases have a relatively narrow substrate profile (Libisch et al., 2008) and contain a
zinc ion in its active site (Libisch et al., 2008). The prevalence of CphA in Aeromonas spp. is
species-specific (Chen et al., 2012). Aquatic isolates of A. veronii and A. caviae were observed
to harbour CphA (Rossolini et al., 1995). Balsalobre et al. (2009) detected the presence of CphA
in aquatic environment isolates of A. jandaei and A. hydrophila. Ornamental fish isolates of A.
aquariorum have been found to carry these CphA MBLs (Martinez-Murcia et al., 2008).
Although they carry chromosomal Aeromonas MBLs, wild type isolates are categorized as being
susceptible to carbapenems (Neuwirth et al., 2007; Libisch et al., 2008), but on exposure to
certain β–lactamases inhibitors will over-express carbapenemases due to selective pressures
(Libisch et al., 2008; Balsalobre et al., 2009; Sànchez-Cespedes et al., 2009).
Another MBL that is 98% identical to the CphA β–lactamase in terms of amino acid
content is the ImiS β–lactamase (Wu et al., 2012). It has been detected in clinical isolates of A.
veronii biovar sobria. This has been correlated to imipenem resistance in clinical isolates of
Aeromonas spp. (Tsai et al., 2006) and it also confers resistance to meropenem but susceptibility
to other β–lactam (Sànchez-Cespedes et al., 2009).
Some MBLs have been found to be associated with integrons. Neuwirth et al. (2007) and
Libisch et al. (2008) observed that blaIMP-19 and blaVIM-4, respectively, were borne-on integrons.
In addition to the three groups of β–lactamases that Aeromonas spp. possess and confer as
resistance to β – lactams, efflux pumps are also involved in the mode of resistance to β – lactam
antimicrobials (Henriques et al., 2006).
1.3 Bacterial biofilm development
Bacterial biofilms are communities of microorganisms that form and grow attached to surfaces,
encased in an exopolysaccharide matrix (Kostakioti et al., 2013). Biofilms may comprise of
single or multiple species colony, such as dental plaque biofilms (Kreth et al., 2008). Bacteria
possess the ability to form biofilms on many surfaces (Kostakioti et al., 2013). Tthis increases
the detrimental effects of these microbial communities in the medical and industrial settings that
they occur in (Lopez, 2010). For example in food industries, they contribute to biofouling and
normal sanitary procedures are no longer sufficient in eradicating these sessile communities
(Simoes, 2010). In medical settings biofilms can form in hospital hot water systems, dental unit
water lines and domestic shower heads can act as a source of infection in immune compromised
patients (Jacques et al., 2010).

15
Biofilm formation is a bacterial survival response to adverse environmental changes,
which consists of five basic stages. The first stage is the initial attachment, here bacteria respond
to nutrient composition and utilizes flagella or chemotaxis in order to overcome surface repelling
hydrodynamic (Lopez et al., 2010; Kostakioti et al., 2013). However this stage is reversible
owing to sheer surface forces that can slough bacteria off desired niches, various surface
properties, nutrient levels, ionic compositions and temperature (Kostakioti et al., 2013).
Adherence to attached surface follows, usually through secreted adhesins or adhesive
appendages such as pilli, curli, fimbriae and antigen 43 (Kostakioti et al., 2013). Successive
adherence leads to the irreversible attachment of bacteria and sessile growth of cells along with
exopolysaccharide (EPS) construction by resident cells can begin. As cells actively multiply and
exchange genetic material such as resistance genes, there is up-regulation of biofilm phenotype
factors that encourage sessility and stabilize biofilms (Fuente-Nunez et al., 2012; Kostakioti et
al., 2013). The mature biofilm community is characterised by different gradients of nutrients,
oxygen and toxic by-products, as a result of active and dead cells within sessile community.
Inevitably biofilm dispersal follows as a natural end of sessile community. This dispersal can be
passive as a result of environment stress or exogenous dispersal inducing compounds. Dispersal
can also be active and initiated by resident cells due to environmental cues viz.; nutrient
availability, oxygen fluctuations, increased toxic products and stress induced conditions (Fuente-
Nunez et al., 2012). Cells within biofilms have been found to be resistant to adverse
environmental effects, ultraviolet damage, metal toxicity, anaerobic conditions, acid exposure,
salinity, pH gradients, desiccations, bacteriophages and a host of other hostilities (Fuente-Nunez
et al., 2012).
1.3.1 Role of biofilms in antimicrobial resistance
Antimicrobial resistance in biofilms is suggested to be a combination of various mechanisms
(Drenkard, 2003). Bacteria existing in biofilms are 1000-fold more resistant to treatment with
antimicrobials than planktonic cells (Fuente-Núńez et al., 2013). This is because the resistance
mechanisms within a biofilm differ from resistance mechanisms present in planktonic cells
(Drenkard, 2003; Simoes et al., 2010). Biofilm bacteria express sets of genes that differ from
planktonic bacteria, including specific antimicrobial resistance genes that are activated as part of
the unique biofilm phenotype (Mah and O’Toole, 2001; Drenkard, 2003; Simoes et al., 2010).

16
The various mechanisms of biofilm resistance (Fig. 1.3) are dependent on the species of
bacteria in question and antimicrobial in use (Mah and O’Toole, 2001; Fuente-Nunez et al.,
2013). There are also general mechanisms that include the structure and composition of the
biofilm (Simoes et al., 2010; Fuente-Nunez et al., 2013). The exopolysaccharide (EPS) matrix of
the biofilm consists of polysaccharides, proteins and extracellular DNA (eDNA), and it has been
shown to be a protective barrier against exogenous stress, host immune phagocytosis and
antimicrobial substance (Kostakioti et al., 2013). In addition to the EPS, the heterogeneous
population of biofilms with bacteria at different growth states also play a part in the resistance of
biofilm bacteria to certain antimicrobials (Fuente-Nunez et al., 2013). Exogenous stresses such
as starvation, anaerobic conditions, sub-inhibitory concentrations of antimicrobials and heat
shock have been suggested to activate adaptive resistances in bacteria within a biofilm (Fuente-
Nunez et al., 2013).
Figure 1.3: Proposed-biofilm associated resistance mechanisms: (1) Antimicrobial agents may fail to penetrate beyond the surface layers of the biofilm. Outer layers of biofilm cells absorb damage. Antimicrobial agents action may be impaired in areas of waste accumulation or altered environment (pH, pCO2, pO2, etc). (2) Antimicrobial agents may be trapped and destroyed by enzymes in the biofilm matrix. (3) Altered growth rate inside the biofilm. Antimicrobial agents may not be active against nongrowing microorganisms (persister cells). (4) Expression of biofilm-specific resistance genes (e.g., efflux pumps). (5) Stress response to hostile environmental conditions (Del Pozo and Patel, 2007).
Other mechanisms include varying physiological gradients of oxygen and nutrients and
several biofilm specific phenotypes such as activation of certain efflux pumps, activity of
perisplasmic glucans and persister cells (Drenkard, 2003; Lewis, 2005; Fuente-Nunez et al.,

17
2013). Persister cells are non-dividing biofilm bacteria that express toxin-antitoxins that block
antimicrobials targets (Lewis, 2005). These cells have been suggested to be bacteria that tolerant
to antimicrobials and are there to insure the propagation of cell species (Lopez, 2010).
1.3.2 Biofilm formation by Aeromonas spp.
Aeromonas spp. are strongly inclined to form colonies on surfaces known as biofilms (Medino-
Martinez et al., 2006; Khajanchi et al., 2009; Ponnusamy et al., 2009; Santos et al., 2010). They
are able to efficiently colonize various surfaces like contact lenses, glass, stainless steel and
micro-titre plates (Merino et al., 2001; Lynch et al., 2002; Gavin et al., 2002; Bechet and
Blondeau, 2003; Asha et al., 2004). Biofilm-forming A. hydrophila was identified on
commercialised green-leafy vegetables in Saudi Arabia (Elhariry, 2011). Aeromonads are an
important constituent of bacterial biofilms in water distribution systems or food processing for
environmental strains, and in the gastrointestinal tract for clinical strains (Scoaris et al., 2007).
Aeromonas spp. are known to possess a polar unsheathed monotrichous flagellum (fla) expressed
for the swimming ability in liquid environments and inducible lateral flagella (laf) expressed for
swarming motility on solid media. This phenomenon is associated with expansion of area of
colonization, biomass production and biofilm formation (Kirov et al., 2002; Gavin et al., 2003).
Aeromonad efficacy in micro-colony development has been attributed to hyperpiliation of
Aeromonas spp. strains through the presence of type IV pilli and to the cell surface
hydrophobicity, which would promote auto-aggregation of bacterial cells (Bechet and Blondeau,
2003). As biofilm formation is a feature of persistent infections and characterize up to 30% of
Aeromonas gastroenteric infections, it is important to understand the mechanisms of
antimicrobial resistance within aeromonad biofilms with a view to develop alternatives in the
treatment of Aeromonas infections both in humans and animals.
1.3.3 Control of biofilms
The control of biofilms targets the different stages of biofilm development (Fig 1.4) (Simoes et
al., 2010; Fuente-Núńez et al., 2013). The initial biofilm formation stage known as adhesion
phase, has been explored as a strategy to prevent biofilm development. Several compounds such
as polysaccharides secreted by mature biofilms, human and animal antimicrobial peptides,
glycoside hydrolase, compounds that inhibit pili and curli syntheses and lyse mature biofilms
have been explored (Fuente-Núńez et al., 2013). The use of substances that are able to cause

18
biofilm self-destruction is a factor that can be explored in seeking strategies to eradicate biofilm
because most biofilm e.g., Pseudomonas fluoresens lyse their exopolysaccharides, liberating
cells within the biofilms on oxygen and substrate depletion (Drenkard, 2003). Lytic phages that
lyse bacteria cells have also been explored in controlling biofilms at microcolony formation and
mature stages. Chelating agents such as sodium citrate and the use of silver nanoparticles have
been observed to be effective at controlling bacteria at microcolony formation and mature stages
as well (Kostakioti et al., 2013). The dispersal of mature biofilms by the use of enzymes such as
DNAse 1, D-amino acids, polyamine norspermidine, nitric acid and dispersin have all been
explored in the search for effective and efficient methods of controlling biofilms (Defoirdt et al.,
2003; Fuente-Núńez et al., 2013). Kaplan et al. (2005) observed that Actinobacillus
actinomycetemcomitans produces a soluble glycoside hydrolase called dispersin B, which
degrades polysaccharide intercellular adhesins. Eradication of persister cells phenotype using a
synergy of biofilm dispersal compounds and conventional antimicrobials may be effective
therapy for biofilm-associated infections (Lewis, 2001). The engineering of universal signaling
molecule 3, 5 cyclic diguanylic acid (c-di-GMP). Deactivation of cell-to-cell communication
known as quorum sensing has been explored as a means of inhibiting biofilm development
(Lynch et al., 2002; Fuente-Núńez et al., 2013). The uses of quorum-quenching enzymes and
inhibitors have been identified as a possible strategy in biofilm dismantling (Dong et al., 2005).
Phytochemicals have also been established to interfere with the signalling pathways of certain
Gram-negative bacteria (Husain et al., 2013).

19
Figure 1.4: Schematic outlining of the stages in biofilm development and listing the strategies aimed at inhibiting and/or disrupting biofilm formation at specific stages (Kostakioti et al., 2013).
1.3.3.1 The use of phytochemicals in biofilm control
Phytochemicals are defined as bioactive, non-nutrient plant compounds found in fruits,
vegetable, grains and other plant products (Doughari et al., 2009). They are also known as
constitutive secondary metabolites that enable plants to overcome temporary or continuous
threats integral to their environment, while also controlling essential functions of growth and
reproduction (Molyneux et al., 2007). Medicinal plants have always been used successfully and
approximately 80% of the world’s population still rely on them as primary health care. The
optimal effectiveness of a medicinal plant may not be due to one main bioactive component, but
a concerted action of all the secondary metabolites within the plant (Senthilkumar et al., 2005).
The use of plant antimicrobials has many advantages, including the lack of deleterious side
effects compared to synthetic antimicrobials, their vast therapeutic potential. There are thousands
of phytochemicals that have been discovered and they are grouped according to function and
source. Four different groups of phytochemicals exist, including flavonoids and flavones,
quinones, tannins and phenols and phenolic acids (Cowan, 1999). The antibacterial active
components of plants may lyse the cell wall, block protein synthesis and DNA synthesis, inhibit
enzyme secretions and/or interfere with the signaling mechanisms of the quorum sensing
pathway (Chakraborty and Hancz, 2011).

20
1.3.3.2 Antimicrobial potential of phytochemicals
Phytochemical compounds present in plant extracts have been in use for the treatment of
ailments of bacterial and fungal origins (de Britto et al., 2011; de Britto et al., 2012a, b;
Dhayanithi et al., 2012). Cinnamaldehyde is a phytochemical belonging to phenol class and has
been shown to have antibacterial activity against Gram-negative and Gram-positive bacteria,
e.g., Staphylococcus aureus, Clostridium botulinum, Escherichia coli O157:H7, Salmonella.
typhimurium and Vibrio species (Brackman et al., 2008; Jia et al., 2011). This is attributed to its
hydrophobicity, which enables it to enter and disturb the lipid bilayer of the cell membrane and
cause increased permeability to protons. Nascimento et al. (2000) observed that plant extracts of
P. granatum, Syzygyum joabolanum (jambolan) and Carophyllus aromatus (clove) exhibited
inhibitory properties against antimicrobial resistant strains of Pseudomonas aeruginosa and other
resistant bacteria tested. Methanolic extracts of five green vegetables (Coriandrum sativum,
Lactuca sativa, Menthe pierita, Portulaca oleracea and Raphanus sativus) were assessed for
their antibacterial activities and all were observed to possess inhibitory properties against clinical
strains of Staphylococcus aureus, Streptococcus pyogenes, Escherichia coli, Bacillus subtilis and
Pseudomonas aeruginosa (Bhat and Al-Daihan, 2014).
The antibacterial activity of several phytochemicals has been explored using Aeromonas
spp. as models (Siri et al., 2008; Dhayanithi et al., 2012; de Britto et al., 2012a, b). Methanolic
extracts of leaves, stem, flowers and fruits of Murraya koenigii (L) were observed to be
antibacterial against A. hydrophila (de Britto et al., 2012b). Siri et al. (2008) demonstrated that
Punica granatum aqueous extract exhibited antibacterial activity against A. caviae. Methanol
extracts of Phyllanthus amarus, P. emblica, Cassia auriculata, Acalypha indica, Aerva lanata
and Caesalpinia pulcherrima was observed to have antibacterial activity against A. hydrophila
(de Britto et al., 2012a). Aeromonas hydrophila isolated from ornamental fish was inhibited by
Excoecaria agallocha leaves (Dhayanithi et al., 2012). Crude aqueous extracts of the stem barks
and fruits of K. africana displayed antimicrobial activity against Gram-negative and Gram-
positive bacteria (Grace et al., 2002; Eldeen and Staden, 2008; Saini et al., 2009). Ethanol
extracts of the stem bark and fruits of K. africana displayed inhibitory activity against S. aureus
and P. aeruginosa (Saini et al., 2009). Water-and-ethanol extracts of P. granatum were observed
to contain phenolic, sterols, proanthocyanidins and flavonoid compounds which contribute to its

21
antibacterial activity against Gram-negative bacteria (Siri et al., 2008). Allicin a major
component of garlic was observed to be bactericidal against A. hydrophila (Nya et al., 2010).
1.3.3.3 Anti-biofilm potential of phytochemicals
Phytochemicals have also been studied for their anti-biofilm and anti-fouling properties
(Ponnusamy et al., 2010). The control of biofouling does not entail limiting bacterial growth but
to block the expression of biofilm-forming phenotypes (Lade et al., 2014). Reduction in biofilm
formation of A. hydrophila and Pseudomonas aeruginosa was observed on treatment with clove
oil (Husain et al., 2013). Similarly, Millezi et al. (2012) reported an interference with biofilm
development of A. hydrophila on stainless steel on application of essential oils of thyme and
lemon grass. Majtan et al. (2014) observed the reduction in biofilm formation and complete
biofilm detachment of Enterobacter cloacae and Proteus mirabilis at sub-inhibitory and
inhibitory concentrations, respectively. Trans-cinnamaldehyde was observed to control biofilms
of uropathogenic E. coli on polystyrene plates and urinary catheters at 0.1 to 1.5% concentrations
(Amalaradjou et al., 2010). Jia et al. (2011) demonstrated that cinnamaldehyde detached and
eradicated all methicillin resistant Staphylococcus aureus (MRSA) at 5× MIC and MBCs
(0.0625 – 0.5% v/v). Vanillin was effective against A. hydrophila biofilm formation in a water
purification system at 0.16 mg/ml concentration (Ponnusamy et al., 2014). Plyuta et al. (2013)
showed vanillin enhanced biofilm production of Pseudomonas spp. at concentrations ranging
from 40 to 400 µg/ml but inhibited biofilms at higher concentrations.
1.4 Rationale for study
Aquaculture is one of the fastest growing food producing industries and worldwide this sector
has increased at an average of 9.2% per year since 1970 (FAO, 2002). Disease outbreaks in
aquaculture have been reported to cause significant constraints in the growth of this sector, with
losses of billions of dollars worldwide. Aeromonas has been highlighted as one of the primary,
opportunistic microorganisms plaguing this industry causing 100% losses in some cases
(Defoirdt et al., 2004). The increasing incidence of antimicrobial resistance and adverse drug
side effects has created an opportunity for the revival of phytomedicine and many plants are
being investigated for their pharmacological activities against diverse disease conditions
(McGaw et al., 2008).

22
There is growing concern worldwide due to the increasing incidence of antimicrobial
resistance and dissemination of antimicrobial resistance genes amongst pathogenic and non-
pathogenic bacteria in varying environments. The dissemination of resistance determinants by
horizontal gene transfer is responsible for antimicrobial resistance in Aeromonas spp. and this is
facilitated by MGEs. Members of this genus play a major role as a reservoir and vector of
antimicrobial resistance determinants (Goni-Urriza et al., 2000; Radu et al., 2003; Palu et al.
2006; Jun et al., 2010). Foods, especially fish and water, remain the important vectors of these
infectious pathogens. Antimicrobial resistance determinants in aquaculture ecosystems may be
transmitted to human pathogenic bacteria, via fish and fish products, and this can lead to serious
public health issues (Jun et al., 2010). The danger of antimicrobial resistance in aquaculture is
treatment failure, which is very expensive and may result in complete loss of fish stocks. It is,
therefore, important to identify selected antimicrobial resistance genes found in Aeromonas spp.
This will lead to an exploration of prophylactic and treatment alternatives by investigating the
antimicrobial and anti-biofilm effects of phytochemicals on aeromonads isolated from
aquaculture and aquatic environments.
1.5 Objectives
The following objectives have been established:
1.5.1 To determine the prevalence and diversity of β – lactam, extended spectrum β –
lactam and integron-associated resistance genes associated with multi-drug
resistance in Aeromonas spp. isolates;
1.5.2 To investigate the antimicrobial effects of selected phytochemicals on Aeromonas
spp. isolates; and
1.5.3 To investigate the effect of these phytochemicals on aeromonad biofilm
formation.
1.6 Aims
The following aims will be pursued:
1.6.1 To isolate genomic DNA of Aeromonas spp. isolates, using the CTAB-NaCl
protocol;
1.6.2 To amplify β-lactam, and extended spectrum β-lactam resistance gene
determinants by PCR;

23
1.6.3 To identify integron platform structures by PCR;
1.6.4 To determine the susceptibility of Aeromonas spp. isolates to cinnamaldehyde,
vanillin and K. africana extracts using the disk diffusion method, and
1.6.5 To determine the effect of cinnamaldehyde, vanillin and K. africana extracts on
biofilm formation of A. bestiarum isolates using micro-titre plate assays.

24
CHAPTER TWO
CHARACTERIZATION OF BETA-LACTAMASE RESISTANCE GENE OF Aeromonas
spp. ISOLATED FROM FISH AND AQUATIC SOURCES
2.1 Introduction
Aeromonas spp. are aquatic, Gram-negative microorganisms that are food and ornamental fish
pathogens and are emerging as human pathogens worldwide (Lamy et al., 2009; Verner-Jeffreys
et al., 2009; Janda and Abbott, 2010). Antimicrobial resistance amongst this genus is
increasingly being described (Janda and Abbott, 2010; Figueira et al., 2011; Carvalho et al.,
2012). This resistance poses therapeutic challenge for infections caused by aeromonads and is a
potential public health risk (Chen et al., 2012). Aeromonas spp. are known to be resistant to
penicillins, cephalosporins and carbapenems due to chromosomal and inducible β-lactamases
(Chen et al., 2012). Aeromonads are known to produce various β-lactamases which confer
resistance to a broad-spectrum of β-lactams (Janda and Abbott, 2010).
Beta-lactams are commonly used antimicrobials in the treatment of human and animal
infections (Paterson and Bonomo, 2005). They are often used at sub-therapeutic doses in fish and
animal farming for the prevention of infectious diseases (Henriques et al., 2006). This has led to
the rise in production of resistance enzymes known as β-lactamases that hydrolyze β-lactam
antimicrobials (Henriques et al., 2006; Cabello et al., 2013). However, β-lactam resistant
bacteria have been detected in environments with no direct antimicrobial selection pressures
(Kűmmerer, 2009; Balsalobre et al., 2010; Chenia and Vietze, 2012; Marti et al., 2013). Beta-
lactamases of Gram-negative bacteria are the most important mechanism of resistance against β-
lactams (Henriques et al., 2006; De Luca et al., 2010), and their mode of action is hydrolysis of
the β-lactam ring (Hall et al., 2004).
In addition to the chromosomal β-lactamases, class A ESBLs have been detected in
aeromonads (Chen et al., 2012). In aeromonads, the majority of ESBLs belong to the TEM-,
SHV- and CTX-M-type enzymes (Chen et al., 2012). These ESBLs are usually borne on
integrons and MGEs such as plasmids and transposons (Chen et al., 2012). Although Aeromonas
spp. are intrinsically resistant to β-lactams (Chen et al., 2012), extra-chromosomal β-lactamases
have also been detected in this genus (Wu et al., 2011; Maravic et al., 2013). Maravic et al.
(2013) identified blaCTX-M-15, blaFOX-2 and blaSHV-1 genes on a conjugative plasmid (IncFIB-type)
from A. hydrophila and A. caviae isolates in Croatia. In Taiwan, the blaPER-3 gene was identified

25
in both chromosomal and plasmid DNA from A. hydrophila and A. caviae isolates (Wu et al.,
2011). Neuwirth et al. (2007) and Libisch et al. (2008) observed that blaIMP-19 and blaVIM-4,
respectively, were borne on class 1 integrons.
The earliest report of aeromonads carrying ESBLs was in a faecal A. caviae strain
harbouring blaTEM-24 (Marchandin et al., 2003). Since then environmental isolates harbouring
blaPER-1, blaPER-6, blaSHV-12, blaVEB-1a, and blaGES-7 have been described (Lu et al., 2010; Girlich et
al., 2011). Picào et al. (2008) detected the presence of blaPER-1 from a Swiss lake A. media
isolate, while blaTEM-24 and blaCTX-M-27 were identified in Aeromonas spp. from an urban river in
China (Lu et al., 2010). The ESBL blaSHV gene is responsible for penicillin and 2nd and 3rd
generation cephalosporin resistance (Rubtsova et al., 2010), and has been identified in
environmental Aeromonas spp. (Maravic et al., 2013). Although the CTX-M enzymes are the
most prevalent ESBLs, group 1 (CTX-M-15) is increasingly being described worldwide (Haque
et al., 2012). They hydrolyze ceftazidime efficiently, unlike the other groups of CTX-M
enzymes, viz., CTX-M-2, CTX-M-8, CTX-M-9 and CTX-M-25 (Naas et al., 2007). In Croatia,
Wu et al. (2011) identified blaCTX-M-15 in environmental isolates of A. hydrophila and A. caviae.
The most common metallo-β-lactamase (MBL) found in aeromonads is CphA. CphA has
a substrate-specific profile as it is only active on carbapenems and penems (Chen et al., 2012).
CphA has been described in A. hydrophila, A. veronii, A. jandaei and A. aquariorum (Martinez-
Murcia et al., 2008; Balsalobre et al., 2009). However, other MBLs have been detected in
various Aeromonas spp., such as ImiS in A. veronii biovar sobria isolates (Walsh et al., 1998)
and IMP-19 in a clinical A. caviae isolate in France (Neuwirth et al., 2007). A multi-resistant
strain of A. hydrophila isolated from a stool sample was observed to produce a VIM metallo-β-
lactamase (Libisch et al., 2008).
Characterization of β-lactamase genes in South Africa shows that TEM and SHV types
are predominant (Paterson and Bonomo, 2005; Meyer et al., 2007). Resistance phenotype of
Aeromonas spp. from catfish, tilapia, goldfish and seawater (Duma, 2012) shows resistance
profiles common in fish and aquatic environments (Jacobs and Chenia, 2007; Balsalobre et al.,
2010; Carvalho et al., 2012; Igbinosa et al., 2013; Marti et al., 2013; Ye et al., 2013). Duma
(2012) observed that these isolates were largely resistant to penicillins such as ampicillin (92.9%;
92/99) and amoxicillin (91.9%; 91/99) across all species tested. Resistance to 2nd and 3rd
generation cephalosporins (cefoxitin 9.1%; 9/99, cefuroxime 17.1%; 17/99 and cefpodoxime
20.2%; 20/99) was observed in Aeromonas spp., Aeromonas spp. 45, A. allosaccharophila, A.

26
bestiarum, A. caviae, A. culicicola, A. hydrophila, A. jandaei and A. veronii species. Although
MBL production was not observed, ESBL production was detected by double disc assay for
8.08% (8/99) of isolates. It was, therefore important to assess the β-lactamase and ESBL gene
content of these Aeromonas spp. study isolates and correlate gene presence with their resistance
phenotypes.
2.2 Materials and Methods
2.2.1 Maintenance of bacterial isolates
Ninety-three Aeromonas spp. and six Plesiomonas shigelloides isolates (Table 2.1), cultured
previously from moribund or healthy Cyprinus carpio (koi carp), Clarias gariepinus (catfish),
Oreochromis mossambicus (tilapia), and sea water (Duma, 2012), were selected for study as well
as two Aeromonas spp. type strains, viz. A. caviae ATCC 15468T and A. hydrophila ATCC
7966T. Aeromonas spp. isolates were previously characterized to species level using
biochemical and physiological tests and MALDI-ToF biotyping (Duma, 2012). Aeromonas spp.
isolates were maintained on tryptic soy agar (TSA) plates at 4 °C and for long-term storage in
tryptic soy broth (TSB) containing 40 % glycerol at -70 °C (Jacobs and Chenia, 2007).
Table 2.1: Antimicrobials resistance profiles displayed by Aeromonas spp. isolates obtained
from South African seawater and fish sources (Duma, 2012).
ISOLATES FISH SPECIES FISH HOST RESISTANCE PHENOTYPES* MI A. culicicola Catfish NA,OX,T M2 A. hydrophila Catfish AMP,AML,OX,W,RL M3 A. allosaccharophila Catfish AMP,AML,OX M4 A. jandaei Catfish AMP,AML,AMC,OX,W,RL M5 A. hydrophila Catfish AMP,AML,OX,W,RL M6 A. hydrophila Catfish AMP,AML,NA,OX,W M7 A. culicicola Catfish AMP,AML,E,OX,T,W,RL M8 A. allosaccharophila Tilapia AMP,AML,AMC,OX,T,W,RL M9 P. shigelloides Catfish OX M10 A. culicicola Catfish AMP,AML,CPD,OX,W,RL M11 Aeromonas spp. Catfish AMP,AML,AMC,E,OX,W M12 A. bestiarum Catfish AMP,AML,OX,W,RL M13 A. hydrophila Catfish AMP,AML,OX,W,RL M14 A. hydrophila Tilapia OX M15 Aeromonas spp. Tilapia AMP,AML,AMC,FOX,OX M16 A. jandaei Tilapia AMP,AMC,CPD,CXM,FOX,OX,W,RL M17 A. hydrophila Tilapia AMP,AML,OX,W,RL

27
M18 A. caviae Tilapia AMP,AML M19 A. jandaei Tilapia AMP,AML,AMC,FOX,OX,W,RL M20 Aeromonas spp. Tilapia AMP,AML,FOX,CPD,CXM,OX,W,RL,SXT M21 A. allosaccharophila Tilapia AMP,AML,AMC,FOX,CPD,CXM,OX,W,S M22 A. culicicola Sea water AMP,AML,OX,W,RL M23 A. culicicola Sea water AMP,AML,OX,RL M24 A. jandaei Sea water AMP,AML,OX,RL M25 A. culicicola Sea water AMP,AML,OX,RL M26 Aeromonas spp. 45 Sea water AMP,AML,OX,RL M27 Aeromonas spp. 45 Sea water AMP,E, OX, W, RL M28 A. jandaei Sea water AMP,AML,OX,RL M29 A. culicicola Sea water AMP,AML,OX,RL M30 A. jandaei Sea water AMP,AML,OX,RL M31 A. culicicola Sea water AMP,AML,OX,W,RL M32 A. culicicola Sea water AMP,AML,OX,RL M33 Aeromonas spp. 310 Sea water AMP,AML,ATM,NA,OX,W,RL M34 Aeromonas spp. 45 Sea water AMP,AML,OX,RL M35 A. culicicola Sea water AMP,AML,OX,RL M36 A. jandaei Sea water AMP,AML,E,OX,RL M37 Aeromonas spp. 45 Sea water AMP,AML,OX,T,W,RL M38 A. culicicola Sea water ATM,OX,RL M39 A. culicicola Sea water AMP,AML,OX,RL M40 A. culicicola Sea water AMP,AML,ATM,OX,RL M41 Aeromonas spp. Sea water AMP,AML,OX,RL M42 A. culicicola Tilapia AMP,AML,NA,OX,RL M43 Aeromonas spp. 310 Tilapia AMP,AML,NA,OX,RL M44 A. icthiosmia Tilapia AMP,AML,OX,RL M45 P. shigelloides Tilapia AMP,AML,AMC,OX,T,W,RL M46 P. shigelloides Tilapia AMP,AML,E,NA,OX,W,S,RL,SXT M47 P. shigelloides Tilapia AMP,AML,OX,W,RL M48 A. icthiosmia Tilapia AMP,AML,OX,W,RL M49 A. sobria Tilapia AMP,AML,AMC,OX,T M50 A. hydrophila Catfish AMP,AML,CXM,E,NA,OX,W,RL M51 A. hydrophila Catfish AMP,AML,AMC,OX,W,RL M52 A. hydrophila Tilapia AMP,AML,AMC,CPD,CXM,E,OX,T,W,RL M53 A. hydrophila Catfish AMP,AML,OX,T,W,RL M54 A. icthiosmia Tilapia AMP,AML,AMC,E,OX,T,W,RL M55 A. veronii Tilapia AMP,AML,OX,W,RL M56 A. culicicola Tilapia AMP,AML,E,NA,OX,W,RL M57 A. veronii Tilapia AMP,AML,AMC,CPD,CXM,C,E,OX,T,W,RL M58 A. culicicola Tilapia AMP,AML,AMC,OX,W,RL M59 A. caviae Tilapia AMP,AML,OX,T,W,RL M60 A. hydrophila Tilapia AMP,AML,AMC,E,OX,T,W,RL M61 A. culicicola Tilapia AMP,AML,OX

28
M62 A. hydrophila Tilapia AMP,AML,OX,RW,RL M63 A. veronii Tilapia AMP,AML,AMC,OX,W,RL M64 A. hydrophila Tilapia AMP,AML,CPD,FOX,OX,W,RL M65 A. hydrophila Tilapia AMP,AML,OX,W,RL M66 P. shigelloides Tilapia AMP,AML,OX,RL M67 P. shigelloides Tilapia AMP,AML,OX,W,RL M68 A. caviae Koi carp AMP,AML,AMC,CPD,OX,W,RL M69 A. bestiarum Koi carp AMP,AML,AMC,CPD,OX,W,S,RL M70 A. bestiarum Koi carp AMP,AML,AMC,CPD,OX,T,W,RL M71 A. bestiarum Koi carp AMP,AML,CPD,CXM,E,OX,W M72 A. bestiarum Koi carp AMP,AML,OX,W,RL M73 A. bestiarum Koi carp AMP,AML,AMC,CXM,FOX,OX,W,RL M74 A. allosaccharophila Koi carp AMP,AML,C,NA,OX,T,W,RL M75 Aeromonas spp. 45 Koi carp AMP,AML,CPD,CXM,C,E,OX,W M76 A. salmonicida Koi carp AMP,AML,AMC,CPD,OX,W,RL M77 A. salmonicida Koi carp AMP,AML,AMC,CPD,OX,W,RL M78 A. bestiarum Koi carp AMP,AML,AMC,CPD,CXM,OX,W,RL M79 A. bestiarum Koi carp APM,AML,OX M80 A. bestiarum Koi carp AMP,AML,NA,OX,T,W M81 A. bestiarum Koi carp AMP,AML,CXM,CTX,OX,W,RL M82 A. culicicola Koi carp AMP,AML,AMC,ATM,CPD,CXM,E,FOX,OX,W,RL M83 A. bestiarum Koi carp AMP,AML,OX,W,RL M84 A. bestiarum Koi carp AMP,AML,OX,W,RL M85 A. allosaccharophila Koi carp AMP,AML,AMC,OX,W,RL M86 A. hydrophila Koi carp AMP,AML,AMC,OX,W,RL M87 A. bestiarum Koi carp AMP,AML,AMC,OX,W,RL M88 A. bestiarum Koi carp AMP,AML,AMC,CPD,CXM,E,FOX,OX,W,RL M89 A. allosaccharophila Koi carp AMP,AML,AMC,CPD,CXM,OX M90 A. bestiarum Koi carp AMP,AML,AMC,CXM,OX,W,RL M91 A. bestiarum Koi carp AMP,AML,OX,W,RL M92 A. allosaccharophila Koi carp AMP,AML,CPD,OX,W,RL M93 A. allosaccharophila Koi carp AMP,AML,C,NA,OX,W,RL M94 A. hydrophila Koi carp AMP,AML,AMC,E,OX,T,W,RL M95 A. hydrophila Koi carp AMP,AML,AMC,CXM,E,OX,T,W,RL M96 A. bestiarum Koi carp E,OX,T M97 A. bestiarum Koi carp E,OX,T M98 Aeromonas spp. 310 Koi carp AMP,AML,OX,W,RL M99 A. bestiarum Koi carp AMP,AML,CPD,CXM,OX
*AMP=ampicillin (AMP10), AML=amoxicillin (AML10), AMC=augmentin (AMC30), AZM=azithromycin (AZM15), ATM=aztreonam (ATM30), CPD=cefpodoxime (CPD10), CXM=cefuroxime (CXM30), E=erythromycin (E15), FOX=cefoxitin (FOX30), NA=nalidixic acid (NA30), OX=oxacillin (OX1), W=trimethoprim (W1.25), S=streptomycin (S10), RL=sulphamethoxazole (RL25), TE=tetracycline (TE30), TS=cotrimoxazole (TS25).

29
2.2.2 Genomic DNA isolation and analysis
Genomic DNA of Aeromonas spp. and P. shigelloides isolates was obtained according to the
CTAB/NaCl protocol (Ausubel et al., 1989). Bacterial cultures (1.5 ml) were pelleted, following
overnight growth in LB broth, by centrifugation at 12 000 rpm for 2 min. Pellets were
resuspended in 567 µl TE buffer and subjected to alkaline lysis by addition of 30 µl of 10% SDS
and 3 µl of 20 mg/ml proteinase K, followed by 1 h incubation at 37 ºC. Alkaline lysis, removal
of cell debris, left over protein and polysaccharide was achieved by the addition of 100 µl of
cetylthrimethyl ammonium bromide CTAB and 80 µl of NaCl, followed by 10 min incubation at
65 ºC. Genomic DNA was extracted using an equal volume of chloroform/isoamyl alcohol,
followed by centrifugation at 12 000 rpm for 5 min and upper aqueous phase transferred to fresh
tube. Equal volumes of phenol/chloroform/isoamyl alcohol was added, followed by
centrifugation for 5 min at 12 000 rpm. There after high quality DNA was precipitated out of the
upper aqueous solution by the use of 0.6% of volume isopropanol, followed by centrifugation for
2 min at 12 000 rpm. Fifty µl of 70% ethanol was added to purify the DNA and pellets were
resuspended in 20 µl of TE buffer, and stored at -20 ºC. Aliquots (2 µl) were subjected to
electrophoresis in 1% TAE agarose gels, stained with ethidium bromide and viewed by UV
transillumination, to determine the quality of the DNA samples (Jacobs and Chenia, 2007).
2.2.3 Detection of TEM type beta-lactamase resistance genes
Based on data from Duma (2012), study isolates displayed high levels of resistance to β-lactams
(92.9%; 92/99), while (100%; 99/99) were susceptible to carbapenems (imipenem).
Cephalosporin resistance was detected in 27.3% (27/99) of study isolates (Table 2.2), with
resistance to cefoxitin (33.3%; 9/27), cefpodoxime (74.1%; 20/27) and cefuroxime (62.9%;
17/27). Thus two primers (blaTEM (1) and blaTEM (2)) were designed to characterise the β-
lactamase gene content of study isolates. A 503 bp blaTEM (1) gene fragment was amplified by
PCR using β-lactamase gene primers (Table 2.2) described by Guerra et al. (2001). Reaction
mixtures (20 µl) consisted of 100 ng template DNA, 200 µM of each dNTP (Fermentas), 50
pmol of each primer, 1.5 mM MgCl2 (25mM) and 1 U Super Therm Taq DNA polymerase
(Southern Cross Biotechnology), together with 1 × Super Therm reaction buffer. PCR cycling
parameters consisted of 35 cycles of 94 ºC for 30 s; 55 ºC for 30 s; and 72 ºC for 2 min in a MJ
mini thermal cycler (Biorad). An initial denaturation step of 95 ºC for 5 min and a final
elongation step of 72 ºC for 10 min were included in reactions. The positive control used for this

30
assay was E. coli ATCC 35218 while E. coli ATCC 25922 was used as the negative control. The
type strains A. caviae ATCC 15468T and A. hydrophila ATCC 7966T, P. aeruginosa ATCC
35032 and P. aeruginosa ATCC 27853 were also included in the assays.
Table 2.2: Primers used in beta-lactamase and extended spectrum beta-lactamase detection.
Target Gene Sequence Size (bp) References blaTEM (1) 5’-TTGGGTGCACGAGTGGGT-3’ 503 Guerra et al. (2001) blaTEM 5’-TAATTGTTGCCGGGAAGC-3’
bla TEM (2) 5’-GAGTATTCAACATTTTCGT-3’ 857 Maynard et al. (2004) bla TEM 5’-ACCAATGCTTAATCAGTGA-3’
blaSHV 5’-GCCCGGGTTATTCTTATTTGTCGC-3’ 1008 Wu et al. (2007) blaSHV 5’-TCTTTCCGATGCCGCCGCCAGTCA-3’
blaCTX-M-15 5’-TTTCCCCATTCCGTTTCCGC-3’ 925 Jacoby et al. (2006) blaCTX -M-15 5’-TTCGTATCTTCCAGAATAAG-3’
blaCTX-II 5’-CGATGTGCAGTACCAGTAA-3’ 585 Hopkins et al. (2007) blaCTX-II 5’-TTAGTGACCAGAATCAGCGG-3’
An 857 bp blaTEM (2) gene fragment was also amplified by PCR using a β-lactamase gene
primer set (Table 2.2) that could detect all variants of the blaTEM-type gene (Maynard et al.,
2004). Reaction mixtures (20 µl) consisted of 100 ng template, DNA 200 µM of each dNTP
(Fermentas), 50 pmol of each primer, 1.5 mM MgCl2 and 1 U Super Therm Taq DNA
polymerase (Southern Cross Biotechnology), together with 1 × Super Therm reaction buffer.
PCR cycling parameters consisted of 35 cycles of 94 ºC for 30 s; 53 ºC for 30 s; and 72 ºC for 2
min in a MJ mini thermal cycler (Biorad). An initial denaturation step of 95 ºC for 5 min and a
final elongation step of 72 ºC for 10 min were included in reactions. The positive control used
for this amplification was E. coli ATCC 35218 while E. coli ATCC 25922 was used as the
negative control.
Ten µl of both blaTEM (1) and blaTEM (2) PCR reaction products were subjected to
electrophoresis in 1.5% agarose gels, stained in ethidium bromide, and viewed by UV
transillumination to identify the 503 and 857 bp β-lactamase gene fragments, respectively, with
O’GeneRulerTM 100 bp DNA Ladder Plus or O’GeneRulerTM 100 bp DNA Ladder as markers
(Fermentas, Canada) (Jacobs and Chenia, 2007).

31
2.2.4 Detection of extended spectrum beta-lactamases resistance genes
PCR reaction mixtures as described in Section 2.2.3 were used to amplify ESBL resistance
genes. The presence of SHV (blaSHV-1) and CTX (blaCTX-M-15 and blaCTX-II) type ESBLs were
investigated using primers described previously by Wu et al. (2007), Jacoby et al. (2006), and
Hopkins et al. (2007) respectively (Table 2.2). Duma (2012) had previously observed eight
isolates to be ESBL producers, i.e., M10, M13, M27, M37, M81, M87, M94, M95, so these
isolates were screened by PCR for the presence of blaSHV-I. The blaSHV-1 primer set targets
variants of the blaSHV gene that express FOX, CPD and CXM resistance. All variants of blaCTX-M
genes were targeted by the blaCTX-II primer set, while the blaCTX-M-15 primer set targets the blaCTX-
M-15 resistance gene. Both are plasmid-borne and mobile. K. pneumoniae ATCC 700603 was
used as the positive control for SHV (blaSHV-1) assay while E. coli ATCC 25922 was used as
negative control. A previously identified Salmonella typhimurium CTX-M positive strain was
used as positive control for the CTX (blaCTX-M-15 and blaCTX-II) assay and E. coli ATCC 25922
was used as negative control.
Five microliters of each PCR reaction mixture was subjected to electrophoresis in 1%
agarose gels, stained in ethidium bromide, and viewed by UV transillumination with
O’GeneRulerTM 100 bp DNA Ladder and/or O’GeneRulerTM 1kb DNA Ladder Plus as markers
(Fermentas, Canada) (Jacobs and Chenia, 2007).
2.3 Results
2.3.1 Identification of TEM type beta-lactamase resistance genes
It was observed that 46.4% (46/99) of isolates possessed blaTEM genes. Using the blaTEM (1)
primer set, 17% (17/99) were positive with amplification of a 503 bp fragment ((Fig. 2.1; Table
2.3). The blaTEM gene positive control E. coli ATCC 35218, P. aeruginosa ATCC 35032 and the
two type strains; A. caviae ATCC 15468T and A. hydrophila ATCC 7966T were also positive for
TEM presence with the blaTEM (1) primer set.

32
Figure 2.1: Agarose gel (1.5%) electrophoresis picture of a typical example of 503 bp blaTEM
gene amplicons obtained using primer set (1). Lane 1 was O’GeneRulerTM 100 bp DNA Ladder Plus (Fermentas, Canada); lane 2 was negative control E. coli ATCC 25922; lane 3 was positive control E. coli ATCC 35218; lane 4 was M63; lane 5 was M64; lane 6 was M65 and lane 7 was M66.
Since resistance profiles of isolates suggested a greater prevalence of blaTEM gene, a
second primer set described by Maynard et al. (2004) was also used. It was observed that 29%
(29/99) of study isolates were positive with the blaTEM (2) primer set. The amplification of an 857
bp fragment (Fig. 2.2; Table 2.3) was observed for all 29 positives. Figure 2.2 is a typical picture
of 503 bp gene fragments obtained from blaTEM (1) primer set.
Figure 2.2: Agarose gel (1.5%) electrophoresis picture of a typical example of 857 bp blaTEM
type gene amplicons obtained using primer set (2). Lane 1 was positive control E. coli ATCC 35218; lane 2 was M1; lane 3 was O’GeneRulerTM 100 bp DNA Ladder (Fermentas, Canada); lane 4 was negative control E. coli ATCC 25922, lane 5 was M6 and lane 6 was M9.
Although an 857 bp blaTEM fragment was amplified from positive control E. coli ATCC 35218 using the blaTEM (2) primer set, it was not possible to amplify the gene fragment from A.

33
caviae ATCC 15468T and A. hydrophila ATCC 7966T. Of the isolates assayed, 12% (12/99) were positive with both blaTEM (1) and blaTEM (2) primer sets.
Table 2.3: Results of amplifications of blaTEM gene using primer sets blaTEM (1) and blaTEM (2) from Aeromonas spp. isolated from fish and seawater.
ISOLATES SPECIES DESIGNATION blaTEM (1)* blaTEM (2)*
MI A. culicicola + M2 A. hydrophila M3 A. allosaccharophila M4 A. jandaei M5 A. hydrophila M6 A. hydrophila + + M7 A. culicicola M8 A. allosaccharophila M9 P. shigelloides + +
M10 A. culicicola + M11 Aeromonas spp. + M12 A. bestiarum M13 A. hydrophila + M14 A. hydrophila + + M15 Aeromonas spp. M16 A. jandaei + + M17 A. hydrophila + M18 A. caviae M19 A. jandaei + + M20 Aeromonas spp. + + M21 A. allosaccharophila + M22 A. culicicola M23 A. culicicola + M24 A. jandaei M25 A. culicicola M26 Aeromonas spp. 45 M27 Aeromonas spp. 45 M28 A. jandaei + + M29 A. culicicola + + M30 A. jandaei M31 A. culicicola M32 A. culicicola + M33 Aeromonas spp. 310 M34 Aeromonas spp. 45 M35 A. culicicola M36 A. jandaei M37 Aeromonas spp. 45

34
M38 A. culicicola M39 A. culicicola M40 A. culicicola M41 Aeromonas spp. + M42 A. culicicola + M43 Aeromonas spp. 310 + M44 A. icthiosmia M45 P. shigelloides + + M46 P. shigelloides + M47 P. shigelloides M48 A. icthiosmia M49 A. sobria + M50 A. hydrophila + M51 A. hydrophila M52 A. hydrophila M53 A. hydrophila M54 A. icthiosmia + M55 A. veronii M56 A. culicicola + M57 A. veronii + + M58 A. culicicola + M59 A. caviae M60 A. hydrophila M61 A. culicicola M62 A. hydrophila + M63 A. veronii + + M64 A. hydrophila M65 A. hydrophila + M66 P. shigelloides + + M67 P. shigelloides M68 A. caviae M69 A. bestiarum M70 A. bestiarum M71 A. bestiarum M72 A. bestiarum M73 A. bestiarum M74 A. allosaccharophila M75 Aeromonas spp. 45 M76 A. salmonicida M77 A. salmonicida M78 A. bestiarum M79 A. bestiarum M80 A. bestiarum + M81 A. bestiarum

35
M82 A. culicicola M83 A. bestiarum M84 A. bestiarum M85 A. allosaccharophila M86 A. hydrophila M87 A. bestiarum M88 A. bestiarum M89 A. allosaccharophila M90 A. bestiarum M91 A. bestiarum M92 A. allosaccharophila M93 A. allosaccharophila M94 A. hydrophila + M95 A. hydrophila M96 A. bestiarum M97 A. bestiarum + M98 Aeromonas spp. 310 M99 A. bestiarum
A. hydrophila ATCC 7966 + A. caviae ATCC 15468 + E. coli ATCC 29522 E. coli ATCC 35218 + + K. pneumoniae ATCC 700603 P. aeruginosa ATCC 27853
2.3.2 Analysis of TEM type gene content based on species designation and source
of isolation
The fourteen different species groups were analyzed with respect to presence of TEM gene
within each species group (Table 2.4). Among the 17.1% (17/99) of isolates positive for the
blaTEM gene using the blaTEM (1) primer set, the highest prevalence was observed for A.
hydrophila (29.4%; 5/17) and P. shigelloides (23.5%; 4/17). Of blaTEM (2) positives (29.2%;
29/99), the blaTEM gene was most prevalent in A. culicicola (27.6%; 8/29) and A. hydrophila
(17.2%; 5/29). The blaTEM gene was amplified with both blaTEM (1 and 2) primer sets (12.1%;
12/99) predominantly from P. shigelloides (25%; 3/12) and A. jandaei (25%; 3/12) (Table. 2.4).

36
Table 2.4: Species designation analysis of Aeromonas spp. blaTEM gene positives using primer sets blaTEM (1) and blaTEM (2).
SPECIES Total blaTEM (1)* blaTEM (2)* blaTEM (1) and blaTEM (2)
Aeromonas spp. 4 25% (1/4) 75% (3/4) 25% (1/4) Aeromonas spp. 45 5 0 0 0
Aeromonas spp. 310 3 0 33.3% (1/3) 0
A. allosaccharophila 8 0 12.5% (1/8) 0 A. bestiarum 19 5.3% (1/19) 5.3% (1/19) 0 A. caviae 3 0 0 0
A. culicicola 18 5.6 % (1/18) 44.4% (8/18) 5.6% (1/18)
A. hydrophila 17 29.4% (5/17) 29.4% (5/17) 11.8% (2/17) A. icthiosmia 3 0 1 0
A. jandaei 7 42.9% (3/7) 42.9% (3/7) 42.9% (3/7) A. salmonicida 2 0 0 0 A. sobria 1 0 100% (1/1) 0 A. veronii 3 66.7% (2/3) 66.6% (2/3) 66.7% (2/3)
P. shigelloides 6 66.7% (4/6) 50% (3/6) 50% (3/6) * blaTEM (1) – Guerra et al. (2001) primer set; blaTEM (2) – Maynard et al. (2004) primer set.
Isolates from catfish had the highest prevalence (33.3%; 4/33) of blaTEM type gene being
amplified using the blaTEM (1) primer set (Table. 2.5). Isolates from tilapia had the highest
number of positives (51.5%; 17/33) with the blaTEM (2) primer set. The amplification of blaTEM
gene using both blaTEM (1 and 2) primer sets was most prevalent for tilapia isolates (24.2%; 8/33)
(Table. 2.5).
Table 2.5: Percentage analysis of Aeromonas spp. blaTEM gene positives using blaTEM (1) and
blaTEM (2) primer sets, based on source of isolation.
HOST blaTEM (1)* blaTEM (2)* blaTEM (1) and blaTEM (2) Catfish (Clarias gariepinus) (n= 12) 33.3% (4/12) 41.7% (5/12) 16.7% (2/12) Goldfish (Carassius auratus) (n= 33) 3.03% (1/33) 6.06% (2/33) - Sea water (n= 20) 10% (2/20) 25% (5/20) 10% (2/20) Tilapia (Oreochromis mossambicus) (n= 33) 30.3% (10/33) 51.5% (17/33) 24.2% (8/33)
* blaTEM (1) – Guerra et al. (2001) primer set,; blaTEM (2) – Maynard et al. (2004) primer set.

37
2.3.3 Identification of extended spectrum beta-lactamases resistance genes
It was observed that the positive control K. pneumoniae ATCC 700603 was positive for blaSHV-I
gene presence (Fig. 2.3) as the expected 1008 bp fragment was obtained. However the 1008 bp
gene fragment was not amplified from aeromonad isolates tested.
Figure 2.3: Agarose gel (1.5%) electrophoresis of 1008 bp blaSHV type gene amplicon using primer set blaSHV-1. Lane 1 was O’GeneRulerTM 100 bp DNA Ladder (Fermentas, Canada); lane 2 was the negative control E. coli ATCC 25922; lane 3 was the positive control K. pneumoniae ATCC 700603 and lanes 4 - 11 were eight ESBL-producers (M10, M13, M27, M37, M81, M87, M94, M95).
Figure 2.4: Agarose gel (1.5%) electrophoresis of blaCTX-M-I5 (925 bp) and blaCTX-M (585 bp) gene amplicons using primer sets blaCTX-M-I5 and blaCTX-II. Lane 1 was positive control Salmonella typhimurium; lane 2 was M81; lane 3 was M82; lane 4 was M88; lane 5 was O’GeneRulerTM 1kb DNA Ladder Plus (Fermentas, Canada); lane 6 was positive control Salmonella typhimurium; lane 7 was M81; lane 8 was M82 and lane 9 was M88.
Second and 3rd generation cephalosporin-resistant isolates were screened for CTX genes.
Expected amplicons for 925 bp (blaCTX-M-15) and 585 bp (blaCTX-II), were amplified from only
three (M81, M82 and M88) cephalosporinase producers (Fig. 2.4). There were two species

38
group represented among the blaCTX-M-15 and blaCTX-M positives viz.; A. bestiarum 66.7% (2/3)
and A. culicicola 33.3% (1/3), from goldfish.
2.4 Discussion
Environmental Aeromonas species living in water bodies have been reported to be reservoirs of
antimicrobial resistance genes (Girlich et al., 2011). In addition to their intrinsic antimicrobial
resistance to Ambler classes B, C and D β-lactamases (Chen et al., 2012), they have been
associated with mobile genetic elements such as integrons and plasmids (Igbinosa et al., 2012).
This increases the incidence of extended spectrum β-lactam resistance in aeromonads (Chen et
al., 2012). In the present study, the blaTEM primer set (1) amplified TEM-type genes from fewer
aeromonads (17.1% ; 17/99) than the blaTEM primer set (2) (29.2%; 29/99). This is because while
blaTEM primer set (1) was designed to amplify the classical TEM-1-like β-lactamases (Guerra et
al., 2001), blaTEM primer set (2) was designed to detect all variants of the TEM-type β-lactamase
genes (ESBLs) (Maynard et al., 2004). Therefore using both primer sets, a greater prevalence of
blaTEM type resistance genes determinants (classical TEM-1-like and TEM-type extended β-
lactamases) was identified. Data from study carried out by Duma (2012) demonstrated that
isolates were resistant to ampicillin (AMP) (92.9%; 92/99), amoxicillin (AML) (91.9%; 91/99),
cefpodoxime (CPD) (20.2%; 20/99), cefuroxime (CXM) (20.2%; 20/99), cefoxitin (FOX)
(9.09%; 9/99) and aztreonam (ATM) (4.04%; 4/99). This is expected as TEM-1-like β-lactamase
genes hydrolyze narrow spectrum penicillin while TEM-type ESBLs are known to hydrolyze
narrow and extended spectrum-penicillins, monobactams and second and third generation
cephalosporins (Paterson and Bonomo, 2005). Among clinical Gram-negative bacteria, blaTEM-I
is the most frequently detected β-lactamases (Balsalobre et al., 2010; Girlich et al., 2011),
environmental Aeromonas spp. have also been observed to possess blaTEM-I-like genes in their
chromosomes (Balsalobre et al., 2010). In the present study, fish and environmental isolates
were observed to carry the blaTEM resistance gene determinant, with highest prevalence in tilapia
isolates. The rest of the blaTEM negative isolates (53.5%; 53/99) may have other β-lactamases not
tested for (Wu et al., 2011), perhaps the chromosomal class C β-lactamases (Chen et al., 2012).
This may also explain the resistance of isolates to augmentin (AMC) (32.3%; 32/99).
In the present study A. hydrophila was found to have the highest incidence of the blaTEM-I-
like gene amplified with primer set (1). This is consistent with findings of Balsalobre et al.
(2010), who observed that environmental isolates of A. hydrophila and A. jandaei possessed

39
blaTEM-I-like genes. Aeromonas culicicola was observed to be the species harbouring the most
blaTEM-type gene amplified with primer set (2), although not clinically important A. culicicola
has been isolated from mosquitoes (Piyidar et al., 2002). The blaTEM-type (primer set 2) gene was
also prevalent among Aeromonas hydrophila, P. shigelloides, A. veronii, Aeromonas spp. and A.
jandaei isolates. Since these are clinically important species, it poses a health threat as they are
known to be associated with both animal and human infections (Janda and Abbott, 2010; Dias et
al., 2012). These mobile blaTEM resistance genes were more prevalent in isolates from tilapia
than the other three sources, i.e., koi carp, catfish and seawater. Since tilapia host were not
exposed to any antimicrobial agents, it is possible that fish feeds, fish farm influents from
environmental water, naked DNA and resistance determinants from lysed commensal and
pathogenic bacteria and biofilms forming on sediments and aquaculture structures may be
sources of these resistance genes (Cabello et al., 2013; Marti et al., 2013).
The blaSHV genes were not detected on amplification, this is expected as the resistance
profile of study isolates (Table 2.1) showed that they were susceptible to imipenem (100%;
99/99). However, blaCTX-M-15 and blaCTX-M genes were amplified from 3 isolates, with only one
isolate (A. bestiarum) demonstrating resistance to cefotaxime (CTX) (Fig 2.4). Resistance to
cefuroxime (CXM) (6.1%; 6/99), cefoxitin (FOX) (8.1%; 8/99) and cefpodoxime (CPD) (5.1%;
5/99) may be due partly to, the presence of blaTEM gene variants that were amplified (Maynard et
al., 2004) or presence of intrinsic class C β-lactamases (Chen et al., 2012).
Duma (2012) study demonstrated that isolates with β-lactam resistance also demonstrated
resistance to aminoglycosides (streptomycin; 3.03%; 3/99), macrolides (erythromycin; 18.1%;
18/99), trimethoprim (68.6%; 68/99) and sulphamethoxazole (81.8%; 81/99) (Table. 2.1). This is
consistent with findings of Guerra et al. (2001) and Maynard et al. (2004) that TEM positives
carry class 1 integrons. Study isolates demonstrating β-lactam resistance could be correlated with
presence of blaTEM and blaCTX-M genes. Data from this study suggests that Aeromonas spp. from
fish and aquatic environment may be reservoirs and possible agents of dissemination of β-
lactamase genes (Maravic et al., 2013; Wu et al., 2011, 2013).

40
CHAPTER THREE
IDENTIFICATION OF INTEGRONS ASSOCIATED WITH FISH AND AQUATIC
AEROMONAS spp.
3.1 Introduction
The increasing dissemination of resistance genes among fish pathogens has become a major
concern in many countries worldwide (Ndi and Barton, 2011). This problem is impacting
negatively on aquaculture production worldwide, causing million dollar losses and retarding
economic growth of the industry (Janda and Abbott, 2010). Antimicrobial compounds are widely
used worldwide in aquaculture, agriculture farms and animal farms, and there is a tendency to
abuse their use. These antimicrobials are used for prophylactic and therapeutic purposes in
aquaculture usually through incorporation into fish feed (Cabello et al., 2013). These
antimicrobial compounds are usually released into the aquaculture environment intact through
uningested feed or in their unabsorbed forms in the excreta of fish and/or in absorbed forms as
secretions from fish. This has accelerated the development of antimicrobial resistance genes
(ARGs) and resistant bacteria (Zhang et al., 2009a; Cabello et al., 2013). The risk of
contamination of human and animal food and water with resistant bacteria is an emerging
problem worldwide (Cabello et al., 2013). The increase in the dissemination of antimicrobial
resistance via resistant bacteria and antimicrobial resistance gene determinants is disturbing as it
can be transferred to human commensal and pathogenic bacteria (Jacobs and Chenia, 2007). This
in turn endangers humans and renders current chemotherapy for bacterial infections in
aquaculture ineffective (Jacobs and Chenia, 2007).
The resistance determinants that are commonly implicated are either plasmid-borne or
chromosomally-located (Janda and Abbott, 2010). Associated with these plasmids are integrons
that are immobile and are only disseminated by conjugative plasmids and transposons (Pellegrini
et al., 2010). These integrons are elements that encode a site-specific recombination system that
recognizes and captures mobile gene cassettes (Pellegrini et al., 2010).

41
Figure 3.1: Classic integron structure diagram showing gene cassette (cassette 1), capture and integration by integrase gene intI at attI site (González et al., 2004).
Integrons are genetic modules associated with both pathogenic and commensal bacteria
that confer the ability to capture and express promoterless DNA units called gene cassettes which
confer a variety of adaptive functions including antimicrobial resistance (Binh et al., 2009).
There are three clinically important integrons that are known:- classes 1, 2 and 3 (Stalder et al.,
2012), with class 1 integrons being the most prevalent class (Chang et al., 2007; Verner-Jeffreys
et al., 2009; Nawaz et al., 2010). Class 1 integrons encode an integrase (intI) and a
recombination site (attI) where multiple gene cassettes may eventually be captured and
expressed (Fig. 3.1) (Binh et al., 2009). In addition to the integrase (intI) and recombination
(attI) sites, integrons possess a third integral part, the out-ward-oriented promoter (Pc) that
directs transcription of the captured genes. Integration occurs downstream of the resident Pc
promoter at the attI site, allowing the expression of genes in the cassette (Binh et al., 2009). The
acquisition of gene cassettes occurs through a site-specific recombination mechanism catalyzed
by an integron-encoded integrase (intI). The integrative recombination reaction occurs primarily
between an integron receptor site (attI) and a cassette-associated sequence known as the attC site
or 59-base element. Gene cassettes are mobile genetic elements comprised of a single gene and a
recombination site (attC) (Binh et al., 2009).
Gene cassettes are the smallest mobilizable DNA, which comprise a single gene and a
recombination site (attC), with more than 100 different gene cassettes having been reported
(Binh et al., 2009; Nawaz et al., 2010). These mobile genetic elements (MGEs) are discrete
genetic elements that exist as free circular, non-replicating DNA molecules when moving from
one genetic site to another (Pellegrini et al., 2010). They exhibit different sizes that range from

42
500 to 1000 bp as well as different functions but have a common structure. The 3’ end region of
every gene is adjacent to a palindromic sequence attC, which constitutes a specific
recombination site recognized by the integrase (Pellegrini et al., 2010). Gene cassettes consists
of a gene immediately followed by an attC site, each cassette has only one attC site, with various
elements being associated with the different resistance cassettes. Movements of the cassettes in
and out of integrons are random, usually a result of circumstance and natural selection. The
presence of selective pressures results in dissemination of integron-containing antimicrobial
resistance cassettes (Boucher et al., 2007; Partridge et al., 2009).
Antimicrobial resistance in Aeromonas spp. associated with cassette-borne resistance
genes and integrons are being increasingly described among food-borne, aquatic and clinical
species. (Jacobs and Chenia, 2007; Lee et al., 2008; Verner-Jeffreys et al., 2009; Kadlec et al.,
2011; Sarria-Guzmàn et al., 2013). Clinical isolates of A. hydrophila, A. veronii, and A. sobria
were found to contain the intI gene coding for the class 1 integron (Lee et al., 2008). Ornamental
fish and its carriage water analyzed for antimicrobial resistance gene presence were found to
contain aeromonads that carried class 1 integrons (Verner-Jeffreys et al., 2009). Ndi and Barton
(2011) observed the prevalence of class 1 integron in A. hydrophila, A. veronii, A. veronii bv
sobria, A. caviae and A. bestiarum isolated from Australian farmed rainbow trout. Integron
content and multidrug resistant phenotype of Aeromonas species have been correlated (Jacobs
and Chenia, 2007; Nawaz et al., 2010). In Croatia, Maravic et al. (2013) detected the presence of
class 1 and class 2 integrons in Mediterranean mussel (Mytilus galloprovincialis) from the
Adriatic Sea.
In aeromonads, gene cassettes that are commonly described are the dfr12 and dfr2d
coding for trimethoprim resistance, aadA1 and aadA2 responsible for aminoglycoside resistance,
qacEΔ1 conferring resistance to antiseptics and detergents, sulI and sulII responsible for
sulphonamide resistance, oxa2 encoding beta-lactam resistance and catB3 and catB8 conferring
resistance to chloramphenicol (Chang et al., 2007; Jacobs and Chenia, 2007; Lee et al., 2008;
Pérez-Valdespino et al., 2009; Ndi and Barton, 2011). Integron-positive Aeromonas spp. isolates
had a higher frequency of resistance compared to integron-negative isolates (Chang et al., 2007).
Since the beta-lactam, trimethoprim and sulphonamide resistance phenotype was detected in
Aeromonas spp. isolates from catfish, goldfish, seawater and tilapia (Duma, 2012), it was

43
important to determine if this resistance phenotype could be correlated with integron presence in
these isolates.
3.2. Materials and Methods
3.2.1 Detection of integron and integron-associated components
The presence of integrons and associated integron structures were identified by PCR analysis using
int, qacEΔ1 and sulI primer sets (Table 3.1). Reaction mixtures (25 µl) containing 100 ng template
DNA, 200 μM of each dNTP (Fermentas), 50 pmol of each primer, 1.5 mM MgCl2 and 1 U
SuperTherm Taq DNA polymerase (Southern Cross Biotechnology), together with 1× SuperTherm
reaction buffer, was prepared. PCR cycling parameters consists of 35 cycles of 94 °C for 30 s; 55
°C for 1 min; and 72 °C for 2 min in a MJ Mini Thermal Cycler (BioRad). An initial denaturation
step of 95 °C for 5 min and a final elongation step of 72 °C for 10 min were included in reactions.
Table 3.1: Primers used in detection of integrons and integron-associated genes
Target gene Sequence Size (bp) References
intI–integrase 1 ATCATCGTCGTAGAGACGTCGG GTCAAGGTTCTGGACCAGTTGC 892 Jacobs and Chenia (2007)
intII–integrase 2 GCAAATGAAGTGCAACGC ACACGCTTGCTAACGATG 467 Jacobs and Chenia (2007)
sulI – sulI CTTCGATGAGAGCCGGCGGC GCAAGGCGGAAACCCGCGCC 417 Jacobs and Chenia (2007)
sulII CGGCATCGTCAACATAACC GTGTGCGGATGAAGTCAG 722 Maynard et al.(2004)
qacE∆1–Qac ATCGCAATAGTTGGCGAAGT CAAGCTTTTGCCCATGAAGC 230 Jacobs and Chenia (2007)
Class 1 integrons Conserved areas
GGCATCCAAGCAGCAAG AAGCAGACTTGACCTGA Variable Jacobs and Chenia (2007)
Class 2 integrons Conserved areas
CGGGATCCCCGGCATGCACGATTTGTA GATGCCATCGCAAGTACGAG Variable Jacobs and Chenia (2007)
The presence of sulII gene was identified by PCR analysis using the sulII primer as
described by Maynard et al. (2004). Reaction mixtures (25 µl) containing 100 ng template DNA,
200 μM of each dNTP (Fermentas), 50 pmol of each primer, 1.5 mM MgCl2 and 1 U
SuperTherm Taq DNA polymerase (Southern Cross Biotechnology), together with 1×
SuperTherm reaction buffer was prepared. PCR cycling parameters consisted of 35 cycles: 5 min

44
at 94°C, followed by 35 cycles of 94 °C for 30 s, 58 °C for 30 s, and 72 °C for 1.5 min. Including
a final elongation step of 72 °C for 10 min. Type strains A. caviae ATCC 15468T and A.
hydrophila ATCC 7966T as well as E. coli ATCC 35218, P. aeruginosa ATCC 35032, P.
aeruginosa ATCC 27853 and K. pneumoniae ATCC 700603 were included in assays.
3.2.2 Detection of conserved regions for class 1 and 2 integron positives
The variable regions of class 1 and class 2 intI and intII positives, respectively, were identified
by PCR analysis using primers targeting the variable regions (CS and HEP) as described by
Jacobs and Chenia (2007). Reaction mixtures (25 µl) containing 100 ng template DNA, 200 μM
of each dNTP (Fermentas), 50 pmol of each primer, 1.5 mM MgCl2 and 1 U SuperTherm Taq
DNA polymerase (Southern Cross Biotechnology), together with 1× SuperTherm reaction buffer
was prepared. PCR cycling parameters consisted of 35 cycles consisting of 5 min at 94°C, 30
cycles of 94 °C for 30 s, 53 °C for 30 s, and 72 °C for 1.5 min. A final elongation step of 72 °C
for 10 min
Seven microliters of PCR reaction mixtures was subjected to electrophoresis in 1% agarose
gels, stained in ethidium bromide, and viewed by UV transillumination to identify integrons and
their associated genes with O’GeneRulerTM 100 bp DNA Ladder and O’GeneRulerTM 100 bp DNA
Ladder Plus as DNA molecular weight markers (Fermentas) (Jacobs and Chenia, 2007).
3.3 Results
3.3.1 Identification of integron-associated components
It was observed that 10.1% (10/99) of study isolates were positive for intI gene with
amplification of 892 bp amplicon (Fig. 3.2; Table 3.2). Figures 3.2 - 3.4 are typical examples of
PCR products of study isolates and controls obtained with intI and intII primers. Type strain A.
caviae ATCC 15468T, and controls E. coli ATCC 35218 (Fig. 3.3), P. aeruginosa ATCC 27853
and K. pneumoniae ATCC 700603 were also positive for the intI gene.

45
Figure 3.2: Agarose gel (1.5%) electrophoresis picture of a typical example of 892 bp intI gene amplicon obtained using intI primer. Lanes 1-3 were M42 – M44, lane 4 was M45, lanes 5 – 12 were M46 – M53 and lane 13 was O’GeneRulerTM 100 bp DNA Ladder (Fermentas, Canada).
Figure 3.3: Agarose gel (1.5%) electrophoresis picture of a typical example of 892 bp intI gene amplicon obtained using intI primer. Lane 1 was O’GeneRulerTM 100 bp DNA Ladder (Fermentas, Canada); lane 2 was E. coli ATCC 25922; lane 3 is E. coli ATCC 35218; lane 4 was M1 and lane 5 was M2.
The 467 bp intII gene was amplified from 23.2% (23/99) of isolates (Fig 3.4).
Pseudomonas aeruginosa ATCC 27853 and E. coli ATCC 35218 were also positive for intII
gene.
Figure 3.4: Agarose gel (1.5%) electrophoresis picture of a typical example of 467 bp intII gene amplicon obtained using intII primer. Lane 1 was O’GeneRulerTM 100 bp DNA Ladder (Fermentas, Canada); lane 2 was A. hydrophila ATCC 7966T; lane 3 was A. caviae ATCC 15468T; lane 4 was M63; lane 5 was M64; lane 6 was M65; lane 7 was M66 and lanes 8 – 13 were M67 – M73.

46
Table 3.2: Characterization of Aeromonas spp. from fish and seawater isolates based on PCR amplification of integron and associated
integron genes content and their resistance phenotypes.
Isolates Species designation Integrase type
qacEΔ1* sulI* sulII* Class 1 integron CS (bp)
Class 2 integron HEP (bp)
Resistance phenotype
M1 A. culicicola intII + - + - 700+1500+2000+3000
NA,OX,T
M2 A. hydrophila - + - - - - AMP,AML,OX,W,RL M5 A. hydrophila - + + - - - AMP,AML,OX,W,RL M6 A. hydrophila intII + - - - 2000 AMP,AML,OX,W,NA M8 A. allosaccharophila intII + - + - 2000 AMP,AML,AMC,OX,T,W,RL M9 P. shigelloides - + - - - - OX
M11 Aeromonas spp. intII + - - - 2000 AMP,AML,AMC,E,OX,W M13 A. hydrophila - + + - - - AMP,AML,OX,W,RL M14 A. hydrophila intII + + - - 400 OX M16 A. jandaei + + - - 700 AMP,AML,CPD,CXM,FOX,OX,W,RL M17 A. hydrophila intII + + - - - AMP,AML,OX,W,RL M18 A. caviae - + - - - - AMP,AML M19 A. jandaei intII + - - - 2000 AMP,AML,AMC,FOX,OX,W,RL M20 Aeromonas spp. - + - + - - AMP,AML,FOX,CPD,CXM,OX,W,RL,SXT M21 A. allosaccharophila - + - - - - AMP,AML,AMC,FOX,CPD,CXM,OX,W,S M22 A. culicicola - + - - - - AMP,AML,OX,W,RL M23 A. culicicola - + + - - - AMP,AML,OX,RL M24 A. jandaei - + - - - - AMP,AML,OX,RL M26 Aeromonas spp. 45 intI, intII + + - 500+600+800 400 AMP,AML,OX,RL M28 A. jandaei intI - + - 600+800+1000 - AMP,AML,OX,RL M29 A. culicicola - - + - - - AMP,AML,OX,RL M30 A. jandaei intI - - - 600+800 - AMP,AML,OX,RL M31 A. culicicola intI - + - 500+600+800+10
00 - AMP,AML,OX,W,RL
M32 A. culicicola - - + - - - AMP,AML,OX,RL

47
M39 A. culicicola - - + - - - AMP,AML,OX,RL M41 Aeromonas spp. intII - + - - 400 AMP,AML,OX,RL M42 A. culicicola - + - + - - AMP,AML,NA,OX,RL M43 Aeromonas spp. 310 - + - - - - AMP,AML,NA,OX,RL M45 P. shigelloides intI - + - 600+900 - AMP,AML,AMC,T,OX,W,RL M46 P. shigelloides - + + - - - AMP,AML,NA,E,W,S,SXT,OX,RL M49 A. sobria - + - - - - AMP,AMC,AML,OX,T M52 A. hydrophila - - + - - - AMP,AMC,AML,CPD,CXM,E,OX,T,W,RL M53 A. hydrophila intII + - + - 700+2000 AMP,AML,OX,T,W,RL M54 A. icthiosmia - + - - - - AMP,AML,AMC,E,OX,T,W,RL M55 A. veronii - + - - - - AMP,AML,OX,W,RL M56 A. culicicola - + - + - - AMP,AML,E,NA,OX,W,RL M57 A. veronii intI + - - 500+600+800+10
00 - AMP,AML,AMC,CPD,CXM,C,E,T,OX,W,RL
M58 A. culicicola - + - - - - AMP,AML,AMC,OX,W,RL M61 A. culicicola - + - - - - AMP,AML,OX M62 A. hydrophila intI, intII + - + 600+900+2000 400 AMP,AML,OX,W,RL M63 A. veronii intI + - - 500+650+800+90
0+1000 - AMP,AML,AMC,OX,W,RL
M64 A. hydrophila - + - - - - AMP,AML,OX,FOX,W,RL,CPD M65 A. hydrophila intII + - - - 400 AMP,AML,OX,W,RL M66 P. shigelloides intII + - + - 2000 AMP,AML,OX,RL M67 P. shigelloides - + - - - - AMP,AML,OX,RL,W M68 A. caviae - + - - - - AMP,AML,AMC,CPD,OX,W,RL M69 A. bestiarum - + - + - - AMP,AML,AMC,CPD,OX,S,W,RL M72 A. bestiarum - + - - - - AMP,AML,OX,W,RL M73 A. bestiarum - + - - - - AMP,AML,AMC,CXM,FOX,OX,W,RL M74 A. allosaccharophila intII + + - - 2000 AMP,AML,C,NA,OX,T,W,RL M75 Aeromonas spp. 45 intII + + - - 1000+1500 AMP,AML,CPD,CXM,C,E,OX,W M76 A. salmonicida intI, intII + + - 800+2000 2000 AMP,AML,AMC,CPD,OX,W,RL M77 A. salmonicida - + - - - - AMP,AML,AMC,CPD,OX,W,RL
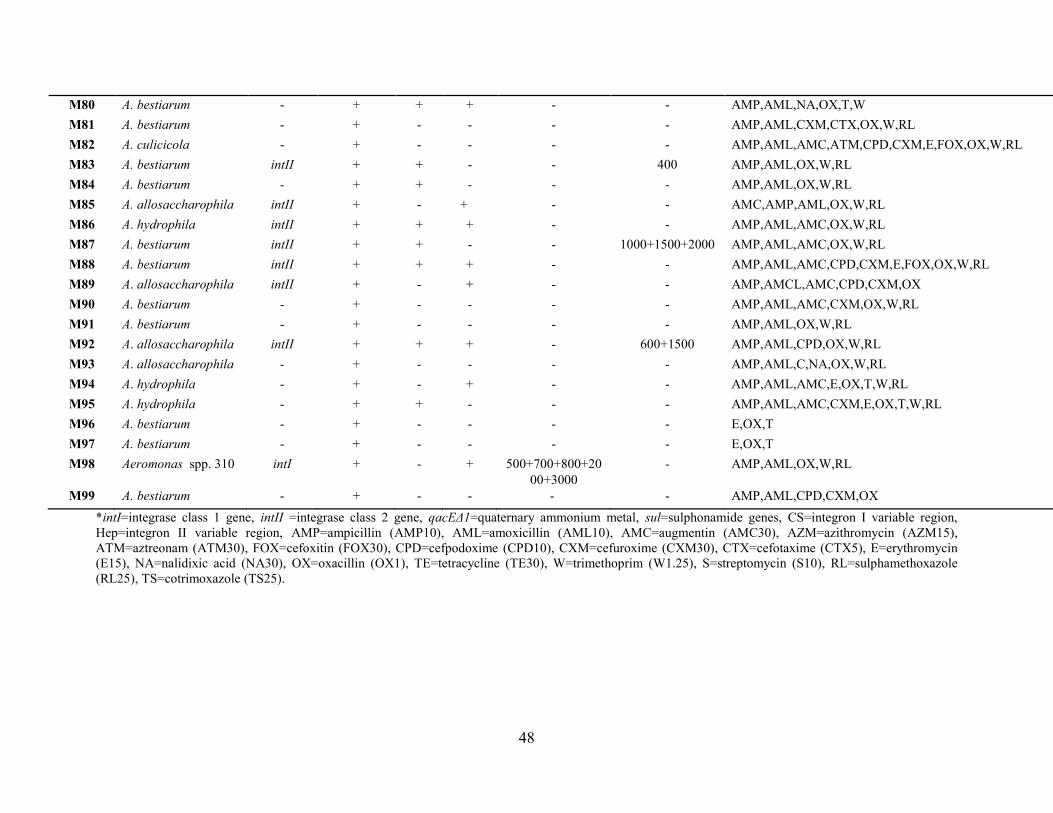
48
M80 A. bestiarum - + + + - - AMP,AML,NA,OX,T,W M81 A. bestiarum - + - - - - AMP,AML,CXM,CTX,OX,W,RL M82 A. culicicola - + - - - - AMP,AML,AMC,ATM,CPD,CXM,E,FOX,OX,W,RL M83 A. bestiarum intII + + - - 400 AMP,AML,OX,W,RL M84 A. bestiarum - + + - - - AMP,AML,OX,W,RL M85 A. allosaccharophila intII + - + - - AMC,AMP,AML,OX,W,RL M86 A. hydrophila intII + + + - - AMP,AML,AMC,OX,W,RL M87 A. bestiarum intII + + - - 1000+1500+2000 AMP,AML,AMC,OX,W,RL M88 A. bestiarum intII + + + - - AMP,AML,AMC,CPD,CXM,E,FOX,OX,W,RL M89 A. allosaccharophila intII + - + - - AMP,AMCL,AMC,CPD,CXM,OX M90 A. bestiarum - + - - - - AMP,AML,AMC,CXM,OX,W,RL M91 A. bestiarum - + - - - - AMP,AML,OX,W,RL M92 A. allosaccharophila intII + + + - 600+1500 AMP,AML,CPD,OX,W,RL M93 A. allosaccharophila - + - - - - AMP,AML,C,NA,OX,W,RL M94 A. hydrophila - + - + - - AMP,AML,AMC,E,OX,T,W,RL M95 A. hydrophila - + + - - - AMP,AML,AMC,CXM,E,OX,T,W,RL M96 A. bestiarum - + - - - - E,OX,T M97 A. bestiarum - + - - - - E,OX,T M98 Aeromonas spp. 310 intI + - + 500+700+800+20
00+3000 - AMP,AML,OX,W,RL
M99 A. bestiarum - + - - - - AMP,AML,CPD,CXM,OX *intI=integrase class 1 gene, intII =integrase class 2 gene, qacEΔ1=quaternary ammonium metal, sul=sulphonamide genes, CS=integron I variable region, Hep=integron II variable region, AMP=ampicillin (AMP10), AML=amoxicillin (AML10), AMC=augmentin (AMC30), AZM=azithromycin (AZM15), ATM=aztreonam (ATM30), FOX=cefoxitin (FOX30), CPD=cefpodoxime (CPD10), CXM=cefuroxime (CXM30), CTX=cefotaxime (CTX5), E=erythromycin (E15), NA=nalidixic acid (NA30), OX=oxacillin (OX1), TE=tetracycline (TE30), W=trimethoprim (W1.25), S=streptomycin (S10), RL=sulphamethoxazole (RL25), TS=cotrimoxazole (TS25).

49
Only 27.2% (27/99) were positive for the sulI gene following amplification of 417 bp
ampliner (Fig. 3.5; Table 3.2). Figures 3.5 - 3.6 are typical examples of sulI and sulII PCR gene
fragments results obtained from sulI and sulII primers used. Although the intI and intII genes had
been amplified, it was not possible to identify the associated sulI gene for all integrase-positive
isolates by PCR. Therefore, sulII gene was targeted and a 722 bp fragment was amplified from
17.1% (17/99) of isolates (Fig. 3.6; Table 3.2). None of the type strains and controls was positive
for the sulI gene, while type strain A. caviae ATCC 15468T and E. coli ATCC 35218 were
positive for the sulII gene.
Figure 3.5: Agarose gel (1.5%) electrophoresis picture of a typical example of 417 bp sulI gene amplicon sulI primer. Lane 1 was O’GeneRulerTM 100 bp DNA Ladder (Fermentas, Canada); lane 2 was M85; lane 3 was M86; lane 4 was M87; lane 5 was M88; lane 6 was M89; lane 7 was M90; lane 8 was M91; lane 9 was M92; lane 10 was M93, and lane 11 was M94.
Figure 3.6: Agarose gel electrophoresis of 722 bp sulII gene amplicon using sulII primer. Lane 1 was O’GeneRulerTM 100 bp DNA Ladder Plus (Fermentas, Canada); lane 2 was A. hydrophila ATCC 7966T; lane 3 was A. caviae ATCC 15468T; lane 4 was E. coli 25922; lane 5 was E. coli 35218; lane 6 was P. aeruginosa ATCC 27853; lane 7 was P. aeruginosa ATCC 35032; lane 8 was K. pneumoniae 700603; lane 9 was M1 and lane 10 was M2.
It was observed that 64.6% (64/99) of study isolates carried the qacEΔ1 gene (Fig 3.7),
with a 230 bp amplicon being obtained (Table 3.2). The qacEΔ1 gene was also amplified from P.
aeruginosa ATCC 35032 and E. coli ATCC 35218.

50
Figure 3.7: Agarose gel (1.5%) electrophoresis picture of a typical example of 230 bp qacEΔ1 gene amplicons using Qac primer. Lane 1wasO’GeneRulerTM 100 bp DNA Ladder (Fermentas, Canada); lane 2 was M54; lane 3 was M55; lane 4 was M56; lane 5 was M57; lane 6 was M58; lane 7 was M59; lane 8 was M60 and lane 9 was M61.
Sixty percent (6/10) of intI-positive isolates were also qacEΔ1-positive, while 50% (5/10)
of intI positives carried the sulI gene (Table 3.2). Trimethoprim resistance was observed for 70%
(7/10) of class 1 integron-positive isolates and sulphamethoxazole resistance was also observed
for 90% (9/10) of class 1 integron-positive isolates. While 74% (17/23) of class 2 integron
positive isolates demonstrated sulphamethoxazole resistance (Table 3.2), trimethoprim resistance
was identified for 70% (16/23) of class 2 integron-positive isolates. Ampicillin resistance was
observed for 91.3% (21/23) of class 2 integron-positive isolates. All five intI positive isolates
that possessed sulI gene were found to carry the qacEΔ1 gene as well. Among intII positives,
95.6% (22/23) were found to be qacEΔ1-positives, while 30.4% (7/23) of intII positives also
possessed the sulII gene. The seven intII- sulII-positive isolates were observed to also possess
the qacEΔ1 gene (Table 3.2). Although 3% (3/99) of study isolates were observed to be positive
for both sulI and sulII genes, 50% (32/64), 30% (3/10) and 17% (4/23) of qacEΔ1, intI and intII
positives did not possess either sulI or sulII, respectively (Table 3.2). Three isolates: M26
Aeromonas spp. 45 from seawater), (M62 A. hydrophila from tilapia), (M76 A. salmonicida from
goldfish) were positive for intI, intII, qacEΔ1 and sulI/sulII genes (Table 3.2 and 3.3)
3.3.2 Analysis of integron gene content based on species designation and source of
isolation
The intI gene was prevalent in A. veronii (67%; 2/3) and A. jandaei (29%; 2/7) isolates (Table
3.3). The intII gene was most prevalent in A. allosaccharophila and A. hydrophila isolates
(Table 3.3). intI was not amplified from Aeromonas spp., A. allosaccharophila, A. bestiarum, A.

51
caviae, A. icthiosmia and A. sobria isolates, while intII was not amplified from Aeromonas spp.
310, A. caviae, A. icthiosmia, A. veronii and A. sobria (Table 3.3).
qacEΔ1 gene was predominantly amplified from 83% (14/17) of A. hydrophila and 74%
(14/19) of A. bestiarum isolates. The sulI gene was not detected in Aeromonas spp. 310, A.
caviae, A. icthiosmia and A. veronii (Table 3.3). Greatest prevalence for sulI gene was detected
for A. hydrophila (41%; 7/17) isolates, while the sulII gene was predominantly amplified from A.
allosaccharophila (Table 3.3).
Species specificity was observed primarily for intI, intII, qacEΔ1, sulI and sulII genes,
with A. hydrophila being the species with most positives. Although qacEΔ1 gene were amplified
from A. caviae, A. icthiosmia and A. sobria, no corresponding intI, intII, sulI and sulII genes
were amplified (Table 3.3).
Table 3.3: Species designation-based analysis of amplified integron genes
Species intI* intII* qacEΔ1* sulI* sulII* Aeromonas spp. (n=4) 0 50% (2/4) 50% (2/4) 25% (1/4) 25% (1/4)
Aeromonas spp. 45 (n=5) 20% (1/5) 40% (2/5) 50% (2/5) 60% (3/5) 0 Aeromonas spp. 310 (n=3) 33% (1/3) 0 67% (2/3) 0 33% (1/3) A. allosaccharophila (n=8) 0 63% (5/8) 88% (7/8) 25% (2/8) 50% (4/8) A. bestiarum (n=19) 0 16% (3/19) 74% (14/19) 26% (5/19) 16% (3/19)
A. caviae (n=3) 0 0 66.7% (2/3) 0 0
A. culicicola (n=18) 6% (1/18) 6% (1/18) 44% (8/18) 28% (5/18) 17% (3/18)
A. hydrophila (n=17) 6% (1/17) 41% (7/17) 83% (14/17) 41% (7/17) 24% (4/17)
A. icthiosmia (n=3) 0 0 33% (1/3) 0 0 A. jandaei (n=7) 29% (2/7) 29% (1/7) 43% (3/7) 14% (1/7) 0
A. salmonicida (n=2) 50% (1/2) 50% (1/2) 100% (2/2) 50% (1/2) 0
A. sobria (n=1) 0 0 100% (1/1) 0 0
A. veronii (n=3) 67% (2/3) 0 100% (3/3) 0 0
P. shigelloides (n=6) 17% (1/6) 17% (1/6) 50% (3/6) 33% (2/6) 17% (1/6)
*intI=integrase class 1 gene, intII=integrase class 2 gene, qacEΔ1=quaternary ammonium metal, sul=sulphonamide genes.
Integron-containing isolates were identified primarily from A. hydrophila (Table 3.3) and
goldfish isolates (Table 3.3). However A. allosaccharophila, A. bestiarum, A. jandaei and A.
veronii occurred frequently among positive isolates.

52
Table 3.4: Source of isolation-based analysis of amplified integron genes
Source intI* intII* qacEΔ1* sulI* sulII* Catfish (n=13) 0 26.7% (4/15) 53% (8/15) 13% (2/15) 20% (3/15) Goldfish (n=33) 6.1% (2/33) 30% (10/33) 85% (28/33) 33% (11/33) 85% (9/33) Sea water (n=20) 20% (4/20) 10% (2/20) 20% (4/20) 40% (8/20) 0 Tilapia (n=33) 12% (4/33) 21% (7/33) 73% (24/33) 18% (6/33) 15% (5/33)
*intI=integrase class 1 gene, intII =integrase class 2 gene, qacEΔ1=quaternary ammonium metal, sul=sulfonamide genes.
3.3.3 Identification of conserved regions for class 1 and 2 integron positives
Only 10% (10/99) of isolates examined were positive for the intI gene. Thus the gene cassette-
containing regions of these 10 isolates were amplified using the class 1 integron CS primers.
Amplicons of varying lengths (0.5 - 3 kb) were observed in CS profiles of all 10 isolates (Fig.
3.8; Table 3.4). Table 3.2 is a summary of all Aeromonas spp. study isolates qacEΔ1, intI, intII,
sulI, sulII positives. The correlation between intI positives and CS variable regions, as well as
the intII positives and HEP variable regions can be observed in Table 3.2. The resistance
phenotypes identified by Duma (2012) were also correlated to intI or intII presence in certain
cases. Figure 3.8 shows the 10 intI positives with the various multiple bands that ranged from
500 to 3000 kb. These bands represent various gene cassettes that were not tested for in this
study.
A higher prevalence of intII was identified in study isolates. The conserved regions of the
22 isolates were amplified using the class 2 integron HEP primer (Fig. 3.9). Only 83.0% (19/23)
of isolates yielded amplification products ranging from 0.5 – 3 kb (Table 3.2). HEP profiles were
not observed for the remaining 17.3% (4/23) of isolates. Figure 3.9 shows intII positives and
their HEP variable regions, with multiple bands representing various gene cassettes that were not
tested for in this study. Lanes 19, 20 22 and 23 seemed to lack HEP regions, as there was
smearing in these lanes.

53
Figure 3.8: Agarose gel electrophoresis of CS variable regions (0.5 – 3 kb) of ten intI-positive Aeromonas spp. isolates. Lane 1was A. caviae ATCC 15468T; lane 2 was E. coli ATCC 35218, lane 3 was M26; lane 4 was M28; lane 5 was M30; lane 6 was M31; lane 7 was M45; lane 8 wasO’GeneRulerTM100 bp DNA Ladder Plus (Fermentas, Canada); lane 9 was M57; lane 10 was M62; lane 11 was M63; lane 12 was M76 and lane 13 was M98.
The CS and HEP regions were similar in the size of bands they contained (500 – 3000
kb) (Table 3.4). Both variable regions also seemed to demonstrate similar resistance phenotypes,
with the commonest being the resistance to ampicillin, trimethoprim and sulphamethoxazole.
However these intI and intII variable regions differ in the number of bands each isolate variable
region contained. The CS variable region had an average of 3 bands each, while the HEP
variable region had an average of 2 bands each (Table 3.4).
Figure 3.9: Agarose gel electrophoresis of HEP variable regions (0.5 – 3 kb) of 23 intII-positive Aeromonas sp. isolates. Lanes 1was M1; lane 2 was M6; lane 3 was M8; lane 4 was M11; lane 5 was M14; lane 6 was M17; lane 7 was M19; lane 8 was M26; lane 9 was M41; lane 10 was M53; lane 11 was M62; lane 12 was M65; lane 13 was O’GeneRulerTM 100 bp DNA Ladder Plus (Fermentas, Canada); lane 14 was M66; lane 15 was M74; lane 16 was M75; lane 17 was M76; and lane 18 was M83.

54
3.4 Discussion
Isolates originating from aquatic sources have been shown to harbour integrons and other genes
coding for resistance determinants (Ndi and Barton, 2011). A number of studies have observed
the prevalence of class 1 integron among food-borne, environmental and clinical isolates of
Aeromonas spp. (Chang et al., 2007; Lee et al., 2008; Perez-Valdespino et al., 2009; Čižek et al.,
2010; Ndi and Barton, 2011). Studies by Nawaz et al. (2010), Kadlec et al. ( 2011) and Sarria-
Guzmàn et al. (2013) have demonstrated that Aeromonas spp. in aquaculture are usually
associated with class 1 integrons in the United States of America and Germany. Similarly in
Australia, Ndi and Barton (2011) detected the prevalence of class 1 integrons in Aeromonas spp.
from cultured fish. Čižek et al. (2010) observed that aeromonads from cultured ornamental (koi)
carp (Cyprinus carpio koi) and common carp (Cyprinus carpio) were associated with class 1
integrons. In South Africa, Igbinosa et al. (2013) observed the prevalence of integron 1 in
Aeromonas spp. in two South African rivers situated in the Eastern Cape region. In the present
study, Aeromonas spp. isolated from aquatic systems and food were observed to possess both
class 1 and class 2 integrons.
Class 2 integrons have previously been identified in non-pathogenic E. coli strains from
farmed poultry and swine (Lapierre et al., 2008), and in resistant E. coli strains from wastewater
treatment plants in Italy (Pellegrini et al., 2010). Studies by Maravic et al. (2013) detected the
presence of both class 1 and class 2 integrons in environmental isolates of Aeromonas spp. In
South Africa, Jacobs and Chenia (2007) detected the presence of both class 1 and class 2
integrons in Aeromonas spp. from aquaculture systems. This is consistent with data obtained
from this study, however, in the present study there was greater incidence of class 2 integrons
than class 1 integrons.
All integron-positive Aeromonas spp. are known to be multidrug resistant to at least three
or more antimicrobials commonly in use (Kadlec et al., 2011; Ndi and Barton, 2011; Igbinosa et
al., 2013). In this study, it was observed that all class 1 and 2integron-positive isolates were
resistant to ampicillin, trimethoprim, sulphamethoxazole, and trimethoprim-sulphamethoxazole.
Trimethoprim and sulphamethoxazole resistance among class 1 integron carrying isolates was
correlated to the sulI and sulII genes presence. All of class 1 integron-containing isolates (Table
3.2) were ampicillin-resistant, with 50% (5/10) possessing either a beta-lactamase gene (blaTEM-I)
and/or extended spectrum beta-lactamase genes (blaTEM-II) (Chapter Two). This is consistent with

55
findings by Tacao et al. (2014), where class 1 integrons found in Aeromonas spp. like A.
hydrophila from aquatic systems were associated with extended spectrum beta-lactamase genes
and multi-drug resistance to three or more classes of antimicrobials.
Class 2 integron positive isolates demonstrated sulphamethoxazole, trimethoprim and
ampicillin resistance (Table 3.2). This is similar to findings of Maravic et al. (2013) and Moura
et al. (2007), who identified that integron carrying Aeromonas spp. were resistant to ampicillin,
cefazolin, chloramphenicol, nalidixic acid, trimethoprim, sulphamethoxazole, and trimethoprim-
sulphamethoxazole. This multidrug resistance could be an effect of co-selection of several
resistance genes in the same genetic platform or cross-resistance due to expression of a
mechanism responsible for resistance to different compounds (Tacao et al., 2014).
The detection of sulI gene in 27.2% (27/99) and sulII gene in 17.1% (17/99) correlates
with the high level of resistance to trimethoprim, sulphamethoxazole, and trimethoprim-
sulphamethoxazole. Only 1.01% (1/99) of sulI-containing and 3.03% (3/99) of sulII-containing
gene were not resistant to trimethoprim, sulphamethoxazole, and trimethoprim-
sulphamethoxazole. This could be due to lack in selection pressures required for expression
(Sarria-Guzmàn et al., 2013). Although there were isolates that were negative for both sulI and
sulII genes, they presented with resistance to trimethoprim, sulphamethoxazole, and
trimethoprim-sulphamethoxazole. This could be as a result of other mobile genetic elements
present in study isolates that was not tested for in this study. Similarly, 3.03% (3/99) of isolates
were observed to possess both integrase genes and 70.7% (70/99) of study isolates were negative
for both intI and intII genes. Furthermore, 61.6% (61/99) lacking both integrase genes were
observed to be resistant to either trimethoprim or sulphamethoxazole and both. This could be due
to the presence of other resistance genes being associated with plasmids and transposons which
present co-resistance to commonly used antimicrobials. This usually occurs when these strains
are exposed to single or multiple antimicrobials. This induces production of these resistance
genes through mutation or horizontal transfer (Tacao et al., 2014). In the present study 50%
(32/64) of isolates carrying the qacEΔ1 gene were positive for both sulI and sulII genes. This is
similar to findings of Jacobs and Chenia (2007) for Aeromonas spp. isolates and for E. coli
isolates by Sunde (2005).
All study isolates positive for intI possessed CS profiles with amplicons ranging from
500 - 3000 bp, while 17.3% (4/23) of intII carrying study isolates did not yield HEP profiles

56
(Table 3.2). This may as a result of empty variable regions (Sarria-Guzmàn et al., 2013), or gene
cassettes present in these variable regions that are less than 300 bp or too large to be amplified
(Chang et al., 2007).
In this study, species analysis of integron containing isolates suggests that intI, intII,
qacEΔ1, sulI and sulII genes were prevalent among A. veronii, A. jandaei, A. hydrophila, A.
allosaccharophila and A. bestiarum (Tables 3.3 and 3.5). This is similar to findings by Čižek et
al. (2010), Nawaz et al. (2010), Kadlec et al. (2011), Ndi and Barton (2011) and Sarria-Guzmàn
et al. (2013). Nawaz et al. (2010) observed that A. veronii possessing class 1 integrons were
frequently isolated from catfish. However in the present study, only class 2 integrons were
observed for catfish isolates. The fish pathogen A. salmonicida possessed intI, intII, qacEΔ1 and
sulI genes, which has been previously observed by Kadlec et al. (2011). Since integron-carrying
motile species A. veronii biovar sobria, A. jandaei, A. hydrophila and A. caviae are associated
with human infections and possess multi-drug resistance. This poses a threat to public health as
these pathogenic aeromonads can transfer these antimicrobial resistance determinants to humans
(Kadlec et al., 2011).
Based on data from this study, Aeromonas spp. from fish and seawater are associated
with resistance determinants such as integrons, and are multi-drug resistant to several
antimicrobials commonly in use. The prevalence of both class 1 and 2 integrons increases the
possibility of horizontal gene transfer of resistance genes within the aquatic environment and to
human pathogens and suggests that they may be vectors of antimicrobial resistance genes in the
aquatic environments (Lupo et al., 2012). This presents a challenge for treatment processes, as
the multidrug resistance phenotypes observed for Aeromonas spp. isolated from food and
environmental sources can seriously cripple chemotherapeutics that are currently in use.

57
CHAPTER FOUR
CHARACTERISATION OF AQUATIC Aeromonas spp. ISOLATES’
SUSCEPTIBILITY TO PHYTOCHEMICAL COMPOUNDS: CINNAMALDEHYDE,
Kigelia africana AND VANILLIN
4.1 Introduction
According to the World Health Organization (WHO), more than 80% of the world’s population
depends on traditional plant medicine for their primary health care needs (Cowan et al., 1999). It
is estimated that around 70,000 plant species, from lichens to tall trees, have been used at one
time or another for medicinal purposes (De Britto et al., 2012b). Phytochemicals are non-
nutritive plant chemicals that have protective or disease preventive properties (de Britto et al.,
2012a). These plant chemicals are produced by plants for their protection. These phytochemicals
have antimicrobial, immunostimulating, appetite increasing, growth promoting, de-stressing, and
aphrodisiac properties (Citarasu et al., 2002; Ardo et al., 2008; Rajendiran et al., 2008;
Harikrishnan et al., 2010; Velmurugan et al., 2010; Abdel-Tawwab et al., 2012). Plant extracts
are highly efficient against resistant microbial infections. This has led to increasing interest in
phytochemical pharmacology, although phytochemicals have been in use since early man
(Phillipson, 2001). According to WHO, medicinal plants with various life-sustaining constituents
would be the best source to obtain a variety of potential, safe and novel drugs (Natarajan et al.,
2003).
With advances in phytochemical techniques, several active principles of many medicinal
plants have been isolated and introduced as valuable drugs in modern systems of medicine
(Senthilkumar et al., 2005). The most active components of plant phytochemicals are secondary
metabolites such as alkaloids, tannins, phenolic/flavonoid compounds, sterols, terpenoids, and
proanthocyanidins (Siri et al., 2008). The antibacterial active components of plants may lyse the
cell wall, block both protein and DNA synthesis, inhibit enzyme secretions and interfere with the
signaling mechanisms of the quorum sensing pathway (Chakraborty and Hancz, 2011). Tannins
which are polyphenols that are obtained from various parts of different plants are toxic to
bacteria, and filamentous yeast (Harborne, 1973). Phenolics are known to inactivate microbial
adhesins enzymes, cell envelope, and transport proteins through non-specific forces like

58
hydrogen bonding, covalent bonding, and hydrophobic effects (Saleem et al., 2010). Flavonoids
are one of the biggest classes of secondary metabolites and are distributed in various plant
species. Flavonoid efficacy is attributed to their ability to complex with extracellular and soluble
proteins and then alters permeability of bacterial cell walls and porins in microbial membrane
(Saleem et al., 2010). They protect the plant from UV radiation and other environmental stresses,
and significant antioxidant properties are associated with them. In comparison to antimicrobial
agents, phytochemicals of plant origin are not associated with many side effects and have an
enormous therapeutic potential to heal many infectious diseases (Ponnusamy et al., 2010).
Cinnamaldehyde or 3-phenyl-2-propenal, a natural flavouring substance and a major
constituent of cinnamon essential oils, occurs naturally in the bark and leaves of cinnamon trees
of the genus Cinnamomum. This potent aromatic compound demonstrates a broad spectrum of
antimicrobial activity (Nuryastuti et al., 2009). Cinnamaldehyde has been shown to have
antibacterial activities against a number of Gram-negative and Gram-positive organisms, e.g.,
Escherichia coli O157:H7, Salmonella typhimurium, Clostridium botulinum, Staphylococcus
aureus (Morozumi, 1985). The important characteristic of cinnamaldehyde is its hydrophobicity,
which enables it to enter and disturb the lipid bilayer of the cell membrane and cause increased
permeability to protons (Jia et al., 2011). Cinnamaldehyde acts by uncoupling of oxidative
phosphorylation, inhibition of active transport, loss of pool metabolites and disturbing the
synthesis of DNA, RNA, proteins, lipids and polysaccharides by inhibiting the proton motive
force, respiratory chain, electron transfer and substrate oxidation (Nuryastuti et al., 2009). The
resulting extensive leakage from bacterial cells or the exit of critical molecules and ions leads to
cell death (Denyer, 1995; Nuryastuti et al., 2009).
Vanillin (4-hydroxy-3-methoxybenzaldehyde) is a major component of natural vanilla, (a
widely used flavouring material with generally regarded as safe status), which is a bean of the
tropical orchid Vanilla planifolia (Walton et al., 2003; Bythrow, 2006; Kappachery et al., 2010).
The mode of action of the phenylpropene phenolic aldehyde vanillin is not well understood, but
it has been proposed to function as a membrane-active compound that might have intracellular
targets. Being a phenolic compound, vanillin demonstrates antimicrobial and antioxidant
properties (Davidson and Naidu, 2000). Vanillin’s efficacy against both Gram-negative and
Gram-positive bacteria yeasts and molds has been demonstrated (Cerrutti et al. 1997; Lopez-
Malo et al. 1998; Fitzgerald et al. 2004). Vanillin inhibited respiration of E. coli and Listeria

59
innocua cells, and disrupted the potassium and pH homeostasis of Lactobacillus plantarum cells
(Fitzgerald et al., 2004). Fitzgerald et al. (2004) observed that treatment with vanillin disrupted
membrane integrity of only a sub-population of cells and it was proposed that although vanillin
primarily is a membrane- active compound, it may also have intracellular target sites.
Kigelia africana, commonly known, as the sausage tree of the Bignoniaceae family, is
commonly found in South, Central and West Africa. The semi-deciduous tree grows wild and
gets up to 25 m in height (Figure 5.1). K. africana has been known to be effective in the therapy
of primary and secondary infections of humans as well as a disinfectant. The antimicrobial
properties of K. africana leaves, fruits and bark against Gram-negative and Gram-positive
bacteria have been investigated and reported (Eldeen and Staden, 2007; Jeyachandran and
Mahesh, 2007; Shai et al., 2008).The fruits of K. africana are a popular source of traditional
medicine throughout Africa, and Grace et al. (2002) observed the antibacterial activity of K.
africana fruits against Gram-negative and Gram-positive bacteria. Fatty acids exhibiting
antibacterial activity, vermonosides γ, flavonoids, ᵞ-sitosterols and iridoids have been isolated
from the fruits and this supports the traditional use of the plant in therapy for bacterial infections
(Gouda et al., 2003; Picerno et al., 2005; Asekun et al., 2006; Olatunji and Olubunmi, 2009;
Saini et al., 2009). Houghton (2007) demonstrated the presence of 3b, 19a-dihydroxyurs-12-ene-
28oic acid, caffeic acid and chlorgeric acid in the fruits of K. africana and 7-0-glycoside in both
the fruits and leaves. Methanolic extracts of roots and fruits of K. africana demonstrate the
presence of naphthoquinones, kigelinone, iso-pinnatal, dehydro-α-lapachone, lapachol,
phenylpropanoids, phenylethanoid, derivatives, p-coumaric acid and freulic acid (Saini et al.,
2009).
Figure 4.1: Kigelia africana (Lam.) Benth. (Saini et al., 2009).

60
Aeromonas spp. are autochthonous in aquatic environments and as a result form normal
flora of fish and aquatic animals. In aquaculture, over-crowding and increased stress levels
predispose fish to develop infections caused by aeromonads (Yin et al., 2009). While prevention
and treatment of these infections can be achieved using chemotherapy, the dangers of increasing
incidences of drug resistance selected for by these synthetic antimicrobials have been reported
(Yin et al., 2009). Aeromonas spp. have been reported to be resistant to penicillins,
cephalosporins, aminoglycosides, macrolides, quinolones, and tetracyclines (Goni-Urriza et al.,
2000; Radu et al., 2003; Palu et al. 2006; Jun et al., 2010). This resistance can be transmitted by
resistance determinants (plasmids and integrons) through ingestion of contaminated water and
foods to humans (Janda and Abbott, 2010). Phytochemicals have gained special interest as
sources of natural antimicrobial and antioxidant agents because of the antimicrobial resistance of
microorganisms and the toxicities of synthetic antioxidants (Ozkan et al., 2010). In aquaculture,
phytochemicals promote various activities, including anti-stress, growth promotion appetite
simulation, tonic and immune-stimulation and antimicrobial properties (Yin et al., 2009).
Phytochemicals can be useful for the effective treatment of infectious fish diseases; enhancing
fish health and food safety and quality while conserving the aquatic environment (Yin et al.,
2009). Plant-derived phyto-medicines have great promise in the treatment of infectious disease
and thus represent a vast untapped source, which has the potential to combat pathogen infection
in aquaculture (Pakravan et al., 2011). Therefore, this study aimed to investigate the
antimicrobial activity of three phytochemical compounds; cinnamaldehyde, vanillin and Kigelia
africana fruit extracts on antimicrobial resistant aquatic Aeromonas spp.
4.2 Materials and methods
4.2.1 Maintenance of bacterial isolates
Ninety-three Aeromonas spp. and six Plesiomonas shigelloides isolates, cultured previously from
moribund or healthy koi carp, catfish, tilapia, and sea-water, were screened as well as two
Aeromonas spp. type strains viz; A. caviae ATCC 15468T and A. hydrophila ATCC 7966T.
Aeromonas spp. isolates were maintained on tryptic soy agar (TSA) plates and stored at 4 °C and
for long-term storage in tryptic soy broth containing 40 % glycerol at -70 °C (Jacobs and Chenia,
2007).

61
4.2.2 Preparation of crude K. africana fruit extracts
K. africana fruits were collected around the Westville Campus of University of KwaZulu-Natal.
Material was washed, dried, chopped, and oven-dried at 60°C, milled and stored in polythene
bags at 4°C. Crude extracts were prepared by sequential exhaustive extraction with ethyl acetate,
dichloromethane, and methanol by maceration and continuous shaking on an orbital shaker at
room temperature for 48 h (Kiplimo et al., 2011). Solvent extracts were concentrated using a
vacuum rotary evaporator, dried, dissolved in dimethylsulfoxide (DMSO) to a final
concentration of 100 mg/ml and stored at 4 ºC.
4.2.3 Phytochemical antimicrobial activity test against study isolates
Antimicrobial susceptibility to cinnamaldehyde, vanillin and four crude K. africana extracts
were determined using the disc diffusion method. Blank discs (MAST, UK) were impregnated
with 10 µl (1mg/ml), 125 µl (1mg/ml), 25 µl (10 mg/ml), 50 µl (10 mg/ml) and 125 µl (10
mg/ml) of cinnamaldehyde (Sigma); 5 µl (1 mg/ml), 20 µl (1 mg/ml) and 25 µl (10 mg/ml) of
vanillin (Sigma) and 40 µl (100 µg/ml) of K. africana ethyl acetate (EX1), 40 µl (100 µg/ml) of
dichloromethane (EX2), 100 µl (100 µg/ml)of methanol (EX3), and 40 µl (100 µg/ml) of hexane
(EX4) extracts and allowed to dry.
Bacterial isolates were grown overnight on TSA agar plates and the turbidity of the cell
suspensions were adjusted equivalent to that of a 0.5 McFarland standard. These were used to
inoculate Mueller-Hinton (MH) agar plates, by streaking swabs over the entire agar surface
followed by the application of the respective phytochemical extracts discs (CLSI, 2007). Plates
were then incubated for 24 h at 30 °C. Bacterial strains Escherichia coli ATCC 29522, A.
hydrophila ATCC 7966T and A. caviae ATCC 15468T were used as antimicrobial susceptibility
testing controls. Testing was done in duplicate and tetracycline (TE30; 30 mg) and ampicillin
(AMP10; 10 mg) discs were used as standard antimicrobial agent controls. Zone diameters were
determined and averaged and the following criteria were used to assign susceptibility or
resistance to phytochemicals tested: Susceptible (S) ≥ 15 mm, Intermediate (I) = 11 – 14 mm,
and Resistant (R) ≤ 0 – 10 mm. Criteria for assigning susceptibility or resistance to AMP10 were
as follows: (S) ≥ 17 mm, (I) = 14 – 16 mm, (R) ≤ 13 mm, while those for TE30 were: (S) ≥ 19
mm, (I) 15 – 18 mm, (R) ≤ 14 mm (CLSI, 2007).

62
Activity indices were calculated by comparing zones of inhibition obtained with each of
the extracts with those obtained with the standard antimicrobial agents, tetracycline and
ampicillin (Jeyachandran and Mahesh, 2007). The following equation was used: Activity index
(AI) = Inhibition diameter (mm) with test extract / Inhibition diameter (mm) with standard
antimicrobial agent.
4.3 RESULTS
4.3.1 Effect of phytochemicals on study isolates
Resistance to ampicillin was displayed by 64.6% (64/99) of isolates, while 56.5% (56/99) of
isolates demonstrated susceptibility to tetracycline (Table 4.1). Differences were observed in the
antimicrobial effect of cinnamaldehyde, vanillin and the K. africana extracts against the 93
Aeromonas spp., six P. shigelloides isolates and two type strains tested (Table 4.1; Appendix:
Table A1). No zones of inhibition were observed with all concentrations of vanillin tested (5, 20
and 250 µg/ml).
While 10 µg/ml of cinnamaldehyde did not demonstrate a bactericidal effect against all
isolates tested, 125, 250, 500 and 1250 µg/ml of cinnamaldehyde proved inhibitory for study
isolates (Table 4.1), with zone diameters ranging from 0 to 31 mm, 0 to 32 mm, 0 to 41 mm and
0 to 40 mm, respectively (Appendix: Table A1). Susceptibility was observed for 12.1% (12/99),
57.5% (57/99), 91.9% (91/99) and 98.9% (98/99) of study isolates as well as both type strains,
with 125, 250, 500 and 1250 µg/ml of cinnamaldehyde respectively (Table 4.1).
Zone diameters obtained with K. africana ethyl acetate extract (EX 1) ranged from 0 to
15 mm (Appendix: Table A1) with 78.7% (78/99) of isolates displaying resistance and 3.0%
(1/99) of isolates being susceptible (Table 4.1). Zone /diameters for the dichloromethane extract
(EX2) ranged from 0 to 13 mm (Appendix: Table A1) with 91.9% (91/99) of isolates displaying
resistance and no susceptibility being observed (Table 4.1). The methanol extract (EX3) zone
diameters ranged from 8 to 16.5 mm (Appendix: Table A1) with 13.1% (13/99) of isolates
displaying resistance, and 34.3% (34/99) of isolates being susceptible (Table 4.1). The hexane
extract (EX4) did not have an inhibitory effect on all study isolates and type strains, which
appeared to have no activity as there were no zones of inhibition (Appendix: Table A1). Among
study isolates the four different extracts exhibited varying ranges of activity, with the ethyl
acetate extract (EX 1) being the second most inhibitory against isolates. The methanol extract

63
(EX 3) was the most active against study isolates, while the dichloromethane (EX 2) and hexane
extracts (EX 4) were the least active against study isolates. While the two type strains A.
hydrophila 7966T and A. caviae 15468T were susceptible to TE30, 125 to 1250 µg/ml
cinnamaldehyde and the K. africana methanol extract (EX3), they displayed resistance to
AMP10, K. africana dichloromethane (EX2) and hexane (EX 4) extracts, and intermediate
susceptibility to K. africana ethyl acetate extract (EX1) (Table 4.1).
Table 4.1: Susceptibility analysis of ninety-three Aeromonas and six Plesiomonas spp. study
isolates to phytochemical extracts and standard antimicrobial agent
% Susceptibility/Resistance phenotype (number of isolates)
Phytochemical Susceptible Intermediate Resistant 125 µg/ml cinnamaldehyde 12 (12/99) 27 (27/99) 60 (60/99)
250 µg/ml cinnamaldehyde 57 (57/99) 26 (26/99) 16 (16/99)
500 µg/ml cinnamaldehyde 91(91/99) 7 (7/99) 1(1/99)
1250 µg/ml cinnamaldehyde 98 (98/99) 0 (99/99) 1 (1/99)
5 µg/ml vanillin 0 (99/99) 0 (99/99) 100 (99/99)
20 µg/ml vanillin 0 (99/99) 0 (99/99) 100 (99/99)
250 µg/ml vanillin 0 (99/99) 0 (99/99) 100 (99/99)
4 mg/ml K. africana EX 1 3 (3/99) 18 (18/99) 78 (78/99)
4 mg/ml K. africana EX 2 0 (99/99) 8 (8/99) 91 (91/99)
10 mg/ml K. africana EX 3 34 (34/99) 52 (52/99) 13 (13/99)
4 mg/ml K. africana EX 4 0 (99/99) 0 (99/99) 100 (99/99)
Ampicillin AMP10 8 (8/99) 27 (27/99) 64 (64/99)
Tetracycline TE30 56 (56/99) 35 (35/99) 8 (8/99)
4.3.2: Analysis of phytochemical effects on Aeromonas spp.
Isolates were assessed for susceptibility based upon species designation (Table 4.2). Upon
exposure to 500 and 1250 µg/ml cinnamaldehyde, there was complete susceptibility observed
across all Aeromonas species except for an A. allosaccharophila strain that was also resistant to
all phytochemicals tested and standards used. Aeromonas sobria strain was observed to be
resistant to all K. africana extracts used and 125 µg/ml of cinnamaldehyde, but was susceptible
to increased cinnamaldehyde concentrations (250 µg/ml, 500 µg/ml and 1250 µg/ml) and

64
tetracycline. A. bestiarum, A. culicicola, A. hydrophila, A. allosaccharophila, A. jandaei,
Aeromonas spp. 45 isolates displayed resistance to 250 µg/ml cinnamaldehyde, while isolates
belonging to the remaining Aeromonas and Plesiomonas species exhibited susceptibility (Table
4.2).
Analysis of percentage resistance based on source (Table 4.3) shows that none of the
catfish isolates were resistant to tetracycline while majority of the catfish and koi carp isolates
were resistant to ampicillin. Isolates displayed increased susceptibility on exposure to increasing
cinnamaldehyde concentrations, and greater susceptibility to K. africana EX 3 (Table 4.3).
Based on zones of inhibition obtained with phytochemicals and standard antimicrobial
agents, the relative activity indices were determined (Appendix: Table A2). An extract was
considered effective against an isolate if the activity index was ≥ 1 (Table 4.4). Ampicillin was
regarded a poor standard for comparison since 64.6% (64/99) of the study isolates exhibited
resistance (Table 4.1). Activity indices ranging from 0 to 1.286, 0 to 1.125, 0 to 1.929 and 0,
relative to ampicillin for the K. africana extracts (EX 1, EX 2, EX 3 and EX 4) (Appendix: Table
A2), respectively. Activity indices ranging from 0 to 2.385, 0 to 2.462, 0 to 2.846 and 0 to 4.353,
relative to tetracycline, were obtained when using 125, 250, 500 and 1250 µg/ml
cinnamaldehyde, respectively (Appendix: Table A2). Activity indices for the K. africana ethyl
acetate extract (EX 1) ranged from 0 to 1.273, the dichloromethane extract (EX 2) had activity
indices ranging from 0 to 0.909, the methanol extract (EX 3) activity indices ranged from 0 to
1.600 and the hexane extract (EX 4) had activity indices of 0 (Appendix: Table A2). Based on AI
≥ 1, 1250 µg/ml of cinnamaldehyde was the most effective.

65
Table 4.2 Analysis of percentage resistance of test isolates to phytochemicals based on species designation
Species C125* C250* C500* C1250* EX 1* EX 2* EX 3* EX 4* AMP10* TE30* A. bestiarum 68% (13/19) 26% (5/19) 0 0 89% (17/19) 100% (19/19) 16% (3/19) 100% (19/19) 79% (15/19) 0
A. culicicola 61% (11/18) 28% (5/18) 0 0 83% (15/18) 83% (15/18) 11% (2/19) 100% (18/18) 61% (11/18) 0
A. hydrophila 65% (11/17) 12% (2/17) 0 0 76% (13/17) 88% (15/17) 12% (2/17) 100% (17/17) 65% (11/17) 12% (2/17)
A. allosaccharophila 75% (6/8) 25% ( 2/8) 13% (1/8) 13% (1/8) 88% (7/8) 88% (7/8) 25% (2/8) 100% (8/8) 63% (5/8) 13% (1/8)
A. jandaei 57% (4/7) 14% (1/7) 0 0 71% (5/7) 100% (7/7) 0 100% (7/7) 57% (4/7) 14% (1/7)
Aeromonas spp. 45 60% (3/5) 20% (1/5) 0 0 60% (3/5) 80% (4/5) 20% (1/5) 100% (5/5) 80% (4/5) 20% (1/5)
Aeromonas spp. 75% (3/4) 0 0 0 75% (3/4) 100% (4/4) 25% (1/4) 100% (4/4) 25% (1/4) 0
Aeromonas spp. 310 33% (1/3) 0 0 0 67% (2/3) 67% (2/3) 0 100% (3/3) 100% (3/3) 0
A. caviae 33% (1/3) 0 0 0 100% (3/3) 100% (3/3) 0 100% (3/3) 33% (1/3) 67% (2/3) A. icthiosmia 33% (1/3) 0 0 0 33% (1/3) 100% (3/3) 0 100% (3/3) 33% (1/3) 0 A. veronii 67% (2/3) 0 0 0 67% (2/3) 100% (3/3) 0 100% (3/3) 67%( 2/3) 33% (1/3) A. salmonicida 50% (1/2) 0 0 0 50% (1/2) 100% (2/2) 0 100% (2/2) 100% (2/2) 0 A. sobria 100% (1/1) 0 0 0 100% (1/1) 100% (1/1) 100% (1/1) 100% (1/1) 100% (1/1) 0 P. shigelloides 33% (2/6) 0 0 0 83% (5/6) 100% (6/6) 17% (1/6) 100% (6/6) 50% (3/6) 0
* C125: 125 µg/ml; C250: 250 µg/ml; C500: 500 µg/ml and C1250: 1250 µg/ml cinnamaldehyde; EX 1: (4 mg/ml) K. africana ethyl acetate extract; EX 2: 4 mg/ml K. africana dichloromethane extract; EX 3: 10 mg/ml K. africana methanol extract; EX 4: 4 mg/ml K. africana hexane extract; AMP10: Ampicillin; TE30: Tetracycline.
TABLE 4.3 Analysis of percentage resistance of test isolates to phytochemicals used based on source of isolation
Source C125* C250* C500* C1250* EX 1* EX 2* EX 3* EX 4* AMP10* TE30* Catfish 47% (7/15) 13% (2/15) 0 0 82% (12/15) 82% (12/15) 13% (2/15) 100% (15/15) 67% (10/15) 0 Gold fish 59% (19/32) 19% (6/32) 3% (1/32) 3% (1/32) 78% (25/32) 91 % (29/32) 16% (5/15) 100% (32/32) 78% (25/32) 94% (3/32) Sea water 70% (14/20) 25% (5/20) 0 0 80% (16/20) 90% (18/20) 15% (3/20) 100% (20/20) 55% (11/20) 10% (2/20) Tilapia 63% (20/32) 9% (3/32) 0 0 78% (25/32) 100% (32/32) 9% (3/32) 100% (32/32) 56% (18/32) 9% (3/32)
* C125: 125 µg/ml; C250: 250 µg/ml; C500: 500 µg/ml and C1250: 1250 µg/ml cinnamaldehyde; EX 1: 4 mg/ml K. africana Ethyl acetate extract; EX 2: 4 mg/ml K. africana Dichloromethane extract; EX 3: 10 mg/ml K. africana Methanol extract; EX 4: 4 mg/ml K. africana Hexane extract; AMP10: Ampicillin; TE30: Tetracycline.

66
Table 4.4 Percentage of isolates with cinnamaldehyde and K. africana extracts activity
indices ≥1, relative to ampicillin (AMP10) and tetracycline (TE30).
Compound
% of isolates with activity indices ≥ 1
Study Isolates Type Strain* Ampicillin Tetracycline Ampicillin Tetracycline (AMP10) (TE30) (AMP10) (TE30)
125 µg/ml cinnamaldehyde 11.1 (11/99) 13.13 (13/99) 0 (0/2) 0 (0/2) 250 µg/ml cinnamaldehyde 30.30 (30/99) 40.40 (40/99) 0 (0/2) 0 (0/2) 500 µg/ml cinnamaldehyde 40.40 (40/99) 68.69 (69/99) 0 (0/2) 0 (0/2) 1250 µg/ml cinnamaldehyde 42.42 (42/99) 81.81 (81/99) 0 (0/2) 100 (2/2) 4 mg/ml K. Africana EX 1 7.07 (7/99) 6.06 (6/99) 0 (0/2) 0 (0/2) 4 mg/ml K. africana EX 2 4.04 (4/99) 0 (0/99) 0 (0/2) 0 (0/2) 10 mg/ml K. africana EX 3 29.29 (29/99) 33.33 (33/99) 0 (0/2) 0 (0/2) 4 mg/ml K. africana EX 4 0 (0/99) 0 (0/99) 0 (0/2) 0 (0/2)
*Type strains: A. caviae ATCC 15468T and A. hydrophila ATCC 7966T
4.4 DISCUSSION
There have been a number of studies that have used A. hydrophila as an indicator organism in
testing the efficacy of phytochemical extracts (Senthilkumar et al., 2005; MahfuzulHoque et al.,
2007; Pachanawan et al., 2008; Rajendiran et al., 2008; Siri et al., 2008; Acharyya et al., 2009;
Abdel-Tawwab et al., 2010; Awad and Austin, 2010; Dhayanithi et al., 2012). Ginger, garlic,
lupin, mango and stinging nettle have been observed to prevent A. hydrophila disease in rainbow
trout (Awad and Austin, 2010; Nya et al., 2010). MahfuzulHoque et al. (2007) observed very
low levels of inhibition with both the water and ethanol extracts of guava (MICs 1 – 4 mg/ml),
while neem extracts had no antibacterial activity against two A. hydrophila strains. Abdel-
Tawaad et al. (2010) observed that inclusion of green tea, Camellia sinensis, in Nile tilapia diet
increased fish health against A. hydrophila infection, while the use of Psidium guajava dry leaf
powder or dried ethanol extracts in fish-feed has been suggested to reduce mortality of A.
hydrophila infected tilapia (Pachanawan et al., 2008). The methanol extract of Excoecaria
agallocha leaves demonstrated antibacterial activity against A. hydrophila (MIC 500 µg/ml) in
Amphiprion sebae, a marine ornamental fish (Dhayanithi et al., 2012). Siri et al. (2008) observed
a dose-dependent response by A. caviae to phytochemicals extracted from 20 Thai plants.
Senthilkumar et al. (2005) observed that crude extract from three Indian medicinal plants

67
produced antibacterial activity against A. hydrophila at high concentrations of 2.5 – 10 mg/ml,
while Acharyya et al. (2005) screened nine medicinal plant methanol extracts against A.
hydrophila and observed MICs ranging from 1 -32 mg/ml.
All the concentrations (5, 20 and 250 µg/ml) of vanillin tested did not exhibit bactericidal
activity against the study isolates. This is in keeping with findings of Kappachery et al. (2010)
and Ponnusamy et al. (2009), who observed that vanillin does not have bactericidal effects at
concentrations ranging from 63 to 250 µg/ml. Rather vanillin inhibits quorum sensing and
biofilm development of A. hydrophila. Jay and Rivers (1984) have reported that vanillin was
more effective against fungi and non-lactic Gram-positive bacteria than Gram-negative bacteria,
while Fitzgerald et al. (2004) observed that vanillin had a time of exposure, concentration and
target organism dependency to its antimicrobial activity. It was also observed that vanillin had
bacteriostatic rather than bactericidal activity. It is possible that the resistance exhibited by
Aeromonas spp. in the present study is due to the bacteriostatic activity of vanillin.
Most isolates in the present study were susceptible to tetracycline while displaying high
level resistance to ampicillin. This is to be expected because of production of inducible
chromosomal β-lactamase in Aeromonas spp. (Ghengesh et al., 2008). The phytochemicals
tested in this study had varying ranges of activity indices (Appendix A.2), with 1250 µg/ml
cinnamaldehyde being the most effective. This concurs with findings of Morozumi (1978), who
observed that cinnamaldehyde bactericidal concentrations ranged from 100 - 200 µg/ml. Ooi et
al. (2006) observed that cinnamaldehyde inhibited both Gram-negative and Gram-positive
bacteria at concentrations from 75 - 600 µg/ml. Chang et al. (2001) observed that Cinnamomum
osmophloeum essential oil extract B with cinnamaldehyde as a major component (76%) had
excellent antibacterial activity against Gram-negative and Gram-positive bacteria at 250, 500 and
1000 µg/ml concentrations. Similarly, in the present study, cinnamaldehyde demonstrated
excellent antimicrobial activity at 250 - 1000 µg/ml. As cinnamaldehyde is a registered
flavouring and foodstuff with international food safety organizations (Zhou et al., 2007), its
application to aquaculture may be feasible.
The use of K. africana tree parts for the treatment of dermal, gastrointestinal and urinary
tract infections in traditional medicine has been validated by literature (Grace et al., 2002).
Eldeen and Van Staden (2007) observed that the dichloromethane, ethyl acetate and ethanol
extracts of K. africana leaf and stem bark demonstrated antibacterial activity against Gram-

68
negative and Gram-positive bacteria. Owolabi et al. (2007) suggested a narrow-spectrum activity
of ethanolic K. africana stem bark extract as no activity was observed against Gram-negative
bacteria. Grace et al. (2002) observed that the antibacterial activity of K. africana fruits against
Gram-negative and Gram-positive bacteria was due to the antimicrobial effects of a mixture of
three fatty acids (palmitic acid, nonanoic acid and 8-heptadecenoic acid) in an ethyl acetate fruit
extract. However in the present study, the ethyl acetate extract only moderately inhibited study
isolates while the dichloromethane extract proved less bactericidal against study isolates. The
methanolic K. africana extract (10 mg/ml) was effective with 33.3% (33/99) of study isolates
demonstrating activity indices ≥ 1 when compared to tetracycline. This is similar to the findings
of Jeyachandran and Mahesh (2007), who observed that this organic solvent was more suitable to
verify antibacterial activity against Gram negative bacteria. This might be as a result of
methanol being an amphiphilic compound and a good solvent for extraction, since it is able
solubilise polar compounds and many non-polar compounds (de Britto, 2012a and b). Studies
carried out by Dhayanithi et al. (2012) observed that the methanolic extract Excoecaria
agallocha used exhibited maximum activity against A. hydrophila. Based on survey of literature
available (Eldeen and Staden, 2007; Jeyachandran and Mahesh, 2007; Shai et al., 2008), there is
notable efficacy of the methanolic extract on Gram-negative bacteria. This efficacy is attributed
to exhaustive extraction quality of the organic solvent methanol, with methanol is able to
solubilise the bioactive compounds with antibacterial properties of medicinal plants
(Jeyachandran and Mahesh, 2007). The antimicrobial activity of the K. africana extracts is most
likely as a result of the synergistic action of the multiple bioactive compounds found within
them. The fruits of K. africana is known to contain flavonoids (Gouda et al., 2003; Saini et al.,
2009), which has the ability form complexes with the cell wall of bacteria thereby compromising
its integrity. Methanolic extracts of roots and fruits of K. africana demonstrates the presence of
naphthoquinones, kigelinone, iso-pinnatal, dehydro-α-lapachone, lapachol, phenylpropanoids,
phenylethanoid, derivatives, p-coumaric acid and freulic acid as the compounds responsible for
the observed antibacterial and antifungal activity (Saini et al., 2009). The ethyl acetate extract
moderately inhibited study isolates while the dichloromethane extract proved less inhibitory
against study isolates. There appeared to be a concentration dependent difference in the
inhibitory effects of cinnamaldehyde against Aeromonas spp. This was observed for 500 µg/ml
and 1250 µg/ml concentrations there was complete inhibition observed for test isolates except for

69
an A. allosaccharophila koi isolate that was resistant. Cinnamaldehyde exhibited greater efficacy
than tetracycline as an antimicrobial agent against study isolates and the K. africana methanol
extract was more effective than ampicillin as an antimicrobial agent against isolates.
In conclusion, the present study demonstrated that cinnamaldehyde and the methanol
extract of K. africana are promising candidates to be tested for their efficacy in the treatment of
multi-drug resistant aquatic Aeromonas species. Further investigations will have to be carried out
to ascertain the effects of antimicrobial agent synergy with cinnamaldehyde and K. africana
phytochemical compounds and phytotherapy of infected fish with these phytochemicals.

70
CHAPTER FIVE
ANTI-BIOFILM EFFECT OF CINNAMALDEHYDE, VANILLIN AND CRUDE K.
africana FRUIT EXTRACTS AGAINST RESISTANT AQUATIC A. bestiarum
ISOLATES
5.1 Introduction
Aeromonas species are known to be successful colonizers of diverse surfaces (Lynch et al., 2002;
Bechet and Blondeau, 2003; Elhariry, 2011; Angeles-Morales et al., 2012; Vinay et al., 2013;
Igbinosa, 2014). Their possession of pili, flagella and surface adhesins play an important role in
adhesion on animal and human mucosal surfaces (Kirov et al., 2004) and establishing infection
in hosts (Janda and Abbott, 2010). Biofilm formation is a feature of persistent infection and
characterizes up to 30% of Aeromonas gastroenteric infections (Kirov et al., 2004). Aeromonas
spp. in biofilm communities are observed to be increasingly pathogenic and resistant to many
antimicrobials (Igbinosa, 2014). Biofilm formation in Aeromonas has been described as a
virulence property of this genus, aiding survival and defence mechanisms against antimicrobials
in its environment (Angeles-Morales et al., 2012; Desai and Desai, 2014).
There are several specific biofilm phenotypes that are activated on formation of a biofilm
that makes bacteria increasingly resistant (Lopez, 2010). These phenotypes may be species-
specific or general in their resistance to antimicrobials (Drenkard, 2003). Comparison of the
physiology of biofilm bacteria with that of planktonic bacteria identifies an increased resistance
to many antimicrobial agents that are used in medicine and industry (Simoes et al., 2010; Fuente-
Nunez et al., 2013). Therefore, biofilm control is important as there is an increased risk in
infections associated with biofilms and with Aeromonas spp. their possession of mobile genetic
elements increases the risk of transfer and receipt of resistance genes within and across species in
biofilms.
Since planktonic bacteria are increasingly resistant and even more so when they are in
biofilms, development of new antimicrobials are required for effective biofilm control. Several
studies that have explored the different stages of biofilm development as targets for biofilm
control (Ponnusamy et al., 2009; Simoes et al., 2010; Fuente-Nunez et al., 2013; Kostakioti et
al., 2013). The most commonly targeted are the adhesion and the dispersal stages (Ponnusamy et
al., 2009; Simoes et al., 2010; Fuente-Nunez et al., 2013). Phytochemical compounds are thus

71
being investigated for their anti-adhesion and anti-biofilm properties (Borges et al., 2012).
Phytochemical compounds and plant extracts are able to inhibit biofilm formation and disperse
mature biofilms (Niu and Gilbert, 2004; Ponnusamy et al., 2009; Khan and Ahmad, 2011;
Millezi et al., 2013; Nazzaro et al., 2013). Borges et al. (2014) observed that dietary
phytochemical such as glucosinolates from cabbage, broccoli and cauliflower prevented
adhesion and biofilm formation of P. aeruginosa, S. aureus and Listeria monocytogenes. Husain
et al. (2013) observed that sub-MIC concentrations of clove oil inhibited biofilm formation of A.
hydrophila by reducing virulence properties such as protease and EPS production while not
affecting cell growth. Among the various known classes of phytochemicals, phenolic phyto-
compounds are reported to have great efficacy against biofilm formation by certain bacteria
(Vattem et al., 2007; Plyuta et al., 2013).
Cinnamaldehyde was observed to be bactericidal to Aeromonas species at 125 - 1250
µg/ml (Okolie and Chenia, 2013). It has also been observed to inhibit adhesion and biofilm
formation of Pseudomonas spp. and E. coli (Niu and Gilbert, 2004; Amalaradjou et al., 2010).
Cinnamaldehyde reduced the biofilm-forming ability of Burkholderia species by targeting QS
with an unknown mechanism of action (Brackman et al., 2009). Vanillin also a phenolic
phytochemical is a known QS inhibitor, able to inhibit both short and long chain AHLs in A.
hydrophila (Ponnusamy et al., 2009). Antimicrobial activity was not observed at concentrations
of 5, 20 and 250 µg/ml against A. hydrophila, A. caviae, A. icthiosmia, A. sobria, A. veronii, A.
salmonicida and A. bestiarum strains (Okolie and Chenia, 2013). However Kappachery et al.
(2010) observed that vanillin inhibited the biofilm formation of A. hydrophila at 0.18 mg/ml,
while Ponnusamy et al. (2014) observed biofilm reduction of A. hydrophila at concentrations of
0.063 – 0.25 mg/ml.
The antimicrobial activities of K. africana have been studied (Higgins et al., 2010;
Okolie and Chenia, 2013). K. africana fruit extracts exhibited varying levels of bactericidal and
bacteriostatic activities against Aeromonas spp. at concentrations of 4 – 10 mg/ml (Okolie and
Chenia, 2013). K. africana stem bark and fruit dichloromethane extracts contain antimicrobial
compounds such as norviburtinal and isopinnatal (Higgins et al., 2010). Several studies showed
that the fruit extracts contained γ-sitosterols, iridoids, phenlypropanoids, phenolics, flavonoids,
terpenoids, various oleic acids and essential fatty acids (Gouda, 2006; Saini et al., 2009; Higgins
et al., 2010).

72
Aeromonas species are successful colonizers of various biotic and abiotic surfaces
(Kregiel and Niedzielska, 2014). Although A. hydrophila and A. caviae (Bechet and Blondeau,
2003; Khajanchi et al., 2009; Jahid et al., 2014) are the most common models used in studying
biofilm formation in Aeromonas species, there is very little information available on biofilm
formation by other Aeromonas species and their control. A. bestiarum is an important fish
pathogen and is known to cause motile aeromonad septicemia (MAS) (Kozinska and Guz, 2004;
Turska-Szewczuk et al., 2013). They are reported to be multi-drug resistant to several classes of
antimicrobials (Kadlec et al., 2011). A. bestiarum in the present study was observed to be
multidrug resistant to penicillins, first, second and third generation cephalosporins, trimethoprim,
sulphamethoxazole, macrolides and aminoglycosides. It has been established that K. africana
fruit extracts possess both antimicrobial and anti-quorum sensing properties (Higgins et al.,
2010; Chenia, 2013), however, there is no information in literature about its anti-biofilm
activities. The aim of this study was thus to determine the anti-biofilm effect of trans-
cinnamaldehyde, vanillin and Kigelia africana fruit extracts against multi-drug resistant A.
bestiarum isolates.
5.2 Materials and Methods
5.2.1 Bacterial isolates
Aeromonas bestiarum (n = 19; Table 5.1) were selected for study. Antimicrobial resistance
phenotype (Duma, 2012), and source of isolation of the 19 A. bestiarum strains are shown in
Table 5.1. Type strains A. caviae ATCC 15468T and A. hydrophila ATCC 7966T were used as
controls for both the initial attachment and pre-formed, mature biofilm assays.
5.2.2 Effect of phytochemicals on initial attachment (IA) and mature biofilm (MB)
by A. bestiarum
Trans-cinnamaldehyde, vanillin, K. africana fruit extracts (as described in Chapter four) and
commercial 10% ethanol K. africana (PhytoForce, SA) extract, were used to determine their
effect on initial attachment and biofilm detachment using modified microtiter plate assays
(Basson et al., 2008). Isolates were grown overnight in TSB, washed three times with sterile
distilled water and the turbidity of the cell suspensions adjusted to that equivalent to a 0.5

73
McFarland standard. The first assay investigated the effect of phytochemicals and/or extracts on
initial attachment of aeromonad isolates.
Phytochemicals/extracts at a final concentration of 50 and 100 µg/ml trans-
cinnamaldehyde (Table 5.2), 100 and 250 µg/ml vanillin, 150 and 300 mg/ml of 10% ethanolic
(PhytoForce) extract of K. africana, and 0.5, 1, 2 and 4 mg/ml each of K. africana extracts (EX1,
EX2, EX3, and EX4) were added to 90 µl TSB and 10 µl of respective cell suspensions and
incubated for 24 h at 30 ºC with agitation.
For the second assay, biofilms were grown for 24 h without treatment at 30 ºC, following
which pre-formed biofilms were exposed to respective trans-cinnamaldehyde, vanillin, 10%
ethanolic extract of K. africana and K. africana fruit extracts in TSB (90 µl) and incubated for a
further 24 h at 30 ºC with agitation. The negative control contained only broth, while the positive
controls contained the respective cell suspensions in TSB with no phytochemicals added.
Contents of each well were aspirated, washed three times with 250 µl of sterile distilled
water and the remaining cells were fixed with 200 µl of methanol for 15 min. After air-drying,
wells were stained with 150 µl of 2% Hucker’s crystal violet for 5 min. Excess crystal violet was
removed by gently rinsing plates under running tap water and air dried. Dye bound to the
adherent cells was resolubilized with 150 µl of 33% (v/v) glacial acetic acid, and the optical
density (OD) of each well was obtained at 595 nm using the GloMax (Ascent F1, Thermo lab
systems). Tests were done in triplicate, on three occasions and the results averaged (Basson et
al., 2008). The OD595 nm of the control wells without phytochemicals were compared to wells
with phytochemicals to determine the effect of these phytochemicals on biofilm formation.
A measure of efficacy called Percentage biofilm reduction was calculated from the blank
(negative control), control (positive control), and treated absorbance values (Pitts et al., 2003):
Percentage reduction =[(C−B)− (T−B)
C−B] × 100, where B denotes the average absorbance per well
for blank wells (no biofilm, no treatment), C denotes the average absorbance per well for control
wells (biofilm, no treatment), and T denotes the average absorbance per well for treated wells
(biofilm and treatment).
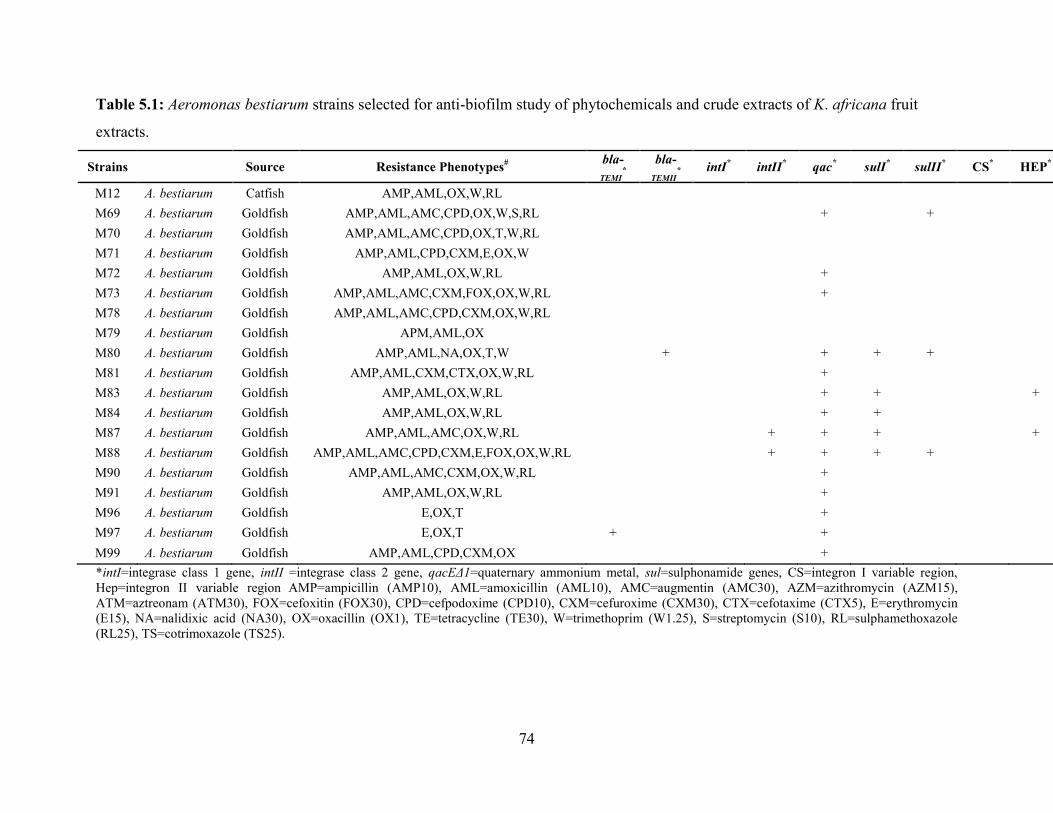
74
Table 5.1: Aeromonas bestiarum strains selected for anti-biofilm study of phytochemicals and crude extracts of K. africana fruit
extracts.
Strains Source Resistance Phenotypes# bla-TEMI
* bla-
TEMII* intI* intII* qac* sulI* sulII* CS* HEP*
M12 A. bestiarum Catfish AMP,AML,OX,W,RL M69 A. bestiarum Goldfish AMP,AML,AMC,CPD,OX,W,S,RL + + M70 A. bestiarum Goldfish AMP,AML,AMC,CPD,OX,T,W,RL M71 A. bestiarum Goldfish AMP,AML,CPD,CXM,E,OX,W M72 A. bestiarum Goldfish AMP,AML,OX,W,RL + M73 A. bestiarum Goldfish AMP,AML,AMC,CXM,FOX,OX,W,RL + M78 A. bestiarum Goldfish AMP,AML,AMC,CPD,CXM,OX,W,RL M79 A. bestiarum Goldfish APM,AML,OX M80 A. bestiarum Goldfish AMP,AML,NA,OX,T,W + + + + M81 A. bestiarum Goldfish AMP,AML,CXM,CTX,OX,W,RL + M83 A. bestiarum Goldfish AMP,AML,OX,W,RL + + + M84 A. bestiarum Goldfish AMP,AML,OX,W,RL + + M87 A. bestiarum Goldfish AMP,AML,AMC,OX,W,RL + + + + M88 A. bestiarum Goldfish AMP,AML,AMC,CPD,CXM,E,FOX,OX,W,RL + + + + M90 A. bestiarum Goldfish AMP,AML,AMC,CXM,OX,W,RL + M91 A. bestiarum Goldfish AMP,AML,OX,W,RL + M96 A. bestiarum Goldfish E,OX,T + M97 A. bestiarum Goldfish E,OX,T + + M99 A. bestiarum Goldfish AMP,AML,CPD,CXM,OX + *intI=integrase class 1 gene, intII =integrase class 2 gene, qacEΔ1=quaternary ammonium metal, sul=sulphonamide genes, CS=integron I variable region, Hep=integron II variable region AMP=ampicillin (AMP10), AML=amoxicillin (AML10), AMC=augmentin (AMC30), AZM=azithromycin (AZM15), ATM=aztreonam (ATM30), FOX=cefoxitin (FOX30), CPD=cefpodoxime (CPD10), CXM=cefuroxime (CXM30), CTX=cefotaxime (CTX5), E=erythromycin (E15), NA=nalidixic acid (NA30), OX=oxacillin (OX1), TE=tetracycline (TE30), W=trimethoprim (W1.25), S=streptomycin (S10), RL=sulphamethoxazole (RL25), TS=cotrimoxazole (TS25).

75
5.2.3 Statistical analysis
Differences in adhesion between untreated and treated samples were determined by Paired t-tests
or Wilcoxon signed rank tests if the homogeneity of variances test failed (Sigma Stat V3.5,
Systat Software, Inc; San Jose, CA, USA). Differences were considered significant if p< 0.05.
5.3 Results
5.3.1 Effect of phytochemicals on initial attachment and biofilm formation by
Aeromonas spp. isolates
Since cinnamaldehyde was bactericidal against study isolates at concentrations (125 - 1250
µg/ml; Chapter Four), sub-inhibitory concentrations of 50 and 100 µg/ml were used to ascertain
the anti-biofilm effect. Treatment with 50 µg/ml cinnamaldehyde decreased adhesion for both A.
caviae ATCC 15468T and A. hydrophila ATCC 7966T while 100 µg/ml increased adhesion of A.
caviae ATCC 15468T (Fig. 5.1). Treatment of A. bestiarum biofilms with 50 and 100 µg/ml
concentrations of cinnamaldehyde exhibited similar anti-biofilm activities. Following treatment
with 50 µg/ml cinnamaldehyde, decreased adhesion of 73.7% (14/19) of isolates, increased
adhesion of 21.1% (4/19) of isolates and no effect on 5.3% (1/19) of isolates was observed.
Treatment with 50 µg/ml in the initial attachment assay resulted in statistical significant altered
adherence (p = 0.025). The 100 µg/ml concentration decreased adhesion of 63.2% (12/19) of
isolates, increased adhesion of 26.3% (5/19) of isolates and had no effect on adhesion for 10.5%
(2/19) of isolates (Fig. 5.1). Treatment with 100 µg/ml in the initial attachment assay resulted in
statistical significant altered adherence (p = 0.123).
Decrease in adhesion for A. caviae ATCC 15468T and A. hydrophila ATCC 7966T were
observed on treatment with 100 and 250 µg/ml of vanillin (Fig. 5.2). While 5, 20 and 250 µg/ml
concentrations did not demonstrate antimicrobial activity against study isolates, the 100 and 250
µg/ml concentrations of vanillin exhibited similar activities against A. bestiarum biofilms. Where
the 100 µg/ml concentration decreased adhesion of 15.8% (3/19) of isolates and increased
adhesion for 84.2% (16/19) of isolates. Treatment with 100 µg/ml in the initial attachment assay
resulted in statistical significant altered adherence (p = 0.758).Treatment with 250 µg/ml
concentration decreased adhesion of 47.4% (9/19) of isolates, increased adhesion of 42.1%
(8/19) of isolates and had no effect on adhesion for 10.5% (2/19) of isolates (Fig. 5.2). Treatment

76
with 50 µg/ml in the initial attachment assay resulted in statistical significant altered adherence
(p = 0.011).
A. caviae isolate ATCC 15468T and A. hydrophila ATCC 7966T exhibited an increase in
adhesion on treatment with both concentrations of K. africana ethanol extract (Fig. 5.3).
Exposure to 150 µg/ml K. africana ethanol extract increased adhesion of 100% (19/19) of
isolates. Treatment with 150 µg/ml in the initial attachment assay resulted in statistical
significant altered adherence (p = 0.001).While 300 µg/ml decreased adhesion for 5.3% (1/19) of
isolates and increased adhesion for 94.7% (18/19) of isolates (Fig. 5.3). Treatment with 300
µg/ml in the initial attachment assay resulted in statistical significant altered adherence (p =
0.001).
The sub-inhibitory concentrations (0.5, 1 and 2 mg/ml) and inhibitory concentration (4
mg/ml) used for the four extracts of K. africana (EX1, EX2, EX3 and EX4) exhibited varying
levels of activities against A. bestiarum adhesion in the initial attachment assay (Fig. 5.1 – 5.7;
Table 5.2). For A. caviae ATCC 15468T, treatment with 0.5 and 2 mg/ml of the EX1 extract
increased adhesion while treatment with 1 and 4 mg/ml decreased adhesion. For A. hydrophila
ATCC 7966T, treatment with 0.5, 1 and 2 µg/ml decreased adhesion, while 4 mg/ml had no effect
on adhesion (Fig. 5.4). Reduction in adhesion was observed for 42.1% (8/19) of isolates and
increased adhesion of 57.9% (11/19) of isolates on treatment with 0.5 mg/ml of EX1. Treatments
with 1 mg/ml of extract resulted in decreased adhesion for 15.8% (3/19) of isolates and increase
in adhesion for 84.2% (16/19) of isolates. The 2 mg/ml concentration decreased adhesion for
31.6% (6/19) isolates and increased adhesion for 68.4% (13/19). Treatment with 0.5, 1 and 2
µg/ml in the initial attachment assay resulted in statistical significant altered adherence (p =
0.289), (p = 0.002), (p = 0.015) respectively.While the 4 mg/ml concentration decreased
adhesion for 47.4% (9/19) and increased adhesion for 52.6% (10/19) of isolates (Fig. 5.4).
Treatment with 4 µg/ml in the initial attachment assay resulted in statistical significant altered
adherence (p = 0.726).
Both A. caviae ATCC 15468T and A. hydrophila ATCC 7966T exhibited decreased
adhesion on treatment with all concentrations of EX2 extract (0.5, 1, 2 and 4 mg/ml) (Fig. 5.5).
Treatment of A. bestiarum isolates with 0.5 mg/ml EX2 extract decreased adhesion of 52.6%
(10/19) of isolates, increased adhesion of 36.4% (7/19) of isolates and had no effect on 10.5%
(2/19) of isolates. Treatment with 0.5 mg/ml in the initial attachment assay resulted in statistical

77
significant altered adherence (p = 0.961). Both 1 and 2 mg/ml concentrations decreased adhesion
of 42.1% (8/19) isolates, increased adhesion for 52.6% (10/19) and no effect on 5.3% (1/19) of
isolates. Treatment with 1 and 2 mg/ml in the initial attachment assay resulted in statistical
significant altered adherence (p = 0.080) (p = 0.325) respectively. Exposure to 4 mg/ml
concentration decreased adhesion of 42.1% (8/19) of isolates, increased adhesion of 47.4%
(9/19) of isolates and had no effect on 10.5% (2/19) of isolates (Fig. 5.5). Treatment with 4
mg/ml in the initial attachment assay resulted in statistical significant altered adherence (p =
0.812).
For EX3 extract, treatment of A. caviae ATCC 15468T with 0.5, 1 and 4 mg/ml decreased
adhesion, while 2 mg/ml increased adhesion. For A. hydrophila ATCC 7966T, treatment with all
concentrations (0.5, 1, 2 and 4 mg/ml) decreased adhesion (Fig. 5.6). Treatment of isolates with
0.5 mg/ml decreased adhesion of 36.8% (7/19) of isolates and increased adhesion of 63.1%
(12/19) of isolates. Treatment with 0.5 mg/ml in the initial attachment assay resulted in statistical
significant altered adherence (p = 0.150). Decreased adhesion of 26.3% (5/19) of isolates and
increased adhesion of 73.7% (14/19) of isolates was observed on treatment with 1, 2 and 4
mg/ml (Fig. 5.6). Treatment with 0.5, 1, 2 mg/ml in the initial attachment assay resulted in
statistical significant altered adherence (p = 0.008) (p = 0.015) (p = 0.006) respectively.
EX4 extract treatment of A. caviae ATCC 15468T at all concentrations (0.5, 1, 2 and 4
mg/ml) decreased adhesion, while for A. hydrophila ATCC 7966T, treatment with 0.5, 2 and 4
mg/ml decreased adhesion of biofilms and 1 mg/ml had no effect on adhesion (Fig. 5.7).
Treatment of study isolates with both 0.5 mg/ml EX4 extract decreased the adhesion of 15.8%
(3/19) of isolates, increased adhesion of 73.7% (14/19) of isolates and had no effect on adhesion
of 10.5% (2/19) of isolates. Treatment with 0.5 mg/ml in the initial attachment assay resulted in
statistical significant altered adherence (p = 0.006).Treatment with 2 mg/ml decreased the
adhesion for 21.1% (4/19) isolates and increased adhesion for 78.9% (15/19) isolates. Treatment
with 2 mg/ml in the initial attachment assay resulted in statistical significant altered adherence (p
= 0.001). While both 1 and 4 mg/ml decreased the adhesion for 10.5% (2/19) isolates and
increased adhesion for 89.5% (17/19) (Fig. 5.7). Treatment with 1 and 4 mg/ml in the initial
attachment assay resulted in statistical significant altered adherence (p = 0.001) (p = 0.001).

78
Figure 5.1: Effect of 50 and 100 μg/ml of cinnamaldehyde on initial attachment of A. bestiarum isolates following addition at the time
of inoculation, using micro-titre plate assays. Data represents the mean standard deviations of three replicates on three separate
occasions.
0.000
0.200
0.400
0.600
0.800
1.000
1.200
1.400
1.600
1.800
2.000
Abs
orba
nce
(595
nm
)
Isolates
untreated 50 µg/ml 100 µg/ml

79
Figure 5.2: Effect of 100 and 250 μg/ml vanillin on initial attachment of A. bestiarum isolates following addition at the time of
inoculation, using micro-titre plate assays. Data represents the mean standard deviations of three replicates on three separate
occasions.
0.000
0.200
0.400
0.600
0.800
1.000
1.200
1.400
1.600
1.800
2.000
Abs
orba
nce
(595
nm
)
Isolates
untreated 100 µg/ml 250 µg/ml

80
Figure 5.3: Effect of 150 and 300 μg/ml 10% K. africana ethanol (PhytoForce) extract on initial attachment of A. bestiarum isolates
following addition at the time of inoculation, using the micro-titre plate assays. Data represents the mean standard deviation of three
replicates on three separate occasions.
0.000
0.500
1.000
1.500
2.000
2.500
Abs
orba
nce
(595
nm
)
Isolates
untreated 150 µg/ml 300 µg/ml

81
Figure 5.4: Effect of 0.5, 1, 2 and 4 mg/ml ethyl acetate EX1 K. africana fruit extract on initial attachment of A. bestiarum isolates
following addition at the time of inoculation, using the micro-titre plate assays. Data represents the mean standard deviation of three
replicates on three separate occasions.
0.000
0.200
0.400
0.600
0.800
1.000
1.200
1.400
1.600
1.800
Abs
orba
nce
(595
nm
)
Isolates
untreated 0.5 mg/ml 1 mg/ml 2 mg/ml 4 mg/ml

82
Figure 5.5: Effect of 0.5, 1, 2 and 4 mg/ml dichloromethane EX2 K. africana fruit extract on initial attachment of A. bestiarum
isolates following addition at the time of inoculation, using the micro-titre plate assays. Data represents the mean standard deviation of
three replicates on three separate occasions.
0.000
0.200
0.400
0.600
0.800
1.000
1.200
1.400
1.600
1.800
Abs
orba
nce
(595
nm
)
Isolates
untreated 0.5 mg/ml 1 mg/ml 2 mg/ml 4 mg/ml

83
Figure 5.6: Effect of 0.5, 1, 2 and 4 mg/ml methanol EX3 K. africana fruit extract on initial attachment of A. bestiarum isolates
following addition at the time of inoculation, using the micro-titre plate assays. Data represents the mean standard deviation of three
replicates on three separate occasions.
0.000
0.200
0.400
0.600
0.800
1.000
1.200
1.400
1.600
1.800
2.000
Abs
orba
nce
(595
nm
)
Isolates
untreated 0.5 mg/ml 1 mg/ml 2 mg/ml 4 mg/ml

84
Figure 5.7: Effect of 0.5, 1, 2 and 4 mg/ml hexane EX4 K. africana fruit extract on initial attachment of A. bestiarum isolates
following addition at the time of inoculation, using the micro-titre plate assays. Data represents the mean standard deviation of three
replicates on three separate occasions.
0.000
0.200
0.400
0.600
0.800
1.000
1.200
1.400
1.600
1.800
2.000
Abs
orba
nce
(595
nm
)
Isolates
untreated 0.5 mg/ml 1 mg/ml 2 mg/ml 4 mg/ml

85
5.3.2 Effect of phytochemicals on mature biofilm of A. bestiarum isolates
Type strains A. caviae ATCC 15468T and A. hydrophila ATCC 7966T exhibited similar trends
where 50 and 100 µg/ml concentrations of cinnamaldehyde increased detachment of biofilm
(Fig. 5.8). Treatment of A. bestiarum biofilms with 50 and 100 µg/ml concentrations of
cinnamaldehyde exhibited varying anti-biofilm activities pre-formed biofilm assay. Following
treatment with 50 µg/ml increased detachment was observed for 63.2% (12/19) of isolates (Table
5.2) and increased adhesion for 36.8% (7/19) of isolates. Treatment with 50 µg/ml in the pre-
formed biofilms assay resulted in statistical significant altered adherence (p = 0.144). Exposure
to 100 µg/ml increased detachment for 57.9% (11/19) of isolates and increased adhesion for
42.1% (8/19) of isolates (Fig. 5.8). Treatment with 100 µg/ml in the pre-formed biofilms assay
resulted in statistical significant altered adherence (p = 0.457).
Increase in detachment of A. caviae ATCC 15468T and A. hydrophila ATCC 7966T
biofilms was observed on exposure to 100 and 250 µg/ml concentrations of vanillin (Fig. 5.9).
Treatment with 100 µg/ml in the pre-formed biofilms assay resulted in statistical significant
altered adherence (p = 0.799). Treatment with 100 and 250 µg/ml concentrations of vanillin
demonstrated similar activities against A. bestiarum biofilms. Exposure to 100 µg/ml increased
detachment for 63.2% (12/19) of isolates and increased adhesion for 36.8% (7/19) of isolates.
Treatment with 250 µg/ml increased detachment for 57.9% (11/19) of isolates and increased
adhesion for 42.1% (8/19) of isolates (Fig. 5.9). Treatment with 250 µg/ml in the pre-formed
biofilms assay resulted in statistical significant altered adherence (p = 0.145).
By contrast, A. caviae ATCC 15468T and A. hydrophila ATCC 7966T exhibited an
increase in adhesion on exposure to both concentrations of K. africana ethanol extract (Fig.
5.10). Treatment with both 150 and 300 µg/ml of K. africana ethanol extract increased
detachment for 10.5% (2/19) of isolates and increased adhesion of 89.5% (17/19) of isolates
(Fig. 5.10). Treatment with 150 µg/ml and 300 µg/ml in the pre-formed biofilms assay resulted
in statistical significant altered adherence (p = 0.001) (p = 0.001) respectively.
The various concentrations (0.5, 1, 2 and 4 mg/ml) used for the four K. africana (EX1,
EX2, EX3 and EX4) extracts exhibited varying levels of inhibition against A. bestiarum adhesion
in the pre-formed assay (Fig. 5.11 – 5.14; Table 5.2). Following treatment of A. caviae ATCC
15468T and A. hydrophila ATCC 7966T with 0.5, 1, 2 and 4 mg/ml EX1 extract, increased

86
detachment for biofilms was observed (Fig. 5.11). Treatment with 0.5 mg/ml EX1 extract
exhibited increased detachment for 47.4% (9/19) of isolates and increased adhesion for 52.6%
(10/19) of isolates. Treatment with 0.5 µg/ml in the pre-formed biofilms assay resulted in
statistical significant altered adherence (p = 0.395). Treatment with 1 mg/ml increased
detachment for 31.6% (6/19) of isolates and increased adhesion for 68.4% (13/19) of isolates.
Treatment with 1µg/ml in the pre-formed biofilms assay resulted in statistical significant altered
adherence (p = 0.059). Treatment with 2 mg/ml increased detachment for 31.6% (6/19) of
isolates, increased adhesion for 57.9% (11/19) of isolates and had no effect for 10.5% (2/19) of
isolates. Treatment with 2 µg/ml in the pre-formed biofilms assay resulted in statistical
significant altered adherence (p = 0.889).Treatment of isolates with 4 mg/ml increased
detachment for 42.1% (8/19) of isolates and increased adhesion for 57.9% (11/19) of isolates
(Fig. 5.11). Treatment with 4 µg/ml in the pre-formed biofilms assay resulted in statistical
significant altered adherence (p = 0.241).
Treatment of A. caviae ATCC 15468T with 0.5 and 1 mg/ml EX2 extract increased
detachment of biofilms, while 2 and 4 mg/ml had no effect. For A. hydrophila ATCC 7966T 0.5,
1 and 2 mg/ml increased detachment for biofilms, while 4 mg/ml had no effect (Fig. 5.12).
Following treatment with 0.5, 2 and 4 mg/ml of EX2 extract, increased detachment for 47.4%
(9/19) of isolates and increased adhesion for 52.6% (10/19) of isolates was observed. Treatment
with 0.5, 2 and 4 µg/ml in the pre-formed biofilms assay resulted in statistical significant altered
adherence (p = 0.703) (p = 0.619) and (p = 0.609) respectively. Treatment with 1 mg/ml
increased detachment for 26.3% (5/19) of isolates, increased adhesion for 63.2% (12/19) of
isolates and had no effect on 10.5% (2/19) of isolate (Fig. 5.12). Treatment with 1 µg/ml in the
pre-formed biofilms assay resulted in statistical significant altered adherence (p = 0.039).
For A. caviae ATCC 15468T exposure to 0.5, 1, 2 and 4 mg/ml of EX3 extract increased
detachment for biofilms, while for A. hydrophila ATCC 7966T treatment with 1, 2 and 4 mg/ml
increased detachment for biofilms and the 0.5 mg/ml had no effect (Fig. 5.13). Treatment of test
isolates with 0.5 mg/ml EX3 extract increased detachment for 42.1% (8/19) of isolates and
increased adhesion for 57.9% (11/19) of isolates. Treatment with 0.5 µg/ml in the pre-formed
biofilms assay resulted in statistical significant altered adherence (p = 0.942). Increased
detachment for 36.8% (7/19) of isolates, increased adhesion for 57.9% (11/19) of isolates and no
effect against 5.3% (1/19) of isolate was observed on treatment with 1 mg/ml. Treatment with 1

87
µg/ml in the pre-formed biofilms assay resulted in statistical significant altered adherence (p =
0.172). Following treatment with 2 mg/ml, increased detachment for 42.1% (8/19) of isolates and
increased adhesion for 57.9% (11/19) of isolates was observed. Treatment with 2 µg/ml in the
pre-formed biofilms assay resulted in statistical significant altered adherence (p = 0.807).
Exposure of isolates to 4 mg/ml increased detachment for 36.8% (7/19) of isolates and increased
adhesion for 63.2% (12/19) of isolates (Fig. 5.13). Treatment with 4 µg/ml in the pre-formed
biofilms assay resulted in statistical significant altered adherence (p = 0.414).
For A. caviae ATCC 15468T treatment with all concentrations (0.5, 1, 2 and 4 mg/ml) of
EX4 extract increased detachment for biofilms, while for A. hydrophila ATCC 7966T treatment
with 0.5, 1, and 2 mg/ml increased detachment for biofilms and the 4 mg/ml had no effect (Fig.
5.14). Treatment of test isolates with 0.5 mg/ml EX4 extract, increased detachment for 21.1%
(4/19) of isolates and increased adhesion for 78.9% (15/19) of isolates. Treatment with 0.5 µg/ml
in the pre-formed biofilms assay resulted in statistical significant altered adherence (p = 0.008).
Exposure to 1 mg/ml increased detachment for 10.5% (2/19) of isolates, increased adhesion for
84.2% (16/19) of isolates and had no effect on 5.3% (1/19) of isolates. Treatment with 1 µg/ml in
the pre-formed biofilms assay resulted in statistical significant altered adherence (p =
0.002).Treatment of isolates with 2 mg/ml increased detachment for 15.8% (3/19) of isolates and
increased adhesion for 84.2% (16/19) of isolates. Treatment with 2 µg/ml in the pre-formed
biofilms assay resulted in statistical significant altered adherence (p = 0.010). Exposure to 4
mg/ml increased detachment for 10.5% (2/19) of isolates, increased adhesion for 78.9% (15/19)
of isolates and had no effect for 10.5% (2/19) of isolate (Fig. 5.14). Treatment with 4 µg/ml in
the pre-formed biofilms assay resulted in statistical significant altered adherence (p = 0.005).

88
Figure 5.8: Effect of 50 and 100 μg/ml cinnamaldehyde on pre-formed biofilm of A. bestiarum isolates following addition to 24 h
biofilm, using micro-titre plate assays. Data represents the mean standard deviation of three replicates on three separate occasions.
0.000
0.500
1.000
1.500
2.000
2.500
Abs
orba
nce
(595
nm
)
Isolates
untreated 50 µg/ml 100 µg/ml

89
Figure 5.9: Effect of 100 and 250 μg/ml vanillin on pre-formed biofilm of A. bestiarum isolates following addition to 24 h biofilm,
using micro-titre plate assays. Data represents the mean standard deviation of three replicates on three separate occasions.
0.000
0.500
1.000
1.500
2.000
2.500
Abs
orba
nce
(595
nm
)
Isolates
untreated 100 µg/ml 250 µg/ml

90
Figure 5.10: Effect of 150 and 300 μg/ml commercial ethanol K. africana extract (PhytoForce) on pre-formed biofilm of A. bestiarum
isolates following addition to 24 h biofilm, using micro-titre plate assays. Data represents the mean standard deviation of three
replicates on three separate occasions.
0.000
0.500
1.000
1.500
2.000
2.500
Abs
orba
nce
(595
nm
)
Isolates
untreated 150 µg/ml 300 µg/ml

91
Figure 5.11: Effect of 0.5, 1, 2 and 4 mg/ml ethyl acetate EX1 K. africana fruit extract on pre-formed biofilm of A. bestiarum isolates
following addition to 24 h biofilm, using micro-titre plate assays. Data represents the mean standard deviation of three replicates at
three separate occasions.
0.000
0.500
1.000
1.500
2.000
2.500
Abs
orba
nce
(595
nm
)
Isolates
untreated 0.5 mg/ml 1 mg/ml 2 mg/ml 4 mg/ml

92
Figure 5.12: Effect of 0.5, 1, 2 and 4 mg/ml dichloromethane EX2 K. africana fruit extract on pre-formed biofilm of A. bestiarum
isolates following addition to 24 h biofilm, using micro-titre plate assays. Data represents the mean standard deviation of three
replicates on three separate occasions.
0.000
0.500
1.000
1.500
2.000
2.500
Abs
orba
nce
(595
nm
)
Isolates
untreated 0.5 mg/ml 1 mg/ml 2 mg/ml 4 mg/ml

93
Figure 5.13: Effect of 0.5, 1, 2 and 4 mg/ml methanol EX3 K. africana fruit extract on pre-formed biofilm of A. bestiarum isolates
following addition to 24 h biofilm, using micro-titre plate assays. Data represents the mean standard deviation of three replicates at
three separate occasions.
0.000
0.500
1.000
1.500
2.000
2.500
Abs
oban
ce (5
95 n
m)
Isolates
untreated 0.5 mg/ml 1 mg/ml 2 mg/ml 4 mg/ml

94
Figure 5.14: Effect of 0.5, 1, 2 and 4 mg/ml hexane EX4 K. africana fruit extract on pre-formed biofilm of A. bestiarum isolates
following addition to 24 h biofilm, using micro-titre plate assays. Data represents the mean standard deviation of three replicates at
three separate occasions.
0.000
0.500
1.000
1.500
2.000
2.500
Abs
orba
nce
(595
nm
)
Isolates
untreated 0.5 mg/ml 1 mg/ml 2 mg/ml 4 mg/ml

95
Table 5.2: Effect of phytochemicals and K. africana extracts on initial attachment and pre-
formed biofilm of A. bestiarum strains
5.3.3 Analysis of percentage biofilm reduction data of A. bestiarum isolates in
presence of phytochemicals/ extracts for initial attachment (IA) and mature
biofilm (MB) assays
The percent reduction following phytochemical/extracts treatments at time of inoculation and on
pre-formed biofilm, respectively, are shown in Table 5.3. For initial attachment assays, 50 µg/ml
cinnamaldehyde treatment inhibited initial attachment of 68.4% (13/19) of isolates. Percent
reduction for 50 µg/ml cinnamaldehyde ranged from 1.18 to 39.79% and percent induction
ranged from 0.70 to 140.56% (Table 5.3). Cinnamaldehyde treatment (100 µg/ml) inhibited
Phytochemicals Initial attachment Pre-formed biofilm
% Decrease % Increase % No effect % Decrease % Increase % No effect
Cinnamaldehyde (50 μg/ml) 21.1 (4/19) 73.7 (14/19) 5.3 (1/19) 63.2 (12/19) 36.8 (7/19) 0 (100 μg/ml) 63.2 (12/19) 26.3 (5/19) 10.5 (2/19) 57.9 (11/19) 36.8 (7/19) 5.3 (1/19) Vanillin (100 μg/ml) 15.8 (3/19) 84.2 (16/19) 0 36.8 (7/19) 63.2 (12/19) 0 (250 μg/ml) 47.4 (9/19) 42.1 (8/19) 10.5 (2/19) 42.1 (8/19) 57.9 (11/19) 0 Kigelia africana ethanol (150 mg/ml) 0 100 (19/19) 0 10.5 (2/19) 89.5 (17/19) 0 (300 mg/ml) 5.3 (1/19) 89.5 (17/19) 5.3 (1/19) 10.5 (2/19) 89.5 (17/19) 0 EX1: EA (0.5 mg/ml) 52.6 (10/19) 36.8 (7/19) 10.5 (2/19) 47.4 (9/19) 52.6 (10/19) 0 (1 mg/ml) 42.1 (8/19) 52.6 (10/19) 5.3 (1/19) 26.3 (5/19) 89.5 (12/19) 10.5 (2/19) (2 mg/ml) 42.1 (8/19) 52.6 (10/19) 5.3 (1/19) 47.4 (9/19) 52.6 (10/19) 0 (4 mg/ml) 42.1 (8/19) 47.4 (9/19) 10.5 (2/19) 47.4 (9/19) 52.6 (10/19) 0 EX2: DCM (0.5 mg/ml) 42.1 (8/19) 57.9 (11/19) 0 47.4 (9/19) 52.6 (10/19) 0 (1 mg/ml) 15.8 (3/19) 84.2 (16/19) 0 31.6 (6/19) 68.4 (13/19) 0 (2 mg/ml) 31.6 (6/19) 68.4 (13/19) 0 31.6 (6/19) 57.9 (11/19) 10.5 (2/19) (4 mg/ml) 47.4 (9/19) 52.6 (10/19) 0 31.6 (6/19) 68.4 (13/19) 0 EX3: MeOH (0.5 mg/ml) 15.8 (3/19) 78.9 (15/19) 5.3 (1/19) 21.1 (4/19) 78.9 (15/19) 0 (1 mg/ml) 10.5 (2/19) 89.5 (17/19) 0 5.3 (1/19) 84.2 (16/19) 10.5 (2/19) (2 mg/ml) 21.1 (4/19) 78.9 (15/19) 0 15.8 (3/19) 84.2 (16/19) 0 (4 mg/ml) 10.5 (2/19) 89.5 (17/19) 0 10.5 (2/19) 78.9 (15/19) 10.5 (2/19) EX4: HEX (0.5 mg/ml) 36.8 (7/19) 63.2 (12/19) 0 42.1 (8/19) 57.9 (11/19) 0 (1 mg/ml) 21.1 (4/19) 78.9 (15/19) 0 36.8 (7/19) 57.9 (11/19) 5.3 (1/19) (2 mg/ml) 21.1 (4/19) 78.9 (15/19) 0 42.1 (8/19) 57.9 (11/19) 0 (4 mg/ml) 21.1 (4/19) 78.9 (15/19) 0 36.8 (7/19) 63.2 (12/19) 0

96
initial attachment of 78.9% (15/19) of isolates. Percent reduction ranging from 0.30 to 57.93%
and percent induction ranging from 3.10 to 55.47%.
Treatment with 100 µg/ml vanillin inhibited initial attachment of 52.6% (10/19) of
isolates (Table 5.3). Its percent reduction ranged from 0.45 to 42.00% and percent induction
ranged from 1.88 to 91.94%. While 250 µg/ml vanillin inhibited initial attachment of 15.8%
(3/19) of isolates, its percent reduction ranged from 4.31 to 29.86% and percent induction ranged
from 2.27 to 73.53%.
Exposure to 150 mg/ml K africana ethanol extract (PhytoForce) did not inhibit initial
attachment of isolates (Table 5.3), rather it induced adhesion for isolates and percent induction
ranged from 8.14 to 206.07%. Exposure to 300 mg/ml K africana ethanol extract inhibited initial
attachment of 5.3% (1/19) of isolates.
Treatment with 0.5 mg/ml K africana EX1 extract inhibited initial attachment of 42.10%
(8/19) of isolates (Table 5.3). Percent reduction for 0.5 mg/ml K africana EX1 extract ranged
from 6.33 to 34.21% and percent induction ranged from 9.58 to 72.79%. Exposure of isolates to
1 mg/ml inhibited initial attachment of 15.8% (3/19) of isolates and its percent reduction ranged
from 2.12 to 18.09% and percent induction ranged from 1.21 to 84.28%. Treatment with 2 mg/ml
inhibited initial attachment for 31.60% (6/19) with a range of 3.81 to 22.14% reduction percent
and 10.33 to 56.34% percent induction. The 4 mg/ml concentration inhibited initial attachment
for 47.40% (9/19). Its percent reduction ranged from 3.10 to 51.987% and percent induction
ranged from 2.89 to 73.90%. K africana EX2 extract 0.5 mg/ml treatment inhibited initial
attachment of 47.40% (9/19) of isolates (Table 5.3). Percent reduction for 0.5 mg/ml K africana
EX2 extract ranged from 2.03 to 39.29% and percent induction ranged from 0.03 to 67.83%.

97
Table 5.3: Percentage biofilm reduction in the presence of phytochemicals and K. africana fruit extracts on initial attachment (IA)
and mature biofilms (MB) of A. bestiarum multidrug resistant isolates.
*% biofilm reduction A. caviae A. hydrophila M12 M69 M70 M71 M72
Phytochemicals *IA *MB IA MB IA MB IA MB IA MB IA MB IA MB
Cinnamaldehyde (50 μg/ml) -8.57 12.2 22.36 32.87 -27.02 -111.43 18.87 23.63 -11.89 -24.97 39.79 6.74 -140.56 -68.53
(100 μg/ml) 15.03 40.16 32.97 51.35 -3.1 -94.01 25.54 -6.6 0.3 -25.04 57.93 11.08 -33.37 -41.75
Vanillin (100 μg/ml) 8.75 17.41 18.36 29.47 -16.14 -29.15 -3.19 -17.91 -35.43 -22.75 8.15 4.4 -91.94 -71.96
(250 μg/ml) 31.18 2.08 32.81 38.38 -31.42 -91.7 -51.08 -27.75 -6.04 -38.65 -3.67 -4.61 -73.53 -84.63
Kigelia africana ethanol (150 mg/ml) -57.4 -102.46 -41.06 -37.36 -206.07 -158.81 -29.29 -55.96 -85.3 -43.77 -54.1 -10.96 -134.61 -204.7
(300 mg/ml) -99.45 -108.61 -61.1 -49.04 -199.95 -161.07 -15.24 -68.31 -120.97 -71.95 -44.57 -27.22 -170.37 -229.41
EX1: EA (0.5 mg/ml) -13.52 1.31 8.68 9.49 -65.78 -28.13 -13.97 6.33 -15.15 -45.66 -23.23 6.4 -67.56 -87.63
(1 mg/ml) 5.85 9.04 18.39 2.82 -56.82 -136.24 -16.88 -25.8 -18.4 -49.95 -28.85 4.73 -75.93 -144.48
(2 mg/ml) -13.77 12.45 28.65 28.96 -56.34 -22.76 5.79 0.45 -41.37 -12.39 -24.83 17.35 -56.31 -135.74
(4 mg/ml) 1.6 23.26 -0.47 2.59 -73.9 -38.33 -2.89 -18.48 -16.11 -12.2 -35.45 8.87 -45.7 -143.01
EX2: DCM (0.5 mg/ml) 16.66 13.57 30.93 23.06 -63.44 -86.84 5.23 -28.34 -9.36 -35.51 15.31 8.2 -61.63 -35.38
(1 mg/ml) 31.99 26.64 21.35 5.51 -72.52 -133.04 10.48 -28.62 -33.63 -44.92 -0.98 5.74 -117.06 -93.37
(2 mg/ml) 15.9 0.17 40.41 28.29 -48.41 -65.52 -6.5 -38.19 -21.55 -20.15 -31.31 4.5 -93.47 -111.7
(4 mg/ml) 2.8 0.52 19.48 0.92 -63.09 -63.96 -0.73 -18.58 -8.16 -16.24 -3.25 9.09 -38.14 -90.93
EX3: MeOH (0.5 mg/ml) 19.16 12.53 19.75 0.01 -68.35 -49.04 15.17 -25.86 -9.02 -40.63 41.34 11.64 -68.3 -80.24
(1 mg/ml) 3.03 3.3 28.91 27.29 -68.26 -153.68 -23.6 -20.29 -16.26 -43.93 16.25 -0.82 -77.33 -113.78
(2 mg/ml) -9.67 3.03 40.05 37.27 -73.11 -87.66 -5.76 -19.83 -17.56 -17.33 13.59 10.4 -68.72 -151.98
(4 mg/ml) 17.33 14.92 27.57 29.09 -53.38 -113.86 7.23 -3.26 -19.44 -49.97 -15.05 -4.64 -68.07 -145.4
EX4: HEX (0.5 mg/ml) 31.19 14.47 6.63 1.19 -59.5 -53.15 9.23 -18.15 -40.38 -47.31 -18.89 3.33 -56.49 -132.32
(1 mg/ml) 18.95 12.85 -2.51 9.63 -102.24 -111.24 -39.88 -29.32 -47.61 -45.71 -14.61 -2.37 -84.85 -143.9
(2 mg/ml) 45.69 15.83 -5.28 37.44 -131.55 -35.11 -45.85 -16.73 -60.06 3.54 -28.34 -2.78 -107.28 -174.59
(4 mg/ml) 16.73 12.42 -14.66 -0.64 -137.19 -3.81 3.18 -29.83 -55 -1.05 -52.55 -8.39 -118.03 -135.47

98
*% biofilm reduction
M73 M78 M79 M80 M81 M83 M84
Phytochemicals IA MB IA MB IA MB IA MB IA MB IA MB IA MB
Cinnamaldehyde (50 μg/ml) -68.40 -30.04 -13.00 -27.03 12.41 -24.24 14.73 -3.87 19.54 40.50 2.84 32.35 19.74 17.95
(100 μg/ml) -55.47 -28.96 14.06 2.06 29.78 -20.87 28.51 32.90 21.36 57.40 31.56 28.59 40.86 45.07
Vanillin (100 μg/ml) -16.70 -38.03 1.59 -1.12 0.45 6.06 -15.38 30.73 -12.86 14.86 15.82 30.19 -1.89 34.04
(250 μg/ml) -26.14 -35.48 -3.24 -10.14 4.31 14.62 -29.44 1.09 -8.64 7.88 4.85 -16.91 -9.37 34.52
Kigelia africana ethanol (150 mg/ml) -79.59 -47.69 -18.58 -27.09 51.02 -16.07 -9.25 -72.71 -93.82 9.24 -14.59 -73.49 -80.64 27.04
(300 mg/ml) -93.19 -66.51 -57.67 -16.40 97.20 -19.82 5.47 -57.41 -66.86 10.32 -11.73 -93.80 -112.89 22.87
EX1: EA (0.5 mg/ml) -71.08 -32.16 9.00 1.52 13.13 30.83 7.20 -75.24 10.36 3.82 -6.08 -72.43 -9.58 49.80
(1 mg/ml) -83.91 -28.66 -13.36 -1.89 22.01 19.29 -3.59 -56.79 -11.92 11.96 -4.02 -46.86 -28.81 20.13
(2 mg/ml) -52.23 -36.77 5.42 6.65 10.33 55.01 -19.15 -65.98 -51.30 6.46 -13.71 -29.79 22.14 48.32
(4 mg/ml) -44.02 -36.34 22.36 12.94 11.59 69.44 16.24 -60.65 -14.37 6.46 -13.84 -25.37 27.31 50.28
EX2: DCM (0.5 mg/ml) -0.44 -29.19 13.26 32.35 2.03 13.14 -0.03 15.24 -1.03 43.53 13.62 -14.94 35.34 42.20
(1 mg/ml) -23.16 -34.04 3.73 16.79 28.84 -12.29 -1.34 -9.31 7.01 7.48 13.95 -44.89 -44.18 25.46
(2 mg/ml) -31.39 -8.84 3.16 11.35 5.76 30.71 -15.74 -25.80 22.97 11.47 6.23 -14.85 -55.42 48.89
(4 mg/ml) -76.85 -29.02 -1.22 8.98 14.66 38.17 12.98 -34.29 0.24 10.71 -5.77 -18.28 -22.67 45.14
EX3: MeOH (0.5 mg/ml) -71.96 -22.10 0.97 -13.17 18.26 22.01 -5.59 13.72 16.49 46.27 5.47 -10.09 9.80 14.27
(1 mg/ml) -94.70 -19.16 -13.12 -25.05 15.27 -11.79 -3.41 13.17 -7.53 37.36 3.47 -24.68 4.52 22.85
(2 mg/ml) -89.57 -6.31 -14.17 -34.90 2.80 12.50 -19.38 -7.06 -18.65 42.32 -14.98 -13.26 16.90 44.54
(4 mg/ml) -11.62 -15.83 -13.99 -51.35 10.40 4.30 -24.51 -4.02 -3.20 38.15 -24.81 -31.95 7.07 30.21
EX4: HEX (0.5 mg/ml) -67.60 -34.02 -11.20 -36.46 34.21 -17.90 -4.98 -17.33 -15.88 3.25 -20.62 -64.96 -61.27 37.05
(1 mg/ml) -71.63 -32.39 -5.02 -36.40 48.24 -18.87 -24.10 -44.51 -27.14 13.09 -33.89 -77.07 -67.33 33.97
(2 mg/ml) -48.69 -27.82 -8.34 -46.49 48.12 -25.24 -30.26 -58.16 -66.93 8.60 -38.05 -68.85 -60.41 44.43
(4 mg/ml) -43.98 -35.17 -25.95 -15.28 63.68 -9.88 -22.71 -76.39 -80.29 12.57 -36.72 -61.20 -70.50 56.43

99
*% biofilm reduction
M87 M88 M90 M91 M96 M97 M99
Phytochemicals IA MB IA MB IA MB IA MB IA MB IA MB IA MB
Cinnamaldehyde (50 μg/ml) 19.60 -7.85 27.11 44.37 33.40 34.53 1.18 10.24 -0.77 11.91 6.45 9.04 6.40 41.28
(100 μg/ml) 35.96 -19.24 42.13 30.06 42.31 34.30 8.38 4.78 20.94 18.07 4.88 14.61 13.56 52.68
Vanillin (100 μg/ml) 11.02 -7.55 42.00 -20.69 9.96 25.05 11.78 -14.02 8.95 17.07 4.14 -56.93 -1.88 2.07
(250 μg/ml) -9.58 -28.14 29.86 -23.71 -2.74 12.18 -41.14 -56.19 -2.49 19.42 -4.76 -42.09 -16.78 30.09
Kigelia africana ethanol (150 mg/ml) -8.17 -27.66 -8.14 -3.43 -26.34 -10.53 -39.93 -111.54 -34.21 -15.12 -44.25 -77.30 -90.12 -58.58
(300 mg/ml) -21.88 -28.8 -2.46 -33.90 -41.30 -19.37 -20.53 -100.50 -29.83 -23.36 -38.05 -126.81 -112.64 -59.98
EX1: EA (0.5 mg/ml) 34.21 -8.41 31.66 -8.40 26.48 36.42 -34.59 -14.85 19.25 3.05 -16.43 -2.24 -72.79 4.69
(1 mg/ml) -1.21 -23.63 17.94 -7.61 18.09 33.18 -40.49 -31.37 2.12 -4.31 -42.74 -9.83 -84.28 -6.59
(2 mg/ml) 12.91 0.05 30.94 -12.36 3.81 35.62 -14.05 -20.76 -11.02 -6.37 -15.14 -28.07 -55.16 -7.84
(4 mg/ml) 33.70 -10.10 51.98 -5.28 11.42 32.6 -24.27 -55.28 25.34 -7.86 3.10 -25.21 -64.35 -14.96
EX2: DCM (0.5 mg/ml) 7.27 -0.86 39.29 -9.56 29.32 25.69 -24.55 -29.98 -6.88 6.63 -13.35 -11.13 -67.83 20.18
(1 mg/ml) 5.17 -19.92 17.50 -26.20 21.99 35.36 -22.63 -64.27 -18.78 -0.35 6.83 -59.36 -68.81 -0.72
(2 mg/ml) 37.73 3.86 50.11 56.29 19.59 48.87 1.65 -12.47 -6.96 8.59 5.38 -46.06 -54.90 -2.26
(4 mg/ml) 37.23 7.57 52.07 71.92 43.36 51.46 -16.05 -39.55 13.90 3.78 -0.75 -49.59 -46.13 -2.85
EX3: MeOH (0.5 mg/ml) -5.24 -22.25 27.85 16.32 2.89 22.30 -11.49 -1.69 12.33 8.28 -24.82 -2.65 -73.86 -8.28
(1 mg/ml) -3.81 -24.79 9.78 26.54 -12.43 6.34 -33.63 -31.14 13.06 7.08 -13.76 47.07 -90.52 6.11
(2 mg/ml) -6.23 -7.16 8.50 15.27 13.87 16.66 -10.53 -10.32 2.82 0.56 -8.65 47.01 -54.38 9.15
(4 mg/ml) -11.01 -15.34 -7.47 27.19 16.82 23.13 -36.53 -21.44 10.25 4.11 -6.43 -25.48 -82.26 18.99
EX4: HEX (0.5 mg/ml) 21.04 -19.75 33.39 -17.59 -0.68 -16.65 -29.54 -21.50 12.32 4.79 -0.26 -28.63 -79.45 -9.40
(1 mg/ml) -10.88 -21.58 21.38 -21.47 -14.94 -16.62 -43.63 -42.61 18.40 -0.11 -45.49 -76.77 -97.92 -25.23
(2 mg/ml) 4.68 -7.35 42.80 -14.38 -11.39 -16.61 -32.28 -55.69 3.46 -5.68 10.66 -52.15 -56.85 -31.72
(4 mg/ml) -3.20 -14.76 25.13 -12.53 -13.14 -9.46 -32.08 -58.93 25.63 -6.45 -9.65 -74.45 -66.06 -36.90 *IA = initial attachment, MB = mature biofilm, %Biofilm reduction = [ ((C − B) − (T − B))/(C − B) ] × 100. Where B=average absorbance per well for blank wells, C = average absorbance per well for control wells, T = average absorbance per well for treated wells (Pitts et al., 2003).

100
Exposure of isolates to 1 mg/ml inhibited initial attachment of 42.10% (8/19) of isolates,
and its percent reduction ranged from 3.73 to 21.99% while the percent induction ranged from
0.98 to 117.06%. Treatment with 2 mg/ml inhibited initial attachment for 42.10% (8/19) with a
range of 1.65 to 50.11% reduction percent and 5.76 to 93.47% percent induction. The 4 mg/ml
concentration inhibited initial attachment for 36.8% (7/19), while its percent reduction ranged
from 0.24 to 52.07% and percent induction ranged from 0.73 to 63.04%.
Treatment with 0.5 mg/ml K africana EX3 extract inhibited initial attachment of 42.10%
(8/19) of isolates (Table 5.3). Percent reduction for 0.5 mg/ml K africana EX3 extract ranged
from 0.97 to 41.34% and percent induction ranged from 5.24 to 73.86%. Exposure of isolates to
1 mg/ml inhibited initial attachment of 26.30% (5/19) of isolates. Its percent reduction ranged
from 3.47 to 16.25% and percent induction ranged from 3.81 to 94.70%. Treatment with 2 mg/ml
inhibited initial attachment for 26.30% (5/19) with a range of 2.82 to 16.90% reduction percent
and 2.80 to 89.57% percent induction. The 4 mg/ml concentration inhibited initial attachment for
21.10% (4/19). Its percent reduction ranged from 7.07 to 16.827% and percent induction ranged
from 3.20 to 82.26%.
Treatment with 0.5 mg/ml K africana EX4 extract inhibited initial attachment of 15.80%
(3/19) of isolates (Table 5.3). Percent reduction for 0.5 mg/ml K africana EX4 extract ranged
from 12.32 to 33.39% and percent induction ranged from 0.26 to 79.45%. Exposure of isolates to
1 mg/ml inhibited initial attachment of 10.5% (2/19) of isolates. Its percent reduction ranged
from 18.40 to 21.38% and percent induction ranged from 5.02 to 102.24%. Treatment with 2
mg/ml inhibited initial attachment for 21.10% (4/19) with a range of 3.46 to 42.80% reduction
percent and 11.37 to 107.28% percent induction. The 4 mg/ml concentration inhibited initial
attachment for 10.50% (2/19). Its percent reduction ranged from 3.18 to 25.137% and percent
induction ranged from 3.20 to 137.19%.
In the pre-formed biofilm assays, 50 µg/ml cinnamaldehyde inhibited the biofilm of
74.1% (11/19) of isolates (Table 5.3). Percent reduction for 50 µg/ml cinnamaldehyde ranged
from 6.74 to 44.37% and percent induction ranged from 3.87 to 111.43%. The 100 µg/ml
cinnamaldehyde treatment inhibited the biofilm of 63.2% (12/19) of isolates, while the percent
reduction for 100 µg/ml cinnamaldehyde ranged from 02.06 to 57.40% and percent induction
ranged from 6.60 to 94.01%.

101
Treatment with 100 µg/ml vanillin inhibited the biofilm of 47.4% (9/19) of isolates
(Table 5.3). Percent reduction for 100 µg/ml vanillin ranged from 2.07 to 34.04% and percent
induction ranged from 1.12 to 71.96%, while 250 µg/ml vanillin inhibited the biofilm of 36.8%
(7/19) of isolates. Percent reduction for 250 µg/ml vanillin ranged from 1.09 to 34.52% and
percent induction ranged from 4.61 to 91.70%.
Exposure to 150 mg/ml K africana ethanol extract (PhytoForce) inhibited the biofilm of
15.8% (3/19) of isolates (Table 5.3). Its percent reduction ranged from 9.24 to 27.64% and
percent induction ranged from 3.43 to 158.81. While 300 mg/ml K africana ethanol extract
treatment inhibited the biofilm of 15.8% (3/19). Its percent reduction ranged from 10.32 to
23.36% and percent induction ranged from 16.40 to 229.41.
Treatment with 0.5 mg/ml K africana EX1 extract inhibited the biofilm of 47.40% (9/19)
of isolates (Table 5.3). Percent reduction for 0.5 mg/ml K africana EX1 extract ranged from 1.52
to 49.80% and percent induction ranged from 2.24 to 87.63%. Exposure of isolates to 1 mg/ml
inhibited the biofilm of 26.30% (5/19) of isolates. Its percent reduction ranged from 4.73 to
33.18% and percent induction ranged from 1.89 to 144.48%. Treatment with 2 mg/ml inhibited
the biofilm for 42.10% (8/19) with a range of 0.45 to 55.01% reduction percent and 6.37 to
135.74% percent induction. The 4 mg/ml concentration inhibited the biofilm for 31.60% (6/19).
Its percent reduction ranged from 6.46 to 69.447% and percent induction ranged from 5.28 to
143.01%.
Exposure to 0.5 mg/ml K africana EX2 extract inhibited the biofilm of 47.40% (9/19) of
isolates (Table 5.3). Percent reduction for 0.5 mg/ml K africana EX2 extract ranged from 8.20 to
43.53% and percent induction ranged from 0.86 to 86.84%. Exposure of isolates to 1 mg/ml
inhibited the biofilm of 26.30% (5/19) of isolates. Its percent reduction ranged from 5.74 to
35.36% and percent induction ranged from 0.72 to 133.04%. Treatment with 2 mg/ml inhibited
the biofilm for 47.40% (9/19) with a range of 3.86 to 56.29% reduction percent and 2.26 to
111.70% percent induction. The 4 mg/ml concentration inhibited the biofilm for 47.40% (9/19).
Its percent reduction ranged from 3.78 to 71.92% and percent induction ranged from 2.85 to
90.93%.
Treatment with 0.5 mg/ml of K africana EX3 extract inhibited the biofilm of 42.10%
(8/19) of isolates (Table 5.3). Percent reduction for 0.5 mg/ml K africana EX3 extract ranged
from 8.28 to 46.27% and percent induction ranged from 1.69 to 80.24%. Exposure of isolates to

102
1 mg/ml inhibited the biofilm of 36.8% (7/19) of isolates. Its percent reduction ranged from 6.11
to 37.36% and percent induction ranged from 0.82 to 153.68%. Treatment with 2 mg/ml
inhibited the biofilm for 42.10% (8/19) with a range of 0.86 to 44.54% reduction percent and
6.31 to 151.98% percent induction. The 4 mg/ml concentration inhibited the biofilm for 36.80%
(7/19). Its percent reduction ranged from 4.11 to 38.15% and percent induction ranged from 3.26
to 145.40%.
Exposure to 0.5 mg/ml K africana EX4 extract inhibited the biofilm of 21.10% (4/19) of
isolates (Table 5.3). Percent reduction for 0.5 mg/ml K africana EX4 extract ranged from 3.25 to
37.05% and percent induction ranged from 9.40 to 53.15%. Exposure of isolates to 1 mg/ml
inhibited the biofilm of 10.5% (2/19) of isolates. Its percent reduction ranged from 13.09 to
33.97% and percent induction ranged from 0.11 to 143.90%. Treatment with 2 mg/ml inhibited
the biofilm for 15.80% (3/19) with a range of 3.45 to 44.43% reduction percent and 2.78 to
174.59% percent induction. The 4 mg/ml concentration inhibited the biofilm for 10.50% (2/19).
Its percent reduction ranged from 12.57 to 56.43% and percent induction ranged from 1.05 to
135.47%.
5.4 Discussion
In aquaculture, antimicrobial resistance is increasingly being observed and is responsible for
losses going up to millions annually (Cabello et al., 2013). Aeromonas spp. are known fish
pathogens forming biofilms in their aquatic environment and are resistant to various
antimicrobials used in aquaculture (Janda and Abbott, 2010; Igbinosa and Okoh, 2013). In this
study the effects of cinnamaldehyde, vanillin, K. africana fruit extracts (EX1, EX2, EX3 and
EX4), as well as commercially available ethanolic K. africana extract were investigated for their
anti-biofilm properties against multidrug resistant A. bestiarum isolates.
There have been several studies on aeromonad biofilm formation (Bechet and Blondeau,
2003; Khajanchi et al., 2009; Jahid et al., 2014), however, none have used A. bestiarum as a
study model. A. bestiarum is an important fish pathogen that is multidrug resistant to several
antimicrobials presently in use (Kadlec et al., 2011). Data from this study shows that A.
bestiarum isolates sourced from ornamental fish and catfish are multidrug resistant to ampicillin,
trimethoprim, sulphamethoxazole and first, second and third generation cephalosporins (Table
5.1).

103
Plants are being extensively investigated for novel antimicrobial and anti-pathogenic
phytochemicals that attenuate virulence properties (Chenia, 2013; Husain et al., 2013; Nazzaro et
al., 2013). All concentrations of phytochemicals and K africana extracts used in this study
seemed promising as anti-biofilm agents (Table 5.2). However these phytochemicals/extracts
were more effective in treating performed biofilms than initial attachment (Tables 5.2 and 5.3).
Cinnamaldehyde is a known phytochemical, with anti-quorum sensing and anti-biofilm
properties (Brackman et al., 2008; Niu et al., 2006). In the present study, the sub-inhibitory
concentrations (50 and 100 µg/ml) of cinnamaldehyde were more effective in treating initial
attachment than pre-formed biofilms (Tables 5.2 and 5.3). In contrast, Amalaradjou et al. (2010)
observed an eradication of 24 h pre-formed biofilms of uropathogenic E. coli on treatment with
250 µg/ml of cinnamaldehyde. However for type strains A. caviae and A. hydrophila the sub-
inhibitory cinnamaldehyde concentrations were more effective in treating pre-formed biofilms
(Tables 5.2 and 5.3).
Vanillin has been shown to be a suitable and sustainable anti-biofilm agent, which
inhibits biofilm formation without affecting cell growth (Ponnusamy et al., 2009; Kappachery et
al., 2010). Kappachery et al. (2010) observed that 0.063 – 0.25 mg/ml concentrations of vanillin
reduced biofilm formation and biofilm biomass thickness of A. hydrophila considerably over
seven days while not inhibiting planktonic cell growth. In the present study, 100 µg/ml
concentration of vanillin was more effective against initial attachment than pre-formed biofilms.
However, 250 µg/ml was more effective against pre-formed biofilms than initial attachment
(Tables 5.2 and 5.3). In contrast, Kappachery et al. (2010) observed that 0.063 – 0.25 mg/ml
concentrations of vanillin had no effect on 24 h pre-formed biofilms. It is important to note the
difference in aeromonad models used, as multidrug A. bestiarum biofilms may behave differently
than A. hydrophila biofilms. For type strains A. caviae and A. hydrophila both concentrations of
vanillin were effective in treating initial attachment and pre-formed biofilms (Tables 5.2 and
5.3).
Kigelia africana is used traditionally in the treatment of a cornucopia of infections
ranging from skin infections to urinary tract infections (Saini et al., 2009; Dada et al., 2010;
Higgins et al., 2010). In addition to their antimicrobial activities, K. africana fruit extracts have
also been explored for its anti-pathogenic uses (Chenia, 2013). Sub-MIC and MIC of K. africana

104
fruit extracts (0.31 – 8.20 mg/ml) were active against QSing inhibition in C. violaceum without
reducing cell growth (Chenia, 2013).
Data from this study shows that K. africana EX2 fruit extract was the second most
effective phytochemical/extract used in treating initial attachment and pre-formed biofilms
(Table 5.2 and 5.3). There is no information in current literature on anti-biofilm effects of K.
africana fruit extracts. However, Chenia (2013) observed the efficacy of K. africana extracts
(EX1, EX2, EX3 and EX4) against QS in Chromobacterium violaceum in the order EX4 > EX2
> EX1 > EX3. This substantiates results from this study as biofilm formation is a virulence
property of bacteria controlled by QS phenomenon. Overall, other fruit extracts of K. africana
used were effective against initial attachment and pre-formed biofilms in the order EX2 > EX3 >
EX1 > EX4, while K. africana ethanolic extract (PhytoForce) (150 and 300 mg/ml), induced
adhesion in both initial attachment and pre-formed biofilm assays (Tables 5.2 and 5.3). Exposure
of type strains A. caviae and A. hydrophila to various concentrations of K. africana fruit extracts
showed that they were more effective in treating preformed biofilms than initial attachment
(Table 5.2 and 5.3).
In conclusion, cinnamaldehyde was more effective in inhibiting initial attachment and
pre-formed biofilms of multidrug A. bestiarum than other phytochemical/extracts used in this
study. Future work can be designed to elucidate the anti-biofilm mode of action of these
phytochemicals/extracts against multidrug resistant A. bestiarum.

105
CHAPTER SIX
CONCLUSIONS
Aeromonas spp. are primary and opportunistic pathogens of humans and animals and they are
responsible for great economic losses in aquaculture. They are ubiquitous in aquatic
environments, this increases contact and infection rate with this genus (Janda and Abbott, 2010).
Antimicrobial resistance is increasingly being described in aeromonads and they are known to be
associated with resistance determinants and mobile genetic elements such as integrons, plasmids
and transposons (Janda and Abbott, 2010). Aeromonas spp. are also known biofilm formers,
although, A. caviae and A. hydrophila are the two most studied models. Phytochemicals are
being explored in the search for alternative and sustainable antimicrobial agents (Siri et al., 2008;
Dhayanithi et al., 2012; de Britto et al., 2011; de Britto et al., 2012a, b). This study thus
investigated the presence of genetic resistance determinants in Aeromonas spp. and the
antimicrobial and anti-biofilm effect of phytochemicals and crude fruit K. africana extracts on
resistance isolates of Aeromonas spp.
The blaTEM gene was observed to be the most prevalent beta-lactamase gene among study
isolates (34.3%; 34/99). Although ESBL resistance was observed in study isolates, correlating
gene phenotypic resistance with gene content was not possible as the blaSHV gene wasn’t
identified among the eight ESBL producers. Three isolates (M81, M82 and M88) were positive
for both blaCTX-M-15 and blaCTX-M genes.
Antimicrobial resistance determinants such as integrons have been previously identified
in Aeromonas spp. (Chang et al., 2007; Jacobs and Chenia, 2007; Maravic et al., 2013). Study
isolates were observed to possess class 1 (10.1%; 10/99) and class 2 (23.2%; 23/99) integrons
and 12.1% (12/99) were noted to be positive for both class 1 and 2 integrons. The sul gene
(46.4%; 46/99) was identified with two primer sets sulI and sulII. Although not all isolates that
were positive for intI (30%; 3/10) and intII (17%; 4/23) integrons were positive for ths sul gene.
The qacEΔ1 gene was observed to be prevalent among study isolates with 64% (64/99) being
positive for this gene.
Cinnamaldehyde (250 – 1250 µg/ml) was observed to be the most effective
phytochemical against study isolates. Of the four K. africana fruit extracts tested, the methanol
extract (4 mg/ml) was more effective in inhibiting study isolates. Although vanillin possesses
anti-biofilm properties, all concentrations used were observed to be ineffective in inhibiting

106
study isolates. Overall the K. africana extracts efficacy was in the order EX3 > EX1 > EX2 >
EX4.
Cinnamaldehyde was the best phytochemical/extract used in initial attachment assay, all
concentrations (50 and 100 µg/ml) used were effective against A. bestiarum biofilms. The second
most effective phytochemical/extract used was the K. africana EX2 (dichloromethane), it was
observed that EX2 was effective against A. bestiarum biofilms in both initial attachment and pre-
formed biofilm assays. All of vanillin used (100 and 250 µg/ml) was effective against A.
bestiarum biofilms in both initial attachment and pre-formed biofilm assays.
Future studies may target the elucidation of the mode of action of
phytochemicals/extracts against Aeromonas spp., the active antimicrobial and anti-biofilm
compounds in K. africana extracts (EX1, EX2, EX3 and EX4) and possible synergistic use of
phytochemicals and K. africana extracts with standard antimicrobials against Aeromonas spp. in
aquaculture.
107
REFERENCES Abbot, S. L., and J. M. Janda. 2010. The genus Aeromonas: Taxonomy, pathogenicity and infection. Clinical Microbiology Reviews 23:35-73. Abd-El-Rhnan, A. M. M. 2009. Antagonism of Aeromonas hydrophila by propolis and its effect on the performance of Nile tilapia, Oreochromis niloticus. Fish and Shellfish Immunology 27:454-459. Abdel-Tawwab, M., Ahmad, M. H., Seden, M. E. A., and Sakr, S. F. M. 2010.Use of green tea, Camellia sinensis L., in practical diet for growth and protection of Nile tilapia, Oreochromis niloticus (L.), against Aeromonas hydrophila infection. Journal of the World Aquaculture Society 41:203-213. Acharyya, S., A. Patra, and P. K. Bag. 2009. Evaluation of the antimicrobial activity of some medicinal plants against enteric bacteria with particular reference to multi-drug resistant Vibrio cholerae. Tropical Journal of Pharmaceutical Research 3:231-237. Adeleye, I. A., R. O. Nwanze, F. V. Daniels, V. A. eyinnia, S. I. Smith, M. A. Fowora and H. A. Goodluck. 2010. Non-plasmid mediated multi-drug resistance in Vibrio and Aeromonas spp. isolated from seafoods in Lagos. International Journal of Food Safety 12:10-15. Akinbowale, O. L., H. Peng, and M. D. Barton. 2007. Diversity of tetracycline resistance genes in bacteria from aquaculture sources in Australia. Journal of Applied Microbiology 103:2016-2025. Amalaradjou, M.A.R., A. Narayanan, S.A. Baskaran, and K. Venkitanarayanan. 2010. Antibiofilm effect of trans-cinnamaldehyde on uropathogenic Escherichia coli. Journal of Urology 184: 358-363. Ardo, L., G. Yin, P. Xu, L. Váradi, G. Szigeti, Z. Jeney. 2008. Chinese herbs (Astragalus membranceus and Lonicera Japonica) and boron enhance the none-specific immune response of Nile tilapia, (Oreochromis niloticus), and resistance against Aeromonas hydrophila. Aquaculture 275:26-33 Aravena-Romàn, M., T. J. J. Inglis, B. Henderson, T. V. Riley, B. J. Chang. 2011. Antimicrobial susceptibility of Aeromonas spp. isolated from clinical and environmental sources to 26 antimicrobial agents. Antimicrobial Agents and Chemotherapy 8:3006-3008. Asekun, O.T., E. Olusegun and O. Adebola. 2007. The volatile constituents of the leaves and flowers of Kigelia africana Benth. Flavor and Fragrance Journal 22:21-23. Asha, A., D.K. Nayak, K.M. Shankar, and C.V. Mohan. 2004. Antigenic expression in biofilm cells of Aeromonas hydrophila employed in oral vaccination of fish. Fish and Shellfish Immunology 16: 429–436.

108
Ausubel, F. M., R. Brent, R. E. Kingston, D. D. Moore, J. G. Seidman, J. A. Smith, and K. Struhl.1989. Current protocols in molecular biology. John Wiley and Sons, New York, USA 2:241-245. Awad, E., and B. Austin. 2010. Use of Lupinous perennis, mango, Mangifera indica and stinging nettle, Urtica dioica, as feed additives to prevent Aeromonas hydrophila infection in rainbow trout, Oncorhynchus Mykiss (Walbaum). Journal of Fish Diseases 33:413-420. Azu, O. O., F. I. O. Duru, A. A. Osinobi, C. C. Naronha, S. O. Elesha, and A. O. Okanlawon. 2010. Protective agent, Kigelia africana fruit extract, against cisplatin-induced kidney oxidant injury in Sprague-Dawley rats. Asian Journal of Pharmaceutical and Clinical Research 2:84-88. Balsalobre, C. L., M. Dropa, D. E. De oliveira, N. Lincopan, E. M. Mamizuka, G. R. Matte and M. H. Matte. 2010. Presence of BLATEM_116 gene in environment isolates of Aeromonas hydrophila and Aeromonas jandaei from Brazil. 2010. Brazilian Journal of Microbiology 41:718-719. Balsalobre, L.C., M. Dropa, N. Lincopan, E.M. Mamizuka, G.R. Matte, and M.H. Matte. 2009. Detection of metallo β-lactamases-encoding genes in environmental isolates of Aeromonas hydrophila and Aeromonas jandaei. Letters in Applied Microbiology 49:142-145. Basson, A., L.A. Flemming, and H.Y. Chenia. 2008. Evaluation of adherence, hydrophobicity, aggregation, and biofilm development of Flavobacterium johnsoniae-like isolates. Microbial Ecology 55:1-14. Balassiano, I. T., M. C. F. Bastos, D. J. Madureira, I. G. da Silva, A. C. frietas-almeida, S. S oliveira. 2007. The involvement of tetA anf tetE tetracycline resistance genes in plasmid and chromosomal resistance of Aeromonas in Brazilian strains. Memorias do Instituto Oswald Cruz 102:861-866. Beaz-Hidalgo, R., A. Aperi, N. Bujan, J. L. Ronald, M. J. Figueras. 2010. Composition of phenotypical and genetic identification of Aeromonas strains isolated from diseased fish. Systematic Applied Microbiology 33:149-153. Beaz-Hidalgo, R., A. Martnez-Murcia and M. J. Figueras. 2013. Reclassification of Aeromonas hydrophila subsp. dhakensis Huys et al. 2002 and Aeromonas aquariorum Martinez-Murcia et al. 2008 as Aeromonas dhakensis sp. nov. comb. nov. and emendation of the species Aeromonas hydrophila. Systematic and Applied Microbiology 36:171-176. Bechet, M., and R. Blondeau. 2003. Factors associated with the adherence and biofilm formation by Aeromonas caviae on glass surfaces. Journal of Applied Microbiology 94:1072-1078. Behlau, I., and M.S. Gilmore. 2008. Microbial biofilms in ophthalmology and infectious disease. Archives of Ophthalmology 126:1572-1581.

109
Bhat, R. S., and S. Al-Daihan. 2014. Phytochemical constituents and antibacterial activity of some green leafy vegetables. Journal of Tropical Biomedicine 4: 189-193. Binh, C. T. T., H. Heuer, M. Kaupenjohann and K. Smalla. 2009. Diverse aadA gene cassettes on class 1 integrons introduced into soil via spread manure. Research in Microbiology 160:427-433. Birnboim, H. C., and J. Doly. 1979. A rapid alkaline extraction procedure for screening recombinant plasmid DNA. Nucleic Acids Resistance 7:1513-1523. Borges, A., M. J. Saavedra and M. Simoes. 2012. The activity of ferulic and gallic acids in biofilm prevention and control of pathogenic bacteria. Biofouling 28:755-767. Borges, A., L. C., M. J. Saavedra and M. Simoes. 2014. The action of selected isothiocyanates on bacterial biofilm prevention and control. International Biodeterioration and Biodegradation 86:25-33. Boucher, Y., M. Labbate, J. E. Koenig & H. W. Stokes. 2007. Integrons: mobilizable platforms that promote genetic diversity in bacteria. Trends in Microbiology 15:301–309. Brackman, G., U. Hillaert, S. Van Calenbergh, H.J. Nelis, and T. Coenye. 2009. Use of quorum sensing inhibitors to interfere with biofilm formation and development in Burkholderia multivorans and Burkholderia cenocepacia. Research in Microbiology 160:144-151. Cabello, F. C., H. P. Godfrey, A. Tomova, L. Ivanova, H. Dölz, A. Millanao and A. H. Buschmann. 2013. Antimicrobial use in aquaculture re-examined: its relevance to antimicrobial resistance and to animal and human health. Environmental Microbiology 213:1-26. Carvalho, M. J., A. Martinez-Murcia, A. C. Esteves, A. Correia and M. J. Saavedra. 2012. Phylogenetic diversity, antibiotic resistance and virulence traits of Aeromonas spp. from untreated waters for human consumption. International Journal of Food Microbiology 159:230-239. Casas, C., E. C. Anderson, K. K. Ojo, I. Keithe, D. Whelan, D. Rainnie, and M.C. Roberts. 2005. Characterisation of pRAS1-like plasmids from atypical North American psychrophilic Aeromonas salmonicida. FEMS Microbiology Letters 242:59-63. Chakraborty, S. B., and C. Hancz. 2011. Application of phytochemicals as immunostimulant, antipathogenic and antistress agents in finfish culture. Reviews in Aquaculture 3:103-119. Chang, S-T., P-F. Chen, and S-C.Chang. 2001. Antibacterial activity of leaf essential oils and their constituents from Cinnamomum osmophloeum. Journal of Ethnopharmacology 77:123-127. Chang, Y. C., D. Y. Shih, J. Wang, and S. Yang. 2007. Molecular characterization of class 1 integrons and antimicrobial resistance in Aeromonas strains from food borne outbreak-suspect

110
samples and environmental sources in Taiwan. Diagnostic Microbiology and Infectious Disease 59:191-197. Chen, P-L., W-C. Ko and C-J. Wu. 2012. Complexity of β-lactamase among clinical Aeromonas isolates and its clinical implications. Journal of Microbiology Immunology and Infection 45:398-403. Chenia, H. Y., and C. Vietze. 2012. Tetracycline resistance determinants of heterotrophic bacteria isolated from a South African tilapia aquaculture system. African Journal of Microbiology Research 6:6761-6768. Chenia, H. Y. 2013. Anti-qourum sensing potential of crude Kigelia africana fruit extracts. Sensors 13:2802-2817. Chikwendu, C. I., S. N. Ibe, and G. C. Okpokwasili. 2011. Detection of blaSHV and blaTEM beta-lactamase genes in multi-resistant Pseudomonas isolates from environmental sources. African Journal of Microbiology Research 15:2067-2074. Choresca, C. H., S. H. Choi, D. K. Gomez, J. H. Kim and S. C. Park. 2010. Bacteria isolated from the mucus of farmed-raised adult and juvenile charm Abalone, Haliotis discus hannoi. Journal of the Aquaculture Society 44:139-144. Chuang, H-C., Y-H. Ho, C-J. Lay, L-S. Wang, Y-S. Tsai, and C-C. Tsai. 2011. Different clinical characteristics among Aeromonas hydrophila, Aeromonas veronii biovar sobria and Aeromonas caviae monomicrobial bacteraemia. Infectious Diseases, Microbiology and Parasitology 26:1415-1420. Cizek, A., M. Dolejska, R. Sochorova, K. strachotova, V. Piackova, T. Vesely. 2010. Antimicrobiology resistance and its genetic determinants in aeromonads isolated in ornamental (koi) carp (Cyprinus carpio koi) and common carp (Cyprinus carpio). Veterinary Microbiology 142:435-439. Clinical and Laboratory Standards Institute. 2007. M100-S17. Performance Standards for Antimicrobial Susceptibility Testing, 17th informational supplement, vol. 27, No. 1, Wayne, PA. Clinical and Laboratory Standards Institute. 2006. Methods for antimicrobial dilution and disk susceptibility testing of infrequently isolated or fastidious bacteria. Approved guideline M45-A. Clinical and Laboratory Standards Institute, Wayne, PA. Cowan, M. M. 1999. Plant products as antimicrobial agents. Clinical Microbiology Reviews 12:564-582. Citarasu, T., R. R. Sekar, M. M. Babu, and M. P. Marian. 2002. Developing artemia enriched herbal diet for producing quality larvae in Penaeus monodon. Asia Fishery Science 15:21-32.

111
Dada, A. A., E. O. Adeparusi, and O. V Alale. 2010. Dietary dried Kigelia africana fruits meal as fertility enhancer in female Clarias gariepinus (Burchell, 1822). Agriculture and Biology Journal of North America 5:791-795. De Britto, A. J., D. H. S Gracelin, and P. B. J. R. Kumar. 2012a. Screening and separation of bioactive compounds from murraya koenigii extracts. International Journal of Universal Pharmacy and Life Sciences 1:56-63. De Britto, A. J., P. B. J. R. Kumar, and D. Gracelin. 2012b. Abrus precatorius L.: A medicinal plant with potential as antibacterial agent. Journal of Pharmacy Research 2:1207-1209. De Carvalho C.C.C.R. 2007. Biofilms: recent developments on an old battle. Recent Patents on Biotechnology 1:49-57. Defoirdt, T., N. Boon, P. Bossier, and W. Verstraete. 2004. Disruption of bacterial quorum sensing: an unexplored strategy to fight infections in aquaculture. Aquaculture 240:69-88. De Luca, F., C. Giraud-Morm, G. M. Rossolini, J-D. Docquier and T. Fosse. 2010. Genetic and biochemical characterisation of TRU-1, the endogenous class C β-lactamase from Aeromonas enteropelogenes. Antimicrobial Agents and Chemotherapy 54:1547-1554. Del Pozo, J. L., and R. Patel. 2007. The challenge of treating biofilm-associated bacterial infection. Clinical Pharmacology and Therapeutics 82:204-209. Denyer, S. P. 1995. Mechanism of action of antibacterial biocides. International Biodeterioration and Biodegradation 36:227-245. Desai, B., and P. Desai. 2014. Biofilm formation and effect of disinfectants on the isolates obtained from aquatic ecosystem. Biomedical Research Journal 1:1-7. Dhayanthi, N. B., Ajit Kumar, T. T., Balasubramanian, T. 2012. Effects of Excoecaria agallocha leaves against Aeromonas hydrophila in marine ornamental fish, Amphirion sebae. Indian Journal of Geo-Marine Sciences 41:76-82 Dias, C., V. Mota, A. Martinez-Murcia, M. J. Saavedra. 2012. Antimicrobial resistance patterns of Aeromonas spp. isolated from ornamental fish. Journal of Aquaculture Research and Development 3:1-13. Doughari, J. H., I. S. Human, S. Bennade, and P. A. Ndakidemi. 2009. Phytochemicals as chemotherapeutic agents and antioxidants: Possible solution to the control of the antibiotic resistant verocytotoxin producing bacteria. Journal of Medicinal Plants Research 11:839-848. Drenkard, E. 2003. Antimicrobial resistance of Pseudomonas aeruginosa biofilms. Microbes and Infection 13:1213-1219.

112
Duma, S. T. 2012. Characterization of factors involved in and affecting biofilm formation by Aeromonas spp. isolates. University of KwaZulu Natal Masters Dissertation. Eldeen, I. M. S., and J. Staden. 2008. Cyclooxygenase inhibition and antimycobacterial effects of extracts from Sudanese medicinal plants. South African Journal of Botany 74:225-229. Eldeen, I. M. S., and J. V. Staden. 2008. In vitro pharmacological investigation of extracts from some trees used in Sudanese traditional medicine. South African Journal of Botany 73:435-440. Elhariry, H.M. 2011. Biofilm Formation by Aeromonas hydrophila on green-leafy vegetables: cabbage and lettuce. Food borne Pathogens and Disease 8:125-131. FAO, 2002. State of World Fisheries and Aquaculture. FAO Fisheries Department, Food and Agriculture Organisation of the United Nations, Rome, Italy. 150 pp. Farmer III, J. J., M. J. Arduino, and F. W. Hickman-Brenner. 2006. The Genera Aeromonas and Plesiomonas. The Prokaryotes 6:564-596. Fontes, M. C., M. J. Saavedra, C. Martins, and A. J. Martínez-Murcia. 2011. Phylogenetic identification of Aeromonas from pigs slaughtered for consumption in slaughter houses at the North of Portugal. International Journal of Food Microbiology 146:118-122. Fosse, T., C. Giraud-Morin, and I. Madinier. 2003. Phénotypes de résistance aux β-lactamines dans le genre Aeromonas. Pathological Biology (Paris) 51:290–296. Figuera, V., I. Vaz-Moreira, M. Silva, C. M. Manaia. 2011. Diversity and antibiotic resistance of Aeromonas spp. in drinking and waste water treatment plants. Water Research 45:5599-5611. Fitzgerald, D. J., M. Stratford, M. J. Gasson, J. Ueckert, A. Bos and A. Norbad. 2004. Mode of antimicrobial action of vanillin against Escherichia coli, Lactobacillus platarum and Listeria innocua. Journal of Applied Microbiology 97:104-113. Fuente-nunez, C., F. Reffuville, L. Fernandez and R.EW. Hancock. 2013. Bacterial biofilm development as a multicellular adaptation: antibiotic resistant and new therapeutic strategies. Current Opinion in Microbiology 16:580-589. Gavin, R., A. A. Rabaan, S. Merino, J. M. Tomas, I. Gryllos, and J. G. Shaw. 2002. Lateral flagella of Aeromonas species are essential for epithelial cell adherence and biofilm formation. Molecular Microbiology 43:383-397. Gavin, R., S. Merino, M. Altarriba, R. Canals, J. G. Shaw, and J. M Tomas. 2003. Lateral flagella are required for increased cell adherence, invasion and biofilm formation by Aeromonas spp. FEMS Microbiology Letters 224:77-83. Gabriel, O. A., and A. Olubunmi.2009. Comprehensive scientific demystification of Kigelia africana: A review. African Journal of Pure and Applied Chemistry 3:158 -164.

113
Ghenghesh, K. S., S. F. Ahmed, R. A. ElKhalek, A. Al-Gendy and J. Klena. 2008. Aeromonas-associated infections in developing countries. Journal of Infections in Developing Countries 2:81-98. Godoy, M., V. Gherardelli, A. Heisinger, J. Fernandez, P. Olmos, L. Ovalle, P. Llardi and R. Avendano-Herrera. 2010. First description of atypical furunculosis in freshwater farmed Atlantic salmon, Salmo salar L., in Chile. Journal of Fish Diseases 33:441-449. Goni-Urriza, M., L. Pineall, M. Capedepy, C. Roques, P. Caumette, and C. Quentin. 2000. Antimicrobial resistance of mesophilic Aeromonas spp. isolated from two European rivers. Journal of Antimicrobial Chemotherapy 46:297-301. Gonzalez, G., S. Mella and R. Zemelmann. 2004. Integrons and resistance gene cassettes: structure and role against antimicrobials. Revista Medica de Chile 32:619-626. Gomez-garcés, J. L., D. Saez, M. Almagro, M. Fernandez-Romero, S. merino, F. Campos, J. Oteo. 2011. Osteomyelitis associated to CTX-M-15-producing A. hydrophila: first description in the literature. Diagnostic Microbiology and Infectious Disease 70:420-422. Gouda, Y. G., A. M. Abdel-Baky, F. M. Darwish, K. M. Mohammed, R. Kasai and K. Yamasaki. 2003. Iridoids from Kigelia pinnata DC. fruits. Phytochemistry 63:887-892. Gouda, Y. G., A. M. Abdel-Baky, K. M Mohammed, F. M. Darwish, R. Kasai and K. Yamasaki. 2006. Phenylpropanoid and phenylethanoid derivatives from Kigelia pinnata DC. fruits. Natural Product Research 20:935-939. Girlich, D., L. Poirel and P. Nordmann. 2011. Diversity of clavulanic acid-inhibited extended spectrum β-lactamase in Aeromonas spp. from the Seine river, Paris, France. Antimicrobial Agents and Chemotherapy 55:1256-1261. Grace, O. M., M. E. Light, K. L Lindsey, D. A. Mulholland, J. Van Staden and A. K. Jagar.2002. Antibacterial activity and isolation of active components from fruits of the traditional African medicinal tree Kigelia africana. South African Journal of Botany 68:220-222. Guerra, I. M. F., R. Fadamelli, M. Figuerio, F. Schreimer, A. P. L. Delaware, C. wollheim, S. O. P. Costa, S. Echeverrigaray. 2007. Aeromonas associated diarrhoeal disease in South Brazil: prevalence, virulence and antimicrobial resistance. Brazilian Journal of Microbiology 38:638-643. Hall, B. G., S. J. Salipante, M. Barlow. 2004. Independent origins of subgroup B1 and B2 and subgroup B3 metallo-β-lactamases. Journal of Molecular Evolution 59:133-141. Haque, S. F., S. S. Ali, T. P. Mohammed and A. U. Khan. 2012. Prevalence of plasmid mediated blaTEM-1 and blaCTX-M-15 extended spectrum beta-lactamase in patients with sepsis. Asian Pacific Journal of Tropical Medicine 12:98-102.

114
Harikrishnan, R., and C. Balasundaram. 2005. Modern Trends in Aeromonas hydrophila disease management with fish. Reviews in Fish Science 13:281-320. Harikrishanan, R. C. Balasundaram, and M-S. Heo. 2010. Herbal supplementation diets on hematology and innate immunity in goldfish against Aeromonas hydrophila. Fish and Shellfish Immunology 28:354-361. Harborne, J. B. 1973. Method of plant analysis. Phytochemical methods. London: Chapman and Hall pp 17. Henriques, I. S., F. Fonseca, A. Alves, M. J. Saavedra, A. Correia. 2006. Occurrence and diversity of integrons and β-lactamase genes among ampicillin-resistant isolates from estuarine waters. Research in Microbiology 157:938-947. Hernould, M., S. Gagné, M. Fournier, C. Quentin, and C. Arpin. 2008. Role of the Ahe ABC pump in Aeromonas hydrophila intrinsic multidrug resistance. Antimicrobial Agents and Chemotherapy 52:1559-1563. Hoa, P. T. P., S. Mnagolia, N. Nkada, H. Takada, A. Shimizu, D. H. Anh, P. H. Viet and S. Suzuki. 2011. Antibiotic contamination and occurrence of antibiotic-resistant bacteria in aquatic environments of northern Vietnam. Science of the Total Environment 409:2894-2901. Houghton, P. J. 2002. The sausage tree (Kigelia africana): ethnobotany and recent scientific work. South African Journal of Botany 68:14-20. Huddleston, J.R., J.C. Zak, and R.M. Jeter. 2006. Antimicrobial susceptibilities of Aeromonas spp. isolated from environmental sources. Applied and Environmental Microbiology 72:7036-7042.
Husain, F. M., J. Ahmad, A. Mohammed and Q. Tahseen. 2013. Influence of clove oil on certain quorum-sensing regulated functions and biofilm of Pseudomonas aeruginosa and Aeromonas hydrophila. Journal of Bioscience 38:835-844. Hopkins, K. L., L. Wootton, M. R. Dey, and E. J. Threfall. 2007. Plasmid-mediated quinolone resistance determinants qnrSI found in Salmonella enteric strains isolated in the UK. Journal of Antimicrobial Chemotherapy 59:1071-1075. Igbinosa, I. H., E. Igumbor, F. Aghdasi, T. Mvuyo, and A. I. Okoh. 2012. Emerging Aeromonas species infections and their significance in public health. The Scientific World Journal 2012:1-13. Igbinosa, I. H., and A. I. Okoh. 2012. Antibiotic susceptibility profile of Aeromonas species isolated from wastewater treatment plant. The Scientific World Journal 2012:1-6.

115
Igbinosa, I. H., V. N. Chigor, E. O. Igbinosa, l. C. obi, and A. I. Okoh. 2013. Antibiogram, adhesive characteristics and incidence of class1 integron in Aeromonas species isolated from two South African rivers. Biomedical Research International 2013:1-8. Igbinosa, I. H. 2014. Antibiogram profiling and pathogenic status of Aeromonas spp. recovered from chicken. Saudi Journal of Biological Sciences 21:481-485. Jacobs, L., and H. Y. Chenia. 2007. Characterization of integrons and tetracycline resistance determinants in Aeromonas spp. isolated from South African aquaculture systems. International Journal of Food Microbiology 114:295-306. Jacoby, G. A., K. E. Walsh, D. M. Millis, V. J. Walker, H. Oh, A. Robicsek and A. C. Hooper,. 2006. qnrB, another plasmid-mediated gene for quinolone resistance. Antimicrobial Agents and Chemotherapy 50:1178-1182. Jahid, I. K., N. Han and S-D. Ha. 2104. Inactivation kinetics of cold oxygen plasma depends on incubation conditions of Aeromonas hydrophila biofilm on lettuce. Food Research International 55:181-189. Jay, J. M., and G. M. Rivers. 1984. Antimicrobial activity of some food flavoring compounds. Journal of Food Safety 6:129-139. Jeyachandran, R., and A. Mahesh. 2007. Antimicrobial evaluation of Kigelia africana (Lam). Research Journal of Microbiology 8:645-649. Jia, p., Y. J. Xue, X. J. Duan, and S. H. Shao. 2011. Effect of cinnamaldehyde on biofilm formation and sarA expression by methicillin-resistant Staphylococcus aureus. Letters in Applied Microbiology 53:409-416. Jun, W.J., J. H. Kim, D. K. Gomez, C. H. Choresca jnr, J. E. Han, S. P. Shin, and S. C. Park. 2010. Occurrence of tetracycline-resistant infection in Korean cyprinid loach (Misgumus anguillicaudatus). Journal of Microbiology Research 9:849-855. Kadlec, K., E. V. Czapiewski, H. Kaspar, J. Wallmann, G. B. Micheal, U. Steinacker, S. Schwarz. 2011. Molecular basis of sulphonamide and trimethoprim resistance in fish-pathogenic Aeromonas isolates. Applied and Environmental Microbiology 77:7147-7150. Kappachery, S., D. Paul, J. Yoon, and J. H. Kweon. 2010. Vanillin, a potential agent to prevent biofouling of reverse osmosis membrane. The Journal of Bioadhesion and Biofilm Research 26:667-672. Kaplan, J. B. 2010. Biofilm dispersal: Mechanisms, clinical implications, and potential therapeutic uses. Journal of Dental Research 89:205-218. Khajanchi, B. K., A. A. Fadl, M. A. Borchardt, R. L. Berg, R. L. Hornemon, M. E. Joseph, S. W. Moyer, J. Sha and A. A. Chopra. 2010. Distribution of virulence factors and molecular

116
fingerprinting of Aeromonas species isolates from water and clinical sample suggestive evidence of water-to-human transmission. Applied and Environmental Microbiology 7:2313-2325. Khan, M. S. A., and I. Ahmad. 2011. Anti-biofilm activity of certain phytochemicals and their synergy with flucanazole against Candida albicans biofilms. Journal of Antimicrobial Chemotherapy 67:618-621. Kiplimo, J. J., N. A. Koorbanally, and H. Y. Chenia. 2011. Triterpernoids from Vernonia auriculifera Hiern exhibit antimicrobial activity. African Journal of Pharmacy and Pharmacology 5:1150–1156. Kirov, S. M., B. C. Tassel, A. B. T. Semmler, L. A. O'Donovan, A. A. Rabaan, and J. G. Shaw. 2002. Lateral flagella and swarming motility in Aeromonas species. Journal of Bacteriology 184: 547-555. Kostakioti, M. M. Hadjifrangiskou and S. J. Hultgreen. 2013. Bacterial biofilms: development, dispersal and therapeutic strategies in the dawn of the post-antibiotic era. Cold Spring Harbour Perspectives in Medicine 2013:1-24. Kozinska, A., and L. Guz. 2004. The effect of various Aeromonas bestiarum vaccines on non-specific immune parameters and protection of carp (Cyprinus carpio L.). Fish Shellfish Immunology 6:437-445. Kregiel, D., and K. Niedzielska. 2014. Effect of plasma processing and organosilone modifications of polyethylene on Aeromonas hydrophila biofilm formation. Biomedical Research International 214:1-5. Kreth, J., Y. Zhang, M. C. Herzberg. 2008. Streptococcal antagonism in oral biofilms: Streptococcus sanguinis and Streptococcus gordonii interference with Streptococcus mutans. Journal of Bacteriology 190:4632-4640. Kümmerer, K. 2009. Antibiotics in the Aquatic Environment. Chemosphere 75:435-441. L'Abee-Lund, T. M., and H. Sorum. 2001. Class 1 integrons mediate antibiotic resistance in the fish pathogen Aeromonas salmonicida worldwide. Microbial Drug Resistance 7:263-272. Lamy, B., A. Kodjo, the colBVH Study Group, and F. Laurent. 2009. Prospective nationwide study of Aeromonas infections in France. Journal of Clinical Microbiology 47:1234–1237. Lapierre, L., J. Cornejo, C. Borie, C. Toro and B. S. Martin. 2008. Genetic characteristics of antibiotic genes linked to class 1 and class 2 integrons in commensal strains of Escherichia coli isolated from poultry and swine. Microbiological Drug Research 14:265-272. Lee, M. F., C. F. Peng, Y. H. Lin, S. R. Lin, and Y. H. Chen. 2008. Molecular diversity of class 1 integrons in human isolates of Aeromonas spp. from Southern Taiwan. Japan Journal of Infectious Diseases 61:343-349.

117
Lewis, K. 2005. Persister cells and the riddle of biofilm survival. Biochemistry 70:267-274. Levy, S. B., and B. Marshall. 2004. Antibacterial resistance worldwide: causes, challenges and responses. Nature Medical 10:S122–9. Libisch, B., C. G. Giske, B. Kovács, T. G. Tóth, and M. Füzi. 2008. Identification of the first VIM metallo-β-lactamase-producing multiresistant Aeromonas hydrophila strain. Journal of Clinical Microbiology 46:1878–1880. Lopez, D., H. Vlamakis and R. Kolter. 2010. Biofilms. Cold Spring Harbour Perspectives in Biology. 256:1-15. Lu, S-Y., Y-L. Zhang, S-N. Geng, T-Y. Li, Z-M. Ye, D-S. Zhang, F. Zou and H-W. Zhou. 2010. High diversity of extended-spectrum beta-lactamase producing bacteria in an urban river sediment habitat. Applied and Environmental Microbiology 76:5972-5976. Lu, C., H. Wang, W. L. P. Xu, J. Zhu, J. Xie, B. Liu, and Z. Lou. 2011. Antibacterial properties of anthraquinones extracted from rhubarb against Aeromonas hydrophila. Fisheries Science 77:375–384. Lupo, A., S. Cogne, and T. U. Berendonk. 2012. Origin and evolution of antibiotic resistance: The common mechanisms of emergence and spread in water bodies. Frontiers in Microbiology 3: 1-13. Lynch, M. J., S. Swift, D. K. Kirke, C. W. Keevil, C. E. R. Dodd, and P. Williams. 2002. The regulation of biofilm development by quorum sensing in Aeromonas hydrophila. Environmental Microbiology 4:18-28. Mah, T.-F.. C., and G.A. O’Toole. 2001. Mechanisms of biofilm resistance to antimicrobial agents. Trends in Microbiology 9:34-39. MahfuzulHoque, M. D., Bari, M. L., Inatsu, Y. Juneja, V. K., and Kwaamoto, S. 2007. Antibacterial activity of guava (Psidium guajava L.) and neem (Azadirachta indica A. Juss.) extracts against food-borne pathogens and spoilage bacteria. Food-borne Pathogens and Disease 4:481-488. Majumbar, T., S. Ghosh, J. Pal, and S. Mazumder. 2006. Possible role of a plasmid in the pathogenesis of a fish disease caused by Aeromonas hydrophila. Aquaculture 256:95-104.
Matyar, F., T. Akkan, Y. Ucak, B. Eraslan. 2010. Aeromonas and Pseudomonas: antibiotic and heavy metal resistant species from Iskenderun bay, Turkey (northeast Mediterranean Sea). Environmental Monitoring Assessment 167:309-320. Maravic, A., M. Skocibusic, I. Samanic, Z. Fredotovic, S. Cvjetan, M. Jutronic, J. Puizina. 2013. Aeromonas spp. simultaneously harbouring blaCTX-M-15, blaSHV-12, blaPER-1 and blaFOX-2, in wild

118
growing Mediterranean mussel (Mytilus galloprovincialis) from Adriatic Sea, Croatia. International Journal of Food Microbiology 166:301-308. Marchandin, H., S. Godreuil, H. Darbes, H. Jean-Pierre. 2003. Extended spectrum beta-lactamase tem-24 in an Aeromonas clinical strain: acquisition from the prevalent Enterobacter aerogenes clone in France. Antimicrobial Agents and Chemotherapy 47:3994-3995. Marti, E., J. Jofre, J. I. Balcazar. 2013. Prevalence of antibiotic resistance genes and bacterial community composition in a river influenced by a waste water treatment plant. PLOS One 10:234-233. Martınez-Murcia, A. J., M. J. Saavedra, V. R. Mota, T . Maier, E. Stackebrandt, S. Cousin. 2008. Aeromonas aquariorum sp. nov., isolated from aquaria of ornamental fish. International Journal Systematic and Evolutionary Microbiology 58:1169–1175. Mayanard, C., S. Bekal, F. Sanschagrin, R. C. brousseau, L. Masson, S. Lariviere and J. Harel. 2004. Heterogeneity among virulence and antimicrobial resistant gene profiles of extraintestinal Escherichia coli isolates of animals and human origins. Journal of Clinical Microbiology 42:5444-5452. Meyer, L., C. D. J. Labuschagne, M. M. Ehlers, M. G. Dove, G. F. Weldhagen. 2007. Diversity of bla-type genes in extended-spectrum β-lactamase-producing Klebsiella pneumoniae isolated during 2003-2004 at Pretoria academic hospital. South African Journal of Epidemiology and Infection 22:5-7. McGaw, L. J., N. Lall, J. J. M. Meyer, and J. N. Eloff. 2008. The potential of South African plants against Mycobacterium infections. Journal of Ethnopharmacology 119:482-500. Mcintosh, D., M. Cunningham, B. Ji, F. A. fekete, E. M. Parry, S. E. Clark, Z. B. zalinger, I. C. Gilg, G. R. Danner, K. A. Johnson, M. Bealtie and R. Ritchie. 2008. Transferable, multiple antibiotic and mercury resistance in Atlantic Canadian isolates of Aeromonas salmonicida subsp. salmonicida is associated with carriage of an IncA/C plasmid similar to the salmonicida enteric plasmid PSN254. Journal of Antimicrobial Chemotherapy 61:1221-1228. Millezi, A. F., M. G. Cardoso, E. Alves, R. H. Piccolo. 2013. Reduction of Aeromonas hydrophila biofilm on stainless steel surface by essential oils. Brazilian Journal of Microbiology 44:73-80. Molyneaux, R. J., S. T. Lee, D. R. Gardner, K. E. Panter, and J. F. Jones. 2007. Phytochemicals: The good, the bad and the ugly? Phytochemistry 68:2973-2985. Morozumi, S. 1985. Isolation, purification, and antibiotic activity of o-methoxycinnamaldehyde from cinnamon. Applied and Environmental Microbiology 36:577-582.

119
Moura, A., I. Henriques, R. Ribeiro, A. Correia. 2007. Prevalence and characteristics of integrons from bacteria isolated from a slaughterhouse wastewater treatment plant. Journal of Antimicrobial Chemotherapy 60:1243-1250. Naas, T., C. Oxaceky and P. Nordmann. Identification of CTX-M-type extended spectrum-β-lactamase genes using real-time PCR and pyro-sequencing. Antimicrobial Agents and Chemotherapy 51:223-230. Nagar, V., R N. Shashidhar and J. R. Bondekar. 2011. Prevalence, characterization and antimicrobial resistance of Aeromonas strains from various retail food products in Mumbai, India. Journal of Food Science 76:486-492. Najimi, M., M. L. Lemos, and C. R. Osorio. 2008. Distribution of small plasmids in Aeromonas salmonicida strains isolated from NW Spain and Portugal: evidence of clonality in strains isolated from turbot Psetta maxima (L.). Journal of Fish Diseases 31:469-472. Nawaz, M., S. A. Khan, A. A. Khan, K. Sung, Q. Tran, K. Kerdahi, R. Steele. 2010. Detection and characterization of virulence genes and integrons in Aeromonas veronii isolated from catfish. Food Microbiology 27:327–331. Nascimento, G. G. F., L. Juliana, P. C. Freitas, G. L. Silva. 2000. Antibacterial activity of plant extracts and phytochemicals on antibiotic resistant bacteria. Brazilian Journal of Microbiology 31:247-256. Naviner, M., L. Gordon, E. Giraud, M. Denis, C. Mangion, H. Le-Bris, and J. Ganiere. 2011. Antimicrobial resistance of Aeromonas spp. isolated from the growth pond to the commercial product in a rainbow trout farm following a flumequine treatment. Aquaculture 315:236-241. Nazzaro, F., F. Fratianni and R. Coppola. Quorum sensing and phytochemicals. International Journal of Molecular Science 14:12607-12619. Neuwirth, C., E. Siebor, F. Robin, R. Bonnet. 2007. First occurrence of an isolate from france. Antimicrobial Agents and Chemotherapy 51:4486-4488. Ndi, O. L., and Barton, M. D. 2011.Incidence of class 1 integron and other antibiotic resistance determinants in Aeromonas spp. from rainbow trout farms in Australia. Journal of Fish Diseases 34:589-599. Niu, C. and E. S. Gilbert. 2004. Colorimetric method for identifying plant essential oil components that affect biofilm formation and structure. Applied and Environmental Microbiology 12:6951-6956. Niu, C., S. Afre and E. S. Gilbert. 2006. Subinhibitory concentrations of cinnamaldehyde interference with quorum sensing. Letters in Applied Microbiology 43:489-494.

120
Nuryastuti, T., Van der Mei, H. C., Bussher, H. J., Iravati, S., Aman, A. T., and Krom B. P. 2009. Effect of cinnamon oil on icaA expression and biofilm formation by Staphylococcus epidermidis. Applied and Environmental Microbiology 75:6850-6855. Nya, E. J., Dawood, Z., and Austin, B. 2010. The garlic component Allicin prevents disease caused by Aeromonas hydrophila in rainbow trout, Oncorhynchus mykiss (Walbaum). Journal of Fish Disease 33:293-300. Obi, C. L., J. Ramalivhana, A. Samie, J. O. Igumbor. 2007. Prevalence, pathogenesis, antibiotic susceptibility profiles and in-vitro activity of selected medicinal plants against Aeromonas isolates from stool samples of patients in the Venda region of South Africa. Journal of Health Population and Nutrition 4:428-435. Obi, C. L., J. Ramalivhana, M. N. B. Momba, B. Onabolu, J. O. Igumbor, M. Lukoto, T. B. Mulaudzi, P. O. Bessong, E. L. Jansen Van Rensburg, E. Green, and S. Ndou. 2007. Antibiotic resistance profiles and relatedness of enteric bacterial pathogens isolated from HIV/AIDS patients with and without diarrhoea and their household drinking water in rural communities in Limpopo province South Africa. African Journal of Biotechnology 6:1035-1047. Ooi, L. S. M., Li, Y., Kam S-L., Wang, E. Y. L., and Ooi, V. E. C. 2006. Antimicrobial activities of cinnamon oil and cinnamaldehyde from the Chinese medicinal herb Cinnamomum cassia Blume. American Journal of Chinese Medicine 34:511-522. Owolabi, O. J., Omogbai, E. K. I., Obasuyi, O.2007. Antifungal and antibacterial activities of ethanolic and aqueous extract of Kigelia africana (Bignoniaceae) stem bark. African Journal of Biotechnology 6:1677-1680. Ozkan, G., O. Sagdic, R. S. Gokturk, O. Unalis, and S. Albayrak. 2010. Study on chemical composition and biological activities of essential oil and extract from Salvia pisidia. Food Science and Technology 43:186-190. Pachanawan, A., P. Phumkhachorn, and P. Rattanachaikunsopon. 2008. Potential of Psidium guajava supplemented fish diets in controlling A. hydrophila infection in tilapia (Oreochromis niloticus). Journal of Bioscience and Bioengineering 106:419-424. Palu, A. P., M. A. L. Miguel, I. I. Balassiano, M. L. P. Queiroz, A. C. Freitas-Almeida, and S. S. De-Oliveira. 2006. Antimicrobial resistance in food and clinical Aeromonas isolates. Food Microbiology 23:504-509. Partridge, S. R., G. Tsafnat, E. Coiera and J. R. Iredell. 2009. Gene cassette arrays in mobile resistance integrons. FEMS Microbiology Reviews 33:757-784. Paterson, D. L. and R. A. Bonomo. 2005. Extended spectrum β-lactamases: a clinical update. Clinical Microbiology Reviews 18:657-686.

121
Pakravan, S., A. Hajimoradloo and R. Ghorbani. 2011. Effect of dietary willow herb, Epilobium hirsutum extract on growth performance, body composition, haematological parameters and Aeromonas hydrophila challenge on common carp. Cyprinus carpio. Aquaculture Research 2011:1-9. Parker, J. L., and J. C. Shaw. 2011. Aeromonas spp. clinical microbiology and disease. Journal of Infection 62:109-118. Pérez-Valdespino, A., E. Férnāndez-Rendõn and E. Curiel-quesada. 2009. Detection and characterisation of class 1 integrons in aeromonas spp. isolated from human diarrheic stool in Mexico. Journal of Basic Microbiology 49:572-578. Pellegrini, C., G. Celenza, B. Segatore, P. Beslio, D. Setacci, G. Amicosante and M. Perili. 2010. Occurrence of class 1 and class 2 integrons in resistance Enterobacteriaceae collected from a urban wastewater treatment plant: fruit report from central Italy. Microbiology and Drug Resistance 17:229-234. Phillipson, J. D. 2001. Phytochemistry and medicinal plants. Phytochemistry 56:237-243. Ponnusamy, K., D. Paul, and J.H. Kweon. 2009. Inhibition of quorum sensing mechanism and Aeromonas hydrophila biofilm formation by vanillin. Environmental Engineering Science 26: 1359-1363. Ponnusamy, K., D. Paul, Y. Sam Kim, and J.H. Kweon. 2010. 2(5H)-furanone: a prospective strategy for biofouling-control in membrane biofilm bacteria by quorum sensing inhibition. Brazilian Journal of Microbiology 41:227-234. Ponnusamy, K., S. Kappachery, M. Thekeetle, J, H. Song, J. H. Kweon. 2013. Anti-biofouling property of vanillin on A. hydrophila initial biofilm on various membrane surfaces. World Journal of Microbiology and Biotechnology 29:1695-1703. Poole, K. 2004. Resistance to β-lactam antibiotics. Cellular and Molecular Life Sciences 61:2200-2223. Picerno, P., C. Antere, S. Marzocco, M. Mekni, R. Sanogo and R. P. Aquino.2005. Anti-inflammatory activity of vermonosides from Kigelia africana and evaluation of cutaneous irritation in cell cultures and reconstituted human epidermis. Journal of Natural Products 68:1610-1614. Picào, R. C., L. Poirel, A. Demarta, C. S. F. Silva, A. R. Corvaglia, O. Petrini, and P. Nordmann. 2008. Plasmid-mediated quinolone resistance in Aeromonas allosaccharophila recovered from a Swiss lake. Journal of Antimicrobial Chemotherapy 62:948-950. Picào, R. C., J. P. Cardoso, E. H. Campana, A. G. Nicoletti, F. V. Petrolini, D. M. Assis, L. Juliano and A. C. Gales. 2013. The role of antimicrobial resistant from the hospital effluent to

122
the environment: focus on the occurrence of KPC producing Aeromonas spp. and Enterobacteriaceae in sewage. Diagnostic Microbiology, Infection and Disease 76:80-85. Pitts, B., M. A. Hamilton, N. Zelver, P. S. Stewart. 2003. A microtiter-plate screening method for biofilm disinfection and removal. Journal of Microbiology Methods 54:269-276. Piyidar, V., A. Kaznowski, N. B. Narayan, M. Patole and Y. S. Shouche. 2002. Aeromonas culicicola sp. nov., from midgut of Culex quinquefasciatus. International Journal of Systematic and Evolutionary Microbiology 52:1723-1728. Radu, S., N. Almad., F. H. Ling, and A. Reezal. 2003. Prevalence and resistance to antibiotics for Aeromonas spp. from retail fish in Malaysia. International Journal of Food Microbiology 81:261-266. Rajendiran, A., Natarajan, E., Subramanian, P. 2008. Control of Aeromonas hydrophila infection in spotted snakehead, Chana puntatus, by Solanum nigrum, L., a medicinal plant. Journal of the World Aquaculture Society 39:375-383. Rossolini, G. M., A. zanchi, A. Chiesurin, G. Amicosante, G. Salta and P. Guglielmelti. 1995. Distribution of CphA or related carbapenemases activity in members of the genus Aeromonas. Antimicrobial Agents and Chemotherapy 39:346-349. Rubtsova, M. T., M. M. Ulyashova, T. T. Bachmann, R. D. Schimd and A. M. Egorov. Muliparametric determination of genes and their point mutations for identification of beta-lactamase. Biochemistry 75:1628-1649. Saini, S., H. Kaur., B. Verma., Ripudaman, and S. K Singh. 2009. Kigelia africana (Lam) Beth. - An overview. Natural Product Radiance 2:190-197. Saleem, M., M. Nazir, M. S Ali, H. Hussain, Y. S. Lee, N. Riaz and A. Jabbar. 2010. Antimicrobial natural products: An update on future antibiotic drugs. Nature Product Reports 27:238-254. Sànchez-céspedes, J., M. J. Figueras, C. aspiroz, M. J. aldea, M. Toledo, A. Alperi, F. Marco and J. Vila. 2009. Development of impenem resistance in an A. veronii biovar sobria clinical isolate recovered from a patient with cholangitis. Journal of Medical Microbiology 58:451-455. Saria-Guzmàn, Y., A. P. Lõpez-ramirez, Y. Chàvez-romero, E. Ruiz-romero,L. Dendooven and J. M. Bello-lopez. 2013. Identification of antbiotic resistance cassettes in class 1integrons in aeromonas spp. strains isolated from fresh fish (Cyprinus carpio L.). Current Microbiology 68:581-586. Senthikumar, M., Gurumoorthi, P., and Janardhana, K. 2005.Antibacterial potential of some plants used by trials in Maruthamalai hills, Tamil Nadu. Natural Product Radiance 4:27-34.

123
Santos, P.G., P.A. Santos, A.R. Bello, and A.C. Freitas-Almeida. 2010. Association of Aeromonas caviae polar and lateral flagella with biofilm formation. Letters in Applied Microbiology 52:49–55. Samaha-Kfoury, J. N., and G. F. Araj. 2003. Recent developments in β-lactamases and extended spectrum β-lactamases. Clinical Reviews 327:1209-13. Shai, L. J., L. J McGraw, P. Masoko, and J. N Eloff. 2008. Antifungal and antibacterial activity of seven traditionally used South African plant species active against Candida albicans. South African Journal of Botany 74:677-684. Sorum, H., T.M. L' Abee-Lund, A. Solberg, and A. Wold. 2003. Integron-containing IncU R plasmids pRAS1 and pAr-32 from the fish pathogen Aeromonas salmonicida. Antimicrobial Agents and Chemotherapy 47:1285-1290. Simões, M., L.C. Simões, and M.J. Viera. 2010. A review of current and emergent biofilm control strategies. Food Science Technology 43:573-583. Siri, S. P., P. Wadbua, W. Wangphathanakul, N. Kitancharoen and P. Chantaranothai.2008. Antibacterial and phytochemical studies of 20 Thai medicinal plants against catfish-infectious bacteria Aeromonas caviae. Khon Kaen University Science Journal 36:1-10. Stalder, T., O. Barraud, M. Casellas, C. Dagot, M-C. Ploy. 2012. Integron involvement in environment spread of antibiotic resistance. Frontiers in Microbiology 3:1-14. Sunde, M. 2005. Prevalence and characterisation of class 1 and class 2 integrons in Escherichia coli isolated from meat and meat products of Norwegian origin. Journal of Antimicrobial Agents and Chemotherapy 58:741-747. Tacao, M., A. Moura, A. Correia and I. Henriques. 2014. Co-resistance to different classes of antibiotics among extended-spectrum-beta-lactamase-producers from aquatic systems. Water Research 1448:100-107. Talavera, B. M. M., F. O. Benassi, M. H. Von Specht, M. I. Quiroga, M. A. A. Garcia, A. B. Pucciarelli, E. Zubreski, M. E. Laczeski, and G. Gutkind. 2006. Susceptibilities to carbepenams and presence of cphA gene on food borne Aeromonas. Brazilian Archives of Biology and Technology 40:677-682. Tenover, F. C. 2006. Mechanisms of antimicrobial resistant in bacteria. The American Journal of Medicine 6A:S3-S10. Tristram, S. G., R. Haves and J. Souprounov. 2005. Variation in selected regions of blaTEM genes and promoters Haemophilus influenza. Journal of Antimicrobial Chemotherapy 56:481-484.

124
Tsai, M.-S., C.-Y. Kuo, M.-C. Wang, H.-C. Wu, C.-C. Chien, and J.-W. Liu. 2006. Clinical features and risk factors for mortality in Aeromonas bacteremic adults with hematologic malignancies. Journal of Microbiology, Immunology and Infections 39:150–154. Turska-szewczuk, A., B. Lindner, I. Komaniecka, A. Kozinska, A. Pekala, A. Choma and O. Holst. 2013. Structural immunochemical studies of the lipopolysaccharide from the fish pathogen Aeromonas bestiarum strain K296, serotypes 016. Marine Drugs 235:1-10. Vega-Sanchez, V., J. Acosta-Dibarrat, F. Vega-Castillo, G. Castro-Escarpulli, G. Aguilera-Arreola and E. Soriano-Vargas. 2014. Phenotypical characteristics, genetic. Identification and antimicrobial sensitivity of Aeromonas species isolated from farmed rainbow trout (Onchorynchus Mykiss) in Mexico. Acta Tropica 130:76-79. Velmurugan, S., S. M. J. Punitha, M. M. Babu, T. Selvaraj, and T. Citarasu. 2010. Indian Herbal Medications to replace antibiotics for shrimp Penaeus monodon post larvae. Journal of Applied Aquaculture 3:230-239. Verner-Jeffreys, D. W., T. J. Welch, T. Schwarz, M. J. Pond, M. J. Woodward and S. J. Haig. 2009. High prevalence of multidrug-tolerant bacteria and associated antimicrobial resistance genes isolated from ornamental fish and their carriage water. PLOS One. 234:1-6. Vladimir, P., Z. Julia, L. Elena, Z. Natalia, K. Alexander, K. Inessa. 2103. Effect of plant phenolic compounds on biofilm formation by Pseudomonas Acta Pathologica Microbiologica et Immunologica Scandinavica. 121:1073-1081. Vinay, T. N., R. P. Patil, B. P. P. Suresh, R. Rajesh, and K. M. Shankar. 2013. Evaluation of the efficiency of Aeromonas hydrophila biofilm vaccine in Labeo rohita employing monoclonal antibody based ELISA. Scientific Reports 2:1-5.
Walton, N. J., M. J. Mayer, and A. Narbad. 2003. Vanillin. Phytochemistry 63:505-515.
Walsh, T .R., W. A. Neville, M. H. Haran, D. Tolson, D. J. Payne, J. H. Bateson, A. P. Mac Gowan and P. M. Bennett. 1998. Nucleotide and amino acid sequence of the metallo-β-lactamase, Imis, from Aeromonas veronii bv. sobria. Antimicrobial Agents and Chemotherapy 42:436-439. WHO (World Health Organization). 2004. Joint FAO/OIE/WHO second workshop on none-human antimicrobial usage and antimicrobial resistance: Management Options. pp 1-31. Wu, C.J., J. J. Wu, J. J. Yan, H. C. Lee, N. Y. Lee, C. M. Chang, H. I. Shih, H. M. Wu, L. R. Wang, W. C. Ko. 2007. Clinical significance and distribution of putative virulence markers of 116 consecutive clinical Aeromonas isolates in southern Taiwan. Journal of Infections 54:151-158.

125
Wu, C-J., Y-C. Chuang, M-F. Lee, C-C. Lee, H-C. lee, N-Y. Lee, C-M. Chang, P-L. Chen, Y-T. Lin, J-J. Yan, and W-C Ko. 2011. Bacteraemia due to extended-spectrum-β-lactamase producing Aeromonas spp. at a medical centre in southern Taiwan. Antimicrobial Agents and Chemotherapy 55:5813-5818. Xanthopoulos, v., n. Tzanetakise. Litopoulou-tzanetaki. 2010. Occurrence and characterisation of Aeromonas hydrophila and Yersina enterocolitica in minimally processed fresh vegetable salads. Food Control 21:393-398. Ye, Y., X-H. Xu and J-B. Li. 2010. Emergency of CTX-M-3, TEM-1 and a new plasmid-mediated MOX-4 Amp C in a multiresistant A. caviae isolate from a patient with pneumoniae. Journal of Medical Microbiology 59:843-847. Yin, G., L. Ardo, K. D. Thompson, A. Adams, Z. Jeney, and G. Jeney. 2009. Chinese herbs (Astragalus radix and Ganoderma lucidum) enhance immune response of carp, Cyprinus carpio, and protection against Aeromonas hydrophila. Fish and Shellfish Immunology 26:140-145. Zaky, A. M. M., F. A. Mansour and K. M. Person. 2010. Factors influencing multi-drug resistant and plasmid harbouring Aeromonas hydrophila isolated from Lake Manzala, Eqypt. Journal of Bacteriology Research 2:30-40. Zhang, X., T. Zhang, and H. H. P. Fang. 2009. Antibiotic resistance genes in water environments. Applications of Microbiological Biotechnology 82:397-414. Zhou, F., Ji, B., Zhang, H., Jiang, H., Yang, Z., Li, J., and Yan, w. 2007.The antibacterial effect of cinnamaldehyde, thymol, carvacrol and their combinations against the food-borne pathogen Salmonella typhimurium. Journal of Food Safety 27:124-133.

126
APPENDIX
Table A1: Zones of inhibition (mm) obtained with cinnamaldehyde and K. africana extracts as well as standard antimicrobial agents,
ampicillin (AMP10) and tetracycline (TE30), against water-and fish-associated Aeromonas spp. isolates
Isolates Source Species ID C 125* C 250* C 500* C 1250 EX 1* EX 2* EX 3* EX 4* AMP10*
TE30*
A. caviae ATCC 15468T 9 16 22 34 11 9 15 0 0 28 A. hydrophila ATCC 7966T 14 17 23 33 14 10 17 0 0 27 E. coli ATCC 25922 0 0 0 40 8 8 10 0 22 28
M1 Catfish A. culicicola 9 16 21 21 8 0 14 0 0 11 M2 Tilapia A. hydrophila 8 14 19 20 11 7 18 0 14.5 18 M3 Catfish A. allosaccharophila 14 19 27 28 8.5 0 10.5 0 0 28 M4 Catfish A. jandaei 0 9 17 20 9 0 11 0 13 27.5 M5 Catfish A. hydrophila 0 12 14 19 9 10.5 14 0 0 12.5 M6 Catfish A. hydrophila 0 0 17 20 0 0 13.5 0 14 14.5 M7 Catfish A. culicicola 19 30 41 21 0 0 11.5 0 0 26 M8 Tilapia A. allosaccharophila 0 12 17 25 9 8 15 0 0 14 M9 Catfish P. shigelloides 10 14 23 20 6 7 9 0 0 13.5
M10 Catfish A. culicicola 14 19 26 32 7 0 12 0 0 16 M11 Catfish Aeromonas spp. 11 16 21 23 11.5 0 13.5 0 0 17 M12 Koi carp A. bestiarum 0 0 13 21 9 9 13 0 12 18 M13 Catfish A. hydrophila 14 17 25 27 9 8 12.5 0 0 25 M14 Tilapia A. hydrophila 10 14 27 29 12.5 10 18 0 19 12 M15 Tilapia Aeromonas spp. 9 13 17 19 0 9.5 13 0 12 27 M16 Tilapia A. jandaei 13 15 20 28 10 0 11 0 0 14.5 M17 Tilapia A. hydrophila 12 15 20 25 9 9 14 0 0 15.5 M18 Tilapia A. caviae 10 17 23 30 10 9 15 0 11 15 M19 Tilapia A. jandaei 0 16 18 34 12 10 16 0 0 17.5 M20 Tilapia Aeromonas spp. 0 12 16 30 8 7 8.5 0 12 29

127
M21 Tilapia A. allosaccharophila 0 12 19 37 8 0 12.5 0 11 13 M22 Sea water A. culicicola 14 19 23 28 9 8 12.5 0 11.5 13 M23 Sea water A. culicicola 8 11 18 26 11 0 13 0 0 14 M24 Sea water A. jandaei 0 13 24 24 10 0 13 0 0 14.5 M25 Sea water A. culicicola 0 10 19 31 8 8 14 0 13 16 M26 Sea water Aeromonas spp. 45 0 0 14 20 7 7 13 0 12 13 M27 Sea water Aeromonas spp. 45 0 15 19 35 13 10 16 0 0 33 M28 Sea water A. jandaei 8 14 21 33 12 10 14.5 0 11.5 13.5 M29 Sea water A. culicicola 11 26 30 34 0 0 10 0 18 32 M30 Sea water A. jandaei 13 18 27 36 7 8 11 0 0 16 M31 Sea water A. culicicola 0 0 19 30 0 8 14.5 0 12 12 M32 Sea water A. culicicola 8 15 21 21 0 0 10 0 0 14.5 M33 Sea water Aeromonas spp. 310 9 12 17 28 8 0 10.5 0 0 12.5 M34 Sea water Aeromonas spp. 45 0 14 16 31 8 0 11 0 0 15 M35 Sea water A. culicicola 0 12 15 33 0 11 16 0 0 34 M36 Sea water A. jandaei 21 24 34 30 10 8 14 0 12 0 M37 Sea water Aeromonas spp. 45 13 17 23 30 0 0 10 0 0 10 M38 Sea water A. culicicola 20 23 27 33 0 0 13 0 0 12 M39 Sea water A. culicicola 0 0 15 30 9 8 14.5 0 14 12 M40 Sea water A. culicicola 0 9 12 31 15 12 13 0 0 30 M41 Sea water Aeromonas spp. 7 14 18 30 9 0 16 0 12 11 M42 Tilapia A. culicicola 0 9 17 33 10 9 16.5 0 0 34 M43 Tilapia Aeromonas spp. 310 18 24 28 36 8 0 13 0 0 31.5 M44 Tilapia A. icthiosmia 11 14 19 35 14 9 15 0 11.5 14 M45 Tilapia P. shigelloides 13 16 25 35 0 0 16 0 13 14 M46 Tilapia P. shigelloides 9 16 27 34 8 0 11.5 0 0 17 M47 Tilapia P. shigelloides 13 15 26 31 10 9 16.5 0 9 12 M48 Tilapia A. icthiosmia 31 32 37 19 10.5 9 13.5 0 8.5 13 M49 Tilapia A. sobria 0 17 26 28 7 8 10 0 0 15.5 M50 Catfish A. hydrophila 0 16 21 25 7 0 12 0 0 12.5 M51 Catfish A. hydrophila 14 18 23 35 8.5 9 9 0 14 15 M52 Tilapia A. hydrophila 0 12 16 25 9 9 14 0 17 0

128
M53 Catfish A. hydrophila 10 15 21 30 10 9 13 0 8 17 M54 Tilapia A. icthiosmia 8 14 18 28 0 0 15 0 11.5 14 M55 Tilapia A. veronii 11 16 24 26 9.5 9.5 14.5 0 0 16 M56 Tilapia A. culicicola 0 0 16 29 11 11.5 20 0 0 18 M57 Tilapia A. veronii 0 21 23 31 10 8 13 0 18 0 M58 Tilapia A. culicicola 0 16 20 31 9.5 10 14.5 0 14 15 M59 Tilapia A. caviae 11 17 20 30 6 7 13.5 0 0 10 M60 Tilapia A. hydrophila 9 14 18 29 7.5 9 14.5 0 13.5 14 M61 Tilapia A. culicicola 13 16 19 31 10 9 14 0 0 12 M62 Tilapia A. hydrophila 0 13 17 30 9.5 10 15 0 0 12 M63 Tilapia A. veronii 10 15 19 28 11.5 0 14.5 0 0 31.5 M64 Tilapia A. hydrophila 17 24 33 32 0 0 9 0 10 13.5 M65 Tilapia A. hydrophila 0 0 13 18 6.5 0 12 0 0 16 M66 Tilapia P. shigelloides 12 16 27 30 0 6 11 0 11 16.5 M67 Tilapia P. shigelloides 11 20 31 40 12 9 15.5 0 12 12 M68 Koi carp A. caviae 15 30 36 32 0 8 13 0 11 0 M69 Koi carp A. bestiarum 0 14 27 31 9 10 14 0 0 12 M70 Koi carp A. bestiarum 8 15 26 28 9 0 12 0 13 16 M71 Koi carp A. bestiarum 14 19 30 30 9 9.5 17 0 10 13 M72 Koi carp A. bestiarum 0 12 16 31 0 0 9 0 0 25 M73 Koi carp A. bestiarum 9 15 21 27 7 9 10 0 15 28 M74 Koi carp A. allosaccharophila 9 15 18 30 0 0 8 0 12 11 M75 Koi carp Aeromonas spp. 45 12 18 28 35 15 13 11 0 0 28 M76 Koi carp A. salmonicida 11 14 25 33 12 9 14 0 0 10.5 M77 Koi carp A. salmonicida 10 14 21 34 10 0 16 0 0 19 M78 Koi carp A. bestiarum 18 19 30 15 10 0 16 0 0 19 M79 Koi carp A. bestiarum 15 19 21 32 12 0 13 0 0 37 M80 Koi carp A. bestiarum 0 0 16 35 0 0 14 0 0 13 M81 Koi carp A. bestiarum 0 14 20 33 7.5 9 10 0 0 29 M82 Koi carp A. culicicola 12 15 19 30 7 7.5 10.5 0 23 31.5 M83 Koi carp A. bestiarum 0 16 21 27 9 0 13 0 10 18 M84 Koi carp A. bestiarum 0 0 25 31 0 0 13 0 0 16

129
M85 Koi carp A. allosaccharophila 12 20 22 31 15 12 16 0 0 33 M86 Koi carp A. hydrophila 21 26 28 29 11 0 16 0 0 10 M87 Koi carp A. bestiarum 17 23 29 31 0 0 14 0 0 11.5 M88 Koi carp A. bestiarum 10 19 21 33 8 10 12.5 0 20 29 M89 Koi carp A. allosaccharophila 0 0 0 0 9 0 15 0 14 19 M90 Koi carp A. bestiarum 9 16 19 32 9 8 15 0 0 17 M91 Koi carp A. bestiarum 0 0 13 18 10 0 12 0 0 12 M92 Koi carp A. allosaccharophila 8 15 20 30 0 0 14.5 0 9 13.5 M93 Koi carp A. allosaccharophila 0 0 11 17 8 0 9 0 0 10 M94 Koi carp A. hydrophila 0 16 18 33 9 7 13.5 0 7 22 M95 Koi carp A. hydrophila 11 16 18 30 14 12 15 0 0 34 M96 Koi carp A. bestiarum 0 9 16 30 7 0 14.5 0 0 17 M97 Koi carp A. bestiarum 13 16 21 30 14 10 15.5 0 0 11 M98 Koi carp Aeromonas spp. 310 11 18 24 31 14 10.5 14 0 0 40 M99 Koi carp A. bestiarum 15 17 21 31 8 8 12 0 0 16
* C125: 125 µg/ml; C250: 250 µg/ml; C500: 500 µg/ml and C1250: 1250 µg/ml cinnamaldehyde; EX 1: (4 mg/ml) K. africana ethyl acetate extract; EX 2: (4 mg/ml) K. africana dichloromethane extract; EX 3: (10 mg/ml) K. africana methanol extract; EX 4: (4 mg/ml) K. africana hexane extract; AMP10: Ampicillin; TE30: Tetracycline.

130
TABLE A2 Activity indices of cinnamaldehyde and K. africana extracts in relation to the standard antimicrobial agents, ampicillin
(AMP10) and tetracycline (TE30), against Aeromonas spp. isolates from seawater and fish
Isolates Activity index AMP10 Activity index TE30
C125* C250* C500* C1250*EX 1* EX 2* EX 3* EX 4* C125* C250* C500* C1250* EX 1* EX 2* EX 3* EX 4*
A. caviae ATCC 15468T 0 0 0 0 0 0 0 0 0.333 0.593 0.815 1.259 0.393 0.321 0.536 0
A. hydrophila ATCC 7966T 0 0 0 0 0 0 0 0 0.500 0.607 0.821 1.179 0.519 0.370 0.630 0
E. coli ATCC 25922 0 0 0 1.818 0.364 0.364 0.455 0 0 0 0 1.429 0.286 0.286 0.357 0
M1 0 0 0 0 0 0 0 0 0.818 1.455 1.909 1.909 0.727 0 1.273 0 M2 1.379 0.552 0.966 1.310 0.759 0.483 1.241 0 0.444 0.778 1.056 1.111 0.611 0.389 1.000 0 M3 0 0 0 0 0 0 0 0 0.500 0.679 0.964 1.000 0.304 0 0.375 0 M4 1.538 0 0.692 1.308 0.692 0 0.846 0 0 0.327 0.618 0.727 0.327 0 0.400 0 M5 0 0 0 0 0 0 0 0 0 0.960 1.120 1.520 0.720 0.840 1.120 0 M6 1.429 0 0 1.214 0 0 0.964 0 0 0 1.172 1.379 0 0 0.931 0 M7 0 0 0 0 0 0 0 0 0.731 1.154 1.577 0.808 0 0 0.442 0 M8 0 0 0 0 0 0 0 0 0 0.857 1.214 1.786 0.643 0.571 1.071 0 M9 0 0 0 0 0 0 0 0 0.741 1.037 1.704 1.481 0.444 0.519 0.667 0 M10 0 0 0 0 0 0 0 0 0.875 1.188 1.625 2.000 0.438 0 0.750 0 M11 0 0 0 0 0 0 0 0 0.647 0.941 1.235 1.353 0.676 0 0.794 0 M12 1.750 0 0 1.083 0.750 0.750 1.083 0 0 0 0.722 1.167 0.500 0.500 0.722 0 M13 0 0 0 0 0 0 0 0 0.560 0.680 1.000 1.08 0.360 0.320 0.500 0 M14 1.526 0.526 0.737 1.421 0.658 0.526 0.947 0 0.833 1.167 2.25 2.417 1.042 0.833 1.500 0 M15 1.583 0.750 1.083 1.417 0 0.792 1.083 0 0.333 0.481 0.630 0.704 0 0.352 0.481 0 M16 0 0 0 0 0 0 0 0 0.897 1.034 1.379 1.931 0.690 0 0.759 0 M17 0 0 0 0 0 0 0 0 0.774 0.968 1.29 1.613 0.581 0.581 0.903 0 M18 2.727 0.909 1.545 2.091 0.909 0.818 1.364 0 0.667 1.133 1.533 2.000 0.667 0.600 1.000 0 M19 0 0 0 0 0 0 0 0 0 0.914 1.029 1.943 0.686 0.571 0.914 0 M20 2.500 0 1.000 1.333 0.667 0.583 0.708 0 0 0.414 0.552 1.034 0.276 0.241 0.293 0 M21 3.364 0 1.091 1.727 0.727 0 1.136 0 0 0.923 1.462 2.846 0.615 0 0.962 0

131
M22 2.435 1.217 1.652 2.000 0.783 0.696 1.087 0 1.077 1.462 1.769 2.154 0.692 0.615 0.962 0 M23 0 0 0 0 0 0 0 0 0.571 0.786 1.286 1.857 0.786 0 0.929 0 M24 0 0 0 0 0 0 0 0 0 0.897 1.655 1.655 0.690 0 0.897 0 M25 2.385 0 0.769 1.462 0.615 0.615 1.077 0 0 0.625 1.188 1.938 0.500 0.500 0.875 0 M26 1.667 0 0 1.167 0.583 0.583 1.083 0 0 0 1.077 1.538 0.538 0.538 1.000 0 M27 0 0 0 0 0 0 0 0 0 0.455 0.576 1.061 0.394 0.303 0.485 0 M28 2.870 0.696 1.217 1.826 1.043 0.87 1.261 0 0.593 1.037 1.556 2.444 0.889 0.741 1.074 0 M29 1.889 0.611 1.444 1.667 0 0 0.556 0 0.344 0.813 0.938 1.063 0 0 0.313 0 M30 0 0 0 0 0 0 0 0 0.813 1.125 1.688 2.250 0.438 0.500 0.688 0 M31 2.500 0 0 1.583 0 0.667 1.208 0 0 0 1.583 2.500 0 0.667 1.208 0 M32 0 0 0 0 0 0 0 0 0.552 1.034 1.448 1.448 0 0 0.69 0 M33 0 0 0 0 0 0 0 0 0.720 0.960 1.360 2.240 0.640 0 0.84 0 M34 0 0 0 0 0 0 0 0 0 0.933 1.067 2.067 0.533 0 0.733 0 M35 0 0 0 0 0 0 0 0 0 0.353 0.441 0.971 0 0.324 0.471 0 M36 2.500 1.750 2.000 2.833 0.833 0.667 1.167 0 0 0 0 0 0 0 0 0 M37 0 0 0 0 0 0 0 0 1.300 1.700 2.300 3.000 0 0 1.000 0 M38 0 0 0 0 0 0 0 0 1.667 1.917 2.250 2.750 0 0 1.083 0 M39 2.143 0 0 1.071 0.643 0.571 1.036 0 0 0 1.250 2.500 0.750 0.667 1.208 0 M40 0 0 0 0 0 0 0 0 0 0.300 0.400 1.033 0.500 0.400 0.433 0 M41 2.500 0.583 1.167 1.500 0.750 0 1.333 0 0.636 1.273 1.636 2.727 0.818 0 1.455 0 M42 0 0 0 0 0 0 0 0 0 0.265 0.500 0.971 0.294 0.265 0.485 0 M43 0 0 0 0 0 0 0 0 0.571 0.762 0.889 1.143 0.254 0 0.413 0 M44 3.043 0.957 1.217 1.652 1.217 0.783 1.304 0 0.786 1.000 1.357 2.500 1.000 0.643 1.071 0 M45 2.692 1.000 1.231 1.923 0 0 1.231 0 0.929 1.143 1.786 2.500 0 0 1.143 0 M46 0 0 0 0 0 0 0 0 0.529 0.941 1.588 2.000 0.471 0 0.676 0 M47 3.444 1.444 1.667 2.889 1.111 1.000 1.833 0 1.083 1.250 2.167 2.583 0.833 0.75 1.375 0 M48 2.235 3.647 3.765 4.353 1.235 1.059 1.588 0 2.385 2.462 2.846 1.462 0.808 0.692 1.038 0 M49 0 0 0 0 0 0 0 0 0 1.097 1.677 1.806 0.452 0.516 0.645 0 M50 0 0 0 0 0 0 0 0 0 1.280 1.68 2.000 0.56 0 0.960 0 M51 2.500 1.000 1.286 1.643 0.607 0.643 0.643 0 0.933 1.200 1.533 2.333 0.567 0.600 0.600 0 M52 1.471 0 0.706 0.941 0.529 0.529 0.824 0 0 0 0 0 0 0 0 0

132
M53 3.750 1.250 1.875 2.625 1.25 1.125 1.625 0 0.588 0.882 1.235 1.765 0.588 0.529 0.765 0 M54 2.435 0.696 1.217 1.565 0 0 1.304 0 0.571 1.000 1.286 2.000 0 0 1.071 0 M55 0 0 0.00 0 0 0 0 0 0.688 1.000 1.500 1.625 0.594 0.594 0.906 0 M56 0 0 0 0 0 0 0 0 0 0 0.889 1.611 0.611 0.639 1.111 0 M57 1.722 0 1.167 1.278 0.556 0.444 0.722 0 0 0 0 0 0 0 0 0 M58 2.214 0 1.143 1.429 0.679 0.714 1.036 0 0 1.067 1.333 2.067 0.633 0.667 0.967 0 M59 0 0 0 0 0 0 0 0 1.100 1.700 2.000 3.000 0.600 0.700 1.350 0 M60 2.148 0.667 1.037 1.333 0.556 0.667 1.074 0 0.643 1.000 1.286 2.071 0.536 0.643 1.036 0 M61 0 0 0 0 0 0 0 0 1.083 1.333 1.583 2.583 0.833 0.750 1.167 0 M62 0 0 0 0 0 0 0 0 0 1.083 1.417 2.500 0.792 0.833 1.250 0 M63 0 0 0 0 0 0 0 0 0.317 0.476 0.603 0.889 0.365 0 0.460 0 M64 3.200 1.700 2.400 3.300 0 0 0.900 0 1.259 1.778 2.444 2.370 0 0 0.667 0 M65 0 0 0 0 0 0 0 0 0 0 0.813 1.125 0.406 0 0.750 0 M66 2.727 1.091 1.455 2.455 0 0.545 1.000 0 0.727 0.970 1.636 1.818 0 0.364 0.667 0 M67 3.333 0.917 1.667 2.583 1.000 0.750 1.292 0 0.917 1.667 2.583 3.333 1.000 0.750 1.292 0 M68 2.909 1.364 2.727 3.273 0 0.727 1.182 0 0 0 0 0 0 0 0 0 M69 0 0 0 0 0 0 0 0 0 1.167 2.250 2.583 0.750 0.833 1.167 0 M70 2.154 0.615 1.154 2.000 0.692 0 0.923 0 0.500 0.938 1.625 1.750 0.563 0 0.750 0 M71 3.000 1.400 1.900 3.000 0.900 0.950 1.700 0 1.077 1.462 2.308 2.308 0.692 0.731 1.308 0 M72 0 0 0 0 0 0 0 0 0 0.480 0.640 1.240 0 0 0.360 0 M73 1.800 0.600 1.000 1.400 0.467 0.600 0.667 0 0.321 0.536 0.750 0.964 0.250 0.321 0.357 0 M74 2.500 0.750 1.250 1.500 0 0 0.667 0 0.818 1.364 1.636 2.727 0 0 0.727 0 M75 0 0 0 0 0 0 0 0 0.429 0.643 1.000 1.250 0.536 0.464 0.393 0 M76 0 0 0 0 0 0 0 0 1.048 1.333 2.381 3.143 1.143 0.857 1.333 0 M77 0 0 0 0 0 0 0 0 0.526 0.737 1.105 1.789 0.526 0 0.842 0 M78 0 0 0 0 0 0 0 0 0.947 1.000 1.579 0.789 0.526 0 0.842 0 M79 0 0 0 0 0 0 0 0 0.405 0.514 0.568 0.865 0.324 0 0.351 0 M80 0 0 0 0 0 0 0 0 0 0 1.231 2.692 0 0 1.077 0 M81 0 0 0 0 0 0 0 0 0 0.483 0.690 1.138 0.259 0.310 0.345 0 M82 1.304 0.522 0.652 0.826 0.304 0.326 0.457 0 0.381 0.476 0.603 0.952 0.222 0.238 0.333 0 M83 2.700 0 1.600 2.100 0.900 0 1.300 0 0 0.889 1.167 1.500 0.500 0 0.722 0

133
M84 0 0 0 0 0 0 0 0 0 0 1.563 1.938 0 0.00 0.813 0 M85 0 0 0 0 0 0 0 0 0.364 0.606 0.667 0.939 0.455 0.364 0.485 0 M86 0 0 0 0 0 0 0 0 2.100 2.600 2.800 2.900 1.100 0 1.600 0 M87 0 0 0 0 0 0 0 0 1.478 2.000 2.522 2.696 0 0 1.217 0 M88 1.650 0.500 0.950 1.050 0.400 0.500 0.625 0 0.345 0.655 0.724 1.138 0.276 0.345 0.431 0 M89 0 0 0 0 0.643 0 1.071 0 0 0 0 0 0.474 0 0.789 0 M90 0 0 0 0 0 0 0 0 0.529 0.941 1.118 1.882 0.529 0.471 0.882 0 M91 0 0 0 0 0 0 0 0 0 0 1.083 1.500 0.833 0 1.000 0 M92 3.333 0.889 1.667 2.222 0 0 1.611 0 0.593 1.111 1.481 2.222 0 0 1.074 0 M93 0 0 0 0 0 0 0 0 0 0 1.100 1.700 0.800 0 0.900 0 M94 4.714 0 2.286 2.571 1.286 1.000 1.929 0 0 0.727 0.818 1.500 0.409 0.318 0.614 0 M95 0 0 0 0 0 0 0 0 0.324 0.471 0.529 0.882 0.412 0.353 0.441 0 M96 0 0 0 0 0 0 0 0 0 0.529 0.941 1.765 0.412 0 0.853 0 M97 0 0 0 0 0 0 0 0 1.182 1.455 1.909 2.727 1.273 0.909 1.409 0 M98 0 0 0 0 0 0 0 0 0.275 0.450 0.600 0.775 0.350 0.263 0.350 0 M99 0 0 0 0 0 0 0 0 0.938 1.063 1.313 1.938 0.500 0.500 0.750 0
* C125: 125 µg/ml; C250: 250 µg/ml; C500: 500 µg/ml and C1250: 1250 µg/ml cinnamaldehyde; EX 1: 4 mg/ml K. africana ethyl acetate extract; EX 2: 4 mg/ml K. africana dichloromethane extract; EX 3: 10 mg/ml K. africana methanol extract; EX 4: 4 mg/ml K. africana hexane extract; AMP10: Ampicillin; TE30: Tetracycline.

cxxxiv
Copyright © 2022 FDOKUMEN