Characterization of a newly developed chicken 44K Agilent microarray
14
BioMed Central Page 1 of 14 (page number not for citation purposes) BMC Genomics Open Access Research article Characterization of a newly developed chicken 44K Agilent microarray Xianyao Li 1 , Hsin-I Chiang 1 , James Zhu 1,2 , Scot E Dowd 3 and Huaijun Zhou* 1 Address: 1 Texas Agricultural Experiment Station, Texas A&M University, College Station, TX, USA, 2 USDA Agriculture Research Service Plum Island Animal Disease Center, Orient Point, NY, USA and 3 USDA Agriculture Research Service, Livestock Issues Research Unit, Lubbock, TX, USA Email: Xianyao Li - [email protected]; Hsin-I Chiang - [email protected]; James Zhu - [email protected]; Scot E Dowd - [email protected]; Huaijun Zhou* - [email protected] * Corresponding author Abstract Background: The development of microarray technology has greatly enhanced our ability to evaluate gene expression. In theory, the expression of all genes in a given organism can be monitored simultaneously. Sequencing of the chicken genome has provided the crucial information for the design of a comprehensive chicken transcriptome microarray. A long oligonucleotide microarray has been manually curated and designed by our group and manufactured using Agilent inkjet technology. This provides a flexible and powerful platform with high sensitivity and specificity for gene expression studies. Results: A chicken 60-mer oligonucleotide microarray consisting of 42,034 features including the entire Marek's disease virus, two avian influenza virus (H5N2 and H5N3), and 150 chicken microRNAs has been designed and tested. In an important validation study, total RNA isolated from four major chicken tissues: cecal tonsil (C), ileum (I), liver (L), and spleen (S) were used for comparative hybridizations. More than 95% of spots had high signal noise ratio (SNR > 10). There were 2886, 2660, 358, 3208, 3355, and 3710 genes differentially expressed between liver and spleen, spleen and cecal tonsil, cecal tonsil and ileum, liver and cecal tonsil, liver and ileum, spleen and ileum (P < 10 -7 ), respectively. There were a number of tissue-selective genes for cecal tonsil, ileum, liver, and spleen identified (95, 71, 535, and 108, respectively; P < 10 -7 ). Another highlight of these data revealed that the antimicrobial peptides GAL1, GAL2, GAL6 and GAL7 were highly expressed in the spleen compared to other tissues tested. Conclusion: A chicken 60-mer oligonucleotide 44K microarray was designed and validated in a comprehensive survey of gene expression in diverse tissues. The results of these tissue expression analyses have demonstrated that this microarray has high specificity and sensitivity, and will be a useful tool for chicken functional genomics. Novel data on the expression of putative tissue specific genes and antimicrobial peptides is highlighted as part of this comprehensive microarray validation study. The information for accessing and ordering this 44K chicken array can be found at http:// people.tamu.edu/~hjzhou/TAMUAgilent44KArray/ Published: 31 January 2008 BMC Genomics 2008, 9:60 doi:10.1186/1471-2164-9-60 Received: 21 November 2007 Accepted: 31 January 2008 This article is available from: http://www.biomedcentral.com/1471-2164/9/60 © 2008 Li et al; licensee BioMed Central Ltd. This is an Open Access article distributed under the terms of the Creative Commons Attribution License (http://creativecommons.org/licenses/by/2.0 ), which permits unrestricted use, distribution, and reproduction in any medium, provided the original work is properly cited.
-
Upload
independent -
Category
Documents
-
view
1 -
download
0
Transcript of Characterization of a newly developed chicken 44K Agilent microarray

BioMed CentralBMC Genomics
ss
Open AcceResearch articleCharacterization of a newly developed chicken 44K Agilent microarrayXianyao Li1, Hsin-I Chiang1, James Zhu1,2, Scot E Dowd3 and Huaijun Zhou*1Address: 1Texas Agricultural Experiment Station, Texas A&M University, College Station, TX, USA, 2USDA Agriculture Research Service Plum Island Animal Disease Center, Orient Point, NY, USA and 3USDA Agriculture Research Service, Livestock Issues Research Unit, Lubbock, TX, USA
Email: Xianyao Li - [email protected]; Hsin-I Chiang - [email protected]; James Zhu - [email protected]; Scot E Dowd - [email protected]; Huaijun Zhou* - [email protected]
* Corresponding author
AbstractBackground: The development of microarray technology has greatly enhanced our ability toevaluate gene expression. In theory, the expression of all genes in a given organism can bemonitored simultaneously. Sequencing of the chicken genome has provided the crucial informationfor the design of a comprehensive chicken transcriptome microarray. A long oligonucleotidemicroarray has been manually curated and designed by our group and manufactured using Agilentinkjet technology. This provides a flexible and powerful platform with high sensitivity and specificityfor gene expression studies.
Results: A chicken 60-mer oligonucleotide microarray consisting of 42,034 features including theentire Marek's disease virus, two avian influenza virus (H5N2 and H5N3), and 150 chickenmicroRNAs has been designed and tested. In an important validation study, total RNA isolatedfrom four major chicken tissues: cecal tonsil (C), ileum (I), liver (L), and spleen (S) were used forcomparative hybridizations. More than 95% of spots had high signal noise ratio (SNR > 10). Therewere 2886, 2660, 358, 3208, 3355, and 3710 genes differentially expressed between liver andspleen, spleen and cecal tonsil, cecal tonsil and ileum, liver and cecal tonsil, liver and ileum, spleenand ileum (P < 10-7), respectively. There were a number of tissue-selective genes for cecal tonsil,ileum, liver, and spleen identified (95, 71, 535, and 108, respectively; P < 10-7). Another highlight ofthese data revealed that the antimicrobial peptides GAL1, GAL2, GAL6 and GAL7 were highlyexpressed in the spleen compared to other tissues tested.
Conclusion: A chicken 60-mer oligonucleotide 44K microarray was designed and validated in acomprehensive survey of gene expression in diverse tissues. The results of these tissue expressionanalyses have demonstrated that this microarray has high specificity and sensitivity, and will be auseful tool for chicken functional genomics. Novel data on the expression of putative tissue specificgenes and antimicrobial peptides is highlighted as part of this comprehensive microarray validationstudy. The information for accessing and ordering this 44K chicken array can be found at http://people.tamu.edu/~hjzhou/TAMUAgilent44KArray/
Published: 31 January 2008
BMC Genomics 2008, 9:60 doi:10.1186/1471-2164-9-60
Received: 21 November 2007Accepted: 31 January 2008
This article is available from: http://www.biomedcentral.com/1471-2164/9/60
© 2008 Li et al; licensee BioMed Central Ltd. This is an Open Access article distributed under the terms of the Creative Commons Attribution License (http://creativecommons.org/licenses/by/2.0), which permits unrestricted use, distribution, and reproduction in any medium, provided the original work is properly cited.
Page 1 of 14(page number not for citation purposes)

BMC Genomics 2008, 9:60 http://www.biomedcentral.com/1471-2164/9/60
BackgroundThe chicken, being the first farm animal with a completelysequenced genome, has become an important animalmodel in the fields of evolution, development, immunol-ogy, oncology, cell biology, virology, and genetics [1,2].Candidate genes, QTL, and molecular markers have beenwidely utilized to reveal the genetic basis of economicallyimportant traits in chickens [3-5]. There are also manynew genetic and bioinformatics resources available thatare based upon chicken genome information, includinggenetic and physical maps [6], EST databases [7], and SNPmaps [1,8]. Global gene expression profiling will providea complementary tool improving our ability to study reg-ulation of complex and economically important traits inchickens.
The development of high-throughput microarray hasaccelerated the study of gene expression by interrogatingthousands of genes simultaneously [9-11]. Microarraytechnologies provide an important tool to infer gene net-works and to identify highly conserved genetic pathwaysin plants and animals. There have been many importantstudies contributing to gene expression profiling in agri-cultural animals including pigs [12,13], rabbits [14], andcattle [15,16]. Several chicken cDNA or oligonucleotideprobe (oligo) arrays have also been developed and uti-lized in gene expression studies. These arrays include a3,011 lymphocyte array [17], a 3,072 intestinal array [18],an 11K heart specific array [19], a 14,718 macrophagespecific array [20], a 13K cDNA transcriptome array [21],a 5K immune related array [21,22], a 20K long oligochicken genome array [23], and a 33K Affymetrix chickengenome array [24].
Short and long oligo arrays have several advantages overcDNA arrays in terms of specificity, sensitivity, and repro-ducibility [25]. Both microarray technologies can providecomprehensive and reliable data for global expressionanalyses. However, oligos are more uniform in concentra-tions and annealing temperature, more gene-specific, flex-ible, and economic. Long oligos can provide increasedsignal intensity compared to short ones [26,27]. Longoligo arrays generated by Agilent Technology may be ableto detect down to single transcript per cell [25]. This 60-mer 44K chicken whole genome custom array which wasdeveloped by our group and manufactured using the Agi-lent Technology will provide a comprehensive and power-ful functional genomics tool for the agriculturalcommunity.
ResultsGenes selected on the arrayA total of 42,034 probes were designed based on thewhole chicken genome sequence including autosomes,sex chromosomes, unlocalized chromosomes (i.e.
E22C19W28, E26C13 and E50C23), and mitochondria(Figure 1), plus 1264 positive control features and 153negative control features. Chicken chromosomes rangefrom 0.15 Mb to 188.2 Mb [6]. In order to calculate theprobe density (number of probes per Mb) on each chro-mosome, the number of probes targeted to each chromo-some was divided by the length of the chromosome. Theprobe density ranged from 28 probes per Mb (Chr. 16) to445 probes per Mb (Chr. 2), with a mean value of 76. Thisarray also included probes designed from 150 chickenmicroRNA, 43 Marek's disease virus genes, and 20 avianinfluenza virus genes (10 H5N2 and 10 H5N3 genes).
Array qualityThe signal-to-noise ratio (SNR) for each element was cal-culated using the difference of the median intensity,minus the median background, divided by the standarddeviation of the background [28]. The percentage of highquality spots (SNR > 10) were calculated as the number ofhigh quality spots divided by the total number of spots onthe array. For all 24 arrays, the average percentage of highquality spots was determined to be 96.55 ± 4.89%.
To evaluate the array quality, two comparisons were car-ried out: (1) two biological replicates from the same tissuelabelled with the same dye and (2) the same sampleslabelled with Cy5 and Cy3. The correlation coefficients ofsignal intensities between the two biological replicatesand between the two different dyes compared among thesame samples (dye swap) were calculated by JMP 5.5 (SASInstitute, Cary, NC) (Figure 2). The correlation coeffi-cients between two biological replicates of cecal tonsil
Number of probes in the microarray represented in each chromosomeFigure 1Number of probes in the microarray represented in each chromosome. U represents ChrUn_random; M rep-resents mitochondrial sequence; O represents other chro-mosome, like chrE22, E64.
Page 2 of 14(page number not for citation purposes)
BMC Genomics 2008, 9:60 http://www.biomedcentral.com/1471-2164/9/60
labelled with Cy5 or Cy3 were 0.99, 1.00, respectively. Theregression lines between two biological replicates of cecaltonsil labelled with Cy5 or Cy3 were y = 0.9779x + 0.0057(R2 = 0.99) and y = 0.9778x (R2 = 0.99), respectively (Fig-ures 2A, B). Dye swaps were utilized throughout this studyin order to avoid the dye bias. The correlation coefficientand regression line between cecal tonsils labelled withCy5 and Cy3 were 1.00 and y = 0.99x (R2 = 0.98), respec-tively (Figure 2C).
Gene expression in different tissuesBefore normalization, signal intensities of each featurewere filtered against negative controls in the array. Theratio of signal intensity for each gene and the average sig-nal intensity of negative control elements were calculated.An arbitrary ratio of 1.5 was used to determine if a partic-ular gene was expressed in a given tissue. It was found that43.83% of all genes on the array were expressed within allfour tissues. Looking at each tissue individually, it wasfound that 71.11%, 80.05%, 75.37%, and 80.22% of the
genes on the array were expressed in cecal tonsil, ileum,liver, and spleen, respectively.
A comparative study was conducted by comparing geneexpression profiles between each of the four selected tis-sues (cecal tonsil, ileum, liver, and spleen). There were3710, 3355, 3208, 2886, 2660, and 358 genes signifi-cantly and differentially expressed between spleen andileum, liver and ileum, liver and cecal tonsil, liver andspleen, spleen and cecal tonsil, and cecal tonsil and ileumat the cut-off of P < 10-7. The corresponding false discov-ery rate (FDR) for each comparison was calculated andshown to be 4.46 × 10⁻⁷, 4.14 × 10⁻⁷, 4.37 × 10⁻⁷, 5.02 ×10⁻⁷, 7.39 × 10⁻⁷ and 9.11 × 10⁻⁶, respectively. Out of the150 chicken microRNAs included in this microarray, itwas shown that 15, 36, 31, 24, 15, and 11 microRNAswere differentially expressed when comparing spleen andileum, liver and ileum, liver and cecal tonsil, liver andspleen, spleen and cecal tonsil, and cecal tonsil and ileum(P < 0.05).
The correlation of signal intensities between biological replicates and dye swapsFigure 2The correlation of signal intensities between biological replicates and dye swaps. A. The correlation of signal inten-sities between two individual cecal tonsil (C) samples labeled with Cy5, Y = 0.98 X+0.0057, R2 = 0.99. B. The correlation of sig-nal intensities between two individual cecal tonsil (C) samples labeled with Cy3, Y = 0.98 X, R2 = 0.99. C. The correlation of signal intensities between the same cecal tonsil (C) sample labeled with Cy3 and Cy5, Y = 0.99 X, R2 = 0.98.
A.
C.
B.
Page 3 of 14(page number not for citation purposes)

BMC Genomics 2008, 9:60 http://www.biomedcentral.com/1471-2164/9/60
There were three pairs of tissue gene expression compari-sons performed for each tissue as part of this study. Thesecomparisons were used to obtain a list of genes that arespecifically expressed in each tissue (Figure 3). In sum-mary, there were 286, 489, 4102, and 3929 genes signifi-cantly expressed in cecal tonsil, ileum, liver, and spleen (P< 10-3), respectively; 167, 201, 1627, and 1141 genes atcut-off P value of 10-5, and 156, 88, 737, and 378 genes atP < 10-7.
Fold change is an indication of relative gene expressiondifferences. It is considered that genes, which areexpressed at a higher level in one tissue compared to allother tissues, are "tissue-selective" genes [29]. Those geneswhich are significantly expressed with at least two-foldhigher expression in one tissue when compared to theother three tissues are considered to be selectivelyexpressed in this tissue. The data on the selectivelyexpressed genes at three different cut-off P values (10-3, 10-
5, and 10-7) as determined in this study are listed in Table1. There were 120, 153, 857, and 541 genes selectivelyexpressed in the cecal tonsil, ileum, liver and spleen at P <10-3, respectively. There were 103, 115, 736, and 291selective genes respectively at a cut-off P value of 10-5 andthere were 95, 71, 535, and 108 selective genes at a cut-offP value of 10-7. The selectively expressed genes expressedat P < 10-7 are listed in the additional data files 1, 2, 3, 4.
Gene ontologyFunctional category enrichment evaluation based on thegene ontology (GO) was performed on the differentiallyexpressed genes for each tissue comparison (Figure 4, 5,6). There are three components to a GO annotation: cel-
lular component (CC), molecular function (MF), and bio-logical process (BP). Biological Processes may arguably bethe more relevant aspect of GO in relation to this study,therefore, only functional clusters belonging to this com-ponent have been presented. Comparatively inducedgenes from liver when individually compared to the otherthree tissues showed GO BP enrichments associated withcellular biosynthesis, cellular lipid metabolism, coagula-tion, hemostasis, metabolism, nitrogen compoundmetabolism, and physical process (Figure 4A). GO BPenrichment analysis of repressed liver genes for each ofthe three comparisons identified the categories of actincytoskeleton organization and biogenesis, cell differentia-tion, cell organization and biogenesis and development.There were many significantly enriched functional catego-ries associated with comparatively repressed genes whenonly considering the comparisons between liver andspleen, and liver and cecal tonsil. These were cellularphysiological processes, primary metabolism, macromol-ecule biosynthesis, macromolecule metabolism, develop-ment, protein biosynthesis, protein metabolism, andregulation of cellular process (Figure 4B). GO BP enrich-ments of induced genes in the spleen revealed enrichedcategories that included biopolymer metabolism, nucleo-base, nucleoside, nucleotide and nucleic acid metabolism,physiological process, and primary metabolism (Figures4B, 5). Induced genes in comparisons of cecal tonsil withliver and ileum showed functional enrichment primarilycategorized as cell death (Figures 4B, 5). Comparisons ofrepressed genes in cecal tonsils with both spleen and livershowed enrichments associated with physiological proc-ess and response to stress (Figures 4A, 5). In the functionalcomparisons of induced genes from ileum with bothspleen and liver, there were enrichments associated withdevelopment (Figures 4B, 6); however, the repressedgenes in ileum when compared to spleen and livershowed functional enrichment of cellular biosynthesis,physiological process, and protein biosynthesis (Figures4A, 5).
Quantitative real time PCRTo validate the microarray results, quantitative real timePCR (qRT-PCR) assays were performed on the same RNAsamples used for the microarrays. A total of 23 genes wereselected for these verifications. These genes includedinduced and repressed genes that were significantly and
Table 1: The number of tissue selective genes at certain cut-off P values
Cut-off Cecal tonsil Ileum Liver Spleen
10-3 120 153 857 54110-5 103 115 736 29110-7 95 71 535 108
Venn diagram showing the number of specifically expressed genes in each tissueFigure 3Venn diagram showing the number of specifically expressed genes in each tissue. A. Gene number at cut-off P values of 10-3. B. Gene number at cut-off P values of 10-
5. C. Gene number at cut-off P values of 10-7.
Liver
4102
Ileum
489
Spleen 3929
Cecal tonsil286
103 103
375
615
36
A.
Liver
Spleen
Cecal tonsil
1627
1141
167Ileum
201
10
10
152
5
128
B.
Liver
Spleen
Cecal tonsilIleum
378
88156
737
213
45
45
C.
Page 4 of 14(page number not for citation purposes)

BMC Genomics 2008, 9:60 http://www.biomedcentral.com/1471-2164/9/60
Page 5 of 14(page number not for citation purposes)
Significantly enriched Gene Ontology (GO) terms for Biological Process classification of the differentially expressed genesFigure 4Significantly enriched Gene Ontology (GO) terms for Biological Process classification of the differentially expressed genes. A. Up regulated genes between liver and cecal tonsil, liver and ileum, and liver and spleen. B. Down regu-lated genes between liver and cecal tonsil, liver and ileum, and liver and spleen. nucleobase, nucleoside, nucleotide and nucleic acid ...: nucleobase, nucleoside, nucleotide and nucleic acid metabolism. Percentage shown in Y-axis was calculated as genes in each GO term divided by all up regulated or down regulated genes in each comparison.
0
20
40
60
80
100
120
140
160am
ine
met
abol
ism
amin
o ac
id a
nd d
eriv
ativ
e m
etab
olis
m
amin
o ac
id m
etab
olis
m
acet
yl-C
oA c
atab
olis
m
aero
bic
resp
iratio
n
alco
hol c
atab
olis
m
alco
hol m
etab
olis
m
arom
atic
com
poun
d m
etab
olis
m
carb
oxyl
ic a
cid
met
abol
ism
carb
oxyl
ic a
cid
met
abol
ism
cellu
lar b
iosy
nthe
sis
cellu
lar
carb
ohyd
rate
cat
abol
ism
cellu
lar
carb
ohyd
rate
met
abol
ism
cellu
lar c
atab
olis
m
cellu
lar l
ipid
met
abol
ism
cellu
lar
resp
iratio
nco
agul
atio
n
coen
zym
e bi
osyn
thes
is
coen
zym
e m
etab
olis
m
cofa
ctor
bio
synt
hesi
s
cofa
ctor
met
abol
ism
elec
tron
tran
spor
t
esta
blis
hmen
t of l
ocal
izat
ion
gene
ratio
n of
pre
curs
or m
etab
olite
s an
d en
ergy
gluc
ose
cata
bolis
m
gluc
ose
met
abol
ism
glyc
olys
ishe
mos
tasi
s
hexo
se c
atab
olis
m
hexo
se m
etab
olis
m
lipid
bio
synt
hesi
s
lipid
tran
spor
tlo
caliz
atio
nm
etab
olis
m
mon
osac
char
ide
cata
bolis
m
mon
osac
char
ide
met
abol
ism
nitro
gen
com
poun
d m
etab
olis
m
nucle
osid
e m
onop
hosp
hate
bio
synt
hesi
s
nucle
osid
e m
onop
hosp
hate
met
abol
ism
orga
nic
acid
met
abol
ism
nucl
eotid
e m
etab
olis
m
phys
iolo
gica
l pro
cess
prot
ein
bios
ynth
esis
purin
e nu
cleo
tide
bios
ynth
esis
regu
latio
n of
bod
y flu
ids
resp
onse
to e
xter
nal s
timul
us
resp
onse
to o
ther
org
anis
m
resp
onse
to p
est,
path
ogen
or p
aras
ite
resp
onse
to s
tress
resp
onse
to w
ound
ing
ribon
ucle
osid
e m
onop
hosp
hate
bio
synt
hesi
s
ribon
ucle
osid
e m
onop
hosp
hate
met
abol
ism
trans
latio
ntra
nspo
rt
trica
rbox
ylic
acid
cyc
le
wou
nd h
ealin
g
% o
f G
enes
L vs S induced
L vs I induced
L vs C induced
0
10
20
30
40
50
60
70
80
actin
fila
men
t cap
ping
actin
fila
men
t dep
olym
eriz
atio
n
actin
fila
men
t-bas
ed p
roce
ss
actin
cyt
oske
leto
n or
gani
zatio
n an
d bi
ogen
esis
actin
pol
ymer
izat
ion
and/
or d
epol
ymer
izat
ion
apop
tosi
s
barb
ed-e
nd a
ctin
fila
men
t cap
ping
biop
olym
er m
etab
olis
mce
ll cy
cle
cell
deat
h
cell
diffe
rent
iatio
nce
ll di
visi
on
cell
orga
niza
tion
and
biog
enes
is
cell
prol
ifera
tion
cellu
lar m
acro
mol
ecul
e m
etab
olis
m
cellu
lar m
orph
ogen
esis
cellu
lar p
hysi
olog
ical
pro
cess
cyto
skel
eton
org
aniz
atio
n an
d bi
ogen
esis
deve
lopm
ent
mor
phog
enes
is
M p
hase
of m
itotic
cel
l cyc
le
mac
rom
olec
ule
bios
ynth
esis
mac
rom
olec
ule
met
abol
ism
nega
tive
regu
latio
n of
act
in fi
lam
ent d
epol
ymer
izat
ion
nega
tive
regu
latio
n of
bio
logi
cal p
roce
ss
nega
tive
regu
latio
n of
cel
l org
aniz
atio
n an
d bi
ogen
esis
nega
tive
regu
latio
n of
cel
lula
r phy
siol
ogic
al p
roce
ss
nega
tive
regu
latio
n of
cel
lula
r pro
cess
nega
tive
regu
latio
n of
met
abol
ism
nega
tive
regu
latio
n of
pro
tein
met
abol
ism
nucl
eoba
se, n
ucle
osid
e, n
ucle
otid
e an
d nu
clei
c ac
id m
...
orga
nelle
org
aniz
atio
n an
d bi
ogen
esis
phys
iolo
gica
l pro
cess
prim
ary
met
abol
ism
prog
ram
med
cel
l dea
th
prot
ein
bios
ynth
esis
prot
ein
depo
lym
eriz
atio
n
prot
ein
met
abol
ism
prot
ein
ubiq
uitin
atio
n
regu
latio
n of
act
in fi
lam
ent d
epol
ymer
izat
ion
regu
latio
n of
act
in fi
lam
ent l
engt
h
regu
latio
n of
act
in p
olym
eriz
atio
n an
d/or
dep
olym
eriz
atio
n
regu
latio
n of
cel
l org
aniz
atio
n an
d bi
ogen
esis
regu
latio
n of
apo
ptos
is
regu
latio
n of
bio
logi
cal p
roce
ss
regu
latio
n of
cel
l org
aniz
atio
n an
d bi
ogen
esis
regu
latio
n of
cel
l pro
lifer
atio
n
regu
latio
n of
cel
lula
r pro
cess
regu
latio
n of
phy
siol
ogic
al p
roce
ss
regu
latio
n of
pro
gram
med
cel
l dea
th
regu
latio
n of
pro
tein
met
abol
ism
RN
A p
roce
ssin
g
% o
f Gen
es
L vs S repressd
L vs I repressd
L vs C repressd
A.
B.
A.

BMC Genomics 2008, 9:60 http://www.biomedcentral.com/1471-2164/9/60
non-significantly expressed (Table 2). The relative signalintensities of those genes selected for qRT-PCR rangedfrom low to high (10 to 65535). Glyceraldehyde-3-phos-phate dehydrogenase (GAPDH) was used as the normali-zation standard.
The coefficient of variation between the replicate qRT-PCRreactions was calculated and ranged from 0.1%-2%. Forthe genes with P < 5 × 10⁻⁴ in microarray results, 95.5% ofthe genes tested by qRT-PCR were also differentiallyexpressed (P < 0.05); for genes 5 × 10⁻⁴<P < 0.05 in themicroarray only 16.7% were significantly and differen-tially expressed (P < 0.05) using qRT-PCR; none of thegenes with P > 0.05 were shown to be differentiallyexpressed using qRT-PCR. In terms of regulation directionfor the genes in each qRT-PCR comparison, the microar-ray results were always consistent with qRT-PCR for geneswith P < 0.0001, but only 75% when considering geneswith 0.0001 <P < 0.05, and genes with P > 0.05, we found78.57% of genes were consistently expressed betweenmicroarray and qRT-PCR (Tables 3 and 4). The fold-changes (log2 ratio) of each gene for six comparisons are
presented in Tables 3 and 4. Most of fold-changes in qRT-PCR were higher than those seen in microarray compari-sons.
Utilization of the arrayMIAME information about this chicken transcriptomemicroarray has been deposited in NCBI's Gene ExpressionOmnibus (GEO) [30]. The accession numbers are: Plat-form, GPL4993; Series, GSE7452; Samples,GSM180391–GSM180406, GSM180426, GSM180428,GSM180430, GSM180433, GSM180434, GSM180436,GSM180438, GSM180441.
DiscussionMicroarray performanceThree different types of microarrays have been widely uti-lized in genome research including cDNA (long strands ofamplified cDNA sequences), short oligonucleotide(25–30 nt), and long oligonucleotide (50–80 nt). Severalstudies have compared the performance of different plat-forms [10,13,31-34]. Annotation and identity of the com-mercial oligonucleotides are reliable and the probe
Significantly enriched Gene Ontology (GO) terms for Biological Process classification of the differentially up regulated genes between cecal tonsil and ileum, spleen and cecal tonsil, spleen and ileumFigure 5Significantly enriched Gene Ontology (GO) terms for Biological Process classification of the differentially up regulated genes between cecal tonsil and ileum, spleen and cecal tonsil, spleen and ileum. Percentage shown in Y-axis was calculated as genes in each GO term divided by all up regulated or down regulated genes in each comparison.
0
10
20
30
40
50
60
70
80
90
biop
olym
er m
etab
olis
mbi
osyn
thes
isce
ll cy
cle
cell
deat
h
cellu
lar b
iosy
nthe
sis
cellu
lar m
acro
mol
ecul
e m
etab
olis
m
cellu
lar p
hysi
olog
ical
pro
cess
cellu
lar p
rote
in m
etab
olis
m
DN
A m
etab
olis
mD
NA
repa
ir
DN
A re
plic
atio
n
DN
A-d
epen
dent
DN
A re
plic
atio
nM
pha
se
mac
rom
olec
ule
bios
ynth
esis
mac
rom
olec
ule
met
abol
ism
nucl
eoba
se, n
ucle
osid
e, n
ucle
otid
e an
d nu
clei
c ac
id m
etab
olis
m
phys
iolo
gica
l pro
cess
prim
ary
met
abol
ism
prot
ein
bios
ynth
esis
prot
ein
met
abol
ism
regu
latio
n of
bio
logi
cal p
roce
ss
regu
latio
n of
cel
lula
r pro
cess
regu
latio
n of
phy
siol
ogic
al p
roce
ss
resp
onse
to D
NA
dam
age
stim
ulus
resp
onse
to e
ndog
enou
s st
imul
us
resp
onse
to o
ther
org
anis
m
resp
onse
to p
est,
path
ogen
or p
aras
ite
resp
onse
to s
timul
us
resp
onse
to s
tress
RN
A m
etab
olis
m
% o
f Gen
es
S vs I induced
S vs C induced
C vs I induced
Page 6 of 14(page number not for citation purposes)

BMC Genomics 2008, 9:60 http://www.biomedcentral.com/1471-2164/9/60
performance is excellent [32]. Commercial microarrayscan provide higher precision than homemade microarrays[33]. This custom long-oligo array was generated by theAgilent SurePrint ink-jet technology, which also providesa flexible platform for revising and updating oligonucle-otide probes in the array without additional cost [25,35].Only small amount of RNA is needed for labelling (50 ngto 5 μg of total RNA or 10–100 ng of poly (A)+ RNA) [35],compared to at least 20–30 μg total RNA using cDNAarray. This is especially important for those applicationsthat generate limited amounts of RNA, such as laser-cap-ture.
Chicken, as a major food animal, plays a key role in nutri-tion and food safety for human health, and is a modelorganism in developmental biology and for diseaseresearch including virology, oncology, and immunology[36]. There were several chicken whole genome microar-rays as noted in the introduction. The currently described44K long oligonucleotide (60-mer) microarray has shownoverall high array quality and specificity compared tocDNA and 25-mer oligo arrays [37]. In addition, the 4 ×44K platform in the array design has the feature of fourindependent arrays in one slide, which is more cost effec-tive and can also reduce variations among the arrayswithin a slide. The design of this array was based on
expressed sequences selected by walking over the chickengenome sequences in the UCSC genome browser. Thismanual approach allowed us to maximize genome cover-age and minimize gene redundancy.
High background levels in an array platform can obscurethe signal from low-expressed genes and impede accuratequantification. The magnitude of SNR can affect the sen-sitivity of the microarray, and a higher SNR indicates highsensitivity and low background. In general, SNR > 3 wasused as the lower-bound threshold for spot detection [21]in the current microarray studies and a SNR > 10 was theindication of high quality spots [28]. More than 95% ofthe spots with SNR > 10 in the array compared to 86.3 to88.9% with SNR > 3 for the chicken cDNA array [21] havedemonstrated the high sensitivity of the current array. Theaverage SNR of the current microarray was 921.93, whichwas much higher than the SNR of most cDNA array plat-forms (35.1 to 38.3). This will promote sufficient signalgeneration for the detection of even low copy genes.
Quantitative real time PCR has become the gold standardfor the gene expression and generally used to validate themicroarray results [38]. At the criterion of P < 5 × 10⁻⁴ inthe microarray analysis, false positives could be effectivelycontrolled (95.5% consistency between microarray andqRT-PCR). For those 4.5% inconsistent ones, large varia-tions were observed between four biological replicateswithin each tissue using the more sensitive qRT-PCRmethod, which caused higher P values. On the otherhand, the results from qRT-PCR demonstrated that type IIerrors (false negatives) can be controlled, given certaincut-off P value from microarray analysis (100% true false,given P > 0.05). These results indicated that microarrayanalyses from the current array were statistically reliableand accurate.
Genes on the microarrayThis whole genome 44 K microarray consists of probesdesigned from all potential genes and was designed basedon the February 2004 chicken (Gallus gallus) v1.0 draftassembly. The current array design includes all of theavailable (150) chicken microRNAs from miRBase 8.1[39,40], all known Marek's disease virus and two avianinfluenza virus (H5N2 and H5N3) transcripts. This arrayplatform will provide a unique opportunity to study host-pathogen interaction using the same array simultane-ously. This is important as we currently face potentialemergence of an avian influenza virus epidemic. A secondversion of this array based on May 2006 chicken (Gallusgallus) v2.1 draft assembly has been updated and is nowavailable.
A strict statistical criterion has been applied in the currentanalysis. Several thousand genes were differentially
Significantly enriched Gene Ontology (GO) terms for Biolog-ical Process classification of the differentially down regulated genes between cecal tonsil and ileum, spleen and cecal tonsil, spleen and ileumFigure 6Significantly enriched Gene Ontology (GO) terms for Biological Process classification of the differentially down regulated genes between cecal tonsil and ileum, spleen and cecal tonsil, spleen and ileum. Gen-eration of precursor metab...: generation of precursor metabolites and energy. Percentage shown in Y-axis was cal-culated as genes in each GO term divided by all up regulated or down regulated genes in each comparison.
0
10
20
30
40
50
acet
yl-C
oA c
atab
olis
mae
robi
c re
spira
tion
cellu
lar r
espi
ratio
n
coen
zym
e ca
tabo
lism
deve
lopm
ent
gene
ratio
n of
pre
curs
or m
etab
...lip
id tr
ansp
ort
phys
iolo
gica
l pro
cess
trica
rbox
ylic
aci
d cy
cle
% o
f Gen
es
S vs I repressed
S vs C repressed
C vs I repressed
Page 7 of 14(page number not for citation purposes)
BMC Genomics 2008, 9:60 http://www.biomedcentral.com/1471-2164/9/60
expressed between every two tissue comparison even at P< 10-7. Because there were more than 40 thousand genesanalyzed in this microarray experiment; therefore, it isimportant to control the proportion of false positives[41]. False discovery rates (FDR) based on P values is theexpected proportion of true null hypotheses rejected inrelation to the total number of null hypotheses rejected[42]. FDR is a more convenient and natural scale than theP-value scale, and it can provide the probability of a genevalue to be false positive [43]. In this study, the FDRs wereless than 5% for a P value of 10-7, which demonstrated thereliable results of the current microarray experiment. Sim-ilar FDR were observed in gene expression profilingbetween different tissues using a long oligo swine array[12].
Gene expression profiles of different normal tissues pro-vide information about the biological function of the tis-sue and are expected to be conserved during evolution.Liver, spleen, and ileum have been widely utilized in geneexpression profiling studies in human [29,44-46] and
swine [12,47]. There were some common gene ontologyterms enriched with tissue comparison between spleenand ileum in both human [44] and chickens such as pro-tein biosynthesis, energy pathways, and immuneresponse. But there were some distinct enrich termsbetween human and chickens including cytochrome Coxidase activity in human, and cell death, development,M phase, macromolecule metabolism, and physiologicalprocess in chicken. For the comparison of liver andspleen, energy pathways, main pathways of carbohydratemetabolism, and fatty acid oxidation were enriched inhuman [44], while generation of precursor metabolitesand energy, cellular carbohydrate metabolism, cellularlipid metabolism, tricarboxylic acid cycle organic acidmetabolism were enriched in chickens (Figures 4A, B).
Cecal tonsil and ileum are two proximal tissues in thedigestive tract. Both of these are critical components ofgut-associated immune system. They might share manycommon functions, which means, there might be fewergenes differentially expressed between them. The lowest
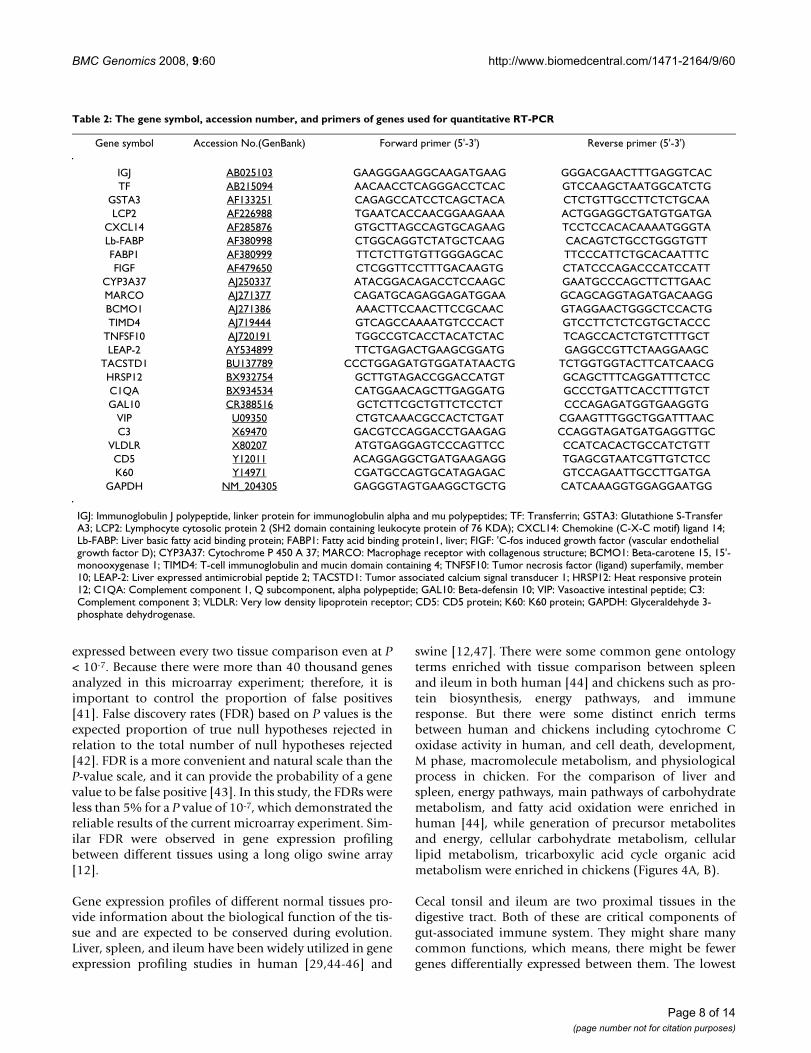
Table 2: The gene symbol, accession number, and primers of genes used for quantitative RT-PCR
Gene symbol Accession No.(GenBank) Forward primer (5'-3') Reverse primer (5'-3')
IGJ AB025103 GAAGGGAAGGCAAGATGAAG GGGACGAACTTTGAGGTCACTF AB215094 AACAACCTCAGGGACCTCAC GTCCAAGCTAATGGCATCTG
GSTA3 AF133251 CAGAGCCATCCTCAGCTACA CTCTGTTGCCTTCTCTGCAALCP2 AF226988 TGAATCACCAACGGAAGAAA ACTGGAGGCTGATGTGATGA
CXCL14 AF285876 GTGCTTAGCCAGTGCAGAAG TCCTCCACACAAAATGGGTALb-FABP AF380998 CTGGCAGGTCTATGCTCAAG CACAGTCTGCCTGGGTGTTFABP1 AF380999 TTCTCTTGTGTTGGGAGCAC TTCCCATTCTGCACAATTTCFIGF AF479650 CTCGGTTCCTTTGACAAGTG CTATCCCAGACCCATCCATT
CYP3A37 AJ250337 ATACGGACAGACCTCCAAGC GAATGCCCAGCTTCTTGAACMARCO AJ271377 CAGATGCAGAGGAGATGGAA GCAGCAGGTAGATGACAAGGBCMO1 AJ271386 AAACTTCCAACTTCCGCAAC GTAGGAACTGGGCTCCACTGTIMD4 AJ719444 GTCAGCCAAAATGTCCCACT GTCCTTCTCTCGTGCTACCC
TNFSF10 AJ720191 TGGCCGTCACCTACATCTAC TCAGCCACTCTGTCTTTGCTLEAP-2 AY534899 TTCTGAGACTGAAGCGGATG GAGGCCGTTCTAAGGAAGC
TACSTD1 BU137789 CCCTGGAGATGTGGATATAACTG TCTGGTGGTACTTCATCAACGHRSP12 BX932754 GCTTGTAGACCGGACCATGT GCAGCTTTCAGGATTTCTCCC1QA BX934534 CATGGAACAGCTTGAGGATG GCCCTGATTCACCTTTGTCTGAL10 CR388516 GCTCTTCGCTGTTCTCCTCT CCCAGAGATGGTGAAGGTG
VIP U09350 CTGTCAAACGCCACTCTGAT CGAAGTTTGGCTGGATTTAACC3 X69470 GACGTCCAGGACCTGAAGAG CCAGGTAGATGATGAGGTTGC
VLDLR X80207 ATGTGAGGAGTCCCAGTTCC CCATCACACTGCCATCTGTTCD5 Y12011 ACAGGAGGCTGATGAAGAGG TGAGCGTAATCGTTGTCTCCK60 Y14971 CGATGCCAGTGCATAGAGAC GTCCAGAATTGCCTTGATGA
GAPDH NM_204305 GAGGGTAGTGAAGGCTGCTG CATCAAAGGTGGAGGAATGG
IGJ: Immunoglobulin J polypeptide, linker protein for immunoglobulin alpha and mu polypeptides; TF: Transferrin; GSTA3: Glutathione S-Transfer A3; LCP2: Lymphocyte cytosolic protein 2 (SH2 domain containing leukocyte protein of 76 KDA); CXCL14: Chemokine (C-X-C motif) ligand 14; Lb-FABP: Liver basic fatty acid binding protein; FABP1: Fatty acid binding protein1, liver; FIGF: 'C-fos induced growth factor (vascular endothelial growth factor D); CYP3A37: Cytochrome P 450 A 37; MARCO: Macrophage receptor with collagenous structure; BCMO1: Beta-carotene 15, 15'-monooxygenase 1; TIMD4: T-cell immunoglobulin and mucin domain containing 4; TNFSF10: Tumor necrosis factor (ligand) superfamily, member 10; LEAP-2: Liver expressed antimicrobial peptide 2; TACSTD1: Tumor associated calcium signal transducer 1; HRSP12: Heat responsive protein 12; C1QA: Complement component 1, Q subcomponent, alpha polypeptide; GAL10: Beta-defensin 10; VIP: Vasoactive intestinal peptide; C3: Complement component 3; VLDLR: Very low density lipoprotein receptor; CD5: CD5 protein; K60: K60 protein; GAPDH: Glyceraldehyde 3-phosphate dehydrogenase.
Page 8 of 14(page number not for citation purposes)

BMC Genomics 2008, 9:60 http://www.biomedcentral.com/1471-2164/9/60
number of differentially expressed genes (358) was foundin the comparison of cecal tonsil and ileum. These find-ings support the expectation that tissues with similar geneexpression might have similar biological functions.
Liver is a major organ with important biological functionslike lipid metabolism. More genes specifically expressedin liver than spleen and ileum and/or other tissues inhuman and swine [12,44,46]. Similar results wereobserved in chickens. In human, oxidoreductase activity,lipid metabolism, complement activation, steroid metab-olism, alcohol metabolism, cytochrome P450 activity,urea cycle, coagulation, amino acid metabolism, bile acidbiosynthesis, and carbohydrate metabolism were liver-selective [29,44,45,48]. In swine, coagulation pathway,alcohol metabolism, lipid processing, bile metabolismand xenobiotic metabolism were liver-specific [12]. In thecurrent study, energy, metabolism, especial fatty acidmetabolism-related genes, fatty acid or lipid binding pro-tein, fatty acid synthase, cholesterol hydroxylase, lectin,adenyl nucleotide binding, ATPase, hydrolase, coagula-tion factor, cytochrome P450, lyase, C3, C4B, C8, phos-phorylase, and oxidoreductase, were found liver-selective(see additional file 3).
Spleen is one of the major immune organs. Manyimmune-related genes were more highly expressed in
spleen than the other three tissues in chickens. Similarresults have been observed using northern blot hybridiza-tion [49], moreover, it was reported that immuneresponse genes were selectively expressed in humanspleen [44] and porcine small intestine [12]. Ileum is oneof the more important tissues involved as part of bacterialpathogenesis studies in agricultural animals. Genesrelated to interaction between organisms and viral lifecycle were specifically expressed in porcine ileum cDNAlibraries [50]. In chickens, class II histocompatibility anti-gen, B-L beta chain and C7 were found ileum-selective(see additional file 2). No ileum-selective genes wereavailable in human from the previous studies. The con-served gene expression profiles in tissue comparisonsamong species have provide a solid basis for comparativegenomics study. The tissue-selective genes could be poten-tially used as markers for the origin of pathogen, like gut-related pathogens.
Perhaps one of the most important and interesting find-ings in the study was in relation to antimicrobial peptides(AMPs). AMPs are essential for the innate immuneresponse in plants, flies, mammals, and chickens. Thereare two major families of AMPs: defensins and cathelici-dins. Fourteen β-defensins, known as gallinacins (GAL)and cathelicidin have been described in chickens [51-53].In the present study, GAL1, GAL2 and GAL6-7 showed
Table 3: Microarray and qRT-PCR results of 23 selected genes for each pair of comparison
Gene symbol Liver vs. spleen Spleen vs. cecal tonsil Cecal tonsil vs. ileum
Microarray qRT-PCR Microarray qRT-PCR Microarray qRT-PCR
IGJ -4.9 # -7.1 2.3 # 2.3 3.0 # 2.2VLDLR -3.2 # -3.5 1.6 # 2.1 0.2 0.7LEAP-2 4.5 # 10.0 -1.0 * -5.5 -2.8# -4.5Lb-FABP 8.6 # 12.6 -0.8 0.0 -0.3 -1.0
TACSTD1 1.9 # 4.1 -5.7 # -3.5 0.0 -2.9CYP3A37 3.1 # 14.8 -3.6 # -14.8 -0.1 0.2
C1QA -0.5 * -0.6 2.0 # 2.8 0.2 -0.2MARCO -0.6 * -3.7 2.7 # 4.7 0.1 1.4BCMO1 1.8 # 4.8 0.8 * -1.3 -2.1 # -2.6
K60 -0.9 # -2.3 -0.8 # -1.6 2.0 # 3.0GSTA3 3.1 # 7.0 -3.4 # -3.9 2.3 # 1.0FIGF -1.0 * -0.6 -2.6 # -1.8 1.0 * 0.9CD5 -3.2 # -4.2 0.3 0.6 2.6 # 2.2
GAL10 5.0 # 12.7 -0.1 -2.1 0.0 -1.1TF 4.2 # 7.2 0.9 * 4.4 0.6 0.7VIP 0.0 -2.2 -3.2 # -3.7 -0.6 -0.6
CXCL14 0.1 -5.8 -2.6 # -6.4 0.3 0.0HRSP12 3.7 # 6.0 -0.8 * -1.8 0.3 -0.8
C3 2.8 # 3.0 0.2 1.7 0.6 3.0FABP1 8.6 # 13.5 -0.8 # -6.0 -0.3 -2.7
TNFSF10 1.4 # 1.3 -3.3 # -3.3 0.6 0.2LCP2 -2.0 # -0.5 1.1 # 1.0 1.1 * -0.1
TIMD4 0.0 -0.1 2.0 # 2.5 1.4 # 1.0
Page 9 of 14(page number not for citation purposes)

BMC Genomics 2008, 9:60 http://www.biomedcentral.com/1471-2164/9/60
strong comparative induction in spleen and weakestexpression in the ileum. Macrophage receptor with colla-genous structure (MARCO) mediates alveolar macro-phages to bind, ingest and clear the inhaled particle andbacteria [54]. MARCO only expressed on the marginalzone macrophage of the spleen and macrophages ofmeullary cord in lymph nodes in normal mice [55]. Thecurrent study corroborates this as we also found MARCOwas highly expressed in spleen compared to other tissues.
To our knowledge, this is the first study to characterize tis-sue expression in chickens using a whole genome array. Atotal of four tissues were selected for this study. Two ofthese (liver and spleen) are complete organs, which playsignificant roles in many sophisticated biological func-tions of the animals. The liver is responsible for lipid,amino acid, and carbohydrate metabolism, while thespleen is an essential part of immune function in animals.The other two tissues (ileum and cecal tonsil) may haveless complicated functions than liver and spleen. The GOanalysis of global gene expression profiling among thesefour tissues supported the notion that more clusters ofgenes would be significantly enriched in the comparisonsof organ (liver and spleen) against tissues such as ileum
and cecal tonsil (Figures 4A, 4B, 5). The majority of func-tional enrichments associated with gene regulation in theliver comparisons were consistent with the roles of liver[56]. In the spleen, there were many immune-related (celldeath, apoptosis, response to stimulus etc) clustersenriched. In summary, the results above demonstratedthat this newly developed chicken 44K whole genomearray is a powerful genomic tool to investigate differentbiological processes in chickens.
ConclusionWe have characterized a newly developed chicken 44Kwhole genome oligonucleotide microarray using fourmajor tissues. This microarray in theory consists of probesdesigned from the whole chicken transcriptome as well as150 microRNAs, the entire genome sequences of Marek'sdisease virus and two avian influenza virus genomes.Comparison of gene expression among 2 organs and 2 tis-sues has been submitted to GEO providing valuable com-parative gene expression data to the scientific community.Novel findings related to defensins and cathelicidinexpression in the spleen is highlighted. Additionally, thecustom tracks for sequences and probes used in this arrayhave been built for Chicken Genome Browser Gateway in
Table 4: Microarray and qRT-PCR results of 23 selected genes for each pair of comparison
Gene symbol Liver vs. cecal tonsil Liver vs. ileum Spleen vs. ileum
Microarray qRT-PCR Microarray qRT-PCR Microarray qRT-PCR
IGJ -2.6# -4.9 0.4 -2.6 5.3 # 4.5VLDLR -1.5 # -1.4 -1.4 -0.7 1.8 # 2.8LEAP-2 3.5 # 4.5 0.6 0.0 -3.8 # -10.1Lb-FABP 7.8 # 12.7 7.6 # 11.7 -1.0 -0.9
TACSTD1 -3.8 # -0.3 -3.7 # -3.3 -5.7 # -6.8CYP3A37 -0.5 0.0 -0.6 * 0.2 -3.7 # -14.6
C1QA 1.5 # 2.2 1.7 # 2.0 2.3 # 2.6MARCO 2.1 # 2.2 2.2 # 3.5 2.8 # 6.0BCMO1 2.6 # 3.0 0.6 * 1.0 -1.2 # -3.8
K60 -1.7 # -3.9 0.3 * -0.9 1.2 # 0.7GSTA3 -0.2 3.0 2.0 # 4.0 -1.1 * -2.9FIGF -3.6 # -2.4 -2.7 # -1.5 -1.6 # -0.9CD5 -2.9 # -3.7 -0.2 -1.4 2.9 # 2.8
GAL10 4.9 # 10.6 4.9 # 9.5 -0.1 -3.2TF 5.2 # 9.6 5.8 # 10.6 1.5 * 3.1VIP -3.2 # -5.8 -3.8 # -6.4 -3.8 # -4.3
CXCL14 -2.5 # -11.1 -2.3 # -9.2 -2.3 # -5.9HRSP12 2.9 # 3.6 3.2 # 3.4 -0.5 -2.6
C3 3.0 # 4.7 3.6 # 7.7 0.8 * 4.8FABP1 7.8 3.6 7.6 0.9 -6.4 # -8.1
TNFSF10 -1.9 # -2.0 -1.4 # -1.8 -2.7 # -3.1LCP2 -0.9 0.5 0.2 0.4 2.2 # 1.0
TIMD4 2.0 # 2.8 3.4 # 3.8 3.4 # 3.9
Note: All data are shown as log2, positive value means up regulated between tissue A vs. tissue B (tissue A – tissue B)#represents P value for the comparison is less than 0.0001 in microarray results.* represents P value for the comparison is between 0.05 and 0.0001 in microarray results.Micrroarray results shown in bold font in diagonal are the results those were used to select genes for qRT-PCR for each comparison.
Page 10 of 14(page number not for citation purposes)

BMC Genomics 2008, 9:60 http://www.biomedcentral.com/1471-2164/9/60
UCSC providing an efficient tool to link genomic infor-mation from this powerful genome browser to our expres-sion data. This array will be a complimentary platform forthe scientific community to study genetics, immunology,developmental biology, genomics, nutrition, and foodsafety in chickens.
MethodsTissue collectionCecal tonsil (C), ileum (I), liver (L), and spleen (S) werecollected from six two-week commercial broilers. Total of24 samples were immersed into 10 volumes of RNAlater(Ambion, Austin, USA) and stored at -20°C until RNAisolation.
Microarray designLoop design and dye swap were used in the microarraystudy (Figure 7). In brief, four different tissue samples(cecal tonsil, ileum, liver, and spleen) from each chickenwere designed for one loop. The orders of the tissues indifferent loops were changed so that there were four com-parisons with a dye swap across all six pairs of tissue com-parisons. Data from 12 measurements for each tissue werecollected, with total of 48 measurements from 24 arrays.
RNA isolationTissues were homogenized using a Tissue Miser (FisherScientific, Houston, TX). Total RNA was isolated fromeach homogenized tissue using Trizol extraction methodas described by the manufacturer (Invitrogen, Carlsbad,CA). All of DNA was removed from the samples usingTURBO DNA free™ Kit (Ambion, Austin, TX) according to
the manufacturer's protocol. The RNA quantity and puritywere determined by NanoDrop ND-1000 spectropho-tometer at 260/280 nm (Nano Drop Technologies, Wilm-ington, Delaware). The integrity of total RNA was assessedwith an Agilent Bioanalyzer 2100 and RNA 6000 NanoLabChip Kit (Agilent Technologies, Palo Alto, CA). TheRNA Integrity Numbers (RINs) for the samples wereobtained. Only RNA samples with RIN values of 6, orhigher, were used for the analysis.
cRNA preparationA 500 ng of aliquot of total RNA was reverse transcribedinto cDNA using the Low RNA Input Fluorescent LinearAmplification Kit (Agilent Technologies). The synthesizedcDNA was transcribed into cRNA and labelled with eithercyanine 3 or cyanine 5-labelled nucleotide (Perkin Elmer,Wellesley, MA). Labelled cRNA was purified with RNeasyMini columns (Qiagen, Valecia, CA). The quality of eachcRNA sample was verified by total yield and specificity cal-culated based on NanoDrop ND-1000 spectrophotome-ter measurement (NanoDrop Technologies).
Microarray hybridizationLabelled cRNAs with specificity greater than 8 were usedfor hybridization using the in situ hybridization kit plus(Agilent Technologies). Arrays were incubated at 65°C for17 h in Agilent's microarray hybridization chambers. Afterhybridization, arrays were washed according to the Agi-lent protocol.
Image processingArrays were scanned at 5-μm resolution using GenePixPersonal 4100A (Molecular Devices Corporation, Sunny-vale, CA) and images were saved as TIFF format. AutoPhotomultiplier tube (PMT) settings were selected andadjusted to get the ratio of the overall intensities betweentwo channels (Cy3 and Cy5) to 0.95 to 1.05. The signalintensities of all spots on each image were quantified byGenepix pro 6.0 software (Molecular Devices Corpora-tion, Downingtown, PA), and data were saved as .txt filesfor further analysis.
Normalization and statistical analysisThe signal intensity of each probe was divided by that ofnegative control to filter the genes which were notexpressed. The signal intensity of each gene was globallynormalized using LOWESS within the R statistics package[57]. A mixed model that included the fixed effects of dye(Cy3 and Cy5), tissue, and random effect of slide andarray, was used to analyze the normalized data by SAS(SAS Institute, Cary, NC). P value and fold changesbetween each comparison for each gene were calculated.One tissue was included in three comparisons, the signif-icantly expressed genes among these three comparisonswere joined together to derive the selectively expressed tis-
The diagram of the microarray experiment designFigure 7The diagram of the microarray experiment design. The arrow represents Cy3, the end of the arrow represents Cy5.
L iver
S pleen
Cecal tonsil
Ileum
Page 11 of 14(page number not for citation purposes)

BMC Genomics 2008, 9:60 http://www.biomedcentral.com/1471-2164/9/60
sue genes. False discovery rate (FDR) (q values) were cal-culated by R program according to Benjamini andHochberg's method [42].
BioinformaticsAn unreleased version of the High Throughput GeneOntology Functional Annotation Toolkit (HTGOFAT)was utilized [58,59] to assign updated Gene Ontology[60] numbers, Enzyme Commission [61] numbers, map-pings to Kyoto Encylopedia of Genes and Genomes(KEGG) Pathways [62] and updated definitions. Addi-tionally, differentially regulated genes were mapped toProtein Information Resource (PIR) keywords [63] andCOG [64] functional annotations through the use of theDatabase for Annotation, Visualization and IntegratedDiscovery (DAVID) [65]. Statistics related to over repre-sentation of functional categories were performed usingDAVID, which is based upon a Fisher Exact statistic meth-odology similar to that described by Al-Shahrour et al[66]. A P < 0.001 was considered as significant.
Quantitative real-time PCRBoth up-regulated and down regulated genes from eachcomparison were selected for quantitative real time PCR(qRT-PCR). Four tissue samples from each chicken, andtotal of sixteen samples from 4 chickens were used. Allreagents for qRT-PCR were loaded by Eppendorf epMotion 5070 workstation (Eppendorf, Westbury, NY). Theprimers were designed with Primer 3 [67]. Gene symbolsand primers are listed in Table 2. A 1 ug aliquot of totalRNA was used to synthesize first-strand cDNA using ran-dom hexamers and Thermoscript™ RT-PCR system (Invit-rogen) in a reaction volume of 20 μL. The PCR reactionswere performed in a 10 ul volume containing a 1×SYBRGreen Master Mix, 50 ng cDNA, 300 nM of forward prim-ers, 300 nM of reverse primers on an ABI Prism 7900HTsequence detection system (Applied Biosystems, FosterCity, CA). The amplification condition was 50°C for 2min; 95°C for 10 min, followed by 40 cycles of 95°C for15 sec and 59°C for 1 min; a final soak at 4°C was alsoincorporated. Glyceraldehyde-3-phosphate dehydroge-nase (GAPDH) was used as the internal control. All of thesamples were measured in duplicate. Two measurementsof each tissue sample were averaged for further analysis.The comparative Ct method was used to calculate the rel-ative gene expression level across the tissues. Relativeexpression level of each gene in one tissue (ΔCt) was cal-culated by Ct target gene-Ct GAPDH; relative expression of eachgene in two different tissues (ΔΔCt) was calculated by ΔCt
A -ΔCt B.
Authors' contributionsXL contributed to carry out the microarray experiments,analyzed data and drafted the manuscript. HC wasresponsible for tissue sample collection and data analysis.
JZ provided the concept of the array design and contrib-uted to the array design. SD contributed to annotationand functional analyses. HZ designed the microarray, pro-vided the concept and design of the study, and revised themanuscript. All authors read and approved the manu-script.
Additional material
AcknowledgementsThis project was supported by National Research Initiative Grant no. 2007-35604-17903 from the USDA Cooperative State Research, Education, and Extension Service Animal Genome program. Thanks Angie Hinrichs from UCSC CBSE for providing custom track for microarray, and Juan M. Anzola from Texas A&M University for probe custom track. Thanks to Michael H. Kogut and Christina L. Swaggerty from Southern Plain Agricultural Research Center, USDA-ARS for providing the samples.
References1. International Chicken Genome Sequencing Consortium: Sequence
and comparative analysis of the chicken genome provideunique perspectives on vertebrate evolution. Nature 2004,432(7018):695-716.
2. Siegel PB, Dodgson JB, Andersson L: Progress from chickengenetics to the chicken genome. Poult Sci 2006,85(12):2050-2060.
3. Cheng HH, Crittenden LB: Microsatellite markers for geneticmapping in the chicken. Poult Sci 1994, 73(4):539-546.
Additional file 1Cecal tonsil-selective expression genes. This table includes the P values and fold change in each comparison for 95 selectively expressed genes in cecal tonsil.Click here for file[http://www.biomedcentral.com/content/supplementary/1471-2164-9-60-S1.xls]
Additional file 2Ileum-selective expression genes. This table includes the P values and fold change in each comparison for 71 selectively expressed genes in cecal tonsil.Click here for file[http://www.biomedcentral.com/content/supplementary/1471-2164-9-60-S2.xls]
Additional file 3Liver-selective expression genes. This table includes the P values and fold changes in each comparison for 535 selectively expressed genes in liver.Click here for file[http://www.biomedcentral.com/content/supplementary/1471-2164-9-60-S3.xls]
Additional file 4Spleen-selective expression genes. This table includes the P values and fold changes in each comparison for 108 selectively expressed genes in liver.Click here for file[http://www.biomedcentral.com/content/supplementary/1471-2164-9-60-S4.xls]
Page 12 of 14(page number not for citation purposes)

BMC Genomics 2008, 9:60 http://www.biomedcentral.com/1471-2164/9/60
4. Jacobsson L, Park HB, Wahlberg P, Fredriksson R, Perez-Enciso M,Siegel PB, Andersson L: Many QTLs with minor additive effectsare associated with a large difference in growth between twoselection lines in chickens. Genet Res 2005, 86(2):115-125.
5. Park HB, Jacobsson L, Wahlberg P, Siegel PB, Andersson L: QTLanalysis of body composition and metabolic traits in an inter-cross between chicken lines divergently selected for growth.Physiol Genomics 2006, 25(2):216-223.
6. Wallis JW, Aerts J, Groenen MA, Crooijmans RP, Layman D, GravesTA, Scheer DE, Kremitzki C, Fedele MJ, Mudd NK, Cardenas M, Hig-ginbotham J, Carter J, McGrane R, Gaige T, Mead K, Walker J,Albracht D, Davito J, Yang SP, Leong S, Chinwalla A, Sekhon M, WylieK, Dodgson J, Romanov MN, Cheng H, de Jong PJ, Osoegawa K, Nefe-dov M, Zhang H, McPherson JD, Krzywinski M, Schein J, Hillier L,Mardis ER, Wilson RK, Warren WC: A physical map of thechicken genome. Nature 2004, 432(7018):761-764.
7. BBSRC Chicken EST database [http://www.chick.manchester.ac.uk/]
8. Wong GK, Liu B, Wang J, Zhang Y, Yang X, Zhang Z, Meng Q, ZhouJ, Li D, Zhang J, Ni P, Li S, Ran L, Li H, Zhang J, Li R, Li S, Zheng H, LinW, Li G, Wang X, Zhao W, Li J, Ye C, Dai M, Ruan J, Zhou Y, Li Y,He X, Zhang Y, Wang J, Huang X, Tong W, Chen J, Ye J, Chen C, WeiN, Li G, Dong L, Lan F, Sun Y, Zhang Z, Yang Z, Yu Y, Huang Y, HeD, Xi Y, Wei D, Qi Q, Li W, Shi J, Wang M, Xie F, Wang J, Zhang X,Wang P, Zhao Y, Li N, Yang N, Dong W, Hu S, Zeng C, Zheng W,Hao B, Hillier LW, Yang SP, Warren WC, Wilson RK, Brandstrom M,Ellegren H, Crooijmans RP, van der Poel JJ, Bovenhuis H, GroenenMA, Ovcharenko I, Gordon L, Stubbs L, Lucas S, Glavina T, Aerts A,Kaiser P, Rothwell L, Young JR, Rogers S, Walker BA, van Hateren A,Kaufman J, Bumstead N, Lamont SJ, Zhou H, Hocking PM, Morrice D,de Koning DJ, Law A, Bartley N, Burt DW, Hunt H, Cheng HH, Gun-narsson U, Wahlberg P, Andersson L, Kindlund E, Tammi MT,Andersson B, Webber C, Ponting CP, Overton IM, Boardman PE,Tang H, Hubbard SJ, Wilson SA, Yu J, Wang J, Yang H: A geneticvariation map for chicken with 2.8 million single-nucleotidepolymorphisms. Nature 2004, 432(7018):717-722.
9. Barrett JC, Kawasaki ES: Microarrays: the use of oligonucle-otides and cDNA for the analysis of gene expression. DrugDiscov Today 2003, 8(3):134-141.
10. Hardiman G: Microarray platforms--comparisons and con-trasts. Pharmacogenomics 2004, 5(5):487-502.
11. Held GA, Duggar K, Stolovitzky G: Comparison of Amershamand Agilent microarray technologies through quantitativenoise analysis. Omics 2006, 10(4):532-544.
12. Zhao SH, Recknor J, Lunney JK, Nettleton D, Kuhar D, Orley S, Tug-gle CK: Validation of a first-generation long-oligonucleotidemicroarray for transcriptional profiling in the pig. Genomics2005, 86(5):618-625.
13. Tsai S, Mir B, Martin A, Estrada J, Bischoff S, Hsieh W, Cassady J, Frek-ing B, Nonneman D, Rohrer G, Piedrahita J: Detection of tran-scriptional difference of porcine imprinted genes usingdifferent microarray platforms. BMC Genomics 2006, 7(1):328.
14. Popp MP, Liu L, Timmers A, Esson DW, Shiroma L, Meyers C, BerceliS, Tao M, Wistow G, Schultz GS, Sherwood MB: Development ofa microarray chip for gene expression in rabbit ocularresearch. Mol Vis 2007, 13:164-173.
15. Band MR, Olmstead C, Everts RE, Liu ZL, Lewin HA: A 3800 genemicroarray for cattle functional genomics: comparison ofgene expression in spleen, placenta, and brain. Anim Biotechnol2002, 13(1):163-172.
16. Suchyta SP, Sipkovsky S, Kruska R, Jeffers A, McNulty A, Coussens MJ,Tempelman RJ, Halgren RG, Saama PM, Bauman DE, Boisclair YR,Burton JL, Collier RJ, DePeters EJ, Ferris TA, Lucy MC, McGuire MA,Medrano JF, Overton TR, Smith TP, Smith GW, Sonstegard TS, SpainJN, Spiers DE, Yao J, Coussens PM: Development and testing ofa high-density cDNA microarray resource for cattle. PhysiolGenomics 2003, 15(2):158-164.
17. Neiman PE, Ruddell A, Jasoni C, Loring G, Thomas SJ, Brandvold KA,Lee R, Burnside J, Delrow J: Analysis of gene expression duringmyc oncogene-induced lymphomagenesis in the bursa ofFabricius. Proc Natl Acad Sci U S A 2001, 98(11):6378-6383.
18. van Hemert S, Ebbelaar BH, Smits MA, Rebel JM: Generation ofEST and microarray resources for functional genomic stud-ies on chicken intestinal health. Anim Biotechnol 2003,14(2):133-143.
19. Afrakhte M, Schultheiss TM: Construction and analysis of a sub-tracted library and microarray of cDNAs expressed specifi-cally in chicken heart progenitor cells. Dev Dyn 2004,230(2):290-298.
20. Bliss TW, Dohms JE, Emara MG, Keeler CL Jr.: Gene expressionprofiling of avian macrophage activation. Vet Immunol Immun-opathol 2005, 105(3-4):289-299.
21. Burnside J, Neiman P, Tang J, Basom R, Talbot R, Aronszajn M, BurtD, Delrow J: Development of a cDNA array for chicken geneexpression analysis. BMC Genomics 2005, 6(1):13.
22. Smith J, Speed D, Hocking P, Talbot R, Degen W, Schijns V, Glass E,Burt D: Development of a chicken 5 K microarray targetedtowards immune function. BMC Genomics 2006, 7(1):49.
23. Operon Gallus gallus (chicken) Roslin/ARK CoRe Array V1.02007 [https://www.operon.com/arrays/oligosets_chicken.php?].
24. Affymetrix Chicken Genome Array 2007 [http://www.affymetrix.com/products/arrays/specific/chicken.affx].
25. Hughes TR, Mao M, Jones AR, Burchard J, Marton MJ, Shannon KW,Lefkowitz SM, Ziman M, Schelter JM, Meyer MR, Kobayashi S, DavisC, Dai H, He YD, Stephaniants SB, Cavet G, Walker WL, West A,Coffey E, Shoemaker DD, Stoughton R, Blanchard AP, Friend SH, Lin-sley PS: Expression profiling using microarrays fabricated byan ink-jet oligonucleotide synthesizer. Nat Biotech 2001,19(4):342-347.
26. Relogio A, Schwager C, Richter A, Ansorge W, Valcarcel J: Optimi-zation of oligonucleotide-based DNA microarrays. NucleicAcids Res 2002, 30(11):e51.
27. Shippy R, Sendera T, Lockner R, Palaniappan C, Kaysser-Kranich T,Watts G, Alsobrook J: Performance evaluation of commercialshort-oligonucleotide microarrays and the impact of noise inmaking cross-platform correlations. BMC Genomics 2004,5(1):61.
28. Leiske D, Karimpour-Fard A, Hume P, Fairbanks B, Gill R: A com-parison of alternative 60-mer probe designs in an in-situ syn-thesized oligonucleotide microarray. BMC Genomics 2006,7(1):72.
29. Hsiao LL, Dangond F, Yoshida T, Hong R, Jensen RV, Misra J, DillonW, Lee KF, Clark KE, Haverty P, Weng Z, Mutter GL, Frosch MP,Macdonald ME, Milford EL, Crum CP, Bueno R, Pratt RE,Mahadevappa M, Warrington JA, Stephanopoulos G, StephanopoulosG, Gullans SR: A compendium of gene expression in normalhuman tissues. Physiol Genomics 2001, 7(2):97-104.
30. Barrett T, Troup DB, Wilhite SE, Ledoux P, Rudnev D, Evangelista C,Kim IF, Soboleva A, Tomashevsky M, Edgar R: NCBI GEO: miningtens of millions of expression profiles--database and toolsupdate. Nucleic Acids Res 2007, 35(Database issue):D760-5.
31. Petersen D, Chandramouli GVR, Geoghegan J, Hilburn J, Paarlberg J,Kim C, Munroe D, Gangi L, Han J, Puri R, Staudt L, Weinstein J, Bar-rett JC, Green J, Kawasaki E: Three microarray platforms: ananalysis of their concordance in profiling gene expression.BMC Genomics 2005, 6(1):63.
32. Woo Y, Affourtit J, Daigle S, Viale A, Johnson K, Naggert J, ChurchillG: A comparison of cDNA, oligonucleotide, and AffymetrixGeneChip gene expression microarray platforms. J BiomolTech 2004, 15(4):276-284.
33. de Reynies A, Geromin D, Cayuela JM, Petel F, Dessen P, Sigaux F,Rickman DS: Comparison of the latest commercial short andlong oligonucleotide microarray technologies. BMC Genomics2006, 7:51.
34. Wang Y, Barbacioru C, Hyland F, Xiao W, Hunkapiller K, Blake J,Chan F, Gonzalez C, Zhang L, Samaha R: Large scale real-timePCR validation on gene expression measurements from twocommercial long-oligonucleotide microarrays. BMC Genomics2006, 7(1):59.
35. Wolber PK, Collins PJ, Lucas AB, De Witte A, Shannon KW: TheAgilent in situ-synthesized microarray platform. MethodsEnzymol 2006, 410:28-57.
36. Dequeant ML, Pourquie O: Chicken genome: new tools and con-cepts. Dev Dyn 2005, 232(4):883-886.
37. Agilent: Performance comparison of Agilent's 60-mer and 25-mer in situ synthesized oligonucleotide microarrays. 2005.
38. Dallas P, Gottardo N, Firth M, Beesley A, Hoffmann K, Terry P, Frei-tas J, Boag J, Cummings A, Kees U: Gene expression levelsassessed by oligonucleotide microarray analysis and quanti-tative real-time RT-PCR ?how well do they correlate? BMCGenomics 2005, 6(1):59.
Page 13 of 14(page number not for citation purposes)

BMC Genomics 2008, 9:60 http://www.biomedcentral.com/1471-2164/9/60
Publish with BioMed Central and every scientist can read your work free of charge
"BioMed Central will be the most significant development for disseminating the results of biomedical research in our lifetime."
Sir Paul Nurse, Cancer Research UK
Your research papers will be:
available free of charge to the entire biomedical community
peer reviewed and published immediately upon acceptance
cited in PubMed and archived on PubMed Central
yours — you keep the copyright
Submit your manuscript here:http://www.biomedcentral.com/info/publishing_adv.asp
BioMedcentral
39. Griffiths-Jones S, Grocock RJ, van Dongen S, Bateman A, Enright AJ:miRBase: microRNA sequences, targets and gene nomencla-ture. Nucleic Acids Res 2006, 34(Database issue):D140-4.
40. Griffiths-Jones S: The microRNA Registry. Nucleic Acids Res 2004,32(Database issue):D109-11.
41. Tsai CA, Hsueh HM, Chen JJ: Estimation of false discovery ratesin multiple testing: application to gene microarray data. Bio-metrics 2003, 59(4):1071-1081.
42. Benjamini Y, Hochberg Y: Controlling the False Discovery Rate:A Practical and Powerful Approach to Multiple Testing. Jour-nal of the Royal Statistical Society Series B (Methodological) 1995,57(1):289-300.
43. Pawitan Y, Michiels S, Koscielny S, Gusnanto A, Ploner A: False dis-covery rate, sensitivity and sample size for microarray stud-ies. Bioinformatics 2005, 21(13):3017-3024.
44. Son CG, Bilke S, Davis S, Greer BT, Wei JS, Whiteford CC, Chen QR,Cenacchi N, Khan J: Database of mRNA gene expression pro-files of multiple human organs. Genome Res 2005,15(3):443-450.
45. Shyamsundar R, Kim YH, Higgins JP, Montgomery K, Jorden M,Sethuraman A, van de Rijn M, Botstein D, Brown PO, Pollack JR: ADNA microarray survey of gene expression in normalhuman tissues. Genome Biol 2005, 6(3):R22.
46. Saito-Hisaminato A, Katagiri T, Kakiuchi S, Nakamura T, Tsunoda T,Nakamura Y: Genome-wide profiling of gene expression in 29normal human tissues with a cDNA microarray. DNA Res2002, 9(2):35-45.
47. Hornshoj H, Conley LN, Hedegaard J, Sorensen P, Panitz F, BendixenC: Microarray Expression Profiles of 20.000 Genes across 23Healthy Porcine Tissues. PLoS ONE 2007, 2(11):e1203.
48. Levine DM, Haynor DR, Castle JC, Stepaniants SB, Pellegrini M, MaoM, Johnson JM: Pathway and gene-set activation measurementfrom mRNA expression data: the tissue distribution ofhuman pathways. Genome Biol 2006, 7(10):R93.
49. Takahashi T, Iwase T, Tachibana T, Komiyama K, Kobayashi K, ChenCL, Mestecky J, Moro I: Cloning and expression of the chickenimmunoglobulin joining (J)-chain cDNA. Immunogenetics 2000,51(2):85-91.
50. Gorodkin J, Cirera S, Hedegaard J, Gilchrist MJ, Panitz F, Jorgensen C,Scheibye-Knudsen K, Arvin T, Lumholdt S, Sawera M, Green T,Nielsen BJ, Havgaard JH, Rosenkilde C, Wang J, Li H, Li R, Liu B, HuS, Dong W, Li W, Yu J, Wang J, Staefeldt HH, Wernersson R, MadsenLB, Thomsen B, Hornshoj H, Bujie Z, Wang X, Wang X, Bolund L,Brunak S, Yang H, Bendixen C, Fredholm M: Porcine transcrip-tome analysis based on 97 non-normalized cDNA librariesand assembly of 1,021,891 expressed sequence tags. GenomeBiol 2007, 8(4):R45.
51. Lynn DJ, Higgs R, Gaines S, Tierney J, James T, Lloyd AT, Fares MA,Mulcahy G, O'Farrelly C: Bioinformatic discovery and initialcharacterisation of nine novel antimicrobial peptide genes inthe chicken. Immunogenetics 2004, 56(3):170-177.
52. Xiao Y, Hughes AL, Ando J, Matsuda Y, Cheng JF, Skinner-Noble D,Zhang G: A genome-wide screen identifies a single beta-defensin gene cluster in the chicken: implications for the ori-gin and evolution of mammalian defensins. BMC Genomics2004, 5(1):56.
53. Zhao C, Nguyen T, Liu L, Sacco RE, Brogden KA, Lehrer RI: Gall-inacin-3, an inducible epithelial beta-defensin in the chicken.Infect Immun 2001, 69(4):2684-2691.
54. Arredouani MS, Palecanda A, Koziel H, Huang YC, Imrich A, SulahianTH, Ning YY, Yang Z, Pikkarainen T, Sankala M, Vargas SO, Takeya M,Tryggvason K, Kobzik L: MARCO is the major binding receptorfor unopsonized particles and bacteria on human alveolarmacrophages. J Immunol 2005, 175(9):6058-6064.
55. Elomaa O, Kangas M, Sahlberg C, Tuukkanen J, Sormunen R, LiakkaA, Thesleff I, Kraal G, Tryggvason K: Cloning of a novel bacteria-binding receptor structurally related to scavenger receptorsand expressed in a subset of macrophages. Cell 1995,80(4):603-609.
56. Yang X, Schadt EE, Wang S, Wang H, Arnold AP, Ingram-Drake L,Drake TA, Lusis AJ: Tissue-specific expression and regulationof sexually dimorphic genes in mice. Genome Res 2006,16(8):995-1004.
57. Yang YH, Dudoit S, Luu P, Lin DM, Peng V, Ngai J, Speed TP: Nor-malization for cDNA microarray data: a robust composite
method addressing single and multiple slide systematic vari-ation. Nucleic Acids Res 2002, 30(4):e15.
58. Dowd SE, Zaragoza J: High throughput gene ontology func-tional annotation toolkit (HT-GO-FAT) utilized for animaland plant [abstract]. In Plant and Animal Genome Conference SanDiego, CA ; 2005.
59. High Throughput Gene Ontology Functional AnnotationToolkit [http://liru.ars.usda.gov/mainbioinformatics.html]
60. Ashburner M, Ball CA, Blake JA, Botstein D, Butler H, Cherry JM,Davis AP, Dolinski K, Dwight SS, Eppig JT, Harris MA, Hill DP, Issel-Tarver L, Kasarskis A, Lewis S, Matese JC, Richardson JE, Ringwald M,Rubin GM, Sherlock G: Gene ontology: tool for the unificationof biology. The Gene Ontology Consortium. Nat Genet 2000,25(1):25-29.
61. Shah I, Hunter L: Visualization based on the Enzyme Commis-sion nomenclature. Pac Symp Biocomput 1998:142-152.
62. Ogata H, Goto S, Sato K, Fujibuchi W, Bono H, Kanehisa M: KEGG:Kyoto Encyclopedia of Genes and Genomes. Nucleic Acids Res1999, 27(1):29-34.
63. Wu CH, Huang H, Arminski L, Castro-Alvear J, Chen Y, Hu ZZ, Led-ley RS, Lewis KC, Mewes HW, Orcutt BC, Suzek BE, Tsugita A, Vinay-aka CR, Yeh LS, Zhang J, Barker WC: The Protein InformationResource: an integrated public resource of functional anno-tation of proteins. Nucleic Acids Res 2002, 30(1):35-37.
64. Tatusov RL, Fedorova ND, Jackson JD, Jacobs AR, Kiryutin B, KooninEV, Krylov DM, Mazumder R, Mekhedov SL, Nikolskaya AN, Rao BS,Smirnov S, Sverdlov AV, Vasudevan S, Wolf YI, Yin JJ, Natale DA: TheCOG database: an updated version includes eukaryotes.BMC Bioinformatics 2003, 4:41.
65. Dennis G Jr., Sherman BT, Hosack DA, Yang J, Gao W, Lane HC,Lempicki RA: DAVID: Database for Annotation, Visualization,and Integrated Discovery. Genome Biol 2003, 4(5):P3.
66. Al-Shahrour F, Diaz-Uriarte R, Dopazo J: FatiGO: a web tool forfinding significant associations of Gene Ontology terms withgroups of genes. Bioinformatics 2004, 20(4):578-580.
67. Rozen S, Skaletsky H: Primer3 on the WWW for general usersand for biologist programmers. Methods Mol Biol 2000,132:365-386.
Page 14 of 14(page number not for citation purposes)
http://www.ncbi.nlm.nih.gov/entrez/query.fcgi?cmd=Retrieve&db=PubMed&dopt=Abstract&list_uids=7867067
http://www.ncbi.nlm.nih.gov/entrez/query.fcgi?cmd=Retrieve&db=PubMed&dopt=Abstract&list_uids=7867067
http://www.ncbi.nlm.nih.gov/entrez/query.fcgi?cmd=Retrieve&db=PubMed&dopt=Abstract&list_uids=7867067
http://www.ncbi.nlm.nih.gov/entrez/query.fcgi?cmd=Retrieve&db=PubMed&dopt=Abstract&list_uids=9697178
http://www.ncbi.nlm.nih.gov/entrez/query.fcgi?cmd=Retrieve&db=PubMed&dopt=Abstract&list_uids=9697178
http://www.ncbi.nlm.nih.gov/entrez/query.fcgi?cmd=Retrieve&db=PubMed&dopt=Abstract&list_uids=9847135