Corrole− Fullerene Dyads: Formation of Long-Lived Charge-Separated States in Nonpolar Solvents

Water Research 36 (2002) 4552–4562
Characterization, differentiation and classification of aquatichumic matter separated with different sorbents: synchronous
scanning fluorescence spectroscopy
Juhani Peuravuori*, Riitta Koivikko, Kalevi Pihlaja
Laboratory of Physical Chemistry, Department of Chemistry, University of Turku, FIN-20014 Turku, Finland
Received 6 June 2001; received in revised form 8 February 2002; accepted 12 April 2002
Abstract
Aquatic humic solutes were separated by the non-ionic macroporous XAD-8 and DAX-8 resins and a weakly basic
DEAE cellulose anion exchanger from seven different fresh water sources. Synchronous fluorescence spectroscopy was
applied for characterization, differentiation and classification of the different humic-solute aggregates. Fluorescence
properties verified that humic-solute fractions isolated parallelly with the non-ionic XAD-8 and DAX-8 resins
resembled very closely each other speaking strongly for their structural similarities. DAX-8 resin separated ca. 19%
more aquatic humic matter than did the analogous XAD-8 resin. It was possible to tentatively differentiate the
untreated water samples according to their fluorescent materials. Several distinct classes of chromophores were detected
in both DOM and isolated humic fractions by the synchronous technique: lex=lem 280/298, 330/348, 355/373, 400/418,
427/445, 460/478, 492/510 and 516/534 nm. r 2002 Elsevier Science Ltd. All rights reserved.
Keywords: Fluorescence; Dissolved organic matter; DAX/XAD-resin isolation; Chromophores
1. Introduction
Over more than three decades fluorescence spectro-
scopy has been applied extensively to characterization,
differentiation and classification of natural organic
matter (OM) such as humic matter (HM). Likewise,
attempts to identify certain structural and functional
constituents (fluorophores) in natural HM have been
carried out. Many investigations have been performed
solely with the conventional fluorescence methods in the
emission or excitation modes. Fluorescence is sensitive
and many environmental factors (type of solution, pH,
ionic strength, temperature, redox potential of the
medium and interactions with metal ions and organic
substances) affect it (e.g. [1]). Despite the effects of the
structural units of DOM/aquatic HM on the intensity
and wavelength of the molecular fluorescence are
extremely complicated and partly unknown, some
fundamental hypothesis have been stated (e.g. [1–4]):
The intensity will decrease with increasing molecular size
of humic aggregates. Electron-withdrawing groups
decrease and electron-donating groups increase the
intensity of fluorescence in aromatic compounds.
Carbonyl-containing substituents, hydroxyl, alkoxyl
and amino groups tend to shift fluorescence to longer
wavelengths. Structural factors in HM which fluoresce
at long wavelengths with low intensity could be the
linearly condensed aromatic rings and other unsaturated
bond systems capable of a high degree of conjugation.
Fluorescence studies may sometimes be surprising and
contradictory. For example, fluorescence does not show
significant correlation with total organic carbon (TOC)
of certain model materials [3] or seawater TOC.
However, a linear correlation between fluorescence and
TOC has been found in surface waters [5] and in run-off*Corresponding author. Fax: +358-2-333-6700.
E-mail address: [email protected] (J. Peuravuori).
0043-1354/02/$ - see front matter r 2002 Elsevier Science Ltd. All rights reserved.
PII: S 0 0 4 3 - 1 3 5 4 ( 0 2 ) 0 0 1 7 2 - 0

waters of peatlands [6]. Also, a nice correlation has been
found between fluorescence and biochemical oxygen
demand (BOD) of wastewater [7].
Fluorescence spectrometers equipped for synchronous
scanning in the constant-wavelength or constant-energy
modes have been used with good results to differentiate
fluorescent contaminants such as oils and polycyclic
hydrocarbons in the environment (e.g. [8–10]). Synchro-
nous fluorescence spectroscopy (SFS) has also the same
limitations inherent to the basic fluorescence technique,
such as spectral distortions caused by intermolecular
interactions and by static and dynamic quenching
processes. SFS offers, however, a potentiality to reduce
overlapping interferences and a possibility for each
fluorescent component to be identified in a specific
spectral range.
The idea of the synchronous technique was first
suggested by Lloyd [11]. In SFS the excitation wave-
length, lex; and the emission wavelength, lem; are
scanned synchronously with a constant-wavelength
interval, Dl ¼ lem � lex: For well-defined absorption
and quantum yield maxima, the optimum value of the
bandwidth Dl is set by the difference in wavelength of
the emission and excitation maxima which is known as
Stoke’s shift. As pointed out by Vo-Dinh [12,13], one of
the most essential limitations in multi-component
analysis by synchronous or any other luminescence
technique is spectral overlap. When more and more
components are present, as is the case with the HM
solution, the chances of spectral overlap increase, which
may lead to problems such as distortion of the
synchronous signal.
The Stoke’s shift is dependent on the solvent
environment but of most interest, the width of the
synchronous spectrum can be simply compressed or
expanded just by decreasing or increasing the Dltotal(Dl+the spectral overlap range) parameter [12]. The
decrease of the bandwidth of the synchronous signal is
advantageous since the spectral overlap greatly reduces.
Lloyd [14] has suggested that the interval of the
bandwidth should be between 20 and 30 nm for
condensed aromatic compounds. It has been later
proved experimentally (e.g. [4,15–18] that a constant
wavelength difference of 18 nm (Dl ¼ lem � lex) pro-
vides the best optimized resolution of the synchronous
signal for the natural HM in its different solutions.
The natural DOM has been nowadays generally
classified and modelled by different column chromato-
graphic methods into, structurally quite simple, non-
humic solutes and into very complicated heterogeneous
humic-solute aggregates. Sorption of humic solutes onto
wide variety of different sorbents takes place via
different mechanisms at given chemical conditions.
Thus, humic aggregates retained on different sorbents
do not have necessarily the same chemical and physical
properties although they possess somewhat acidic
character. The most popular sorbent has been the
XAD-8 (poly methyl methacrylate) resin at preadjusted
acidity. However, the manufacture of the XAD-8 resin
has been ceased for some years ago. It has been stated
[19] that XAD-8 can be substituted by Supelitet DAX-8
since their technical specifications are quite close
together. It is also possible to isolate with a very good
yield of macromolecular organic acids as an integrated
whole of HM from fresh waters without any pH-
adjustment of the original sample using weakly basic
anion exchange resins (namely Sigmas DEAE cellulose,
diethylaminoethylcellulose: –OC2H4N(C2H5)2).
In the present study the SFS technique was applied for
characterization and differentiation of several lake
aquatic HM samples originating in seven slightly
different environmental sources—also some coarse
structural classification of these, with different sorbents,
isolated HM samples was attempted to carry out. The
sorbents utilized for isolation of the HM samples were:
non-ionic macroporous (1) XAD-8 and (2) DAX-8
copolymers and (3) weakly basic DEAE cellulose anion
exchange resin. The objectives were: (I) study the effect
of the sorption resin on the structural compositions of
the different HMs, (II) examine the environmental
impact on the quality of the HMs, (III) study the effect
of the freeze-drying process on the structural composi-
tions of the HMs, (IV) try to find general similarities-
dissimilarities occurring between the different original
DOMs, (V) try to find similarities occurring between the
isolated HM samples and the original DOM, and (VI)
try to name some structural units as potential con-
tributors to molecular fluorescence.
2. Experimental
2.1. Origin and isolation of samples
Natural fresh water humic samples were collected
from five forest lakes (Kakarlampi, Ka; Mustaj.arvi, Mu;
Kuljuj.arvi, Ku; Pikkuj.arvi, Pi; Pappinen, Pa), from one
reservoir (Maaria, Ma) and from one river (Aura, Au).
All surface waters situate around the city of Turku in
southwestern Finland. The aquatic environments of Au
and Ma are sources of raw waters for the city Turku.
The water samples (ca. 50 l) were collected from 1m
below the surface into glass bottles between October
1999 and January 2000. The samples were prefiltrated
(0.2 mm, Nuclepore 611101 and Gelman Sciences 12117
polycarbonate filter cartridges) directly after sampling
and, thereafter, stored in the hermetic containers in the
dark at 41C during the analysis and isolation proce-
dures. Table 1 shows some characteristic properties for
the studied natural fresh water samples.
Aquatic humic solutes were isolated from the seven
water samples (Ka; Mu; Au; Ma; Ku; Pi and Pa) by the
J. Peuravuori et al. / Water Research 36 (2002) 4552–4562 4553

conventional so-called XAD technique at pH 2 using the
non-ionic Amberlites XAD-8 resin (isolated humic
samples are sublabelled as [XAD.HM]. The humic
solutes were also isolated from the water samples of
Ka, Mu, Au and Ma using the non-ionic Supelitet
DAX-8 resin (isolated humic samples are sublabelled as
[DAX.HM]. The isolation procedure with the DAX-8
resin was analogous to that of XAD-8 resin. Further-
more, in the case of the Mu-water sample the DEAE
cellulose was applied for isolating at the natural acidity
the integrated whole of practically all humic solutes
(isolated humic sample is sublabelled as [DEAE.HM].
The specific humic solutes (referred also as hydrophobic
humic substances) eluted with 0.1M NaOH from the
XAD-8 and DAX-8 resins were not further divided at
pH 1 into functional humic- (HA) and fulvic- (FA) acid
fractions. Similarly, the macromolecular organic acids
of the [DEAE.HM] sample were not divided at pH 1
into fictional HA and FA subfractions. The organic
constituents not eluted from the XAD-8 and DAX-8
resins with base (so-called hydrophobic neutrals being
relatively too hydrophobic to be eluted with base) were
eluted with methanol and labelled as [XAD.MeOH] and
[DAX.MeOH], respectively. The different analytical
flow procedures have been reported in detail previously
(e.g. [20,21]). The amounts of the humic samples
obtained by the different sorbents and their relation-
ships to the original DOCs are shown in Table 2. It is
noteworthy that the most hydrophobic constituents
eluted only with organic solvents from non-ionic sorbing
solids are not, according to an adopted definition,
usually counted to aquatic HM/substances. In this
study, however, the [-.MeOH] fractions are also
terminologically considered to form a part of the HM
samples.
2.2. Chemical analysis
Colour, pH, CODMn, Fetot and conductivity of the
original water samples were measured, for the sake of
general comparison, in the laboratory of Turku Water
Works using the standard methods. The methods and
equipments used for the determination of dissolved
organic carbon (DOC) in the original water samples, the
moisture and ash contents of the isolated HMs as well
their elemental analyses (carbon, hydrogen, nitrogen
Table 1
Some characteristic properties of studied fresh water samplesa
Water source pH (201C) Colour
(mg Pt l�1)
CODMn
(mg l�1)
DOC
(mg C l�1)
Fetot(mg l�1)
Conductivity
(251C, mSm�1)
Lake Kakarlampi, Ka 5.8 100 77 17.2 0.4 4
Lake Mustaj.arvi, Mu 5.6 150 83 18.9 1.1 3
Aura river, Au 6.8 175 72 16.4 0.7 13
Maaria reservoir, Ma 6.6 175 70 15.2 0.9 14
Lake Kuljuj.arvi, Ku 5.2 175 94 21.2 1.7 4
Lake Pikkuj.arvi, Pi 5.5 70 55 11.6 0.7 2
Lake Pappinen, Pa 6.3 175 83 18.7 2.1 10
aCODMn=chemical oxygen demand as mg KMnO4 l�1. Colour values were measured in the laboratory of Turku Water Works with
a Lovibond 1000 comparator.
Table 2
Amounts (mg l�1) and carbon distributions (% of original DOC) of different humic isolates obtained by different sorbents (moisture-
and ash-free basis)a
Water source [XAD.HM]
(mg l�1, %)
[DAX.HM]
(mg l�1, %)
[DEAE.HM]
(mg l�1, %)
[XAD.MeOH]
(mg l�1, %)
[DAX.MeOH]
(mg l�1, %)
Lake Kakarlampi, Ka 18.7 59 20.6 65 1.7 6 0.3 1
Lake Mustaj.arvi, Mu 20.8 57 22.2 63 30.1 82 2.4 8 0.8 2
Aura river, Au 15.5 51 20.7 68 1.3 4 0.4 1
Maaria reservoir, Ma 14.9 54 18.5 67 0.7 3 0.3 1
Lake Kuljuj.arvi, Ku 19.9 53 1.9 5
Lake Pikkuj.arvi, Pi 9.3 48 1.2 7
Lake Pappinen, Pa 18.6 53 1.9 6
aDifferent [-.HM] fractions were not divided into so-called humic- (HA) and fulvic- (FA) acid subfractions thus representing their
combined mixtures.
J. Peuravuori et al. / Water Research 36 (2002) 4552–45624554
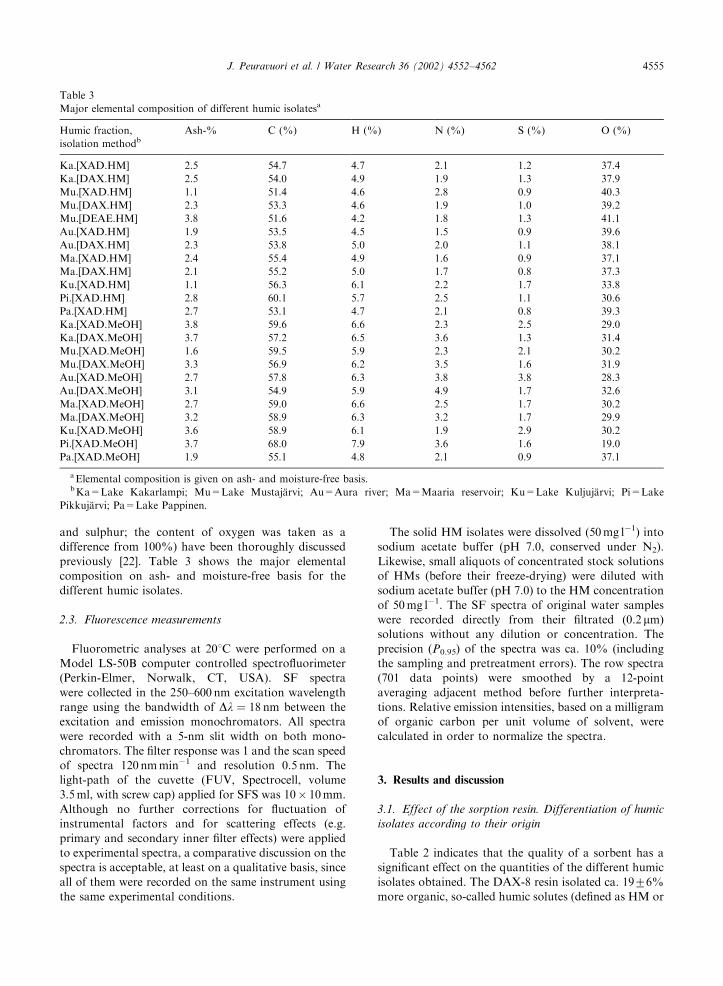
and sulphur; the content of oxygen was taken as a
difference from 100%) have been thoroughly discussed
previously [22]. Table 3 shows the major elemental
composition on ash- and moisture-free basis for the
different humic isolates.
2.3. Fluorescence measurements
Fluorometric analyses at 201C were performed on a
Model LS-50B computer controlled spectrofluorimeter
(Perkin-Elmer, Norwalk, CT, USA). SF spectra
were collected in the 250–600 nm excitation wavelength
range using the bandwidth of Dl ¼ 18 nm between the
excitation and emission monochromators. All spectra
were recorded with a 5-nm slit width on both mono-
chromators. The filter response was 1 and the scan speed
of spectra 120 nmmin�1 and resolution 0.5 nm. The
light-path of the cuvette (FUV, Spectrocell, volume
3.5ml, with screw cap) applied for SFS was 10� 10mm.
Although no further corrections for fluctuation of
instrumental factors and for scattering effects (e.g.
primary and secondary inner filter effects) were applied
to experimental spectra, a comparative discussion on the
spectra is acceptable, at least on a qualitative basis, since
all of them were recorded on the same instrument using
the same experimental conditions.
The solid HM isolates were dissolved (50mg l�1) into
sodium acetate buffer (pH 7.0, conserved under N2).
Likewise, small aliquots of concentrated stock solutions
of HMs (before their freeze-drying) were diluted with
sodium acetate buffer (pH 7.0) to the HM concentration
of 50mg l�1. The SF spectra of original water samples
were recorded directly from their filtrated (0.2 mm)solutions without any dilution or concentration. The
precision (P0.95) of the spectra was ca. 10% (including
the sampling and pretreatment errors). The row spectra
(701 data points) were smoothed by a 12-point
averaging adjacent method before further interpreta-
tions. Relative emission intensities, based on a milligram
of organic carbon per unit volume of solvent, were
calculated in order to normalize the spectra.
3. Results and discussion
3.1. Effect of the sorption resin. Differentiation of humic
isolates according to their origin
Table 2 indicates that the quality of a sorbent has a
significant effect on the quantities of the different humic
isolates obtained. The DAX-8 resin isolated ca. 1976%
more organic, so-called humic solutes (defined as HM or
Table 3
Major elemental composition of different humic isolatesa
Humic fraction,
isolation methodbAsh-% C (%) H (%) N (%) S (%) O (%)
Ka.[XAD.HM] 2.5 54.7 4.7 2.1 1.2 37.4
Ka.[DAX.HM] 2.5 54.0 4.9 1.9 1.3 37.9
Mu.[XAD.HM] 1.1 51.4 4.6 2.8 0.9 40.3
Mu.[DAX.HM] 2.3 53.3 4.6 1.9 1.0 39.2
Mu.[DEAE.HM] 3.8 51.6 4.2 1.8 1.3 41.1
Au.[XAD.HM] 1.9 53.5 4.5 1.5 0.9 39.6
Au.[DAX.HM] 2.3 53.8 5.0 2.0 1.1 38.1
Ma.[XAD.HM] 2.4 55.4 4.9 1.6 0.9 37.1
Ma.[DAX.HM] 2.1 55.2 5.0 1.7 0.8 37.3
Ku.[XAD.HM] 1.1 56.3 6.1 2.2 1.7 33.8
Pi.[XAD.HM] 2.8 60.1 5.7 2.5 1.1 30.6
Pa.[XAD.HM] 2.7 53.1 4.7 2.1 0.8 39.3
Ka.[XAD.MeOH] 3.8 59.6 6.6 2.3 2.5 29.0
Ka.[DAX.MeOH] 3.7 57.2 6.5 3.6 1.3 31.4
Mu.[XAD.MeOH] 1.6 59.5 5.9 2.3 2.1 30.2
Mu.[DAX.MeOH] 3.3 56.9 6.2 3.5 1.6 31.9
Au.[XAD.MeOH] 2.7 57.8 6.3 3.8 3.8 28.3
Au.[DAX.MeOH] 3.1 54.9 5.9 4.9 1.7 32.6
Ma.[XAD.MeOH] 2.7 59.0 6.6 2.5 1.7 30.2
Ma.[DAX.MeOH] 3.2 58.9 6.3 3.2 1.7 29.9
Ku.[XAD.MeOH] 3.6 58.9 6.1 1.9 2.9 30.2
Pi.[XAD.MeOH] 3.7 68.0 7.9 3.6 1.6 19.0
Pa.[XAD.MeOH] 1.9 55.1 4.8 2.1 0.9 37.1
aElemental composition is given on ash- and moisture-free basis.bKa=Lake Kakarlampi; Mu=Lake Mustaj.arvi; Au=Aura river; Ma=Maaria reservoir; Ku=Lake Kuljuj.arvi; Pi=Lake
Pikkuj.arvi; Pa=Lake Pappinen.
J. Peuravuori et al. / Water Research 36 (2002) 4552–4562 4555

humic substances) than did XAD-8 resin. This is very
well in agreement with the report of Farnworth [19]. The
high binding capacity of the DEAE cellulose (ca. 45%
more HM was obtained than with the XAD technique)
was analogous to that in a previous study [21]. The
amount of the most hydrophobic organic constituents
([-.MeOH]) back eluted from the DAX-8 resin with
methanol was considerably smaller (ca. 6975%) than
that found by the XAD-8 resin. The major elemental
compositions in Table 3 were, in turn, practically similar
for the different [-.HM] fractions and also for different
[-.MeOH] fractions (except that the carbon contents of
[XAD.MeOH] fractions were slightly, ca. 471%, great-
er than those of [DAX.MeOH]. Table 1 shows that the
characteristic properties of the original water samples
were fairly similar, except those for Lake Pikkuj.arvi.
Fig. 1 shows the fluorescent behaviours of the humic
isolates separated with different methods from different
sources. The spectra of all the [XAD.-], [DAX.-] and
[DEAE.HM] type fractions in Fig. 1(a) were fairly
similar with each other as was also the case for different
[XAD.-] and [DAX.MeOH] type fractions in Fig. 1(b).
The characterization of the spectra can at the first sight
look somewhat confusing because of the poorly resolved
‘‘peaks’’ between wavy valleys. The first thing which
can be clearly deduced from Figs. 1(a) and (b) is that
the distribution of the fluorescent components is
fully different for the [-.HM] and the corresponding
275 300 325 350 375 400 425 450 475 500 525 550 575 600
0.00
0.05
0.10
0.15
0.20
0.25
0.30
0.35
0.40
(a)
Ka.[XAD.HM]
Ka.[DAX.HM]
Mu.[XAD.HM]
Mu.DAX.HM]
Mu.[DEAE.HM]
Au.[XAD.HM]
Au.[DAX.HM]
Ma.[XAD.HM]
Ma.[DAX.HM]
Ku.[XAD.HM]
Pi.[XAD.HM]
Pa.[XAD.HM]Rel
ativ
e em
issi
on in
tens
ity
250 275 300 325 350 375 400 425 450 475 500 525 550 575 600
0.00
0.05
0.10
0.15
0.20
0.25
0.30
0.35
0.40
0.45
(b)
Ka.[XAD.MeOH]
Ka.[DAX.MeOH]
Mu.[XAD.MeOH]
Mu.[DAX.MeOH]
Au.[XAD.MeOH]
Au.[DAX.MeOH]
Ma.[XAD.MeOH]
Ma.[DAX.MeOH]
Ku.[XAD.MeOH]
Pi.[XAD.MeOH]
Pa.[XAD.MeOH]Rel
ativ
e em
issi
on in
tens
ity
Excitation wavelength (nm), λem = λex+ 18 nm
Excitation wavelength (nm), λem = λex+ 18 nm
Fig. 1. SF spectra recorded for different humic isolates. In (a) the [-.HM] samples were back eluted from the sorbents with 0.1M
NaOH. In (b) the [-.MeOH] samples were back eluted from the sorbents with methanol. The freeze-dried solid samples were dissolved
in sodium acetate buffer (pH 7.0) before SF measurements. Abbreviations of different water-sample sources are given in Table 3.
J. Peuravuori et al. / Water Research 36 (2002) 4552–45624556

[-.MeOH] fractions. A closer inspection of the spectra
indicates that the valleys between the ‘‘tops’’ of the
different waveforms locate fairly precisely at the
same positions for both the [-.HM] and [-.MeOH]
type fractions. Therefore, the whole spectral range
was divided into eight sections: A ¼ 2602302 nm;B ¼ 3022340 nm;C ¼ 3402370 nm; D ¼ 3702420 nm;E ¼ 4202438 nm; F ¼ 4382487 nm;G ¼ 4872510 nm;H ¼ 5102550 nm:For better extracting the information from the spectra
they were mathematically manipulated to fix the set of
‘‘primary’’ peaks between the different valleys. The
baseline drifts of the spectra were removed (e.g. [23]), i.e.
the peaks and adjacent valleys were defined by a
modified multi-point method originally described by
Marshall [24] and Marshall et al. [25]. The ‘‘real’’ peak
heights were then detected and their relative proportions
calculated for every eight spectral regions of A–H. In
this way the very large multi-dimensional spectral data
sets of Fig. 1 (12� 701 in Fig. 1(a) and 11� 701 matrixes
in Fig. 1(b)) were reduced into smaller size matrixes
(12� 8 in Fig. 1(a) and 11� 8 in Fig. 1(b)) without
significant loss of the original information. These new
data sets were computationally [26] examined closer with
a statistical-graphical principal components analysis,
PCA (e.g. [27]). The basic goal of the PCA is to reduce
the numerous variables and to seek linear combinations
(e.g. so-called scores) of those variables explaining most
of the variability.
Fig. 2 shows the biplot of the eight variables for the
different humic isolates (12 [-.HM] cases in Fig. 2(a) and
11 [-.MeOH] cases in Fig. 2(b)). The level of statements
were 72% and 15% for PC1 and PC2 in Fig. 2(a) and
52% and 36% for PC1 and PC2 in Fig. 2(b), respec-
tively. The eight arrowhead lines intersecting at (0,0)
represent the weights of the variables. The direction and
length of each vector (variable) are proportional to
its contribution to the principal components, and the
angle between any two is inversely proportional to
the correlation between them. It is clearly seen that the
fluorescent units of A, B, C, D and F have the most
powerful differentiating abilities.
The statistical graphical analysis of Fig. 2(a) discloses
the important finding that the spectral features are
practically similar to the parallelly isolated [XAD.HM]
and [DAX.HM] fractions, i.e. they were positioned in
pairs quite close to each other. In other words, the
XAD-8 and DAX-8 resins seem to isolate humic-solute
bulks equally, producing mixtures with similar structur-
al compositions. This essential outcome was absolutely
analogous to that obtained previously [22] for the same
HM fractions by means of solid-state carbon-13
measurements confirming the of the SFS utilization.
Furthermore, the distant position of the Mu.[-
DEAE.HM] fraction from that of the corresponding
Mu.[XAD.HM] fraction confirms the perception (e.g.
[21]) that the structural composition of the humic-solute
mixture isolable with the DEAE procedure differs
partially from any special HM fraction obtained
by the multi-stage XAD technique. Fig. 2(b) shows
interestingly that the organic (humic) fractions
[DAX.MeOH], independent of the water sources,
formed their own compact cluster far from their
[XAD.MeOH] homologues. This may mean that the
hydrophobic–hydrophilic sorption-desorption proper-
ties of the DAX-8 resin are more precise than those of
the XAD-8 resin, as also the obtained quantities in
Table 2 indicate.
The environmental impact of the various fresh water
sources on the quality of the different humic-solute
isolates can be seen also from Fig. 2 by inspecting the
distribution of the different fractions. In Fig. 2(a) every
sampling site differs more or less from each other, and
Lake Pikkuj.arvi (Pi) is clearly individual. According to
the distinct distributions it is evident that the water
sources in question play their own essential roles in the
structural fine-chemistry of the HM isolates. Fig. 2(b)
demonstrates, on the contrary, that the water source has
no strong effect on the distribution of the [-.MeOH] type
fractions but they are rather random.
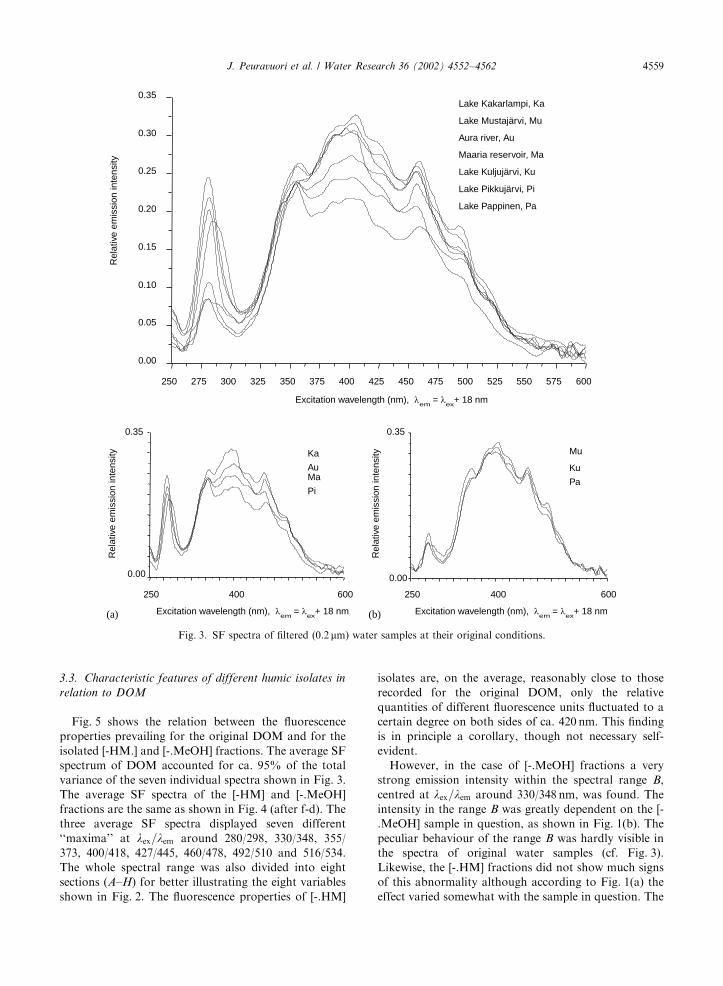
The bands in the SF spectra of Fig. 3 obtained for all
seven original filtrated water samples resemble widely
speaking those recorded for the different [-.HM] isolates
in Fig. 1(a). This is a quite natural consequence because
the [-.HM] isolates accounted up to ca. 80% for the
original DOC. The water-sample sources can be divided
into two subgroups based on the average fluorescence
unit-contents of their original DOM as demonstrated in
Figs. 3(a) and (b). It is, however, noteworthy that the
differentiation of the water sources in Figs. 3(a) and (b)
is totally different from that obtained especially in
Fig. 2(a) and also in Fig. 2(b) for their humic isolates.
This implies strongly that the isolation procedure (e.g.
drastic changes of acidities between ca. pH 2–11) has a
given effect on the structural composition of the isolates
verifying the difficulty to isolate humic solutes as they
occur in their natural conditions. On the other hand,
Fig. 3 supports the statement [15,28,29] that the type of
raw water can be tentatively defined with the aid of
certain so-called fingerprints of the SF spectra.
3.2. Effect of freeze-drying on the composition of humic
isolates
An uncertainty connected to the isolation procedure
of humic solutes is the freeze-drying process for
obtaining solid matter for further analyses. It is essential
that the composition and also the conformation of
the freeze-dried and back dissolved solid HM remain
as equal as possible with those prevailing in their
original solution straight after isolation and purification
procedures, i.e. structural changes during freeze-drying
J. Peuravuori et al. / Water Research 36 (2002) 4552–4562 4557

should be minimized. SFS permits for this purpose an
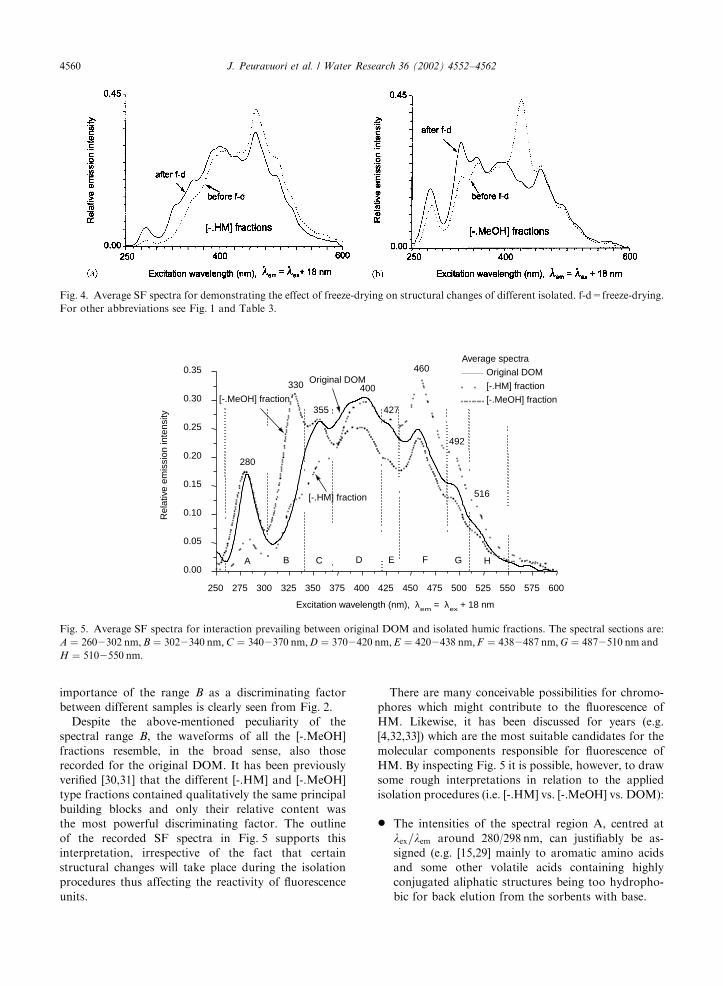
applicable control technique. Fig. 4 demonstrates the
effect of freeze-drying on the average fluorescence
properties (structural changes) of the different humic
isolates. The average SF spectra (both after and before
freeze-drying) accounted for ca. 96% of the total
variance of the individual [-.HM] fractions and for ca.
83% in the case of [-.MeOH] fractions. Fig. 4(a)
indicates that structural changes happened during the
freeze-drying process are quite minor for the [-.HM]
isolates back eluted from the sorbing solids with base,
only the quantities of different fluorescence units
fluctuated slightly on both sides of ca. 417 nm. This
finding will strengthen the general significance of
different [-.HM] type fractions as an applicable model
for natural aquatic humic solutes.
However, the situation was not so straightforward in
the case of [-.MeOH] fractions as shown in Fig. 4(b).
The strong spectral intensities lying in the spectral range
of 420–438 nm, centred at lex=lem around 427/445 nm,
obtained before freeze-drying for [-.MeOH] fractions
almost vanished during the freeze-drying and dissolving
procedures. This speaks strongly for significant structur-
al changes taking place in the freeze-drying process of
this minor and the most hydrophobic humic-solute
fraction.
PC1PC1
-3.8-3.8 -2.4-2.4 -1-1 0.40.4 1.81.8 3.23.2 4.64.6
-2.2-2.2
-1.4-1.4
-0.6-0.6
0.20.2
1
1.81.8
2.62.6
-3.4-3.4 -2-2 -0.6-0.6 0.80.8 2.22.2 3.63.6
-1.6-1.6
-0.6-0.6
0.40.4
1.41.4
2.42.4
3.43.4
PC2
PC2
PC2
PC2
PC1PC1
Ma.[XAD.HM]
Ma.[DAX.HM]
DB
Pa.[XAD.HM]
Mu.[DAX.HM]
Mu.[XAD.HM]u.[XAD.HM
Mu.[DEAE.HM]
(a)
Ka.[DAX.HM]
Ka.[XAD.HM] GG
H
C
E
Pi.[XAD.HM]A
Ku.[XAD.HM]
F
Au.[DAX.HM]
Au.[XAD.HM]
B
Ku.[XAD.MeOH]
Ma.[XAD.MeOH]
Au.[XAD.MeOH]
E
HG
C
A
D
FMa.[DAX.MeOH]
Au.[DAX.MeOH]Mu.[DAX.MeOH]
Ka.[DAX.MeOH]
Mu.[XAD.MeOH]
Pi.[XAD.MeOH]
Ka.[XAD.MeOH]
Pa.[XAD.MeOH]
(b)
Fig. 2. Graphical perspective on the distribution (biplot) of the different humic isolates for first-two principal components. The eight
variables (A–H) indicate different fluoresence units. For abbreviations of cases (samples) see Table 3.
J. Peuravuori et al. / Water Research 36 (2002) 4552–45624558
3.3. Characteristic features of different humic isolates in
relation to DOM
Fig. 5 shows the relation between the fluorescence
properties prevailing for the original DOM and for the
isolated [-HM.] and [-.MeOH] fractions. The average SF
spectrum of DOM accounted for ca. 95% of the total
variance of the seven individual spectra shown in Fig. 3.
The average SF spectra of the [-HM] and [-.MeOH]
fractions are the same as shown in Fig. 4 (after f-d). The
three average SF spectra displayed seven different
‘‘maxima’’ at lex=lem around 280/298, 330/348, 355/
373, 400/418, 427/445, 460/478, 492/510 and 516/534.
The whole spectral range was also divided into eight
sections (A–H) for better illustrating the eight variables
shown in Fig. 2. The fluorescence properties of [-.HM]
isolates are, on the average, reasonably close to those
recorded for the original DOM, only the relative
quantities of different fluorescence units fluctuated to a
certain degree on both sides of ca. 420 nm. This finding
is in principle a corollary, though not necessary self-
evident.
However, in the case of [-.MeOH] fractions a very
strong emission intensity within the spectral range B,
centred at lex=lem around 330/348 nm, was found. The
intensity in the range B was greatly dependent on the [-
.MeOH] sample in question, as shown in Fig. 1(b). The
peculiar behaviour of the range B was hardly visible in
the spectra of original water samples (cf. Fig. 3).
Likewise, the [-.HM] fractions did not show much signs
of this abnormality although according to Fig. 1(a) the
effect varied somewhat with the sample in question. The
250 275 300 325 350 375 400 425 450 475 500 525 550 575 600
0.00
0.05
0.10
0.15
0.20
0.25
0.30
0.35 Lake Kakarlampi, Ka
Lake Mustajärvi, Mu
Aura river, Au
Maaria reservoir, Ma
Lake Kuljujärvi, Ku
Lake Pikkujärvi, Pi
Lake Pappinen, Pa
Rel
ativ
e em
issi
on in
tens
ity
(b)
Mu
Ku
Pa
250 400 600
0.00
0.35
Rel
ativ
e em
issi
on in
tens
ity
250 400 600
0.00
0.35
(a)
Ka
AuMa
Pi
Rel
ativ
e em
issi
on in
tens
ity
Excitation wavelength (nm), λem
= λex
+ 18 nm Excitation wavelength (nm), λem
= λex
+ 18 nm
Excitation wavelength (nm), λem
= λex
+ 18 nm
Fig. 3. SF spectra of filtered (0.2 mm) water samples at their original conditions.
J. Peuravuori et al. / Water Research 36 (2002) 4552–4562 4559
importance of the range B as a discriminating factor
between different samples is clearly seen from Fig. 2.
Despite the above-mentioned peculiarity of the
spectral range B, the waveforms of all the [-.MeOH]
fractions resemble, in the broad sense, also those
recorded for the original DOM. It has been previously
verified [30,31] that the different [-.HM] and [-.MeOH]
type fractions contained qualitatively the same principal
building blocks and only their relative content was
the most powerful discriminating factor. The outline
of the recorded SF spectra in Fig. 5 supports this
interpretation, irrespective of the fact that certain
structural changes will take place during the isolation
procedures thus affecting the reactivity of fluorescence
units.
There are many conceivable possibilities for chromo-
phores which might contribute to the fluorescence of
HM. Likewise, it has been discussed for years (e.g.
[4,32,33]) which are the most suitable candidates for the
molecular components responsible for fluorescence of
HM. By inspecting Fig. 5 it is possible, however, to draw
some rough interpretations in relation to the applied
isolation procedures (i.e. [-.HM] vs. [-.MeOH] vs. DOM):
* The intensities of the spectral region A, centred at
lex=lem around 280/298 nm, can justifiably be as-
signed (e.g. [15,29] mainly to aromatic amino acids
and some other volatile acids containing highly
conjugated aliphatic structures being too hydropho-
bic for back elution from the sorbents with base.
Fig. 4. Average SF spectra for demonstrating the effect of freeze-drying on structural changes of different isolated. f-d=freeze-drying.
For other abbreviations see Fig. 1 and Table 3.
250 275 300 325 350 375 400 425 450 475 500 525 550 575 600
0.00
0.05
0.10
0.15
0.20
0.25
0.30
0.35
HGFEDCBA
516
492
460
427
400
355
330
280
Original DOM
[-.HM] fraction
[-.MeOH] fraction
Average spectra
Original DOM
[-.HM] fraction
[-.MeOH] fraction
Rel
ativ
e em
issi
on in
tens
ity
Excitation wavelength (nm), λem
= λex + 18 nm
Fig. 5. Average SF spectra for interaction prevailing between original DOM and isolated humic fractions. The spectral sections are:
A ¼ 2602302 nm;B ¼ 3022340 nm;C ¼ 3402370 nm;D ¼ 3702420 nm;E ¼ 4202438 nm;F ¼ 4382487 nm;G ¼ 4872510 nm and
H ¼ 5102550 nm:
J. Peuravuori et al. / Water Research 36 (2002) 4552–45624560
* Potential structural descriptor for the abnormal
intensities within the spectral region B, centred at
lex=lem around 330/348 nm, can be naphthalene [9]
with its derivatives. In a recent study [30] it was
found that naphthalene was in the first place enriched
in the [-.MeOH] type fractions according to the
hydrophobic–hydrophilic interactions being in force
during the isolation conditions.* A plain classification of fluorescence units of the
longer wavelengths based solely on the condensation
degree of aromatic compounds, disregarding the
influence of the different substituents (e.g. [9,28]), is
in accordance with the hydrophobic–hydrophilic
qualities of the isolation technique and the recent
study of principal building blocks [30,31].* Potential contributors to the fluorescence behaviour
within the spectral range C, centred at lex=lemaround 355/373 nm, are polycyclic aromatics with
three to four fused benzene rings.* Accordingly, the significant range D, centred at
lex=lem around 400/418 nm, corresponds to polycyc-
lic aromatic with approximately five fused benzene
rings.* The last significant range F, with a maximum at
lex=lem around 460/478 nm, is probably reflecting
the influence of polycyclic aromatics consisting of
about seven fused benzene rings. Also, the most
common lignin descriptors fluorescent within this
region.
4. Conclusions
This study has revealed a number of essential
outcomes for the study of humus chemistry: (I) The
utilization of the synchronous scanning fluorescence
technique seems to be quite reliable also in the study of
multi-component humic solutes. (II) Fluorescence prop-
erties of different humic fractions verified that the
hydrophobic–hydrophilic sorption-desorption proper-
ties of the DAX-8 resin seem to be more precise than
those of the XAD-8 resin. (III) The freeze-drying
process in the isolation procedure had no significant
effect on the fluorescence properties of the bulk of humic
solutes speaking for the stability of the structural
composition. (IV) The environmental source of fresh
water samples had its own effect on the fluorescence
properties of isolated humic-solute fractions. (V) The
fluorescence properties of the bulk of the conventional
humic solutes are quite close to those recorded for the
original DOM except in the case of the minor and
most hydrophobic humic solutes. (VI) Interpretations
about some molecular fluorescence units, based only
on aromatic moieties, were reasonable with the hydro-
phobic–hydrophilic qualities of the applied isolation
techniques.
Acknowledgements
The authors wish to thank Dr. Ronald .Osterbacka
(Department of Physics, (Abo Akademi University) for
his assistance in obtaining the synchronous fluorescence
spectra. Special thanks are expressed to Prof. Jorma
H .ols.a (Laboratory of Inorganic Chemistry, University
of Turku) for his favourable position on the thermal
analyses and to Dr. Ensio Laine (Laboratory of
Industrial Physics, University of Turku) for the practical
efforts. The authors are also thankful to Dr. Christer
Eckerman (Laboratory of Paper Chemistry, (Abo
Akademi) for his assistance in DOC analyses.
References
[1] Senesi N. Molecular and quantitative aspects of the
chemistry of fulvic acid and its interactions with
metal ions and organic chemicals. Part II. The fluorescence
spectroscopy approach. Anal Chim Acta 1990;232:
77–106.
[2] Stewart AJ, Wetzel RG. Fluorescence-absorbance ratios.
A molecular-weight tracer of dissolved organic matter.
Limnol Oceanogr 1980;25:559–64.
[3] Stewart AJ, Wetzel RG. A symmetrical relationships
between absorbance, fluorescence, and dissolved organic
carbon. Limnol Oceanogr 1981;26:590–7.
[4] Senesi N, Miano TM, Provenzano MR, Brunetti G.
Characterization, differentiation and classification of
humic substances by fluorescence spectroscopy. Soil Sci
1991;152:259–71.
[5] Mounier S, Braucher R, Benaim JY. Differentiation of
organic matter’s properties of the Rio Negro basin by
cross-flow ultra-filtration and UV-spectrofluorescence.
Water Res 1999;33:2363–73.
[6] Peuravuori J, Pihlaja K. Chemical mapping of peatlands
with special emphasis on the energy production. Ministry
of Trade and Industry, Finland, 1988, D:148, 121pp
(in Finnish with English abstract).
[7] Reynolds DM, Ahmad SR. Rapid and direct determina-
tion of wastewater BOD values using a fluorescence
technique. Water Res 1997;31:2012–8.
[8] Eiroa AA, Blanco VE, Mah!ıa PL, Lorenzo SM, Rodr!ıguez
DP, Fern!andez EF. Determination of polycyclic aromatic
hydrocarbons (PAHs) in a complex mixture by second-
derivative constant-energy synchronous spectrofluorime-
try. Talanta 2000;51:677–84.
[9] Kister J, Pieri N. Effects of preheating and oxidation on
two bituminous coals assessed by synchronous UV
fluorescence and FTIR spectroscopy. Energy Fuels
1996;10:948–57.
[10] Kumke MU, Frimmel FH, Ariese F, Gooijer C. Fluores-
cence of humic acids (HA) and pyrene-HA complexes
at ultralow temperature. Environ Sci Technol 2000;
34:3818–23.
[11] Lloyd JBF. Synchronyzed excitation of fluorescence
emission spectra. Nature (London) Phys Sci 1971;231:
64–5.
J. Peuravuori et al. / Water Research 36 (2002) 4552–4562 4561

[12] Vo-Dinh T. Multicomponent analysis by synchronous
luminescence spectrometry. Anal Chem 1978;50:396–401.
[13] Vo-Dinh T. Synchronous excitation spectroscopy. In:
Wehry EL, editor. Modern fluorescence spectroscopy,
vol. 4. New York: Plenum Press, 1981. p. 167–92.
[14] Lloyd JBF. The nature and evidential value of the
luminescence of automobile engine oils and related
materials. Part III. Separated luminescence. J Forensic
Sci Soc 1971;11:235–53.
[15] Lombardi AT, Jardim WF. Fluorescence spectroscopy of
high performance liquid chromatography fractionated
marine and terrestrial organic materials. Water Res
1999;33:512–20.
[16] Miano TM, Senesi N. Synchronous excitation fluorescence
spectroscopy applied to soil humic substances chemistry.
Sci Total Environ 1992;117/118:41–51.
[17] Provenzano MR, Miano TM, Senesi N. Concentration
and pH effects on the fluorescence spectra of humic acid-
like soil fungal polymers. Sci Total Environ 1989;81/
82:129–36.
[18] Senesi N, Miano TM, Provenzano MR, Brunetti G.
Spectroscopic and compositional characterization of
I.H.S.S. reference and standard fulvic and humic acids of
various origin. Sci Total Environ 1989;81/82:143–56.
[19] Farnworth JJ. Comparisons of the sorption from solution
of a humic acid by Supelite DAX-8 and by XAD-8 resins.
IHSS Newsletter 1995;13:8–9.
[20] Leenheer JA. Comprehensive approach to preparative
isolation and fractionation of dissolved organic carbon
from waters and wastewaters. Environ Sci Technol
1981;15:578–87.
[21] Peuravuori J, Pihlaja K, V.alim.aki N. Isolation and
characterization of natural organic matter from lake
water: two different adsorption chromatographic methods.
Environ Int 1997;23:453–64.
[22] Peuravuori J, Ingman P, Pihlaja K, Koivikko R. Compar-
ison of sorption of aquatic humic matter by DAX-8 and
XAD-8 resins from solid-state 13C NMR spectroscopy’s
point of view. Talanta 2001;55:733–42.
[23] Peuravuori J. Precision of isolation of aquatic humic
matter by XAD-resin technology from NMR spectro-
scopy’s point of view. Int J Environ Anal Chem
2000;76:179–98.
[24] Marshall RJ. The determination of peaks in biological
waveforms. Comput Biomed Res 1986;19:319–29.
[25] Marshall RJ, Bleasby AJ, Turner B, Cooper EH. A
computer system for analysis of chromatographic data.
Chemometr Intell Lab 1987;1:285–95.
[26] Statistica, for Windows, R. 5.1. StatSoft, Inc., Tulsa, 1997.
[27] Sharaf MA, Illman DL, Kowalski BR. Exploratory data
analysis. In: Chemometrics. New York: Wiley, 1986. p.
179–295.
[28] Dujmov J, Suevi P, Antoli B. UV-fluorescence spectro-
photometric assessment and characterization of dissolved
fluorescent matter in coastal water of the central Adriatic.
Neth J Sea Res 1992;29:291–6.
[29] Ahmad SR, Reynolds DM. Synchronous fluorescence
spectroscopy of wastewater and some potential constitu-
ents. Water Res 1995;29:1599–602.
[30] Lehtonen T, Peuravuori J, Pihlaja K. Characterization of
lake-aquatic humic matter isolated with two different
sorbing solid techniques: tetramethylammonium hydro-
xide treatment and pyrolysis-gas chromatography/mass
spectrometry. Anal Chim Acta 2000;424:91–103.
[31] Peuravuori J, Paaso N, Pihlaja K. Characterization of
lake-aquatic humic matter isolated with two different
sorbing solid techniques: pyrolysis electron impact mass
spectrometry. Anal Chim Acta 1999;391:331–44.
[32] Larson RA, Rockwell AL. Fluorescence spectra of water-
soluble humic materials and some potential precursors.
Arch Hydrobiol 1980;89:416–25.
[33] Smith DS, Kramer JR. Fluorescence analysis for multi-site
aluminum binding to natural organic matter. Environ Int
1999;25:295–306.
J. Peuravuori et al. / Water Research 36 (2002) 4552–45624562
Copyright © 2022 FDOKUMEN