Lifetimes of Stratospheric Ozone-Depleting Substances, Their ...
Characterization of groundwater humic substances:in¯uence of sedimentary organic carbon
R. Artingera,*, G. Buckaua, S. Geyerb, P. Fritzb, M. Wolfc, J.I. Kima
aForschungszentrum Karlsruhe, Institut fuÈr Nukleare Entsorgungstechnik, 76021 Karlsruhe, GermanybUFZ-Umweltforschungszentrum Leipzig-Halle, Sektion Hydrogeologie, 06246 Bad LauchstaÈdt, Germany
cGSF-National Research Center for Environment and Health, Institute of Hydrology, 85764 Neuherberg, Germany
Received 12 June 1998; accepted 4 December 1998
Editorial handling by R. Fuge
Abstract
A total of 35 groundwaters from 4 di�erent aquifer systems in Germany are investigated for their physico-
chemical properties, dissolved organic C (DOC) and humic and fulvic acids. Humic substances are isolated andcharacterized for their elemental composition, UV/Vis and ¯uorescence spectroscopic properties, size distribution bygel permeation chromatography (GPC) and 14C content. For isolation of su�cient quantities of humic substances a
mobile sampling system is developed based on a combination of reverse osmosis (RO) and XAD±8 adsorptionchromatography. One of the aquifer systems (Gorleben) covers a wide range of hydrogeochemical conditions,whereas the other 3 aquifer systems (Munich, Franconian Albvorland and Fuhrberg) have less diverse properties.
One speci®c feature of the Gorleben aquifer system is the presence of a very high DOC, which, in contrast to otheraquifer systems, contains considerable amounts of aquatic humic acid. This is attributed to the release of aquatichumic substances originating from sedimentary organic C (SOC) that is abundant in Gorleben sediments. Theresults show that aquatic humic substances from di�erent aquifer systems have dissimilar properties which di�er
from one another. Systematic di�erences are found among humic substances from di�erent regions of the Gorlebenaquifer system. Such di�erences are considered to be caused by the mixing of humic substances from the SOC.However, exact quanti®cation of such mixing appears di�cult because overlapping e�ects of di�erent geochemical
processes feigning a dissolution of SOC cannot be excluded. # 1999 Elsevier Science Ltd. All rights reserved.
1. Introduction
Humic substances are ubiquitous in groundwatersystems. They do not show a unique chemical struc-ture, but rather represent a group of organic com-
pounds with polyelectrolytic properties and resistanceto degradation under aquatic conditions. Due to theirlarge hydrodynamic size and their metal ion interaction
properties, they appear in natural water as humic col-
loids that are loaded with metal ions (Kim et al.,1996). Humic substances interact with non-polar or-ganic substances as well. For these reasons humic sub-stances play a crucial role for the geochemical
behavior of non-polar organic pollutants, heavy metalions and a multitude of radionuclides, especially multi-valent actinide ions (Manahan, 1989; Kim et al., 1989;
Kumke, 1994).Humic substances are divided into two fractions,
namely, humic acid (HA) and fulvic acid (FA). Both
fractions exhibit hydrophobic properties at low pH,
Applied Geochemistry 15 (2000) 97±116
0883-2927/99/$ - see front matter # 1999 Elsevier Science Ltd. All rights reserved.
PII: S0883-2927(99 )00021-9
* Corresponding author.
E-mail address: [email protected] (R. Artinger)
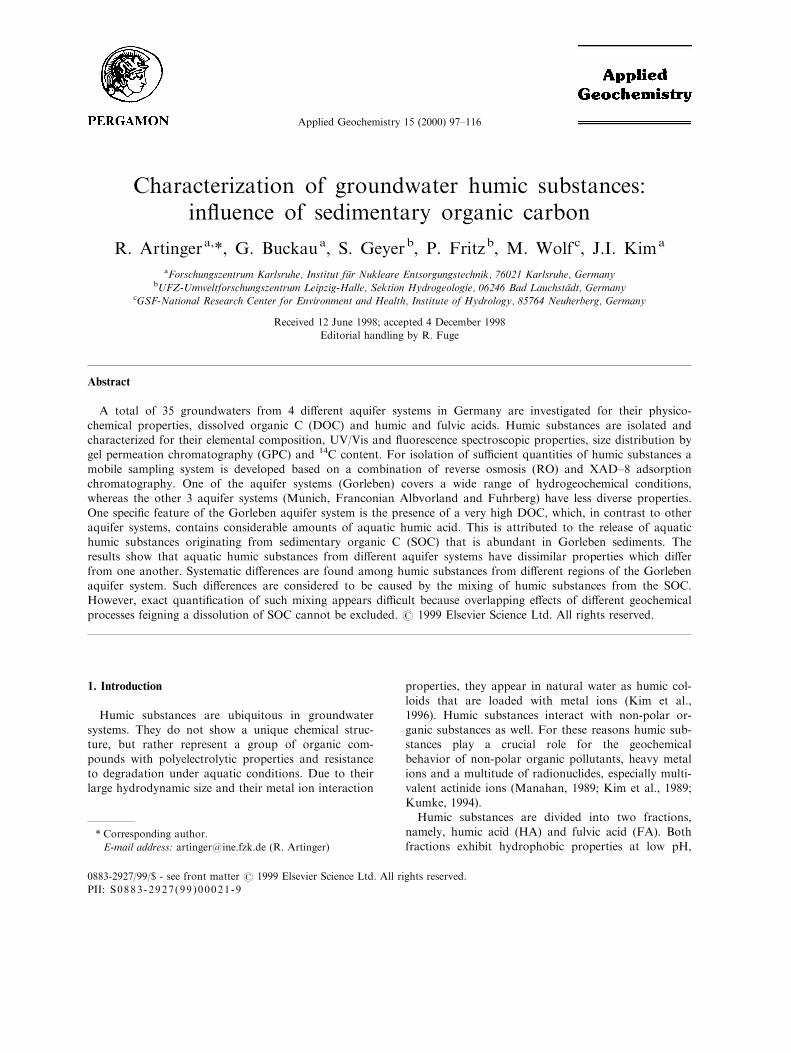
Table
1
Sampledgroundwaters
andtheirbasichydrologicalparameters,
chem
icalcomposition,DOC
concentrationand
3H
content.
nd=notdetermined
(dueto
oxygen
contact
during
groundwatersampling)
Depth
(m)
Sedim
enttype
Tem
p.
(8C)
pH
Eh
(mV)
Conduct.
(mS/cm)
Oxygen
(mg/L)
Na
KMg
Ca
(mmol/L)
HCO
3ÿSO
2ÿ4
Clÿ
3H
TU
aDOC
HA
(mgC/L)
FA
Gorleben
(coarse,
sand,clay)
Recharge
GoHy±181
15±18
Weichsel
9.6
6.4
29
0.13
0.1
0.35
0.04
0.10
0.27
0.30
0.34
0.19
39
0.5
0.009
0.14
GoHy±411
17±20
Weichsel
9.4
7.0
ÿ10.27
0.1
0.47
0.06
0.16
0.82
1.18
0.53
0.35
21
2.2
0.022
0.70
GoHy±421
10±13
Weichsel
9.3
6.0
53
0.35
0.2
0.92
0.08
0.28
0.53
0.15
0.82
1.04
20
1.9
±0.53
GoHy±611
21±24
Weichsel
8.9
8.4
72
0.20
<0.1
0.47
0.02
0.09
0.84
1.05
0.33
0.38
8.0
1.4
0.11
0.46
GoHy±711
6±9
Weichsel
92
6.0
398
0.19
4.5
0.45
0.07
0.28
0.38
0.15
0.53
0.34
29
0.9
(0.001)
0.35
Transition
GoHy±182
70±73
Elster
102
8.0
ÿ48
0.13
<0.1
0.24
0.03
0.05
0.54
1.04
0.04
0.20
<0.3
0.8
0.126
0.13
GoHy±201
30±35
Weichsel
9.6
7.8
121
0.17
<0.1
0.33
0.02
0.09
0.49
0.75
0.24
0.29
<1.1
0.9
0.05
0.40
EnhancedDOC
GoHy±412
65±68
Elster
10.7
7.6
92
0.36
<0.8
2.50
0.09
0.11
0.51
3.46
<0.01
0.51
<0.2
7.6
1.68
2.6
GoHy±492
35±38
Saale
9.6
8.0
128
2.15
<0.1
21.7
0.08
0.07
0.32
11.6
0.73
8.39
<0.2
127
114
8.9
GoHy±572
70±73
Elster
12.2
8.8
17
0.55
<0.1
5.74
0.03
0.04
0.08
4.74
0.01
0.72
0.5
14.4
9.4
3.2
GoHy±573
134±137
PraÈelster
14.2
8.0
ÿ32
1.63
<0.1
18.3
0.09
0.10
0.23
7.97
0.02
10.3
<0.2
97.2
60
17
GoHy±612
121±125
Saale
10.9
8.4
35
2.06
<0.1
19.8
0.08
0.15
0.56
13.2
0.30
6.59
0.5
184
171
9.2
GoHy±851
57±40
Elster
10.8
8.2
ÿ52.37
<0.1
Z.9
0.08
0.04
0.24
9.85
<0.01
12.7
0.4
169
140
6.7
GoHy±2211
83±85
Elster
12.1
8.1
31
4.99
<0.1
47.0
0.14
0.09
0.35
9.51
0.20
37.7
0.3
93.9
70
22
GoHy±2227
128±130
PraÈelster
14.4
7.8
ÿ58
4.30
<0.1
41.8
0.33
0.20
0.53
7.90
0.32
36.7
<0.3
73.4
58
5.9
R. Artinger et al. / Applied Geochemistry 15 (2000) 97±11698
Channel
Brines
GoHy±193
220±223
PraÈelster
12.9
6.8/7.1
b137
110.8
<0.1
2018
6.47
39.6
25.4
3.85
29.9
1974
<0.2
32
±0.50
GoHy±514
235±238
Elster
16.9
6.3/7.0
b162
170.9
<0.1
4870
20.3
82.3
26.5
2.09
52.9
4766
<0.3
1.6
±0.20
GoHy±653
216±219
Elster
18.9
6.5/7.1
b134
154.3
<0.1
4014
18.8
68.2
23.6
2.96
46.0
4079
<0.3
1.3
±0.24
Uplift-M
ixing
GoHy±341
10±13
Weichsel
8.6
7.0
140
4.84
<0.1
43.0
0.03
0.44
1.30
4.25
0.15
42.3
0.4
64.0
41
15
Munich
(lim
egravel)
MS±UP±178
0.5±23
Wu Èrm
/Riû
9.3
7.2
523
0.63
8.1
0.17
0.06
0.89
2.13
5.23
0.25
0.91
37
0.6
±0.12
MS±U1±630
6±18
Wu Èrm
/Riû
9.4
7.3
634
0.63
8.8
0.75
<0.01
0.88
2.29
5.38
0.26
0.75
34
0.9
±0.34
MS±KP±916
2±7
Wu Èrm
/Riû
9.0
7.3
330
0.67
5.6
020
0.06
0.87
2.34
5.75
0.25
1.22
36
0.7
±0.12
FranconianAlbvorland
(sandstone)
Laibstadt
76±144
Keuper
12.9
6.3
594
0.26
6.0
0.08
0.16
0.34
0.86
1.92
0.24
0.07
<0.4
0.5
±0.06
J-S-T
III
110±166
Keuper
18.6
6.8
283
0.57
<0.1
0.21
0.51
0.85
1.99
5.10
0.92
0.04
<0.7
0.1
±0.01
GredingI
80±92
(Lias)-K
euper
18.4
7.3
172
0.75
<0.1
0.45
0.83
0.96
2.26
5.79
0.15
0.03
<0.8
0.4
±0.03
GredingII
83±143
(Lias)-K
euper
19.1
7.4
185
0.42
<0.1
0.19
0.50
0.69
1.51
4.54
0.06
0.03
<0.7
0.3
±0.03
Beilngries
80±88
Keuper
15.6
7.4
41
0.52
<0.1
0.74
0.78
0.69
2.22
5.08
0.57
0.06
<0.5
0.4
±0.04
Fuhrberg
(sand)
FF±OW
1.3
below
forest
9.4
4.3
nd
0.24
nd
0.50
0.08
0.10
025
0.01
0.82
0.69
18
6.1
±1.3
FF±OA
1.8
below®eld
10.0
4.8
nd
0.42
nd
0.55
0.46
0.41
0.93
0.02
0.63
0.67
16
16.8
±4.0
FF±T1-4
4Weichsel
10.0
5.8
nd
0.66
nd
0.86
0.71
0.58
1.81
0.24
1.25
0.98
17
11.9
±3.0
FF±T3-11
11
Weichsel
10.0
5.5
nd
0.53
nd
0.45
0.07
0.73
1.60
0.21
2.34
0.88
18
4.4
±0.67
FF±N5-12
12
Weichsel
10.3
5.0
nd
0.33
nd
0.38
0.42
0.26
0.80
0.10
1.02
1.01
22
6.9
±4.5
FF±N10-4
4Weichsel
10.0
5.3
nd
0.54
nd
0.37
0.45
0.47
1.78
0.26
1.00
0.92
15
11.5
±3.2
FF±N10-6
6Weichsel
10.0
5.9
nd
0.56
nd
0.35
0.45
0.50
1.96
0.45
1.04
1.06
16
7.9
±2.0
FF±N10-12
12
Weichsel
10.0
5.9
nd
0.45
nd
0.68
0.27
0.32
1.48
0.55
1.70
1.49
32
11.3
±1.8
FF±N10-14
14
Weichsel
10.0
6.0
nd
0.51
nd
0.75
0.36
0.34
1.34
0.85
1.64
1.31
36
9.8
±1.8
aTU
3H
unit(1
TU=
0.118Bq/L).
bpH
correctedaccordingto
Runde(1993).
R. Artinger et al. / Applied Geochemistry 15 (2000) 97±116 99
which are used for the isolation of aquatic humic sub-stances by chromatographic separation on the non-
ionic acrylic ester resin XAD±8 (Aiken, 1988;Thurman and Malcolm, 1981). The part of DOC thatis not sorbed on XAD±8 at low pH is classi®ed to be
made up of hydrophilic compounds. HA and FA showdi�erent characteristics with respect to, amongstothers, the elemental composition, functional group
content, hydrodynamic size distribution and spectro-scopic properties (Kim et al., 1990; Stevenson, 1982;Steelink, 1985; MacCarthy and Rice, 1985; Beckett et
al., 1987; Pullin and Cabaniss, 1995; Chin et al.,1994).Important aspects for the role of humic substances
in transporting pollutants along with a water path are
their generation, migration behavior, residence timeand stability against degradation. If the stability ofaquatic humic substances is su�ciently long, their mi-
gration behavior often follows that of an ideal tracerand, thus, 14C measurements can be used for ground-water dating. Recent investigations demonstrated that
radiocarbon dating can contribute to the understand-ing of their migration behavior and residence time ingroundwater systems (Geyer et al., 1993; Geyer, 1993;
Geyh and BruÈ hl, 1991; Wassenaar et al., 1991;Pettersson and Allard, 1991; Purdy et al., 1992).However, in the presence of 14C free organic depositsthis dating method may result in too high groundwater
ages, if it is assumed that all the dissolved humic sub-stances originate from the surface (Artinger et al.,1996). Therefore, knowledge of their origin is necessary
to reconstruct the migration behavior of humic sub-stances in aquifer systems with organic deposits.In this paper aquatic humic substances from 35
di�erent groundwaters samples of 4 di�erent ground-water systems in Germany are quanti®ed and charac-terized. Three of the aquifers investigated haverelatively well known hydrological and geochemical
conditions (Munich, Franconian Albvorland andFuhrberg). The fourth aquifer (Gorleben) investigatedhas organic deposits, a very complex geohydrology
and a wide range of geochemical conditions. The dis-cussion focuses on the applicability of di�erent charac-terization methods for the distinction between HA and
FA in®ltrated via groundwater recharge and thoseoriginating from sedimentary organic C (SOC).
2. Aquifers and investigation
Four di�erent aquifer systems in Germany (Munich,
Franconian Albvorland, Fuhrberg and Gorleben) areused for the investigation. The sampled groundwatersare shown in Table 1 together with their characteristic
parameters. The aquifer systems are described as
follows:
Munich. This aquifer is located in the eastern out-
skirts of the city of Munich in southern Bavaria. It
is an uncon®ned lime-gravel aquifer and consists of
quaternary ¯uviatile alternating sandy, ®ne and
coarse pebbles. The sediment is mainly calcium car-
bonate and dolomite (>98%) and practically free
from organic deposits. The DOC content of the
groundwater varies from 0.3 to 1.5 mg C per liter
(mg C/L) according to season (Zahn, 1988). From
this aquifer 3 samples were taken from the top of
the groundwater level. All 3 groundwater samples
are saturated with O2 and contain 3H in concen-
trations of about 35 tritium units (TU), re¯ecting a
contamination by atmospheric nuclear testing. This
aquifer provides data for humic substances in
young recharge groundwater (<40 a) without inter-
ference by the in situ generation from sedimentary
organic C (SOC).
Franconian Albvorland. This aquifer is located in the
Franconian Albvorland in northern Bavaria. It is a
con®ned sandstone aquifer of the Upper Triassic
Keuper sequence and hydrogeologically well investi-
gated (Rietzler, 1979; Eichinger, 1981). The aquifer
extends over a distance of about 25 km to the SE
and declines moderately with an average water
table gradient of 0.8-. The sediments are free from
SOC. The groundwater is found to be of
Pleistocene origin (>12 000 a) at the end of the
¯owpath (Geyer, 1993; Eichinger, 1981). A mixing
with younger water along the groundwater ¯ow is
not probable since the aquifer is covered by thick
clay layers of the Upper Middle Keuper
(Feuerletten). This is also supported by non-detect-
able 3H concentrations (cf. Table 1). The aquifer is
anaerobic beyond 8 km of groundwater recharge
and SO4 reducing beyond 18 km. The DOC concen-
tration varies between 0.1 and 0.5 mg C/L. This
aquifer allows the characterization of HA and FA
in reducing groundwaters with ages exceeding
12 000 a presumably without interference of in situ
generation from SOC.
Fuhrberg. This aquifer is situated about 30 km N of
the city of Hanover in the drinking-water recovery
area of Fuhrberg. The aquifer consists of
Quaternary ®ne and coarse grained, and partly
gravel sands of 20 to 30 m thickness. The free
groundwater surface is in sandy podzols with a low
humus content. The groundwater samples are all
young (<40 a) as seen by the high 3H concen-
trations (>15 TU) and mass balance calculations
(BoÈ ttcher et al., 1985). In¯ux of DOC with ground-
water recharge along the main ¯owpath varies with,
amongst others, local vegetation conditions, includ-
R. Artinger et al. / Applied Geochemistry 15 (2000) 97±116100
ing variations in agricultural activity. The DOC
concentration varies between 17 mg C/L at ®eld
sampling sites near the surface and 5 mg C/L at a
depth of 11 m near the waterworks well. This aqui-
fer allows the characterization of humic substances
from groundwaters under recharge conditions, i.e.,
young, oxidizing groundwaters with relatively high
DOC concentrations.
Gorleben. This aquifer system is located at
Gorleben in the Northern German Plain (Lower
Saxony). The aquifer extends down to 280 m below
ground surface and is situated in the rock covering
and surrounding a Permian salt dome under
exploration for construction of a nuclear waste
repository. In the upper part of the aquifer system
freshwater is found in ¯uviatile sediments of highpermeability. Below this, clayey sediments of low
water permeability are found. At higher depths in
the vicinity of the salt dome, dissolution of salt
results in groundwater with higher salt concen-
tration. Furthermore, the so-called Gorleben chan-
nel is located on top of the salt dome. During the
Elster glaciation, the cap rock was removed along
this channel, followed by deposition of sand and
marl.
According to the regional groundwater model, the
main recharge area is located S of the salt dome with
the Gorleben channel extending towards the NE. For
the part of the Gorleben aquifer system discussed in
this paper, Pleistocene origin (>12 000 a) is only
expected for nearly salt saturated channel brines in the
direct vicinity of the salt dome as shown by numerical
¯ow modeling and d2H and d18O isotope signatures
(BfS, 1990). Signi®cant 3H concentrations are only
found down to 25 m sampling depth Table 1 (cf. also
Sonntag and Suckow, 1993). One speci®c characteristic
of this aquifer system is the large variety of DOC con-
centrations, from <1 mg C/L up to more than 200 mg
C/L (Buckau, 1991) (cf. also Table 1). The very high
DOC concentrations are generally attributed to in situ
generation from local Miocene brown coal and
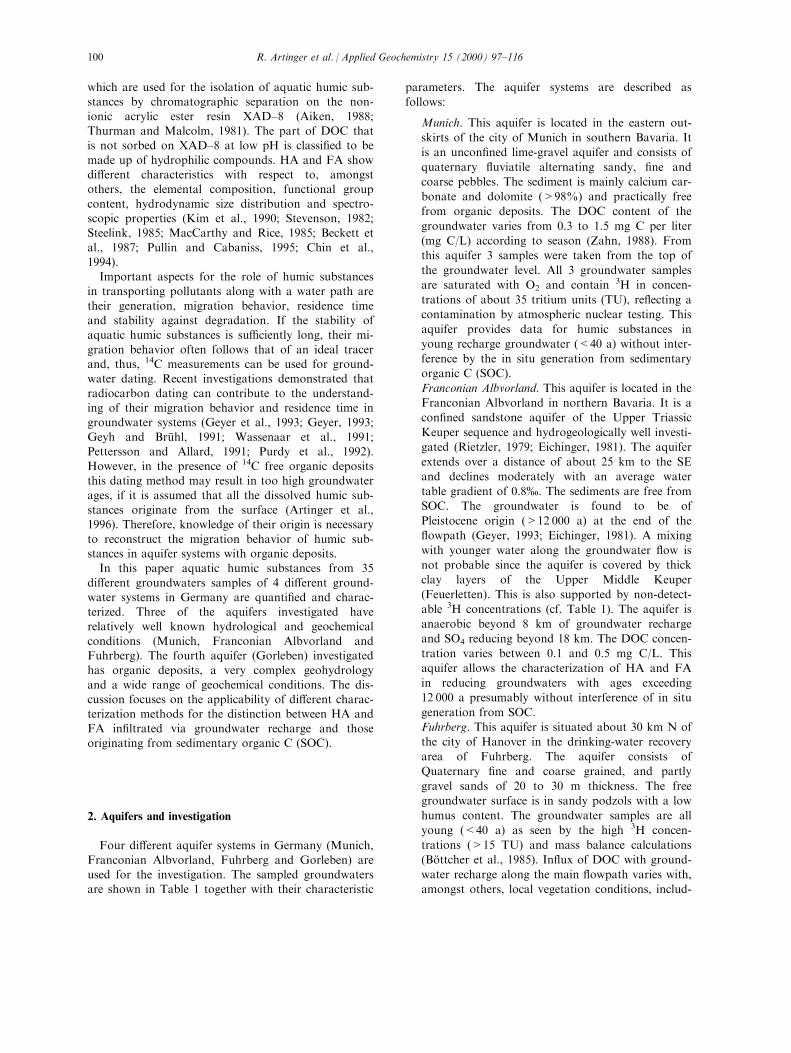
Fig. 1. Schematic description of setup for the enrichment and isolation of aquatic humic substances (from Artinger et al., 1996).
R. Artinger et al. / Applied Geochemistry 15 (2000) 97±116 101
Pleistocene peat deposits (BfS, 1990). Due to the largevariation of the DOC concentration and the assumed
large contribution of in situ generation from SOC es-pecially in some deep groundwaters, this aquifer o�ersthe possibility to study aquatic humic substances from
both recharge and SOC as well as mixtures of them.
3. Experimental
3.1. Enrichment and isolation of aquatic humic
substances
For the characterization of HA or FA, an amountof at least 100 mg of the isolated substance is required.
The principle scheme for preparing these HA and FAsamples from groundwater consists of (i) enrichment;(ii) isolation; and (iii) separation of HA and FA. For
enrichment and isolation of aquatic humic substancesa mobile ®eld operation system has been developed.For enrichment the developed system utilizes reverse
osmosis (RO) (Wilhelm Werner Co., Germany).Isolation is done by sorption on XAD±8 (Rohm andHaas Co., USA) at low pH (Thurman, 1985).
The mobile ®eld operation system for enrichmentand isolation of humic substances is described in Fig.1. This setup works automatically and allows the pro-cessing of 5000 L groundwater per day.
Simultaneously with the enrichment of DOC by RO, asmaller side stream of DOC concentrate is processedby acidi®cation and sorption of humic substances on
XAD±8. Thereby, build-up of the salt concentration inthe DOC concentrate is kept within acceptable limitsin order not to inhibit the RO process. Depending on
the chemical composition and DOC concentration ofgroundwater, the enrichment and isolation scheme ismodi®ed. At low salt concentrations and su�cientlyhigh DOC content, enrichment is conducted in the
®eld and the resulting 50 L of DOC concentrate isfurther processed in the laboratory. For high DOCgroundwaters enrichment by RO is not applied and for
channel brines the high salt concentration does notallow the application of RO. In the latter case, up to1000 L of groundwater are directly processed in the
®eld using a XAD±8 column of 8 L volume. Allgroundwaters are pre®ltered at 450 nm pore size toseparate the suspended particles. For waters with a
high Ca content an ion exchanger (Serdolit CSG,Serva Co., Germany) for water softening is addition-ally installed upstream of the RO to avoid calcite pre-cipitation at increasing Ca enrichment in the DOC
concentrate.Separation and processing of isolated humic sub-
stance are accomplished by standard procedures
(Buckau, 1991). After elution from XAD±8 with 0.1 MNaOH, HA ¯occulate is separated from FA by cen-
trifugation after acidi®cation to pH 1 (HCl). IsolatedHA is dispersed in 0.1 M HCl followed by separation
of supernatant via centrifugation. This washing pro-cedure is repeated 3 times. Finally HA is freeze-dried.The FA remainder in the acidic solution after separ-
ation of HA is puri®ed twice by sorption on XAD±8,followed by alkaline elution. Finally, FA is puri®ed bycation exchange over BIO REX 70 or AG MP±50
(BIO RAD Co., Germany) in order to remove theexcess salt prior to freeze drying.
3.2. Contamination due to sampling
Great care is taken with respect to possible contami-nation during sample enrichment, isolation and hand-
ling. This is a critical issue especially in view of thelow humic substance concentrations in many of thesampled groundwaters. For estimating the maximum
contamination, the impact on the 14C concentrationdue to the applied humic and fulvic acid samplingmethods is tested, using (i) a young 3H containing
granitic groundwater with low DOC concentration(<0.1 mg C/L) of high 14C concentration, and (ii) asolution containing humic acid with a very low 14C
concentration (Aldrich Co., Germany, 14C concen-tration approximately 1% modern C (pmc)). For thelarge ®eld sampling with the XAD±8 column, a smallincrease in the 14C concentration is found. Assuming a14C concentration of 137 pmc for the source of con-tamination, a total amount of an additional 0.11 mg Cduring isolation can be calculated. Such a 14C contami-
nation source corresponds to, for example, cellulosethat may originate from soxhlet treatment of XAD±8for its puri®cation. For enrichment and isolation of
aquatic humic substances by the ®eld sampling reverseosmosis system coupled with a small XAD±8 column,a small decrease of the 14C concentration is observed.It corresponds to a total contamination of 0.20 mg 14C
free C in the isolated humic substance. Using the ionexchanger for water softening of 660 L groundwater,the 14C concentration of isolated humic substance is
also reduced, corresponding to an addition of 0.9 mg14C free C. Contamination by 14C free C may originatefrom, for example, tubings, membranes or construction
parts of the apparatus of petrochemical origin. Theresults show that contamination of humic substancesduring enrichment, isolation and handling are of no
great importance for sample amounts of more than 20mg C.
3.3. Characterization methods
DOC is determined using the TOC analyzer Tocor 2(Maihak Co., Germany). The inorganic C of water
samples is removed by degasi®cation of CO2 with Arafter acidi®cation to pH 2.5±3. The DOC concen-
R. Artinger et al. / Applied Geochemistry 15 (2000) 97±116102

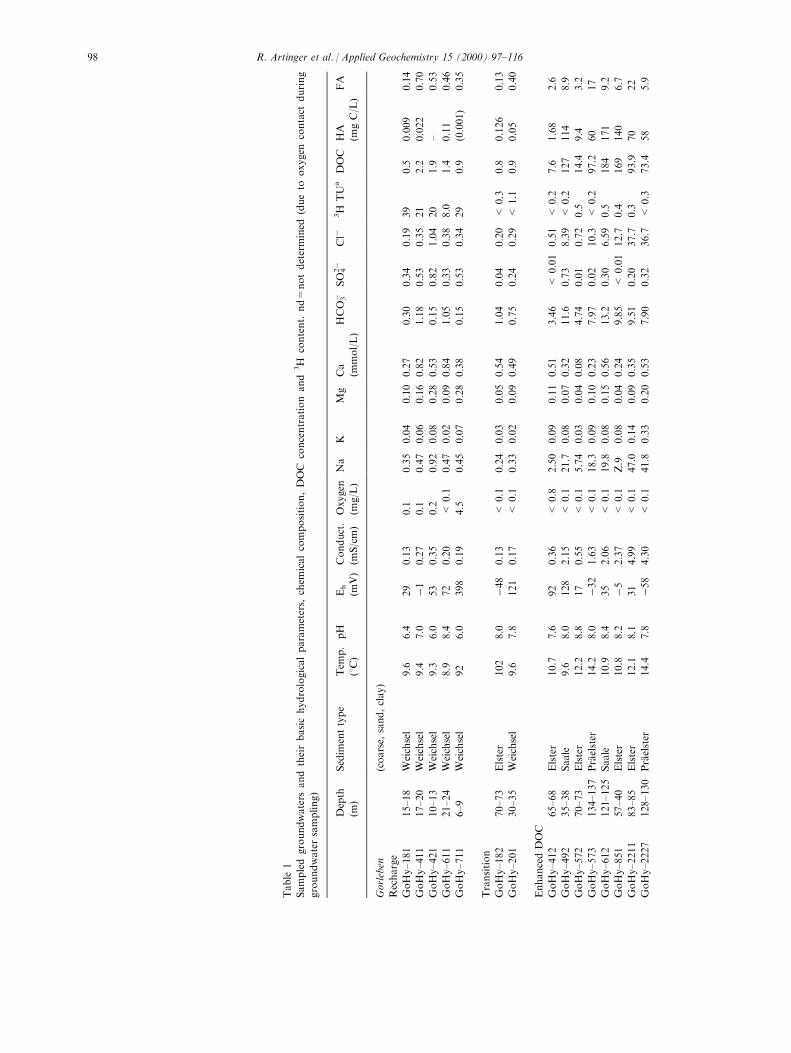
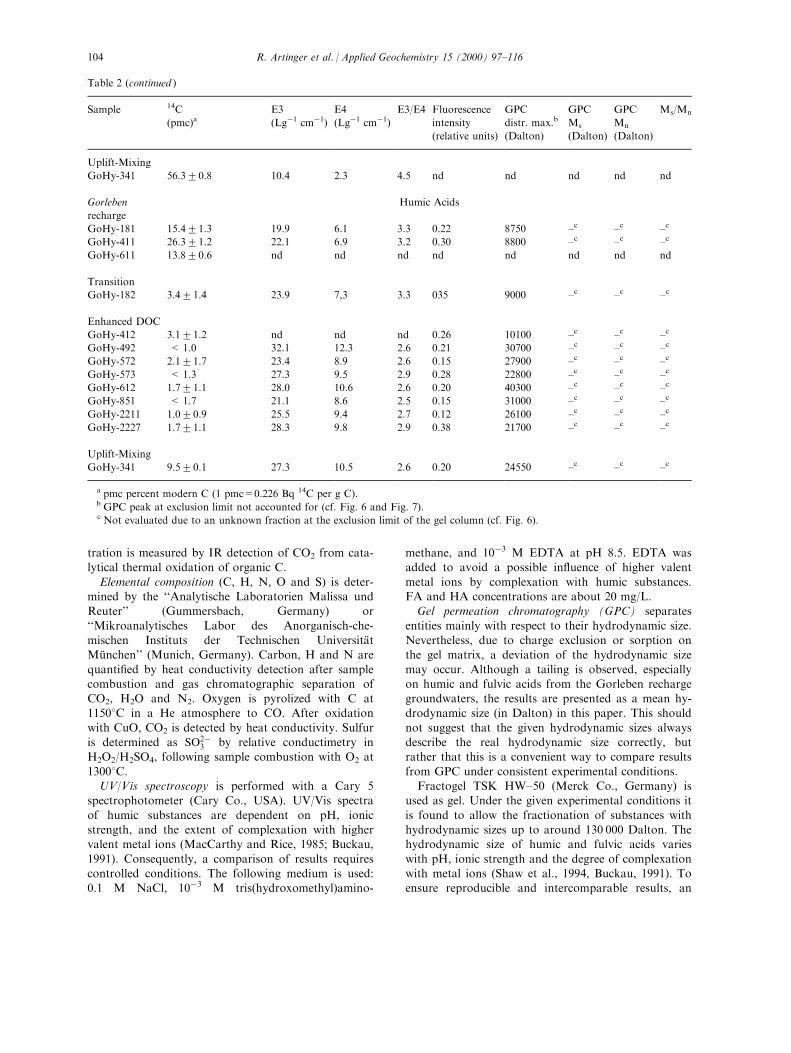
Table 2
Aquatic humic and fulvic acids isolated from the investigated groundwaters and their 14C concentration, speci®c absorption at 300
(E3) and 400 nm (E4), their ratio E3/E4, ¯uorescence intensity, gel permeation chromatography distribution (in Dalton: distri-
bution maximum, size average Ms and number average Mn), and their size ratio (Ms/Mn). nd=not determined (mainly due to lack
of sample amount); �: values from di�erent groundwater sampling occasions
Sample 14C
(pmc)aE3
(Lgÿ1 cmÿ1)E4
(Lgÿ1 cmÿ1)E3/E4 Fluorescence
intensity
(relative units)
GPC
distr. max.b
(Dalton)
GPC
Ms
(Dalton)
GPC
Mn
(Dalton)
Ms/Mn
Munich Fulvic acids
MS-UP-178 72.821.1 4.9 0.59 8.2 0.49 2900 2350 690 3.4
MS-U1-630 76.021.1 5.4 0.73 7.3 0.61 3100 2880 830 3.5
MS-KP-916 45.223.1 6.5 0.88 7.4 0.74 3750 3690 1080 3.4
Franconian Albvorland
Laibstadt 79.821.0 3.5 0.38 9.1 0.33 2450 1900 560 3.4
J-S-T III 29.321.9 nd nd nd nd 3000 1780 540 3.3
Greding I 15.621.3 nd nd 8.0 nd 3400 3710 860 4.3
Greding II 25.422.0 nd nd 6.7 nd 4850 2510 640 3.9
Beilngries 13.925.6 3.4 0.57 6.0 0.51 2950 3110 760 4.1
Fuhrberg
FF-OW 74.521.1 6.2 1.1 5.8 0.60 3750 3700 1040 3.6
FF-OA 85.021.2 8.6 1.5 5.8 1.34 5450 4670 1530 3.1
FF-T1-4 79.920.6 8.1 1.4 5.9 0.87 5450 4030 1120 3.6
FF-T3-11 117.322.3 6.4 1.0 6.6 nd 4100 3940 1220 3.2
FF-N5-12 85.321.3 8.1 1.4 5.7 0.68 5450 4050 970 4.2
FF-N10-4 80.321.1 9.9 1.8 5.5 0.90 4800 4180 1290 3.2
FF-N10-6 81.521.1 7.1 1.3 5.7 0.17 3400 2910 830 3.5
FF-N10-12 138.423.9 9.9 1.8 5.4 0.75 6950 5730 1290 4.4
FF-N10-14 119.222.1 10.4 1.9 5.3 1.05 5800 5440 1670 3.3
Gorleben
recharge
GoHy-181 75.921.2 6.6 1.2 5.8 0.43 4500 3490 790 4.4
GoHy-411 109.721.4 5.7 0.80 7.2 0.70 4300 3680 940 3.9
GoHy-421 92.521.5 6.4 1.0 6.2 0.56 3300 2750 770 3.6
GoHy-611 38.225.4 11.0 2.4 4.6 1.05 6250 5000 1380 3.6
GoHy-711 100.921.5 4.4 0.57 7.6 0.34 2450 2060 570 3.6
Transition
GoHy-182 46.121.2 7.0 1.4 6.0 1.01 7050 5130 1230 4.2
GoHy-201 58.622.4 7.9 1.6 4.9 0.70 6350 4810 1230 3.9
Enhanced DOC
GoHy-412 8.122.2 10.6 2.0 5.3 1.64 8200 7170 2090 3.4
GoHy-492 4.720.2 10.4 2.1 5.2 1.50 8250 7090 3400 2.1
GoHy-572 13.520.4/23.621.8� 10.4 2.1 4.9 1.34 8100 7740 2430 3.2
GoHy-573 7.023.2/ < 3.6� 14.9 3.6 4.2 1.89 9600 8120 3110 2.6
GoHy-612 26.722.3 12.1 2.2 6.2 1.97 8100 7120 2800 2.5
GoHy-851 11.320.4 12.0 2.7 4.5 1.35 9450 8330 3610 2.3
GoHy-2211 13.420.4 17.5 4.5 3.9 1.84 9350 8340 3310 2.5
GoHy-2227 10.623.3 16.4 3.7 4.4 1.82 9550 8080 3290 2.5
Channel brines
GoHy-193 46.821.1 4.2 0.77 6.6 0.65 7100 8220 2440 3.4
GoHy-514 20.321.3 5.8 0.87 6.7 1.12 6550 7390 1940 3.8
GoHy-653 40.021.3 3.9 0.55 7.2 0.70 6350 7280 2530 2.9
(continued on next page)
R. Artinger et al. / Applied Geochemistry 15 (2000) 97±116 103
tration is measured by IR detection of CO2 from cata-lytical thermal oxidation of organic C.
Elemental composition (C, H, N, O and S) is deter-mined by the ``Analytische Laboratorien Malissa undReuter'' (Gummersbach, Germany) or
``Mikroanalytisches Labor des Anorganisch-che-mischen Instituts der Technischen UniversitaÈ tMuÈ nchen'' (Munich, Germany). Carbon, H and N are
quanti®ed by heat conductivity detection after samplecombustion and gas chromatographic separation ofCO2, H2O and N2. Oxygen is pyrolized with C at11508C in a He atmosphere to CO. After oxidation
with CuO, CO2 is detected by heat conductivity. Sulfuris determined as SO2ÿ
3 by relative conductimetry inH2O2/H2SO4, following sample combustion with O2 at
13008C.UV/Vis spectroscopy is performed with a Cary 5
spectrophotometer (Cary Co., USA). UV/Vis spectra
of humic substances are dependent on pH, ionicstrength, and the extent of complexation with highervalent metal ions (MacCarthy and Rice, 1985; Buckau,
1991). Consequently, a comparison of results requirescontrolled conditions. The following medium is used:0.1 M NaCl, 10ÿ3 M tris(hydroxomethyl)amino-
methane, and 10ÿ3 M EDTA at pH 8.5. EDTA wasadded to avoid a possible in¯uence of higher valent
metal ions by complexation with humic substances.FA and HA concentrations are about 20 mg/L.Gel permeation chromatography (GPC) separates
entities mainly with respect to their hydrodynamic size.Nevertheless, due to charge exclusion or sorption onthe gel matrix, a deviation of the hydrodynamic size
may occur. Although a tailing is observed, especiallyon humic and fulvic acids from the Gorleben rechargegroundwaters, the results are presented as a mean hy-drodynamic size (in Dalton) in this paper. This should
not suggest that the given hydrodynamic sizes alwaysdescribe the real hydrodynamic size correctly, butrather that this is a convenient way to compare results
from GPC under consistent experimental conditions.Fractogel TSK HW±50 (Merck Co., Germany) is
used as gel. Under the given experimental conditions it
is found to allow the fractionation of substances withhydrodynamic sizes up to around 130 000 Dalton. Thehydrodynamic size of humic and fulvic acids varies
with pH, ionic strength and the degree of complexationwith metal ions (Shaw et al., 1994, Buckau, 1991). Toensure reproducible and intercomparable results, an
Table 2 (continued )
Sample 14C
(pmc)aE3
(Lgÿ1 cmÿ1)E4
(Lgÿ1 cmÿ1)E3/E4 Fluorescence
intensity
(relative units)
GPC
distr. max.b
(Dalton)
GPC
Ms
(Dalton)
GPC
Mn
(Dalton)
Ms/Mn
Uplift-Mixing
GoHy-341 56.320.8 10.4 2.3 4.5 nd nd nd nd nd
Gorleben Humic Acids
recharge
GoHy-181 15.421.3 19.9 6.1 3.3 0.22 8750 ±c ±c ±c
GoHy-411 26.321.2 22.1 6.9 3.2 0.30 8800 ±c ±c ±c
GoHy-611 13.820.6 nd nd nd nd nd nd nd nd
Transition
GoHy-182 3.421.4 23.9 7,3 3.3 035 9000 ±c ±c ±c
Enhanced DOC
GoHy-412 3.121.2 nd nd nd 0.26 10100 ±c ±c ±c
GoHy-492 < 1.0 32.1 12.3 2.6 0.21 30700 ±c ±c ±c
GoHy-572 2.121.7 23.4 8.9 2.6 0.15 27900 ±c ±c ±c
GoHy-573 < 1.3 27.3 9.5 2.9 0.28 22800 ±c ±c ±c
GoHy-612 1.721.1 28.0 10.6 2.6 0.20 40300 ±c ±c ±c
GoHy-851 < 1.7 21.1 8.6 2.5 0.15 31000 ±c ±c ±c
GoHy-2211 1.020.9 25.5 9.4 2.7 0.12 26100 ±c ±c ±c
GoHy-2227 1.721.1 28.3 9.8 2.9 0.38 21700 ±c ±c ±c
Uplift-Mixing
GoHy-341 9.520.1 27.3 10.5 2.6 0.20 24550 ±c ±c ±c
a pmc percent modern C (1 pmc=0.226 Bq 14C per g C).b GPC peak at exclusion limit not accounted for (cf. Fig. 6 and Fig. 7).c Not evaluated due to an unknown fraction at the exclusion limit of the gel column (cf. Fig. 6).
R. Artinger et al. / Applied Geochemistry 15 (2000) 97±116104
elution medium is chosen consisting of 0.1 M NaCl,0.05 M Na2HPO4, 10
ÿ3 M EDTA at pH 8.5 and 10
volume % of methanol. Samples of 20 to 100 mL areinjected with humic or fulvic acid concentrationsbetween 0.7 and 4.0 g/L. The elution pro®les are deter-
mined by absorption at 254 nm (Hewlett-Packard8452A diode array spectrophotometer).For calibration of the GPC column, the exclusion
volume is determined with Dextrane blue and the totalvolume with sodium azide. In the working range thecolumn is calibrated with globular proteins, namely,
Albumin (67 000 Dalton), Ovalbumin (43 000 Dalton),Ribonuclease (13 700 Dalton) and Cytochrome C(12 400 Dalton). The outcome of the GPC is character-ized by general properties of the elution pro®les, the
hydrodynamic size at maximum absorption, and thesize average (MS) and number average hydrodynamicsize (Mn). The latter two are evaluated in accordance
with Yau et al. (1979). Reproducibility is found to beapproximately 2500 Dalton for sizes around 10 000Dalton and approximately 22000 Dalton in the size
range around 30 000 Dalton (cf. GPC distributionmaximum of around 2500 to 10 000 Dalton for fulvicacids and about 10 000 to 30 000 Dalton for humic
acids (cf. Table 2)).Fluorescence spectroscopy is carried out in addition
to the absorption detection of the GPC elution pro-®les. The excitation wavelength for the ¯uorescence
measurement is 340 nm. The detection of the emitted¯uorescence light is made via optical ®ber using adiode array spectrophotometer IRY 700 GR
(Spectroscopy Instruments Co., USA) at 425 nm. The¯uorescence yield of humic substances is determinedby integration over the ¯uorescence signal of the whole
GPC elution pro®le.14C measurement on a sample amount of 0.5 g C or
more is made by conventional liquid scintillationcounting after combustion to CO2 followed by syn-
thesis of benzene (Eichinger et al., 1980). For the com-bustion method used, the maximum C contaminationis determined to be equivalent to 0.24 mg C with a 14C
concentration of 115 pmc. For smaller sampleamounts, accelerator mass spectrometry is used(Isotrace Laboratory, University of Toronto)
(Beukens, 1992). The 14C concentration is given inpmc (% modern C) referred to 94.9% of the activityconcentration of the NBS oxalic acid standard in 1950.
All given values are corrected with respect to theimpacts of sample handling.
4. Results and discussion
The results have been obtained for individual
groundwaters of di�erent aquifer systems.Groundwaters from the Gorleben aquifer are divided
into di�erent groups/areas based on their hydrologicaland geochemical characteristics, namely, (i) recharge
area with shallow groundwaters having 3H concen-trations of 8 TU or more; (ii) transition area with deepgroundwaters with no signi®cant 3H concentrations
(<1 TU); (iii) high salinity brines from the Gorlebenchannel; (iv) deep groundwaters with enhanced DOCconcentrations (between 7.6 and 169 mg C/L contrast-
ing with <3.2 mg C/L in non-enhanced DOC ground-waters; and (v) one near surface groundwater withenhanced DOC (GoHy±341) where young recharge
water is mixed with up-lifting water from the depth(`uplift-mixing'). Re¯ecting the important hydrologicaland geochemical di�erences, this classi®cation ofGorleben groundwaters is applied throughout this
paper.
4.1. DOC, humic acid, fulvic acid and 14C concentration
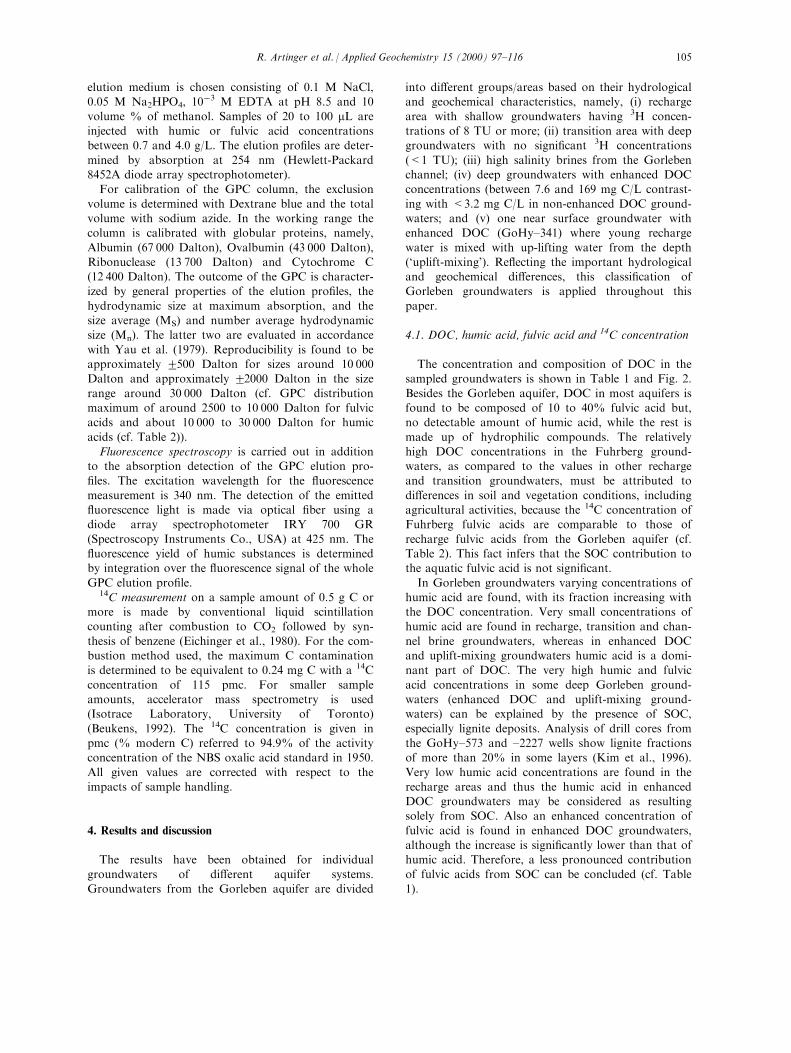
The concentration and composition of DOC in thesampled groundwaters is shown in Table 1 and Fig. 2.
Besides the Gorleben aquifer, DOC in most aquifers isfound to be composed of 10 to 40% fulvic acid but,no detectable amount of humic acid, while the rest is
made up of hydrophilic compounds. The relativelyhigh DOC concentrations in the Fuhrberg ground-waters, as compared to the values in other rechargeand transition groundwaters, must be attributed to
di�erences in soil and vegetation conditions, includingagricultural activities, because the 14C concentration ofFuhrberg fulvic acids are comparable to those of
recharge fulvic acids from the Gorleben aquifer (cf.Table 2). This fact infers that the SOC contribution tothe aquatic fulvic acid is not signi®cant.
In Gorleben groundwaters varying concentrations ofhumic acid are found, with its fraction increasing withthe DOC concentration. Very small concentrations ofhumic acid are found in recharge, transition and chan-
nel brine groundwaters, whereas in enhanced DOCand uplift-mixing groundwaters humic acid is a domi-nant part of DOC. The very high humic and fulvic
acid concentrations in some deep Gorleben ground-waters (enhanced DOC and uplift-mixing ground-waters) can be explained by the presence of SOC,
especially lignite deposits. Analysis of drill cores fromthe GoHy±573 and ±2227 wells show lignite fractionsof more than 20% in some layers (Kim et al., 1996).
Very low humic acid concentrations are found in therecharge areas and thus the humic acid in enhancedDOC groundwaters may be considered as resultingsolely from SOC. Also an enhanced concentration of
fulvic acid is found in enhanced DOC groundwaters,although the increase is signi®cantly lower than that ofhumic acid. Therefore, a less pronounced contribution
of fulvic acids from SOC can be concluded (cf. Table1).
R. Artinger et al. / Applied Geochemistry 15 (2000) 97±116 105
In Fig. 3 the 14C concentration of fulvic acids is rep-resented versus the fraction of humic acid of DOCthat is taken as an indicator for the in situ generation
of aquatic humic substances originating from SOC. Inthe deep enhanced DOC groundwaters, 14C concen-trations of fulvic acid are found to be typically below
20 pmc. These groundwaters are of Holocene origin(Artinger et al., 1996) and, therefore, between theirrecharge and present time, a maximum 14C decay ofapproximately 2 hal¯ives is possible. Considering that
recharge fulvic acid has 14C concentrations of around80 pmc (Artinger et al., 1996), a considerable contri-bution of fulvic acid from SOC seems reasonable. The
release of fulvic acid from SOC may be considerablenot only in deep groundwaters but also in young 3Hcontaining recharge groundwaters. This may be the
case in the recharge groundwater GoHy±611 whichshows a fulvic acid 14C concentration of 38 pmc aswell as a signi®cant contribution of humic acid to theDOC (8%).
In Fig. 3, the channel brine fulvic acids showdecreasing 14C concentrations although no humic acids
are found. The concentrations and characteristic prop-erties of the channel brine fulvic acids (cf. below) re-semble those of recharge fulvic acids and the 14C
concentrations re¯ect the expected groundwater age(Artinger et al., 1996). Therefore, an absence of fulvicacid from SOC can be assumed in the channel brines
and a decrease in the 14C concentration may be relatedto radioactive decay. In the uplift-mixing groundwaterGoHy±341, the speci®c hydrogeological and geochem-ical conditions result in a humic acid concentration
similar to the average value found in enhanced DOCgroundwaters, but the 14C concentration is rather simi-lar to the values in recharge and transition ground-
waters.To sum up, DOC, humic acid and fulvic acid con-
centrations as well as their 14C contents provide im-
portant information concerning the origin of aquatichumic and fulvic acids in di�erent groundwaters. Inthe Munich, Fuhrberg and Franconian Albvorlandaquifers, aquatic fulvic acid originates predominantly
from the humus horizon with no detectable amount ofaquatic humic acid. In Gorleben, and especially in
Fig. 2. DOC concentration and composition of investigated groundwaters.
R. Artinger et al. / Applied Geochemistry 15 (2000) 97±116106

some deep groundwaters, the release of aquatic humicand fulvic acids from SOC takes place in addition toaquatic fulvic acid from the soil horizon. The discus-
sion below is focused on the possibility of identifyingthe origin of aquatic humic and fulvic acids by theircharacteristic properties. Here, it should be borne in
mind that the extended residence time of aquatichumic substances in a given groundwater may changetheir characteristic properties due to the prevailing
physico-chemical conditions of the groundwater irre-spective of their origin.
4.2. Elemental composition of humic and fulvic acids
The elemental composition (C, H, O, N and S) of
the humic and fulvic acids investigated are shown inTable 3. The individual values are normalized to thesum of the elements analyzed and referred to dried
substances. The results re¯ect the generally founddi�erences between humic and fulvic acids, namely, thehigher C and lower O content of humic acids as com-
pared to fulvic acids (Steelink, 1985; Pettersson et al.,1994). The element ratios of H/C and O/C are lower in
Fig. 3. 14C concentration of Gorleben fulvic acids plotted versus the fraction of DOC consisting of humic acid.
Table 3
Elemental composition as well as H/C and O/C ratios of isolated aquatic humic and fulvic acids from di�erent aquifers. Samples
from the Gorleben aquifer are additionally arranged according to hydrogeological/geochemical aspects. The numbers of samples
studied are given in brackets
Aquifer C (%) H (%) O (%) N (%) S (%) H/C O/C
Munich FA (3) 52.220.6 4.420.2 37.721.2 1.220.1 4.520.8 1.0120.06 0.5420.03
Franconian Alb. FA (4) 56.322.1 6.120.5 35.323.2 0.720.2 2.021.0 1.3120.09 0.4720.06
Fuhrberg FA (9) 52.424.0 4.520.5 38.724.0 1.020.5 3.521.6 1.0220.09 0.5620.11
Gorleben FA
Recharge area (5) 54.622.8 5.020.6 38.321.6 0.520.1 ± 1.1020.09 0.5320.04
Transition area (2) 53.020.1 4.620.8 38.124.1 1.020.3 ± 1.0420.17 0.5920.06
Enhanced DOC (8) 53.022.2 4.320.5 39.922.4 1.620.5 2.322.0 0.9820.12 0.5720.05
Channel brines (3) 51.321.9 5.320.2 42.721.7 0.520.2 ± 1.2320.01 0.6320.05
Gorleben HA
Recharge area (1) 55.0 4.4 36.1 1.7 2.9 0.96 0.49
Transition area (2) 56.821.0 4.420.3 34.421.1 2.520.8 1.921.0 0.9420.09 0.4520.01
Enhanced DOC (8) 58.621.6 4.820.4 33.120.8 2.320.9 1.220.7 0.9820.09 0.4220.02
Uplift-Mixing (1) 57.4 5.1 34.8 1.12 1.6 1.07 0.45
± : large scatter in data including results below detection limit.
R. Artinger et al. / Applied Geochemistry 15 (2000) 97±116 107
aquatic humic acids than in aquatic fulvic acids. Thisis due to the enhanced aromatic entities of humic acid
(Steelink, 1985; Pettersson et al., 1994). On the otherhand, humic acid from humus is reported to have ahigher O/C ratio than humic acid from peat/lignite
(Steelink, 1985).Fulvic acids from young recharge groundwaters with
or without a minor in¯uence of SOC (Munich,
Fuhrberg and the Gorleben recharge area) and fromthe Gorleben transition area show very similar H/Cand O/C ratios. Fulvic acids from the Franconian
Albvorland aquifer with progressively reducing con-ditions along with the main ¯owpath (groundwaterages exceeding 12 000 a), show a lower O/C ratio anda higher H/C ratio. This may be the result of advanced
chemical or microbiological degradation, leading to areduced O content (De Haan, 1983). Fulvic acids fromthe channel brines exhibit relatively high H/C and O/C
ratios. Whether or not this result re¯ects a selectiveionic strength driven precipitation of fulvic acids withless O-containing hydrophilic functional groups and a
higher content of aromatic groups cannot be ascer-tained. For the Gorleben enhanced DOC groundwatersthe H/C and O/C ratios do not deviate signi®cantly
from the values of recharge and transition waters.Regarding humic acids the data are available only forthe enhanced DOC groundwaters and thus no con-clusion can be drawn from the elemental composition.
To sum up, the elemental composition does not pro-vide information on the presence of humic and fulvicacids which might originate from SOC. The di�erences
observed may rather re¯ect the geochemical conditions,such as the ionic strength driven selective precipitationor impact of redox variations over extended periods of
time.
4.3. UV/Vis spectroscopy
UV/Vis spectroscopy is commonly used for thecharacterization of humic substances (Schnitzer, 1978;Stevenson, 1982; MacCarthy and Rice, 1985). The
spectra of humic substances show an increasingabsorption with decreasing wavelength without charac-teristic features. The characterization is made by either
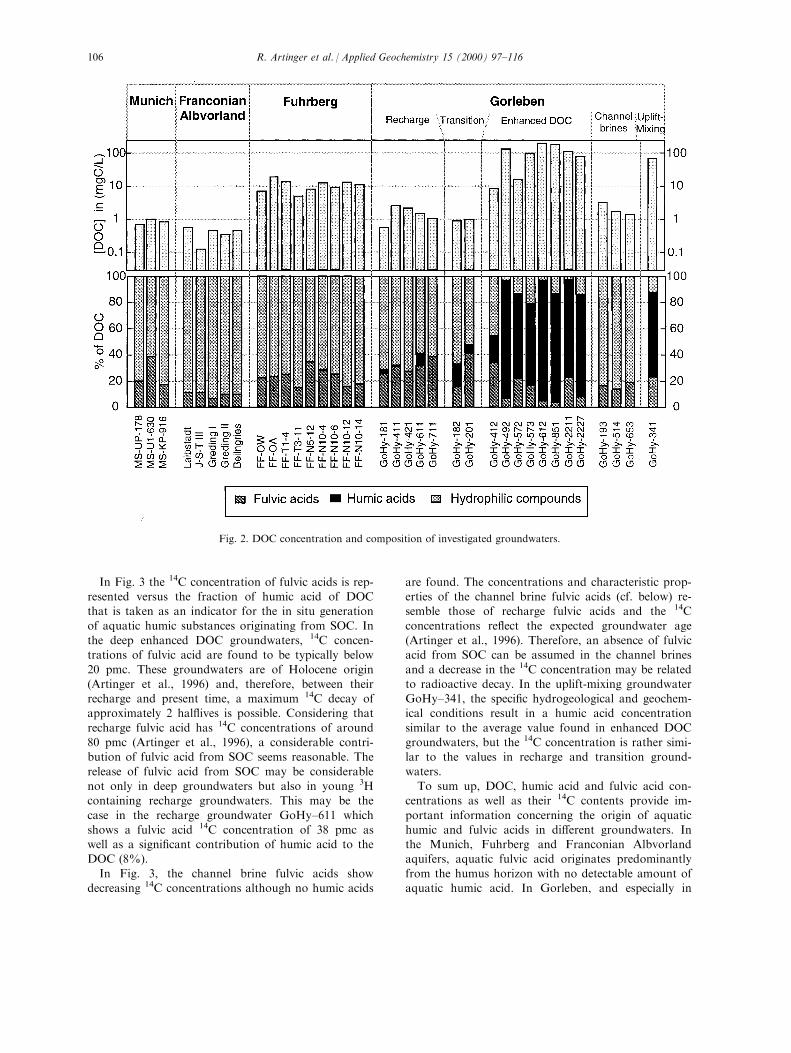
the speci®c absorption at one wavelength (Petterson etal., 1994; Kukkonen, 1992; Pennanen, 1972) or theabsorption ratio at two wavelengths for a qualitative
description of the curvature of the absorption conti-nuum (Chin et al., 1994; Kukkonen, 1992; De Haan,1983; Stevenson, 1982). In this work, absorptions at300 and 400 nm (E3 and E4, respectively) are used as
well as their ratio (E3/E4). These wavelengths areselected for their low impact of background compen-sation and, consequently, good reproducibility. Due to
the high molecular weight and colloidal form of thedissolved humic substances, the absorption spectrum
includes the e�ect of light scattering (Power and
Langford, 1988; Wylie and Lai, 1986; Pennanen,1972).The results of UV/Vis spectroscopy are shown in
Table 2. In Fig. 4 the speci®c absorption (in L/gÿ1
cmÿ1) of humic and fulvic acids at 300 nm and 400 nmis plotted versus the absorption ratio E3/E4. These two
properties vary over a wide range and show the follow-ing tendency: the higher the speci®c absorption, thelower is the E3/E4 absorption ratio for humic and ful-vic acids. Following the published results (Chin et al.,
1994; Kukkonen, 1992; Traina et al., 1990; Gauthier etal., 1987), an increase in the speci®c absorption and adecrease in the absorption ratio are indicative of an
increasing humi®cation, aromaticity and molecularweight of humic substances. A fundamental di�erenceis not observed between the absorption ratio of 465 to
665 nm, often cited in the literature, and the E3/E4ratio used. In Fig. 5 the average speci®c absorption at300 nm (E3) is plotted versus the average absorption
ratio of 300 and 400 nm (E3/E4) for humic and fulvicacids separated into di�erent groups of groundwaters.A signi®cant di�erence is observed to exist betweenhumic and fulvic acids as well as among the humic or
fulvic acids.As a general trend for both humic and fulvic acids,
the speci®c absorption is increasing and the E3/E4
ratio is decreasing in the order of recharge, transition,enhanced DOC. Fulvic acids from Gorleben channelbrines as well as from Munich and the Franconian
Albvorland aquifers resemble the Gorleben rechargefulvic acids. In contrast to this, Fuhrberg fulvic acids
Fig. 4. Speci®c absorption at 300 nm (E3) and 400 nm (E4)
plotted versus their ratio (E3/E4) for investigated humic and
fulvic acids.
R. Artinger et al. / Applied Geochemistry 15 (2000) 97±116108
resemble Gorleben transition fulvic acids. Fulvic acids
from the recharge groundwater GoHy±611 and theuplift-mixing groundwater GoHy±341 resemble theenhanced DOC fulvic acids. In the Franconian
Albvorland the E3/E4 ratio shows a decrease withincreasing distance from recharge along the main ¯owdirection to the most distant downstream well of
Beilngries. According to the 14C dating of dissolvedinorganic C in the Franconian Abvorland aquifer, thegroundwater in the Beilngries well is of Pleistocenceorigin (Geyer et al., 1993). Furthermore, the redox po-
tential changes from 594 mV to ÿ41 mV from therecharge to Beilngries. This could be an indication foran impact of the residence time on the spectroscopic
properties or changes with the geochemical environ-ment. The range of E3/E4 ratios, as observed for theFranconian Albvorland water, is comparable with the
recharge waters of Gorleben and Munich.Furthermore, fulvic acids from the young near-surfaceFuhrberg groundwaters with no reducing conditionsare found to have lower E3/E4 ratios than those from
other recharge groundwaters and from the reducingFranconian Albvorland aquifer.In the Gorleben young (<40 a) recharge ground-
water GoHy±611 containing 3H, the 14C concentrationof fulvic acid and E3/E4 ratio are signi®cantly lowerthan in other young recharge groundwaters. The 14C
concentration is about half to one third of the concen-
tration found in fulvic acids from other recharge
waters, while the UV/Vis absorption properties re-semble fulvic acids from enhanced DOC groundwaters.In this case, it may be assumed that the origin, i.e.,
release of fulvic acid from SOC, is the governing factorfor the spectroscopic properties rather than local geo-chemical conditions.
Therefore, it may be concluded that the UV/Visabsorption properties of aquatic humic and fulvicacids depend on both the origin, including di�erencesin recharge conditions, and to a lesser extent on the
prevailing geochemical conditions in the groundwater.Consequently, the UV/Vis spectroscopic properties ofaquatic humic substances may be useful to identify
their origin.
4.4. Gel-permeation chromatography (GPC)
Some representative GPC chromatograms ofGorleben groundwaters are shown in Fig. 6. In allcases, some degree of tailing is observed, which is
more pronounced for humic and fulvic acids fromrecharge and transition groundwaters and, thus, cau-tion is necessary when interpreting the hydrodynamic
size. With respect to humic acids from di�erent groupsof Gorleben groundwaters, di�erences occur in (i) theoverall elution peak area; (ii) the position of the
elution pro®le in the working range of GPC; and (iii)
Fig. 5. Speci®c absorption at 300 nm (E3) plotted versus the absorption ratio E3/E4 of isolated humic and fulvic acids arranged
according to the di�erent groups of investigated groundwaters. The fulvic acid of the recharge groundwater GoHy-611 is shown
separately.
R. Artinger et al. / Applied Geochemistry 15 (2000) 97±116 109
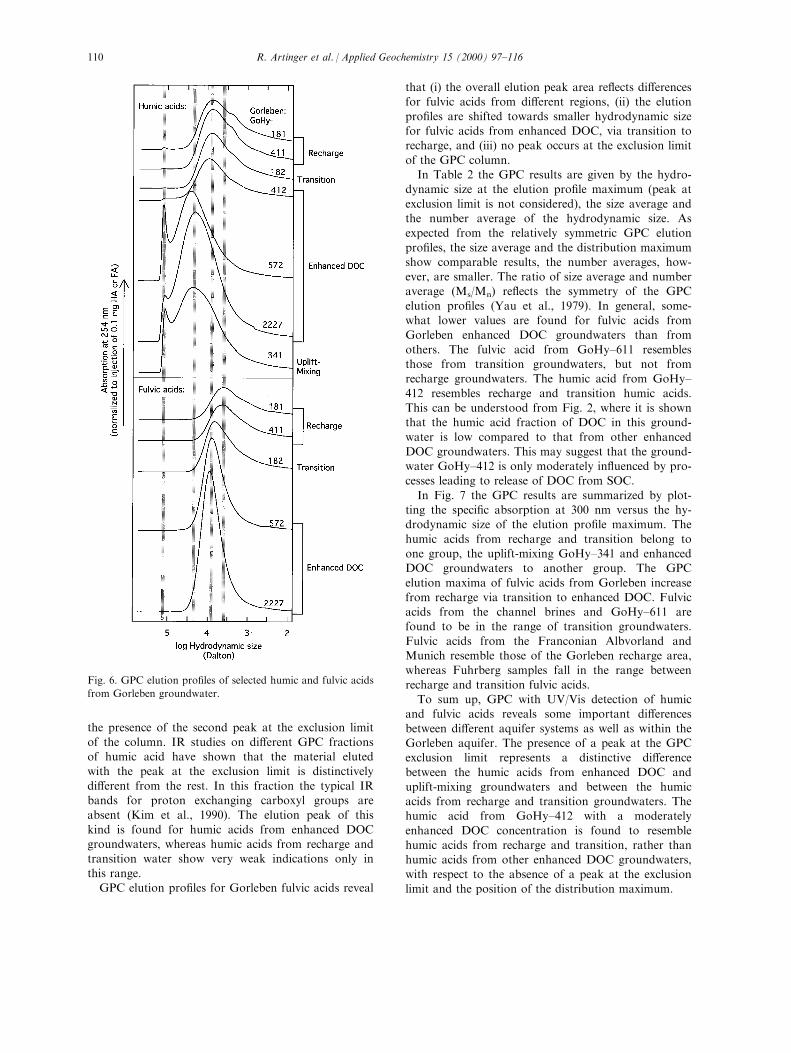
the presence of the second peak at the exclusion limit
of the column. IR studies on di�erent GPC fractionsof humic acid have shown that the material elutedwith the peak at the exclusion limit is distinctively
di�erent from the rest. In this fraction the typical IRbands for proton exchanging carboxyl groups areabsent (Kim et al., 1990). The elution peak of this
kind is found for humic acids from enhanced DOCgroundwaters, whereas humic acids from recharge andtransition water show very weak indications only in
this range.GPC elution pro®les for Gorleben fulvic acids reveal
that (i) the overall elution peak area re¯ects di�erencesfor fulvic acids from di�erent regions, (ii) the elution
pro®les are shifted towards smaller hydrodynamic sizefor fulvic acids from enhanced DOC, via transition torecharge, and (iii) no peak occurs at the exclusion limit
of the GPC column.In Table 2 the GPC results are given by the hydro-
dynamic size at the elution pro®le maximum (peak at
exclusion limit is not considered), the size average andthe number average of the hydrodynamic size. Asexpected from the relatively symmetric GPC elution
pro®les, the size average and the distribution maximumshow comparable results, the number averages, how-ever, are smaller. The ratio of size average and numberaverage (Ms/Mn) re¯ects the symmetry of the GPC
elution pro®les (Yau et al., 1979). In general, some-what lower values are found for fulvic acids fromGorleben enhanced DOC groundwaters than from
others. The fulvic acid from GoHy±611 resemblesthose from transition groundwaters, but not fromrecharge groundwaters. The humic acid from GoHy±
412 resembles recharge and transition humic acids.This can be understood from Fig. 2, where it is shownthat the humic acid fraction of DOC in this ground-
water is low compared to that from other enhancedDOC groundwaters. This may suggest that the ground-water GoHy±412 is only moderately in¯uenced by pro-cesses leading to release of DOC from SOC.
In Fig. 7 the GPC results are summarized by plot-ting the speci®c absorption at 300 nm versus the hy-drodynamic size of the elution pro®le maximum. The
humic acids from recharge and transition belong toone group, the uplift-mixing GoHy±341 and enhancedDOC groundwaters to another group. The GPC
elution maxima of fulvic acids from Gorleben increasefrom recharge via transition to enhanced DOC. Fulvicacids from the channel brines and GoHy±611 arefound to be in the range of transition groundwaters.
Fulvic acids from the Franconian Albvorland andMunich resemble those of the Gorleben recharge area,whereas Fuhrberg samples fall in the range between
recharge and transition fulvic acids.To sum up, GPC with UV/Vis detection of humic
and fulvic acids reveals some important di�erences
between di�erent aquifer systems as well as within theGorleben aquifer. The presence of a peak at the GPCexclusion limit represents a distinctive di�erence
between the humic acids from enhanced DOC anduplift-mixing groundwaters and between the humicacids from recharge and transition groundwaters. Thehumic acid from GoHy±412 with a moderately
enhanced DOC concentration is found to resemblehumic acids from recharge and transition, rather thanhumic acids from other enhanced DOC groundwaters,
with respect to the absence of a peak at the exclusionlimit and the position of the distribution maximum.
Fig. 6. GPC elution pro®les of selected humic and fulvic acids
from Gorleben groundwater.
R. Artinger et al. / Applied Geochemistry 15 (2000) 97±116110

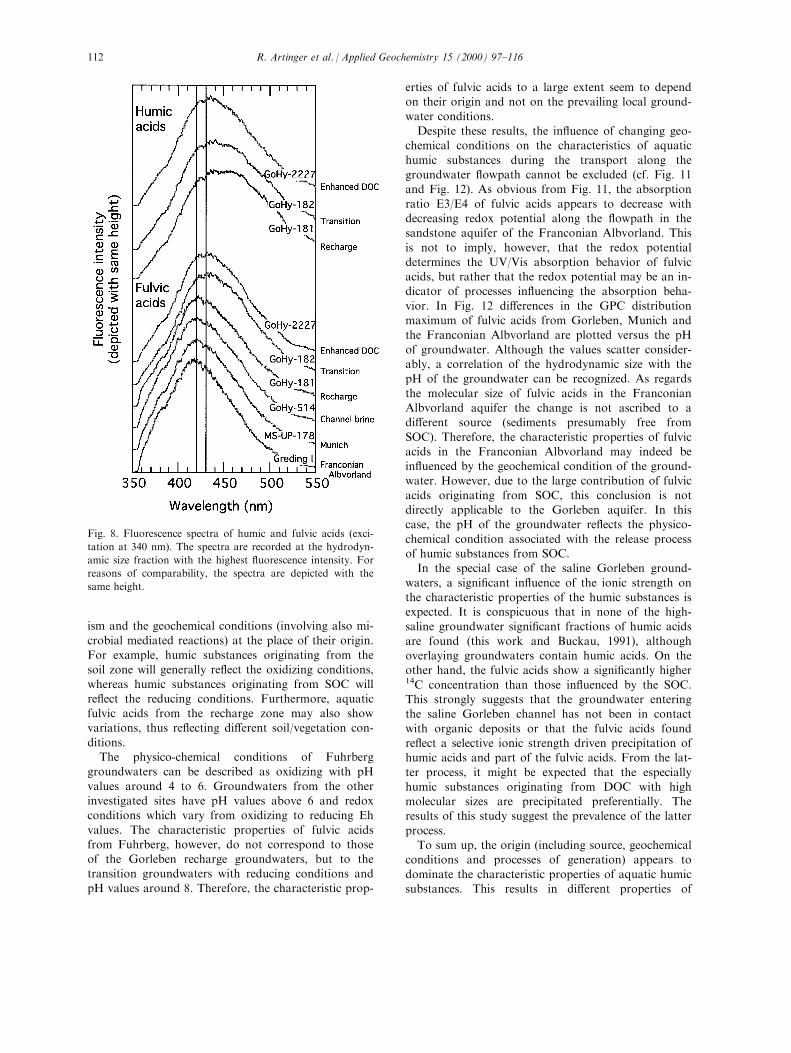
4.5. Fluorescence spectroscopy
The results obtained from the characterization by¯uorescence spectroscopy are given in Table 2. Someexamples of ¯uorescence spectra are shown in Fig. 8.The spectra possess the general characteristics of
aquatic humic substances (Hayase and Tsubota, 1985;Miano et al., 1988; Visser, 1983). For ¯uorescencespectra of humic acids from recharge via transition to
enhanced DOC groundwaters, a decrease of theshoulder at the higher wavelength of the spectra canbe observed. The fulvic acids show similar spectra for
the Franconian Albvorland, Munich and Gorlebenchannel brine and recharge groundwaters, whereas thespectra for FA from transition and enhanced DOC
groundwaters with a higher hydrodynamic size areslightly shifted towards a longer wavelength. Theseresults are in accordance with the bathochromic shiftobserved for HA and FA fractions of di�erent hydro-
dynamic size, as obvious for GoHy±411 in Fig. 9. Thesame behavior has been found by Jones and Indig(1996) for di�erent fractions of Aldrich humic acid
(Aldrich Co.). The correlation between the ¯uorescencespectra and the hydrodynamic size of fulvic acids indi-cates that the ¯uorescence spectra may also provide
some information about the origin of humic sub-stances.Somewhat more distinct di�erences can be seen in
the ¯uorescence intensity (see Fig. 10). In general, the¯uorescence intensity of humic acid is lower than of
fulvic acid. While humic acids from di�erent types ofGorleben groundwaters cannot be distinguished fromone another, fulvic acids from enhanced DOC ground-waters have a considerably higher ¯uorescence inten-
sity than other fulvic acids. The ¯uorescence intensitiesof fulvic acids from Fuhrberg, Munich and Gorlebentransition and channel brine groundwaters are compar-
able with the values for Gorleben recharge andFranconian Albvorland fulvic acids. As expected fromthe above discussions concerning the fulvic acid
GoHy±611, the ¯uorescence behavior indicates anadmixture of fulvic acids originating from SOC, as thisis done by the DOC composition, 14C concentration,
UV/Vis absorption and the hydrodynamic size.Therefore, ¯uorescence spectroscopy could be an ad-ditional tool for determining the origin of fulvic acids.
4.6. In¯uence of physico-chemical/geochemicalconditions
The above discussion has shown that a characteriz-ation may be useful to distinguish humic and fulvicacids from di�erent aquifers, but also from di�erent
sources within an aquifer system, such as Gorleben.The characteristic properties of aquatic humic sub-stances may re¯ect the source, the generation mechan-
Fig. 7. Speci®c absorption at 300 nm (E3) plotted versus the GPC elusion pro®le maximum of isolated humic and fulvic acids
arranged according to the di�erent groups of investigated groundwaters. The humic acid peak at the exclusion limit of the GPC
column is not accounted for. The fulvic acid of the recharge groundwater GoHy-611 is shown separately.
R. Artinger et al. / Applied Geochemistry 15 (2000) 97±116 111
ism and the geochemical conditions (involving also mi-
crobial mediated reactions) at the place of their origin.For example, humic substances originating from thesoil zone will generally re¯ect the oxidizing conditions,
whereas humic substances originating from SOC willre¯ect the reducing conditions. Furthermore, aquaticfulvic acids from the recharge zone may also showvariations, thus re¯ecting di�erent soil/vegetation con-
ditions.The physico-chemical conditions of Fuhrberg
groundwaters can be described as oxidizing with pH
values around 4 to 6. Groundwaters from the otherinvestigated sites have pH values above 6 and redoxconditions which vary from oxidizing to reducing Eh
values. The characteristic properties of fulvic acidsfrom Fuhrberg, however, do not correspond to thoseof the Gorleben recharge groundwaters, but to thetransition groundwaters with reducing conditions and
pH values around 8. Therefore, the characteristic prop-
erties of fulvic acids to a large extent seem to dependon their origin and not on the prevailing local ground-
water conditions.Despite these results, the in¯uence of changing geo-
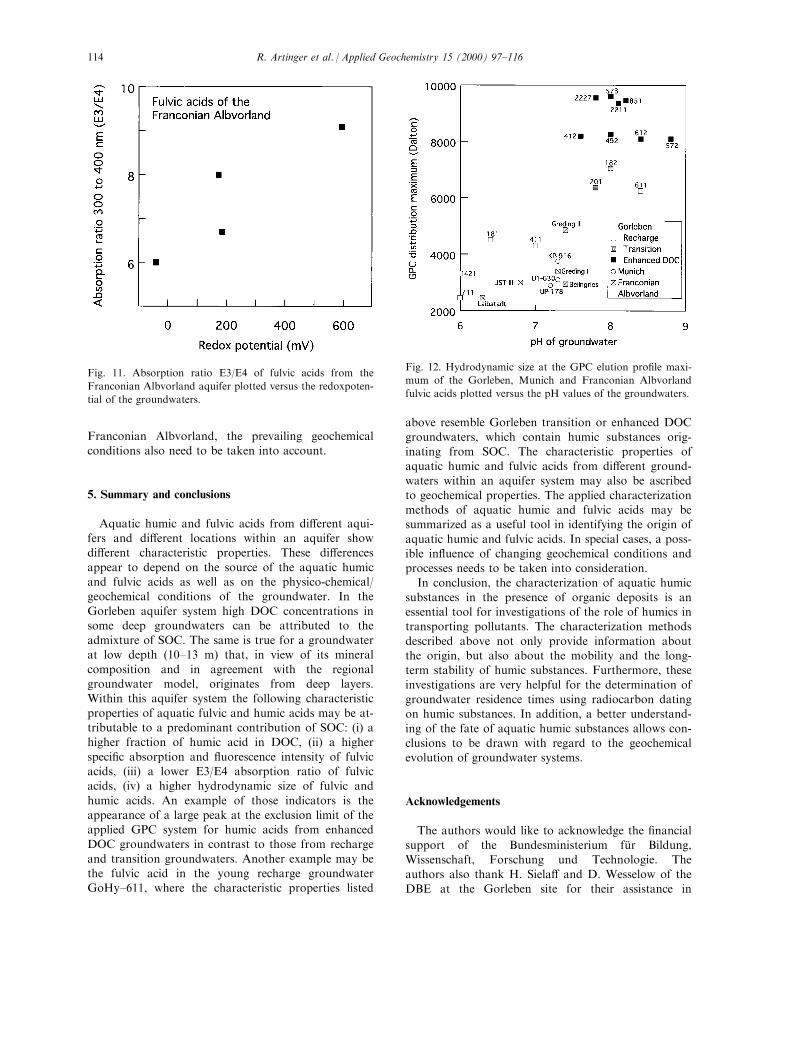
chemical conditions on the characteristics of aquatic
humic substances during the transport along thegroundwater ¯owpath cannot be excluded (cf. Fig. 11and Fig. 12). As obvious from Fig. 11, the absorption
ratio E3/E4 of fulvic acids appears to decrease withdecreasing redox potential along the ¯owpath in thesandstone aquifer of the Franconian Albvorland. This
is not to imply, however, that the redox potentialdetermines the UV/Vis absorption behavior of fulvicacids, but rather that the redox potential may be an in-dicator of processes in¯uencing the absorption beha-
vior. In Fig. 12 di�erences in the GPC distributionmaximum of fulvic acids from Gorleben, Munich andthe Franconian Albvorland are plotted versus the pH
of groundwater. Although the values scatter consider-ably, a correlation of the hydrodynamic size with thepH of the groundwater can be recognized. As regards
the molecular size of fulvic acids in the FranconianAlbvorland aquifer the change is not ascribed to adi�erent source (sediments presumably free from
SOC). Therefore, the characteristic properties of fulvicacids in the Franconian Albvorland may indeed bein¯uenced by the geochemical condition of the ground-water. However, due to the large contribution of fulvic
acids originating from SOC, this conclusion is notdirectly applicable to the Gorleben aquifer. In thiscase, the pH of the groundwater re¯ects the physico-
chemical condition associated with the release processof humic substances from SOC.In the special case of the saline Gorleben ground-
waters, a signi®cant in¯uence of the ionic strength onthe characteristic properties of the humic substances isexpected. It is conspicuous that in none of the high-saline groundwater signi®cant fractions of humic acids
are found (this work and Buckau, 1991), althoughoverlaying groundwaters contain humic acids. On theother hand, the fulvic acids show a signi®cantly higher14C concentration than those in¯uenced by the SOC.This strongly suggests that the groundwater enteringthe saline Gorleben channel has not been in contact
with organic deposits or that the fulvic acids foundre¯ect a selective ionic strength driven precipitation ofhumic acids and part of the fulvic acids. From the lat-
ter process, it might be expected that the especiallyhumic substances originating from DOC with highmolecular sizes are precipitated preferentially. Theresults of this study suggest the prevalence of the latter
process.To sum up, the origin (including source, geochemical
conditions and processes of generation) appears to
dominate the characteristic properties of aquatic humicsubstances. This results in di�erent properties of
Fig. 8. Fluorescence spectra of humic and fulvic acids (exci-
tation at 340 nm). The spectra are recorded at the hydrodyn-
amic size fraction with the highest ¯uorescence intensity. For
reasons of comparability, the spectra are depicted with the
same height.
R. Artinger et al. / Applied Geochemistry 15 (2000) 97±116112
aquatic fulvic acids from di�erent aquifer systems as
well as di�erent sources (soil zone versus peat/browncoal deposits) within the Gorleben aquifer. However,
under special geochemical conditions like the saline
Gorleben groundwaters or changes in geochemical con-ditions over extended time periods, as in the
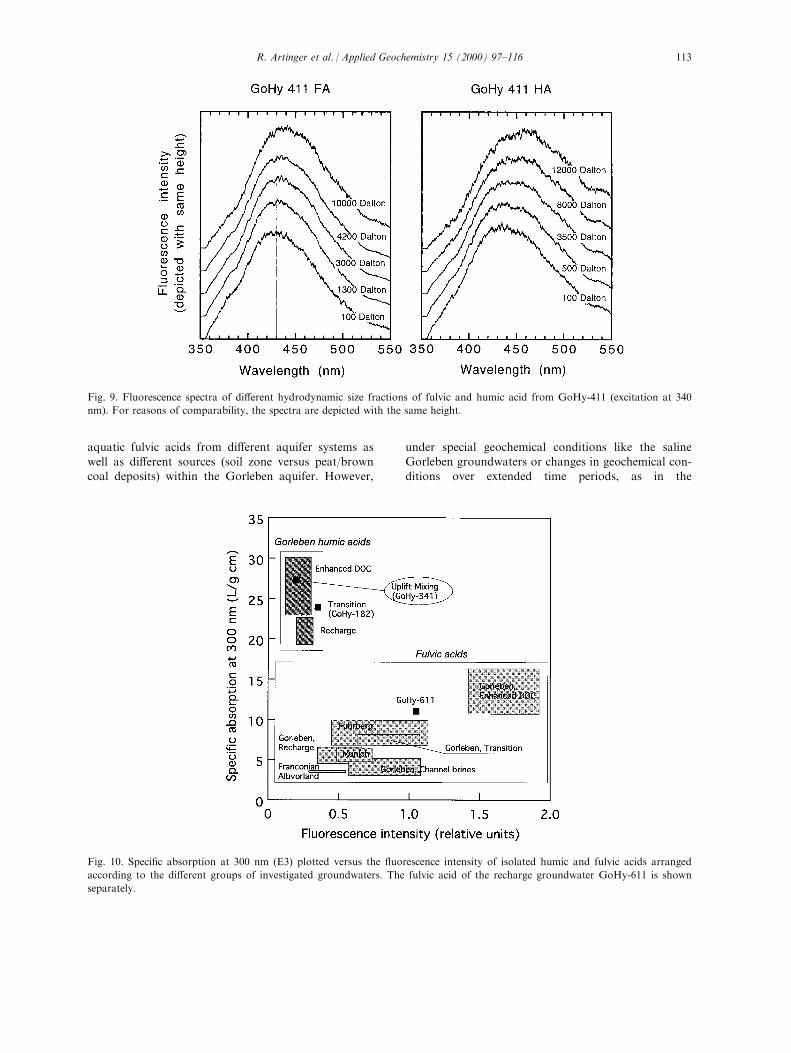
Fig. 9. Fluorescence spectra of di�erent hydrodynamic size fractions of fulvic and humic acid from GoHy-411 (excitation at 340
nm). For reasons of comparability, the spectra are depicted with the same height.
Fig. 10. Speci®c absorption at 300 nm (E3) plotted versus the ¯uorescence intensity of isolated humic and fulvic acids arranged
according to the di�erent groups of investigated groundwaters. The fulvic acid of the recharge groundwater GoHy-611 is shown
separately.
R. Artinger et al. / Applied Geochemistry 15 (2000) 97±116 113
Franconian Albvorland, the prevailing geochemicalconditions also need to be taken into account.
5. Summary and conclusions
Aquatic humic and fulvic acids from di�erent aqui-fers and di�erent locations within an aquifer showdi�erent characteristic properties. These di�erences
appear to depend on the source of the aquatic humicand fulvic acids as well as on the physico-chemical/geochemical conditions of the groundwater. In the
Gorleben aquifer system high DOC concentrations insome deep groundwaters can be attributed to theadmixture of SOC. The same is true for a groundwaterat low depth (10±13 m) that, in view of its mineral
composition and in agreement with the regionalgroundwater model, originates from deep layers.Within this aquifer system the following characteristic
properties of aquatic fulvic and humic acids may be at-tributable to a predominant contribution of SOC: (i) ahigher fraction of humic acid in DOC, (ii) a higher
speci®c absorption and ¯uorescence intensity of fulvicacids, (iii) a lower E3/E4 absorption ratio of fulvicacids, (iv) a higher hydrodynamic size of fulvic and
humic acids. An example of those indicators is theappearance of a large peak at the exclusion limit of theapplied GPC system for humic acids from enhancedDOC groundwaters in contrast to those from recharge
and transition groundwaters. Another example may bethe fulvic acid in the young recharge groundwaterGoHy±611, where the characteristic properties listed
above resemble Gorleben transition or enhanced DOC
groundwaters, which contain humic substances orig-inating from SOC. The characteristic properties ofaquatic humic and fulvic acids from di�erent ground-waters within an aquifer system may also be ascribed
to geochemical properties. The applied characterizationmethods of aquatic humic and fulvic acids may besummarized as a useful tool in identifying the origin of
aquatic humic and fulvic acids. In special cases, a poss-ible in¯uence of changing geochemical conditions andprocesses needs to be taken into consideration.
In conclusion, the characterization of aquatic humicsubstances in the presence of organic deposits is anessential tool for investigations of the role of humics intransporting pollutants. The characterization methods
described above not only provide information aboutthe origin, but also about the mobility and the long-term stability of humic substances. Furthermore, these
investigations are very helpful for the determination ofgroundwater residence times using radiocarbon datingon humic substances. In addition, a better understand-
ing of the fate of aquatic humic substances allows con-clusions to be drawn with regard to the geochemicalevolution of groundwater systems.
Acknowledgements
The authors would like to acknowledge the ®nancialsupport of the Bundesministerium fuÈ r Bildung,Wissenschaft, Forschung und Technologie. The
authors also thank H. Siela� and D. Wesselow of theDBE at the Gorleben site for their assistance in
Fig. 11. Absorption ratio E3/E4 of fulvic acids from the
Franconian Albvorland aquifer plotted versus the redoxpoten-
tial of the groundwaters.
Fig. 12. Hydrodynamic size at the GPC elution pro®le maxi-
mum of the Gorleben, Munich and Franconian Albvorland
fulvic acids plotted versus the pH values of the groundwaters.
R. Artinger et al. / Applied Geochemistry 15 (2000) 97±116114
groundwater sampling, C. Kardinal and H. Halder forassistance in the DOC sample preparation and charac-
terization, and F. Scherbaum for assistance in the ¯u-orescence measurement. The isotope measurementswere carried out under the supervision of W. Rauert
and P. Trimborn.
References
Aiken, G.R., 1988. A critical evaluation of the use of macro-
porous resins for the isolation of aquatic humic sub-
stances. In: Frimmel, F.H., Christman, R.F. (Eds.), Humic
substances and their role in the environment. Wiley, pp.
15±28.
Artinger, R., Buckau, G., Kim, J.I., Geyer, S., Wolf, M.,
1996. The in¯uence of sedimentary organic matter on dis-
solved fulvic acids in groundwaterÐsigni®cance for
groundwater dating with 14C in dissolved organic matter.
Isotopes in Water Resources Management, Proc. IAEA
Symp. SM±336, pp. 57±72. IAEA, Vienna.
Beckett, R., Jue, Z., Giddings, J.C., 1987. Determination of
molecular weight distributions of fulvic and humic acids
using ¯ow ®eld-¯ow fractionation. Environ. Sci. Technol.
21, 289±295.
Beukens, R.P., 1992. Radiocarbon accelerator mass spec-
trometry: background, precision and accuracy. In: Taylor,
R.E., Long, A., Kra, R.S. (Eds.), Radiocarbon after four
decades. Springer, pp. 230±239.
BfS (Bundesamt fuÈ r Strahlenschutz/Federal O�ce for
Radiation Protection), 1990. Fortschreibung des zusam-
menfassenden Zwischenberichtes uÈ ber bisherige Ergebnisse
der Standortuntersuchung Gorleben vom Mai 1983.
Bundesamt fuÈ r Strahlenschutz BfS, ET±2/90, Salzgitter.
BoÈ ttcher, J., Strebel, O., Duynisveld, W.H.M., 1985. Vertikale
Sto�konzentrationspro®le im Grundwasser eines
Lockergesteins-Aquifers und deren Interpretation (Beispiel
Fuhrberger Feld). Z. dt. geol. Ges. 136, 543±552.
Buckau, G., 1991. Komplexierung von Americium (III) mit
Huminsto�en in natuÈ rlichen GrundwaÈ ssern. Thesis, Freie
UniversitaÈ t Berlin.
Chin, Y.-P., Aiken, G., O'Loughlin, E., 1994. Molecular
weight, polydispersity, and spectroscopic properties of
aquatic humic substances. Environ. Sci. Technol. 28,
1853±1858.
De Haan, H., 1983. Use of ultraviolet spectroscopy, gel ®l-
tration, pyrolysis/mass spectrometry and numbers of ben-
zoate-metabolizing bacteria in the study of humi®cation
and degradation of aquatic organic matter. In: Christman,
R.F., Gjessing, E.T. (Eds.), Aquatic and terrestrial humic
materials. Ann Arbor Science, pp. 165±182.
Eichinger, L., 1981. Bestimmung des Alters von Grundwasser
mit Kohlensto�±14: Messung und Interpretation der
GrundwaÈ sser des FraÈ nkischen Albvorlandes. Thesis,
Ludwig-Maximilians-UniversitaÈ t MuÈ nchen.
Eichinger, L., Rauert, W., Salvamoser, J., Wolf, M., 1980.
Large-volume liquid scintillation counting of carbon-14.
Radiocarbon 22, 417±427.
Gauthier, T.D., Seitz, W.R., Grant, C.L., 1987. E�ects of
structural and compositional variations of dissolved humic
materials on pyrene KOC values. Environ. Sci. Technol.
21, 243±248.
Geyer, S., 1993. Isotopengeochemische Untersuchungen an
Fraktionen von geloÈ stem organischem Kohlensto� (DOC)
zur Bestimmung der Herkunft und Evolution des DOC im
Hinblick auf die Datierung von Grundwasser. Thesis,
Ludwig-Maximilians-UniversitaÈ t MuÈ nchen.
Geyer, S., Wolf, M., Wassenaar, L.I., Fritz, P., Buckau, G.,
Kim, J.I., 1993. Isotope investigations on fractions of dis-
solved organic carbon for 14C groundwater dating. Isotope
Techniques in the Study of Past and Current
Environmental Changes in the Hydrosphere and the
Atmosphere. Proc. IAEA Symp. SM±329, IAEA, Vienna,
pp. 359±380.
Geyh, M.A., BruÈ hl, H., 1991. Attempt of 14C-age determi-
nation of groundwater via dissolved organic matter. Geol.
Jb. E48, 385±397.
Hayase, K., Tsubota, H., 1985. Sedimentary humic and fulvic
acid as ¯uorescent organic materials. Geochim.
Cosmochim. Acta 49, 159±163.
Jones II, G., Indig, G.L., 1996. Spectroscopic and chemical
binding properties of humic acids in water. New J. Chem.
20, 221±232.
Kim, J.I., Buckau, G., Rommel, H., Sohnius, B., 1989. The
migration behaviour of transuranium elements in
Gorleben aquifer systems. Mat. Res. Soc. Symp. Proc.
127, 849.
Kim, J.I., Buckau, G., Li, G.H., Psarros, N., 1990.
Characterization of humic and fulvic acids from Gorleben
groundwater. Fresenius J. Anal. Chem. 338, 245±252.
Kim, J.I., Delakowitz, B., Zeh, P., Probst, T., Lin, X.,
Ehrlicher, U., Schauer, S., Ivanovich, M., Longworth, G.,
Hasler, S.E., Gardiner, M., Fritz, P., Klotz, D., Lazik, D.,
Wolf, M., Geyer, S., Alexander, J.L., Read, D., Thomas,
J.B., 1996. Colloid migration in groundwaters: geochem-
ical interactions of radionuclides with natural colloids.
Report EUR 16754, Brussels/Luxembourg.
Kukkonen, J., 1992. E�ects of lignin and chlorolignin in pulp
mill e�uents on the binding and bioavailability of hydro-
phobic pollutants. Wat. Res. 26, 1523±1532.
Kumke, M.U., 1994. Spektroskopische Untersuchungen der
Wechselwirkung zwischen Huminsto�en und polyzyk-
lischen aromatischen Kohlenwassersto�en. Thesis,
Technische UniversitaÈ t Carolo-Wilhelmina zu
Braunschweig.
MacCarthy, P., Rice, J.A., 1985. Spectroscopic methods
(other than NMR) for determining functionality in humic
substances. In: Aiken, G.R., MacCarthy, P., McKnight,
D.S., Wershaw, R.L. (Eds.), Humic substances in Soil,
Sediment, and Water. Wiley, pp. 457±476.
Manahan, S.E., 1989. Interactions of hazardous-waste chemi-
cals with humic substances. Adv. Chem. Ser. 219, 83±92.
Miano, T.M., Sposito, G., Martin, J.P., 1988. Fluorescence
spectroscopy of humic substances. Soil Sci. Soc. Am. J. 52,
1016±1019.
Pennanen, V., 1972. Seasonal and spatial distribution of
humus fractions in a chain of polyhumic lakes in southern
Finland. Hydrobiologia 86, 73±80.
Pettersson, C., Allard, B., 1991. Dating of groundwaters by14C-analysis of dissolved humic substances. In: Allard, B.,
Boren, H., Grimvall, A. (Eds.), Humic Substances in the
R. Artinger et al. / Applied Geochemistry 15 (2000) 97±116 115

Aquatic and Terrestrial Environment. Springer, pp. 134±
141.
Pettersson, C., Ephraim, J., Allard, B., 1994. On the compo-
sition and properties of humic substances isolated from
deep groundwater and surface waters. Org. Geochem. 21,
443±451.
Power, J.F., Langford, C.H., 1988. Optical absorbance of dis-
solved organic matter in natural water studies using the
thermal lens e�ect. Anal. Chem. 60, 842±846.
Pullin, M.J., Cabaniss, S.E., 1995. Rank analysis of the pH-
dependent synchronous ¯uorescence spectra of six standard
humic substances. Environ. Sci. Technol. 29, 1460±1467.
Purdy, C.B., Burr, G.S., Rubin, M., Helz, G.R., Mignerey,
A.C., 1992. Dissolved organic and inorganic 14C concen-
trations and ages for coastal plain aquifers in southern
Maryland. Radiocarbon 34, 654±663.
Rietzler, J., 1979. Zur Hydrologie suÈ doÈ stlich von NuÈ rnberg
unter besonderer BeruÈ cksichtigung der Gradabteilungs-
blaÈ tter 6533 RoÈ thenbach, 6633 Feucht und 6733 Allers-
berg. Thesis, Ludwig-Maximilians-UniversitaÈ t MuÈ nchen.
Runde, W., 1993. Zum chemischen Verhalten von drei- und
fuÈ nfwertigem Americium in salinen NaCl-LoÈ sungen.
Thesis, Technische UniversitaÈ t MuÈ nchen.
Schnitzer, M., 1978. Humic substances: chemistry and reac-
tions. In: Schnitzer, M., Khan, S.U. (Eds.), Soil Organic
Matter. Elsevier, pp. 1±64.
Shaw, P.J., De Haan, H., Jones, R.I., 1994. Applicability and
reliability of gel ®ltration to study aquatic humic sub-
stances revisited; the e�ects of pH on molecular size distri-
bution. Environ. Technol. 15, 753±764.
Sonntag, C., Suckow, A., 1993. Isotope and noble gas investi-
gation of paleowaters in the sediments above the salt
dome Gorleben. Paleohydrogeological Methods and their
Applications. Proc. NEA Workshop, OECD/NEA, Paris,
pp. 251±258.
Steelink, C., 1985. Implications of elemental characteristics of
humic substances. In: Aiken, G.R., MacCarthy, P.,
McKnight, D.S., Wershaw, R.L. (Eds.), Humic substances
in Soil, Sediment, and Water. Wiley, pp. 457±476.
Stevenson, F.J., 1982. Humus chemistryÐGenesis, compo-
sition, reactions. Wiley.
Thurman, E.M., 1985. Humic substances in groundwater. In:
Aiken, G.R., MacCarthy, P., McKnight, D.S., Wershaw,
R.L. (Eds.), Humic substances in Soil, Sediment, and
Water. Wiley, pp. 87±103.
Thurman, E.M., Malcolm, R.L., 1981. Preparative isolation
of aquatic humic substances. Environ. Sci. Technol. 15,
463±466.
Traina, S.J., Novak, J., Smeck, N.E., 1990. An ultraviolet
absorbance method of estimating the percent aromatic car-
bon content of humic acids. J. Environ. Qual. 19, 151±
153.
Visser, S.A., 1983. Fluorescence phenomena of humic matter
of aquatic origin and microbial cultures. In: Christman,
R.F., Gjessing, E.T. (Eds.), Aquatic and terrestrial humic
materials. Ann Arbor Science, pp. 183±202.
Wassenaar, L.I., Aravena, R., Hendry, J., Fritz, P., 1991.
Radiocarbon in dissolved organic carbon, a possible
groundwater dating method: Case studies from western
Canada. Wat. Resources Res. 27, 1975±1986.
Wylie, I.W., Lai, E.P.C., 1986. Development of a photoacous-
tic probing technique to study the sedimentation of humic
acid. Rev. Sci. Instrum. 57, 1185±1191.
Yau, W.W., Kirkland, J.J., Bly, D.D., 1979. Modern Size-
Exclusion Liquid chromatography. Wiley.
Zahn, M.T., 1988. Die Ausbreitung von Schwermetallen und
Anionen im Grundwasser der quartaÈ ren Kiese aus dem
Raum MuÈ nchen (Dornach)ÐErgebnisse von Labor- und
GelaÈ ndeversuchen. Report GSF 26/88, Neuherberg,
Germany.
R. Artinger et al. / Applied Geochemistry 15 (2000) 97±116116
Copyright © 2022 FDOKUMEN