Characterization and Performance of Zero-Cement Concrete
327
CHARACTERIZATION AND PERFORMANCE OF ZERO-CEMENT CONCRETE December 2018 Final Report MoDOT Research Report number cmr 18-011 Project number TR201614 PREPARED BY: Eslam Gomaa Simon Sargon Cedric Kashosi Ahmed Gheni Mohamed ElGawady, Ph.D. William Schonberg, Ph.D., PE Missouri University of Science and Technology PREPARED FOR: Missouri Department of Transportation Construction and Materials Division Research Section
-
Upload
khangminh22 -
Category
Documents
-
view
2 -
download
0
Transcript of Characterization and Performance of Zero-Cement Concrete
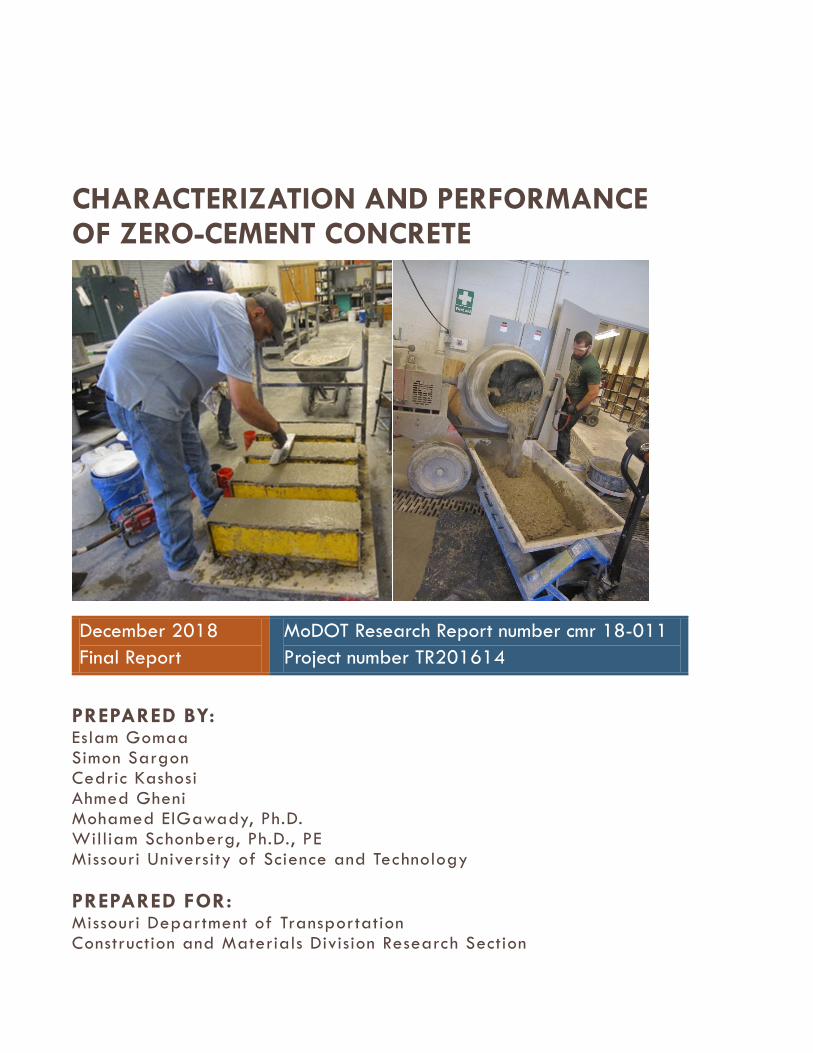
CHARACTERIZATION AND PERFORMANCE OF ZERO-CEMENT CONCRETE
December 2018 Final Report
MoDOT Research Report number cmr 18-011 Project number TR201614
PREPARED BY: Eslam Gomaa Simon Sargon Cedric Kashosi Ahmed Gheni Mohamed ElGawady, Ph.D. William Schonberg, Ph.D., PE Missouri University of Science and Technology
PREPARED FOR: Missouri Department of Transportation Construction and Materials Division Research Section
TECHNICAL REPORT DOCUMENTATION PAGE 1. Report No.cmr 18-011
2. Government Accession No. 3. Recipient’s Catalog No.
4. Title and SubtitleCharacterization and Performance of Zero-Cement Concrete
5. Report DateMay 2018Published: December 20186. Performing Organization Code
7. Author(s)Eslam Gomaa https://orcid.org/0000-0002-8748-8867Simon SargonCedric KashosiAhmed Gheni https://orcid.org/0000-0001-9042-869XMohamed ElGawady, Ph.D. https://orcid.org/0000-0001-6928-9875William Schonberg, Ph.D, PE https://orcid.org/0000-0002-6405-349X
8. Performing Organization Report No.
9. Performing Organization Name and AddressDepartment of Civil, Architectural and Environmental EngineeringMissouri University of Science and Technology1401 N. Pine St., Rolla, MO 65409
10. Work Unit No.
11. Contract or Grant No.MoDOT project # TR201614
12. Sponsoring Agency Name and AddressMissouri Department of Transportation (SPR)Construction and Materials DivisionP.O. Box 270Jefferson City, MO 65102
13. Type of Report and Period CoveredFinal Report (January 2017-April 2018)14. Sponsoring Agency Code
15. Supplementary NotesConducted in cooperation with the U.S. Department of Transportation, Federal Highway Administration. MoDOT research reportsare available in the Innovation Library at https://www.modot.org/research-publications.16. AbstractThis study has investigated the feasibility of using five different types of class C fly ashes (FAs) sourced from Labadie, Jeffrey, Kansas City, Thomas Hill, and Sikeston power plants in the state of Missouri to synthesize zero-cement concrete (ZCC) for different structural and repair applications. Alkali activator (Alk) consisting of sodium silicate (SS), Na2SiO3, and sodium hydroxide (SH), NaOH were used to synthesize the ZCC. Slag, crumb rubber, and air-entraining admixture (AEA) were used in a few mixtures as additives to improve the durability of the ZCC. Approximately 300 mortar and concrete mixtures were prepared during this study to investigate the mixing procedure, water/FA, Alk/FA, SS/SH, curing regime, fresh properties, mechanical properties, durability, repair applicability, and cost analysis of the ZCC. A 5000 psi MoDOT conventional concrete (CC) mixture was also prepared and tested for comparison purposes. This study revealed that ZCC can be used as a replacement for CC. ZCC showed good workability and adequate compressive strength for structural applications ranging from 3,660 psi to 7,465 psi based on the curing regime and source of FA. Some ZCC mixtures successfully passed 300 cycles of freeze and thaw per ASTM C666-15 procedures A and B. Furthermore, the drying shrinkage values of the ZCC specimens at all ages were significantly lower than those of the corresponding CC specimens. ZCC also presents higher corrosion resistance compared to CC. ZCC mixtures have a low to moderate permeability and chloride ion penetrability, while the CC mixture showed a high permeability and chloride ion penetrability. Finally, ZCC can be used as a repair material for existing concrete structures. The bond between ZCC as a repair material and CC as a host material was adequate and comparable to the bond between CC and CC.17. Key WordsAdmixtures; Binders; Bridge decks; Concrete; Fly ash; Girders;Hydration; Portland cement
18. Distribution StatementNo restrictions. This document is available through theNational Technical Information Service, Springfield, VA22161.
19. Security Classif. (of this report)Unclassified.
20. Security Classif. (of thispage)Unclassified.
21. No. of Pages327
22. Price
Form DOT F 1700.7 (8-72) Reproduction of completed page authorized
FINAL REPORT
Characterization and Performance of Zero-Cement Concrete
Prepared for
Missouri Department of Transportation
By
Eslam Gomaa Simon Sargon Cedric Kashosi Ahmed Gheni
Mohamed ElGawady, Ph.D. William Schonberg, Ph.D, PE
Missouri University of Science and Technology, Rolla, Missouri
May 2018
i
COPYRIGHT STATEMENT
Authors herein are responsible for the authenticity of their materials and for obtaining written
permissions from publishers or individuals who own the copyright to any previously published
or copyrighted material used herein.
DISCLAIMER STATEMENT
The opinions, findings, and conclusions expressed in this document are those of the
investigators. They are not necessarily those of the Missouri Department of Transportation, U.S.
Department of Transportation, or Federal Highway Administration. This information does not
constitute a standard or specification
ii
ACKNOWLEDGMENTS
The authors would like to acknowledge all the organizations and individuals that supported this
research project. The work in this research project was funded by Missouri Department of
Transportation (MoDOT). Partial financial supported from Ameren Corporation is also
appreciated. Special thanks for the Construction and Materials Laboratory of MoDOT for testing
the ZCC prisms under the freeze and thaw cycles per ASTM C666-15 Procedure B. Appreciation
is also extended to Mr. Brett Trautman the director of the Physical Laboratory at the
Construction and Materials Division. A sincere thank you to Ms. Lucille Goff the supervisor of
the Materials Testing, Construction and Materials, Central Laboratory. The authors also wish to
extend a sincere thank you to Mr. Tom Crowe the intermediate Material Technician,
Construction and Materials, Central Laboratory. Appreciation is extended to Michael Tierney
and Randy Blalock from MoDOT for their technical support during the durability test.
The authors would like also to thank Headwater Resources and Ameren for donating the
different fly ashes used in this study over the project period. Appreciation extended to PQ
Corporation for supplying the sodium silicate with a special discount. The authors also wish to
extend a sincere thank you to Clinton Knox, the Operations Supervisor, Boral CM Services
for his great help with supplying the fly ashes sourced from Sikeston, Thomas Hill and
Jeffrey Energy Center.
Special thanks for John Bullock and Ronald Lekrone for their great help in collecting the fly
ashes from Labadie and Kansas City and appreciated technical support. The authors highly
appreciate Dr. Mike Lusher, Jason Cox, Gary L. Abbott, and Brian Swift for their valuable
technical support. Finally, the authors would like to express their appreciation to the many
graduate and undergraduate students that contributed to the project including Ikram Efaz, Yasser
Darwish, Matthew Short, Kritsada Cody, Jonathan Cureton, Royce Ingram, Zoe Rechav, Luke
Myrick, Emily Eisenbacher, and Brittney Kennedy.
iii
EXECUTIVE SUMMARY
This study has investigated the feasibility of using locally available fly ashes (FAs) to synthesize
zero-cement concrete (ZCC) for different structural and repair applications. Using ZCC made of
100% FA reduces global CO2 emissions, saves energy, and decreases raw material consumption
during the production process of ordinary Portland cement. Class C FAs, sourced from Labadie,
Jeffrey, Kansas City, Thomas Hill, and Sikeston power plants in the state of Missouri, were used
to synthesize the ZCC. Two different alkali activators (Alk) were used in this study: sodium
silicate (SS), Na2SiO3, and sodium hydroxide (SH), NaOH. Slag, crumb rubber, and air-
entraining admixture (AEA) were used in a few mixtures as additives to improve the durability
of the ZCC. The mixing procedure, water/FA, Alk/FA, SS/SH, curing regime, fresh
properties, mechanical properties, durability, repair applicability, and cost analysis of the ZCC
were investigated in this study. Approximately 300 mortar and concrete mixtures were
tested. A 5000 psi MoDOT conventional concrete (CC) mixture was prepared and tested
for comparison purposes. Three curing regimes (oven, ambient, and moist) were applied to the
ZCC.
This study revealed that ZCC can be used as a replacement for CC. ZCC showed good
workability and adequate compressive strength for structural applications ranging from 3,660 psi
to 7,465 psi based on the curing regime and source of FA. Some ZCC mixtures successfully
passed 300 cycles of freeze and thaw per ASTM C666-15 procedures A and B. Furthermore,
the drying shrinkage values of the ZCC specimens at all ages were significantly lower than
those of the CC specimens. ZCC also presents higher corrosion resistance compared to
CC. ZCC mixtures have a low to moderate permeability and chloride ion penetrability,
while the CC mixture showed a high permeability and chloride ion penetrability. Finally, ZCC
can be used as a repair material for existing concrete structures. The bond between ZCC as a
repair material and CC as a host material was adequate and comparable to the bond between CC
and CC.
The relationships between the compressive strength of ZCC and splitting tensile
strength, flexural strength, and modulus of elasticity are similar to those used by current
codes and standards such ACI 318-14. Finally, ZCC is cost competitive; the cost of ZCC
ranged from $59/yd3 to $105/yd3.
iv
Table of Contents
Chapter 1: Introduction ............................................................................................................... 1
1.1 Background ...................................................................................................................... 1
1.2 Fly Ash (FA) .................................................................................................................... 2
1.2.1 Chemical properties .................................................................................................. 4
1.2.2 Physical properties .................................................................................................... 5
1.3 Constituents of Zero-Cement Concrete (ZCC) ................................................................ 6
1.3.1 Precursors .................................................................................................................. 6
1.3.2 Alkali activators ........................................................................................................ 8
1.4 Mixing and Curing Zero-Cement Concrete (ZCC) ........................................................ 12
1.4.1 Mixing procedure and energy ................................................................................. 12
1.4.2 Rest time for oven-cured ZCC ................................................................................ 15
1.4.3 Curing temperature ................................................................................................. 16
1.4.4 Curing regime ......................................................................................................... 19
1.5 Mechanical Properties of ZCC ....................................................................................... 20
1.6 Drying Shrinkage ........................................................................................................... 21
1.7 Durability of ZCC .......................................................................................................... 24
1.8 ZC Mortar/Concrete for Repair Applications ................................................................ 31
1.9 Safety and Transportation of Alkali Activators ............................................................. 36
v
1.10 Cost and CO2 .............................................................................................................. 37
1.11 Objective and Organization of this Report ................................................................. 37
Chapter 2: Material Properties .................................................................................................. 41
2.1 Aggregates ...................................................................................................................... 41
2.1.1 Coarse aggregate ..................................................................................................... 41
2.1.1 Fine aggregate ......................................................................................................... 42
2.2 Alkali Activators ............................................................................................................ 43
2.2.1 Sodium silicate ........................................................................................................ 43
2.2.2 Sodium hydroxide ................................................................................................... 44
2.3 Fly Ash (FA) Characterization ....................................................................................... 45
2.3.1 X-ray fluorescence .................................................................................................. 46
2.3.2 Physical properties .................................................................................................. 49
Chapter 3: Trial Mixture and Mixing Procedures of Zero-Cement Mortar and Concrete ........ 53
3.1 Mortar ............................................................................................................................. 54
3.1.1 Materials ................................................................................................................. 54
3.1.2 Mixing procedures .................................................................................................. 54
3.1.3 Trial mixtures .......................................................................................................... 57
3.1.4 Fresh properties, casting, curing, and testing .......................................................... 59
3.1.5 Results ..................................................................................................................... 63
3.2 Concrete ......................................................................................................................... 74
vi
3.2.1 Materials ................................................................................................................. 74
3.2.2 Mixing procedures .................................................................................................. 74
3.2.3 Trial mixtures .......................................................................................................... 78
3.2.4 Fresh properties, casting, curing, and testing .......................................................... 82
3.2.5 Results ..................................................................................................................... 84
3.2.6 Discussion ............................................................................................................... 89
3.2.7 Findings and conclusions ........................................................................................ 94
Chapter 4: Fresh Properties and Strength of Zero-Cement Mortar .......................................... 96
4.1 Mix Properties and Mixing Procedures .......................................................................... 96
4.2 Fresh and Hardened Properties of ZC Mortar ................................................................ 97
4.2.1 Results of fresh properties ...................................................................................... 98
4.2.2 Results of compressive strength ............................................................................ 114
4.3 Discussion .................................................................................................................... 126
4.4 Summary and Conclusions ........................................................................................... 133
Chapter 5: Optimization of Thermal Curing Temperature and Duration of Zero-Cement
Mortar 135
5.1 Material Properties ....................................................................................................... 135
5.1.1 Fly ashes, sand, coarse aggregate, and alkali solutions ........................................ 135
5.1.2 Mix design ............................................................................................................ 135
5.1.3 Mixing procedures ................................................................................................ 136
vii
5.1.4 Curing conditions .................................................................................................. 136
5.2 Fresh Properties of the Mortar ..................................................................................... 137
5.3 Results and Discussion ................................................................................................. 137
5.3.1 Setting time and workability ................................................................................. 137
5.3.2 Compressive strength ............................................................................................ 140
5.3.3 Energy consumption ............................................................................................. 148
5.4 Findings and Conclusions ............................................................................................ 154
Chapter 6: Mechanical Properties and Drying Shrinkage of Zero-Cement Concrete ............ 156
6.1 Experimental Details .................................................................................................... 156
6.1.1 Materials ............................................................................................................... 156
6.1.2 Packing density test............................................................................................... 156
6.1.3 Specimen preparation............................................................................................ 158
6.1.4 Mixing procedures ................................................................................................ 160
6.1.5 Specimen casting .................................................................................................. 161
6.1.6 Specimen curing.................................................................................................... 166
6.1.7 Mechanical properties determination .................................................................... 167
6.1.8 Drying shrinkage determination ........................................................................... 169
6.2 Results and Discussion ................................................................................................. 171
6.2.1 Fresh properties ..................................................................................................... 171
6.2.2 Mechanical properties ........................................................................................... 173
viii
6.3 Findings and Conclusions ............................................................................................ 210
Chapter 7: Durability of Zero-Cement Concrete .................................................................... 213
7.1 Experimental Program.................................................................................................. 213
7.1.1 Materials ............................................................................................................... 213
7.1.2 Mix design ............................................................................................................ 214
7.1.3 Mixing procedure .................................................................................................. 215
7.1.4 Casting and curing conditions ............................................................................... 215
7.1.5 Fresh and mechanical properties testing ............................................................... 216
7.1.6 Freeze and thaw test .............................................................................................. 216
7.1.7 Surface resistivity.................................................................................................. 218
7.1.8 Bulk electrical conductivity .................................................................................. 220
7.1.9 Rapid chloride ion penetration (RCIP) ................................................................. 222
7.2 Results and Discussion ................................................................................................. 224
7.2.1 Fresh and mechanical properties ........................................................................... 224
7.2.2 Freeze and thaw performance ............................................................................... 227
7.2.3 Surface resistivity, bulk electrical conductivity, and rapid chloride ion penetration
235
7.3 Findings and Conclusions ............................................................................................ 239
Chapter 8: Zero-Cement Concrete as a Repair Material ........................................................ 242
8.1 Experimental Program.................................................................................................. 242
ix
8.1.1 Materials ............................................................................................................... 242
8.1.2 Mixture design and procedure .............................................................................. 242
8.1.3 Casting and curing of the test specimens .............................................................. 243
8.1.4 Testing................................................................................................................... 248
8.1.5 Results and discussion .......................................................................................... 253
8.1.6 Pull-off test............................................................................................................ 261
8.2 Findings and Conclusions ............................................................................................ 271
Chapter 9: Cost Analysis ........................................................................................................ 273
9.1 Mixture Cost ................................................................................................................. 273
9.2 Findings and Conclusions ............................................................................................ 275
Chapter 10: Conclusions, Recommendations, and Future Work .......................................... 277
10.1 Findings and Conclusions ......................................................................................... 278
10.1.1 Mixing procedures ................................................................................................ 278
10.1.2 Mixing design ....................................................................................................... 279
10.1.3 Curing regimes ...................................................................................................... 279
10.1.4 Mechanical properties ........................................................................................... 281
10.1.5 Durability .............................................................................................................. 282
10.1.6 Repair .................................................................................................................... 283
10.1.7 Cost analysis ......................................................................................................... 285
10.2 Recommendations .................................................................................................... 285

x
10.3 Future Work .............................................................................................................. 287
Chapter 11: References ......................................................................................................... 289
xi
List of Figures
Figure 1.1: FA production [17]. ...................................................................................................... 3
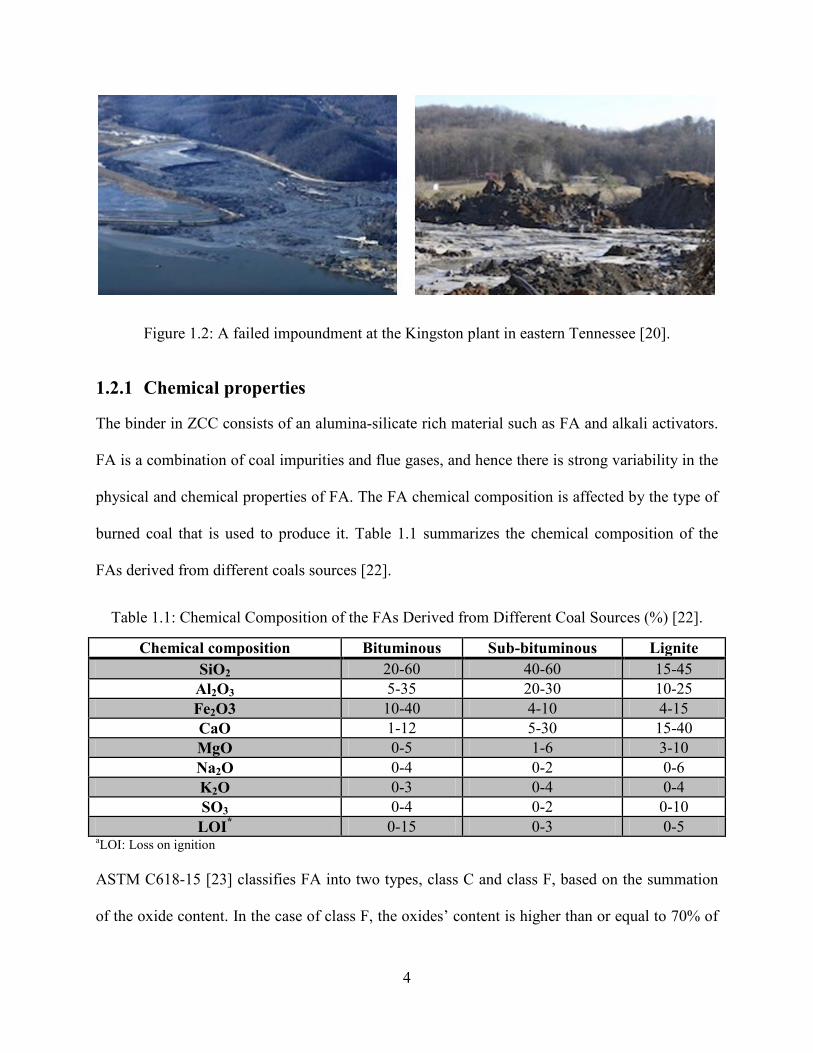
Figure 1.2: A failed impoundment at the Kingston plant in eastern Tennessee [20]. ..................... 4
Figure 1.3: Correlation between the ASTM C618-15 [23] and CSA A3001 [24] classifications. . 5
Figure 1.4: Effect of SS/SH on 7-day compressive strength [44]. .................................................. 9
Figure 1.5: Effect of SS/SH on the compressive strength of ZCC for FA/Alk of 1.5. 2, and 2.5
[54]. ............................................................................................................................................... 10
Figure 1.6: Effect of SH molarity on the compressive strength [51]. ........................................... 11
Figure 1.7: Effect of SH molarity on the compressive strength of ZCC at different curing
temperatures and durations [55].................................................................................................... 11
Figure 1.8: Flexural and compressive strength of ZC mortar mixed for different times [65]. ..... 13
Figure 1.9: Initial and final setting time of ZC paste mixed for different times [66]. .................. 14
Figure 1.10: Effect of resting time on the compressive strength of ZC mortar [44]. ................... 15
Figure 1.11: Effect of curing temperature on the compressive strength of ZCC [13]. ................. 17
Figure 1.12: Effect of curing temperature on the compressive strength of ZCC [13]. ................. 17
Figure 1.13: Effect of curing temperature on the compressive strength of ZC mortar [44]. ........ 18
Figure 1.14: Effect of curing temperature and time on the compressive strength of ZC paste [69].
....................................................................................................................................................... 18
Figure 1.15: Effect of curing regime on the compressive strength of ZCC [56]. ......................... 20
Figure 1.16: Effect of fibers and storing condition on the shrinkage over time for slag specimens
[39]. ............................................................................................................................................... 22
Figure 1.17: Effect of fibers and storing condition on the shrinkage over time for OPC specimens
[39]. ............................................................................................................................................... 22
xii
Figure 1.18: Effect of fibers and storing condition on the shrinkage over time for FA specimens
[39]. ............................................................................................................................................... 22
Figure 1.19: Drying shrinkage in ZC and OPC mortars [34]. ...................................................... 23
Figure 1.20: Effect of fibers and storing condition on the shrinkage over time for FA specimens
[39]. ............................................................................................................................................... 23
Figure 1.21: Compressive strength after 150 freeze-thaw cycles relative to 28 days of curing of
mortars composed of activated fly ash, with and without additives [75, 76]. (Note: this figure was
taken from [81]. ............................................................................................................................ 26
Figure 1.22: Dynamic modulus retention (%) after 90, 210, and 300 freeze–thaw cycles [77, 78].
(Note: CN = OPC mortar without air entraining agent, CA = OPC mortar with air entraining
agent, FN = FA mortar without air entraining agent, and FAA = FA mortar with air entraining
agent)............................................................................................................................................. 26
Figure 1.23: Weight loss after 50, 100, 200 and 300 freeze-thaw cycles of alkali-activated fly ash
concretes compared to OPC concretes, with and without air entrainment [79, 80]. (Note: this
figure was taken from [81]. ........................................................................................................... 27
Figure 1.24: Weight loss of ZC mortars after 25 cycles of freeze-thaw [82]. .............................. 29
Figure 1.25: Residual compressive strength of ZC mortars after 25 cycles of freeze-thaw [82]. 29
Figure 1.26: Mechanical behavior of materials with different modulus of elasticity: (a) load
perpendicular to the interface, and (b) load parallel to the interface [84]. .................................... 31
Figure 1.27: Slant shear specimens with interface line at 30o [86]. .............................................. 32
Figure 1.28: Failure modes; (a) adhesive failure, and (b) monolithic failure [86]. ...................... 33
Figure 1.29: The bond strength results from the slant shear test [86]. .......................................... 34
Figure 1.30: Tested specimens’ (a) dimensions, and (b) compression test [87]. .......................... 35

xiii
Figure 1.31: Bond strength between the substrate and repaired layers (note: PCC stands for CC
repair) [87]. ................................................................................................................................... 36
Figure 2.1: Sieve analysis of the coarse aggregate ....................................................................... 41
Figure 2.2: Sieve analysis of the sand used for mortar mixture. ................................................... 42
Figure 2.3: Sieve analysis of the sand used for concrete mixture. ................................................ 43
Figure 2.4: Sodium silicate solution (a) 5 gallon bucket, (b) 55 gallon barrel, (c) color. ............. 44
Figure 2.5: Sodium hydroxide (a) before preparation in solid pellet form and (b) after preparation
in liquid form. ............................................................................................................................... 45
Figure 2.6: FA colors and sources. ............................................................................................... 46
Figure 2.7: BET surface area analyzer (Nova 2000e). .................................................................. 49
Figure 2.8: FAs surface areas........................................................................................................ 50
Figure 2.9: Particle size analyzer (Microtrac S3500). .................................................................. 51
Figure 2.10: Particles size distribution of FAs.............................................................................. 51
Figure 2.11: Pycnometer for measuring the specific gravity of the FAs. ..................................... 52
Figure 3.1: Two sizes of Hobart N50 mortar mixers. ................................................................... 54
Figure 3.2: Workability testing of ZC mortar (a) mortar filling the brass mold, and (b) the final
workability of the mixture. ........................................................................................................... 59
Figure 3.3: Setting time testing of ZC mortar. .............................................................................. 60
Figure 3.4: Brass molds (a) before and (b) after placing the ZC mortar. ..................................... 61
Figure 3.5: Thermocouples Setup. ................................................................................................ 62
Figure 3.6: Compression test of ZC mortar cubes (a) during, and (b) after testing. ..................... 63
xiv
Figure 3.7: (a) Workability, (b) initial setting times, (c) final setting time, (d) oven-cured
compressive strength, and (e) ambient-cured compressive strength of ZC mortars prepared using
procedures no. 1 and 2. ................................................................................................................. 68
Figure 3.8: Effect of (a) W/FA on workability, (b) W/FA on setting times, (c) Alk/FA on
workability, (d) Alk/FA on setting times, (e) SS/SH on workability, and (f) SS/SH on setting
times of ZC mortars prepared using mixing procedures no. 1 and no. 2. ..................................... 70
Figure 3.9: Effect of (a) W/FA, (b) Alk/FA, and (c) SS/SH on the compressive strengths of ZC
mortars, respectively, prepared using mixing procedures no. 1 and 2. ......................................... 71
Figure 3.10: Gravity mixer with a maximum capacity of 1.5 ft3. ................................................. 75
Figure 3.11: Examples of slump tests of ZCC (a) 8 in (mix 11 of FA27), and (b) 6.5 in (mix 7 of
FA25). ........................................................................................................................................... 82
Figure 3.12: ZCC cylinders (a) before, and (b) after testing the compressive strength. ............... 84
Figure 3.13: Effect of mixing procedure on (a) slump value and (b) compressive strengths of
ZCC. .............................................................................................................................................. 90
Figure 3.14: Effect of (a) W/FA on slump value, (b) W/FA on compressive strengths, (c) Alk/FA
on slump value, (d) Alk/FA on compressive strength, (e) FA content on slump value, and (f) FA
content on compressive strength of ZCC, respectively. ............................................................... 93
Figure 4.1: Effect of calcium content on the workability of ZC mortar. .................................... 100
Figure 4.2: Effect of surface area on the workability of ZC mortar. .......................................... 100
Figure 4.3: Effect of calcium content on the initial setting time of ZC mortar. ......................... 102
Figure 4.4: Effect of calcium content on the final setting time of ZC mortar. ........................... 102
Figure 4.5: Effect of calcium content on the initial setting time of ZC mortar. ......................... 103
Figure 4.6: Effect of calcium content on the final setting time of ZC mortar. ........................... 103
xv
Figure 4.7: Workability of ZC mortar for Alk/FA of 0.250 and SS/SH of 1.0 for different W/FA.
..................................................................................................................................................... 104
Figure 4.8: Initial setting time of ZC mortar for Alk/FA of 0.250 and SS/SH of 1.0 for different
W/FA........................................................................................................................................... 105
Figure 4.9: Final setting time of ZC mortar for Alk/FA of 0.250 and SS/SH of 1.0 for different
W/FA........................................................................................................................................... 105
Figure 4.10: Workability of ZC mortar for Alk/FA of 0.300 and SS/SH of 1.0 for different
W/FA........................................................................................................................................... 106
Figure 4.11: Initial setting time of ZC mortar for Alk/FA of 0.300 and SS/SH of 1.0 for different
W/FA........................................................................................................................................... 106
Figure 4.12: Final setting time of ZC mortar for Alk/FA of 0.300 and SS/SH of 1.0 for different
W/FA........................................................................................................................................... 107
Figure 4.13: Workability of ZC mortar for W/FA of 0.400 and SS/SH of 1.0 for different
Alk/FA. ....................................................................................................................................... 108
Figure 4.14: Initial setting time of ZC mortar for W/FA of 0.400 and SS/SH of 1.0 for different
Alk/FA. ....................................................................................................................................... 109
Figure 4.15: Final setting time of ZC mortar for W/FA of 0.400 and SS/SH of 1.0 for different
Alk/FA. ....................................................................................................................................... 109
Figure 4.16: Workability of ZC mortar for W/FA of 0.400 and Alk/FA of 0.250 for different
SS/SH. ......................................................................................................................................... 110
Figure 4.17: Initial setting time of ZC mortar for W/FA of 0.400 and Alk/FA of 0.250 for
different SS/SH. .......................................................................................................................... 111
xvi
Figure 4.18: Final setting time of ZC mortar for W/FA of 0.400 and Alk/FA of 0.250 for
different SS/SH. .......................................................................................................................... 111
Figure 4.19: Workability of ZC mortar for W/FA of 0.450 and Alk/FA of 0.300 for different
SS/SH. ......................................................................................................................................... 112
Figure 4.20: Initial setting time of ZC mortar for W/FA of 0.450 and Alk/FA of 0.300 for
different SS/SH. .......................................................................................................................... 112
Figure 4.21: Final setting time of ZC mortar for W/FA of 0.450 and Alk/FA of 0.300 for
different SS/SH. .......................................................................................................................... 113
Figure 4.22: Effect of calcium content on the 7-day compressive strength of ZC mortar. ........ 117
Figure 4.23: Effect of surface area on the 7-day compressive strength of ZC mortar. ............... 117
Figure 4.24: Compressive strength of the oven-cured ZC mortar for Alk/FA of 0.250 and SS/SH
of 1.0 for different W/FA. ........................................................................................................... 118
Figure 4.25: Compressive strength of the ambient-cured ZC mortar for Alk/FA of 0.250 and
SS/SH of 1.0 for different W/FA. ............................................................................................... 119
Figure 4.26: Compressive strength of the oven-cured ZC mortar for Alk/FA of 0.300 and SS/SH
of 1.0 for different W/FA. ........................................................................................................... 119
Figure 4.27: Compressive strength of the ambient-cured ZC mortar for Alk/FA of 0.300 and
SS/SH of 1.0 for different W/FA. ............................................................................................... 120
Figure 4.28: Compressive strength of the oven-cured ZC mortar for W/FA of 0.400 and SS/SH
of 1.0 for different Alk/FA.......................................................................................................... 121
Figure 4.29: Compressive strength of the ambient-cured ZC mortar for W/FA of 0.400 and
SS/SH of 1.0 for different Alk/FA. ............................................................................................. 122
xvii
Figure 4.30: Compressive strength of the oven-cured ZC mortar for W/FA of 0.400 and Alk/FA
of 0.250 for different SS/SH. ...................................................................................................... 123
Figure 4.31: Compressive strength of the ambient-cured ZC mortar for W/FA of 0.400 and
Alk/FA of 0.250 for different SS/SH. ......................................................................................... 124
Figure 4.32: Compressive strength of the oven-cured ZC mortar for W/FA of 0.450 and Alk/FA
of 0.300 for different SS/SH. ...................................................................................................... 124
Figure 4.33: Compressive strength of the ambient-cured ZC mortar for W/FA of 0.450 and
Alk/FA of 0.300 for different SS/SH. ......................................................................................... 125
Figure 4.34: Peak strength for mortar at SS/SH of 1.0 and Alk/FA of 0.250 and 0.300. ........... 127
Figure 5.1: Environmental chamber temperature for one week. ................................................ 137
Figure 5.2: Setting times of ZC mortar mixes. ........................................................................... 139
Figure 5.3: Workability of ZC mortar mixes. ............................................................................. 139
Figure 5.4: Compressive strength of different mixes at different temperatures and durations. .. 142
Figure 5.5: 7-day testing at 30˚C and Missouri summer conditions. .......................................... 148
Figure 5.6: Compressive strength related to energy consumption, (a) M37-LA, (b) M37-HA, (c)
M37-HS....................................................................................................................................... 150
Figure 5.7: Compressive strength related to energy consumption, (a) M29-LA, (b) M29-HA, (c)
M29-HS....................................................................................................................................... 151
Figure 5.8: Compressive strength related to energy consumption, (a) M26-LA, (b) M26-HA, (c)
M26-HS....................................................................................................................................... 152
Figure 5.9: Compressive strength related to energy consumption, (a) M24-LA, (b) M24-HA, (c)
M24-HS....................................................................................................................................... 153
xviii
Figure 5.10: Compressive strength related to energy consumption, (a) M21-LA, (b) M21-HA, (c)
M21-HS....................................................................................................................................... 154
Figure 6.1: Gyratory compaction machine. ................................................................................ 157
Figure 6.2: Packing density results. ............................................................................................ 158
Figure 6.3: ZCC mixing (a) Adding the materials to the mixer, (b) mixing process, (c) pouring
the concrete, and (d) concrete ready for casting. ........................................................................ 161
Figure 6.4: Slump test of ZCC: (a) filling the slump cone, (b) before moving the cone vertically,
and (c) the slump. ........................................................................................................................ 162
Figure 6.5: Air content test (a) before, and (b) after testing. ...................................................... 162
Figure 6.6: Casting 4 x 8 in cylinders. ........................................................................................ 163
Figure 6.7: Casting 3 x 3 x 11.25 in and 3 x 3 x 16 in prisms (a) before casting and (b) surfacing
the prisms. ................................................................................................................................... 163
Figure 6.8: Casting 6 x 6 x 24 in beams (a) molds before casting, (b) during casting, and (c)
surfacing the beams..................................................................................................................... 164
Figure 6.9: (a) During, and (b) after encasing the beams in oven bags. ..................................... 165
Figure 6.10: Placing the specimens in the ovens (a) cylinders and prisms, and (b) beams in oven
bags. ............................................................................................................................................ 166
Figure 6.11: Hardened concrete testing (a) compression, and (b) elastic modulus tests. ........... 168
Figure 6.12: Splitting tensile testing (a) before, and (b) after splitting tensile testing. .............. 168
Figure 6.13: Modulus of rupture (flexural) testing (a) before, and (b) after modulus of rupture
(flexural) testing. ......................................................................................................................... 169
Figure 6.14: Curing the ZCC in a lime-water tank. .................................................................... 170

xix
Figure 6.15: Drying shrinkage (a) storing and (b) testing the prisms of the ZCC and CC mixtures.
..................................................................................................................................................... 171
Figure 6.16: Slump of the different concrete mixtures. .............................................................. 173
Figure 6.17: The compressive strength of the oven-cured specimens at different ages. (Note: the
CC mixture was moist cured). .................................................................................................... 174
Figure 6.18: The compressive strength of the ambient-cured specimens at different ages. (Note:
the CC mixture was moist cured)................................................................................................ 175
Figure 6.19: The compressive strength of the moist-cured specimens at different ages. ........... 175
Figure 6.20: The compressive strength of the oven-cured specimens with the calcium content.177
Figure 6.21: The compressive strength of the ambient-cured specimens with the calcium content.
..................................................................................................................................................... 178
Figure 6.22: The compressive strength of the moist-cured specimens with the calcium content.
..................................................................................................................................................... 178
Figure 6.23: The compressive strength of differently cured ZCC synthesized using C37. ........ 180
Figure 6.24: The compressive strength of differently cured ZCC synthesized using C29. ........ 180
Figure 6.25: The compressive strength of differently cured ZCC synthesized using C26. ........ 181
Figure 6.26: The compressive strength of differently cured ZCC synthesized using C24. ........ 181
Figure 6.27: The compressive strength of differently cured ZCC synthesized using C21. ........ 182
Figure 6.28: Compressive strength at the age of 7 days of three different curing regimes for the
five different FA sources. ........................................................................................................... 184
Figure 6.29: Compressive strength at the age of 28 days of three different curing regimes for the
five different FA sources. ........................................................................................................... 185

xx
Figure 6.30: Splitting tensile strength of oven-cured ZCC specimens at different ages (Note: the
CC mixture was cured in the moisture room). ............................................................................ 186
Figure 6.31: Splitting tensile strength of moist-cured ZCC specimens at different ages. .......... 187
Figure 6.32: Splitting tensile strength and compressive strength of ZCC with the design codes’
equations. .................................................................................................................................... 192
Figure 6.33: Splitting tensile strength and compressive strength of ZCC with the researchers’
equations. .................................................................................................................................... 192
Figure 6.34: Flexural strength of oven-cured ZCC specimens at different ages (Note: the CC
mixture was cured in the moisture room). .................................................................................. 194
Figure 6.35: Flexural strength of moist-cured ZCC specimens at different ages. ...................... 194
Figure 6.36: Flexural strength and compressive strength of ZCC with the design codes’
equations. .................................................................................................................................... 199
Figure 6.37: Flexural strength and compressive strength of ZCC with the researchers’ equations.
..................................................................................................................................................... 199
Figure 6.38: Modulus of elasticity of oven-cured ZCC specimens at different ages (Note: the CC
mixture was cured in the moisture room). .................................................................................. 201
Figure 6.39: Modulus of elasticity of moist-cured ZCC specimens at different ages. ............... 201
Figure 6.40: Modulus of elasticity and compressive strength of ZCC with the design codes’
equations. .................................................................................................................................... 207
Figure 6.41: Modulus of elasticity and compressive strength of ZCC with the researchers’
equations. .................................................................................................................................... 207
Figure 6.42: Shrinkage results of the oven-cured specimens tested directly after 24 hours of oven
curing. ......................................................................................................................................... 208
xxi
Figure 6.43: Shrinkage results of the oven-cured specimens stored for 28 days then tested. .... 209
Figure 6.44: Shrinkage results of the moist-cured specimens stored for 28 days then tested. ... 209
Figure 7.1: Ultrasonic pulse velocity test. .................................................................................. 217
Figure 7.2: Freeze and thaw chamber for procedure A of ASTM C666-15 [74]. ...................... 218
Figure 7.3: Surface resistivity test. ............................................................................................. 219
Figure 7.4: Principles of surface resistivity test [145]. ............................................................... 220
Figure 7.5: Grinded surfaces of the test specimens prior to the bulk electrical conductivity test.
..................................................................................................................................................... 221
Figure 7.6: Bulk electrical conductivity testing. ......................................................................... 221
Figure 7.7: 2 in. high disks for RCIP test. .................................................................................. 222
Figure 7.8: Chloride ion penetration test (a) soaking a disk under water, (b) placing a disk
between two cells, and (c) running the test. ................................................................................ 224
Figure 7.9: Slump values of the different mixtures. ................................................................... 225
Figure 7.10: Air content of the different mixtures. ..................................................................... 226
Figure 7.11: Compressive strength of the different mixtures. .................................................... 227
Figure 7.12: Dynamic modulus of elasticity vs. time for specimens subjected to freeze and thaw
cycles following procedure A of ASTM C666-15 [74]. ............................................................. 229
Figure 7.13: Durability factor for the different specimens subjected to freeze and thaw cycles
following procedure A of ASTM C666-15 [74]. ........................................................................ 230
Figure 7.14: ZCC mixtures after freeze and thaw cycles for specimens subjected to freeze and
thaw cycles following procedure A of ASTM C666-15 [74]. .................................................... 231
xxii
Figure 7.15: (a, b, c) ZCC mixtures, and (d) CC before and after freeze and thaw cycles for
specimens subjected to freeze and thaw cycles following procedure A of ASTM C666-15 [74].
..................................................................................................................................................... 232
Figure 7.16: Dynamic modulus of elasticity vs. time for the different mixtures for specimens
subjected to freeze and thaw cycles following procedure B of ASTM C666-15 [74]. ............... 234
Figure 7.17: Durability factor for the different specimens subjected to freeze and thaw cycles
following procedure B of ASTM C666-15 [74]. ........................................................................ 234
Figure 7.18: Surface resistivity of the different oven- and moist-cured mixtures. ..................... 237
Figure 7.19: Bulk electrical resistivity of the different oven- and moist-cured mixtures. .......... 238
Figure 7.20: Rapid chloride ion penetration of the different oven- and moist-cured mixtures. . 238
Figure 8.1: Preparing the test specimens for the slant shear test (a) form work inclined at 45o, and
(b) applying oil to the plastic cylinders. ...................................................................................... 244
Figure 8.2: Storing the half cylinders of the CC specimens in the moisture curing room. ........ 245
Figure 8.3: (a) Half cylinders of the CC mixture after moisture curing and (b) schematic for the
host and repaired layers. ............................................................................................................. 245
Figure 8.4: Half beams constructed out of the host material, i.e., CC after curing and before
placing the ZCC repair. ............................................................................................................... 247
Figure 8.5: Slant shear test for the repaired cylinders. ............................................................... 248
Figure 8.6: Core preparation processes (a) before drilling, (b) during drilling, and (c) the beams
after drilling all the cores. ........................................................................................................... 250
Figure 8.7: Pull-off test procedures (a) placing the pull-off device on top of the beams, (b)
adjusting the levels of the pull-off device legs before testing, and (c) leveling and pull-off
readings. ...................................................................................................................................... 251
xxiii
Figure 8.8: Modes of failure of the pull-off test, failure (a) in bottom layer, (b) at the interface
between the two layers, (c) in top layer, and (d) at the top surface of the beam [146]. .............. 252
Figure 8.9: Failure modes of the full-height and repaired cylinders for the oven-cured specimens.
..................................................................................................................................................... 253
Figure 8.10: Failure modes of the full-height and repaired cylinders for the moist-cured
specimens. ................................................................................................................................... 255
Figure 8.11: Compressive strength of the oven-cured repaired and full-height ZCC specimens
(Note: repaired and full-height ambient-cured CC cylinders are shown as a reference). ........... 256
Figure 8.12: Full-height normalized compressive strength of the oven-cured repaired and full-
height ZCC specimens (Note: repaired and full-height ambient-cured CC cylinders are show as a
reference). ................................................................................................................................... 256
Figure 8.13: Compressive strength of the moist-cured repaired and full-height ZCC specimens
(Note: repaired and full-height moist-cured CC cylinders are shown as a reference). ............... 257
Figure 8.14: Full-height normalized compressive strength of the moist-cured repaired and full-
height ZCC specimens (Note: repaired and full-height moist-cured CC cylinders are shown as a
reference). ................................................................................................................................... 258
Figure 8.15: CC normalized compressive strength of the oven-cured repaired specimens (Note:
repaired ambient-cured CC cylinders are shown as a reference). ............................................... 259
Figure 8.16: CC normalized compressive strength of the moist-cured repaired specimens (Note:
repaired moist-cured CC cylinders are shown as a reference). ................................................... 259
Figure 8.17: Different failure modes of the reference and repaired specimens. ......................... 262
Figure 8.18: Beams tested for the pull-off test. .......................................................................... 264
xxiv
Figure 8.19: Pull-off load of the oven-cured repaired and full-depth ZCC specimens (Note:
repaired and full-depth ambient-cured CC beams are shown as a reference). ............................ 265
Figure 8.20: Full-depth normalized pull-off load of the oven-cured repaired (Note: repaired and
full-depth ambient-cured CC beams are shown as a reference). ................................................ 266
Figure 8.21: Pull-off load of the moist-cured repaired and full-depth ZCC specimens (Note:
repaired and full-depth moist-cured CC cylinders are shown as a reference). ........................... 266
Figure 8.22: Full-depth normalized pull-off load of the moist-cured repaired specimens (Note:
repaired and full-depth moist-cured CC cylinders are shown as a reference). ........................... 267
Figure 8.23: CC normalized pull-off load of the oven-cured repaired specimens (Note: repaired
ambient-cured CC beams are shown as a reference). ................................................................. 268
Figure 8.24: CC normalized pull-off load of the moist-cured repaired specimens (Note: repaired
moist-cured CC cylinders are shown as a reference). ................................................................. 269
xxv
List of Tables
Table 1.1: Chemical Composition of the FAs Derived from Different Coal Sources (%) [22]. .... 4
Table 1.2: Flow (workability) and Setting Time of ZCC [45]. ..................................................... 10
Table 1.3: Effect of SH Molarity and SS/SH on Compressive Strength [13]. .............................. 10
Table 1.4: Properties of Slag-Based ZCC and Summary of Test Results after 500 Cycles of
Freezing and Thawing [73]. .......................................................................................................... 25
Table 1.5: Flexural and Compressive Strengths With and Without 50 Cycles of Freeze and Thaw
[39]. ............................................................................................................................................... 28
Table 1.6: Freeze and Thaw Resistance of ZCC [5]. .................................................................... 30
Table 2.1: Chemical Composition of the First Batch of FAs Samples by XRF. .......................... 47
Table 2.2: Chemical Composition of the Second Batch of FAs Samples by XRF (ElGawady et.
Al 2020). ....................................................................................................................................... 48
Table 2.3: Chemical Composition of the Slag Samples by XRF. ................................................. 48
Table 2.4: Physical properties of FAs. .......................................................................................... 52
Table 3.1: ZC Mortar Mixtures Prepared Using Mixing Procedure no. 1. ................................... 58
Table 3.2: ZC Mortar Mixtures Prepared Using Mixing Procedure no. 2. ................................... 58
Table 3.3: ZC Mortar Mixtures Prepared Using Mixing Procedures no. 2 Through no. 4........... 59
Table 3.4: Properties of ZC mortar mixtures prepared using mixing procedure no. 1. ................ 64
Table 3.5: Properties of ZC mortar mixtures prepared using mixing procedure no. 2. ................ 66
Table 3.6: Properties of ZC Mortar Mixture Prepared Using the Improved Mixing Procedures. 73
Table 3.7: Compressive Strengths Results of the Oven-Cured Specimens With and Without Oven
Bags............................................................................................................................................... 74
Table 3.8: Design of ZCC Mixtures Prepared Using FA25 (lb/ft3). ............................................. 79
xxvi
Table 3.9: Design of ZCC Mixtures Prepared Using FA27 (lb/ft3). ............................................. 80
Table 3.10: Design of ZCC Mixtures Prepared Using FA24 (lb/ft3). ........................................... 81
Table 3.11: Design of ZCC Mixtures Prepared Using FA21 (lb/ft3). ........................................... 81
Table 3.12: Slump and Compressive Strengths of ZCC Mixtures Prepared Using FA25. ........... 85
Table 3.13: Slump and Compressive Strengths of ZCC Mixtures Prepared Using FA27. ........... 86
Table 3.14: Slump and Compressive Strengths of ZCC Mixtures Prepared Using FA24. ........... 87
Table 3.15: Slump and Compressive Strengths of ZCC Mixtures Prepared Using FA21. ........... 87
Table 3.16: Properties of ZCC Mixture Prepared Using Different Mixing Procedures. .............. 90
Table 3.17: Compressive Strengths of the Ambient-Cured Specimens With and Without
Encasing Them in Bags. ............................................................................................................... 91
Table 4.1: Mix Design of ZC Mortars. ......................................................................................... 97
Table 4.2: Details and Compressive Strength Results of Oven- and Ambient-Cured Mixtures of
M21. ............................................................................................................................................ 128
Table 4.3: Details and Compressive Strength Results of Oven- and Ambient-Cured Mixtures of
M24. ............................................................................................................................................ 129
Table 4.4: Details and Compressive Strength Results of Oven- and Ambient-Cured Mixtures of
M25. ............................................................................................................................................ 130
Table 4.5: Details and Compressive Strength Results of Oven- and Ambient-Cured Mixtures of
M27. ............................................................................................................................................ 131
Table 4.6: Details and Compressive Strength Results of Oven- and Ambient-Cured Mixtures of
M29. ............................................................................................................................................ 132
Table 5.1: Mix Designs. .............................................................................................................. 136
Table 5.2: Sodium/FA Ratios. .................................................................................................... 136
xxvii
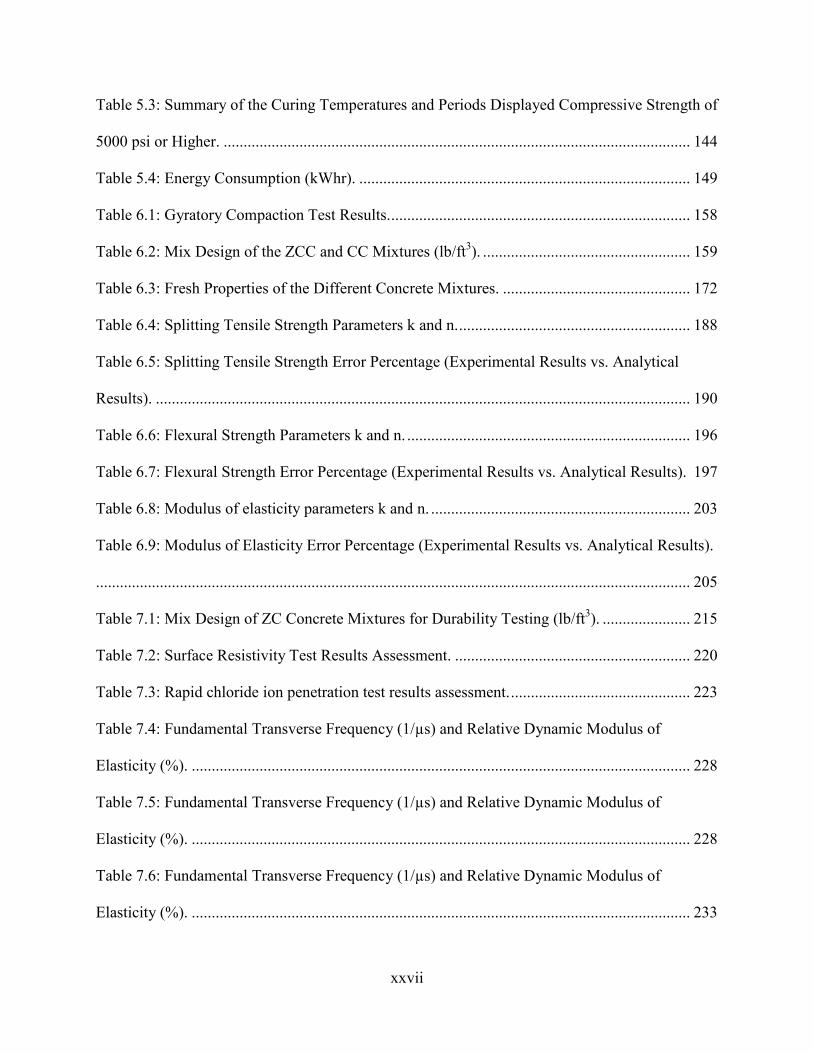
Table 5.3: Summary of the Curing Temperatures and Periods Displayed Compressive Strength of
5000 psi or Higher. ..................................................................................................................... 144
Table 5.4: Energy Consumption (kWhr). ................................................................................... 149
Table 6.1: Gyratory Compaction Test Results. ........................................................................... 158
Table 6.2: Mix Design of the ZCC and CC Mixtures (lb/ft3). .................................................... 159
Table 6.3: Fresh Properties of the Different Concrete Mixtures. ............................................... 172
Table 6.4: Splitting Tensile Strength Parameters k and n. .......................................................... 188
Table 6.5: Splitting Tensile Strength Error Percentage (Experimental Results vs. Analytical
Results). ...................................................................................................................................... 190
Table 6.6: Flexural Strength Parameters k and n. ....................................................................... 196
Table 6.7: Flexural Strength Error Percentage (Experimental Results vs. Analytical Results). 197
Table 6.8: Modulus of elasticity parameters k and n. ................................................................. 203
Table 6.9: Modulus of Elasticity Error Percentage (Experimental Results vs. Analytical Results).
..................................................................................................................................................... 205
Table 7.1: Mix Design of ZC Concrete Mixtures for Durability Testing (lb/ft3). ...................... 215
Table 7.2: Surface Resistivity Test Results Assessment. ........................................................... 220
Table 7.3: Rapid chloride ion penetration test results assessment. ............................................. 223
Table 7.4: Fundamental Transverse Frequency (1/µs) and Relative Dynamic Modulus of
Elasticity (%). ............................................................................................................................. 228
Table 7.5: Fundamental Transverse Frequency (1/µs) and Relative Dynamic Modulus of
Elasticity (%). ............................................................................................................................. 228
Table 7.6: Fundamental Transverse Frequency (1/µs) and Relative Dynamic Modulus of
Elasticity (%). ............................................................................................................................. 233
xxviii
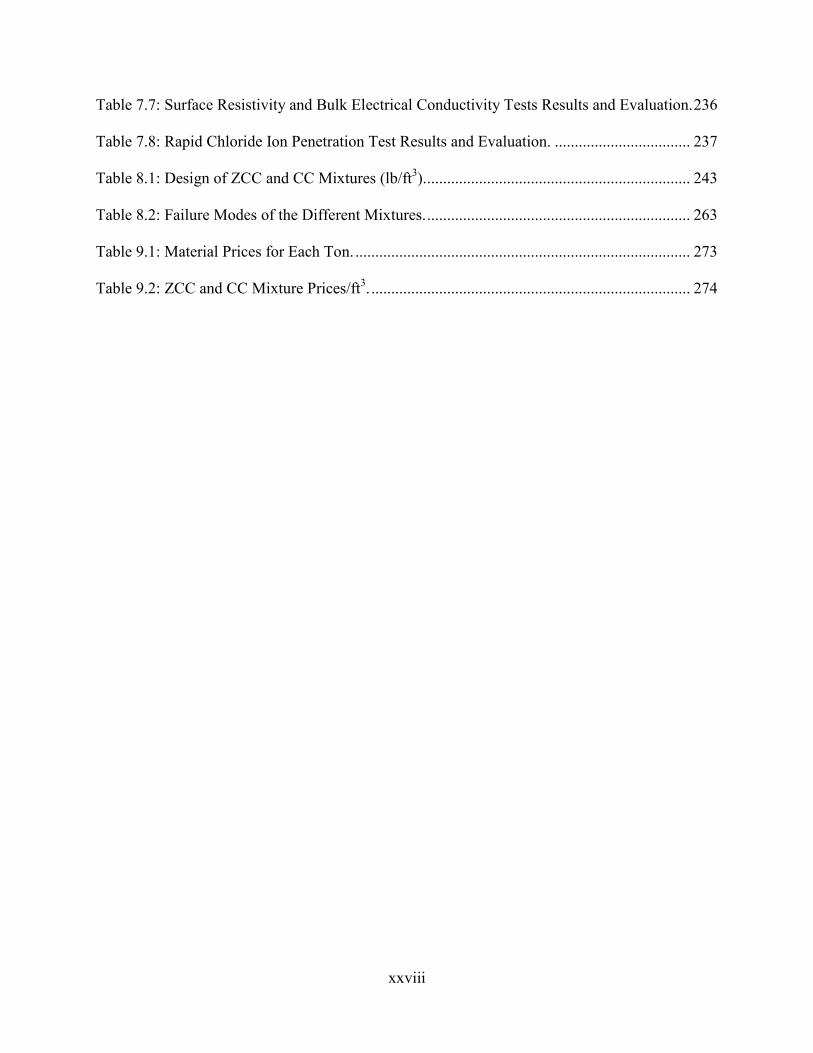
Table 7.7: Surface Resistivity and Bulk Electrical Conductivity Tests Results and Evaluation. 236
Table 7.8: Rapid Chloride Ion Penetration Test Results and Evaluation. .................................. 237
Table 8.1: Design of ZCC and CC Mixtures (lb/ft3). .................................................................. 243
Table 8.2: Failure Modes of the Different Mixtures. .................................................................. 263
Table 9.1: Material Prices for Each Ton. .................................................................................... 273
Table 9.2: ZCC and CC Mixture Prices/ft3. ................................................................................ 274
1
Chapter 1: Introduction
1.1 Background The annual global concrete production amounts to four tons per capita and about 1.7 tons in the
United States [1]. The U.S. consumed about 230 million m3 of ready mixed concrete during 2014
[1]. These tremendous numbers are due to the multiple construction applications of concrete,
including buildings, bridges, tunnels, pavement, and dams. It was estimated that more than 70%
of the bridges and 50% of the low rise buildings throughout the U.S. are constructed using
concrete [1], which makes it the most consumed material after water in the world [2].
Concrete is a composite material that includes cement, aggregates, and water. Cement acts as the
binder of the concrete, so it is one of the most important concrete components. The volume of
cement represents between 7% to 14% of the total volume of the concrete mixture [1]. The
global production of the cement industry has had a massive growth; in 1950 the production was
133 million tons and increased to 4.2 billion tons in 2014 [3]. The U.S. consumed 86.5 million
metric tons of Portland cement (OPC) in 2014 [1]. However, the production of one ton of
ordinary Portland cement causes about one ton of CO2 emissions, which represents about 8% of
the global CO2 emissions [4-7]. In addition, 1.7 tons of raw materials are required for the
production of one ton of cement. Furthermore, the consumed energy during the cement
production is about 3000 kJ for each kg of clinker during the cement production. Therefore,
finding a more environmentally friendly alternative to cement is an urgent need.
One way to reduce cement usage is to partially replace it with by-product or natural pozzolanic
materials such as fly ash (FA), ground granulated blast furnace slag (GGBFS), and metakaolin
(MK). Utilizing fly ash in the concrete industry has not only a good impact on the environment

2
but also improves the rheology, mechanical strength, durability, and economy of concrete
production [8, 9]. However, FA has a negative effect on the concrete’s early strength, especially
with a high replacement ratio [10].
Another way to improve the sustainability of concrete is totally replace the cement by these by-
products or natural pozzolanic materials, producing zero-cement concrete (ZCC) [6, 11]. The
ZCC is synthesized by reacting a material rich in silica and alumina such as FA with alkali
solutions such as sodium silicate and/or sodium hydroxide that induce the formation of strong
binding phases. ZCC possess attractive characteristics such as sustainability [12], lower
shrinkage [13], better fire and acid resistance, durability [14], lower creep [15], and better
resistance to sulphuric acid attack [16].
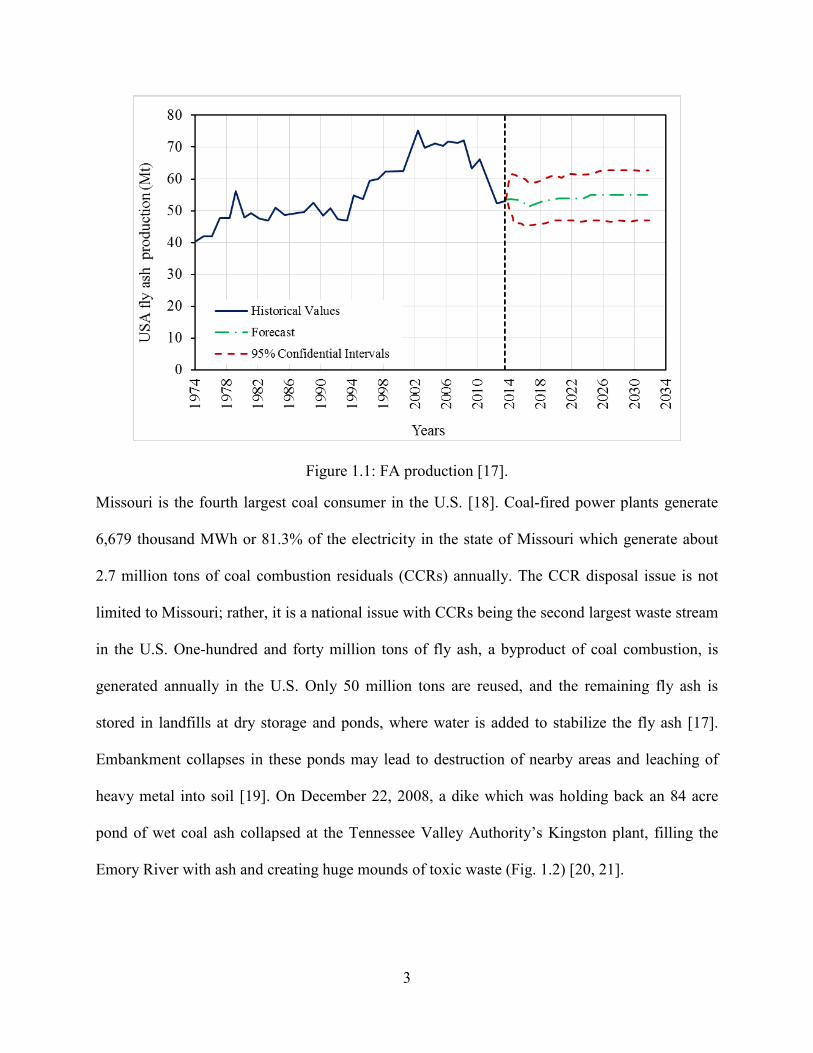
1.2 Fly Ash (FA) FA is a by-product of coal combustion during energy generation in power plants. The FA
production in the U.S. reached 53.4 million tons in 2013 [17]. According to a forecast study
prepared by the American Road and Transportation Builders Association, FA production will
reach 54.6 in 2033 with two 95% confidential intervals as shown in Fig. 1.1, which assure the
sustainability of FA production for long term usage [17]. There will be a relatively unchanged
amount of electrical power generated from coal in the next few decades due to several
socioeconomic factors [17].
3
Figure 1.1: FA production [17].
Missouri is the fourth largest coal consumer in the U.S. [18]. Coal-fired power plants generate
6,679 thousand MWh or 81.3% of the electricity in the state of Missouri which generate about
2.7 million tons of coal combustion residuals (CCRs) annually. The CCR disposal issue is not
limited to Missouri; rather, it is a national issue with CCRs being the second largest waste stream
in the U.S. One-hundred and forty million tons of fly ash, a byproduct of coal combustion, is
generated annually in the U.S. Only 50 million tons are reused, and the remaining fly ash is
stored in landfills at dry storage and ponds, where water is added to stabilize the fly ash [17].
Embankment collapses in these ponds may lead to destruction of nearby areas and leaching of
heavy metal into soil [19]. On December 22, 2008, a dike which was holding back an 84 acre
pond of wet coal ash collapsed at the Tennessee Valley Authority’s Kingston plant, filling the
Emory River with ash and creating huge mounds of toxic waste (Fig. 1.2) [20, 21].
4
Figure 1.2: A failed impoundment at the Kingston plant in eastern Tennessee [20].
1.2.1 Chemical properties
The binder in ZCC consists of an alumina-silicate rich material such as FA and alkali activators.
FA is a combination of coal impurities and flue gases, and hence there is strong variability in the
physical and chemical properties of FA. The FA chemical composition is affected by the type of
burned coal that is used to produce it. Table 1.1 summarizes the chemical composition of the
FAs derived from different coals sources [22].
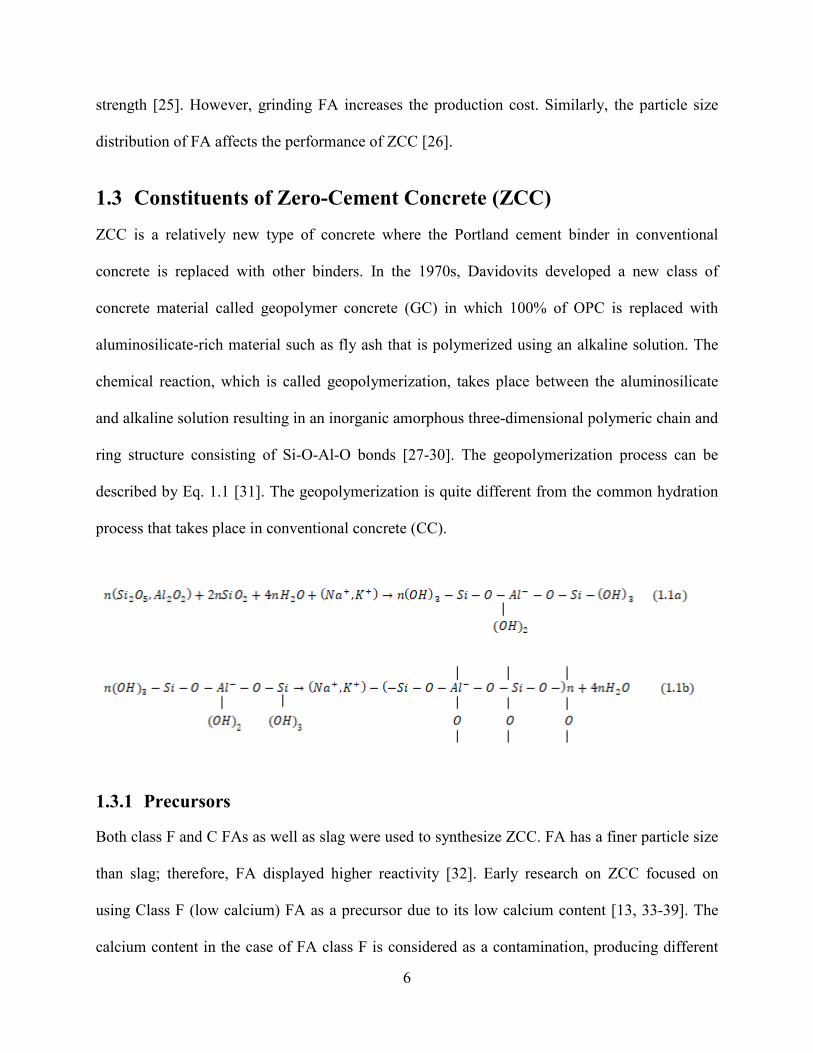
Table 1.1: Chemical Composition of the FAs Derived from Different Coal Sources (%) [22].
Chemical composition Bituminous Sub-bituminous Lignite SiO2 20-60 40-60 15-45 Al2O3 5-35 20-30 10-25 Fe2O3 10-40 4-10 4-15 CaO 1-12 5-30 15-40 MgO 0-5 1-6 3-10 Na2O 0-4 0-2 0-6 K2O 0-3 0-4 0-4 SO3 0-4 0-2 0-10 LOI* 0-15 0-3 0-5
aLOI: Loss on ignition ASTM C618-15 [23] classifies FA into two types, class C and class F, based on the summation
of the oxide content. In the case of class F, the oxides’ content is higher than or equal to 70% of
5
the total weight of the FA while it has to be between 50% and 70% of the total weight of the FA
in the case of class C. Despite the importance of the calcium content on the characteristics of FA,
ASTM C618-15 doesn’t consider that. However, it is more common to find that class F has a low
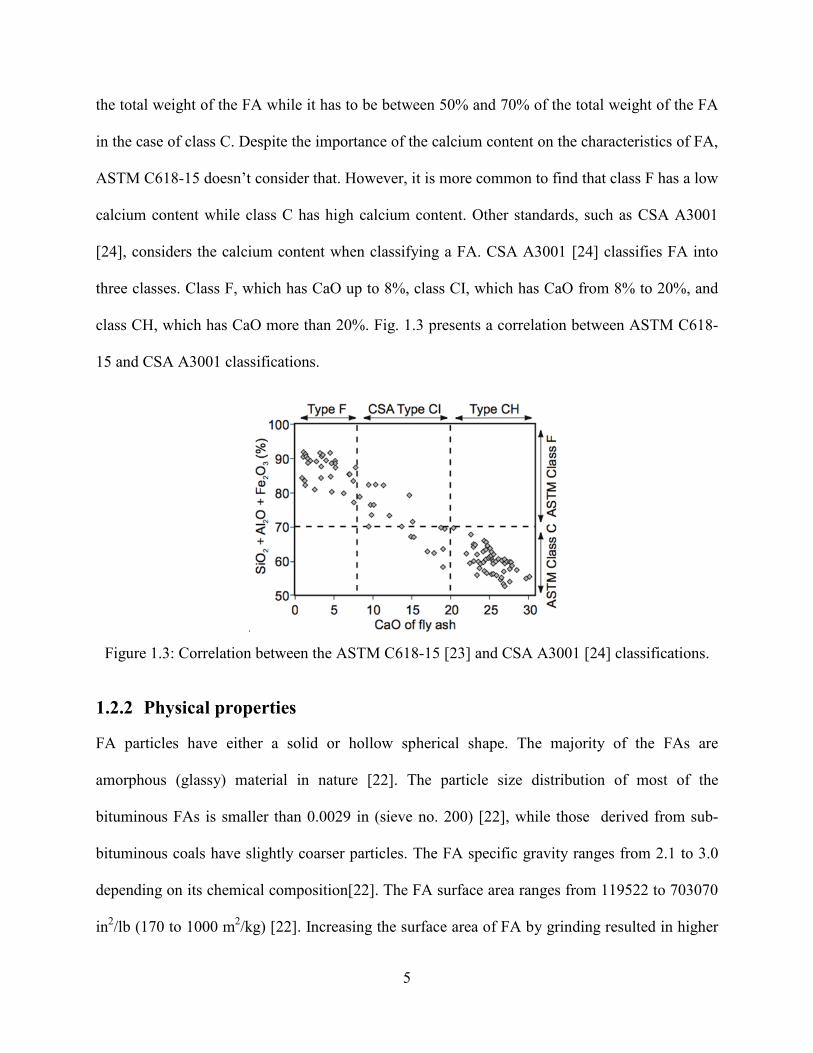
calcium content while class C has high calcium content. Other standards, such as CSA A3001
[24], considers the calcium content when classifying a FA. CSA A3001 [24] classifies FA into
three classes. Class F, which has CaO up to 8%, class CI, which has CaO from 8% to 20%, and
class CH, which has CaO more than 20%. Fig. 1.3 presents a correlation between ASTM C618-
15 and CSA A3001 classifications.
Figure 1.3: Correlation between the ASTM C618-15 [23] and CSA A3001 [24] classifications.
1.2.2 Physical properties
FA particles have either a solid or hollow spherical shape. The majority of the FAs are
amorphous (glassy) material in nature [22]. The particle size distribution of most of the
bituminous FAs is smaller than 0.0029 in (sieve no. 200) [22], while those derived from sub-
bituminous coals have slightly coarser particles. The FA specific gravity ranges from 2.1 to 3.0
depending on its chemical composition[22]. The FA surface area ranges from 119522 to 703070
in2/lb (170 to 1000 m2/kg) [22]. Increasing the surface area of FA by grinding resulted in higher
6
strength [25]. However, grinding FA increases the production cost. Similarly, the particle size
distribution of FA affects the performance of ZCC [26].
1.3 Constituents of Zero-Cement Concrete (ZCC) ZCC is a relatively new type of concrete where the Portland cement binder in conventional
concrete is replaced with other binders. In the 1970s, Davidovits developed a new class of
concrete material called geopolymer concrete (GC) in which 100% of OPC is replaced with
aluminosilicate-rich material such as fly ash that is polymerized using an alkaline solution. The
chemical reaction, which is called geopolymerization, takes place between the aluminosilicate
and alkaline solution resulting in an inorganic amorphous three-dimensional polymeric chain and
ring structure consisting of Si-O-Al-O bonds [27-30]. The geopolymerization process can be
described by Eq. 1.1 [31]. The geopolymerization is quite different from the common hydration
process that takes place in conventional concrete (CC).
1.3.1 Precursors
Both class F and C FAs as well as slag were used to synthesize ZCC. FA has a finer particle size
than slag; therefore, FA displayed higher reactivity [32]. Early research on ZCC focused on
using Class F (low calcium) FA as a precursor due to its low calcium content [13, 33-39]. The
calcium content in the case of FA class F is considered as a contamination, producing different
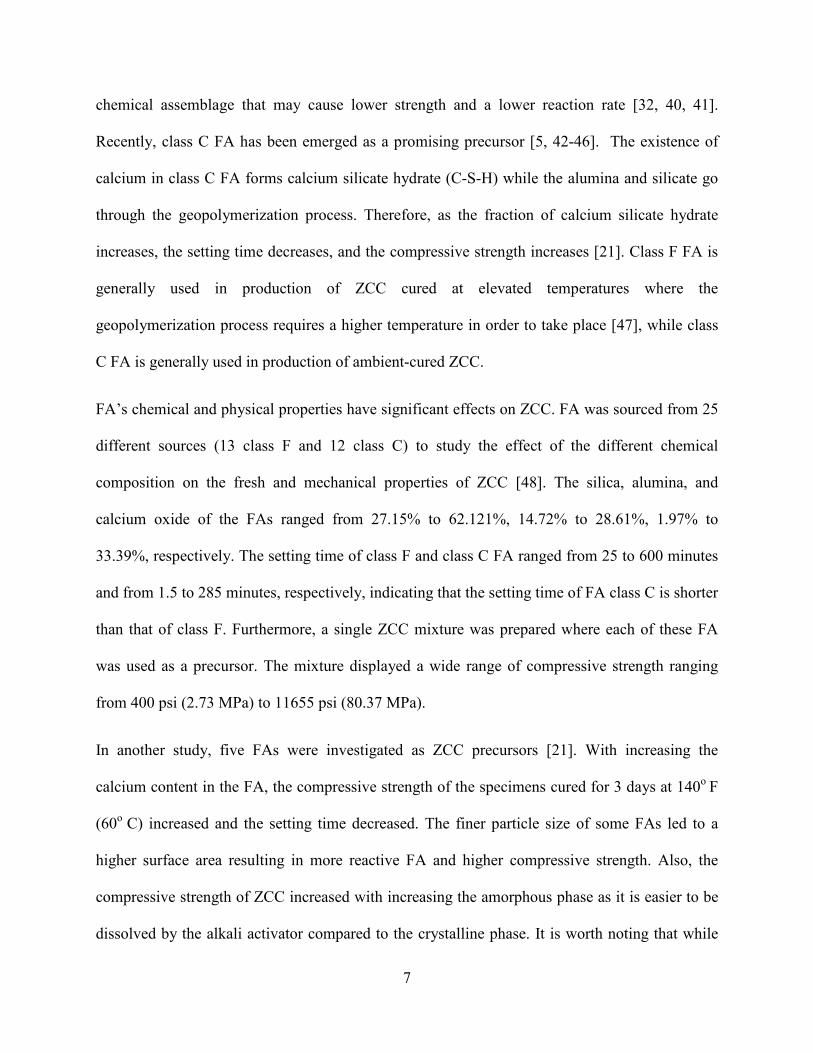
7
chemical assemblage that may cause lower strength and a lower reaction rate [32, 40, 41].
Recently, class C FA has been emerged as a promising precursor [5, 42-46]. The existence of
calcium in class C FA forms calcium silicate hydrate (C-S-H) while the alumina and silicate go
through the geopolymerization process. Therefore, as the fraction of calcium silicate hydrate
increases, the setting time decreases, and the compressive strength increases [21]. Class F FA is
generally used in production of ZCC cured at elevated temperatures where the
geopolymerization process requires a higher temperature in order to take place [47], while class
C FA is generally used in production of ambient-cured ZCC.
FA’s chemical and physical properties have significant effects on ZCC. FA was sourced from 25
different sources (13 class F and 12 class C) to study the effect of the different chemical
composition on the fresh and mechanical properties of ZCC [48]. The silica, alumina, and
calcium oxide of the FAs ranged from 27.15% to 62.121%, 14.72% to 28.61%, 1.97% to
33.39%, respectively. The setting time of class F and class C FA ranged from 25 to 600 minutes
and from 1.5 to 285 minutes, respectively, indicating that the setting time of FA class C is shorter
than that of class F. Furthermore, a single ZCC mixture was prepared where each of these FA
was used as a precursor. The mixture displayed a wide range of compressive strength ranging
from 400 psi (2.73 MPa) to 11655 psi (80.37 MPa).
In another study, five FAs were investigated as ZCC precursors [21]. With increasing the
calcium content in the FA, the compressive strength of the specimens cured for 3 days at 140o F
(60o C) increased and the setting time decreased. The finer particle size of some FAs led to a
higher surface area resulting in more reactive FA and higher compressive strength. Also, the
compressive strength of ZCC increased with increasing the amorphous phase as it is easier to be
dissolved by the alkali activator compared to the crystalline phase. It is worth noting that while
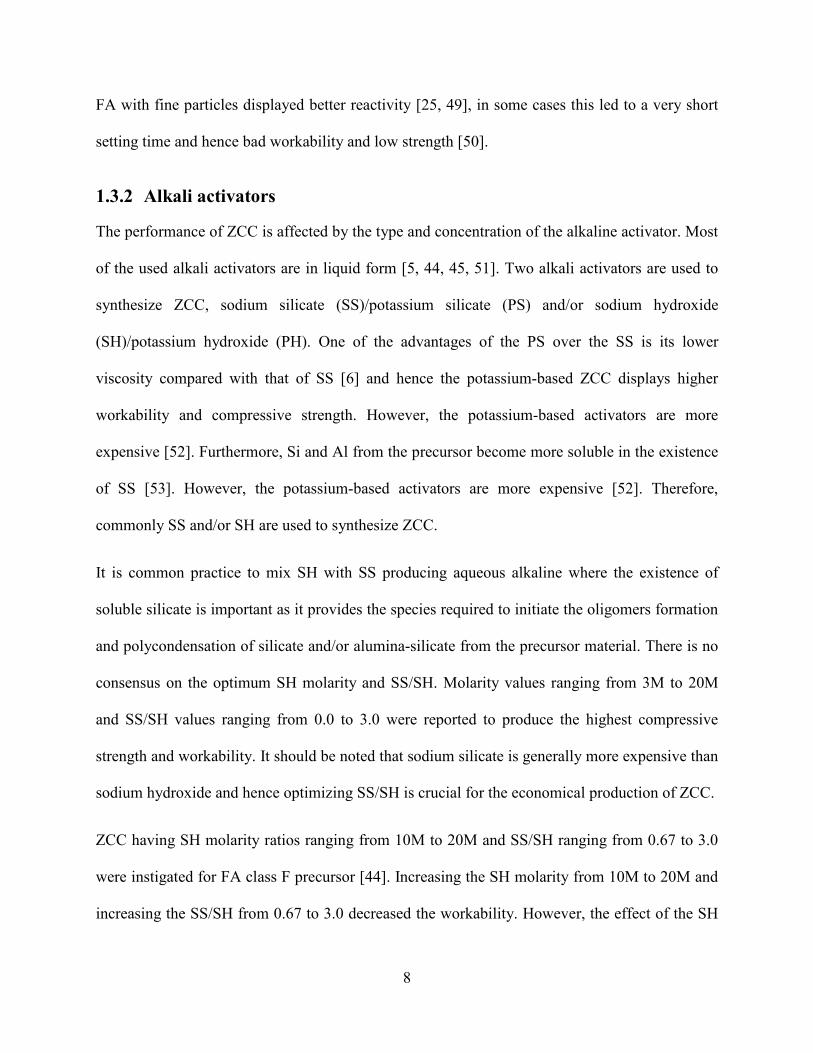
8
FA with fine particles displayed better reactivity [25, 49], in some cases this led to a very short
setting time and hence bad workability and low strength [50].
1.3.2 Alkali activators
The performance of ZCC is affected by the type and concentration of the alkaline activator. Most
of the used alkali activators are in liquid form [5, 44, 45, 51]. Two alkali activators are used to
synthesize ZCC, sodium silicate (SS)/potassium silicate (PS) and/or sodium hydroxide
(SH)/potassium hydroxide (PH). One of the advantages of the PS over the SS is its lower
viscosity compared with that of SS [6] and hence the potassium-based ZCC displays higher
workability and compressive strength. However, the potassium-based activators are more
expensive [52]. Furthermore, Si and Al from the precursor become more soluble in the existence
of SS [53]. However, the potassium-based activators are more expensive [52]. Therefore,
commonly SS and/or SH are used to synthesize ZCC.
It is common practice to mix SH with SS producing aqueous alkaline where the existence of
soluble silicate is important as it provides the species required to initiate the oligomers formation
and polycondensation of silicate and/or alumina-silicate from the precursor material. There is no
consensus on the optimum SH molarity and SS/SH. Molarity values ranging from 3M to 20M
and SS/SH values ranging from 0.0 to 3.0 were reported to produce the highest compressive
strength and workability. It should be noted that sodium silicate is generally more expensive than
sodium hydroxide and hence optimizing SS/SH is crucial for the economical production of ZCC.
ZCC having SH molarity ratios ranging from 10M to 20M and SS/SH ranging from 0.67 to 3.0
were instigated for FA class F precursor [44]. Increasing the SH molarity from 10M to 20M and
increasing the SS/SH from 0.67 to 3.0 decreased the workability. However, the effect of the SH
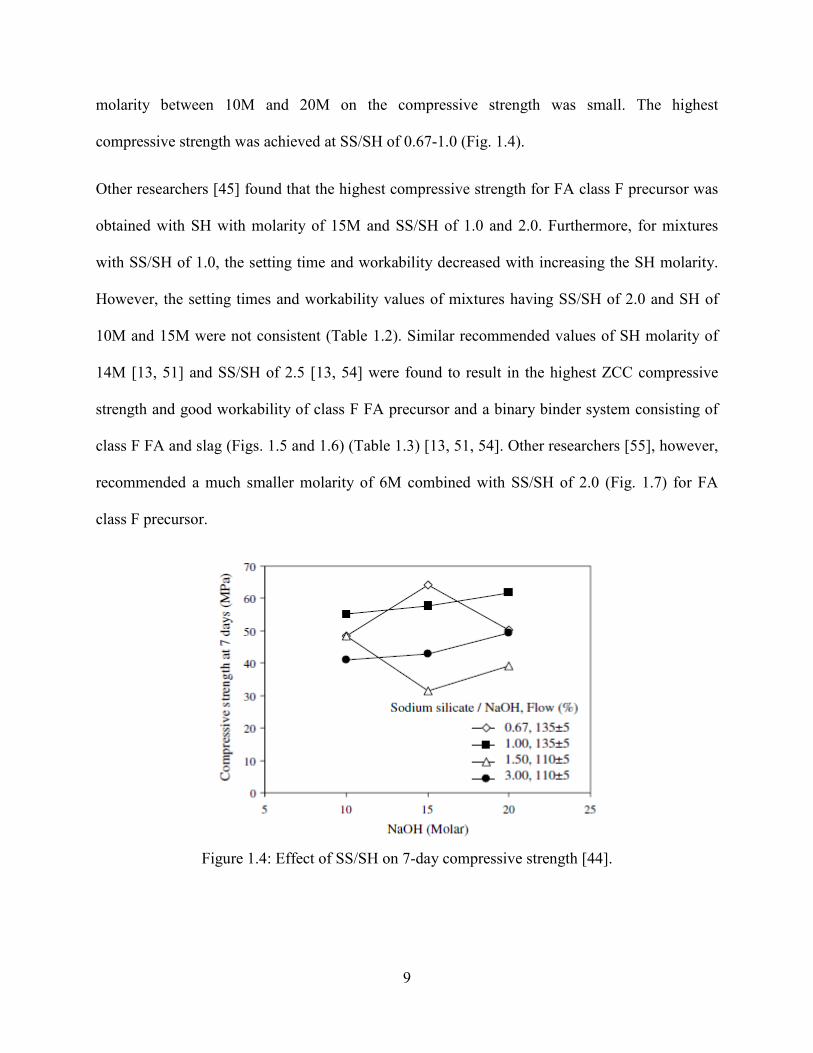
9
molarity between 10M and 20M on the compressive strength was small. The highest
compressive strength was achieved at SS/SH of 0.67-1.0 (Fig. 1.4).
Other researchers [45] found that the highest compressive strength for FA class F precursor was
obtained with SH with molarity of 15M and SS/SH of 1.0 and 2.0. Furthermore, for mixtures
with SS/SH of 1.0, the setting time and workability decreased with increasing the SH molarity.
However, the setting times and workability values of mixtures having SS/SH of 2.0 and SH of
10M and 15M were not consistent (Table 1.2). Similar recommended values of SH molarity of
14M [13, 51] and SS/SH of 2.5 [13, 54] were found to result in the highest ZCC compressive
strength and good workability of class F FA precursor and a binary binder system consisting of
class F FA and slag (Figs. 1.5 and 1.6) (Table 1.3) [13, 51, 54]. Other researchers [55], however,
recommended a much smaller molarity of 6M combined with SS/SH of 2.0 (Fig. 1.7) for FA
class F precursor.
Figure 1.4: Effect of SS/SH on 7-day compressive strength [44].
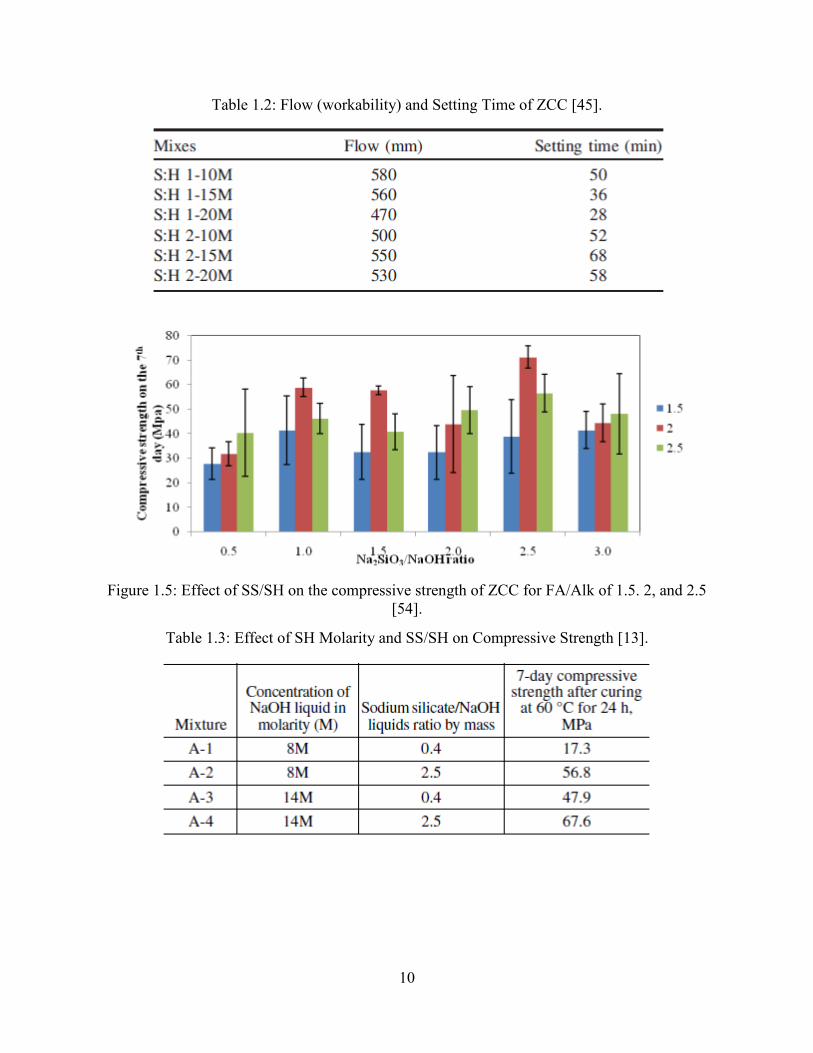
10
Table 1.2: Flow (workability) and Setting Time of ZCC [45].
Figure 1.5: Effect of SS/SH on the compressive strength of ZCC for FA/Alk of 1.5. 2, and 2.5
[54].
Table 1.3: Effect of SH Molarity and SS/SH on Compressive Strength [13].
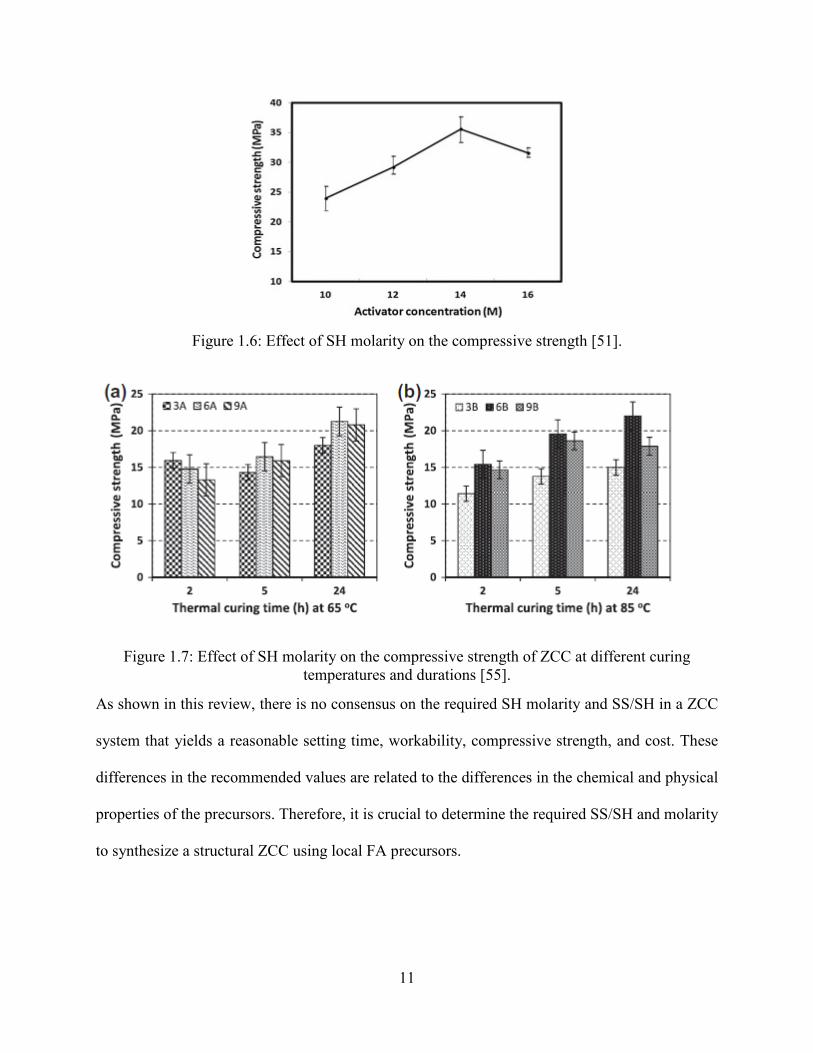
11
Figure 1.6: Effect of SH molarity on the compressive strength [51].
Figure 1.7: Effect of SH molarity on the compressive strength of ZCC at different curing temperatures and durations [55].
As shown in this review, there is no consensus on the required SH molarity and SS/SH in a ZCC
system that yields a reasonable setting time, workability, compressive strength, and cost. These
differences in the recommended values are related to the differences in the chemical and physical
properties of the precursors. Therefore, it is crucial to determine the required SS/SH and molarity
to synthesize a structural ZCC using local FA precursors.

12
1.4 Mixing and Curing Zero-Cement Concrete (ZCC)
1.4.1 Mixing procedure and energy
Different mixing procedures were used by different researchers to synthesize ZCC [38, 56-59].
The mixing procedures can be grouped as follows.
Procedure no.1 was used for ZCC or ZC mortar using class F FA [32, 59], class C FA [56], slag
[57], and class F FA and slag [38, 58] precursors. This procedure includes adding the dry
ingredients including the coarse aggregate, sand, and FA to the mixer; then, mixing them for one
to three minutes. Then, the SS and SH that had been mixed were added to the mixer over one to
five minutes. Lastly, the water and superplasticizer (if needed) were added over one minute.
Once all ingredients were added, mixing continued up to four minutes.
Procedure no. 2 was used for ZCC or ZC mortar using FA class F precursors [42, 45, 60]. The
FA and SH were added to the mixer over five minutes. Then, the aggregates were added to the
mixer over five minutes. Lastly, the SS was added to the mixer and mixed for five minutes.
Procedure no. 3 was used for ZCC or ZC mortar using class F and class C [48], and class F [61]
precursors. The FA and SH were added to the mixer over 30 seconds to five minutes. Second, the
SS was added to the mixer and mixed over one minute. Lastly, the aggregates were added to the
mixer over one to three minutes.
Procedure no. 4 was used for ZCC or ZC mortar using FA class F [34, 37, 62] and class C [37].
All the dry materials were mixed together for two to four minutes. Then, the alkali activators,
water, and superplasticizer (if needed) were added and mixed for two to eight minutes.
Procedure no. 5 was used for ZCC or ZC mortar using FA class F with additives such as nano-
silica, rice husk, nano-alumina [63], and FA class C [64]. All the dry materials were mixed
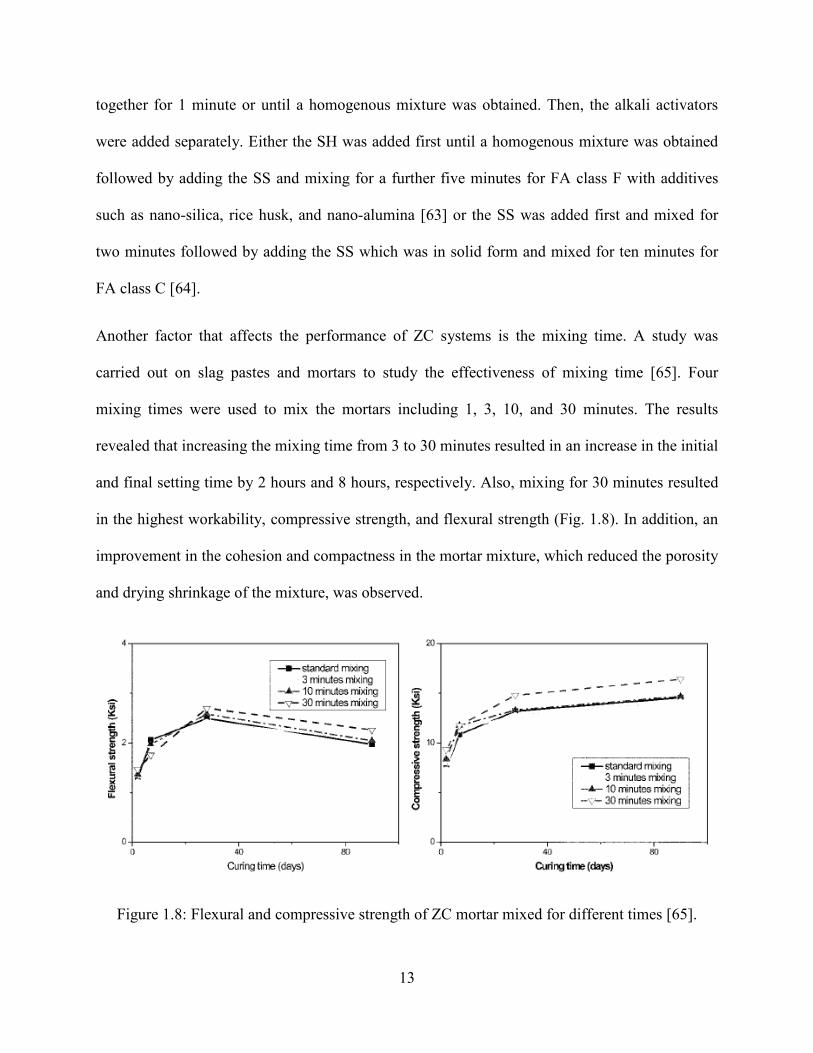
13
together for 1 minute or until a homogenous mixture was obtained. Then, the alkali activators
were added separately. Either the SH was added first until a homogenous mixture was obtained
followed by adding the SS and mixing for a further five minutes for FA class F with additives
such as nano-silica, rice husk, and nano-alumina [63] or the SS was added first and mixed for
two minutes followed by adding the SS which was in solid form and mixed for ten minutes for
FA class C [64].
Another factor that affects the performance of ZC systems is the mixing time. A study was
carried out on slag pastes and mortars to study the effectiveness of mixing time [65]. Four
mixing times were used to mix the mortars including 1, 3, 10, and 30 minutes. The results
revealed that increasing the mixing time from 3 to 30 minutes resulted in an increase in the initial
and final setting time by 2 hours and 8 hours, respectively. Also, mixing for 30 minutes resulted
in the highest workability, compressive strength, and flexural strength (Fig. 1.8). In addition, an
improvement in the cohesion and compactness in the mortar mixture, which reduced the porosity
and drying shrinkage of the mixture, was observed.
Figure 1.8: Flexural and compressive strength of ZC mortar mixed for different times [65].

14
Another factor that affects the performance of ZC systems is the mixing energy [66]. Mixing
periods of 1, 3, and 6 minutes were used with a mixing speed of 1000 rpm to prepare ZC paste
using class C FA precursor. Another mixing period of 10 minutes was used with a mixing speed
of 140 rpm. Increasing the mixing time from 1 minute to 10 minutes while decreasing the mixing
speed increased the initial and final setting times (Fig. 1.9). Also, mixing at a higher speed for
only one minute resulted in a higher compressive strength compared with mixing at lower speed
for 10 minutes, where the compressive strength increased from 9080 psi (62.6 MPa) to 10890 psi
(75.1 MPa). High speed mixing resulted in uniform mixing of raw materials which is important
for initial dissolution of the fly ash [67]. Furthermore, increasing the mixing speed improved the
workability of the materials [63].
The presented literature showed that there is no consensus on the best approach to mix ZCC or
the mixing duration and speed. Therefore, more research is required to determine the optimal
ZCC mixing approach, duration, and speed.
Figure 1.9: Initial and final setting time of ZC paste mixed for different times [66].
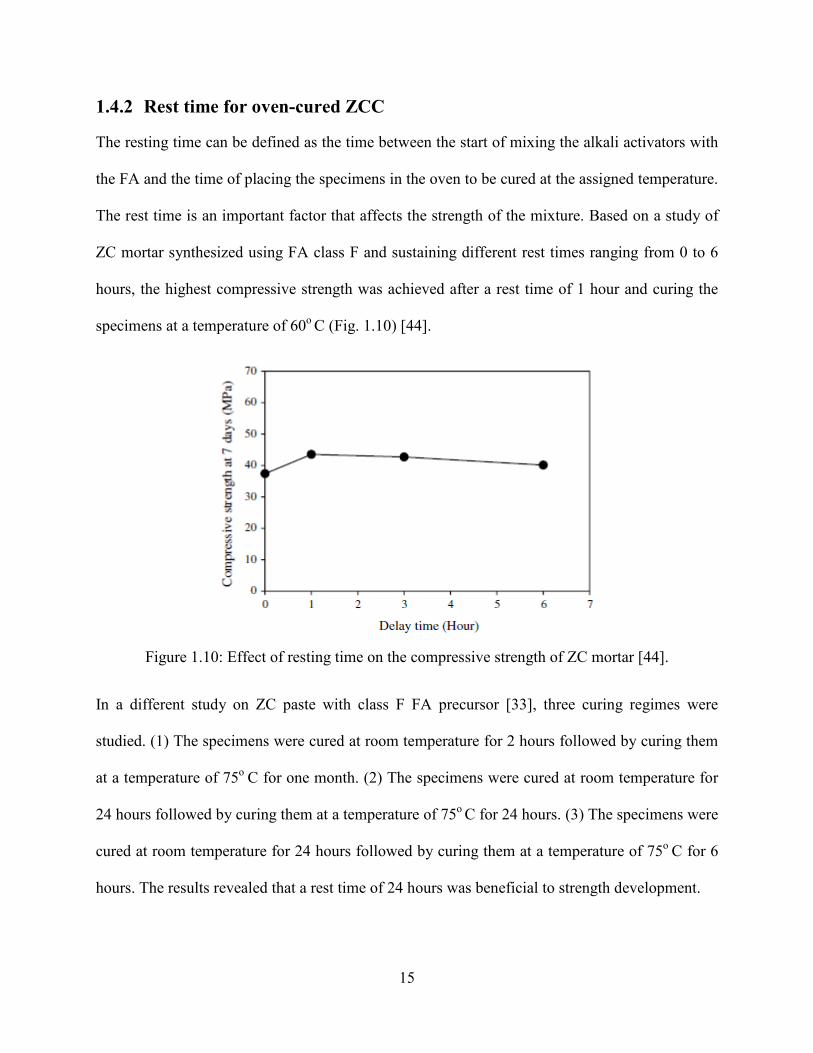
15
1.4.2 Rest time for oven-cured ZCC
The resting time can be defined as the time between the start of mixing the alkali activators with
the FA and the time of placing the specimens in the oven to be cured at the assigned temperature.
The rest time is an important factor that affects the strength of the mixture. Based on a study of
ZC mortar synthesized using FA class F and sustaining different rest times ranging from 0 to 6
hours, the highest compressive strength was achieved after a rest time of 1 hour and curing the
specimens at a temperature of 60o C (Fig. 1.10) [44].
Figure 1.10: Effect of resting time on the compressive strength of ZC mortar [44].
In a different study on ZC paste with class F FA precursor [33], three curing regimes were
studied. (1) The specimens were cured at room temperature for 2 hours followed by curing them
at a temperature of 75o C for one month. (2) The specimens were cured at room temperature for
24 hours followed by curing them at a temperature of 75o C for 24 hours. (3) The specimens were
cured at room temperature for 24 hours followed by curing them at a temperature of 75o C for 6
hours. The results revealed that a rest time of 24 hours was beneficial to strength development.
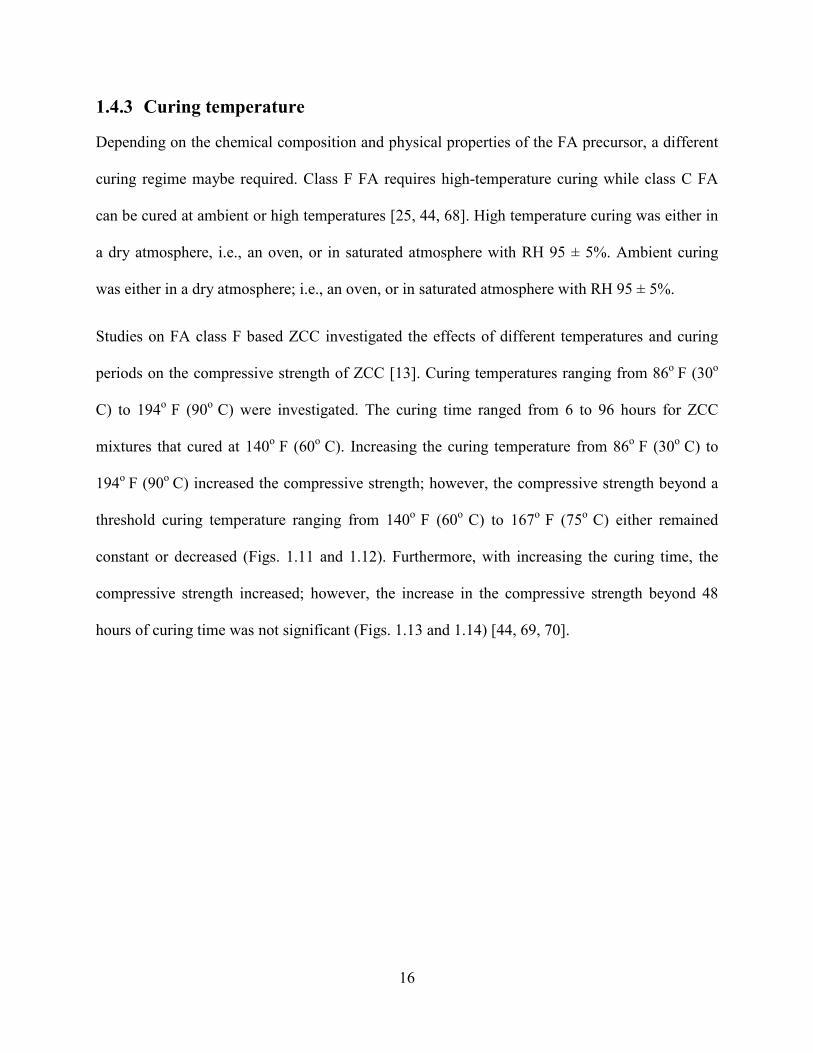
16
1.4.3 Curing temperature
Depending on the chemical composition and physical properties of the FA precursor, a different
curing regime maybe required. Class F FA requires high-temperature curing while class C FA
can be cured at ambient or high temperatures [25, 44, 68]. High temperature curing was either in
a dry atmosphere, i.e., an oven, or in saturated atmosphere with RH 95 ± 5%. Ambient curing
was either in a dry atmosphere; i.e., an oven, or in saturated atmosphere with RH 95 ± 5%.
Studies on FA class F based ZCC investigated the effects of different temperatures and curing
periods on the compressive strength of ZCC [13]. Curing temperatures ranging from 86o F (30o
C) to 194o F (90o C) were investigated. The curing time ranged from 6 to 96 hours for ZCC
mixtures that cured at 140o F (60o C). Increasing the curing temperature from 86o F (30o C) to
194o F (90o C) increased the compressive strength; however, the compressive strength beyond a
threshold curing temperature ranging from 140o F (60o C) to 167o F (75o C) either remained
constant or decreased (Figs. 1.11 and 1.12). Furthermore, with increasing the curing time, the
compressive strength increased; however, the increase in the compressive strength beyond 48
hours of curing time was not significant (Figs. 1.13 and 1.14) [44, 69, 70].

17
Figure 1.11: Effect of curing temperature on the compressive strength of ZCC [13].
Figure 1.12: Effect of curing temperature on the compressive strength of ZCC [13].
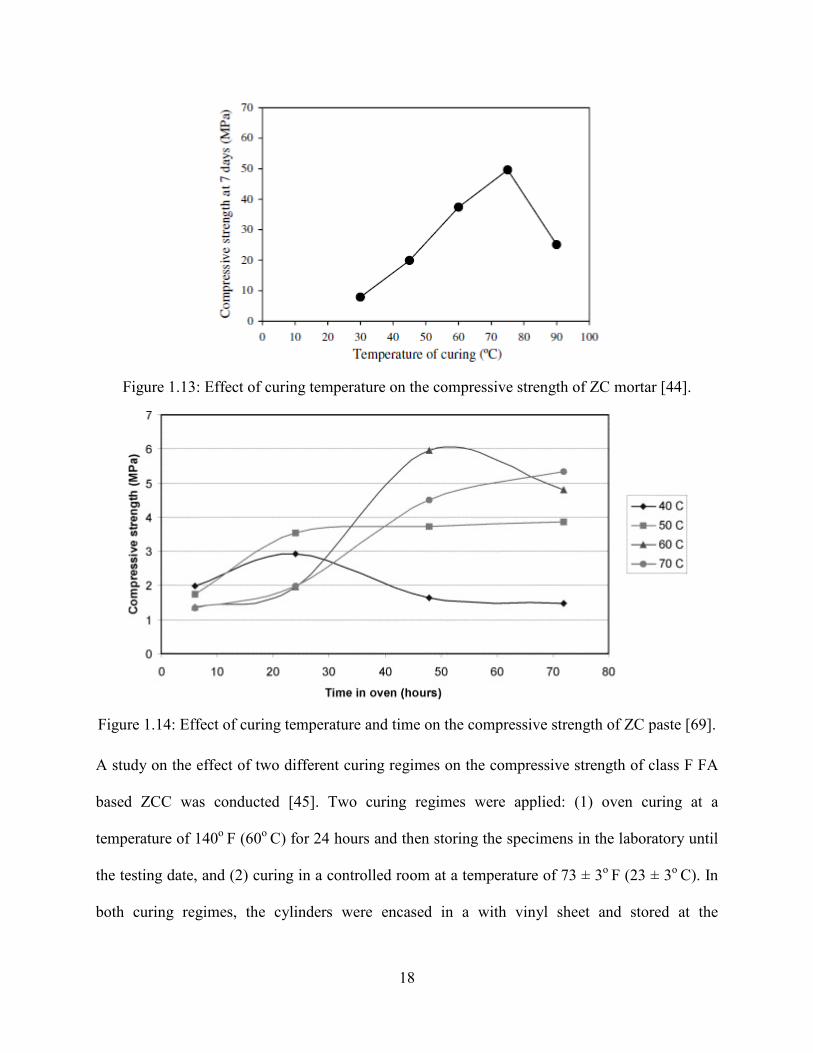
18
Figure 1.13: Effect of curing temperature on the compressive strength of ZC mortar [44].
Figure 1.14: Effect of curing temperature and time on the compressive strength of ZC paste [69].
A study on the effect of two different curing regimes on the compressive strength of class F FA
based ZCC was conducted [45]. Two curing regimes were applied: (1) oven curing at a
temperature of 140o F (60o C) for 24 hours and then storing the specimens in the laboratory until
the testing date, and (2) curing in a controlled room at a temperature of 73 ± 3o F (23 ± 3o C). In
both curing regimes, the cylinders were encased in a with vinyl sheet and stored at the
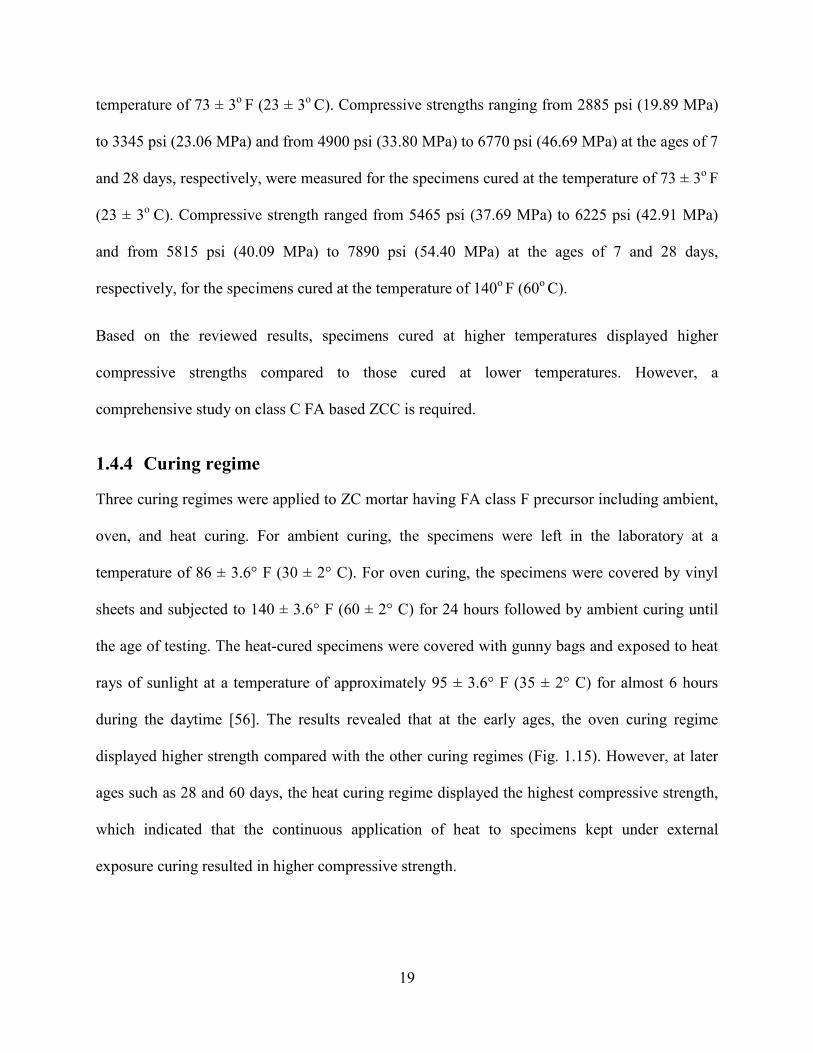
19
temperature of 73 ± 3o F (23 ± 3o C). Compressive strengths ranging from 2885 psi (19.89 MPa)
to 3345 psi (23.06 MPa) and from 4900 psi (33.80 MPa) to 6770 psi (46.69 MPa) at the ages of 7
and 28 days, respectively, were measured for the specimens cured at the temperature of 73 ± 3o F
(23 ± 3o C). Compressive strength ranged from 5465 psi (37.69 MPa) to 6225 psi (42.91 MPa)
and from 5815 psi (40.09 MPa) to 7890 psi (54.40 MPa) at the ages of 7 and 28 days,
respectively, for the specimens cured at the temperature of 140o F (60o C).
Based on the reviewed results, specimens cured at higher temperatures displayed higher
compressive strengths compared to those cured at lower temperatures. However, a
comprehensive study on class C FA based ZCC is required.
1.4.4 Curing regime
Three curing regimes were applied to ZC mortar having FA class F precursor including ambient,
oven, and heat curing. For ambient curing, the specimens were left in the laboratory at a
temperature of 86 ± 3.6° F (30 ± 2° C). For oven curing, the specimens were covered by vinyl
sheets and subjected to 140 ± 3.6° F (60 ± 2° C) for 24 hours followed by ambient curing until
the age of testing. The heat-cured specimens were covered with gunny bags and exposed to heat
rays of sunlight at a temperature of approximately 95 ± 3.6° F (35 ± 2° C) for almost 6 hours
during the daytime [56]. The results revealed that at the early ages, the oven curing regime
displayed higher strength compared with the other curing regimes (Fig. 1.15). However, at later
ages such as 28 and 60 days, the heat curing regime displayed the highest compressive strength,
which indicated that the continuous application of heat to specimens kept under external
exposure curing resulted in higher compressive strength.
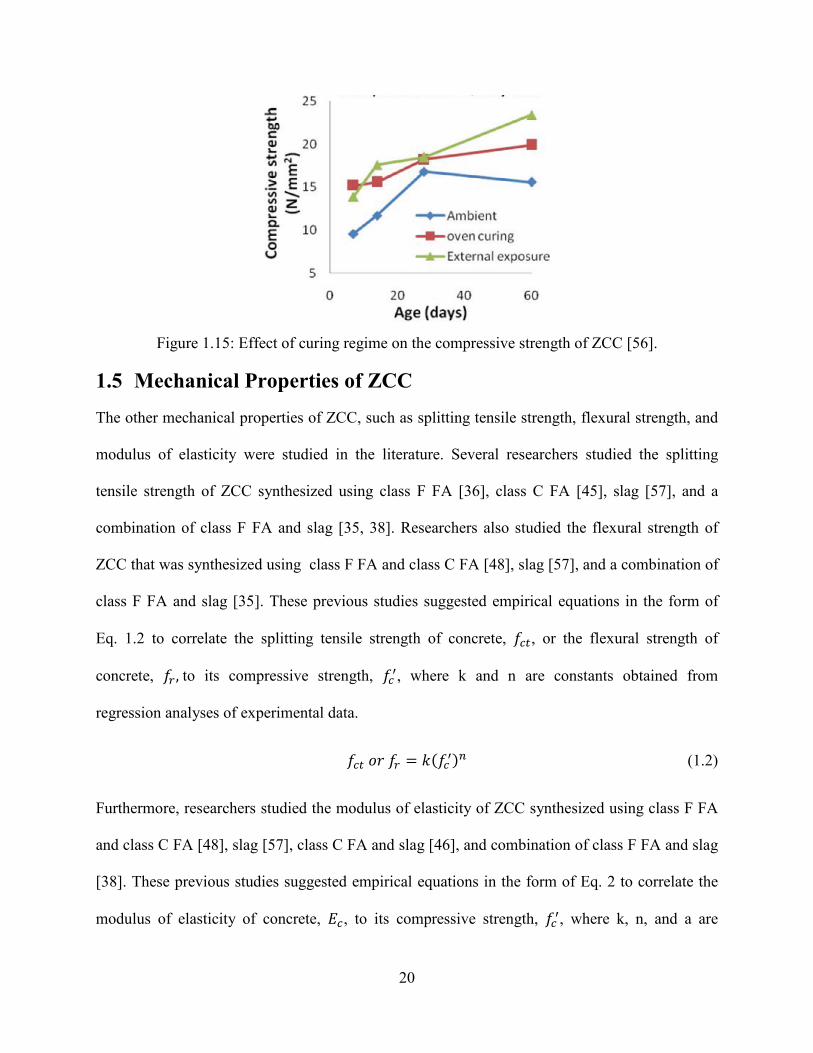
20
Figure 1.15: Effect of curing regime on the compressive strength of ZCC [56].
1.5 Mechanical Properties of ZCC The other mechanical properties of ZCC, such as splitting tensile strength, flexural strength, and
modulus of elasticity were studied in the literature. Several researchers studied the splitting
tensile strength of ZCC synthesized using class F FA [36], class C FA [45], slag [57], and a
combination of class F FA and slag [35, 38]. Researchers also studied the flexural strength of
ZCC that was synthesized using class F FA and class C FA [48], slag [57], and a combination of
class F FA and slag [35]. These previous studies suggested empirical equations in the form of
Eq. 1.2 to correlate the splitting tensile strength of concrete, 𝑓𝑐𝑡, or the flexural strength of
concrete, 𝑓𝑟 , to its compressive strength, 𝑓𝑐′, where k and n are constants obtained from
regression analyses of experimental data.
𝑓𝑐𝑡 𝑜𝑟 𝑓𝑟 = 𝑘(𝑓𝑐′)𝑛 (1.2)
Furthermore, researchers studied the modulus of elasticity of ZCC synthesized using class F FA
and class C FA [48], slag [57], class C FA and slag [46], and combination of class F FA and slag
[38]. These previous studies suggested empirical equations in the form of Eq. 2 to correlate the
modulus of elasticity of concrete, 𝐸𝑐, to its compressive strength, 𝑓𝑐′, where k, n, and a are
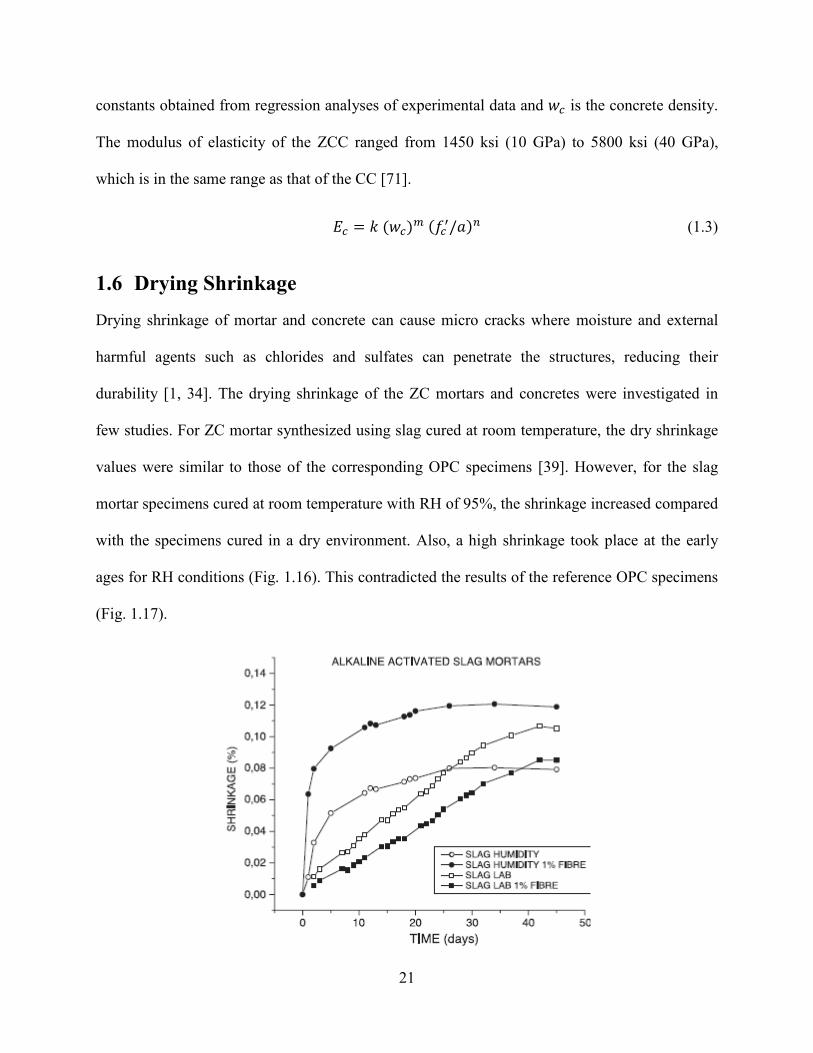
21
constants obtained from regression analyses of experimental data and 𝑤𝑐 is the concrete density.
The modulus of elasticity of the ZCC ranged from 1450 ksi (10 GPa) to 5800 ksi (40 GPa),
which is in the same range as that of the CC [71].
𝐸𝑐 = 𝑘 (𝑤𝑐)𝑚 (𝑓𝑐′/𝑎)𝑛 (1.3)
1.6 Drying Shrinkage Drying shrinkage of mortar and concrete can cause micro cracks where moisture and external
harmful agents such as chlorides and sulfates can penetrate the structures, reducing their
durability [1, 34]. The drying shrinkage of the ZC mortars and concretes were investigated in
few studies. For ZC mortar synthesized using slag cured at room temperature, the dry shrinkage
values were similar to those of the corresponding OPC specimens [39]. However, for the slag
mortar specimens cured at room temperature with RH of 95%, the shrinkage increased compared
with the specimens cured in a dry environment. Also, a high shrinkage took place at the early
ages for RH conditions (Fig. 1.16). This contradicted the results of the reference OPC specimens
(Fig. 1.17).
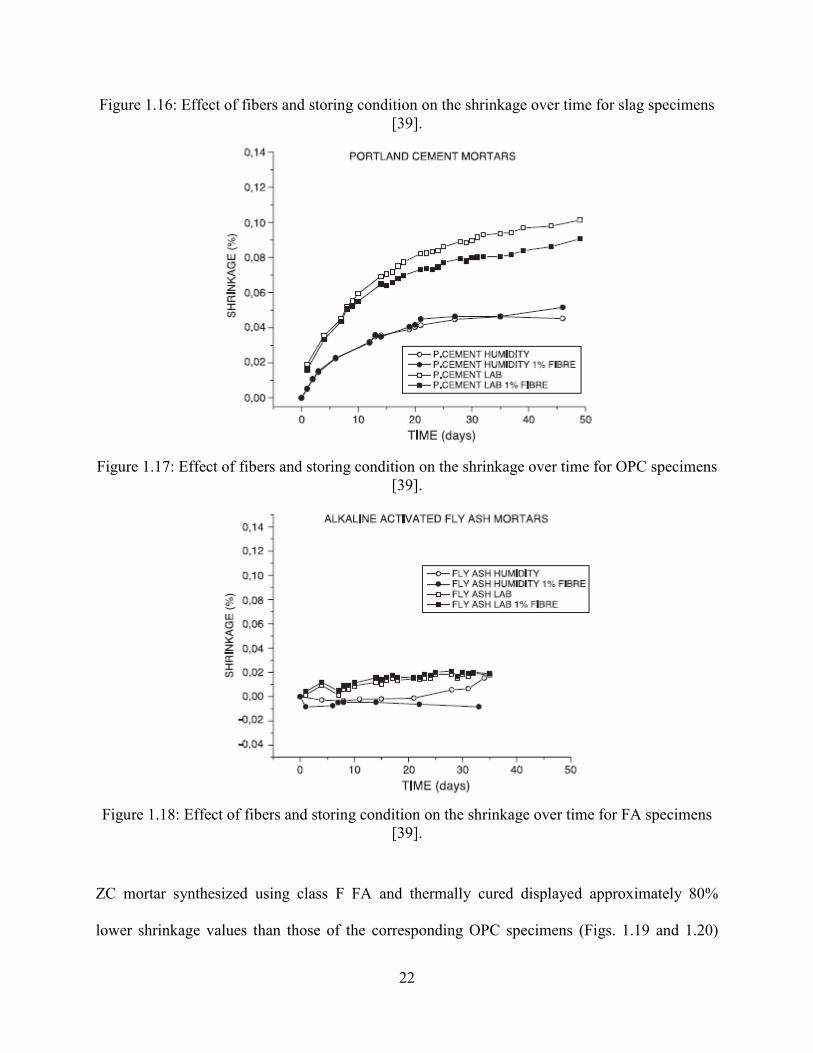
22
Figure 1.16: Effect of fibers and storing condition on the shrinkage over time for slag specimens [39].
Figure 1.17: Effect of fibers and storing condition on the shrinkage over time for OPC specimens
[39].
Figure 1.18: Effect of fibers and storing condition on the shrinkage over time for FA specimens
[39].
ZC mortar synthesized using class F FA and thermally cured displayed approximately 80%
lower shrinkage values than those of the corresponding OPC specimens (Figs. 1.19 and 1.20)

23
[34, 39]. Placing the ZC mortar synthesized using class F FA in 95% RH, i.e., where free water
was available, decreased the shrinkage slightly compared with dry conditions [39]. Similarly,
using 1% fiber did not significantly change the shrinkage [39].
Figure 1.19: Drying shrinkage in ZC and OPC mortars [34].
Figure 1.20: Effect of fibers and storing condition on the shrinkage over time for FA specimens
[39].
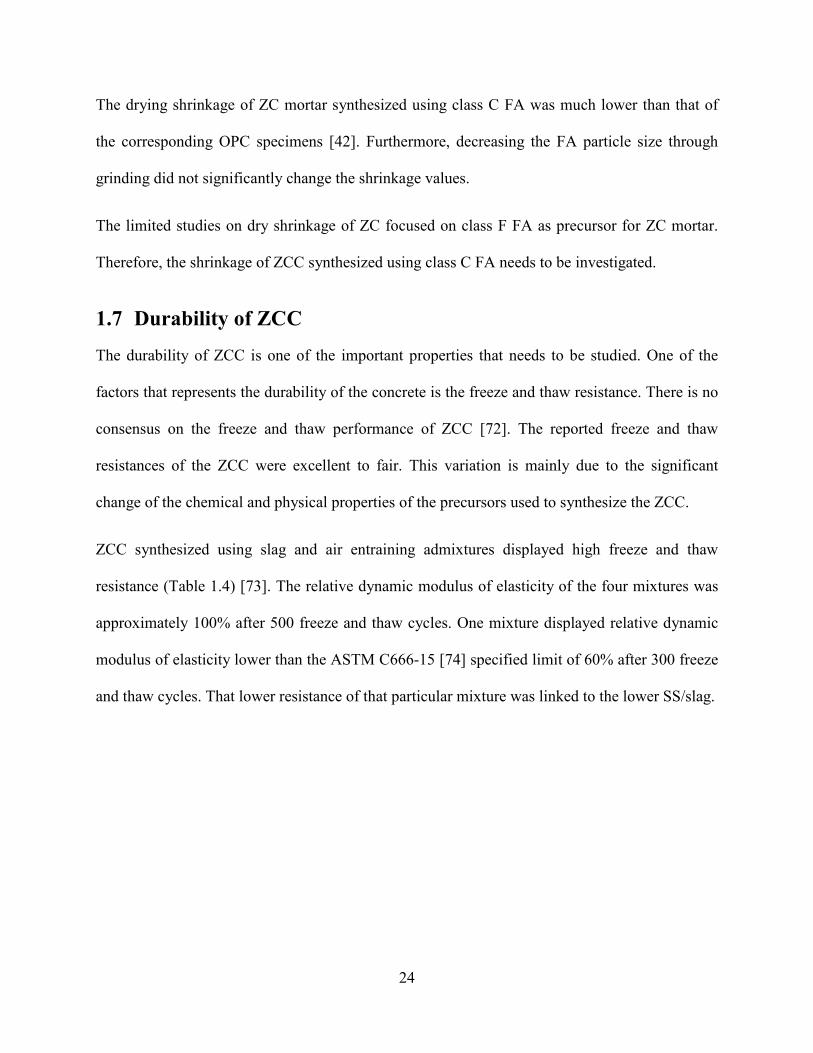
24
The drying shrinkage of ZC mortar synthesized using class C FA was much lower than that of
the corresponding OPC specimens [42]. Furthermore, decreasing the FA particle size through
grinding did not significantly change the shrinkage values.
The limited studies on dry shrinkage of ZC focused on class F FA as precursor for ZC mortar.
Therefore, the shrinkage of ZCC synthesized using class C FA needs to be investigated.
1.7 Durability of ZCC The durability of ZCC is one of the important properties that needs to be studied. One of the
factors that represents the durability of the concrete is the freeze and thaw resistance. There is no
consensus on the freeze and thaw performance of ZCC [72]. The reported freeze and thaw
resistances of the ZCC were excellent to fair. This variation is mainly due to the significant
change of the chemical and physical properties of the precursors used to synthesize the ZCC.
ZCC synthesized using slag and air entraining admixtures displayed high freeze and thaw
resistance (Table 1.4) [73]. The relative dynamic modulus of elasticity of the four mixtures was
approximately 100% after 500 freeze and thaw cycles. One mixture displayed relative dynamic
modulus of elasticity lower than the ASTM C666-15 [74] specified limit of 60% after 300 freeze
and thaw cycles. That lower resistance of that particular mixture was linked to the lower SS/slag.
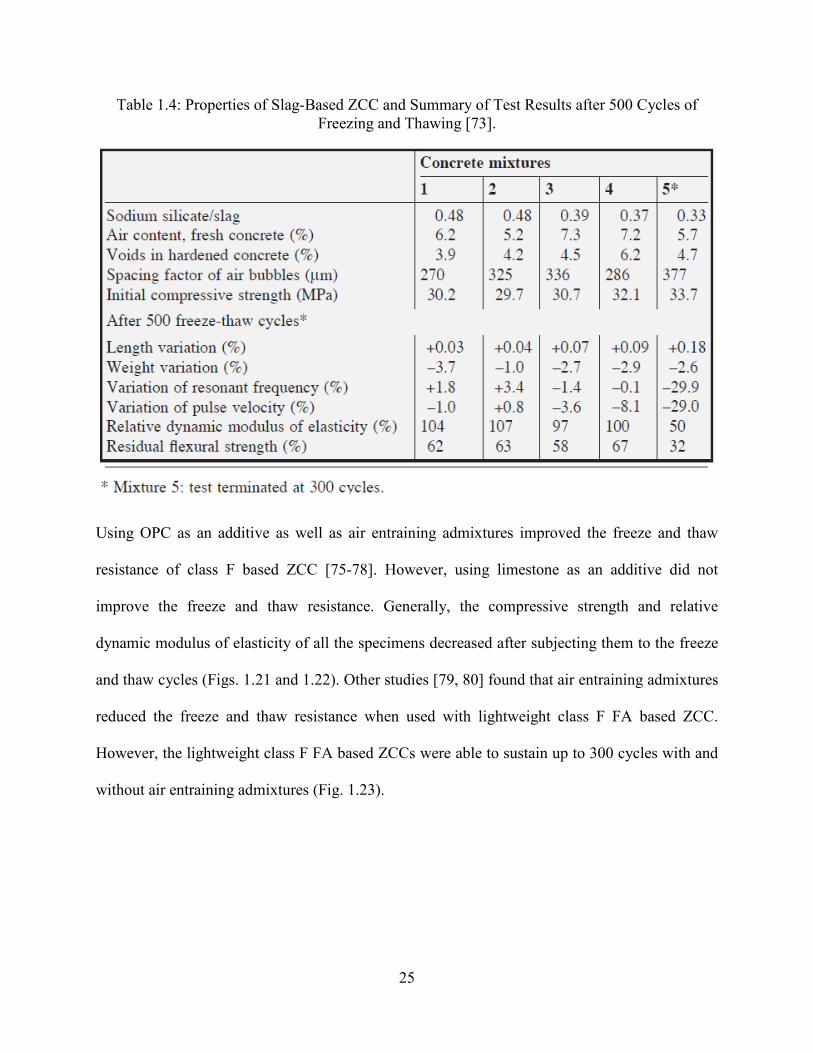
25
Table 1.4: Properties of Slag-Based ZCC and Summary of Test Results after 500 Cycles of Freezing and Thawing [73].
Using OPC as an additive as well as air entraining admixtures improved the freeze and thaw
resistance of class F based ZCC [75-78]. However, using limestone as an additive did not
improve the freeze and thaw resistance. Generally, the compressive strength and relative
dynamic modulus of elasticity of all the specimens decreased after subjecting them to the freeze
and thaw cycles (Figs. 1.21 and 1.22). Other studies [79, 80] found that air entraining admixtures
reduced the freeze and thaw resistance when used with lightweight class F FA based ZCC.
However, the lightweight class F FA based ZCCs were able to sustain up to 300 cycles with and
without air entraining admixtures (Fig. 1.23).
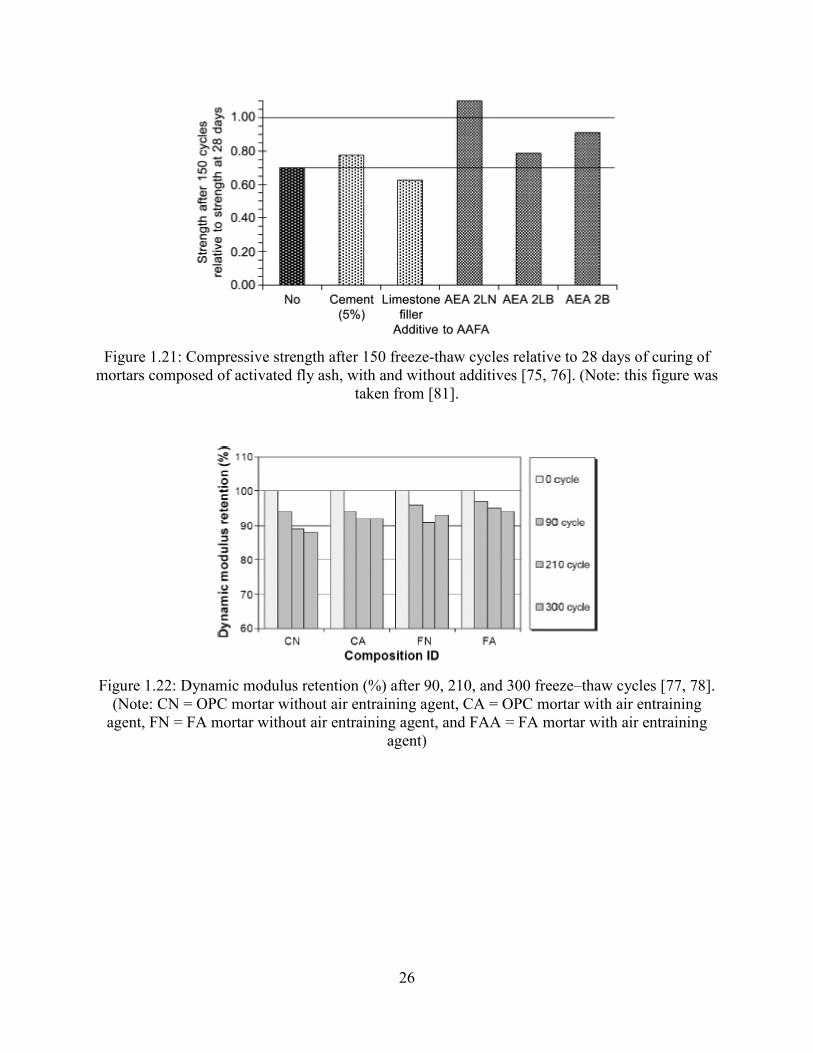
26
Figure 1.21: Compressive strength after 150 freeze-thaw cycles relative to 28 days of curing of
mortars composed of activated fly ash, with and without additives [75, 76]. (Note: this figure was taken from [81].
Figure 1.22: Dynamic modulus retention (%) after 90, 210, and 300 freeze–thaw cycles [77, 78].
(Note: CN = OPC mortar without air entraining agent, CA = OPC mortar with air entraining agent, FN = FA mortar without air entraining agent, and FAA = FA mortar with air entraining
agent)
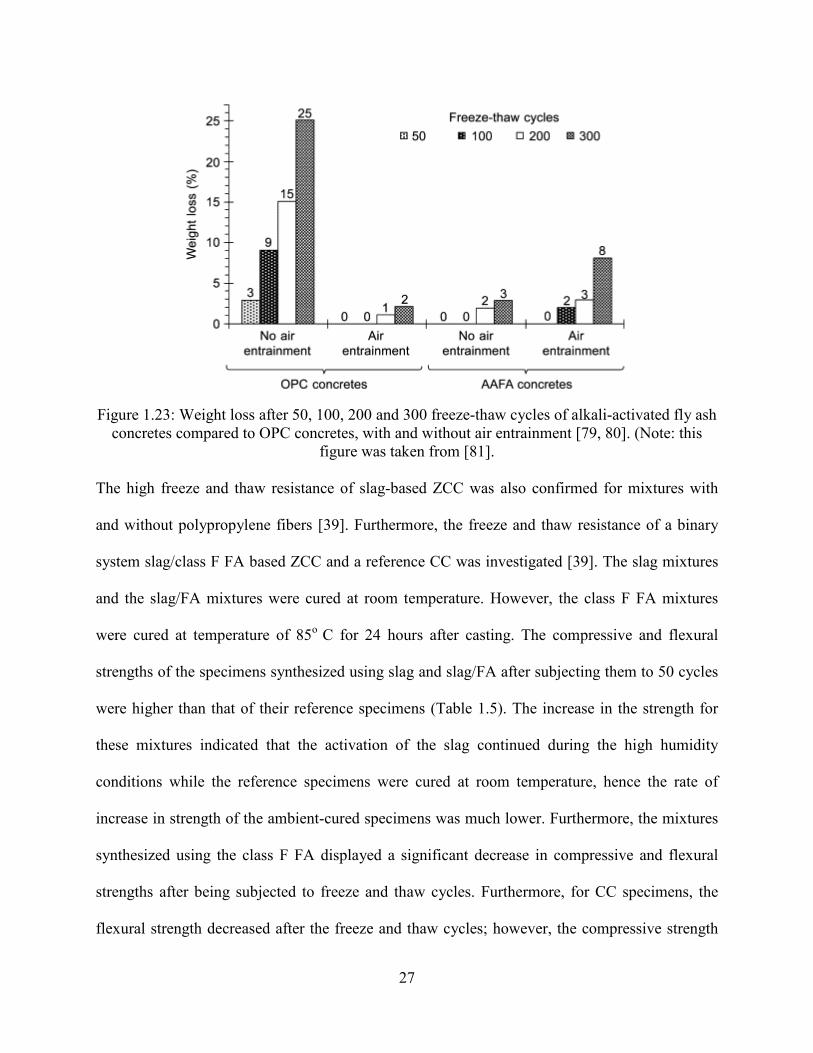
27
Figure 1.23: Weight loss after 50, 100, 200 and 300 freeze-thaw cycles of alkali-activated fly ash
concretes compared to OPC concretes, with and without air entrainment [79, 80]. (Note: this figure was taken from [81].
The high freeze and thaw resistance of slag-based ZCC was also confirmed for mixtures with
and without polypropylene fibers [39]. Furthermore, the freeze and thaw resistance of a binary
system slag/class F FA based ZCC and a reference CC was investigated [39]. The slag mixtures
and the slag/FA mixtures were cured at room temperature. However, the class F FA mixtures
were cured at temperature of 85o C for 24 hours after casting. The compressive and flexural
strengths of the specimens synthesized using slag and slag/FA after subjecting them to 50 cycles
were higher than that of their reference specimens (Table 1.5). The increase in the strength for
these mixtures indicated that the activation of the slag continued during the high humidity
conditions while the reference specimens were cured at room temperature, hence the rate of
increase in strength of the ambient-cured specimens was much lower. Furthermore, the mixtures
synthesized using the class F FA displayed a significant decrease in compressive and flexural
strengths after being subjected to freeze and thaw cycles. Furthermore, for CC specimens, the
flexural strength decreased after the freeze and thaw cycles; however, the compressive strength
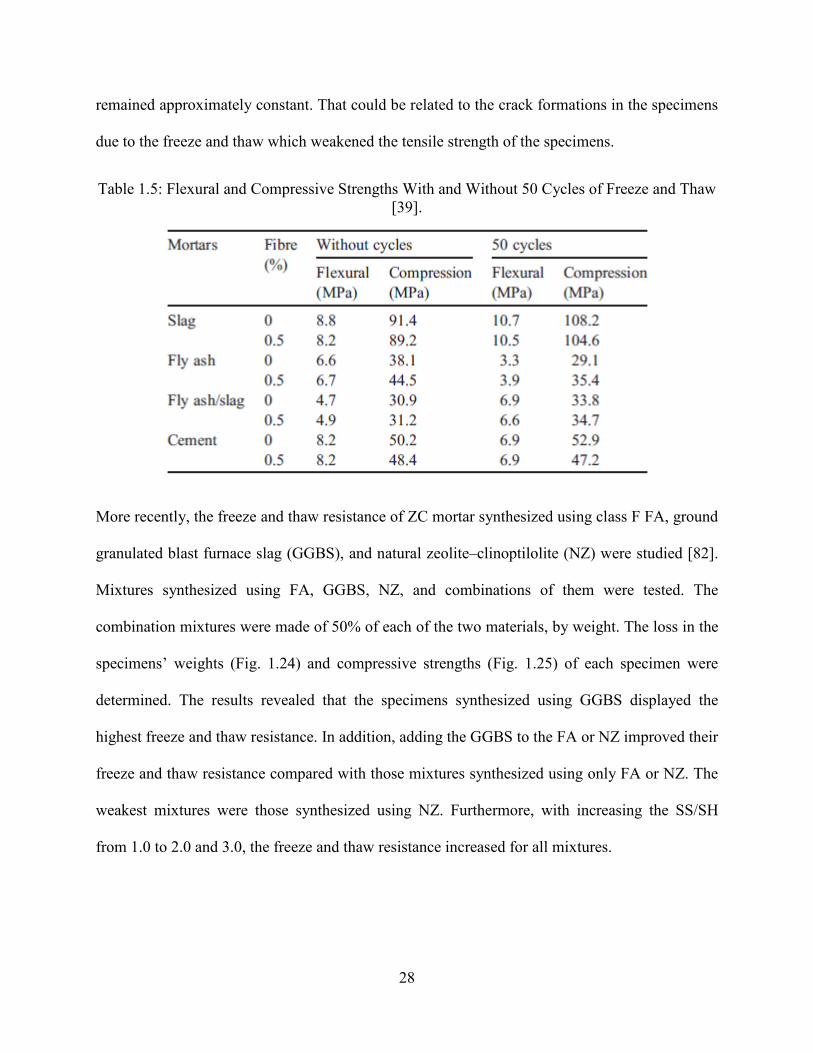
28
remained approximately constant. That could be related to the crack formations in the specimens
due to the freeze and thaw which weakened the tensile strength of the specimens.
Table 1.5: Flexural and Compressive Strengths With and Without 50 Cycles of Freeze and Thaw [39].
More recently, the freeze and thaw resistance of ZC mortar synthesized using class F FA, ground
granulated blast furnace slag (GGBS), and natural zeolite–clinoptilolite (NZ) were studied [82].
Mixtures synthesized using FA, GGBS, NZ, and combinations of them were tested. The
combination mixtures were made of 50% of each of the two materials, by weight. The loss in the
specimens’ weights (Fig. 1.24) and compressive strengths (Fig. 1.25) of each specimen were
determined. The results revealed that the specimens synthesized using GGBS displayed the
highest freeze and thaw resistance. In addition, adding the GGBS to the FA or NZ improved their
freeze and thaw resistance compared with those mixtures synthesized using only FA or NZ. The
weakest mixtures were those synthesized using NZ. Furthermore, with increasing the SS/SH
from 1.0 to 2.0 and 3.0, the freeze and thaw resistance increased for all mixtures.
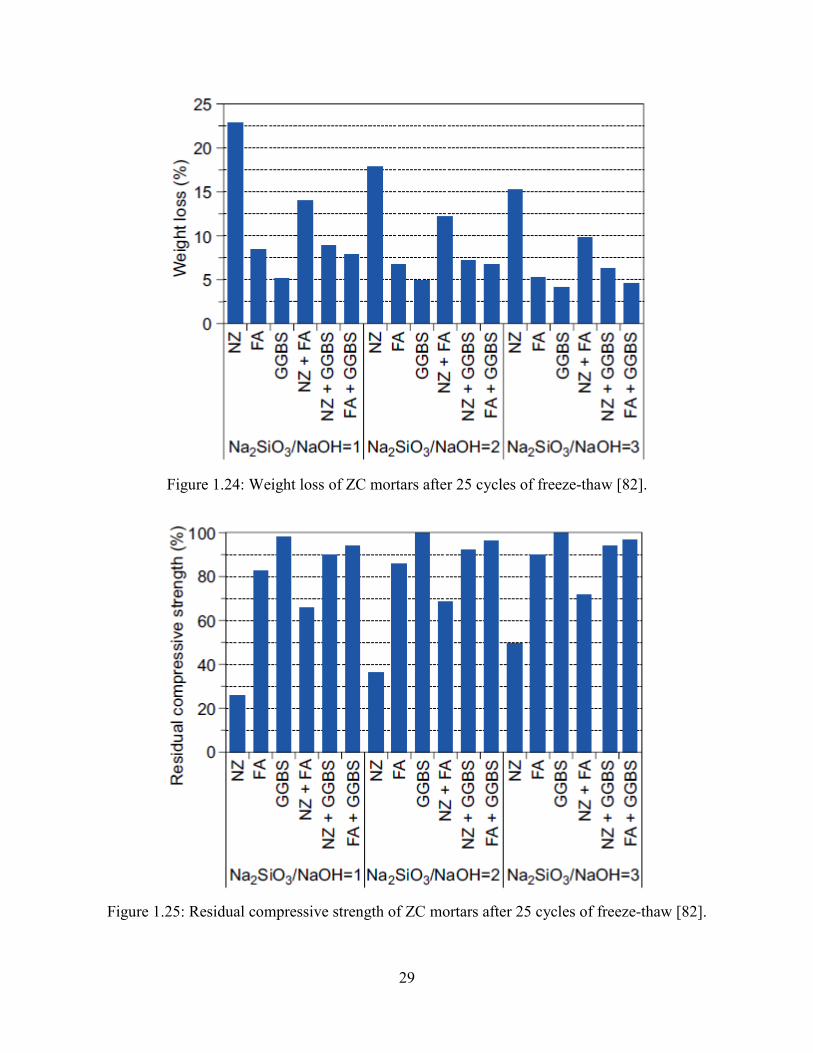
29
Figure 1.24: Weight loss of ZC mortars after 25 cycles of freeze-thaw [82].
Figure 1.25: Residual compressive strength of ZC mortars after 25 cycles of freeze-thaw [82].

30
Studies on freeze and thaw resistance of class C FA based ZCC are very limited. The freeze and
thaw of ZCC synthesized using two different radioactive high-calcium FAs were studied [5]. The
two FAs, referred to as Shivee Ovoo and Baganuur, had calcium content of 30.19% and 14.24%
and are classified as class C and class F, respectively. The results revealed that the ZCC
synthesized using class C FA displayed higher compressive strength before and after sustaining
40 freeze and thaw cycles (Table 1.6). Furthermore, the specimens subjected to freeze and thaw
cycles and prepared using SS/SH of 1.0 displayed lower compressive strength compared with
those prepared using SS/SH of 0.0.
Table 1.6: Freeze and Thaw Resistance of ZCC [5].
The previous studies displayed that the freeze and thaw resistance of the ZCC synthesized using
slag were high and passed ASTM C666-15 limits [74]. In addition, adding slag to class F FA
based ZCC improved its freeze and thaw resistance. However, the freeze and thaw resistance of
ZCC synthesized using class F FA only was low. Furthermore, air entraining admixtures
generally improves the freeze and thaw resistance of ZCC synthesized using class F FA. The
freeze and thaw resistance of ZCC synthesized using class C FA has been little studied before
[5]. Therefore, it is urgent to study the freeze and thaw resistance of ZCC synthesized using class
C FA.
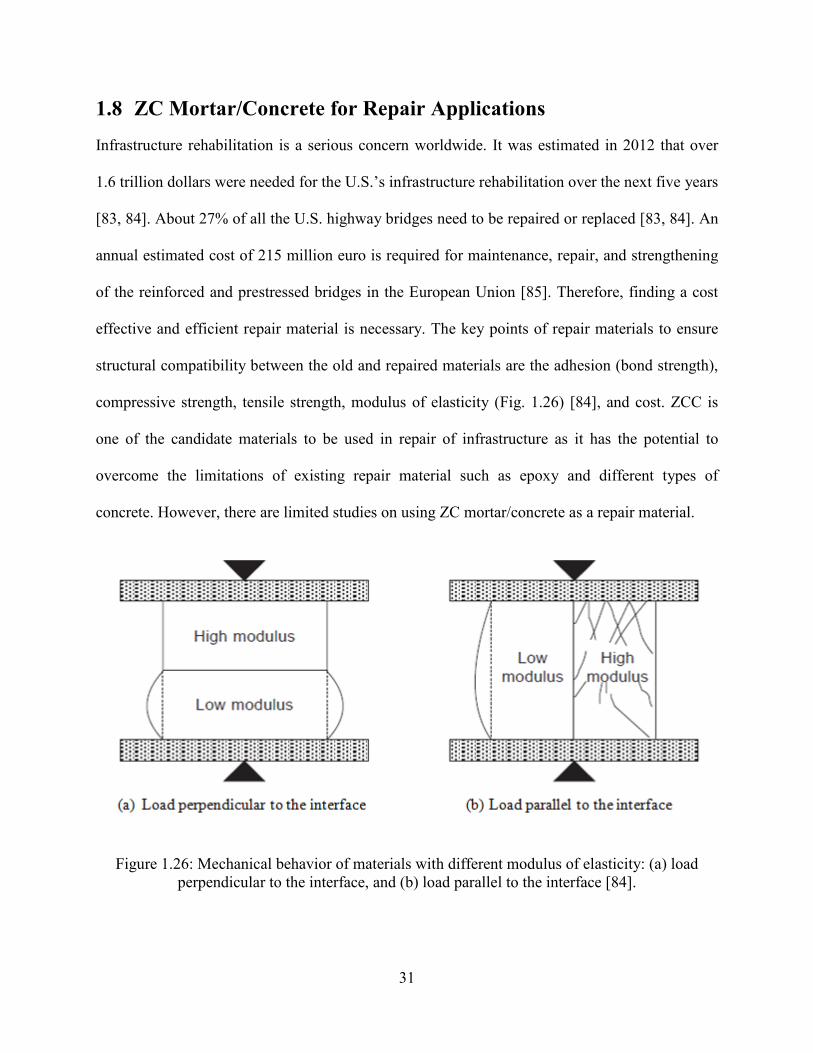
31
1.8 ZC Mortar/Concrete for Repair Applications Infrastructure rehabilitation is a serious concern worldwide. It was estimated in 2012 that over
1.6 trillion dollars were needed for the U.S.’s infrastructure rehabilitation over the next five years
[83, 84]. About 27% of all the U.S. highway bridges need to be repaired or replaced [83, 84]. An
annual estimated cost of 215 million euro is required for maintenance, repair, and strengthening
of the reinforced and prestressed bridges in the European Union [85]. Therefore, finding a cost
effective and efficient repair material is necessary. The key points of repair materials to ensure
structural compatibility between the old and repaired materials are the adhesion (bond strength),
compressive strength, tensile strength, modulus of elasticity (Fig. 1.26) [84], and cost. ZCC is
one of the candidate materials to be used in repair of infrastructure as it has the potential to
overcome the limitations of existing repair material such as epoxy and different types of
concrete. However, there are limited studies on using ZC mortar/concrete as a repair material.
Figure 1.26: Mechanical behavior of materials with different modulus of elasticity: (a) load perpendicular to the interface, and (b) load parallel to the interface [84].
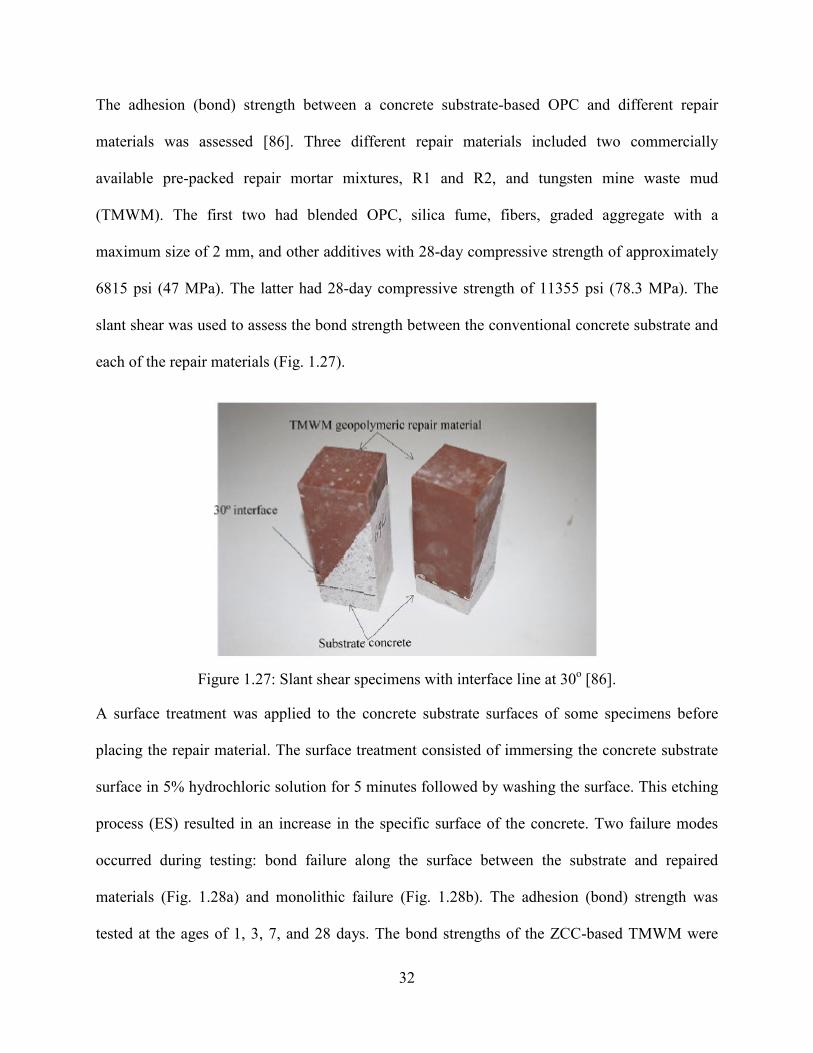
32
The adhesion (bond) strength between a concrete substrate-based OPC and different repair
materials was assessed [86]. Three different repair materials included two commercially
available pre-packed repair mortar mixtures, R1 and R2, and tungsten mine waste mud
(TMWM). The first two had blended OPC, silica fume, fibers, graded aggregate with a
maximum size of 2 mm, and other additives with 28-day compressive strength of approximately
6815 psi (47 MPa). The latter had 28-day compressive strength of 11355 psi (78.3 MPa). The
slant shear was used to assess the bond strength between the conventional concrete substrate and
each of the repair materials (Fig. 1.27).
Figure 1.27: Slant shear specimens with interface line at 30o [86].
A surface treatment was applied to the concrete substrate surfaces of some specimens before
placing the repair material. The surface treatment consisted of immersing the concrete substrate
surface in 5% hydrochloric solution for 5 minutes followed by washing the surface. This etching
process (ES) resulted in an increase in the specific surface of the concrete. Two failure modes
occurred during testing: bond failure along the surface between the substrate and repaired
materials (Fig. 1.28a) and monolithic failure (Fig. 1.28b). The adhesion (bond) strength was
tested at the ages of 1, 3, 7, and 28 days. The bond strengths of the ZCC-based TMWM were
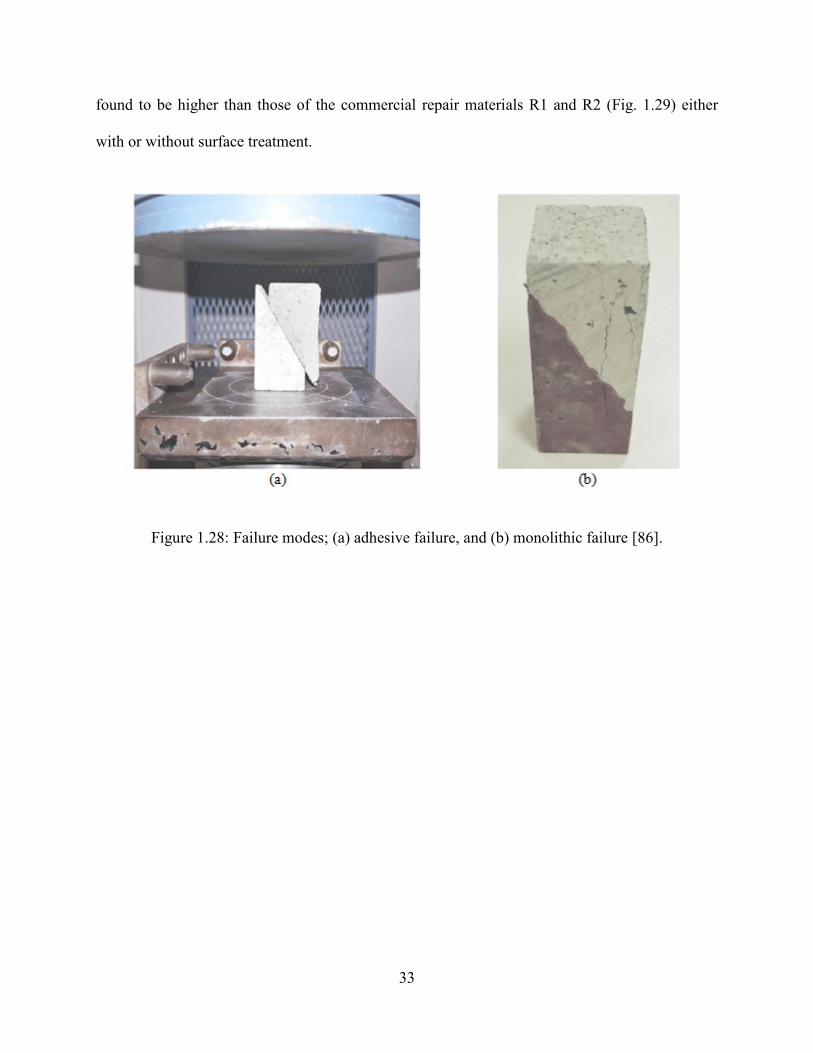
33
found to be higher than those of the commercial repair materials R1 and R2 (Fig. 1.29) either
with or without surface treatment.
Figure 1.28: Failure modes; (a) adhesive failure, and (b) monolithic failure [86].
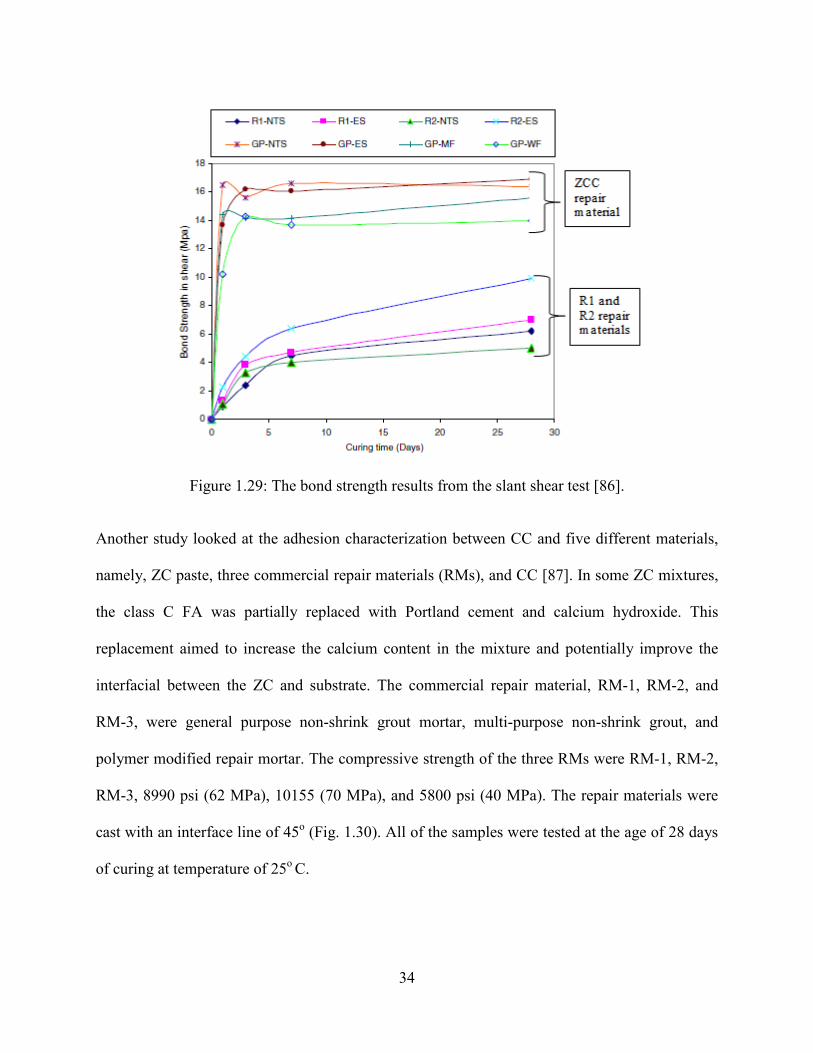
34
Figure 1.29: The bond strength results from the slant shear test [86].
Another study looked at the adhesion characterization between CC and five different materials,
namely, ZC paste, three commercial repair materials (RMs), and CC [87]. In some ZC mixtures,
the class C FA was partially replaced with Portland cement and calcium hydroxide. This
replacement aimed to increase the calcium content in the mixture and potentially improve the
interfacial between the ZC and substrate. The commercial repair material, RM-1, RM-2, and
RM-3, were general purpose non-shrink grout mortar, multi-purpose non-shrink grout, and
polymer modified repair mortar. The compressive strength of the three RMs were RM-1, RM-2,
RM-3, 8990 psi (62 MPa), 10155 (70 MPa), and 5800 psi (40 MPa). The repair materials were
cast with an interface line of 45o (Fig. 1.30). All of the samples were tested at the age of 28 days
of curing at temperature of 25o C.
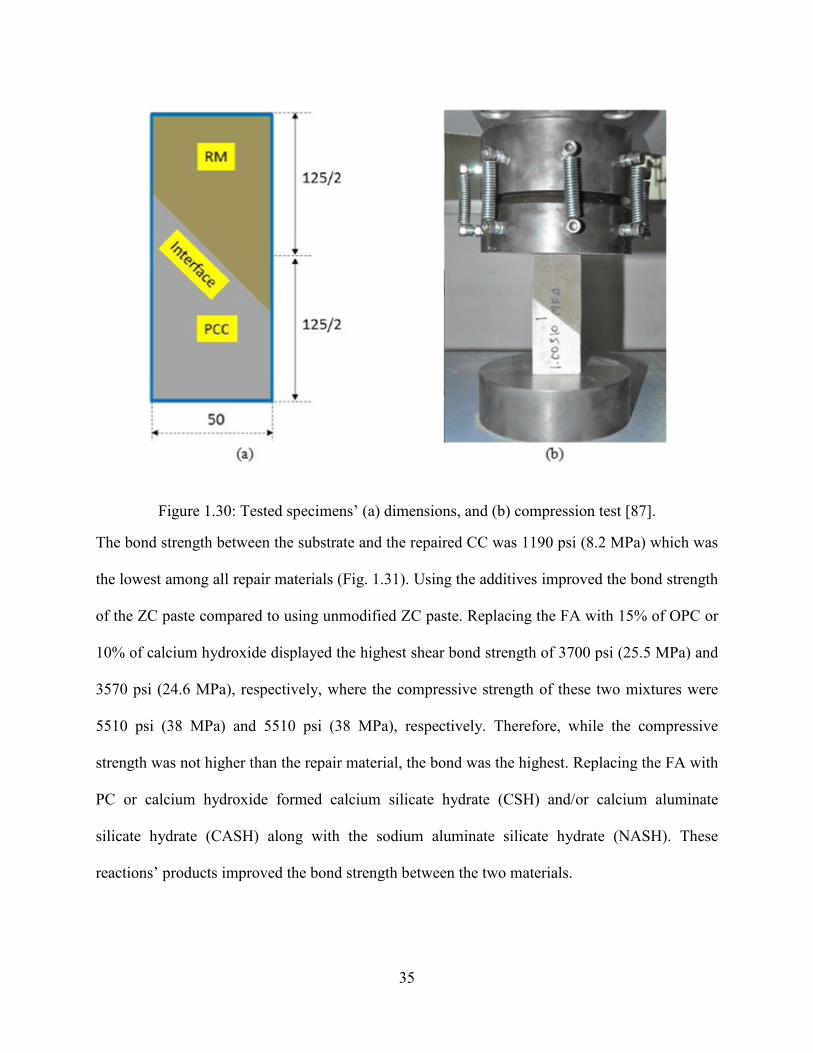
35
Figure 1.30: Tested specimens’ (a) dimensions, and (b) compression test [87].
The bond strength between the substrate and the repaired CC was 1190 psi (8.2 MPa) which was
the lowest among all repair materials (Fig. 1.31). Using the additives improved the bond strength
of the ZC paste compared to using unmodified ZC paste. Replacing the FA with 15% of OPC or
10% of calcium hydroxide displayed the highest shear bond strength of 3700 psi (25.5 MPa) and
3570 psi (24.6 MPa), respectively, where the compressive strength of these two mixtures were
5510 psi (38 MPa) and 5510 psi (38 MPa), respectively. Therefore, while the compressive
strength was not higher than the repair material, the bond was the highest. Replacing the FA with
PC or calcium hydroxide formed calcium silicate hydrate (CSH) and/or calcium aluminate
silicate hydrate (CASH) along with the sodium aluminate silicate hydrate (NASH). These
reactions’ products improved the bond strength between the two materials.
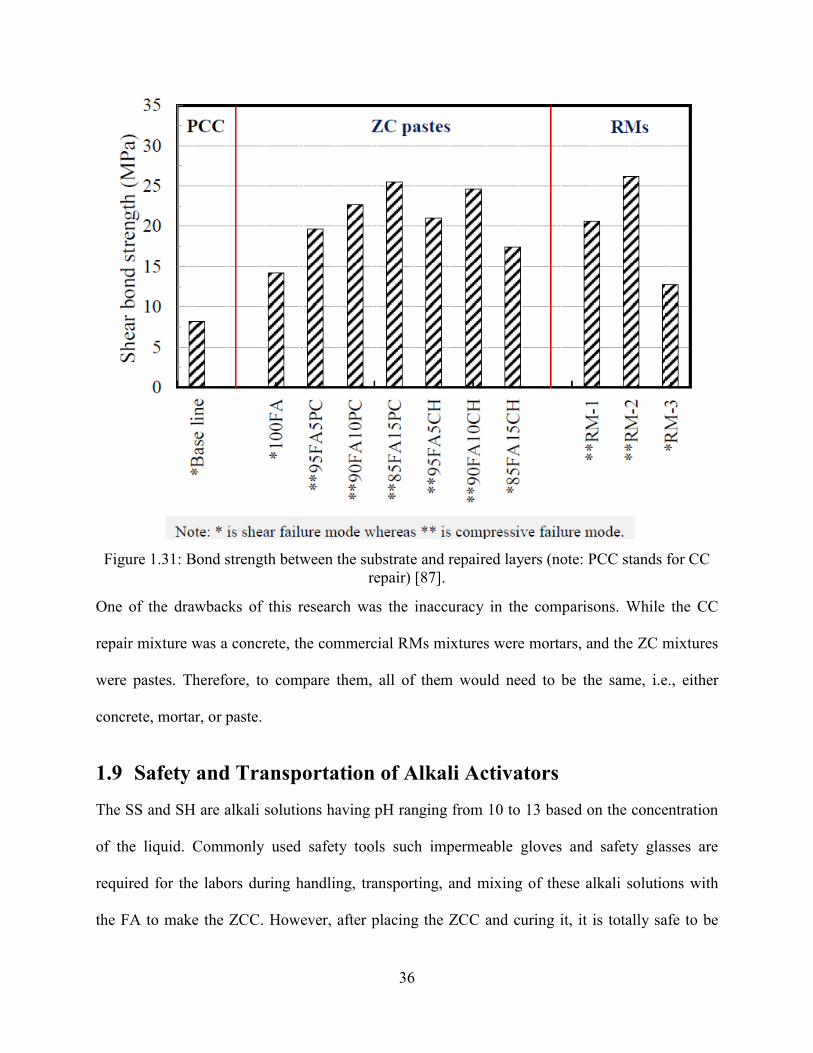
36
Figure 1.31: Bond strength between the substrate and repaired layers (note: PCC stands for CC
repair) [87].
One of the drawbacks of this research was the inaccuracy in the comparisons. While the CC
repair mixture was a concrete, the commercial RMs mixtures were mortars, and the ZC mixtures
were pastes. Therefore, to compare them, all of them would need to be the same, i.e., either
concrete, mortar, or paste.
1.9 Safety and Transportation of Alkali Activators The SS and SH are alkali solutions having pH ranging from 10 to 13 based on the concentration
of the liquid. Commonly used safety tools such impermeable gloves and safety glasses are
required for the labors during handling, transporting, and mixing of these alkali solutions with
the FA to make the ZCC. However, after placing the ZCC and curing it, it is totally safe to be
37
handled, moved, and tested using bare hands. The supplies for the personal safety tools are
specified in the Materials Safety Data Sheets that are available with the commercial alkali
activated materials are quite similar to those specified for the CC. Similar to CC, the tools such
as mixer, wheelbarrow, scoop, rod, and mold that are used during the mixing and casting of the
ZCC need to be cleaned using a running water. It does not require special drainage pipelines or
cleaning process.
1.10 Cost and CO2 The cost of raw material required for ZCC is comparable to that of CC. Large-scale usage of
ZCC will likely lead to lower costs due to large orders of reagents, which is the most expensive
component. Depending on the binder-source location, the energy source, and the mode of
transportation, zero-cement concrete can be financially and environmentally efficient, leading to
a potential reduction of 44% to 64% in CO2 emissions while financial costs range from 7% lower
to 39% higher compared to conventional concrete [88]. Furthermore, the embodied energy of
FA-based zero-cement concrete was found to be 40% less than that of CC. The sodium
hydroxide and sodium silicate contributed 34% and 21%, respectively, to the cost of the ZCC
[89].
1.11 Objective and Organization of this Report The overarching objective of this research is to study the feasibility of using the locally available
fly ashes (FAs) to make zero-cement concrete (ZCC) for different structural and repair
applications. ZCC is relatively new class of concrete that does not include any ordinary Portland
cement (OPC) and relies on other alternative materials such as fly ash, slag, etc. as the binder. To
38
achieve the objectives of this research, different tasks were carried out (Fig. 32) and summarized
in this report. The report is organized in the following chapters:
Chapter 1: Literature review
This chapter presents a brief overview of the literature available on precursors, alkaline
activators, mixing, curing, performance, and cost of zero-cement concrete.
Chapter 2: Material properties
This chapter presents a comprehensive characterization for the materials that were used in this
project. This includes the particle size distribution of the aggregates, chemical and physical
properties of the fly ash sourced from five different power plants, and properties of the alkali
activators.
Chapter 3: Trial mixtures and mixing procedures of zero-cement mortars and concrete
Using high calcium FAs to synthesized ZC mortar and concrete is relatively new. Therefore,
finding the best mixing procedure for ZC mortar and concrete is essential. Chapter 3 presents the
best mixing procedure for ZC mortar and concrete. In addition, the appropriate ranges of
water/fly ash (W/FA), alkali activators/fly ash (Alk/FA), and sodium silicate to sodium
hydroxide (SS/SH) to synthesize ZC mortar and concrete with acceptable workability and setting
time as well as adequate strength for structural applications were investigated and presented.
Chapter 4: Fresh properties and strength of zero-cement mortar
The appropriate mixing procedure and ranges were determined and presented in Chapter 3. A
fine-tuning and optimization procedure for ZC mortar was carried out and presented in Chapter
39
4. The purpose of this chapter was to study the effect of W/FA, Alk/FA, and SS/SH on the fresh
properties and compressive strength of ZC mortars.
Chapter 5: Optimization of thermal curing temperature and duration of zero-cement
mortar
This chapter investigates the effect of different curing durations and temperatures on the
compressive strength of ZC mortar. Curing temperatures ranging from 185o F (85o C) to 86o F
(30o C) applied over durations ranging from 4 hours to 168 hours were investigated. In addition,
hot weather common during the summer in the state of Missouri was imitated using two different
curing regimes.
Chapter 6: Mechanical properties and drying shrinkage of zero-cement concrete
This chapter presents the fresh and mechanical properties of ZCC. Five ZCC mixtures were
prepared and subjected to three different curing regimes including oven, ambient, and moist
curing. The fresh properties including the slump, unit weight, air content, and temperature are
presented in Chapter 6. The mechanical properties including the compressive strength, splitting
tensile strength, modulus of elasticity, flexural strength are also presented.
Chapter 7: Durability of zero-cement concrete
This chapter presents the durability of ZCC. Durability was investigated by testing the freeze and
thaw resistance, surface resistivity, bulk electrical conductivity, and rapid chloride ion
penetration. Also, the effects of adding slag, crumb rubber, and air entraining admixture (AEA)
to ZCC mixtures was investigated and presented.
Chapter 8: Zero-cement concrete as a repair material
40
This chapter presents the results of slant shear and pull-off tests on ZCC used as a repair
material. Specimens were constructed out of CC mixtures representing the host structure, i.e., the
existing concrete structural elements. Then, ZCC was used as a repair material by placing it
against the CC specimens. The repair procedures and results of both tests are presented.
Chapter 9: Cost analysis
This chapter presents a cost analysis for the ZCC and CC mixtures.
Chapter 10: Conclusions, recommendations, and future work
This chapter provides a summary of the main findings of this project. In addition,
recommendations for synthesizing ZCC are presented, as well as suggestions for future studies
on ZCC are presented as well.
Chapter 11: References
This chapter includes bibliographical references.
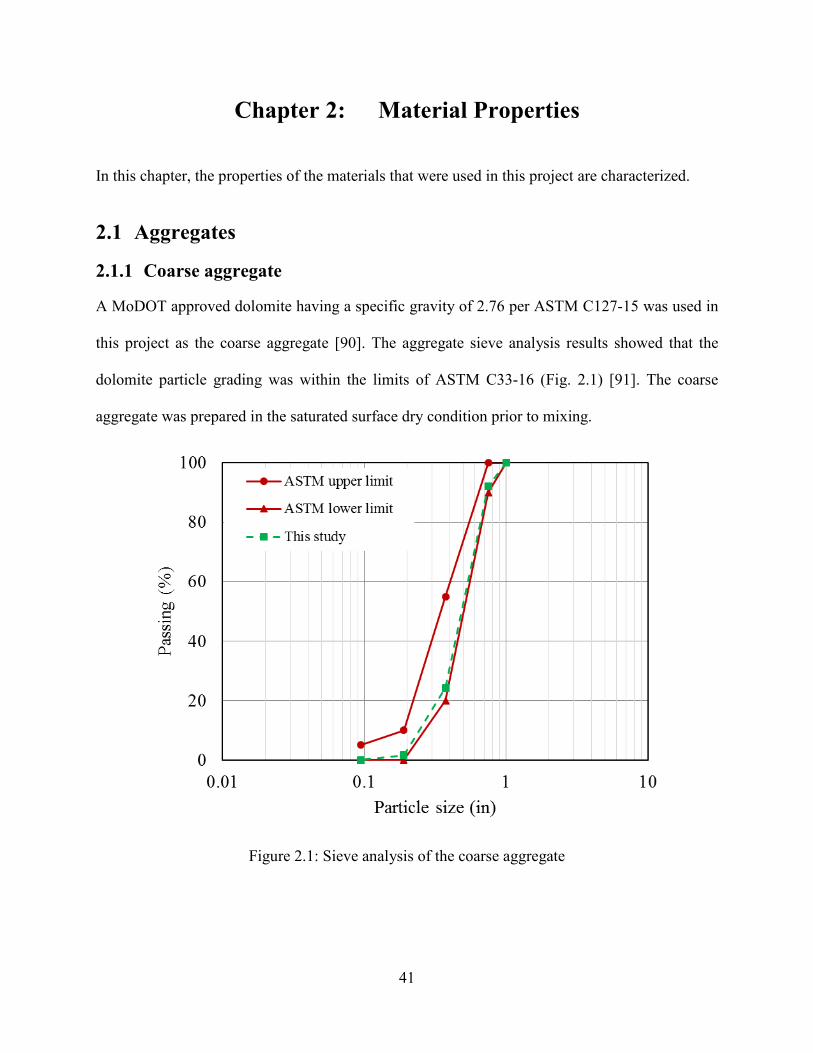
41
Chapter 2: Material Properties
In this chapter, the properties of the materials that were used in this project are characterized.
2.1 Aggregates
2.1.1 Coarse aggregate
A MoDOT approved dolomite having a specific gravity of 2.76 per ASTM C127-15 was used in
this project as the coarse aggregate [90]. The aggregate sieve analysis results showed that the
dolomite particle grading was within the limits of ASTM C33-16 (Fig. 2.1) [91]. The coarse
aggregate was prepared in the saturated surface dry condition prior to mixing.
Figure 2.1: Sieve analysis of the coarse aggregate
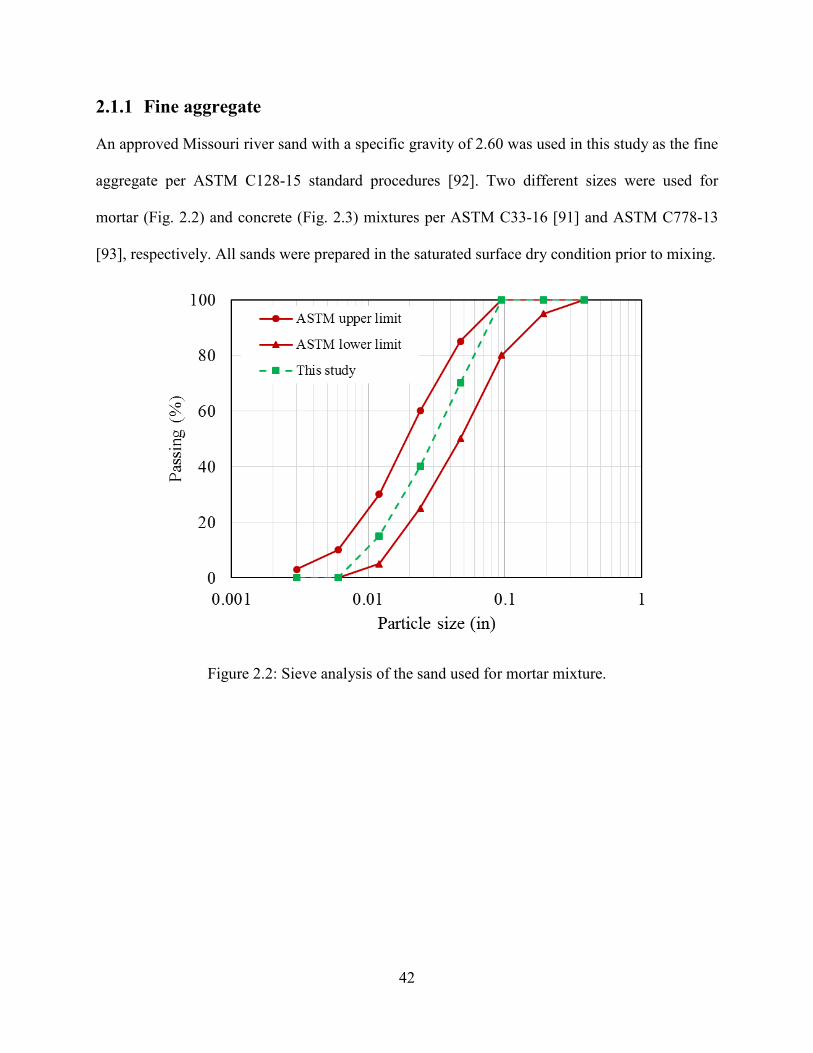
42
2.1.1 Fine aggregate
An approved Missouri river sand with a specific gravity of 2.60 was used in this study as the fine
aggregate per ASTM C128-15 standard procedures [92]. Two different sizes were used for
mortar (Fig. 2.2) and concrete (Fig. 2.3) mixtures per ASTM C33-16 [91] and ASTM C778-13
[93], respectively. All sands were prepared in the saturated surface dry condition prior to mixing.
Figure 2.2: Sieve analysis of the sand used for mortar mixture.
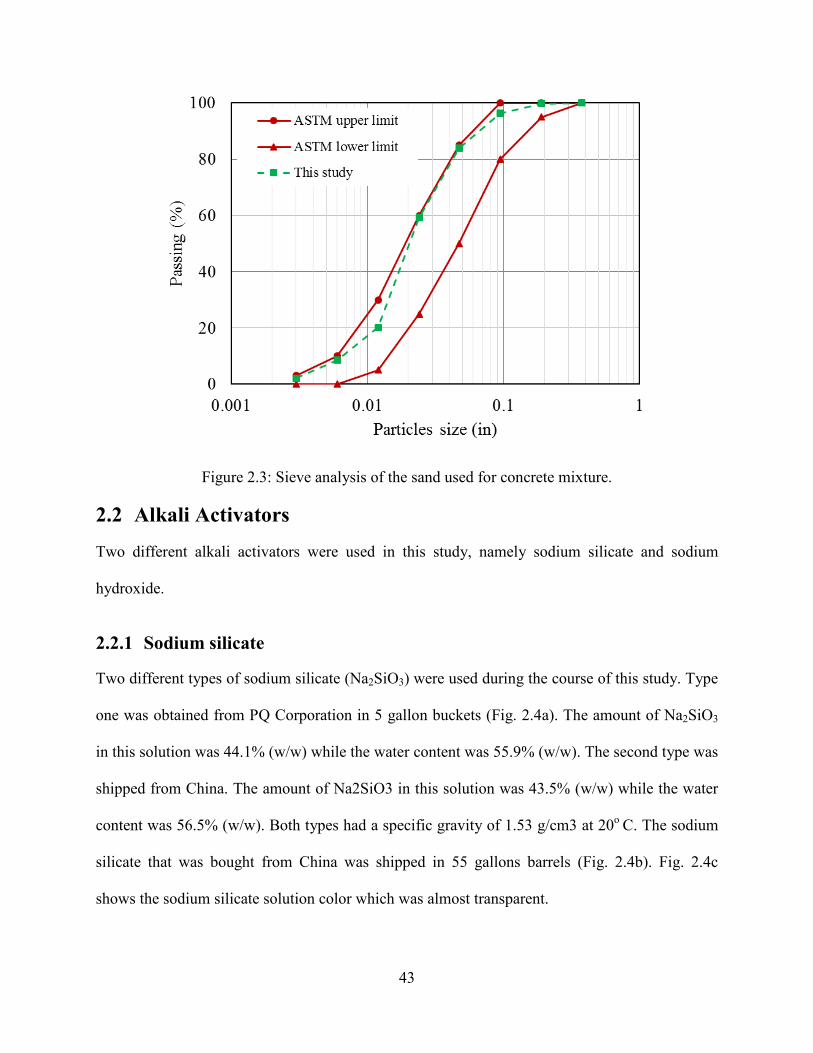
43
Figure 2.3: Sieve analysis of the sand used for concrete mixture.
2.2 Alkali Activators Two different alkali activators were used in this study, namely sodium silicate and sodium
hydroxide.
2.2.1 Sodium silicate
Two different types of sodium silicate (Na2SiO3) were used during the course of this study. Type
one was obtained from PQ Corporation in 5 gallon buckets (Fig. 2.4a). The amount of Na2SiO3
in this solution was 44.1% (w/w) while the water content was 55.9% (w/w). The second type was
shipped from China. The amount of Na2SiO3 in this solution was 43.5% (w/w) while the water
content was 56.5% (w/w). Both types had a specific gravity of 1.53 g/cm3 at 20o C. The sodium
silicate that was bought from China was shipped in 55 gallons barrels (Fig. 2.4b). Fig. 2.4c
shows the sodium silicate solution color which was almost transparent.

44
Figure 2.4: Sodium silicate solution (a) 5 gallon bucket, (b) 55 gallon barrel, (c) color.
2.2.2 Sodium hydroxide
The sodium hydroxide was obtained in solid pellet form from Bulk Apothecary Company (Fig.
2.5a). A sodium hydroxide solution with molarity of 10 M was prepared 24 hours prior to the
mixing day to let the solution cool down to room temperature. It was not a necessary condition
that the solution is prepared 24 hours prior to mixing, only that it was cooled to room
temperature before mixing. The SH solution molarity was fixed at 10 M, which was obtained by
mixing 314 gm of the SH solid pellets with 686 gm of distilled water (Fig. 2.5b).
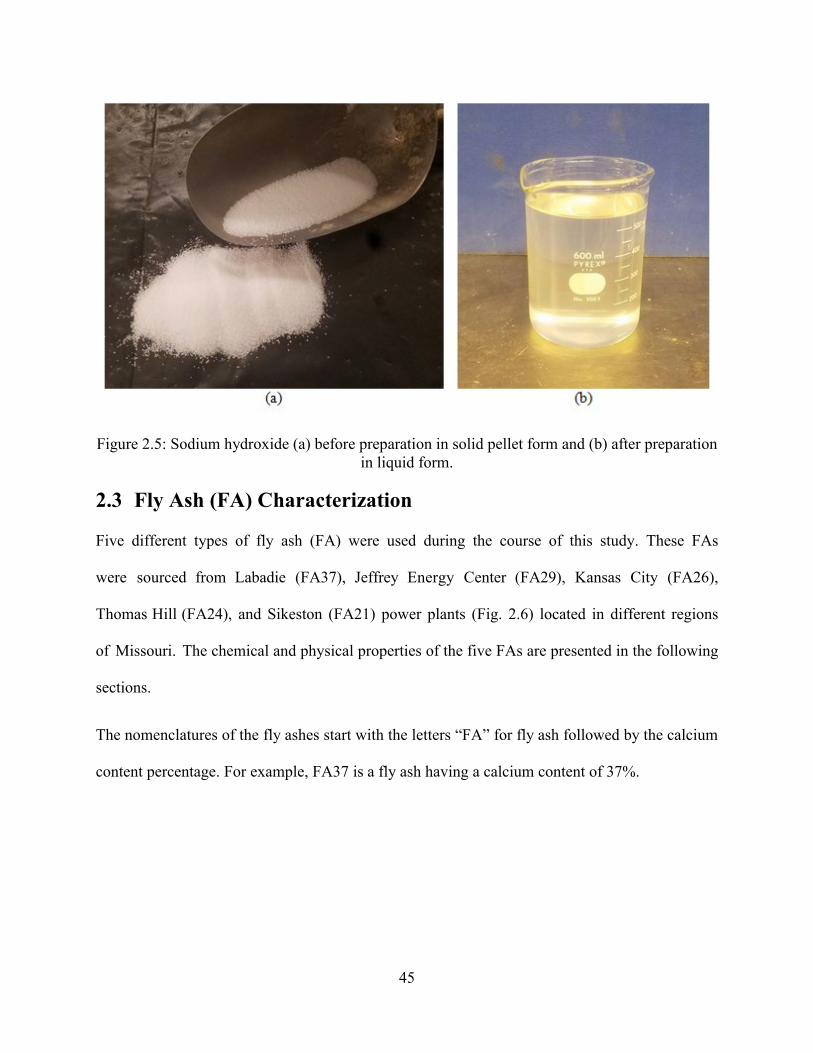
45
Figure 2.5: Sodium hydroxide (a) before preparation in solid pellet form and (b) after preparation in liquid form.
2.3 Fly Ash (FA) Characterization
Five different types of fly ash (FA) were used during the course of this study. These FAs
were sourced from Labadie (FA37), Jeffrey Energy Center (FA29), Kansas City (FA26),
Thomas Hill (FA24), and Sikeston (FA21) power plants (Fig. 2.6) located in different regions
of Missouri. The chemical and physical properties of the five FAs are presented in the following
sections.
The nomenclatures of the fly ashes start with the letters “FA” for fly ash followed by the calcium
content percentage. For example, FA37 is a fly ash having a calcium content of 37%.
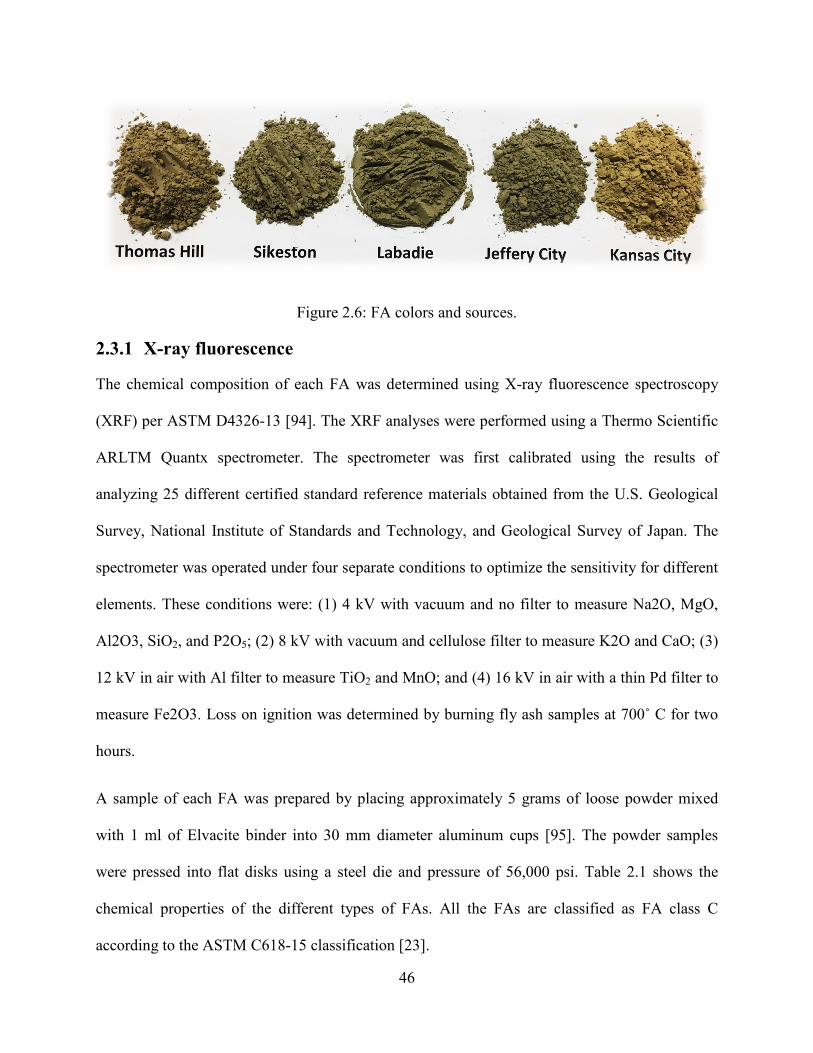
46
Figure 2.6: FA colors and sources.
2.3.1 X-ray fluorescence
The chemical composition of each FA was determined using X-ray fluorescence spectroscopy
(XRF) per ASTM D4326-13 [94]. The XRF analyses were performed using a Thermo Scientific
ARLTM Quantx spectrometer. The spectrometer was first calibrated using the results of
analyzing 25 different certified standard reference materials obtained from the U.S. Geological
Survey, National Institute of Standards and Technology, and Geological Survey of Japan. The
spectrometer was operated under four separate conditions to optimize the sensitivity for different
elements. These conditions were: (1) 4 kV with vacuum and no filter to measure Na2O, MgO,
Al2O3, SiO2, and P2O5; (2) 8 kV with vacuum and cellulose filter to measure K2O and CaO; (3)
12 kV in air with Al filter to measure TiO2 and MnO; and (4) 16 kV in air with a thin Pd filter to
measure Fe2O3. Loss on ignition was determined by burning fly ash samples at 700˚ C for two
hours.
A sample of each FA was prepared by placing approximately 5 grams of loose powder mixed
with 1 ml of Elvacite binder into 30 mm diameter aluminum cups [95]. The powder samples
were pressed into flat disks using a steel die and pressure of 56,000 psi. Table 2.1 shows the
chemical properties of the different types of FAs. All the FAs are classified as FA class C
according to the ASTM C618-15 classification [23].
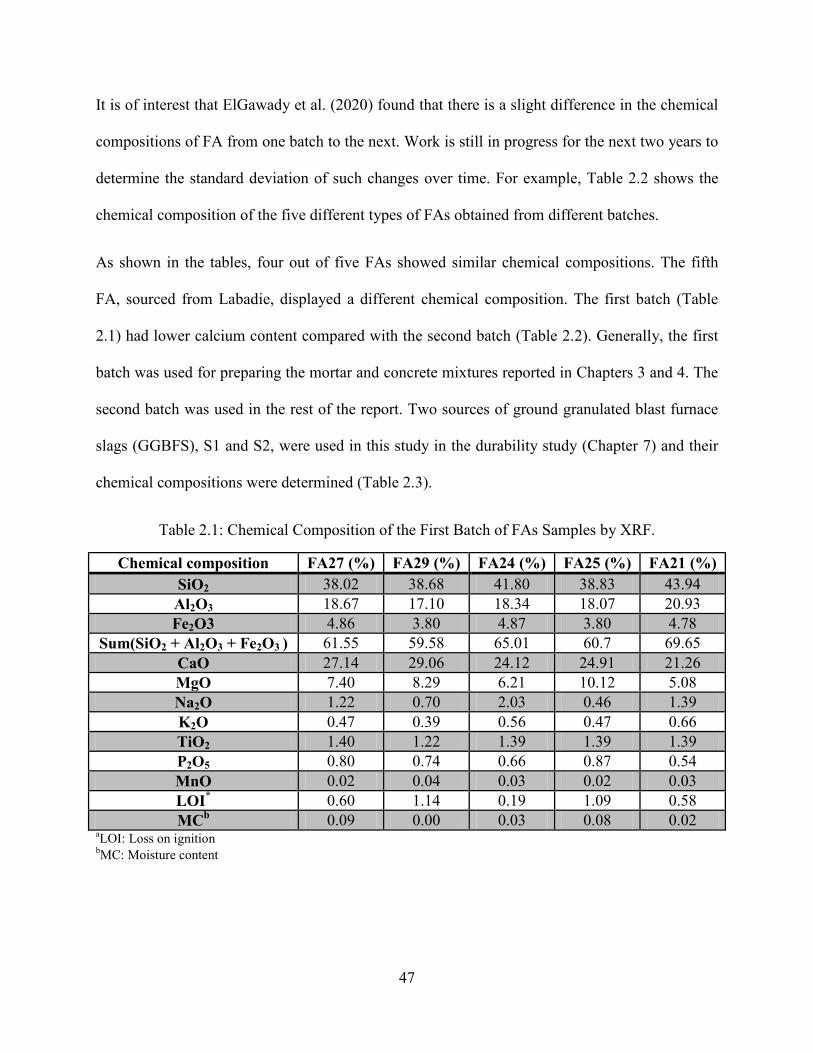
47
It is of interest that ElGawady et al. (2020) found that there is a slight difference in the chemical
compositions of FA from one batch to the next. Work is still in progress for the next two years to
determine the standard deviation of such changes over time. For example, Table 2.2 shows the
chemical composition of the five different types of FAs obtained from different batches.
As shown in the tables, four out of five FAs showed similar chemical compositions. The fifth
FA, sourced from Labadie, displayed a different chemical composition. The first batch (Table
2.1) had lower calcium content compared with the second batch (Table 2.2). Generally, the first
batch was used for preparing the mortar and concrete mixtures reported in Chapters 3 and 4. The
second batch was used in the rest of the report. Two sources of ground granulated blast furnace
slags (GGBFS), S1 and S2, were used in this study in the durability study (Chapter 7) and their
chemical compositions were determined (Table 2.3).
Table 2.1: Chemical Composition of the First Batch of FAs Samples by XRF.
Chemical composition FA27 (%) FA29 (%) FA24 (%) FA25 (%) FA21 (%) SiO2 38.02 38.68 41.80 38.83 43.94 Al2O3 18.67 17.10 18.34 18.07 20.93 Fe2O3 4.86 3.80 4.87 3.80 4.78
Sum(SiO2 + Al2O3 + Fe2O3 ) 61.55 59.58 65.01 60.7 69.65 CaO 27.14 29.06 24.12 24.91 21.26 MgO 7.40 8.29 6.21 10.12 5.08 Na2O 1.22 0.70 2.03 0.46 1.39 K2O 0.47 0.39 0.56 0.47 0.66 TiO2 1.40 1.22 1.39 1.39 1.39 P2O5 0.80 0.74 0.66 0.87 0.54 MnO 0.02 0.04 0.03 0.02 0.03 LOI* 0.60 1.14 0.19 1.09 0.58 MCb 0.09 0.00 0.03 0.08 0.02
aLOI: Loss on ignition bMC: Moisture content
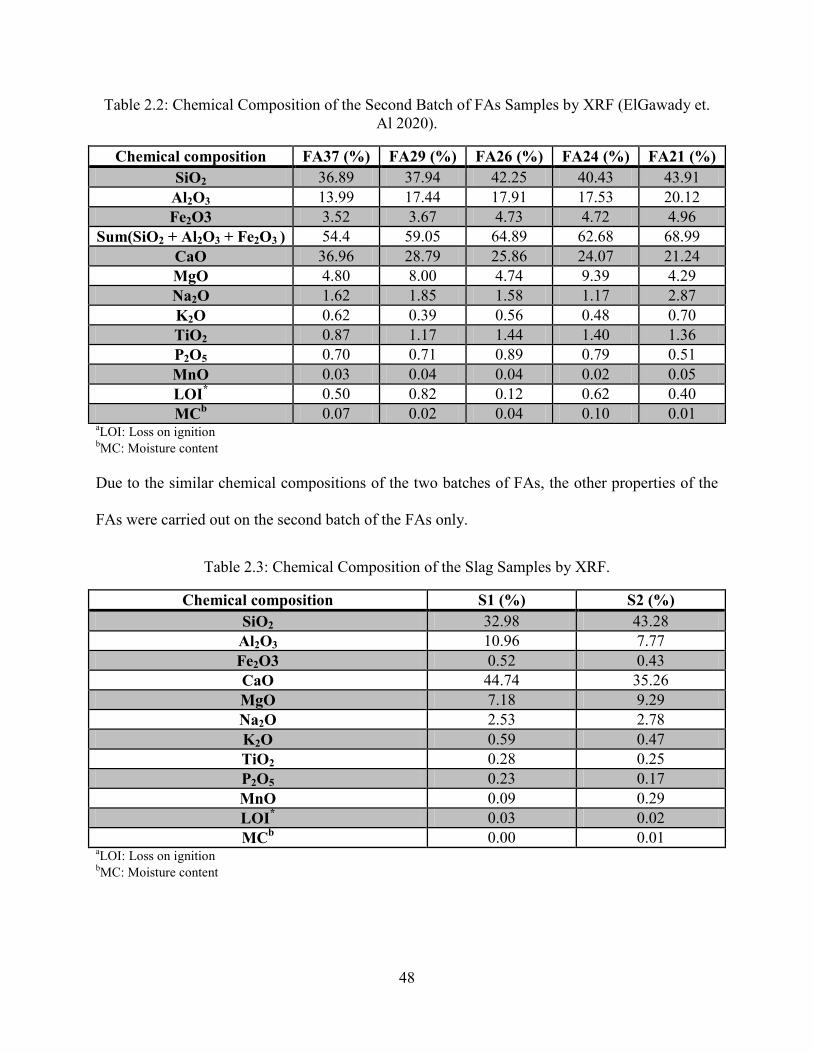
48
Table 2.2: Chemical Composition of the Second Batch of FAs Samples by XRF (ElGawady et. Al 2020).
Chemical composition FA37 (%) FA29 (%) FA26 (%) FA24 (%) FA21 (%) SiO2 36.89 37.94 42.25 40.43 43.91 Al2O3 13.99 17.44 17.91 17.53 20.12 Fe2O3 3.52 3.67 4.73 4.72 4.96
Sum(SiO2 + Al2O3 + Fe2O3 ) 54.4 59.05 64.89 62.68 68.99 CaO 36.96 28.79 25.86 24.07 21.24 MgO 4.80 8.00 4.74 9.39 4.29 Na2O 1.62 1.85 1.58 1.17 2.87 K2O 0.62 0.39 0.56 0.48 0.70 TiO2 0.87 1.17 1.44 1.40 1.36 P2O5 0.70 0.71 0.89 0.79 0.51 MnO 0.03 0.04 0.04 0.02 0.05 LOI* 0.50 0.82 0.12 0.62 0.40 MCb 0.07 0.02 0.04 0.10 0.01
aLOI: Loss on ignition bMC: Moisture content Due to the similar chemical compositions of the two batches of FAs, the other properties of the
FAs were carried out on the second batch of the FAs only.
Table 2.3: Chemical Composition of the Slag Samples by XRF.
Chemical composition S1 (%) S2 (%) SiO2 32.98 43.28 Al2O3 10.96 7.77 Fe2O3 0.52 0.43 CaO 44.74 35.26 MgO 7.18 9.29 Na2O 2.53 2.78 K2O 0.59 0.47 TiO2 0.28 0.25 P2O5 0.23 0.17 MnO 0.09 0.29 LOI* 0.03 0.02 MCb 0.00 0.01
aLOI: Loss on ignition bMC: Moisture content
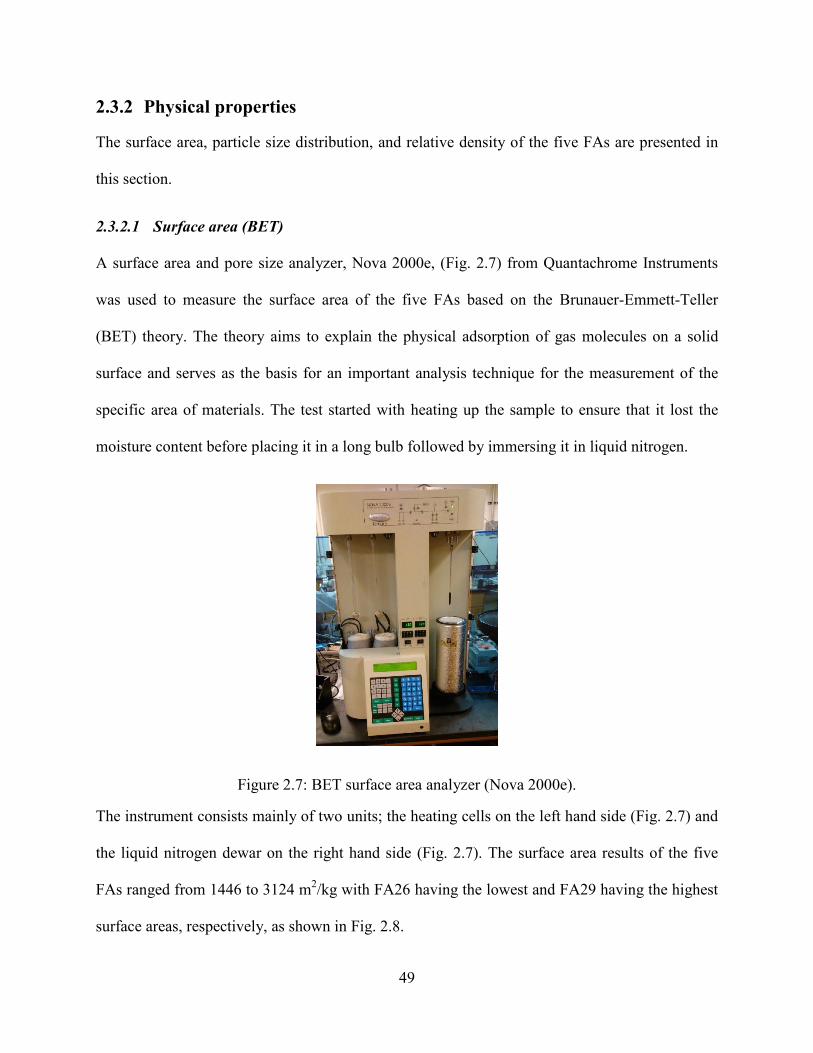
49
2.3.2 Physical properties
The surface area, particle size distribution, and relative density of the five FAs are presented in
this section.
2.3.2.1 Surface area (BET)
A surface area and pore size analyzer, Nova 2000e, (Fig. 2.7) from Quantachrome Instruments
was used to measure the surface area of the five FAs based on the Brunauer-Emmett-Teller
(BET) theory. The theory aims to explain the physical adsorption of gas molecules on a solid
surface and serves as the basis for an important analysis technique for the measurement of the
specific area of materials. The test started with heating up the sample to ensure that it lost the
moisture content before placing it in a long bulb followed by immersing it in liquid nitrogen.
Figure 2.7: BET surface area analyzer (Nova 2000e).
The instrument consists mainly of two units; the heating cells on the left hand side (Fig. 2.7) and
the liquid nitrogen dewar on the right hand side (Fig. 2.7). The surface area results of the five
FAs ranged from 1446 to 3124 m2/kg with FA26 having the lowest and FA29 having the highest
surface areas, respectively, as shown in Fig. 2.8.
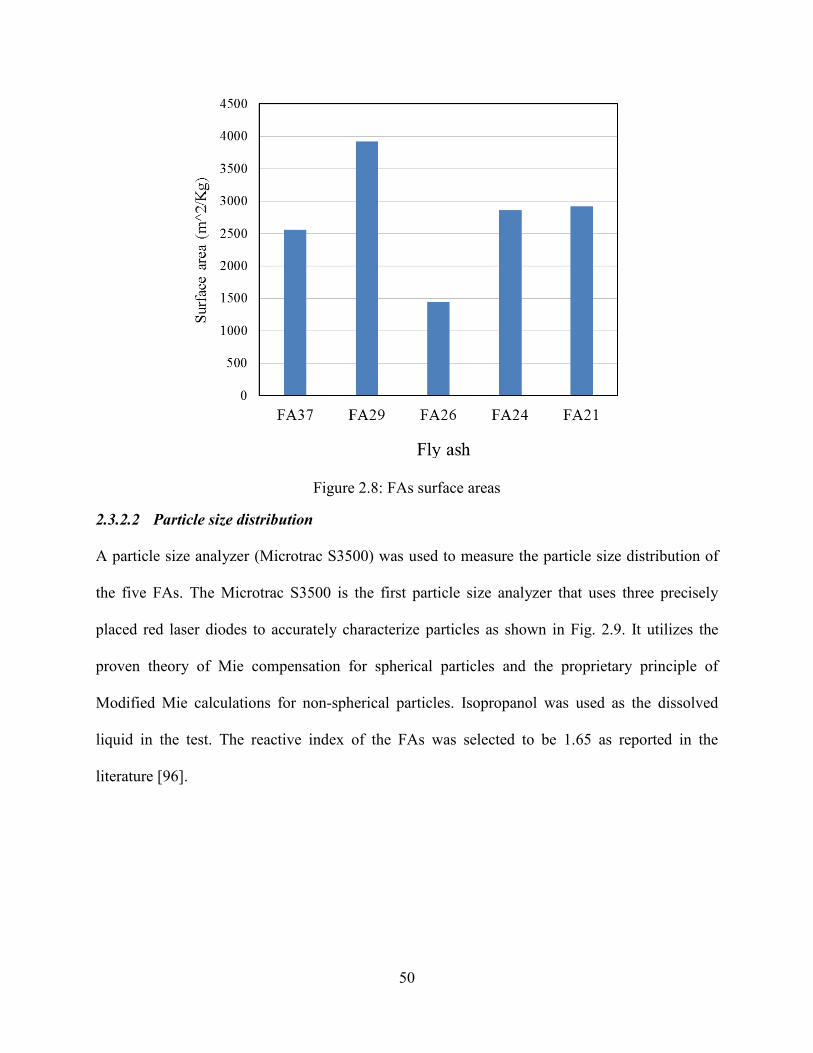
50
Figure 2.8: FAs surface areas
2.3.2.2 Particle size distribution
A particle size analyzer (Microtrac S3500) was used to measure the particle size distribution of
the five FAs. The Microtrac S3500 is the first particle size analyzer that uses three precisely
placed red laser diodes to accurately characterize particles as shown in Fig. 2.9. It utilizes the
proven theory of Mie compensation for spherical particles and the proprietary principle of
Modified Mie calculations for non-spherical particles. Isopropanol was used as the dissolved
liquid in the test. The reactive index of the FAs was selected to be 1.65 as reported in the
literature [96].

51
Figure 2.9: Particle size analyzer (Microtrac S3500).
Fig. 2.10 shows the results of the particle size distribution test. The diameters at which 50% of
the particles passed (D50) were 14.75, 14.87, 16.25, 16.13, and 12.81 µm for FA37, FA29, FA26,
FA24, and FA21, respectively.
Figure 2.10: Particles size distribution of FAs.
2.3.2.3 Specific gravity
A pycnometer (Ultrapyc 1200e) was used to measure the specific gravity of the FAs by applying
Archimedes’ principle of fluid (gas) displacement and the technique of gas expansion (Boyle’s
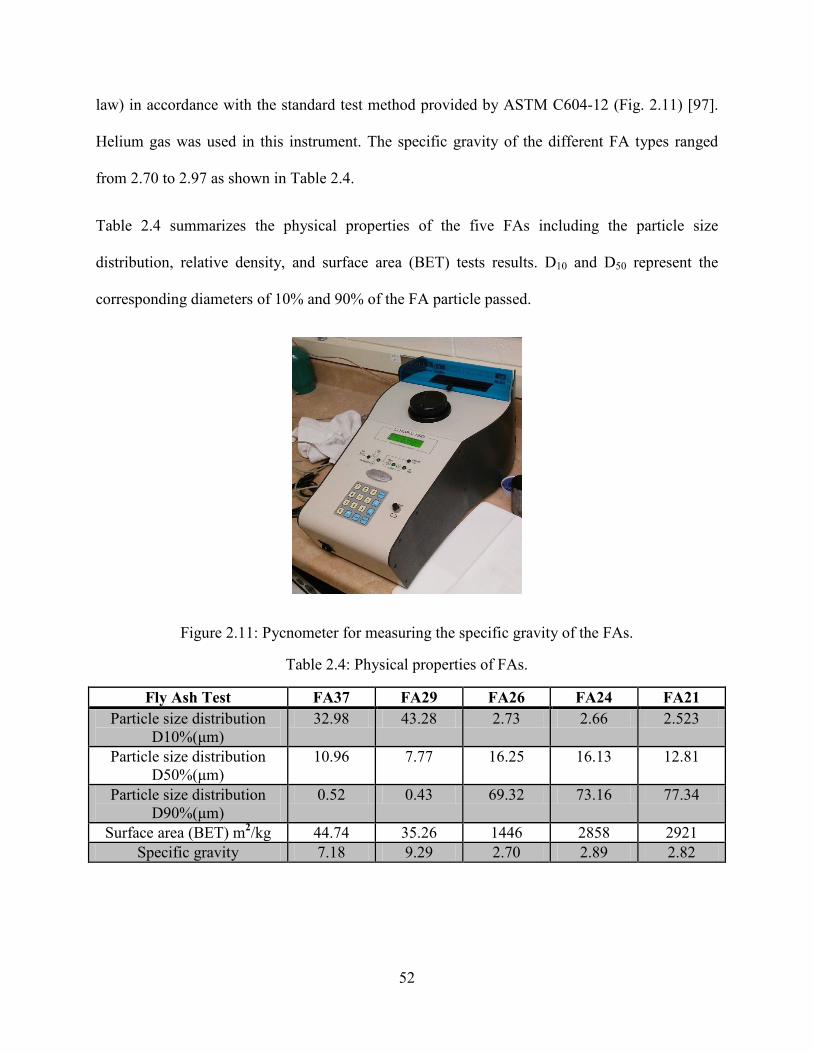
52
law) in accordance with the standard test method provided by ASTM C604-12 (Fig. 2.11) [97].
Helium gas was used in this instrument. The specific gravity of the different FA types ranged
from 2.70 to 2.97 as shown in Table 2.4.
Table 2.4 summarizes the physical properties of the five FAs including the particle size
distribution, relative density, and surface area (BET) tests results. D10 and D50 represent the
corresponding diameters of 10% and 90% of the FA particle passed.
Figure 2.11: Pycnometer for measuring the specific gravity of the FAs.
Table 2.4: Physical properties of FAs.
Fly Ash Test FA37 FA29 FA26 FA24 FA21 Particle size distribution
D10%(μm)
32.98 43.28 2.73 2.66 2.523
Particle size distribution D50%(μm)
10.96 7.77 16.25 16.13 12.81
Particle size distribution D90%(μm)
0.52 0.43 69.32 73.16 77.34
Surface area (BET) m2/kg 44.74 35.26 1446 2858 2921 Specific gravity 7.18 9.29 2.70 2.89 2.82
53
Chapter 3: Trial Mixture and Mixing Procedures of Zero-Cement Mortar and Concrete
ZCC synthesized out of high calcium FA is a relatively new material that requires a thorough
investigation. This chapter presents preliminary studies to determine the following aspects:
(1) What is the best mixing procedure for ZC mortar and ZCC? Four different mortar and
eight different concrete mixing procedures were tried, investigated and are presented in
this chapter.
(2) What are the appropriate ranges of Alk/FA, SS/SH, and W/FA to produce a structural
mortar and concrete?
To address these issues, 215 mortar mixtures and 80 concrete mixtures were investigated. These
mixtures were prepared using only one source of FA for mortar mixtures and four sources of FA
for the concrete mixtures. Once the required ranges and appropriate mixing procedures were
determined, a fine-tuning and optimization procedure was carried out and presented in Chapter 4,
where the five sources of FA were used for mortar mixtures. The mixtures presented in this
chapter evolved with the understanding of the effects of the different parameters and mixing
procedures on the performance of ZC mortar and concrete. The criterion for accepting a
structural mortar was a good workability higher than 40%. For concrete mixtures, the criteria
were an adequate concrete strength exceeding 3000 psi and workability with a minimum slump
of three inches.
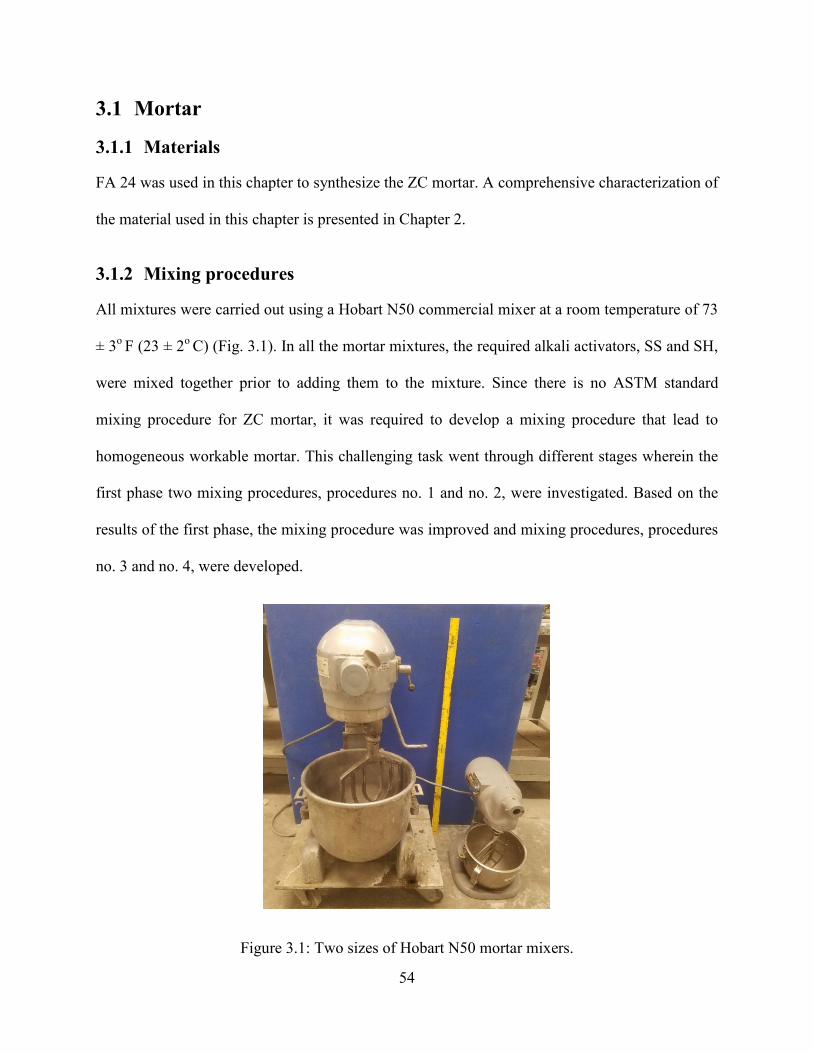
54
3.1 Mortar
3.1.1 Materials
FA 24 was used in this chapter to synthesize the ZC mortar. A comprehensive characterization of
the material used in this chapter is presented in Chapter 2.
3.1.2 Mixing procedures
All mixtures were carried out using a Hobart N50 commercial mixer at a room temperature of 73
± 3o F (23 ± 2o C) (Fig. 3.1). In all the mortar mixtures, the required alkali activators, SS and SH,
were mixed together prior to adding them to the mixture. Since there is no ASTM standard
mixing procedure for ZC mortar, it was required to develop a mixing procedure that lead to
homogeneous workable mortar. This challenging task went through different stages wherein the
first phase two mixing procedures, procedures no. 1 and no. 2, were investigated. Based on the
results of the first phase, the mixing procedure was improved and mixing procedures, procedures
no. 3 and no. 4, were developed.
Figure 3.1: Two sizes of Hobart N50 mortar mixers.
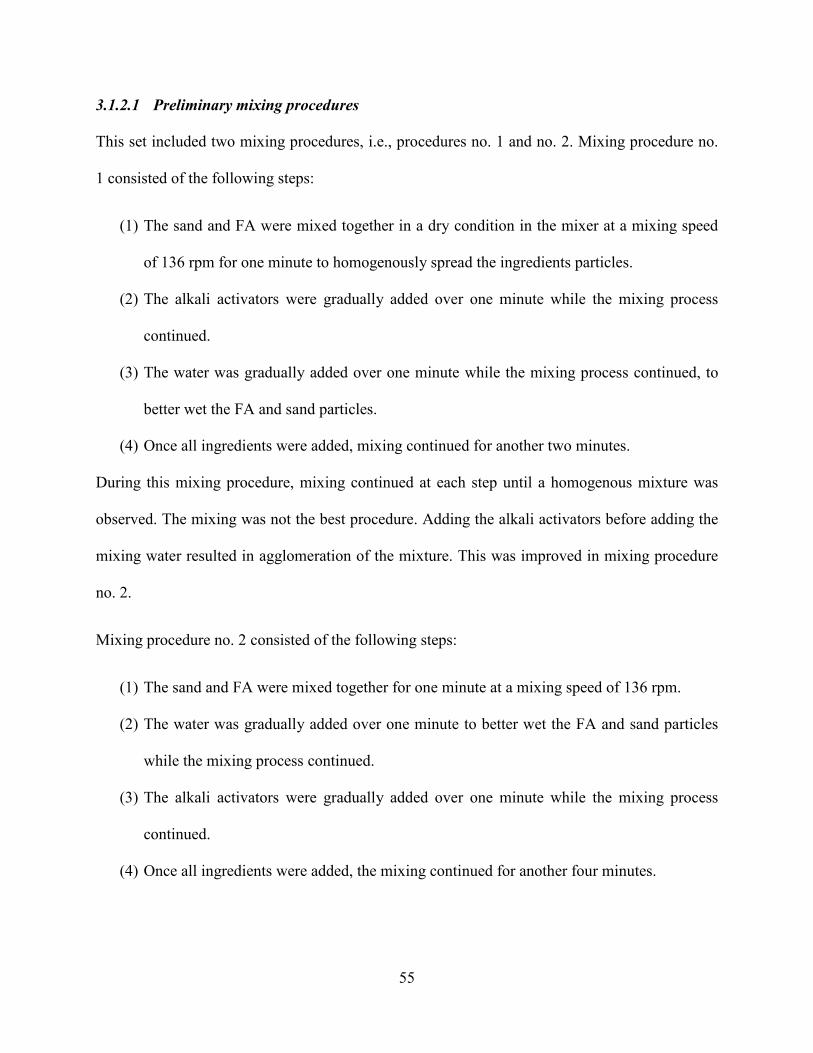
55
3.1.2.1 Preliminary mixing procedures
This set included two mixing procedures, i.e., procedures no. 1 and no. 2. Mixing procedure no.
1 consisted of the following steps:
(1) The sand and FA were mixed together in a dry condition in the mixer at a mixing speed
of 136 rpm for one minute to homogenously spread the ingredients particles.
(2) The alkali activators were gradually added over one minute while the mixing process
continued.
(3) The water was gradually added over one minute while the mixing process continued, to
better wet the FA and sand particles.
(4) Once all ingredients were added, mixing continued for another two minutes.
During this mixing procedure, mixing continued at each step until a homogenous mixture was
observed. The mixing was not the best procedure. Adding the alkali activators before adding the
mixing water resulted in agglomeration of the mixture. This was improved in mixing procedure
no. 2.
Mixing procedure no. 2 consisted of the following steps:
(1) The sand and FA were mixed together for one minute at a mixing speed of 136 rpm.
(2) The water was gradually added over one minute to better wet the FA and sand particles
while the mixing process continued.
(3) The alkali activators were gradually added over one minute while the mixing process
continued.
(4) Once all ingredients were added, the mixing continued for another four minutes.

56
Although there was not any sign of agglomeration when using this mixing procedure, more
iterations were carried out to improve the workability using the same amount of W/FA. Hence,
mixing procedures no. 3 and no. 4 were investigated.
3.1.2.2 Improved mixing procedures
This phase included mixing procedures no. 3 and no. 4, which were improved procedures based
on mixing procedure no. 2. Mixing procedure no. 3 was similar to mixing procedure no. 2 with
one difference. During step no. 4, the mixer speed was increased to 281 rpm and the mixing
continued for another four minutes. The higher mixing speed during step no. 4 increased the
mortar slump flow and prevented the flash setting that occurred in some mixtures prepared using
mixing procedure no. 2.
Mixing procedure no. 4 was similar to mixing procedure no. 3. However, steps no. 3 and no. 4
were changed as follows:
(1) The alkali activators were gradually added over five minutes while the mixing process
continued.
(2) The mixing speed was increased to 281 rpm and the mixing continued for another five
minutes.
Adding the alkali activators gradually over five minutes, rather than adding them over one
minute only as in mixing procedure no. 3, enhanced the workability significantly allowing the
use of a smaller W/FA. Hence, procedure no. 4 was selected to carry out the mortar mixtures
presented in Chapter 5.

57
3.1.3 Trial mixtures
As discussed in detail later in this chapter, the results of the fresh properties of the ZC mortar
showed that mixing procedures no.1 and no. 2 were not the best. Hence, not every single mixture
was carried out using the four different mixing procedures. Rather, the best mixtures were
selected for further improvements while less successful mixtures were discarded. Furthermore,
some mixtures were not reported here as they suffered flash setting when mixed using
procedures no. 1 and no. 2. Tables 3.1 and 3.2 show the mixture details that were mixed using
procedures no. 1 and no. 2, respectively. The details of the mixtures prepared using mixing
procedures no. 3 and no. 4 are shown in Chapters 4 and 5, respectively, as they were more
successful and hence received more attention and testing. However, the results of a single
mixture that was mixed using the three mixing procedures, i.e. 2, 3, and 4, are presented in this
chapter for comparison purposes (Table 3.3).
For mixing procedures no. 1 and no. 2, a wide range of parameters were investigated. For
example, the W/FA ranged from 0.400 to 0.600 for mixing procedure no. 1 and from 0.425 to
0.550 for mixing procedure no. 2. The Alk/FA ranged from 0.200 to 0.300 for mixing procedure
no. 1 and from 0.300 to 0.400 for mixing procedure no. 2. The SS/SH ranged from 0.0 to 2.5
procedure no. 1 and from 0.5 to 2.5 for mixing procedure no. 2.
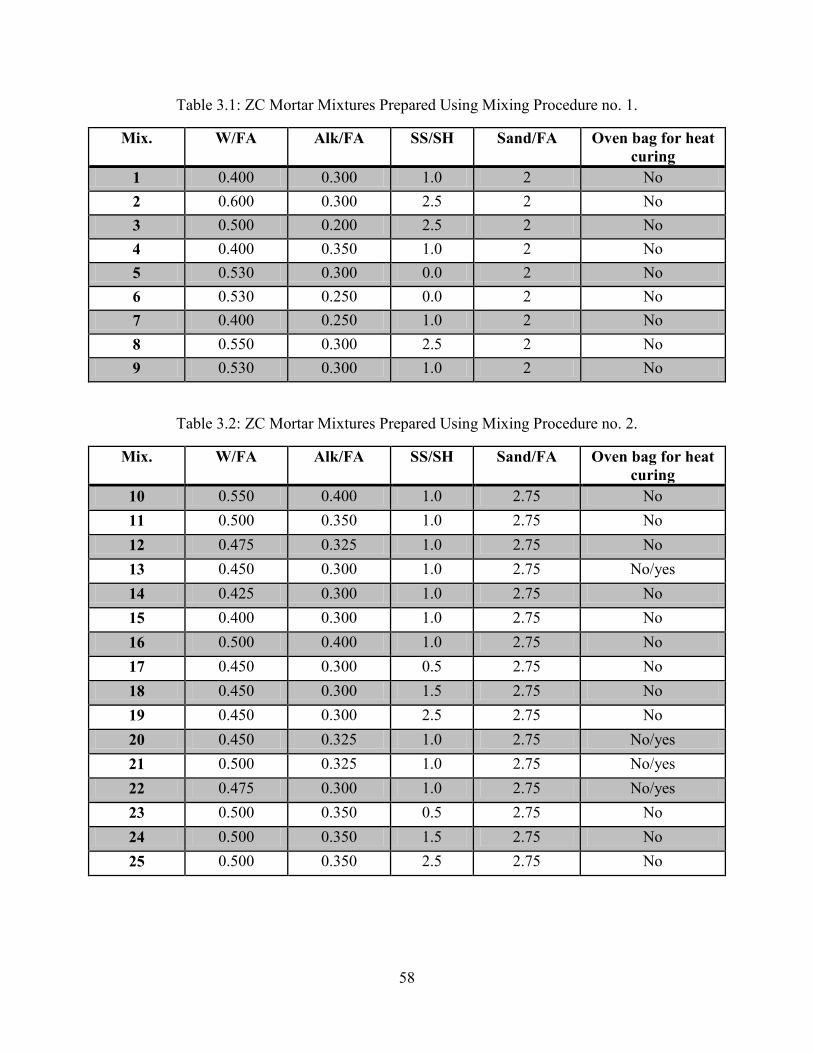
58
Table 3.1: ZC Mortar Mixtures Prepared Using Mixing Procedure no. 1.
Mix. W/FA Alk/FA SS/SH Sand/FA Oven bag for heat curing
1 0.400 0.300 1.0 2 No 2 0.600 0.300 2.5 2 No 3 0.500 0.200 2.5 2 No 4 0.400 0.350 1.0 2 No 5 0.530 0.300 0.0 2 No 6 0.530 0.250 0.0 2 No 7 0.400 0.250 1.0 2 No 8 0.550 0.300 2.5 2 No 9 0.530 0.300 1.0 2 No
Table 3.2: ZC Mortar Mixtures Prepared Using Mixing Procedure no. 2.
Mix. W/FA Alk/FA SS/SH Sand/FA Oven bag for heat curing
10 0.550 0.400 1.0 2.75 No 11 0.500 0.350 1.0 2.75 No 12 0.475 0.325 1.0 2.75 No 13 0.450 0.300 1.0 2.75 No/yes 14 0.425 0.300 1.0 2.75 No 15 0.400 0.300 1.0 2.75 No 16 0.500 0.400 1.0 2.75 No 17 0.450 0.300 0.5 2.75 No 18 0.450 0.300 1.5 2.75 No 19 0.450 0.300 2.5 2.75 No 20 0.450 0.325 1.0 2.75 No/yes 21 0.500 0.325 1.0 2.75 No/yes 22 0.475 0.300 1.0 2.75 No/yes 23 0.500 0.350 0.5 2.75 No 24 0.500 0.350 1.5 2.75 No 25 0.500 0.350 2.5 2.75 No
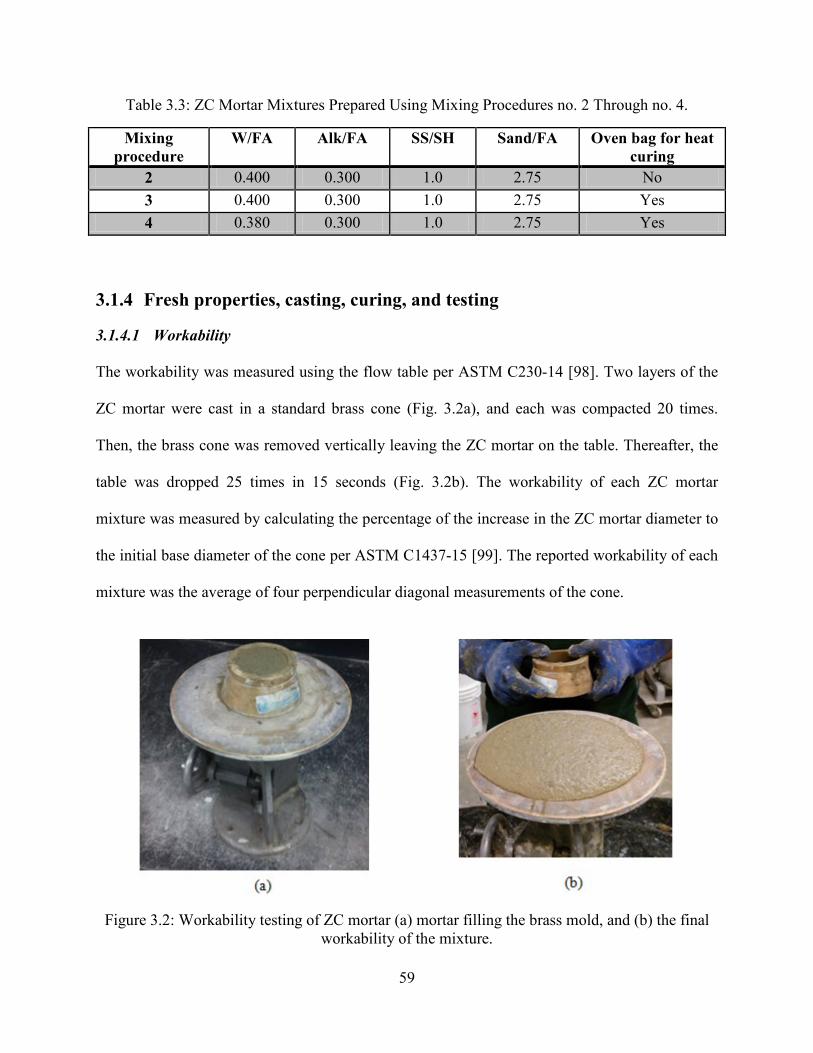
59
Table 3.3: ZC Mortar Mixtures Prepared Using Mixing Procedures no. 2 Through no. 4.
Mixing procedure
W/FA Alk/FA SS/SH Sand/FA Oven bag for heat curing
2 0.400 0.300 1.0 2.75 No 3 0.400 0.300 1.0 2.75 Yes 4 0.380 0.300 1.0 2.75 Yes
3.1.4 Fresh properties, casting, curing, and testing
3.1.4.1 Workability
The workability was measured using the flow table per ASTM C230-14 [98]. Two layers of the
ZC mortar were cast in a standard brass cone (Fig. 3.2a), and each was compacted 20 times.
Then, the brass cone was removed vertically leaving the ZC mortar on the table. Thereafter, the
table was dropped 25 times in 15 seconds (Fig. 3.2b). The workability of each ZC mortar
mixture was measured by calculating the percentage of the increase in the ZC mortar diameter to
the initial base diameter of the cone per ASTM C1437-15 [99]. The reported workability of each
mixture was the average of four perpendicular diagonal measurements of the cone.
Figure 3.2: Workability testing of ZC mortar (a) mortar filling the brass mold, and (b) the final workability of the mixture.
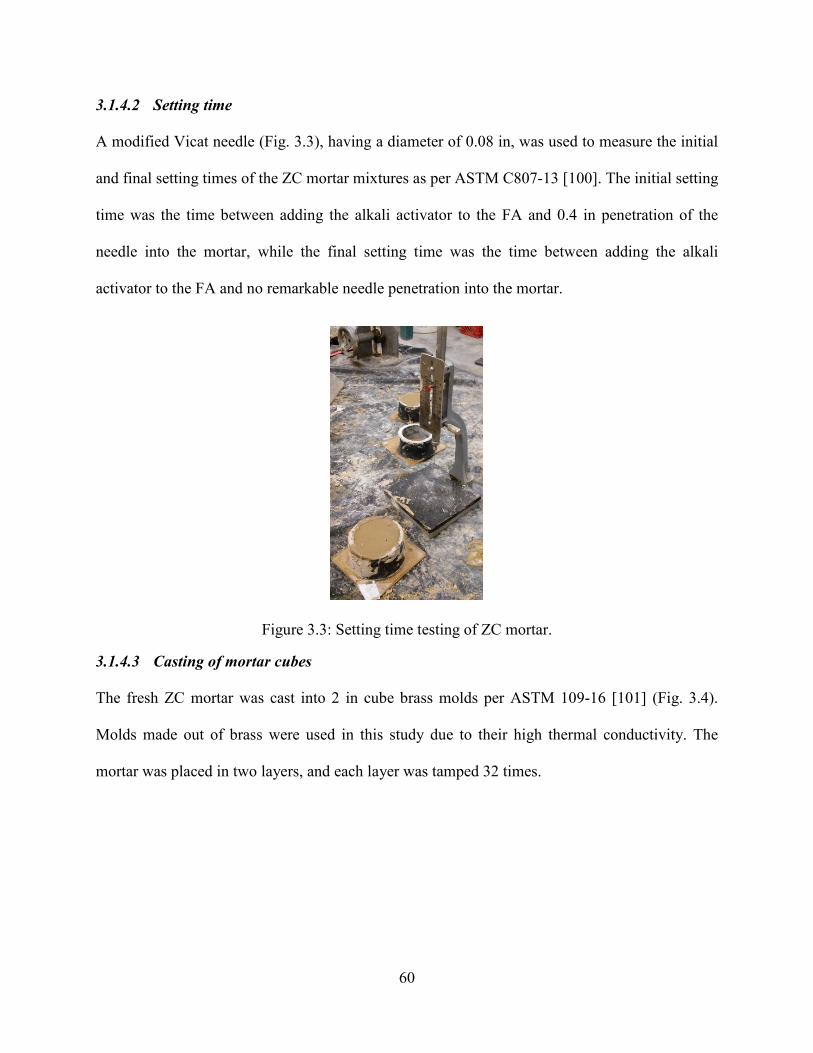
60
3.1.4.2 Setting time
A modified Vicat needle (Fig. 3.3), having a diameter of 0.08 in, was used to measure the initial
and final setting times of the ZC mortar mixtures as per ASTM C807-13 [100]. The initial setting
time was the time between adding the alkali activator to the FA and 0.4 in penetration of the
needle into the mortar, while the final setting time was the time between adding the alkali
activator to the FA and no remarkable needle penetration into the mortar.
Figure 3.3: Setting time testing of ZC mortar.
3.1.4.3 Casting of mortar cubes
The fresh ZC mortar was cast into 2 in cube brass molds per ASTM 109-16 [101] (Fig. 3.4).
Molds made out of brass were used in this study due to their high thermal conductivity. The
mortar was placed in two layers, and each layer was tamped 32 times.
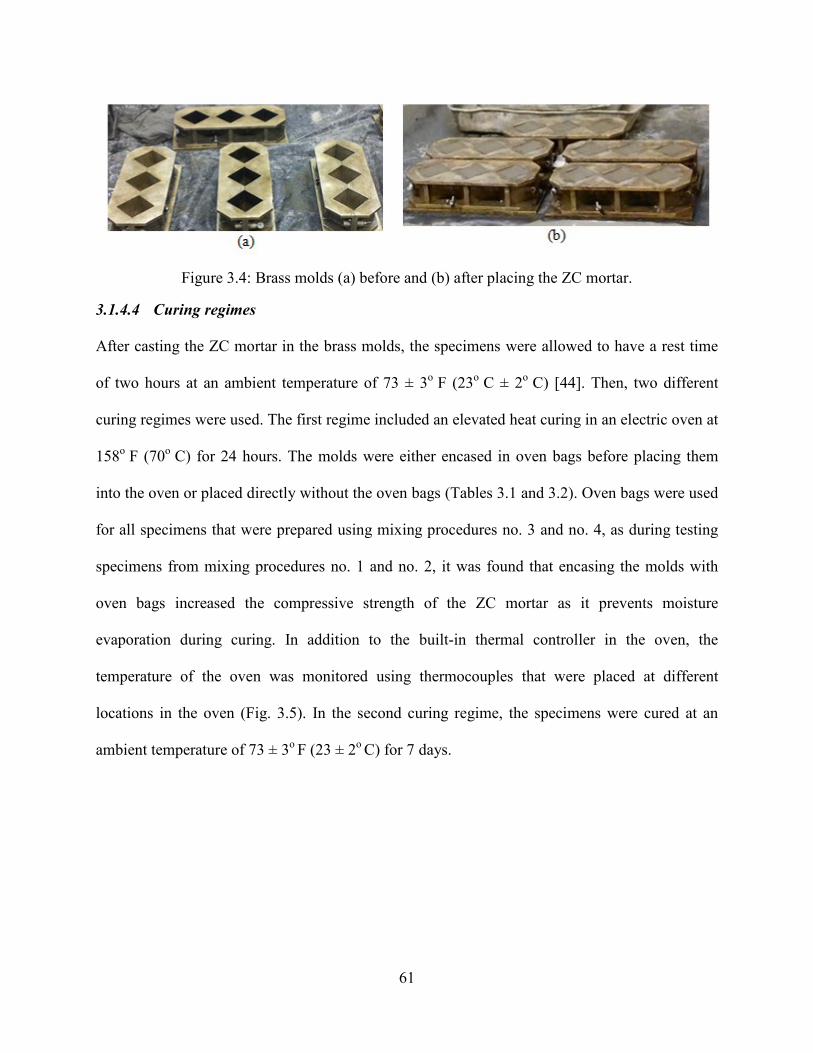
61
Figure 3.4: Brass molds (a) before and (b) after placing the ZC mortar.
3.1.4.4 Curing regimes
After casting the ZC mortar in the brass molds, the specimens were allowed to have a rest time
of two hours at an ambient temperature of 73 ± 3o F (23o C ± 2o C) [44]. Then, two different
curing regimes were used. The first regime included an elevated heat curing in an electric oven at
158o F (70o C) for 24 hours. The molds were either encased in oven bags before placing them
into the oven or placed directly without the oven bags (Tables 3.1 and 3.2). Oven bags were used
for all specimens that were prepared using mixing procedures no. 3 and no. 4, as during testing
specimens from mixing procedures no. 1 and no. 2, it was found that encasing the molds with
oven bags increased the compressive strength of the ZC mortar as it prevents moisture
evaporation during curing. In addition to the built-in thermal controller in the oven, the
temperature of the oven was monitored using thermocouples that were placed at different
locations in the oven (Fig. 3.5). In the second curing regime, the specimens were cured at an
ambient temperature of 73 ± 3o F (23 ± 2o C) for 7 days.
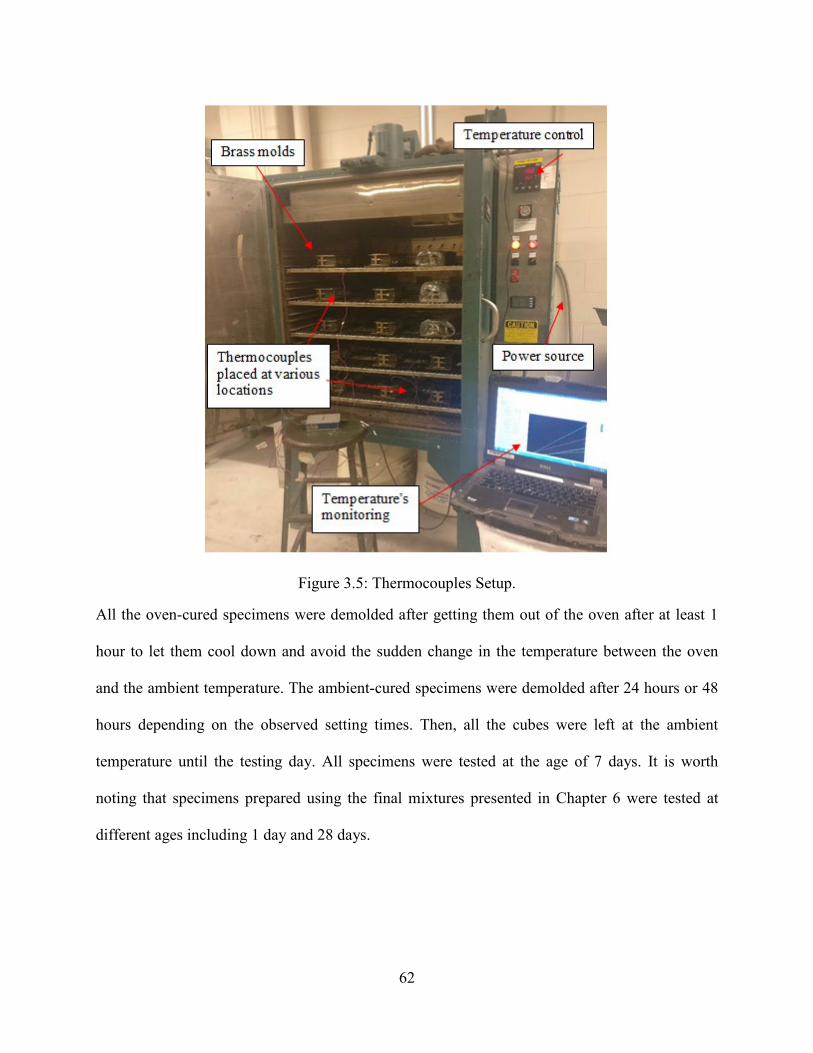
62
Figure 3.5: Thermocouples Setup.
All the oven-cured specimens were demolded after getting them out of the oven after at least 1
hour to let them cool down and avoid the sudden change in the temperature between the oven
and the ambient temperature. The ambient-cured specimens were demolded after 24 hours or 48
hours depending on the observed setting times. Then, all the cubes were left at the ambient
temperature until the testing day. All specimens were tested at the age of 7 days. It is worth
noting that specimens prepared using the final mixtures presented in Chapter 6 were tested at
different ages including 1 day and 28 days.
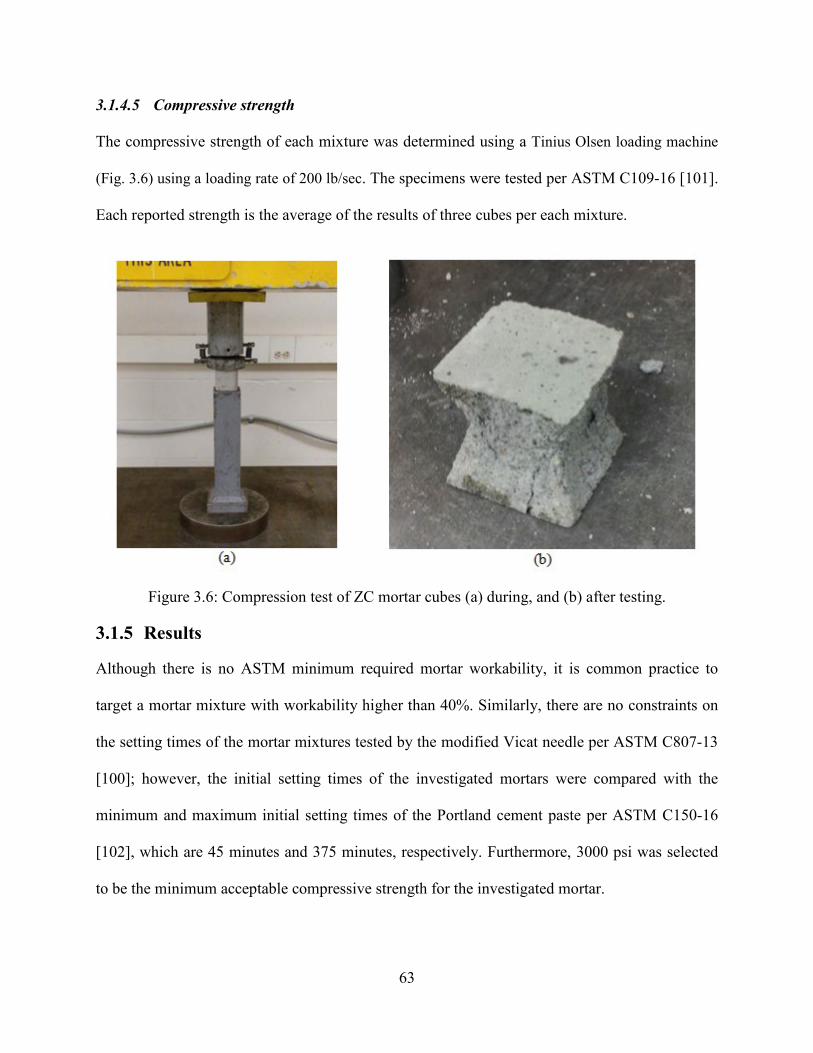
63
3.1.4.5 Compressive strength
The compressive strength of each mixture was determined using a Tinius Olsen loading machine
(Fig. 3.6) using a loading rate of 200 lb/sec. The specimens were tested per ASTM C109-16 [101].
Each reported strength is the average of the results of three cubes per each mixture.
Figure 3.6: Compression test of ZC mortar cubes (a) during, and (b) after testing.
3.1.5 Results
Although there is no ASTM minimum required mortar workability, it is common practice to
target a mortar mixture with workability higher than 40%. Similarly, there are no constraints on
the setting times of the mortar mixtures tested by the modified Vicat needle per ASTM C807-13
[100]; however, the initial setting times of the investigated mortars were compared with the
minimum and maximum initial setting times of the Portland cement paste per ASTM C150-16
[102], which are 45 minutes and 375 minutes, respectively. Furthermore, 3000 psi was selected
to be the minimum acceptable compressive strength for the investigated mortar.
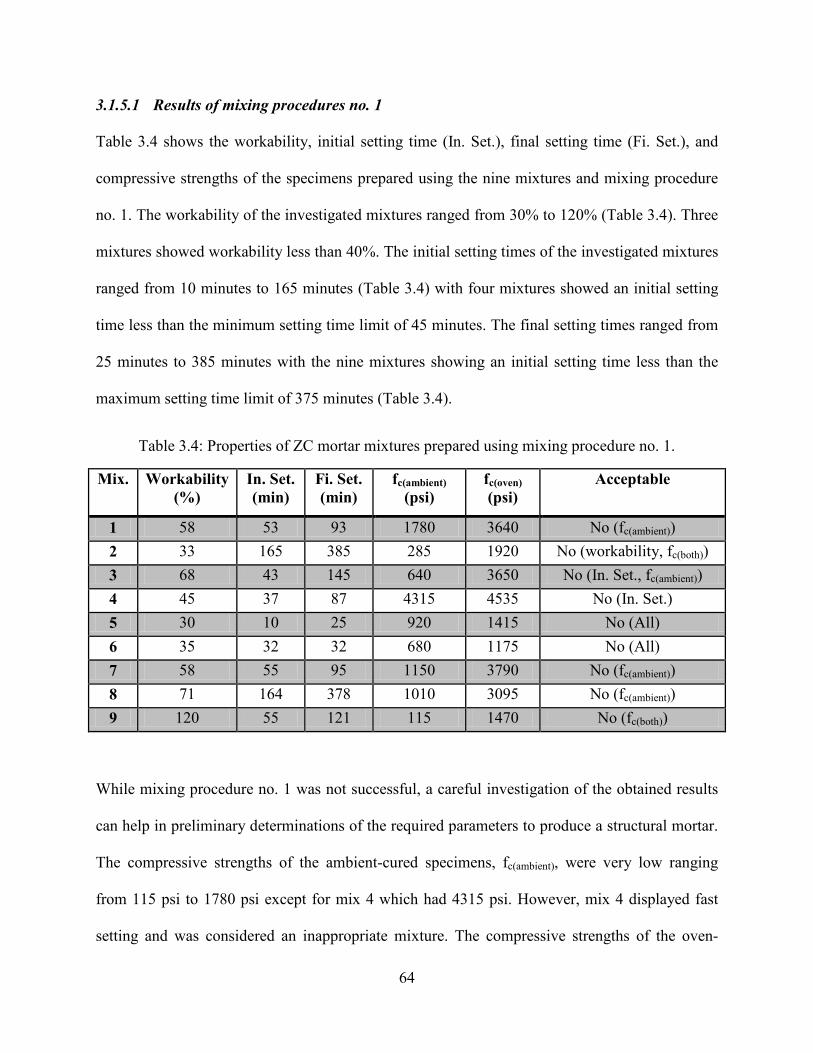
64
3.1.5.1 Results of mixing procedures no. 1
Table 3.4 shows the workability, initial setting time (In. Set.), final setting time (Fi. Set.), and
compressive strengths of the specimens prepared using the nine mixtures and mixing procedure
no. 1. The workability of the investigated mixtures ranged from 30% to 120% (Table 3.4). Three
mixtures showed workability less than 40%. The initial setting times of the investigated mixtures
ranged from 10 minutes to 165 minutes (Table 3.4) with four mixtures showed an initial setting
time less than the minimum setting time limit of 45 minutes. The final setting times ranged from
25 minutes to 385 minutes with the nine mixtures showing an initial setting time less than the
maximum setting time limit of 375 minutes (Table 3.4).
Table 3.4: Properties of ZC mortar mixtures prepared using mixing procedure no. 1.
Mix. Workability (%)
In. Set. (min)
Fi. Set. (min)
fc(ambient) (psi)
fc(oven) (psi)
Acceptable
1 58 53 93 1780 3640 No (fc(ambient)) 2 33 165 385 285 1920 No (workability, fc(both)) 3 68 43 145 640 3650 No (In. Set., fc(ambient)) 4 45 37 87 4315 4535 No (In. Set.) 5 30 10 25 920 1415 No (All) 6 35 32 32 680 1175 No (All) 7 58 55 95 1150 3790 No (fc(ambient)) 8 71 164 378 1010 3095 No (fc(ambient)) 9 120 55 121 115 1470 No (fc(both))
While mixing procedure no. 1 was not successful, a careful investigation of the obtained results
can help in preliminary determinations of the required parameters to produce a structural mortar.
The compressive strengths of the ambient-cured specimens, fc(ambient), were very low ranging
from 115 psi to 1780 psi except for mix 4 which had 4315 psi. However, mix 4 displayed fast
setting and was considered an inappropriate mixture. The compressive strengths of the oven-
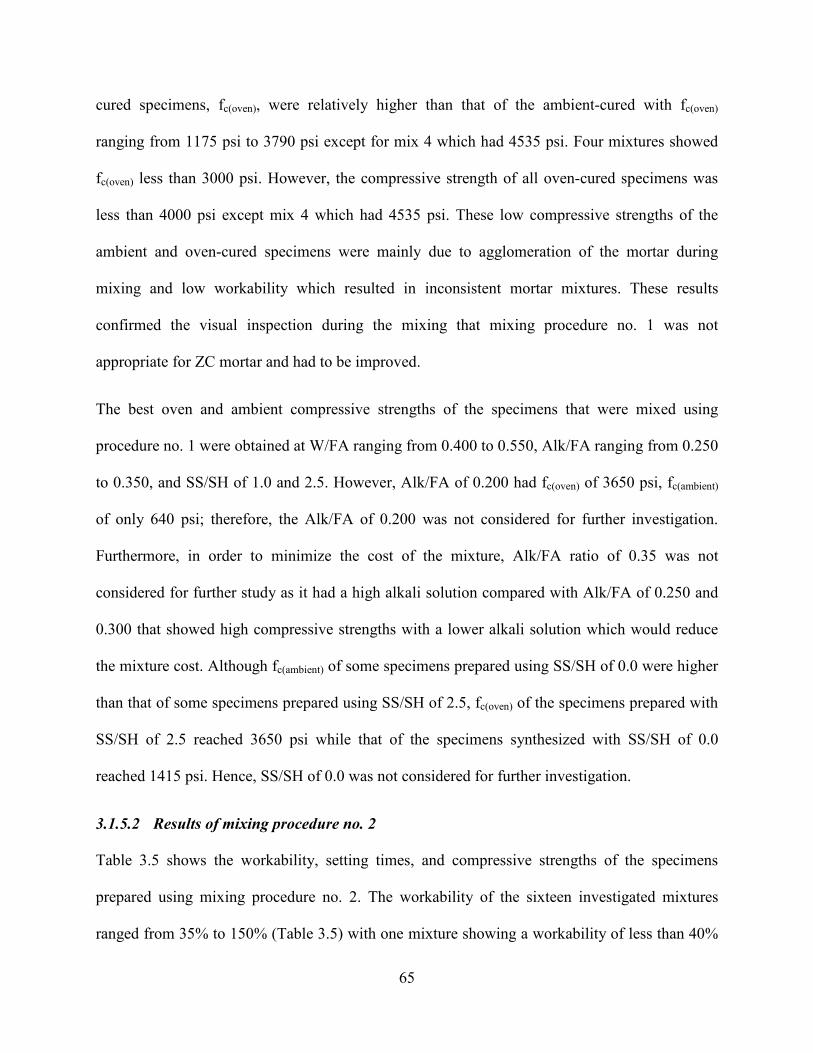
65
cured specimens, fc(oven), were relatively higher than that of the ambient-cured with fc(oven)
ranging from 1175 psi to 3790 psi except for mix 4 which had 4535 psi. Four mixtures showed
fc(oven) less than 3000 psi. However, the compressive strength of all oven-cured specimens was
less than 4000 psi except mix 4 which had 4535 psi. These low compressive strengths of the
ambient and oven-cured specimens were mainly due to agglomeration of the mortar during
mixing and low workability which resulted in inconsistent mortar mixtures. These results
confirmed the visual inspection during the mixing that mixing procedure no. 1 was not
appropriate for ZC mortar and had to be improved.
The best oven and ambient compressive strengths of the specimens that were mixed using
procedure no. 1 were obtained at W/FA ranging from 0.400 to 0.550, Alk/FA ranging from 0.250
to 0.350, and SS/SH of 1.0 and 2.5. However, Alk/FA of 0.200 had fc(oven) of 3650 psi, fc(ambient)
of only 640 psi; therefore, the Alk/FA of 0.200 was not considered for further investigation.
Furthermore, in order to minimize the cost of the mixture, Alk/FA ratio of 0.35 was not
considered for further study as it had a high alkali solution compared with Alk/FA of 0.250 and
0.300 that showed high compressive strengths with a lower alkali solution which would reduce
the mixture cost. Although fc(ambient) of some specimens prepared using SS/SH of 0.0 were higher
than that of some specimens prepared using SS/SH of 2.5, fc(oven) of the specimens prepared with
SS/SH of 2.5 reached 3650 psi while that of the specimens synthesized with SS/SH of 0.0
reached 1415 psi. Hence, SS/SH of 0.0 was not considered for further investigation.
3.1.5.2 Results of mixing procedure no. 2
Table 3.5 shows the workability, setting times, and compressive strengths of the specimens
prepared using mixing procedure no. 2. The workability of the sixteen investigated mixtures
ranged from 35% to 150% (Table 3.5) with one mixture showing a workability of less than 40%
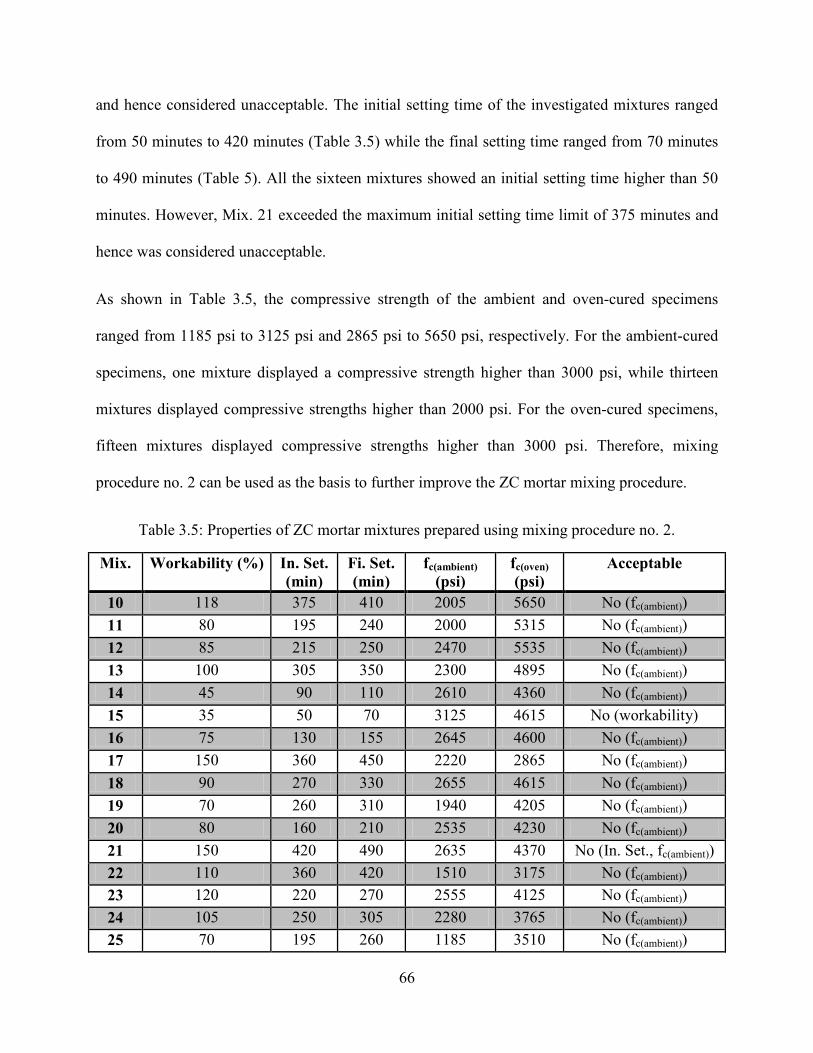
66
and hence considered unacceptable. The initial setting time of the investigated mixtures ranged
from 50 minutes to 420 minutes (Table 3.5) while the final setting time ranged from 70 minutes
to 490 minutes (Table 5). All the sixteen mixtures showed an initial setting time higher than 50
minutes. However, Mix. 21 exceeded the maximum initial setting time limit of 375 minutes and
hence was considered unacceptable.
As shown in Table 3.5, the compressive strength of the ambient and oven-cured specimens
ranged from 1185 psi to 3125 psi and 2865 psi to 5650 psi, respectively. For the ambient-cured
specimens, one mixture displayed a compressive strength higher than 3000 psi, while thirteen
mixtures displayed compressive strengths higher than 2000 psi. For the oven-cured specimens,
fifteen mixtures displayed compressive strengths higher than 3000 psi. Therefore, mixing
procedure no. 2 can be used as the basis to further improve the ZC mortar mixing procedure.
Table 3.5: Properties of ZC mortar mixtures prepared using mixing procedure no. 2.
Mix. Workability (%) In. Set. (min)
Fi. Set. (min)
fc(ambient) (psi)
fc(oven) (psi)
Acceptable
10 118 375 410 2005 5650 No (fc(ambient)) 11 80 195 240 2000 5315 No (fc(ambient)) 12 85 215 250 2470 5535 No (fc(ambient)) 13 100 305 350 2300 4895 No (fc(ambient)) 14 45 90 110 2610 4360 No (fc(ambient)) 15 35 50 70 3125 4615 No (workability) 16 75 130 155 2645 4600 No (fc(ambient)) 17 150 360 450 2220 2865 No (fc(ambient)) 18 90 270 330 2655 4615 No (fc(ambient)) 19 70 260 310 1940 4205 No (fc(ambient)) 20 80 160 210 2535 4230 No (fc(ambient)) 21 150 420 490 2635 4370 No (In. Set., fc(ambient)) 22 110 360 420 1510 3175 No (fc(ambient)) 23 120 220 270 2555 4125 No (fc(ambient)) 24 105 250 305 2280 3765 No (fc(ambient)) 25 70 195 260 1185 3510 No (fc(ambient))
67
As shown in Table 3.5, the mixtures that displayed an acceptable compressive strength while
displaying good workability and setting times had W/FA ranging from 0.400 to 0.550, Alk/FA
ranging from 0.250 to 0.400, and SS/SS ranging from 0.5 to 2.5. Furthermore, due to the cost of
alkali activators, mixtures that had Alk/FA higher than 0.30 was not considered for further
analysis. These ranges are similar to those obtained using mixture procedure no. 1.
3.1.5.3 Discussion of mixing procedures no. 1 and no. 2
This section presents qualitative comparison between the performances of mixtures prepared
using mixing procedures no. 1 and no. 2. Fig. 3.7 shows comparisons between the workability,
setting times, and compressive strengths of the mixtures prepared using procedures no. 1 and no.
2. The ambient compressive strength of mix 4 prepared using procedure no.1 was not included in
Fig. 3.7e since it displayed fast setting. As shown in the figures, the workability, setting times,
and compressive strengths of the oven and ambient-cured specimens prepared using mixing
procedure no. 2 were better than those prepared using mixing procedure no. 1. During mixing
procedure no. 2 there was no sign of agglomeration as was noticed in the specimens that were
mixed following mixing procedure no.1. Using mixing procedure no. 2 increased the average
workability (Fig. 3.7a), initial setting time ((Fig. 3.7b), final setting time (Fig. 3.7c), oven (Fig.
3.7d) and ambient (Fig. 3.7e) compressive strengths by 38%, 72%, 48%, 37%, and 47%,
respectively.
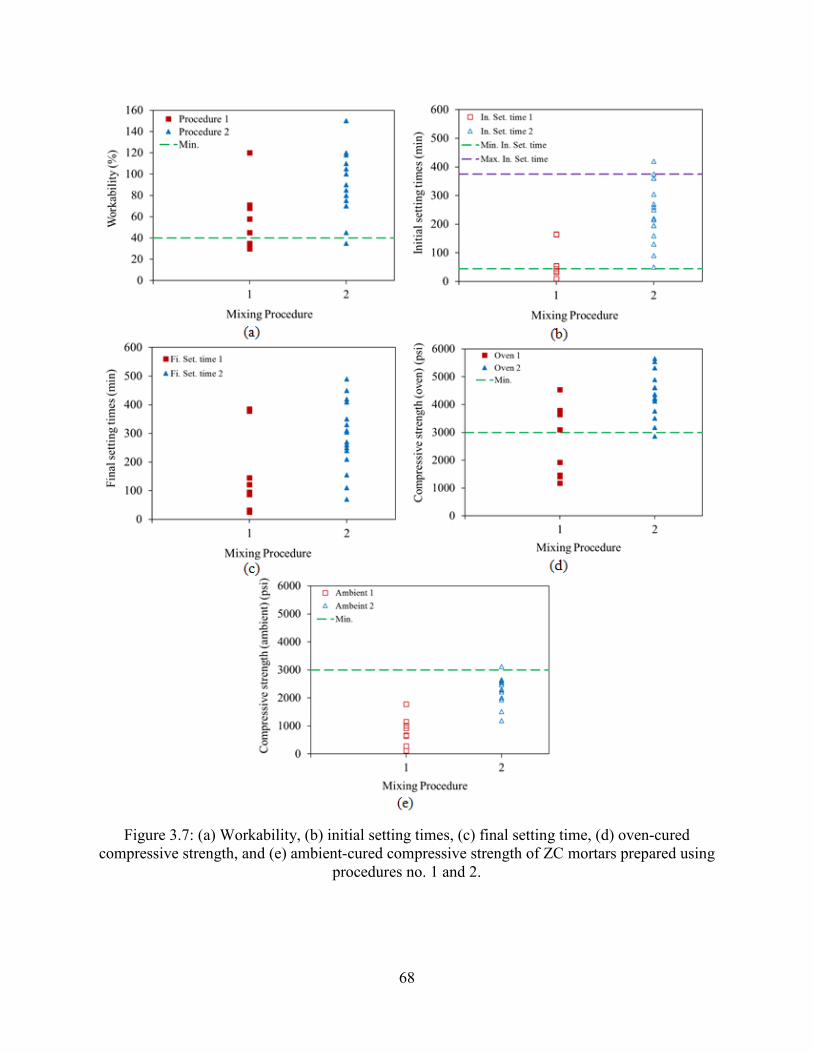
68
Figure 3.7: (a) Workability, (b) initial setting times, (c) final setting time, (d) oven-cured compressive strength, and (e) ambient-cured compressive strength of ZC mortars prepared using
procedures no. 1 and 2.
69
3.1.5.4 Effect of W/FA
Figs. 3.8 and 3.9 show the effect of the W/FA, Alk/FA, and SS/SH on the workability, setting
times, and compressive strength of the ZC mortars prepared using mixing procedures no. 1 and
no. 2. The W/FA ranging from 0.40 to 0.550 showed workability higher than 40% (Fig. 3.8a) for
all mixtures except one prepared using procedure no. 2. However, mixing procedure no. 1 did
not have a consistent results, where mixtures having high values W/FA displayed very low
workability. For W/FA of 0.40 and higher, all mixtures prepared using mixing procedure no. 2,
but one, displayed an acceptable initial setting time. This was not the case for mixing procedure
no. 1, where several mixtures didn’t meet the minimum initial setting time (Fig. 3.8d).
Furthermore, the W/FA ranging from 0.40 to 0.55 displayed compressive strength higher than
3000 psi for the oven-cured specimens prepared using mixing procedure no. 2. However, for this
W/FA range, ambient-cured specimens prepared using mixing procedures no. 1 displayed very
low strength while most of those prepared using mixing procedure no. 2 displayed strengths
ranging from 1000 to 3000 psi (Fig. 3.9a).
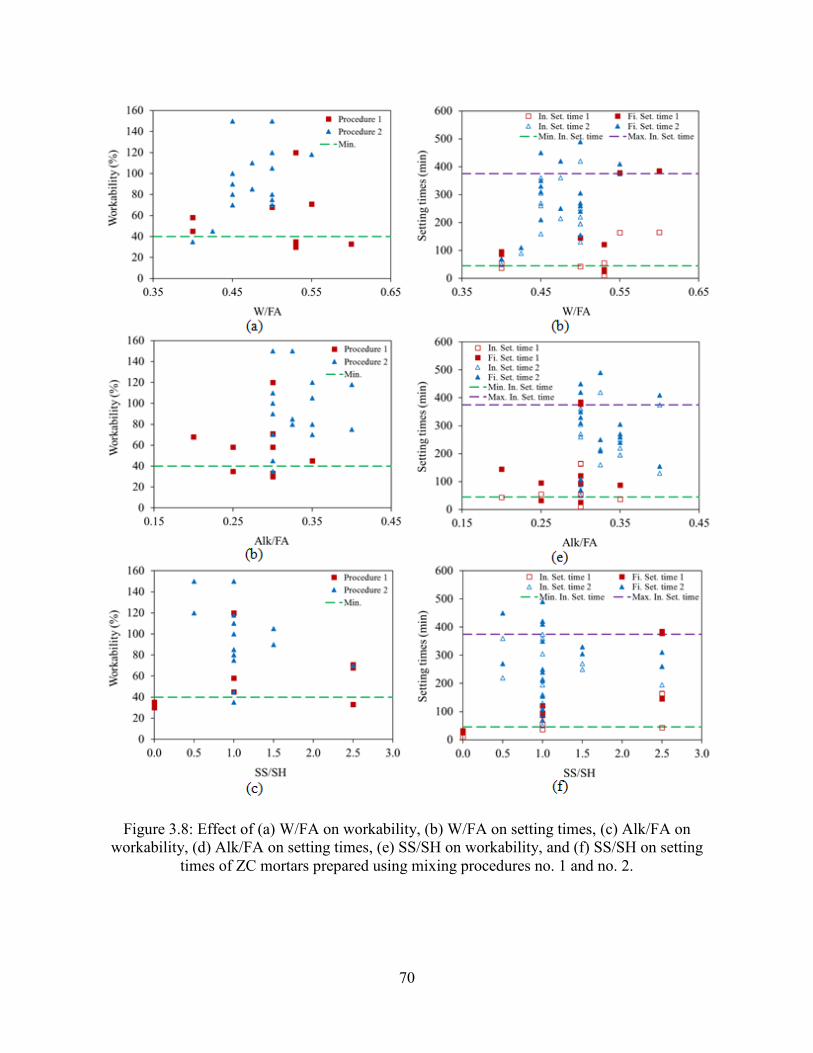
70
Figure 3.8: Effect of (a) W/FA on workability, (b) W/FA on setting times, (c) Alk/FA on workability, (d) Alk/FA on setting times, (e) SS/SH on workability, and (f) SS/SH on setting
times of ZC mortars prepared using mixing procedures no. 1 and no. 2.
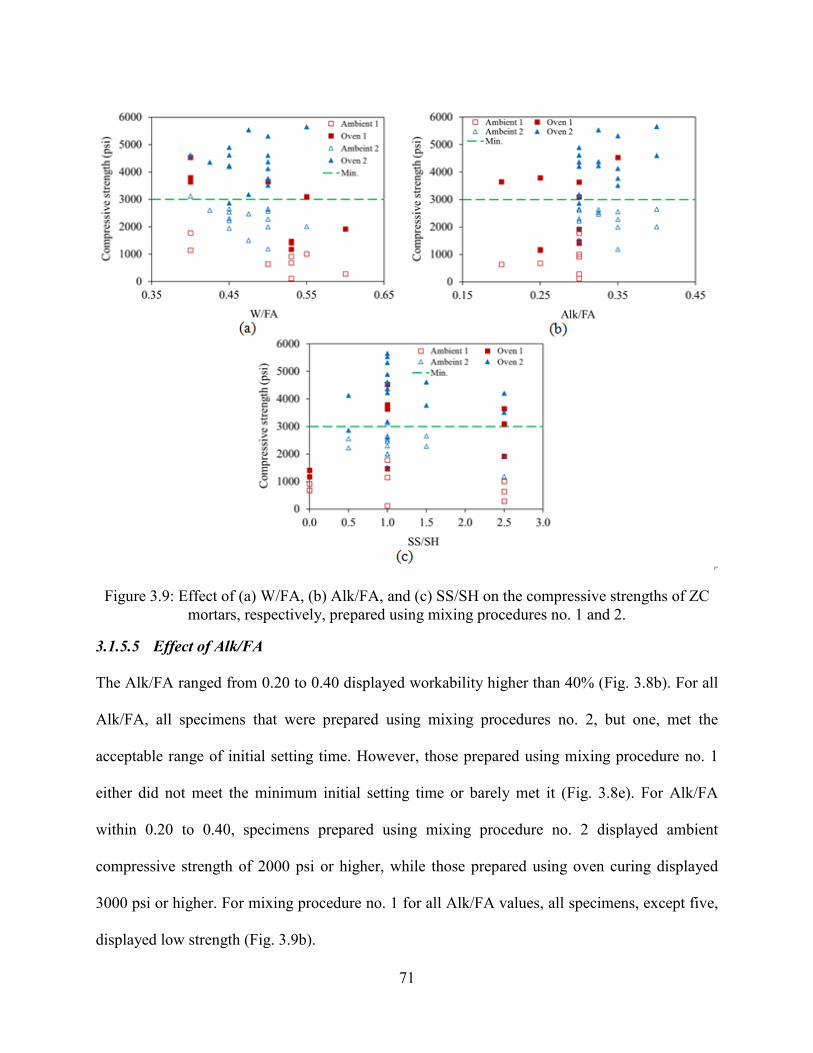
71
Figure 3.9: Effect of (a) W/FA, (b) Alk/FA, and (c) SS/SH on the compressive strengths of ZC mortars, respectively, prepared using mixing procedures no. 1 and 2.
3.1.5.5 Effect of Alk/FA
The Alk/FA ranged from 0.20 to 0.40 displayed workability higher than 40% (Fig. 3.8b). For all
Alk/FA, all specimens that were prepared using mixing procedures no. 2, but one, met the
acceptable range of initial setting time. However, those prepared using mixing procedure no. 1
either did not meet the minimum initial setting time or barely met it (Fig. 3.8e). For Alk/FA
within 0.20 to 0.40, specimens prepared using mixing procedure no. 2 displayed ambient
compressive strength of 2000 psi or higher, while those prepared using oven curing displayed
3000 psi or higher. For mixing procedure no. 1 for all Alk/FA values, all specimens, except five,
displayed low strength (Fig. 3.9b).
72
3.1.5.6 Effect of SS/SH
The SS/SH ranging from 0.5 to 2.5 displayed workability higher than 40% (Fig. 3.8b). For the
same range, all specimens prepared using mixing procedure no. 2, except one, displayed initial
setting times within the acceptable range. However, regardless of SS/SH, numerous specimens
that were prepared using mixing procedure no. 1 did not meet the setting time criterion
regardless of SS/SH (Fig. 3.8f). The best compressive strengths also occurred at SS/SH of 1.0 for
mixing procedures no. 1 and no. 2 (Fig. 3.9c).
3.1.5.7 Improved mixing procedures
Table 3.6 shows the workability, setting times, and compressive strength of the two improved
mixing procedures and mixing procedure no. 2 for comparison. The workability, initial setting
time, and final setting time of the mixture prepared using procedure no. 3 are 125%, 54%, and
53% higher than those of the same mixture prepared using procedure no. 2. Furthermore, the
compressive strength of the oven-cured specimen prepared using procedure no. 3 is 26% higher
than that of the specimen prepared using mixing procedure no. 2. However, the compressive
strength of the ambient-cured specimens remained approximately constant. In mixing no. 3, after
adding the alkali activator, the mixing speed was increased from 136 rpm to 281 rpm which
increased the workability and homogeneity of the mixture, therefore increasing the compressive
strength.
In the case of mixing procedure no. 4, adding the alkali activator gradually over five minutes
instead of one minute enhanced the properties of the mixture significantly. The workability,
initial setting time, and final setting time of the mixture prepared using procedure no. 4 are
122%, 219%, and 173% higher than those of the same mixture prepared using procedure no. 3.
Furthermore, the compressive strength of the ambient-cured specimen prepared using mixing
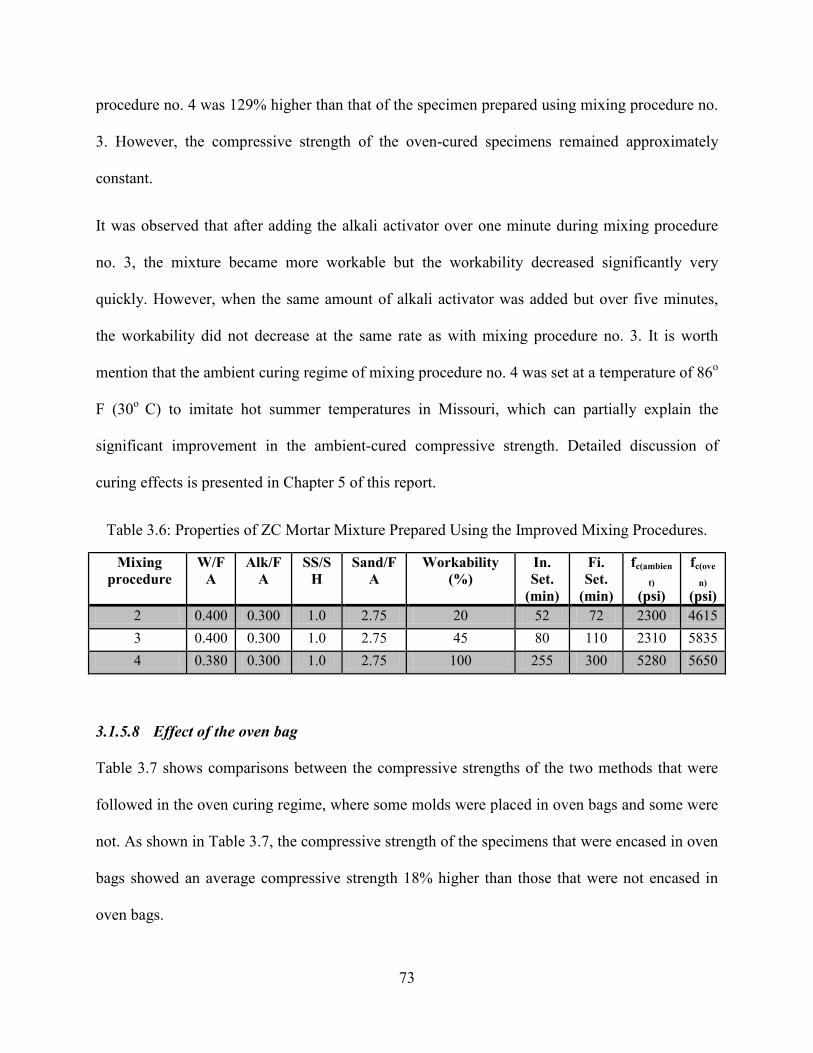
73
procedure no. 4 was 129% higher than that of the specimen prepared using mixing procedure no.
3. However, the compressive strength of the oven-cured specimens remained approximately
constant.
It was observed that after adding the alkali activator over one minute during mixing procedure
no. 3, the mixture became more workable but the workability decreased significantly very
quickly. However, when the same amount of alkali activator was added but over five minutes,
the workability did not decrease at the same rate as with mixing procedure no. 3. It is worth
mention that the ambient curing regime of mixing procedure no. 4 was set at a temperature of 86o
F (30o C) to imitate hot summer temperatures in Missouri, which can partially explain the
significant improvement in the ambient-cured compressive strength. Detailed discussion of
curing effects is presented in Chapter 5 of this report.
Table 3.6: Properties of ZC Mortar Mixture Prepared Using the Improved Mixing Procedures.
Mixing procedure
W/FA
Alk/FA
SS/SH
Sand/FA
Workability (%)
In. Set.
(min)
Fi. Set.
(min)
fc(ambien
t) (psi)
fc(ove
n) (psi)
2 0.400 0.300 1.0 2.75 20 52 72 2300 4615 3 0.400 0.300 1.0 2.75 45 80 110 2310 5835 4 0.380 0.300 1.0 2.75 100 255 300 5280 5650
3.1.5.8 Effect of the oven bag
Table 3.7 shows comparisons between the compressive strengths of the two methods that were
followed in the oven curing regime, where some molds were placed in oven bags and some were
not. As shown in Table 3.7, the compressive strength of the specimens that were encased in oven
bags showed an average compressive strength 18% higher than those that were not encased in
oven bags.
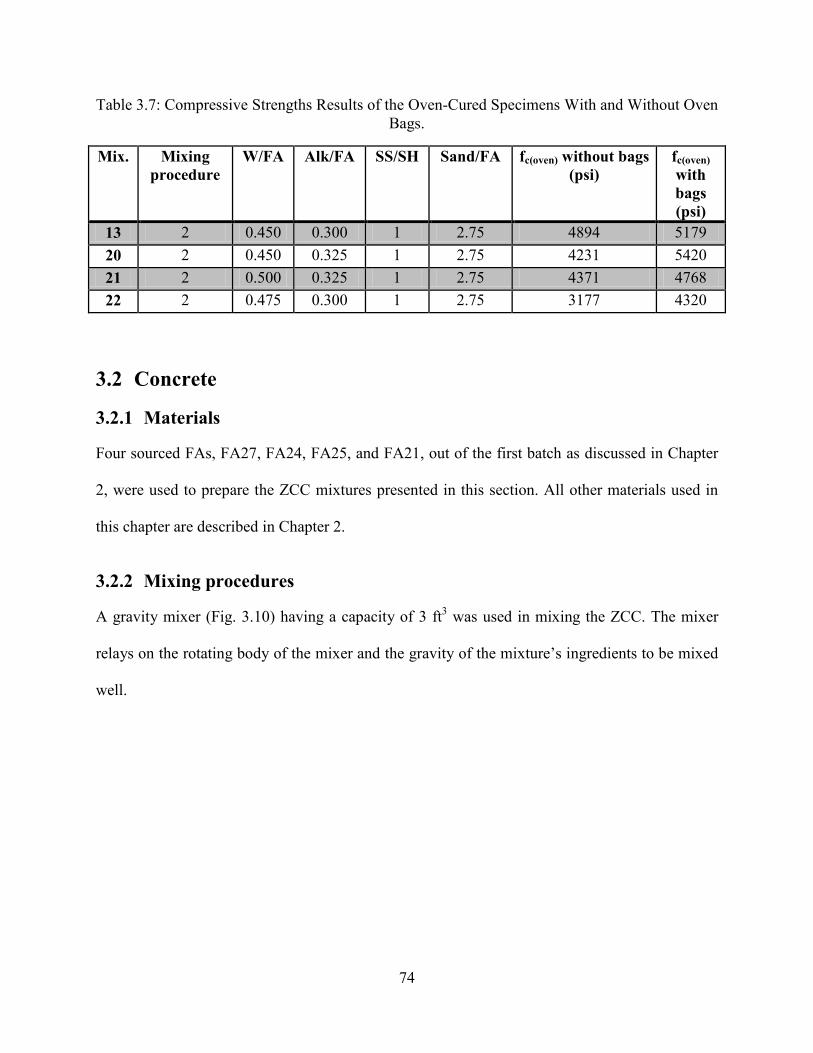
74
Table 3.7: Compressive Strengths Results of the Oven-Cured Specimens With and Without Oven Bags.
Mix. Mixing procedure
W/FA Alk/FA SS/SH Sand/FA fc(oven) without bags (psi)
fc(oven) with bags (psi)
13 2 0.450 0.300 1 2.75 4894 5179 20 2 0.450 0.325 1 2.75 4231 5420 21 2 0.500 0.325 1 2.75 4371 4768 22 2 0.475 0.300 1 2.75 3177 4320
3.2 Concrete
3.2.1 Materials
Four sourced FAs, FA27, FA24, FA25, and FA21, out of the first batch as discussed in Chapter
2, were used to prepare the ZCC mixtures presented in this section. All other materials used in
this chapter are described in Chapter 2.
3.2.2 Mixing procedures
A gravity mixer (Fig. 3.10) having a capacity of 3 ft3 was used in mixing the ZCC. The mixer
relays on the rotating body of the mixer and the gravity of the mixture’s ingredients to be mixed
well.

75
Figure 3.10: Gravity mixer with a maximum capacity of 1.5 ft3.
In all concrete mixtures, the required alkali activators consisting of SS and SH were mixed
together prior to adding them to the mixture. Since there is no ASTM standard mixing procedure
for ZCC, it was required to develop a mixing procedure that led to homogeneous workable
concrete. To address this challenge, eight mixing procedures were investigated during this
chapter.
3.2.2.1 Mixing procedure no. 1
The mixing procedure consisted of the following steps:
(1) The coarse and sand aggregates were mixed for one minute.
(2) The FA was added and mixed with the aggregates for one minute.
76
(3) The alkali activators were gradually added over one minute.
(4) The water was gradually added over one minute.
(5) Once all ingredients were added, the mixing procedure continued for another three
minutes.
3.2.2.2 Mixing procedure no. 2
The first two steps are similar to mixing procedure no. 1. The other steps are as follows:
(3) The water was gradually added over one minute.
(4) The alkali activators were gradually added over one minute.
(5) Once all ingredients were added, the mixing procedure continued for another three
minutes.
3.2.2.3 Mixing procedure no. 3
The first two steps are similar to mixing procedure no. 1. The other steps are as follows:
(3) The water was gradually added to the mix over one minute.
(4) The sodium hydroxide (SH) only was gradually added over two minutes.
(5) The sodium silicate (SS) was gradually added over one minute.
(6) Once all ingredients were added, the mixing procedure continued for another three
minutes.
3.2.2.4 Mixing procedure no. 4
The first two steps are similar to mixing procedure no. 1. The other steps are as follows:
(3) Three quarters of the required water was gradually added over one minute.
(4) The alkali activators were gradually added over one minute.
(5) The remaining amount of water was gradually added over one minute.
77
(6) Once all ingredients were added, the mixing procedure continued for another three
minutes.
3.2.2.5 Mixing procedure no. 5
The first two steps are similar to mixing procedure no. 1. The other steps are as follows:
(3) One half of the required water was gradually added over one minute.
(4) One half of the alkali activators were gradually added over one minute.
(5) The mixing was continued for two more minutes.
(6) The second half of the water was gradually added over one minute.
(7) The second half of the alkali activators was gradually added over one minute.
(8) Once all ingredients were added, the mixing procedure continued for another three
minutes.
3.2.2.6 Mixing procedure no. 6
The mixing procedure consisted of the following steps:
(1) The coarse and sand aggregates were mixed for one minute.
(2) One half of the required water was gradually added over one minute.
(3) The FA was added and mixed with the aggregates for one minute.
(4) The second half of the water was gradually added over one minute.
(5) One half of the alkali activators were added over one minute.
(6) The mixing was continued for one more minute.
(7) The second half of the alkali activators was gradually added for one minute.
(8) Once all ingredients were added, the mixing procedure continued for another three
minutes.
78
3.2.2.7 Mixing procedure no. 7
The first two steps are similar to mixing procedure no. 1. The other steps are as follows:
(3) The water was gradually added over one minute.
(4) One half of the alkali activators were gradually added over one minute.
(5) The mixing was continued for one more minute.
(6) The second half of the alkali activator was gradually added over one minute.
(7) Once all ingredients were added, the mixing procedure continued for another three
minutes.
3.2.2.8 Mixing procedure no. 8
The first two steps are similar to mixing procedure no. 1. The other steps are as follows:
(3) The water was gradually added over one minute.
(4) The alkali activator was gradually added over five minutes.
(5) Once all ingredients were added, the mixing procedure continued for another five
minutes.
3.2.3 Trial mixtures
In order to determine the required range of W/FA, FA content, coarse aggregate to sand ratio,
and mixing procedure, numerous trial mixtures were investigated. The different mixing
procedures were first investigated using FA25 (Table 3.8). Then, other sourced FAs were
explored as well. Fine tuning of the concrete mixture is presented in Chapter 6. Tables 3.8
through 3.11 show the mixture details for FAs, FA25, FA27, FA24, and FA21, respectively.

79
Table 3.8: Design of ZCC Mixtures Prepared Using FA25 (lb/ft3).
Mix. W/FA Alk/FA SS/SH Mixing Pro. C.A. Sand FA S.S. S.H. Water 1 0.400 0.300 1 1 60.7 50.6 25.0 3.75 3.75 5.91 2 0.550 0.250 1 2 70.6 48.6 19.0 2.38 2.38 8.11 3 0.425 0.250 1 2 92.6 63.7 25.0 3.12 3.12 7.52 4 0.350 0.300 1 2 56.2 56.2 25.0 3.75 3.75 4.66 5 0.450 0.300 1 2 56.2 56.2 25.0 3.75 3.75 7.15 6 0.500 0.300 1 2 59.9 49.9 25.0 3.75 3.75 8.40 7 0.425 0.300 1 2 59.9 49.9 25.0 3.75 3.75 6.52 8 0.400 0.300 1 2 60.7 50.6 25.0 3.75 3.75 5.91 9 0.375 0.275 1 2 62.2 51.8 25.0 3.43 3.43 5.68 10 0.400 0.275 1 2 61.4 51.2 25.0 3.43 3.43 6.30 11 0.390 0.250 1 2 62.2 62.2 25.0 3.12 3.12 6.44 12 0.425 0.300 1 2 49.9 49.9 29.3 4.40 4.40 7.52 13 0.450 0.300 1 2 50.6 50.6 28.1 4.21 4.21 7.93 14 0.425 0.300 1 2 51.4 51.4 28.1 4.21 4.21 7.24 15 0.425 0.300 1 2 60.7 50.6 25.0 3.75 3.75 6.53 16 0.400 0.300 1 3 60.7 50.6 25.0 3.75 3.75 5.91 17 0.400 0.300 1 4 60.7 50.6 25.0 3.75 3.75 5.91 18 0.400 0.300 1 5 60.7 50.6 25.0 3.75 3.75 5.91 19 0.400 0.300 1 6 60.7 50.6 25.0 3.75 3.75 5.91 20 0.400 0.300 1 7 57.3 47.8 28.1 4.21 4.21 6.55 21 0.400 0.300 1 7 60.7 50.6 25.0 3.75 3.75 5.91 22 0.380 0.300 1 8 58.2 48.4 28.1 4.21 4.21 5.99 23 0.350 0.300 1 8 59.8 49.9 28.1 4.21 4.21 5.17
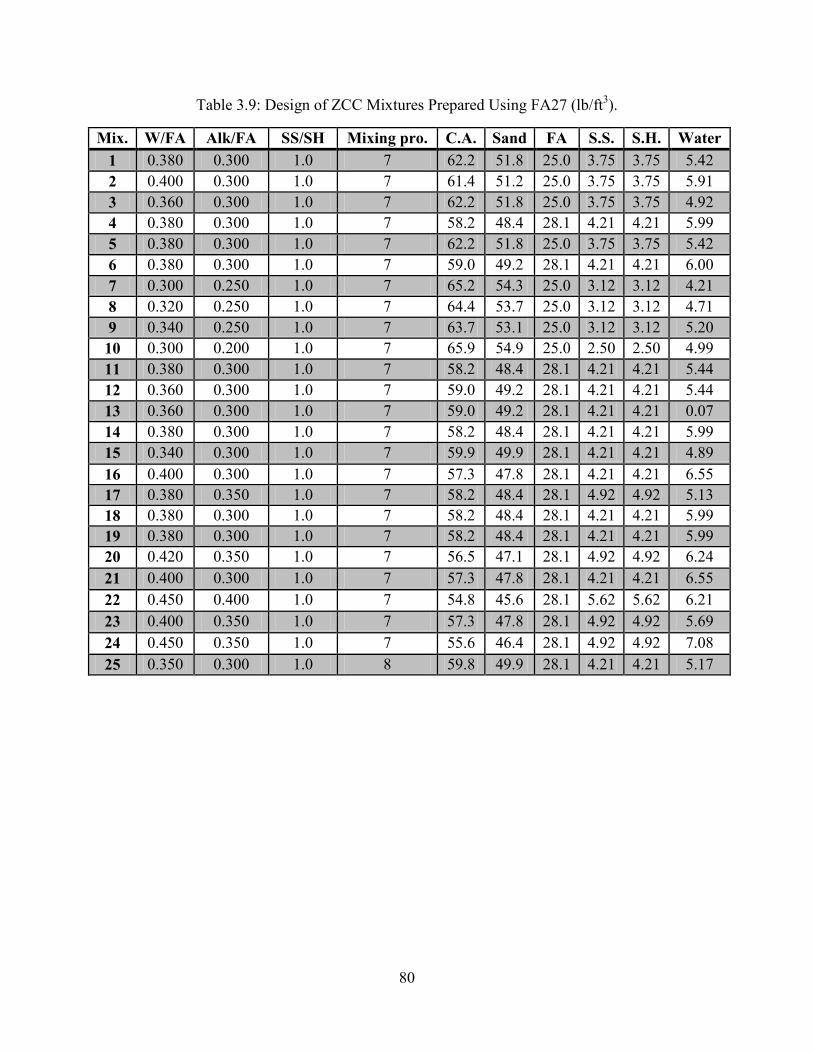
80
Table 3.9: Design of ZCC Mixtures Prepared Using FA27 (lb/ft3).
Mix. W/FA Alk/FA SS/SH Mixing pro. C.A. Sand FA S.S. S.H. Water 1 0.380 0.300 1.0 7 62.2 51.8 25.0 3.75 3.75 5.42 2 0.400 0.300 1.0 7 61.4 51.2 25.0 3.75 3.75 5.91 3 0.360 0.300 1.0 7 62.2 51.8 25.0 3.75 3.75 4.92 4 0.380 0.300 1.0 7 58.2 48.4 28.1 4.21 4.21 5.99 5 0.380 0.300 1.0 7 62.2 51.8 25.0 3.75 3.75 5.42 6 0.380 0.300 1.0 7 59.0 49.2 28.1 4.21 4.21 6.00 7 0.300 0.250 1.0 7 65.2 54.3 25.0 3.12 3.12 4.21 8 0.320 0.250 1.0 7 64.4 53.7 25.0 3.12 3.12 4.71 9 0.340 0.250 1.0 7 63.7 53.1 25.0 3.12 3.12 5.20 10 0.300 0.200 1.0 7 65.9 54.9 25.0 2.50 2.50 4.99 11 0.380 0.300 1.0 7 58.2 48.4 28.1 4.21 4.21 5.44 12 0.360 0.300 1.0 7 59.0 49.2 28.1 4.21 4.21 5.44 13 0.360 0.300 1.0 7 59.0 49.2 28.1 4.21 4.21 0.07 14 0.380 0.300 1.0 7 58.2 48.4 28.1 4.21 4.21 5.99 15 0.340 0.300 1.0 7 59.9 49.9 28.1 4.21 4.21 4.89 16 0.400 0.300 1.0 7 57.3 47.8 28.1 4.21 4.21 6.55 17 0.380 0.350 1.0 7 58.2 48.4 28.1 4.92 4.92 5.13 18 0.380 0.300 1.0 7 58.2 48.4 28.1 4.21 4.21 5.99 19 0.380 0.300 1.0 7 58.2 48.4 28.1 4.21 4.21 5.99 20 0.420 0.350 1.0 7 56.5 47.1 28.1 4.92 4.92 6.24 21 0.400 0.300 1.0 7 57.3 47.8 28.1 4.21 4.21 6.55 22 0.450 0.400 1.0 7 54.8 45.6 28.1 5.62 5.62 6.21 23 0.400 0.350 1.0 7 57.3 47.8 28.1 4.92 4.92 5.69 24 0.450 0.350 1.0 7 55.6 46.4 28.1 4.92 4.92 7.08 25 0.350 0.300 1.0 8 59.8 49.9 28.1 4.21 4.21 5.17
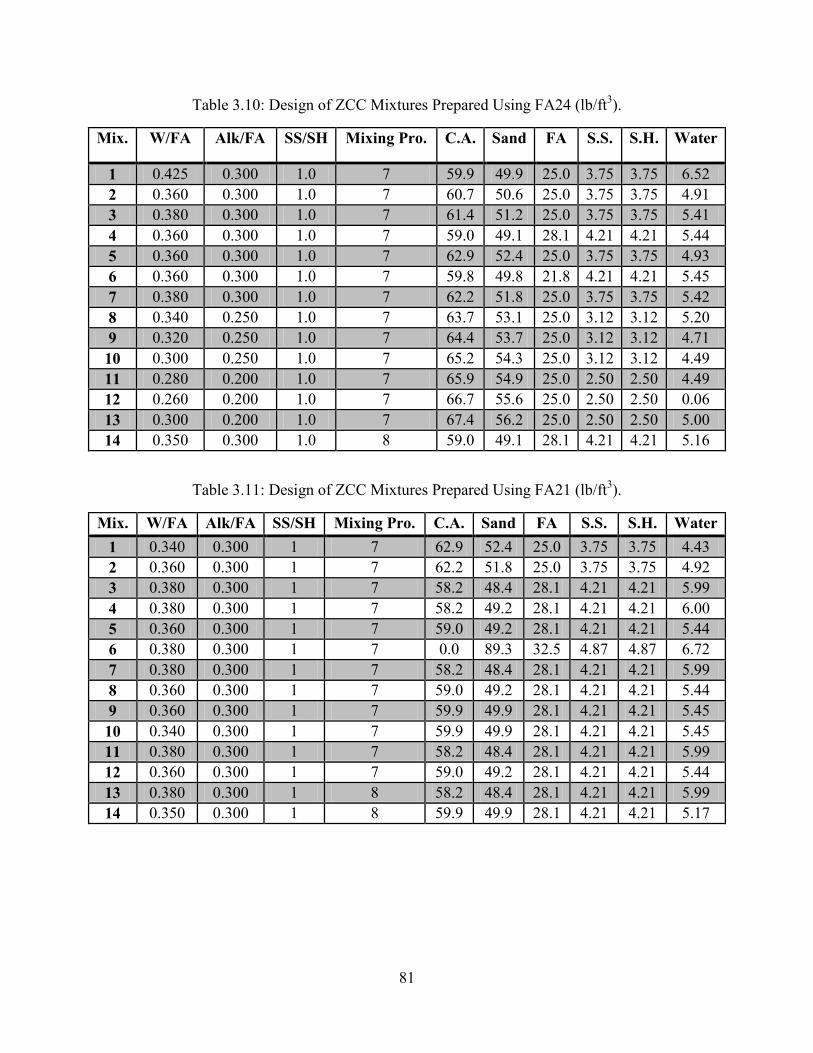
81
Table 3.10: Design of ZCC Mixtures Prepared Using FA24 (lb/ft3).
Mix. W/FA Alk/FA SS/SH Mixing Pro. C.A. Sand FA S.S. S.H. Water
1 0.425 0.300 1.0 7 59.9 49.9 25.0 3.75 3.75 6.52 2 0.360 0.300 1.0 7 60.7 50.6 25.0 3.75 3.75 4.91 3 0.380 0.300 1.0 7 61.4 51.2 25.0 3.75 3.75 5.41 4 0.360 0.300 1.0 7 59.0 49.1 28.1 4.21 4.21 5.44 5 0.360 0.300 1.0 7 62.9 52.4 25.0 3.75 3.75 4.93 6 0.360 0.300 1.0 7 59.8 49.8 21.8 4.21 4.21 5.45 7 0.380 0.300 1.0 7 62.2 51.8 25.0 3.75 3.75 5.42 8 0.340 0.250 1.0 7 63.7 53.1 25.0 3.12 3.12 5.20 9 0.320 0.250 1.0 7 64.4 53.7 25.0 3.12 3.12 4.71 10 0.300 0.250 1.0 7 65.2 54.3 25.0 3.12 3.12 4.49 11 0.280 0.200 1.0 7 65.9 54.9 25.0 2.50 2.50 4.49 12 0.260 0.200 1.0 7 66.7 55.6 25.0 2.50 2.50 0.06 13 0.300 0.200 1.0 7 67.4 56.2 25.0 2.50 2.50 5.00 14 0.350 0.300 1.0 8 59.0 49.1 28.1 4.21 4.21 5.16
Table 3.11: Design of ZCC Mixtures Prepared Using FA21 (lb/ft3).
Mix. W/FA Alk/FA SS/SH Mixing Pro. C.A. Sand FA S.S. S.H. Water 1 0.340 0.300 1 7 62.9 52.4 25.0 3.75 3.75 4.43 2 0.360 0.300 1 7 62.2 51.8 25.0 3.75 3.75 4.92 3 0.380 0.300 1 7 58.2 48.4 28.1 4.21 4.21 5.99 4 0.380 0.300 1 7 58.2 49.2 28.1 4.21 4.21 6.00 5 0.360 0.300 1 7 59.0 49.2 28.1 4.21 4.21 5.44 6 0.380 0.300 1 7 0.0 89.3 32.5 4.87 4.87 6.72 7 0.380 0.300 1 7 58.2 48.4 28.1 4.21 4.21 5.99 8 0.360 0.300 1 7 59.0 49.2 28.1 4.21 4.21 5.44 9 0.360 0.300 1 7 59.9 49.9 28.1 4.21 4.21 5.45 10 0.340 0.300 1 7 59.9 49.9 28.1 4.21 4.21 5.45 11 0.380 0.300 1 7 58.2 48.4 28.1 4.21 4.21 5.99 12 0.360 0.300 1 7 59.0 49.2 28.1 4.21 4.21 5.44 13 0.380 0.300 1 8 58.2 48.4 28.1 4.21 4.21 5.99 14 0.350 0.300 1 8 59.9 49.9 28.1 4.21 4.21 5.17

82
3.2.4 Fresh properties, casting, curing, and testing
3.2.4.1 Workability
The workability of each concrete mixtures was determined using a slump test per ASTM C143-
15 [103] (Fig. 3.11).
Figure 3.11: Examples of slump tests of ZCC (a) 8 in (mix 11 of FA27), and (b) 6.5 in (mix 7 of FA25).
3.2.4.2 Casting of concrete cylinders
The concrete mixture that had an accepted slump was cast in 4 x 8 in plastic cylinders per ASTM
C192-16 [104]. The concrete was placed in two layers and each layer was tamped 25 times.
3.2.4.3 Curing regimes
After casting the concrete in the plastic cylinders, each specimen had a rest time of two hours at
an ambient temperature of 73 ± 3o F (23o C ± 2o C) [44]. Then, two different curing regimes were
used. The oven curing regime included an elevated heat curing in an electric oven at 158o F (70o
C) for 24 hours. The molds were either encased in oven bags before placing them into the oven
or placed directly in the oven without the bags (Tables 3.1 and 3.2). Oven bags were used for all
specimens when it was found that encasing the molds in oven bags increased the compressive
83
strength of ZC mortar. As explained in the previous section, in addition to the built-in thermal
controller in the oven, the temperature was monitored using thermocouples that were placed at
different locations in the oven (Fig. 3.5). The ambient curing regime included leaving the
specimens at an ambient temperature of 73 ± 3o F (23 ± 2o C) for 7 days.
All the oven-cured specimens were demolded after letting them rest out of the oven for at least 1
hour to let them cool down and avoid sudden changes in the temperature between the oven and
the ambient temperature. The ambient-cured specimens were demolded after 48 hours. With both
curing techniques, two approaches were used to store the specimens after demolding them. First,
specimens were stored directly in the laboratory at the room temperature of 73 ± 3o F (23 ± 2o C)
until the testing age. Second, specimens were encased in plastic bags to prevent moisture loss.
The first storing approach was in conjunction with the mixing procedures no. 1 through 7. The
second storing regime was followed for the specimens that were mixed according to mixing
procedure no. 8. Furthermore, the two storing regimes were applied to a selected mixture of
FA25 and FA21 that was prepared using mixing procedure no. 8 for comparison. All specimens
were tested at the age of 7 days. It is worth noting that specimens prepared using final mixtures
presented in Chapter 6 were tested at different ages including 1 day and 28 days.
3.2.4.4 Compressive strength test
The compressive strength of each mixture was determined using a Tinius Olsen loading machine
at a loading rate of 500 lb/sec (Fig. 3.12). The specimens were tested per ASTM C39-16 [105].
The reported strengths are the average of the results of three cylinders per each mixture.
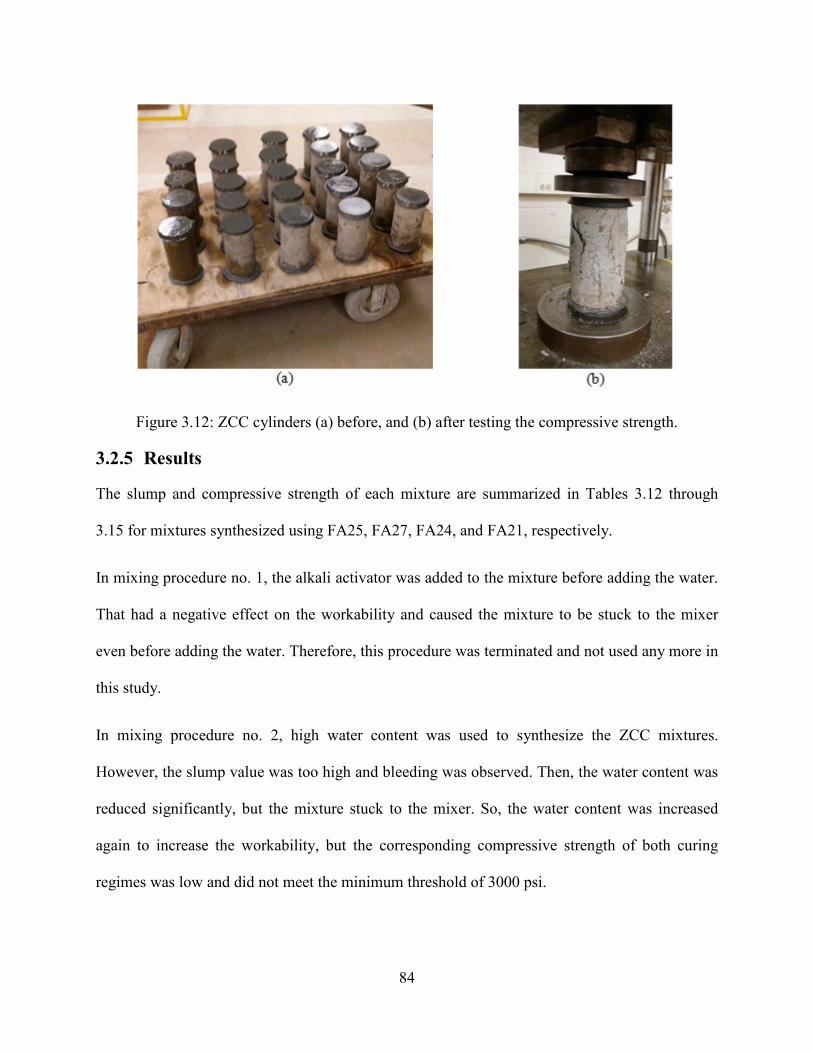
84
Figure 3.12: ZCC cylinders (a) before, and (b) after testing the compressive strength.
3.2.5 Results
The slump and compressive strength of each mixture are summarized in Tables 3.12 through
3.15 for mixtures synthesized using FA25, FA27, FA24, and FA21, respectively.
In mixing procedure no. 1, the alkali activator was added to the mixture before adding the water.
That had a negative effect on the workability and caused the mixture to be stuck to the mixer
even before adding the water. Therefore, this procedure was terminated and not used any more in
this study.
In mixing procedure no. 2, high water content was used to synthesize the ZCC mixtures.
However, the slump value was too high and bleeding was observed. Then, the water content was
reduced significantly, but the mixture stuck to the mixer. So, the water content was increased
again to increase the workability, but the corresponding compressive strength of both curing
regimes was low and did not meet the minimum threshold of 3000 psi.
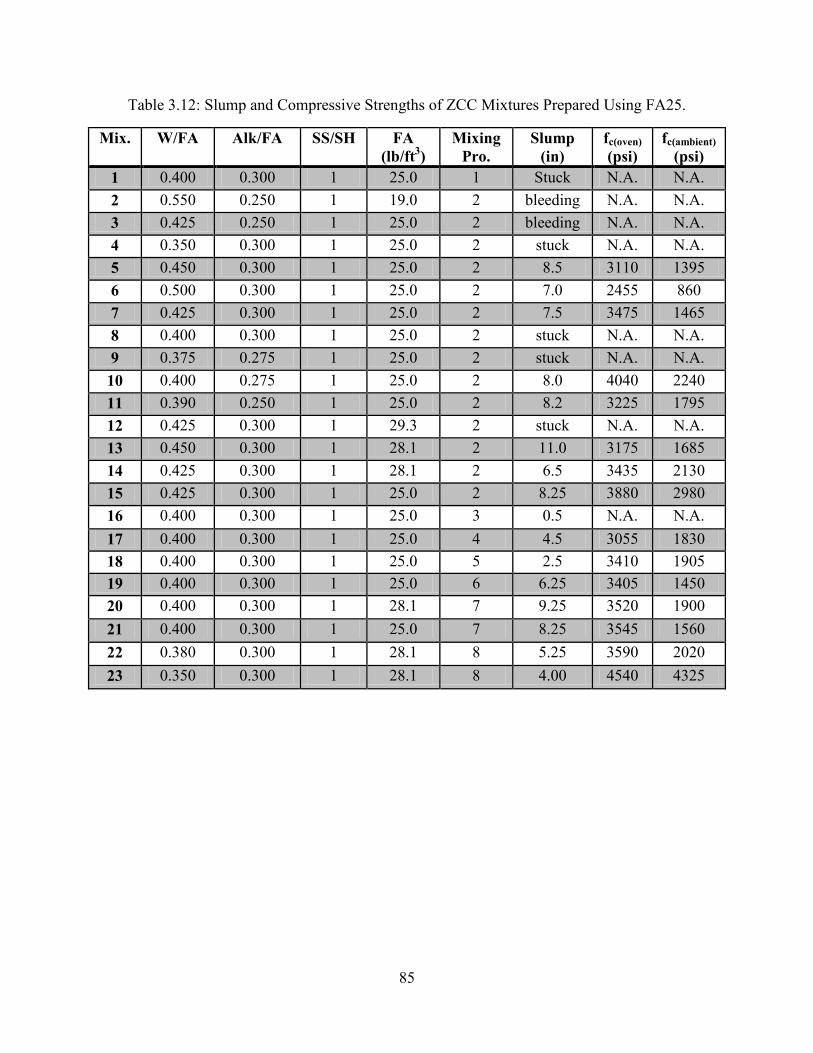
85
Table 3.12: Slump and Compressive Strengths of ZCC Mixtures Prepared Using FA25.
Mix. W/FA Alk/FA SS/SH FA (lb/ft3)
Mixing Pro.
Slump (in)
fc(oven) (psi)
fc(ambient) (psi)
1 0.400 0.300 1 25.0 1 Stuck N.A. N.A. 2 0.550 0.250 1 19.0 2 bleeding N.A. N.A. 3 0.425 0.250 1 25.0 2 bleeding N.A. N.A. 4 0.350 0.300 1 25.0 2 stuck N.A. N.A. 5 0.450 0.300 1 25.0 2 8.5 3110 1395 6 0.500 0.300 1 25.0 2 7.0 2455 860 7 0.425 0.300 1 25.0 2 7.5 3475 1465 8 0.400 0.300 1 25.0 2 stuck N.A. N.A. 9 0.375 0.275 1 25.0 2 stuck N.A. N.A. 10 0.400 0.275 1 25.0 2 8.0 4040 2240 11 0.390 0.250 1 25.0 2 8.2 3225 1795 12 0.425 0.300 1 29.3 2 stuck N.A. N.A. 13 0.450 0.300 1 28.1 2 11.0 3175 1685 14 0.425 0.300 1 28.1 2 6.5 3435 2130 15 0.425 0.300 1 25.0 2 8.25 3880 2980 16 0.400 0.300 1 25.0 3 0.5 N.A. N.A. 17 0.400 0.300 1 25.0 4 4.5 3055 1830 18 0.400 0.300 1 25.0 5 2.5 3410 1905 19 0.400 0.300 1 25.0 6 6.25 3405 1450 20 0.400 0.300 1 28.1 7 9.25 3520 1900 21 0.400 0.300 1 25.0 7 8.25 3545 1560 22 0.380 0.300 1 28.1 8 5.25 3590 2020 23 0.350 0.300 1 28.1 8 4.00 4540 4325
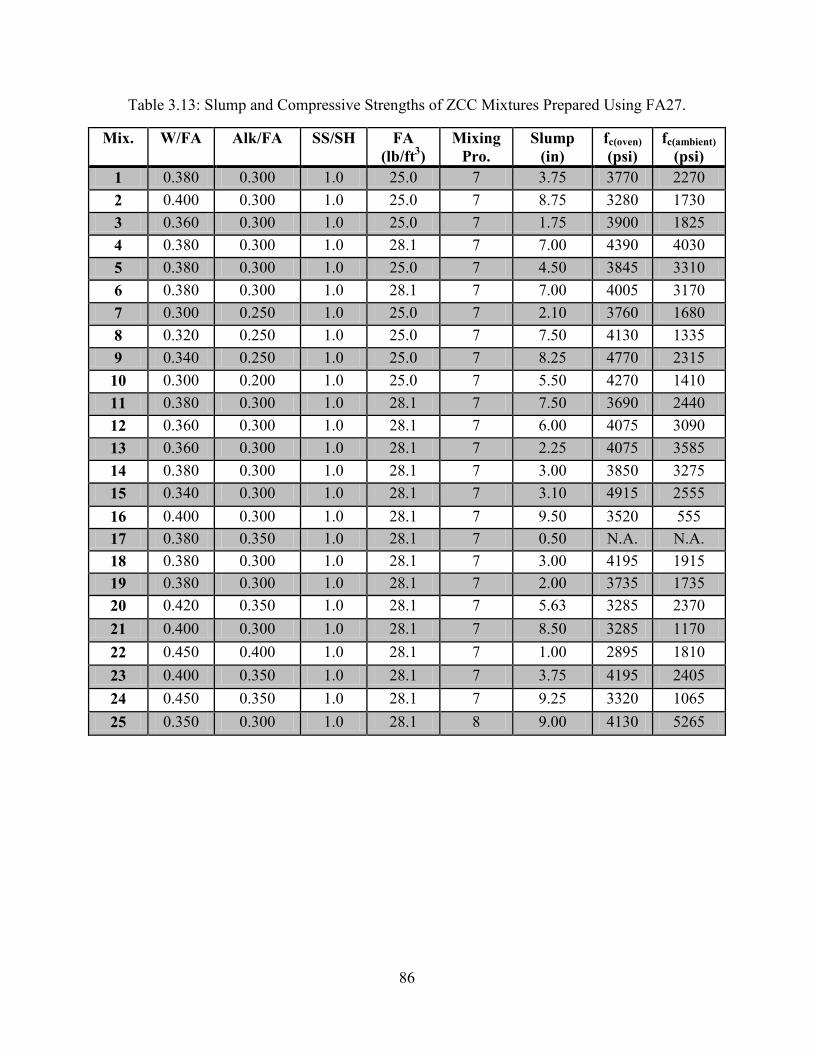
86
Table 3.13: Slump and Compressive Strengths of ZCC Mixtures Prepared Using FA27.
Mix. W/FA Alk/FA SS/SH FA (lb/ft3)
Mixing Pro.
Slump (in)
fc(oven) (psi)
fc(ambient) (psi)
1 0.380 0.300 1.0 25.0 7 3.75 3770 2270 2 0.400 0.300 1.0 25.0 7 8.75 3280 1730 3 0.360 0.300 1.0 25.0 7 1.75 3900 1825 4 0.380 0.300 1.0 28.1 7 7.00 4390 4030 5 0.380 0.300 1.0 25.0 7 4.50 3845 3310 6 0.380 0.300 1.0 28.1 7 7.00 4005 3170 7 0.300 0.250 1.0 25.0 7 2.10 3760 1680 8 0.320 0.250 1.0 25.0 7 7.50 4130 1335 9 0.340 0.250 1.0 25.0 7 8.25 4770 2315 10 0.300 0.200 1.0 25.0 7 5.50 4270 1410 11 0.380 0.300 1.0 28.1 7 7.50 3690 2440 12 0.360 0.300 1.0 28.1 7 6.00 4075 3090 13 0.360 0.300 1.0 28.1 7 2.25 4075 3585 14 0.380 0.300 1.0 28.1 7 3.00 3850 3275 15 0.340 0.300 1.0 28.1 7 3.10 4915 2555 16 0.400 0.300 1.0 28.1 7 9.50 3520 555 17 0.380 0.350 1.0 28.1 7 0.50 N.A. N.A. 18 0.380 0.300 1.0 28.1 7 3.00 4195 1915 19 0.380 0.300 1.0 28.1 7 2.00 3735 1735 20 0.420 0.350 1.0 28.1 7 5.63 3285 2370 21 0.400 0.300 1.0 28.1 7 8.50 3285 1170 22 0.450 0.400 1.0 28.1 7 1.00 2895 1810 23 0.400 0.350 1.0 28.1 7 3.75 4195 2405 24 0.450 0.350 1.0 28.1 7 9.25 3320 1065 25 0.350 0.300 1.0 28.1 8 9.00 4130 5265
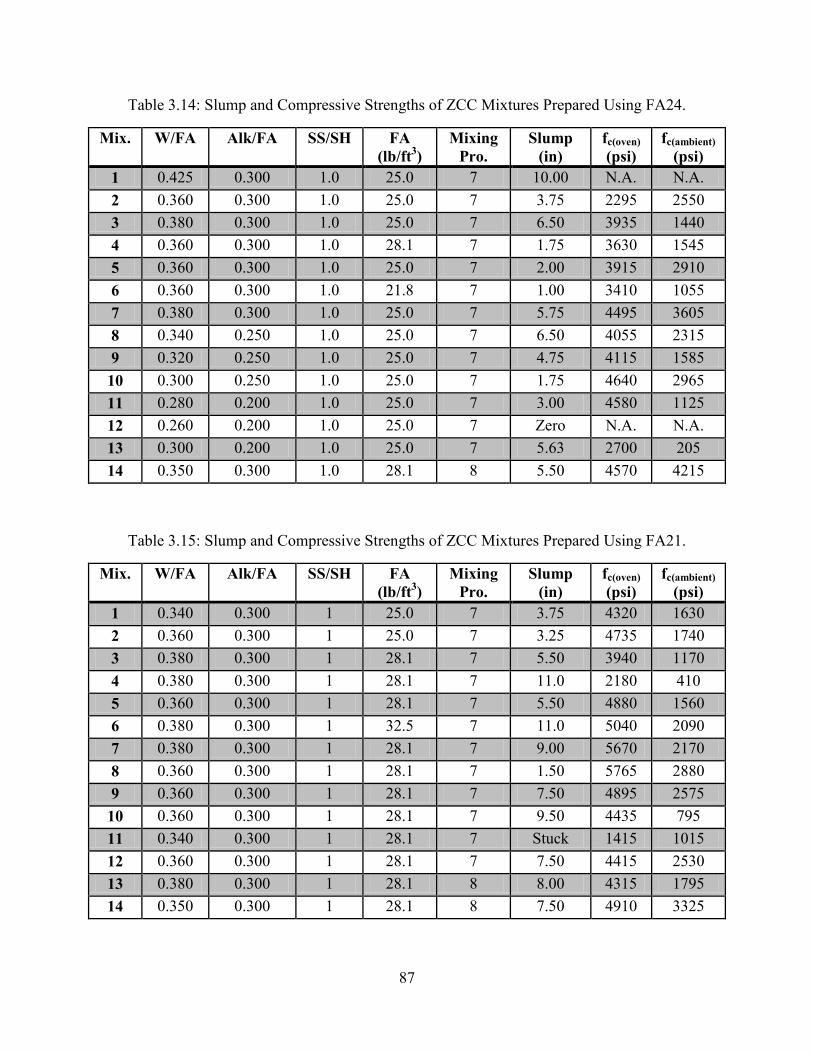
87
Table 3.14: Slump and Compressive Strengths of ZCC Mixtures Prepared Using FA24.
Mix. W/FA Alk/FA SS/SH FA (lb/ft3)
Mixing Pro.
Slump (in)
fc(oven) (psi)
fc(ambient) (psi)
1 0.425 0.300 1.0 25.0 7 10.00 N.A. N.A. 2 0.360 0.300 1.0 25.0 7 3.75 2295 2550 3 0.380 0.300 1.0 25.0 7 6.50 3935 1440 4 0.360 0.300 1.0 28.1 7 1.75 3630 1545 5 0.360 0.300 1.0 25.0 7 2.00 3915 2910 6 0.360 0.300 1.0 21.8 7 1.00 3410 1055 7 0.380 0.300 1.0 25.0 7 5.75 4495 3605 8 0.340 0.250 1.0 25.0 7 6.50 4055 2315 9 0.320 0.250 1.0 25.0 7 4.75 4115 1585 10 0.300 0.250 1.0 25.0 7 1.75 4640 2965 11 0.280 0.200 1.0 25.0 7 3.00 4580 1125 12 0.260 0.200 1.0 25.0 7 Zero N.A. N.A. 13 0.300 0.200 1.0 25.0 7 5.63 2700 205 14 0.350 0.300 1.0 28.1 8 5.50 4570 4215
Table 3.15: Slump and Compressive Strengths of ZCC Mixtures Prepared Using FA21.
Mix. W/FA Alk/FA SS/SH FA (lb/ft3)
Mixing Pro.
Slump (in)
fc(oven) (psi)
fc(ambient) (psi)
1 0.340 0.300 1 25.0 7 3.75 4320 1630 2 0.360 0.300 1 25.0 7 3.25 4735 1740 3 0.380 0.300 1 28.1 7 5.50 3940 1170 4 0.380 0.300 1 28.1 7 11.0 2180 410 5 0.360 0.300 1 28.1 7 5.50 4880 1560 6 0.380 0.300 1 32.5 7 11.0 5040 2090 7 0.380 0.300 1 28.1 7 9.00 5670 2170 8 0.360 0.300 1 28.1 7 1.50 5765 2880 9 0.360 0.300 1 28.1 7 7.50 4895 2575 10 0.360 0.300 1 28.1 7 9.50 4435 795 11 0.340 0.300 1 28.1 7 Stuck 1415 1015 12 0.360 0.300 1 28.1 7 7.50 4415 2530 13 0.380 0.300 1 28.1 8 8.00 4315 1795 14 0.350 0.300 1 28.1 8 7.50 4910 3325
88
In mixing procedure no. 3, the two alkali activators were not added together at the same time, but
the sodium hydroxide was added first. That had a negative effect on the workability; the mixture
had poor workability of only 0.5 in, and it was not possible to place the mixture in the molds for
further testing.
In mixing procedure no. 4, not all the water was added before adding the alkali activator. That
allowed adding less water content, but the strength was not improved, due to agglomeration of
the mixture where not all the FA particles were wetted completely. Therefore, adding the alkali
activators caused an agglomeration.
In mixing procedure no. 5, one half of the water and one half of the alkali activator were added
first; then, the remaining amount of both were added later. That had a negative effect on the
workability compared with adding all the water first before the alkali activator.
In mixing procedure no. 6, the water was added in two equal portions followed by adding the
alkali activator in two equal portions. This change resulted in a significant improvement in the
workability. However, the compressive strength was not improved due to the high W/FA that
was necessary to avoid agglomeration.
In mixing procedure no. 7, the water was added in full followed by adding the alkali activator in
two equal portions. This mixing procedure improved the workability, and the compressive
strength exceeded the target of 3000 psi. However, more improvements in the workability and
strength were desired.
In mixing procedure no. 8, the water was added at the beginning of the mixing procedure;
however, the alkali activators were added gradually over five minutes which prevented the
agglomeration and significantly improved the workability allowing the use of a lower water
89
content to achieve a given slump compared to other mixing procedures. This reduction in water
content improved the strength of the ambient-cured specimens while it did not affect that of the
oven-cured. It is worth noting that specimens that were prepared using this procedure were
encased in plastic bags during the ambient curing which reduced the evaporation of water,
allowing more effective curing and achieving higher strengths.
3.2.6 Discussion
3.2.6.1 Mixing procedures
This section presents qualitative comparisons between the performances of mixtures prepared
using mixing procedures no. 1 through no. 8. Fig. 3.13 shows the effect of the mixing procedure
on the slump and compressive strengths of ZCC. Furthermore, Table 3.16 presents comparisons
between the performances of the same mixture design prepared using different mixing
procedures. For the particular mixture presented in Table 3.16, mixing procedure no. 7
outperformed all other mixing procedures. For other mixtures, mixing procedures no. 2, 7, and 8
displayed the highest slump values (Fig. 3.13a). Although some of the specimens that were
prepared using mixing procedure no. 7 showed very low workability (i.e. less than 3 in), those
particular mixtures were prepared after the preliminary success of preparing ZCC mixtures using
mixing procedure no. 7. Therefore, more mixtures were prepared where the W/FA was
significantly reduced and/or the Alk/FA was significantly increased to obtain relatively higher
strength ZCC having a good workability.
Table 3.16 shows that the compressive strength of the oven-cured specimens prepared using
procedure no. 7 displayed the highest strength compared to those prepared using the other
mixing procedures. However, the compressive strength of the ambient-cured specimens was low
for all specimens. Qualitatively, the ambient and oven compressive strengths of the mixtures
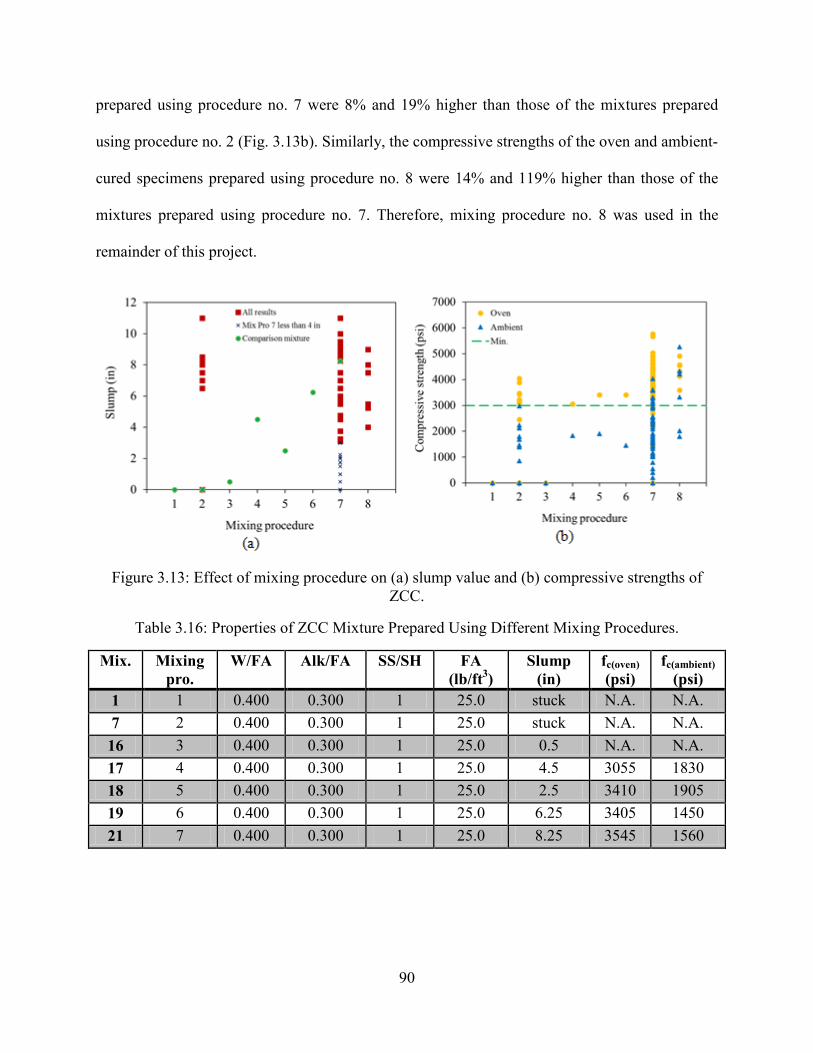
90
prepared using procedure no. 7 were 8% and 19% higher than those of the mixtures prepared
using procedure no. 2 (Fig. 3.13b). Similarly, the compressive strengths of the oven and ambient-
cured specimens prepared using procedure no. 8 were 14% and 119% higher than those of the
mixtures prepared using procedure no. 7. Therefore, mixing procedure no. 8 was used in the
remainder of this project.
Figure 3.13: Effect of mixing procedure on (a) slump value and (b) compressive strengths of ZCC.
Table 3.16: Properties of ZCC Mixture Prepared Using Different Mixing Procedures.
Mix. Mixing pro.
W/FA Alk/FA SS/SH FA (lb/ft3)
Slump (in)
fc(oven) (psi)
fc(ambient) (psi)
1 1 0.400 0.300 1 25.0 stuck N.A. N.A. 7 2 0.400 0.300 1 25.0 stuck N.A. N.A. 16 3 0.400 0.300 1 25.0 0.5 N.A. N.A. 17 4 0.400 0.300 1 25.0 4.5 3055 1830 18 5 0.400 0.300 1 25.0 2.5 3410 1905 19 6 0.400 0.300 1 25.0 6.25 3405 1450 21 7 0.400 0.300 1 25.0 8.25 3545 1560
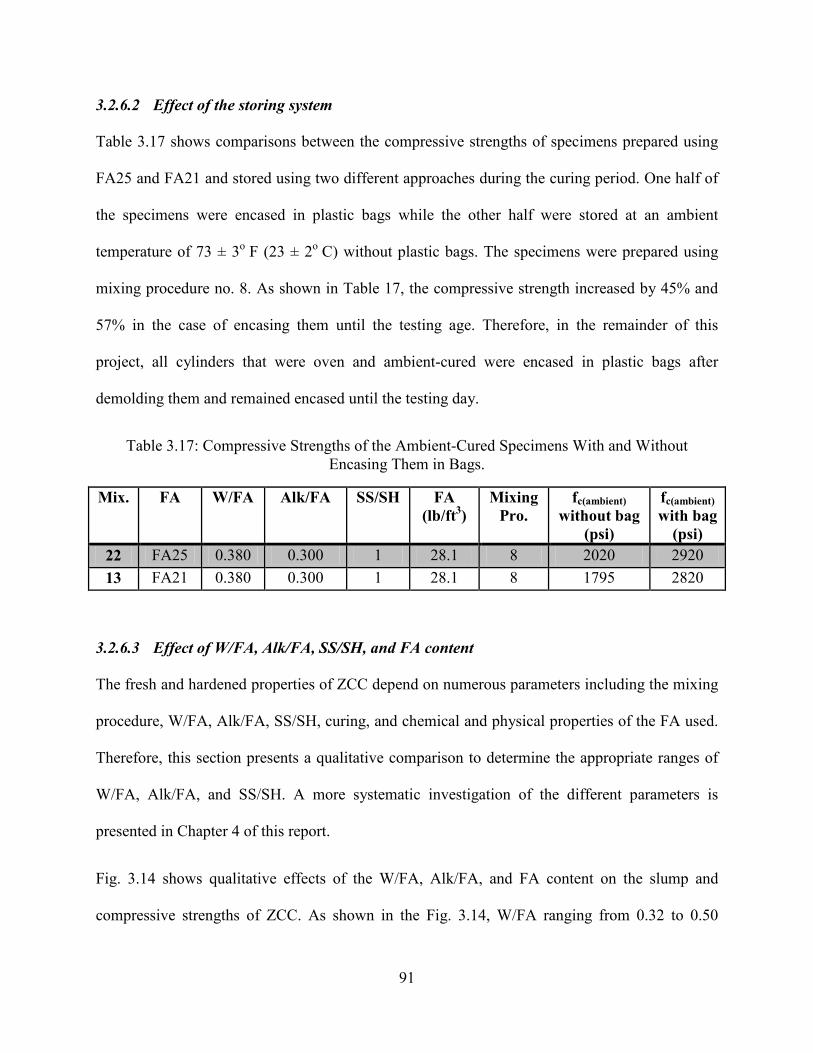
91
3.2.6.2 Effect of the storing system
Table 3.17 shows comparisons between the compressive strengths of specimens prepared using
FA25 and FA21 and stored using two different approaches during the curing period. One half of
the specimens were encased in plastic bags while the other half were stored at an ambient
temperature of 73 ± 3o F (23 ± 2o C) without plastic bags. The specimens were prepared using
mixing procedure no. 8. As shown in Table 17, the compressive strength increased by 45% and
57% in the case of encasing them until the testing age. Therefore, in the remainder of this
project, all cylinders that were oven and ambient-cured were encased in plastic bags after
demolding them and remained encased until the testing day.
Table 3.17: Compressive Strengths of the Ambient-Cured Specimens With and Without Encasing Them in Bags.
Mix. FA W/FA Alk/FA SS/SH FA (lb/ft3)
Mixing Pro.
fc(ambient) without bag
(psi)
fc(ambient) with bag
(psi) 22 FA25 0.380 0.300 1 28.1 8 2020 2920 13 FA21 0.380 0.300 1 28.1 8 1795 2820
3.2.6.3 Effect of W/FA, Alk/FA, SS/SH, and FA content
The fresh and hardened properties of ZCC depend on numerous parameters including the mixing
procedure, W/FA, Alk/FA, SS/SH, curing, and chemical and physical properties of the FA used.
Therefore, this section presents a qualitative comparison to determine the appropriate ranges of
W/FA, Alk/FA, and SS/SH. A more systematic investigation of the different parameters is
presented in Chapter 4 of this report.
Fig. 3.14 shows qualitative effects of the W/FA, Alk/FA, and FA content on the slump and
compressive strengths of ZCC. As shown in the Fig. 3.14, W/FA ranging from 0.32 to 0.50
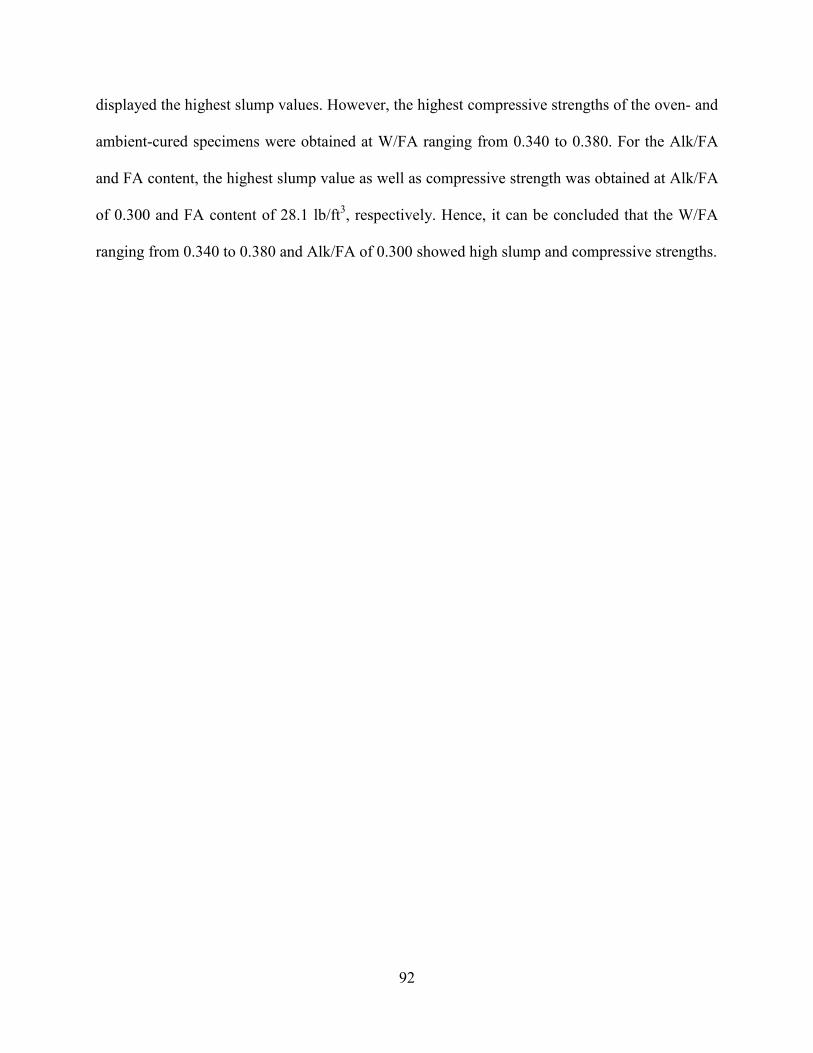
92
displayed the highest slump values. However, the highest compressive strengths of the oven- and
ambient-cured specimens were obtained at W/FA ranging from 0.340 to 0.380. For the Alk/FA
and FA content, the highest slump value as well as compressive strength was obtained at Alk/FA
of 0.300 and FA content of 28.1 lb/ft3, respectively. Hence, it can be concluded that the W/FA
ranging from 0.340 to 0.380 and Alk/FA of 0.300 showed high slump and compressive strengths.
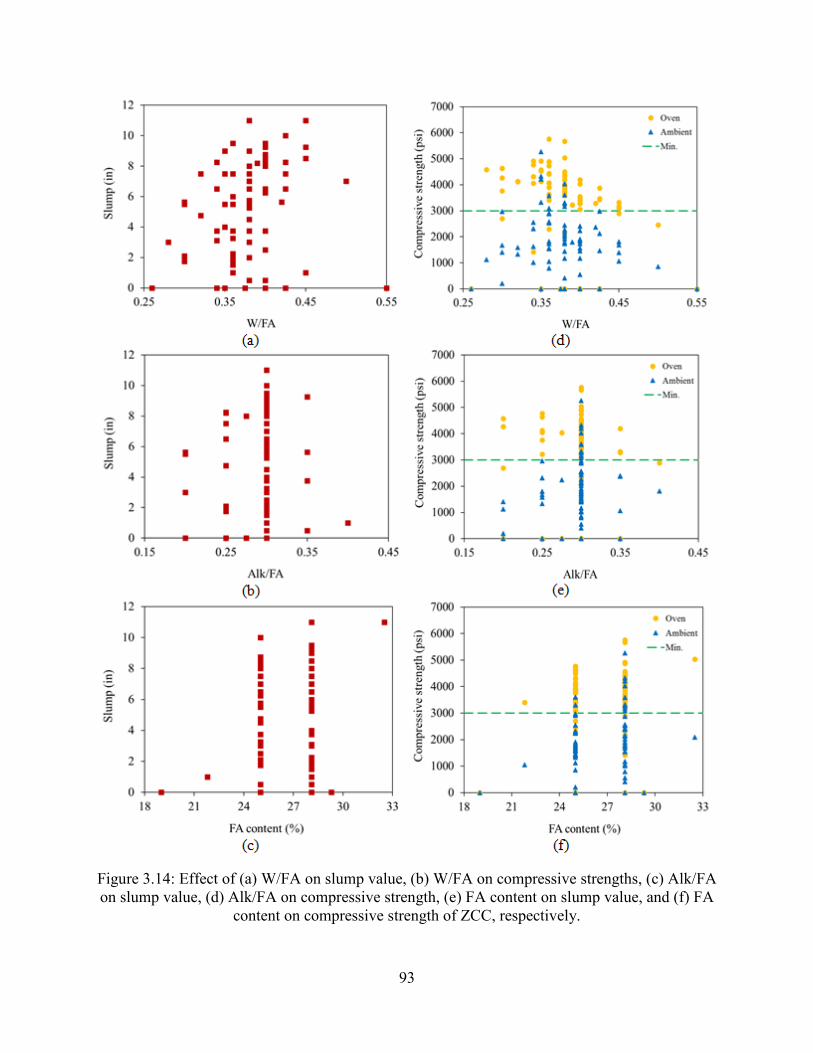
93
Figure 3.14: Effect of (a) W/FA on slump value, (b) W/FA on compressive strengths, (c) Alk/FA on slump value, (d) Alk/FA on compressive strength, (e) FA content on slump value, and (f) FA
content on compressive strength of ZCC, respectively.
94
3.2.7 Findings and conclusions
3.2.7.1 Mortar trial mixtures
Based on investigating 27 ZC mortar mixtures using four different mixing procedures, the
following conclusions can be drawn:
• ZC mortar having W/FA ranging from 0.400 to 0.550, Alk/FA ranging from 0.250 to
0.300, and SS/SH ranging from 0.5 to 2.5 resulted in a workable ZC mortar with a
compressive strength adequate for structural applications. More refinement of these
mixtures is presented in Chapters 4 and 5.
• Adding the alkali activator to the FA before adding the water caused a poor workability
and a flash setting or required adding more water to prevent that phenomenon, which
resulted in decreased compressive strength.
• Mixing the water with all ingredients before adding the alkali activator resulted in a good
workability, setting time, and compressive strength.
• Mixing at a high speed of 281 rpm rather than 136 rpm after adding the alkali activator
increased the workability, setting times, and the compressive strength.
• Adding the alkali activator gradually over five minutes rather than one minute improved
the workability, setting times, and compressive strength.
3.2.7.2 Concrete trial mixtures
Based on investigating 76 ZCC mixtures using eight different mixing procedures and four
different sourced FAs, the following conclusions can be drawn:
95
• ZCC having W/FA ranging from 0.340 to 0.380, Alk/FA of 0.300, and FA content of
28.1 lb/ft3 resulted in workable ZCC with a compressive strength adequate for structural
applications.
• Adding the alkali activator to the FA before adding the water caused a poor workability
and a flash setting or required adding more water to prevent that phenomenon, which
resulted in a decrease of the compressive strength of the test specimens.
• Mixing the water with all ingredients before adding the alkali activator resulted in a good
workability and compressive strength.
• Adding the alkali activator gradually over 5 minutes improved the workability
significantly and allowed adding a lower W/FA ratio, which resulted in higher
compressive strength.
• Encasing the concrete cylinders with plastic bags to prevent moisture loss during the
curing at room temperature improved the compressive strength of the ambient-cured
specimens significantly.
• Mixing procedure no. 8 displayed the highest strength among the rest of mixing
procedures. Therefore, it was used in the rest of the project for mixing concrete.
96
Chapter 4: Fresh Properties and Strength of Zero-Cement Mortar
The effects of water to fly ash (W/FA), alkali activators to fly ash (Alk/FA), and sodium silicate
to sodium hydroxide (SS/SH) ratios on the fresh properties and compressive strength of ZC
mortar are presented in this chapter. This chapter also reports the optimum ratios of those
parameters that resulted in structural ZC mortar.
4.1 Mix Properties and Mixing Procedures As discussed in Chapter 2, two batches of FA were received and used during the course of this
project. Five sourced FAs, namely FA27, FA29, FA24, FA25, and FA21, of the first batch, were
used to prepare the mortar mixtures presented in this chapter. Detailed characterizations of the
materials used for synthesizing the mortar mixtures are presented in Chapter 2 of this report.
To optimize the strength and workability of ZC mortar, thirteen mixtures were prepared (Table
4.1) with five different W/FA of 0.350, 0.375, 0.400, 0.425, and 0.450, three Alk/FA of 0.250,
0.275, and 0.300, and four SS/SH of 0.5, 1.0, 1.5, and 2.5. These ratios were selected based on
the trial mixtures presented in Chapter 3. The sand to FA ratio remained constant at 2.75 for all
mixtures. The W/FA presented in Table 4.1 included both the water in the alkali activator
solution and the extra added water to the mix. Hence, the extra added water was adjusted for the
different mixtures based on the amount of alkali activator. Mortar mixing procedure no. 3
described in Chapter 3 was used throughout this chapter. This set of thirteen mixtures was
repeated for each source of FA. Hence, a total of 65 mixtures were prepared.
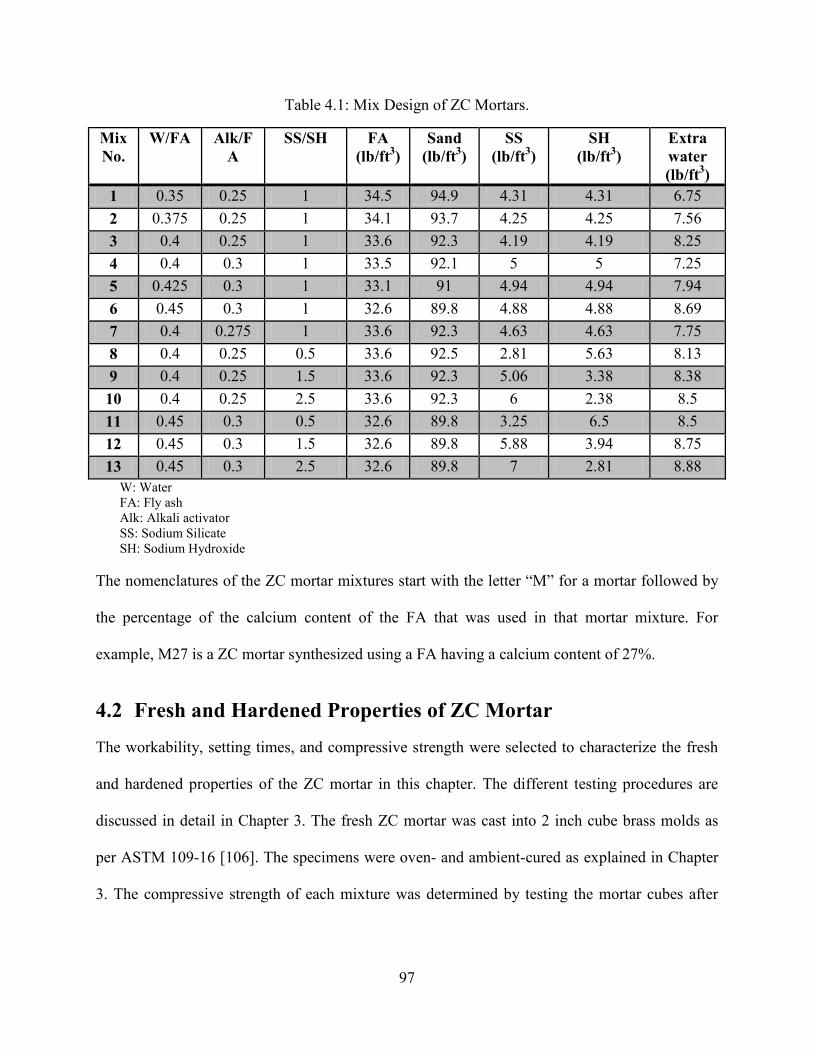
97
Table 4.1: Mix Design of ZC Mortars.
Mix No.
W/FA Alk/FA
SS/SH FA (lb/ft3)
Sand (lb/ft3)
SS (lb/ft3)
SH (lb/ft3)
Extra water (lb/ft3)
1 0.35 0.25 1 34.5 94.9 4.31 4.31 6.75 2 0.375 0.25 1 34.1 93.7 4.25 4.25 7.56 3 0.4 0.25 1 33.6 92.3 4.19 4.19 8.25 4 0.4 0.3 1 33.5 92.1 5 5 7.25 5 0.425 0.3 1 33.1 91 4.94 4.94 7.94 6 0.45 0.3 1 32.6 89.8 4.88 4.88 8.69 7 0.4 0.275 1 33.6 92.3 4.63 4.63 7.75 8 0.4 0.25 0.5 33.6 92.5 2.81 5.63 8.13 9 0.4 0.25 1.5 33.6 92.3 5.06 3.38 8.38 10 0.4 0.25 2.5 33.6 92.3 6 2.38 8.5 11 0.45 0.3 0.5 32.6 89.8 3.25 6.5 8.5 12 0.45 0.3 1.5 32.6 89.8 5.88 3.94 8.75 13 0.45 0.3 2.5 32.6 89.8 7 2.81 8.88
W: Water FA: Fly ash Alk: Alkali activator SS: Sodium Silicate SH: Sodium Hydroxide
The nomenclatures of the ZC mortar mixtures start with the letter “M” for a mortar followed by
the percentage of the calcium content of the FA that was used in that mortar mixture. For
example, M27 is a ZC mortar synthesized using a FA having a calcium content of 27%.
4.2 Fresh and Hardened Properties of ZC Mortar The workability, setting times, and compressive strength were selected to characterize the fresh
and hardened properties of the ZC mortar in this chapter. The different testing procedures are
discussed in detail in Chapter 3. The fresh ZC mortar was cast into 2 inch cube brass molds as
per ASTM 109-16 [106]. The specimens were oven- and ambient-cured as explained in Chapter
3. The compressive strength of each mixture was determined by testing the mortar cubes after
98
curing 7 days from the casting day. The reported strength of each mixture is the average of three
cubes cast out of that mixture.
4.2.1 Results of fresh properties
A summary of the results is presented in Tables 4.2 through 4.6 at the end of this chapter. The
mean, range, variance, standard deviation (SD), and coefficient of variation (CV) of the results
are also presented in the tables. As shown in the tables, 85% of the results had a CV less than
10% and the remaining 15% of the results had a CV less than 18%, which reflects the accuracy
of the tabulated results.
There are no acceptance criteria for the workability or setting times of Portland cement mortar.
However, ASTM C150-16 [102] limits the initial setting time (In. Set.), measured by the Vicat
needle per ASTM C191-C [107], of Portland cement paste to a minimum of 45 minutes and a
maximum of 375 minutes. This study adopted these acceptance criteria for the setting times.
Furthermore, this report recommends a minimum workability of 40%.
The workability of the thirteen mixtures ranged from 50% to 150% for M21, 20% to 150% for
M24, 42.5% to 150% for M25, 20% to 150% for M27, and 20% to 150% for M29 (Fig. 4.1). It is
worth noting that the workability values are saturated at 150% corresponding to the diameter of
the flow table. The initial set (In. Set.) time ranged from 35 minutes to 300 minutes for M21, 70
minutes to 395 minutes for M24, 35 minutes to 390 minutes for M25, 25 minutes to 250 minutes
for M27, and 40 to 145 minutes for M29 (Fig. 4.2). The final setting (Fi. Set.) time ranged from
80 minutes to 410 minutes for M21, 110 minutes to 450 minutes for M24, 70 minutes to 490
minutes for M25, 40 minutes to 310 minutes M27, and 75 minutes to 195 minutes for M29 (Fig.
4.3).
99
The results revealed that the main factors that affect the workability and setting times of ZC
mortar are the FA’s chemical and physical properties such as the calcium content, surface area of
the FA, W/FA, Alk/FA and, SS/SH.
4.2.2.1. Effect of calcium content and surface area.
Fig. 4.1 shows the relationship between the calcium content and workability of the different
sourced FAs. Also shown in the figure is the correlation between workability and calcium
content. Two coefficients of determination, R2, are also shown on the figure. The first R2 value
of 0.11 is for all data and the second R2 value of 0.24 is for all data points excluding the saturated
points at workability of 150%. As shown in the figure, for all sourced FAs, except M24,
increasing the calcium content decreased the workability. The workability of the M21 that has
the lowest calcium content was the highest among all FAs while the workability of M29 and
M27 that have the highest calcium contents was the lowest. For the M24, while it has an average
amount of calcium content, it had a high workability due to its low surface area. As discussed in
Chapter 2, FA24 has a surface area of 1446 m2/kg while FA21, FA25, FA27, and FA29 had
surface areas of 2921, 2858, 2560, and 3925 m2/kg, respectively. However, the direct correlation
between the surface area of FA and workability doesn’t exist (Fig. 4.2).
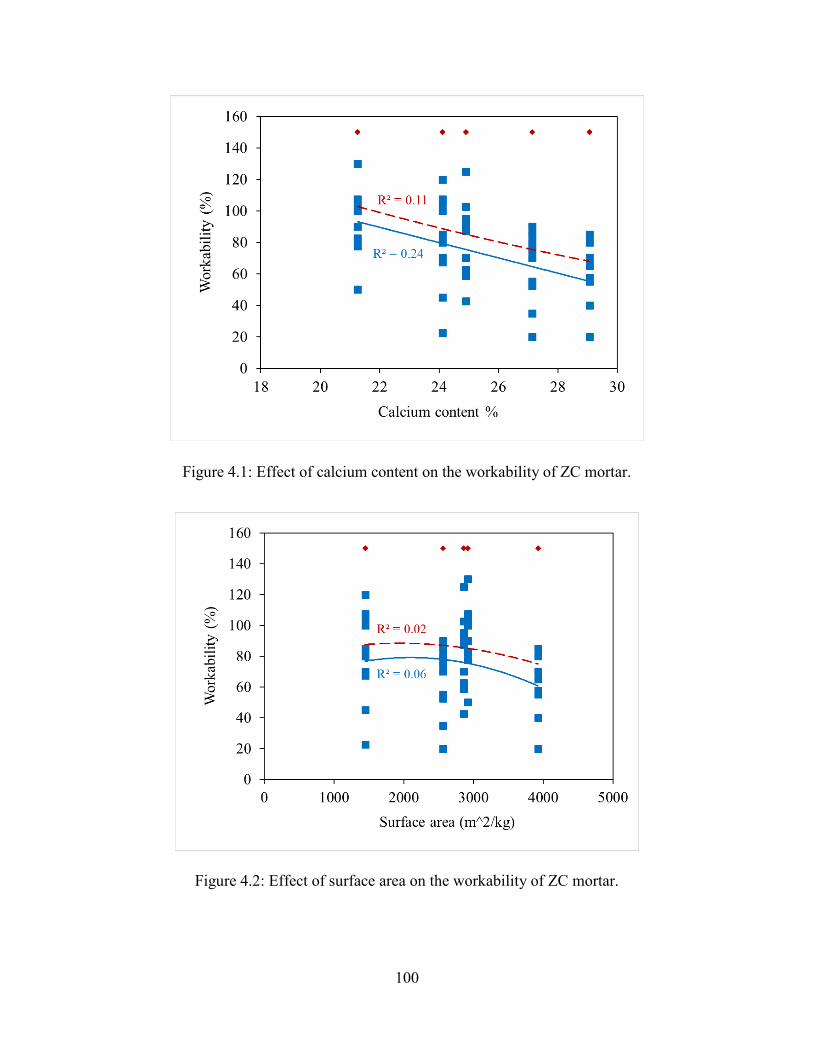
100
Figure 4.1: Effect of calcium content on the workability of ZC mortar.
Figure 4.2: Effect of surface area on the workability of ZC mortar.

101
Figs. 4.3 and 4.4 show the relationship between the calcium content and setting times of the
different sourced FAs. As shown in the figures, increasing the calcium content decreased the
setting times. The coefficient of determination, R2, is 0.32, representing a moderate correlation
between calcium and setting time. The setting times of the M21 that has the lowest calcium
content was the highest among all FAs while the workability of M29 and M27 that have the
highest calcium contents was the lowest. The rapid formation of calcium silicate hydrate (CSH)
and/or calcium aluminate silicate hydrate (CASH) caused low workability and short setting
times. Furthermore, the setting times of M24 and M25 were relatively higher than those of the
corresponding mixtures synthesized using the other FAs. The M24 had an average amount of
calcium content; however, its surface area was relatively low, which decelerated the leaching and
dissolution of the FA in the alkali activators which delayed and decelerated the
geopolymerization and hydration process [49, 108]. Figs. 4.5 and 4.6 show the correlations
between the surface area of the FA and the setting times. As shown in the figure, R2 for both
setting times was 0.24.
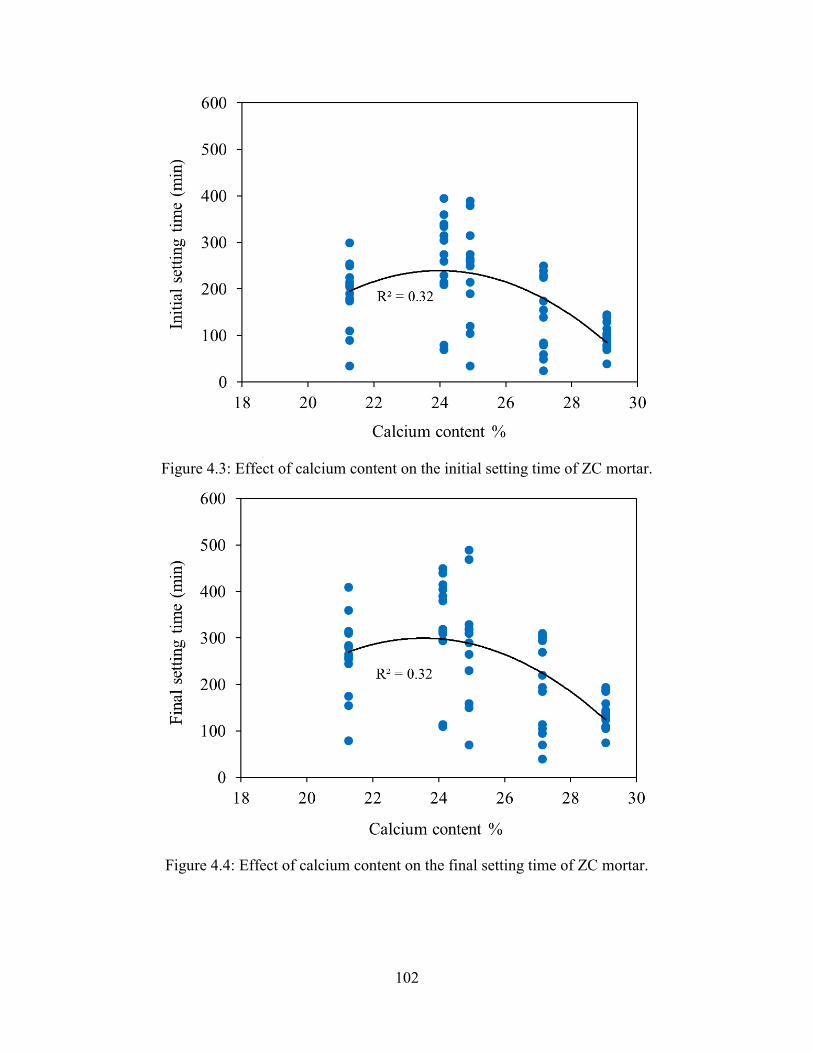
102
Figure 4.3: Effect of calcium content on the initial setting time of ZC mortar.
Figure 4.4: Effect of calcium content on the final setting time of ZC mortar.
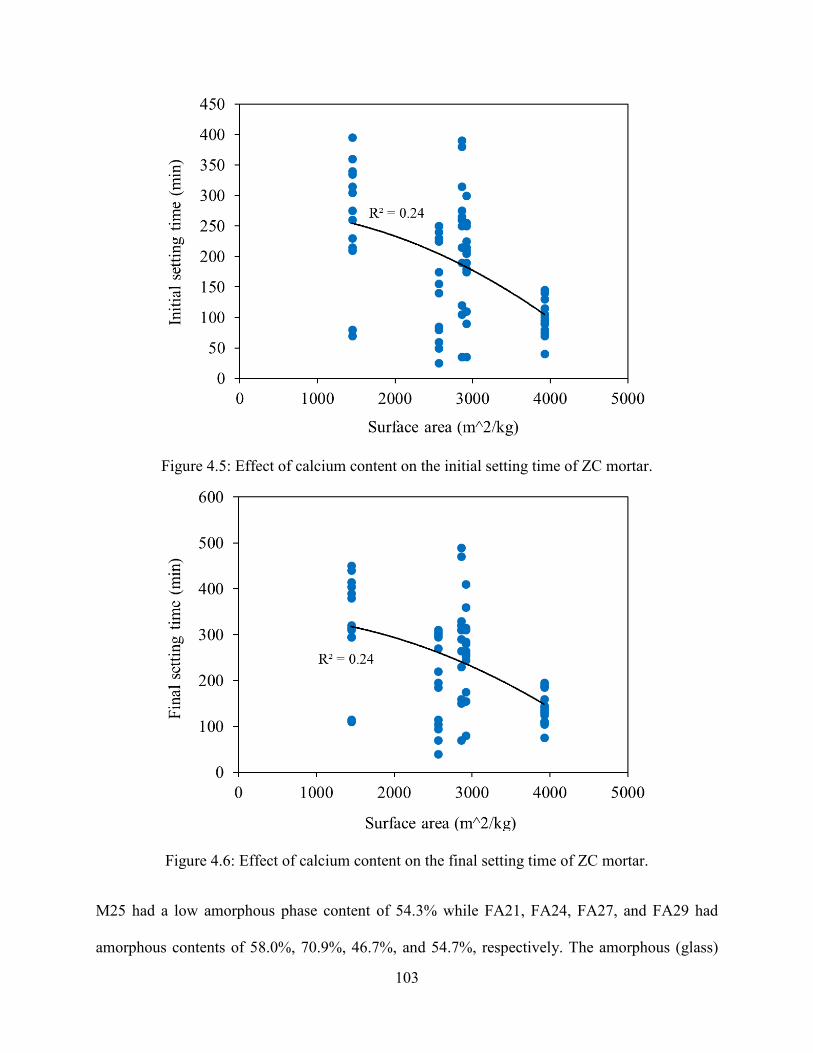
103
Figure 4.5: Effect of calcium content on the initial setting time of ZC mortar.
Figure 4.6: Effect of calcium content on the final setting time of ZC mortar.
M25 had a low amorphous phase content of 54.3% while FA21, FA24, FA27, and FA29 had
amorphous contents of 58.0%, 70.9%, 46.7%, and 54.7%, respectively. The amorphous (glass)
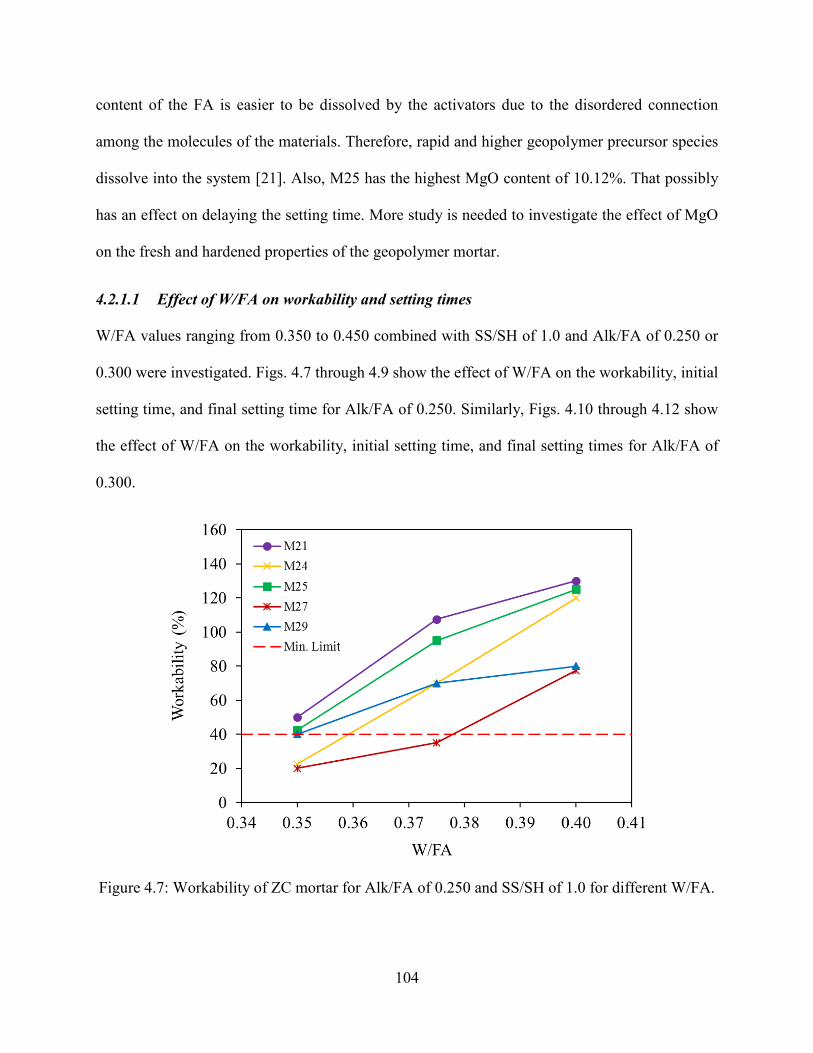
104
content of the FA is easier to be dissolved by the activators due to the disordered connection
among the molecules of the materials. Therefore, rapid and higher geopolymer precursor species
dissolve into the system [21]. Also, M25 has the highest MgO content of 10.12%. That possibly
has an effect on delaying the setting time. More study is needed to investigate the effect of MgO
on the fresh and hardened properties of the geopolymer mortar.
4.2.1.1 Effect of W/FA on workability and setting times
W/FA values ranging from 0.350 to 0.450 combined with SS/SH of 1.0 and Alk/FA of 0.250 or
0.300 were investigated. Figs. 4.7 through 4.9 show the effect of W/FA on the workability, initial
setting time, and final setting time for Alk/FA of 0.250. Similarly, Figs. 4.10 through 4.12 show
the effect of W/FA on the workability, initial setting time, and final setting times for Alk/FA of
0.300.
Figure 4.7: Workability of ZC mortar for Alk/FA of 0.250 and SS/SH of 1.0 for different W/FA.
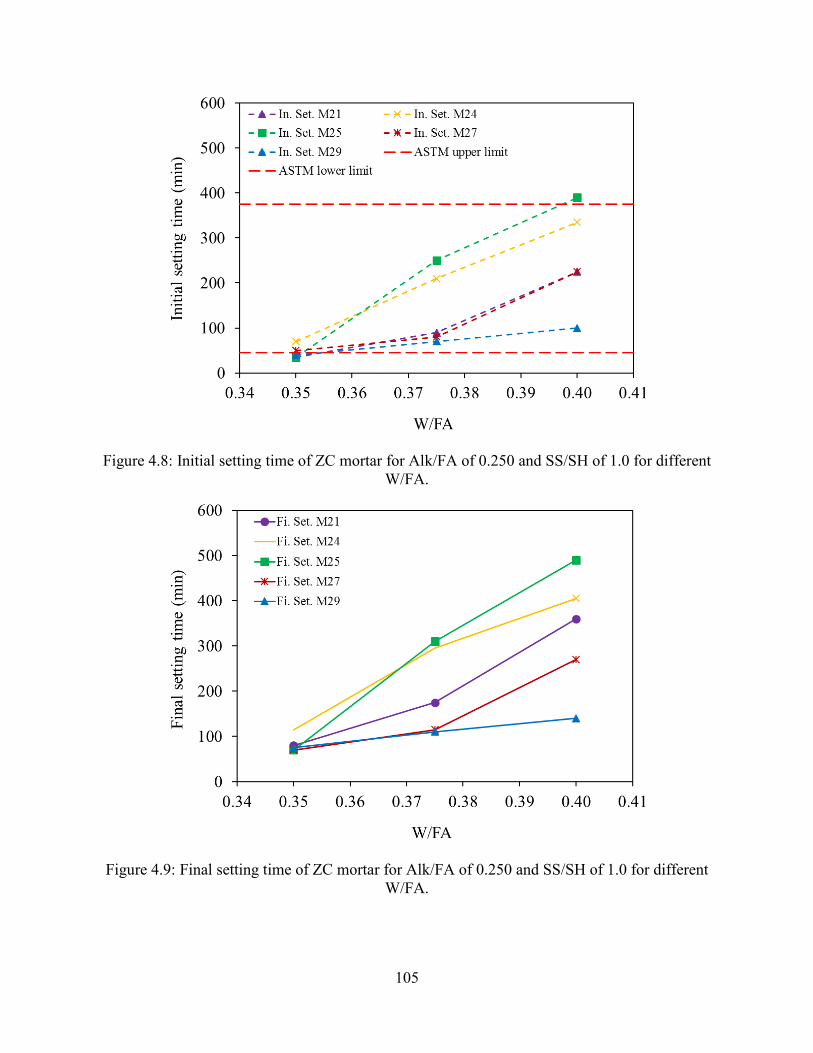
105
Figure 4.8: Initial setting time of ZC mortar for Alk/FA of 0.250 and SS/SH of 1.0 for different W/FA.
Figure 4.9: Final setting time of ZC mortar for Alk/FA of 0.250 and SS/SH of 1.0 for different W/FA.
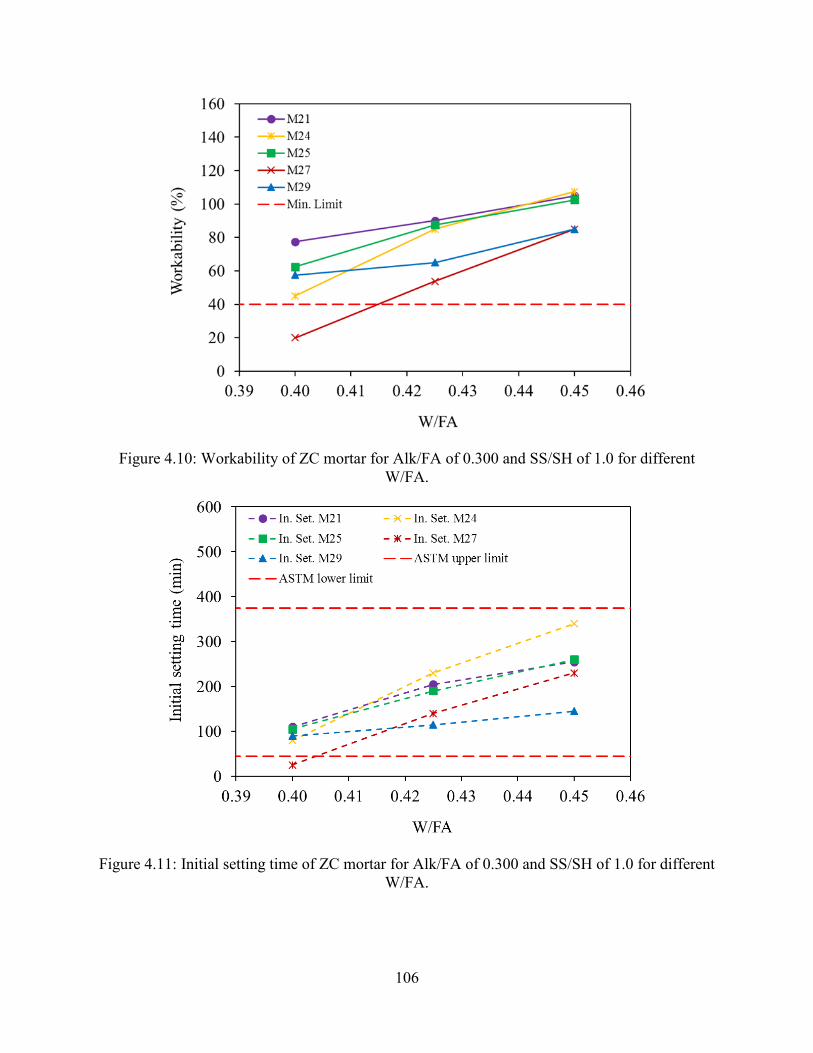
106
Figure 4.10: Workability of ZC mortar for Alk/FA of 0.300 and SS/SH of 1.0 for different W/FA.
Figure 4.11: Initial setting time of ZC mortar for Alk/FA of 0.300 and SS/SH of 1.0 for different W/FA.
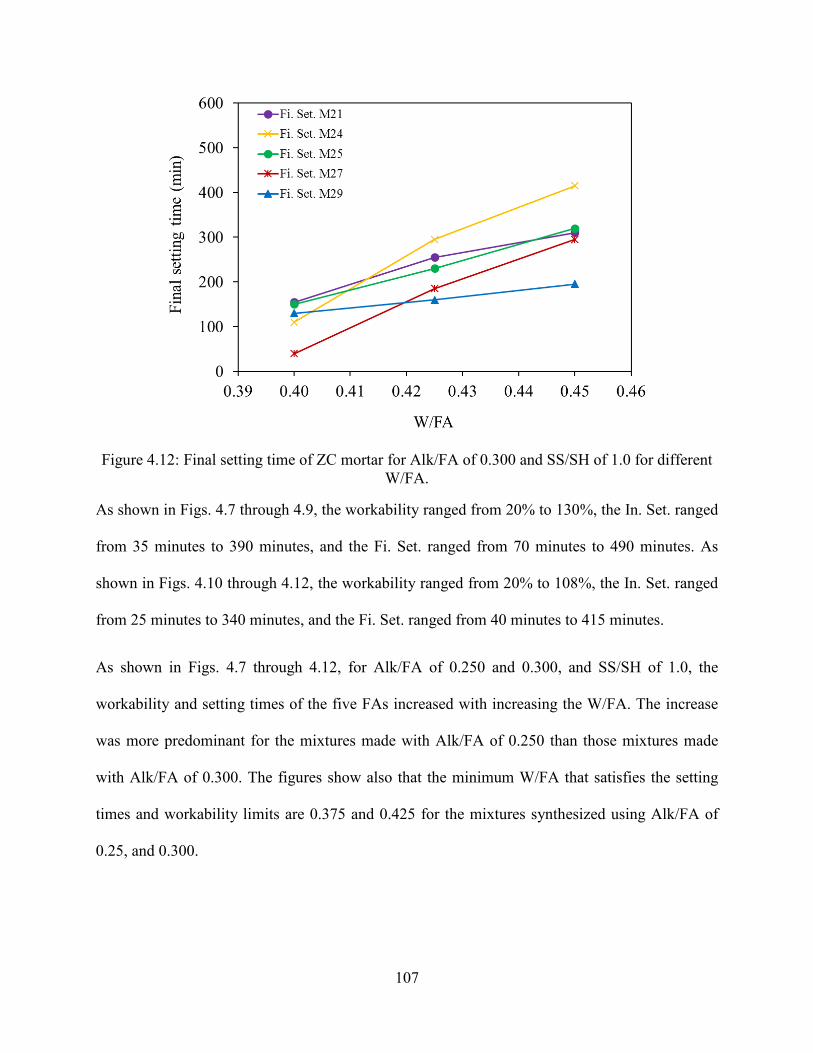
107
Figure 4.12: Final setting time of ZC mortar for Alk/FA of 0.300 and SS/SH of 1.0 for different W/FA.
As shown in Figs. 4.7 through 4.9, the workability ranged from 20% to 130%, the In. Set. ranged
from 35 minutes to 390 minutes, and the Fi. Set. ranged from 70 minutes to 490 minutes. As
shown in Figs. 4.10 through 4.12, the workability ranged from 20% to 108%, the In. Set. ranged
from 25 minutes to 340 minutes, and the Fi. Set. ranged from 40 minutes to 415 minutes.
As shown in Figs. 4.7 through 4.12, for Alk/FA of 0.250 and 0.300, and SS/SH of 1.0, the
workability and setting times of the five FAs increased with increasing the W/FA. The increase
was more predominant for the mixtures made with Alk/FA of 0.250 than those mixtures made
with Alk/FA of 0.300. The figures show also that the minimum W/FA that satisfies the setting
times and workability limits are 0.375 and 0.425 for the mixtures synthesized using Alk/FA of
0.25, and 0.300.
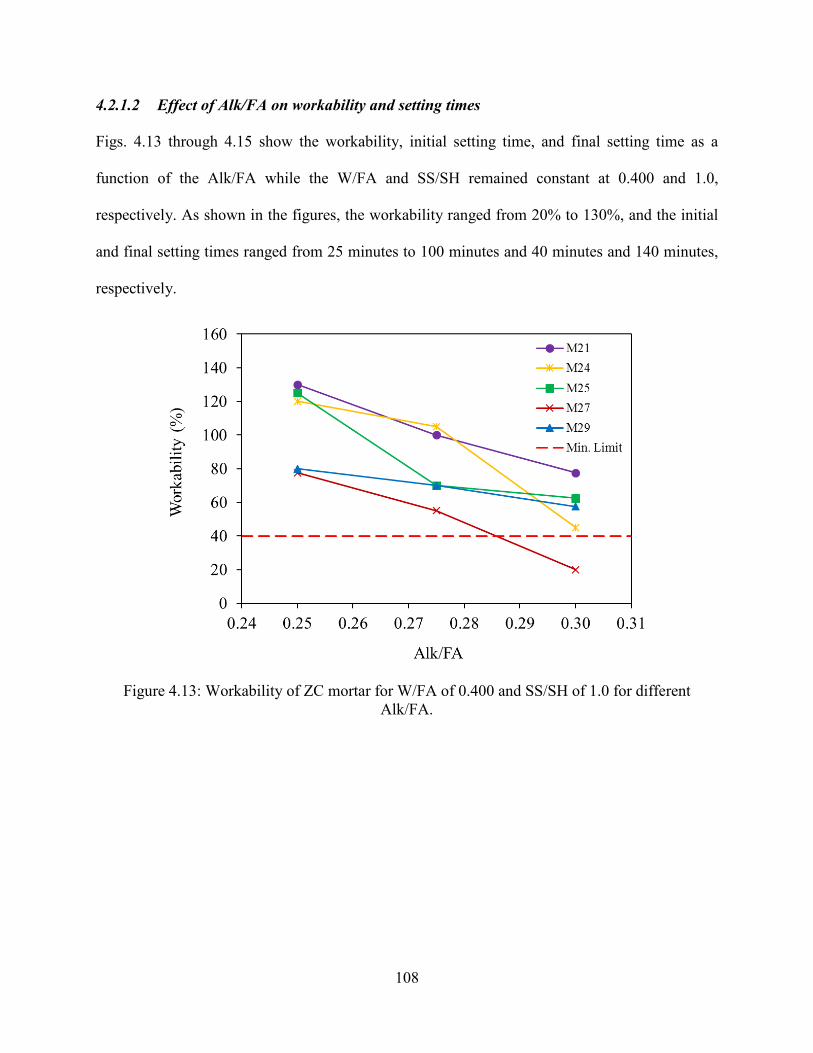
108
4.2.1.2 Effect of Alk/FA on workability and setting times
Figs. 4.13 through 4.15 show the workability, initial setting time, and final setting time as a
function of the Alk/FA while the W/FA and SS/SH remained constant at 0.400 and 1.0,
respectively. As shown in the figures, the workability ranged from 20% to 130%, and the initial
and final setting times ranged from 25 minutes to 100 minutes and 40 minutes and 140 minutes,
respectively.
Figure 4.13: Workability of ZC mortar for W/FA of 0.400 and SS/SH of 1.0 for different Alk/FA.
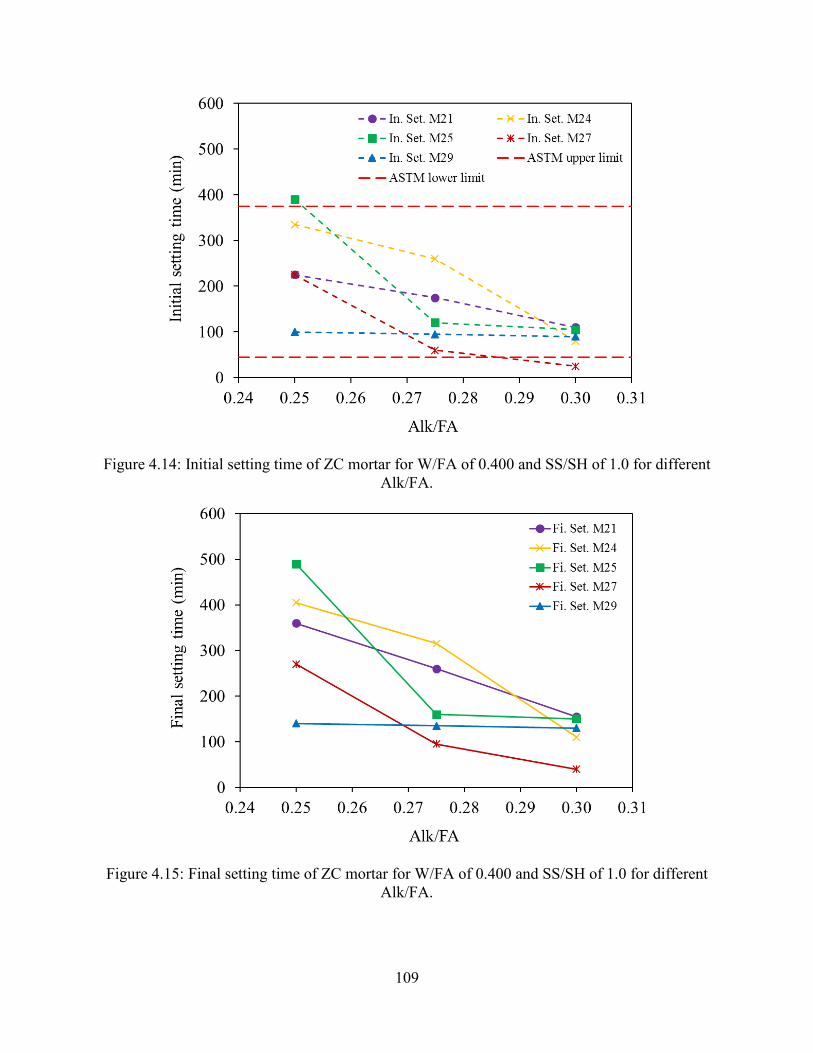
109
Figure 4.14: Initial setting time of ZC mortar for W/FA of 0.400 and SS/SH of 1.0 for different Alk/FA.
Figure 4.15: Final setting time of ZC mortar for W/FA of 0.400 and SS/SH of 1.0 for different Alk/FA.
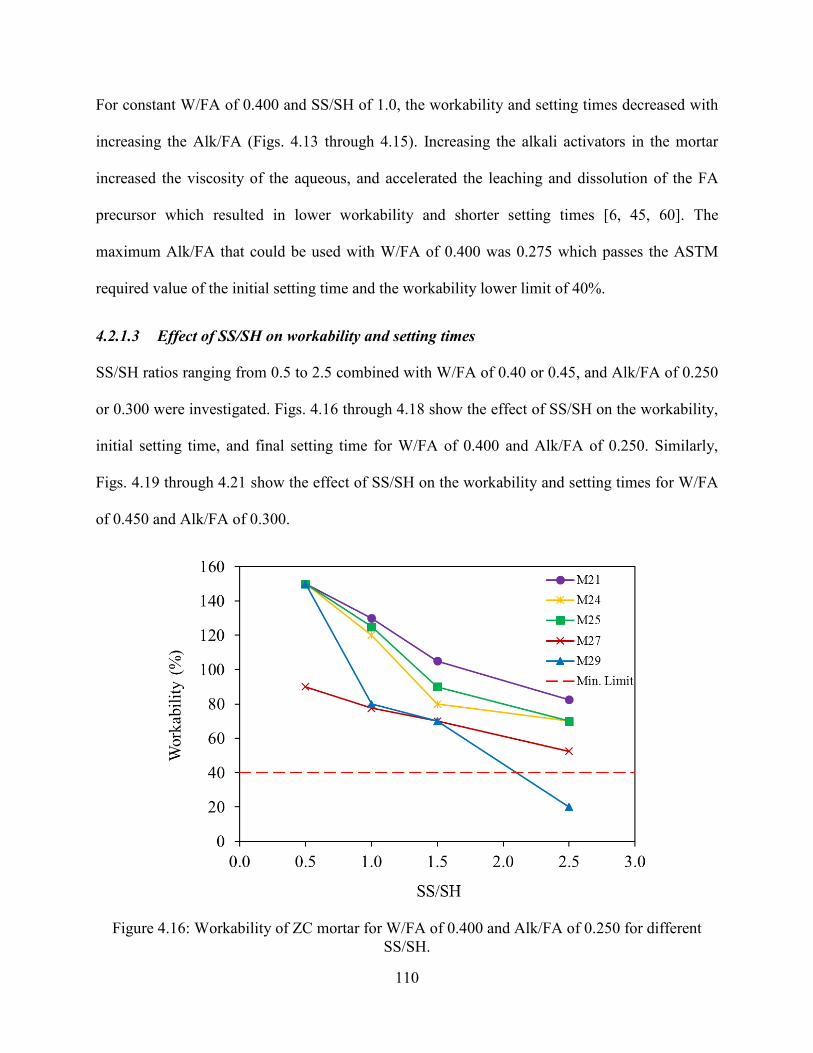
110
For constant W/FA of 0.400 and SS/SH of 1.0, the workability and setting times decreased with
increasing the Alk/FA (Figs. 4.13 through 4.15). Increasing the alkali activators in the mortar
increased the viscosity of the aqueous, and accelerated the leaching and dissolution of the FA
precursor which resulted in lower workability and shorter setting times [6, 45, 60]. The
maximum Alk/FA that could be used with W/FA of 0.400 was 0.275 which passes the ASTM
required value of the initial setting time and the workability lower limit of 40%.
4.2.1.3 Effect of SS/SH on workability and setting times
SS/SH ratios ranging from 0.5 to 2.5 combined with W/FA of 0.40 or 0.45, and Alk/FA of 0.250
or 0.300 were investigated. Figs. 4.16 through 4.18 show the effect of SS/SH on the workability,
initial setting time, and final setting time for W/FA of 0.400 and Alk/FA of 0.250. Similarly,
Figs. 4.19 through 4.21 show the effect of SS/SH on the workability and setting times for W/FA
of 0.450 and Alk/FA of 0.300.
Figure 4.16: Workability of ZC mortar for W/FA of 0.400 and Alk/FA of 0.250 for different SS/SH.
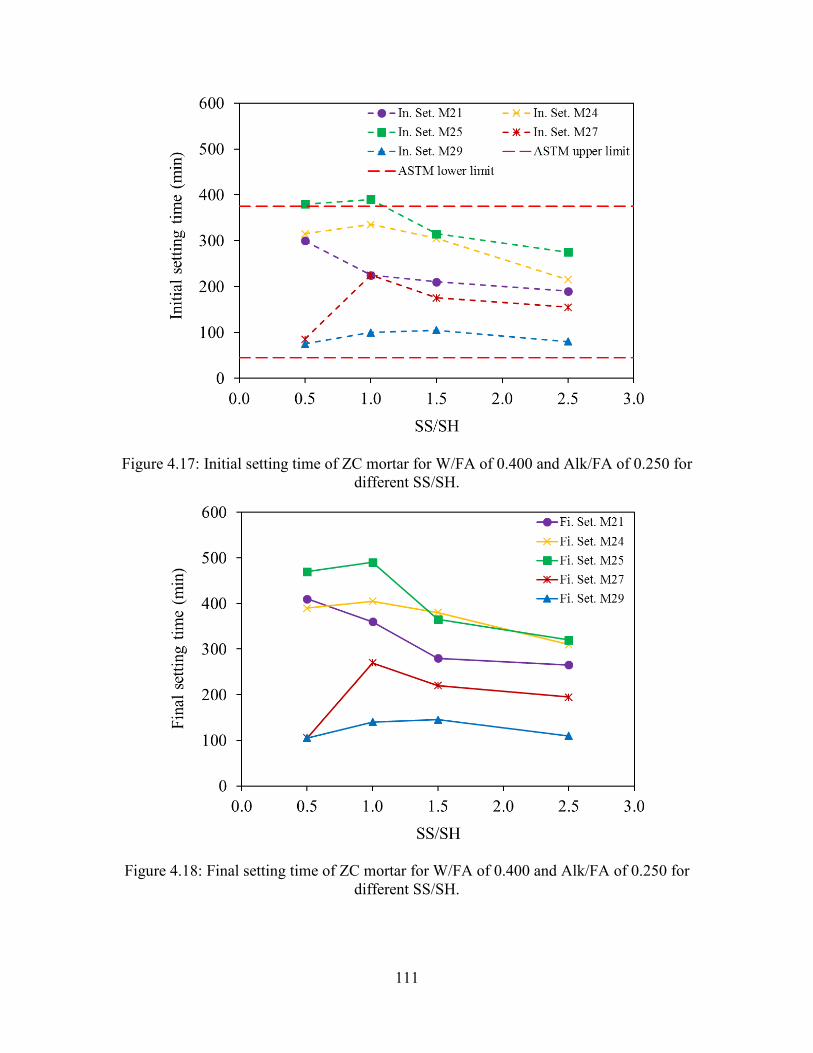
111
Figure 4.17: Initial setting time of ZC mortar for W/FA of 0.400 and Alk/FA of 0.250 for different SS/SH.
Figure 4.18: Final setting time of ZC mortar for W/FA of 0.400 and Alk/FA of 0.250 for different SS/SH.
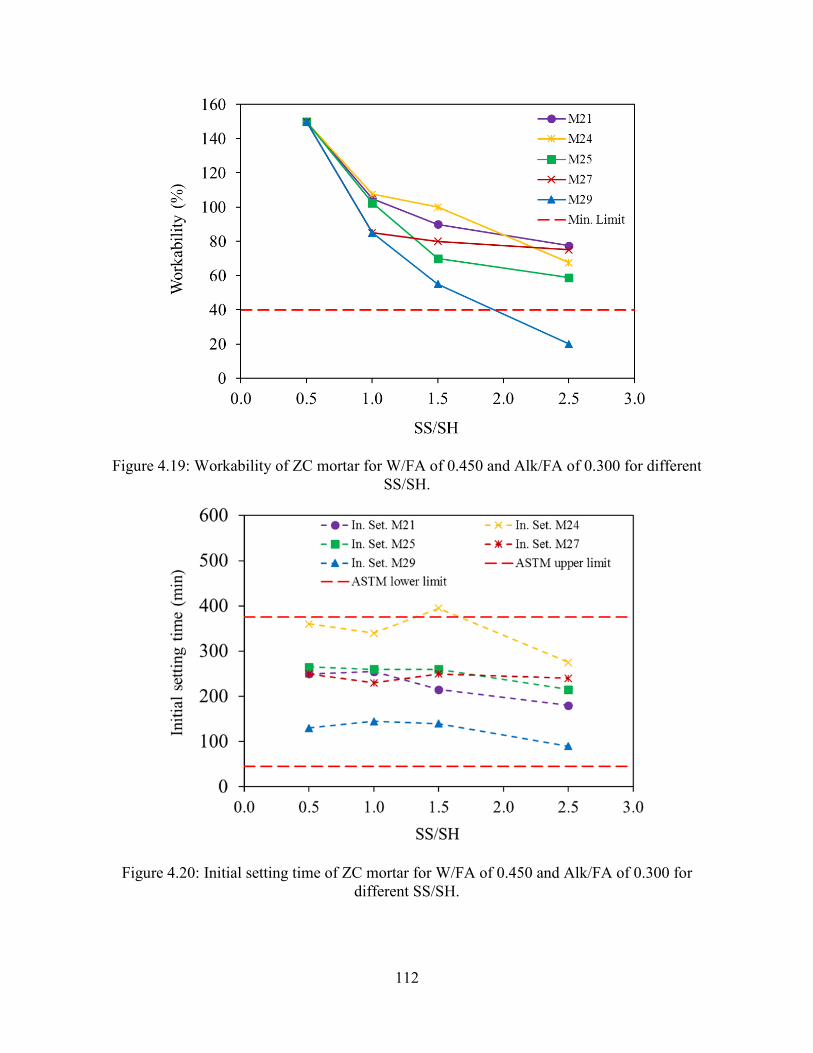
112
Figure 4.19: Workability of ZC mortar for W/FA of 0.450 and Alk/FA of 0.300 for different SS/SH.
Figure 4.20: Initial setting time of ZC mortar for W/FA of 0.450 and Alk/FA of 0.300 for different SS/SH.

113
Figure 4.21: Final setting time of ZC mortar for W/FA of 0.450 and Alk/FA of 0.300 for different SS/SH.
As shown in Figs. 4.16 through 4.18, the workability ranged from 20% to 150%, the In. Set.
ranged from 75 minutes to 390 minutes, and the Fi. Set. ranged from 105 minutes to 490
minutes. As shown in Figs. 4.19 through 4.21, the workability ranged from 20% to 150%, the In.
Set. ranged from 90 minutes to 395 minutes, and the Fi. Set. ranged from 125 minutes to 450
minutes.
As shown in Figs. 4.16 through 4.21, for a given W/FA and Alk/FA, the workability and the
setting time decreased with increasing the SS/SH from 0.5 to 1.0, 1.5, and 2.5. With increasing
the SS the viscosity of the alkaline solution increased which resulted in lower workability [6].
Furthermore, increasing the SS/SH to 2.5 in the mixture increased the amount of soluble silica
(SiO2). Increasing the soluble silica enhanced the geopolymerization process and leaching and
dissolution of the FA species in the mixture, causing a reduction in the setting time and
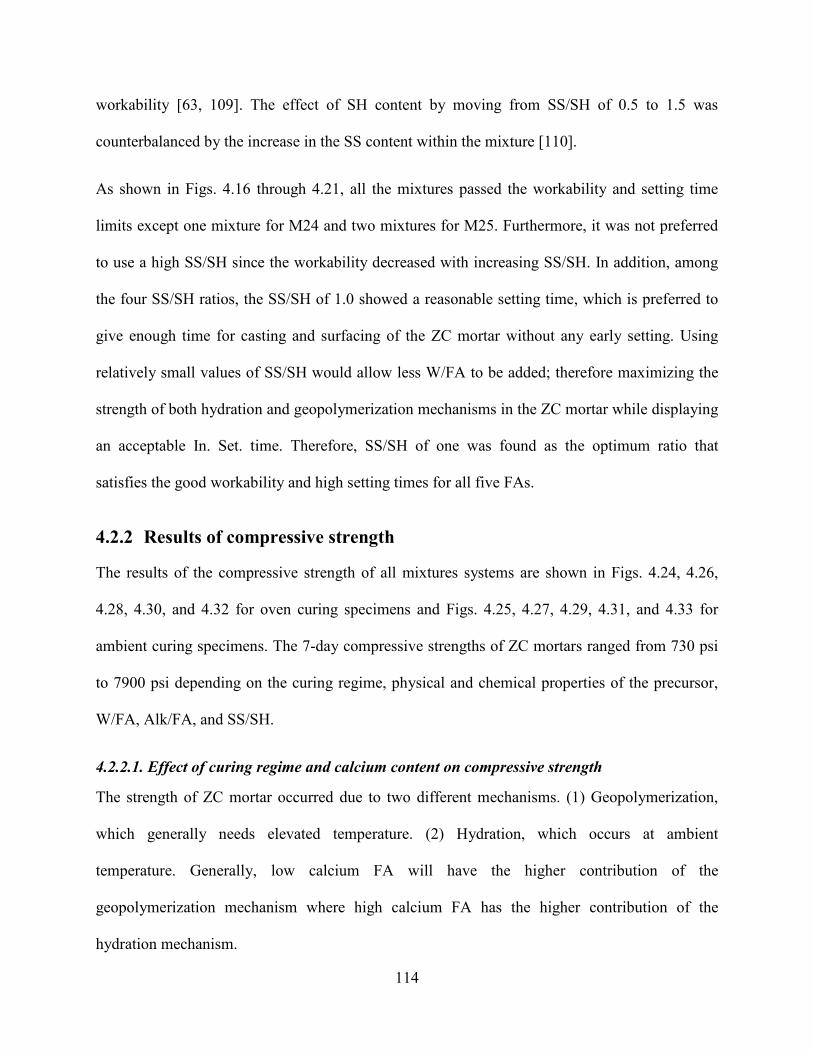
114
workability [63, 109]. The effect of SH content by moving from SS/SH of 0.5 to 1.5 was
counterbalanced by the increase in the SS content within the mixture [110].
As shown in Figs. 4.16 through 4.21, all the mixtures passed the workability and setting time
limits except one mixture for M24 and two mixtures for M25. Furthermore, it was not preferred
to use a high SS/SH since the workability decreased with increasing SS/SH. In addition, among
the four SS/SH ratios, the SS/SH of 1.0 showed a reasonable setting time, which is preferred to
give enough time for casting and surfacing of the ZC mortar without any early setting. Using
relatively small values of SS/SH would allow less W/FA to be added; therefore maximizing the
strength of both hydration and geopolymerization mechanisms in the ZC mortar while displaying
an acceptable In. Set. time. Therefore, SS/SH of one was found as the optimum ratio that
satisfies the good workability and high setting times for all five FAs.
4.2.2 Results of compressive strength
The results of the compressive strength of all mixtures systems are shown in Figs. 4.24, 4.26,
4.28, 4.30, and 4.32 for oven curing specimens and Figs. 4.25, 4.27, 4.29, 4.31, and 4.33 for
ambient curing specimens. The 7-day compressive strengths of ZC mortars ranged from 730 psi
to 7900 psi depending on the curing regime, physical and chemical properties of the precursor,
W/FA, Alk/FA, and SS/SH.
4.2.2.1. Effect of curing regime and calcium content on compressive strength
The strength of ZC mortar occurred due to two different mechanisms. (1) Geopolymerization,
which generally needs elevated temperature. (2) Hydration, which occurs at ambient
temperature. Generally, low calcium FA will have the higher contribution of the
geopolymerization mechanism where high calcium FA has the higher contribution of the
hydration mechanism.
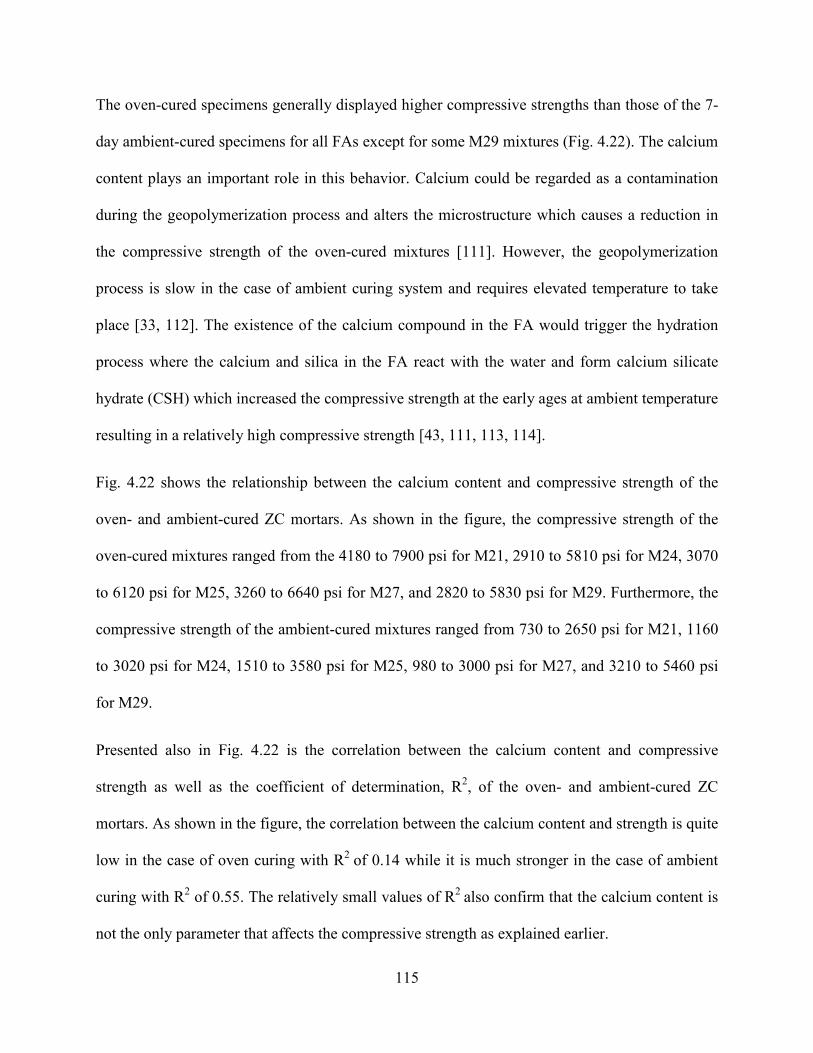
115
The oven-cured specimens generally displayed higher compressive strengths than those of the 7-
day ambient-cured specimens for all FAs except for some M29 mixtures (Fig. 4.22). The calcium
content plays an important role in this behavior. Calcium could be regarded as a contamination
during the geopolymerization process and alters the microstructure which causes a reduction in
the compressive strength of the oven-cured mixtures [111]. However, the geopolymerization
process is slow in the case of ambient curing system and requires elevated temperature to take
place [33, 112]. The existence of the calcium compound in the FA would trigger the hydration
process where the calcium and silica in the FA react with the water and form calcium silicate
hydrate (CSH) which increased the compressive strength at the early ages at ambient temperature
resulting in a relatively high compressive strength [43, 111, 113, 114].
Fig. 4.22 shows the relationship between the calcium content and compressive strength of the
oven- and ambient-cured ZC mortars. As shown in the figure, the compressive strength of the
oven-cured mixtures ranged from the 4180 to 7900 psi for M21, 2910 to 5810 psi for M24, 3070
to 6120 psi for M25, 3260 to 6640 psi for M27, and 2820 to 5830 psi for M29. Furthermore, the
compressive strength of the ambient-cured mixtures ranged from 730 to 2650 psi for M21, 1160
to 3020 psi for M24, 1510 to 3580 psi for M25, 980 to 3000 psi for M27, and 3210 to 5460 psi
for M29.
Presented also in Fig. 4.22 is the correlation between the calcium content and compressive
strength as well as the coefficient of determination, R2, of the oven- and ambient-cured ZC
mortars. As shown in the figure, the correlation between the calcium content and strength is quite
low in the case of oven curing with R2 of 0.14 while it is much stronger in the case of ambient
curing with R2 of 0.55. The relatively small values of R2 also confirm that the calcium content is
not the only parameter that affects the compressive strength as explained earlier.

116
Generally, for all sourced FAs, except for M27, increasing the calcium content decreased the
compressive strength of the oven-cured specimens and increased the compressive strength of the
ambient-cured specimens. The oven-cured specimens of the M21 that have the lowest calcium
content was the highest compressive strength among all FAs while the ambient-cured specimens
of M29 that have the highest calcium contents was the highest compressive strength among all
FAs. For the M27, while FA27 had the second-highest calcium content it had a low ambient
compressive strength since it had the second-lowest surface area and amorphous content among
all the FAs, as discussed in Chapter 2, which reduced the reactivity of the FA. Fig. 4.23 shows
the effects of the surface area of each FA on the compressive strength of the different mixtures.
Presented also in Fig. 4.23 is the correlation between the surface area and compressive strength
as well as the coefficient of determination, R2, of the oven- and ambient-cured ZC mortars. As
show in the figure, the correlation between the calcium content and strength is quite low in the
case of oven curing with R2 of 0.08 while it is much stronger in the case of ambient curing with
R2 of 0.62.
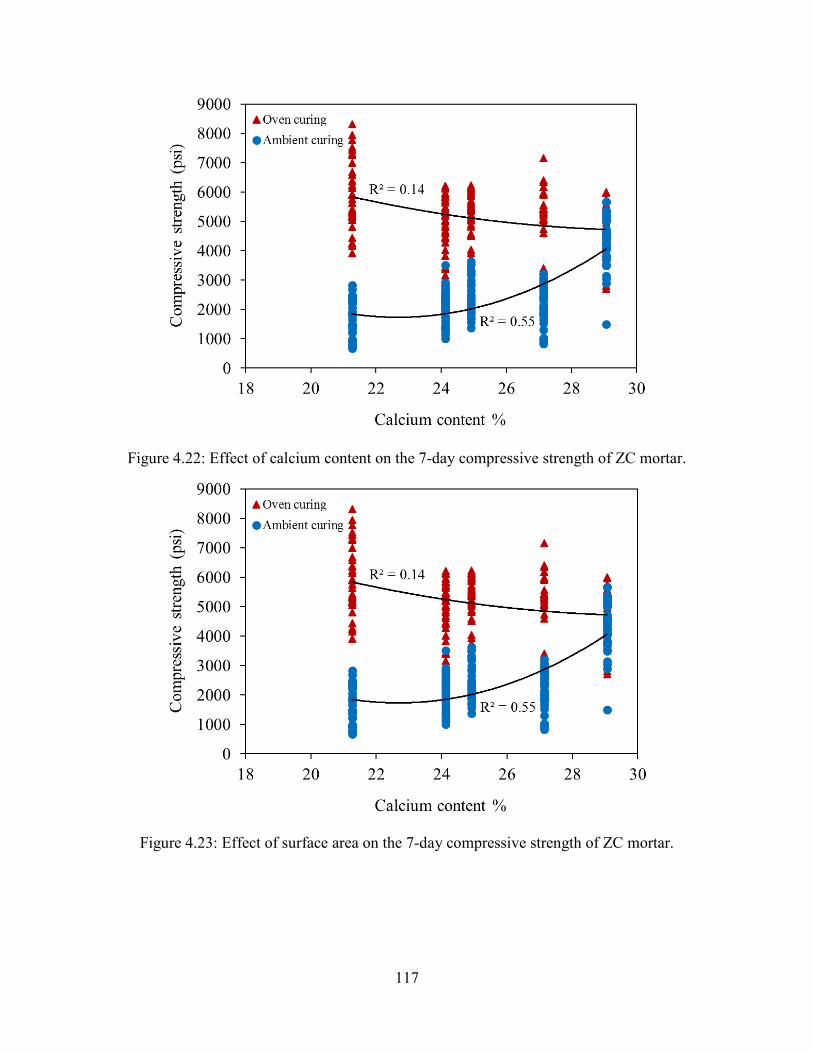
117
Figure 4.22: Effect of calcium content on the 7-day compressive strength of ZC mortar.
Figure 4.23: Effect of surface area on the 7-day compressive strength of ZC mortar.
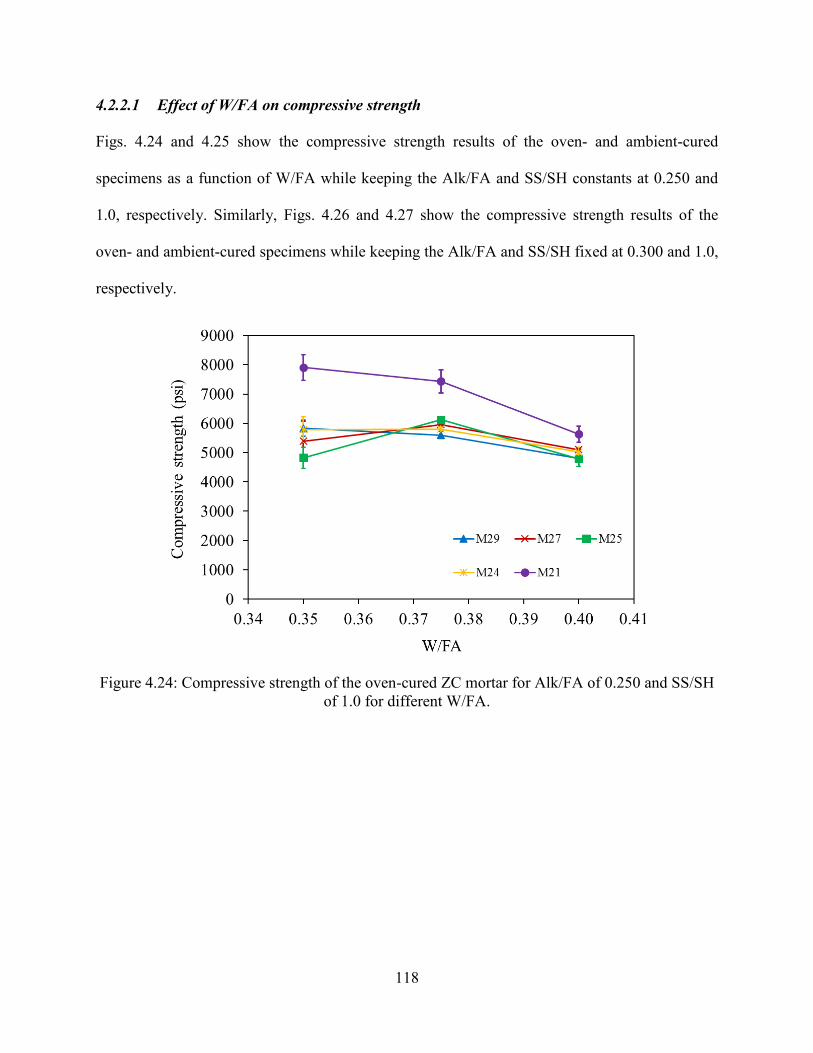
118
4.2.2.1 Effect of W/FA on compressive strength
Figs. 4.24 and 4.25 show the compressive strength results of the oven- and ambient-cured
specimens as a function of W/FA while keeping the Alk/FA and SS/SH constants at 0.250 and
1.0, respectively. Similarly, Figs. 4.26 and 4.27 show the compressive strength results of the
oven- and ambient-cured specimens while keeping the Alk/FA and SS/SH fixed at 0.300 and 1.0,
respectively.
Figure 4.24: Compressive strength of the oven-cured ZC mortar for Alk/FA of 0.250 and SS/SH of 1.0 for different W/FA.
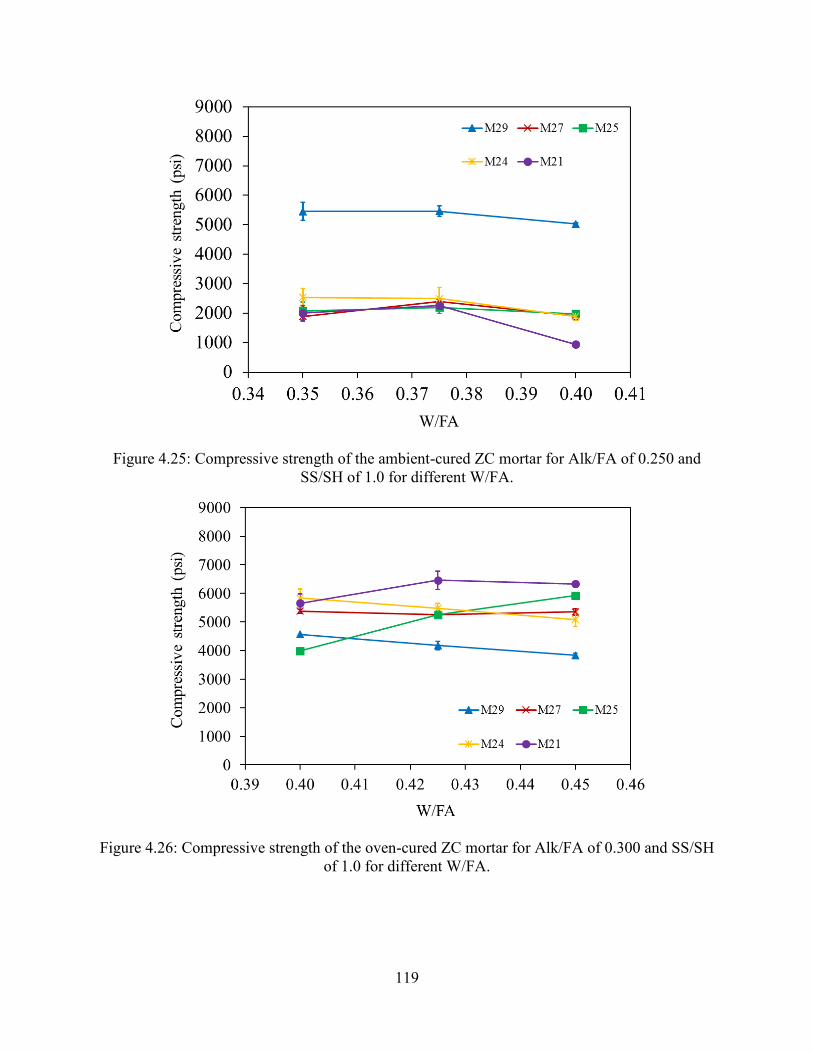
119
Figure 4.25: Compressive strength of the ambient-cured ZC mortar for Alk/FA of 0.250 and SS/SH of 1.0 for different W/FA.
Figure 4.26: Compressive strength of the oven-cured ZC mortar for Alk/FA of 0.300 and SS/SH of 1.0 for different W/FA.

120
Figure 4.27: Compressive strength of the ambient-cured ZC mortar for Alk/FA of 0.300 and SS/SH of 1.0 for different W/FA.
As shown in Figs 4.24 and 4.25, with Alk/FA of 0.250 and SS/SH of 1.0, the compressive
strength of all mixtures except those synthesized using FA25 and FA27 decreased with
increasing the W/FA from 0.350 to 0.400. For M25 and M27, the strength slightly increased with
increasing the W/FA from 0.350 to 0.400. Hence, the optimum W/FA was 0.350 for M21, M24,
and M29 and 0.375 for M25 and M27.
For specimens having Alk/FA of 0.300, SS/SH of 1.0, and subjected to oven curing (Figs. 4.26
and 4.27), with increasing the W/FA, the compressive strength increased for M21 and M25 only.
This is because in the case of high Alk/FA of 0.300, the presence of sufficient water content in
the mixtures is necessary for geopolymerization to take place, which resulted in higher strength
especially for mixtures synthesized using the FAs that had higher silica and alumina content. For
specimens having Alk/FA of 0.300, SS/SH of 1.0, and subjected to ambient curing, adequate
W/FA is important mainly for the hydration process; therefore, with low W/FA of 0.400, the
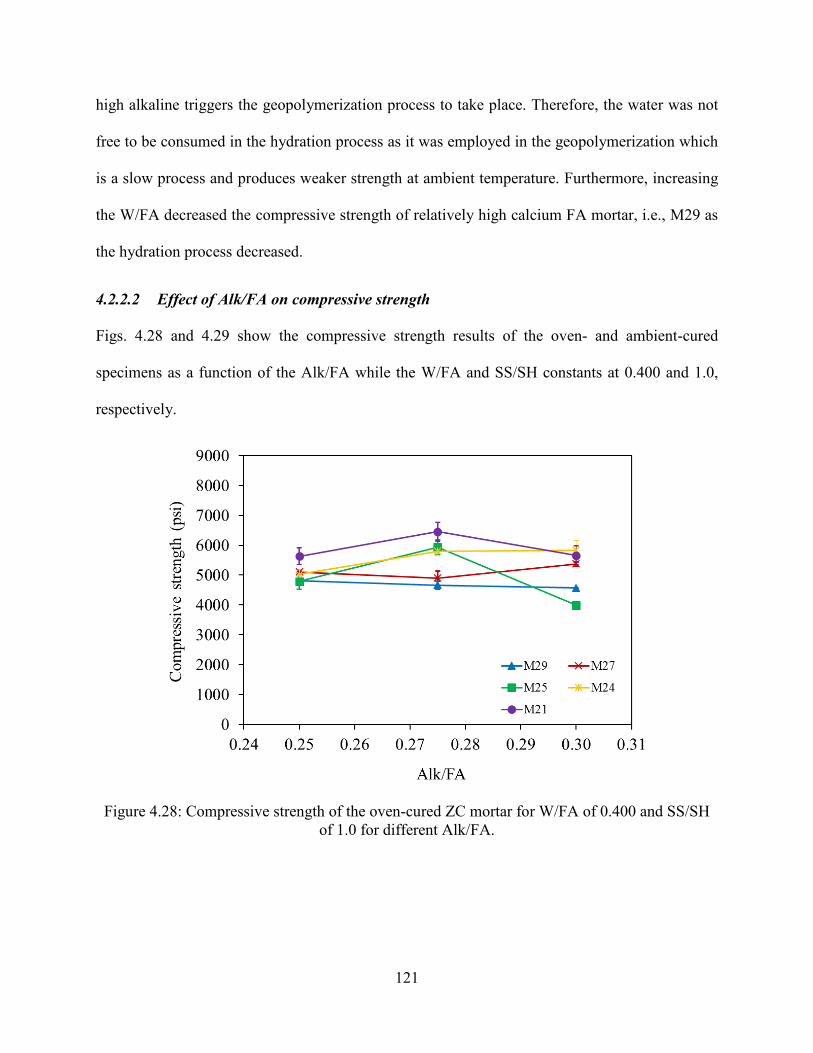
121
high alkaline triggers the geopolymerization process to take place. Therefore, the water was not
free to be consumed in the hydration process as it was employed in the geopolymerization which
is a slow process and produces weaker strength at ambient temperature. Furthermore, increasing
the W/FA decreased the compressive strength of relatively high calcium FA mortar, i.e., M29 as
the hydration process decreased.
4.2.2.2 Effect of Alk/FA on compressive strength
Figs. 4.28 and 4.29 show the compressive strength results of the oven- and ambient-cured
specimens as a function of the Alk/FA while the W/FA and SS/SH constants at 0.400 and 1.0,
respectively.
Figure 4.28: Compressive strength of the oven-cured ZC mortar for W/FA of 0.400 and SS/SH of 1.0 for different Alk/FA.
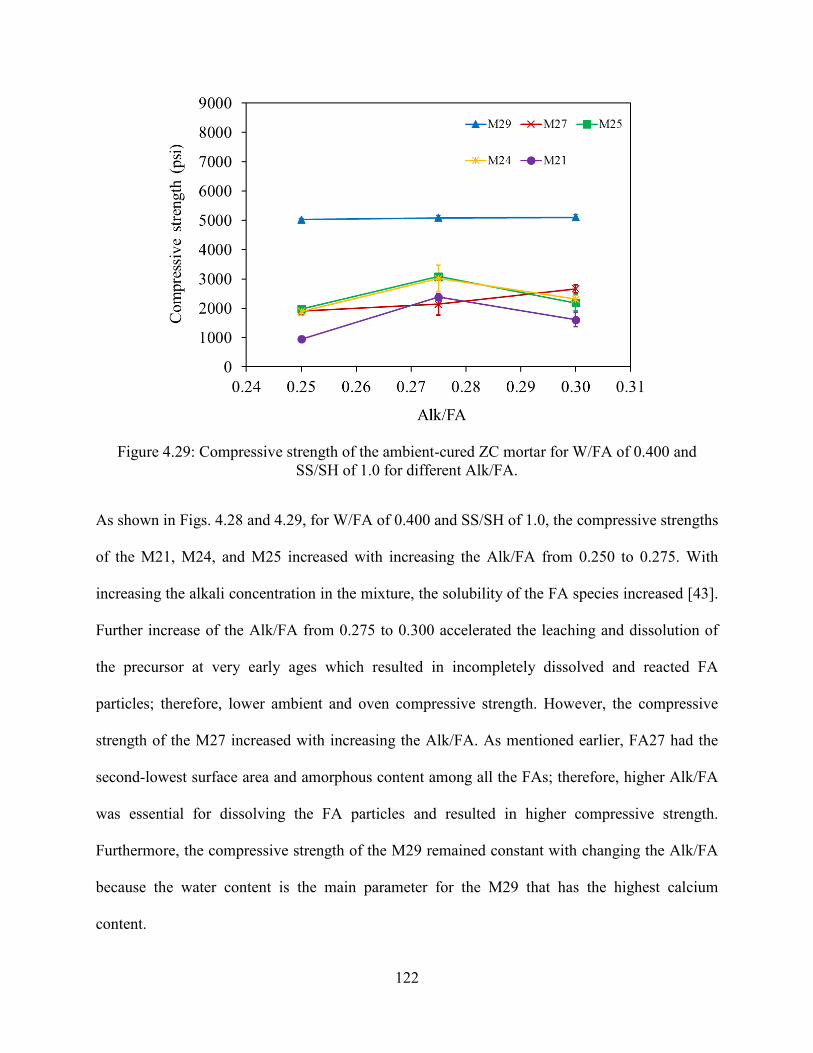
122
Figure 4.29: Compressive strength of the ambient-cured ZC mortar for W/FA of 0.400 and SS/SH of 1.0 for different Alk/FA.
As shown in Figs. 4.28 and 4.29, for W/FA of 0.400 and SS/SH of 1.0, the compressive strengths
of the M21, M24, and M25 increased with increasing the Alk/FA from 0.250 to 0.275. With
increasing the alkali concentration in the mixture, the solubility of the FA species increased [43].
Further increase of the Alk/FA from 0.275 to 0.300 accelerated the leaching and dissolution of
the precursor at very early ages which resulted in incompletely dissolved and reacted FA
particles; therefore, lower ambient and oven compressive strength. However, the compressive
strength of the M27 increased with increasing the Alk/FA. As mentioned earlier, FA27 had the
second-lowest surface area and amorphous content among all the FAs; therefore, higher Alk/FA
was essential for dissolving the FA particles and resulted in higher compressive strength.
Furthermore, the compressive strength of the M29 remained constant with changing the Alk/FA
because the water content is the main parameter for the M29 that has the highest calcium
content.
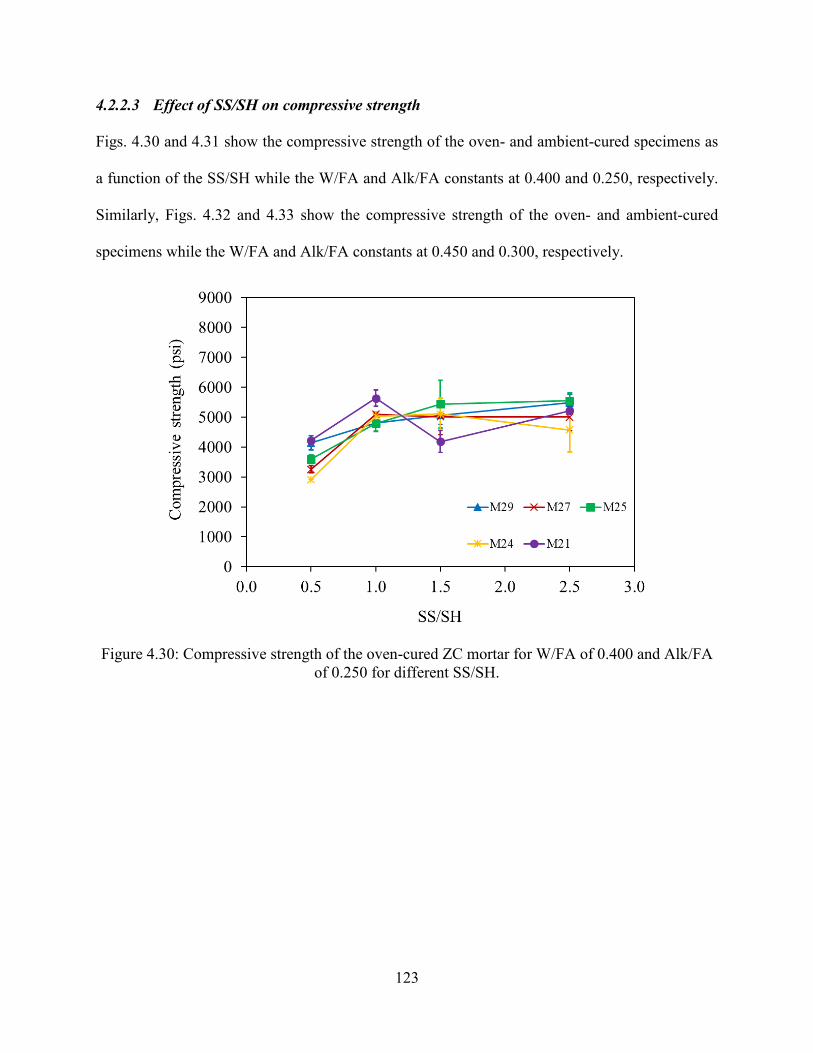
123
4.2.2.3 Effect of SS/SH on compressive strength
Figs. 4.30 and 4.31 show the compressive strength of the oven- and ambient-cured specimens as
a function of the SS/SH while the W/FA and Alk/FA constants at 0.400 and 0.250, respectively.
Similarly, Figs. 4.32 and 4.33 show the compressive strength of the oven- and ambient-cured
specimens while the W/FA and Alk/FA constants at 0.450 and 0.300, respectively.
Figure 4.30: Compressive strength of the oven-cured ZC mortar for W/FA of 0.400 and Alk/FA of 0.250 for different SS/SH.
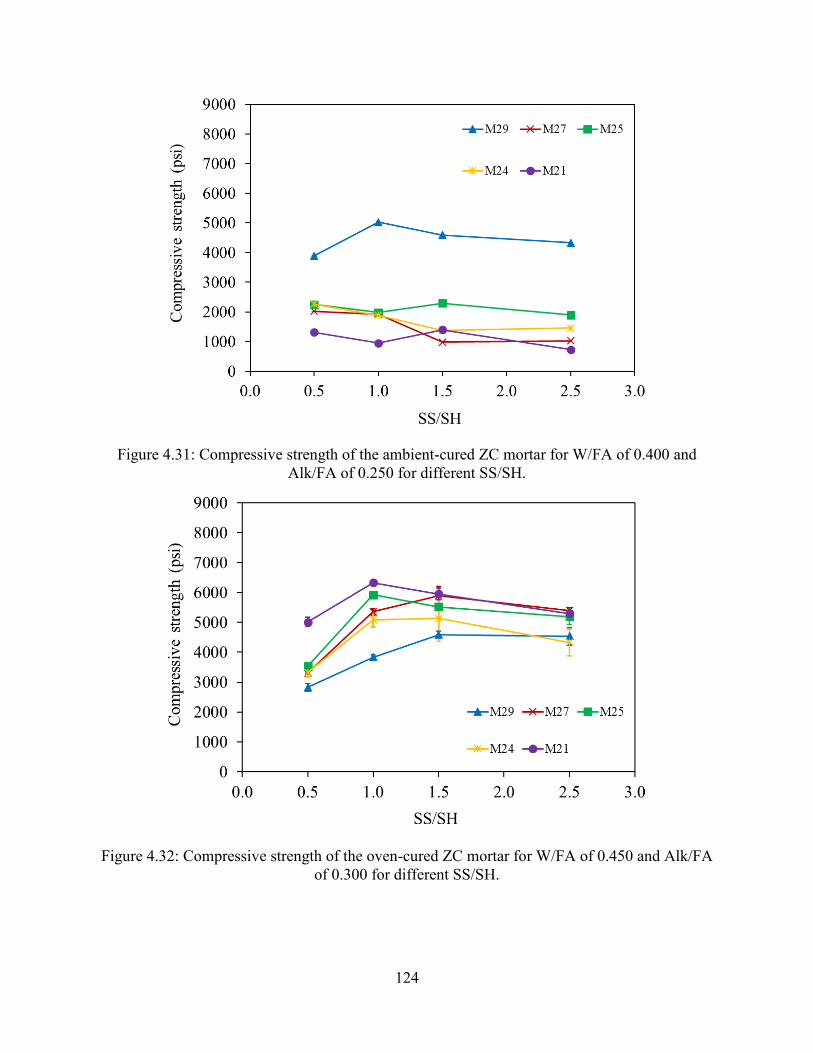
124
Figure 4.31: Compressive strength of the ambient-cured ZC mortar for W/FA of 0.400 and Alk/FA of 0.250 for different SS/SH.
Figure 4.32: Compressive strength of the oven-cured ZC mortar for W/FA of 0.450 and Alk/FA of 0.300 for different SS/SH.
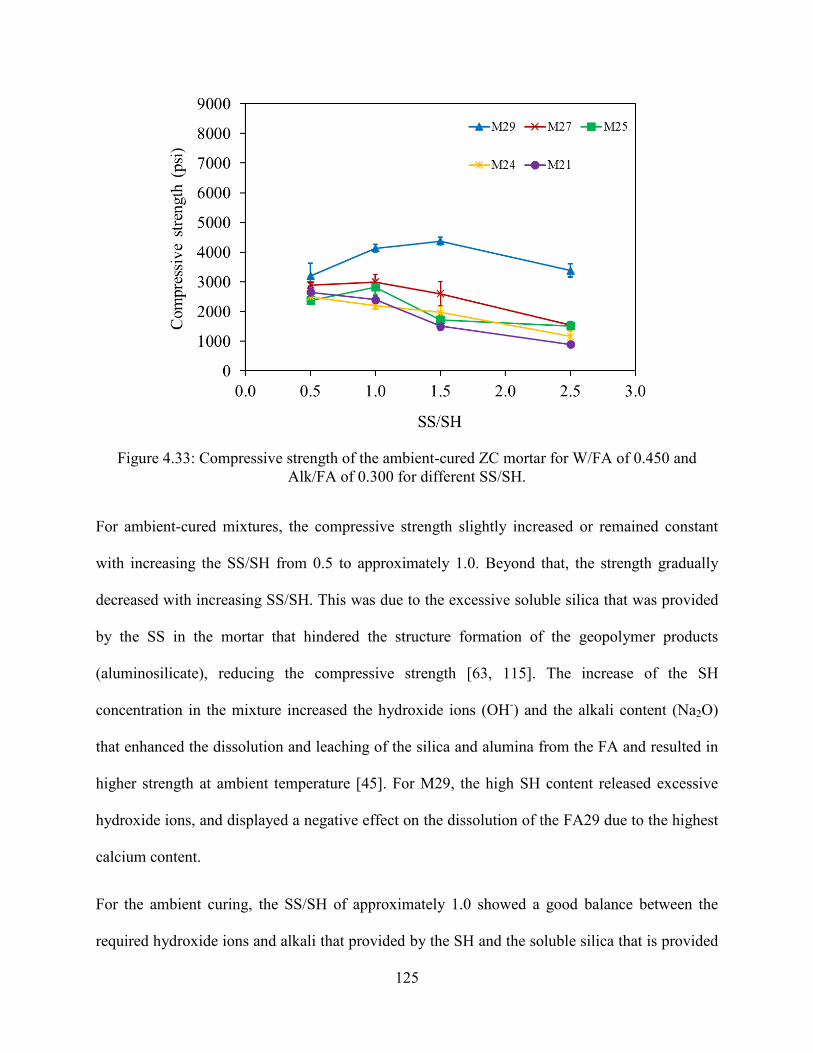
125
Figure 4.33: Compressive strength of the ambient-cured ZC mortar for W/FA of 0.450 and Alk/FA of 0.300 for different SS/SH.
For ambient-cured mixtures, the compressive strength slightly increased or remained constant
with increasing the SS/SH from 0.5 to approximately 1.0. Beyond that, the strength gradually
decreased with increasing SS/SH. This was due to the excessive soluble silica that was provided
by the SS in the mortar that hindered the structure formation of the geopolymer products
(aluminosilicate), reducing the compressive strength [63, 115]. The increase of the SH
concentration in the mixture increased the hydroxide ions (OH-) and the alkali content (Na2O)
that enhanced the dissolution and leaching of the silica and alumina from the FA and resulted in
higher strength at ambient temperature [45]. For M29, the high SH content released excessive
hydroxide ions, and displayed a negative effect on the dissolution of the FA29 due to the highest
calcium content.
For the ambient curing, the SS/SH of approximately 1.0 showed a good balance between the
required hydroxide ions and alkali that provided by the SH and the soluble silica that is provided
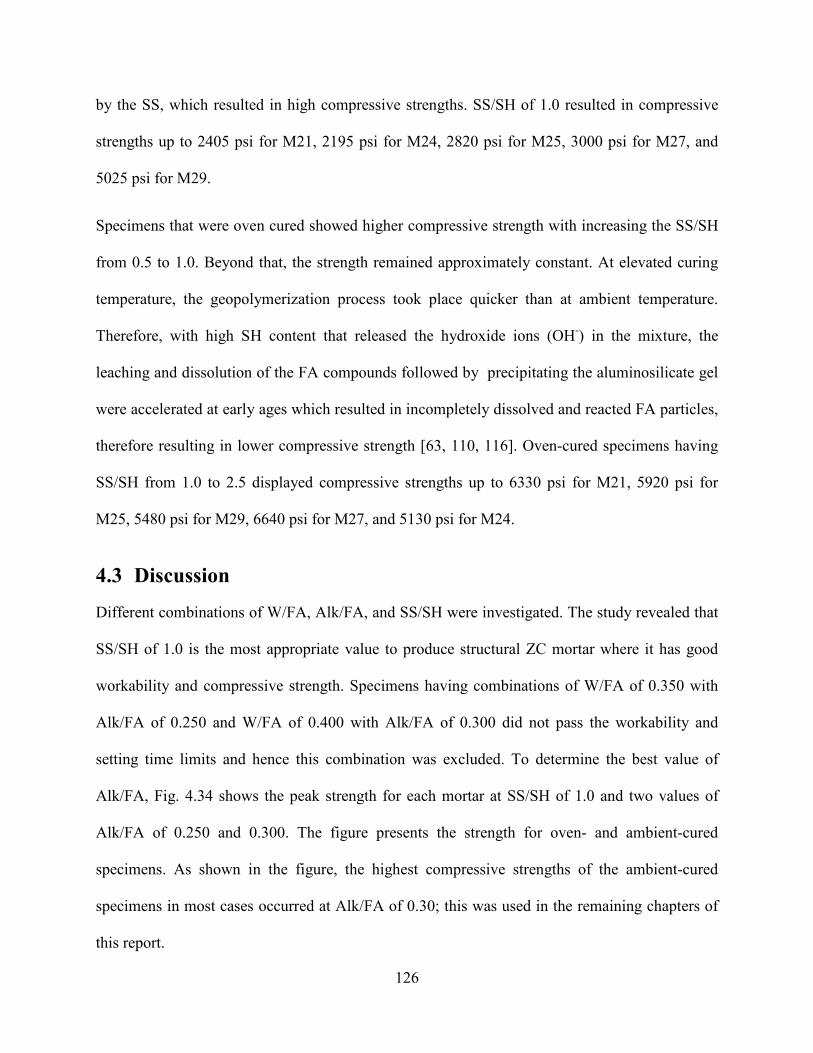
126
by the SS, which resulted in high compressive strengths. SS/SH of 1.0 resulted in compressive
strengths up to 2405 psi for M21, 2195 psi for M24, 2820 psi for M25, 3000 psi for M27, and
5025 psi for M29.
Specimens that were oven cured showed higher compressive strength with increasing the SS/SH
from 0.5 to 1.0. Beyond that, the strength remained approximately constant. At elevated curing
temperature, the geopolymerization process took place quicker than at ambient temperature.
Therefore, with high SH content that released the hydroxide ions (OH-) in the mixture, the
leaching and dissolution of the FA compounds followed by precipitating the aluminosilicate gel
were accelerated at early ages which resulted in incompletely dissolved and reacted FA particles,
therefore resulting in lower compressive strength [63, 110, 116]. Oven-cured specimens having
SS/SH from 1.0 to 2.5 displayed compressive strengths up to 6330 psi for M21, 5920 psi for
M25, 5480 psi for M29, 6640 psi for M27, and 5130 psi for M24.
4.3 Discussion Different combinations of W/FA, Alk/FA, and SS/SH were investigated. The study revealed that
SS/SH of 1.0 is the most appropriate value to produce structural ZC mortar where it has good
workability and compressive strength. Specimens having combinations of W/FA of 0.350 with
Alk/FA of 0.250 and W/FA of 0.400 with Alk/FA of 0.300 did not pass the workability and
setting time limits and hence this combination was excluded. To determine the best value of
Alk/FA, Fig. 4.34 shows the peak strength for each mortar at SS/SH of 1.0 and two values of
Alk/FA of 0.250 and 0.300. The figure presents the strength for oven- and ambient-cured
specimens. As shown in the figure, the highest compressive strengths of the ambient-cured
specimens in most cases occurred at Alk/FA of 0.30; this was used in the remaining chapters of
this report.
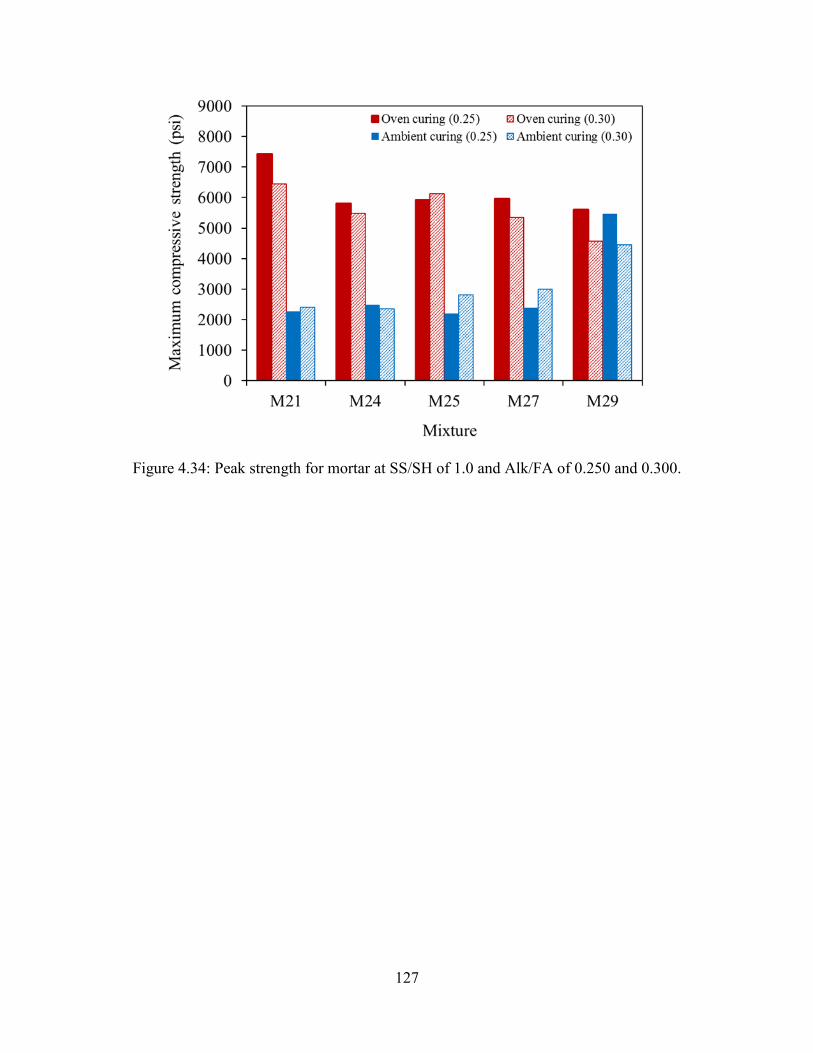
127
Figure 4.34: Peak strength for mortar at SS/SH of 1.0 and Alk/FA of 0.250 and 0.300.
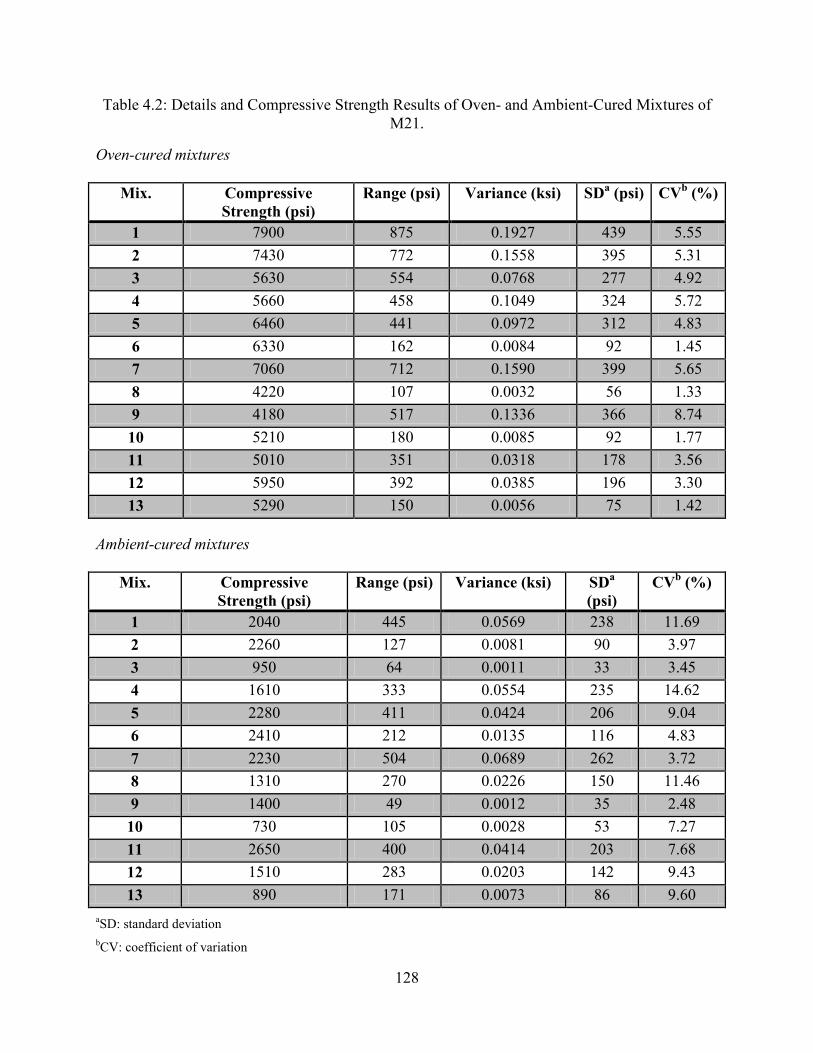
128
Table 4.2: Details and Compressive Strength Results of Oven- and Ambient-Cured Mixtures of M21.
Oven-cured mixtures
Mix. Compressive Strength (psi)
Range (psi) Variance (ksi) SDa (psi) CVb (%)
1 7900 875 0.1927 439 5.55 2 7430 772 0.1558 395 5.31 3 5630 554 0.0768 277 4.92 4 5660 458 0.1049 324 5.72 5 6460 441 0.0972 312 4.83 6 6330 162 0.0084 92 1.45 7 7060 712 0.1590 399 5.65 8 4220 107 0.0032 56 1.33 9 4180 517 0.1336 366 8.74 10 5210 180 0.0085 92 1.77 11 5010 351 0.0318 178 3.56 12 5950 392 0.0385 196 3.30 13 5290 150 0.0056 75 1.42
Ambient-cured mixtures
Mix. Compressive Strength (psi)
Range (psi) Variance (ksi) SDa (psi)
CVb (%)
1 2040 445 0.0569 238 11.69 2 2260 127 0.0081 90 3.97 3 950 64 0.0011 33 3.45 4 1610 333 0.0554 235 14.62 5 2280 411 0.0424 206 9.04 6 2410 212 0.0135 116 4.83 7 2230 504 0.0689 262 3.72 8 1310 270 0.0226 150 11.46 9 1400 49 0.0012 35 2.48 10 730 105 0.0028 53 7.27 11 2650 400 0.0414 203 7.68 12 1510 283 0.0203 142 9.43 13 890 171 0.0073 86 9.60
aSD: standard deviation bCV: coefficient of variation

129
Table 4.3: Details and Compressive Strength Results of Oven- and Ambient-Cured Mixtures of M24.
Oven-cured mixtures
Mix. Compressive Strength (psi)
Range (psi) Variance (ksi) SDa (psi)
CVb (%)
1 5790 864 0.1875 433 7.48 2 5800 672 0.1137 337 5.81 3 5030 312 0.0248 158 3.13 4 5830 646 0.1047 324 5.55 5 5490 314 0.0249 158 2.88 6 5090 447 0.0591 243 4.78 7 5810 253 0.0201 142 2.44 8 2910 210 0.0110 105 3.61 9 5110 1036 0.2707 520 10.18 10 4570 1365 0.5279 727 15.91 11 3330 288 0.0232 152 4.58 12 5130 1525 0.5928 770 15.01 13 4330 860 0.2009 448 10.35
Ambient-cured mixtures
Mix. Compressive Strength (psi)
Range (psi) Variance (ksi) SDa (psi)
CVb (%)
1 5790 864 0.1875 433 7.48 2 5800 672 0.1137 337 5.81 3 5030 312 0.0248 158 3.13 4 5830 646 0.1047 324 5.55 5 5490 314 0.0249 158 2.88 6 5090 447 0.0591 243 4.78 7 5810 253 0.0201 142 2.44 8 2910 210 0.0110 105 3.61 9 5110 1036 0.2707 520 10.18 10 4570 1365 0.5279 727 15.91 11 3330 288 0.0232 152 4.58 12 5130 1525 0.5928 770 15.01 13 4330 860 0.2009 448 10.35
aSD: standard deviation bCV: coefficient of variation
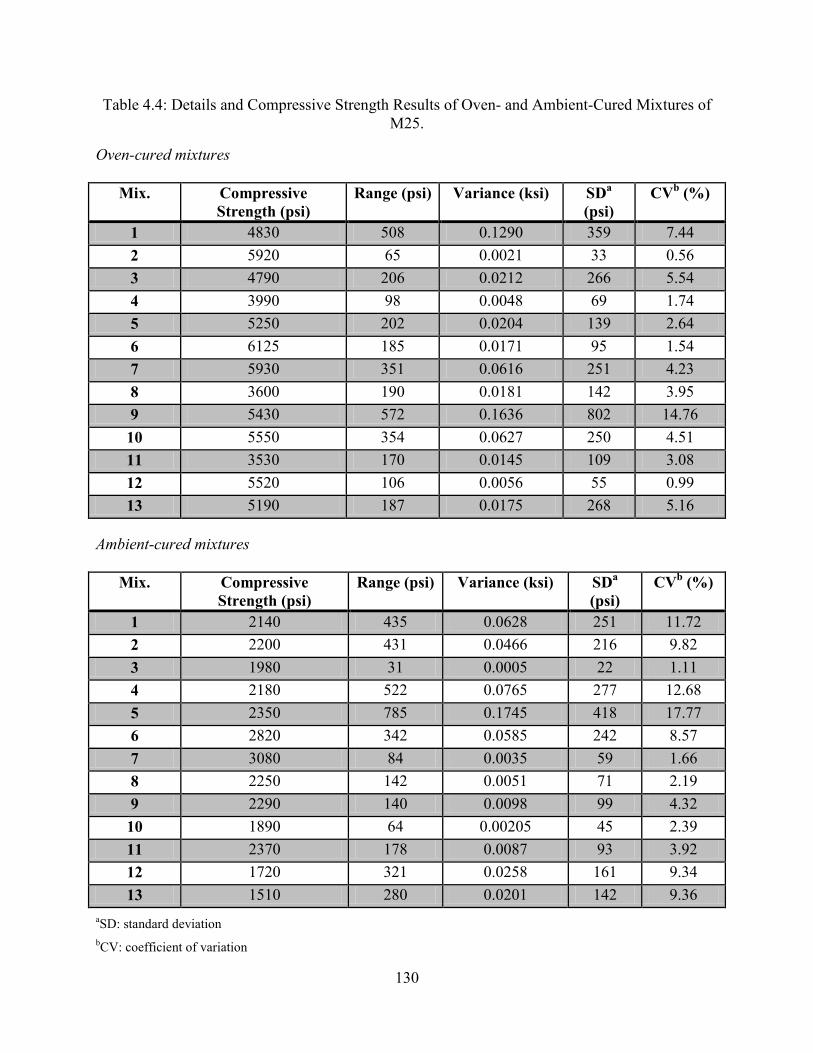
130
Table 4.4: Details and Compressive Strength Results of Oven- and Ambient-Cured Mixtures of M25.
Oven-cured mixtures
Mix. Compressive Strength (psi)
Range (psi) Variance (ksi) SDa (psi)
CVb (%)
1 4830 508 0.1290 359 7.44 2 5920 65 0.0021 33 0.56 3 4790 206 0.0212 266 5.54 4 3990 98 0.0048 69 1.74 5 5250 202 0.0204 139 2.64 6 6125 185 0.0171 95 1.54 7 5930 351 0.0616 251 4.23 8 3600 190 0.0181 142 3.95 9 5430 572 0.1636 802 14.76 10 5550 354 0.0627 250 4.51 11 3530 170 0.0145 109 3.08 12 5520 106 0.0056 55 0.99 13 5190 187 0.0175 268 5.16
Ambient-cured mixtures
Mix. Compressive Strength (psi)
Range (psi) Variance (ksi) SDa (psi)
CVb (%)
1 2140 435 0.0628 251 11.72 2 2200 431 0.0466 216 9.82 3 1980 31 0.0005 22 1.11 4 2180 522 0.0765 277 12.68 5 2350 785 0.1745 418 17.77 6 2820 342 0.0585 242 8.57 7 3080 84 0.0035 59 1.66 8 2250 142 0.0051 71 2.19 9 2290 140 0.0098 99 4.32 10 1890 64 0.00205 45 2.39 11 2370 178 0.0087 93 3.92 12 1720 321 0.0258 161 9.34 13 1510 280 0.0201 142 9.36
aSD: standard deviation bCV: coefficient of variation
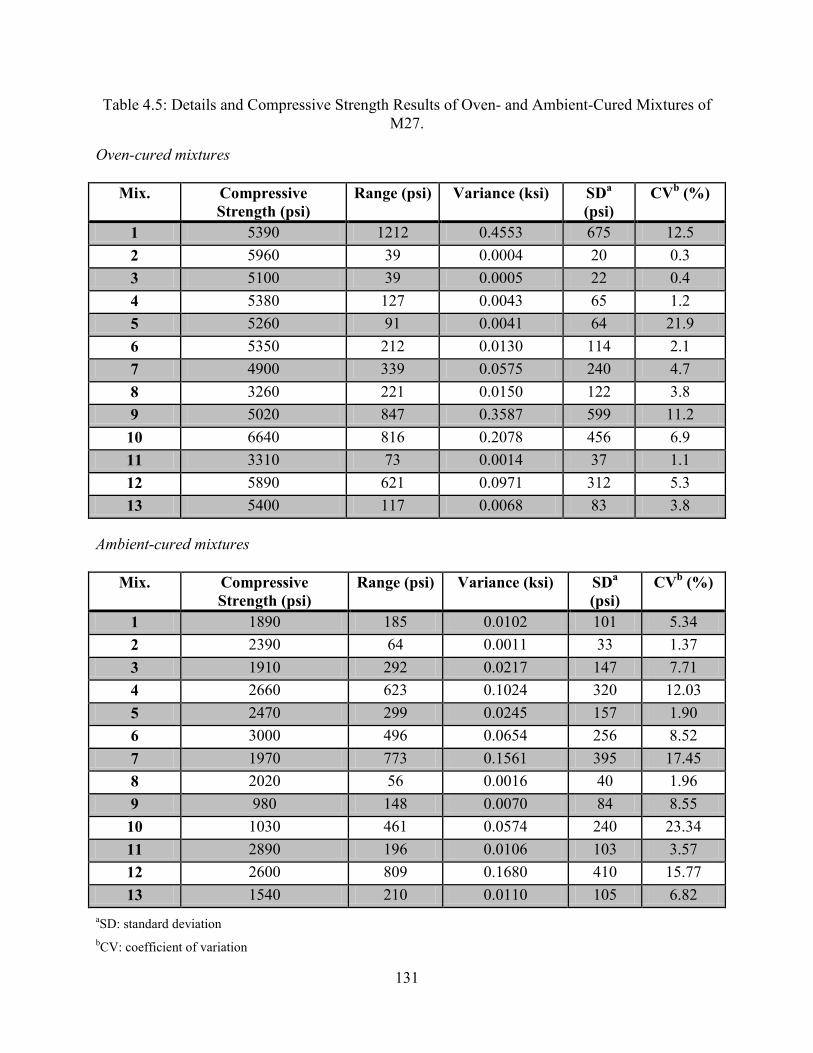
131
Table 4.5: Details and Compressive Strength Results of Oven- and Ambient-Cured Mixtures of M27.
Oven-cured mixtures
Mix. Compressive Strength (psi)
Range (psi) Variance (ksi) SDa (psi)
CVb (%)
1 5390 1212 0.4553 675 12.5 2 5960 39 0.0004 20 0.3 3 5100 39 0.0005 22 0.4 4 5380 127 0.0043 65 1.2 5 5260 91 0.0041 64 21.9 6 5350 212 0.0130 114 2.1 7 4900 339 0.0575 240 4.7 8 3260 221 0.0150 122 3.8 9 5020 847 0.3587 599 11.2 10 6640 816 0.2078 456 6.9 11 3310 73 0.0014 37 1.1 12 5890 621 0.0971 312 5.3 13 5400 117 0.0068 83 3.8
Ambient-cured mixtures
Mix. Compressive Strength (psi)
Range (psi) Variance (ksi) SDa (psi)
CVb (%)
1 1890 185 0.0102 101 5.34 2 2390 64 0.0011 33 1.37 3 1910 292 0.0217 147 7.71 4 2660 623 0.1024 320 12.03 5 2470 299 0.0245 157 1.90 6 3000 496 0.0654 256 8.52 7 1970 773 0.1561 395 17.45 8 2020 56 0.0016 40 1.96 9 980 148 0.0070 84 8.55 10 1030 461 0.0574 240 23.34 11 2890 196 0.0106 103 3.57 12 2600 809 0.1680 410 15.77 13 1540 210 0.0110 105 6.82
aSD: standard deviation bCV: coefficient of variation
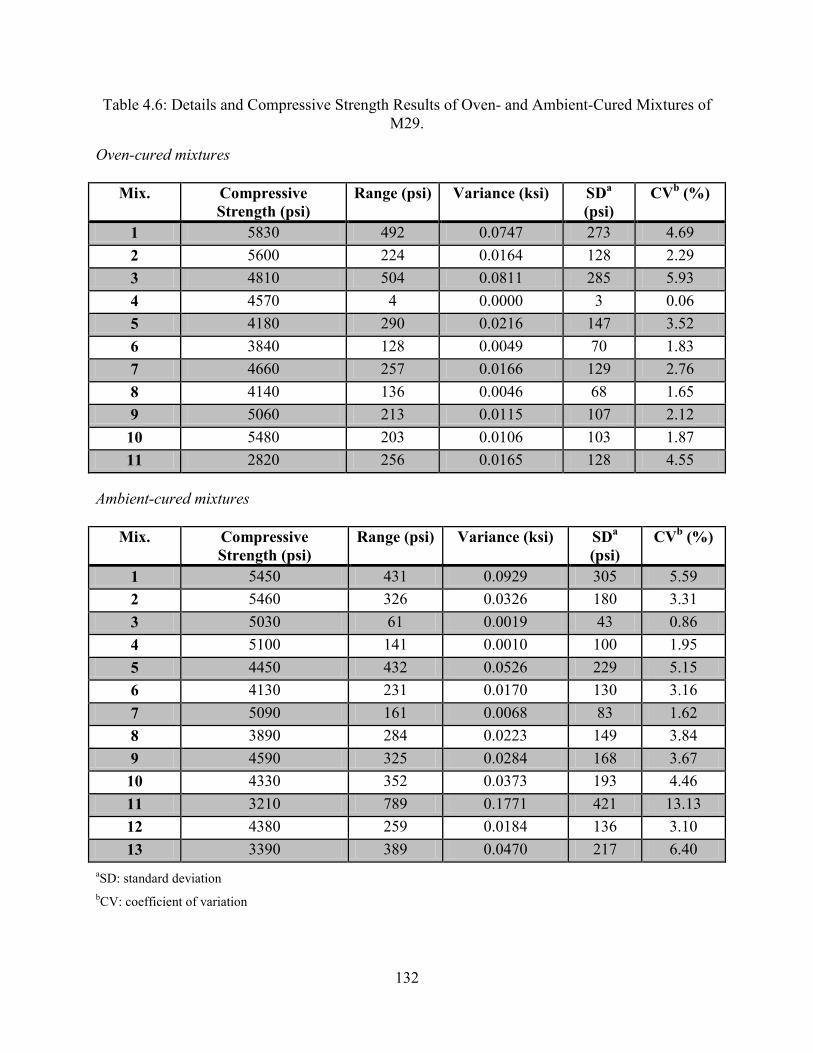
132
Table 4.6: Details and Compressive Strength Results of Oven- and Ambient-Cured Mixtures of M29.
Oven-cured mixtures
Mix. Compressive Strength (psi)
Range (psi) Variance (ksi) SDa (psi)
CVb (%)
1 5830 492 0.0747 273 4.69 2 5600 224 0.0164 128 2.29 3 4810 504 0.0811 285 5.93 4 4570 4 0.0000 3 0.06 5 4180 290 0.0216 147 3.52 6 3840 128 0.0049 70 1.83 7 4660 257 0.0166 129 2.76 8 4140 136 0.0046 68 1.65 9 5060 213 0.0115 107 2.12 10 5480 203 0.0106 103 1.87 11 2820 256 0.0165 128 4.55
Ambient-cured mixtures
Mix. Compressive Strength (psi)
Range (psi) Variance (ksi) SDa (psi)
CVb (%)
1 5450 431 0.0929 305 5.59 2 5460 326 0.0326 180 3.31 3 5030 61 0.0019 43 0.86 4 5100 141 0.0010 100 1.95 5 4450 432 0.0526 229 5.15 6 4130 231 0.0170 130 3.16 7 5090 161 0.0068 83 1.62 8 3890 284 0.0223 149 3.84 9 4590 325 0.0284 168 3.67 10 4330 352 0.0373 193 4.46 11 3210 789 0.1771 421 13.13 12 4380 259 0.0184 136 3.10 13 3390 389 0.0470 217 6.40
aSD: standard deviation bCV: coefficient of variation
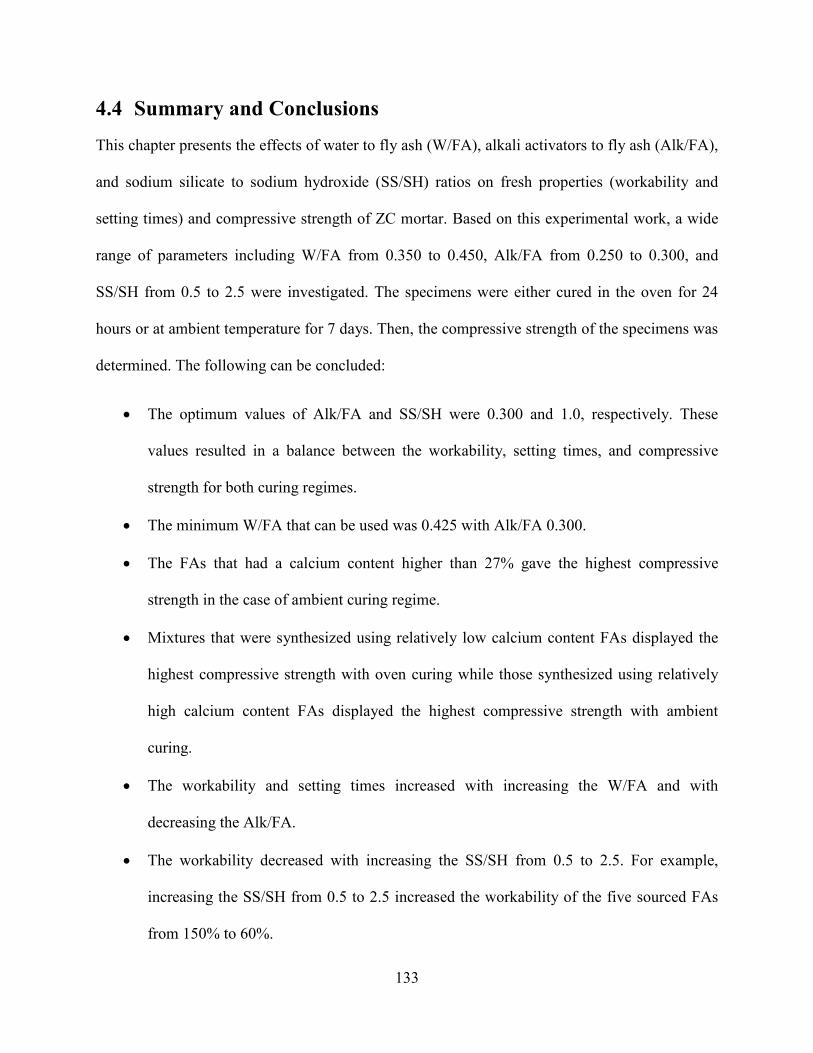
133
4.4 Summary and Conclusions This chapter presents the effects of water to fly ash (W/FA), alkali activators to fly ash (Alk/FA),
and sodium silicate to sodium hydroxide (SS/SH) ratios on fresh properties (workability and
setting times) and compressive strength of ZC mortar. Based on this experimental work, a wide
range of parameters including W/FA from 0.350 to 0.450, Alk/FA from 0.250 to 0.300, and
SS/SH from 0.5 to 2.5 were investigated. The specimens were either cured in the oven for 24
hours or at ambient temperature for 7 days. Then, the compressive strength of the specimens was
determined. The following can be concluded:
• The optimum values of Alk/FA and SS/SH were 0.300 and 1.0, respectively. These
values resulted in a balance between the workability, setting times, and compressive
strength for both curing regimes.
• The minimum W/FA that can be used was 0.425 with Alk/FA 0.300.
• The FAs that had a calcium content higher than 27% gave the highest compressive
strength in the case of ambient curing regime.
• Mixtures that were synthesized using relatively low calcium content FAs displayed the
highest compressive strength with oven curing while those synthesized using relatively
high calcium content FAs displayed the highest compressive strength with ambient
curing.
• The workability and setting times increased with increasing the W/FA and with
decreasing the Alk/FA.
• The workability decreased with increasing the SS/SH from 0.5 to 2.5. For example,
increasing the SS/SH from 0.5 to 2.5 increased the workability of the five sourced FAs
from 150% to 60%.
134
• The initial and final setting times decreased with increasing the SS/SH. For example,
increasing the SS/SH from 0.5 to 2.5 decreased the average initial setting time of the five
sourced fly ashes from 251 minutes to 200 minutes while it decreased the average final
setting time from 316 minutes to 256 minutes.
• FA29 showed the lowest workability and setting time among the other five FAs due to
its high calcium content and surface area.
135
Chapter 5: Optimization of Thermal Curing Temperature and Duration of Zero-Cement Mortar
In this chapter, the effects of curing duration and temperature on ZC mortar mixtures were
investigated. Five sourced FA were used to synthesize mortar mixtures. The mixtures were
prepared using different alkaline and silicate contents. Therefore, the correlation between the
alkaline, silicate, and curing characteristics can be evaluated. Curing temperatures ranging from
185o F (85o C) to 86o F (30o C) applied over durations ranging from 4 hours to 168 hours were
used. Furthermore, hot weather curing was imitated using two different regimes. The energy
required to achieve the different curing regimes was then calculated and correlated to the
achieved compressive strength. Therefore, the compressive strength can be optimized based on
the energy cost.
5.1 Material Properties
5.1.1 Fly ashes, sand, coarse aggregate, and alkali solutions
Five FAs were used in this part of the chapter to mix mortar; FA37, FA29, FA26, FA24, and
FA21. The alkali activators, the sand for mortar was used in this chapter were mentioned in
Chapter 2 of this report.
5.1.2 Mix design
Three different mixtures were selected as reference mixtures and prepared out of each of the five
FA types, i.e., 15 mixtures were prepared during the course of this research. All three mixtures
have a sand-to-binder (FA) ratio of 2.75 (Table 5.1). The first mixture, LA, had a relatively low
Alk/FA of 0.275 with W/FA of 0.380. The silicate modulus, i.e., SS/SH in the alkali activator,
was 1.0. The second mixture, HA, had a relatively high Alk/FA of 0.300 while keeping the
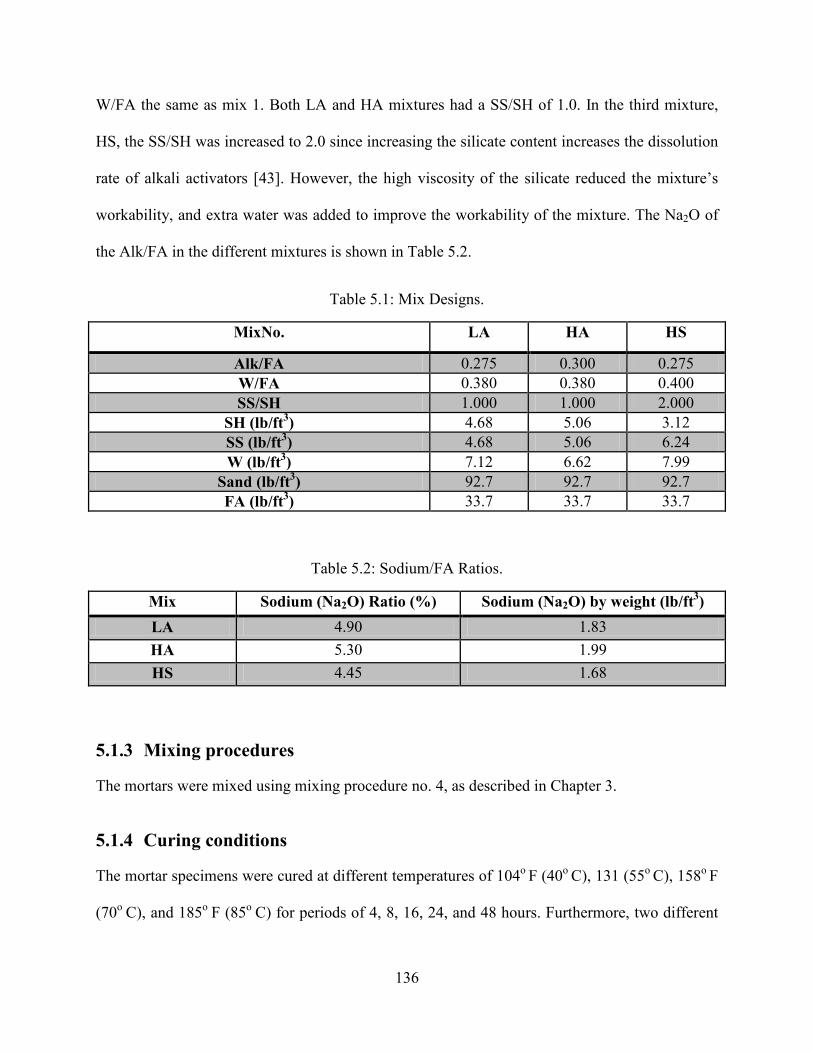
136
W/FA the same as mix 1. Both LA and HA mixtures had a SS/SH of 1.0. In the third mixture,
HS, the SS/SH was increased to 2.0 since increasing the silicate content increases the dissolution
rate of alkali activators [43]. However, the high viscosity of the silicate reduced the mixture’s
workability, and extra water was added to improve the workability of the mixture. The Na2O of
the Alk/FA in the different mixtures is shown in Table 5.2.
Table 5.1: Mix Designs.
MixNo. LA HA HS
Alk/FA 0.275 0.300 0.275 W/FA 0.380 0.380 0.400 SS/SH 1.000 1.000 2.000
SH (lb/ft3) 4.68 5.06 3.12 SS (lb/ft3) 4.68 5.06 6.24 W (lb/ft3) 7.12 6.62 7.99
Sand (lb/ft3) 92.7 92.7 92.7 FA (lb/ft3) 33.7 33.7 33.7
Table 5.2: Sodium/FA Ratios.
Mix Sodium (Na2O) Ratio (%) Sodium (Na2O) by weight (lb/ft3) LA 4.90 1.83 HA 5.30 1.99 HS 4.45 1.68
5.1.3 Mixing procedures
The mortars were mixed using mixing procedure no. 4, as described in Chapter 3.
5.1.4 Curing conditions
The mortar specimens were cured at different temperatures of 104o F (40o C), 131 (55o C), 158o F
(70o C), and 185o F (85o C) for periods of 4, 8, 16, 24, and 48 hours. Furthermore, two different
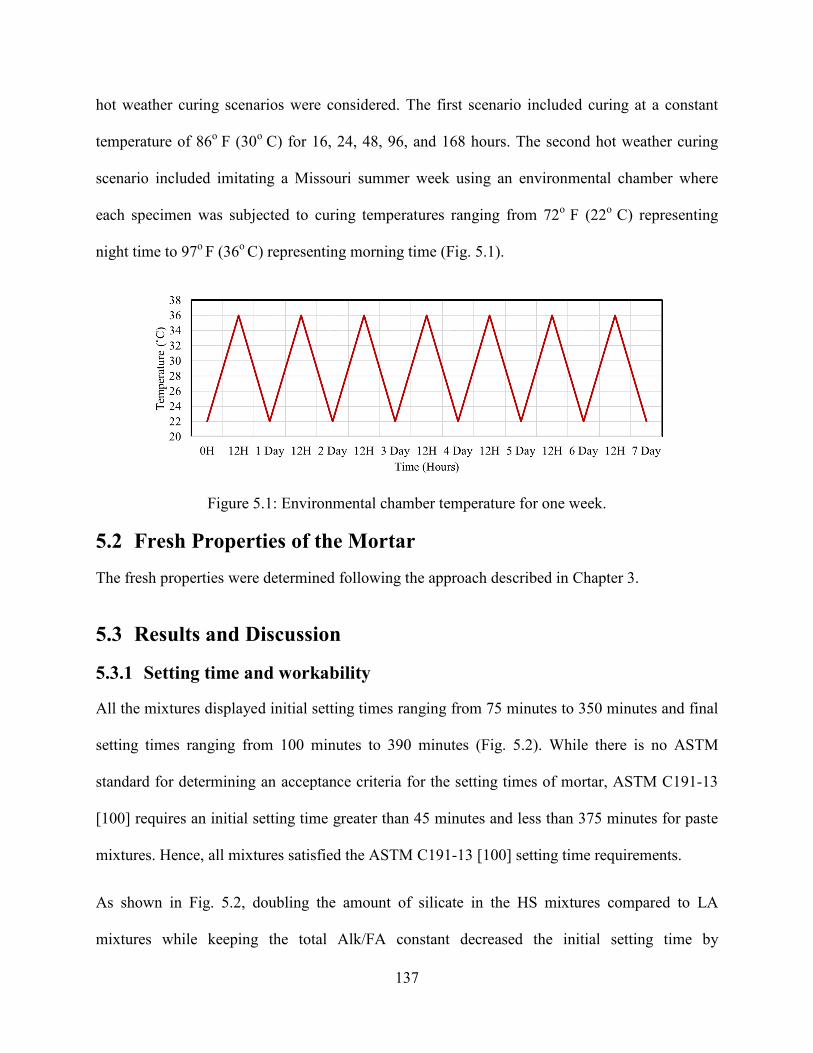
137
hot weather curing scenarios were considered. The first scenario included curing at a constant
temperature of 86o F (30o C) for 16, 24, 48, 96, and 168 hours. The second hot weather curing
scenario included imitating a Missouri summer week using an environmental chamber where
each specimen was subjected to curing temperatures ranging from 72o F (22o C) representing
night time to 97o F (36o C) representing morning time (Fig. 5.1).
Figure 5.1: Environmental chamber temperature for one week.
5.2 Fresh Properties of the Mortar The fresh properties were determined following the approach described in Chapter 3.
5.3 Results and Discussion
5.3.1 Setting time and workability
All the mixtures displayed initial setting times ranging from 75 minutes to 350 minutes and final
setting times ranging from 100 minutes to 390 minutes (Fig. 5.2). While there is no ASTM
standard for determining an acceptance criteria for the setting times of mortar, ASTM C191-13
[100] requires an initial setting time greater than 45 minutes and less than 375 minutes for paste
mixtures. Hence, all mixtures satisfied the ASTM C191-13 [100] setting time requirements.
As shown in Fig. 5.2, doubling the amount of silicate in the HS mixtures compared to LA
mixtures while keeping the total Alk/FA constant decreased the initial setting time by
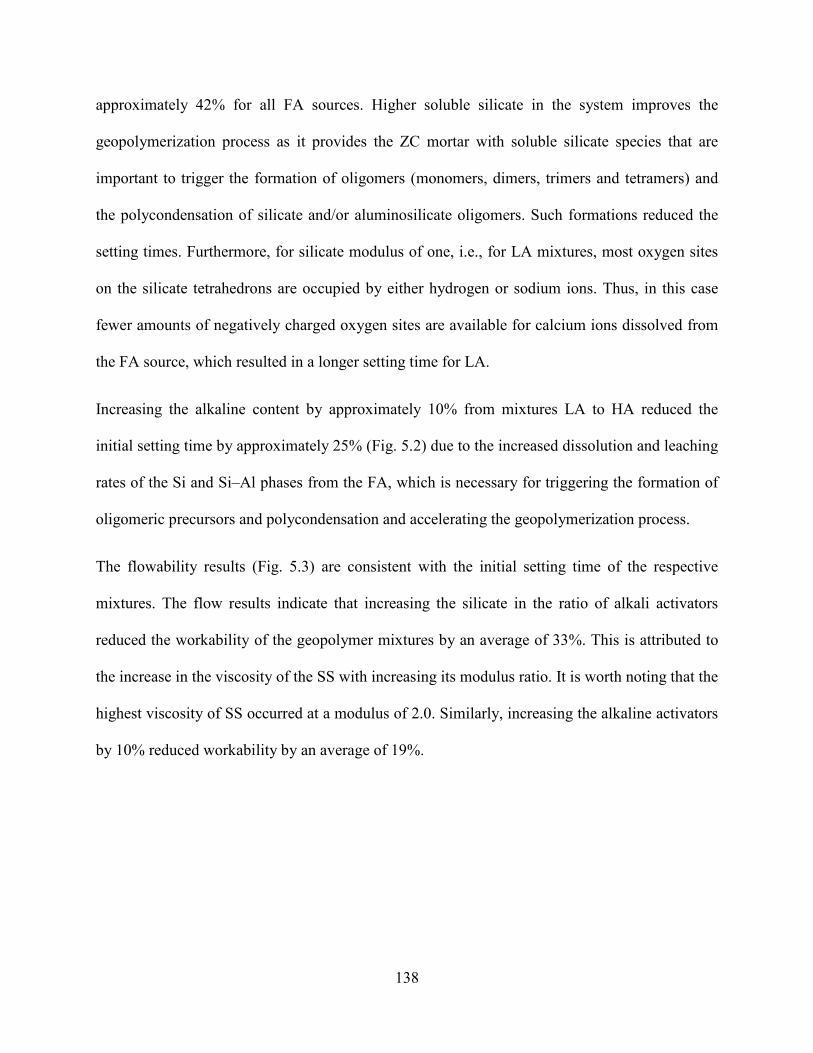
138
approximately 42% for all FA sources. Higher soluble silicate in the system improves the
geopolymerization process as it provides the ZC mortar with soluble silicate species that are
important to trigger the formation of oligomers (monomers, dimers, trimers and tetramers) and
the polycondensation of silicate and/or aluminosilicate oligomers. Such formations reduced the
setting times. Furthermore, for silicate modulus of one, i.e., for LA mixtures, most oxygen sites
on the silicate tetrahedrons are occupied by either hydrogen or sodium ions. Thus, in this case
fewer amounts of negatively charged oxygen sites are available for calcium ions dissolved from
the FA source, which resulted in a longer setting time for LA.
Increasing the alkaline content by approximately 10% from mixtures LA to HA reduced the
initial setting time by approximately 25% (Fig. 5.2) due to the increased dissolution and leaching
rates of the Si and Si–Al phases from the FA, which is necessary for triggering the formation of
oligomeric precursors and polycondensation and accelerating the geopolymerization process.
The flowability results (Fig. 5.3) are consistent with the initial setting time of the respective
mixtures. The flow results indicate that increasing the silicate in the ratio of alkali activators
reduced the workability of the geopolymer mixtures by an average of 33%. This is attributed to
the increase in the viscosity of the SS with increasing its modulus ratio. It is worth noting that the
highest viscosity of SS occurred at a modulus of 2.0. Similarly, increasing the alkaline activators
by 10% reduced workability by an average of 19%.
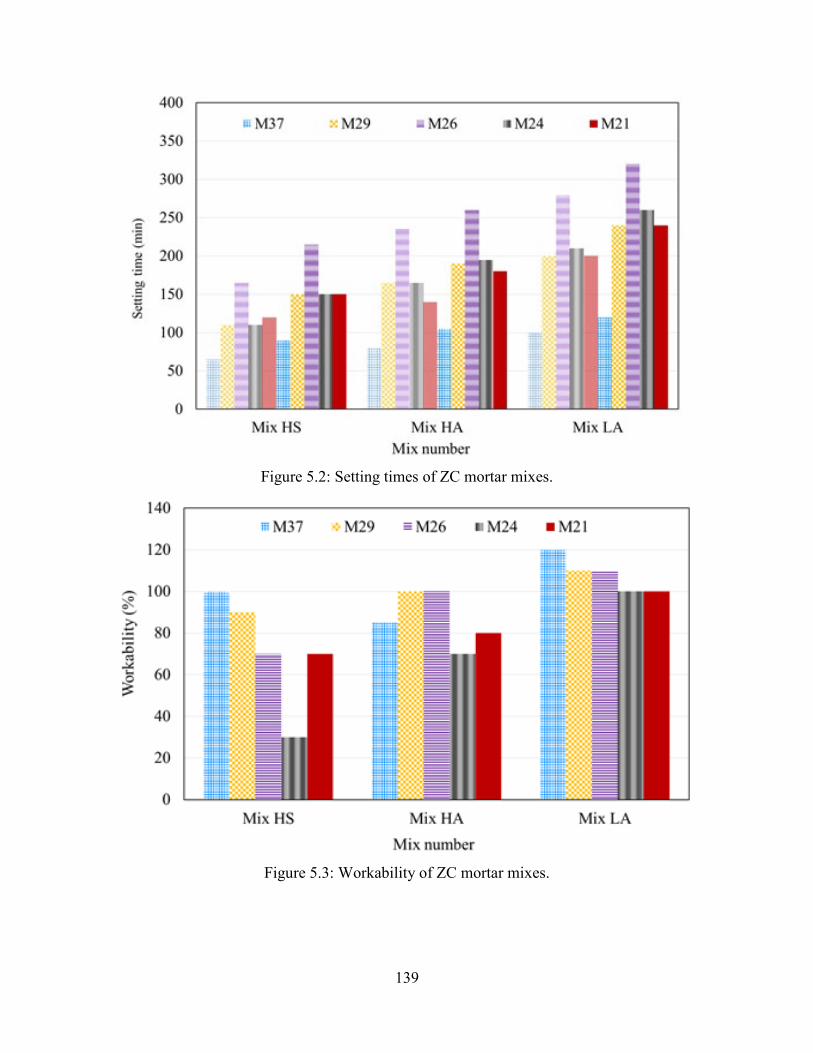
139
Figure 5.2: Setting times of ZC mortar mixes.
Figure 5.3: Workability of ZC mortar mixes.
140
5.3.2 Compressive strength
5.3.2.1 Oven-cured samples
Fig. 5.4 shows the compressive strength of each mixture after being cured for different periods at
different temperatures. As shown in the figure, for a given mixture, it was possible to obtain
different ZC mortar compressive strengths using different combinations of curing temperatures
and durations. For example, it was possible to produce ZC mortar having compressive strengths
in the range of 5000 psi – 5500 psi using numerous combinations such as curing at 104o F (40o C)
for 48 hours or curing at 158o F (70o C) for 12 hours. These combinations granted flexibility to
ZC producers to optimize the curing time and temperature for different project scenarios.
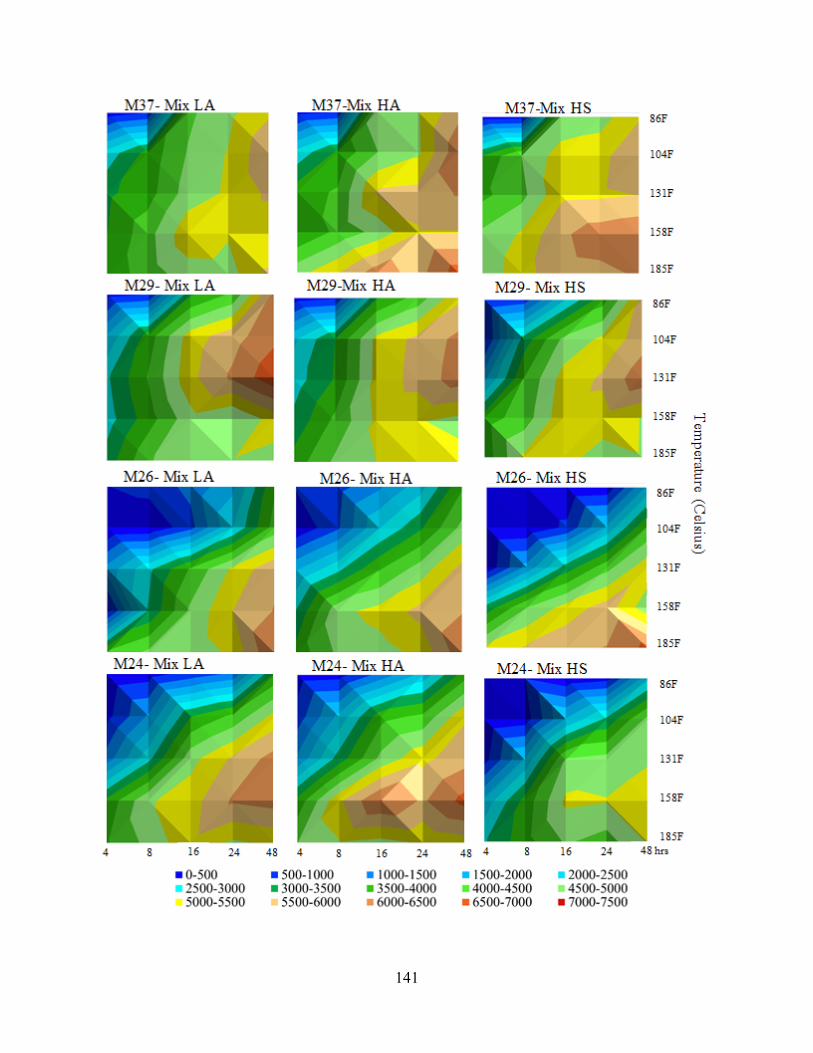
141
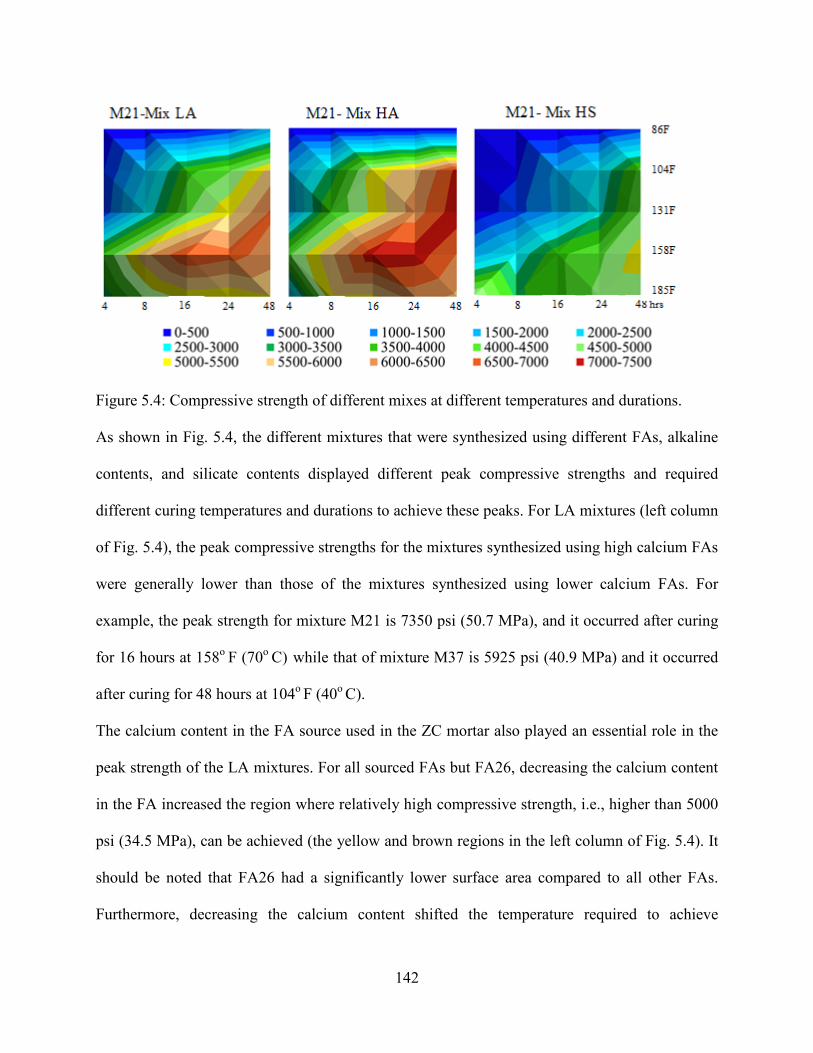
142
Figure 5.4: Compressive strength of different mixes at different temperatures and durations.
As shown in Fig. 5.4, the different mixtures that were synthesized using different FAs, alkaline
contents, and silicate contents displayed different peak compressive strengths and required
different curing temperatures and durations to achieve these peaks. For LA mixtures (left column
of Fig. 5.4), the peak compressive strengths for the mixtures synthesized using high calcium FAs
were generally lower than those of the mixtures synthesized using lower calcium FAs. For
example, the peak strength for mixture M21 is 7350 psi (50.7 MPa), and it occurred after curing
for 16 hours at 158o F (70o C) while that of mixture M37 is 5925 psi (40.9 MPa) and it occurred
after curing for 48 hours at 104o F (40o C).
The calcium content in the FA source used in the ZC mortar also played an essential role in the
peak strength of the LA mixtures. For all sourced FAs but FA26, decreasing the calcium content
in the FA increased the region where relatively high compressive strength, i.e., higher than 5000
psi (34.5 MPa), can be achieved (the yellow and brown regions in the left column of Fig. 5.4). It
should be noted that FA26 had a significantly lower surface area compared to all other FAs.
Furthermore, decreasing the calcium content shifted the temperature required to achieve
143
relatively higher strength toward higher curing temperatures. The calcium content in the FA
affects the geopolymerization process in the following three different aspects. 1) It forms
Ca(OH)2 and precipitates. The formation of Ca(OH)2 will remove the OH- ions which in turn
reduce the pH of the alkaline solution and hence reduce the dissolution rate of the silicon and
aluminum [117, 118]. 2) The free calcium ions react with the silica and alumina forming C-S-H
gel. 3) The free calcium can replace a cation in the geopolymeric gel [43]. Increasing the curing
temperature reduces the solubility of Ca in ZC mortar. For example, increasing the temperature
from 73o F (23o C) to 167o F (75o C) reduced the leached calcium by 50% [43]. Reducing the
solubility of calcium allowed more geopolymerization to take place and hence FA with a lower
calcium content displayed higher compressive strength and vice versa. Table 5.3 shows an
approximate summary of the required curing times and temperatures for each FA to display a
compressive strength of 5000 psi (34.5 MPa) or higher. For example, curing at 86 to 185o F (30
to 85° C) for 24 to 48 hours produced the highest compressive strengths, ranging from 4795 to
5925 psi (33.1 to 40.9 MPa), for M37 mixtures which were synthesized using FA37 that had the
highest calcium content (Fig. 5.4), while for M26 mixtures which were synthesized using a FA
that had 30% lower calcium content than that used for M37 mixtures, curing at 131 to 185o F (55
to 85° C) for 24 to 48 hours produced the highest compressive strengths ranging from 5090 to
6520 psi (34.5 to 45.5 MPa).
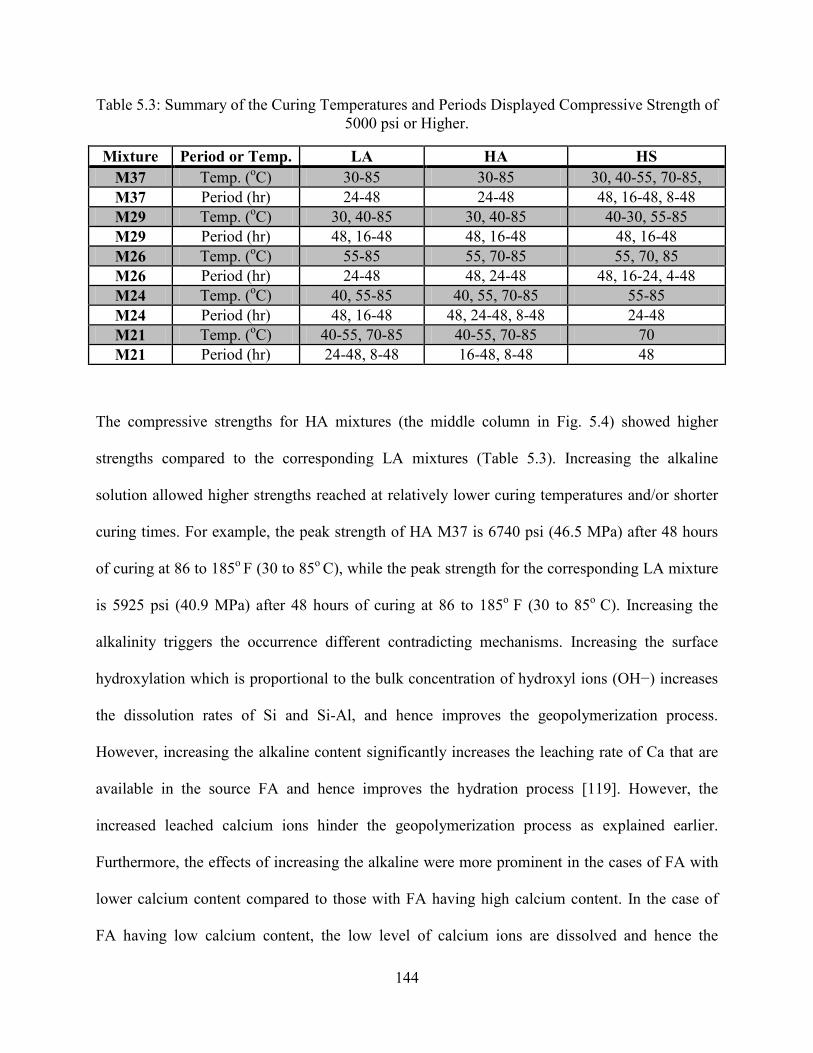
144
Table 5.3: Summary of the Curing Temperatures and Periods Displayed Compressive Strength of 5000 psi or Higher.
Mixture Period or Temp. LA HA HS M37 Temp. (oC) 30-85 30-85 30, 40-55, 70-85, M37 Period (hr) 24-48 24-48 48, 16-48, 8-48 M29 Temp. (oC) 30, 40-85 30, 40-85 40-30, 55-85 M29 Period (hr) 48, 16-48 48, 16-48 48, 16-48 M26 Temp. (oC) 55-85 55, 70-85 55, 70, 85 M26 Period (hr) 24-48 48, 24-48 48, 16-24, 4-48 M24 Temp. (oC) 40, 55-85 40, 55, 70-85 55-85 M24 Period (hr) 48, 16-48 48, 24-48, 8-48 24-48 M21 Temp. (oC) 40-55, 70-85 40-55, 70-85 70 M21 Period (hr) 24-48, 8-48 16-48, 8-48 48
The compressive strengths for HA mixtures (the middle column in Fig. 5.4) showed higher
strengths compared to the corresponding LA mixtures (Table 5.3). Increasing the alkaline
solution allowed higher strengths reached at relatively lower curing temperatures and/or shorter
curing times. For example, the peak strength of HA M37 is 6740 psi (46.5 MPa) after 48 hours
of curing at 86 to 185o F (30 to 85o C), while the peak strength for the corresponding LA mixture
is 5925 psi (40.9 MPa) after 48 hours of curing at 86 to 185o F (30 to 85o C). Increasing the
alkalinity triggers the occurrence different contradicting mechanisms. Increasing the surface
hydroxylation which is proportional to the bulk concentration of hydroxyl ions (OH−) increases
the dissolution rates of Si and Si-Al, and hence improves the geopolymerization process.
However, increasing the alkaline content significantly increases the leaching rate of Ca that are
available in the source FA and hence improves the hydration process [119]. However, the
increased leached calcium ions hinder the geopolymerization process as explained earlier.
Furthermore, the effects of increasing the alkaline were more prominent in the cases of FA with
lower calcium content compared to those with FA having high calcium content. In the case of
FA having low calcium content, the low level of calcium ions are dissolved and hence the
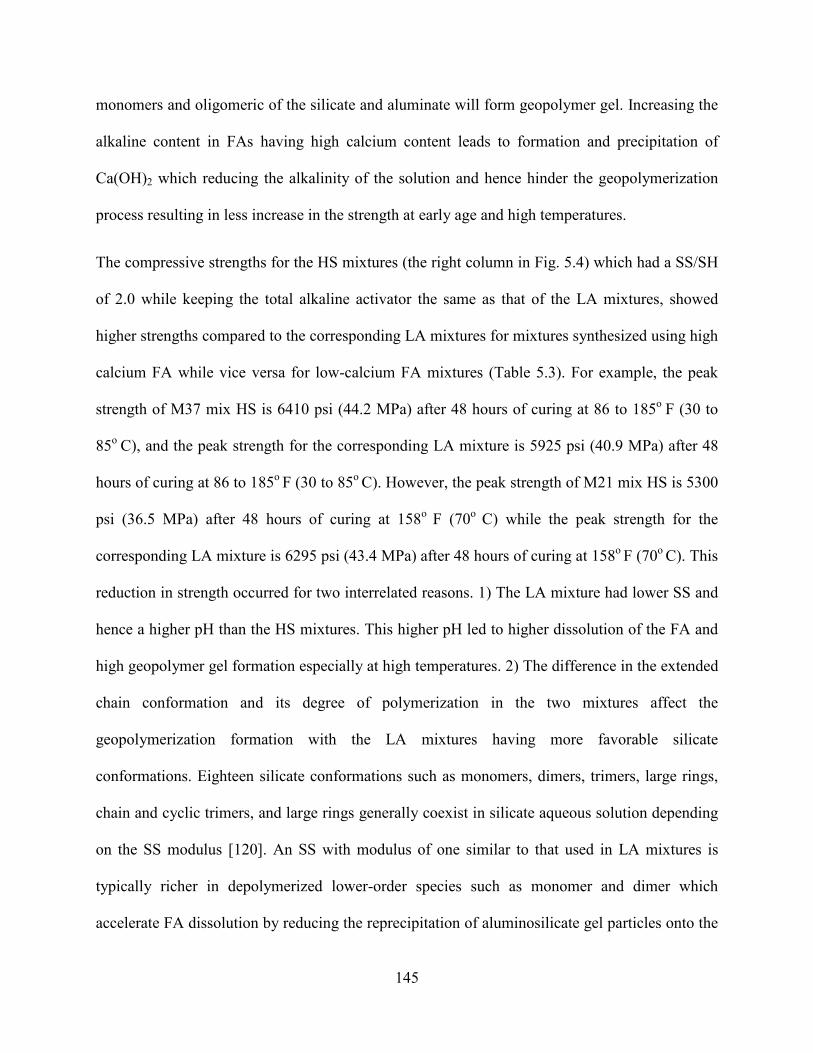
145
monomers and oligomeric of the silicate and aluminate will form geopolymer gel. Increasing the
alkaline content in FAs having high calcium content leads to formation and precipitation of
Ca(OH)2 which reducing the alkalinity of the solution and hence hinder the geopolymerization
process resulting in less increase in the strength at early age and high temperatures.
The compressive strengths for the HS mixtures (the right column in Fig. 5.4) which had a SS/SH
of 2.0 while keeping the total alkaline activator the same as that of the LA mixtures, showed
higher strengths compared to the corresponding LA mixtures for mixtures synthesized using high
calcium FA while vice versa for low-calcium FA mixtures (Table 5.3). For example, the peak
strength of M37 mix HS is 6410 psi (44.2 MPa) after 48 hours of curing at 86 to 185o F (30 to
85o C), and the peak strength for the corresponding LA mixture is 5925 psi (40.9 MPa) after 48
hours of curing at 86 to 185o F (30 to 85o C). However, the peak strength of M21 mix HS is 5300
psi (36.5 MPa) after 48 hours of curing at 158o F (70o C) while the peak strength for the
corresponding LA mixture is 6295 psi (43.4 MPa) after 48 hours of curing at 158o F (70o C). This
reduction in strength occurred for two interrelated reasons. 1) The LA mixture had lower SS and
hence a higher pH than the HS mixtures. This higher pH led to higher dissolution of the FA and
high geopolymer gel formation especially at high temperatures. 2) The difference in the extended
chain conformation and its degree of polymerization in the two mixtures affect the
geopolymerization formation with the LA mixtures having more favorable silicate
conformations. Eighteen silicate conformations such as monomers, dimers, trimers, large rings,
chain and cyclic trimers, and large rings generally coexist in silicate aqueous solution depending
on the SS modulus [120]. An SS with modulus of one similar to that used in LA mixtures is
typically richer in depolymerized lower-order species such as monomer and dimer which
accelerate FA dissolution by reducing the reprecipitation of aluminosilicate gel particles onto the
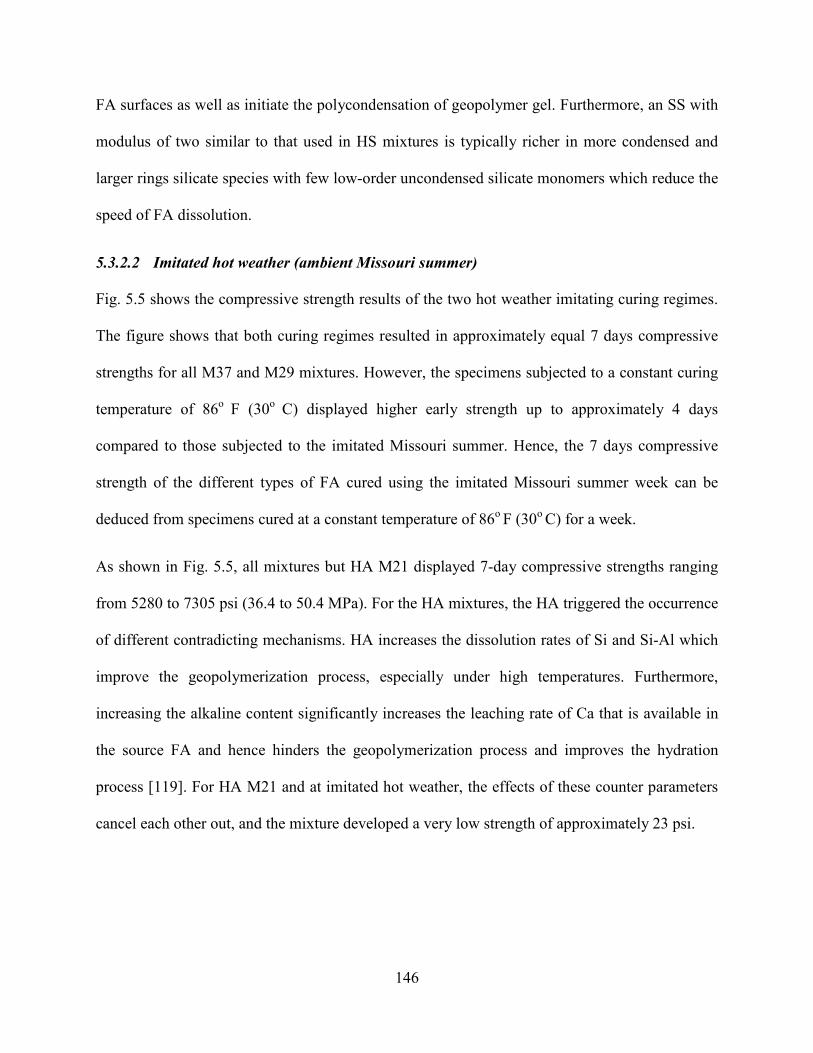
146
FA surfaces as well as initiate the polycondensation of geopolymer gel. Furthermore, an SS with
modulus of two similar to that used in HS mixtures is typically richer in more condensed and
larger rings silicate species with few low-order uncondensed silicate monomers which reduce the
speed of FA dissolution.
5.3.2.2 Imitated hot weather (ambient Missouri summer)
Fig. 5.5 shows the compressive strength results of the two hot weather imitating curing regimes.
The figure shows that both curing regimes resulted in approximately equal 7 days compressive
strengths for all M37 and M29 mixtures. However, the specimens subjected to a constant curing
temperature of 86o F (30o C) displayed higher early strength up to approximately 4 days
compared to those subjected to the imitated Missouri summer. Hence, the 7 days compressive
strength of the different types of FA cured using the imitated Missouri summer week can be
deduced from specimens cured at a constant temperature of 86o F (30o C) for a week.
As shown in Fig. 5.5, all mixtures but HA M21 displayed 7-day compressive strengths ranging
from 5280 to 7305 psi (36.4 to 50.4 MPa). For the HA mixtures, the HA triggered the occurrence
of different contradicting mechanisms. HA increases the dissolution rates of Si and Si-Al which
improve the geopolymerization process, especially under high temperatures. Furthermore,
increasing the alkaline content significantly increases the leaching rate of Ca that is available in
the source FA and hence hinders the geopolymerization process and improves the hydration
process [119]. For HA M21 and at imitated hot weather, the effects of these counter parameters
cancel each other out, and the mixture developed a very low strength of approximately 23 psi.
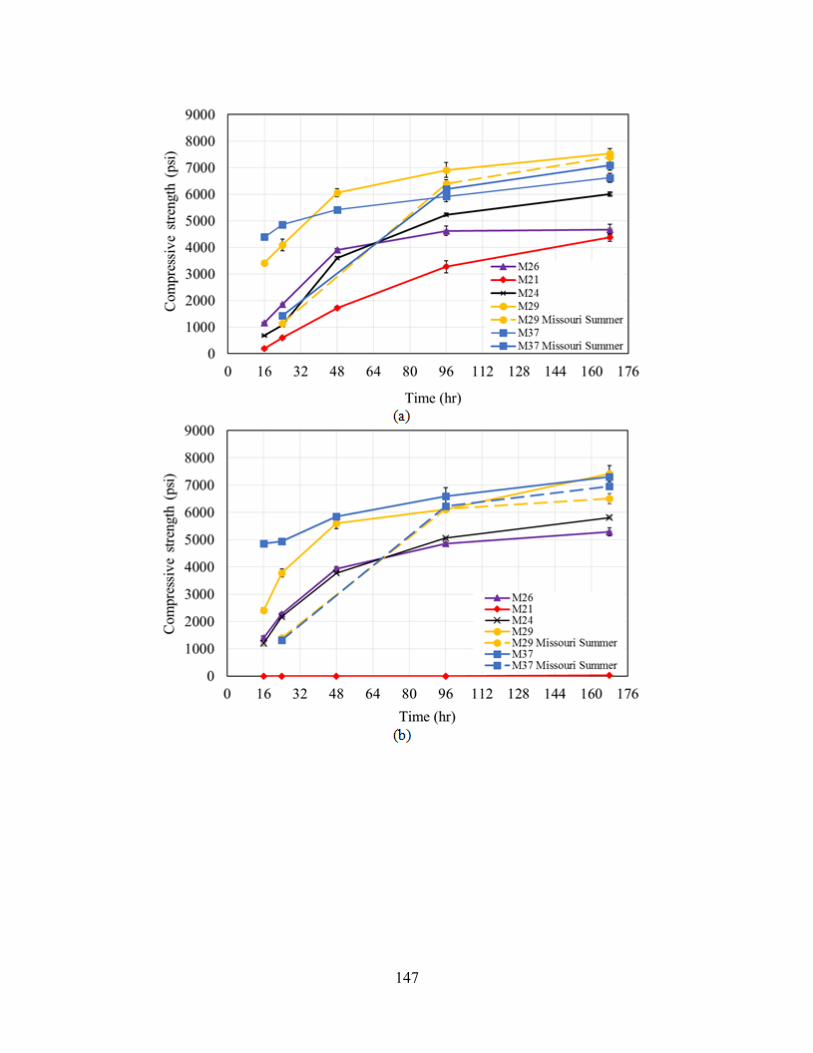
147
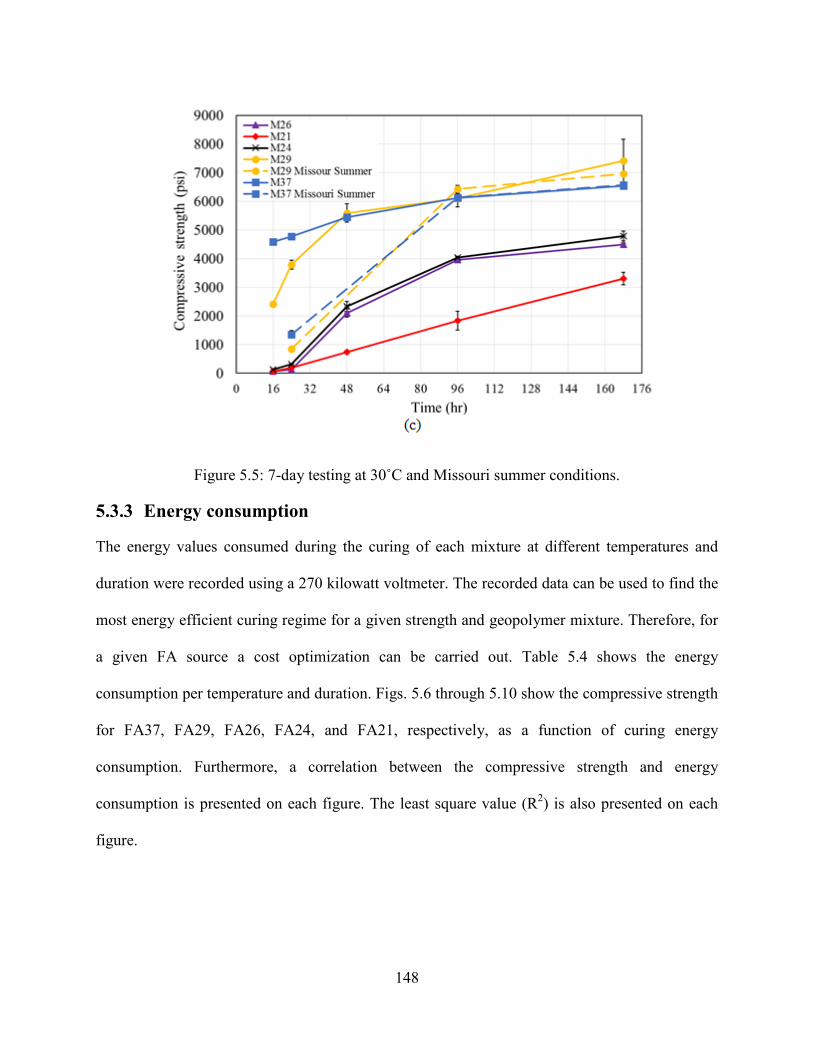
148
Figure 5.5: 7-day testing at 30˚C and Missouri summer conditions.
5.3.3 Energy consumption
The energy values consumed during the curing of each mixture at different temperatures and
duration were recorded using a 270 kilowatt voltmeter. The recorded data can be used to find the
most energy efficient curing regime for a given strength and geopolymer mixture. Therefore, for
a given FA source a cost optimization can be carried out. Table 5.4 shows the energy
consumption per temperature and duration. Figs. 5.6 through 5.10 show the compressive strength
for FA37, FA29, FA26, FA24, and FA21, respectively, as a function of curing energy
consumption. Furthermore, a correlation between the compressive strength and energy
consumption is presented on each figure. The least square value (R2) is also presented on each
figure.
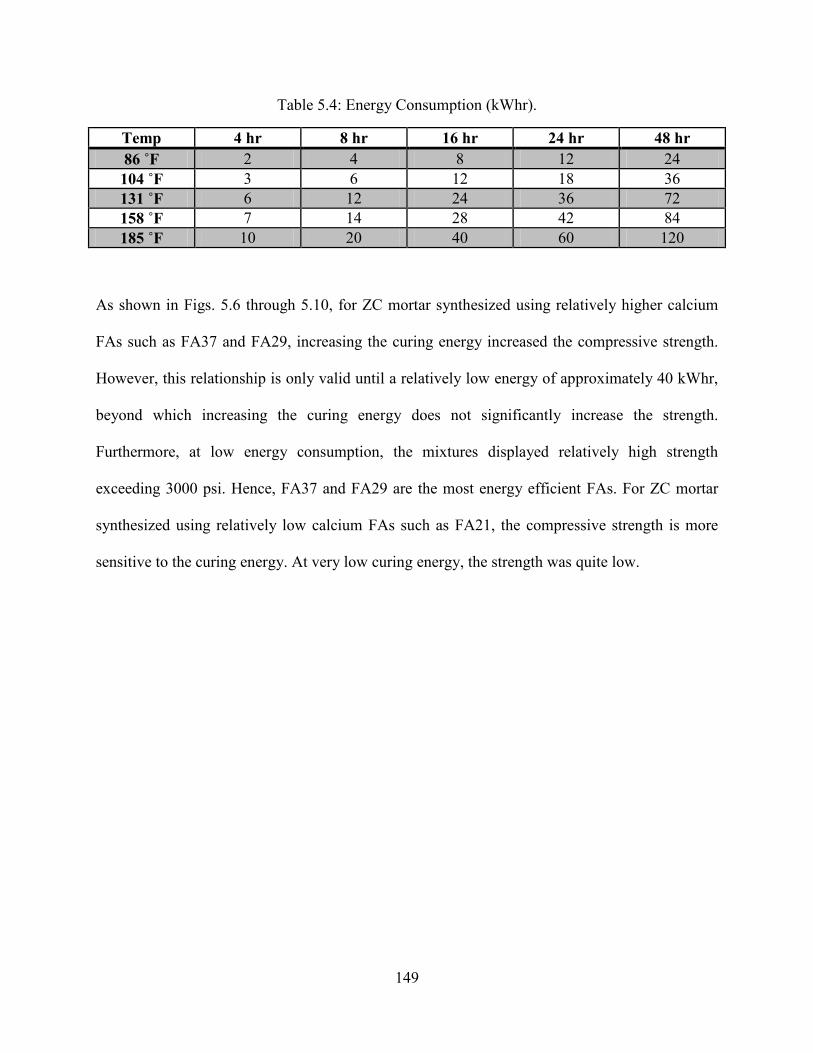
149
Table 5.4: Energy Consumption (kWhr).
Temp 4 hr 8 hr 16 hr 24 hr 48 hr 86 ˚F 2 4 8 12 24 104 ˚F 3 6 12 18 36 131 ˚F 6 12 24 36 72 158 ˚F 7 14 28 42 84 185 ˚F 10 20 40 60 120
As shown in Figs. 5.6 through 5.10, for ZC mortar synthesized using relatively higher calcium
FAs such as FA37 and FA29, increasing the curing energy increased the compressive strength.
However, this relationship is only valid until a relatively low energy of approximately 40 kWhr,
beyond which increasing the curing energy does not significantly increase the strength.
Furthermore, at low energy consumption, the mixtures displayed relatively high strength
exceeding 3000 psi. Hence, FA37 and FA29 are the most energy efficient FAs. For ZC mortar
synthesized using relatively low calcium FAs such as FA21, the compressive strength is more
sensitive to the curing energy. At very low curing energy, the strength was quite low.
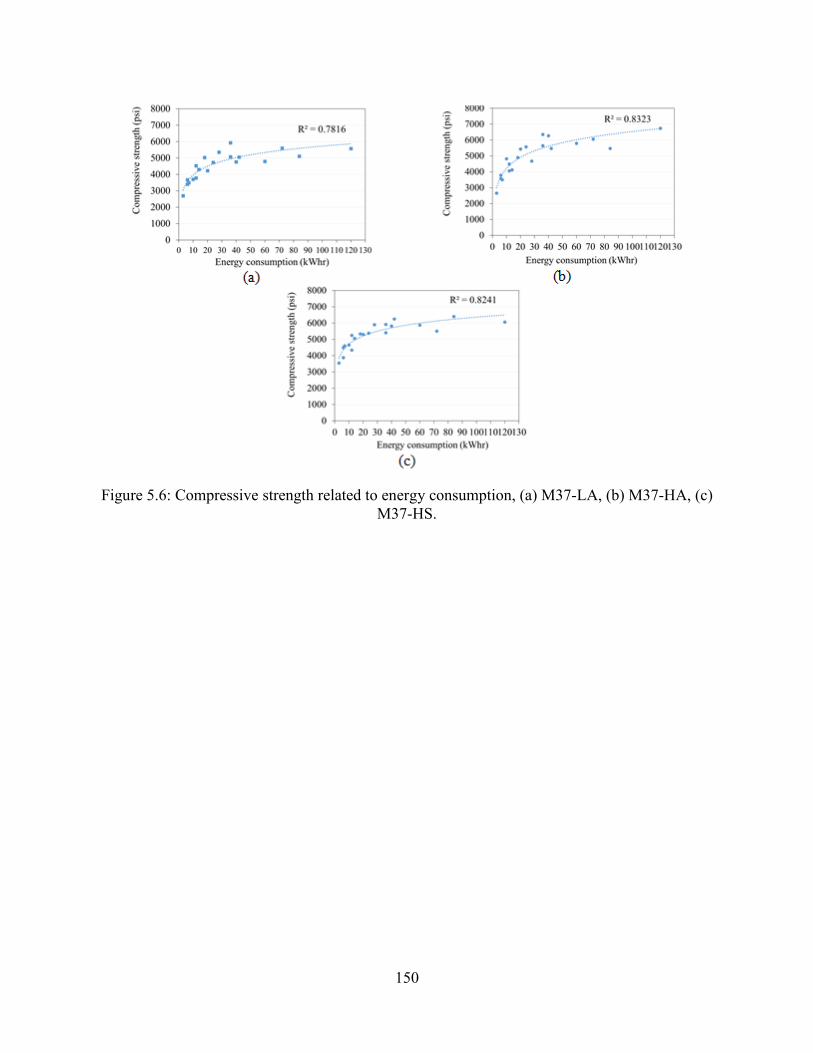
150
Figure 5.6: Compressive strength related to energy consumption, (a) M37-LA, (b) M37-HA, (c) M37-HS.
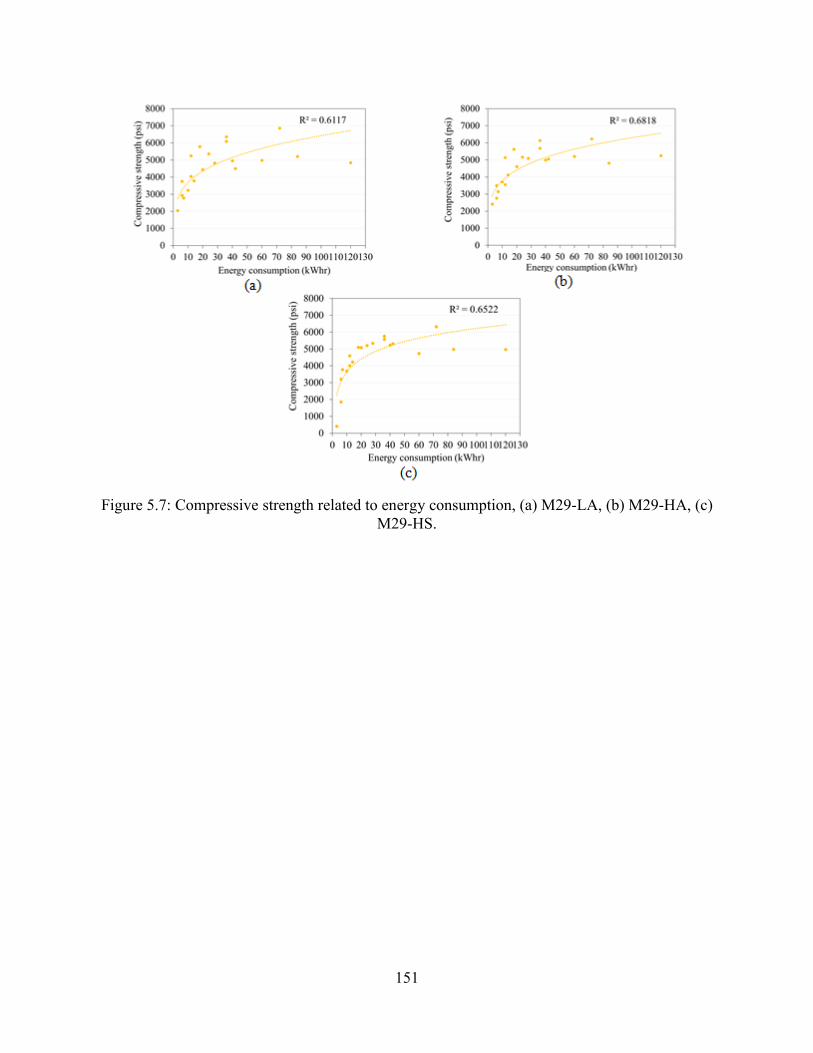
151
Figure 5.7: Compressive strength related to energy consumption, (a) M29-LA, (b) M29-HA, (c) M29-HS.
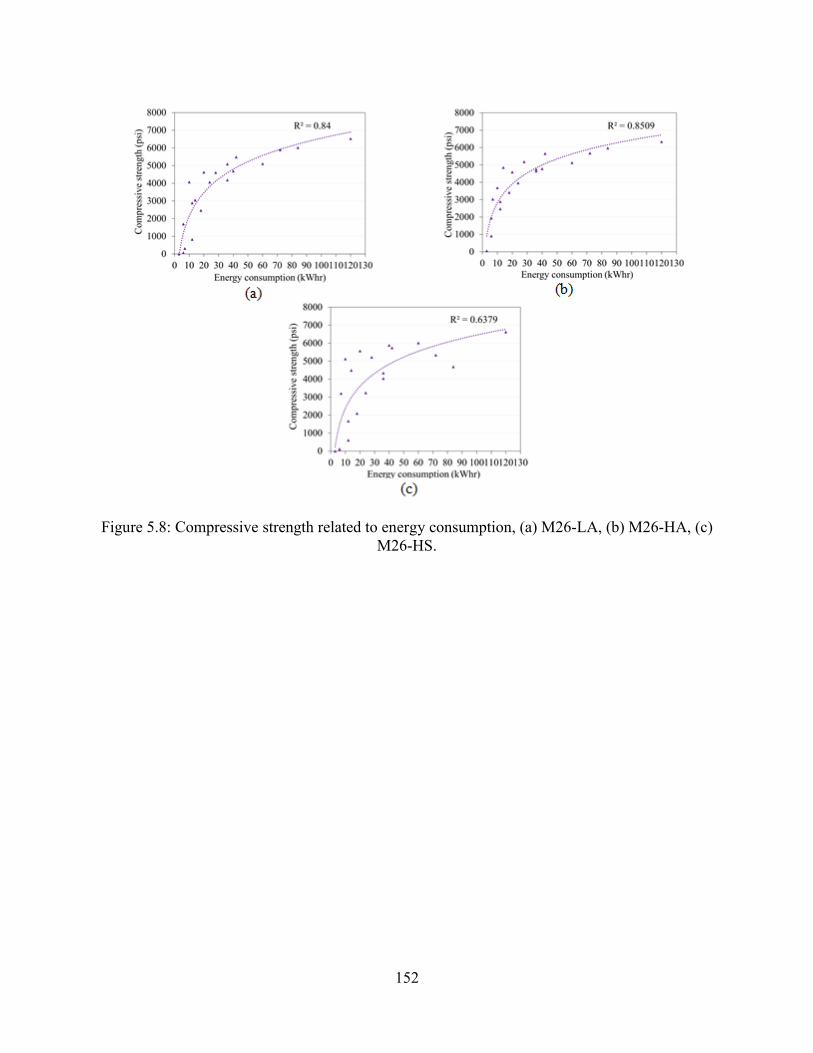
152
Figure 5.8: Compressive strength related to energy consumption, (a) M26-LA, (b) M26-HA, (c) M26-HS.
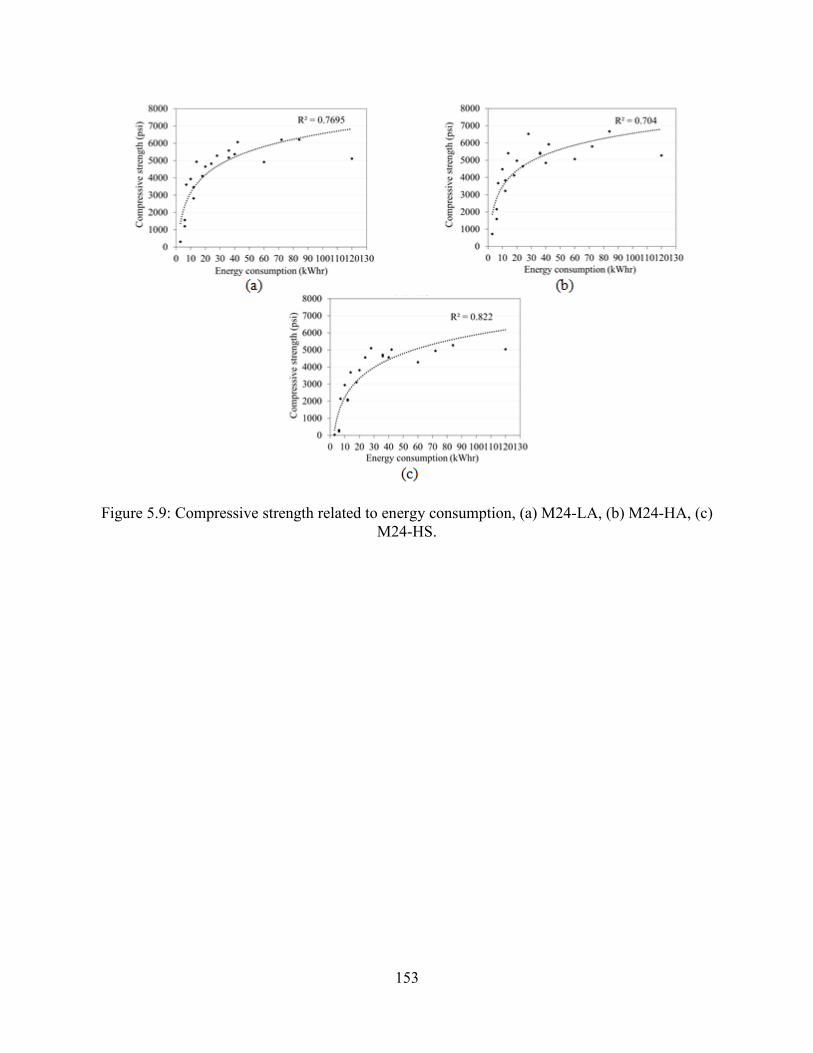
153
Figure 5.9: Compressive strength related to energy consumption, (a) M24-LA, (b) M24-HA, (c) M24-HS.
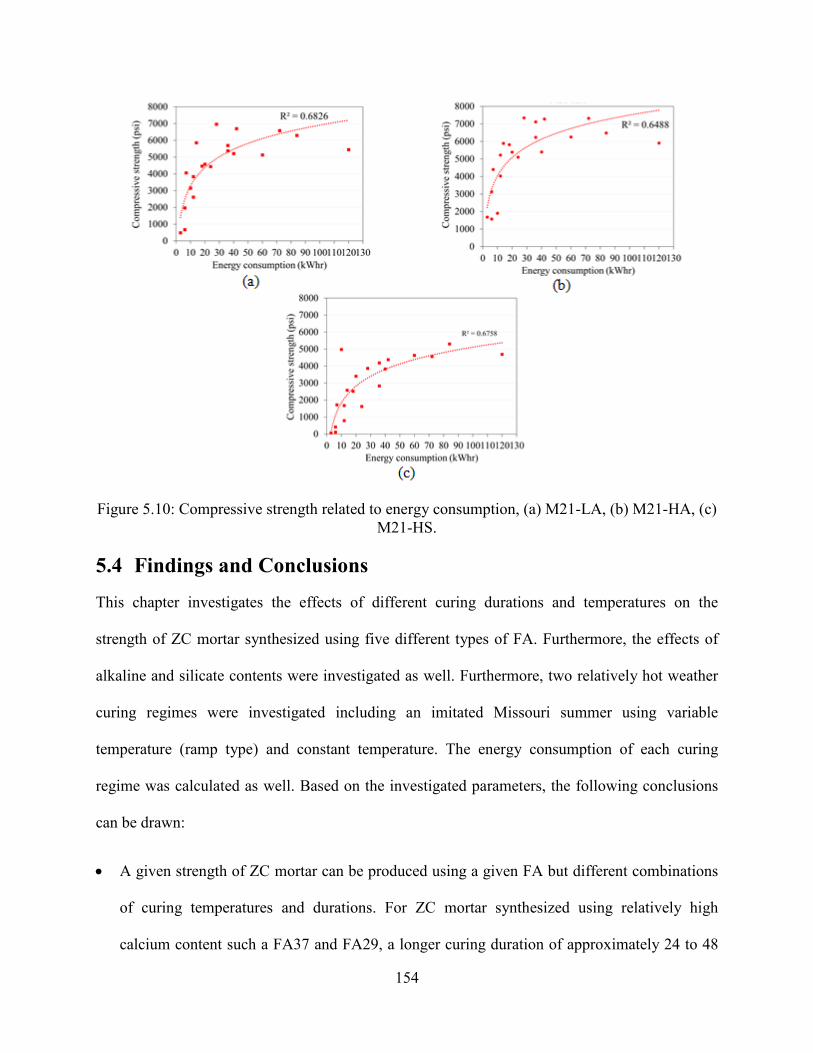
154
Figure 5.10: Compressive strength related to energy consumption, (a) M21-LA, (b) M21-HA, (c) M21-HS.
5.4 Findings and Conclusions This chapter investigates the effects of different curing durations and temperatures on the
strength of ZC mortar synthesized using five different types of FA. Furthermore, the effects of
alkaline and silicate contents were investigated as well. Furthermore, two relatively hot weather
curing regimes were investigated including an imitated Missouri summer using variable
temperature (ramp type) and constant temperature. The energy consumption of each curing
regime was calculated as well. Based on the investigated parameters, the following conclusions
can be drawn:
• A given strength of ZC mortar can be produced using a given FA but different combinations
of curing temperatures and durations. For ZC mortar synthesized using relatively high
calcium content such a FA37 and FA29, a longer curing duration of approximately 24 to 48

155
hours is required in combination with curing temperatures of 86 to 185o F (30o C to 85o C) to
achieve compressive strengths ranging from 3785 to 6740 psi (26.1 to 46.5 MPa). For ZC
mortar synthesized using relatively lower calcium content such as FA21, a short curing
duration of 16 hours is required in combination with a curing temperature of 158 to 185o F
(70 to 85o C) to achieve a compressive strength ranging from 3825 to 7350 psi (26.4 to 50.7
MPa).
• Hot weather curing at 86o F (30o C) for 7 days (168 hours) or imitated Missouri summer week
curing regimes were able to produce 7 days compressive strength ranging from
approximately 3310 to 7530 psi (22.8 to 51.9 MPa) depending on the FA source and mixture
used. Specimens prepared using FA37 and FA29, which had relatively higher calcium
contents, showed the highest strengths at the hot weather curing indicating prominent
hydration mechanisms.
• There was no significant difference in the 7-day compressive strength of specimens that were
cured in a controlled environment at 86o F (30o C) and those cured at the imitated Missouri
summer week where the curing temperature consisted of ramp up temperature from 72o F
(22o C) to 97o F (36o C) over 12 hours followed by ramp down temperature from 97o F (36o C)
to 72o F (22o C) over 12 hours. Hence, the variation in the temperature over nights in
Missouri summer should not affect the strength of ZCC.
• There is a strong correlation between curing energy consumption and compressive strength.
For a given mixture and sourced FA, there is an optimum amount of curing energy beyond
which increasing the curing energy is not cost effective.

156
Chapter 6: Mechanical Properties and Drying Shrinkage of Zero-Cement Concrete
The mechanical properties of the optimized ZCC are presented in this chapter. The mixtures
were subjected to three different curing regimes including oven, ambient, and moist curing.
Then, the mechanical properties including the compressive strength, splitting tensile strength,
modulus of rupture (flexural strength), and modulus of elasticity were investigated. As was
concluded from Chapter 3, the best mixing procedure was no. 8, and it was used in this chapter.
MoDOT Portland cement mixture B1, having a 28 day compressive strength of 5000 psi, was
also investigated as a reference mixture.
6.1 Experimental Details
6.1.1 Materials
The five sourced FAs, FA37, FA29, FA26, FA24, and FA21, out of the second batch as
discussed in Chapter 2 were used to prepare the ZCC mixtures presented in this chapter.
6.1.2 Packing density test
In order to optimize and maximize the compactness of the ratio between the coarse and fine
aggregates that were used in the concrete mixtures, a gyratory compaction (Fig. 6.1) test was
carried out. The gyratory compaction technique consists of a cylindrical mold with the
simultaneous action (force) of a vertical axial static pressure and a shear force resulting from the
rotation of the mold on its inclined axis. Many trials were carried out to optimize the suitable
pressure to make sure that the aggregate will not be crushed under the loading pressure and the
particle size distribution of the aggregates did not change. Finally, a pressure of 1.50 bar was
selected to be applied to the material. The machine cylindrical mold height was 4 in. The gyrator
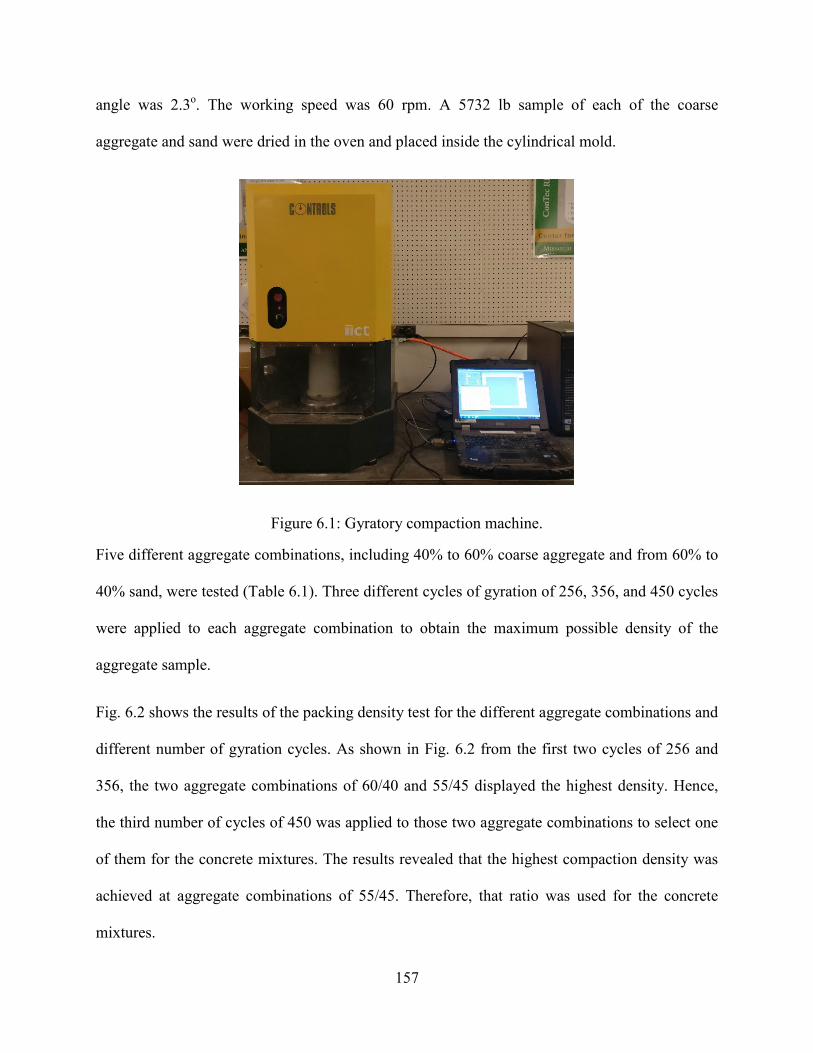
157
angle was 2.3o. The working speed was 60 rpm. A 5732 lb sample of each of the coarse
aggregate and sand were dried in the oven and placed inside the cylindrical mold.
Figure 6.1: Gyratory compaction machine.
Five different aggregate combinations, including 40% to 60% coarse aggregate and from 60% to
40% sand, were tested (Table 6.1). Three different cycles of gyration of 256, 356, and 450 cycles
were applied to each aggregate combination to obtain the maximum possible density of the
aggregate sample.
Fig. 6.2 shows the results of the packing density test for the different aggregate combinations and
different number of gyration cycles. As shown in Fig. 6.2 from the first two cycles of 256 and
356, the two aggregate combinations of 60/40 and 55/45 displayed the highest density. Hence,
the third number of cycles of 450 was applied to those two aggregate combinations to select one
of them for the concrete mixtures. The results revealed that the highest compaction density was
achieved at aggregate combinations of 55/45. Therefore, that ratio was used for the concrete
mixtures.

158
Table 6.1: Gyratory Compaction Test Results.
Trial No.
Coarse agg.
(percentage)
Sand (percen
tage)
Coarse agg.
(weight in lb)
Sand (weight in lb)
256 cycles (density in
lb/ft3)
356 cycles (density in
lb/ft3)
450 cycles (density in
lb/ft3)
1 40 60 2.29 3.44 122.0 124.3 - 2 45 55 2.58 3.15 126.9 125.2 - 3 50 50 2.87 2.87 125.0 127.2 - 4 55 45 3.15 2.58 126.2 128.2 129.4 5 60 40 3.44 2.29 127.4 128.2 128.8
Figure 6.2: Packing density results.
6.1.3 Specimen preparation
The optimum Alk/FA, and SS/SH in ZCC were 0.30 and 1.0 as presented in Chapter 4,
respectively, and they were used in the mixture investigated throughout this chapter. One
mixture for each FA was prepared (Table 6.2) and their mechanical properties were determined
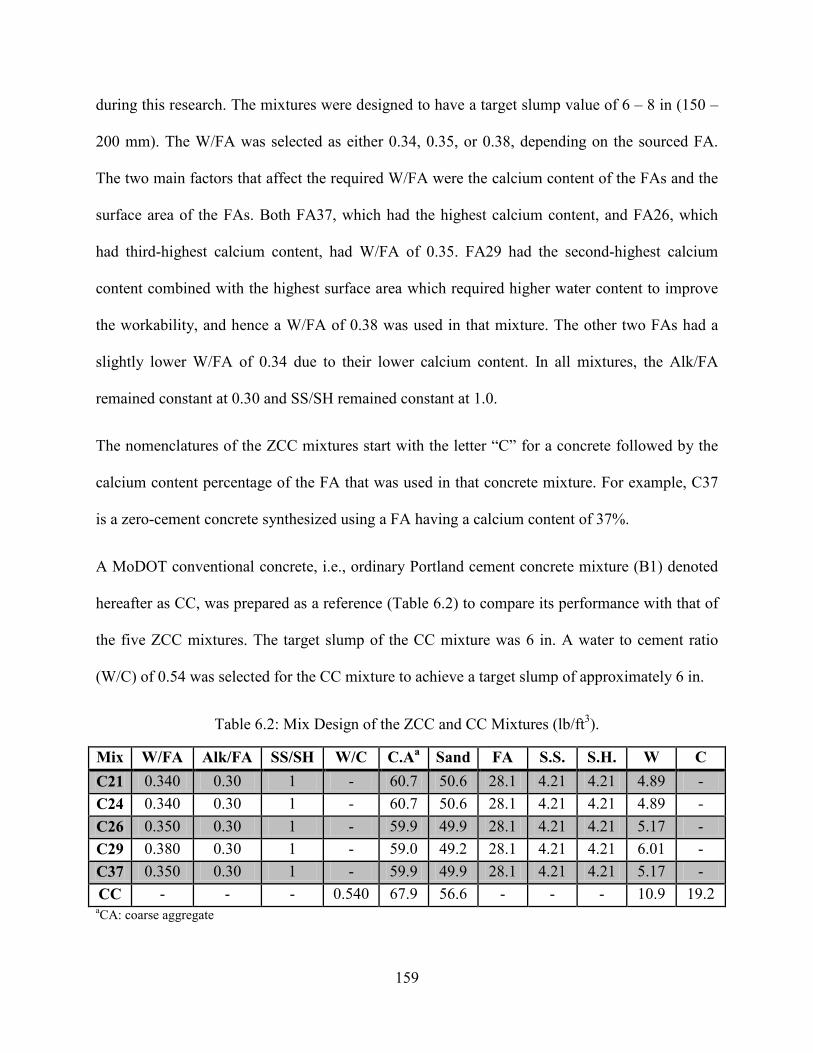
159
during this research. The mixtures were designed to have a target slump value of 6 – 8 in (150 –
200 mm). The W/FA was selected as either 0.34, 0.35, or 0.38, depending on the sourced FA.
The two main factors that affect the required W/FA were the calcium content of the FAs and the
surface area of the FAs. Both FA37, which had the highest calcium content, and FA26, which
had third-highest calcium content, had W/FA of 0.35. FA29 had the second-highest calcium
content combined with the highest surface area which required higher water content to improve
the workability, and hence a W/FA of 0.38 was used in that mixture. The other two FAs had a
slightly lower W/FA of 0.34 due to their lower calcium content. In all mixtures, the Alk/FA
remained constant at 0.30 and SS/SH remained constant at 1.0.
The nomenclatures of the ZCC mixtures start with the letter “C” for a concrete followed by the
calcium content percentage of the FA that was used in that concrete mixture. For example, C37
is a zero-cement concrete synthesized using a FA having a calcium content of 37%.
A MoDOT conventional concrete, i.e., ordinary Portland cement concrete mixture (B1) denoted
hereafter as CC, was prepared as a reference (Table 6.2) to compare its performance with that of
the five ZCC mixtures. The target slump of the CC mixture was 6 in. A water to cement ratio
(W/C) of 0.54 was selected for the CC mixture to achieve a target slump of approximately 6 in.
Table 6.2: Mix Design of the ZCC and CC Mixtures (lb/ft3).
Mix W/FA Alk/FA SS/SH W/C C.Aa Sand FA S.S. S.H. W C
C21 0.340 0.30 1 - 60.7 50.6 28.1 4.21 4.21 4.89 - C24 0.340 0.30 1 - 60.7 50.6 28.1 4.21 4.21 4.89 - C26 0.350 0.30 1 - 59.9 49.9 28.1 4.21 4.21 5.17 - C29 0.380 0.30 1 - 59.0 49.2 28.1 4.21 4.21 6.01 - C37 0.350 0.30 1 - 59.9 49.9 28.1 4.21 4.21 5.17 - CC - - - 0.540 67.9 56.6 - - - 10.9 19.2
aCA: coarse aggregate
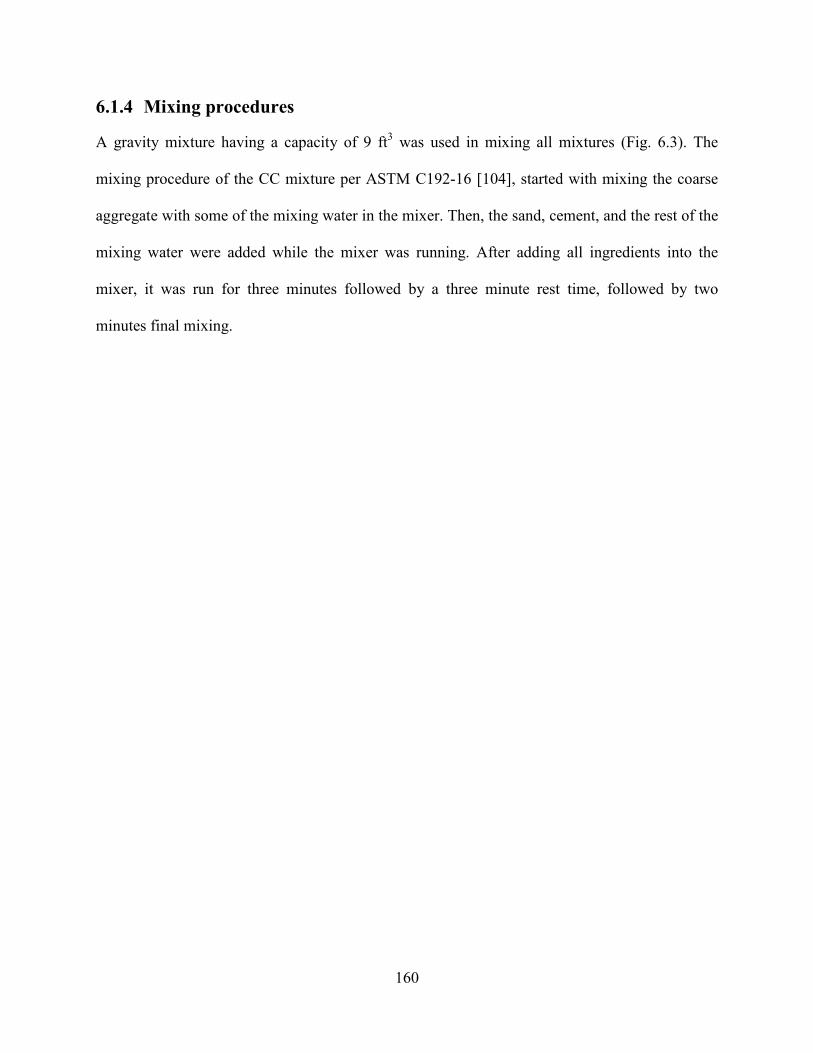
160
6.1.4 Mixing procedures
A gravity mixture having a capacity of 9 ft3 was used in mixing all mixtures (Fig. 6.3). The
mixing procedure of the CC mixture per ASTM C192-16 [104], started with mixing the coarse
aggregate with some of the mixing water in the mixer. Then, the sand, cement, and the rest of the
mixing water were added while the mixer was running. After adding all ingredients into the
mixer, it was run for three minutes followed by a three minute rest time, followed by two
minutes final mixing.
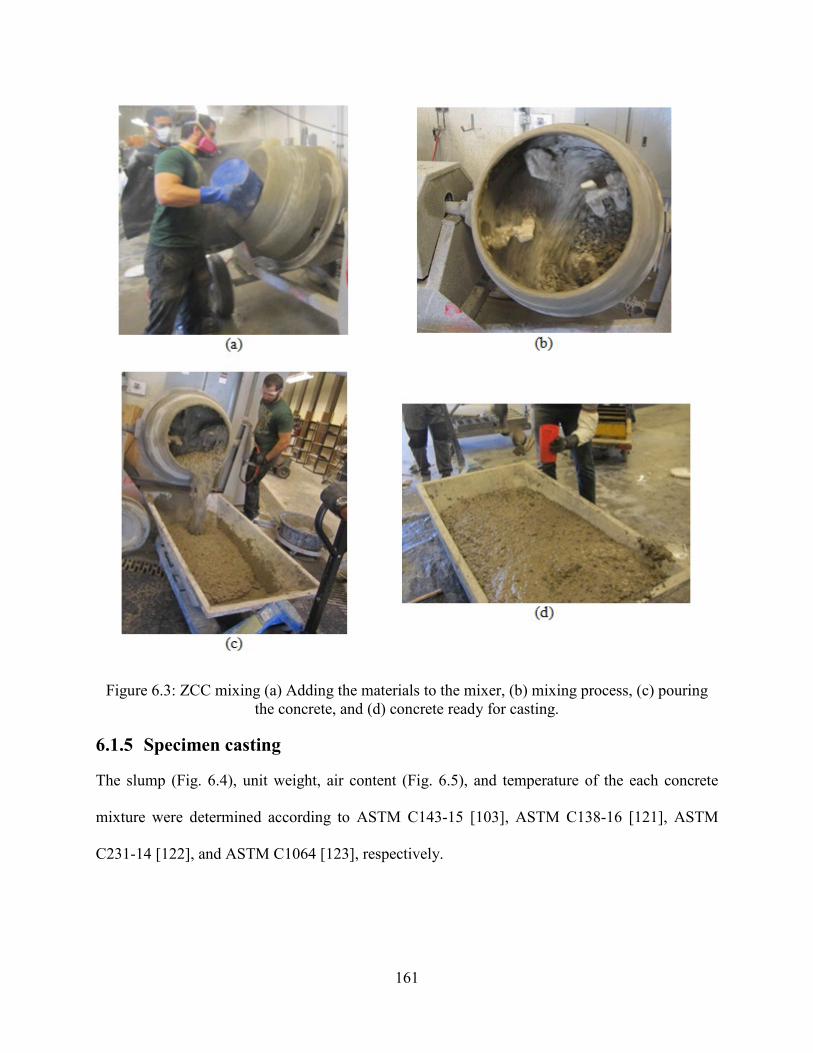
161
Figure 6.3: ZCC mixing (a) Adding the materials to the mixer, (b) mixing process, (c) pouring the concrete, and (d) concrete ready for casting.
6.1.5 Specimen casting
The slump (Fig. 6.4), unit weight, air content (Fig. 6.5), and temperature of the each concrete
mixture were determined according to ASTM C143-15 [103], ASTM C138-16 [121], ASTM
C231-14 [122], and ASTM C1064 [123], respectively.
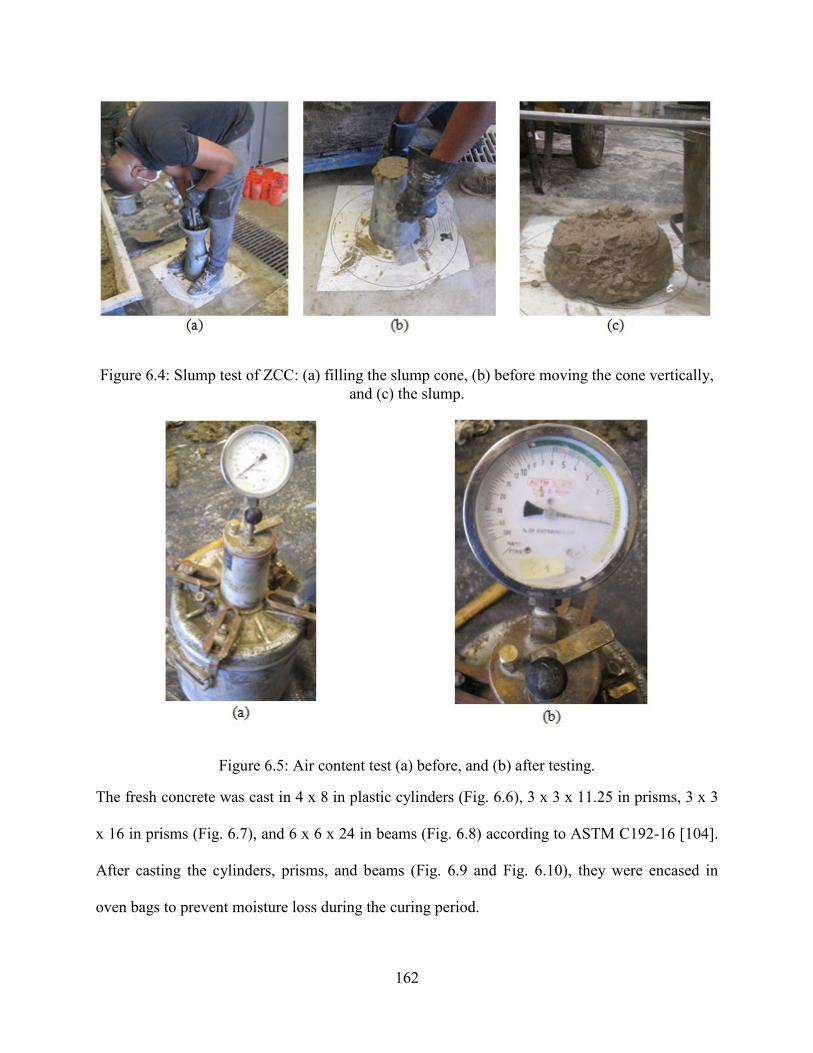
162
Figure 6.4: Slump test of ZCC: (a) filling the slump cone, (b) before moving the cone vertically, and (c) the slump.
Figure 6.5: Air content test (a) before, and (b) after testing.
The fresh concrete was cast in 4 x 8 in plastic cylinders (Fig. 6.6), 3 x 3 x 11.25 in prisms, 3 x 3
x 16 in prisms (Fig. 6.7), and 6 x 6 x 24 in beams (Fig. 6.8) according to ASTM C192-16 [104].
After casting the cylinders, prisms, and beams (Fig. 6.9 and Fig. 6.10), they were encased in
oven bags to prevent moisture loss during the curing period.
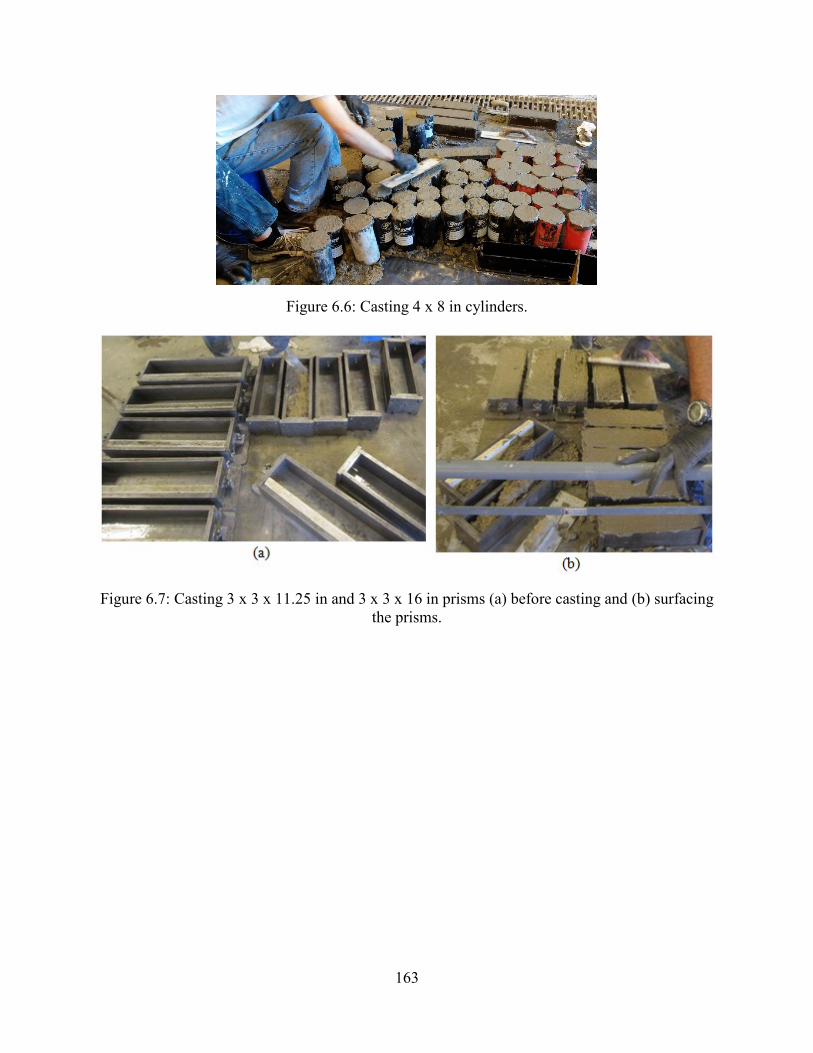
163
Figure 6.6: Casting 4 x 8 in cylinders.
Figure 6.7: Casting 3 x 3 x 11.25 in and 3 x 3 x 16 in prisms (a) before casting and (b) surfacing the prisms.
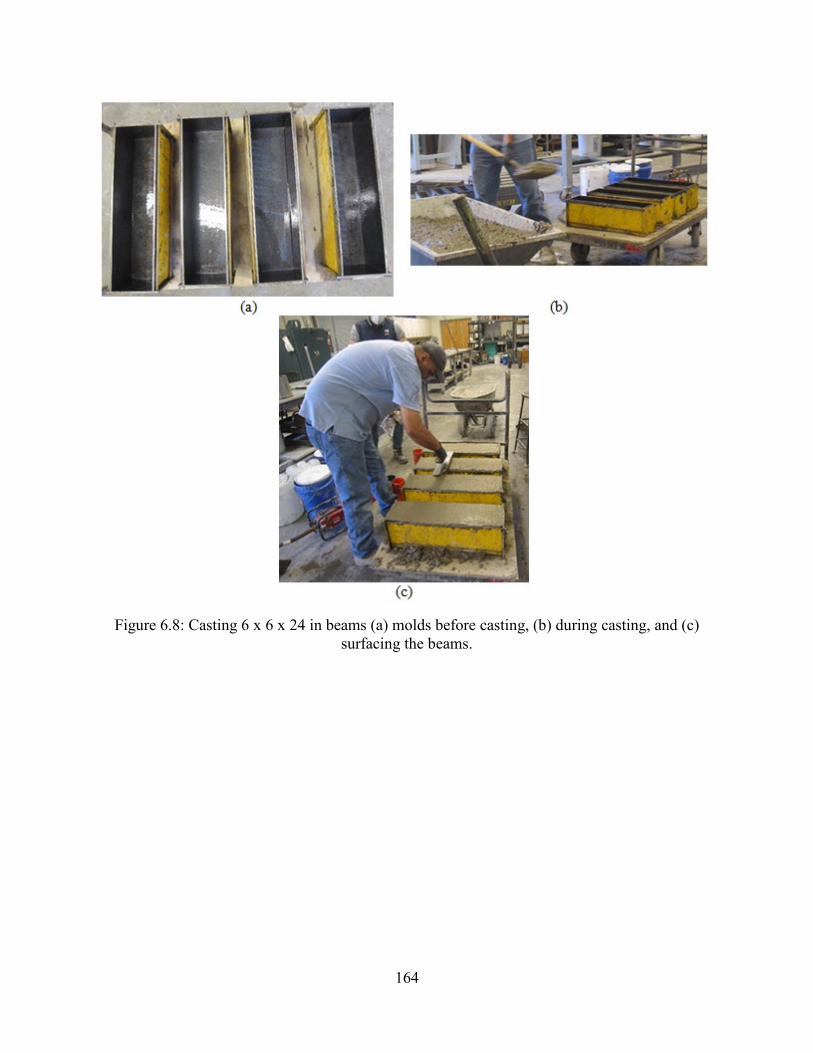
164
Figure 6.8: Casting 6 x 6 x 24 in beams (a) molds before casting, (b) during casting, and (c) surfacing the beams.
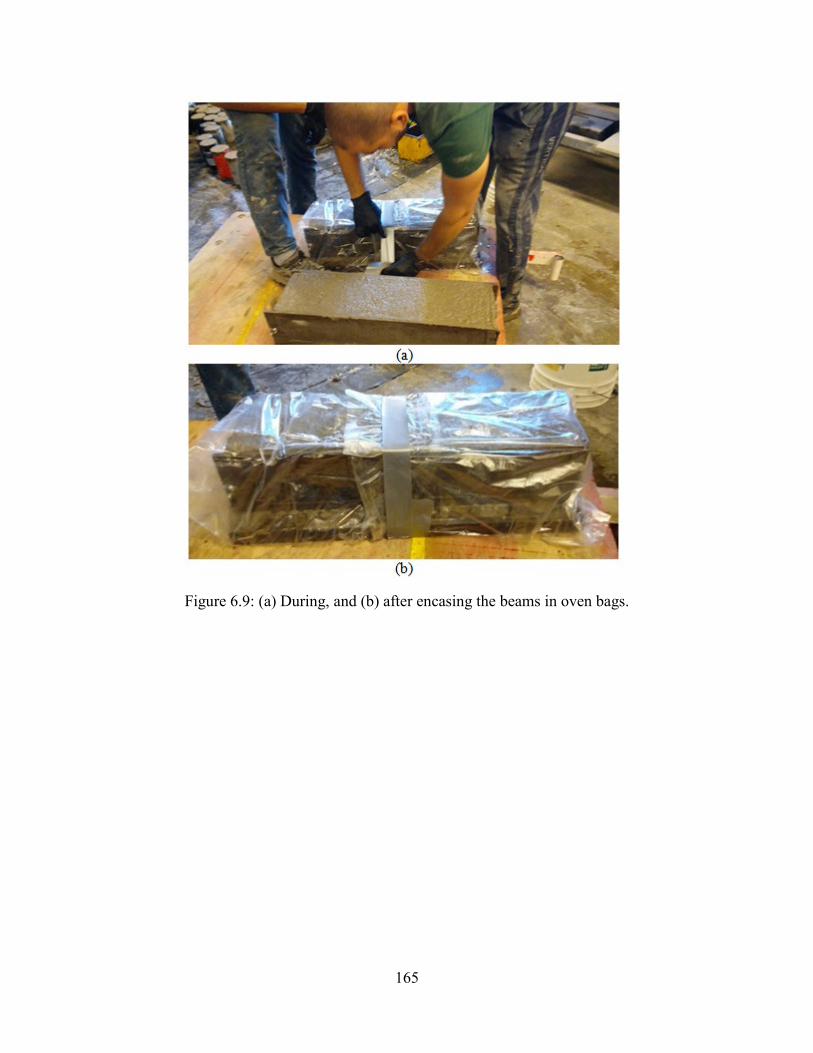
165
Figure 6.9: (a) During, and (b) after encasing the beams in oven bags.
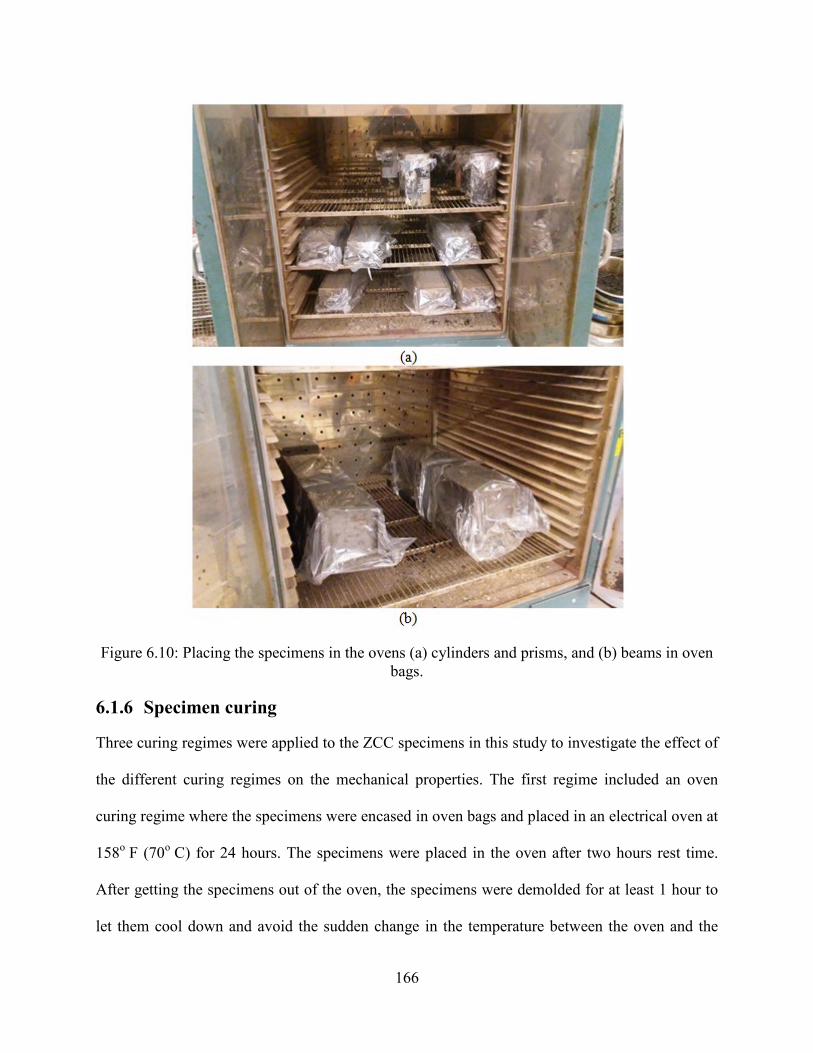
166
Figure 6.10: Placing the specimens in the ovens (a) cylinders and prisms, and (b) beams in oven bags.
6.1.6 Specimen curing
Three curing regimes were applied to the ZCC specimens in this study to investigate the effect of
the different curing regimes on the mechanical properties. The first regime included an oven
curing regime where the specimens were encased in oven bags and placed in an electrical oven at
158o F (70o C) for 24 hours. The specimens were placed in the oven after two hours rest time.
After getting the specimens out of the oven, the specimens were demolded for at least 1 hour to
let them cool down and avoid the sudden change in the temperature between the oven and the
167
ambient temperature. Thereafter the specimens were encased in plastic bags and stored in the
laboratory at a temperature of 73 ± 3o F (23 ± 2o C) until the testing day.
The second curing regime included an ambient curing regime where the specimens were placed
in the laboratory at the room temperature of 73 ± 3o F (23 ± 2o C). After demolding the
specimens, the specimens were encased in sealed plastic bags to prevent the evaporation of the
water until the testing day. The third curing regime included moist curing where the specimens
were placed in the moisture room at a temperature of 73 ± 3o F (23 ± 2° C) and relative humidity
of 95 ± 5% immediately after demolding the specimens until the testing day. The ambient and
moist-cured specimens were demolded at two days from the casting day.
6.1.7 Mechanical properties determination
The concrete cylinders were tested to determine the compressive strength (Fig. 6.11a) per ASTM
C39-17 [124], elastic modulus (Fig. 6.11b) per ASTM C496-11 [125], and splitting tensile
strength (Fig. 6.12) per ASTM C469-14 [126], while the beams were tested to determine the
flexural strength (Fig. 6.13) per ASTM C78-16 [127]. The compressive strengths were
determined at ages of 1, 7, and 28 days for the oven-, ambient-, and moist-cured specimens. The
other properties were determined at ages of 1 and 28 days for oven-cured and ages of 7 and 28
days for moist-cured specimens, including those prepared using the CC mixture.
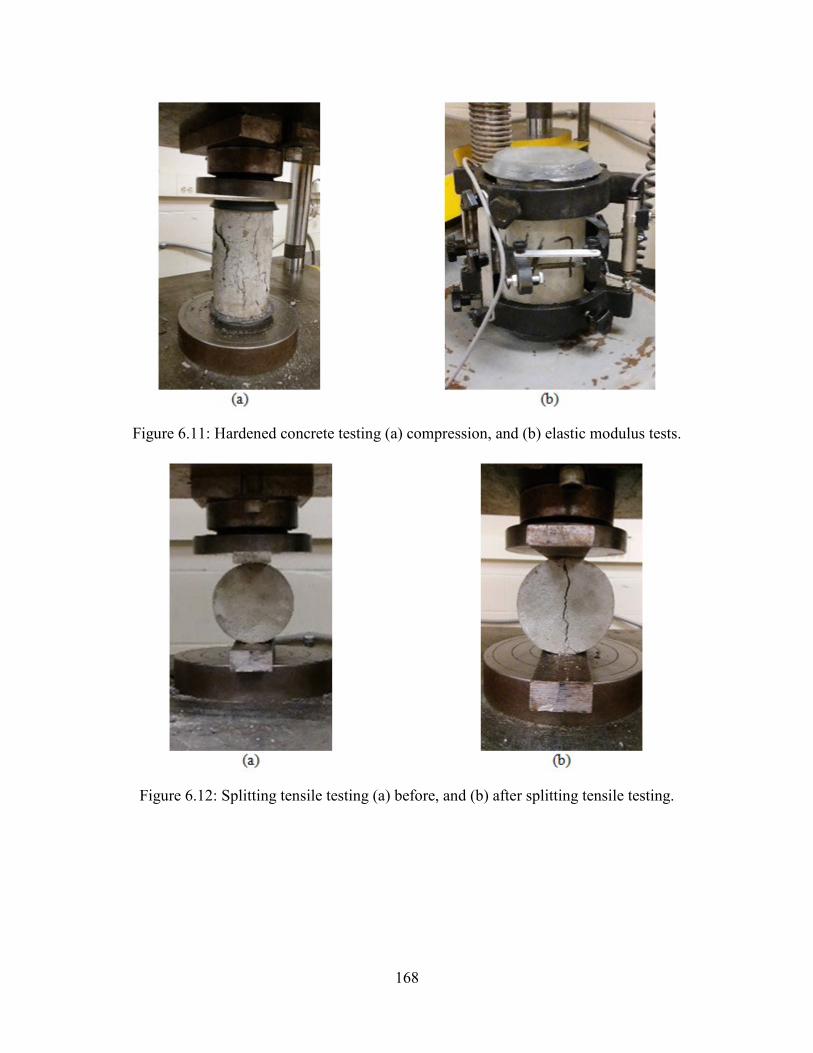
168
Figure 6.11: Hardened concrete testing (a) compression, and (b) elastic modulus tests.
Figure 6.12: Splitting tensile testing (a) before, and (b) after splitting tensile testing.

169
Figure 6.13: Modulus of rupture (flexural) testing (a) before, and (b) after modulus of rupture (flexural) testing.
6.1.8 Drying shrinkage determination
The drying shrinkage tests were carried out on 3 x 3 x 11.25 in concrete prisms per ASTM C157-
17 [128]. The specimens were demolded at the ages of 24 hours and two days for the oven- and
ambient-cured, respectively. Then, the prisms were placed in lime-saturated water for one hour.
The lengths of the prisms were measured as the reference lengths.
ASTM C157-17 requires a specific curing regime including placing the demolded specimens in
lime-saturated water until the specimens reach the age of 28 days; then the drying shrinkage
testing started. However, ASTM does not include a procedure for oven-cured specimens. Hence,
two curing regimes were carried out during this task for the ZCC specimens. First, for the moist-
cured specimens, the demolded specimens were cured in the lime-saturated water at the room
temperature of 73 ± 3o F (23 ± 2o C) for 28 days (Fig 6.14); then, the drying shrinkage test
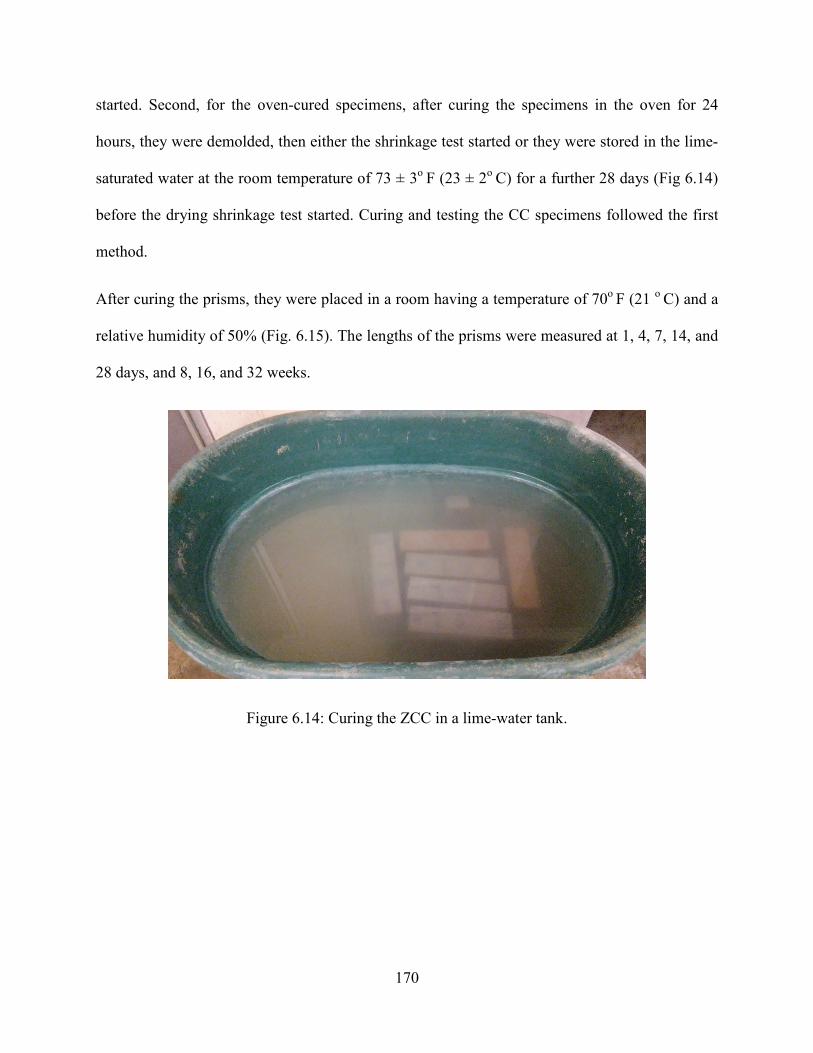
170
started. Second, for the oven-cured specimens, after curing the specimens in the oven for 24
hours, they were demolded, then either the shrinkage test started or they were stored in the lime-
saturated water at the room temperature of 73 ± 3o F (23 ± 2o C) for a further 28 days (Fig 6.14)
before the drying shrinkage test started. Curing and testing the CC specimens followed the first
method.
After curing the prisms, they were placed in a room having a temperature of 70o F (21 o C) and a
relative humidity of 50% (Fig. 6.15). The lengths of the prisms were measured at 1, 4, 7, 14, and
28 days, and 8, 16, and 32 weeks.
Figure 6.14: Curing the ZCC in a lime-water tank.
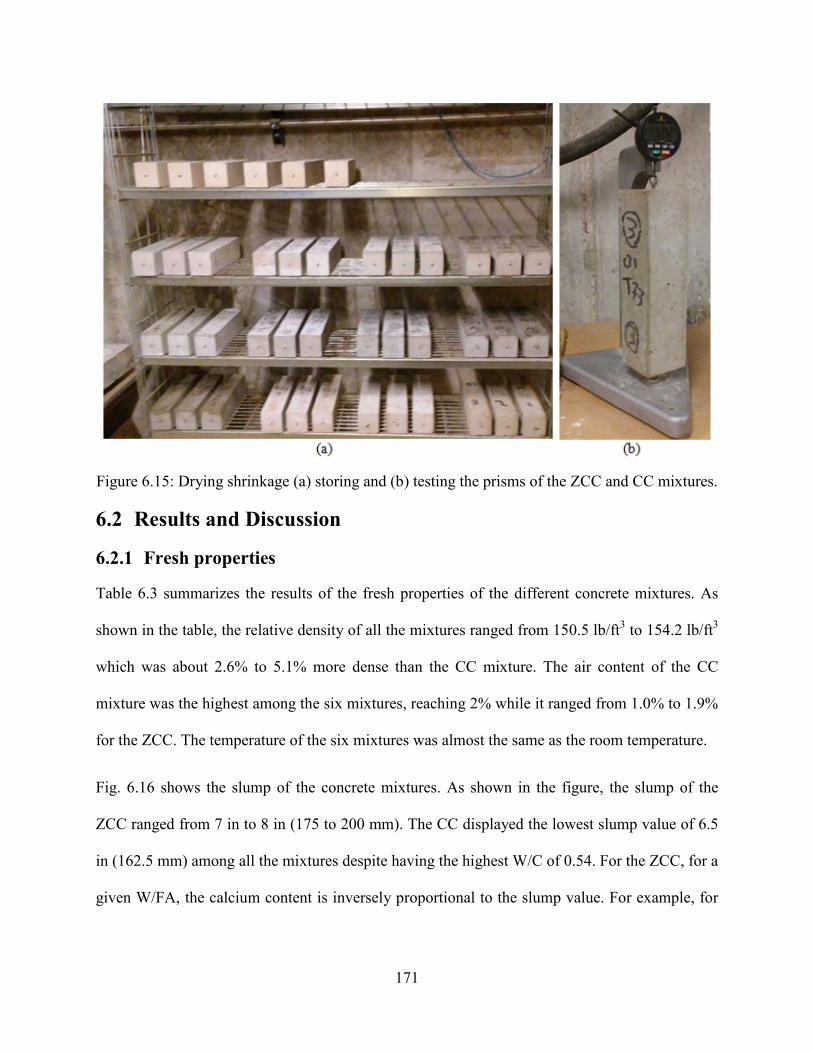
171
Figure 6.15: Drying shrinkage (a) storing and (b) testing the prisms of the ZCC and CC mixtures.
6.2 Results and Discussion
6.2.1 Fresh properties
Table 6.3 summarizes the results of the fresh properties of the different concrete mixtures. As
shown in the table, the relative density of all the mixtures ranged from 150.5 lb/ft3 to 154.2 lb/ft3
which was about 2.6% to 5.1% more dense than the CC mixture. The air content of the CC
mixture was the highest among the six mixtures, reaching 2% while it ranged from 1.0% to 1.9%
for the ZCC. The temperature of the six mixtures was almost the same as the room temperature.
Fig. 6.16 shows the slump of the concrete mixtures. As shown in the figure, the slump of the
ZCC ranged from 7 in to 8 in (175 to 200 mm). The CC displayed the lowest slump value of 6.5
in (162.5 mm) among all the mixtures despite having the highest W/C of 0.54. For the ZCC, for a
given W/FA, the calcium content is inversely proportional to the slump value. For example, for

172
W/FA of 0.35, the slump of C37 was smaller than that of C26. Similarity, for W/FA of 0.34, the
slump of C24 was smaller than that of C21.
Additional nucleation sites for precipitation of the FA dissolved species are created with higher
calcium content, which accelerated the hardening process of the ZCC [129, 130]. Moreover, the
reaction of the water and calcium in the presence of silica and alumina forms calcium silicate
hydrate (CSH) and/or calcium aluminate silicate hydrate (CASH) faster than the relatively
slower geopolymerization process of the FA [63]. Furthermore, the rapid formation of CSH
and/or CASH resulted in low workability. In addition, the consumption of water in the formation
of CSH and/or CASH also reduces the free water in the mixture thereby reducing the workability
[59].
Although mixture C29 had the second-highest calcium content, mixture C29 required the highest
W/FA of 0.38 to achieve a showed slump value of 7 in, which was the lowest among the ZCC
mixtures. That occurred since FA29 had the highest surface area among the five FAs. It had
approximately 60% higher surface area than the average of the other four FAs.
Table 6.3: Fresh Properties of the Different Concrete Mixtures.
C37 C29 C26 C24 C21 CC
Relative Density (lb/ft3) 154.2 153.6 150.5 152.3 153.6 146.7 Air content (%) 1.00 1.10 1.90 1.50 1.30 2.00
Temperature (oF) 74 70 72 73 74 71
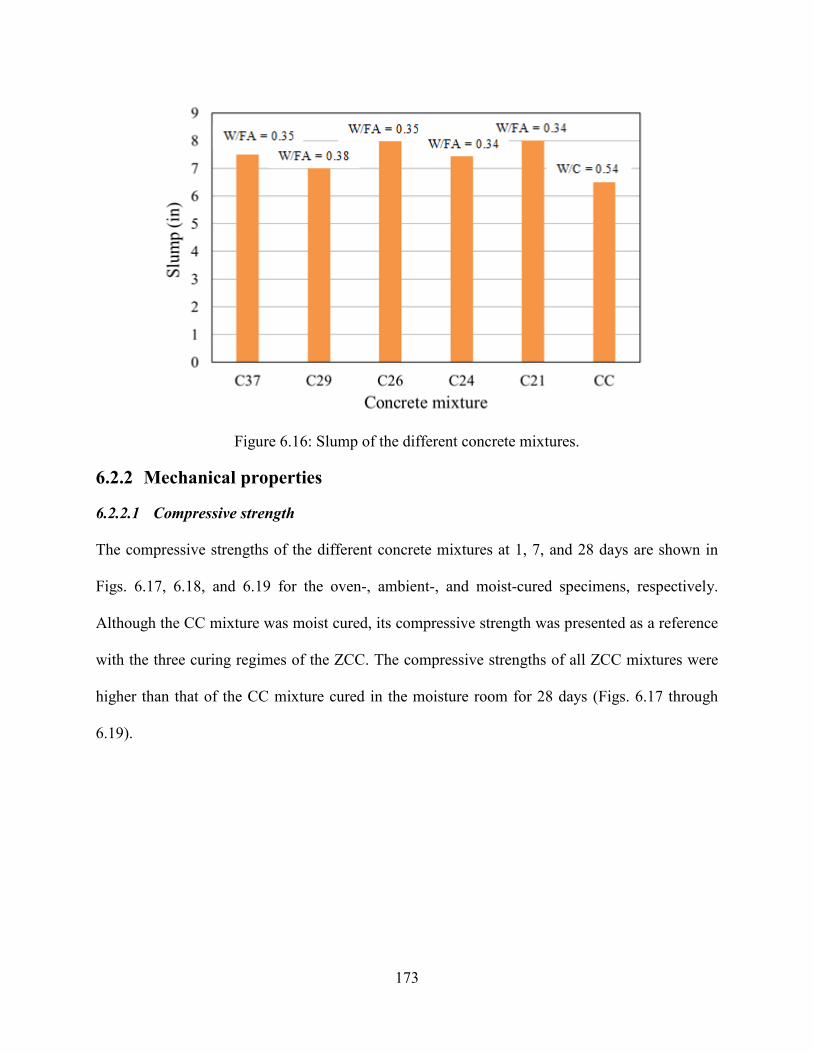
173
Figure 6.16: Slump of the different concrete mixtures.
6.2.2 Mechanical properties
6.2.2.1 Compressive strength
The compressive strengths of the different concrete mixtures at 1, 7, and 28 days are shown in
Figs. 6.17, 6.18, and 6.19 for the oven-, ambient-, and moist-cured specimens, respectively.
Although the CC mixture was moist cured, its compressive strength was presented as a reference
with the three curing regimes of the ZCC. The compressive strengths of all ZCC mixtures were
higher than that of the CC mixture cured in the moisture room for 28 days (Figs. 6.17 through
6.19).
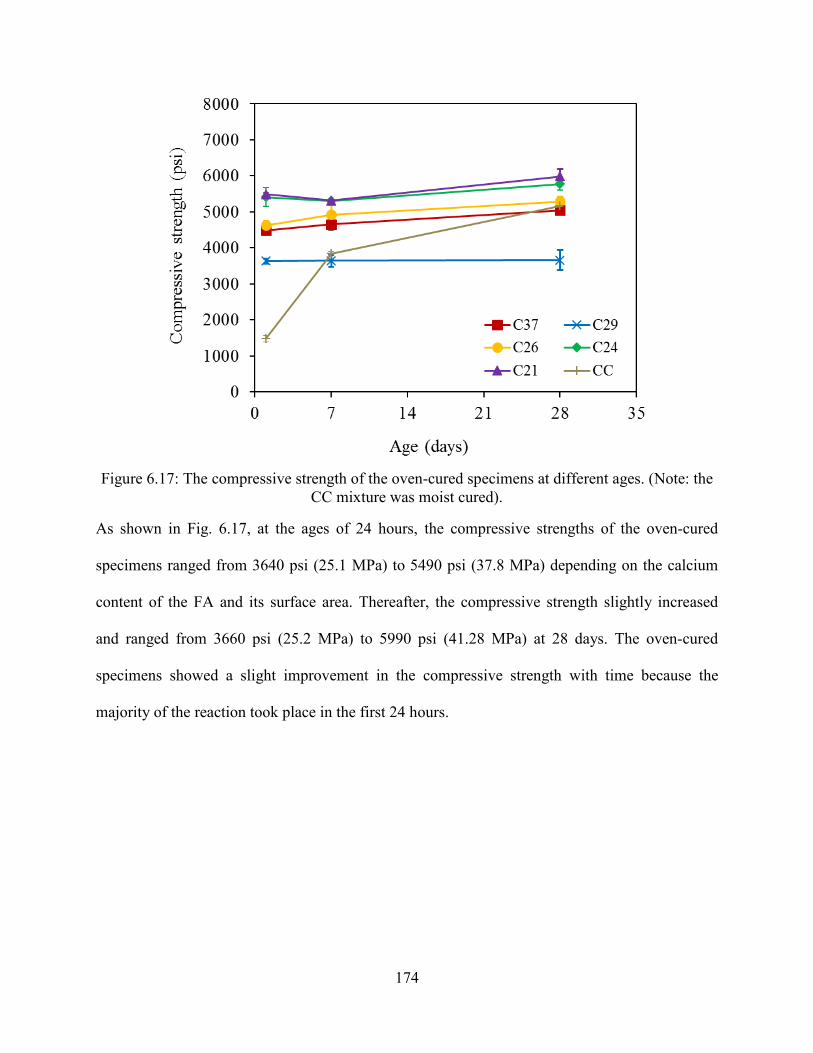
174
Figure 6.17: The compressive strength of the oven-cured specimens at different ages. (Note: the
CC mixture was moist cured).
As shown in Fig. 6.17, at the ages of 24 hours, the compressive strengths of the oven-cured
specimens ranged from 3640 psi (25.1 MPa) to 5490 psi (37.8 MPa) depending on the calcium
content of the FA and its surface area. Thereafter, the compressive strength slightly increased
and ranged from 3660 psi (25.2 MPa) to 5990 psi (41.28 MPa) at 28 days. The oven-cured
specimens showed a slight improvement in the compressive strength with time because the
majority of the reaction took place in the first 24 hours.
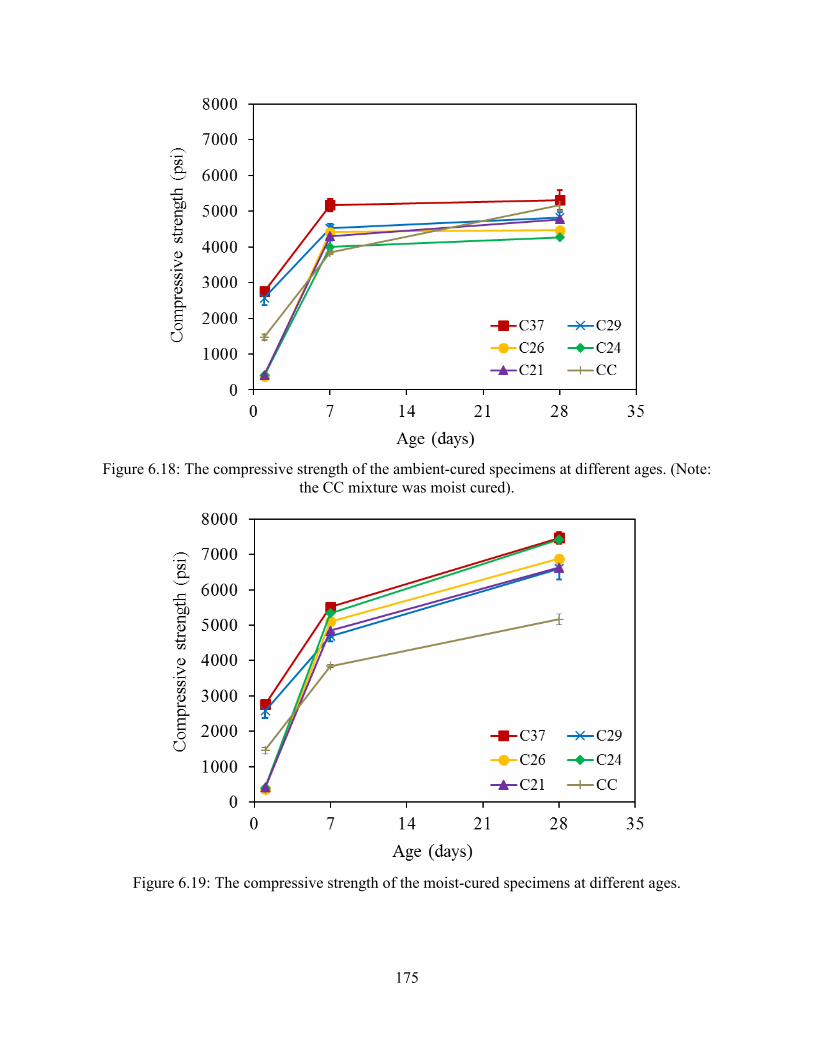
175
Figure 6.18: The compressive strength of the ambient-cured specimens at different ages. (Note:
the CC mixture was moist cured).
Figure 6.19: The compressive strength of the moist-cured specimens at different ages.
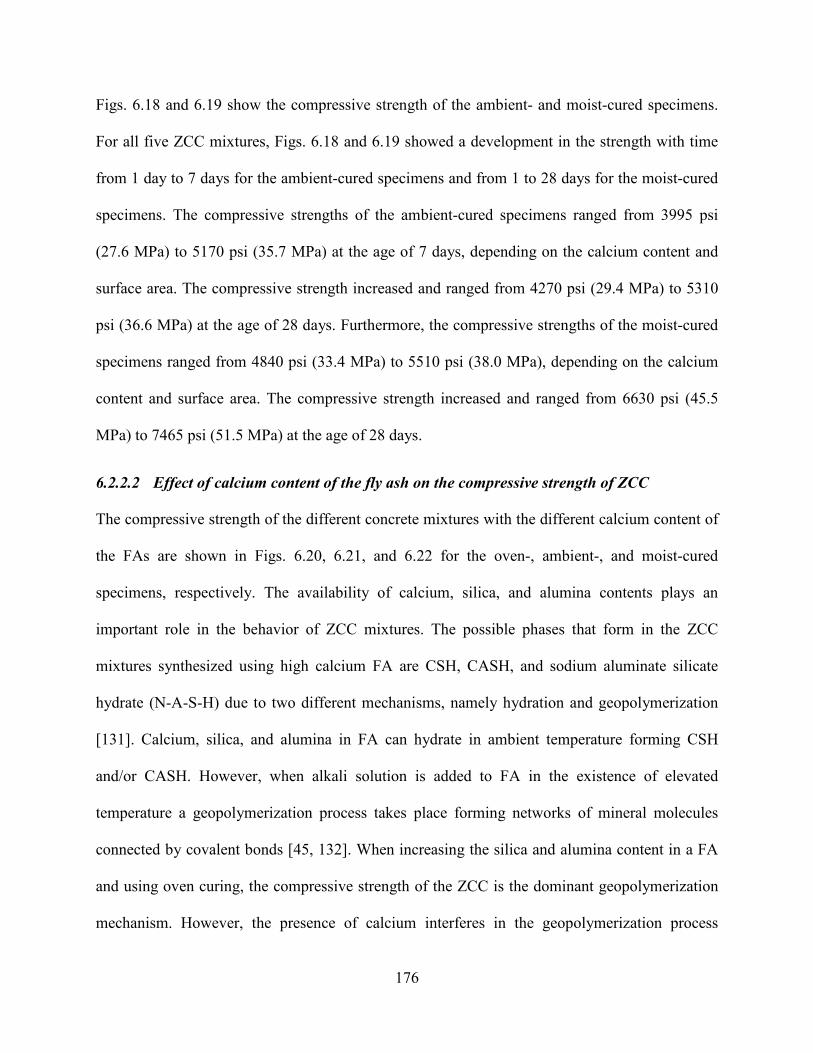
176
Figs. 6.18 and 6.19 show the compressive strength of the ambient- and moist-cured specimens.
For all five ZCC mixtures, Figs. 6.18 and 6.19 showed a development in the strength with time
from 1 day to 7 days for the ambient-cured specimens and from 1 to 28 days for the moist-cured
specimens. The compressive strengths of the ambient-cured specimens ranged from 3995 psi
(27.6 MPa) to 5170 psi (35.7 MPa) at the age of 7 days, depending on the calcium content and
surface area. The compressive strength increased and ranged from 4270 psi (29.4 MPa) to 5310
psi (36.6 MPa) at the age of 28 days. Furthermore, the compressive strengths of the moist-cured
specimens ranged from 4840 psi (33.4 MPa) to 5510 psi (38.0 MPa), depending on the calcium
content and surface area. The compressive strength increased and ranged from 6630 psi (45.5
MPa) to 7465 psi (51.5 MPa) at the age of 28 days.
6.2.2.2 Effect of calcium content of the fly ash on the compressive strength of ZCC
The compressive strength of the different concrete mixtures with the different calcium content of
the FAs are shown in Figs. 6.20, 6.21, and 6.22 for the oven-, ambient-, and moist-cured
specimens, respectively. The availability of calcium, silica, and alumina contents plays an
important role in the behavior of ZCC mixtures. The possible phases that form in the ZCC
mixtures synthesized using high calcium FA are CSH, CASH, and sodium aluminate silicate
hydrate (N-A-S-H) due to two different mechanisms, namely hydration and geopolymerization
[131]. Calcium, silica, and alumina in FA can hydrate in ambient temperature forming CSH
and/or CASH. However, when alkali solution is added to FA in the existence of elevated
temperature a geopolymerization process takes place forming networks of mineral molecules
connected by covalent bonds [45, 132]. When increasing the silica and alumina content in a FA
and using oven curing, the compressive strength of the ZCC is the dominant geopolymerization
mechanism. However, the presence of calcium interferes in the geopolymerization process
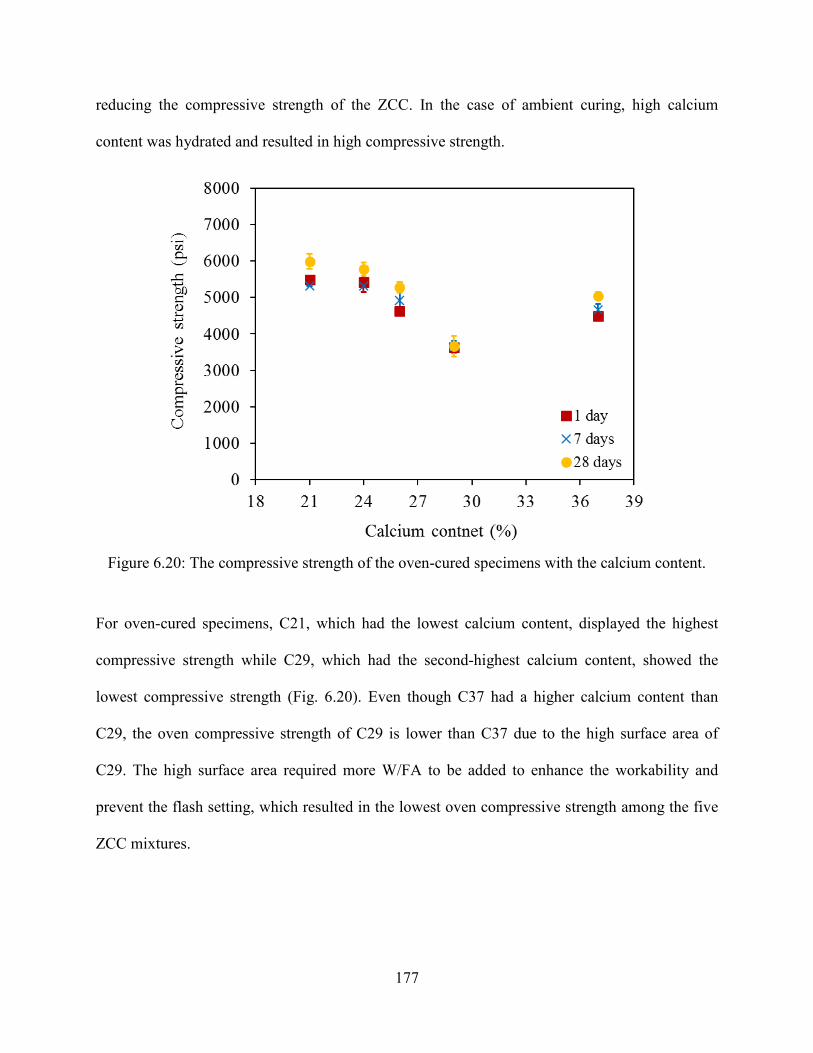
177
reducing the compressive strength of the ZCC. In the case of ambient curing, high calcium
content was hydrated and resulted in high compressive strength.
Figure 6.20: The compressive strength of the oven-cured specimens with the calcium content.
For oven-cured specimens, C21, which had the lowest calcium content, displayed the highest
compressive strength while C29, which had the second-highest calcium content, showed the
lowest compressive strength (Fig. 6.20). Even though C37 had a higher calcium content than
C29, the oven compressive strength of C29 is lower than C37 due to the high surface area of
C29. The high surface area required more W/FA to be added to enhance the workability and
prevent the flash setting, which resulted in the lowest oven compressive strength among the five
ZCC mixtures.
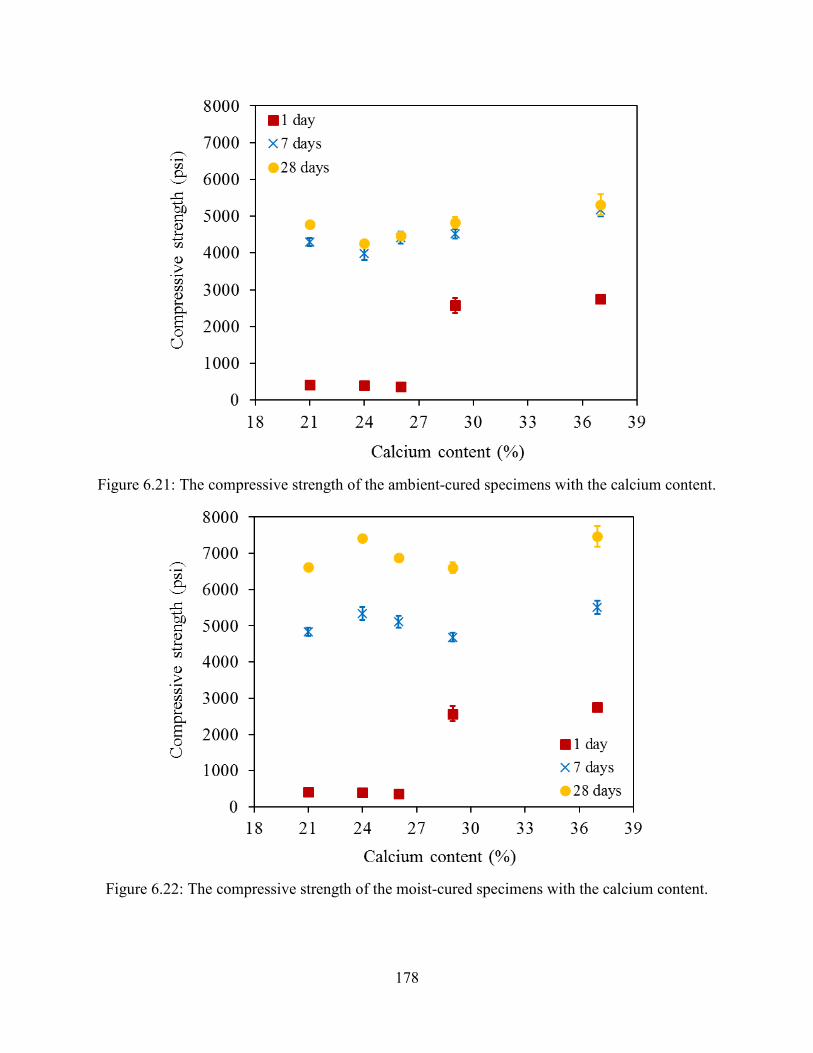
178
Figure 6.21: The compressive strength of the ambient-cured specimens with the calcium content.
Figure 6.22: The compressive strength of the moist-cured specimens with the calcium content.
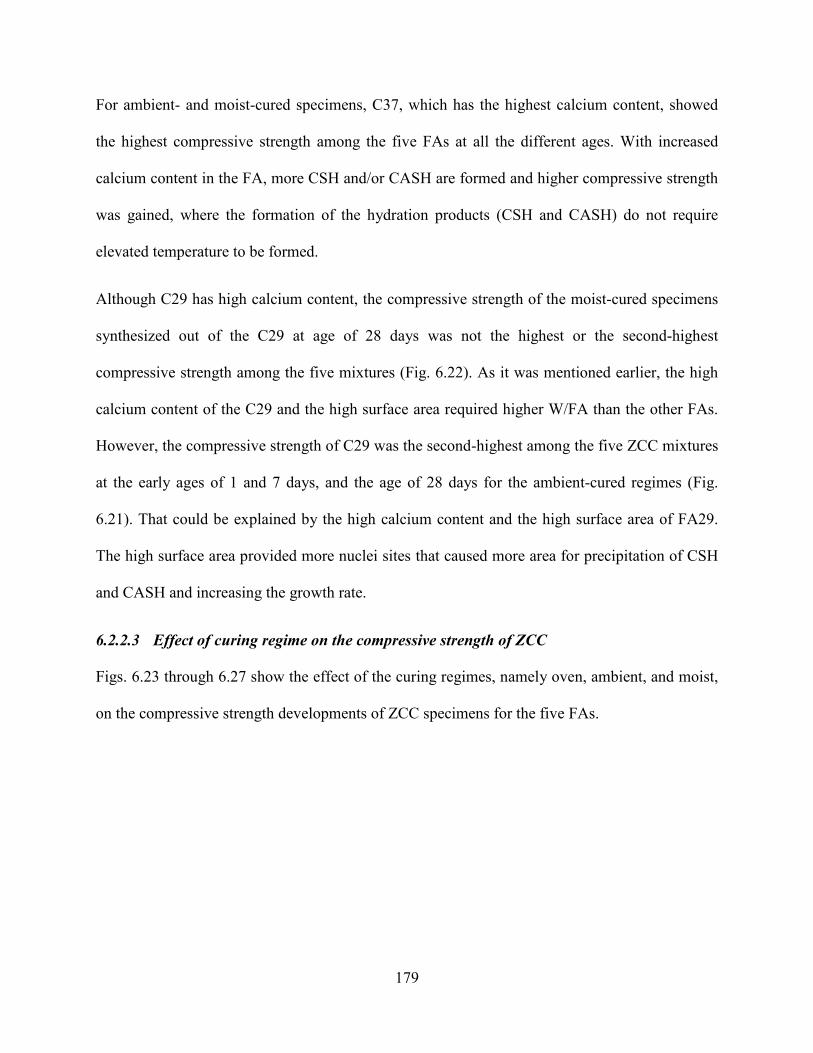
179
For ambient- and moist-cured specimens, C37, which has the highest calcium content, showed
the highest compressive strength among the five FAs at all the different ages. With increased
calcium content in the FA, more CSH and/or CASH are formed and higher compressive strength
was gained, where the formation of the hydration products (CSH and CASH) do not require
elevated temperature to be formed.
Although C29 has high calcium content, the compressive strength of the moist-cured specimens
synthesized out of the C29 at age of 28 days was not the highest or the second-highest
compressive strength among the five mixtures (Fig. 6.22). As it was mentioned earlier, the high
calcium content of the C29 and the high surface area required higher W/FA than the other FAs.
However, the compressive strength of C29 was the second-highest among the five ZCC mixtures
at the early ages of 1 and 7 days, and the age of 28 days for the ambient-cured regimes (Fig.
6.21). That could be explained by the high calcium content and the high surface area of FA29.
The high surface area provided more nuclei sites that caused more area for precipitation of CSH
and CASH and increasing the growth rate.
6.2.2.3 Effect of curing regime on the compressive strength of ZCC
Figs. 6.23 through 6.27 show the effect of the curing regimes, namely oven, ambient, and moist,
on the compressive strength developments of ZCC specimens for the five FAs.
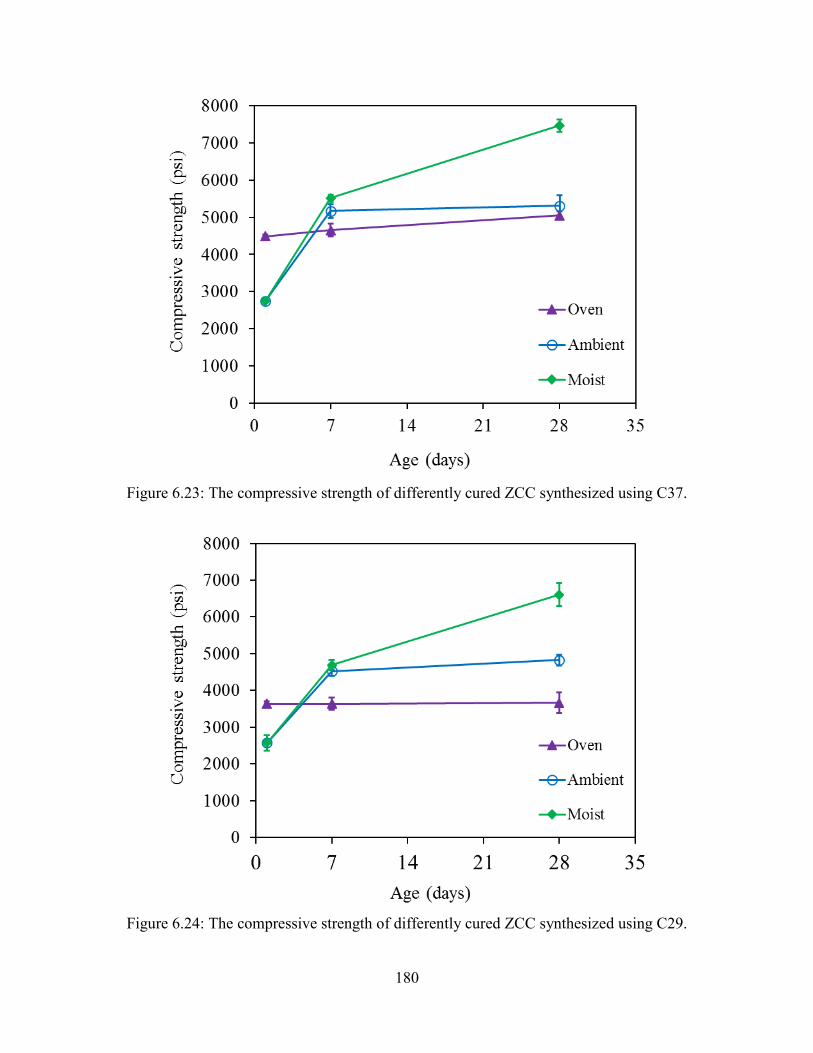
180
Figure 6.23: The compressive strength of differently cured ZCC synthesized using C37.
Figure 6.24: The compressive strength of differently cured ZCC synthesized using C29.
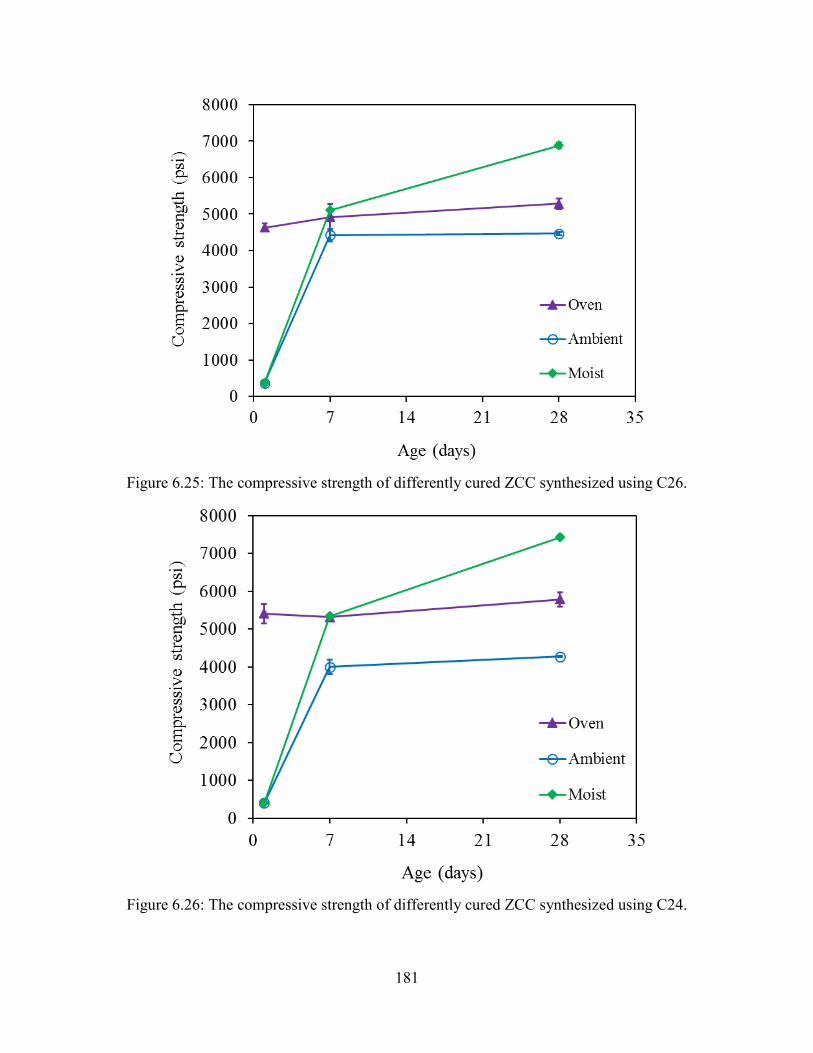
181
Figure 6.25: The compressive strength of differently cured ZCC synthesized using C26.
Figure 6.26: The compressive strength of differently cured ZCC synthesized using C24.
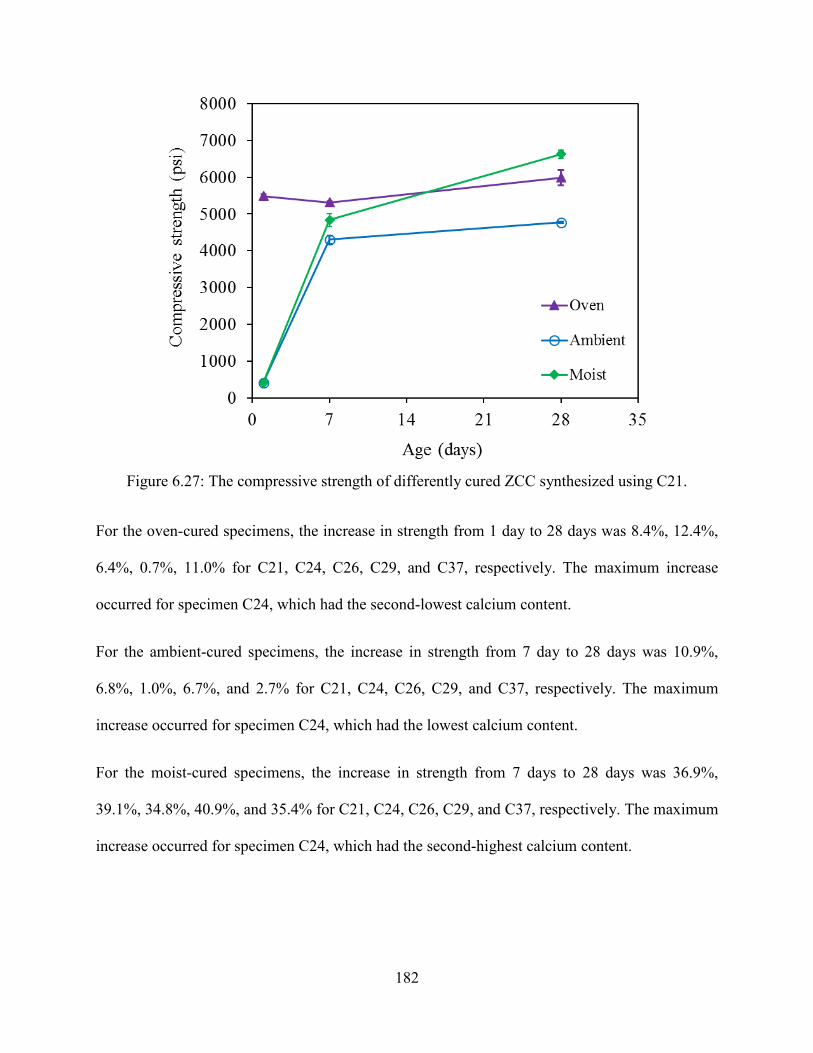
182
Figure 6.27: The compressive strength of differently cured ZCC synthesized using C21.
For the oven-cured specimens, the increase in strength from 1 day to 28 days was 8.4%, 12.4%,
6.4%, 0.7%, 11.0% for C21, C24, C26, C29, and C37, respectively. The maximum increase
occurred for specimen C24, which had the second-lowest calcium content.
For the ambient-cured specimens, the increase in strength from 7 day to 28 days was 10.9%,
6.8%, 1.0%, 6.7%, and 2.7% for C21, C24, C26, C29, and C37, respectively. The maximum
increase occurred for specimen C24, which had the lowest calcium content.
For the moist-cured specimens, the increase in strength from 7 days to 28 days was 36.9%,
39.1%, 34.8%, 40.9%, and 35.4% for C21, C24, C26, C29, and C37, respectively. The maximum
increase occurred for specimen C24, which had the second-highest calcium content.
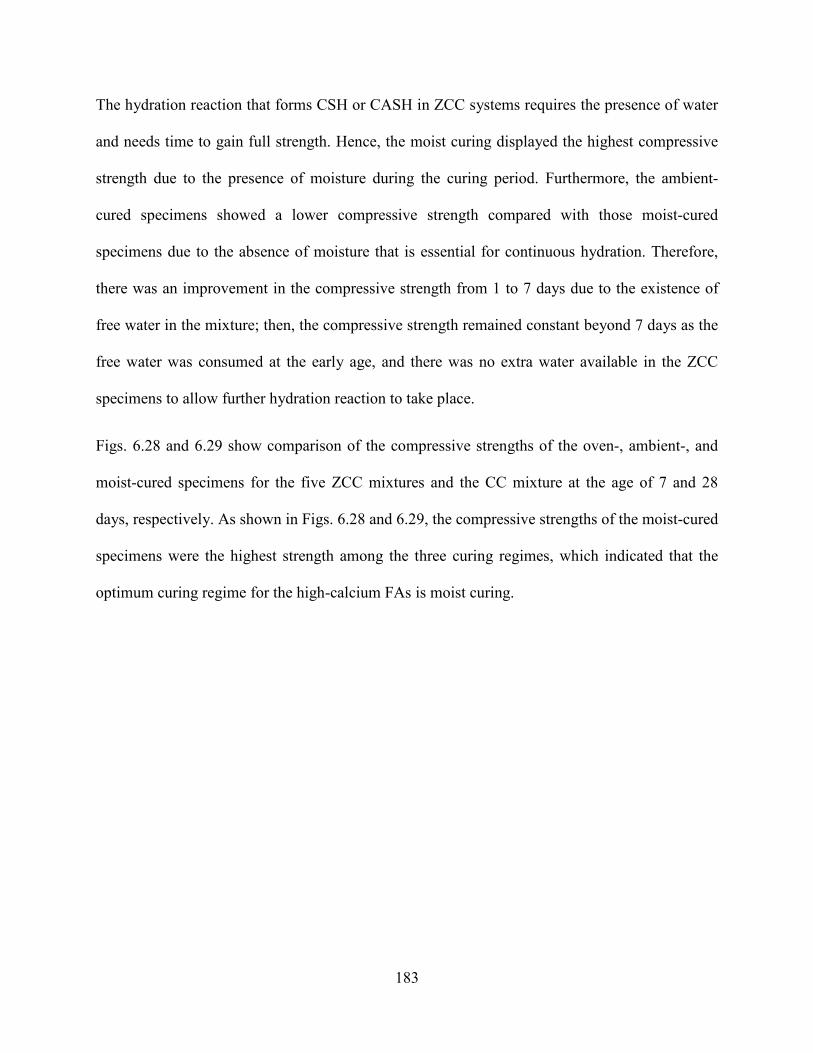
183
The hydration reaction that forms CSH or CASH in ZCC systems requires the presence of water
and needs time to gain full strength. Hence, the moist curing displayed the highest compressive
strength due to the presence of moisture during the curing period. Furthermore, the ambient-
cured specimens showed a lower compressive strength compared with those moist-cured
specimens due to the absence of moisture that is essential for continuous hydration. Therefore,
there was an improvement in the compressive strength from 1 to 7 days due to the existence of
free water in the mixture; then, the compressive strength remained constant beyond 7 days as the
free water was consumed at the early age, and there was no extra water available in the ZCC
specimens to allow further hydration reaction to take place.
Figs. 6.28 and 6.29 show comparison of the compressive strengths of the oven-, ambient-, and
moist-cured specimens for the five ZCC mixtures and the CC mixture at the age of 7 and 28
days, respectively. As shown in Figs. 6.28 and 6.29, the compressive strengths of the moist-cured
specimens were the highest strength among the three curing regimes, which indicated that the
optimum curing regime for the high-calcium FAs is moist curing.
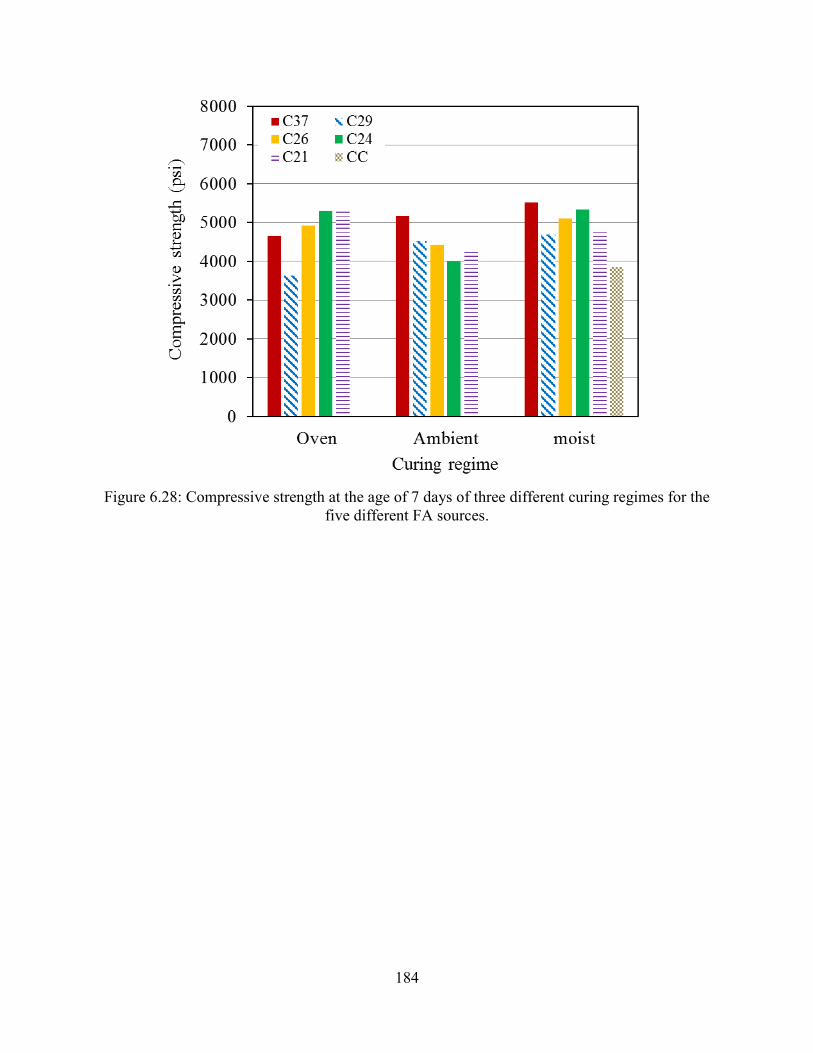
184
Figure 6.28: Compressive strength at the age of 7 days of three different curing regimes for the
five different FA sources.
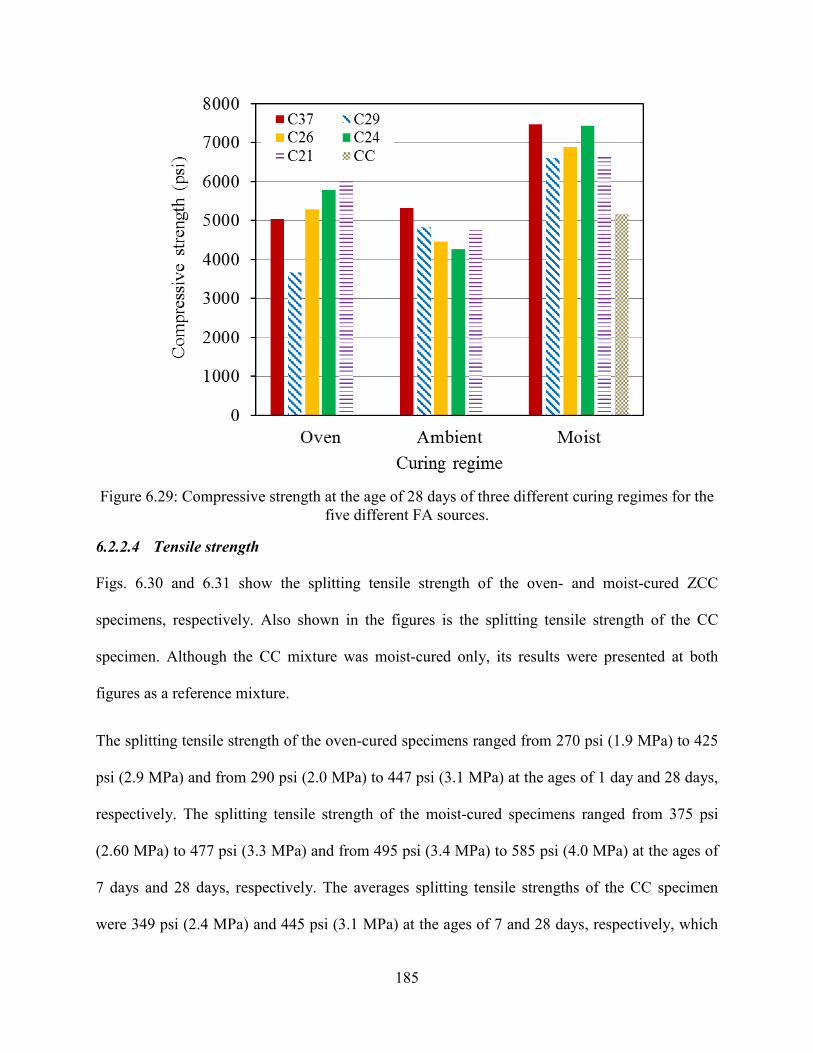
185
Figure 6.29: Compressive strength at the age of 28 days of three different curing regimes for the
five different FA sources.
6.2.2.4 Tensile strength
Figs. 6.30 and 6.31 show the splitting tensile strength of the oven- and moist-cured ZCC
specimens, respectively. Also shown in the figures is the splitting tensile strength of the CC
specimen. Although the CC mixture was moist-cured only, its results were presented at both
figures as a reference mixture.
The splitting tensile strength of the oven-cured specimens ranged from 270 psi (1.9 MPa) to 425
psi (2.9 MPa) and from 290 psi (2.0 MPa) to 447 psi (3.1 MPa) at the ages of 1 day and 28 days,
respectively. The splitting tensile strength of the moist-cured specimens ranged from 375 psi
(2.60 MPa) to 477 psi (3.3 MPa) and from 495 psi (3.4 MPa) to 585 psi (4.0 MPa) at the ages of
7 days and 28 days, respectively. The averages splitting tensile strengths of the CC specimen
were 349 psi (2.4 MPa) and 445 psi (3.1 MPa) at the ages of 7 and 28 days, respectively, which
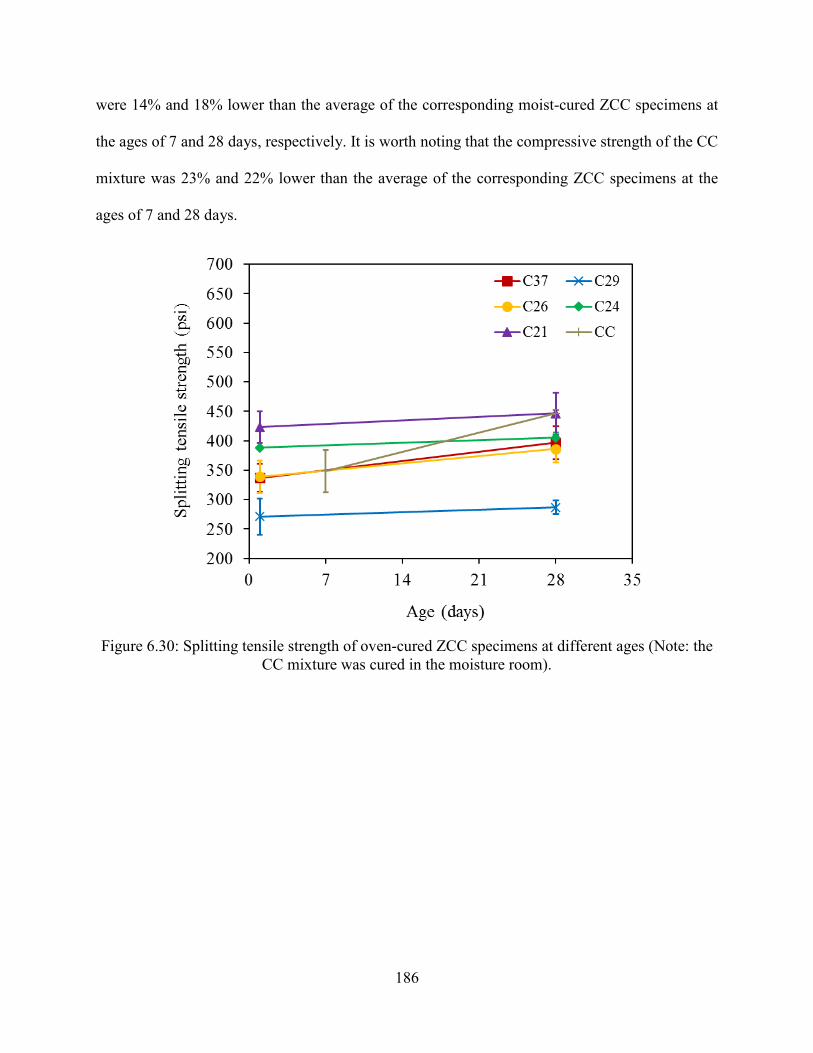
186
were 14% and 18% lower than the average of the corresponding moist-cured ZCC specimens at
the ages of 7 and 28 days, respectively. It is worth noting that the compressive strength of the CC
mixture was 23% and 22% lower than the average of the corresponding ZCC specimens at the
ages of 7 and 28 days.
Figure 6.30: Splitting tensile strength of oven-cured ZCC specimens at different ages (Note: the
CC mixture was cured in the moisture room).
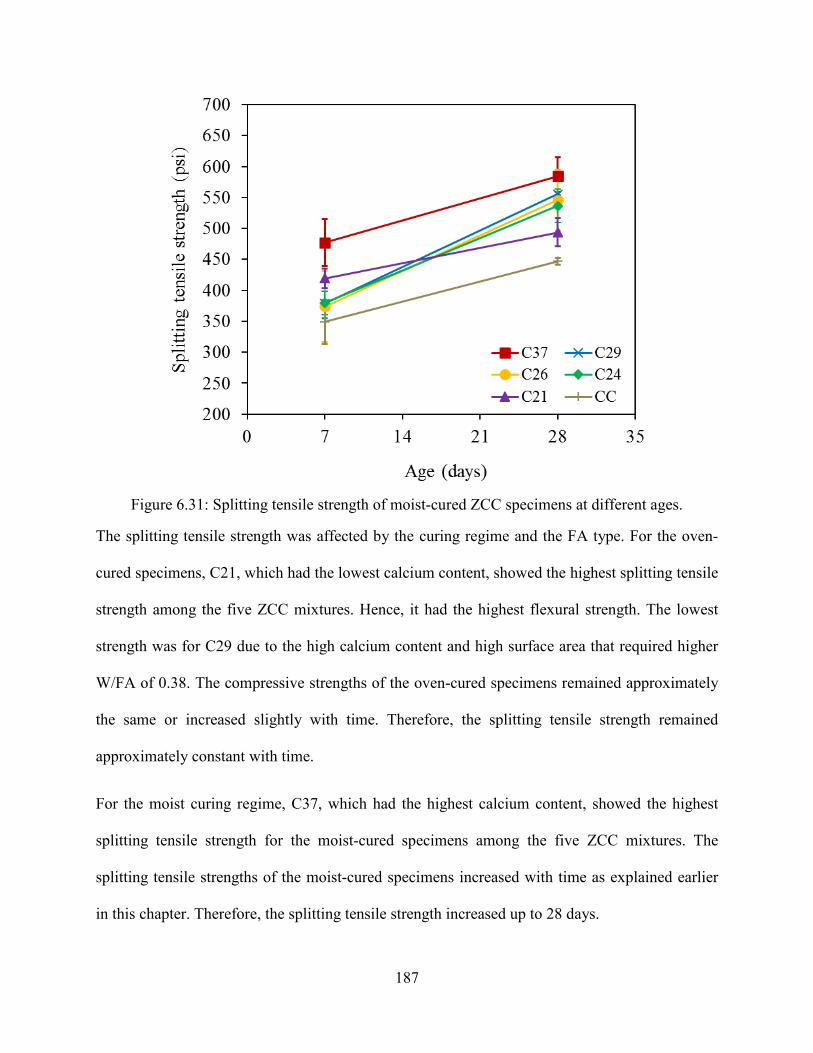
187
Figure 6.31: Splitting tensile strength of moist-cured ZCC specimens at different ages.
The splitting tensile strength was affected by the curing regime and the FA type. For the oven-
cured specimens, C21, which had the lowest calcium content, showed the highest splitting tensile
strength among the five ZCC mixtures. Hence, it had the highest flexural strength. The lowest
strength was for C29 due to the high calcium content and high surface area that required higher
W/FA of 0.38. The compressive strengths of the oven-cured specimens remained approximately
the same or increased slightly with time. Therefore, the splitting tensile strength remained
approximately constant with time.
For the moist curing regime, C37, which had the highest calcium content, showed the highest
splitting tensile strength for the moist-cured specimens among the five ZCC mixtures. The
splitting tensile strengths of the moist-cured specimens increased with time as explained earlier
in this chapter. Therefore, the splitting tensile strength increased up to 28 days.
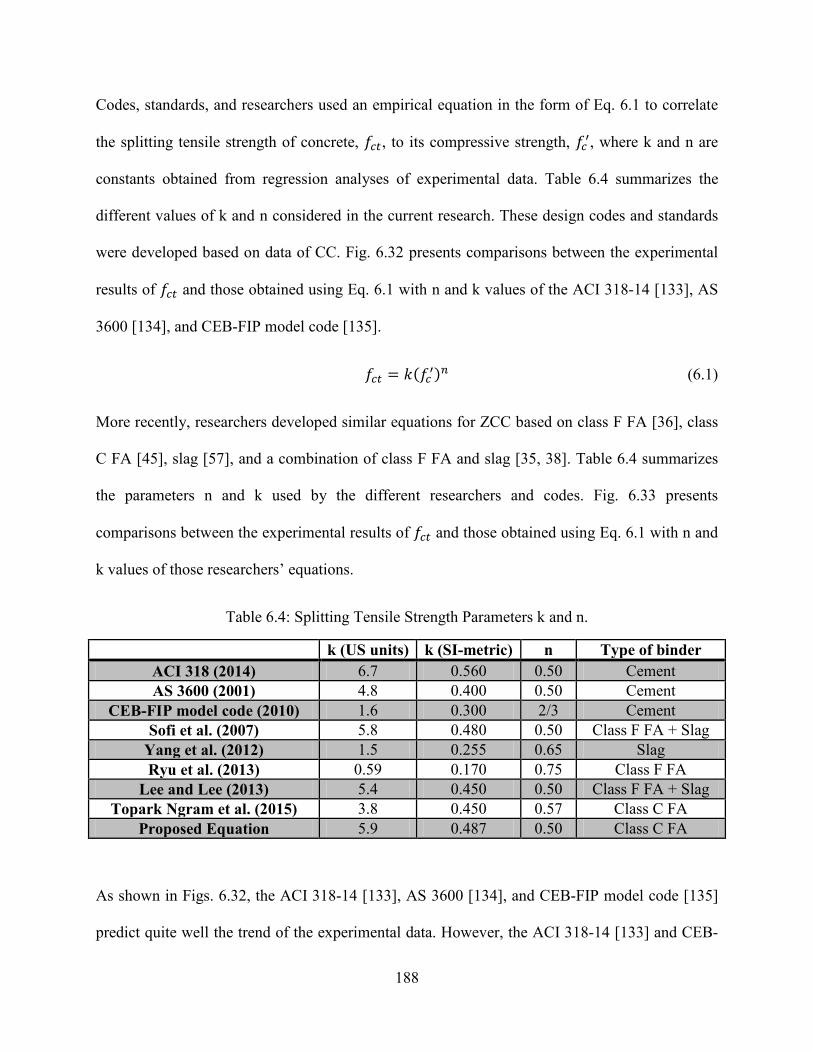
188
Codes, standards, and researchers used an empirical equation in the form of Eq. 6.1 to correlate
the splitting tensile strength of concrete, 𝑓𝑐𝑡, to its compressive strength, 𝑓𝑐′, where k and n are
constants obtained from regression analyses of experimental data. Table 6.4 summarizes the
different values of k and n considered in the current research. These design codes and standards
were developed based on data of CC. Fig. 6.32 presents comparisons between the experimental
results of 𝑓𝑐𝑡 and those obtained using Eq. 6.1 with n and k values of the ACI 318-14 [133], AS
3600 [134], and CEB-FIP model code [135].
𝑓𝑐𝑡 = 𝑘(𝑓𝑐′)𝑛 (6.1)
More recently, researchers developed similar equations for ZCC based on class F FA [36], class
C FA [45], slag [57], and a combination of class F FA and slag [35, 38]. Table 6.4 summarizes
the parameters n and k used by the different researchers and codes. Fig. 6.33 presents
comparisons between the experimental results of 𝑓𝑐𝑡 and those obtained using Eq. 6.1 with n and
k values of those researchers’ equations.
Table 6.4: Splitting Tensile Strength Parameters k and n.
k (US units) k (SI-metric) n Type of binder ACI 318 (2014) 6.7 0.560 0.50 Cement AS 3600 (2001) 4.8 0.400 0.50 Cement
CEB-FIP model code (2010) 1.6 0.300 2/3 Cement Sofi et al. (2007) 5.8 0.480 0.50 Class F FA + Slag
Yang et al. (2012) 1.5 0.255 0.65 Slag Ryu et al. (2013) 0.59 0.170 0.75 Class F FA
Lee and Lee (2013) 5.4 0.450 0.50 Class F FA + Slag Topark Ngram et al. (2015) 3.8 0.450 0.57 Class C FA
Proposed Equation 5.9 0.487 0.50 Class C FA
As shown in Figs. 6.32, the ACI 318-14 [133], AS 3600 [134], and CEB-FIP model code [135]
predict quite well the trend of the experimental data. However, the ACI 318-14 [133] and CEB-
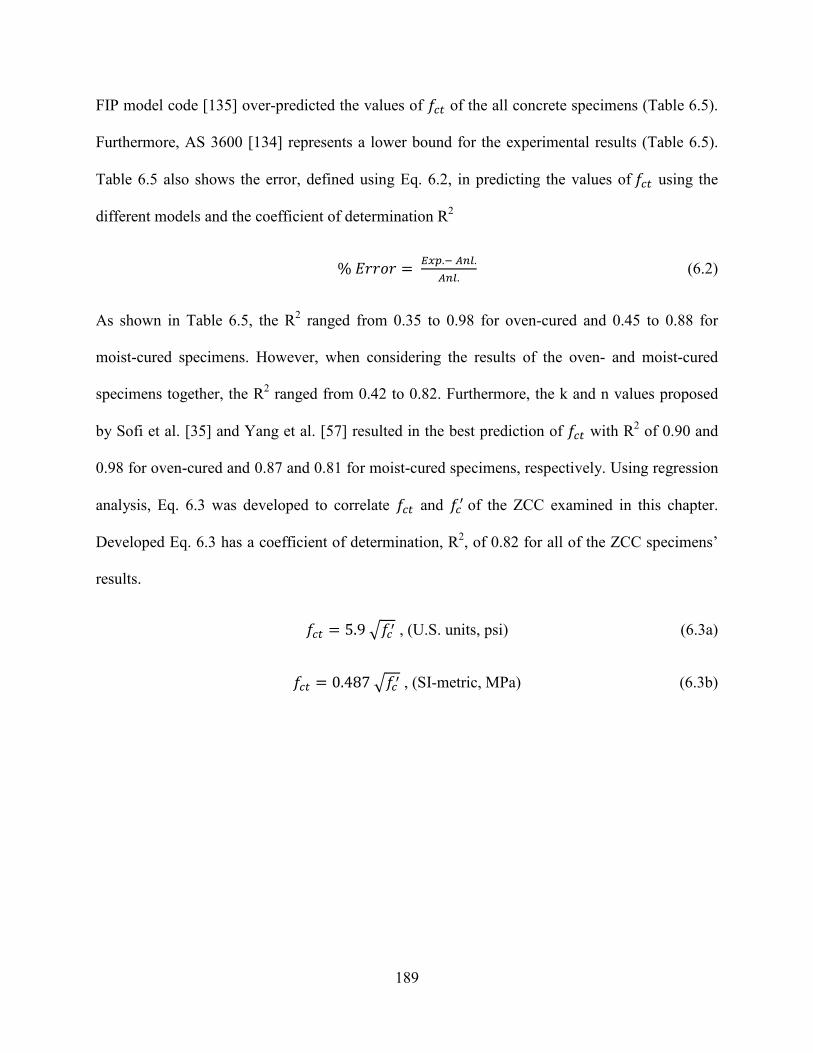
189
FIP model code [135] over-predicted the values of 𝑓𝑐𝑡 of the all concrete specimens (Table 6.5).
Furthermore, AS 3600 [134] represents a lower bound for the experimental results (Table 6.5).
Table 6.5 also shows the error, defined using Eq. 6.2, in predicting the values of 𝑓𝑐𝑡 using the
different models and the coefficient of determination R2
% 𝐸𝑟𝑟𝑜𝑟 = 𝐸𝑥𝑝.− 𝐴𝑛𝑙.𝐴𝑛𝑙.
(6.2)
As shown in Table 6.5, the R2 ranged from 0.35 to 0.98 for oven-cured and 0.45 to 0.88 for
moist-cured specimens. However, when considering the results of the oven- and moist-cured
specimens together, the R2 ranged from 0.42 to 0.82. Furthermore, the k and n values proposed
by Sofi et al. [35] and Yang et al. [57] resulted in the best prediction of 𝑓𝑐𝑡 with R2 of 0.90 and
0.98 for oven-cured and 0.87 and 0.81 for moist-cured specimens, respectively. Using regression
analysis, Eq. 6.3 was developed to correlate 𝑓𝑐𝑡 and 𝑓𝑐′ of the ZCC examined in this chapter.
Developed Eq. 6.3 has a coefficient of determination, R2, of 0.82 for all of the ZCC specimens’
results.
𝑓𝑐𝑡 = 5.9 𝑓𝑐′ , (U.S. units, psi) (6.3a)
𝑓𝑐𝑡 = 0.487 𝑓𝑐′ , (SI-metric, MPa) (6.3b)
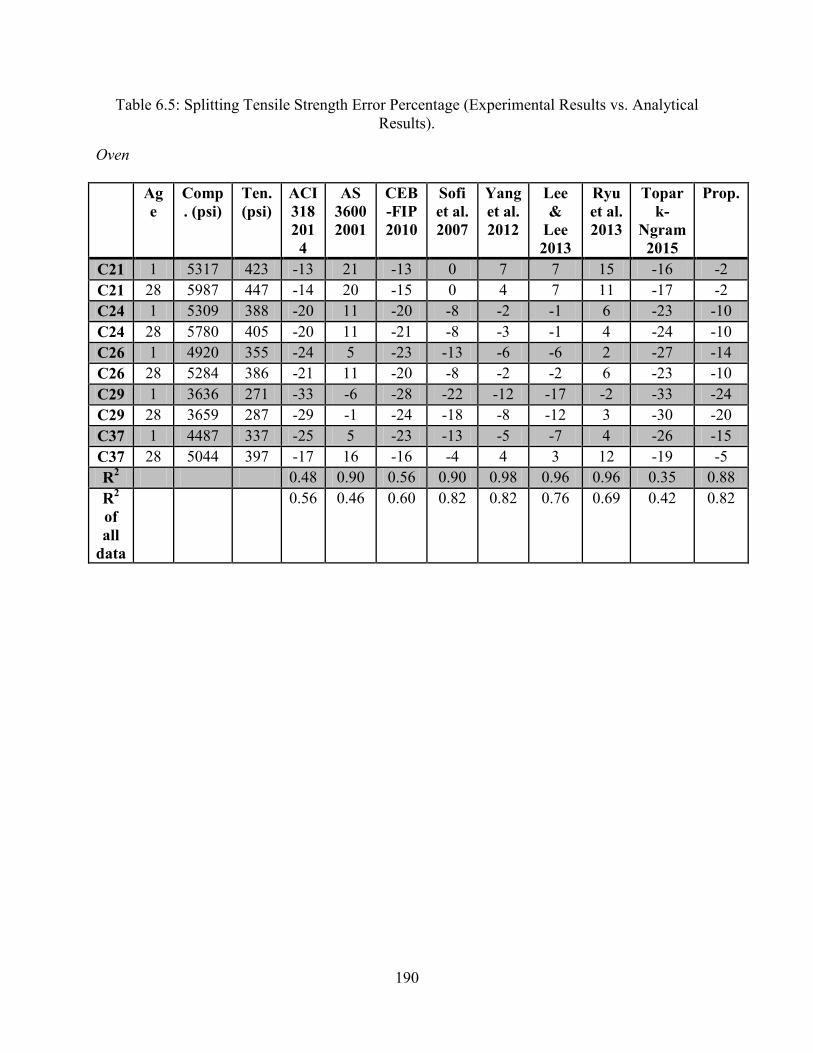
190
Table 6.5: Splitting Tensile Strength Error Percentage (Experimental Results vs. Analytical Results).
Oven
Age
Comp. (psi)
Ten. (psi)
ACI 318 2014
AS 3600 2001
CEB-FIP 2010
Sofi et al. 2007
Yang et al. 2012
Lee &
Lee 2013
Ryu et al. 2013
Topark-
Ngram 2015
Prop.
C21 1 5317 423 -13 21 -13 0 7 7 15 -16 -2 C21 28 5987 447 -14 20 -15 0 4 7 11 -17 -2 C24 1 5309 388 -20 11 -20 -8 -2 -1 6 -23 -10 C24 28 5780 405 -20 11 -21 -8 -3 -1 4 -24 -10 C26 1 4920 355 -24 5 -23 -13 -6 -6 2 -27 -14 C26 28 5284 386 -21 11 -20 -8 -2 -2 6 -23 -10 C29 1 3636 271 -33 -6 -28 -22 -12 -17 -2 -33 -24 C29 28 3659 287 -29 -1 -24 -18 -8 -12 3 -30 -20 C37 1 4487 337 -25 5 -23 -13 -5 -7 4 -26 -15 C37 28 5044 397 -17 16 -16 -4 4 3 12 -19 -5 R2 0.48 0.90 0.56 0.90 0.98 0.96 0.96 0.35 0.88 R2
of all
data
0.56 0.46 0.60 0.82 0.82 0.76 0.69 0.42 0.82
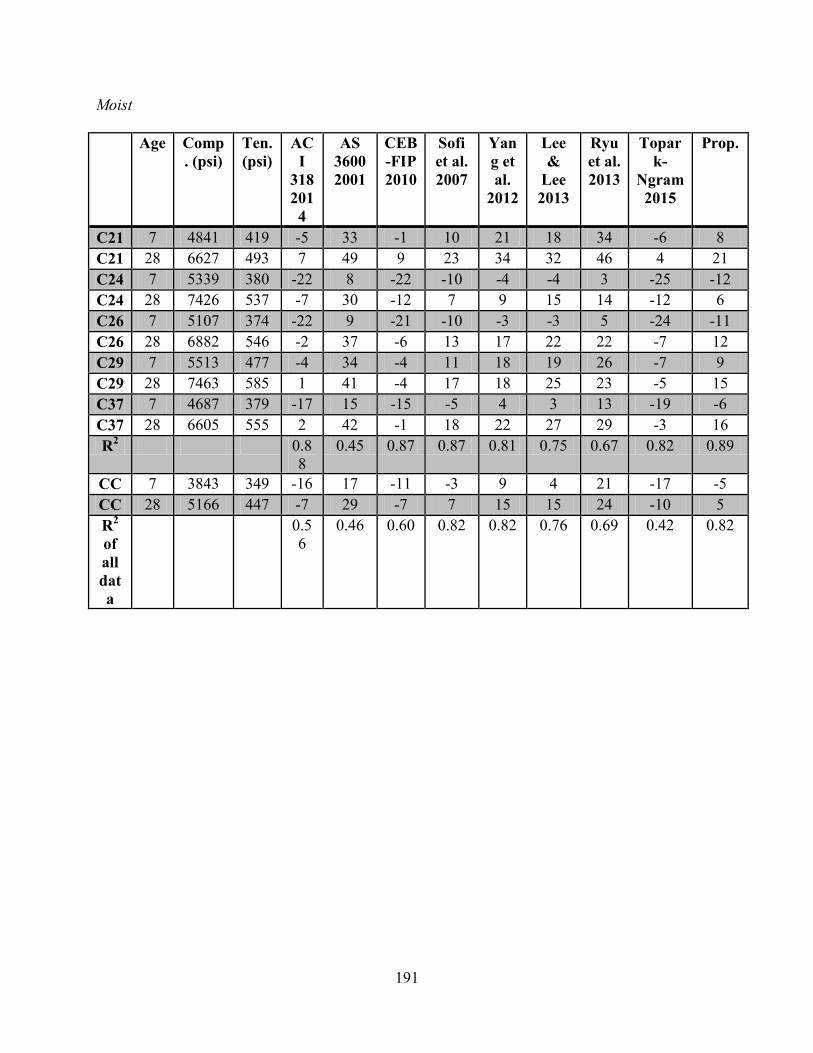
191
Moist
Age Comp. (psi)
Ten. (psi)
ACI
318 201
4
AS 3600 2001
CEB-FIP 2010
Sofi et al. 2007
Yang et al.
2012
Lee &
Lee 2013
Ryu et al. 2013
Topark-
Ngram 2015
Prop.
C21 7 4841 419 -5 33 -1 10 21 18 34 -6 8 C21 28 6627 493 7 49 9 23 34 32 46 4 21 C24 7 5339 380 -22 8 -22 -10 -4 -4 3 -25 -12 C24 28 7426 537 -7 30 -12 7 9 15 14 -12 6 C26 7 5107 374 -22 9 -21 -10 -3 -3 5 -24 -11 C26 28 6882 546 -2 37 -6 13 17 22 22 -7 12 C29 7 5513 477 -4 34 -4 11 18 19 26 -7 9 C29 28 7463 585 1 41 -4 17 18 25 23 -5 15 C37 7 4687 379 -17 15 -15 -5 4 3 13 -19 -6 C37 28 6605 555 2 42 -1 18 22 27 29 -3 16 R2 0.8
8 0.45 0.87 0.87 0.81 0.75 0.67 0.82 0.89
CC 7 3843 349 -16 17 -11 -3 9 4 21 -17 -5 CC 28 5166 447 -7 29 -7 7 15 15 24 -10 5 R2
of all data
0.56
0.46 0.60 0.82 0.82 0.76 0.69 0.42 0.82

192
Figure 6.32: Splitting tensile strength and compressive strength of ZCC with the design codes’ equations.
Figure 6.33: Splitting tensile strength and compressive strength of ZCC with the researchers’ equations.
193
The proposed equation in this study and the previous studies that were conducted on class C FA
and a combination of class F FA and slag all showed a higher strength than a study based on
class F FA. It is known that class C FA has high calcium content, which leads to the formation of
CSH and/or CASH along with the aluminosilicate network (NASH). It was suggested that the
CSH and/or CASH products filled the voids of the aluminosilicate matrix, resulting in a lower
porosity paste which strengthen the bond between the paste the coarse aggregate particles and
leaded to a strong interfacial transition zone (ITZ) [45, 136].
6.2.2.5 Modulus of rupture (flexural strength)
Figs. 6.34 and 6.35 show the flexural strength of the oven- and moist-cured ZCC specimens,
respectively. Also shown on the figures is the flexural strength of the CC specimen. Although the
CC mixture was moist-cured only, its results were presented at both figures as a reference
mixture.
The flexural strength of the oven-cured specimens ranged from 443 psi (3.1 MPa) to 675 psi (4.7
MPa) and from 465 psi (3.2 MPa) to 655 psi (4.5 MPa) at the ages of 1 day and 28 days,
respectively. The flexural strength of the moist-cured specimens ranged from 525 psi (3.6 MPa)
to 785 psi (5.4 MPa) and from 740 psi (5.1 MPa) to 930 psi (6.4 MPa) at the ages of 7 days and
28 days, respectively. The averages flexural strength of the CC specimens were 585 psi (4.0
MPa) and 650 psi (4.5 MPa) at the ages of 7 and 28 days, respectively, which were 9% and 19%
lower than the average of those similar moist-cured ZCC specimens at the ages of 7 and 28 days,
respectively. It is worth noting that the compressive strength of the CC mixture was 23% and
22% lower than the average of the corresponding ZCC specimens at the ages of 7 and 28 days.
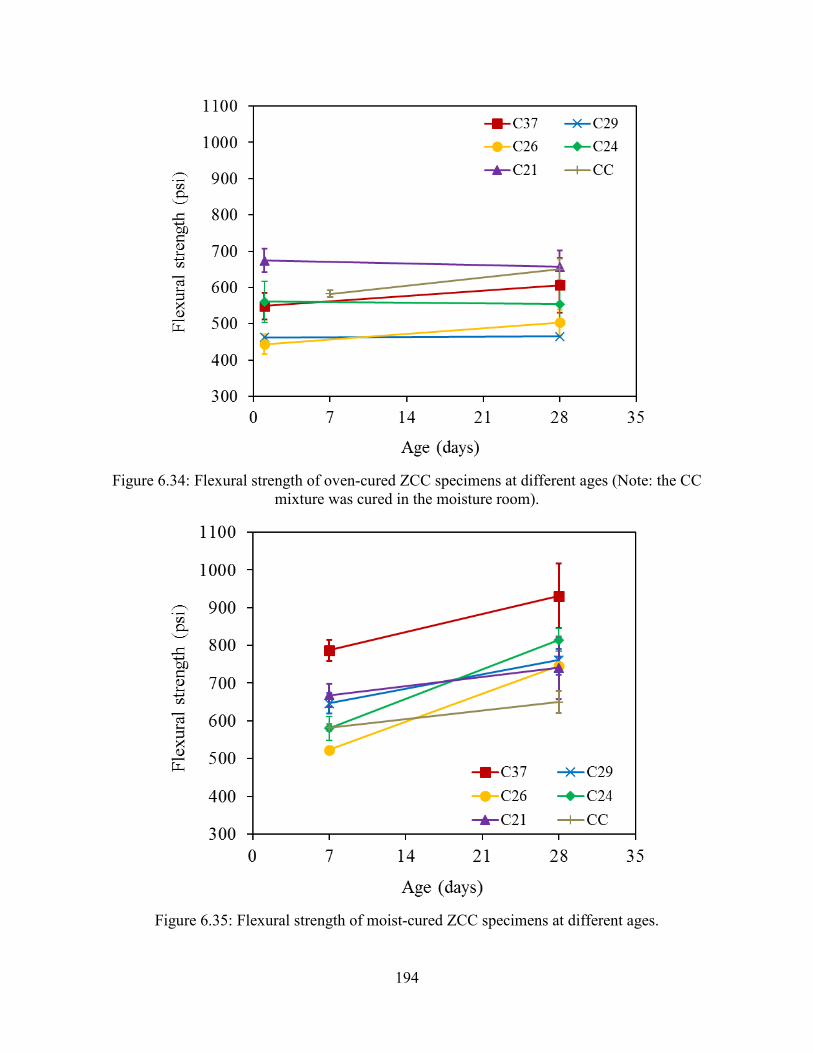
194
Figure 6.34: Flexural strength of oven-cured ZCC specimens at different ages (Note: the CC
mixture was cured in the moisture room).
Figure 6.35: Flexural strength of moist-cured ZCC specimens at different ages.
195
The flexural strength was affected by the curing regime and the FA type. For the oven
specimens, the C21 that had the lowest calcium content showed the highest flexural strength
among the five ZCC mixtures. Hence, it had the highest flexural strength. The compressive
strengths of the oven-cured specimens remained approximately the same with time. Therefore,
the flexural strength remained constant up to 28 days.
For the moist curing regime, the C37, which had the highest calcium content, showed the highest
flexural strength for the moist-cured specimens among the five ZCC mixtures. Hence, it
displayed the highest flexural strength. The flexural strengths of the moist-cured specimens
increased with time as explained earlier in this chapter. Therefore, the flexural strength increased
up to 28 days.
Codes, standards, and researchers used an empirical equation in the form of Eq. 6.4 to correlate
the flexural strength of concrete, 𝑓𝑟, to its compressive strength, 𝑓𝑐′, where k and n are constants
obtained from regression analyses of experimental data. Table 6.6 summarizes the different
values of n and k considered in the current research. These design codes and standards were
developed based on data of CC. Fig. 6.36 presents comparisons between the experimental results
of 𝑓𝑟 and those obtained using Eq. 6.4 with n and k values of the ACI 318-14 [133], AS 3600
[134], and CEB-FIP model code [135]. It is worth noting that the CEB-FIP equation that was
calculated for beam had a depth of 6 in.
𝑓𝑟 = 𝑘(𝑓𝑐′)𝑛 (6.4)
More recently, researchers developed similar equations for ZCC based on 25 different sources of
FAs (13 class F FA and 12 class C FA) [48], slag [57], and a combination of class F FA and slag
[35]. Table 6.6 summarizes the parameter n and k used by the different researchers and codes.
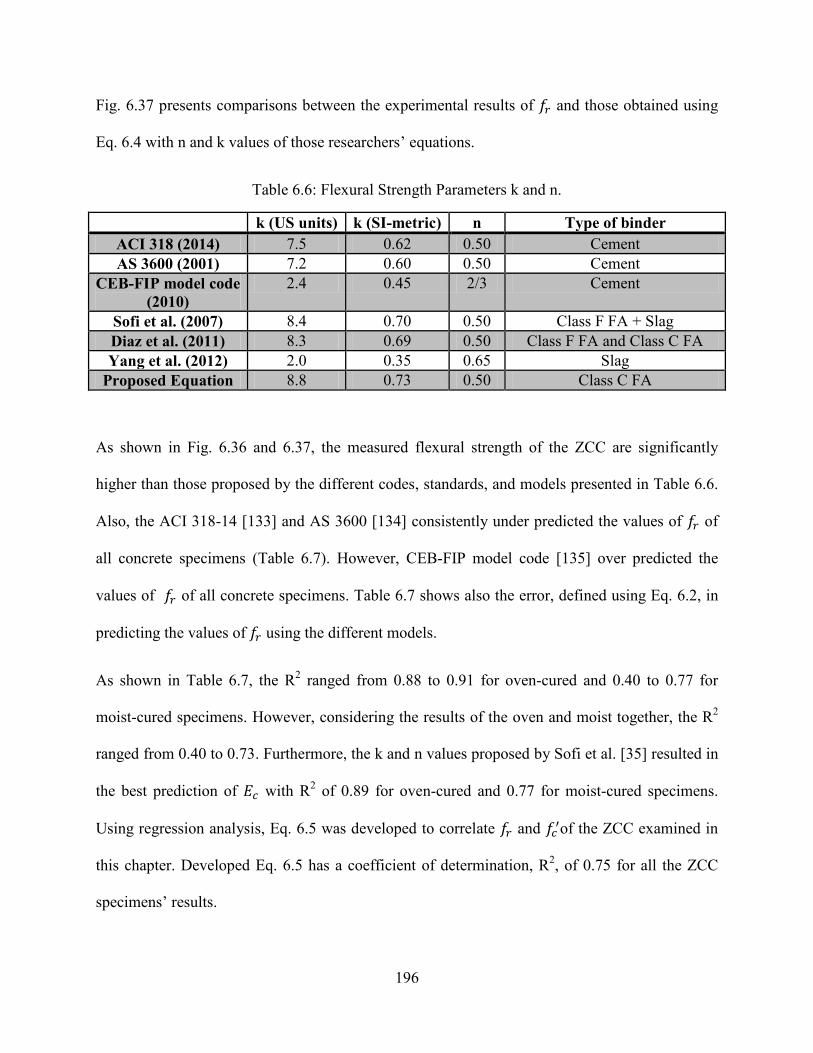
196
Fig. 6.37 presents comparisons between the experimental results of 𝑓𝑟 and those obtained using
Eq. 6.4 with n and k values of those researchers’ equations.
Table 6.6: Flexural Strength Parameters k and n.
k (US units) k (SI-metric) n Type of binder ACI 318 (2014) 7.5 0.62 0.50 Cement AS 3600 (2001) 7.2 0.60 0.50 Cement
CEB-FIP model code (2010)
2.4 0.45 2/3 Cement
Sofi et al. (2007) 8.4 0.70 0.50 Class F FA + Slag Diaz et al. (2011) 8.3 0.69 0.50 Class F FA and Class C FA Yang et al. (2012) 2.0 0.35 0.65 Slag
Proposed Equation 8.8 0.73 0.50 Class C FA
As shown in Fig. 6.36 and 6.37, the measured flexural strength of the ZCC are significantly
higher than those proposed by the different codes, standards, and models presented in Table 6.6.
Also, the ACI 318-14 [133] and AS 3600 [134] consistently under predicted the values of 𝑓𝑟 of
all concrete specimens (Table 6.7). However, CEB-FIP model code [135] over predicted the
values of 𝑓𝑟 of all concrete specimens. Table 6.7 shows also the error, defined using Eq. 6.2, in
predicting the values of 𝑓𝑟 using the different models.
As shown in Table 6.7, the R2 ranged from 0.88 to 0.91 for oven-cured and 0.40 to 0.77 for
moist-cured specimens. However, considering the results of the oven and moist together, the R2
ranged from 0.40 to 0.73. Furthermore, the k and n values proposed by Sofi et al. [35] resulted in
the best prediction of 𝐸𝑐 with R2 of 0.89 for oven-cured and 0.77 for moist-cured specimens.
Using regression analysis, Eq. 6.5 was developed to correlate 𝑓𝑟 and 𝑓𝑐′of the ZCC examined in
this chapter. Developed Eq. 6.5 has a coefficient of determination, R2, of 0.75 for all the ZCC
specimens’ results.
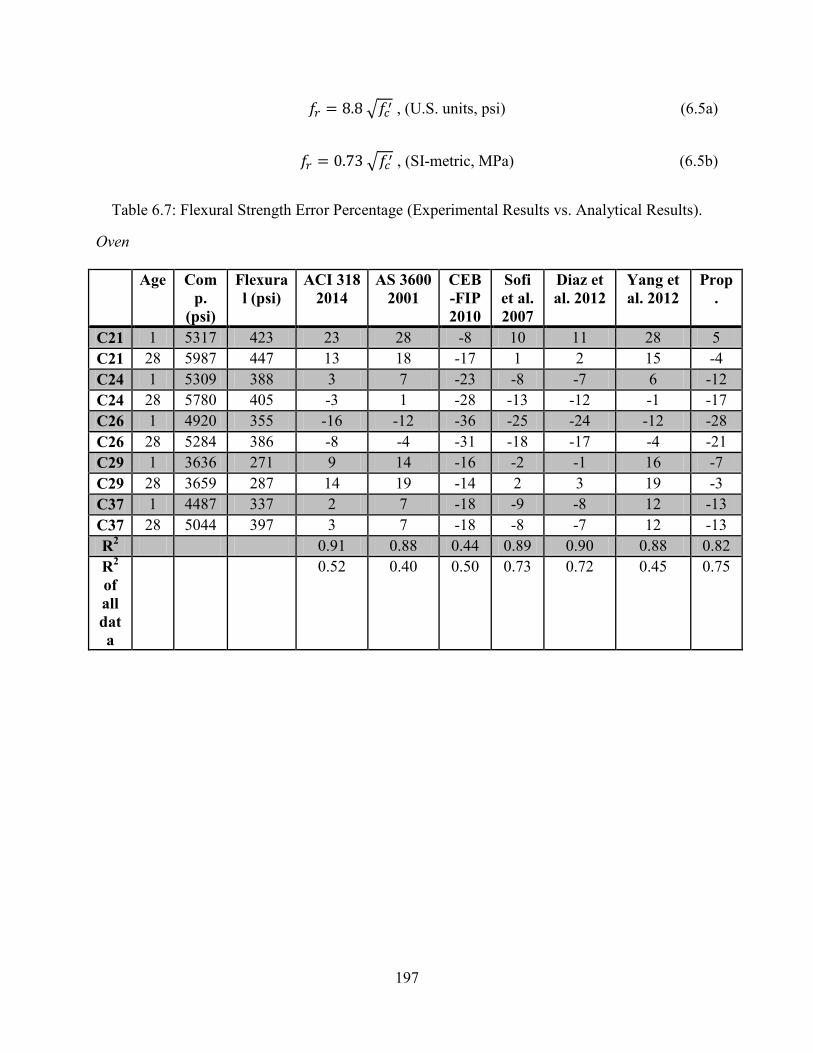
197
𝑓𝑟 = 8.8 𝑓𝑐′ , (U.S. units, psi) (6.5a)
𝑓𝑟 = 0.73 𝑓𝑐′ , (SI-metric, MPa) (6.5b)
Table 6.7: Flexural Strength Error Percentage (Experimental Results vs. Analytical Results).
Oven
Age Comp.
(psi)
Flexural (psi)
ACI 318 2014
AS 3600 2001
CEB-FIP 2010
Sofi et al. 2007
Diaz et al. 2012
Yang et al. 2012
Prop.
C21 1 5317 423 23 28 -8 10 11 28 5 C21 28 5987 447 13 18 -17 1 2 15 -4 C24 1 5309 388 3 7 -23 -8 -7 6 -12 C24 28 5780 405 -3 1 -28 -13 -12 -1 -17 C26 1 4920 355 -16 -12 -36 -25 -24 -12 -28 C26 28 5284 386 -8 -4 -31 -18 -17 -4 -21 C29 1 3636 271 9 14 -16 -2 -1 16 -7 C29 28 3659 287 14 19 -14 2 3 19 -3 C37 1 4487 337 2 7 -18 -9 -8 12 -13 C37 28 5044 397 3 7 -18 -8 -7 12 -13 R2 0.91 0.88 0.44 0.89 0.90 0.88 0.82 R2
of all data
0.52 0.40 0.50 0.73 0.72 0.45 0.75
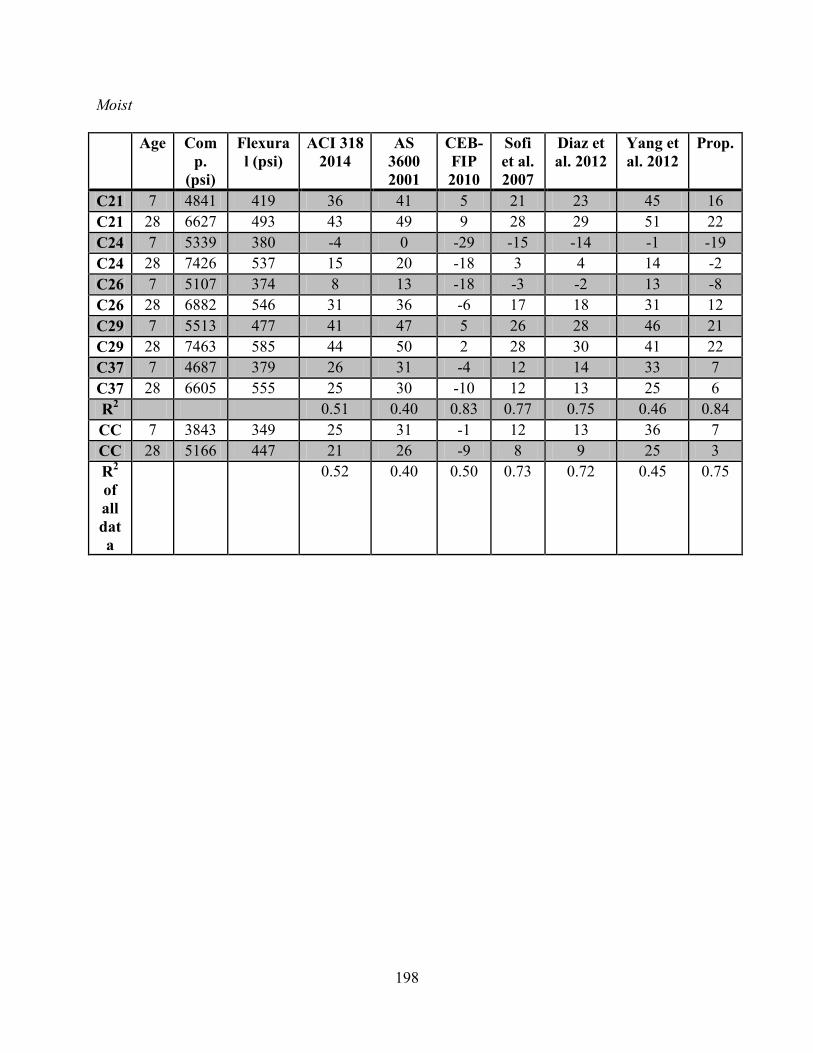
198
Moist
Age Comp.
(psi)
Flexural (psi)
ACI 318 2014
AS 3600 2001
CEB-FIP 2010
Sofi et al. 2007
Diaz et al. 2012
Yang et al. 2012
Prop.
C21 7 4841 419 36 41 5 21 23 45 16 C21 28 6627 493 43 49 9 28 29 51 22 C24 7 5339 380 -4 0 -29 -15 -14 -1 -19 C24 28 7426 537 15 20 -18 3 4 14 -2 C26 7 5107 374 8 13 -18 -3 -2 13 -8 C26 28 6882 546 31 36 -6 17 18 31 12 C29 7 5513 477 41 47 5 26 28 46 21 C29 28 7463 585 44 50 2 28 30 41 22 C37 7 4687 379 26 31 -4 12 14 33 7 C37 28 6605 555 25 30 -10 12 13 25 6 R2 0.51 0.40 0.83 0.77 0.75 0.46 0.84 CC 7 3843 349 25 31 -1 12 13 36 7 CC 28 5166 447 21 26 -9 8 9 25 3 R2
of all data
0.52 0.40 0.50 0.73 0.72 0.45 0.75
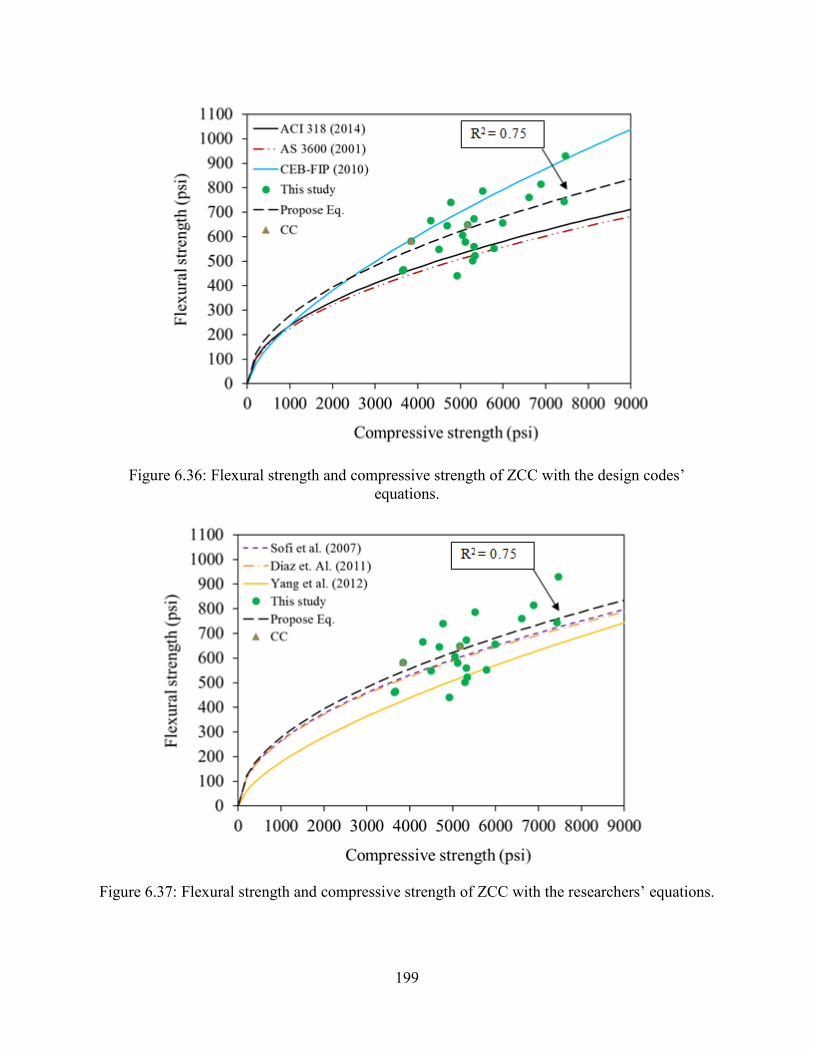
199
Figure 6.36: Flexural strength and compressive strength of ZCC with the design codes’ equations.
Figure 6.37: Flexural strength and compressive strength of ZCC with the researchers’ equations.
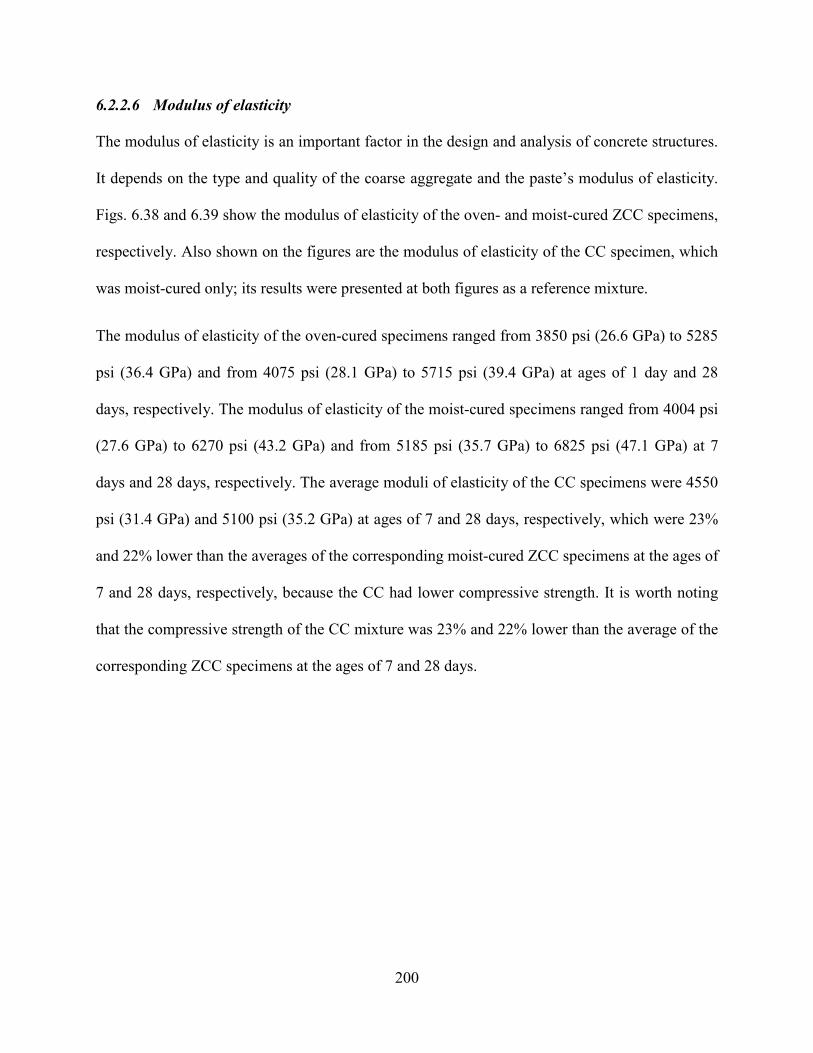
200
6.2.2.6 Modulus of elasticity
The modulus of elasticity is an important factor in the design and analysis of concrete structures.
It depends on the type and quality of the coarse aggregate and the paste’s modulus of elasticity.
Figs. 6.38 and 6.39 show the modulus of elasticity of the oven- and moist-cured ZCC specimens,
respectively. Also shown on the figures are the modulus of elasticity of the CC specimen, which
was moist-cured only; its results were presented at both figures as a reference mixture.
The modulus of elasticity of the oven-cured specimens ranged from 3850 psi (26.6 GPa) to 5285
psi (36.4 GPa) and from 4075 psi (28.1 GPa) to 5715 psi (39.4 GPa) at ages of 1 day and 28
days, respectively. The modulus of elasticity of the moist-cured specimens ranged from 4004 psi
(27.6 GPa) to 6270 psi (43.2 GPa) and from 5185 psi (35.7 GPa) to 6825 psi (47.1 GPa) at 7
days and 28 days, respectively. The average moduli of elasticity of the CC specimens were 4550
psi (31.4 GPa) and 5100 psi (35.2 GPa) at ages of 7 and 28 days, respectively, which were 23%
and 22% lower than the averages of the corresponding moist-cured ZCC specimens at the ages of
7 and 28 days, respectively, because the CC had lower compressive strength. It is worth noting
that the compressive strength of the CC mixture was 23% and 22% lower than the average of the
corresponding ZCC specimens at the ages of 7 and 28 days.
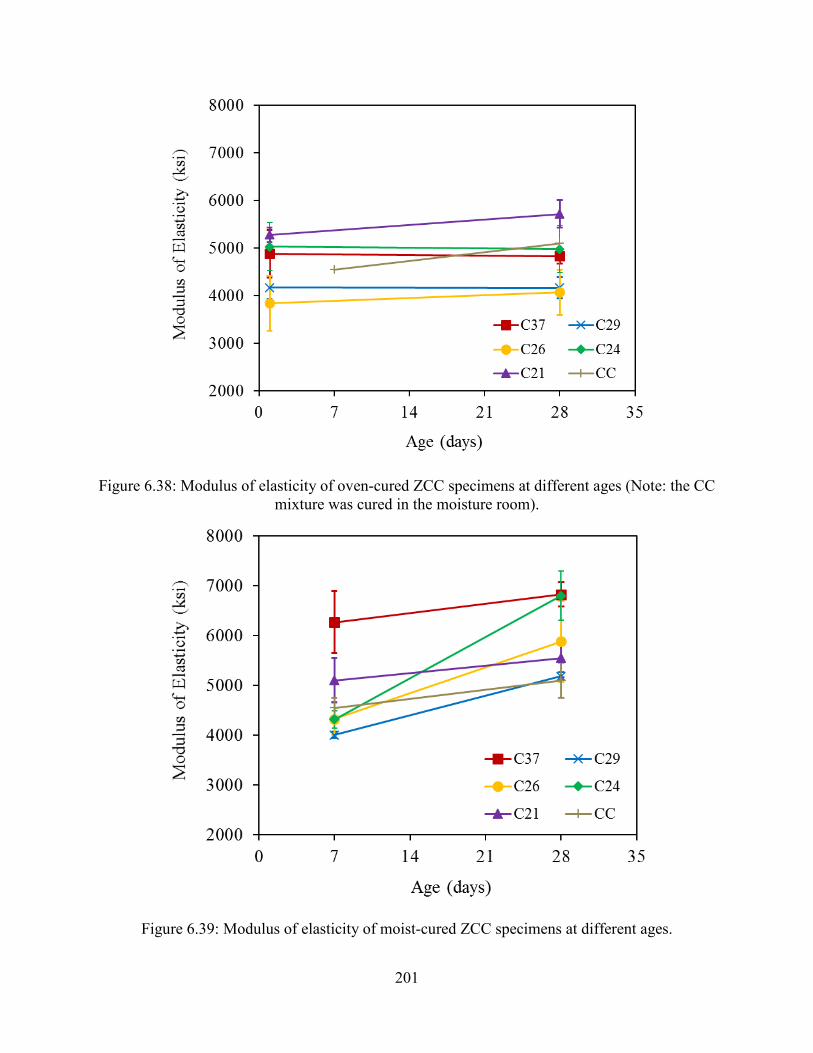
201
Figure 6.38: Modulus of elasticity of oven-cured ZCC specimens at different ages (Note: the CC mixture was cured in the moisture room).
Figure 6.39: Modulus of elasticity of moist-cured ZCC specimens at different ages.
202
The modulus of elasticity was affected by the curing regime and the FA type. For the oven
curing regime, the C21 that had the lowest calcium content showed the highest modulus of
elasticity among the five ZCC mixtures. The moduli of elasticity of the oven-cured specimens
remained approximately the same or increased slightly with time.
For the moist curing regime, C37, which had the highest calcium content, showed the highest
modulus of elasticity for the moist-cured specimens among the five ZCC mixtures. The moduli
of elasticity of the moist-cured specimens increased with time due to the availability of the
moisture during the curing time.
Codes, standards, and researchers used an empirical equation (Eq. 6.6) to correlate the modulus
of elasticity of concrete, 𝐸𝑐, to its compressive strength, 𝑓𝑐′, where k and n are constants obtained
from regression analyses of experimental data and 𝑤𝑐 is the concrete density. These codes and
standards were based on CC data. Fig. 6.36 presents comparisons between the experimental
results of 𝐸𝑐 and those obtained using Eq. 6.6 with n and k values of the ACI 318-14 [133] and
CEB-FIP model code [135]. It worth noting that ACI 318-14 [133] presented two equations; one
of them takes the concrete density into consideration and the second equation does not (Table
6.8). These design codes and standards were developed based on CC data. The modulus of
elasticity of the ZCC ranged from 1450 ksi (10 GPa) to 5800 ksi (40 GPa) which is in the same
range of the CC [71]. Fig. 6.40 presents comparisons between the experimental results of 𝐸𝑐 and
those obtained using Eq. 6.6 with n and k values of the ACI 318-14 [133] and CEB-FIP model
code [135]. It is important to mention that the plotted equations included the concrete density in
Fig. 6.40, the concrete density considered as 152.84 lb/ft3, which was the average density of the
ZCC mixtures.
𝐸𝑐 = 𝑘 (𝑤𝑐/𝑏)𝑚 (𝑓𝑐′/𝑎)𝑛 (6.6)
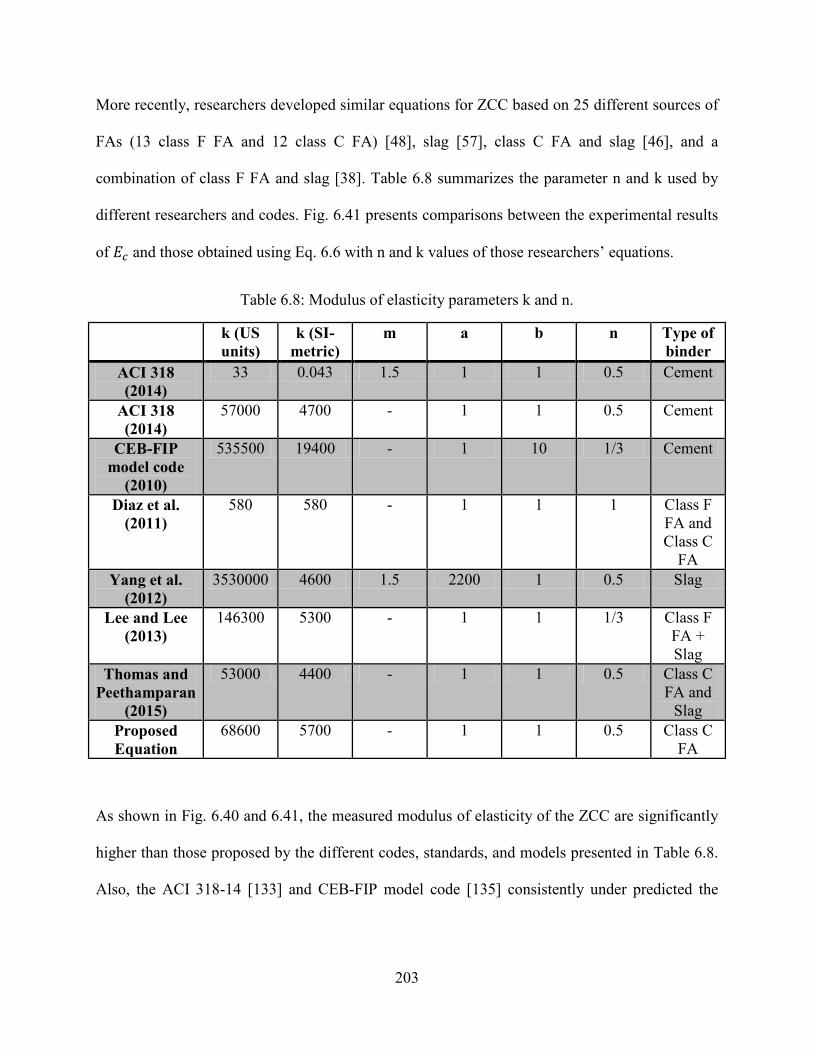
203
More recently, researchers developed similar equations for ZCC based on 25 different sources of
FAs (13 class F FA and 12 class C FA) [48], slag [57], class C FA and slag [46], and a
combination of class F FA and slag [38]. Table 6.8 summarizes the parameter n and k used by
different researchers and codes. Fig. 6.41 presents comparisons between the experimental results
of 𝐸𝑐 and those obtained using Eq. 6.6 with n and k values of those researchers’ equations.
Table 6.8: Modulus of elasticity parameters k and n.
k (US units)
k (SI-metric)
m a b n Type of binder
ACI 318 (2014)
33 0.043 1.5 1 1 0.5 Cement
ACI 318 (2014)
57000 4700 - 1 1 0.5 Cement
CEB-FIP model code
(2010)
535500 19400 - 1 10 1/3 Cement
Diaz et al. (2011)
580 580 - 1 1 1 Class F FA and Class C
FA Yang et al.
(2012) 3530000 4600 1.5 2200 1 0.5 Slag
Lee and Lee (2013)
146300 5300 - 1 1 1/3 Class F FA + Slag
Thomas and Peethamparan
(2015)
53000 4400 - 1 1 0.5 Class C FA and
Slag Proposed Equation
68600 5700 - 1 1 0.5 Class C FA
As shown in Fig. 6.40 and 6.41, the measured modulus of elasticity of the ZCC are significantly
higher than those proposed by the different codes, standards, and models presented in Table 6.8.
Also, the ACI 318-14 [133] and CEB-FIP model code [135] consistently under predicted the
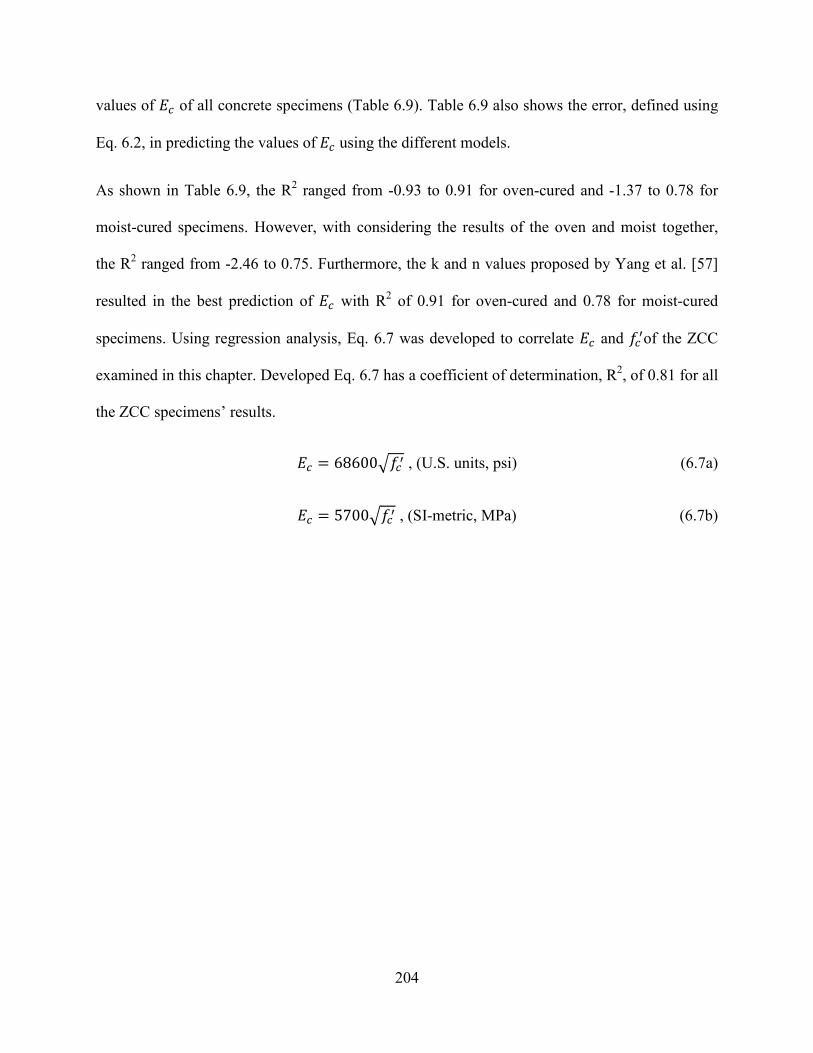
204
values of 𝐸𝑐 of all concrete specimens (Table 6.9). Table 6.9 also shows the error, defined using
Eq. 6.2, in predicting the values of 𝐸𝑐 using the different models.
As shown in Table 6.9, the R2 ranged from -0.93 to 0.91 for oven-cured and -1.37 to 0.78 for
moist-cured specimens. However, with considering the results of the oven and moist together,
the R2 ranged from -2.46 to 0.75. Furthermore, the k and n values proposed by Yang et al. [57]
resulted in the best prediction of 𝐸𝑐 with R2 of 0.91 for oven-cured and 0.78 for moist-cured
specimens. Using regression analysis, Eq. 6.7 was developed to correlate 𝐸𝑐 and 𝑓𝑐′of the ZCC
examined in this chapter. Developed Eq. 6.7 has a coefficient of determination, R2, of 0.81 for all
the ZCC specimens’ results.
𝐸𝑐 = 68600𝑓𝑐′ , (U.S. units, psi) (6.7a)
𝐸𝑐 = 5700𝑓𝑐′ , (SI-metric, MPa) (6.7b)
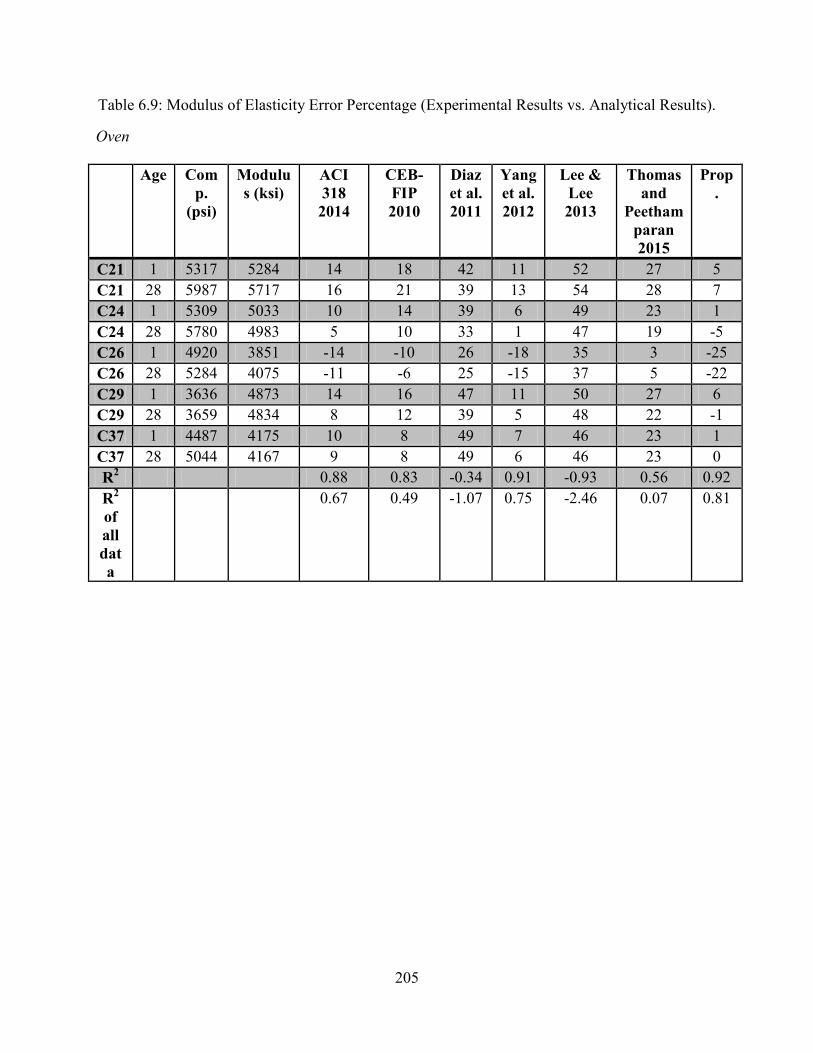
205
Table 6.9: Modulus of Elasticity Error Percentage (Experimental Results vs. Analytical Results).
Oven
Age Comp.
(psi)
Modulus (ksi)
ACI 318 2014
CEB-FIP 2010
Diaz et al. 2011
Yang et al. 2012
Lee & Lee 2013
Thomas and
Peethamparan 2015
Prop.
C21 1 5317 5284 14 18 42 11 52 27 5 C21 28 5987 5717 16 21 39 13 54 28 7 C24 1 5309 5033 10 14 39 6 49 23 1 C24 28 5780 4983 5 10 33 1 47 19 -5 C26 1 4920 3851 -14 -10 26 -18 35 3 -25 C26 28 5284 4075 -11 -6 25 -15 37 5 -22 C29 1 3636 4873 14 16 47 11 50 27 6 C29 28 3659 4834 8 12 39 5 48 22 -1 C37 1 4487 4175 10 8 49 7 46 23 1 C37 28 5044 4167 9 8 49 6 46 23 0 R2 0.88 0.83 -0.34 0.91 -0.93 0.56 0.92 R2
of all data
0.67 0.49 -1.07 0.75 -2.46 0.07 0.81
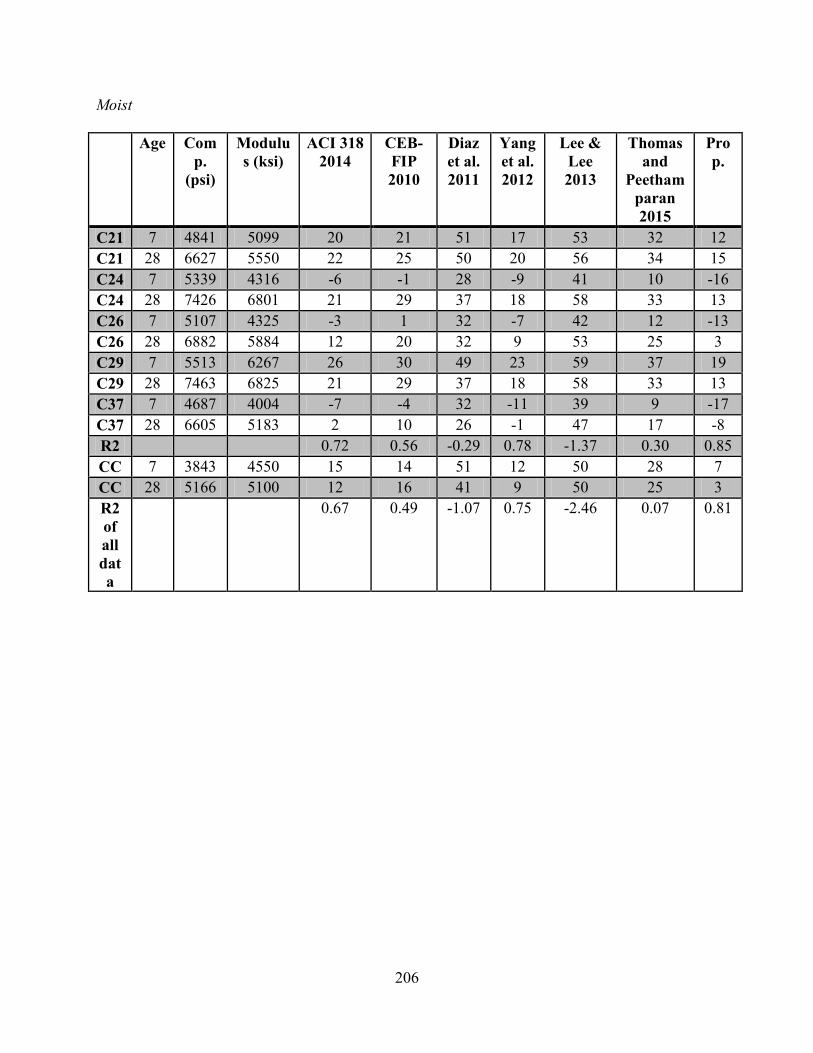
206
Moist
Age Comp.
(psi)
Modulus (ksi)
ACI 318 2014
CEB-FIP 2010
Diaz et al. 2011
Yang et al. 2012
Lee & Lee 2013
Thomas and
Peethamparan 2015
Prop.
C21 7 4841 5099 20 21 51 17 53 32 12 C21 28 6627 5550 22 25 50 20 56 34 15 C24 7 5339 4316 -6 -1 28 -9 41 10 -16 C24 28 7426 6801 21 29 37 18 58 33 13 C26 7 5107 4325 -3 1 32 -7 42 12 -13 C26 28 6882 5884 12 20 32 9 53 25 3 C29 7 5513 6267 26 30 49 23 59 37 19 C29 28 7463 6825 21 29 37 18 58 33 13 C37 7 4687 4004 -7 -4 32 -11 39 9 -17 C37 28 6605 5183 2 10 26 -1 47 17 -8 R2 0.72 0.56 -0.29 0.78 -1.37 0.30 0.85 CC 7 3843 4550 15 14 51 12 50 28 7 CC 28 5166 5100 12 16 41 9 50 25 3 R2 of all data
0.67 0.49 -1.07 0.75 -2.46 0.07 0.81
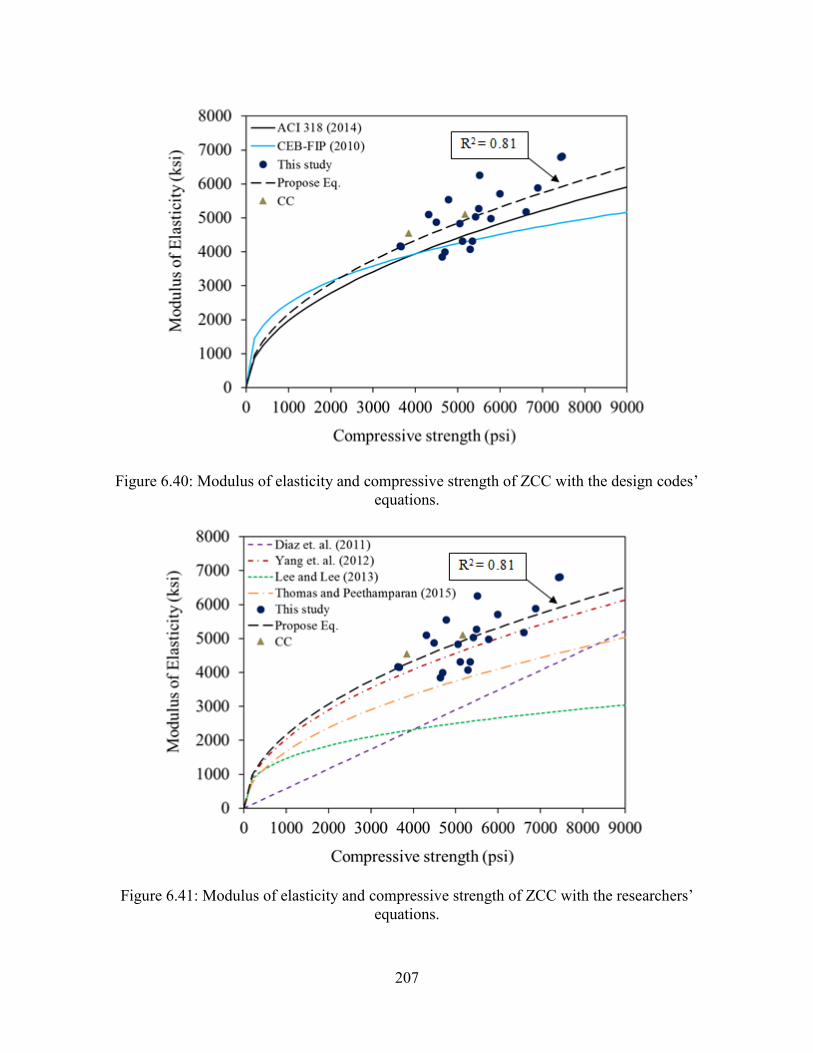
207
Figure 6.40: Modulus of elasticity and compressive strength of ZCC with the design codes’ equations.
Figure 6.41: Modulus of elasticity and compressive strength of ZCC with the researchers’ equations.

208
6.2.2.7 Drying shrinkage
Figs. 6.42, 6.43, and 6.44 show the drying shrinkage values of three curing and storing methods;
the oven-cured specimens that were tested directly after 24 hours of oven curing, the oven-cured
specimens that were stored for 28 days then tested, and the moist-cured specimens that were
stored for 28 days then tested, respectively. The drying shrinkage values of the CC mixture is
also shown in the figures. The CC was moist-cured only and stored for 28 days then tested.
Figure 6.42: Shrinkage results of the oven-cured specimens tested directly after 24 hours of oven curing.
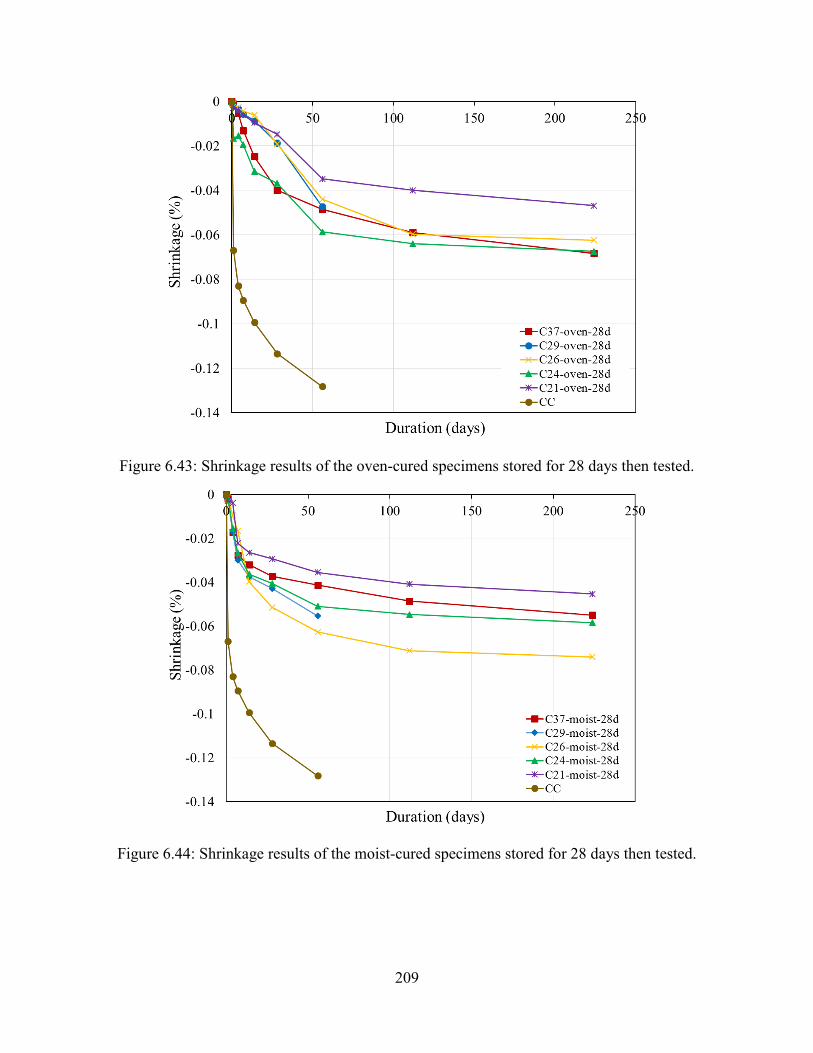
209
Figure 6.43: Shrinkage results of the oven-cured specimens stored for 28 days then tested.
Figure 6.44: Shrinkage results of the moist-cured specimens stored for 28 days then tested.
210
As shown in the figure, the drying shrinkage values of the oven-cured ZCC specimens were
significantly less than those of the CC mixture. At 56 days, the drying shrinkage values of the
ZCC mixtures ranged from 0.0216% to 0.0344% with an average of 0.029%, from 0.0348% to
0.0587% with an average of 0.0467%, and from 0.0355% to 0.0627% with an average of
0.0491%, for the oven-cured specimens that were tested directly after 24 hours of oven curing,
the oven-cured specimens that were stored for 28 days then tested, and the moist-cured
specimens that were stored for 28 days then tested, respectively. However, at 56 days, the drying
shrinkage of the CC mixture was 0.1282%. Hence the drying shrinkage of the ZCC mixtures at
56 days are 77%, 64%, and 62% lower than that of the CC mixture.
The curing regime was also a prominent influential parameter on the drying shrinkage. At 224
days, the drying shrinkage values ranged from 0.0336% to 0.0555% with an average of 0.0463%,
from 0.0468% to 0.0683% with an average of 0.0613%, and from 0.0453% to 0.074% with an
average of 0.0582% for the oven-cured specimens that were tested directly after 24 hours of oven
curing, the oven-cured specimens that were stored for 28 days then tested, and the moist-cured
specimens that were stored for 28 days then tested, respectively.
6.3 Findings and Conclusions This chapter presents the mechanical properties of ZCC mixtures synthesized from FA sourced
from five different locations in Missouri. A reference CC mixture was prepared and tested as
well. The ZCC mixtures were subjected to three curing regime namely oven, ambient, and moist.
The compressive strength, splitting tensile, modulus of rupture, modulus of elasticity, and drying
shrinkage of each ZCC mixture were determined. The following conclusions can be drawn from
this investigation:
211
• The oven curing regime is more suitable for the ZCCs that were synthesized using FA having
a lower calcium content while ambient and moist curing are more suitable for ZCC that were
synthesized using FA having a high calcium content. C21, C24, C26, C29, and C37
displayed compressive strengths of 5485, 5410, 4630, 3635, and 4485 psi after curing at 158o
F (70 o C) for 24 hours. However, C21, C24, C26, C29, and C37 displayed compressive
strengths of 4305, 3995, 4420, 4525, and 5170 psi after 7 days and 4770, 4270, 4465, 4825,
and 5310 psi after 28 days of ambient curing. Furthermore, C21, C24, C26, C29, and C37
displayed compressive strengths of 4840, 5340, 5105, 4685, and 5510 psi after 7 days and
6625, 7425, 6880, 6605, and 7465 psi after 28 days of moist curing, respectively.
• The compressive strength significantly increased from 1 to 7 days for moist and ambient-
cured specimens while it remained approximately constant for oven curing beyond 1 day.
The increases in compressive strength of the ZCC from 1 day to 7 days were 976%, 902%
1079%, 72%, and 88% for ambient-cured and 1110%, 1238%, 1299%, 88%, and 100% for
moist-cured specimens for C21,C24, C26, C29, and C37 respectively. Beyond 7 days, the
rates of increase in the strength decreased. The increases in compressive strength from 7 days
to 28 days were 10.9%, 6.8%, 1.0%, 6.7%, and 2.7% for ambient-cured and 36.9%, 39.1%,
34.8%, 40.9%, and 35.4% for moist-cured specimens for C21, C24, C26, C29, and C37,
respectively. For oven curing, the compressive strength increased by 8.4%, 12.4%, 6.4%,
0.7%, 11.0% for C21, C24, C26, C29, and C37, respectively, from the age of 1 day to 28
days.
• The relationships between the compressive strength of ZCC and splitting tensile strength,
flexural strength, and modulus of elasticity are similar to those used by ACI 318-14 [133],
AS 3600 [134] design code, and CEB-FIP model code [135].
212
• The ACI 318-14 [133] and CEB-FIP model code [135] overestimated the splitting tensile
strength of ZCC by an average of 9% and 11%, respectively, while AS 3600 [134]
underestimated the splitting tensile strength by 27%. Furthermore, the ACI 318-14 [133] and
CEB-FIB [135] also overestimated the splitting tensile strength of CC by 12% and 9%,
respectively.
• The CEB-FIP model code [135] overestimated the flexural strength of ZCC by an average of
9%, while ACI 318-14 [133] and AS 3600 [134] underestimated the flexural strength by 24%
and 29%, respectively. Furthermore, CEB-FIB [135] also overestimated the splitting tensile
strength of CC by 5%.
• The ACI 318-14 [133] and CEB-FIP model code [135] underestimated the modulus of
elasticity of ZCC by an average of 12% and 20%, respectively.
• The drying shrinkage values of the ZCC specimens with different curing regimes at all ages
were significantly lower than those of the CC specimens. At 56 days, the average shrinkage
values of ZCC were 0.029%, 0.0467%, and 0.0491% for the oven-cured specimens that were
tested directly after 24 hours of oven curing, the oven-cured specimens that were stored for
28 days then tested, and, the moist-cured specimens that were stored for 28 days then tested,
respectively, while it was 0.1282% for the moist-cured CC specimens. This indicates that the
ZCC would display fewer cracks during its service life, resulting in less penetration of any
deicing or other harmful salts that could cause deterioration.
213
Chapter 7: Durability of Zero-Cement Concrete
With an average of 110 days with temperatures below 32o F (0o C), freeze-thaw durability is a
crucial issue in the state of Missouri, as there is considerable degradation of concrete pavements
and roads.
The durability of zero-cement concrete (ZCC) is presented in this chapter. Durability was
investigated by testing freeze-thaw resistance, surface resistivity, bulk electrical conductivity,
and rapid chloride ion penetration per ASTM C666-15 [74], AASHTO TP 95 [137], ASTM
C1760-12 [138], and ASTM C1202-17 [139], respectively.
Freeze-thaw damage is caused by unreacted free water molecules that freeze and expand at low
temperatures, breaking the cementitious binders[140]. There are two possible solutions to this
issue: either reduce free water in the matrix, or introduce admixtures that control air voids to
dissipate the stress from free water expansion that leads to disintegration of the paste structure
[141-143]. However, all admixtures are designed specifically for OPC, which behaves
considerably differently to FA. Hence, this chapter focuses mainly on investigating the
performance of ZCC without any admixtures. The results are compared to those of CC without
any admixtures as well.
7.1 Experimental Program
7.1.1 Materials
Chapter 2 of this report details the materials used for the concrete mixtures presented in this
chapter including the alkali activators, sand, coarse aggregate, FAs, and slag. As discussed in
Chapter 2, different batches of FA were received and used during the course of this project. Five
214
FAs, FA37, FA29, FA26, FA24, and FA21 of the second batch, were used to prepare the
concrete mixtures presented in this chapter. A 5000 psi MoDOT conventional concrete (CC)
mixture was also prepared and tested along with the ZC concrete mixtures for comparison
purpose.
7.1.2 Mix design
The optimum Alk/FA, and SS/SH in ZCC were 0.30 and 1.0 as presented in Chapter 4,
respectively, and they were used in the mixture investigated throughout this chapter. The W/FA
was adjusted in each mixture based on the FA chemical composition and physical properties to
have good workability. The mixtures used in this chapter are shown in Table 7.1. As shown in
the table, those mixtures are similar to those used and presented in Chapter 4. Furthermore, the
literature proposes that adding slag to the FA improves the freeze and thaw resistance of ZCC
[39]. Hence, two types of slags, S1 and S2, were used as a partial replacement of the FA in C26
mixture which was prepared using FA26, which has medium calcium content. Similarly, a crumb
rubber was added to mixture C37 as an additive with volume equals to 4% of the total volume of
the mixture for investigating the effect of the rubber on the freeze and thaw resistance of ZCC. In
addition, an air entraining admixture (AEA), BASF Master AE200, was added to mixture C21 to
study its effect on the freeze and thaw resistance of ZCC. The AEA dosage was 0.51 mft3/100lb
(32 mL/100 kg) of the FA.
The nomenclatures of the ZCC mixtures start with the letter “C” for concrete, followed by “S”
for a mixture with slag as a partial replacement, followed by the calcium content percentage of
the FA used, followed by 1 or 2 to indicate which type of slag was used in that mixture, followed
by O for oven curing or M for moist curing. For example, CS26-1M is a ZCC made of an FA
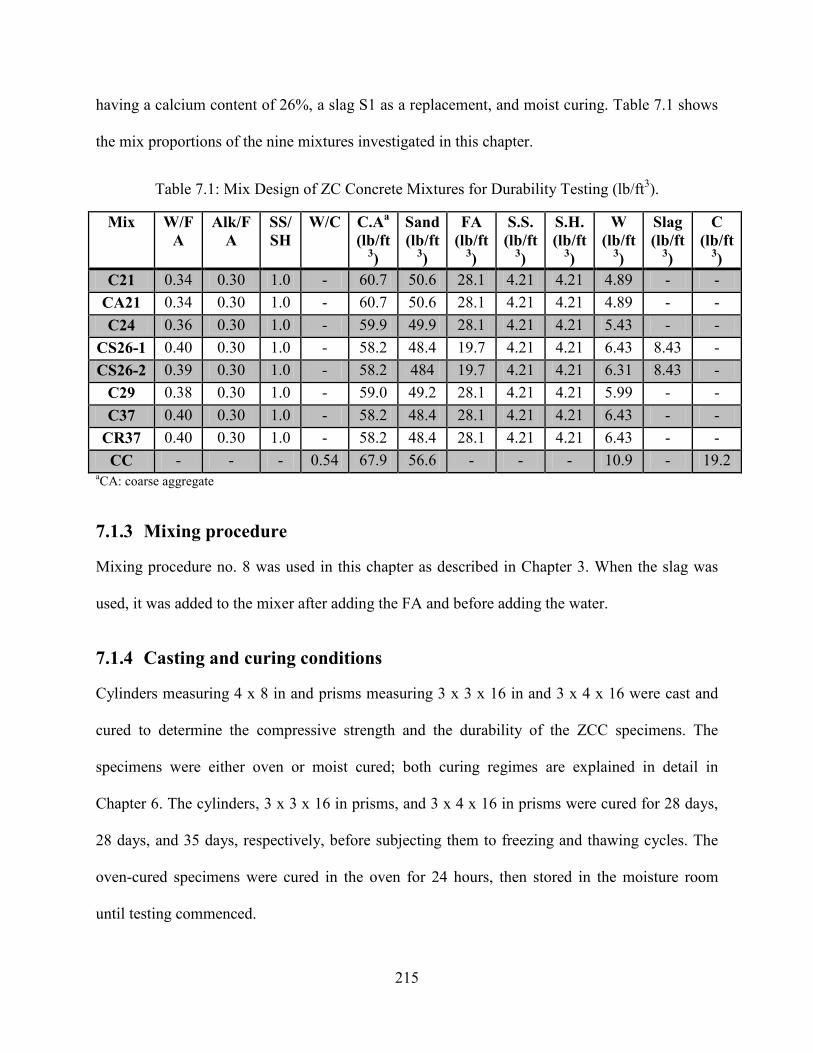
215
having a calcium content of 26%, a slag S1 as a replacement, and moist curing. Table 7.1 shows
the mix proportions of the nine mixtures investigated in this chapter.
Table 7.1: Mix Design of ZC Concrete Mixtures for Durability Testing (lb/ft3).
Mix W/FA
Alk/FA
SS/SH
W/C C.Aa (lb/ft
3)
Sand (lb/ft
3)
FA (lb/ft
3)
S.S. (lb/ft
3)
S.H. (lb/ft
3)
W (lb/ft
3)
Slag (lb/ft
3)
C (lb/ft
3)
C21 0.34 0.30 1.0 - 60.7 50.6 28.1 4.21 4.21 4.89 - - CA21 0.34 0.30 1.0 - 60.7 50.6 28.1 4.21 4.21 4.89 - - C24 0.36 0.30 1.0 - 59.9 49.9 28.1 4.21 4.21 5.43 - -
CS26-1 0.40 0.30 1.0 - 58.2 48.4 19.7 4.21 4.21 6.43 8.43 - CS26-2 0.39 0.30 1.0 - 58.2 484 19.7 4.21 4.21 6.31 8.43 -
C29 0.38 0.30 1.0 - 59.0 49.2 28.1 4.21 4.21 5.99 - - C37 0.40 0.30 1.0 - 58.2 48.4 28.1 4.21 4.21 6.43 - -
CR37 0.40 0.30 1.0 - 58.2 48.4 28.1 4.21 4.21 6.43 - - CC - - - 0.54 67.9 56.6 - - - 10.9 - 19.2
aCA: coarse aggregate
7.1.3 Mixing procedure
Mixing procedure no. 8 was used in this chapter as described in Chapter 3. When the slag was
used, it was added to the mixer after adding the FA and before adding the water.
7.1.4 Casting and curing conditions
Cylinders measuring 4 x 8 in and prisms measuring 3 x 3 x 16 in and 3 x 4 x 16 were cast and
cured to determine the compressive strength and the durability of the ZCC specimens. The
specimens were either oven or moist cured; both curing regimes are explained in detail in
Chapter 6. The cylinders, 3 x 3 x 16 in prisms, and 3 x 4 x 16 in prisms were cured for 28 days,
28 days, and 35 days, respectively, before subjecting them to freezing and thawing cycles. The
oven-cured specimens were cured in the oven for 24 hours, then stored in the moisture room
until testing commenced.
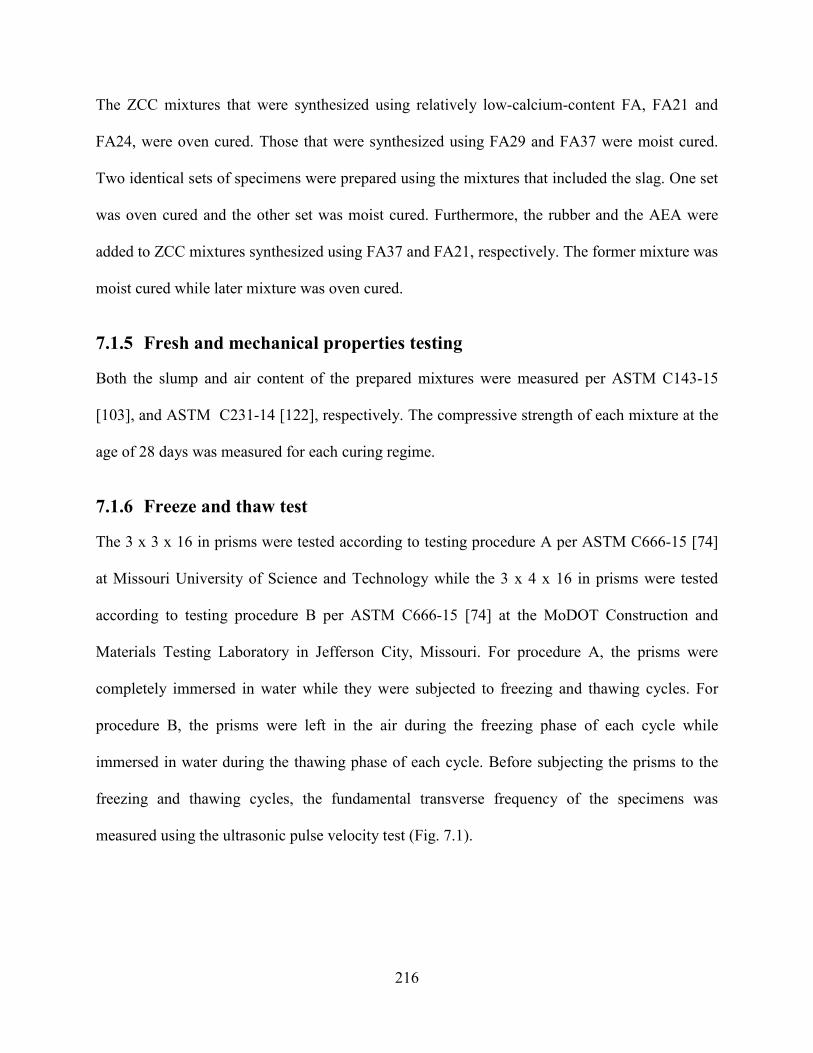
216
The ZCC mixtures that were synthesized using relatively low-calcium-content FA, FA21 and
FA24, were oven cured. Those that were synthesized using FA29 and FA37 were moist cured.
Two identical sets of specimens were prepared using the mixtures that included the slag. One set
was oven cured and the other set was moist cured. Furthermore, the rubber and the AEA were
added to ZCC mixtures synthesized using FA37 and FA21, respectively. The former mixture was
moist cured while later mixture was oven cured.
7.1.5 Fresh and mechanical properties testing
Both the slump and air content of the prepared mixtures were measured per ASTM C143-15
[103], and ASTM C231-14 [122], respectively. The compressive strength of each mixture at the
age of 28 days was measured for each curing regime.
7.1.6 Freeze and thaw test
The 3 x 3 x 16 in prisms were tested according to testing procedure A per ASTM C666-15 [74]
at Missouri University of Science and Technology while the 3 x 4 x 16 in prisms were tested
according to testing procedure B per ASTM C666-15 [74] at the MoDOT Construction and
Materials Testing Laboratory in Jefferson City, Missouri. For procedure A, the prisms were
completely immersed in water while they were subjected to freezing and thawing cycles. For
procedure B, the prisms were left in the air during the freezing phase of each cycle while
immersed in water during the thawing phase of each cycle. Before subjecting the prisms to the
freezing and thawing cycles, the fundamental transverse frequency of the specimens was
measured using the ultrasonic pulse velocity test (Fig. 7.1).
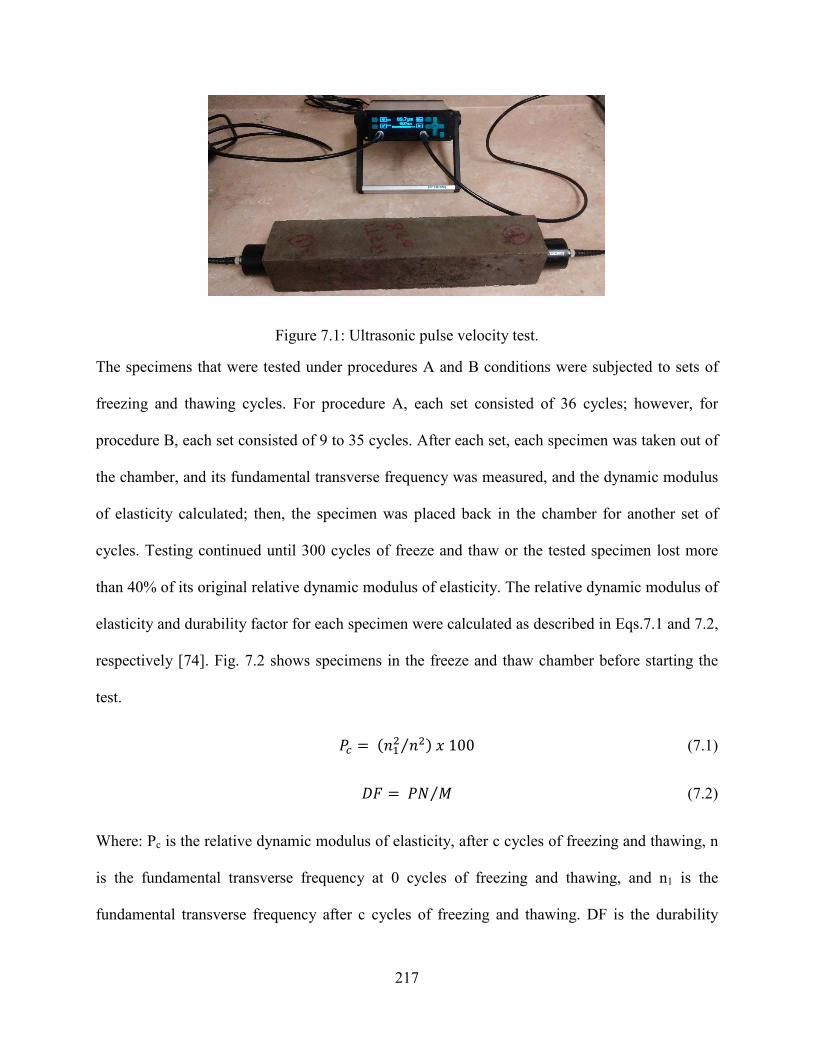
217
Figure 7.1: Ultrasonic pulse velocity test.
The specimens that were tested under procedures A and B conditions were subjected to sets of
freezing and thawing cycles. For procedure A, each set consisted of 36 cycles; however, for
procedure B, each set consisted of 9 to 35 cycles. After each set, each specimen was taken out of
the chamber, and its fundamental transverse frequency was measured, and the dynamic modulus
of elasticity calculated; then, the specimen was placed back in the chamber for another set of
cycles. Testing continued until 300 cycles of freeze and thaw or the tested specimen lost more
than 40% of its original relative dynamic modulus of elasticity. The relative dynamic modulus of
elasticity and durability factor for each specimen were calculated as described in Eqs.7.1 and 7.2,
respectively [74]. Fig. 7.2 shows specimens in the freeze and thaw chamber before starting the
test.
𝑃𝑐 = (𝑛12 𝑛2⁄ ) 𝑥 100 (7.1)
𝐷𝐹 = 𝑃𝑁 𝑀⁄ (7.2)
Where: Pc is the relative dynamic modulus of elasticity, after c cycles of freezing and thawing, n
is the fundamental transverse frequency at 0 cycles of freezing and thawing, and n1 is the
fundamental transverse frequency after c cycles of freezing and thawing. DF is the durability

218
factor, P is the relative dynamic modulus of elasticity at N cycles, N being the number of cycles
at which P reaches the specified minimum value for discontinuing the test or the specified
number of cycles at which the exposure is to be terminated, whichever is less, and M being the
specified number of cycles at which the exposure is to be terminated [74].
Figure 7.2: Freeze and thaw chamber for procedure A of ASTM C666-15 [74].
7.1.7 Surface resistivity
The concrete is a porous material, and the solid part of the concrete has a high surface resistivity.
However, capillary pores that are fully or partially saturated with water have a lower relative
resistivity as the electrical current can flow through these pores. Therefore, the surface resistivity
can indicate the quality of the concrete, where low resistivity indicates more porous concrete.
Low permeability results from a small pore network with low connectivity leading to high
electrical resistivity.
The electrical resistivity ρ (Eq. 7.3) is a function of the applied voltage V by the instrument on
the specimen, the resulting current flow I intensity due to the applied voltage on the specimen,
and the specimen constant k which is the geometrical parameter (Eq. 7.4) that is a function of the
size and the shape of the specimen γ (dimensionless factor) as well as the distance between the
electrodes a (Eq. 3) [144].
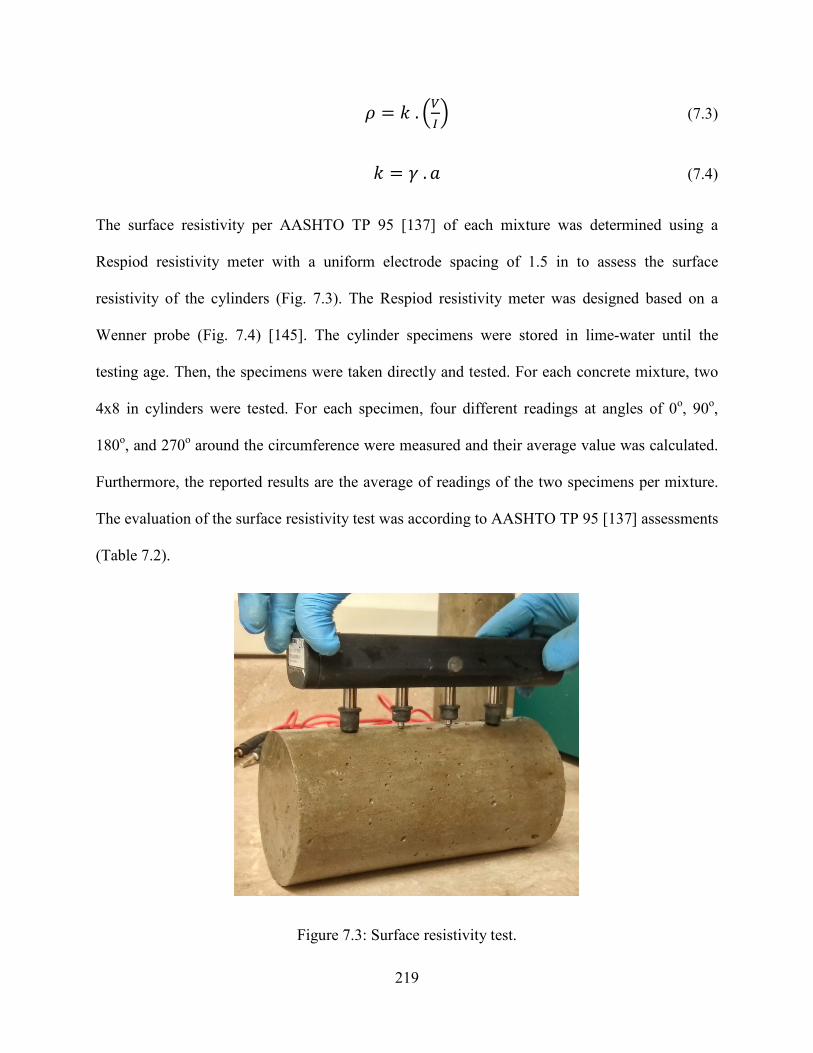
219
𝜌 = 𝑘 . 𝑉𝐼 (7.3)
𝑘 = 𝛾 .𝑎 (7.4)
The surface resistivity per AASHTO TP 95 [137] of each mixture was determined using a
Respiod resistivity meter with a uniform electrode spacing of 1.5 in to assess the surface
resistivity of the cylinders (Fig. 7.3). The Respiod resistivity meter was designed based on a
Wenner probe (Fig. 7.4) [145]. The cylinder specimens were stored in lime-water until the
testing age. Then, the specimens were taken directly and tested. For each concrete mixture, two
4x8 in cylinders were tested. For each specimen, four different readings at angles of 0o, 90o,
180o, and 270o around the circumference were measured and their average value was calculated.
Furthermore, the reported results are the average of readings of the two specimens per mixture.
The evaluation of the surface resistivity test was according to AASHTO TP 95 [137] assessments
(Table 7.2).
Figure 7.3: Surface resistivity test.
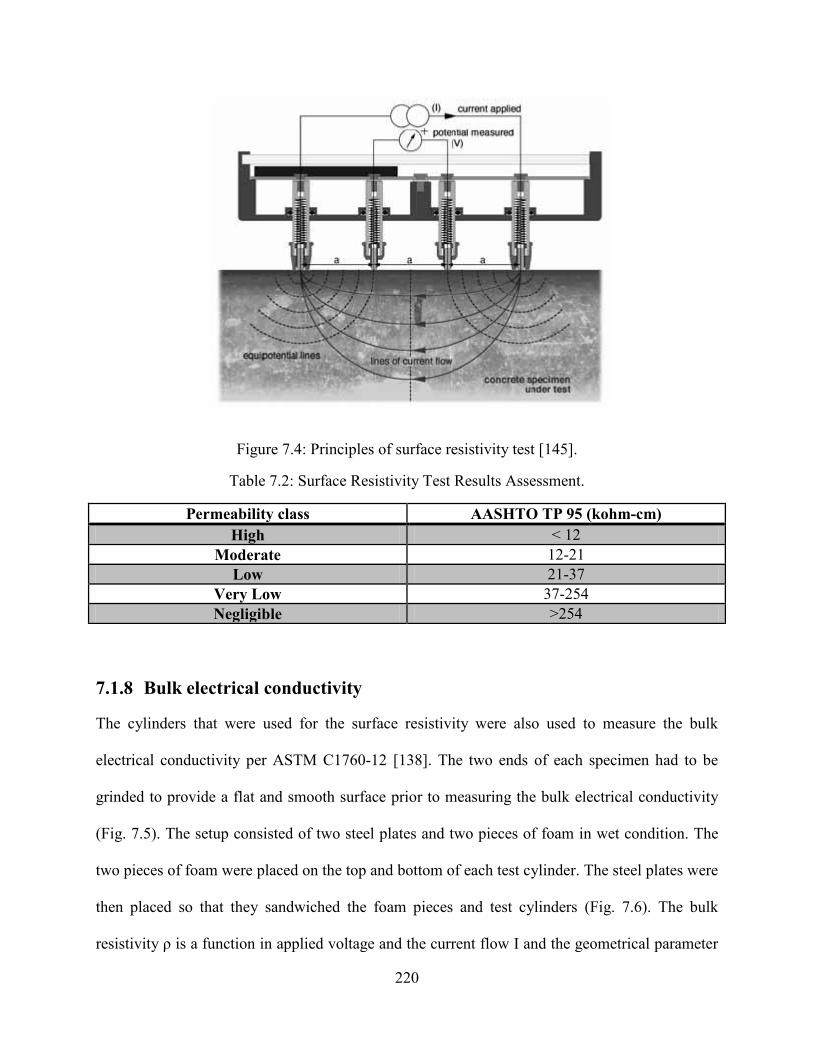
220
Figure 7.4: Principles of surface resistivity test [145].
Table 7.2: Surface Resistivity Test Results Assessment.
Permeability class AASHTO TP 95 (kohm-cm) High < 12
Moderate 12-21 Low 21-37
Very Low 37-254 Negligible >254
7.1.8 Bulk electrical conductivity
The cylinders that were used for the surface resistivity were also used to measure the bulk
electrical conductivity per ASTM C1760-12 [138]. The two ends of each specimen had to be
grinded to provide a flat and smooth surface prior to measuring the bulk electrical conductivity
(Fig. 7.5). The setup consisted of two steel plates and two pieces of foam in wet condition. The
two pieces of foam were placed on the top and bottom of each test cylinder. The steel plates were
then placed so that they sandwiched the foam pieces and test cylinders (Fig. 7.6). The bulk
resistivity ρ is a function in applied voltage and the current flow I and the geometrical parameter
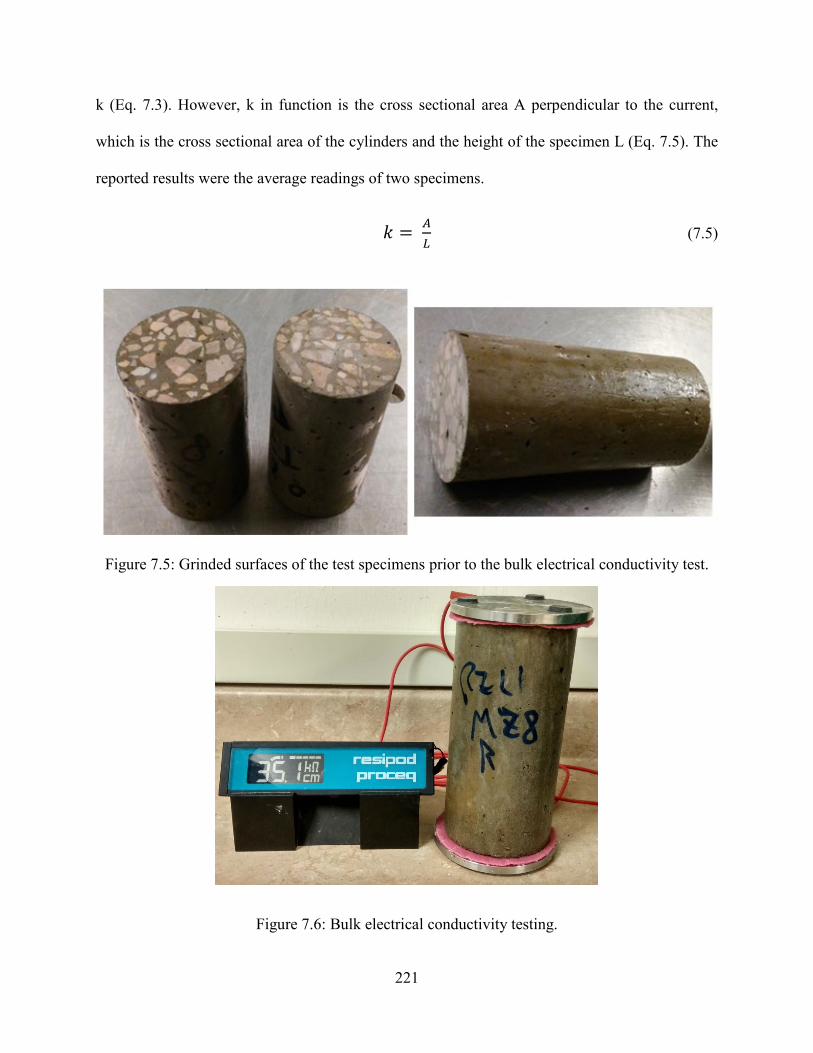
221
k (Eq. 7.3). However, k in function is the cross sectional area A perpendicular to the current,
which is the cross sectional area of the cylinders and the height of the specimen L (Eq. 7.5). The
reported results were the average readings of two specimens.
𝑘 = 𝐴𝐿 (7.5)
Figure 7.5: Grinded surfaces of the test specimens prior to the bulk electrical conductivity test.
Figure 7.6: Bulk electrical conductivity testing.
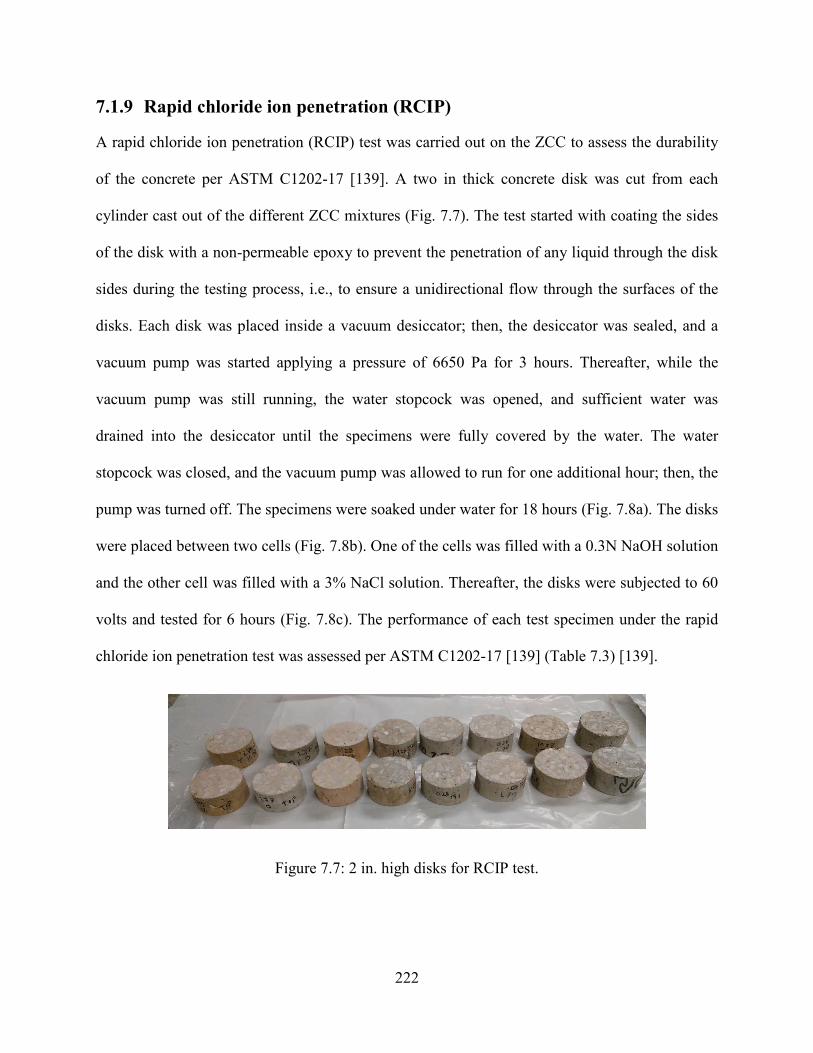
222
7.1.9 Rapid chloride ion penetration (RCIP)
A rapid chloride ion penetration (RCIP) test was carried out on the ZCC to assess the durability
of the concrete per ASTM C1202-17 [139]. A two in thick concrete disk was cut from each
cylinder cast out of the different ZCC mixtures (Fig. 7.7). The test started with coating the sides
of the disk with a non-permeable epoxy to prevent the penetration of any liquid through the disk
sides during the testing process, i.e., to ensure a unidirectional flow through the surfaces of the
disks. Each disk was placed inside a vacuum desiccator; then, the desiccator was sealed, and a
vacuum pump was started applying a pressure of 6650 Pa for 3 hours. Thereafter, while the
vacuum pump was still running, the water stopcock was opened, and sufficient water was
drained into the desiccator until the specimens were fully covered by the water. The water
stopcock was closed, and the vacuum pump was allowed to run for one additional hour; then, the
pump was turned off. The specimens were soaked under water for 18 hours (Fig. 7.8a). The disks
were placed between two cells (Fig. 7.8b). One of the cells was filled with a 0.3N NaOH solution
and the other cell was filled with a 3% NaCl solution. Thereafter, the disks were subjected to 60
volts and tested for 6 hours (Fig. 7.8c). The performance of each test specimen under the rapid
chloride ion penetration test was assessed per ASTM C1202-17 [139] (Table 7.3) [139].
Figure 7.7: 2 in. high disks for RCIP test.
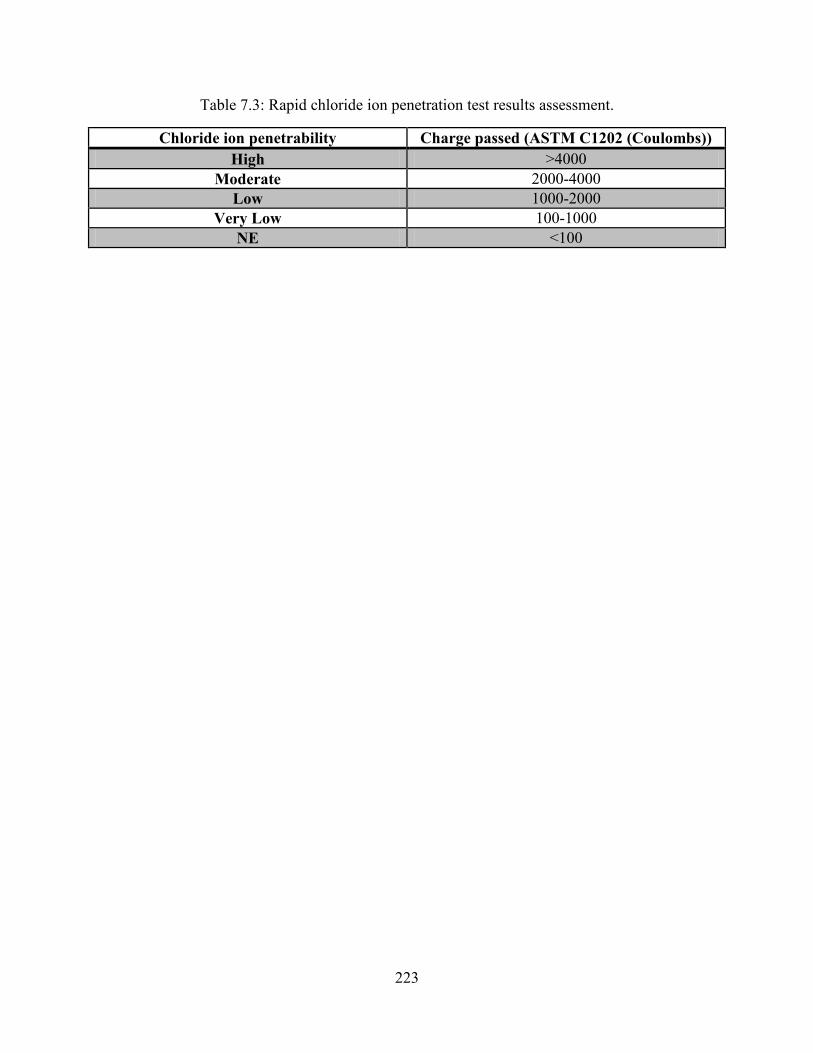
223
Table 7.3: Rapid chloride ion penetration test results assessment.
Chloride ion penetrability Charge passed (ASTM C1202 (Coulombs)) High >4000
Moderate 2000-4000 Low 1000-2000
Very Low 100-1000 NE <100
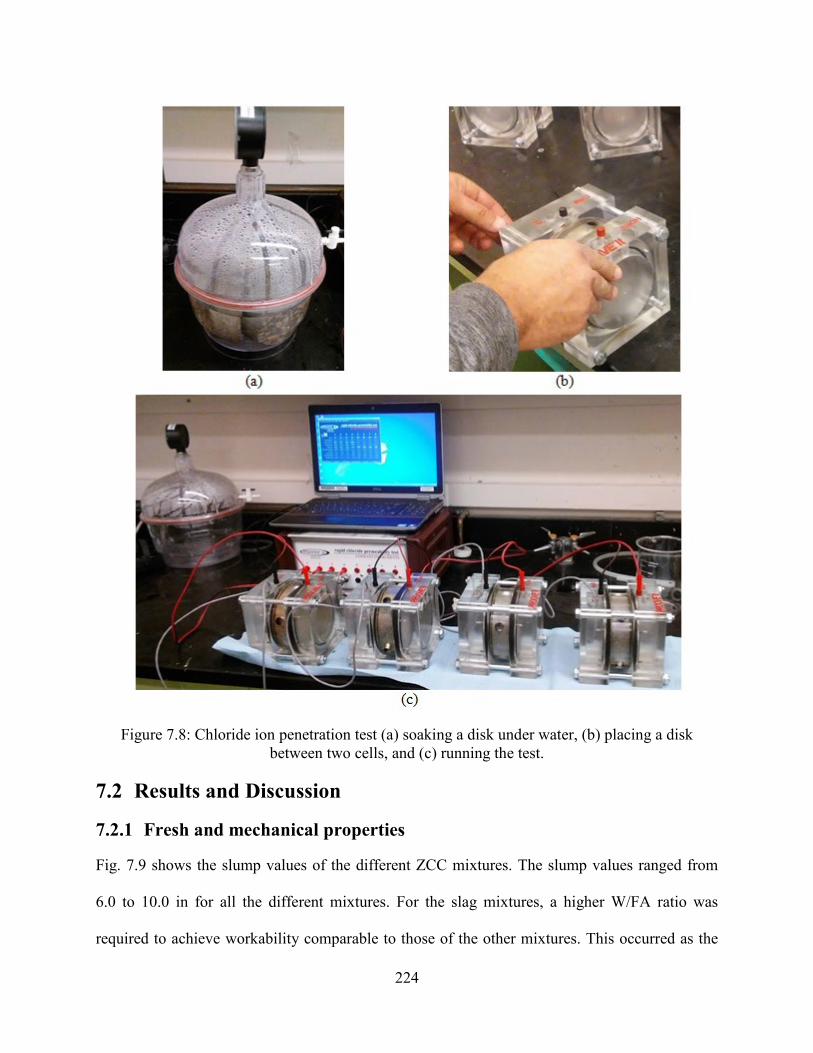
224
Figure 7.8: Chloride ion penetration test (a) soaking a disk under water, (b) placing a disk between two cells, and (c) running the test.
7.2 Results and Discussion
7.2.1 Fresh and mechanical properties
Fig. 7.9 shows the slump values of the different ZCC mixtures. The slump values ranged from
6.0 to 10.0 in for all the different mixtures. For the slag mixtures, a higher W/FA ratio was
required to achieve workability comparable to those of the other mixtures. This occurred as the
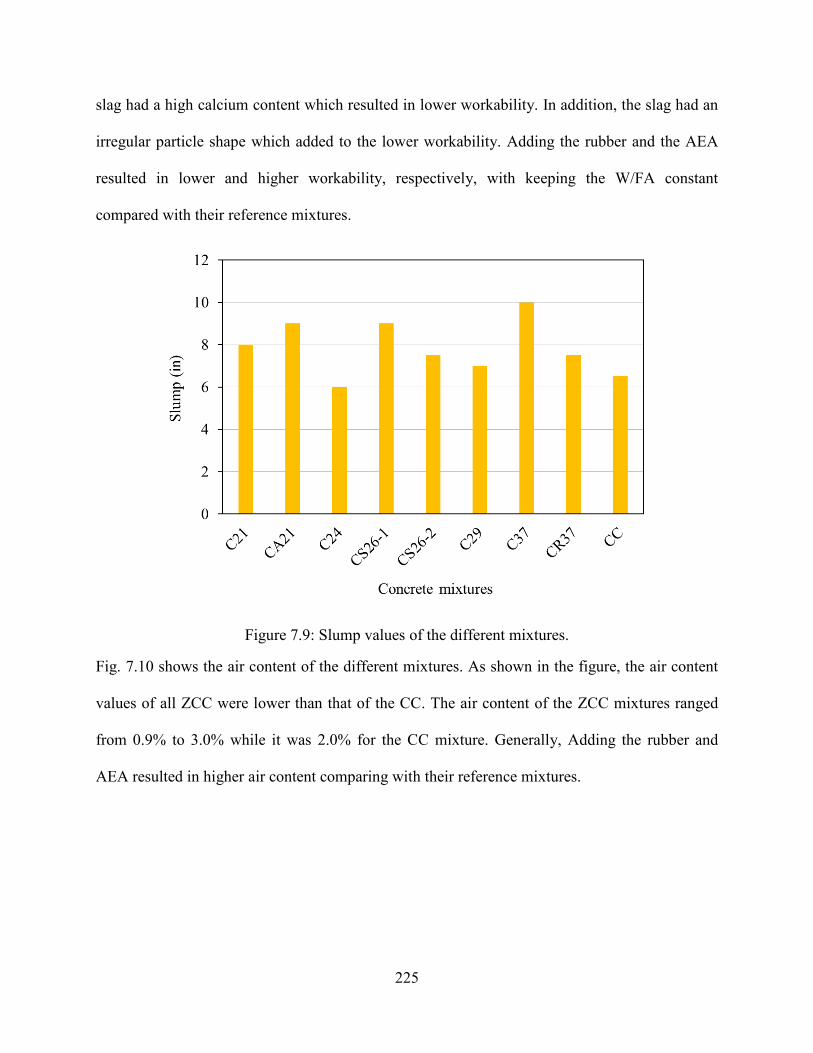
225
slag had a high calcium content which resulted in lower workability. In addition, the slag had an
irregular particle shape which added to the lower workability. Adding the rubber and the AEA
resulted in lower and higher workability, respectively, with keeping the W/FA constant
compared with their reference mixtures.
Figure 7.9: Slump values of the different mixtures.
Fig. 7.10 shows the air content of the different mixtures. As shown in the figure, the air content
values of all ZCC were lower than that of the CC. The air content of the ZCC mixtures ranged
from 0.9% to 3.0% while it was 2.0% for the CC mixture. Generally, Adding the rubber and
AEA resulted in higher air content comparing with their reference mixtures.
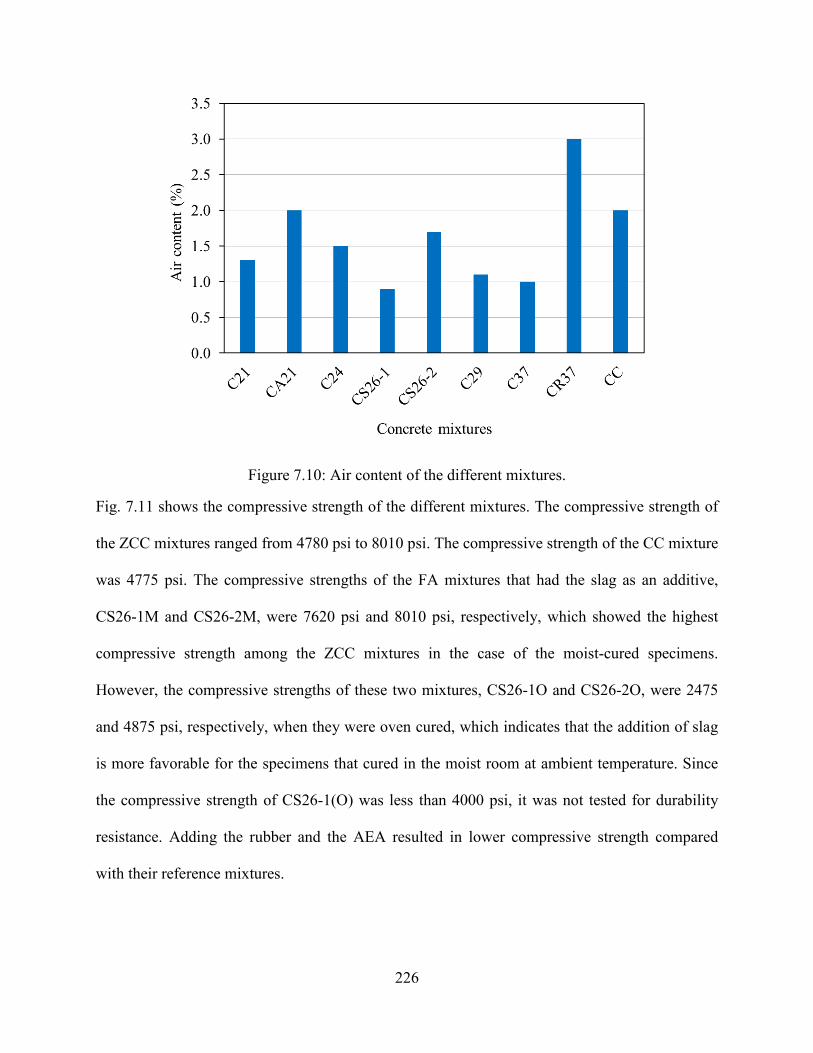
226
Figure 7.10: Air content of the different mixtures.
Fig. 7.11 shows the compressive strength of the different mixtures. The compressive strength of
the ZCC mixtures ranged from 4780 psi to 8010 psi. The compressive strength of the CC mixture
was 4775 psi. The compressive strengths of the FA mixtures that had the slag as an additive,
CS26-1M and CS26-2M, were 7620 psi and 8010 psi, respectively, which showed the highest
compressive strength among the ZCC mixtures in the case of the moist-cured specimens.
However, the compressive strengths of these two mixtures, CS26-1O and CS26-2O, were 2475
and 4875 psi, respectively, when they were oven cured, which indicates that the addition of slag
is more favorable for the specimens that cured in the moist room at ambient temperature. Since
the compressive strength of CS26-1(O) was less than 4000 psi, it was not tested for durability
resistance. Adding the rubber and the AEA resulted in lower compressive strength compared
with their reference mixtures.
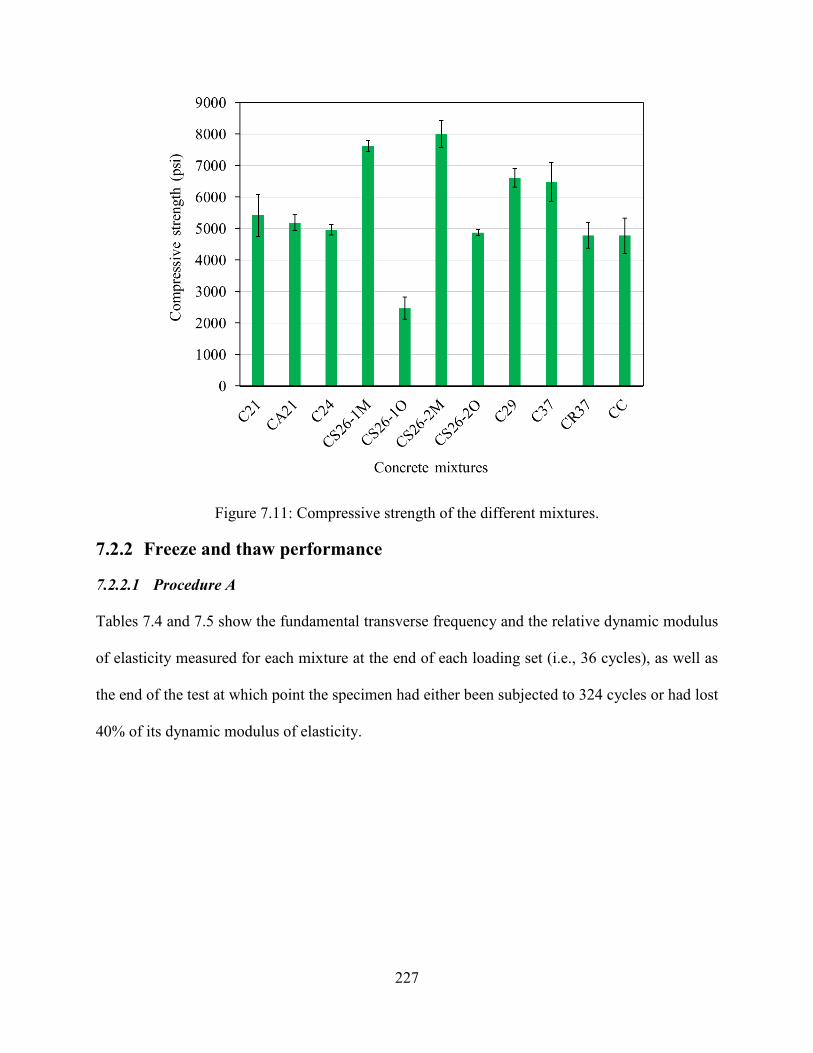
227
Figure 7.11: Compressive strength of the different mixtures.
7.2.2 Freeze and thaw performance
7.2.2.1 Procedure A
Tables 7.4 and 7.5 show the fundamental transverse frequency and the relative dynamic modulus
of elasticity measured for each mixture at the end of each loading set (i.e., 36 cycles), as well as
the end of the test at which point the specimen had either been subjected to 324 cycles or had lost
40% of its dynamic modulus of elasticity.

228
Table 7.4: Fundamental Transverse Frequency (1/µs) and Relative Dynamic Modulus of Elasticity (%).
Mix C21 C21 CA21 CA21
C24 C24 CS26-1M
CS26-
1M
CS26-2O
CS26-2O
No. of cycles 1/FTFa
Pcb 1/FTF
a Pc
b 1/FTFa
Pcb 1/FTF
a Pc
b 1/FTFa
Pcb
0 92.1 100.0
86.0 100.0
92.2 100.0
78.3 100.0
83.4 100.0
36 92.3 99.6 88.7 94.0 139 44.0 78.8 98.7 89.8 86.4 72 93.4 97.2 148.5 33.5 - - 79.9 96.0 91.4 83.4 108 94.8 94.3 - - - - 78.0 100.
8 89.2 87.5
144 102.3 80.9 - - - - 79.2 97.6 85.8 94.5 180 109 71.3 - - - - 79.6 96.8 87.9 90.1 216 375 6.0 - - - - 80.1 95.6 88.1 89.6 252 - - - - - - 80.7 94.0 88.7 88.5 288 - - - - - - 80.9 93.6 89.3 87.2 324 - - - - - - 82.6 89.9 95.7 76.0
aFTF: Fundamental transverse frequency bPc: Relative dynamic modulus of elasticity
Table 7.5: Fundamental Transverse Frequency (1/µs) and Relative Dynamic Modulus of Elasticity (%).
Mix CS26-2M
CS26-2M
C29 C29 C37 C37 CR37 CR37
CC CC
No. of cycles 1/FTFa Pcb 1/FTFa Pc
b 1/FTFa Pcb 1/FTFa Pc
b 1/FTFa Pcb
0 80.9 100.0 82.6 100.0 80.1 100 91.2 100 82.5 100 36 84.3 92.1 84.5 95.4 87.1 84.6 91.6 99.1 346 5.7 72 83.5 93.9 93.6 77.8 89.1 80.8 90.1 102.5 - - 108 82.2 96.9 74.1 77.0 93.2 73.9 88.4 106.4 - - 144 84.8 91.0 346 5.7 94.7 71.5 90.4 101.8 - - 180 97.4 69.1 - - 103 60.5 90.4 101.8 - - 216 346 5.5 - - - - 89.6 103.6 - - 252 - - - - - - 87.9 107.7 - - 288 - - - - - - 88.6 106.0 - - 324 - - - - - - 89.2 104.5 - -
aFTF: Fundamental transverse frequency bPc: Relative dynamic modulus of elasticity
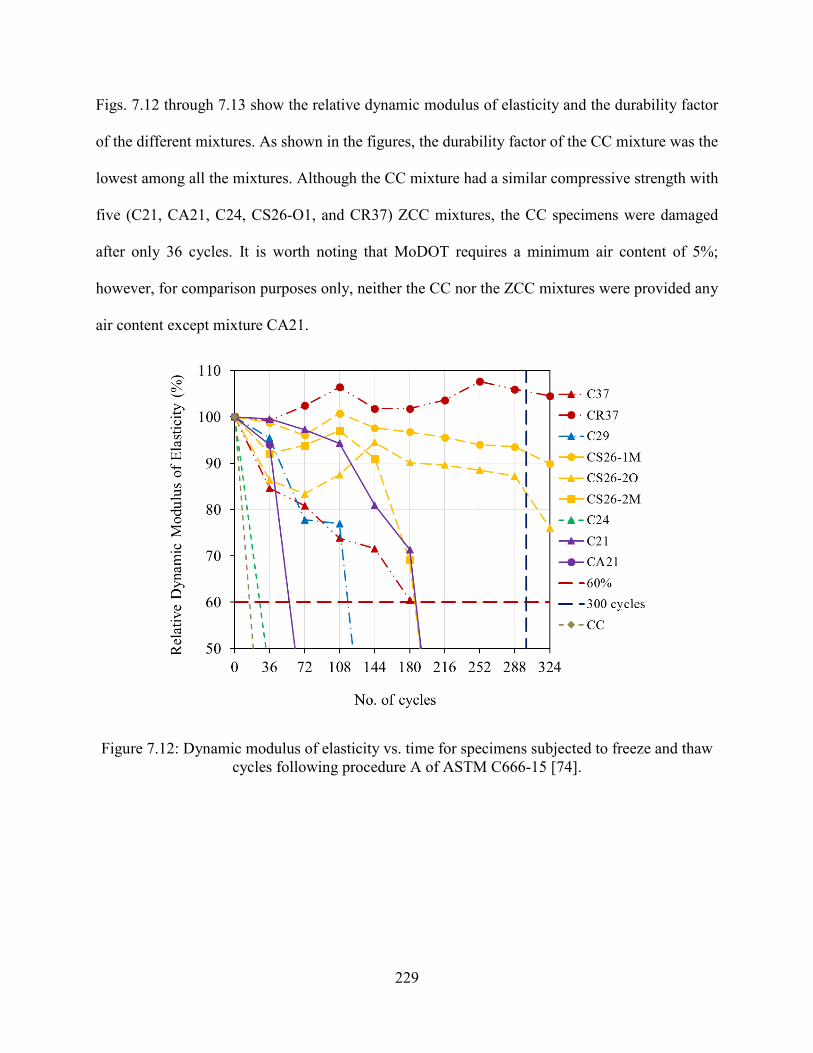
229
Figs. 7.12 through 7.13 show the relative dynamic modulus of elasticity and the durability factor
of the different mixtures. As shown in the figures, the durability factor of the CC mixture was the
lowest among all the mixtures. Although the CC mixture had a similar compressive strength with
five (C21, CA21, C24, CS26-O1, and CR37) ZCC mixtures, the CC specimens were damaged
after only 36 cycles. It is worth noting that MoDOT requires a minimum air content of 5%;
however, for comparison purposes only, neither the CC nor the ZCC mixtures were provided any
air content except mixture CA21.
Figure 7.12: Dynamic modulus of elasticity vs. time for specimens subjected to freeze and thaw cycles following procedure A of ASTM C666-15 [74].
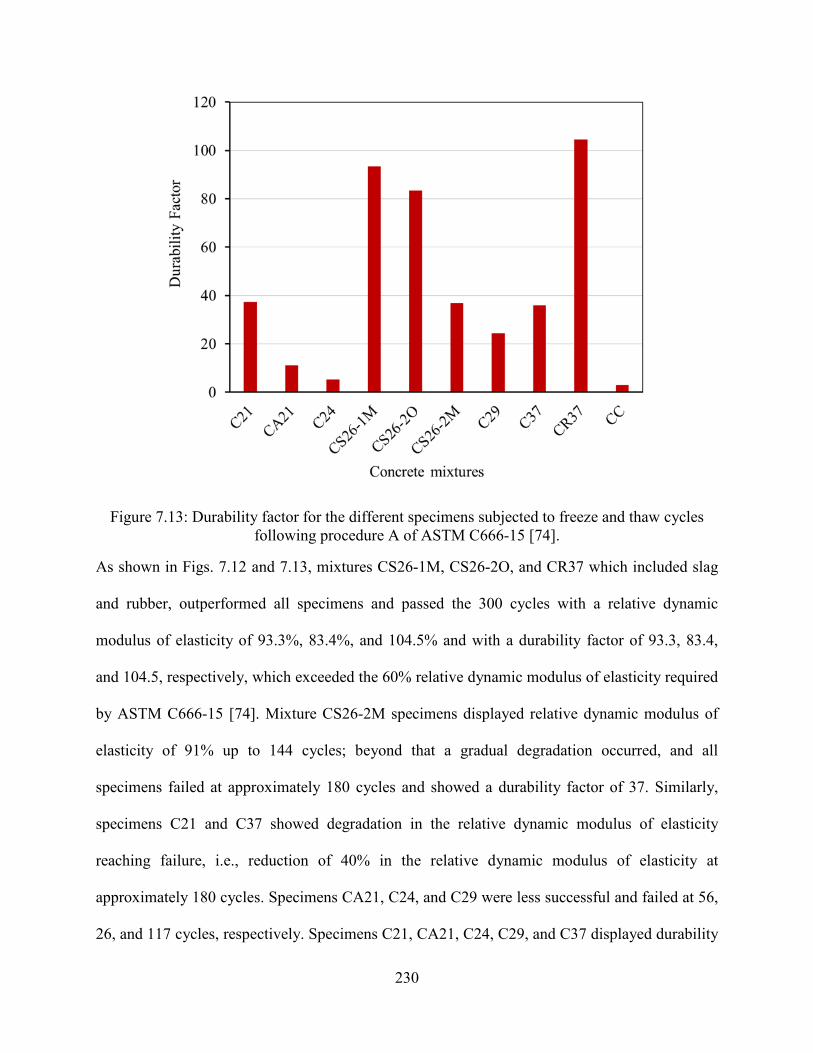
230
Figure 7.13: Durability factor for the different specimens subjected to freeze and thaw cycles following procedure A of ASTM C666-15 [74].
As shown in Figs. 7.12 and 7.13, mixtures CS26-1M, CS26-2O, and CR37 which included slag
and rubber, outperformed all specimens and passed the 300 cycles with a relative dynamic
modulus of elasticity of 93.3%, 83.4%, and 104.5% and with a durability factor of 93.3, 83.4,
and 104.5, respectively, which exceeded the 60% relative dynamic modulus of elasticity required
by ASTM C666-15 [74]. Mixture CS26-2M specimens displayed relative dynamic modulus of
elasticity of 91% up to 144 cycles; beyond that a gradual degradation occurred, and all
specimens failed at approximately 180 cycles and showed a durability factor of 37. Similarly,
specimens C21 and C37 showed degradation in the relative dynamic modulus of elasticity
reaching failure, i.e., reduction of 40% in the relative dynamic modulus of elasticity at
approximately 180 cycles. Specimens CA21, C24, and C29 were less successful and failed at 56,
26, and 117 cycles, respectively. Specimens C21, CA21, C24, C29, and C37 displayed durability
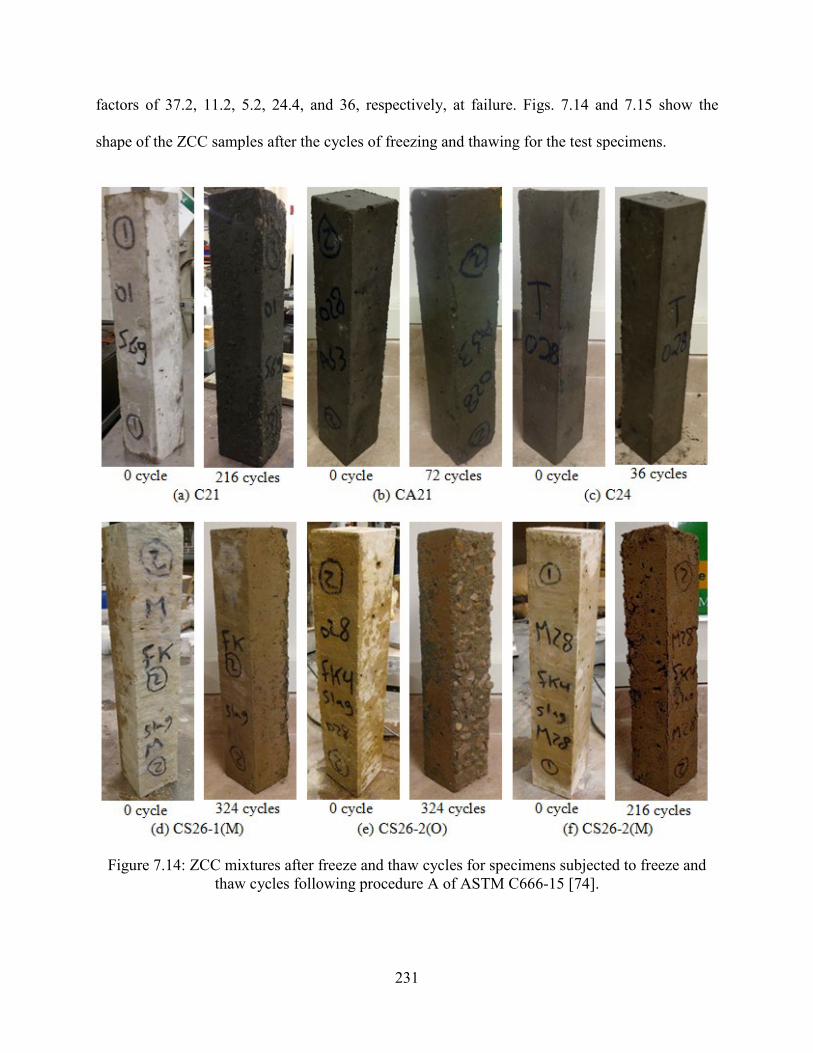
231
factors of 37.2, 11.2, 5.2, 24.4, and 36, respectively, at failure. Figs. 7.14 and 7.15 show the
shape of the ZCC samples after the cycles of freezing and thawing for the test specimens.
Figure 7.14: ZCC mixtures after freeze and thaw cycles for specimens subjected to freeze and thaw cycles following procedure A of ASTM C666-15 [74].
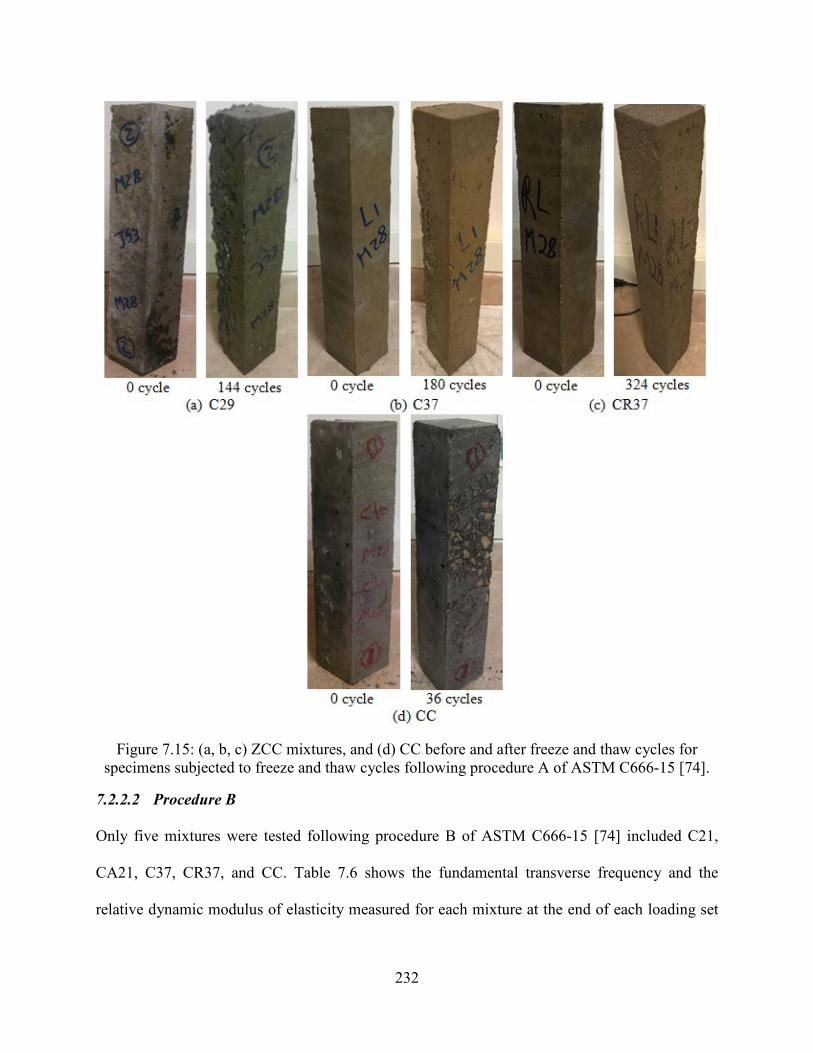
232
Figure 7.15: (a, b, c) ZCC mixtures, and (d) CC before and after freeze and thaw cycles for specimens subjected to freeze and thaw cycles following procedure A of ASTM C666-15 [74].
7.2.2.2 Procedure B
Only five mixtures were tested following procedure B of ASTM C666-15 [74] included C21,
CA21, C37, CR37, and CC. Table 7.6 shows the fundamental transverse frequency and the
relative dynamic modulus of elasticity measured for each mixture at the end of each loading set
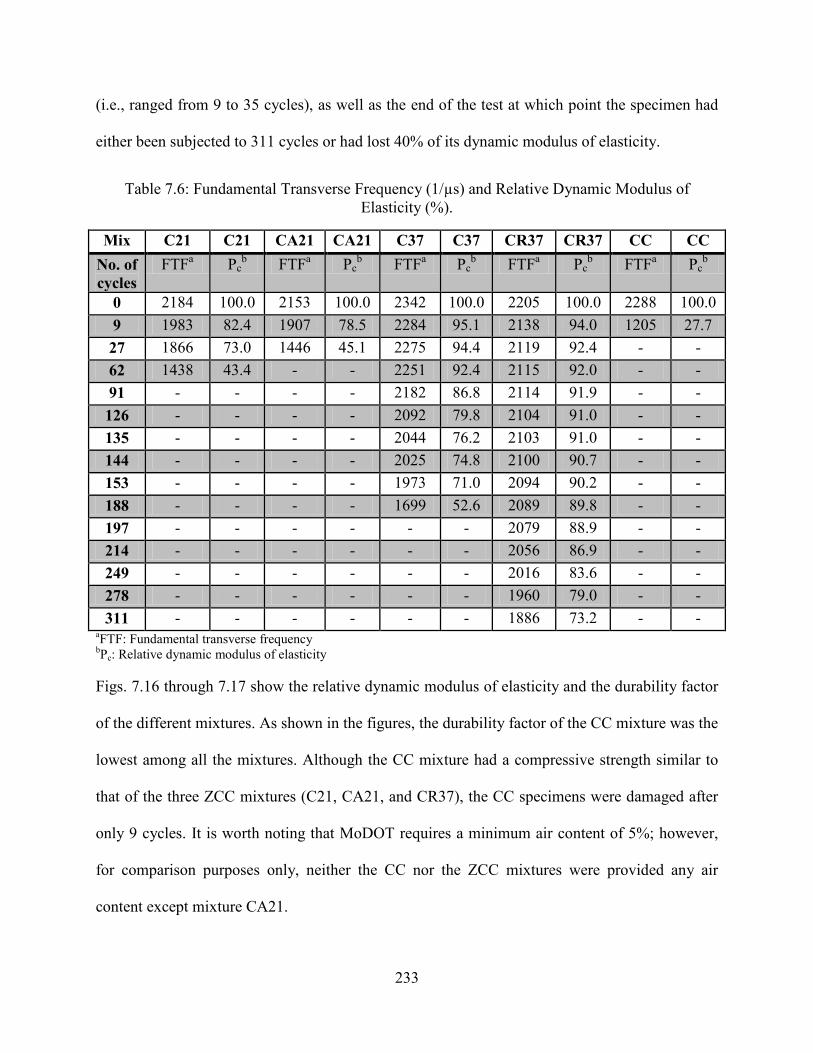
233
(i.e., ranged from 9 to 35 cycles), as well as the end of the test at which point the specimen had
either been subjected to 311 cycles or had lost 40% of its dynamic modulus of elasticity.
Table 7.6: Fundamental Transverse Frequency (1/µs) and Relative Dynamic Modulus of Elasticity (%).
Mix C21 C21 CA21 CA21 C37 C37 CR37 CR37 CC CC No. of cycles
FTFa Pcb FTFa Pc
b FTFa Pcb FTFa Pc
b FTFa Pcb
0 2184 100.0 2153 100.0 2342 100.0 2205 100.0 2288 100.0 9 1983 82.4 1907 78.5 2284 95.1 2138 94.0 1205 27.7 27 1866 73.0 1446 45.1 2275 94.4 2119 92.4 - - 62 1438 43.4 - - 2251 92.4 2115 92.0 - - 91 - - - - 2182 86.8 2114 91.9 - - 126 - - - - 2092 79.8 2104 91.0 - - 135 - - - - 2044 76.2 2103 91.0 - - 144 - - - - 2025 74.8 2100 90.7 - - 153 - - - - 1973 71.0 2094 90.2 - - 188 - - - - 1699 52.6 2089 89.8 - - 197 - - - - - - 2079 88.9 - - 214 - - - - - - 2056 86.9 - - 249 - - - - - - 2016 83.6 - - 278 - - - - - - 1960 79.0 - - 311 - - - - - - 1886 73.2 - -
aFTF: Fundamental transverse frequency bPc: Relative dynamic modulus of elasticity Figs. 7.16 through 7.17 show the relative dynamic modulus of elasticity and the durability factor
of the different mixtures. As shown in the figures, the durability factor of the CC mixture was the
lowest among all the mixtures. Although the CC mixture had a compressive strength similar to
that of the three ZCC mixtures (C21, CA21, and CR37), the CC specimens were damaged after
only 9 cycles. It is worth noting that MoDOT requires a minimum air content of 5%; however,
for comparison purposes only, neither the CC nor the ZCC mixtures were provided any air
content except mixture CA21.
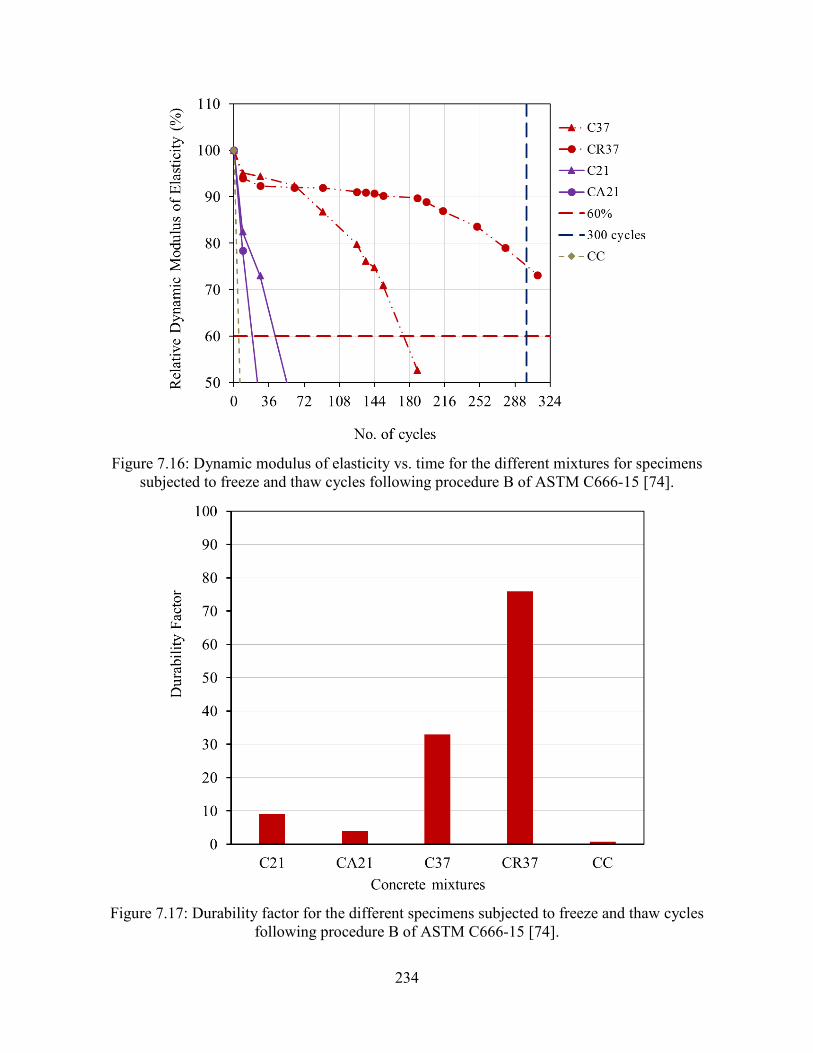
234
Figure 7.16: Dynamic modulus of elasticity vs. time for the different mixtures for specimens
subjected to freeze and thaw cycles following procedure B of ASTM C666-15 [74].
Figure 7.17: Durability factor for the different specimens subjected to freeze and thaw cycles
following procedure B of ASTM C666-15 [74].
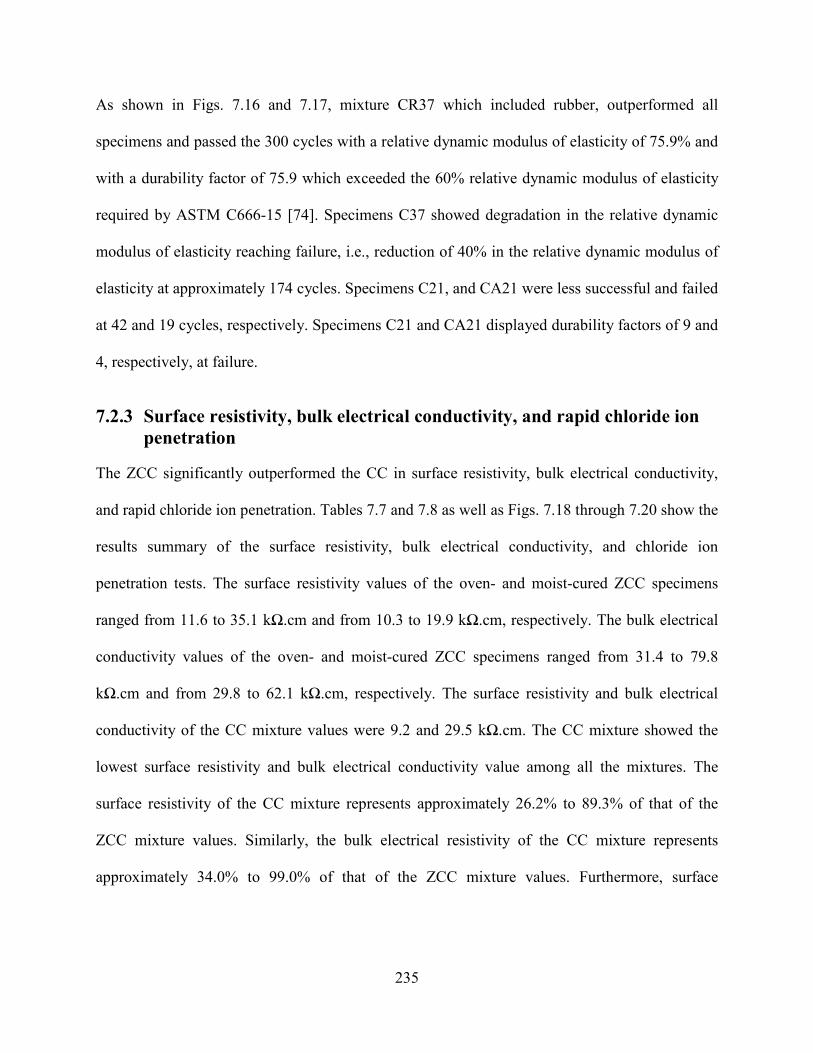
235
As shown in Figs. 7.16 and 7.17, mixture CR37 which included rubber, outperformed all
specimens and passed the 300 cycles with a relative dynamic modulus of elasticity of 75.9% and
with a durability factor of 75.9 which exceeded the 60% relative dynamic modulus of elasticity
required by ASTM C666-15 [74]. Specimens C37 showed degradation in the relative dynamic
modulus of elasticity reaching failure, i.e., reduction of 40% in the relative dynamic modulus of
elasticity at approximately 174 cycles. Specimens C21, and CA21 were less successful and failed
at 42 and 19 cycles, respectively. Specimens C21 and CA21 displayed durability factors of 9 and
4, respectively, at failure.
7.2.3 Surface resistivity, bulk electrical conductivity, and rapid chloride ion penetration
The ZCC significantly outperformed the CC in surface resistivity, bulk electrical conductivity,
and rapid chloride ion penetration. Tables 7.7 and 7.8 as well as Figs. 7.18 through 7.20 show the
results summary of the surface resistivity, bulk electrical conductivity, and chloride ion
penetration tests. The surface resistivity values of the oven- and moist-cured ZCC specimens
ranged from 11.6 to 35.1 kΩ.cm and from 10.3 to 19.9 kΩ.cm, respectively. The bulk electrical
conductivity values of the oven- and moist-cured ZCC specimens ranged from 31.4 to 79.8
kΩ.cm and from 29.8 to 62.1 kΩ.cm, respectively. The surface resistivity and bulk electrical
conductivity of the CC mixture values were 9.2 and 29.5 kΩ.cm. The CC mixture showed the
lowest surface resistivity and bulk electrical conductivity value among all the mixtures. The
surface resistivity of the CC mixture represents approximately 26.2% to 89.3% of that of the
ZCC mixture values. Similarly, the bulk electrical resistivity of the CC mixture represents
approximately 34.0% to 99.0% of that of the ZCC mixture values. Furthermore, surface
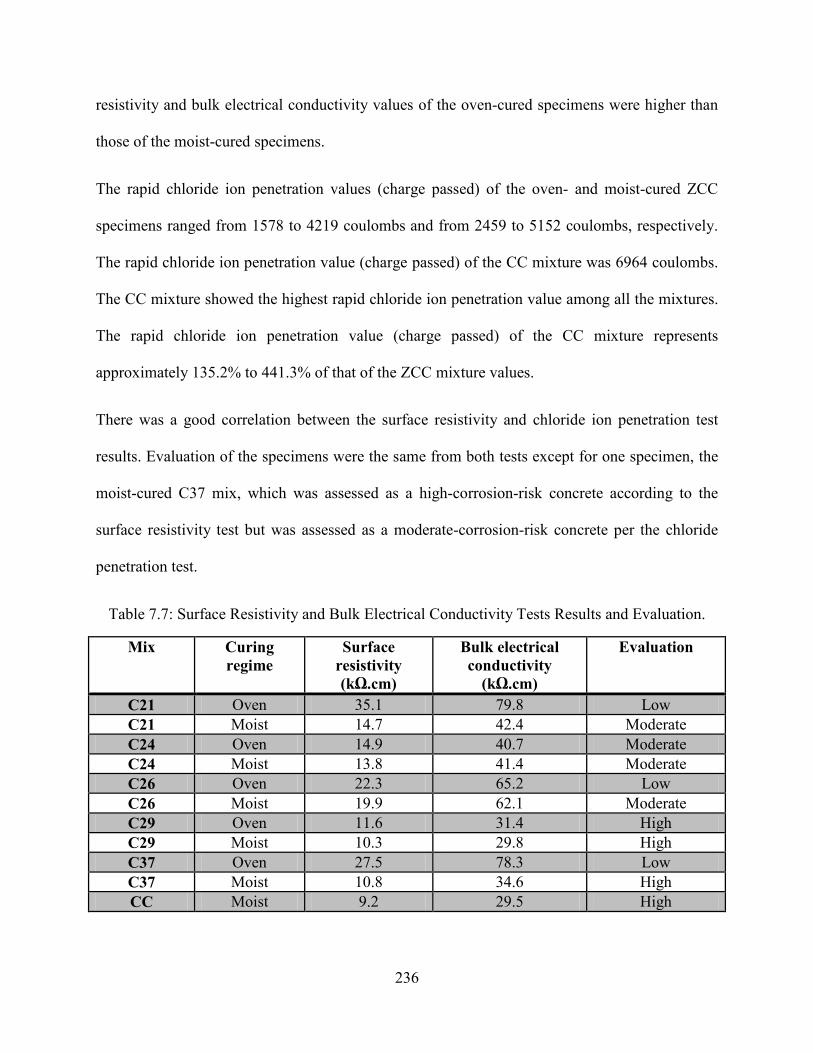
236
resistivity and bulk electrical conductivity values of the oven-cured specimens were higher than
those of the moist-cured specimens.
The rapid chloride ion penetration values (charge passed) of the oven- and moist-cured ZCC
specimens ranged from 1578 to 4219 coulombs and from 2459 to 5152 coulombs, respectively.
The rapid chloride ion penetration value (charge passed) of the CC mixture was 6964 coulombs.
The CC mixture showed the highest rapid chloride ion penetration value among all the mixtures.
The rapid chloride ion penetration value (charge passed) of the CC mixture represents
approximately 135.2% to 441.3% of that of the ZCC mixture values.
There was a good correlation between the surface resistivity and chloride ion penetration test
results. Evaluation of the specimens were the same from both tests except for one specimen, the
moist-cured C37 mix, which was assessed as a high-corrosion-risk concrete according to the
surface resistivity test but was assessed as a moderate-corrosion-risk concrete per the chloride
penetration test.
Table 7.7: Surface Resistivity and Bulk Electrical Conductivity Tests Results and Evaluation.
Mix Curing regime
Surface resistivity (kΩ.cm)
Bulk electrical conductivity
(kΩ.cm)
Evaluation
C21 Oven 35.1 79.8 Low C21 Moist 14.7 42.4 Moderate C24 Oven 14.9 40.7 Moderate C24 Moist 13.8 41.4 Moderate C26 Oven 22.3 65.2 Low C26 Moist 19.9 62.1 Moderate C29 Oven 11.6 31.4 High C29 Moist 10.3 29.8 High C37 Oven 27.5 78.3 Low C37 Moist 10.8 34.6 High CC Moist 9.2 29.5 High
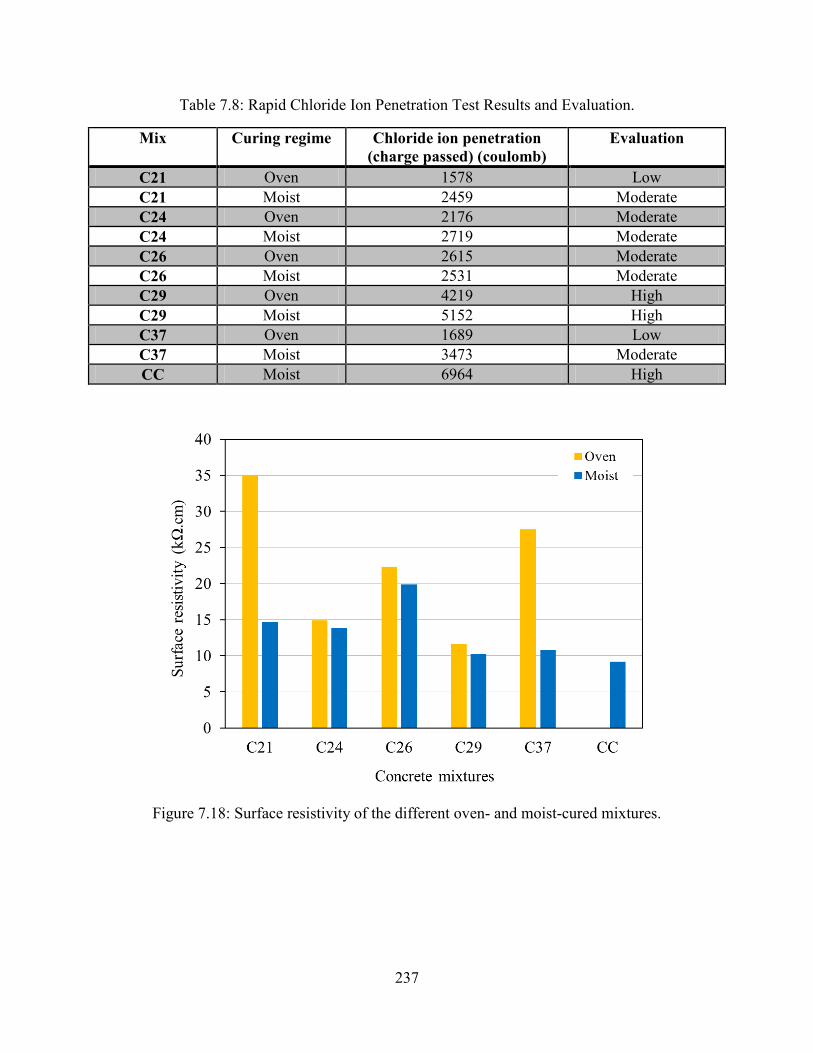
237
Table 7.8: Rapid Chloride Ion Penetration Test Results and Evaluation.
Mix Curing regime Chloride ion penetration (charge passed) (coulomb)
Evaluation
C21 Oven 1578 Low C21 Moist 2459 Moderate C24 Oven 2176 Moderate C24 Moist 2719 Moderate C26 Oven 2615 Moderate C26 Moist 2531 Moderate C29 Oven 4219 High C29 Moist 5152 High C37 Oven 1689 Low C37 Moist 3473 Moderate CC Moist 6964 High
Figure 7.18: Surface resistivity of the different oven- and moist-cured mixtures.
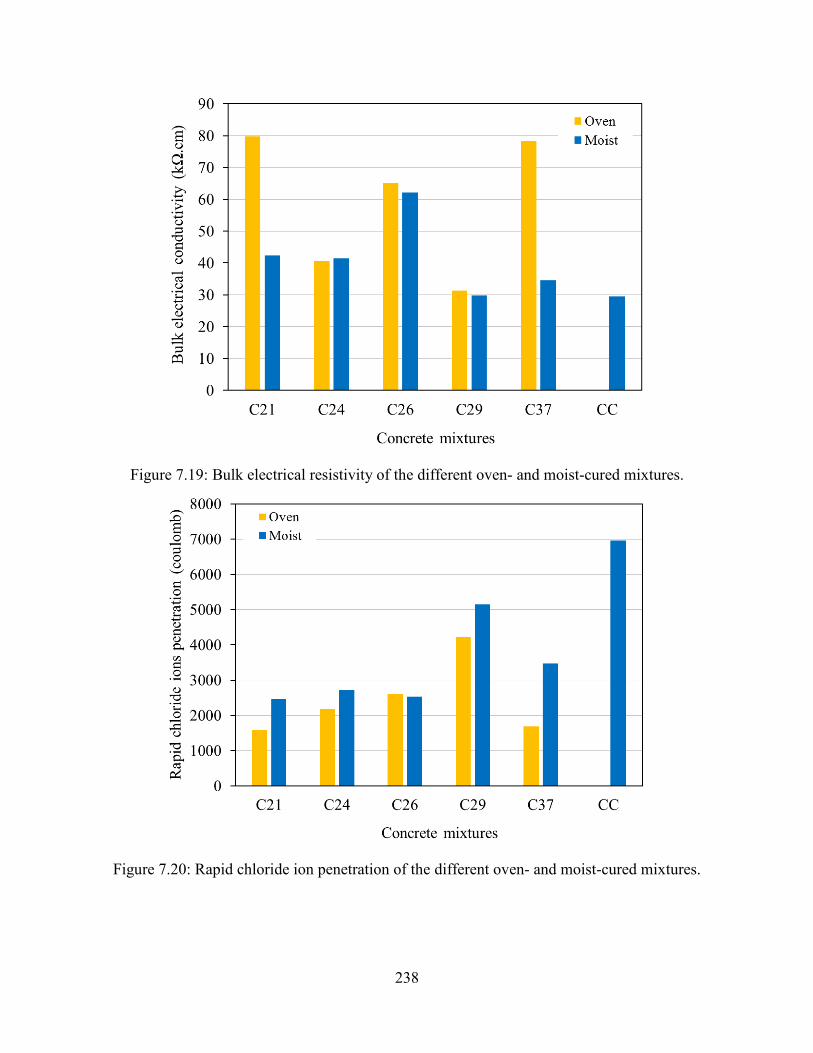
238
Figure 7.19: Bulk electrical resistivity of the different oven- and moist-cured mixtures.
Figure 7.20: Rapid chloride ion penetration of the different oven- and moist-cured mixtures.

239
7.3 Findings and Conclusions This chapter presents the durability results of C21, C24, CS26, CS26-1, CS26-2, C29, and C37
ZCC mixtures and a CC mixture. Durability was determined in terms of freeze-thaw resistance,
surface resistivity, bulk electrical conductivity, and rapid chloride ion penetration tests per
ASTM C666-15 [74], AASHTO TP 95 [137], ASTM C1760-12 [138] , and ASTM C1202-17
[139], respectively.
To improve the durability, CS26-1 and CS26-2 ZCC mixtures were prepared using slag as an
additive to replace FA26. Using slag in ZCC mixtures required adding more water, compared to
other ZCC mixtures, to keep the mixture slump the same as in ZCC mixtures without slag. The
air content of the FA mixtures including slag was almost the same as that of the other FA
mixtures. However, the compressive strength of the moist-cured mixtures improved and reached
8010 psi, but the strength of the oven-cured mixture decreased compared with that of the
reference mixtures. The following points can be concluded:
• All the ZCC mixtures displayed higher freeze-thaw resistance compared with that of the
CC mixture
• The CC mixture failed after only 36 and 9 cycles following procedure A and B per
ASTM C666-15 [74], respectively. All other ZCC mixtures were able to resist from 19 to
324 cycles of freeze-thaw for both procedures A and B per ASTM C666-15 [74].
• Among all ZCC mixtures, specimens synthesized using FA21 and FA37 showed the
highest freeze-thaw resistance while specimens synthesized using FA24 showed the
lowest resistance.
• The durability of the ZCC was improved significantly by adding the slag as a partial
replacement and the rubber as an additive to the FA. Two out of three slag specimens
240
successfully passed the 324 cycles of ASTM C666-15 procedure A with durability factor
of 93.3 and 83.4 for the moist-and oven-cured specimens, respectively. The rubber
specimens successfully passed 324 cycles with a durability factor of 104.5 following
ASTM C666-15 procedure A and 311 cycles with a durability factor of 75.9 following
C666-15 procedure B, respectively.
• There was a good agreement between the results of the chloride ion penetrability and that
of surface resistivity.
• Based on the surface resistivity and chloride ion penetration tests, most of the ZCC
mixtures had a low to moderate permeability and chloride ion penetrability. However, the
CC mixture showed a high permeability and chloride ion penetrability.
• The results of the rapid chloride ion penetration test showed lower values in the case of
most of the ZCC mixtures compared to that of CC. The rapid chloride ion penetration
(charge passed) ranged from 0.23 to 0.61 and 0.35 to 0.74 times that of CC for thermally
cured and moist-cured. For thermal curing, the rapid chloride ion penetration (charge
passed) were 1578, 2176, 2615, 4219, and 1689 coulomb for C21, C24, C26, C29, and
C37, respectively. For moist curing, the rapid chloride ion penetration (charge passed)
were 2459, 2719, 2531, 5152, and 3473 coulomb for C21, C24, C26, C29, and C37,
respectively.
• The results of the surface resistivity test showed higher values in the case of most of the
ZCC mixtures compared with CC. The surface resistivity of ZCC ranged from 1.3 to 3.8
and 1.1 to 2.2 times that of CC for thermally cured and moist-cured, respectively. For
oven curing, the surface resistivity values were 35.1, 14.9, 22.3, 11.6, and 27.5 kΩ.cm for
241
C21, C24, C26, C29, and C37, respectively. For moist curing, the surface resistivity
values were 14.7, 13.8, 19.9, 10.3, and 10.8, respectively.
• The results of the bulk electrical conductivity test showed higher values in the case of
most of the ZCC mixtures compared to that of CC. The bulk resistivity of ZCC ranged
from 1.1 to 2.7 and 1.0 to 2.1 times that of CC for thermally cured and moist-cured,
respectively. For oven curing, the bulk electrical conductivities were 79.8, 40.7, 65.2,
31.1, and 78.3 kΩ.cm for C21, C24, C26, C29, and C37, respectively. For moist curing,
the bulk electrical conductivities were 42.4, 41.4, 62.1, 29.8, and 34.6 kΩ.cm for C21,
C24, C26, C29, and C37, respectively.
242
Chapter 8: Zero-Cement Concrete as a Repair Material
Slant shear and pull-off tests were carried out to examine the bond between zero-cement concrete
(ZCC) and conventional concrete (CC). Adequate bond is required for successful use of ZCC in
repairing structures that are constructed out of conventional concrete (CC). During both tests,
specimens had been constructed out of CC mixtures representing the host structure, i.e., the
existing concrete structural elements. The specimens had been then left to cure. Then, ZCC was
used as a repair material by placing it against the CC specimens. Hence, both tests examine the
bond between the newly placed ZCC and the existing CC. This chapter reports the material
characterization, repair procedure, and results of both tests.
8.1 Experimental Program
8.1.1 Materials
The four FAs, FA21, FA24, FA29, and FA37, obtained from the second batch as explained in
Chapter 2 were used throughout this chapter. As explained in Chapter 2, two of the FAs had high
calcium content, FA29 and F37, and the other two had relatively low calcium content, FA21 and
FA24. The details of the FAs chemical composition, the coarse aggregate, the fine aggregate, and
alkali activators were discussed in Chapter 2 of this report.
8.1.2 Mixture design and procedure
Six mixtures were prepared and used during this chapter; this included four ZCC mixtures and
two CC mixtures. The four ZCC mixtures were similar to those described and used in Chapter 4.
They had Alk/FA of 0.30 and SS/SH of 1.0 (Table 8.1). Mixing procedure no. 8 was used for
mixing the concrete as discussed in detail in Chapter 3. Two CC mixtures were used as reference
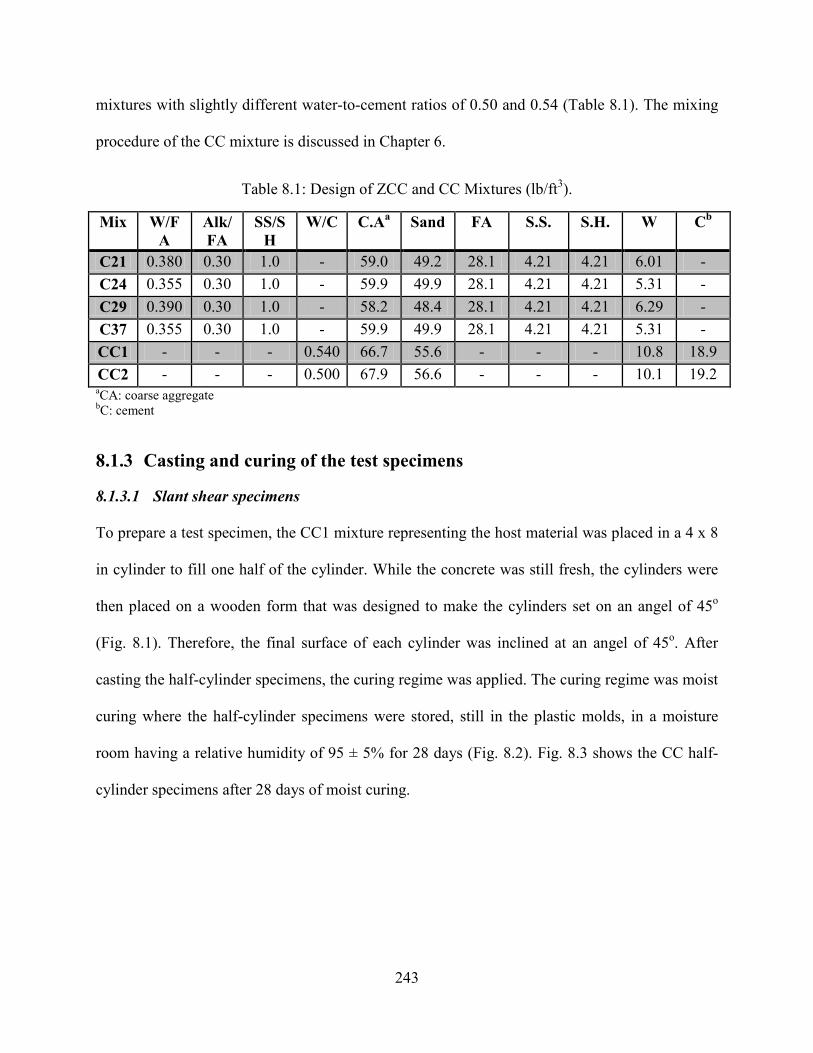
243
mixtures with slightly different water-to-cement ratios of 0.50 and 0.54 (Table 8.1). The mixing
procedure of the CC mixture is discussed in Chapter 6.
Table 8.1: Design of ZCC and CC Mixtures (lb/ft3).
Mix W/FA
Alk/FA
SS/SH
W/C C.Aa
Sand
FA
S.S.
S.H.
W
Cb
C21 0.380 0.30 1.0 - 59.0 49.2 28.1 4.21 4.21 6.01 - C24 0.355 0.30 1.0 - 59.9 49.9 28.1 4.21 4.21 5.31 - C29 0.390 0.30 1.0 - 58.2 48.4 28.1 4.21 4.21 6.29 - C37 0.355 0.30 1.0 - 59.9 49.9 28.1 4.21 4.21 5.31 - CC1 - - - 0.540 66.7 55.6 - - - 10.8 18.9 CC2 - - - 0.500 67.9 56.6 - - - 10.1 19.2 aCA: coarse aggregate bC: cement
8.1.3 Casting and curing of the test specimens
8.1.3.1 Slant shear specimens
To prepare a test specimen, the CC1 mixture representing the host material was placed in a 4 x 8
in cylinder to fill one half of the cylinder. While the concrete was still fresh, the cylinders were
then placed on a wooden form that was designed to make the cylinders set on an angel of 45o
(Fig. 8.1). Therefore, the final surface of each cylinder was inclined at an angel of 45o. After
casting the half-cylinder specimens, the curing regime was applied. The curing regime was moist
curing where the half-cylinder specimens were stored, still in the plastic molds, in a moisture
room having a relative humidity of 95 ± 5% for 28 days (Fig. 8.2). Fig. 8.3 shows the CC half-
cylinder specimens after 28 days of moist curing.
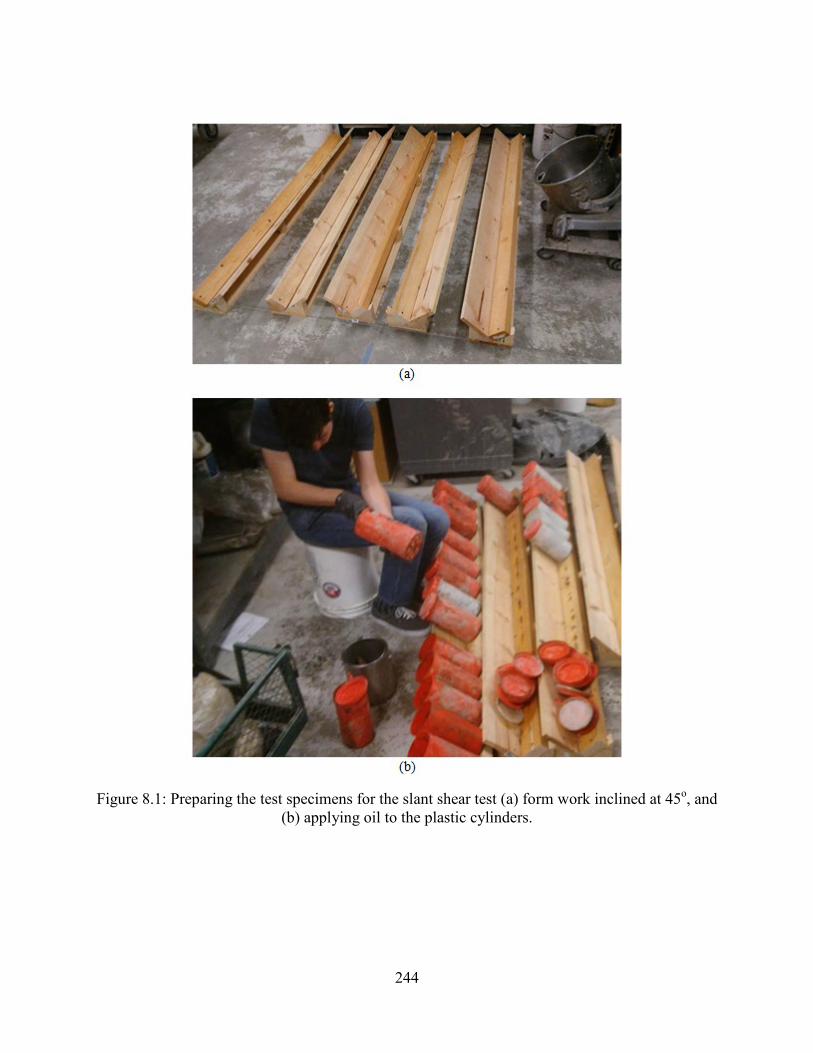
244
Figure 8.1: Preparing the test specimens for the slant shear test (a) form work inclined at 45o, and (b) applying oil to the plastic cylinders.
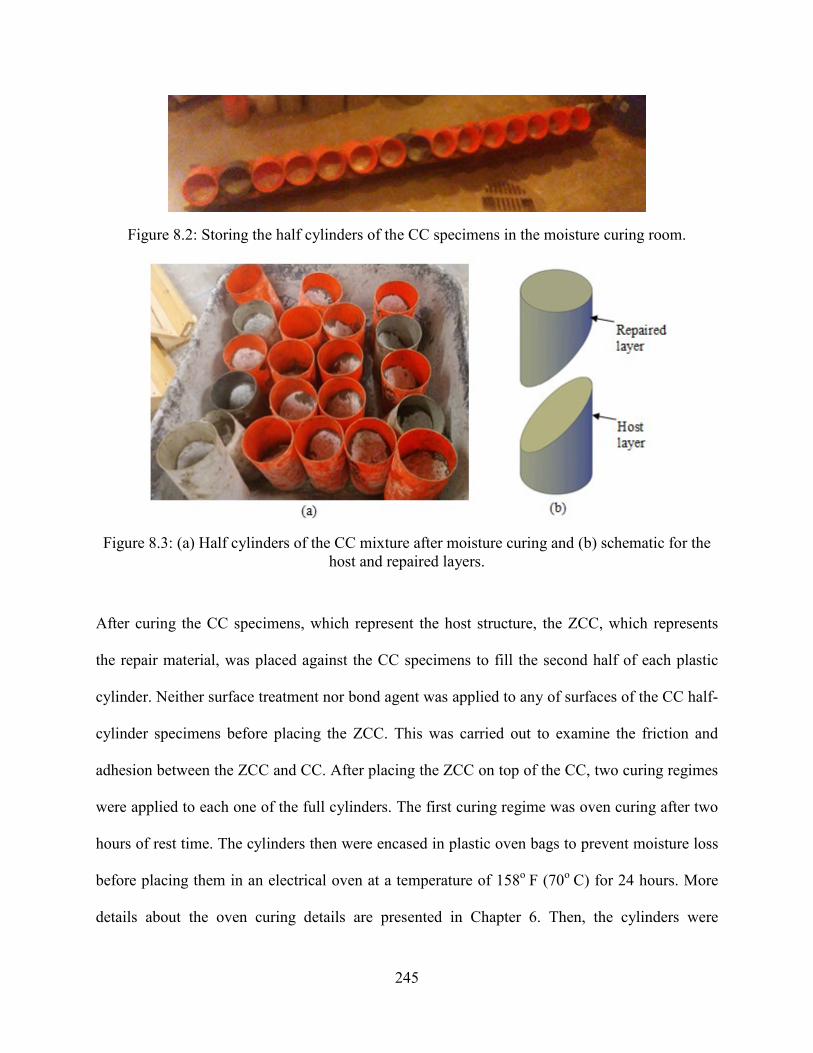
245
Figure 8.2: Storing the half cylinders of the CC specimens in the moisture curing room.
Figure 8.3: (a) Half cylinders of the CC mixture after moisture curing and (b) schematic for the host and repaired layers.
After curing the CC specimens, which represent the host structure, the ZCC, which represents
the repair material, was placed against the CC specimens to fill the second half of each plastic
cylinder. Neither surface treatment nor bond agent was applied to any of surfaces of the CC half-
cylinder specimens before placing the ZCC. This was carried out to examine the friction and
adhesion between the ZCC and CC. After placing the ZCC on top of the CC, two curing regimes
were applied to each one of the full cylinders. The first curing regime was oven curing after two
hours of rest time. The cylinders then were encased in plastic oven bags to prevent moisture loss
before placing them in an electrical oven at a temperature of 158o F (70o C) for 24 hours. More
details about the oven curing details are presented in Chapter 6. Then, the cylinders were
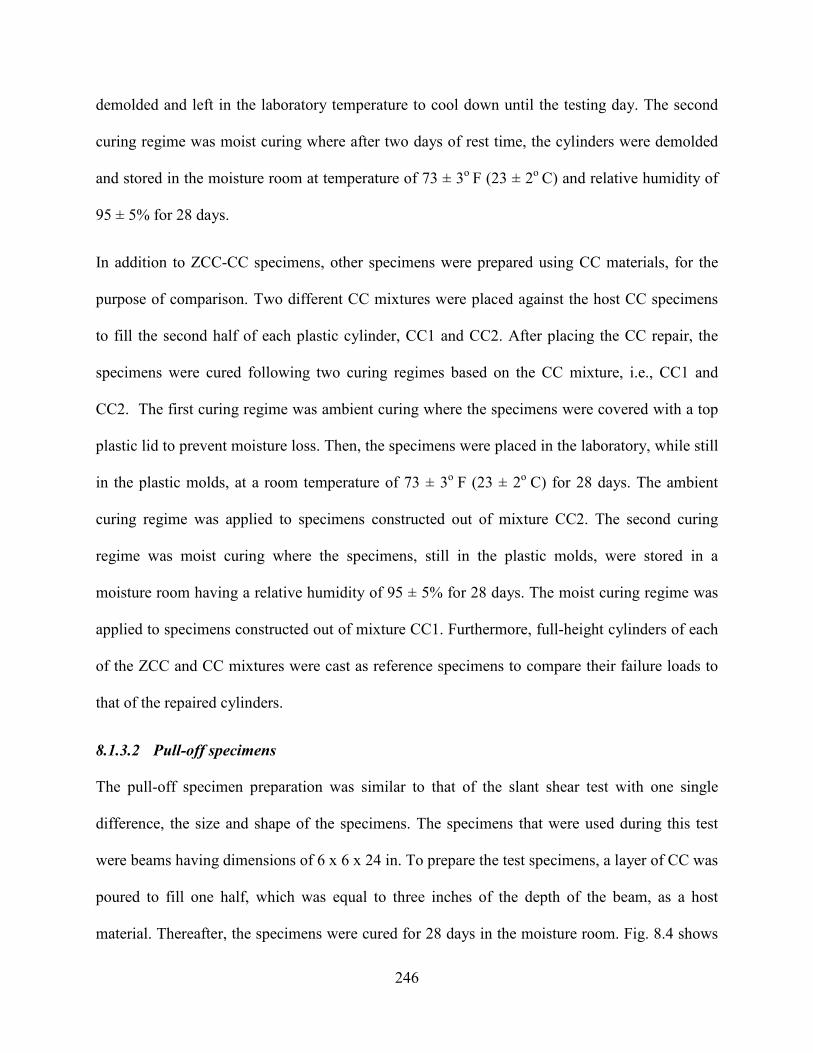
246
demolded and left in the laboratory temperature to cool down until the testing day. The second
curing regime was moist curing where after two days of rest time, the cylinders were demolded
and stored in the moisture room at temperature of 73 ± 3o F (23 ± 2o C) and relative humidity of
95 ± 5% for 28 days.
In addition to ZCC-CC specimens, other specimens were prepared using CC materials, for the
purpose of comparison. Two different CC mixtures were placed against the host CC specimens
to fill the second half of each plastic cylinder, CC1 and CC2. After placing the CC repair, the
specimens were cured following two curing regimes based on the CC mixture, i.e., CC1 and
CC2. The first curing regime was ambient curing where the specimens were covered with a top
plastic lid to prevent moisture loss. Then, the specimens were placed in the laboratory, while still
in the plastic molds, at a room temperature of 73 ± 3o F (23 ± 2o C) for 28 days. The ambient
curing regime was applied to specimens constructed out of mixture CC2. The second curing
regime was moist curing where the specimens, still in the plastic molds, were stored in a
moisture room having a relative humidity of 95 ± 5% for 28 days. The moist curing regime was
applied to specimens constructed out of mixture CC1. Furthermore, full-height cylinders of each
of the ZCC and CC mixtures were cast as reference specimens to compare their failure loads to
that of the repaired cylinders.
8.1.3.2 Pull-off specimens
The pull-off specimen preparation was similar to that of the slant shear test with one single
difference, the size and shape of the specimens. The specimens that were used during this test
were beams having dimensions of 6 x 6 x 24 in. To prepare the test specimens, a layer of CC was
poured to fill one half, which was equal to three inches of the depth of the beam, as a host
material. Thereafter, the specimens were cured for 28 days in the moisture room. Fig. 8.4 shows
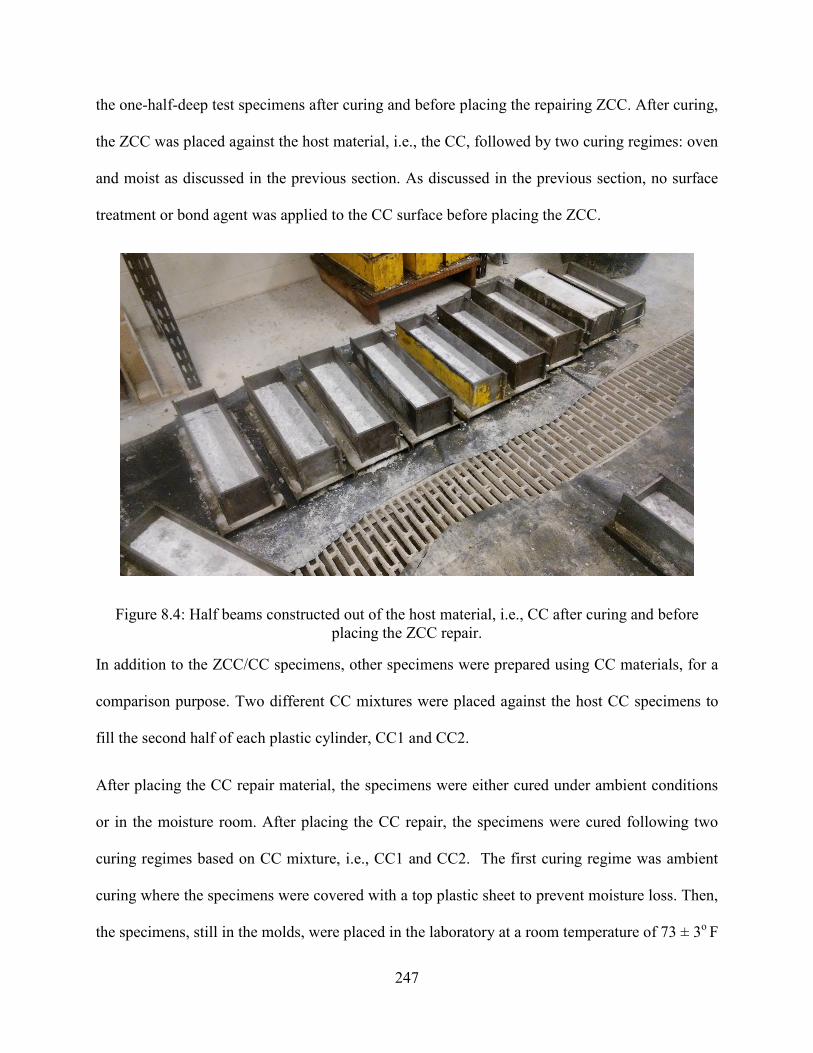
247
the one-half-deep test specimens after curing and before placing the repairing ZCC. After curing,
the ZCC was placed against the host material, i.e., the CC, followed by two curing regimes: oven
and moist as discussed in the previous section. As discussed in the previous section, no surface
treatment or bond agent was applied to the CC surface before placing the ZCC.
Figure 8.4: Half beams constructed out of the host material, i.e., CC after curing and before placing the ZCC repair.
In addition to the ZCC/CC specimens, other specimens were prepared using CC materials, for a
comparison purpose. Two different CC mixtures were placed against the host CC specimens to
fill the second half of each plastic cylinder, CC1 and CC2.
After placing the CC repair material, the specimens were either cured under ambient conditions
or in the moisture room. After placing the CC repair, the specimens were cured following two
curing regimes based on CC mixture, i.e., CC1 and CC2. The first curing regime was ambient
curing where the specimens were covered with a top plastic sheet to prevent moisture loss. Then,
the specimens, still in the molds, were placed in the laboratory at a room temperature of 73 ± 3o F
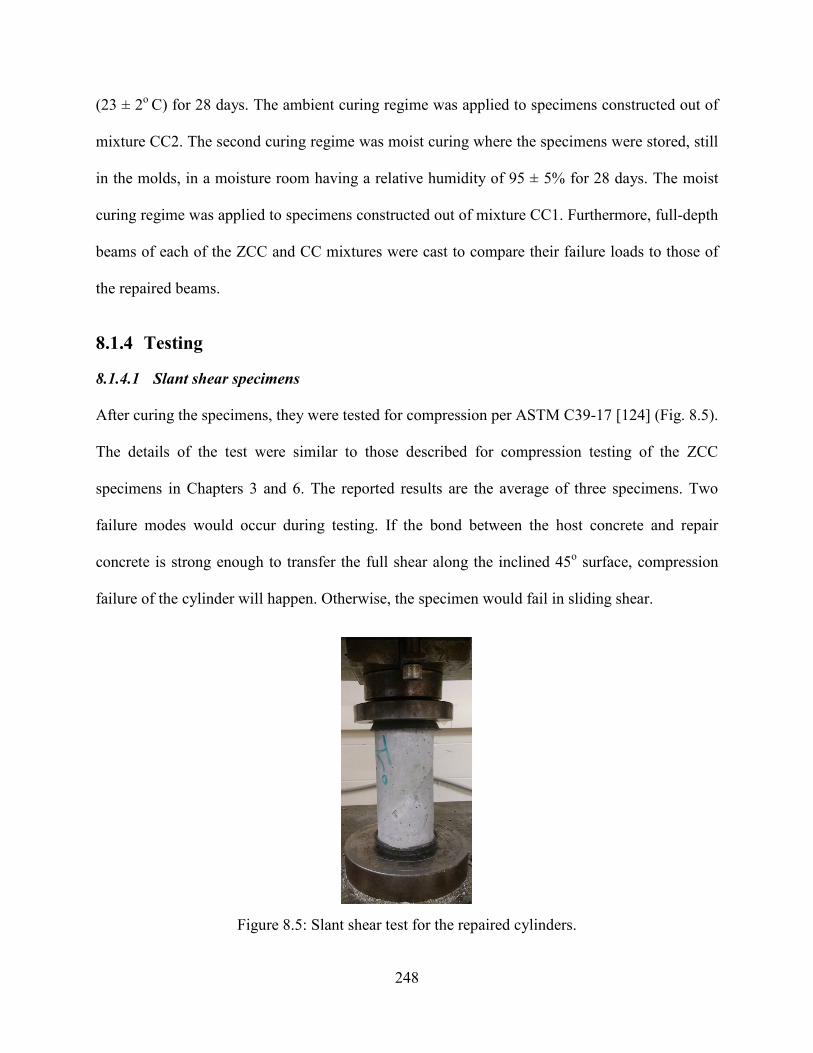
248
(23 ± 2o C) for 28 days. The ambient curing regime was applied to specimens constructed out of
mixture CC2. The second curing regime was moist curing where the specimens were stored, still
in the molds, in a moisture room having a relative humidity of 95 ± 5% for 28 days. The moist
curing regime was applied to specimens constructed out of mixture CC1. Furthermore, full-depth
beams of each of the ZCC and CC mixtures were cast to compare their failure loads to those of
the repaired beams.
8.1.4 Testing
8.1.4.1 Slant shear specimens
After curing the specimens, they were tested for compression per ASTM C39-17 [124] (Fig. 8.5).
The details of the test were similar to those described for compression testing of the ZCC
specimens in Chapters 3 and 6. The reported results are the average of three specimens. Two
failure modes would occur during testing. If the bond between the host concrete and repair
concrete is strong enough to transfer the full shear along the inclined 45o surface, compression
failure of the cylinder will happen. Otherwise, the specimen would fail in sliding shear.
Figure 8.5: Slant shear test for the repaired cylinders.
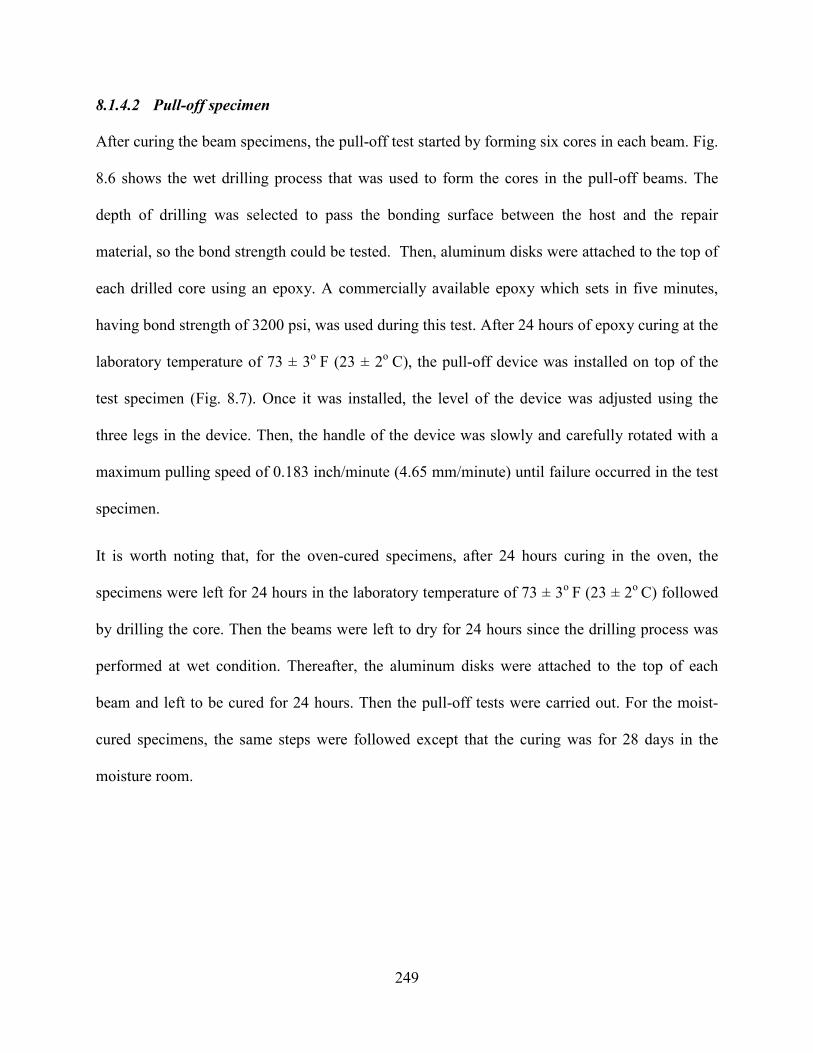
249
8.1.4.2 Pull-off specimen
After curing the beam specimens, the pull-off test started by forming six cores in each beam. Fig.
8.6 shows the wet drilling process that was used to form the cores in the pull-off beams. The
depth of drilling was selected to pass the bonding surface between the host and the repair
material, so the bond strength could be tested. Then, aluminum disks were attached to the top of
each drilled core using an epoxy. A commercially available epoxy which sets in five minutes,
having bond strength of 3200 psi, was used during this test. After 24 hours of epoxy curing at the
laboratory temperature of 73 ± 3o F (23 ± 2o C), the pull-off device was installed on top of the
test specimen (Fig. 8.7). Once it was installed, the level of the device was adjusted using the
three legs in the device. Then, the handle of the device was slowly and carefully rotated with a
maximum pulling speed of 0.183 inch/minute (4.65 mm/minute) until failure occurred in the test
specimen.
It is worth noting that, for the oven-cured specimens, after 24 hours curing in the oven, the
specimens were left for 24 hours in the laboratory temperature of 73 ± 3o F (23 ± 2o C) followed
by drilling the core. Then the beams were left to dry for 24 hours since the drilling process was
performed at wet condition. Thereafter, the aluminum disks were attached to the top of each
beam and left to be cured for 24 hours. Then the pull-off tests were carried out. For the moist-
cured specimens, the same steps were followed except that the curing was for 28 days in the
moisture room.

250
Figure 8.6: Core preparation processes (a) before drilling, (b) during drilling, and (c) the beams after drilling all the cores.
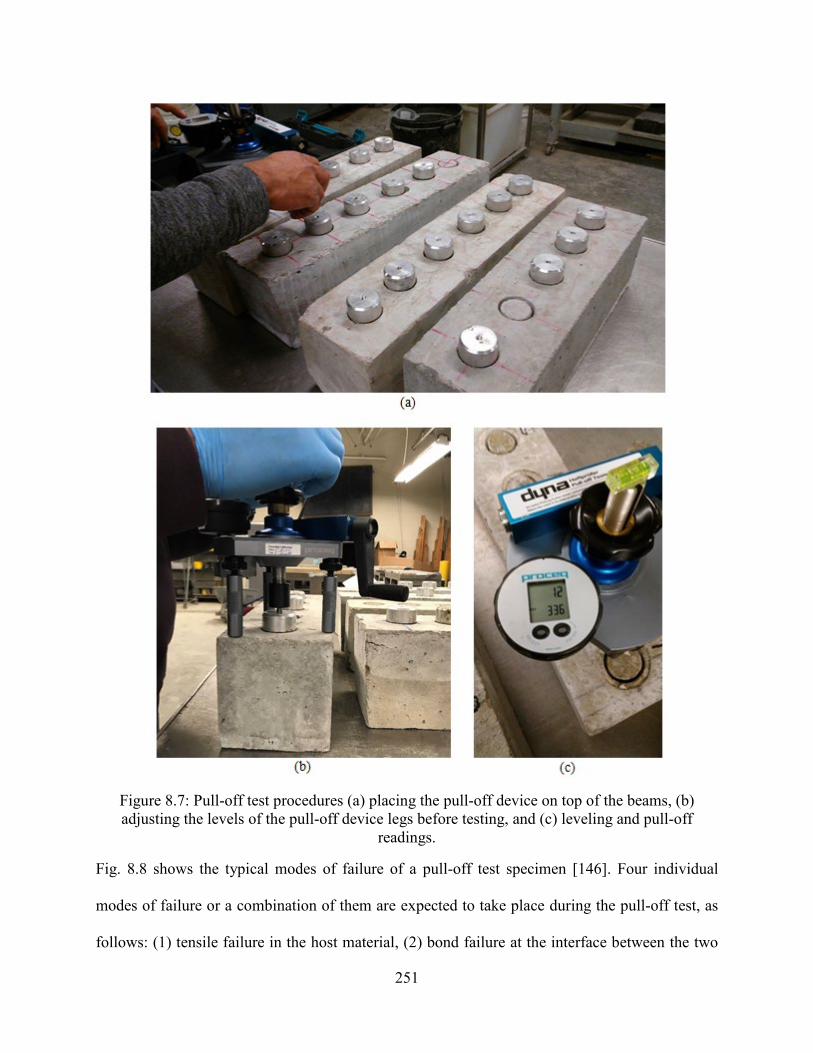
251
Figure 8.7: Pull-off test procedures (a) placing the pull-off device on top of the beams, (b) adjusting the levels of the pull-off device legs before testing, and (c) leveling and pull-off
readings.
Fig. 8.8 shows the typical modes of failure of a pull-off test specimen [146]. Four individual
modes of failure or a combination of them are expected to take place during the pull-off test, as
follows: (1) tensile failure in the host material, (2) bond failure at the interface between the two
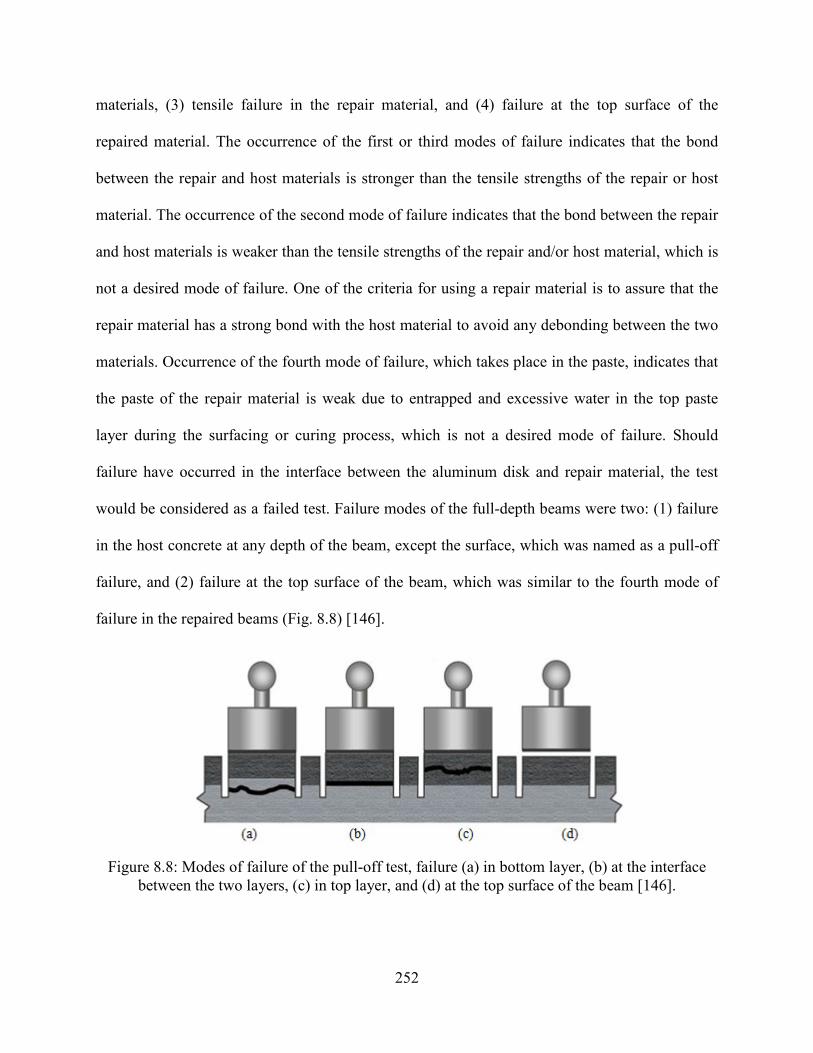
252
materials, (3) tensile failure in the repair material, and (4) failure at the top surface of the
repaired material. The occurrence of the first or third modes of failure indicates that the bond
between the repair and host materials is stronger than the tensile strengths of the repair or host
material. The occurrence of the second mode of failure indicates that the bond between the repair
and host materials is weaker than the tensile strengths of the repair and/or host material, which is
not a desired mode of failure. One of the criteria for using a repair material is to assure that the
repair material has a strong bond with the host material to avoid any debonding between the two
materials. Occurrence of the fourth mode of failure, which takes place in the paste, indicates that
the paste of the repair material is weak due to entrapped and excessive water in the top paste
layer during the surfacing or curing process, which is not a desired mode of failure. Should
failure have occurred in the interface between the aluminum disk and repair material, the test
would be considered as a failed test. Failure modes of the full-depth beams were two: (1) failure
in the host concrete at any depth of the beam, except the surface, which was named as a pull-off
failure, and (2) failure at the top surface of the beam, which was similar to the fourth mode of
failure in the repaired beams (Fig. 8.8) [146].
Figure 8.8: Modes of failure of the pull-off test, failure (a) in bottom layer, (b) at the interface between the two layers, (c) in top layer, and (d) at the top surface of the beam [146].
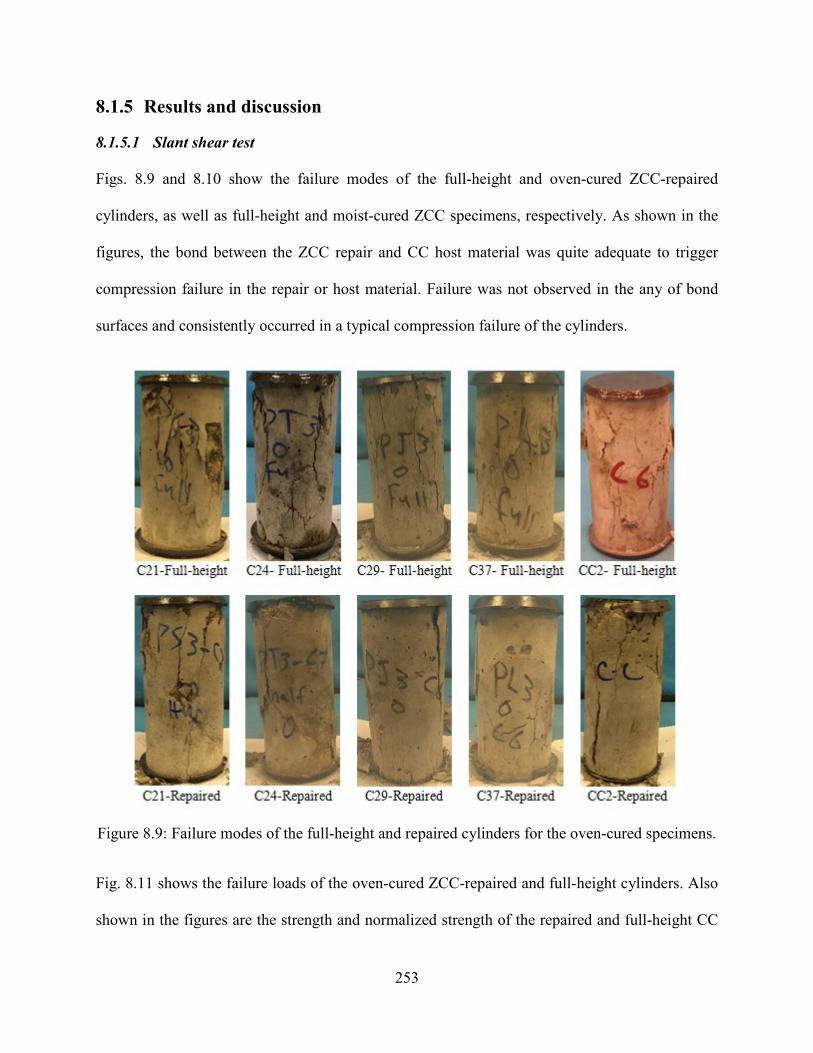
253
8.1.5 Results and discussion
8.1.5.1 Slant shear test
Figs. 8.9 and 8.10 show the failure modes of the full-height and oven-cured ZCC-repaired
cylinders, as well as full-height and moist-cured ZCC specimens, respectively. As shown in the
figures, the bond between the ZCC repair and CC host material was quite adequate to trigger
compression failure in the repair or host material. Failure was not observed in the any of bond
surfaces and consistently occurred in a typical compression failure of the cylinders.
Figure 8.9: Failure modes of the full-height and repaired cylinders for the oven-cured specimens.
Fig. 8.11 shows the failure loads of the oven-cured ZCC-repaired and full-height cylinders. Also
shown in the figures are the strength and normalized strength of the repaired and full-height CC
254
cylinders despite being ambient-cured for comparison purposes. Fig. 8.12 shows the compressive
strength of the repaired cylinders normalized by the compressive strength of the corresponding
full-height cylinders. Similarly, Figs. 8.13 and 8.14 show the failure loads and normalized loads
of the moist-cured ZCC-repaired and full-height cylinders. Similarly shown in the figures are the
strength and normalized strength of the moist-cured CC repaired and full-height CC cylinders.
Figs. 8.15 and 8.16 show the compressive strength of the ZCC-repaired specimens normalized by
the compressive strength of the CC repaired specimens for oven and moist curing, respectively.
The data shown in Figs. 8.11 through 8.16 represent the average of three replicate specimens for
each mixture. The range of the measured data for each mixture is also shown on each figure
using vertical lines.
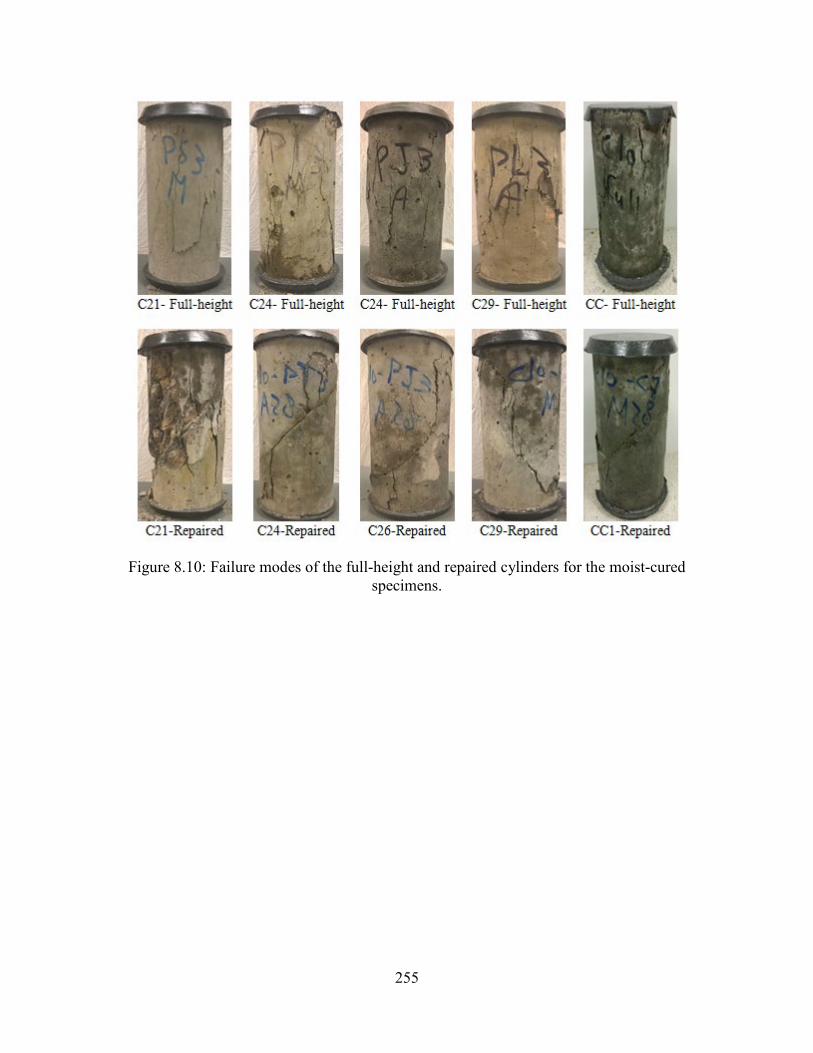
255
Figure 8.10: Failure modes of the full-height and repaired cylinders for the moist-cured specimens.
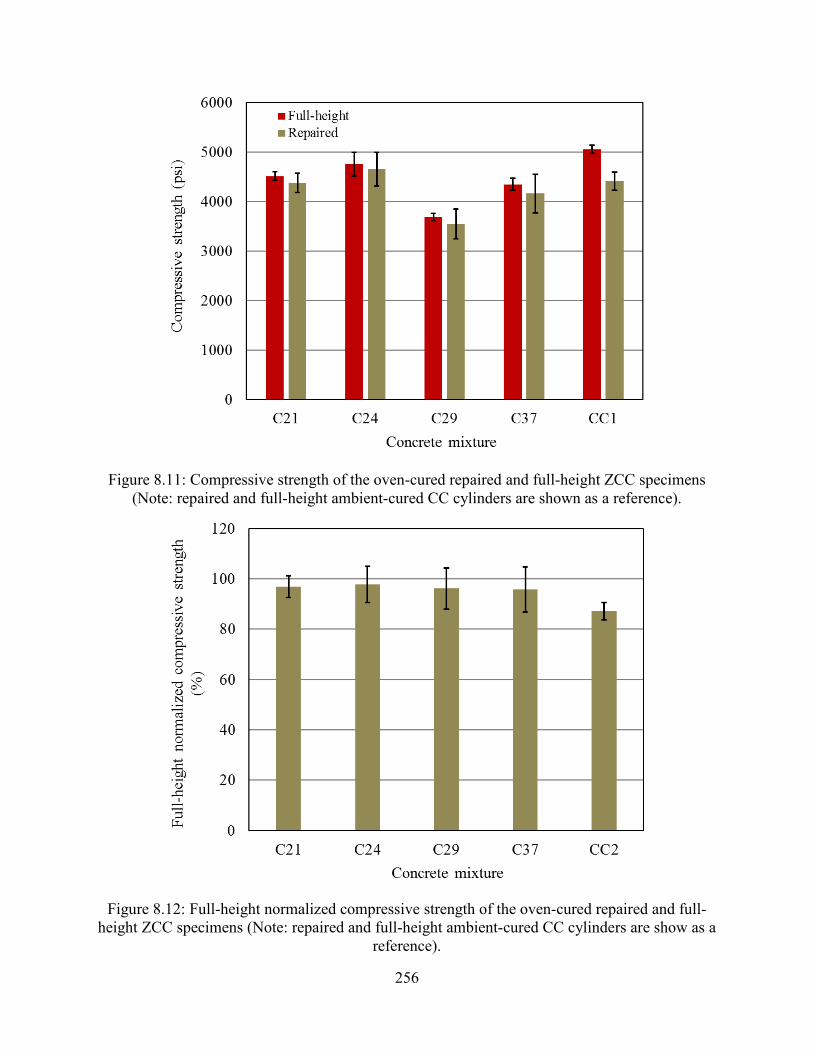
256
Figure 8.11: Compressive strength of the oven-cured repaired and full-height ZCC specimens (Note: repaired and full-height ambient-cured CC cylinders are shown as a reference).
Figure 8.12: Full-height normalized compressive strength of the oven-cured repaired and full-height ZCC specimens (Note: repaired and full-height ambient-cured CC cylinders are show as a
reference).
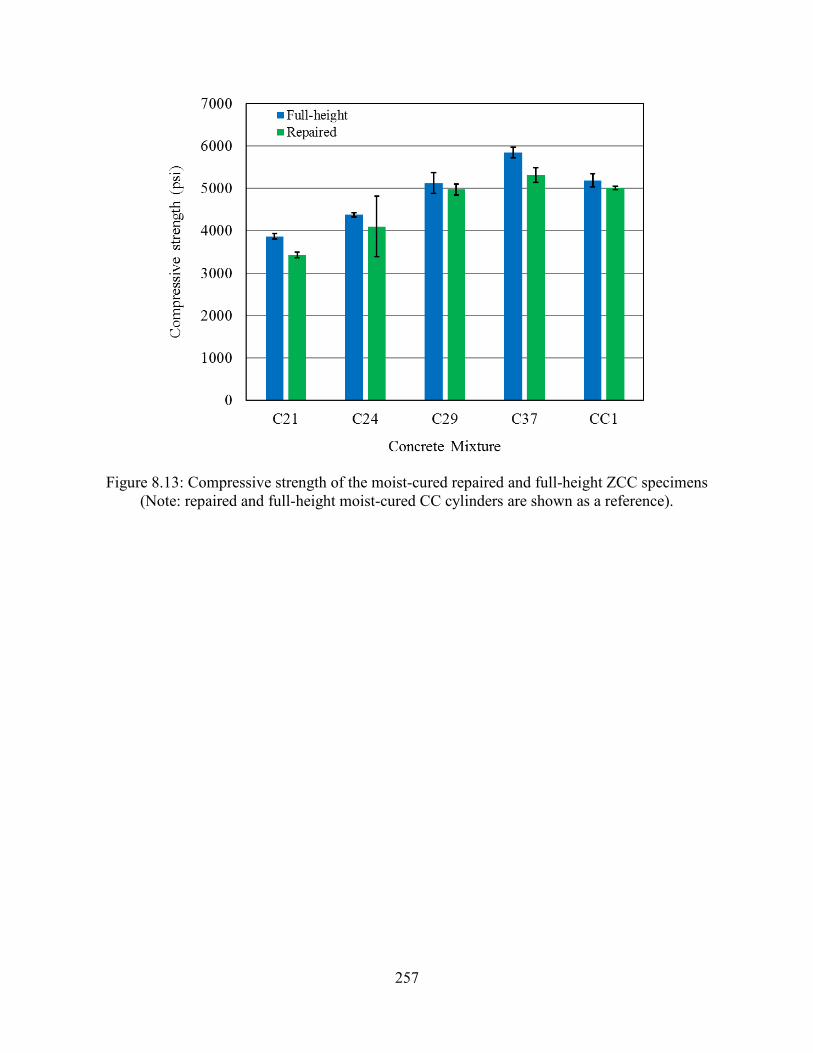
257
Figure 8.13: Compressive strength of the moist-cured repaired and full-height ZCC specimens (Note: repaired and full-height moist-cured CC cylinders are shown as a reference).
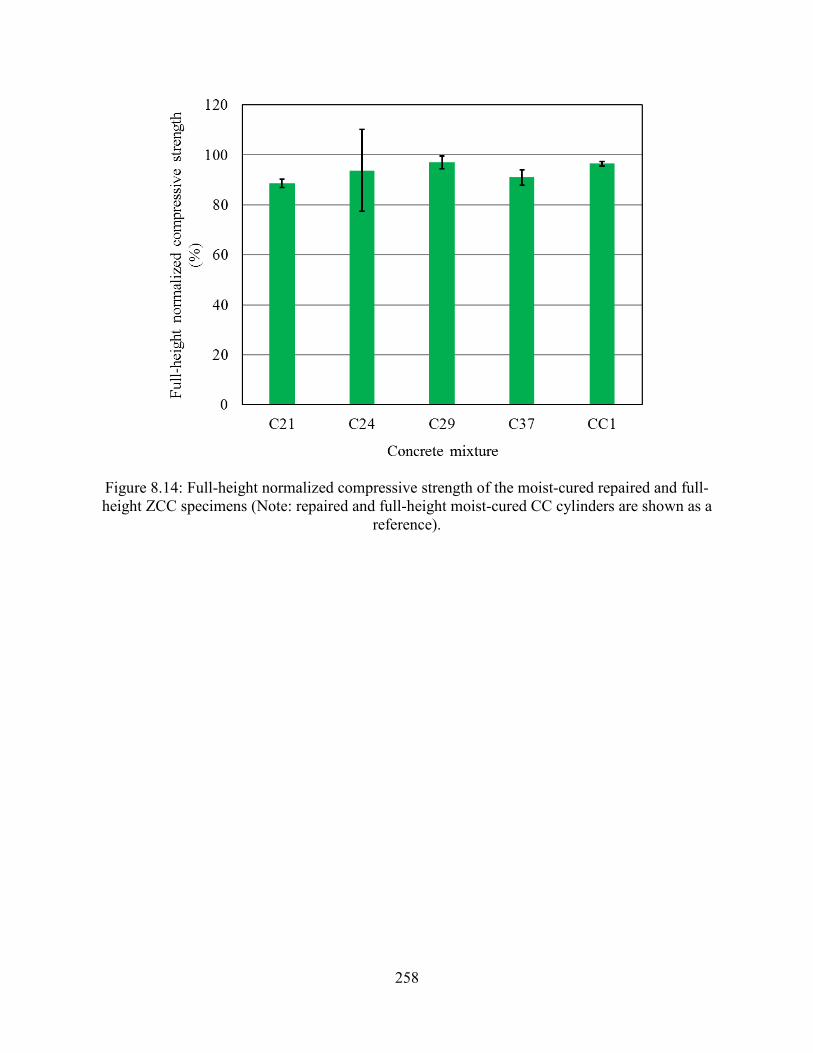
258
Figure 8.14: Full-height normalized compressive strength of the moist-cured repaired and full-height ZCC specimens (Note: repaired and full-height moist-cured CC cylinders are shown as a
reference).
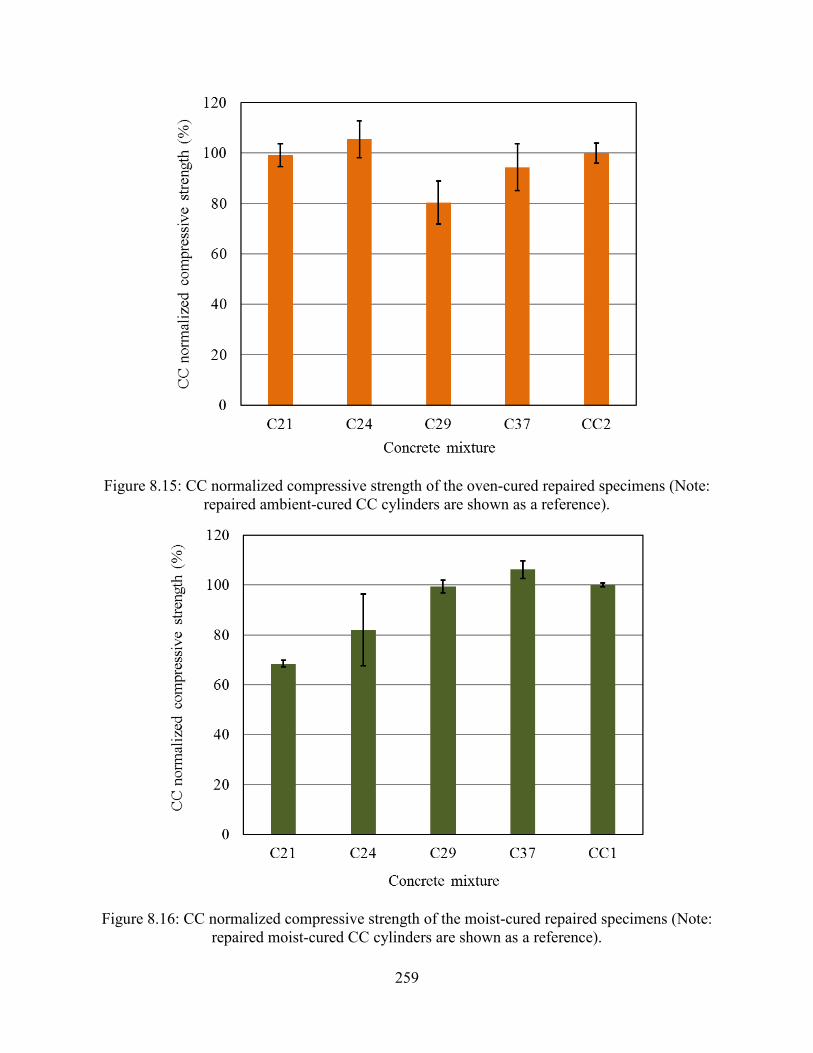
259
Figure 8.15: CC normalized compressive strength of the oven-cured repaired specimens (Note: repaired ambient-cured CC cylinders are shown as a reference).
Figure 8.16: CC normalized compressive strength of the moist-cured repaired specimens (Note: repaired moist-cured CC cylinders are shown as a reference).
260
As shown in Figs. 8.11 through 8.16, repairing CC using ZCC was quite successful, and the ZCC
repair developed an adequate bond with the host CC material. The failure loads of the full-height
cylinders were higher than those of the repaired cylinders only by up to approximately 13%. The
failure loads of the oven-cured repaired specimens were 3.1%, 2.1%, 3.8%, 4.2%, and 12.7%
lower than those of the full-height specimens constructed using C21, C24, C29, C37, and CC2
mixtures. Similarly, the failure loads of the moist-cured repaired specimens were 11.4%, 6.2%,
3.0%, 9.1%, and 3.5% lower than those of the full-height specimens constructed using C21, C24,
C29, C37, and CC1 mixtures, respectively. Therefore, improving the bond between the ZCC
repair material and CC concrete using a bonding agent or sand blasting would have a limited
effect on the strength of the test specimens.
Curing slightly affected the bond between the ZCC repair material and host CC concrete (Figs.
8.15 and 8.16). Oven-cured ZCC repair developed, on average, 97% of the strength of that of the
full-height specimens while the moist-cured ZCC repair developed, on average, 93% of the
strength of that of the full-height specimens. The results of both curing regimes were very
consistent. The average standard deviation and coefficient of variation were 295 psi and 7.1% for
oven-cured repair and 300 psi and 6.9% for moist-cured repair, respectively.
As shown in Figs. 8.15 and 8.16, repairing using ZCC was capable of achieving failure loads
similar to that of the CC repair. The oven-cured ZCC repair strengths normalized by CC repair
strength were 99%, 106%, 80%, and 94% for C21, C24, C29, and C37, respectively, with an
average of 95% and standard deviation of 295 psi. Similarly, the moist-cured ZCC strengths
normalized by CC repair strength were 68%, 82%, 99%, and 106% for C21, C24, C29, and C37,
respectively, with an average of 89% standard deviation of 300 psi. As indicated earlier, no bond
failure occurred in any of the test specimens. Hence, the failure loads were controlled by those of
261
the strength of the ZCC or CC mixtures. Hence, in some cases where the ZCC repair displayed
repair strength smaller than that of the CC repair strength, the strength of the ZCC mixture can
be adjusted to achieve the required repair strength.
8.1.6 Pull-off test
Fig. 8.17 shows a summary of the failure modes of the different repaired beams. Four failure
modes took place as follows: 1) Direct tensile failure in the host material, 2) Bond failure at the
interface surface between the host and repair material, 3) Direct tensile failure in the repaired
material, and 4) Failure at the top surface of the beam.
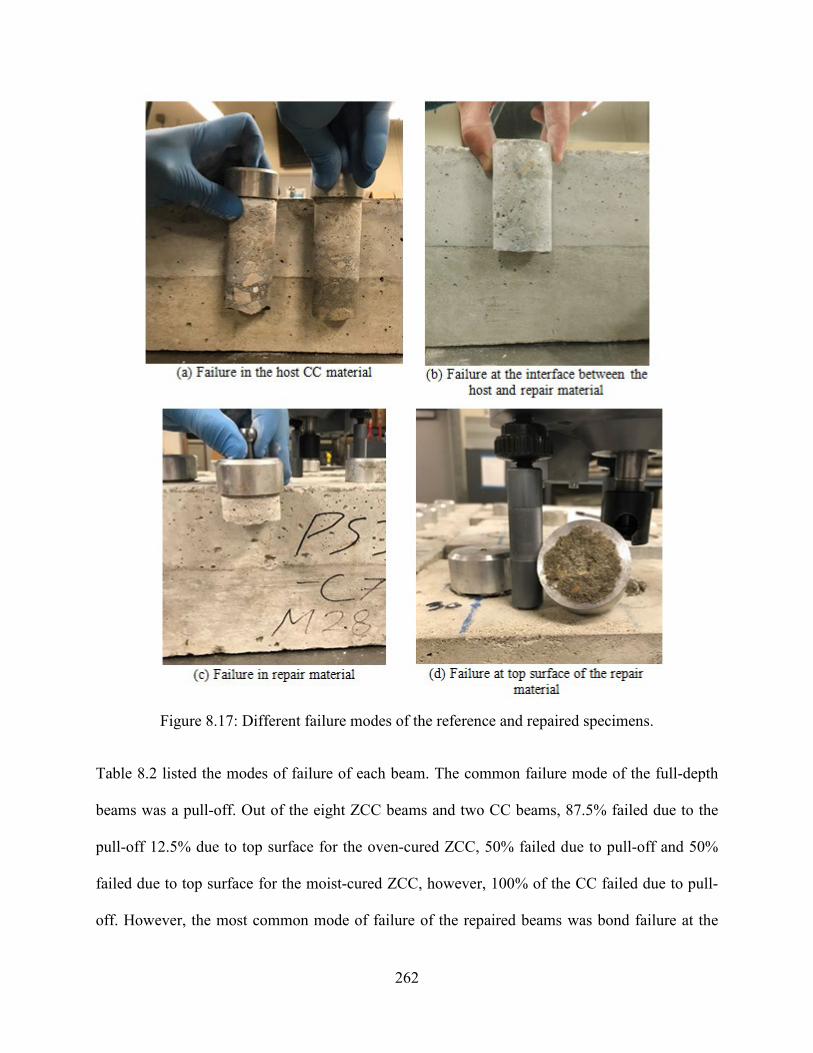
262
Figure 8.17: Different failure modes of the reference and repaired specimens.
Table 8.2 listed the modes of failure of each beam. The common failure mode of the full-depth
beams was a pull-off. Out of the eight ZCC beams and two CC beams, 87.5% failed due to the
pull-off 12.5% due to top surface for the oven-cured ZCC, 50% failed due to pull-off and 50%
failed due to top surface for the moist-cured ZCC, however, 100% of the CC failed due to pull-
off. However, the most common mode of failure of the repaired beams was bond failure at the
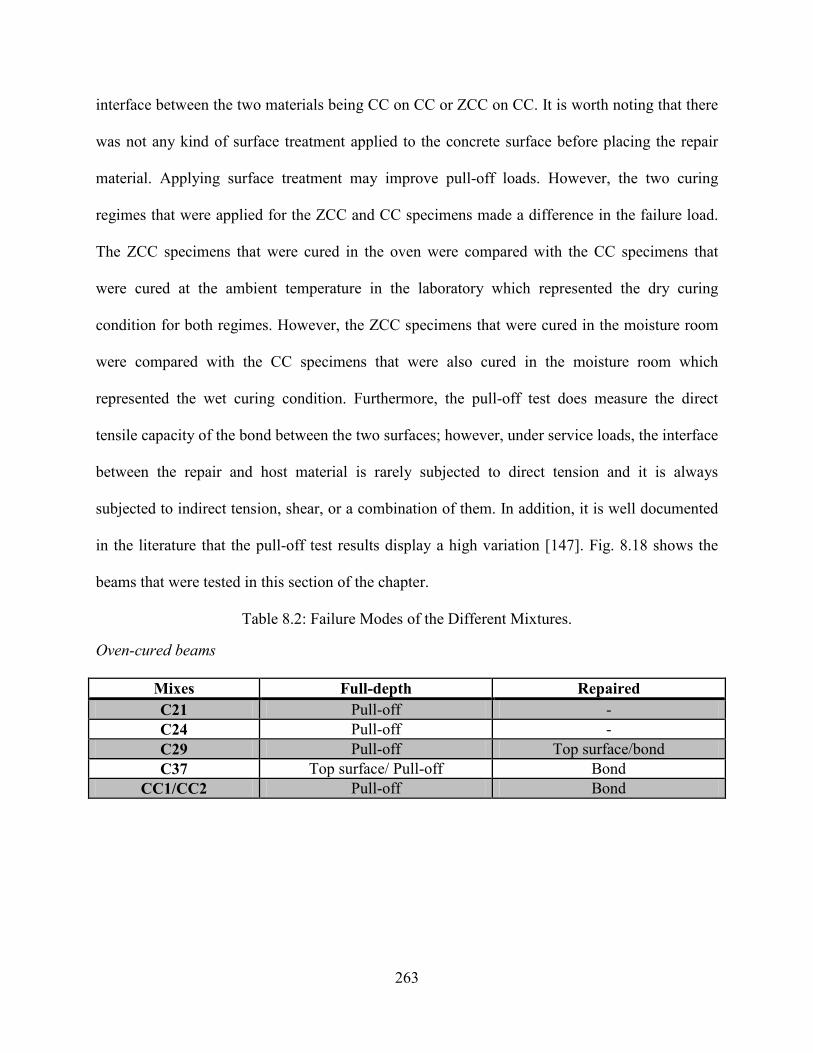
263
interface between the two materials being CC on CC or ZCC on CC. It is worth noting that there
was not any kind of surface treatment applied to the concrete surface before placing the repair
material. Applying surface treatment may improve pull-off loads. However, the two curing
regimes that were applied for the ZCC and CC specimens made a difference in the failure load.
The ZCC specimens that were cured in the oven were compared with the CC specimens that
were cured at the ambient temperature in the laboratory which represented the dry curing
condition for both regimes. However, the ZCC specimens that were cured in the moisture room
were compared with the CC specimens that were also cured in the moisture room which
represented the wet curing condition. Furthermore, the pull-off test does measure the direct
tensile capacity of the bond between the two surfaces; however, under service loads, the interface
between the repair and host material is rarely subjected to direct tension and it is always
subjected to indirect tension, shear, or a combination of them. In addition, it is well documented
in the literature that the pull-off test results display a high variation [147]. Fig. 8.18 shows the
beams that were tested in this section of the chapter.
Table 8.2: Failure Modes of the Different Mixtures.
Oven-cured beams
Mixes Full-depth Repaired C21 Pull-off - C24 Pull-off - C29 Pull-off Top surface/bond C37 Top surface/ Pull-off Bond
CC1/CC2 Pull-off Bond
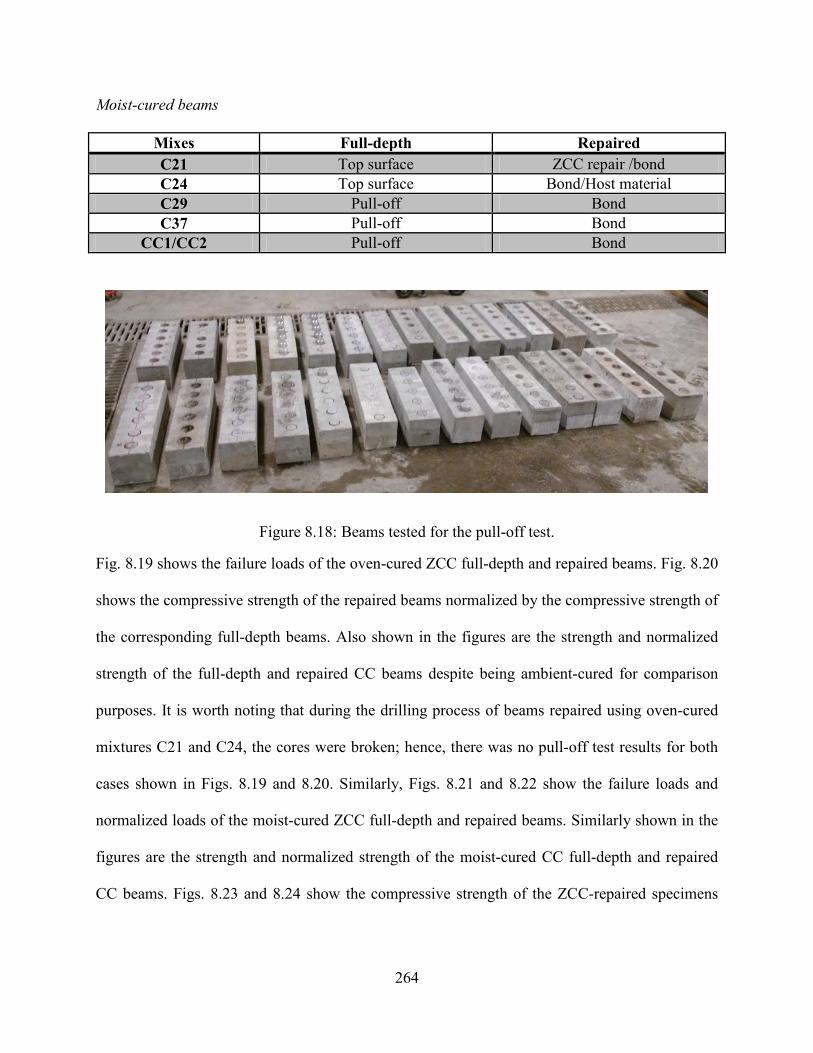
264
Moist-cured beams
Mixes Full-depth Repaired C21 Top surface ZCC repair /bond C24 Top surface Bond/Host material C29 Pull-off Bond C37 Pull-off Bond
CC1/CC2 Pull-off Bond
Figure 8.18: Beams tested for the pull-off test.
Fig. 8.19 shows the failure loads of the oven-cured ZCC full-depth and repaired beams. Fig. 8.20
shows the compressive strength of the repaired beams normalized by the compressive strength of
the corresponding full-depth beams. Also shown in the figures are the strength and normalized
strength of the full-depth and repaired CC beams despite being ambient-cured for comparison
purposes. It is worth noting that during the drilling process of beams repaired using oven-cured
mixtures C21 and C24, the cores were broken; hence, there was no pull-off test results for both
cases shown in Figs. 8.19 and 8.20. Similarly, Figs. 8.21 and 8.22 show the failure loads and
normalized loads of the moist-cured ZCC full-depth and repaired beams. Similarly shown in the
figures are the strength and normalized strength of the moist-cured CC full-depth and repaired
CC beams. Figs. 8.23 and 8.24 show the compressive strength of the ZCC-repaired specimens
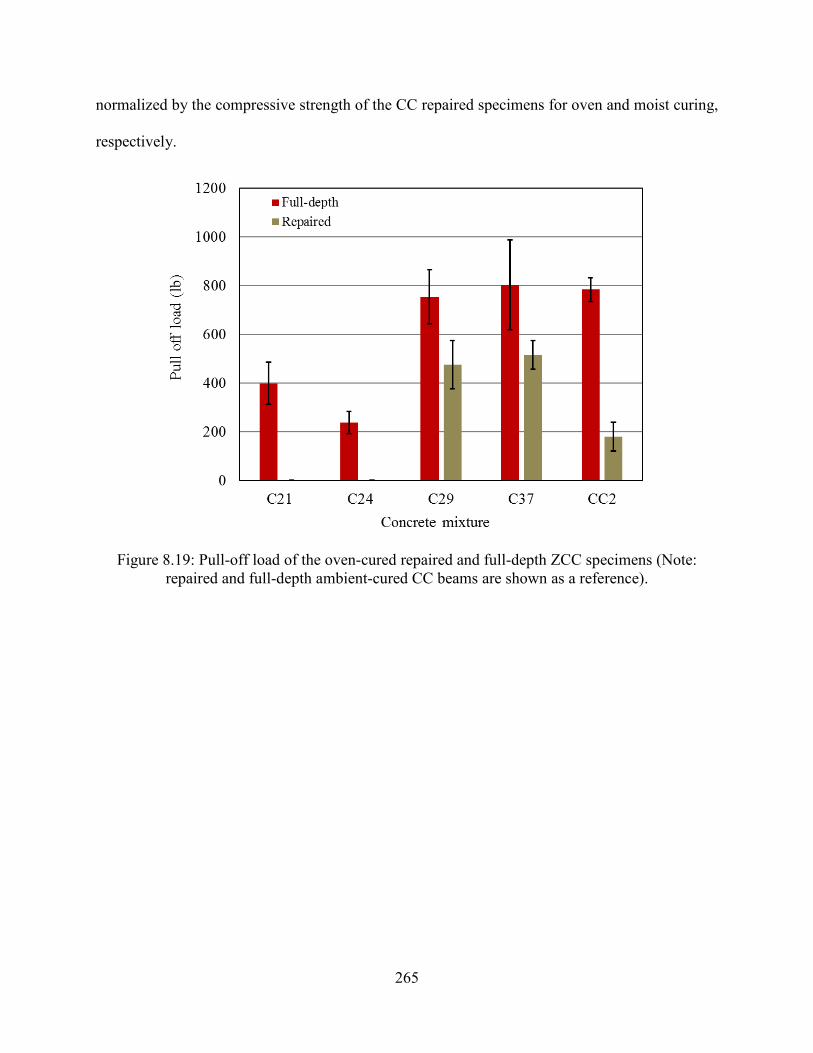
265
normalized by the compressive strength of the CC repaired specimens for oven and moist curing,
respectively.
Figure 8.19: Pull-off load of the oven-cured repaired and full-depth ZCC specimens (Note: repaired and full-depth ambient-cured CC beams are shown as a reference).
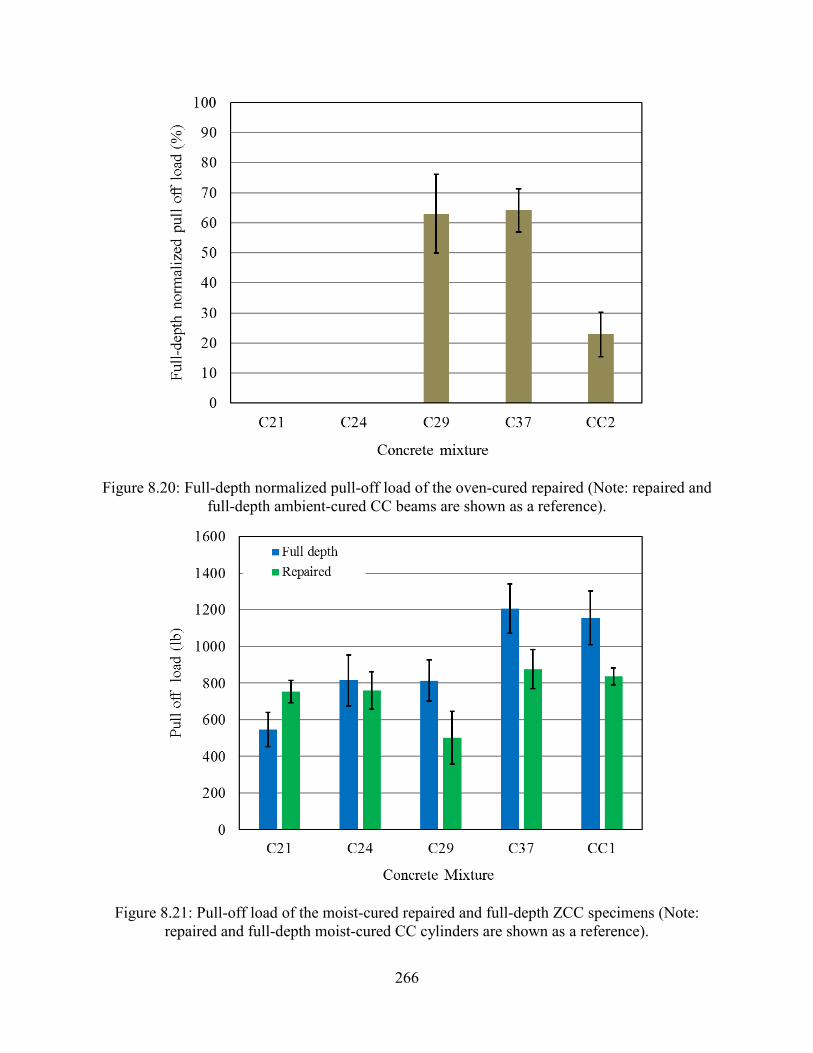
266
Figure 8.20: Full-depth normalized pull-off load of the oven-cured repaired (Note: repaired and full-depth ambient-cured CC beams are shown as a reference).
Figure 8.21: Pull-off load of the moist-cured repaired and full-depth ZCC specimens (Note: repaired and full-depth moist-cured CC cylinders are shown as a reference).
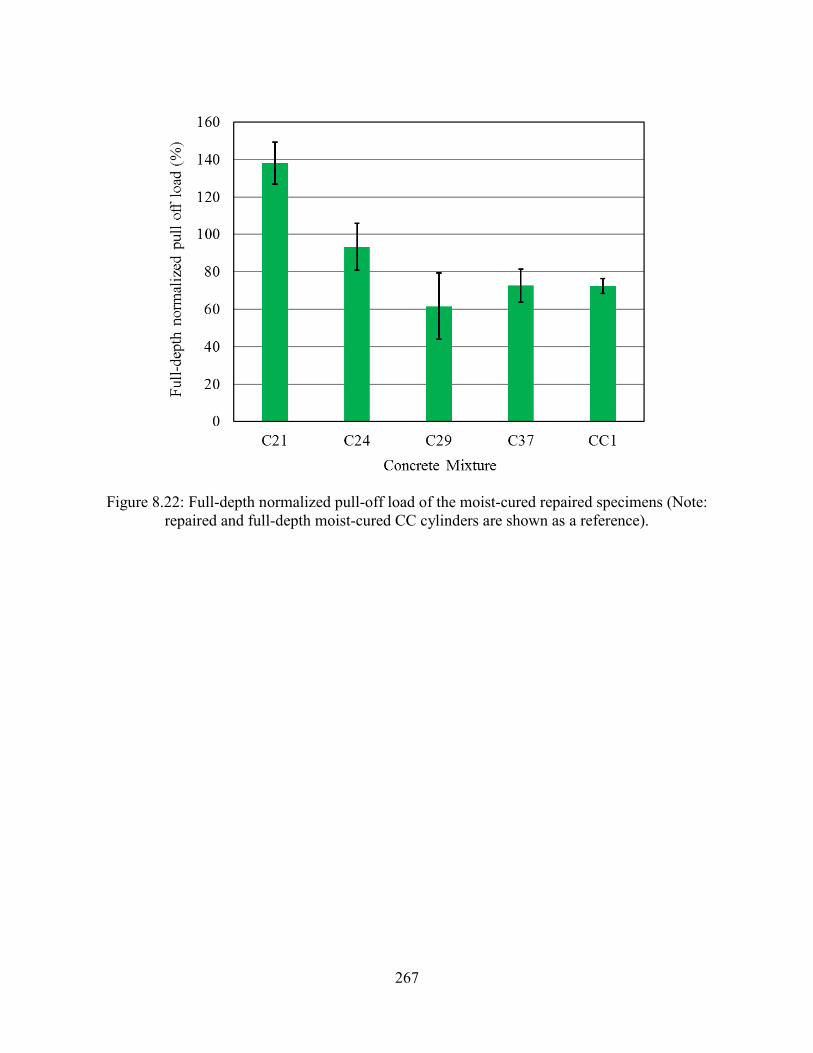
267
Figure 8.22: Full-depth normalized pull-off load of the moist-cured repaired specimens (Note: repaired and full-depth moist-cured CC cylinders are shown as a reference).
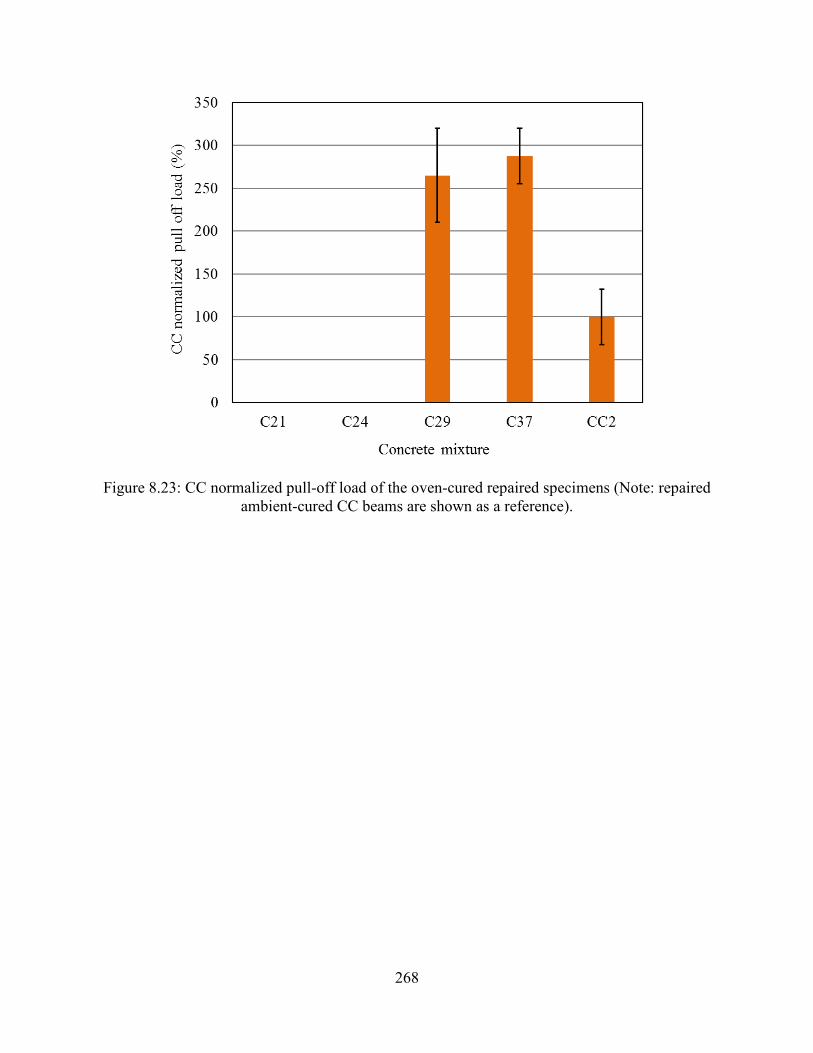
268
Figure 8.23: CC normalized pull-off load of the oven-cured repaired specimens (Note: repaired ambient-cured CC beams are shown as a reference).
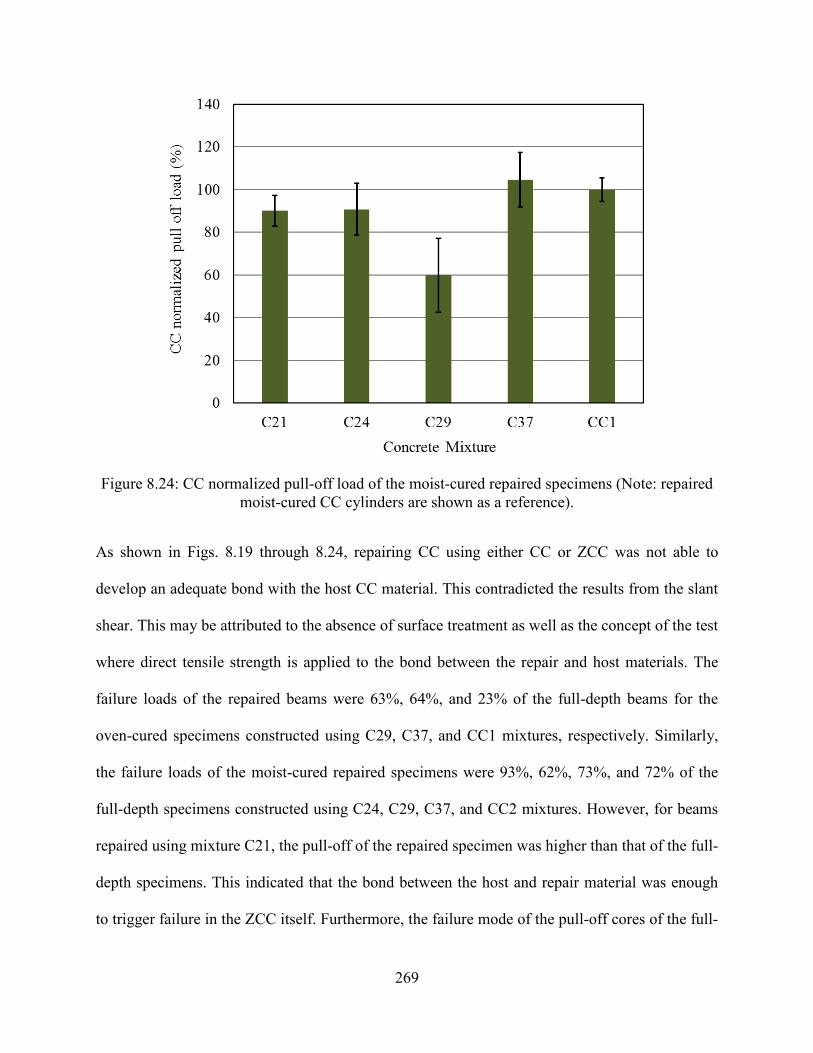
269
Figure 8.24: CC normalized pull-off load of the moist-cured repaired specimens (Note: repaired moist-cured CC cylinders are shown as a reference).
As shown in Figs. 8.19 through 8.24, repairing CC using either CC or ZCC was not able to
develop an adequate bond with the host CC material. This contradicted the results from the slant
shear. This may be attributed to the absence of surface treatment as well as the concept of the test
where direct tensile strength is applied to the bond between the repair and host materials. The
failure loads of the repaired beams were 63%, 64%, and 23% of the full-depth beams for the
oven-cured specimens constructed using C29, C37, and CC1 mixtures, respectively. Similarly,
the failure loads of the moist-cured repaired specimens were 93%, 62%, 73%, and 72% of the
full-depth specimens constructed using C24, C29, C37, and CC2 mixtures. However, for beams
repaired using mixture C21, the pull-off of the repaired specimen was higher than that of the full-
depth specimens. This indicated that the bond between the host and repair material was enough
to trigger failure in the ZCC itself. Furthermore, the failure mode of the pull-off cores of the full-
270
depth beams was mainly at the top surface and pull-off (Table 8.2) indicating that the paste at the
top surface of the beam was weak due to the surfacing process that may have entrapped some
excessive water in the top paste layer. However, failure in the corresponding repaired specimens
was either at the top layer, bond, or bottom layer (Table 8.2).
Curing significantly affected the bond between the ZCC repair material and host CC concrete.
Oven-cured ZCC repair developed an average 63.6% of the strength of that of the full-depth
beams while the moist-cured ZCC repair developed an average 91.4% of the strength of that of
the full-depth beams. Therefore, it can be concluded that curing the repaired specimens under
wet conditions resulted in higher bond strength than curing under dry conditions. The results of
both curing regimes were relatively consistent. The standard deviation and coefficient of
variation were 125 lb and 17.6% for oven-cured repair and 115 lb and 17.2% for moist-cured
repair, respectively.
As shown in Figs. 8.23 and 8.24, repair using ZCC was capable of achieving performance
different than that of CC repair in the case of the oven-cured specimens; however, it was similar
in the case of the moist-cured specimens. The oven-cured ZCC repair strength normalized by
that of the ambient-cured CC repair was 265.0%, and 287.5% for repairing using C29 and C37,
respectively, with an average of 276.3%. Hence, oven cure repair outperformed the CC repair in
the case of curing under the dry conditions. However, the moist-cured ZCC repair strength
normalized by that of the moist-cured CC repair was 90.1%, 90.8%, 59.9%, and 104.7% for
repairing using C21, C24, C29, and C37, respectively, with an average of 86.4%. Hence, moist
cure repair was similar to that of the CC repair.
271
8.2 Findings and Conclusions This chapter presents the results of slant shear and pull-off tests that were carried out to
characterize the bond between the CC as a host material and ZCC as a repair material. The bond
between CC as a host material and CC as a repair material was also investigated as a reference.
In addition to the slant and pull-off tests, compression load tests were carried out on full-height
ZCC and full-height CC specimens. Pull-off tests were also carried out on full-depth ZCC and
CC beams. The following can be concluded:
• The bond between ZCC concrete and CC was adequate to trigger compression damage in
the host CC material or the ZCC repair material rather than shear sliding along the
interface surface.
• The compressive strengths of the repaired cylinders were slightly less than that of the
full-height cylinders since bond failure did not occur. The reduction in the failure load
from the full-height to the repaired ZCC cylinders ranged from 2.1% to 4.2% for the
oven-cured specimens and from 3.0% to 11.4% for the moist-cured specimens.
• In the case of testing the cylinders under compression for the slant shear test, both curing
regimes showed high bond strength between the CC host concrete and ZCC repair, which
indicated that the curing at the elevated temperature of 158o F (70o C) did not adversely
weaken the bond between the two materials.
• The slant shear tests showed that both CC and ZCC repairing performed very similarly.
The cylinders that were repaired using ZCC achieved compressive strength ranging from
68.4% to 106.2% with an average of 91.9% of that of the specimens repaired using CC.
However, since bond failure did not occur; failure was controlled by the compressive
strength of the host CC material and repair ZCC material.

272
• Most of the failure mode of the full-depth beams was a pull-off, where the failure took
place within the beam itself not at the surface. However, the most common mode of
failure of the repaired beams was at the interface between the host and repair materials.
This occurred whether the repair was carried out using CC or ZCC. Surface treatment
such as sand blasting and/or a bonding agent may improve the bond between the two
materials. Furthermore, the pull-off test is a measure of the direct tensile capacity of the
bond between the two surfaces; however, under service loads, the interface between the
repair and host material is rarely subjected to direct tension and it is more common to be
subjected to indirect tension, flexural tension, shear, or a combination of them.
• The pull-off strengths of the repaired beams (whether the repair was CC or ZCC) were
less than that of the full-depth beams. The curing regime played an important role in the
bond strength, where the moist-cured specimens showed higher bond strength than the
oven-cured specimens. For the thermally cured specimens, the pull-off strengths of the
repaired beams ranged from 66% to 67% of the full-depth beams. However, for the
moist-cured specimen, the pull-off strength of the repaired beams ranged from 62% to
93% of the full-depth beams. For the CC specimens, the pull-off strengths of the repaired
CC beams ranged from 23% to 72% of the full-depth beams.
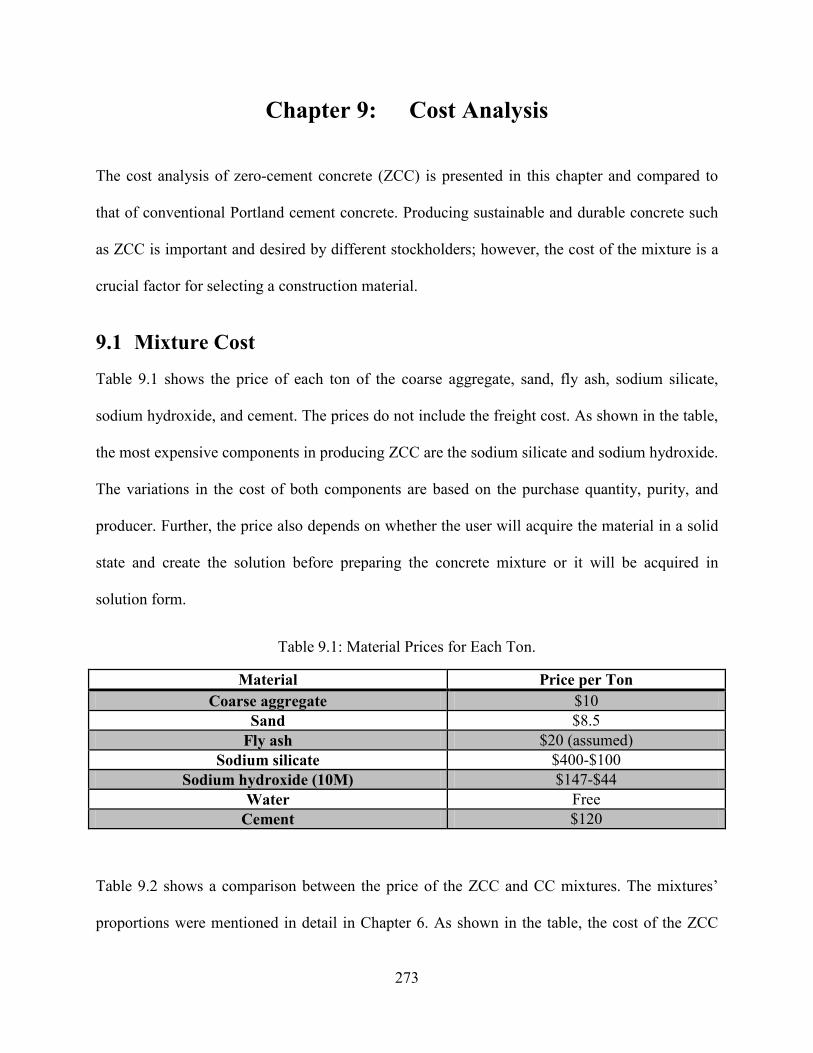
273
Chapter 9: Cost Analysis
The cost analysis of zero-cement concrete (ZCC) is presented in this chapter and compared to
that of conventional Portland cement concrete. Producing sustainable and durable concrete such
as ZCC is important and desired by different stockholders; however, the cost of the mixture is a
crucial factor for selecting a construction material.
9.1 Mixture Cost Table 9.1 shows the price of each ton of the coarse aggregate, sand, fly ash, sodium silicate,
sodium hydroxide, and cement. The prices do not include the freight cost. As shown in the table,
the most expensive components in producing ZCC are the sodium silicate and sodium hydroxide.
The variations in the cost of both components are based on the purchase quantity, purity, and
producer. Further, the price also depends on whether the user will acquire the material in a solid
state and create the solution before preparing the concrete mixture or it will be acquired in
solution form.
Table 9.1: Material Prices for Each Ton.
Material Price per Ton Coarse aggregate $10
Sand $8.5 Fly ash $20 (assumed)
Sodium silicate $400-$100 Sodium hydroxide (10M) $147-$44
Water Free Cement $120
Table 9.2 shows a comparison between the price of the ZCC and CC mixtures. The mixtures’
proportions were mentioned in detail in Chapter 6. As shown in the table, the cost of the ZCC
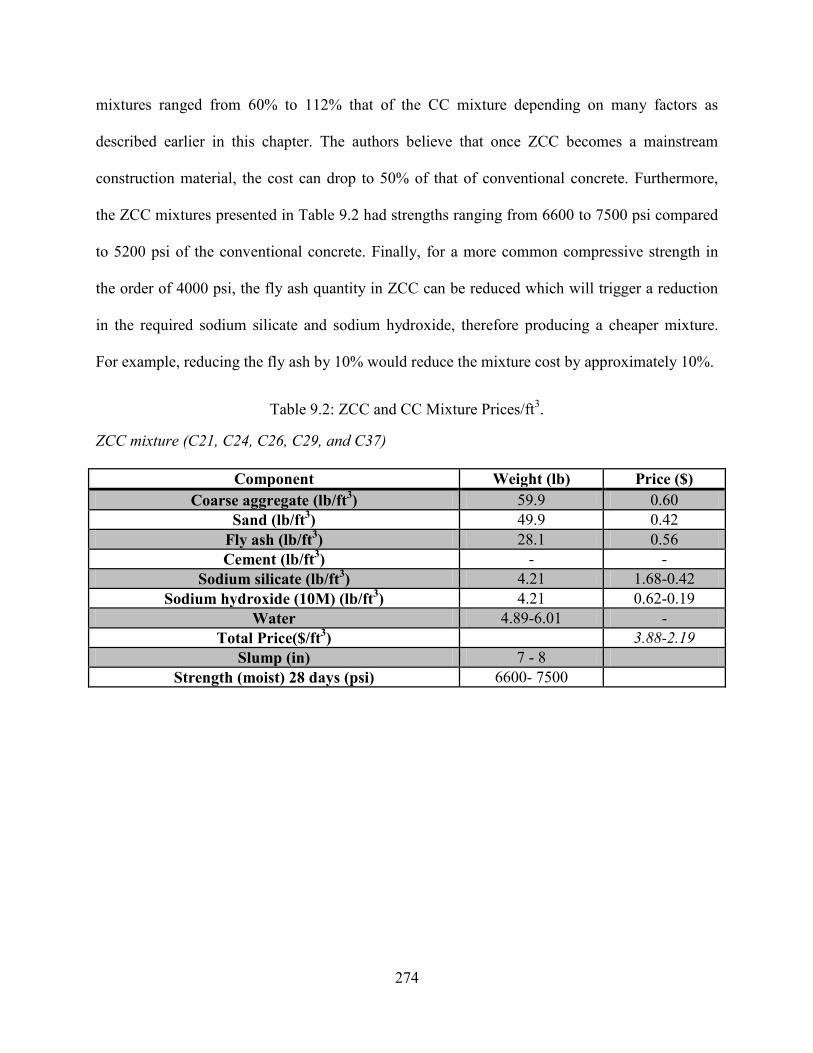
274
mixtures ranged from 60% to 112% that of the CC mixture depending on many factors as
described earlier in this chapter. The authors believe that once ZCC becomes a mainstream
construction material, the cost can drop to 50% of that of conventional concrete. Furthermore,
the ZCC mixtures presented in Table 9.2 had strengths ranging from 6600 to 7500 psi compared
to 5200 psi of the conventional concrete. Finally, for a more common compressive strength in
the order of 4000 psi, the fly ash quantity in ZCC can be reduced which will trigger a reduction
in the required sodium silicate and sodium hydroxide, therefore producing a cheaper mixture.
For example, reducing the fly ash by 10% would reduce the mixture cost by approximately 10%.
Table 9.2: ZCC and CC Mixture Prices/ft3.
ZCC mixture (C21, C24, C26, C29, and C37)
Component Weight (lb) Price ($) Coarse aggregate (lb/ft3) 59.9 0.60
Sand (lb/ft3) 49.9 0.42 Fly ash (lb/ft3) 28.1 0.56 Cement (lb/ft3) - -
Sodium silicate (lb/ft3) 4.21 1.68-0.42 Sodium hydroxide (10M) (lb/ft3) 4.21 0.62-0.19
Water 4.89-6.01 - Total Price($/ft3) 3.88-2.19
Slump (in) 7 - 8 Strength (moist) 28 days (psi) 6600- 7500
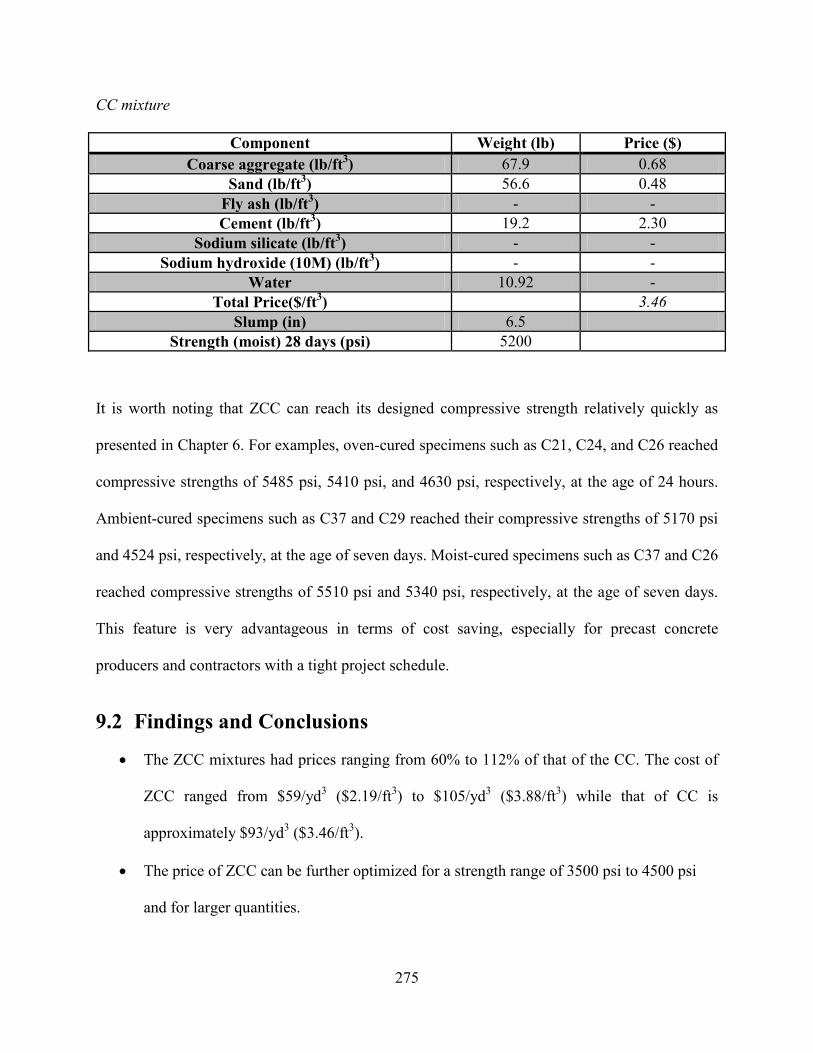
275
CC mixture
Component Weight (lb) Price ($) Coarse aggregate (lb/ft3) 67.9 0.68
Sand (lb/ft3) 56.6 0.48 Fly ash (lb/ft3) - - Cement (lb/ft3) 19.2 2.30
Sodium silicate (lb/ft3) - - Sodium hydroxide (10M) (lb/ft3) - -
Water 10.92 - Total Price($/ft3) 3.46
Slump (in) 6.5 Strength (moist) 28 days (psi) 5200
It is worth noting that ZCC can reach its designed compressive strength relatively quickly as
presented in Chapter 6. For examples, oven-cured specimens such as C21, C24, and C26 reached
compressive strengths of 5485 psi, 5410 psi, and 4630 psi, respectively, at the age of 24 hours.
Ambient-cured specimens such as C37 and C29 reached their compressive strengths of 5170 psi
and 4524 psi, respectively, at the age of seven days. Moist-cured specimens such as C37 and C26
reached compressive strengths of 5510 psi and 5340 psi, respectively, at the age of seven days.
This feature is very advantageous in terms of cost saving, especially for precast concrete
producers and contractors with a tight project schedule.
9.2 Findings and Conclusions
• The ZCC mixtures had prices ranging from 60% to 112% of that of the CC. The cost of
ZCC ranged from $59/yd3 ($2.19/ft3) to $105/yd3 ($3.88/ft3) while that of CC is
approximately $93/yd3 ($3.46/ft3).
• The price of ZCC can be further optimized for a strength range of 3500 psi to 4500 psi
and for larger quantities.
276
• Structural elements made using ZCC can reach their designed compressive strengths
faster than conventional Portland cement concrete where oven-, ambient-, and moist-
cured specimens can reach their specified compressive strength at 24 hours, seven days,
and seven days respectively.
Chapter 10: Conclusions, Recommendations, and Future Work
The main objective of this research study was to investigate the feasibility of using locally
available fly ashes (FAs) to synthesize zero-cement concrete (ZCC) for different structural and
repair applications. ZCC is a relatively new class of concrete that does not include any ordinary
Portland cement (OPC) and relies on other alternative materials such as fly ash, slag, etc. as the
binder material.
Five different types of class C FAs sourced from Labadie (FA37), Jeffrey Energy Center (FA29),
Kansas City (FA26), Thomas Hill (FA24), and Sikeston (FA21) power plants, in the state of
Missouri, were used to synthesize the ZCC used in this report. Two different alkali activators
(Alk) were used in this study as aggregates: sodium silicate (SS), Na2SiO3, and sodium
hydroxide (SH), NaOH, with a fixed molarity of 10M. River sand and dolomite were used for
synthesizing mortar and concrete. Slag, crumb rubber, and air-entraining admixture (AEA) were
used in few mixtures as additives to improve the durability of ZCC.
The mixing procedure, water (W)/FA, Alk/FA, SS/SH, curing regime, fresh properties,
mechanical properties, durability, repair applicability, and cost analysis of the ZCC were
investigated in this study. To address these parameters and properties, approximately 300 mortar
and concrete mixtures were investigated. A 5000 psi MoDOT conventional concrete (CC)
mixture was prepared and tested for comparison purposes.
Twelve different mixing procedures (four for mortar and eight for concrete) were investigated.
W/FA ranging from 0.26 to 0.60, Alk/FA ranging from 0.2 to 0.4, and SS/SH ranging from 0.0 to
2.5 was examined. The investigated fresh properties included the slump, unit weight, air content,
277
278
and temperature. The investigated mechanical properties included the compressive strength,
splitting tensile strength, modulus of rupture (flexural strength), and modulus of elasticity, as
well as the drying shrinkage. The durability testing included the freeze-thaw resistance, surface
resistivity, bulk electrical conductivity, and rapid chloride ion penetration. The ZCC repair
applicability tests included the slant shear and pull-off tests to examine the bond between ZCC
and CC.
This study applied three curing regimes to the ZCC specimens to investigate the effect of the
different curing regimes on the mechanical properties ZCC. The first curing regime included
oven curing where the specimens were encased in oven bags and placed in an electric oven at
different curing temperatures and curing periods with 158o F (70o C) for 24 hours being the most
common thermal curing regime. The second curing approach included ambient curing in the
laboratory at the room temperature of 73o F (23 ± 2o C). The third curing approach included
moist curing in the moisture room at a temperature of 73o F (23 ± 2° C) and relative humidity of
95 ± 5% until the testing day.
10.1 Findings and Conclusions Based on the main findings of this study, the following conclusions can be drawn:
10.1.1 Mixing procedures
• Mixing the water with all the ZC mortar/concrete solid ingredients before adding the
alkali activators was essential where it prevented flash setting and poor workability. In
addition, it resulted in a good workability, setting time, and compressive strength.
279
• Mixing at higher speed, adding the alkali activators gradually over five minutes rather
than one minute, and mixing the SS and SH before adding them to the mixer increased
the workability, setting times, and the compressive strength.
10.1.2 Mixing design
• ZCC having W/FA of 0.34, 0.34 , 0.35 , 0.380, and 0.350 for FA21, FA24, FA26, FA29,
and FA37, respectively, Alk/ FA of 0.300, SS/SH of 1.0, and FA content of 759 lb/yd3
(28.1 lb/ft3) resulted in workable ZCC with a compressive strength exceeding 4000 psi
and hence adequate for most structural applications.
10.1.3 Curing regimes
• The three curing regimes applied to ZCC, namely, oven, ambient, and moist curing
regimes resulted in compressive strengths ranging from 3660 psi to 5985 psi, 4270 psi to
5310 psi, and 6605 psi to 7465 psi, respectively, based on the chemical and physical
properties of the FA as well as mixture design.
• A given strength of ZC mortar can be produced using a given FA and different
combinations of thermal curing temperatures and durations.
• A thermal curing regime is more suitable for the ZCCs that were synthesized using FA
having relatively a lower calcium content while ambient and moist curing are more
suitable for ZCC that were synthesized using FA having a relatively high calcium
content. C21, C24, C26, C29, and C37 displayed compressive strengths of 5485, 5410,
4630, 3635, and 4485 psi after curing at 158o F (70o C) for 24 hours. However, C21, C24,
C26, C29, and C37 displayed compressive strengths of 4305, 3995, 4420, 4525, and 5170
psi after 7 days and 4770, 4270, 4465, 4825, and 5310 psi after 28 days of ambient
280
curing. Furthermore, C21, C24, C26, C29, and C37 displayed compressive strengths of
4840, 5340, 5105, 4685, and 5510 psi after 7 days and 6625, 7425, 6880, 6605, and 7465
psi after 28 days of moist curing, respectively.
• The compressive strength significantly increased from 1 to 7 days for moist- and
ambient-cured specimens while it remained approximately constant for thermal curing
beyond 1 day. The increases in compressive strength of the ZCC from 1 day to 7 days
were 976%, 902% 1079%, 72%, and 88% for ambient-cured and 1110%, 1238%, 1299%,
88%, and 100% for moist-cured specimens for C21,C24, C26, C29, and C37 respectively.
Beyond 7 days, the rates of increase in the strength decreased. The increases in
compressive strength from 7 days to 28 days were 10.9%, 6.8%, 1.0%, 6.7%, and 2.7%
for ambient-cured and 36.9%, 39.1%, 34.8%, 40.9%, and 35.4% for moist-cured
specimens for C21, C24, C26, C29, and C37, respectively. For thermal curing, the
compressive strength increased by 8.4%, 12.4%, 6.4%, 0.7%, 11.0% for C21, C24, C26,
C29, and C37, respectively, from the age of 1 day to 28 days.
• Hot weather curing at 86o F (30o C) for 7 days (168 hours) or imitated Missouri summer
week curing regimes were able to produce 7-day compressive strengths ranging from
approximately 3310 to 7530 psi depending on the FA source and mixture design.
Specimens prepared using FA37 and FA29, which had relatively higher calcium contents,
showed the highest strengths at the hot weather curing indicating prominent hydration
mechanisms.
• There was no significant difference in the 7-day compressive strength of specimens that
were cured in a controlled environment at 86o F (30o C) and those cured at the imitated
Missouri summer week where the curing temperature consisted of ramped up temperature
281
from 72o F (22o C) to 97o F (36o C) over 12 hours followed by ramped down temperature
from 97o F (36o C) to 72o F (22o C) over 12 hours. Hence, the variation in the temperature
overnights in Missouri summer should not affect the strength of ZCC.
• There is a strong correlation between curing energy consumption, i.e., curing duration
and temperature and compressive strength. For a given mixture and sourced FA, there is
an optimum amount of curing energy beyond which increasing the curing energy is not
cost effective.
10.1.4 Mechanical properties
• The relationships between the compressive strength of ZCC and splitting tensile strength,
flexural strength, and modulus of elasticity are similar to those used by ACI 318-14
[133], AS 3600 design code [134], and CEB-FIP model code [135].
• The ACI 318-14 [133] and CEB-FIP model code [135] overestimated the splitting tensile
strength of ZCC by an average of 9% and 11%, respectively, while AS 3600 [134]
underestimated the splitting tensile strength by 27%. Furthermore, the ACI 318-14 and
CEB-FIB model code [135] also overestimated the splitting tensile strength of CC by
12% and 9%, respectively.
• The CEB-FIP model code [135] overestimated the flexural strength of ZCC by an
average of 16%, while ACI 318-14 [133] and AS 3600 [134] underestimated the flexural
strength by 24% and 29%, respectively. Furthermore, CEB-FIB model code [135] also
overestimated the splitting tensile strength of CC by 5%.
• The ACI 318-14 [133] and CEB-FIP model code [135] underestimated the modulus of
elasticity of ZCC by an average of 12% and 20%, respectively.
282
• The drying shrinkage values of the ZCC specimens with different curing regimes at all
ages were significantly lower than those of the CC specimens. At 56 days, the average
shrinkage values of ZCC were 0.029%, 0.0467%, and 0.0491% for the oven-cured
specimens that were tested directly after 24 hours of oven curing, the oven-cured
specimens that were stored for 28 days then tested, and, the moist-cured specimens that
were stored for 28 days then tested, respectively, while it was 0.1282% for the moist-
cured CC specimens. This indicates that the ZCC would display fewer cracks during its
service life, resulting in less penetration of any deicing or other harmful salts that could
cause deterioration.
10.1.5 Durability
• The durability of the ZCC was improved significantly by adding slag as a partial
replacement and the rubber as an additive to the FA. Two out of three slag specimens
successfully passed the 300 cycles of ASTM C666-15 [74] with durability factor of 93.3
and 83.4 for the moist- and oven-cured specimens following procedure A, respectively.
The rubber specimens successfully passed the 300 cycles with durability factor of 104.5
and 75.9 following procedures A and B per ASTM C666-15, respectively.
• Based on the surface resistivity and chloride ion penetration tests, most of the ZCC
mixtures had a low to moderate permeability and chloride ion penetrability. However, the
CC mixture showed a high permeability and chloride ion penetrability. Therefore, ZCC
presents higher corrosion resistance compared to CC.
• The results of the rapid chloride ion penetration test showed lower values in the case of
most of the ZCC mixtures compared to that of CC. The rapid chloride ion penetration
(charge passed) ranged from 0.23 to 0.61 and 0.35 to 0.74 times that of CC for thermally
283
cured and moist-cured. For thermal curing, the rapid chloride ion penetration (charge
passed) were 1578, 2176, 2615, 4219, and 1689 coulomb for C21, C24, C26, C29, and
C37, respectively. For moist curing, the rapid chloride ion penetration (charge passed)
were 2459, 2719, 2531, 5152, and 3473 coulomb for C21, C24, C26, C29, and C37,
respectively.
• The results of the surface resistivity test showed higher values in the case of most of the
ZCC mixtures compared with CC. The surface resistivity of ZCC ranged from 1.3 to 3.8
and 1.1 to 2.2 times that of CC for thermally cured and moist-cured, respectively. For
oven curing, the surface resistivity values were 35.1, 14.9, 22.3, 11.6, and 27.5 kΩ.cm for
C21, C24, C26, C29, and C37, respectively. For moist curing, the surface resistivity
values were 14.7, 13.8, 19.9, 10.3, and 10.8, respectively.
• The results of the bulk electrical conductivity test showed higher values in the case of
most of the ZCC mixtures compared to that of CC. The bulk resistivity of ZCC ranged
from 1.1 to 2.7 and 1.0 to 2.1 times that of CC for thermally cured and moist-cured,
respectively. For oven curing, the bulk electrical conductivities were 79.8, 40.7, 65.2,
31.1, and 78.3 kΩ.cm for C21, C24, C26, C29, and C37, respectively. For moist curing,
the bulk electrical conductivities were 42.4, 41.4, 62.1, 29.8, and 34.6 kΩ.cm for C21,
C24, C26, C29, and C37, respectively.
10.1.6 Repair
• During a slant shear test, the bond between ZCC concrete as a repair material and CC as a
host material was adequate to trigger compression damage in the host CC material or the
ZCC repair material rather than shear sliding along the interface surface.
284
• The compressive strengths of the repaired cylinders, i.e., ZCC placed over CC, was
slightly less than that of the full-height cylinders constructed out of the corresponding
ZCC concrete mixture. The reduction in the failure load from the full-height to the
repaired cylinders ranged from 2.1% to 4.2% for the thermally cured specimens and from
3.0% to 11.4% for the moist-cured specimens.
• In the case of slant shear test, both curing regimes showed high bond strength between
the CC host concrete and ZCC repair, which indicated that the curing at the elevated
temperature of 158o F (70o C) did not adversely weaken the bond between the two
materials.
• For the pull-off test, the failure loads of the ZCC and the CC were comparable to each
other, which prove that the ZCC can be successfully used as a repair material.
• Most of the failure mode of the reference full-depth ZCC or CC beams was a pull-off,
where the failure took place within the beam itself, not at the surface. However, the most
common mode of failure of the repaired beams was at the interface between the host and
repair materials. This occurred whether the repair was carried out using CC or ZCC.
Surface treatment such as sandblasting and/or a bonding agent may improve the bond
between the repair and host materials. Furthermore, the pull-off test is a measure of the
direct tensile capacity of the bond between the two surfaces; however, under service
loads, the interface between the repair and host material is rarely subjected to direct
tension and it is more common to be subjected to indirect tension, flexural tension, shear,
or a combination of them.
• The pull-off strengths of the repaired beams (whether the repair was CC or ZCC) were
less than that of the full-height beams. The curing regime played an important role in the
285
bond strength, where the moist-cured specimens showed higher bond strength than the
oven-cured specimens. For the thermally cured specimens, the pull-off strengths of the
repaired beams ranged from 66% to 67% of the full-depth beams. However, for the
moist-cured specimens, the pull-off strength of the repaired beams ranged from 62% to
93% of the full-depth beams. For the CC specimens, the pull-off strengths of the repaired
CC beams ranged from 23% to 72% of the full-depth beams.
10.1.7 Cost analysis
• The cost of ZCC mixtures ranged from 60% to 112% of that of the CC. The cost of ZCC
ranged from $59/yd3 to $105/yd3 while that of CC is approximately $93/yd3. The price of
ZCC can be further optimized for strength range of 3500 psi to 4500 psi and for larger
quantities.
• Structural elements made using ZCC can reach their designed compressive strengths
faster than conventional Portland cement concrete where thermal, ambient, and moist-
cured specimens can reach their specified compressive strengths at 24 hours, seven days,
and seven days respectively.
10.2 Recommendations The five sourced FAs that were investigated during the course of this study can be used to
produce ZCC and ZC mortar. Based on the extensive and comprehensive experimental work
presented in this report the following recommendations are presented:
1. The best ZCC mixing procedure is as follows: (1) the coarse and fine aggregate were
mixed for one minute. (2) The FA was added and mixed with the aggregates for one
minute. (3) The water was gradually added over one minute. (4) The alkali activator was
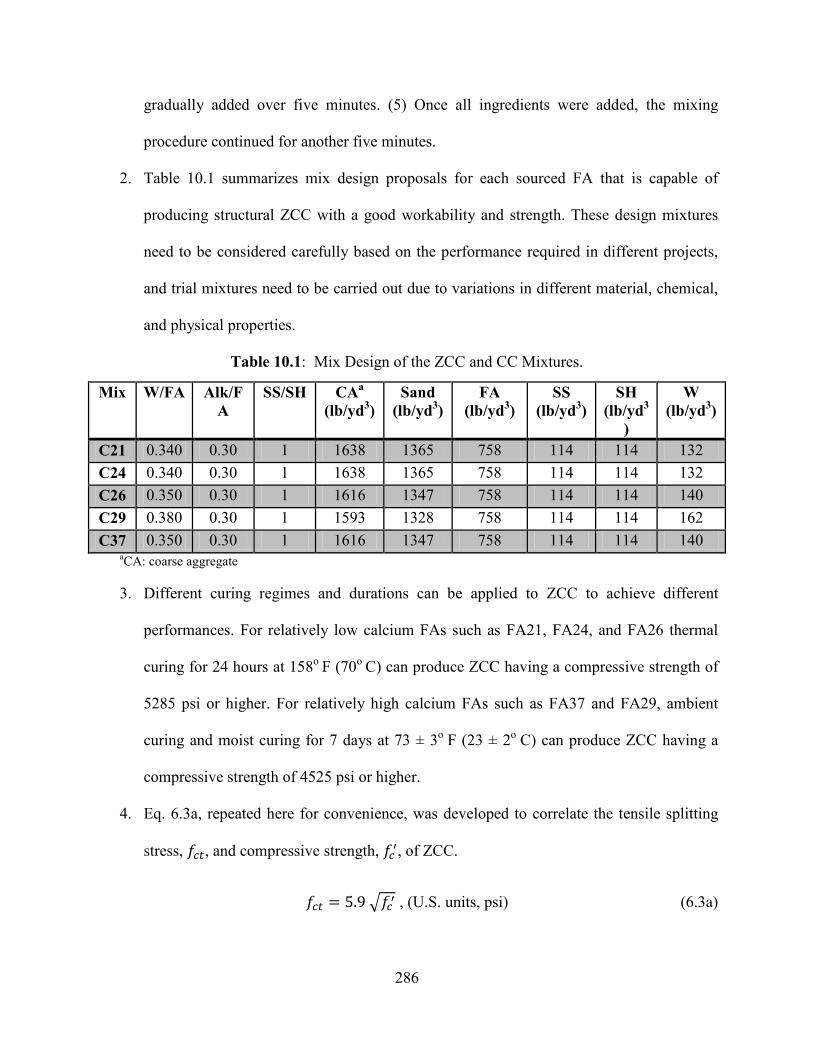
286
gradually added over five minutes. (5) Once all ingredients were added, the mixing
procedure continued for another five minutes.
2. Table 10.1 summarizes mix design proposals for each sourced FA that is capable of
producing structural ZCC with a good workability and strength. These design mixtures
need to be considered carefully based on the performance required in different projects,
and trial mixtures need to be carried out due to variations in different material, chemical,
and physical properties.
Table 10.1: Mix Design of the ZCC and CC Mixtures.
Mix W/FA Alk/FA
SS/SH CAa (lb/yd3)
Sand (lb/yd3)
FA (lb/yd3)
SS (lb/yd3)
SH (lb/yd3
)
W (lb/yd3)
C21 0.340 0.30 1 1638 1365 758 114 114 132 C24 0.340 0.30 1 1638 1365 758 114 114 132 C26 0.350 0.30 1 1616 1347 758 114 114 140 C29 0.380 0.30 1 1593 1328 758 114 114 162 C37 0.350 0.30 1 1616 1347 758 114 114 140
aCA: coarse aggregate
3. Different curing regimes and durations can be applied to ZCC to achieve different
performances. For relatively low calcium FAs such as FA21, FA24, and FA26 thermal
curing for 24 hours at 158o F (70o C) can produce ZCC having a compressive strength of
5285 psi or higher. For relatively high calcium FAs such as FA37 and FA29, ambient
curing and moist curing for 7 days at 73 ± 3o F (23 ± 2o C) can produce ZCC having a
compressive strength of 4525 psi or higher.
4. Eq. 6.3a, repeated here for convenience, was developed to correlate the tensile splitting
stress, 𝑓𝑐𝑡, and compressive strength, 𝑓𝑐′, of ZCC.
𝑓𝑐𝑡 = 5.9 𝑓𝑐′ , (U.S. units, psi) (6.3a)
287
5. Eq. 6.5a, repeated here for convenience, was developed to correlate the modulus of
rupture, 𝑓𝑟, and 𝑓𝑐′ of ZCC.
𝑓𝑟 = 8.8 𝑓𝑐′ , (U.S. units, psi) (6.5a)
6. Eq. 6.7a, repeated here for convenience, was developed to correlate the modulus of
elasticity, 𝐸𝑐, and 𝑓𝑐′of the ZCC examined in this chapter.
𝐸𝑐 = 68600𝑓𝑐′ , (U.S. units, psi) (6.7a)
10.3 Future Work While this study showed the feasibility and advantages of using the locally available class C FAs
to synthesize ZCC concrete, further studies are still required to fine-tune the characterization
long term durability of ZCC. This includes the following issues:
1. The durability of ZCC under the effects of deicing salts, which is a major issue in the
transportation infrastructure in the U.S.
2. The durability of ZCC subjected to an acid solution.
3. The abrasion resistance of ZCC. Abrasion resistance is a crucial characteristic for
transportation infrastructure.
4. The effects of different superplasticizers on slump retention, workability, and strength of
ZCC.
5. The rheological properties of ZCC, especially the workability retention.
6. Trial placement of large-scale ZCC deck and footing in the laboratory to explore the
performance of ZCC.
288
7. Repair of RC beams using ZC mortar. Both slant tests and pull-off tests showed the
potential of using ZCC in repair. However, both tests do not represent the realistic
conditions and state of stresses that ZCC repair will sustain during service, hence it needs
to be investigated.
The development of one-part ZCC, where the alkali activators would be prepared in powder
form instead of the liquid used during this project. This is a tremendous development as the
powder will reduce the freight cost and risk associated with transporting the liquid activator. It
also reduces the risk of handling the liquid activator at the construction site. Furthermore, the fly
ash and activator are mixed together in dry conditions and packed in one bag that acts as a
substitute for the conventional Portland cement bag.
289
Chapter 11: References
1. Kosmatka, S.H. and M.L. Wilson, Design and Control of concrete Mixtures. 16th Edition ed. 2016: Portland Cement Association, Sokie, Illinois, USA. 632.
2. Development, W.B.C.f.S., The Cement Sustainability Initiative. 2009. 3. Edwards, P., The Rise and Potential Peak of Cement Demand in the Urbanized World,
G.C. Magazine, Editor. 2016: CORNERSTONE, The official journal of the world coal industry
4. Glavind, M., 5 - Sustainability of cement, concrete and cement replacement materials in construction A2 - Khatib, Jamal M, in Sustainability of Construction Materials. 2009, Woodhead Publishing. p. 120-147.
5. Temuujin, J., et al., Utilization of radioactive high-calcium Mongolian flyash for the preparation of alkali-activated geopolymers for safe use as construction materials. Ceramics International, 2014. 40(10, Part B): p. 16475-16483.
6. Provis, J.L. and S.A. Bernal, Geopolymers and Related Alkali-Activated Materials. Annual Review of Materials Research, 2014. 44: p. 299-327.
7. Okoye, F.N., J. Durgaprasad, and N.B. Singh, Mechanical properties of alkali activated flyash/Kaolin based geopolymer concrete. Construction and Building Materials, 2015. 98(Supplement C): p. 685-691.
8. Nabil Bouzoubaa, M.-H.Z.V.M.M. and M.G. Dean, Blended Fly Ash Cements A Review. Materials Journal, 1999. 96(6).
9. J. Geiseler, H.K. and E. Lang, Influence of Blast Furnace Cements on Durability of Concrete Structures. Materials Journal, 1995. 92(3).
10. Wongkeo, W., et al., Compressive strength and chloride resistance of self-compacting concrete containing high level fly ash and silica fume. Materials & Design, 2014. 64: p. 261-269.
11. Davidovits, J., Geopolymer chemistry and application, ed. t. Edition. 2015, Saint-Quentin, France: Geopolymer Institute.
12. Blissett, R.S. and N.A. Rowson, A review of the multi-component utilisation of coal fly ash. Fuel, 2012. 97: p. 1-23.
13. Djwantoro Hardjito, S.E.W.D.M.J.S. and B.V. Rangan, On the Development of Fly Ash-Based Geopolymer Concrete. Materials Journal, 2004. 101(6).
14. Kong, D.L.Y. and J.G. Sanjayan, Effect of elevated temperatures on geopolymer paste, mortar and concrete. Cement and Concrete Research, 2010. 40(2): p. 334-339.
15. S.E., W., Creep Behaviour of Fly Ash-Based Geopolymer Concrete. 2010. Vol. 12. 2010. 16. Thokchom, S., P. Ghosh, and S. Ghosh, Resistance of fly ash based geopolymer mortars
in sulfuric acid. arPN Journal of engineering and applied Sciences, 2009. 4. 17. Association, A.R.T.B., Production and use of coal combustion products in the U.S. 2015,
American Coal Ash Association. 18. Administartion, U.S.E.I. Missouri State Profile and Energy Estimates. 2015. 19. Agency, U.S.E.P. National Primary Drinking Regulation. 2017. 20. Sturgis, S. Disaster in east Tennessee. 2010; Available from:
https://grist.org/article/disaster-in-east-tennessee/full/. 21. Diaz, E.I., E.N. Allouche, and S. Eklund, Factors affecting the suitability of fly ash as
source material for geopolymers. Fuel, 2010. 89(5): p. 992-996.
290
22. Ahmaruzzaman, M., A review on the utilization of fly ash. Progress in Energy and Combustion Science, 2010. 36(3): p. 327-363.
23. Standard Specification for Coal Fly Ash and Raw or Calcined Natural Pozzolan for Use in Concrete, in American Society for Testing Materials, ASTM C618. 2015.
24. Association, C.S., Cementitious materials for use in concrete. CAN/CSA A3001, 2008. 25. Somna, K., et al., NaOH-activated ground fly ash geopolymer cured at ambient
temperature. Fuel, 2011. 90(6): p. 2118-2124. 26. Zhu, J.P., et al. Influence of particle size distribution of fly ash on compressive strength
and durability of Portland cement concrete. in Materials Science Forum. 2011. Trans Tech Publ.
27. Davidovits, J., Geopolymers. Journal of thermal analysis, 1991. 37(8): p. 1633-1656. 28. Davidovits, J., High-Alkali Cements for 21st Century Concretes. Special Publication,
1994. 144. 29. Van Jaarsveld, J.G.S., J.S.J. Van Deventer, and L. Lorenzen, The potential use of
geopolymeric materials to immobilise toxic metals: Part I. Theory and applications. Minerals Engineering, 1997. 10(7): p. 659-669.
30. Komnitsas, K. and D. Zaharaki, Geopolymerisation: A review and prospects for the minerals industry. Minerals Engineering, 2007. 20(14): p. 1261-1277.
31. Davidovits, J. Chemistry of geopolymeric systems, terminology. in Geopolymer. 1999. 32. Hardjito, H. and R.V. Rangan, Development and properties of low-calcium fly ash based
geopolymer concrete. 2005, Research Report GC1, Faculty of Engineering, Curtin University of Technology, Perth, Australia.
33. Bakharev, T., Geopolymeric materials prepared using Class F fly ash and elevated temperature curing. Cement and Concrete Research, 2005. 35(6): p. 1224-1232.
34. Ana M. Fernandez-Jimenez, A.P. and L.-H. Cecilio, Engineering Properties of Alkali-Activated Fly Ash Concrete. Materials Journal, 2006. 103(2).
35. Sofi, M., et al., Engineering properties of inorganic polymer concretes (IPCs). Cement and Concrete Research, 2007. 37(2): p. 251-257.
36. Ryu, G.S., et al., The mechanical properties of fly ash-based geopolymer concrete with alkaline activators. Construction and Building Materials, 2013. 47(Supplement C): p. 409-418.
37. Nagalia, G., et al., Compressive Strength and Microstructural Properties of Fly Ash–Based Geopolymer Concrete. Journal of Materials in Civil Engineering, 2016. 28(12): p. 04016144.
38. Lee, N.K. and H.K. Lee, Setting and mechanical properties of alkali-activated fly ash/slag concrete manufactured at room temperature. Construction and Building Materials, 2013. 47: p. 1201-1209.
39. Puertas, F., et al., Mechanical and durable behaviour of alkaline cement mortars reinforced with polypropylene fibres. Cement and Concrete Research, 2003. 33(12): p. 2031-2036.
40. Li, X., et al., Mechanical properties and microstructure of class C fly ash-based geopolymer paste and mortar. Materials, 2013. 6(4): p. 1485-1495.
41. Gourley, J. Geopolymers; opportunities for environmentally friendly construction materials. in Materials 2003 Conference: Adaptive Materials for a Modern Society, Sydney, Institute of Materials Engineering Australia. 2003.
291
42. Chindaprasirt, P., et al., High-Strength Geopolymer Using Fine High-Calcium Fly Ash. Journal of Materials in Civil Engineering, 2011. 23(3): p. 264-270.
43. Guo, X., H. Shi, and W.A. Dick, Compressive strength and microstructural characteristics of class C fly ash geopolymer. Cement and Concrete Composites, 2010. 32(2): p. 142-147.
44. Chindaprasirt, P., T. Chareerat, and V. Sirivivatnanon, Workability and strength of coarse high calcium fly ash geopolymer. Cement and Concrete Composites, 2007. 29(3): p. 224-229.
45. Pattanapong, T.-N., C. Prinya, and S. Vanchai, Setting Time, Strength, and Bond of High-Calcium Fly Ash Geopolymer Concrete. Journal of Materials in Civil Engineering, 2015. 27(7).
46. Thomas, R.J. and S. Peethamparan, Alkali-activated concrete: Engineering properties and stress–strain behavior. Construction and Building Materials, 2015. 93(Supplement C): p. 49-56.
47. Bakharev, T., Thermal behaviour of geopolymers prepared using class F fly ash and elevated temperature curing. Cement and Concrete Research, 2006. 36(6): p. 1134-1147.
48. Diaz-Loya, E.I., E.N. Allouche, and V. Saiprasad, Mechanical Properties of Fly-Ash-Based Geopolymer Concrete. Materials Journal, 2011. 108(3).
49. Temuujin, J., R.P. Williams, and A. van Riessen, Effect of mechanical activation of fly ash on the properties of geopolymer cured at ambient temperature. Journal of Materials Processing Technology, 2009. 209(12): p. 5276-5280.
50. Duxson, P., et al., Geopolymer technology: the current state of the art. Journal of Materials Science, 2007. 42(9): p. 2917-2933.
51. Singh, B., et al., Effect of activator concentration on the strength, ITZ and drying shrinkage of fly ash/slag geopolymer concrete. Construction and Building Materials, 2016. 118: p. 171-179.
52. Sabitha, D., et al., Reactivity, workability and strength of potassium versus sodium-activated high volume fly ash-based geopolymers. Current Science, 2012. 103(11): p. 1320-1327.
53. van Jaarsveld, J.G.S. and J.S.J. van Deventer, Effect of the Alkali Metal Activator on the Properties of Fly Ash-Based Geopolymers. Industrial & Engineering Chemistry Research, 1999. 38(10): p. 3932-3941.
54. Abdullah, M., et al. The relationship of NaOH molarity, Na2SiO3/NaOH ratio, fly ash/alkaline activator ratio, and curing temperature to the strength of fly ash-based geopolymer. in Advanced Materials Research. 2011. Trans Tech Publ.
55. Görhan, G. and G. Kürklü, The influence of the NaOH solution on the properties of the fly ash-based geopolymer mortar cured at different temperatures. Composites Part B: Engineering, 2014. 58: p. 371-377.
56. Muthadhi, A. and V. Dhivya, Investigating Strength Properties of Geopolymer Concrete with Quarry Dust. Materials Journal, 2017. 114(3).
57. Yang, K.-H., A.-R. Cho, and J.-K. Song, Effect of water–binder ratio on the mechanical properties of calcium hydroxide-based alkali-activated slag concrete. Construction and Building Materials, 2012. 29: p. 504-511.
58. Deb, P.S., P. Nath, and P.K. Sarker, The effects of ground granulated blast-furnace slag blending with fly ash and activator content on the workability and strength properties of
292
geopolymer concrete cured at ambient temperature. Materials & Design (1980-2015), 2014. 62: p. 32-39.
59. Zhang Hongen, J.F.W.Q.T.L. and X. Shi, Influence of Cement on Properties of Fly-Ash-Based Concrete. Materials Journal, 2017. 114(05).
60. Rattanasak, U. and P. Chindaprasirt, Influence of NaOH solution on the synthesis of fly ash geopolymer. Minerals Engineering, 2009. 22(12): p. 1073-1078.
61. Rattanasak, U., K. Pankhet, and P. Chindaprasirt, Effect of chemical admixtures on properties of high-calcium fly ash geopolymer. International Journal of Minerals, Metallurgy, and Materials, 2011. 18(3): p. 364.
62. Chamila Gunasekara, S.S. and W.L. David, Long-Term Mechanical Properties of Different Fly Ash Geopolymers. Structural Journal, 2017. 114(3).
63. Chindaprasirt, P., et al., Effect of SiO2 and Al2O3 on the setting and hardening of high calcium fly ash-based geopolymer systems. Journal of Materials Science, 2012. 47(12): p. 4876-4883.
64. Kotwal, A.R., et al., Characterization and Early Age Physical Properties of Ambient Cured Geopolymer Mortar Based on Class C Fly Ash. International Journal of Concrete Structures and Materials, 2015. 9(1): p. 35-43.
65. Palacios, M. and F. Puertas, Effectiveness of Mixing Time on Hardened Properties of Waterglass-Activated Slag Pastes and Mortars. ACI Materials Journal, 2011. 108(1).
66. Chindaprasirt, P., P. De Silva, and S. Hanjitsuwan, Effect of High-Speed Mixing on Properties of High Calcium Fly Ash Geopolymer Paste. Arabian Journal for Science and Engineering, 2014. 39(8): p. 6001-6007.
67. Lowke, D. and P. Schiessl, Effect of mixing energy on fresh properties of SCC. Paper, Technical University of Munich, Centre of Building Materials, 2005: p. 1-8.
68. Pan, Z., J.G. Sanjayan, and B.V. Rangan, An investigation of the mechanisms for strength gain or loss of geopolymer mortar after exposure to elevated temperature. Journal of Materials Science, 2009. 44(7): p. 1873-1880.
69. Swanepoel, J.C. and C.A. Strydom, Utilisation of fly ash in a geopolymeric material. Applied Geochemistry, 2002. 17(8): p. 1143-1148.
70. Sindhunata, et al., Effect of Curing Temperature and Silicate Concentration on Fly-Ash-Based Geopolymerization. Industrial & Engineering Chemistry Research, 2006. 45(10): p. 3559-3568.
71. Ding, Y., J.-G. Dai, and C.-J. Shi, Mechanical properties of alkali-activated concrete: A state-of-the-art review. Construction and Building Materials, 2016. 127(Supplement C): p. 68-79.
72. Deb, P.S., Durability of Fly Ash Based Geopolymer Concrete, in Civil Engineering. June 2013, Curtin University. p. 178.
73. E. Douglas, A.B. and V.M. Malhotra, Properties and Durability of Alkali-Activated Slag Concrete. Materials Journal, 1992. 89(5).
74. Standard Test Method for Resistance of Concrete to Rapid Freezing and Thawing. 2015. 75. Škvára, F., T. Jílek, and L. Kopecký, Geopolymer materials based on fly ash. Ceram.-
Silik, 2005. 49(3): p. 195-204. 76. Škvára, F., et al., Concrete based on fly ash geopolymers. Proceedings of 16th IBAUSIL,
2006. 1: p. 1079-1097. 77. Sun, P. and H.-C. Wu, Chemical and freeze–thaw resistance of fly ash-based inorganic
mortars. Fuel, 2013. 111: p. 740-745.
293
78. Sun, P., Fly ash based inorganic polymeric building material. 2006. 79. Brooks, R., et al., Properties of alkali-activated fly ash: high performance to lightweight.
International Journal of Sustainable Engineering, 2010. 3(3): p. 211-218. 80. Rostami, H. and W. Brendley, Alkali Ash Material: A Novel Fly Ash-Based Cement.
Environmental Science & Technology, 2003. 37(15): p. 3454-3457. 81. Cyr, M. and R. Pouhet, The frost resistance of alkali-activated cement-based binders, in
Handbook of Alkali-Activated Cements, Mortars and Concretes. 2015, Woodhead Publishing: Oxford. p. 293-318.
82. DEGIRMENCI, F.N., Freeze-thaw and fire resistance of geopolymer mortar based on natural and waste pozzolans. Ceramics–Silikáty, 2018. 62(1): p. 41-49.
83. Davalos, J., Advanced materials for civil infrastructure rehabilitation and protection. Seminar at The City College of New York, New York, 2012.
84. Pacheco-Torgal, F., et al., 23 - Performance of alkali-activated mortars for the repair and strengthening of OPC concrete, in Handbook of Alkali-Activated Cements, Mortars and Concretes. 2015, Woodhead Publishing: Oxford. p. 627-641.
85. Yan, L. and N. Chouw, Behavior and analytical modeling of natural flax fibre-reinforced polymer tube confined plain concrete and coir fibre-reinforced concrete. Journal of Composite Materials, 2013. 47(17): p. 2133-2148.
86. Pacheco-Torgal, F., J.P. Castro-Gomes, and S. Jalali, Adhesion characterization of tungsten mine waste geopolymeric binder. Influence of OPC concrete substrate surface treatment. Construction and Building Materials, 2008. 22(3): p. 154-161.
87. Phoo-ngernkham, T., et al., Adhesion characterisation of Portland cement concrete and alkali-activated binders. Advances in Cement Research, 2017. 0(0): p. 1-11.
88. McLellan, B.C., et al., Costs and carbon emissions for geopolymer pastes in comparison to ordinary portland cement. Journal of Cleaner Production, 2011. 19(9): p. 1080-1090.
89. Mathew, M.B.J., M.M. Sudhakar, and D.C. Natarajan, Strength, economic and sustainability characteristics of coal ash–GGBS based geopolymer concrete. International Journal of Computational Engineering Research, 2013. 3(1): p. 207-212.
90. Standard Test Method for Relative Density (Specific Gravity) and Absorption of Coarse Aggregate. 2015.
91. Standard Specification for Concrete Aggregates. 2016, ASTM International. 92. Standard Test Method for Relative Density (Specific Gravity) and Absorption of Fine
Aggregate. 2015. 93. Standard Specification for Standard Sand. 2017. 94. Standard Test Method for Major and Minor Elements in Coal and Coke Ash by X-Ray
Fluorescence, in American Society for Testing Materials, ASTM D4326. 2013. 95. BRUKER, X-Ray Radiattion Safety-Manual for Operator Training. 2010. 96. Arvaniti, E.C., et al., Physical characterization methods for supplementary cementitious
materials. Materials and Structures, 2015. 48(11): p. 3675-3686. 97. Standard Test Method for True Specific Gravity of Refractory Materials by Gas-
Comparison Pycnometer. 2012. 98. Standard Specification for Flow Table for Use in Tests of Hydraulic Cement. 2014. 99. Standard Test Method for Flow of Hydraulic Cement Mortar, in American Soceity for
Testing Materials, ASTM C1437. 2015. 100. Standard Test Methods for Time of Setting of Hydraulic Cement by Vicat Needle, in
American Soceity for Testing Materials, ASTM C191. 2013.
294
101. Standard Test Method for Compressive Strength of Hydraulic Cement Mortars (Using 2-in. or [50-mm] Cube Specimens), in American Soceity for Testing Materials, ASTM C109. 2016.
102. Standard Specification for Portland Cement, in American Society for Testing Materials, ASTM C150. 2016.
103. Standard Test Method for Slump of Hydraulic-Cement Concrete. 2015. 104. Standard Practice for Making and Curing Concrete Test Specimens in the Laboratory.
2016, ASTM International. 105. Standard Test Method for Compressive Strength of Cylindrical Concrete Specimens.
2016. 106. Standard Test Method for Compressive Strength of Hydraulic Cement Mortars (Using 2-
in. or [50-mm] Cube Specimens). 2016, ASTM International. 107. Standard Test Methods for Time of Setting of Hydraulic Cement by Vicat Needle. 2013. 108. Kumar, S. and R. Kumar, Mechanical activation of fly ash: Effect on reaction, structure
and properties of resulting geopolymer. Ceramics International, 2011. 37(2): p. 533-541. 109. Siyal, A.A., et al., Effects of Parameters on the Setting Time of Fly Ash Based
Geopolymers Using Taguchi Method. Procedia Engineering, 2016. 148: p. 302-307. 110. Gomaa, E., et al., Fresh properties and compressive strength of high calcium alkali
activated fly ash mortar. Journal of King Saud University - Engineering Sciences, 2017. 111. Temuujin, J., A. van Riessen, and R. Williams, Influence of calcium compounds on the
mechanical properties of fly ash geopolymer pastes. Journal of Hazardous Materials, 2009. 167(1–3): p. 82-88.
112. Puertas, F., et al., Alkali-activated fly ash/slag cements. Cement and Concrete Research, 2000. 30(10): p. 1625-1632.
113. Guo, X., et al., Alkali-activated complex binders from class C fly ash and Ca-containing admixtures. Journal of Hazardous Materials, 2010. 173(1–3): p. 480-486.
114. Yip, C.K., G.C. Lukey, and J.S.J. van Deventer, The coexistence of geopolymeric gel and calcium silicate hydrate at the early stage of alkaline activation. Cement and Concrete Research, 2005. 35(9): p. 1688-1697.
115. Morsy, M.S., et al., Effect of Sodium Silicate to Sodium Hydroxide Ratios on Strength and Microstructure of Fly Ash Geopolymer Binder. Arabian Journal for Science and Engineering, 2014. 39(6): p. 4333-4339.
116. Part, W.K., M. Ramli, and C.B. Cheah, An overview on the influence of various factors on the properties of geopolymer concrete derived from industrial by-products. Construction and Building Materials, 2015. 77: p. 370-395.
117. Yip, C.K., et al., Effect of calcium silicate sources on geopolymerisation. Cement and Concrete Research, 2008. 38(4): p. 554-564.
118. van Deventer, J.S.J., et al., Reaction mechanisms in the geopolymeric conversion of inorganic waste to useful products. Journal of Hazardous Materials, 2007. 139(3): p. 506-513.
119. Panias, D., I.P. Giannopoulou, and T. Perraki, Effect of synthesis parameters on the mechanical properties of fly ash-based geopolymers. Colloids and Surfaces A: Physicochemical and Engineering Aspects, 2007. 301(1): p. 246-254.
120. Cho, H., et al., Solution state structure determination of silicate oligomers by 29Si NMR spectroscopy and molecular modeling. Journal of the American Chemical Society, 2006. 128(7): p. 2324-2335.
295
121. Standard Test Method for Density (Unit Weight), Yield, and Air Content (Gravimetric) of Concrete. 2016.
122. Standard Test Method for Air Content of Freshly Mixed Concrete by the Pressure Method. 2014.
123. Standard Test Method for Temperature of Freshly Mixed Hydraulic-Cement Concrete. 2017.
124. Standard Test Method for Compressive Strength of Cylindrical Concrete Specimens. 2017, ASTM International.
125. Standard Test Method for Splitting Tensile Strength of Cylindrical Concrete Specimens. 2011, ASTM International.
126. Standard Test Method for Static Modulus of Elasticity and Poisson’s Ratio of Concrete in Compression. 2014.
127. Standard Test Method for Flexural Strength of Concrete (Using Simple Beam with Third-Point Loading). 2016, ASTM International.
128. Standard Test Method for Length Change of Hardened Hydraulic-Cement Mortar and Concrete. 2017.
129. Pangdaeng, S., et al., Influence of curing conditions on properties of high calcium fly ash geopolymer containing Portland cement as additive. Materials & Design, 2014. 53: p. 269-274.
130. Lee, W.K.W. and J.S.J. van Deventer, The effects of inorganic salt contamination on the strength and durability of geopolymers. Colloids and Surfaces A: Physicochemical and Engineering Aspects, 2002. 211(2–3): p. 115-126.
131. Garcia-Lodeiro, I., et al., Compatibility studies between N-A-S-H and C-A-S-H gels. Study in the ternary diagram Na2O–CaO–Al2O3–SiO2–H2O. Cement and Concrete Research, 2011. 41(9): p. 923-931.
132. Davidovits, J. and M. Davidovics, Geopolymer: Room-Temperature Ceramic Matrix for Composites, in Proceedings of the 12th Annual Conference on Composites and Advanced Ceramic Materials: Ceramic Engineering and Science Proceedings. 2008, John Wiley & Sons, Inc. p. 835-841.
133. ACI, A., 318-14. Building Code Requirements for Structural Concrete, American Concrete Institute, Farmington Hills, Michigan, 2014.
134. AS, A.S., Concrete structures. AS3600-2001. Sydney (Australia): Standards Australia, 2001.
135. CEB-FIP, C., Model code 2010. Comite Euro-International du beton, 2010. 136. Hanjitsuwan, S., et al., Cem. Concr. Compos., 2014. 45: p. 9. 137. AASHTO, T., 95-11 “Standard Method of Test for Surface Resistivity Indication of
Concrete’s Ability to Resist Chloride Ion Penetration.”. AASHTO Provisional Standards, 2011 Edition, 2011.
138. Standard Test Method for Bulk Electrical Conductivity of Hardened Concrete. 2012. 139. Standard Test Method for Electrical Indication of Concrete's Ability to Resist
Chloride Ion Penetration. 2017. 140. Beaudoin, J.J. and C. MacInnis, The mechanism of frost damage in hardened cement
paste. Cement and Concrete Research, 1974. 4(2): p. 139-147. 141. Shi Yan, Y.H., Aging Mechanism of Dam Concrete under the action of Freeze-Thaw
Damage Applied Mechanics and Materials 2014.
296
142. Fan, L., Research into the concrete freeze-thaw damage mechanism based on the principle of thermodynamics. Applied Mechanics and Materials 2013.
143. Ben Li, K.W., STUDY ON THE DAMAGE MECHANISM OF PORE STRUCTURE IN CONCRETE SUBJECTED TO FREEZE-THAW CYCLES. THE CIVIL ENGINEERING JOURNAL, 2015.
144. Azarsa, P. and R. Gupta, Electrical Resistivity of Concrete for Durability Evaluation: A Review. Advances in Materials Science and Engineering, 2017. 2017: p. 30.
145. Resipod Family Operating instructions, concrete durability testing, Proceq SA. 2017 [cited 2017.
146. PCTE. Dy-2 Pull Off Tester. 2017 [cited 2018 04/11/2018]; Available from: http://www.pcte.com.au/dy-2-pull-off-tester.
147. Bonaldo, E., J.A.O. Barros, and P.B. Lourenço, Bond characterization between concrete substrate and repairing SFRC using pull-off testing. International Journal of Adhesion and Adhesives, 2005. 25(6): p. 463-474.