Methodology in Robust and Nonparametric Statistics - Taylor ...
Upload
independentCategory
view
1download
0
This article was downloaded by: [University of Colorado Libraries]On: 30 September 2011, At: 09:33Publisher: Taylor & FrancisInforma Ltd Registered in England and Wales Registered Number: 1072954 Registered office: Mortimer House,37-41 Mortimer Street, London W1T 3JH, UK
Aerosol Science and TechnologyPublication details, including instructions for authors and subscription information:http://www.tandfonline.com/loi/uast20
Characterization and Nonparametric Regressionof Rural and Urban Coarse Particulate Matter MassConcentrations in Northeastern ColoradoNicholas Clements a , Ricardo Piedrahita a , John Ortega b , Jennifer L. Peel c , MichaelHannigan a , Shelly L. Miller a & Jana B. Milford aa Department of Mechanical Engineering, University of Colorado at Boulder, Boulder,Colorado, USAb Atmospheric Chemistry Division, National Center for Atmospheric Research, Boulder,Colorado, USAc Department of Environmental and Radiological Health Sciences, Colorado State University,Fort Collins, Colorado, USA
Available online: 27 Jul 2011
To cite this article: Nicholas Clements, Ricardo Piedrahita, John Ortega, Jennifer L. Peel, Michael Hannigan, Shelly L. Miller& Jana B. Milford (2012): Characterization and Nonparametric Regression of Rural and Urban Coarse Particulate Matter MassConcentrations in Northeastern Colorado, Aerosol Science and Technology, 46:1, 108-123
To link to this article: http://dx.doi.org/10.1080/02786826.2011.607478
PLEASE SCROLL DOWN FOR ARTICLE
Full terms and conditions of use: http://www.tandfonline.com/page/terms-and-conditions
This article may be used for research, teaching, and private study purposes. Any substantial or systematicreproduction, redistribution, reselling, loan, sub-licensing, systematic supply, or distribution in any form toanyone is expressly forbidden.
The publisher does not give any warranty express or implied or make any representation that the contentswill be complete or accurate or up to date. The accuracy of any instructions, formulae, and drug doses shouldbe independently verified with primary sources. The publisher shall not be liable for any loss, actions, claims,proceedings, demand, or costs or damages whatsoever or howsoever caused arising directly or indirectly inconnection with or arising out of the use of this material.
Aerosol Science and Technology, 46:108–123, 2012Copyright C© American Association for Aerosol ResearchISSN: 0278-6826 print / 1521-7388 onlineDOI: 10.1080/02786826.2011.607478
Characterization and Nonparametric Regression of Ruraland Urban Coarse Particulate Matter Mass Concentrationsin Northeastern Colorado
Nicholas Clements,1 Ricardo Piedrahita,1 John Ortega,2 Jennifer L. Peel,3
Michael Hannigan,1 Shelly L. Miller,1 and Jana B. Milford1
1Department of Mechanical Engineering, University of Colorado at Boulder, Boulder, Colorado, USA2Atmospheric Chemistry Division, National Center for Atmospheric Research, Boulder, Colorado, USA3Department of Environmental and Radiological Health Sciences, Colorado State University, FortCollins, Colorado, USA
The Colorado Coarse Rural Urban Sources and Health study(CCRUSH) is an ongoing study of the relationship between coarseparticulate mass concentrations (PM10–2.5, particulate matter withdiameter between 2.5 and 10 µm) and selected health effects. Fortwo urban monitoring sites in Denver, CO, and two comparativelyrural sites in Greeley, CO, hourly mass concentrations of PM10–2.5
and fine particulate matter (PM2.5, diameter less than 2.5 µm) havebeen measured by using dichotomous tapered element oscillatingmicrobalances (TEOMs) with Filter Dynamics Measurement Sys-tems (FDMS). This paper presents air quality results from just overa year of PM2.5 and PM10–2.5 measurements. Average PM2.5 concen-trations ranged from 7.7 to 9.2 µg m−3 across the four sites withhigher concentrations in Denver than Greeley. Average PM10–2.5
concentrations ranged from 9.0 to 15.5 µg m−3 with the highest val-ues at the site in northeast Denver. Temporal variability in PM10–2.5
was higher than that in PM2.5 concentrations at all four sites. Thetwo Greeley sites displayed moderate spatial correlation for PM2.5
and high correlation for PM10–2.5, whereas the two Denver sitesshowed lower spatial correlation for both PM sizes. PM10–2.5 con-centrations in Denver were highest with winds from the direction ofthe city’s urban core. PM10–2.5 concentrations in Greeley were mod-erately elevated with winds from the southwest to the northwest,
Received 27 January 2011; accepted 10 July 2011.The CCRUSH study is funded by the National Center for En-
vironmental Research (NCER) of the United States EnvironmentalProtection Agency, under grant number R833744. We wish to thankthis program for their support. We also thank and acknowledge assis-tance from Kelly Albano at the University of Colorado at Boulder;Patrick McGraw and Bradley Rink at the Colorado Department ofPublic Health and Environment; Debbie Bowe and Maria Johncox atThermo Scientific; Greg Philp at Weld County School District 6; PhilBrewer at Weld Country Public Health; and all administrative and cus-todial staff at the elementary schools that serve as the monitoring sitesfor the CCRUSH study.
Address correspondence to Jana B. Milford, Department of Me-chanical Engineering, University of Colorado at Boulder, 427 UCB,Boulder, CO 80309-0427, USA. E-mail: [email protected]
coming from Denver and other large Front Range communities.Wind speed regressions for PM10–2.5 at the Denver sites primar-ily exhibited resuspension effects, while PM10–2.5 concentrations inGreeley showed relatively complex wind speed dependence.
[Supplementary materials are available for this article. Go tothe publisher’s online edition of Aerosol Science and Technologyto view the free supplementary files.]
1. INTRODUCTIONCoarse particulate matter in the size range from 2.5 to
10 µm (PM10–2.5) is believed to be important for human healthbecause particles in this size range are capable of penetrat-ing the thoracic region of the lungs when inhaled (Chan andLippmann 1980). Size-resolved and chemically speciated dataindicate that compared to particulate matter less than 2.5 µm indiameter (PM2.5), PM10–2.5 is more likely to contain crustal ele-ments such as aluminum, iron, and calcium, but may also containions, transition metals, organic, and biological material (Milfordand Davidson 1985, 1987; Boreson et al. 2004; Hueglin et al.2005). PM10–2.5 is commonly derived from abrasive mechani-cal processes, including construction and agricultural activities,resuspended road dust, vegetative debris, and sea spray (Duceet al. 1976; Patterson and Gillette 1977), with emissions frommany of these processes depending strongly on the wind speed(Harrison et al. 2001). It is also produced from incomplete com-bustion of solid fuels such as coal and biomass (U.S. EPA 1995).
Brunekreef and Forsberg (2005) reviewed nearly 60 studiesthat evaluated health effects of short-term exposure to PM10–2.5
and concluded that for some endpoints, including chronicobstructive pulmonary disease, asthma, and respiratory admis-sions, PM10–2.5 could have as strong or a stronger effect thanPM2.5. Short-term increases in PM10–2.5 have also been posi-tively associated with mortality in several studies (Castillejos
108
Dow
nloa
ded
by [
Uni
vers
ity o
f C
olor
ado
Lib
rari
es]
at 0
9:33
30
Sept
embe
r 20
11
COARSE PARTICULATE MATTER IN NORTHEASTERN COLORADO 109
et al. 2000; Mar et al. 2000; Ostro et al. 2000; Villeneuveet al. 2003; Zanobetti and Schwartz 2009). In a recent review ofstudies of the health effects associated with short-term exposureto ambient PM10–2.5, the U.S. Environmental Protection Agency(EPA) concluded that existing evidence is suggestive of a causalrelationship between exposures and mortality, cardiovasculareffects, and respiratory effects (U.S. EPA 2009). EPA alsorecognized several critical uncertainties in epidemiology studiesof PM10–2.5 impacts, including relatively high exposure errorcompared to PM2.5, due to greater expected spatial variability inPM10–2.5 concentrations, and limitations in the characterizationof spatial distributions. Many epidemiologic studies publishedto date have used differences between PM10 and PM2.5 con-centrations measured at colocated monitors and in some cases,monitors located at different sites within the same county to esti-mate PM10–2.5, which contributes further uncertainty in exposureestimation. Furthermore, epidemiologic studies of PM10–2.5
have mostly focused on urban areas, where large populationsresult in greater power for detecting statistically significanteffects. Because sources of PM10–2.5 may be different in urbancompared to rural regions, the associations with health effectsmay also be different in smaller communities or rural areas.
Because of their size, coarse particles are removed from theatmosphere more quickly than fine particles. As a consequenceof both deposition velocity and the intermittent nature of manysource processes, concentrations of PM10–2.5 are expected to bemore spatially and temporally variable than PM2.5 concentra-tions. Wilson et al. (2005) reviewed prior studies and foundthat reported correlation coefficients between sites within sev-eral cities ranged from 0.14 to 0.60 for 24-h average PM10–2.5
concentrations; these values are generally lower than those ob-served for PM2.5 or PM10. Chen et al. (2007) found an averagecorrelation coefficient of 0.75 between 24-h average PM10–2.5
concentrations measured for about 70 days at a central monitorin Chapel Hill, NC, and monitors placed at residences withinabout a 60 km radius. With a year of weekly monitoring at10 sites across the Los Angeles basin, Pakbin et al. (2010)found pairwise correlations ranging from 0.04 for 24-h averagePM10–2.5 concentrations from an industrial site in Long Beachand concentrations at 2 suburban monitors located about 30 and70 km away, to 0.80 for PM10–2.5 concentrations at a pair ofcoastal sites located within a few kilometers of each other.
Most studies of seasonal variability in PM10–2.5 concentra-tions have observed the highest concentrations in summer, butexceptions occur due to specific source activity patterns (Thorn-burg et al. 2009; Pakbin et al. 2010). Harrison et al. (2001)measured PM10–2.5 continuously at five sites in England overa 3-year period. They observed higher PM10–2.5 concentrationson weekdays than on weekends and found that the fraction ofPM10 contributed by PM10–2.5 was highest in the spring andsummer. Moore et al. (2010) reported correlation coefficients of0.1–0.4 for continuous hourly PM10–2.5 concentrations measuredat 3 sites across the Los Angeles basin. In their study, the mostpronounced diurnal variation in PM10–2.5 concentrations was ob-
served at a site near Riverside, CA, with less diurnal variabilityin concentrations measured near downtown Los Angeles and ata desert location about 110 km NW of downtown. Daytime orevening maxima were observed at all three locations.
This paper presents just over a year of mass concentrationdata from continuous PM10–2.5 and PM2.5 sampling conductedin Denver and Greeley, CO, as part of the Colorado Coarse RuralUrban Sources and Health (CCRUSH) study. CCRUSH is a mul-tiyear study of the relationship between PM10–2.5 mass concen-trations and adverse health effects, including cardiopulmonaryemergency department visits and adverse birth outcomes. Den-ver and Greeley were selected for the study to allow comparisonof the composition and relative health effects of coarse PM in ur-ban and rural communities. For two sites in Denver and two sitesin Greeley, continuous hourly mass concentrations of PM10–2.5
and PM2.5 were measured using dichotomous tapered elementoscillating microbalances (TEOMs). Sampling began in Jan-uary 2009 and will continue for three years. At the end of thesampling period, the mass concentration data will be analyzedwith local data on birth outcomes and emergency departmentvisits to assess and compare the associations between the twocommunities.
This paper examines spatial and temporal variations in hourlyand 24-h average concentration values for PM10–2.5 and PM2.5.It also examines the influence of hourly wind speed and winddirection on the mass concentrations. Nonparametric regres-sion (NPR; Henry et al. 2002, 2009; Kim and Hopke 2004; Yuet al. 2004) was used to characterize the wind speed and winddirection relationships, and help understand differences in massconcentrations across sampling locations.
2. METHODS
2.1. Sampling LocationsContinuous particulate mass concentrations were measured
at two locations in Denver and two in Greeley, CO. Greeleyhas a population of 92,625 (U.S. Census 2009b) and an areaof 77.7 km2, and is located within Weld County. Weld Countyhas a population of 254,759 (U.S. Census 2009a) and an area of10,417 km2. Agriculture and oil and gas extraction are amongthe county’s leading economic activities. In contrast, the Cityand County of Denver has a population of 610,345 (U.S. Census2009c) and an area of 401.3 km2, with a highly mixed economy(the urban area1 of Denver–Aurora has a population of 1.98 mil-lion and an area of 1291.9 km2). Denver is transected by majorinterstate highways and experiences much greater traffic vol-umes than Greeley. Correspondingly, PM10–2.5 concentrationsin Denver are expected to be dominated by resuspended urban
1An urban area consists of core census block groups or blocks that have apopulation density of at least 1,000 people per square mile (386 people/km2)and surrounding census blocks that have an overall density of at least 500 peopleper square mile (193 people/km2) (U.S. Census, 2000).
Dow
nloa
ded
by [
Uni
vers
ity o
f C
olor
ado
Lib
rari
es]
at 0
9:33
30
Sept
embe
r 20
11
110 N. CLEMENTS ET AL.
road dust, while agricultural activities (e.g., feedlots, soil prepa-ration, and ditch burning) are expected to be relatively importantsources in Greeley.
Monitors were located on the roofs of two elementary schoolsin Denver: Alsup and Edison, which are 11.1 km apart. Moni-tors were located in Greeley on the roof of Maplewood elemen-tary school and in the heating, ventilation, and air conditioning(HVAC) system enclosure at McAuliffe elementary school. Thetwo Greeley schools are 4.5 km apart. The city of Greeley isroughly 80 km northeast of Denver. Table 1 includes site de-scriptions, sampling periods, and completeness statistics for theCCRUSH data sets considered.
2.2. Particulate Matter Monitoring MethodsTEOM, model 1405-DF (ThermoFisher Scientific, Waltham,
MA) ambient PM monitors were located at each site. Threemonitors (Alsup, Edison, and Maplewood) were located out-side on roofs and housed in enclosures (Complete OutdoorEnclosure for TEOM Series 1405, ThermoFisher Scientific,Waltham, MA) designed to maintain appropriate instrumentconditions. At extreme high and low ambient temperatures, theenclosures failed to maintain appropriate instrument operatingconditions, which resulted in data removal. The monitor locatedat McAuliffe was located just below the roof in an HVAC systemcrawl space and was equipped with an in-house designed foamenclosure equipped with a commercial air conditioner/heaterunit set to maintain a temperature of 21.1◦C.
The TEOM 1405-DF is equipped with a Filter Dynamic Mea-surement System (FDMS) to correct for semivolatile speciesevaporation from mass measurement filter surfaces. After a 16.7L/min PM10 impactor inlet removes the particles larger than 10µm from the sample stream, a round-nozzle virtual impactor isused to separate the PM2.5 and PM10–2.5 size fractions into dual
measurement channels. Virtual impactors separate size fractionsusing particle inertia similar to a traditional inertial impactor. Byreplacing the impaction surface with a vertical collection probewith a low flow rate, virtual impactors separate larger parti-cles that have sufficient inertia to impact the “virtual surface”of the cross-section of the collection probe inlet. Flow throughthe collection probe is referred to as the minor flow. The majorflow, containing small particles, diverts away from the collec-tion probe and has a collection efficiency that is less than unitydue to a fraction of the smaller particles penetrating into the col-lection probe. This fraction is defined by the ratio of minor toinlet flow rates. Virtual impactor design and flow characteristicsare described in detail elsewhere (Marple and Chien 1980; Looand Cork 1988). The TEOM 1405-DF uses a 2.5-µm cut pointvirtual impactor with inlet, major (PM2.5), and minor (PM10–2.5)volumetric flow rates of 16.7, 15, and 1.67 L/min, respectively.Mass concentration corrections for penetration of PM2.5 massinto the PM10–2.5 channel are described in the data processingsection below. The mass measurements are made by dual verti-cal oscillating tapered glass elements, one for each PM channel,with Pallflex TX-40 TEOM filters placed on the ends. Particu-late mass is deposited as aerosol passes through the filter, whichchanges the natural oscillating frequency of the tapered glass el-ement. The frequency change is related to filter mass change bysimple vibration theory. The ambient mass concentrations arecalculated by the change in mass and volumetric airflow rates.
With the FDMS system, the instrument operates by sam-pling in two modes that alternate every 6 min. In the “Base”measurement mode, the sample stream is held at 30◦C with theaerosol passing directly to the mass measurement filter. The ef-fect of water is reduced in the TEOM 1405-DF by the use of aNafionTMmembrane diffusion dryer in each particulate channel.In the Base mode, mass can be either lost or gained from the
TABLE 1Monitoring site descriptions, sampling periods, and completeness statistics for the CCRUSH study
Edison Alsup Maplewood McAuliffe
Coordinates 39.76 N 39.83 N 40.42 N 40.43 N105.04 W 104.94 W 104.71 W 104.77 W
Elevation (m) 1584 1560 1433 1454Inlet height (m) 9 6 9 10.5Location description Urban–Residential Industrial–Residential Residential Residential
Start date/time 1/8/2009 1/16/2009 1/16/2009 1/1/200912:00 15:00 18:00 3:00
End date/time 1/8/2010 2/5/2010 10/16/2009 6/19/200910:00 15:00 16:00 10:00
Number of hourly observations 8759 9241 6551 4064PM2.5 No. usable hourly samples 7182 8050 5550 3963
(% completeness) (82.0%) (87.1%) (84.7%) (97.5%)PM10–2.5 No. usable hourly samples 7182 7910 5550 3963
(% completeness) (82.0%) (85.6%) (84.7%) (97.5%)
Dow
nloa
ded
by [
Uni
vers
ity o
f C
olor
ado
Lib
rari
es]
at 0
9:33
30
Sept
embe
r 20
11
COARSE PARTICULATE MATTER IN NORTHEASTERN COLORADO 111
filter, depending on the amount of semivolatile material present.In the “Reference” mode, after the dryer, the sample is divertedthrough the cooled FDMS filter, a 47 mm Pallflex TX-40 filterheld at 4◦C. This filter removes the particles and semivolatilematerial that will condense at 4◦C or below. This filtered airstream is then directed through the TEOM filter and the masschange on the filter recorded. Reference mode values are com-monly negative due to mass loss from the TEOM filter, butadsorption or absorption of organic gases may also occur, re-sulting in mass gain (Green et al. 2009). The mass change duringthe Reference mode due to evaporation and gas-phase samplingartifacts is assumed to be equal to the artifact contribution to themass change that occurred during the previous Base measure-ment. The time series of Reference mass concentrations are thussubtracted from the Base measurements, correcting for samplingartifacts and approximating the true aerosol mass concentration.This provides a total mass concentration for each 12-min timestep, with the first 6 min providing the Base and the second6 min providing the Reference concentration. The instrumentswere operated at flow rates prescribed by the manufacturer: 1.67L/min (PM10–2.5), 3 L/min (PM2.5), and 12 L/min (bypass). Forthis study, TEOMs were set up to record the raw mass concentra-tion data (Base and Reference) for the PM2.5 and PM10–2.5 chan-nels, along with ambient temperature, relative humidity, andvarious instrument conditions, at 6 min intervals. Raw mass con-centration data are not smoothed by between-measurement av-eraging for unmeasured channels and do not include a correctionfor the penetration of PM2.5 mass into the PM10–2.5 channel fromthe virtual impactor separation. This correction was made duringsubsequent data processing. Flow control was set to active, andactual flow rates were used to calculate the mass concentrations.
TEOM instrument maintenance was performed monthly ateach site and consists of changing TEOM and FDMS filters;cleaning the PM10 inlet, virtual impactor, and FDMS valve;checking for seal leaks in the mass transducer, FDMS valve,and FDMS filter holder; flow audit and calibration; and an in-strument leak check. Operators ensured that the instrument wasoperating properly before leaving the site. Other regular mainte-nance was performed as needed and included exchanging Nafiondiffusion dryers, pump maintenance, and replacing mass trans-ducer, FDMS valve, and FDMS filter holder seals. Ball valveswere installed between the virtual impactor and diffusion dryersto increase the ease of access to sample lines for flow audits,which were performed at a higher frequency than prescribed bythe manufacturer. A single external filter on the bypass flow linewas used to extend pump life.
To assure the highest quality data were used for analysis,extensive quality assurance protocols were developed. Uponarriving at a monitoring site, an instrument status log, mainte-nance log, comment log, and flow audit/leak check log werecompleted. The status log was filled out before and after main-tenance to assure that the instrument conditions did not changedue to operator intervention. The TEOM data were downloadedmanually each month prior to instrument maintenance. The dis-
crete section of data from the last site visit to the current visitwas downloaded via the available universal serial bus (USB)port on the front of the instrument. This process closed theprevious section of data before the operator interfered with in-strument operation. By using the ePort software provided byThermo Scientific, the entire TEOM database was also down-loaded. The data were transferred from a field laptop or flashdrive to a desktop computer immediately upon arriving back atthe University of Colorado.
Discrete data sections downloaded via USB flash drive wereprocessed by a code developed in-house. Log files for eachdata section were created that specified data filenames, whethermaintenance occurred, whether to output hourly averages, saveddata interval, number of hours to remove after maintenance oc-curred, and number of hours to shift the time stamp into Moun-tain Standard Time (MST). Rows were flagged as missing dataif the status code reported the following errors: power failure,database failure, FDMS valve failure, mass transducer failures,any channel flow deviating from the set flow rate (L/min) bymore than 10%, either channel reading filter loading above 90%,or heater tube temperatures (◦C) deviating from set temperatureby more than 2%. Instrument problems were flagged as welland included: vacuum pressures above 40.5 kPa, cooler temper-atures deviating more than 0.5◦C from the specified set point, orif channel relative humidity was above 98%. Data correspondingto instrument problem flags were inspected manually.
Equations (1)–(3) were applied to the 6-min mass concen-tration data to correct for PM2.5 mass depositing in the PM10–2.5
channel due to the virtual impactor. In the following equations, Qrepresents the volumetric flow rate through the indicated chan-nel. PM represents the mass concentration, with the TEOMlabel indicating raw TEOM data. It was assumed that both Baseand Reference channels followed the same correction, i.e., thatsemivolatile mass loss was proportional to the amount of totalmass in each channel
QPM10−2.5
QTotal= 1.67 L/m
16.67 L/m= 0.1, [1]
PM10−2.5Base = PM10−2.5Base(TEOM)
−QPM10−2.5
QTotal(PM2.5Base(TEOM)) , [2]
PM10−2.5Ref = PM10−2.5Ref(TEOM)
−QPM10−2.5
QTotal(PM2.5Ref(TEOM)) . [3]
The hourly average and standard error (i.e., the standard devi-ation divided by the square root of the number of measurementsin the hour) of all downloaded variables were calculated and ex-ported, excluding data flagged as missing. Logs used to processdata were accessed to compile full data sets, filling in missingsections of data between discrete data sets with missing dataflags or combining same hour measurements with a weightedaverage based on the number of measurements made in that
Dow
nloa
ded
by [
Uni
vers
ity o
f C
olor
ado
Lib
rari
es]
at 0
9:33
30
Sept
embe
r 20
11
112 N. CLEMENTS ET AL.
hour in each separate data set. Three scenarios were identifiedthat required further data processing: major events of mass lossfrom filter surfaces, instances of highly variable noise due totemperature aliasing from rapid or oscillating changes of en-closure temperature or other sources, or instances of elevatedstandard error when a nonremoval status code had been trig-gered. The mass loss incidents were identified if the calculatedmass concentration was less than the 1st percentile of the timeseries and the standard error of the measurement was above the95th percentile. The incidents of induced highly variable noisewere identified if the calculated concentration was below the 1stpercentile and the subsequent measurement was greater than the99th percentile or vice versa. The third scenario was triggeredwhen a nonzero status code was recorded and the calculatedhourly mass concentration standard error was above the 95thpercentile. Each occurrence of one of these three scenarios wasassessed manually to determine if data should be removed forfinal hourly average data sets. The data were then filtered forhours with less than 75% completeness. Daily averages werecalculated from cleaned hourly average data sets; days missingmore than 75% of completed hours were also removed.
The data set reported in this paper has been labeled phase1, and resulted from cutting off the currently validated resultswhen instruments were updated to a new version of the TEOM1405-DF firmware. This update required exchanging a physicalflash card; after the update instrument settings were unintention-ally reset to defaults. The start and end dates and completenessstatistics for each site’s phase 1 data are listed in Table 1. Sam-pling began on different dates at each site, and completenessvaries by site based on instrument maintenance issues.
The TEOM 1405-DF is a relatively new instrument and corre-spondingly posed numerous challenges in our effort to producethe continuous time series of mass concentration data. Throughcollaboration with Thermo Scientific, solutions were found formost problems, but they nonetheless led to substantial gapsin our time series. Denver and Greeley experience significantseasonal temperature variations. The air heating and coolingsystems incorporated into the Thermo Scientific TEOM 1405-DF enclosures were unable to adequately condition the spacewithin the enclosures when ambient temperatures were veryhigh or low. Numerous measurements from midday through-out the summer were suspect, and hence flagged for removaldue to large hourly variability associated with increased TEOMmass transducer temperatures. This high measurement variabil-ity mostly originated in the Reference channel, where hourlystandard errors sometimes exceeded 500 µg m−3. Cold tem-perature extremes were less of an issue, though the operatingtemperatures of the FDMS systems occasionally dropped be-low 4◦C. These changes in FDMS operating temperature werenot accompanied by significant increases in the variability ofmass concentration measurements so that corresponding datawere not removed. A further problem with the HVAC systemsoccurred at Alsup and Maplewood, where insulation near theblowers peeled off and either shredded or blocked the blowers.
Malfunction of the Nafion dryer assemblies and pumps alsoleads to gaps in the time series. Dryer assemblies had to bereplaced every 7–10 months and the pumps rebuilt every 12months, in each case about 6 months earlier than the manufac-turer’s maintenance recommendations. Premature pump failuremay be partly due to low ambient atmospheric pressures in Col-orado, which are typically about 85.1 kPa. In addition, the by-pass flow controller of the TEOM installed at McAuliffe failedwhen the inlet system did not adequately dispose of water vaporin the bypass line, resulting in condensation when the air wascooled in the enclosure.
Finally, a significant gap in the McAuliffe data set occurreddue to seal leaks within the FDMS valve system that were notdetected through the leak check process. The problem was onlyidentified upon later inspection of the data. In response, wemodified our monthly maintenance protocol to include disas-sembling the FDMS valve to verify that no seals failed, and toprocess and examine data on-site to verify the absence of leaks.
2.3. Meteorological DataTo assist with the analysis of PM mass concentration data,
hourly meteorological data (temperature, RH, wind speed, anddirection) were obtained from stations located at or near eachof the monitoring sites. Mass concentration data from Edisonwere related to meteorological data from the Carriage site (39.75N, 105.03 W), located 1.65 km to the southeast and operatedby the Colorado Department of Public Health and Environ-ment (CDPHE). Meteorological data for Alsup were collectedfrom a CDPHE-operated meteorological station colocated withour instrument. Meteorological data for Greeley were obtainedfrom the National Oceanic and Atmospheric Administration’s(NOAA) Weld County Airport station (40.26 N, 104.38 W),located 6.7 km west and 10.9 km west of Maplewood andMcAuliffe monitoring sites, respectively. Wind roses of dataused for site-specific wind speed and direction regressions fromCarriage, Alsup, and the Weld County Airport are shown in theonline Supplemental Information. Vector-averaged wind speedwas used in the data analyses.
2.4. Data Analysis and NPRSection 3 presents standard descriptive statistics for PM2.5
and PM10–2.5 mass concentrations, along with the coefficient ofdivergence (COD), which is a measure of uniformity. The re-sults of NPR of concentrations versus wind speed and directionare also presented. All data analyses used concentration datathat were error-code-filtered. No negative data filtering or re-placement was performed in any of the analyses, except whencalculating the COD.
The COD (Wilson et al. 2005) for a set of measurements, X,is defined by
COD =√√√√1
n
n∑i=1
(Xij − XihXij + Xih
)2
[4]
Dow
nloa
ded
by [
Uni
vers
ity o
f C
olor
ado
Lib
rari
es]
at 0
9:33
30
Sept
embe
r 20
11
COARSE PARTICULATE MATTER IN NORTHEASTERN COLORADO 113
where i is the sample, and j and h index different measure-ment sites. A COD value of 0 represents perfect uniformity,and a value of 1 represents total heterogeneity. The COD losesmeaning when negative values are included, so in calculatingthis statistic, negative values in the data set were replaced withzeros.
The data set used in the NPR was different than that used inthe other analyses, as it required wind data and mass concen-trations for each hour, both of which had missing data. Addi-tionally, any data point with a corresponding wind speed valuebelow 1 ms−1 was excluded from the NPR analysis. Exclusionof these periods with relatively calm winds sharply reduced thenumber of observations used in the NPR analyses compared tothe full sets of hourly mass concentration data.
NPR was used to estimate the expected concentration Ci fromeach wind direction or wind speed i by including all observationsusing weighting kernels, giving less weight to observations farfrom the point at which the estimate is being calculated and viceversa. The Gaussian kernel
K1(x) = (2π )−12 e(−0.5x2), −∞ < x < ∞, x = θ − Wi
�θ[5]
was used for the wind direction regressions and the Epanech-nikov kernel
K2(x) = 0.75(1 − x2
), −1 < x < 1 [6]
was used for wind speed regressions (Henry et al. 2002). In thekernels, θ is the wind direction or speed for which the estimateis made, Wi is the wind speed or wind direction value at timei, and �θ is the smoothing parameter. The concentration C(θ )at a given wind speed or direction is then estimated by theNadaraya–Watson estimator, defined as
C(θ ) =∑n
i=1 K(
θ−Wi
�θ
)Ci∑n
i=1 K(
θ−Wi
�θ
) , [7]
where K references the appropriate kernel. In this work, the op-timal value of the smoothing parameter was found for each dataset and meteorological variable by cross-validation. Smooth-ing parameters were then averaged over all sites for each sizefraction and meteorological variable, to allow for more directcomparison of the results. The resulting smoothing parametersare 23.13◦ for PM2.5 with wind direction; 10.88◦ for PM10–2.5
with wind direction; 0.55 ms−1 for PM2.5 with wind speed; and1.2 ms−1 for PM10–2.5 with wind speed. Ninety-five percent con-fidence intervals of the regression estimates were calculated asdescribed in Henry et al. (2002).
2.5. Comparison with Other PM Data SetsAs part of this study, comparisons were made to PM2.5 and
PM10–2.5 data from other studies and locations. These com-parisons are complicated by the use of different instrumentsand measurement methods. Federal reference methods (FRMs)
and federal equivalence methods (FEMs) for PM have beendiscussed previously (U.S. EPA 2004, 2009). The FRM forPM10–2.5 is calculated as the numeric difference between con-current and colocated PM10 and PM2.5 concentrations as mea-sured by FRM low-volume filter samplers of the same make andmodel (U.S. EPA 2009). The TEOM 1400AB and 1405 havebeen designated as FEM methods for PM10. The TEOM 1405-DF has been designated as an FEM method for PM2.5, but not(to date) as an FEM for PM10–2.5 (U.S. EPA 2010).
As described above, the TEOM 1405-DF has been designedto minimize sampling artifacts, both positive and negative. Pos-itive artifacts are a result of excess mass collection typicallycaused by gas-phase adsorption onto the collection media. Neg-ative artifacts are a result of reduced mass collection typicallycaused by semivolatile species that were in the particle phasebut shift to the gas phase after collection due to collection tem-peratures that are higher than ambient or pressures that areslightly less than ambient. For example, when PM2.5 concen-trations were measured by a pair of TEOMs, one operated at50◦C and the other operated at 30◦C, the TEOM held at a highertemperature yielded consistently lower concentrations, as at thehigher temperature, the sensor collected less semivolatile andcondensable mass (Grover et al. 2005; Zhu et al. 2006). TheTEOM 1405-DF operates at 30◦C and also utilizes an FDMSthat adjusts for filter adsorption artifacts. The results from pre-vious studies generally show that for PM2.5, the TEOM FDMSmeasures higher concentrations than the FRM, especially as theambient temperature increases (Grover et al. 2005; Schwab et al.2006; Zhu et al. 2006), the FRM does not adjust for adsorptionartifacts (Solomon and Sioutas 2008). In the end, it is impor-tant to remember that comparison across studies that have useddifferent measurement techniques will have slight biases asso-ciated with the technique differences. Thus, the PM10–2.5 datadiscussed below should be viewed as only roughly comparableacross studies.
3. RESULTS AND DISCUSSION
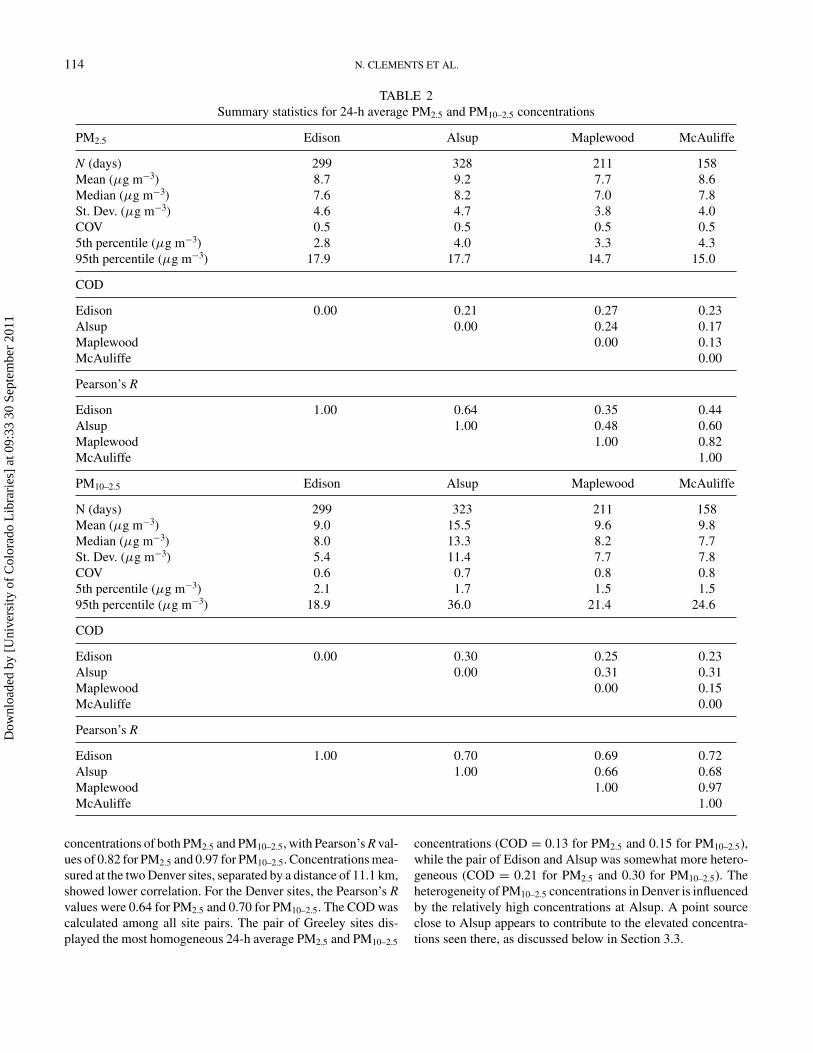
3.1. Summary Statistics and Spatial TrendsTable 2 presents the summary statistics for the 24-h average
PM2.5 and PM10–2.5 concentrations measured at the four studysites. Average PM2.5 concentrations ranged from 7.7 to 9.2 µgm−3 across the four sites. Average concentrations of PM2.5 weresomewhat higher at the two Denver sites than at the two sitesin Greeley. Average PM10–2.5 concentrations ranged from 9.0to 15.5 µg m−3. PM10–2.5 concentrations were sharply higherat the Alsup site in northeast Denver than at the other threelocations. Temporal variability in PM10–2.5 concentrations washigher than that in PM2.5 concentrations, with COV values for24-h average PM10–2.5 ranging from 0.6 to 0.8 and those forPM2.5 all near 0.5. Across the four sites, 95th percentile 24-haverage concentrations ranged from 14.7 to 17.9 µg m−3 forPM2.5 and from 18.9 to 36.0 µg m−3 for PM10–2.5.
The 2 Greeley sites, which are separated by a distance of4.5 km, had the highest spatial correlation for 24-h average
Dow
nloa
ded
by [
Uni
vers
ity o
f C
olor
ado
Lib
rari
es]
at 0
9:33
30
Sept
embe
r 20
11
114 N. CLEMENTS ET AL.
TABLE 2Summary statistics for 24-h average PM2.5 and PM10–2.5 concentrations
PM2.5 Edison Alsup Maplewood McAuliffe
N (days) 299 328 211 158Mean (µg m−3) 8.7 9.2 7.7 8.6Median (µg m−3) 7.6 8.2 7.0 7.8St. Dev. (µg m−3) 4.6 4.7 3.8 4.0COV 0.5 0.5 0.5 0.55th percentile (µg m−3) 2.8 4.0 3.3 4.395th percentile (µg m−3) 17.9 17.7 14.7 15.0
COD
Edison 0.00 0.21 0.27 0.23Alsup 0.00 0.24 0.17Maplewood 0.00 0.13McAuliffe 0.00
Pearson’s R
Edison 1.00 0.64 0.35 0.44Alsup 1.00 0.48 0.60Maplewood 1.00 0.82McAuliffe 1.00
PM10–2.5 Edison Alsup Maplewood McAuliffe
N (days) 299 323 211 158Mean (µg m−3) 9.0 15.5 9.6 9.8Median (µg m−3) 8.0 13.3 8.2 7.7St. Dev. (µg m−3) 5.4 11.4 7.7 7.8COV 0.6 0.7 0.8 0.85th percentile (µg m−3) 2.1 1.7 1.5 1.595th percentile (µg m−3) 18.9 36.0 21.4 24.6
COD
Edison 0.00 0.30 0.25 0.23Alsup 0.00 0.31 0.31Maplewood 0.00 0.15McAuliffe 0.00
Pearson’s R
Edison 1.00 0.70 0.69 0.72Alsup 1.00 0.66 0.68Maplewood 1.00 0.97McAuliffe 1.00
concentrations of both PM2.5 and PM10–2.5, with Pearson’s R val-ues of 0.82 for PM2.5 and 0.97 for PM10–2.5. Concentrations mea-sured at the two Denver sites, separated by a distance of 11.1 km,showed lower correlation. For the Denver sites, the Pearson’s Rvalues were 0.64 for PM2.5 and 0.70 for PM10–2.5. The COD wascalculated among all site pairs. The pair of Greeley sites dis-played the most homogeneous 24-h average PM2.5 and PM10–2.5
concentrations (COD = 0.13 for PM2.5 and 0.15 for PM10–2.5),while the pair of Edison and Alsup was somewhat more hetero-geneous (COD = 0.21 for PM2.5 and 0.30 for PM10–2.5). Theheterogeneity of PM10–2.5 concentrations in Denver is influencedby the relatively high concentrations at Alsup. A point sourceclose to Alsup appears to contribute to the elevated concentra-tions seen there, as discussed below in Section 3.3.
Dow
nloa
ded
by [
Uni
vers
ity o
f C
olor
ado
Lib
rari
es]
at 0
9:33
30
Sept
embe
r 20
11
COARSE PARTICULATE MATTER IN NORTHEASTERN COLORADO 115
The finding of lower correlation and higher COD valuesfor PM2.5 and PM10–2.5 in Denver than in Greeley is consistentwith expectations, as the Denver monitors are separated by agreater distance and are located in more sharply contrastingneighborhoods. The finding of higher correlation for PM10–2.5
than for PM2.5 in both communities is unexpected, as priorstudies have generally observed the opposite. The relativelylow correlations for PM2.5 found in our study may be partlydue to noise in the PM2.5 channel. In comparison, the PM10–2.5
channel is quite stable.
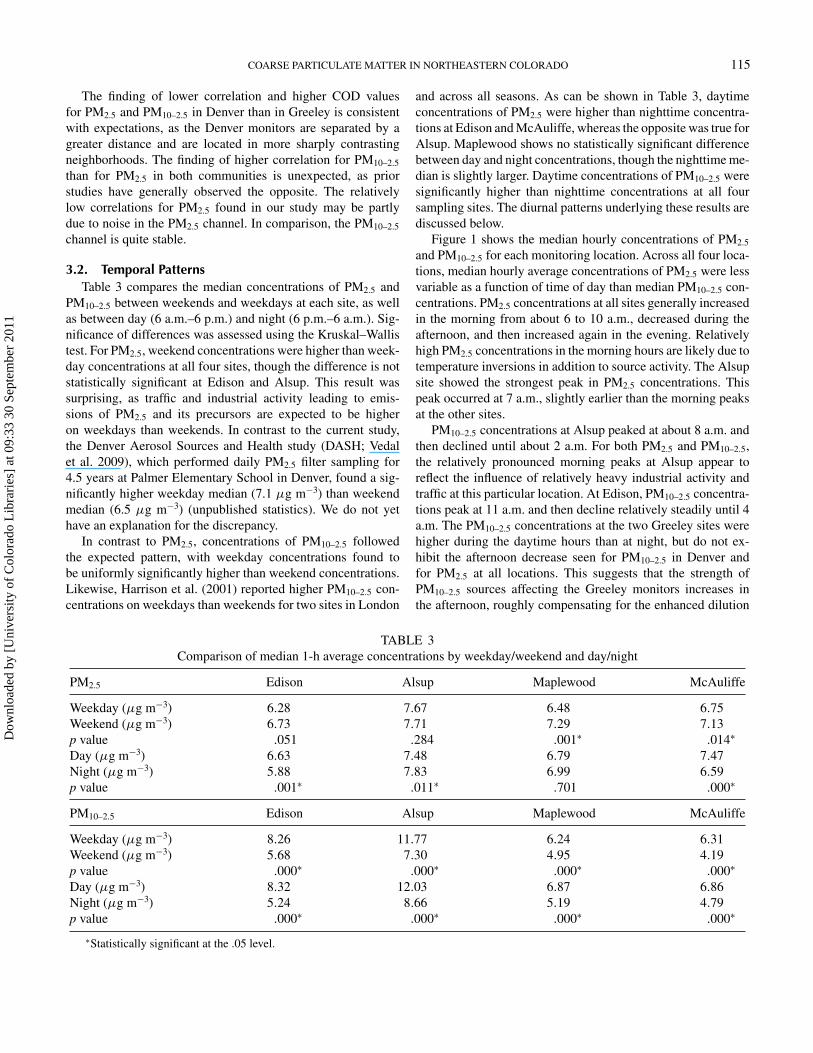
3.2. Temporal PatternsTable 3 compares the median concentrations of PM2.5 and
PM10–2.5 between weekends and weekdays at each site, as wellas between day (6 a.m.–6 p.m.) and night (6 p.m.–6 a.m.). Sig-nificance of differences was assessed using the Kruskal–Wallistest. For PM2.5, weekend concentrations were higher than week-day concentrations at all four sites, though the difference is notstatistically significant at Edison and Alsup. This result wassurprising, as traffic and industrial activity leading to emis-sions of PM2.5 and its precursors are expected to be higheron weekdays than weekends. In contrast to the current study,the Denver Aerosol Sources and Health study (DASH; Vedalet al. 2009), which performed daily PM2.5 filter sampling for4.5 years at Palmer Elementary School in Denver, found a sig-nificantly higher weekday median (7.1 µg m−3) than weekendmedian (6.5 µg m−3) (unpublished statistics). We do not yethave an explanation for the discrepancy.
In contrast to PM2.5, concentrations of PM10–2.5 followedthe expected pattern, with weekday concentrations found tobe uniformly significantly higher than weekend concentrations.Likewise, Harrison et al. (2001) reported higher PM10–2.5 con-centrations on weekdays than weekends for two sites in London
and across all seasons. As can be shown in Table 3, daytimeconcentrations of PM2.5 were higher than nighttime concentra-tions at Edison and McAuliffe, whereas the opposite was true forAlsup. Maplewood shows no statistically significant differencebetween day and night concentrations, though the nighttime me-dian is slightly larger. Daytime concentrations of PM10–2.5 weresignificantly higher than nighttime concentrations at all foursampling sites. The diurnal patterns underlying these results arediscussed below.
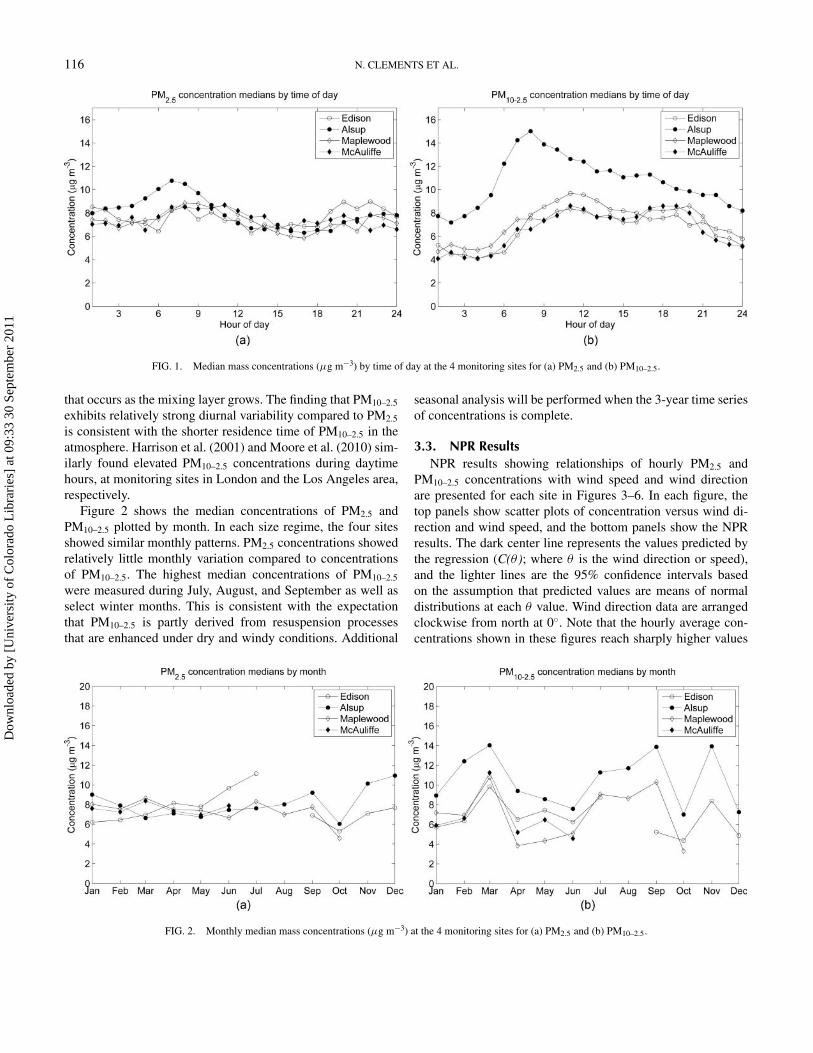
Figure 1 shows the median hourly concentrations of PM2.5
and PM10–2.5 for each monitoring location. Across all four loca-tions, median hourly average concentrations of PM2.5 were lessvariable as a function of time of day than median PM10–2.5 con-centrations. PM2.5 concentrations at all sites generally increasedin the morning from about 6 to 10 a.m., decreased during theafternoon, and then increased again in the evening. Relativelyhigh PM2.5 concentrations in the morning hours are likely due totemperature inversions in addition to source activity. The Alsupsite showed the strongest peak in PM2.5 concentrations. Thispeak occurred at 7 a.m., slightly earlier than the morning peaksat the other sites.
PM10–2.5 concentrations at Alsup peaked at about 8 a.m. andthen declined until about 2 a.m. For both PM2.5 and PM10–2.5,the relatively pronounced morning peaks at Alsup appear toreflect the influence of relatively heavy industrial activity andtraffic at this particular location. At Edison, PM10–2.5 concentra-tions peak at 11 a.m. and then decline relatively steadily until 4a.m. The PM10–2.5 concentrations at the two Greeley sites werehigher during the daytime hours than at night, but do not ex-hibit the afternoon decrease seen for PM10–2.5 in Denver andfor PM2.5 at all locations. This suggests that the strength ofPM10–2.5 sources affecting the Greeley monitors increases inthe afternoon, roughly compensating for the enhanced dilution
TABLE 3Comparison of median 1-h average concentrations by weekday/weekend and day/night
PM2.5 Edison Alsup Maplewood McAuliffe
Weekday (µg m−3) 6.28 7.67 6.48 6.75Weekend (µg m−3) 6.73 7.71 7.29 7.13p value .051 .284 .001∗ .014∗
Day (µg m−3) 6.63 7.48 6.79 7.47Night (µg m−3) 5.88 7.83 6.99 6.59p value .001∗ .011∗ .701 .000∗
PM10–2.5 Edison Alsup Maplewood McAuliffe
Weekday (µg m−3) 8.26 11.77 6.24 6.31Weekend (µg m−3) 5.68 7.30 4.95 4.19p value .000∗ .000∗ .000∗ .000∗
Day (µg m−3) 8.32 12.03 6.87 6.86Night (µg m−3) 5.24 8.66 5.19 4.79p value .000∗ .000∗ .000∗ .000∗
∗Statistically significant at the .05 level.
Dow
nloa
ded
by [
Uni
vers
ity o
f C
olor
ado
Lib
rari
es]
at 0
9:33
30
Sept
embe
r 20
11
116 N. CLEMENTS ET AL.
FIG. 1. Median mass concentrations (µg m−3) by time of day at the 4 monitoring sites for (a) PM2.5 and (b) PM10–2.5.
that occurs as the mixing layer grows. The finding that PM10–2.5
exhibits relatively strong diurnal variability compared to PM2.5
is consistent with the shorter residence time of PM10–2.5 in theatmosphere. Harrison et al. (2001) and Moore et al. (2010) sim-ilarly found elevated PM10–2.5 concentrations during daytimehours, at monitoring sites in London and the Los Angeles area,respectively.
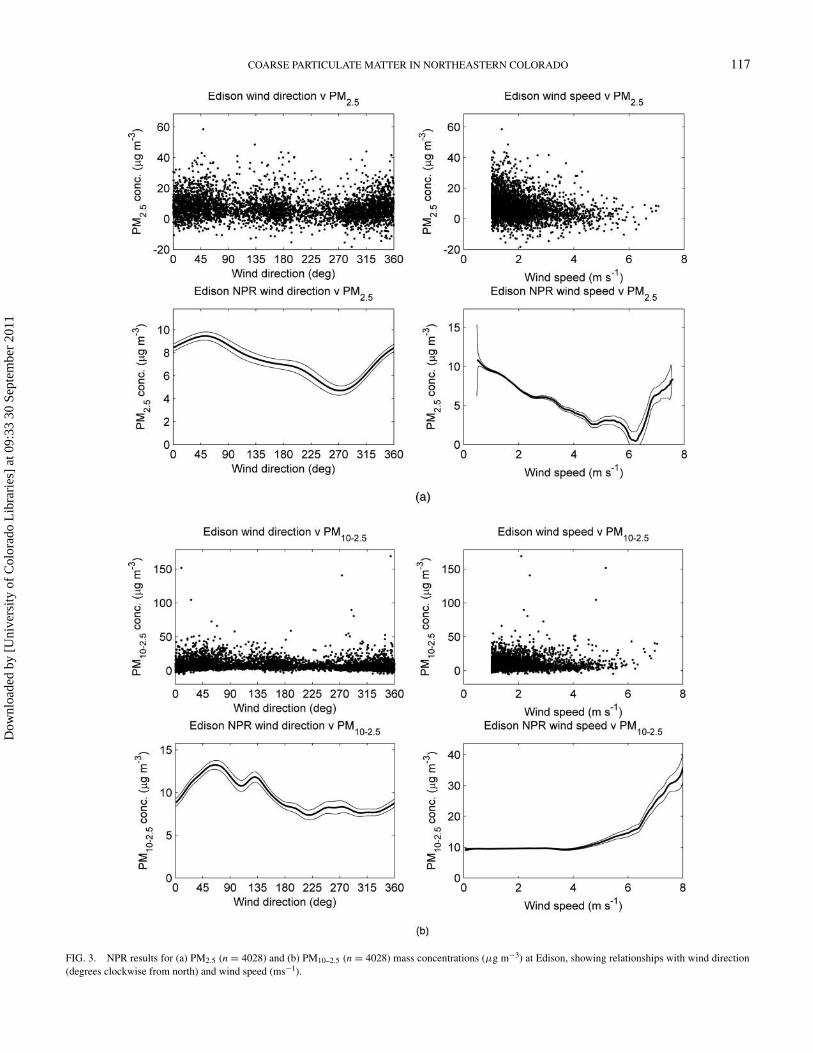
Figure 2 shows the median concentrations of PM2.5 andPM10–2.5 plotted by month. In each size regime, the four sitesshowed similar monthly patterns. PM2.5 concentrations showedrelatively little monthly variation compared to concentrationsof PM10–2.5. The highest median concentrations of PM10–2.5
were measured during July, August, and September as well asselect winter months. This is consistent with the expectationthat PM10–2.5 is partly derived from resuspension processesthat are enhanced under dry and windy conditions. Additional
seasonal analysis will be performed when the 3-year time seriesof concentrations is complete.
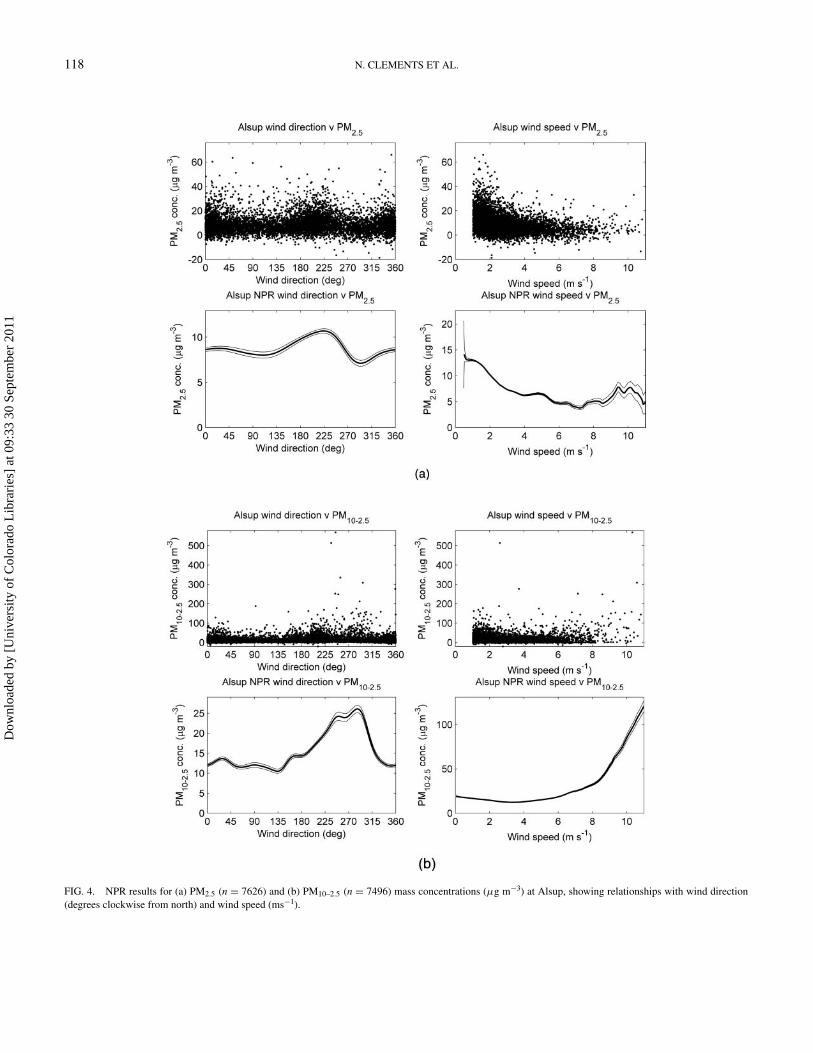
3.3. NPR ResultsNPR results showing relationships of hourly PM2.5 and
PM10–2.5 concentrations with wind speed and wind directionare presented for each site in Figures 3–6. In each figure, thetop panels show scatter plots of concentration versus wind di-rection and wind speed, and the bottom panels show the NPRresults. The dark center line represents the values predicted bythe regression (C(θ ); where θ is the wind direction or speed),and the lighter lines are the 95% confidence intervals basedon the assumption that predicted values are means of normaldistributions at each θ value. Wind direction data are arrangedclockwise from north at 0◦. Note that the hourly average con-centrations shown in these figures reach sharply higher values
FIG. 2. Monthly median mass concentrations (µg m−3) at the 4 monitoring sites for (a) PM2.5 and (b) PM10–2.5.
Dow
nloa
ded
by [
Uni
vers
ity o
f C
olor
ado
Lib
rari
es]
at 0
9:33
30
Sept
embe
r 20
11
COARSE PARTICULATE MATTER IN NORTHEASTERN COLORADO 117
FIG. 3. NPR results for (a) PM2.5 (n = 4028) and (b) PM10–2.5 (n = 4028) mass concentrations (µg m−3) at Edison, showing relationships with wind direction(degrees clockwise from north) and wind speed (ms−1).
Dow
nloa
ded
by [
Uni
vers
ity o
f C
olor
ado
Lib
rari
es]
at 0
9:33
30
Sept
embe
r 20
11
118 N. CLEMENTS ET AL.
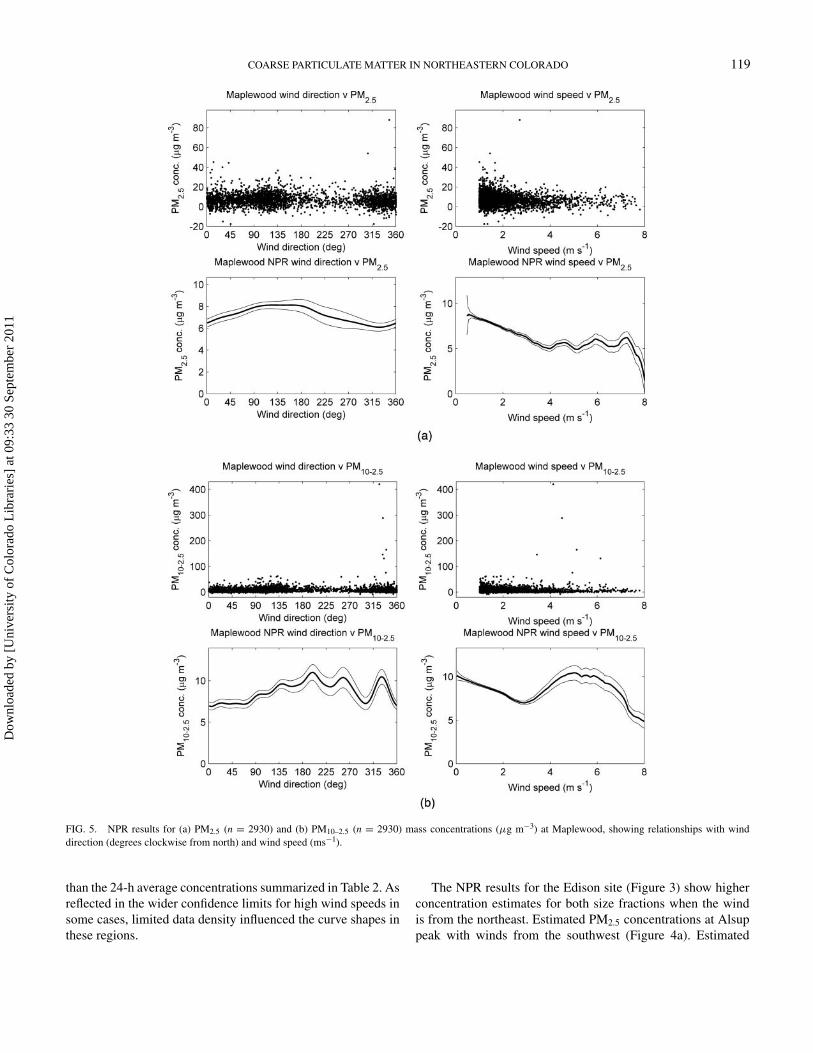
FIG. 4. NPR results for (a) PM2.5 (n = 7626) and (b) PM10–2.5 (n = 7496) mass concentrations (µg m−3) at Alsup, showing relationships with wind direction(degrees clockwise from north) and wind speed (ms−1).
Dow
nloa
ded
by [
Uni
vers
ity o
f C
olor
ado
Lib
rari
es]
at 0
9:33
30
Sept
embe
r 20
11
COARSE PARTICULATE MATTER IN NORTHEASTERN COLORADO 119
FIG. 5. NPR results for (a) PM2.5 (n = 2930) and (b) PM10–2.5 (n = 2930) mass concentrations (µg m−3) at Maplewood, showing relationships with winddirection (degrees clockwise from north) and wind speed (ms−1).
than the 24-h average concentrations summarized in Table 2. Asreflected in the wider confidence limits for high wind speeds insome cases, limited data density influenced the curve shapes inthese regions.
The NPR results for the Edison site (Figure 3) show higherconcentration estimates for both size fractions when the windis from the northeast. Estimated PM2.5 concentrations at Alsuppeak with winds from the southwest (Figure 4a). Estimated
Dow
nloa
ded
by [
Uni
vers
ity o
f C
olor
ado
Lib
rari
es]
at 0
9:33
30
Sept
embe
r 20
11
120 N. CLEMENTS ET AL.
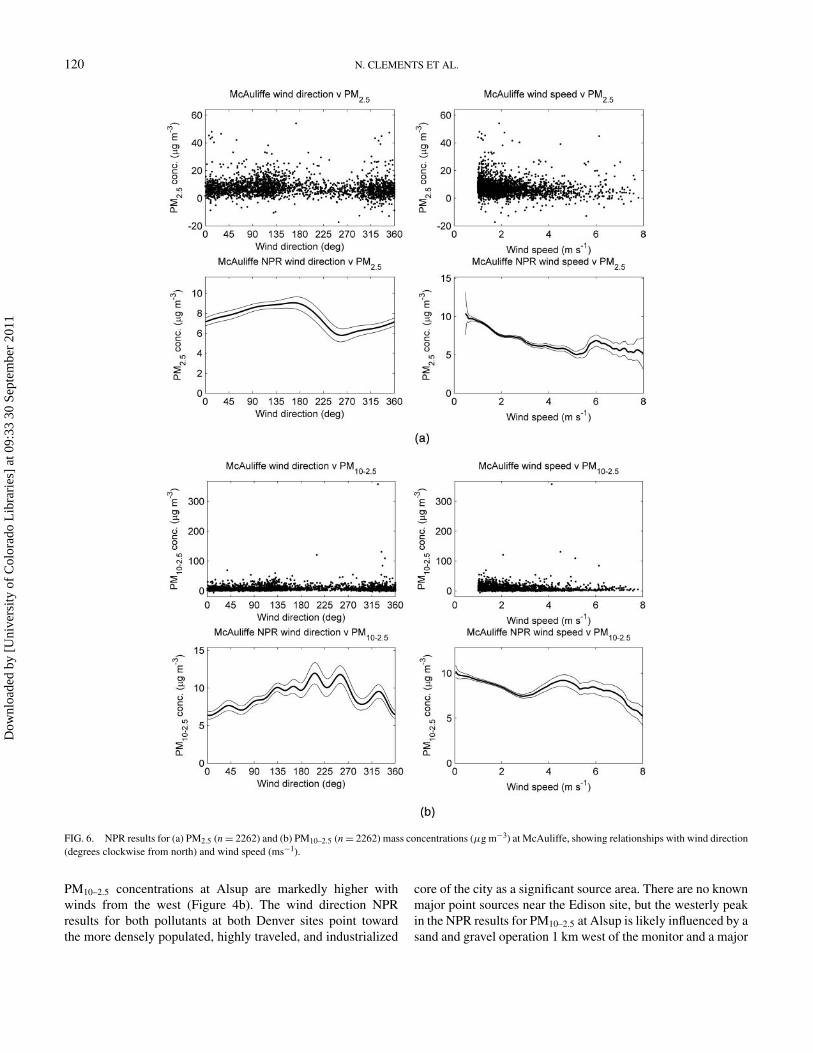
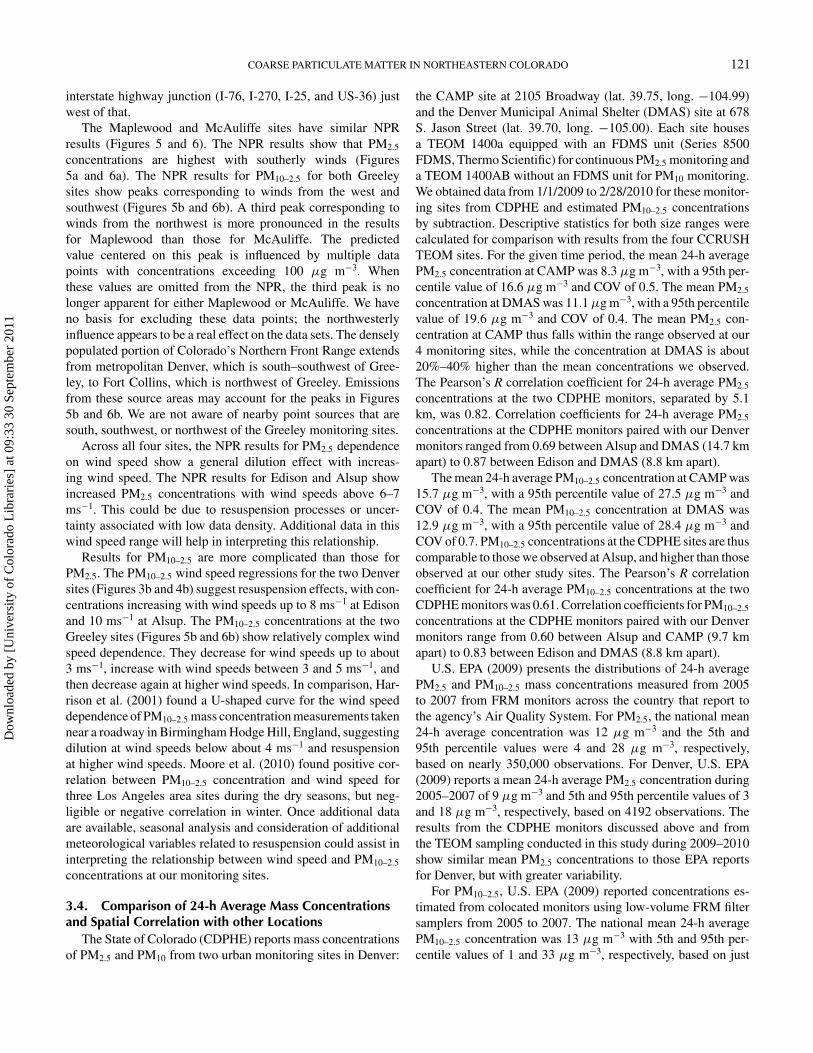
FIG. 6. NPR results for (a) PM2.5 (n = 2262) and (b) PM10–2.5 (n = 2262) mass concentrations (µg m−3) at McAuliffe, showing relationships with wind direction(degrees clockwise from north) and wind speed (ms−1).
PM10–2.5 concentrations at Alsup are markedly higher withwinds from the west (Figure 4b). The wind direction NPRresults for both pollutants at both Denver sites point towardthe more densely populated, highly traveled, and industrialized
core of the city as a significant source area. There are no knownmajor point sources near the Edison site, but the westerly peakin the NPR results for PM10–2.5 at Alsup is likely influenced by asand and gravel operation 1 km west of the monitor and a major
Dow
nloa
ded
by [
Uni
vers
ity o
f C
olor
ado
Lib
rari
es]
at 0
9:33
30
Sept
embe
r 20
11
COARSE PARTICULATE MATTER IN NORTHEASTERN COLORADO 121
interstate highway junction (I-76, I-270, I-25, and US-36) justwest of that.
The Maplewood and McAuliffe sites have similar NPRresults (Figures 5 and 6). The NPR results show that PM2.5
concentrations are highest with southerly winds (Figures5a and 6a). The NPR results for PM10–2.5 for both Greeleysites show peaks corresponding to winds from the west andsouthwest (Figures 5b and 6b). A third peak corresponding towinds from the northwest is more pronounced in the resultsfor Maplewood than those for McAuliffe. The predictedvalue centered on this peak is influenced by multiple datapoints with concentrations exceeding 100 µg m−3. Whenthese values are omitted from the NPR, the third peak is nolonger apparent for either Maplewood or McAuliffe. We haveno basis for excluding these data points; the northwesterlyinfluence appears to be a real effect on the data sets. The denselypopulated portion of Colorado’s Northern Front Range extendsfrom metropolitan Denver, which is south–southwest of Gree-ley, to Fort Collins, which is northwest of Greeley. Emissionsfrom these source areas may account for the peaks in Figures5b and 6b. We are not aware of nearby point sources that aresouth, southwest, or northwest of the Greeley monitoring sites.
Across all four sites, the NPR results for PM2.5 dependenceon wind speed show a general dilution effect with increas-ing wind speed. The NPR results for Edison and Alsup showincreased PM2.5 concentrations with wind speeds above 6–7ms−1. This could be due to resuspension processes or uncer-tainty associated with low data density. Additional data in thiswind speed range will help in interpreting this relationship.
Results for PM10–2.5 are more complicated than those forPM2.5. The PM10–2.5 wind speed regressions for the two Denversites (Figures 3b and 4b) suggest resuspension effects, with con-centrations increasing with wind speeds up to 8 ms−1 at Edisonand 10 ms−1 at Alsup. The PM10–2.5 concentrations at the twoGreeley sites (Figures 5b and 6b) show relatively complex windspeed dependence. They decrease for wind speeds up to about3 ms−1, increase with wind speeds between 3 and 5 ms−1, andthen decrease again at higher wind speeds. In comparison, Har-rison et al. (2001) found a U-shaped curve for the wind speeddependence of PM10–2.5 mass concentration measurements takennear a roadway in Birmingham Hodge Hill, England, suggestingdilution at wind speeds below about 4 ms−1 and resuspensionat higher wind speeds. Moore et al. (2010) found positive cor-relation between PM10–2.5 concentration and wind speed forthree Los Angeles area sites during the dry seasons, but neg-ligible or negative correlation in winter. Once additional dataare available, seasonal analysis and consideration of additionalmeteorological variables related to resuspension could assist ininterpreting the relationship between wind speed and PM10–2.5
concentrations at our monitoring sites.
3.4. Comparison of 24-h Average Mass Concentrationsand Spatial Correlation with other Locations
The State of Colorado (CDPHE) reports mass concentrationsof PM2.5 and PM10 from two urban monitoring sites in Denver:
the CAMP site at 2105 Broadway (lat. 39.75, long. −104.99)and the Denver Municipal Animal Shelter (DMAS) site at 678S. Jason Street (lat. 39.70, long. −105.00). Each site housesa TEOM 1400a equipped with an FDMS unit (Series 8500FDMS, Thermo Scientific) for continuous PM2.5 monitoring anda TEOM 1400AB without an FDMS unit for PM10 monitoring.We obtained data from 1/1/2009 to 2/28/2010 for these monitor-ing sites from CDPHE and estimated PM10–2.5 concentrationsby subtraction. Descriptive statistics for both size ranges werecalculated for comparison with results from the four CCRUSHTEOM sites. For the given time period, the mean 24-h averagePM2.5 concentration at CAMP was 8.3 µg m−3, with a 95th per-centile value of 16.6 µg m−3 and COV of 0.5. The mean PM2.5
concentration at DMAS was 11.1 µg m−3, with a 95th percentilevalue of 19.6 µg m−3 and COV of 0.4. The mean PM2.5 con-centration at CAMP thus falls within the range observed at our4 monitoring sites, while the concentration at DMAS is about20%–40% higher than the mean concentrations we observed.The Pearson’s R correlation coefficient for 24-h average PM2.5
concentrations at the two CDPHE monitors, separated by 5.1km, was 0.82. Correlation coefficients for 24-h average PM2.5
concentrations at the CDPHE monitors paired with our Denvermonitors ranged from 0.69 between Alsup and DMAS (14.7 kmapart) to 0.87 between Edison and DMAS (8.8 km apart).
The mean 24-h average PM10–2.5 concentration at CAMP was15.7 µg m−3, with a 95th percentile value of 27.5 µg m−3 andCOV of 0.4. The mean PM10–2.5 concentration at DMAS was12.9 µg m−3, with a 95th percentile value of 28.4 µg m−3 andCOV of 0.7. PM10–2.5 concentrations at the CDPHE sites are thuscomparable to those we observed at Alsup, and higher than thoseobserved at our other study sites. The Pearson’s R correlationcoefficient for 24-h average PM10–2.5 concentrations at the twoCDPHE monitors was 0.61. Correlation coefficients for PM10–2.5
concentrations at the CDPHE monitors paired with our Denvermonitors range from 0.60 between Alsup and CAMP (9.7 kmapart) to 0.83 between Edison and DMAS (8.8 km apart).
U.S. EPA (2009) presents the distributions of 24-h averagePM2.5 and PM10–2.5 mass concentrations measured from 2005to 2007 from FRM monitors across the country that report tothe agency’s Air Quality System. For PM2.5, the national mean24-h average concentration was 12 µg m−3 and the 5th and95th percentile values were 4 and 28 µg m−3, respectively,based on nearly 350,000 observations. For Denver, U.S. EPA(2009) reports a mean 24-h average PM2.5 concentration during2005–2007 of 9 µg m−3 and 5th and 95th percentile values of 3and 18 µg m−3, respectively, based on 4192 observations. Theresults from the CDPHE monitors discussed above and fromthe TEOM sampling conducted in this study during 2009–2010show similar mean PM2.5 concentrations to those EPA reportsfor Denver, but with greater variability.
For PM10–2.5, U.S. EPA (2009) reported concentrations es-timated from colocated monitors using low-volume FRM filtersamplers from 2005 to 2007. The national mean 24-h averagePM10–2.5 concentration was 13 µg m−3 with 5th and 95th per-centile values of 1 and 33 µg m−3, respectively, based on just
Dow
nloa
ded
by [
Uni
vers
ity o
f C
olor
ado
Lib
rari
es]
at 0
9:33
30
Sept
embe
r 20
11
122 N. CLEMENTS ET AL.
over 12,000 observations. For PM10–2.5 in Denver, EPA reporteda mean concentration of 20 µg m−3 with 5th and 95th percentilevalues of 4 and 42 µg m−3, based on 353 observations. In com-parison to the values U.S. EPA (2009) reports for Denver, theresults from the CDPHE monitoring discussed above and theresults from our study suggest lower mean PM10–2.5 concen-trations. Differences could be due to differences in samplingmethods and monitoring locations or changes in pollutant levelsover time.
As mentioned in Section 1, concentrations of PM10–2.5 havegenerally been expected to be more variable than those of PM2.5.The results from this study indicate that 24-h average PM10–2.5
concentrations are somewhat more temporally variable thanthose for PM2.5, with coefficients of variation ranging from0.6 to 0.8 for PM10–2.5 and near 0.5 for PM2.5. The data fromCDPHE show a comparatively low COV for PM10–2.5 concen-trations at CAMP. For both size classes, spatial correlation wasrelatively strong for the two monitors in Greeley, compared tothe monitors located in Denver. The correlation coefficient of0.97 for PM10–2.5 concentrations from the 2 Greeley locations,which are located 4.5 km apart, is also relatively high comparedto correlation coefficients reported for pairs of PM10–2.5 monitorsin other cities, including those with similar separation distances(Wilson et al. 2005; U.S. EPA 2009; Pabkin et al. 2010). Thehigh correlation of PM10–2.5 for the Greeley monitors suggeststhe impact of regional sources and/or meteorological influences,rather than local sources.
REFERENCESBoreson, J., Dillner, A. M., and Peccia, J. (2004). Correlating Bioaerosol Load
with PM2.5 and PM10cf Concentrations: A Comparison Between NaturalDesert and Urban-Fringe Aerosols. Atmos. Environ., 38:6029–6041.
Brunekreef, B., and Forsberg, B. (2005). Epidemiological Evidence of Effectsof Coarse Airborne Particles on Health. Eur. Respir. J., 26:309–318.
Castillejos, M., Borja-Aburto, V. H., Dockery, D., Gold, D. R., and Loomis, D.(2000). Airborne Coarse Particles and Mortality. Inhal. Toxicol., 12:61–72.http://informahealthcare.com/doi/abs/10.1080/089583700196392.
Chan, T. L., and Lippmann, M. (1980). Experimental Measurements and Empir-ical Modelling of the Regional Deposition of Inhaled Particles in Humans.Am. Ind. Hyg. Assoc. J., 41:399–409.
Chen, F., Williams, R., Svendsen, E., Yeatts, K., Creason, J., Scott, J., Terrell, D.,and Case, M. (2007). Coarse Particulate Matter Concentrations from Resi-dential Outdoor Sites Associated with the North Carolina Asthma and Chil-dren’s Environment Studies (NC-ACES). Atmos. Environ., 41:1200–1208.
Duce, R. A., Hoffman, G. L., Ray, B. J., Fletcher, I. S., Wallace, G. T., Fasching,J. L., Piotrowicz, S. R., Walsh, P. R., Hoffman, E. J., Millner, J. M., andHeffter, J. L. (1976). Trace Metals in the Marine Atmosphere: Sources andFluxes, in Marine Pollutant Transfer, H. L. Windom and R. A. Duce, eds.D.C. Heath, Lexington, MA, pp. 77–119.
Green, D., Fuller, G. W., and Baker, T. (2009). Development and Validation ofthe Volatile Correction Model for PM10—An Empirical Method for Ad-justing TEOM Measurements for Their Loss of Volatile Particulate Matter.Atmos. Environ., 43:2132–2141.
Grover, B. D., Kleinman, M., Eatough, N. L., Eatough, D. J., Hopke, P. K., Long,R. W., Wilson, W. E., Meyer, M. B., and Ambs, J. L. (2005). Measurementof Total PM2.5Mass (Nonvolatile Plus Semivolatile) with the Filter DynamicMeasurement System Tapered Element Oscillating Microbalance Monitor.J.Geophys. Res., 110:D07S03, doi:10.1029/2004JD004995.
Harrison, R. M., Yin, J., Mark, D., Stedman, J., Appleby, R. S., Booker, J., andMoorcroft, S. (2001). Studies of the Coarse Particle (2.5–10 µm) Componentin UK Urban Atmospheres. Atmos. Environ., 35:3667–3679.
Henry, R., Norris, G. A., Vedantham, R., and Turner, J. R. (2009). SourceRegion Identification Using Kernel Smoothing. Environ. Sci. Technol.,43:4090–4097.
Henry, R. C., Chang, Y., and Spiegelman, C. H. (2002). Locating Nearby Sourcesof Air Pollution by Nonparametric Regression of Atmospheric Concentra-tions on Wind Direction. Atmos. Environ., 36:2237–2244.
Hueglin, C., Gehrig, R., Baltensperger, U., Gysel, M., Monn, C., and Vonmont,H. (2005). Chemical Characterization of PM2.5, PM10 and Coarse Parti-cles at Urban, Near-City and Rural Sites in Switzerland. Atmos. Environ.,39:637–651.
Kim, E., and Hopke, P. H. (2004). Comparison Between Conditional ProbabilityFunction and Nonparametric Regression for Fine Particle Source Directions.Atmos. Environ., 38:4667–4673.
Loo, B. W., and Cork, C. P. (1988). Development of High Efficiency VirtualImpactors. Aerosol Sci. Technol., 9:167–176.
Mar, T. F., Norris, G. A., Koenig, J. Q., and Larson, T. V. (2000). Associa-tions Between Air Pollution and Mortality in Phoenix, 1995–1997. Environ.Health Perspect., 108:347–353.
Marple, V. A., and Chien, C. M. (1980). Virtual Impactors: A Theoretical Study.Environ. Sci. Technol., 14:976–985.
Milford, J. B., and Davidson, C. I. (1985). The Sizes of Particulate TraceElements in the Atmosphere—A Review. J. Air Pollut. Control Assoc.,35:1249–1260.
Milford, J. B., and Davidson, C. I. (1987). The Sizes of Particulate Sulfateand Nitrate in the Atmosphere—A Review. J. Air Pollut. Control Assoc.,37:125–134.
Moore, K. F., Verma, V., Minguillon, M. C., and Sioutas, C. (2010). Inter-and Intra-Community Variability in Continuous Coarse Particulate Matter(PM10-2.5) Concentrations in the Los Angeles Area. Aerosol Sci. Technol.,44:526–540.
Ostro, B. D., Broadwin, R., and Lipsett, M. J. (2000). Coarse and Fine Particlesand Daily Mortality in the Coachella Valley, California: A Follow-Up Study.J. Expo. Anal. Environ. Epidemiol., 10:412–419.
Pakbin, P., Hudda, N., Cheung, K. L., Moore, K. F., and Sioutas, C. (2010).Spatial and Temporal Variability of Coarse (PM10-2.5) Particulate MatterConcentrations in the Los Angeles Area. Aerosol Sci. Technol., 44:514–525.
Patterson, E., and Gillette, D. (1977). Commonalities in Measured Size Distri-butions for Aerosols Having a Soil-Derived Component. J. Geophys. Res.,82:2074–2082.
Schwab, J. J., Felton, H. D., Rattigan, O. V., and Demerjian, K. L. (2006). NewYork State Urban and Rural Measurements of Continuous PM2.5 Mass byFDMS, TEOM, and BAM. J. Air Waste Manage. Assoc., 56:372–383.
Solomon, P. A., and Sioutas, C. (2008). Continuous and Semicontinuous Mon-itoring Techniques for Particulate Matter Mass and Chemical Components:A Synthesis of Findings from EPA’s Particulate Matter Supersites Programand Related Studies. J. Air Waste Manage. Assoc., 58:164–195.
Thornburg, J., Rodes, C. E., Lawless, P. A., and Williams, R. (2009). Spatial andTemporal Variability of Outdoor Coarse Particulate Matter Mass Concen-trations Measured with a New Coarse Particle Sampler During the DetroitExposure and Aerosol Research Study. Atmos. Environ., 43:4251–4258.
U.S. Census (2000). United States Census 2000, Urban and Rural Classifica-tion. http://www.census.gov/geo/www/ua/ua 2k.html, accessed December27, 2010.
U.S. Census (2009a). Table 1. Annual Estimates of the Resident Popula-tion for Counties of Colorado: April 1, 2000 to July 1, 2009. 2009Population Estimates. United States Census Bureau, Population Division.http://www.census.gov/popest/counties/counties.html, accessed December27, 2010.
U.S. Census (2009b). Table 4. Annual Estimates of the Resident Popula-tion for Incorporated Places in Colorado: April 1, 2000 to July 1, 2009.2009 Population Estimates. United States Census Bureau, Population
Dow
nloa
ded
by [
Uni
vers
ity o
f C
olor
ado
Lib
rari
es]
at 0
9:33
30
Sept
embe
r 20
11
COARSE PARTICULATE MATTER IN NORTHEASTERN COLORADO 123
Division. http://www.census.gov/popest/cities/SUB-EST2009-states.html,accessed December 27, 2010.
U.S. Census (2009c). Table 1. Annual Estimates of the Resident Populationfor Incorporated Places Over 100,000, Ranked by July 1, 2009 Population:April 1, 2000 to July 1, 2009. 2009 Population Estimates. United States Cen-sus Bureau, Population Division. http://www.census.gov/popest/cities/SUB-EST2009.html, accessed December 27, 2010.
U.S. EPA (1995). AP 42 Fifth Edition: Compilation of Air Pollutant EmissionFactors, Vol. 1: Stationary Point and Area Sources. U.S. EnvironmentalProtection Agency, Office of Air Quality Planning and Standards, ResearchTriangle Park, NC.
U.S. EPA (2004). Air Quality Criteria for Particulate Matter. EPA/600/P-99/002aF-bF. U.S. Environmental Protection Agency, Research TrianglePark, NC.
U.S. EPA. (2009). Integrated Science Assessment for Particulate Matter.EPA/600/R-08/139F. U.S. Environmental Protection Agency, Washington,DC.
U.S. EPA (2010). List of Designated Reference and Equivalence Meth-ods, U.S. Environmental Protection Agency, Research Triangle Park, NC.Available online at: http://www.epa.gov/ttn/amtic/files/ambient/criteria/reference-equivalent-methods-list.pdf, accessed December 29, 2010.
Vedal, S., Hannigan, M. P., Dutton, S. J., Miller, S. L., Milford, J. B., Ra-binovitch, N., Kim, S.-Y., and Sheppard, L. (2009). The Denver AerosolSources and Health (DASH) Study: Overview and Early Findings. Atmos.Environ., 43:1666–1673.
Villeneuve, P. J., Burnett, R. T., Shi, Y., Krewski, D., Goldberg, M. S., Hertzman,C., Chen, Y., and Brook, J. (2003). A Time-Series Study of Air Pollution,Socioeconomic Status, and Mortality in Vancouver, Canada. J. Expo. Anal.Environ. Epidemiol., 13:427–435.
Wilson, J. G., Kingham, S., Pearce, J., and Sturman, A. P. (2005).A Review of IntraurbanVariations in Particulate Air Pollution: Im-plications for Epidemiological Research. Atmos. Environ., 39:6444–6462.
Yu, K. N., Cheung, Y. P., Cheung, T., and Henry, R. C. (2004). Identifying theImpact of Large Urban Airports on Local Air Quality by NonparametricRegression. Atmos. Environ., 38:4501–4507.
Zanobetti, A., and Schwartz, J. (2009). The Effect of Fine and Coarse ParticulateAir Pollution on Mortality: A National Analysis. Environ. Health Perspect.,117:898–903.
Zhu, K., Zhang, J., and Lioy, P. J. (2006). Evaluation and Comparison ofContinuous Fine Particulate Matter Monitors for Measurement of Ambi-ent Aerosols. J. Air Waste Manage. Assoc., 57:1499–1506.
Dow
nloa
ded
by [
Uni
vers
ity o
f C
olor
ado
Lib
rari
es]
at 0
9:33
30
Sept
embe
r 20
11
Copyright © 2022 FDOKUMEN