CHARACTERISATIONS AND PROPERTIES OF ...
193
School of Engineering CHARACTERISATIONS AND PROPERTIES OF NANOCOMPOSITES BASED UPON VINYL ESTER MATRIX AND LAYERED SILICATE. By ABDULRAHMAN IBRAHIM S ALATEYAH The thesis is submitted in partial fulfilment of the requirements for the award of the degree of Doctor of Philosophy of the University of Portsmouth January 2014
-
Upload
khangminh22 -
Category
Documents
-
view
1 -
download
0
Transcript of CHARACTERISATIONS AND PROPERTIES OF ...
School of Engineering
CHARACTERISATIONS AND PROPERTIES OF
NANOCOMPOSITES BASED UPON VINYL ESTER
MATRIX AND LAYERED SILICATE.
By
ABDULRAHMAN IBRAHIM S ALATEYAH
The thesis is submitted in partial fulfilment of the
requirements for the award of the degree of Doctor of
Philosophy of the University of Portsmouth
January 2014
Abstract
I | P a g e
Abstract
In this research, various concentrations of layered silicate based on vinyl ester
nanocomposites were prepared and the effect of the incorporation of layered silicate
into the polymer matrix on the different properties was investigated.
The characterisations of interlaminar structure of the nanocomposites by X-ray
Diffraction, Scanning Electron Microscopy, Energy Dispersive X-ray Spectrometry
and Transmission Electron Microscopy are undertaken. This study revealed that the
incorporation of layered silicate into the polymer matrix formed uniformly distributed
nanocomposites structure at low clay content (i.e. 1, 2, and 3 wt.%). At 4 wt.% clay
loading, the partially intercalated / exfoliated nanocomposites system was observed as
proved by the different characterisations‟ results. However, the addition of more clay
such as 5 wt.% resulted in decreasing the overall intercalation level due to the existence
of aggregation layers.
The addition of layered silicate into the vinyl ester matrix increased the environmental,
mechanical and thermal properties, and the enhancements were correlated to the results
of the characterisations‟ outputs. The mechanical properties such as flexural, tensile,
nanoindentation, impact, and creep properties of neat samples were improved by the
incorporation of layered silicate. The presence of layered silicate into the polymer
matrix increased the tensile strength and modulus and flexural strength and modulus
up to 4 wt.% clay content. The level of intercalation of nanocomposites played an
important role in the improvements of the mechanical properties. So, the tensile and
flexural properties were correlated to the characterisations‟ results. At 5 wt.% clay
content, the modulus and strength of both tensile and flexural were reduced due to the
effect of aggregation layers where the interfacial interaction between the layered
silicate and the polymer is reduced.
The nanoindentation test showed that the addition of layered silicate increased the
reduced modulus and hardness of the nanocomposites compared to the neat vinyl ester.
The presence of only 1 wt.% clay loading increased the hardness and reduced modulus
at up to 13% and 11% respectively compared to the pristine polymer. The
improvement percentage of hardness and modulus at 2 wt.% were 31% and 19%
respectively. The ultimate improvements were observed at 4 wt.% clay loading, where
the enhancements in hardness and modulus were 56 and 50% respectively compared to
Abstract
II | P a g e
the neat vinyl ester. Further addition of clay resulted in marginal reductions in these
properties.
The impact properties of the neat vinyl ester and the nanocomposites were investigated
using a low velocity impact testing. The addition of layered silicate into the polymer
matrix showed that an optimum range of nanoclay reinforcement in the vinyl ester
matrix can produce enhanced load bearing and energy absorption capability compared
to the neat matrix.
Likewise, the influence of the clay addition into the neat polymer on the creep
relaxation behaviour at 25°C and 60°C was studied. In both cases, the presence of the
layered silicate remarkably improved the creep behaviour. The strain reduction is
related to the clay concentration level. The neat polymer illustrated higher strain
compared to the nanocomposites samples.
Moreover, the addition of layered silicate into the polymer matrix improved the
thermal properties. Thermal Gravimetric Analysis (TGA) showed that the
nanocomposites represent better stability compared to the neat polymer. The onset
temperature of the nanocomposites was higher than the neat polymer. At 1, 2, 3, and 4,
wt.% clay content, the improvements in onset temperature were 7 %, 4.2 %, 4 %, 2.5 %
respectively compared to the virgin polymer. In addition, the incorporation of layered
silicate into the polymer matrix increased the thermal conductivity. At 4 wt.% clay, the
thermal conductivity was increased by 12% compared to the neat polymer. Differential
Scanning Calorimetry (DSC) is also performed in order to study the effect of the
addition of layered silicate into the polymer on the glass transition temperature. The
level of intercalation is critical to the Tg values. The nanocomposites represented a
marginal reduction in Tg, however at 4 wt.% clay loading the Tg was as same as the
neat polymer which was traced to the well-dispersed structure.
Furthermore, the study of environmental measurements, which included the water
absorption behaviour and its effect on the nanoindentation test, was investigated. The
improvement of the water repellence behaviour was observed for the nanocomposites.
The enhancements in barrier properties were related to the clay content. At 5 wt.% clay
loading, the reduction of water uptake was about 1266% compared to the neat polymer.
The hardness and elastic moduli after water absorption was reduced due to the effect of
water molecules entering into the polymer chains. However, the higher amount of clay
Abstract
III | P a g e
reinforcement led to less reduction in hardness due to the formation of the barrier
properties by the layered silicate. The hardness of neat polymer after immersing in
water was reduced by 30% whereas the hardness of 5 wt.% nanocomposites showed
only a reduction by 10.3% compared to the dry sample.
Keywords: Nanocomposites, vinyl ester, layered silicate, mechanical properties,
thermal behaviour, environmental measurement, XRD, SEM, EDS, and TEM.
IV | P a g e
Table of Contents
ABSTRACT ................................................................................................................................ I
TABLE OF CONTENTS ........................................................................................................IV
LISTS OF FIGURES ............................................................................................................. VII
LISTS OF TABLES .................................................................................................................XI
DECLARATION.................................................................................................................. XIII
ABBREVIATIONS ............................................................................................................... XIV
ACKNOWLEDGMENTS ..................................................................................................... XV
DISSEMINATION ................................................................................................................ XVI
CHAPTER 1. INTRODUCTION .......................................................................................... 1
1.1 CHAPTER DESCRIPTION ....................................................................................................................... 1 1.2 INTRODUCTION ................................................................................................................................. 1 1.3 AIMS .............................................................................................................................................. 6 1.4 OBJECTIVES ..................................................................................................................................... 6 1.5 RESEARCH DESIGN AND STRATEGY ....................................................................................................... 7
1.5.1 Task One: Review of related literature.................................................................................. 7 1.5.2 Task Two: Design and production of mould .......................................................................... 7 1.5.3 Task Three: Sample fabrication............................................................................................. 7 1.5.4 Task Four: Carry out various testing ..................................................................................... 8 1.5.5 Task Five: Analysing of morphology structure ...................................................................... 8 1.5.6 Task Six: Analysing and discussion the results ...................................................................... 8 1.5.7 Task Seven: Dissemination .................................................................................................... 8 1.5.8 Task Eight: Writing of the thesis ........................................................................................... 8
1.6 THESIS OUTLINE ............................................................................................................................... 9
CHAPTER 2. LITERATURE REVIEW ............................................................................ 10
2.1 CHAPTER DESCRIPTION ..................................................................................................................... 10 2.2 POLYMER ...................................................................................................................................... 10 2.3 CLASSIFICATION OF POLYMER ............................................................................................................ 10
2.3.1 Classification based on the source of polymer. ................................................................... 10 2.3.2 Classification based on the polymer structure .................................................................... 11 2.3.3 Classification of polymers based on the polymerisation type ............................................. 12 2.3.4 Classification of the polymers based on molecular properties ........................................... 14
2.4 NANOCOMPOSITES .......................................................................................................................... 15 2.4.1 Background ......................................................................................................................... 15 2.4.2 Nanocomposites structures ................................................................................................ 16 2.4.3 Nanocomposite structural characterisation ....................................................................... 16
2.5 LAYERED SILICATE ........................................................................................................................... 19 2.5.1 Structure of layered silicate ................................................................................................ 19 2.5.2 Organic modification of layered silicates (OMLS) ............................................................... 21 2.5.3 Cation-exchange capacity (CEC) ......................................................................................... 24

V | P a g e
2.5.4 Layered silicate summary ................................................................................................... 25 2.6 NANOCOMPOSITE POLYMERS ............................................................................................................ 25
2.6.1 Vinyl polymers. .................................................................................................................... 25 2.6.2 Condensation (step) polymers ............................................................................................ 26 2.6.3 Polyolefins ........................................................................................................................... 26 2.6.4 Biodegradable polymers ..................................................................................................... 26
2.7 NANOCOMPOSITES PREPARATION ...................................................................................................... 27 2.7.1 In situ template synthesis ................................................................................................... 27 2.7.2 Intercalation of polymer from solution ............................................................................... 27 2.7.3 In situ intercalative polymerization .................................................................................... 32 2.7.4 Melt intercalation ............................................................................................................... 37 2.7.5 Direct mixing between the polymer and particles .............................................................. 43
2.8 NANOCOMPOSITES PROPERTIES ......................................................................................................... 43 2.8.1 Mechanical properties ........................................................................................................ 44 2.8.2 Barrier properties ................................................................................................................ 64 2.8.3 Thermal stability ................................................................................................................. 68 2.8.4 Flame retardance ................................................................................................................ 76 2.8.5 Optical property .................................................................................................................. 79 2.8.6 Rheological properties ........................................................................................................ 79
2.9 ADVANTAGES OF NANOCOMPOSITES BASED ON LAYERED SILICATE ............................................................. 80 2.10 NANOCOMPOSITES APPLICATIONS .................................................................................................... 81 2.11 CHAPTER TWO SUMMARY .............................................................................................................. 82
CHAPTER 3. EXPERIMENTAL PROCEDURES ........................................................... 84
3.1 CHAPTER DESCRIPTION ..................................................................................................................... 84 3.2 MATERIALS .................................................................................................................................... 84
3.2.1 Matrix ................................................................................................................................. 84 3.2.2 Reinforcement ..................................................................................................................... 84
3.3 MOULD GEOMETRY ......................................................................................................................... 85 3.4 CONCENTRATIONS OF LAYERED SILICATE FOR NANOCOMPOSITES PREPARATION ........................................... 86 3.5 SAMPLES PREPARATION PROCEDURES ................................................................................................. 86
3.5.1 Type 1 sample fabrication process ...................................................................................... 86 3.5.2 Type 2 sample fabrication process ...................................................................................... 88 3.5.3 Post curing .......................................................................................................................... 90 3.5.4 Cutting preparation for various testing .............................................................................. 90
3.6 THE CALCULATION OF NANOCOMPOSITES VOIDS VOLUME ........................................................................ 91 3.7 MORPHOLOGICAL CHARACTERISATIONS .............................................................................................. 92
3.7.1 Wide Angle X-ray Diffraction (WAXD) ................................................................................. 92 3.7.2 Scanning electron microscopy (SEM) .................................................................................. 92 3.7.3 Energy Dispersive X-ray Spectrometry (EDS) ....................................................................... 92 3.7.4 Transmission Electron Microscopy (TEM) ........................................................................... 92
3.8 MECHANICAL TESTING ..................................................................................................................... 93 3.8.1 Flexural testing ................................................................................................................... 93 3.8.2 Tensile testing ..................................................................................................................... 94 3.8.3 Nanoindentation ................................................................................................................. 95 3.8.4 Impact testing ..................................................................................................................... 96 3.8.5 Creep relaxation behaviour ................................................................................................. 96
3.9 THERMAL TESTING .......................................................................................................................... 97 3.9.1 Thermogravimetric Analysis (TGA) ..................................................................................... 97 3.9.2 Differential scanning calorimetric (DSC) ............................................................................. 97 3.9.3 Surface Thermal Conductivity ............................................................................................. 97
VI | P a g e
3.10 ENVIRONMENTAL TESTING .............................................................................................................. 98 3.10.1 Water absorption behaviours ........................................................................................... 98 3.10.2 Contact angle measurements ........................................................................................... 99
CHAPTER 4. RESULTS AND DISCUSSION ................................................................ 100
4.1 CHAPTER DESCRIPTION ................................................................................................................... 100 4.2 RESULTS AND DISCUSSION OF THE TYPE 1 SAMPLES .............................................................................. 100
4.2.1 Nanocomposites voids content ......................................................................................... 100 4.2.2 Characterisations of the interlamellar structure and surface morphology ....................... 101 4.2.3 Mechanical properties ...................................................................................................... 106 4.2.4 Thermal properties............................................................................................................ 124 4.2.5 Environmental measurements .......................................................................................... 128
4.3 RESULTS AND DISCUSSION OF THE TYPE 2 SAMPLES .............................................................................. 134 4.3.1 Characterisations of the interlamellar structure and surface morphology ....................... 134 4.3.2 Mechanical properties ...................................................................................................... 136 4.3.3 Thermal properties............................................................................................................ 141
4.4 COMPARISON BETWEEN TYPE 1 AND 2 SAMPLES ................................................................................. 143 4.4.1 The processing parameters ............................................................................................... 143 4.4.2 Wide Angle X-ray Diffraction (WAXD) of type 1 and 2 sample ......................................... 143 4.4.3 The effect of processing parameters on the mechanical properties ................................. 145 4.4.4 The effect of processing parameters on the thermal properties....................................... 148
CHAPTER 5. CONCLUSIONS AND RECOMMENDATION FOR FUTURE
RESEARCH 149
5.1 CONCLUSIONS .............................................................................................................................. 149 5.1.1 Morphology of nanocomposites ....................................................................................... 149 5.1.2 Mechanical properties ...................................................................................................... 149 5.1.3 Thermal properties............................................................................................................ 151 5.1.4 Water absorption behaviour ............................................................................................. 151 5.1.5 Surface energy characteristics .......................................................................................... 152
5.2 RECOMMENDATIONS FOR FUTURE WORK ........................................................................................... 152
CHAPTER 6. REFERENCES ........................................................................................... 154
CHAPTER 7. APPENDIX ................................................................................................. 176
VII | P a g e
Lists of Figures
FIGURE 1 THE RELATIONSHIP BETWEEN THE POLYMER PROPERTIES AND THE DEGREE OF
POLYMERISATION. ................................................................................................................ 1
FIGURE 2 DIFFERENT TYPES OF NANOCOMPOSITES. .................................................................... 4
FIGURE 3 LINEAR POLYMERS STRUCTURE. ................................................................................ 11
FIGURE 4 BRANCHED OR SIDE CHAINS POLYMERS STRUCTURE. ............................................... 11
FIGURE 5 NETWORK OR CROSS-LINKED POLYMERS STRUCTURE. .............................................. 12
FIGURE 6 HOMOPOLYMERS STRUCTURE. .................................................................................. 12
FIGURE 7 COPOLYMERS STRUCTURE. ........................................................................................ 12
FIGURE 8 ALTERNATING COPOLYMERS STRUCTURE.................................................................. 13
FIGURE 9 BLOCK COPOLYMERS ................................................................................................. 13
FIGURE 10 GRAFTED COPOLYMERS STRUCTURE........................................................................ 13
FIGURE 11 TERPOLYMERS STRUCTURE. ..................................................................................... 13
FIGURE 12 THERMOPLASTIC CHAINS MOLECULES STRUCTURE. ................................................ 14
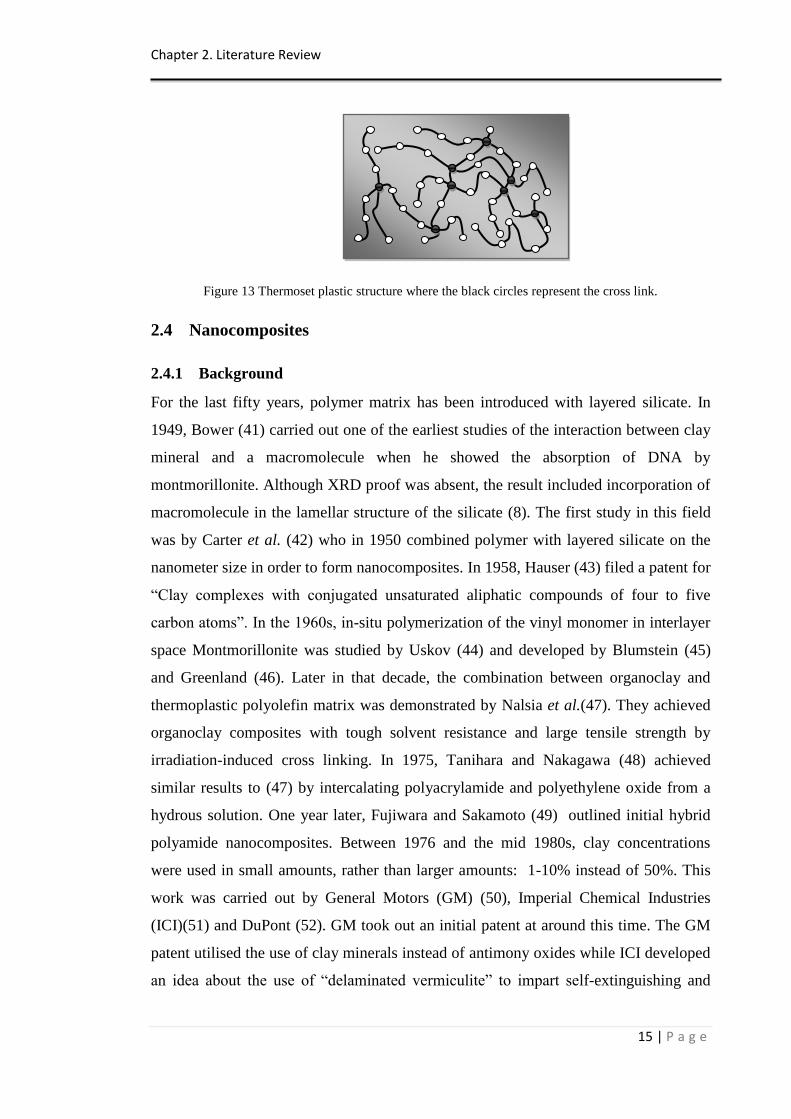
FIGURE 13 THERMOSET PLASTIC STRUCTURE WHERE THE BLACK CIRCLES REPRESENT THE
CROSS LINK. ........................................................................................................................ 15
FIGURE 14 (2:1) LAYERED SILICATE STRUCTURE OR PHYLLOSILICATES. .................................. 20
FIGURE 15 THE INTERCALATION OF ALKALI IONS BETWEEN THE CLAY LAYERS. ...................... 22
FIGURE 16 ION EXCHANGE REACTION, WHICH ENHANCES THE SPACING BETWEEN THE LAYERS
AS WELL AS CHANGES THE PROPERTIES OF THE INDIVIDUAL SURFACE OF THE LAYER FROM
BEING HYDROPHILIC TO HYDROPHOBIC. ............................................................................ 23
FIGURE 17 ORGANISATION OF ALKYLAMMONIUM IONS IN MICA TYPE LAYERED SILICATES
WHERE THE VARIATION OF CHARGE IN THE LAYER IS EXHIBITED. DARK AREAS ARE
SILICATE LAYERS. (A) IS THE MONO LAYERS, (B) THE BILAYERS, WHEREAS (C) AND (D)
REPRESENTS THE MONO AND BIMOLECULAR ORGANISATION RESPECTIVELY. .................. 23
FIGURE 18 FLOWCHART DESCRIBES THE STEPS OF POLYMER INTERCALATION OF SOLUTION ... 28
FIGURE 19 FLOWCHART OF IN SITU POLYMERIZATION STEPS. ................................................... 32
FIGURE 20 INTERLAYER DISTANCE OF FLUORO-MODIFIED TALC (ME 100) IN FUNCTION OF AN
INCREASING AMOUNT OF AMINOLAURIC ACID USED AS THE ORGANIC MODIFIER (233).
REPRODUCED FROM REICHERT BY PERMISSION OF COPYRIGHT WILEY-VCH VERLAG
GMBH & CO. KGAA. ......................................................................................................... 34
FIGURE 21 BASIC STEPS OF MELT INTERCALATION METHOD. .................................................... 37
FIGURE 22 THE DISTRIBUTION OF NA+-MMT SLURRY INTO NYLON6 DURING COMPOUNDING:
(A) PUMPING THE CLAY TO THE SOFTENED MATRIX WITH STRONG STIRRING, (B-C) THE
SLURRY SHRINKAGE TO MINUTE DROPS THROUGHOUT THE MIXING, AND THE WATER OF
VIII | P a g e
THE CLAY BEING EVAPORATED WHEN IT TOUCHES THE PA6 MELT, (D) THE VACUUM
APPLIED IN ORDER TO ELIMINATE THE WATER WITH SILICATE LAYERS DISTRIBUTED INTO
THE PA6 WHICH SOFTEN AS ONE LAYER OR MULTI LAYERS (264). REPRODUCED FROM
HASEGAWA BY PERMISSION OF ELSEVIER SCIENCE LTD., UK. ......................................... 41
FIGURE 23 DIRECT MIXING PROCESS. ........................................................................................ 43
FIGURE 24 DIFFERENT NANOCOMPOSITES STRUCTURES EXHIBITED DIFFERENT CREEP VALUES
(316). REPRODUCED FROM SHOKUHFAR BY PERMISSION OF ELSEVIER SCIENCE LTD., UK.
........................................................................................................................................... 57
FIGURE 25 LOAD DISPLACEMENT CURVES FOR PA11 AND THE CORRESPONDING
NANOCOMPOSITES (320). REPRODUCED FROM HU BY PERMISSION OF ELSEVIER SCIENCE
LTD., UK. ........................................................................................................................... 59
FIGURE 26 HARDNESS AND MODULUS OF PA11 AND NANOCOMPOSITES SAMPLES (320).
REPRODUCED FROM YUCAI BY PERMISSION OF ELSEVIER SCIENCE LTD., UK. ................ 59
FIGURE 27 STORAGE MODULUS BEHAVIOUR OF NEAT POLYMER AND CORRESPONDING
NANOCOMPOSITES (281). REPRODUCED FROM UNNIKRISHNAN BY PERMISSION OF
ELSEVIER SCIENCE LTD., UK. ............................................................................................ 62
FIGURE 28 THE RELATIONSHIP BETWEEN THE STORAGE MODULUS AS WELL AS THE TAN IN A
FUNCTION OF TEMPERATURE (300). REPRODUCED FROM GANß BY PERMISSION OF
ELSEVIER SCIENCE LTD., UK. ............................................................................................ 64
FIGURE 29 (A) IS THE MODEL OF TORTUOUS DIFFUSION PATH IN EXFOLIATED STRUCTURE OF
NANOCOMPOSITES AND (B) IS THE PATH OF CONVENTIONAL COMPOSITES. ...................... 64
FIGURE 30 THERMAL STABILITY FOR (A) NEAT EPOXY AND (B) EPOXY CLAY NANOCOMPOSITES
(351). REPRODUCED FROM LAKSHMI BY PERMISSION OF ELSEVIER SCIENCE LTD., UK. . 70
FIGURE 31 TGA CURVE (A) NEAT PU, (B) PU/KH550-SP (1%), (C) PU/KH550-SP (3%) AND (D)
PU/ KH550-SP (5%) NANOCOMPOSITES (282). REPRODUCED FROM CHEN BY PERMISSION
OF ELSEVIER SCIENCE LTD., UK. ....................................................................................... 71
FIGURE 32 TGA DTG OF NEAT POLYMER AND NANOCOMPOSITES SERIES UNDER (A) NITROGEN
AND (B) AIR (260). REPRODUCED FROM BARICK BY PERMISSION OF ELSEVIER SCIENCE
LTD., UK. ........................................................................................................................... 73
FIGURE 33 (A)TGA AND (B) DTGA CURVE OF A2 AND A2/MT-PCL NANOCOMPOSITES AT
HEATING RATE OF 10 K/MIN. (354). REPRODUCED FROM NAGUIB BY PERMISSION OF
ELSEVIER SCIENCE LTD., UK. ............................................................................................ 75
FIGURE 34 HRR IN A FUNCTION OF TEMPERATURE OF EVA, EVA-NC0 (EVA + POLYMERIC
MODIFIER (20%)) AND EVA-NC5 (EVA+ POLYMERIC MODIFIER + 5.6 WT.% MMT) (291).
REPRODUCED FROM SHI BY PERMISSION OF ELSEVIER SCIENCE LTD., UK. ...................... 77
FIGURE 35 THE STRUCTURE OF VINYL ESTER (390). ................................................................. 84
FIGURE 36 MOULD GEOMETRY, (A) FLAT SHAPE; (B) DOG-BONE SHAPE. ................................. 86
FIGURE 37 FLOW CHART OF THE FIRST SAMPLE FABRICATION. ................................................. 87
IX | P a g e
FIGURE 38 THE SECOND SAMPLE FABRICATION ......................................................................... 89
FIGURE 39 FAN ASSISTED OVEN FOR POST CURING; (A) BEFORE POST CURING, (B) AFTER POST
CURING. .............................................................................................................................. 90
FIGURE 40 (A) THE WATER JET CUTTING PROCESS, (B) THE EFFECT OF WATER JET METHOD ON
THE SAMPLES SURFACE AND (C) THE DIAMOND WHEEL CUTTER. ...................................... 91
FIGURE 41 THE PRINCIPLE OF THE THERMAL CONDUCTIVITY MEASUREMENT. ......................... 97
FIGURE 42 XRD RESULTS OF NEAT POLYMER AND THE CORRESPONDING NANOCOMPOSITES.
......................................................................................................................................... 102
FIGURE 43 SEM IMAGES AT 300 µM AND 50 µM OF (A) 2 WT.%, (B) 4 WT.% AND (C) 5 WT.%
NANOCOMPOSITES. ........................................................................................................... 103
FIGURE 44 EDS IMAGES AT DIFFERENT MAGNIFICATION (A) (55X) AND (B) (550X) OF 2 WT.%,
4 WT.% AND 5 WT.% NANOCOMPOSITES. ......................................................................... 105
FIGURE 45 TEM MICROGRAPHS AT 20 NM MAGNIFICATION OF (A) 2 WT.%, (B) 4 WT.% AND (C)
5 WT.% NANOCOMPOSITES. .............................................................................................. 106
FIGURE 46 THE EFFECT OF CLAY LOADING ON FLEXURAL STRENGTH. .................................... 108
FIGURE 47 THE EFFECT OF CLAY LOADING ON FLEXURAL MODULUS. ..................................... 108
FIGURE 48 THE RELATIONSHIP BETWEEN THE VOIDS CONTENT AND THE FLEXURAL MODULUS.
......................................................................................................................................... 109
FIGURE 49 THE RELATIONSHIP BETWEEN THE VOIDS CONTENT AND THE FLEXURAL STRENGTH.
......................................................................................................................................... 109
FIGURE 50 COMPARISON BETWEEN THEORETICAL AND EXPERIMENTAL DATA OF FLEXURAL
MODULUS AT DIFFERENT CLAY CONTENT. ....................................................................... 110
FIGURE 51 THE IMPROVEMENT AMOUNT OF TANGENT MODULUS FOR DIFFERENT CLAY
LOADINGS. ........................................................................................................................ 112
FIGURE 52 THE IMPROVEMENT OF TENSILE STRENGTH PROPERTIES OF NEAT POLYMER AND
NANOCOMPOSITES ............................................................................................................ 112
FIGURE 53 THE INFLUENCE OF THE VOIDS CONTENT ON THE TANGENT MODULUS .................. 113
FIGURE 54 THE INFLUENCE OF THE VOIDS CONTENT ON THE TENSILE STRENGTH ................... 113
FIGURE 55 THE RELATIONSHIP BETWEEN THE LOAD (MN) AND THE DEPTH (NM) OF THE NEAT
POLYMER AND CORRESPONDING NANOCOMPOSITES SAMPLES ........................................ 115
FIGURE 56 THE ELASTIC MODULUS OF CALCULATED VALUES AND EXPERIMENTAL RESULTS AT
VARIOUS CLAY CONTENT. ................................................................................................ 116
FIGURE 57 ZWICK/ROELL HIT230F DROP WEIGHT IMPACT TOWER AND SPECIMEN CLAMPING.
......................................................................................................................................... 118
FIGURE 58 THE RELATION BETWEEN THE WORK (J) AND THE CLAY LOADING WT.%. ............. 119
FIGURE 59 MAXIMUM FORCE VS. TIME TRACES OF THE IMPACT TEST. .................................... 120
X | P a g e
FIGURE 60 FRAGMENTATION CHARACTERISTICS OF (A) NEAT VINYL ESTER, (B)
NANOCOMPOSITES OF 2 WT.T% CLAY LOADING, (C) NANOCOMPOSITES OF 4 WT.T% CLAY
LOADING, AND (D) NANOCOMPOSITES OF 5 WT.% CLAY LOADING. ................................ 121
FIGURE 61 CREEP RELAXATION BEHAVIOUR OF NEAT POLYMER AND THE CORRESPONDING
NANOCOMPOSITES AT 25°C. ............................................................................................. 122
FIGURE 62 CREEP RELAXATION BEHAVIOUR OF PRISTINE MATRIX AND 2 AND 4 WT.%
NANOCOMPOSITES AT 60°C .............................................................................................. 123
FIGURE 63 TGA CURVE OF NEAT VE AND CORRESPONDING NANOCOMPOSITES. ................... 125
FIGURE 64 DTG CURVE OF BASE POLYMER AND DIFFERENT CONCENTRATIONS OF
NANOCOMPOSITES. ........................................................................................................... 125
FIGURE 65 DSC CURVE OF NEAT POLYMER AND THE CORRESPONDING NANOCOMPOSITES. .. 126
FIGURE 66 THE EFFECT OF LAYERED SILICATE INTO THE VINYL ESTER MATRIX ON THE
THERMAL CONDUCTIVITY. ............................................................................................... 127
FIGURE 67 WATER ABSORPTION BEHAVIOUR OF NEAT VINYL ESTER AND NANOCOMPOSITES.
......................................................................................................................................... 128
FIGURE 68 THE HARDNESS OF PRISTINE POLYMER AND NANOCOMPOSITES BEFORE AND AFTER
WATER ABSORPTION BEHAVIOUR. .................................................................................... 132
FIGURE 69 CONTACT ANGLE OF SOLVENTS (GLYCEROL AND WATER) DROPLET OF NEAT, 2
WT.% AND 4 WT.% NANOCOMPOSITES. ............................................................................ 133
FIGURE70 XRD CURVE OF CLOISITE 10A AND THE CORRESPONDING NANOCOMPOSITES. ..... 135
FIGURE 71 SEM IMAGES AT 50 µM OF (A) 1 WT.% AND (B) 2.5 WT.% NANOCOMPOSITES. ..... 135
FIGURE 72 TEM MICROGRAPHS AT 50 NM MAGNIFICATION OF (A) 1 WT.% AND (B) 2.5 WT.%
NANOCOMPOSITES ............................................................................................................ 136
FIGURE 73 THE EFFECT OF CLAY LOADING ON FLEXURAL STRENGTH. .................................... 138
FIGURE 74 THE EFFECT OF CLAY LOADING ON FLEXURAL MODULUS. ..................................... 138
FIGURE 75 THE TANGENT MODULUS IMPROVEMENTS AT DIFFERENT CLAY LOADING LEVELS.
......................................................................................................................................... 140
FIGURE 76 THE ULTIMATE TENSILE STRENGTH IMPROVEMENTS OF NEAT POLYMER AND
NANOCOMPOSITES. ........................................................................................................... 140
FIGURE 77 TGA CURVE OF NEAT VE AND CORRESPONDING NANOCOMPOSITES. ................... 141
FIGURE 78 DTG CURVE OF BASE POLYMER AND DIFFERENT CONCENTRATIONS OF
NANOCOMPOSITES. ........................................................................................................... 142
FIGURE 79 DSC CURVE OF THE NEAT VINYL ESTER AND THE CORRESPONDING
NANOCOMPOSITES. ........................................................................................................... 142
FIGURE 80 XRD CURVE OF CLOISITE 10A AND THE CORRESPONDING NANOCOMPOSITES OF
FIRST SAMPLE FABRICATION METHOD. ............................................................................ 144
FIGURE 81 XRD CURVE OF CLOISITE 10A AND THE CORRESPONDING NANOCOMPOSITES OF THE
SECOND SAMPLE FABRICATION METHOD. ........................................................................ 144
XI | P a g e
Lists of Tables
TABLE 1 THE COMBINATIONS OF DIFFERENT MATERIALS (186). ............................................... 39
TABLE 2 YOUNG'S MODULUS OF HARD AND SOFT POLYURETHANE NANOCOMPOSITES BY MELT
AND SOLUTION INTERCALATION (223). .............................................................................. 46
TABLE 3 THE RELATIONSHIP BETWEEN THE NANOCOMPOSITES PROPERTIES AND THE
ULTRASOUND AMPLITUDE (292). ....................................................................................... 49
TABLE 4 THE INFLUENCE OF LAYERED SILICATE ON THE TENSILE MODULUS AND STRENGTH
(305). .................................................................................................................................. 51
TABLE 5 THE EFFECT OF THE ADDITION OF LAYERED SILICATE INTO THE POLYMER MATRIX ON
THE NANOMECHANICAL PROPERTIES (319). ....................................................................... 58
TABLE 6 VARIOUS CLAY TYPES THAT WERE USED IN THE EXPERIMENT. REPRINTED FROM
(323). .................................................................................................................................. 61
TABLE 7 E' VALUES AT DIFFERENT CLAY TYPES AND CONCENTRATIONS (323). ....................... 61
TABLE 8 VARIOUS POLYMERS AND CLAYS THAT WERE USED IN THIS STUDY (340). ................. 67
TABLE 9 DIFFERENT TYPES OF MATERIALS THAT HAVE BEEN USED IN THIS STUDY (351). ....... 69
TABLE 10 TGA IN NITROGEN AND AIR OF DIFFERENT CLAY TYPES AND CONTENT (323). ........ 70
TABLE 11 TGA RESULTS OF NANOCOMPOSITES AND NEAT POLYMER (282). ............................ 71
TABLE 12 GLASS TRANSITION TEMPERATURE FOR DIFFERENT POLYMERS BASED ON LAYERED
SILICATE (340).................................................................................................................... 72
TABLE 13 DSC VALUES FOR BASE POLYMER AND NANOCOMPOSITES SERIES (260). ................ 72
TABLE 14 CHEMICAL COMBINATIONS AND MOLECULAR WEIGHTS OF POLY(HB/PCL-PEG-
PCL) URETHANES (354). .................................................................................................... 74
TABLE 15 THE THERMAL DEGRADATION OF POLYURETHANE SAMPLES AND CORRESPONDING
NANOCOMPOSITES (354).................................................................................................... 75
TABLE 16 REINFORCEMENT PROPERTIES (392). ......................................................................... 85
TABLE 17 THE CONCENTRATIONS OF LAYERED SILICATE USED IN THE FABRICATION OF
NANOCOMPOSITES. ............................................................................................................. 86
TABLE 18 SAMPLE DIMENSIONS FOR DIFFERENT TESTS AND CHARACTERISATIONS. ................ 91
TABLE 19 VOIDS CONTENT OF DIFFERENT NANOCOMPOSITES SAMPLES. ................................ 100
TABLE 20 XRD RESULTS OBTAINED FROM DIFFERENT CLAY LOADING OF NANOCOMPOSITES.
......................................................................................................................................... 101
TABLE 21 FLEXURAL TEST RESULTS. ....................................................................................... 107
TABLE 22 COMPARISON BETWEEN CALCULATED AND EXPERIMENTAL RESULTS OF FLEXURAL
MODULUS. ........................................................................................................................ 110
TABLE 23 TENSILE TEST OUTCOMES FOR NEAT AND DIFFERENT CLAY LOADING SAMPLES. ... 111
XII | P a g e
TABLE 24 THE NANOINDENTATION DATA EXTRACTED FROM THE LOAD-UNLOAD CURVE OF THE
EXPERIMENTAL NANOINDENTATION TEST. ...................................................................... 114
TABLE 25 THE THEORETICAL AND PRACTICAL ELASTIC MODULUS OF THE NEAT VINYL ESTER
AND THE CORRESPONDING NANOCOMPOSITES. ................................................................ 116
TABLE 26 THE MODULUS OF NEAT POLYMER AND THE CORRESPONDING NANOCOMPOSITES FOR
DIFFERENT MECHANICAL TESTS. ...................................................................................... 117
TABLE 27 IMPACT TEST RESULTS OF NEAT POLYMER AND THE CORRESPONDING OF
NANOCOMPOSITES. ........................................................................................................... 118
TABLE 28 THE STRAIN AMOUNT OF THE NEAT VINYL ESTER AND THE CORRESPONDING
NANOCOMPOSITES DURING THE CREEP TEST AT DIFFERENT INTERVALS TIMES AND
TEMPERATURES. ............................................................................................................... 121
TABLE 29 THE THERMAL CONDUCTIVITY OF PRISTINE VE AND THE CORRESPONDING
NANOCOMPOSITES. ........................................................................................................... 128
TABLE 30 THE MAXIMUM WATER UPTAKE AND DIFFUSION COEFFICIENT OF PRISTINE POLYMER
AND NANOCOMPOSITES. ................................................................................................... 130
TABLE 31 THE HARDNESS AND REDUCED MODULUS OF NEAT MATRIX AND CORRESPONDING
NANOCOMPOSITES BEFORE AND AFTER WATER ABSORPTION. ......................................... 131
TABLE 32 CONTACT ANGLE VALUES OF NEAT VINYL ESTER AND THE CORRESPONDING
NANOCOMPOSITES OF BOTH WATER AND GLYCEROL. ...................................................... 132
TABLE 33 XRD RESULTS OBTAINED FROM DIFFERENT CLAY LOADING OF NANOCOMPOSITES.
......................................................................................................................................... 134
TABLE 34 FLEXURAL TEST RESULTS. ....................................................................................... 137
TABLE 35 TENSILE TEST OUTCOMES FOR NEAT AND DIFFERENT CLAY LOADING SAMPLES. ... 139
TABLE 36 COMPARISON BETWEEN FIRST AND SECOND SAMPLE FABRICATION METHODS. ..... 143
TABLE 37 XRD RESULTS OBTAINED FROM DIFFERENT CLAY LOADING OF TYPE 1 AND 2
SAMPLES. .......................................................................................................................... 145
TABLE 38 COMPARISONS BETWEEN THE FIRST AND SECOND FABRICATION METHODS REGARD
THE FLEXURAL PROPERTIES. ............................................................................................ 146
TABLE 39 COMPARISONS BETWEEN THE FIRST AND SECOND FABRICATION METHODS IN TERM
OF THE TENSILE PROPERTIES. ........................................................................................... 147
TABLE 40 THE THERMAL PROPERTIES OF THE FIRST AND SECOND SAMPLE FABRICATIONS
PROCESS. .......................................................................................................................... 148

XIII | P a g e
Declaration
I hereby declare that this thesis is a presentation of my original research work and
effort and that it has not been submitted anywhere for any award. Where other sources
of information have been used, they have been acknowledged.
Signature: ……………………………………….
Date: ……………………………………………
XIV | P a g e
Abbreviations
AFM Atomic Force Microscopy PLA Poly(lactic acid)
CEC Cation-exchange capacity POE Polyolefin elastomer
13 C-NMR 13C solid-state nuclear magnetic resonance PP Polypropylene
DSC Differential Scanning Calorimetry PS Polystyrene
DTG Derivative Thermo Gravimetric Analysis PSF Polysulfone
EDS Energy Dispersive X-ray Spectrometry PU Polyurethane
EVA Ethylene vinyl acetate PUA Poly(urethane acrylate)
FTIR Fourier Transform Infrared Spectroscopy PVC Polyvinyl chloride
fwhm Full width at half maximum SEM Scanning electron microscopy
HCL Hydrochloric acid STM Scanning tunnelling microscopy
HRR The rate of heat release Td Decomposition temperature
MLR Mass loss rate TEM Transmission electron microscopy
MMT Montmorillonite Tg Glass transition temperature
OMLS Organo modification layered silicate TGA Thermo Gravimetric Analysis
o-MMT Organo montmorillonite THF Tetrahydrofuran
PA or PI Polyamide THR Complete heat released
PCL Polycaprolactone TTI Period to ignition
PE Polyethylene VE Vinyl ester resin
PEO Poly(ethylene oxide) WAXD Wide angle x-ray diffraction
PET Polyethylene terephthalate XRD X-ray diffraction
PHRR Heat release peak

XV | P a g e
Acknowledgments
It is a pleasure to thank the many people who made this thesis possible. This work
would not have been possible without the support from Dr. Hom Nath Dhakal under
whose guidance I chose this topic. I would like also to gratefully acknowledge him,
since he has been abundantly helpful and has assisted me in numerous ways. I specially
thank him for his infinite patience. The discussions I had with him were invaluable.
Also, I would thank him for helping me with the research material.
I would like to say a big thanks to Dr. Zhong Yi Zhang, who helped me with the many
test. Also, I would like to Thanks all the School of Engineering staff for all the help
and support provided.
I am very grateful to my parents Ibraihim and Monirah for their continuous prayers
for me and would also like to offer thanks to my brothers and sisters. No words can
express my gratitude to all my family.
I would also say a big thanks to my uncle Dr Ali Alateyah for his help and support.
I would also like to express my sincere thanks and gratitude to my wife Ibtihal
Alnugaythan and my daughter Ajawn for their support and help.
XVI | P a g e
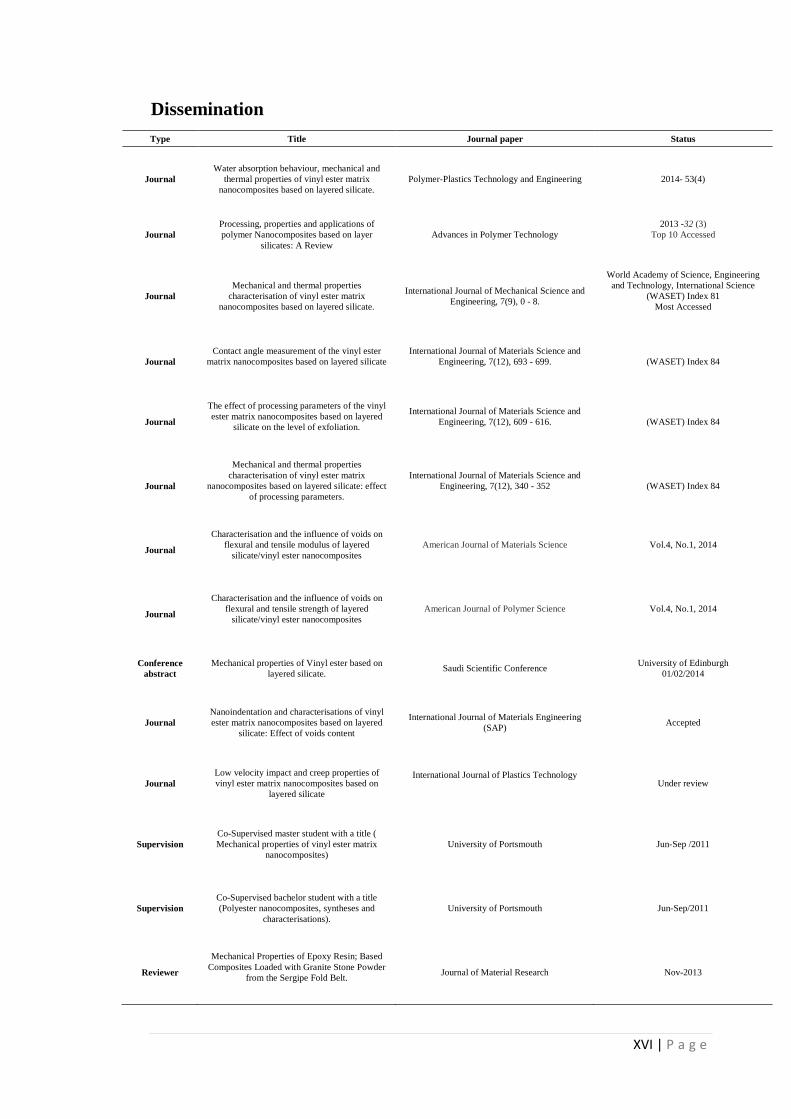
Dissemination
Type Title Journal paper Status
Journal
Water absorption behaviour, mechanical and
thermal properties of vinyl ester matrix
nanocomposites based on layered silicate.
Polymer-Plastics Technology and Engineering 2014- 53(4)
Journal
Processing, properties and applications of
polymer Nanocomposites based on layer
silicates: A Review
Advances in Polymer Technology
2013 -32 (3)
Top 10 Accessed
Journal
Mechanical and thermal properties
characterisation of vinyl ester matrix
nanocomposites based on layered silicate.
International Journal of Mechanical Science and
Engineering, 7(9), 0 - 8.
World Academy of Science, Engineering
and Technology, International Science
(WASET) Index 81
Most Accessed
Journal
Contact angle measurement of the vinyl ester
matrix nanocomposites based on layered silicate
International Journal of Materials Science and
Engineering, 7(12), 693 - 699.
(WASET) Index 84
Journal
The effect of processing parameters of the vinyl
ester matrix nanocomposites based on layered
silicate on the level of exfoliation.
International Journal of Materials Science and
Engineering, 7(12), 609 - 616.
(WASET) Index 84
Journal
Mechanical and thermal properties
characterisation of vinyl ester matrix
nanocomposites based on layered silicate: effect
of processing parameters.
International Journal of Materials Science and
Engineering, 7(12), 340 - 352
(WASET) Index 84
Journal
Characterisation and the influence of voids on
flexural and tensile modulus of layered
silicate/vinyl ester nanocomposites
American Journal of Materials Science
Vol.4, No.1, 2014
Journal
Characterisation and the influence of voids on
flexural and tensile strength of layered
silicate/vinyl ester nanocomposites
American Journal of Polymer Science
Vol.4, No.1, 2014
Conference
abstract
Mechanical properties of Vinyl ester based on
layered silicate. Saudi Scientific Conference
University of Edinburgh
01/02/2014
Journal
Nanoindentation and characterisations of vinyl
ester matrix nanocomposites based on layered
silicate: Effect of voids content
International Journal of Materials Engineering
(SAP) Accepted
Journal
Low velocity impact and creep properties of
vinyl ester matrix nanocomposites based on
layered silicate
International Journal of Plastics Technology
Under review
Supervision
Co-Supervised master student with a title (
Mechanical properties of vinyl ester matrix
nanocomposites)
University of Portsmouth Jun-Sep /2011
Supervision
Co-Supervised bachelor student with a title
(Polyester nanocomposites, syntheses and
characterisations).
University of Portsmouth Jun-Sep/2011
Reviewer
Mechanical Properties of Epoxy Resin; Based
Composites Loaded with Granite Stone Powder
from the Sergipe Fold Belt.
Journal of Material Research Nov-2013
Chapter 1. Introduction
1 | P a g e
Chapter 1. Introduction
1.1 Chapter description
General understanding of the different material subjects which include materials
classification, the terms of polymers, nanocomposites, nanometre, and the polymer-
based nanocomposites are discussed in this chapter. Also, the aims, objectives and the
research design are included in chapter one.
1.2 Introduction
The materials classification can be based on the wide range of properties and their
structural application. In general, four huge families of materials can be obtained. For
example metals and alloys, ceramics and glasses, polymers and elastomers, and
composites (1). In this work, the polymer matrix nanocomposites are studied. The
polymer can be defined as the unique structural characteristic consisting of a very
enormous number of chain units which are connected together by covalent link (2).
The numbers of repeated units are called monomers, which are also expressed as the
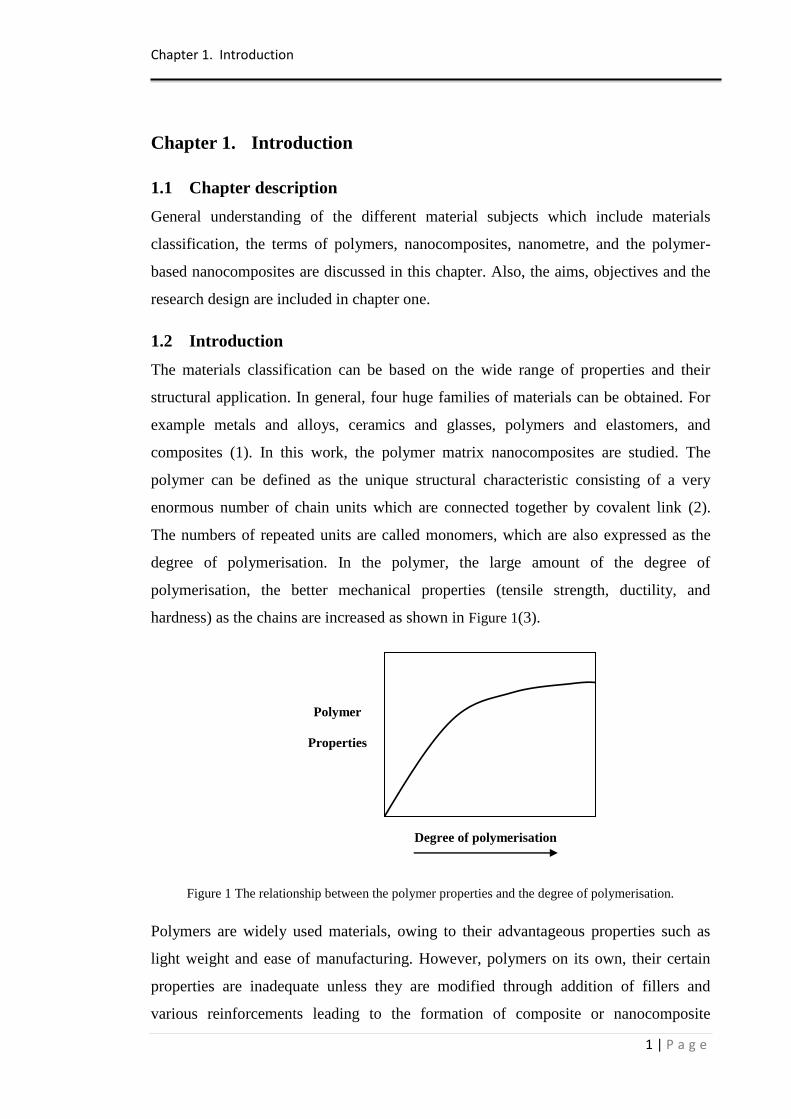
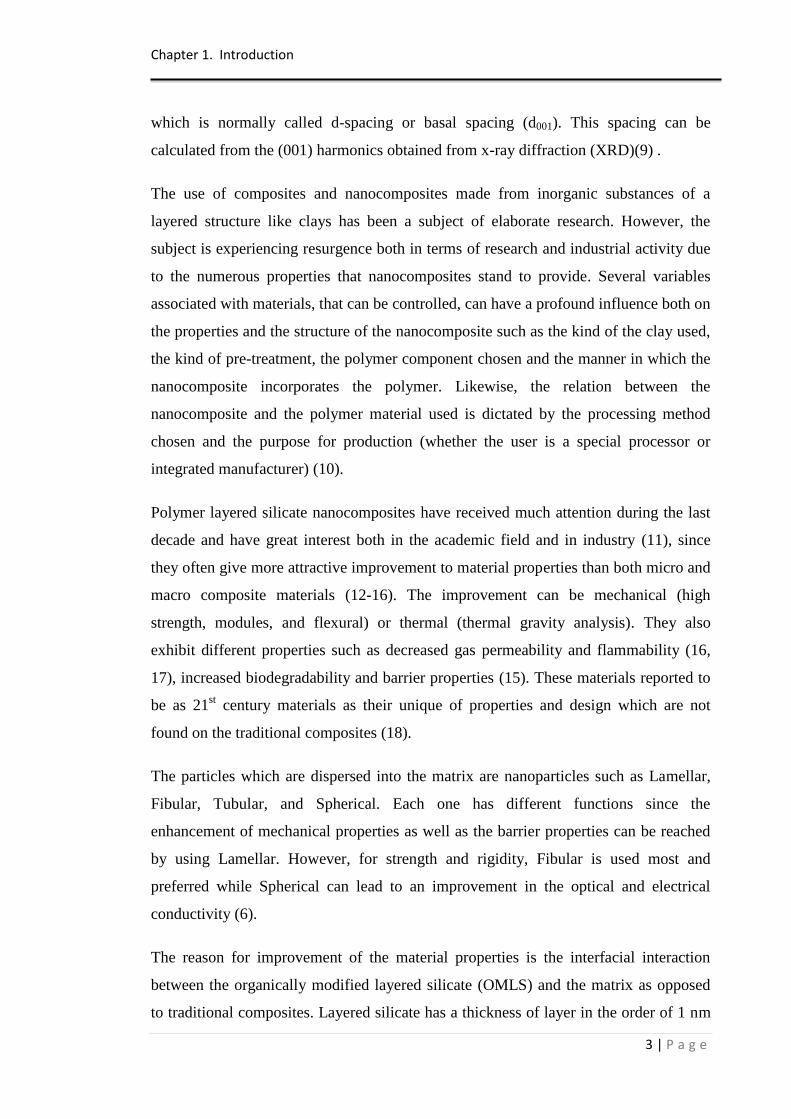
degree of polymerisation. In the polymer, the large amount of the degree of
polymerisation, the better mechanical properties (tensile strength, ductility, and
hardness) as the chains are increased as shown in Figure 1(3).
Figure 1 The relationship between the polymer properties and the degree of polymerisation.
Polymers are widely used materials, owing to their advantageous properties such as
light weight and ease of manufacturing. However, polymers on its own, their certain
properties are inadequate unless they are modified through addition of fillers and
various reinforcements leading to the formation of composite or nanocomposite
Degree of polymerisation
Polymer
Properties
Chapter 1. Introduction
2 | P a g e
materials (4). For that reason and to overcome these drawbacks, suitable fillers
(additives) are applied in the neat polymers in order to enhance their properties.
Polymers with various particulate fillers have been successfully reinforced to improve
their stiffness and toughness, as well as enhancing their resistance to fire and ignition
and also their barrier properties. Addition of the particulate fillers often results in
unwanted properties such as brittleness and opacity as a result of inhomogeneous
dispersion on a nanometer scale between the polymer and the additives. However, if
homogenous dispersion on a nanometer scale could be achieved, the mechanical
properties could be further improved and/or new unexpected features might be
exhibited (5).
Composite materials have a fairly new class which are nanocomposites that are
particle-filled composites in which at least one dimension of the dispersion particles is
in the nanometer range. The matrix can be either single or multicomponent. The matrix
may be either metallic, ceramic or polymeric (6). In other words, nanocomposites are
multiphase solid materials in which one of the phases has at least 1, 2 or 3 dimensions
that are below 100 nm (7).
A nanometer equals one billionth of a meter, which means a nanometer equals
approximately 4 times an atom‟s diameter. In terms of the number of dimensions in the
nanometer range that are discerned, three different types of dimensions can be
observed. Firstly, identifying the isodimensional nanoparticles which comprise the
three dimensions are on the nanometer order. Secondly, when two dimensions of
nanometer scale where a large one is observed, this is called whiskers or nanotube.
However, the most extensive investigation is conducted into the clay (layered silicate),
which is a sheet of one or a few nanometers thick and 100-1000 nanometers in extent.
The reasons for the extent of this investigation of the clay is because of its ease of
availability and because the chemical interaction has been studied for a long time (8).
The most commonly used organophilic layered silicate is obtained from
montmorillonite (MMT). The structure of this layer is made of many stacked layers
and each one has a thickness of between 1.2-1.5 nm and the lateral dimension is from
100-200 nm. These layers order themselves to shape the stacks with a consistent gap
between them; these gaps are called the gallery or interlayer. The sum of galleries and
the thicknesses of single layer represent the repeat unit of the material of multilayer,
Chapter 1. Introduction
3 | P a g e
which is normally called d-spacing or basal spacing (d001). This spacing can be
calculated from the (001) harmonics obtained from x-ray diffraction (XRD)(9) .
The use of composites and nanocomposites made from inorganic substances of a
layered structure like clays has been a subject of elaborate research. However, the
subject is experiencing resurgence both in terms of research and industrial activity due
to the numerous properties that nanocomposites stand to provide. Several variables
associated with materials, that can be controlled, can have a profound influence both on
the properties and the structure of the nanocomposite such as the kind of the clay used,
the kind of pre-treatment, the polymer component chosen and the manner in which the
nanocomposite incorporates the polymer. Likewise, the relation between the
nanocomposite and the polymer material used is dictated by the processing method
chosen and the purpose for production (whether the user is a special processor or
integrated manufacturer) (10).
Polymer layered silicate nanocomposites have received much attention during the last
decade and have great interest both in the academic field and in industry (11), since
they often give more attractive improvement to material properties than both micro and
macro composite materials (12-16). The improvement can be mechanical (high
strength, modules, and flexural) or thermal (thermal gravity analysis). They also
exhibit different properties such as decreased gas permeability and flammability (16,
17), increased biodegradability and barrier properties (15). These materials reported to
be as 21st century materials as their unique of properties and design which are not
found on the traditional composites (18).
The particles which are dispersed into the matrix are nanoparticles such as Lamellar,
Fibular, Tubular, and Spherical. Each one has different functions since the
enhancement of mechanical properties as well as the barrier properties can be reached
by using Lamellar. However, for strength and rigidity, Fibular is used most and
preferred while Spherical can lead to an improvement in the optical and electrical
conductivity (6).
The reason for improvement of the material properties is the interfacial interaction
between the organically modified layered silicate (OMLS) and the matrix as opposed
to traditional composites. Layered silicate has a thickness of layer in the order of 1 nm
Chapter 1. Introduction
4 | P a g e
and very high aspect ratio. A little weight percent of OMLS is dispersed throughout the
matrix, thus giving a larger surface area for polymer filler interfacial interaction than in
conventional composites (15). However in polymers with low polarity such as
polyolefins, the improvement is not too significant since there is not compatibility
between the clay and polymer (19).
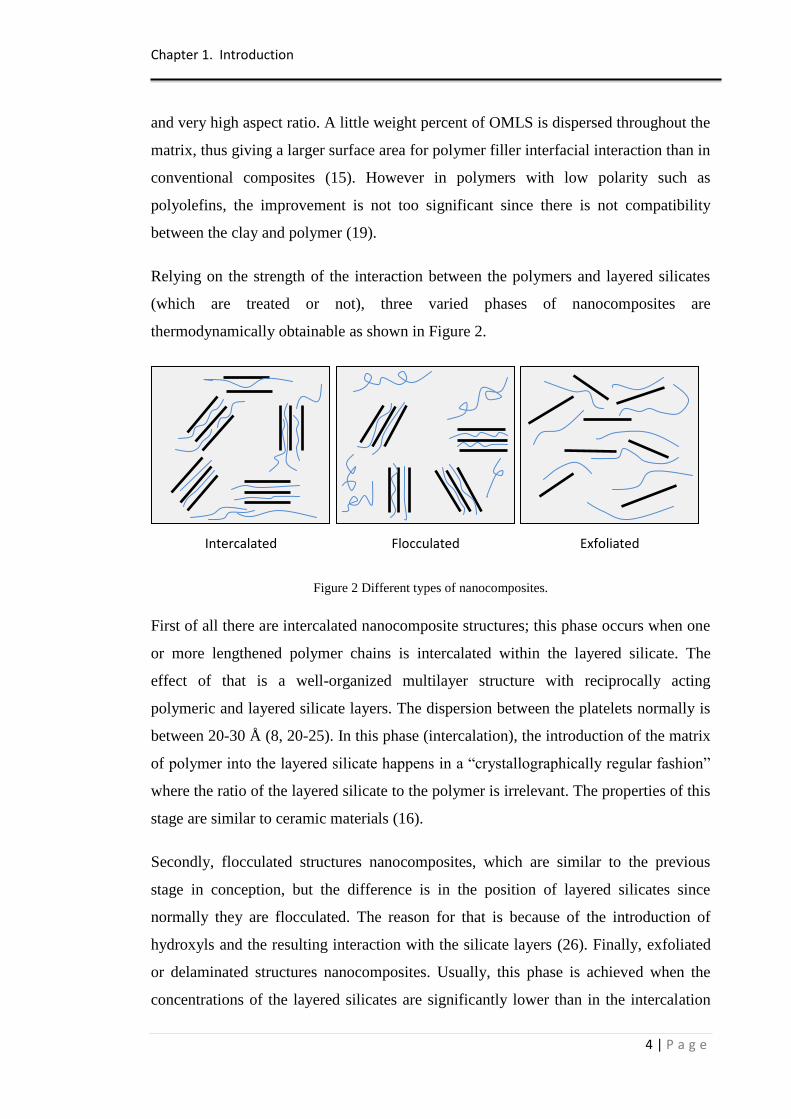
Relying on the strength of the interaction between the polymers and layered silicates
(which are treated or not), three varied phases of nanocomposites are
thermodynamically obtainable as shown in Figure 2.
Figure 2 Different types of nanocomposites.
First of all there are intercalated nanocomposite structures; this phase occurs when one
or more lengthened polymer chains is intercalated within the layered silicate. The
effect of that is a well-organized multilayer structure with reciprocally acting
polymeric and layered silicate layers. The dispersion between the platelets normally is
between 20-30 Å (8, 20-25). In this phase (intercalation), the introduction of the matrix
of polymer into the layered silicate happens in a “crystallographically regular fashion”
where the ratio of the layered silicate to the polymer is irrelevant. The properties of this
stage are similar to ceramic materials (16).
Secondly, flocculated structures nanocomposites, which are similar to the previous
stage in conception, but the difference is in the position of layered silicates since
normally they are flocculated. The reason for that is because of the introduction of
hydroxyls and the resulting interaction with the silicate layers (26). Finally, exfoliated
or delaminated structures nanocomposites. Usually, this phase is achieved when the
concentrations of the layered silicates are significantly lower than in the intercalation
Exfoliated Intercalated Flocculated
Chapter 1. Introduction
5 | P a g e
system. The exfoliation occurs when layered silicate layers are dispersed in a
continuous polymer matrix via median distance, which is dependent on the clay content
(16).
In other words, exfoliated or delaminated structures are produced when the layered
silicate layers are effectively separated from one another and separately incorporated in
the repeated polymer matrix (20-22, 24). The separation between the platelets in the
exfoliation stage is between 80-100 Å. Furthermore, the distance can sometimes be
more than 100Å (25). In the exfoliation structure, the increase in the distance between
the layered silicates is comparable to the radius gyration of the polymer. However, in
the intercalation structure, the expansion of the interlayer is comparable to an extended
chain. The exfoliation system is an attractive option since the properties of this
structure have been improved by the high area interaction between the clay and the
polymer which results in a homogeneous distribution (27). Even with the several
advantages of the exfoliation structure, it is difficult to reach a final exfoliation of the
clay. The reason for this difficulty is because of the large anisotropic structure of layers
of silicate where the outside dimensions are between 100-1000 nm. This makes it
difficult to locate them in a random way in the polymer sea even when they are
dispersed over huge distances such as when delaminated (28). Moreover, it was
revealed that the difficulty of reaching the exfoliation structure was assigned to the clay
surface nature as the clay is naturally hydrophilic and the polymer is hydrophobic,
which leads to difficulty in exfoliation in the polymer matrix (29). In addition, most of
the polymer chains in the mixture of clay and polymer are connected to the surface of
the layers of silicate. As a result of this, it can be thought that there are domains in
these hybrids where a number of long-range orders are retained and the layers of
silicate are positioned in a small number of favourable directions (16, 28).
The thermodynamic behaviour, which includes entropic and energetic factors of the
nanostructure, can determine the outcomes of nanocomposites structure and polymer
interaction. The low entropic penalty that is produced by the polymer chain
confinement when the incorporation of layered silicate took place could be
compensated by the increased conformational freedom of the surfactant chains as the
layers dispersed throughout the polymer sea. The difference in total change of entropy
between them can control the output nanocomposites structure whether immiscible,
Chapter 1. Introduction
6 | P a g e
intercalation or exfoliation. So, when the amount of total change in entropy is small,
less change in the system‟s internal energy will take place and the intercalation level
will be presented. Thus, for successful composite formation, it is important to have an
initial interlayer structure that leads in a maximum enhance in the conformational
entropy of the surfactant chains to compensate the penalty of polymer confinement. As
a result, more change in in the system‟s internal energy will be obtained and then the
exfoliation structure would be presented (30).
The mechanism of nanocomposites properties are correlated to the phase structure and
types. In immiscible nanocomposites system, the properties are similar to the
traditional composites. The intercalation nanocomposites structure provide with better
properties compared to the immiscible structure where the polymer chains reduce the
electrostatic force between layers and the uniform distribution of clay will take place.
The properties of exfoliation nanocomposites can be distinguished which attributed to
the high surface area provided by its structure. Thus, the angle between layered
silicates is high and the interfacial inetraction between the layered silicate and polymer
is significantly increased compared to intercalated structure.
1.3 Aims
The main aims of this study are to explore the structure and the properties of layered
silicate nanocomposites by employing various weight percent of layered silicate
reinforcements. The study further aims at investigating the effect of the presence of
layered silicate into the vinyl ester matrix on the overall properties. The study also aims
to pinpoint the gap and limitations and suggest the mechanisms that involve in
obtaining optimal properties enhancement in nanocomposite systems.
1.4 Objectives
This study is primarily devoted to the preparation and characterisations of neat vinyl
ester and the corresponding nanocomposites using novel preparation techniques, and to
perform a systematic experimental study on the properties of layered silicate reinforced
vinyl ester nanocomposites with various concentrations of clay contents, and
specifically the following objectives therein:
To review the relevant literature;
Chapter 1. Introduction
7 | P a g e
To gain insight into the differences between: conventional composites,
intercalated and exfoliated nanocomposites;
To fabricate vinyl ester nanocomposites reinforced with various concentrations
of layered silicate and study the effect of the various clay contents on the
different properties such as mechanical, thermal, environmental, and surface
energy;
To select and compare alternative methodologies for the preparation of vinyl
ester matrix nanocomposites based on layered silicate and the influence of
these processing parameters on the nanocomposites properties;
To investigate the morphology of nanocomposites by different characterisation
techniques and correlate the morphology structure to the different properties.
1.5 Research Design and Strategy
In order to achieve the overall aims and the objectives of the current thesis, the
following tasks were undertaken.
1.5.1 Task One: Review of related literature
The literature review is the basic infrastructure of the thesis. Reviewing the literature
can benefit the researcher and the reader to understand the whole subject and the
progress of the research. In the current research, extensive literature about the polymers
and the polymer nanocomposites are provided. Also, the effects of the addition of
layered silicate into the polymer matrix on the mechanical, thermal and environment
properties are presented.
1.5.2 Task Two: Design and production of mould
A special stainless steel mould was manufactured under the British Standard (BS)
geometry. For example, the tensile and flexural test need at least a specimen of 70 mm
x 20 mm x 3 mm, so the thickness of this mould was 3mm in order to meet the
requirements of BS.
1.5.3 Task Three: Sample fabrication
Series of the sample were produced which include the neat vinyl ester and the
corresponding nanocomposites with different clay contents. The clay concentrations
were as follows: 1, 2, 3, 4, 5 wt. %.
Chapter 1. Introduction
8 | P a g e
1.5.4 Task Four: Carry out various testing
Mechanical testing
Tensile, Flexural, nanoindentation, impact, and creep tests were carried out in
order to understand the effect of the incorporation of clay into the vinyl ester
matrix.
Thermal measurement
Thermogravimetric Analysis, Differential Scanning Calorimetric and Surface
thermal conductivity were used to evaluate the thermal properties.
Water absorption behaviour
The influence of the presence of layered silicate into the polymer matrix on the
water uptaking behaviour is carried out.
Other tests
The effect of the water absorption behaviour into the nanoindentation samples
was investigated. Concat angle measurment was also performed in order to
study the tension surface energy and the term of the wettability.
1.5.5 Task Five: Analysing of morphology structure
The morphology of the nanocomposites samples are investigated by utilising various
devices of characterisations which include Wide Angle X-ray Diffraction (WAXD),
Scanning Electron Microscopy (SEM), Energy Dispersive X-ray Spectrometry (EDS)
and Transmission Electron Microscopy (TEM).
1.5.6 Task Six: Analysing and discussion the results
Intensive analytical discussions are presented. The comparison between the neat
polymer and the corresponding nanocomposites are performed.
1.5.7 Task Seven: Dissemination
Publish the findings in this research work in high impact factor scientific journal, and
enhancing the literature review section to be ready as a format of review paper.
1.5.8 Task Eight: Writing of the thesis
This task is the last one and combines all the above tasks to be together. Each chapter
will be connected to the others.
Chapter 1. Introduction
9 | P a g e
1.6 Thesis Outline
This thesis provides a useful understanding about the polymer-clay nanocomposites.
The contents of this research are divided into five chapters which are presented below:
Chapter one presents a general introduction about the different terminologies that are
used. Also, the aims, objectives and research strategy and design are included in this
chapter.
Chapter two contains a comprehensive review of current literature which includes the
types and structures of polymers, layered silicates and nanocomposites. In addition, the
polymer based on layered silicate nanocomposites properties, advantages and
applications are discussed.
Chapter three details the materials of polymer and layered silicate that were used in
the current study and the sample fabrication process which was followed. Experimental
procedures and characterisation techniques are also discussed in this chapter.
Chapter four discusses the mechanical, thermal, environmental and surface energy
properties of neat vinyl ester and the corresponding nanocomposites. Full explanations
about the effect of the incorporation of layered silicate into the polymer matrix on the
different properties are presented.
Chapter five summarises the current study.
References contain the references used in this work.
Appendices first page of each publication is presented.
Chapter 2. Literature Review
10 | P a g e
Chapter 2. Literature Review
2.1 Chapter description
This chapter will present enormous background on the field of polymer
nanocomposites based on layered silicate. History, types, definitions, structures,
properties, preparation and applications of nanocomposites are described. The
nanocomposites usually reveal remarkable properties compared to conventional
composites. The concept of nanocomposite and its aims will be introduced.
2.2 Polymer
The word “Polymer” is obtained from Greek words which are “poly” and “mer”;
“poly” means many and “mer” means part or unit. It is a chain of small molecules
which are joining together in different fashions in order to form a single layer
molecule. The polymer represents the structure of repeating units on a large scale of the
joining macromolecules. The repeating parts are known as the monomers and are
linked together by covalent bonds. The formation of a polymer structure is derived
from the polymerisation process of the repeating monomer (31-33).
2.3 Classification of polymer
The polymer classification can vary and depends on different considerations. The
following classifications are the most widely studied and common in terms of polymer.
2.3.1 Classification based on the source of polymer.
2.3.1.1 Natural polymers
These kinds of polymers are found in plants or animals such as proteins, cellulose and
rubber (34, 35).
2.3.1.2 Semi-synthetic polymers
These can be defined as the chemical modification and treatment of the natural original
polymer. For instance cellulose acetate, cellulose methyl ethers and cellulose nitrate are
derived from the natural polymer which is the cellulose (34, 35).
Chapter 2. Literature Review
11 | P a g e
2.3.1.3 Synthetic polymers
This is a polymer which can be prepared in the laboratory and is also usually called
man-made, polymers such as nylon 6,6 and polythene (34, 35).
2.3.2 Classification based on the polymer structure
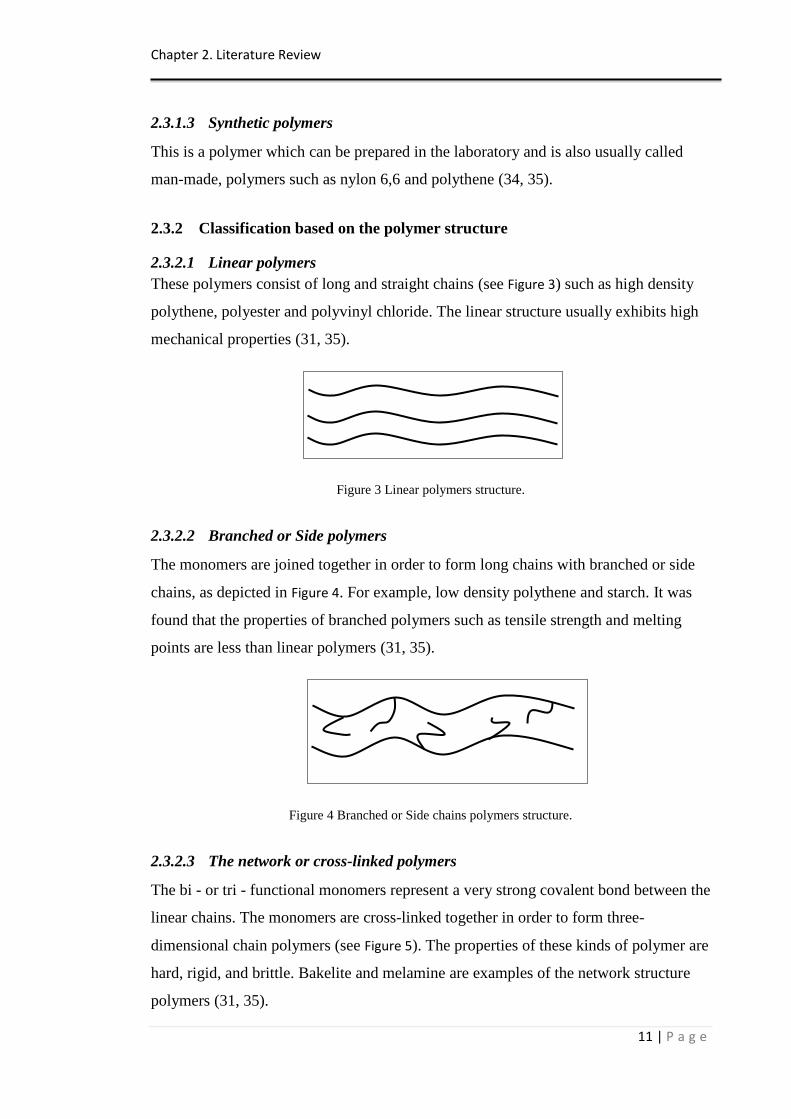
2.3.2.1 Linear polymers
These polymers consist of long and straight chains (see Figure 3) such as high density
polythene, polyester and polyvinyl chloride. The linear structure usually exhibits high
mechanical properties (31, 35).
Figure 3 Linear polymers structure.
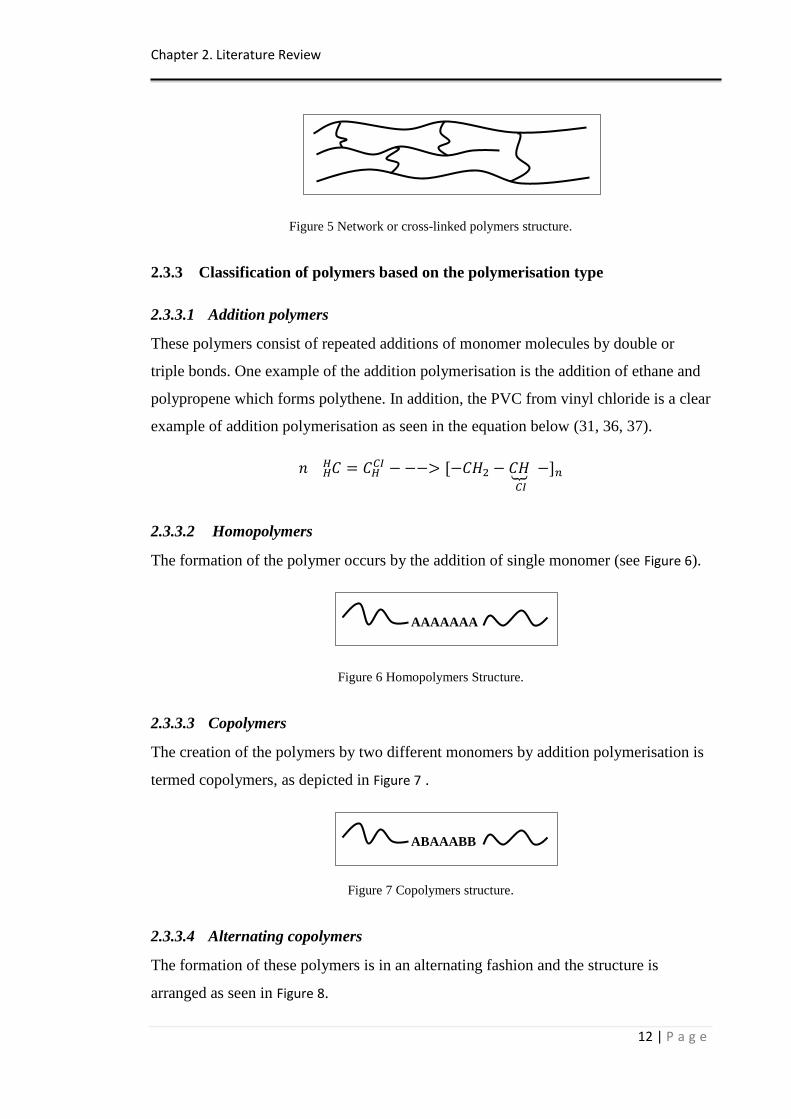
2.3.2.2 Branched or Side polymers
The monomers are joined together in order to form long chains with branched or side
chains, as depicted in Figure 4. For example, low density polythene and starch. It was
found that the properties of branched polymers such as tensile strength and melting
points are less than linear polymers (31, 35).
Figure 4 Branched or Side chains polymers structure.
2.3.2.3 The network or cross-linked polymers
The bi - or tri - functional monomers represent a very strong covalent bond between the
linear chains. The monomers are cross-linked together in order to form three-
dimensional chain polymers (see Figure 5). The properties of these kinds of polymer are
hard, rigid, and brittle. Bakelite and melamine are examples of the network structure
polymers (31, 35).
Chapter 2. Literature Review
12 | P a g e
Figure 5 Network or cross-linked polymers structure.
2.3.3 Classification of polymers based on the polymerisation type
2.3.3.1 Addition polymers
These polymers consist of repeated additions of monomer molecules by double or
triple bonds. One example of the addition polymerisation is the addition of ethane and
polypropene which forms polythene. In addition, the PVC from vinyl chloride is a clear
example of addition polymerisation as seen in the equation below (31, 36, 37).
⏟
2.3.3.2 Homopolymers
The formation of the polymer occurs by the addition of single monomer (see Figure 6).
Figure 6 Homopolymers Structure.
2.3.3.3 Copolymers
The creation of the polymers by two different monomers by addition polymerisation is
termed copolymers, as depicted in Figure 7 .
Figure 7 Copolymers structure.
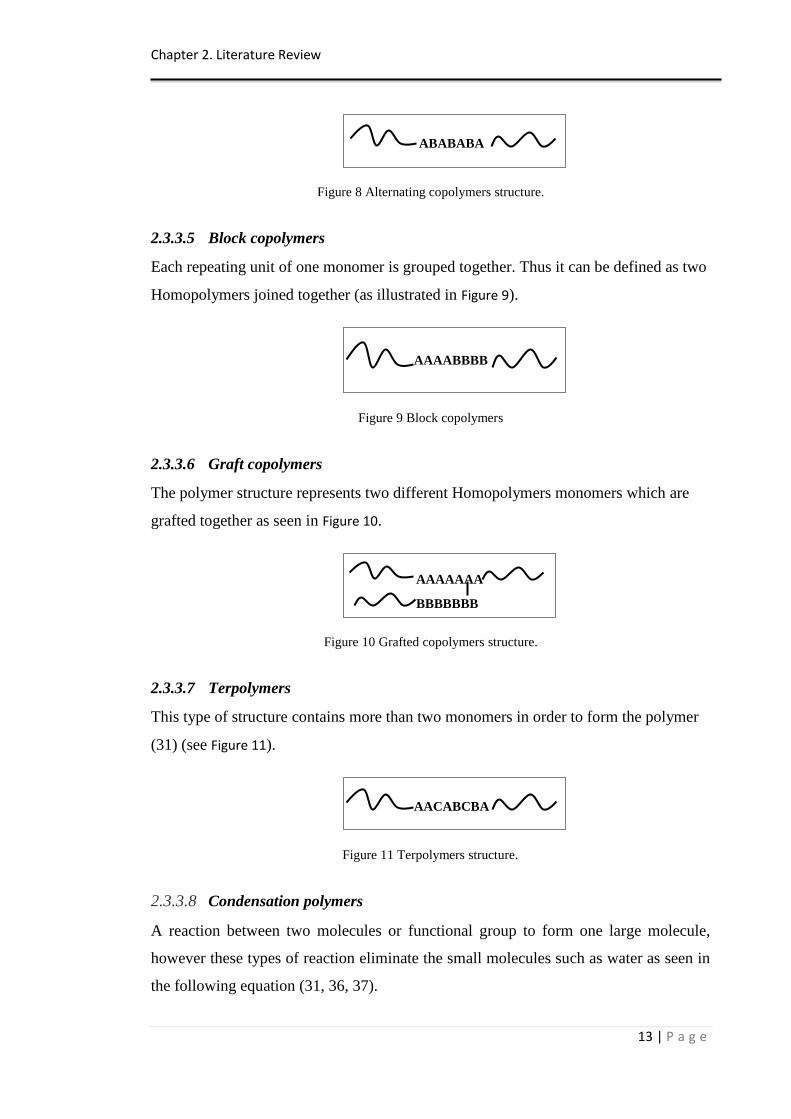
2.3.3.4 Alternating copolymers
The formation of these polymers is in an alternating fashion and the structure is
arranged as seen in Figure 8.
ABAAABB
AAAAAAA
AA
Chapter 2. Literature Review
13 | P a g e
Figure 8 Alternating copolymers structure.
2.3.3.5 Block copolymers
Each repeating unit of one monomer is grouped together. Thus it can be defined as two
Homopolymers joined together (as illustrated in Figure 9).
Figure 9 Block copolymers
2.3.3.6 Graft copolymers
The polymer structure represents two different Homopolymers monomers which are
grafted together as seen in Figure 10.
Figure 10 Grafted copolymers structure.
2.3.3.7 Terpolymers
This type of structure contains more than two monomers in order to form the polymer
(31) (see Figure 11).
Figure 11 Terpolymers structure.
2.3.3.8 Condensation polymers
A reaction between two molecules or functional group to form one large molecule,
however these types of reaction eliminate the small molecules such as water as seen in
the following equation (31, 36, 37).
AACABCBA
AAAAAAA
BBBBBBB
B
AAAABBBB
ABABABA
Q
Chapter 2. Literature Review
14 | P a g e
⏟
2.3.4 Classification of the polymers based on molecular properties
2.3.4.1 Elastomers
These polymers possess high elastic modulus and weak intermolecular forces. The
weak bonding allows the polymer to be stretched. A few crosslink bondings between
the chains permits the polymer to go back to its original shape (31, 32, 38).
2.3.4.2 Fibres
These can be defined as the thread forming solids and the structure of the fibres
contains very strong intermolecular forces. Thus, the fibres have high mechanical
properties (39).
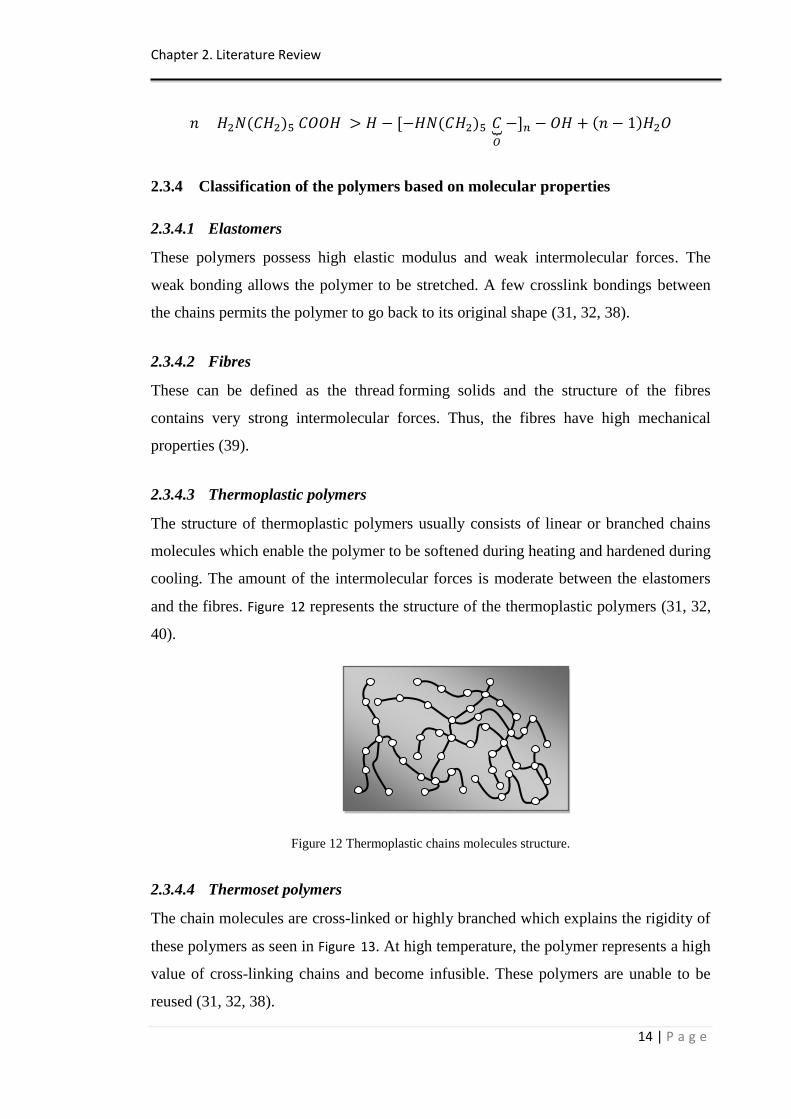
2.3.4.3 Thermoplastic polymers
The structure of thermoplastic polymers usually consists of linear or branched chains
molecules which enable the polymer to be softened during heating and hardened during
cooling. The amount of the intermolecular forces is moderate between the elastomers
and the fibres. Figure 12 represents the structure of the thermoplastic polymers (31, 32,
40).
Figure 12 Thermoplastic chains molecules structure.
2.3.4.4 Thermoset polymers
The chain molecules are cross-linked or highly branched which explains the rigidity of
these polymers as seen in Figure 13. At high temperature, the polymer represents a high
value of cross-linking chains and become infusible. These polymers are unable to be
reused (31, 32, 38).
Chapter 2. Literature Review
15 | P a g e
Figure 13 Thermoset plastic structure where the black circles represent the cross link.
2.4 Nanocomposites
2.4.1 Background
For the last fifty years, polymer matrix has been introduced with layered silicate. In
1949, Bower (41) carried out one of the earliest studies of the interaction between clay
mineral and a macromolecule when he showed the absorption of DNA by
montmorillonite. Although XRD proof was absent, the result included incorporation of
macromolecule in the lamellar structure of the silicate (8). The first study in this field
was by Carter et al. (42) who in 1950 combined polymer with layered silicate on the
nanometer size in order to form nanocomposites. In 1958, Hauser (43) filed a patent for
“Clay complexes with conjugated unsaturated aliphatic compounds of four to five
carbon atoms”. In the 1960s, in-situ polymerization of the vinyl monomer in interlayer
space Montmorillonite was studied by Uskov (44) and developed by Blumstein (45)
and Greenland (46). Later in that decade, the combination between organoclay and
thermoplastic polyolefin matrix was demonstrated by Nalsia et al.(47). They achieved
organoclay composites with tough solvent resistance and large tensile strength by
irradiation-induced cross linking. In 1975, Tanihara and Nakagawa (48) achieved
similar results to (47) by intercalating polyacrylamide and polyethylene oxide from a
hydrous solution. One year later, Fujiwara and Sakamoto (49) outlined initial hybrid
polyamide nanocomposites. Between 1976 and the mid 1980s, clay concentrations
were used in small amounts, rather than larger amounts: 1-10% instead of 50%. This
work was carried out by General Motors (GM) (50), Imperial Chemical Industries
(ICI)(51) and DuPont (52). GM took out an initial patent at around this time. The GM
patent utilised the use of clay minerals instead of antimony oxides while ICI developed
an idea about the use of “delaminated vermiculite” to impart self-extinguishing and
Chapter 2. Literature Review
16 | P a g e
charring properties to large polystyrene beads. Likewise, DuPont established the flame
retardant properties of polymer-clay nanocomposites.
Despite these developments in nanocomposites, the usage of them was not very
extensive until researchers from Toyota (53-56) started specific tests of nylon layered
silicate nanocomposites, and then nanocomposites became widely extended in different
fields such as academic, government and manufacturing research (8). The reason for
the nanocomposites extension after Toyota‟s research was traced to the superior
enhancement in the overall properties of the resulting products that were observed.
2.4.2 Nanocomposites structures
Generally, dispersing the polymer in layered silicate does not essentiality form a
nanocomposite. It depends on the compatibility between the polymer and layered
silicate. In non-mixable situations, the weak physical interaction between the polymers
and layered silicates, weak mechanical properties will result. Likewise, it also leads to
agglomeration to take place which means to decrease the ability of strength as well as
providing poorer materials (21). As a result, when the organic component cannot be
able to intercalate with the inorganic component, the resulting mixture will have
properties that are similar to microcomposites structures which are not desirable (8, 20,
23). There are many correlative structural characteristics which function to differentiate
polymers based on layered silicate nanocomposites from a traditional system. One of
them is the percolation threshold which is much lower compared to conventional
composites. Also, the distance between particles is very small. Moreover, there is high
interfacial interaction between the polymer and layered silicate. The difference of
properties between them can be assigned to the high aspect ratio of layered silicate as
well as the nano dimension dispersion (57).
2.4.3 Nanocomposite structural characterisation
There are many techniques that are used to characterise nanocomposites structures. The
two correlative methods that are normally used are transmission electron microscopy
(TEM) and X-ray diffraction (XRD) (16, 20, 23, 58), or wide angle x-ray diffraction
(WAXD) (16, 21, 29, 59, 60). However, XRD and WAXD are the most widely used
techniques to evaluate the nanocomposites system. This is because of their availability
Chapter 2. Literature Review
17 | P a g e
and ease of use (16). In addition, they are used to analyse the polymer melt
intercalation kinetics (16, 61). The XRD method enables an understanding in relation
to the distances between the silicate layers‟ structure by using Bragg‟s law = sin θ=
nλ/2d.
The structure of nanocomposites, whether intercalated or exfoliated, may be identified
by controlling the direction, intensity, and shape of the basal reflection that results from
the distribution of silicate layers (16). For instance, in the exfoliation structure of
nanocomposites, XRD or WAXD produces a loss of coherent x-ray diffraction that
results from the silicate layers. This is because this structure has a very large layer
distribution in the matrix of the polymer. However, the XRD or WAXD of the
intercalated structure, where the distribution of the layers is limited, produces a new
basal reflection that corresponds to the large interlayer height. Nevertheless, in the non-
mixable combination of polymer/organic modified layered silicate (OMLS), the basal
reflections characteristics of OMLS do not change because the silicates structure is not
affected (16, 20, 23, 62).
The effects of the intercalation structure of the polymer on the arrangement of the
layers of OMLS can be controlled by amendments to the full width at half maximum
(fwhm) of the basal reflections. If there is an increase in the coherent layers stacking
degree, the fwhm of the basal reflections will be decreased. Conversely, if the degree
of coherent layers are decreased, the intensity loss and peak enlarging will be observed
(62).
Despite the detrainment of the gallery spacing of the layers of silicate in the original
layered silicate where the nanocomposites have an intercalated structure (within1-4
nm) by XRD or WAXD, there is little agreement about the spatial distribution of the
silicate layers or any structures that are not homogenous in nanocomposites.
Furthermore, initially some of the layered silicates do not show a well-defined space
between the interlayer (which is the basal reflections). For this reason, the peak
enlargement and intensity loss are difficult to examine and analyse systematically. As a
result, the nanocomposites structure based on XRD or WAXD are uncertain. However,
TEM can provide information about the spatial distribution of the different phases, real
areas, structural problems, localised space and morphology. This makes possible a
Chapter 2. Literature Review
18 | P a g e
qualitative understanding of the internal structure (12, 16, 63). Since the silicate layers
consist of heavy elements such as Al, Si, and O, they can be observed through TEM as
dark lines approximately 1 nm thick. However, the interlayer and the matrix consist of
light elements (i.e. C, H, and N) which appear as bright colours that are not as dark as
in layered silicates. In addition, the use of TEM needs special care which must be
applied to improve the result of the cross-section image of the specimen (58, 63). TEM
must be relied when the structure is midway between exfoliation and intercalation so
the broadening and enlargement of the diffraction peak is observed (20).
Also, 13C solid-state nuclear magnetic resonance (13 C-NMR) is used in order to
characterise the nanocomposites. This technique was first used by VanderHart et al.
(64) and resulted in a much improved understanding of nanocomposites morphology,
as well as the surface properties and, to a small degree, the exfoliation dynamics of the
polymer clay nanocomposites. NMR techniques help to measure the levels of the
structural exfoliation. This is a very important issue because the objective of NMR
measuring is to make a connection between the measured longitudinal relaxation T1
s
and 13C with the clay dispersion quality (16).
In addition, Fourier Transform Infrared Spectroscopy (FTIR) has been used by
different researchers to explain nanocomposites structures (65, 66). FTIR reveals the
differences in the bonding in the mixture and related nanocomposites. However, these
variations are extremely small and nowadays this method is not considered reliable for
the analysis of nanocomposites in the majority of cases (58).
Furthermore, Differential Scanning Calorimetry (DSC) can produce additional
information about intercalation. The high interaction between the chain intercalation of
the host species with the polymer can decrease their circular and transformational
motion. This situation is similar to that of reticulated polymer where limitations on its
mobility enlarge its glass transition temperature (Tg). Likewise, an increase is expected
to result in the nanocomposites because of the height of the energy threshold required
for the process. Obviously, this result is easily demonstrated by DSC (67).
Also, Scanning Electron Microscopy (SEM) is used to elucidate the nanocomposites
structure that works by focusing a beam of intense energy electrons on the surface of
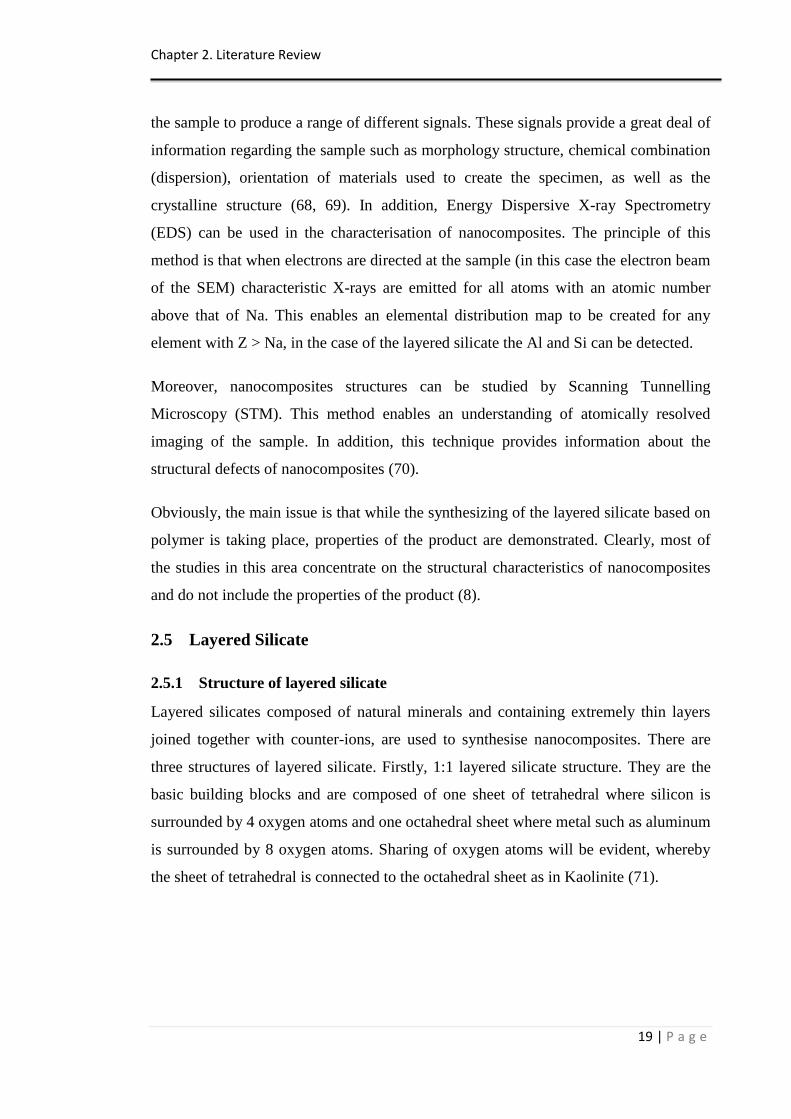
Chapter 2. Literature Review
19 | P a g e
the sample to produce a range of different signals. These signals provide a great deal of
information regarding the sample such as morphology structure, chemical combination
(dispersion), orientation of materials used to create the specimen, as well as the
crystalline structure (68, 69). In addition, Energy Dispersive X-ray Spectrometry
(EDS) can be used in the characterisation of nanocomposites. The principle of this
method is that when electrons are directed at the sample (in this case the electron beam
of the SEM) characteristic X-rays are emitted for all atoms with an atomic number
above that of Na. This enables an elemental distribution map to be created for any
element with Z > Na, in the case of the layered silicate the Al and Si can be detected.
Moreover, nanocomposites structures can be studied by Scanning Tunnelling
Microscopy (STM). This method enables an understanding of atomically resolved
imaging of the sample. In addition, this technique provides information about the
structural defects of nanocomposites (70).
Obviously, the main issue is that while the synthesizing of the layered silicate based on
polymer is taking place, properties of the product are demonstrated. Clearly, most of
the studies in this area concentrate on the structural characteristics of nanocomposites
and do not include the properties of the product (8).
2.5 Layered Silicate
2.5.1 Structure of layered silicate
Layered silicates composed of natural minerals and containing extremely thin layers
joined together with counter-ions, are used to synthesise nanocomposites. There are
three structures of layered silicate. Firstly, 1:1 layered silicate structure. They are the
basic building blocks and are composed of one sheet of tetrahedral where silicon is
surrounded by 4 oxygen atoms and one octahedral sheet where metal such as aluminum
is surrounded by 8 oxygen atoms. Sharing of oxygen atoms will be evident, whereby
the sheet of tetrahedral is connected to the octahedral sheet as in Kaolinite (71).
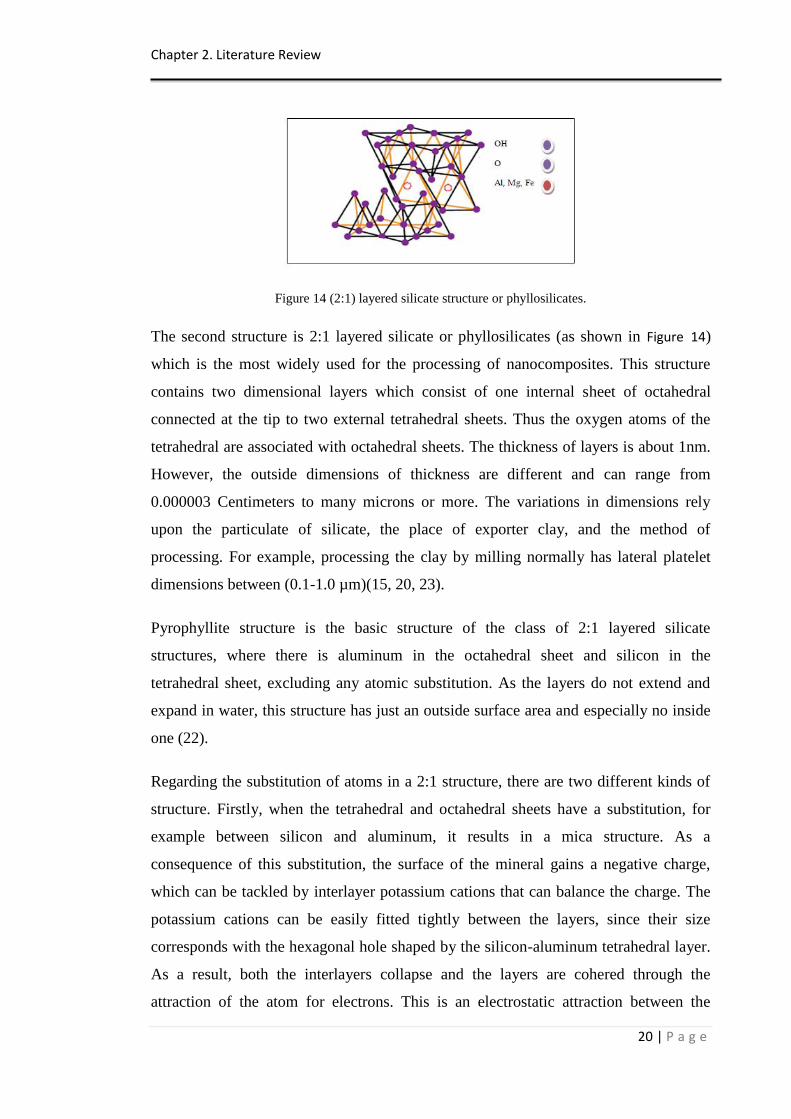
Chapter 2. Literature Review
20 | P a g e
Figure 14 (2:1) layered silicate structure or phyllosilicates.
The second structure is 2:1 layered silicate or phyllosilicates (as shown in Figure 14)
which is the most widely used for the processing of nanocomposites. This structure
contains two dimensional layers which consist of one internal sheet of octahedral
connected at the tip to two external tetrahedral sheets. Thus the oxygen atoms of the
tetrahedral are associated with octahedral sheets. The thickness of layers is about 1nm.
However, the outside dimensions of thickness are different and can range from
0.000003 Centimeters to many microns or more. The variations in dimensions rely
upon the particulate of silicate, the place of exporter clay, and the method of
processing. For example, processing the clay by milling normally has lateral platelet
dimensions between (0.1-1.0 µm)(15, 20, 23).
Pyrophyllite structure is the basic structure of the class of 2:1 layered silicate
structures, where there is aluminum in the octahedral sheet and silicon in the
tetrahedral sheet, excluding any atomic substitution. As the layers do not extend and
expand in water, this structure has just an outside surface area and especially no inside
one (22).
Regarding the substitution of atoms in a 2:1 structure, there are two different kinds of
structure. Firstly, when the tetrahedral and octahedral sheets have a substitution, for
example between silicon and aluminum, it results in a mica structure. As a
consequence of this substitution, the surface of the mineral gains a negative charge,
which can be tackled by interlayer potassium cations that can balance the charge. The
potassium cations can be easily fitted tightly between the layers, since their size
corresponds with the hexagonal hole shaped by the silicon-aluminum tetrahedral layer.
As a result, both the interlayers collapse and the layers are cohered through the
attraction of the atom for electrons. This is an electrostatic attraction between the
Chapter 2. Literature Review
21 | P a g e
potassium cations and the tetrahedral that has negative charge. As a consequence, the
structure of mica does not swell in water and, furthermore, does not have an internal
surface area similar to pyrophyllite (72). Secondly, montmorillonite structure can be
observed, where a trivalent aluminium cation in the original pyrophyllite structure in
the octahedral sheet is not wholly substituted by the divalent magnesium cation.
Montmorillonite is the most recognisable member of the collection of clay minerals
known as smectites. Generally, this structure has a negative charge that can be
stabilised by the ions of sodium and calcium which exhibit a hydrated inside layer
(73). As a result of this structure, there is a specific characteristic where these ions of
sodium and calcium do not fit in the tetrahedral sheet, as in the previous structure
(mica), and the layers are adhered together by a low force, so that the polar molecules
and water have a chance to access between the unit layers, which leads to expansion of
the lattice (22).
Besides Montmorillonite ((OH)4 Si8 Al4 O20·nH2O.), there are other layered silicates, such
as Hectorite (Na0.33(Mg 2.67 Li0.33)Si4O10(OH)2) and Saponite (Ca0.1 Na0.1 Mg2.25 Fe2+
0.75 Si3
AlO10 (OH)2•4(H2O)), which are the most widely used in nanocomposites materials.
The third structure is the 2:2 layered silicate system. Also, it is defined as tetramorphic
of four layer minerals; this is produced by the alternative of condensation of silica
tetrahedral sheet and alumina or magnesium octahedral sheet. An example of this kind
of structure is Chlorite (74).
2.5.2 Organic modification of layered silicates (OMLS)
Neat state layered silicates are only able to be combined with hydrophilic polymers
such as polyvinyl alcohol (46) and polyethylene oxide (75). In a non-mixable system,
there is less interaction between the layered silicate (organic) and the polymer
(inorganic) which leads to unsatisfactory properties such as mechanical or thermal.
However, the dispersion at nanometer scale can occur when a high interaction between
them is observed. As a result, nanocomposites provide exceptional properties that
cannot be compared with micro or conventional composites (16, 21, 29, 76). Thus, in
order to allow the layered silicates to combine with other polymers, the typical
hydrophilic silicate surface must be transferred to an organophilic surface. As such,
this can help to intercalate the layered silicates with several polymers. Normally, this
Chapter 2. Literature Review
22 | P a g e
can be achieved by chemical reaction where ion-exchange of Na+,Ca
2+, or K
+ (77)
reacts with cationic organic surfactants. There are many ions that can be used such as
sulfonium and phosphonium. However, the most widely utilised ions in the exchanging
are Alkylammonium ions (16, 20, 67, 73). Due to the need to achieve an exchange of
the cations with the onium ions in the interlayers, the silicate needs to be expanded by
water. Thus Alkali cations are the most common and preferred in the formation of
interlayers. The reason for that is 2-valent and higher-valent cations stop the layers
from swelling by water. In fact, the hydrate structure of mono-valent intergallery
cations is the motivating influence for water swelling. There is also the possibility of
the natural clay to include divalent cations such as Calcium, which need exchange
processes with Sodium before the ion-exchange with onium salts (67). The Alkali
cations are called „exchangeable cations‟. Due to their composition, they are more
easily substituted by different positively-charged atoms or molecules (see Figure 15)
(78).
Figure 15 The intercalation of alkali ions between the clay layers.
The operation of exchanging ions, for example Alkylammonium in the organosilicates,
can lower the energy of the surface of the inorganic host and provide more hydrating
properties with a polymer matrix (21, 79). In addition, an increase in the interlayers‟
height can be observed when the long organic chains of surfactants (which have a
positive charge) are connected to the surface of the negative charge of the silicate
layers (24). Usually the modification results in enhancing the d-spacing over 2 nm (20).
As a result, it is possible for the polymers to be spread between the layers (as shown in
Figure 16) (8, 16, 78, 80).
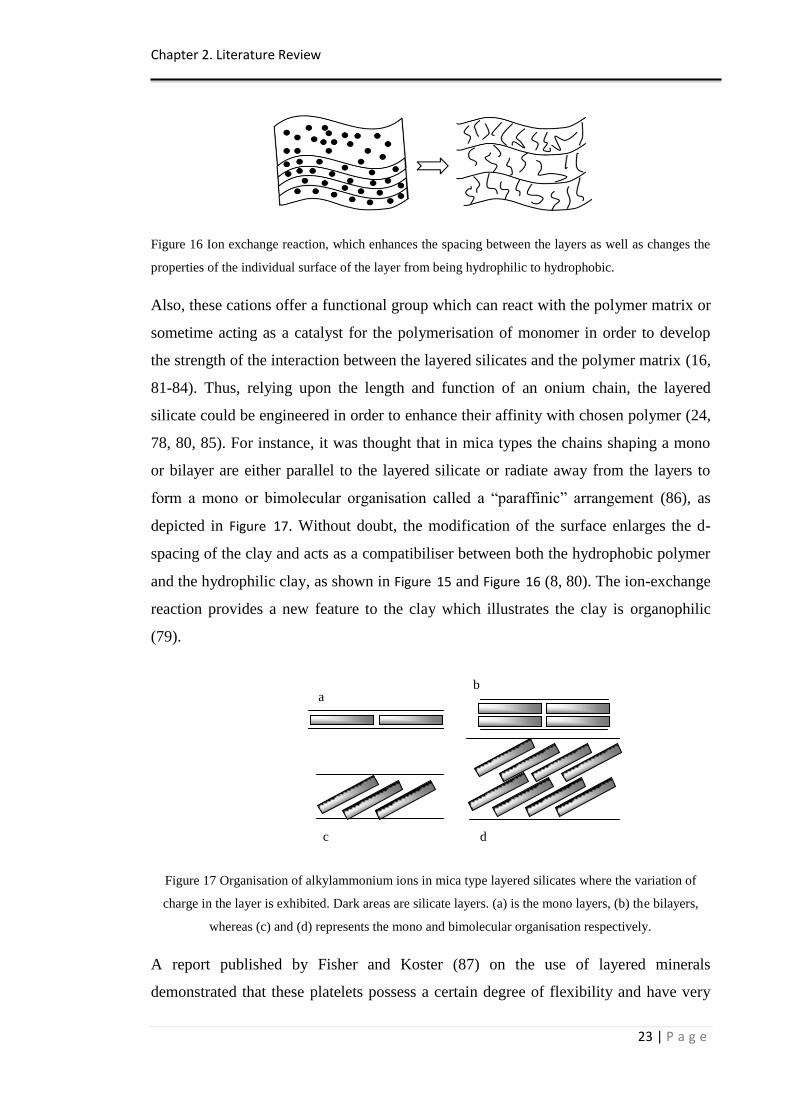
Chapter 2. Literature Review
23 | P a g e
Figure 16 Ion exchange reaction, which enhances the spacing between the layers as well as changes the
properties of the individual surface of the layer from being hydrophilic to hydrophobic.
Also, these cations offer a functional group which can react with the polymer matrix or
sometime acting as a catalyst for the polymerisation of monomer in order to develop
the strength of the interaction between the layered silicates and the polymer matrix (16,
81-84). Thus, relying upon the length and function of an onium chain, the layered
silicate could be engineered in order to enhance their affinity with chosen polymer (24,
78, 80, 85). For instance, it was thought that in mica types the chains shaping a mono
or bilayer are either parallel to the layered silicate or radiate away from the layers to
form a mono or bimolecular organisation called a “paraffinic” arrangement (86), as
depicted in Figure 17. Without doubt, the modification of the surface enlarges the d-
spacing of the clay and acts as a compatibiliser between both the hydrophobic polymer
and the hydrophilic clay, as shown in Figure 15 and Figure 16 (8, 80). The ion-exchange
reaction provides a new feature to the clay which illustrates the clay is organophilic
(79).
Figure 17 Organisation of alkylammonium ions in mica type layered silicates where the variation of
charge in the layer is exhibited. Dark areas are silicate layers. (a) is the mono layers, (b) the bilayers,
whereas (c) and (d) represents the mono and bimolecular organisation respectively.
A report published by Fisher and Koster (87) on the use of layered minerals
demonstrated that these platelets possess a certain degree of flexibility and have very
b a
c d
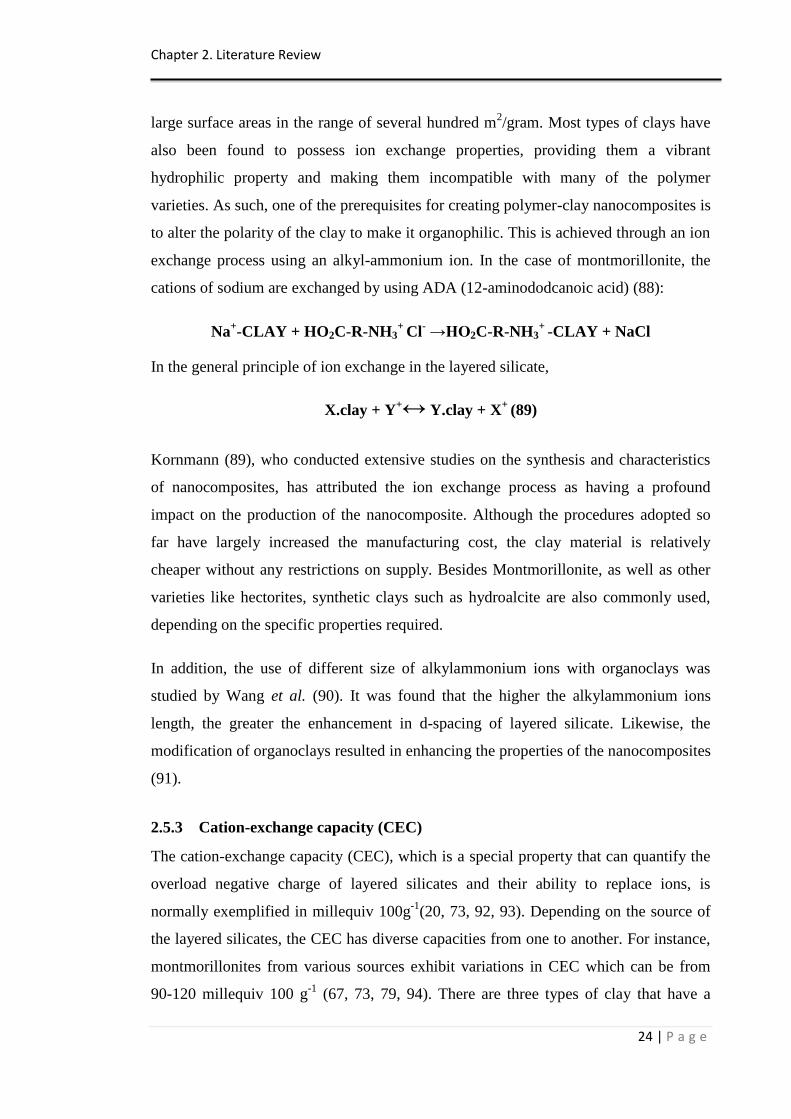
Chapter 2. Literature Review
24 | P a g e
large surface areas in the range of several hundred m2/gram. Most types of clays have
also been found to possess ion exchange properties, providing them a vibrant
hydrophilic property and making them incompatible with many of the polymer
varieties. As such, one of the prerequisites for creating polymer-clay nanocomposites is
to alter the polarity of the clay to make it organophilic. This is achieved through an ion
exchange process using an alkyl-ammonium ion. In the case of montmorillonite, the
cations of sodium are exchanged by using ADA (12-aminododcanoic acid) (88):
Na+-CLAY + HO2C-R-NH3
+ Cl
- →HO2C-R-NH3
+ -CLAY + NaCl
In the general principle of ion exchange in the layered silicate,
X.clay + Y+↔ Y.clay + X
+ (89)
Kornmann (89), who conducted extensive studies on the synthesis and characteristics
of nanocomposites, has attributed the ion exchange process as having a profound
impact on the production of the nanocomposite. Although the procedures adopted so
far have largely increased the manufacturing cost, the clay material is relatively
cheaper without any restrictions on supply. Besides Montmorillonite, as well as other
varieties like hectorites, synthetic clays such as hydroalcite are also commonly used,
depending on the specific properties required.
In addition, the use of different size of alkylammonium ions with organoclays was
studied by Wang et al. (90). It was found that the higher the alkylammonium ions
length, the greater the enhancement in d-spacing of layered silicate. Likewise, the
modification of organoclays resulted in enhancing the properties of the nanocomposites
(91).
2.5.3 Cation-exchange capacity (CEC)
The cation-exchange capacity (CEC), which is a special property that can quantify the
overload negative charge of layered silicates and their ability to replace ions, is
normally exemplified in millequiv 100g-1
(20, 73, 92, 93). Depending on the source of
the layered silicates, the CEC has diverse capacities from one to another. For instance,
montmorillonites from various sources exhibit variations in CEC which can be from
90-120 millequiv 100 g-1
(67, 73, 79, 94). There are three types of clay that have a
Chapter 2. Literature Review
25 | P a g e
large divergence in the CEC. Smectites, for example, contain a substantial amount of
CEC, approximately equal to 80-100 millequiv 100 g-1
. Illites have 15-40 millequiv
100 g-1
and kaolinites have the lowest amount of CEC at 3-15 millequiv 100 g-1
. Even
in the same kind of layered silicate, the CEC varies from one layer to another and is not
fixed (8, 16, 20). By and large, calculating the amount of clay CEC can be done by
establishing the difference in the loss on ignition between modified and unmodified
clays. A further calculation can be made of the variance between them in terms of the
molecular weight of Alkylammonium ions, where the amount of the organic substance
milliequivalents has been maintained by the clay. Once this has been computed, the
result of the CEC will be arrived at. In other words, the total of Alkylammonium ions
kept by organoclays is calculated. In addition, the CEC can be established via chemical
examinations of the clay (8).
2.5.4 Layered silicate summary
Taking everything into account, there are two specific characteristics of layered
silicates used in the field of polymers based on layered silicate nanocomposites. First
of all is the ability to disperse the silicate particles into single layers. Therefore, the full
distribution of single layers can lead to as high an aspect ratio as 1000. Conversely, the
weak distribution of particles can affect the ratio which may be as low as 10. Secondly,
there is the possibility of finding the perfect choice for the treatment of the surface of
layered silicate by the ion exchange reaction. The chemical composition of the material
is important as the clay sheets contain a charge along the surface as well as the edges,
with counter-ions present in the inter-layer spacing which balances this charge (10).
These two characteristics are related since the degree of distribution relies on the
gallery cation (15).
2.6 Nanocomposite polymers
There are many types of polymers that have been used with the layered silicate during
the nanocomposites preparation (16, 95). These polymers can be classified as follows.
2.6.1 Vinyl polymers.
These polymers have the addition of vinyl polymers which derive from popular
monomers, such as methyl methacrylate copolymers (96-98), acrylic acid (99, 100),
Chapter 2. Literature Review
26 | P a g e
acrylonitrile (101, 102), styrene (91, 103-106), acrylamide (107, 108), 4-vinylpyridine
(109, 110), tetrafluoro ethylene and poly (N-isopropylacrylamide) (16). Likewise,
many polymers have been used, such as PVA (111, 112), poly(N-vinyl pyrrolidone)
(113, 114), poly(vinyl pyrrolidinone) (115, 116) , poly(ethylene glycol) (117),
poly(vinylidene fluoride) (118, 119), poly(p-phenylenevinylene) (120, 121),
polybenzoxazole (122, 123), poly(styrene-co-acrylonitrile) (124-126), ethyl vinyl
alcohol copolymer (127), and polystyrene–polyisoprene diblock copolymer (128-130).
2.6.2 Condensation (step) polymers
There are many polycondensates that have been used in the preparation of
nanocomposites with layered silicate: nylon 6 (20, 131, 132), poly(caprolactone) (PCL)
(133-137), poly(ethylene terephthalate) (138-143), poly(trimethylene terephthalate)
(144-146), poly(butylene terephthalate) (26, 147, 148), polycarbonate (PC) (149, 150),
polyethylene oxide (75, 151-153), ethylene oxide copolymers (87), poly(ethylene
imine) (154), poly(dimethyl siloxane) (155-159), polybutadiene (160), butadiene
copolymers (161-163), epoxidized natural rubber (164, 165), epoxy polymer resins
(166-168), phenolic resins (169, 170), polyurethanes (PU) (171, 172), polyurethane
urea (173, 174), polyimides (175-178), poly(amic acid) (179, 180), polysulfone (181,
182) , polyetherimide (85, 183), and fluoropoly( ether-imide) (184, 185).
2.6.3 Polyolefins
There are many examples of Polyolefins polymers which have been used in the
preparation of nanocomposites along with layered silicate. For instance, polypropylene
(186, 187), polyethylene (188-190), polyethylene oligomers (191), copolymers such as
poly(ethylene-covinyl acetate) (EVA) (192-194), ethylene propylene diene methylene
(EPDM) (195, 196) and poly1-butene (197, 198).
2.6.4 Biodegradable polymers
Polylactide (199-202), polyhydroxy butyrate (203-206), unsaturated polyester (207,
208), aliphatic polyester (209-211), and poly(butylene succinate) (PBS) (200, 212,
213) are the biodegradable polymers.
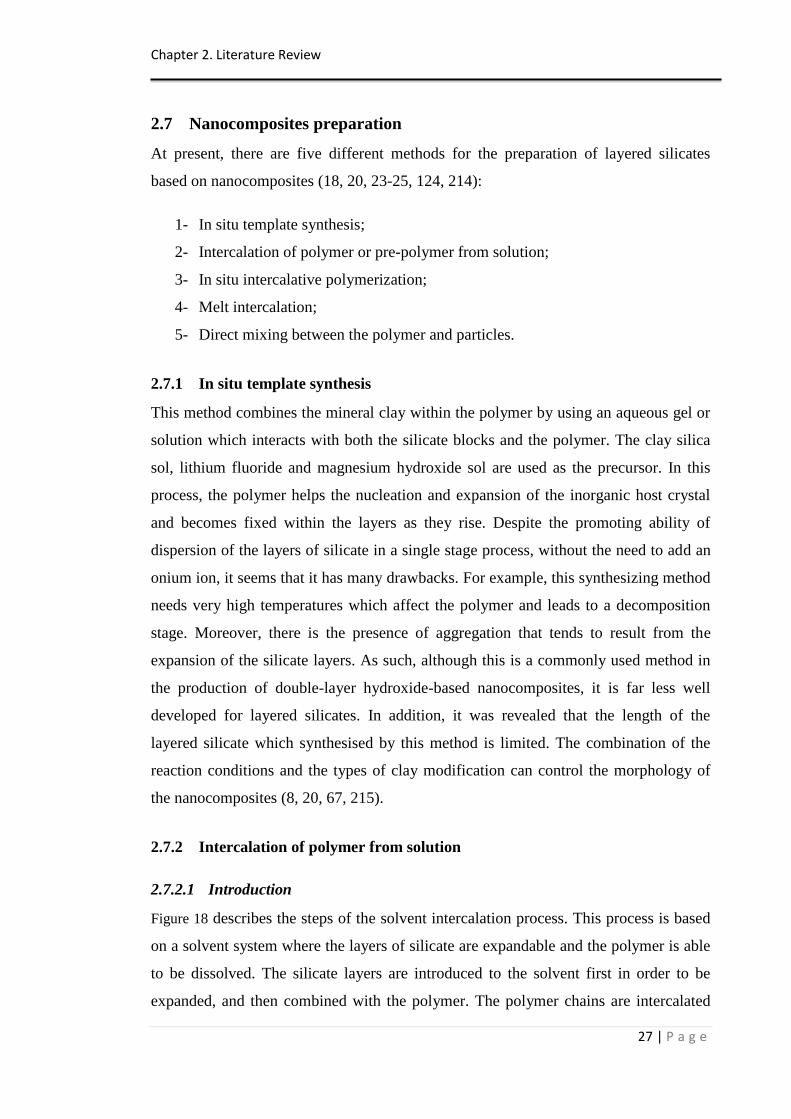
Chapter 2. Literature Review
27 | P a g e
2.7 Nanocomposites preparation
At present, there are five different methods for the preparation of layered silicates
based on nanocomposites (18, 20, 23-25, 124, 214):
1- In situ template synthesis;
2- Intercalation of polymer or pre-polymer from solution;
3- In situ intercalative polymerization;
4- Melt intercalation;
5- Direct mixing between the polymer and particles.
2.7.1 In situ template synthesis
This method combines the mineral clay within the polymer by using an aqueous gel or
solution which interacts with both the silicate blocks and the polymer. The clay silica
sol, lithium fluoride and magnesium hydroxide sol are used as the precursor. In this
process, the polymer helps the nucleation and expansion of the inorganic host crystal
and becomes fixed within the layers as they rise. Despite the promoting ability of
dispersion of the layers of silicate in a single stage process, without the need to add an
onium ion, it seems that it has many drawbacks. For example, this synthesizing method
needs very high temperatures which affect the polymer and leads to a decomposition
stage. Moreover, there is the presence of aggregation that tends to result from the
expansion of the silicate layers. As such, although this is a commonly used method in
the production of double-layer hydroxide-based nanocomposites, it is far less well
developed for layered silicates. In addition, it was revealed that the length of the
layered silicate which synthesised by this method is limited. The combination of the
reaction conditions and the types of clay modification can control the morphology of
the nanocomposites (8, 20, 67, 215).
2.7.2 Intercalation of polymer from solution
2.7.2.1 Introduction
Figure 18 describes the steps of the solvent intercalation process. This process is based
on a solvent system where the layers of silicate are expandable and the polymer is able
to be dissolved. The silicate layers are introduced to the solvent first in order to be
expanded, and then combined with the polymer. The polymer chains are intercalated
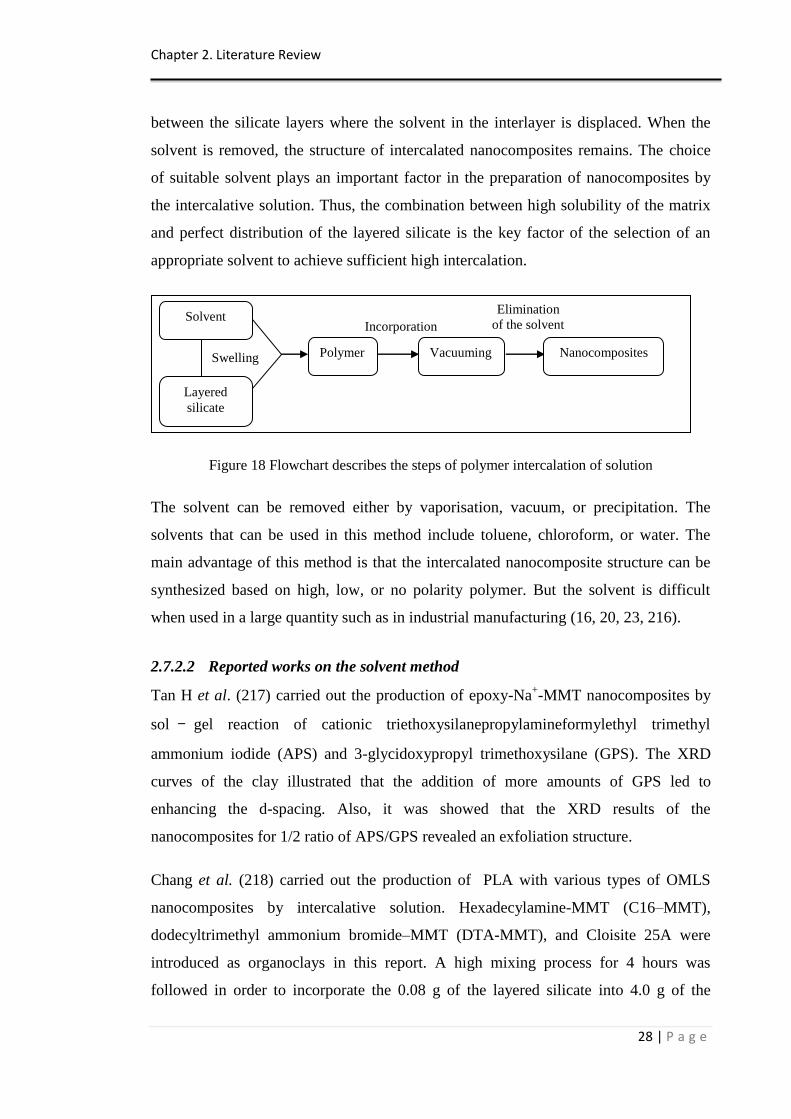
Chapter 2. Literature Review
28 | P a g e
between the silicate layers where the solvent in the interlayer is displaced. When the
solvent is removed, the structure of intercalated nanocomposites remains. The choice
of suitable solvent plays an important factor in the preparation of nanocomposites by
the intercalative solution. Thus, the combination between high solubility of the matrix
and perfect distribution of the layered silicate is the key factor of the selection of an
appropriate solvent to achieve sufficient high intercalation.
Figure 18 Flowchart describes the steps of polymer intercalation of solution
The solvent can be removed either by vaporisation, vacuum, or precipitation. The
solvents that can be used in this method include toluene, chloroform, or water. The
main advantage of this method is that the intercalated nanocomposite structure can be
synthesized based on high, low, or no polarity polymer. But the solvent is difficult
when used in a large quantity such as in industrial manufacturing (16, 20, 23, 216).
2.7.2.2 Reported works on the solvent method
Tan H et al. (217) carried out the production of epoxy-Na+-MMT nanocomposites by
sol – gel reaction of cationic triethoxysilanepropylamineformylethyl trimethyl
ammonium iodide (APS) and 3-glycidoxypropyl trimethoxysilane (GPS). The XRD
curves of the clay illustrated that the addition of more amounts of GPS led to
enhancing the d-spacing. Also, it was showed that the XRD results of the
nanocomposites for 1/2 ratio of APS/GPS revealed an exfoliation structure.
Chang et al. (218) carried out the production of PLA with various types of OMLS
nanocomposites by intercalative solution. Hexadecylamine-MMT (C16–MMT),
dodecyltrimethyl ammonium bromide–MMT (DTA-MMT), and Cloisite 25A were
introduced as organoclays in this report. A high mixing process for 4 hours was
followed in order to incorporate the 0.08 g of the layered silicate into 4.0 g of the
Elimination
of the solvent
Swelling
Solvent
Layered
silicate
Incorporation
Polymer
Nanocomposites
Vacuuming
Chapter 2. Literature Review
29 | P a g e
matrix solution in the presence of the N,N,-Dimethylacetamide solution. The mixture
was casted and the elimination of the solution took place. This method resulted in an
intercalation nanocomposites structure of all the organoclays. The XRD presented an
increase in the basal distance of nanocomposites samples compared to the pristine clay.
The improvements in the interlayer were 6%, 60%, 33% of C16–MMT, DTA–MMT,
and Cloisite 25A respectively. Also, it was found that the organic modification of
layered silicate led to enhancing the basal distance which indicated more compatibility
with the polymer matrix.
Moreover, Poly(L-lactic acid)/layered silicate nanocomposites was successfully
prepared by cast solution in the presence of dichloromethane solution. Three different
clays were used which were Cloisite 15A, 25A, and 30B and their amounts were at
2.5,10, and15 wt.%. The XRD examined the level of the intercalation between the
layered silicate and the polymer. Pristine Cloisite 15A revealed 32.36 Å and the
intercalation of nanocomposites represented an increase in the basal distance which
was 38.08 Å. The authors reported that the nanocomposites structure was intercalated
in most areas of the sample. In the case of Cloisite 25A, the virgin clay reflected 20.04
Å and the incorporation of the polymer resulted in higher increment which was about
36.03 Å which was attributed to the partial dispersion of parallel layers of the clay
which exhibited an exfoliation system. Thus, a combination between intercalated and
exfoliated nanocomposites structure was obtained. The last clay, which was Cloisite
30B, exhibited 18.26 Å and the addition of polymer showed no reflection on the XRD
result which indicated an exfoliation structure was observed. It was revealed that the
key factor of dispersion is the enthalpic interaction between the polymer and clay. The
miscibility between the polymer and modifiers will help the layered silicate to be
exfoliated. Also, it was reported that the interaction of the C=O bonds located in the
PLA backbone in the Cloisite 30B modifier plays an important role in the level of
intercalation (219).
Choi et al. (220) produced PEO/MMT nanocomposites via a process of solvent casting,
where the chloroform acted as a cosolvent. The polymer was dissolved in the solvent
and then the layered silicate was incorporated into the solution at different loadings. A
nanocomposite intercalated structure had been obtained as confirmed by XRD. A
Chapter 2. Literature Review
30 | P a g e
similar process and solvent were also used by Hyun, Y (221) and Lim, S (222) in order
to prepare the nanocomposites.
In addition, polyurethane /Cloisite 30B nanocomposites were prepared by solution
casting. Two types of polymer were used which include soft (SPU) and hard (HPU)
segments. The layered silicate was mixed with toluene and then added to the mixture of
polymer and dimethyl acetamide in order to stir them strongly. XRD showed the basal
distance of virgin organoclays which was 1.85 nm. At 3 and 7 wt.% clay loading, the
nanocomposites of soft and hard segments reflected an increase in the basal distance
which were at 3.95 nm and 3.85 nm respectively. The authors revealed that the
increment in SPU was traced to the existence of higher amounts of entropy which
helped to increase the interlayer. Also, it was observed that the resulting
nanocomposites structure was in between intercalated and exfoliated systems. TEM
confirmed the outcomes of XRD (223).
A new complex method for preparing polypropylene matrix nanocomposites based on
layered silicate by solvent solution was carried out by Kurokawa and Oya (224). The
layered silicate that was introduced is the hydrophobic hectorite. It was dried at 60ºC
and then was dissolved in toluene solution (10 wt %) in order to end up in translucent
sol. Methyl trimethoxysilane (MTMS) was added to the mixture at 1/3 of the mixture
weight. A stirring for six hours at 110ºC was applied on the sol. The reason for this
stirring is to allow the clay to be treated via MTMS. The next step was the elimination
of toluene by a small amount of pressure. A further heating was applied at 180ºC on
the silane surface (chemical compound SiH4) of the modified clay for 1 hour to get rid
of any unreacted chemical structure on the layered silicate surface. The modified clay
was dissolved in toluene for a second time to result in a sol, stirred at 120ºC for 30
minutes with 20 wt.% of polypropylene. The mixture was cooled at 60ºC and then
stirred with methanol; the addition of methanol was in order to wash the clay and
eliminate the unreacted MTMS. The final outcome of MTMS-Clay/polypropylene was
drying and shaping in a mould. XRD results showed an increase in diffraction in
polypropylene nanocomposites over those of conventional clay. The outcome
properties of the nanocomposites are controlled by the stiffness of the layered silicate.
Chapter 2. Literature Review
31 | P a g e
The information can be confirmed via the enhancement in the modulus of three
bending tests of the final material (225).
The dispersion of the layered silicate into the cis-1,4-polybutadiene rubber by the
presence of the oil solution was undertaken by Gu Z et al. (226). The clay was mixed
with the oil solution and then the polymer was added. XRD showed an initial
indication about the nanocomposites morphology. The structure of the nanocomposite
revealed an intercalation structure at lower content; however the higher amount of clay
led to increase the 2 value and shifted toward a higher angle which indicated
agglomerated layers. XRD was not clear especially at low content which presented
poor peak resolution as well as overlapping of the diffraction pattern of the
nanocomposites structure. Thus the use of TEM was essential and to provide a clear
understanding of the structure. TEM of 3wt.% clay showed a mix of exfoliation and
intercalation structures. By the combination of two characterisations method, an
intercalation nanocomposites structure was obtained.
Herrera-Alonso, J. M et al. (227).carried out the production of polyurethane based on
Cloisite 10A, 20A, and 30B nanocomposites by the solution method. Different types
and amount of layered silicates were first dispersed in tetrahydrofuran (THF) solution.
The mixture was mixed for 8 hours and then the polymer was added to be mixed also
for 8 hours. Another process also was used utilising a sonicated device instead of
stirring. XRD was utilised to understand the nanocomposites morphology. Pristine C10
represented 4.7 ° which indicated 18.8 Å. The different amounts of nanocomposites
ranged from 2.4° - 2.6°. They were shifted toward lower angles indicating an
intercalation structure of nanocomposites. The result of the stirred and sonicated
mixture of C10A exhibited almost the same result of XRD. C20A presented the lowest
amount of improvement in d-spacing which was assigned to the presence of two tallow
groups within the layered silicate which shield the surface of layers and prevent the
penetration of polymer. C30B revealed almost the same finding of C10A. It was
suggested that the type of organo modification plays an important role in the dispersion
where C10A and 30B had only one tallow group present in the clay. TEM confirmed
the results from XRD and concluded that the sonicated process had a higher dispersion
than stirring.
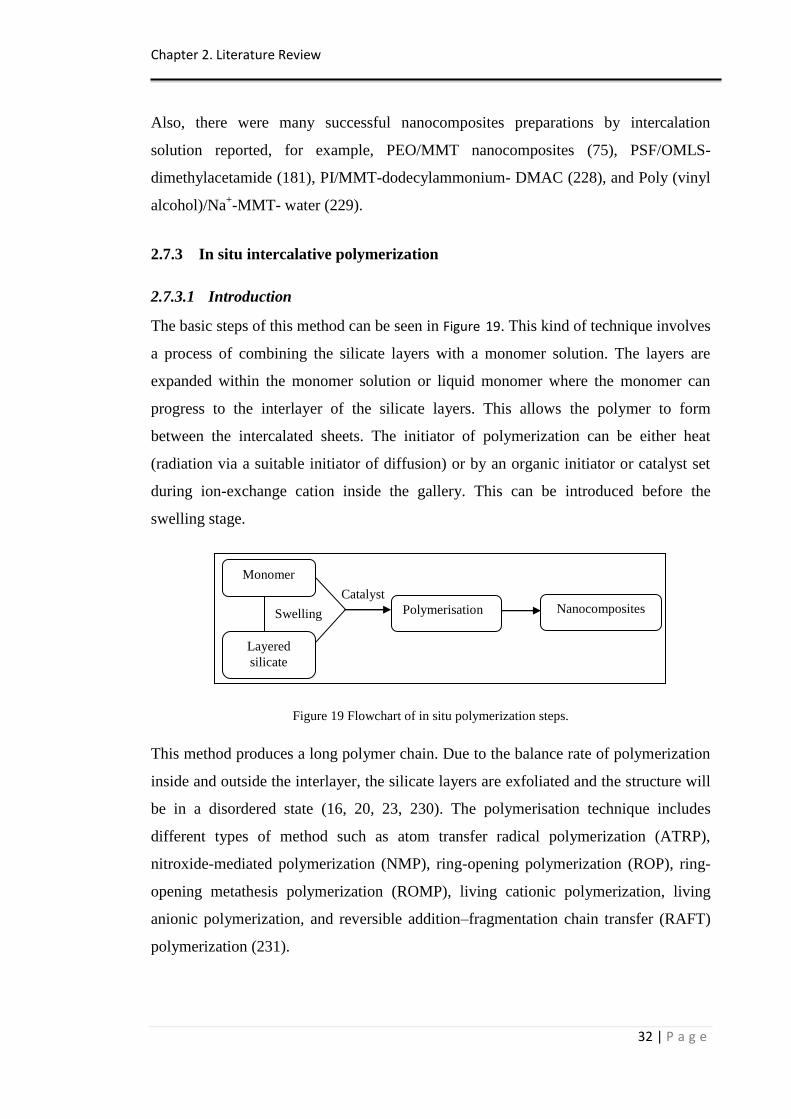
Chapter 2. Literature Review
32 | P a g e
Also, there were many successful nanocomposites preparations by intercalation
solution reported, for example, PEO/MMT nanocomposites (75), PSF/OMLS-
dimethylacetamide (181), PI/MMT-dodecylammonium- DMAC (228), and Poly (vinyl
alcohol)/Na+-MMT- water (229).
2.7.3 In situ intercalative polymerization
2.7.3.1 Introduction
The basic steps of this method can be seen in Figure 19. This kind of technique involves
a process of combining the silicate layers with a monomer solution. The layers are
expanded within the monomer solution or liquid monomer where the monomer can
progress to the interlayer of the silicate layers. This allows the polymer to form
between the intercalated sheets. The initiator of polymerization can be either heat
(radiation via a suitable initiator of diffusion) or by an organic initiator or catalyst set
during ion-exchange cation inside the gallery. This can be introduced before the
swelling stage.
Figure 19 Flowchart of in situ polymerization steps.
This method produces a long polymer chain. Due to the balance rate of polymerization
inside and outside the interlayer, the silicate layers are exfoliated and the structure will
be in a disordered state (16, 20, 23, 230). The polymerisation technique includes
different types of method such as atom transfer radical polymerization (ATRP),
nitroxide-mediated polymerization (NMP), ring-opening polymerization (ROP), ring-
opening metathesis polymerization (ROMP), living cationic polymerization, living
anionic polymerization, and reversible addition–fragmentation chain transfer (RAFT)
polymerization (231).
Swelling
Monomer
Layered
silicate
Catalyst
Polymerisation
Nanocomposites
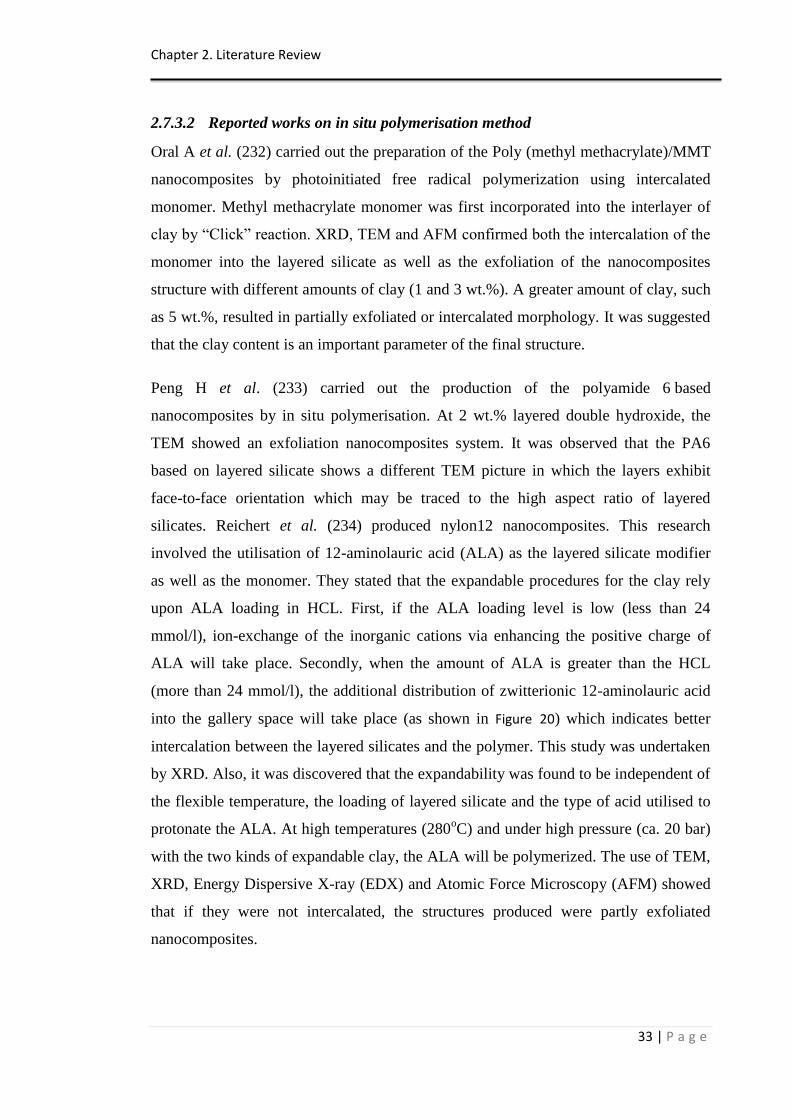
Chapter 2. Literature Review
33 | P a g e
2.7.3.2 Reported works on in situ polymerisation method
Oral A et al. (232) carried out the preparation of the Poly (methyl methacrylate)/MMT
nanocomposites by photoinitiated free radical polymerization using intercalated
monomer. Methyl methacrylate monomer was first incorporated into the interlayer of
clay by “Click” reaction. XRD, TEM and AFM confirmed both the intercalation of the
monomer into the layered silicate as well as the exfoliation of the nanocomposites
structure with different amounts of clay (1 and 3 wt.%). A greater amount of clay, such
as 5 wt.%, resulted in partially exfoliated or intercalated morphology. It was suggested
that the clay content is an important parameter of the final structure.
Peng H et al. (233) carried out the production of the polyamide 6 based
nanocomposites by in situ polymerisation. At 2 wt.% layered double hydroxide, the
TEM showed an exfoliation nanocomposites system. It was observed that the PA6
based on layered silicate shows a different TEM picture in which the layers exhibit
face-to-face orientation which may be traced to the high aspect ratio of layered
silicates. Reichert et al. (234) produced nylon12 nanocomposites. This research
involved the utilisation of 12-aminolauric acid (ALA) as the layered silicate modifier
as well as the monomer. They stated that the expandable procedures for the clay rely
upon ALA loading in HCL. First, if the ALA loading level is low (less than 24
mmol/l), ion-exchange of the inorganic cations via enhancing the positive charge of
ALA will take place. Secondly, when the amount of ALA is greater than the HCL
(more than 24 mmol/l), the additional distribution of zwitterionic 12-aminolauric acid
into the gallery space will take place (as shown in Figure 20) which indicates better
intercalation between the layered silicates and the polymer. This study was undertaken
by XRD. Also, it was discovered that the expandability was found to be independent of
the flexible temperature, the loading of layered silicate and the type of acid utilised to
protonate the ALA. At high temperatures (280oC) and under high pressure (ca. 20 bar)
with the two kinds of expandable clay, the ALA will be polymerized. The use of TEM,
XRD, Energy Dispersive X-ray (EDX) and Atomic Force Microscopy (AFM) showed
that if they were not intercalated, the structures produced were partly exfoliated
nanocomposites.
Chapter 2. Literature Review
34 | P a g e
Figure 20 Interlayer distance of fluoro-modified talc (ME 100) in function of an increasing amount of
aminolauric acid used as the organic modifier (233). Reproduced from Reichert by permission of
Copyright Wiley-VCH Verlag GmbH & Co. KGaA.
PMMA/clay nanocomposites were successfully prepared via ultrasound assisted
emulsifier-free emulsion polymerization method by Patra et al. (235). The XRD
represented an exfoliation and intercalation structure of nanocomposites which were
depending on the way of preparation. The use of the ultrasound helped to improve the
dispersion level. At 3% clay loading, the preparation of the nanocomposites with the
presence of the ultrasound represented no peak in XRD which indicated an exfoliated
structure whereas the disabling of ultrasound represented a peak at lower angle which
referred to the intercalated/exfoliated structure.
Greesh N et al. (236) undertook the study of the impact of Na-MMT on the
Poly(styrene-co-butyl acrylate) copolymers synthesised by Free-Radical
Polymerization in Emulsion. It was revealed that the output result provided an
intercalation structure. The reason for not achieving an exfoliation structure was
assigned to the presence of the organic modifier (sodium 1-allyloxy-2-hydroxypropyl
(Cops)) which acted as a hydrophilicity element. Also, the polymerisation group of
Cops had less reactivity on the monomer. As a result, these factors restricted the
entering of the monomers into the clay galleries.
Wu F and Yang G (237) revealed the study of poly(butylene terephthalate) based on
Na+-MMT nanocomposites prepared by in-situ bulk polymerization. Different layered
silicate concentrations were used (2-4-6 wt.%). At 4 and 6 wt.% layered silicate, the
XRD did not show any peak from 2° to 10° which indicated intercalated structures
Chapter 2. Literature Review
35 | P a g e
were obtained. In order to confirm these observations, TEM was utilised. It was proved
that the resulting structure of 4 and 6 wt.% were intercalated-exfoliated structures
although it had some face-to-face agglomerated layered silicate. The aggregation part
was ascribed to the time before polymerisation as the layered silicates had the time to
aggregate before starting the reaction. Tasdelen A.M (238) carried out the preparation
of Poly(epsilon-caprolactone)/ Azide-MMT nanocomposites by copper (I) catalyzed
azide/alkyne cycloaddition (CuAAC) “click” reaction. The samples were examined by
XRD and TEM and both results showed an intercalation-exfoliation nanocomposites
structure.
In addition, a highly advanced new preparation system to produce large performance
polypropylene layered silicate nanocomposites (PPCN) via in-situ polymerization
under a mild situation was taken by Sun and Garces (239). This experiment improved
the processability, mechanical work and reacted efficiency compared with the
preceding approach. In this new study, there was no need for an external initiator for
the starting of the polymer polymerization such as methylaluminoxane or
perfluoroarylborates as well as the high temperature and pressure procedure conditions
which were not needed. The modified layered silicate was made by ion-exchange
reaction with amine combination as this can enable the activation of the polymerization
catalyst of metallocene olefin monomer. The organically treated layered silicate
powder is dipped in toluene which works as a solvent. The next step is to be mixed
with hydrolytic scavengers and a very large isotactic metallocene propylene
polymerization catalyst by mechanical stirring. The outcome composites are exposed to
a propylene gas stream at surrounding conditions at 25°C in order to produce PPCN. It
was observed that the clay loading is a major concern since the polymerization started
at a desirable loading. As a result, a stop-flow type of polymerization was utilised. The
ease of process, elimination of external reactors, high mechanical performance and the
effectiveness of the catalyst were to play an important role in making this approach
valuable for producing PPCN. Microscopic image and x-ray diffraction angle were
used to prove the changes in basal spacing of different concentrate layered silicate-
polymer nanocomposites within the polymerization procedures. XRD showed that the
use of the modified clay precursor had enhanced the d001-spacing compared to
untreated clay. The microscopic image was utilised to analyse the state of clay
Chapter 2. Literature Review
36 | P a g e
dispersion whether there was an intercalation or exfoliation structure in the PPCN.
Also, Polypropylene/MMT nanocomposite was successfully prepared by in situ
method. Slurry polymerization procedure was utilised to polymerise propylene in
hexane. The XRD was used to study the morphology of nanocomposites. Base clay
showed 1.15 nm and by the addition of 3 wt.% layered silicate into the polymer, the
XRD reflected no peak which indicated an exfoliation structure. For further
investigation and confirmation about the level of dispersion, TEM was introduced.
TEM confirmed the previous results by XRD and illustrated a well uniform distribution
(240).
Qin X et al. (241) reported a novel approach of the preparation of PUA based on 2-
benzyl-2dimethylamino-1-(4-morpholinphenyl) butanone (BDMB)/MMT. The
BDMB/MMT was used as the clay and the initiator. The resulting clay mixture
represented an increase in the basal distance which was about 34% compared to
unmodified clay as calculated by XRD. XRD and TEM revealed an exfoliation
nanocomposites structure was obtained by dispersion treated MMT into PUA matrix.
Oral A et al. (242) studied the result of the Poly(cyclohexene oxide)/ Cloisite 30B
nanocomposites that were prepared by in situ photoinitiated activated monomer
cationic polymerisation. XRD, DSC, AFM and TEM were introduced to evaluate the
output nanocomposites structure. The initial XRD results revealed an increment in the
basal spacing from 1.84 nm to 4.86 nm which indicated an exfoliation structure. The
onset degradation temperature of the nanocomposites was reduced compared to the
neat matrix which was attributed to the catalytic activity of the clay on the matrix
degradation process. TEM and AFM confirmed the previous results.
Katoch S and Kundu P.P (243) carried out the production of unsaturated polyester
based on MMT nanocomposites by in situ polymerisation. Poly(ethylene terephthalate)
waste bottles were glycolyzed as precursors of polyester matrix. Benzoyl per-oxide
was utilised as initiator and styrene monomer to reduce the viscosity of the resin. The
XRD and TEM illustrated exfoliated nanocomposites and stack layers at the same time.
Agag T et al. (244) undertook the preparation of vinyl ester resin (VER) pre-polymer
based on different types of o-MMT by mixing them together followed by thermal
polymerisation. Depending on the kind of the modification used, intercalated and
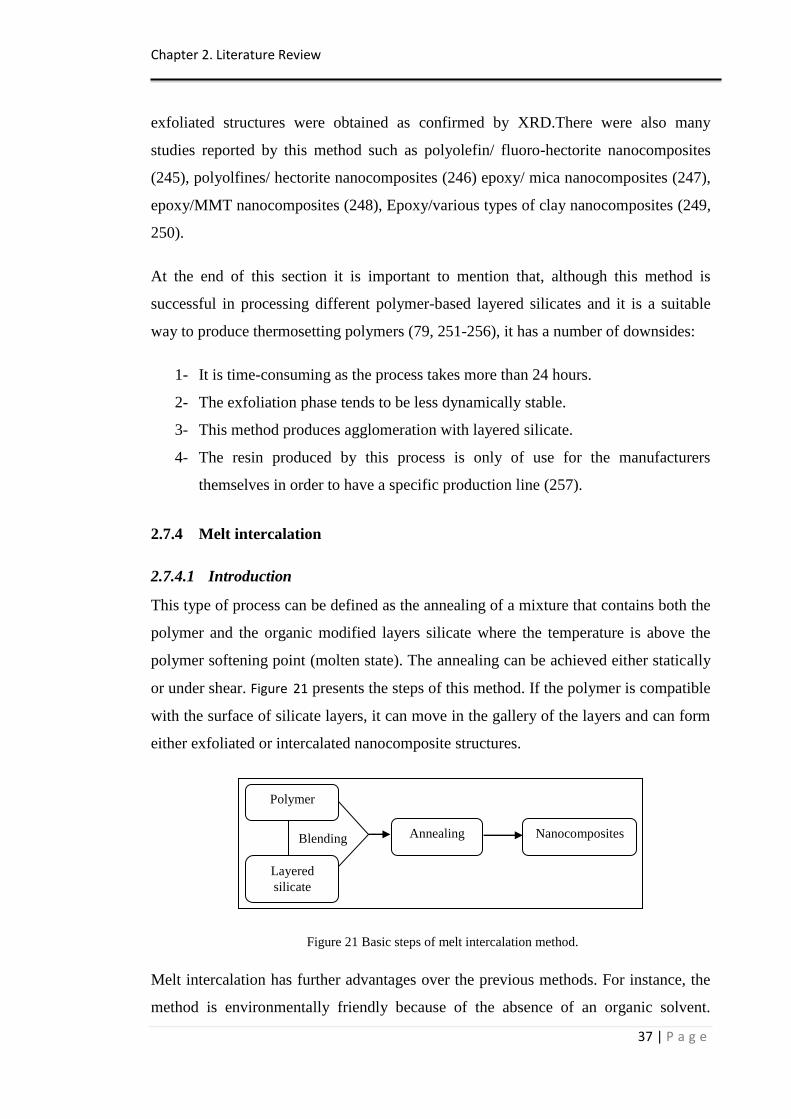
Chapter 2. Literature Review
37 | P a g e
exfoliated structures were obtained as confirmed by XRD.There were also many
studies reported by this method such as polyolefin/ fluoro-hectorite nanocomposites
(245), polyolfines/ hectorite nanocomposites (246) epoxy/ mica nanocomposites (247),
epoxy/MMT nanocomposites (248), Epoxy/various types of clay nanocomposites (249,
250).
At the end of this section it is important to mention that, although this method is
successful in processing different polymer-based layered silicates and it is a suitable
way to produce thermosetting polymers (79, 251-256), it has a number of downsides:
1- It is time-consuming as the process takes more than 24 hours.
2- The exfoliation phase tends to be less dynamically stable.
3- This method produces agglomeration with layered silicate.
4- The resin produced by this process is only of use for the manufacturers
themselves in order to have a specific production line (257).
2.7.4 Melt intercalation
2.7.4.1 Introduction
This type of process can be defined as the annealing of a mixture that contains both the
polymer and the organic modified layers silicate where the temperature is above the
polymer softening point (molten state). The annealing can be achieved either statically
or under shear. Figure 21 presents the steps of this method. If the polymer is compatible
with the surface of silicate layers, it can move in the gallery of the layers and can form
either exfoliated or intercalated nanocomposite structures.
Figure 21 Basic steps of melt intercalation method.
Melt intercalation has further advantages over the previous methods. For instance, the
method is environmentally friendly because of the absence of an organic solvent.
Blending
Polymer
Layered
silicate
Annealing
Nanocomposites
Chapter 2. Literature Review
38 | P a g e
Moreover, it is suitable for various manufacturing processes such as extrusion and
injection machining. Also, it can synthesise polymers that are not compatible with
other methods (8, 16, 20, 23, 230). The incorporation of the polymer via
polymerisation and solvent intercalation is limited because an appropriate monomer or
a special solvent that is compatible with the polymer and silicates is not always
obtainable. Also, the polymerisation and solvent methods are not always suited for all
polymer processes. At this point, it is worth mentioning that scientists dedicate their
time to tackling such downsides. This has ultimately resulted in the invention of the
melt intercalation method. This method is preferable in an environmental context to
other preparation techniques for nanocomposites based on layered silicates due to its
flexibility (21, 258). The melt intercalation method entails annealing the combination
of the polymer and clay and normally happens under shear. Also, this technique allows
the polymer to reach its softening point. Thus, throughout this process, the chains of
the polymer spread out between the silicate layers within the galleries. Straight
intercalation of the softened polymer into layered silicates is a novel process that does
not require any solvent. This approach can be achieved by heating the polymer over the
temperature of glass transition where the condition is static or running, and then
blending it with the layered silicate. The intercalation can be supported via the use of
treated layered silicate. The chain of polymer from the softened state is distributed in
between the interlayers of silicates to end up structuring intercalated or exfoliated
phases which depend on the level of diffusion. The main important aspect that plays a
major role in determining the outcome structure of nanocomposites is possibly
connected to the thermodynamics issues. In other words, the interplay of enthalpy and
entropy factors can help to know whether the resulting structure of the organically
treated layered silicate would be exfoliated, intercalated, or just dispersed within the
polymer matrix (62, 225, 259).
2.7.4.2 Reported works on the melt intercalation
Polypropylene/MMT nanocomposites were prepared by the melt intercalation method.
A twin-screw extruder was used to blend them and the mixture was moulded by an
injection moulding tool. The XRD was utilised to study the morphology of
nanocomposites. Base clay showed 1.15 nm and by the addition of 3 wt.% layered
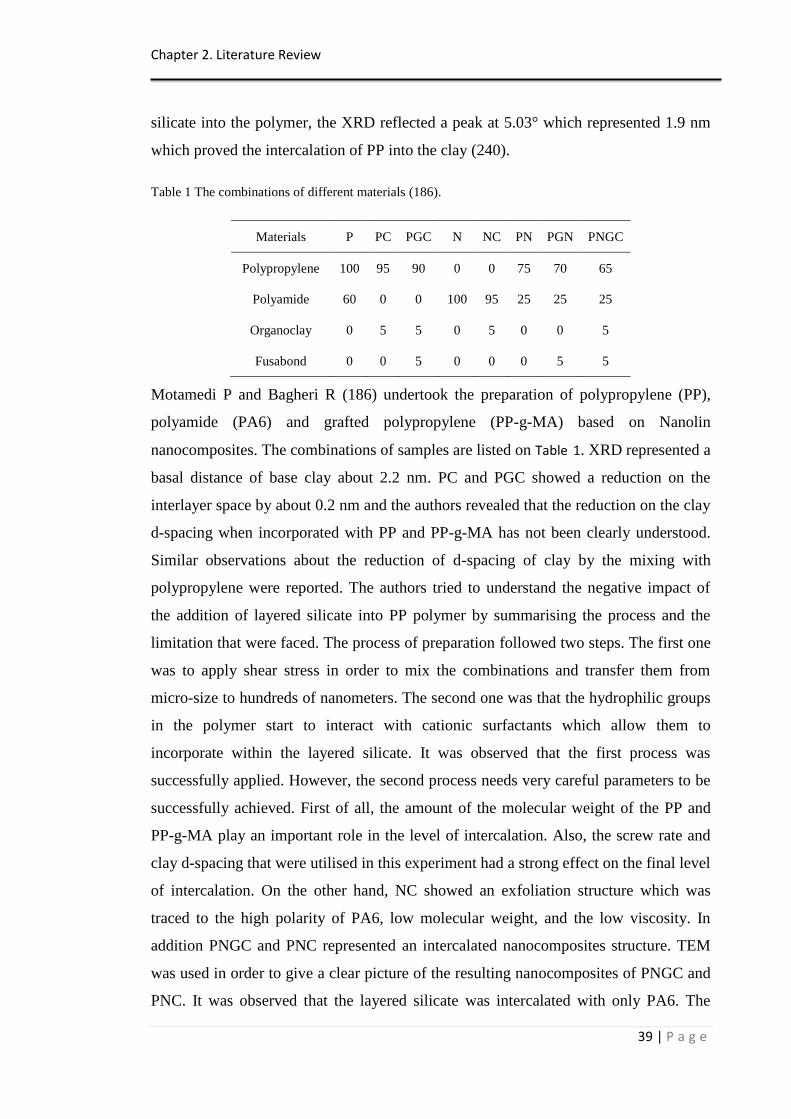
Chapter 2. Literature Review
39 | P a g e
silicate into the polymer, the XRD reflected a peak at 5.03° which represented 1.9 nm
which proved the intercalation of PP into the clay (240).
Table 1 The combinations of different materials (186).
Materials P PC PGC N NC PN PGN PNGC
Polypropylene 100 95 90 0 0 75 70 65
Polyamide 60 0 0 100 95 25 25 25
Organoclay 0 5 5 0 5 0 0 5
Fusabond 0 0 5 0 0 0 5 5
Motamedi P and Bagheri R (186) undertook the preparation of polypropylene (PP),
polyamide (PA6) and grafted polypropylene (PP-g-MA) based on Nanolin
nanocomposites. The combinations of samples are listed on Table 1. XRD represented a
basal distance of base clay about 2.2 nm. PC and PGC showed a reduction on the
interlayer space by about 0.2 nm and the authors revealed that the reduction on the clay
d-spacing when incorporated with PP and PP-g-MA has not been clearly understood.
Similar observations about the reduction of d-spacing of clay by the mixing with
polypropylene were reported. The authors tried to understand the negative impact of
the addition of layered silicate into PP polymer by summarising the process and the
limitation that were faced. The process of preparation followed two steps. The first one
was to apply shear stress in order to mix the combinations and transfer them from
micro-size to hundreds of nanometers. The second one was that the hydrophilic groups
in the polymer start to interact with cationic surfactants which allow them to
incorporate within the layered silicate. It was observed that the first process was
successfully applied. However, the second process needs very careful parameters to be
successfully achieved. First of all, the amount of the molecular weight of the PP and
PP-g-MA play an important role in the level of intercalation. Also, the screw rate and
clay d-spacing that were utilised in this experiment had a strong effect on the final level
of intercalation. On the other hand, NC showed an exfoliation structure which was
traced to the high polarity of PA6, low molecular weight, and the low viscosity. In
addition PNGC and PNC represented an intercalated nanocomposites structure. TEM
was used in order to give a clear picture of the resulting nanocomposites of PNGC and
PNC. It was observed that the layered silicate was intercalated with only PA6. The
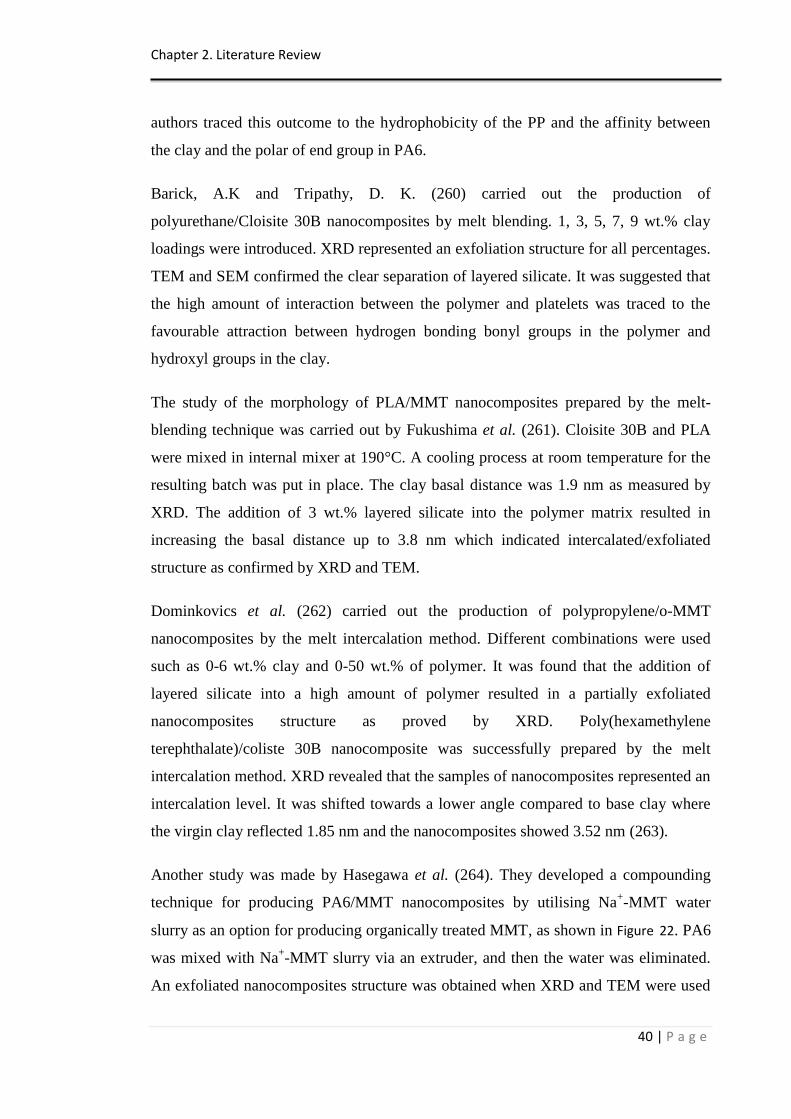
Chapter 2. Literature Review
40 | P a g e
authors traced this outcome to the hydrophobicity of the PP and the affinity between
the clay and the polar of end group in PA6.
Barick, A.K and Tripathy, D. K. (260) carried out the production of
polyurethane/Cloisite 30B nanocomposites by melt blending. 1, 3, 5, 7, 9 wt.% clay
loadings were introduced. XRD represented an exfoliation structure for all percentages.
TEM and SEM confirmed the clear separation of layered silicate. It was suggested that
the high amount of interaction between the polymer and platelets was traced to the
favourable attraction between hydrogen bonding bonyl groups in the polymer and
hydroxyl groups in the clay.
The study of the morphology of PLA/MMT nanocomposites prepared by the melt-
blending technique was carried out by Fukushima et al. (261). Cloisite 30B and PLA
were mixed in internal mixer at 190°C. A cooling process at room temperature for the
resulting batch was put in place. The clay basal distance was 1.9 nm as measured by
XRD. The addition of 3 wt.% layered silicate into the polymer matrix resulted in
increasing the basal distance up to 3.8 nm which indicated intercalated/exfoliated
structure as confirmed by XRD and TEM.
Dominkovics et al. (262) carried out the production of polypropylene/o-MMT
nanocomposites by the melt intercalation method. Different combinations were used
such as 0-6 wt.% clay and 0-50 wt.% of polymer. It was found that the addition of
layered silicate into a high amount of polymer resulted in a partially exfoliated
nanocomposites structure as proved by XRD. Poly(hexamethylene
terephthalate)/coliste 30B nanocomposite was successfully prepared by the melt
intercalation method. XRD revealed that the samples of nanocomposites represented an
intercalation level. It was shifted towards a lower angle compared to base clay where
the virgin clay reflected 1.85 nm and the nanocomposites showed 3.52 nm (263).
Another study was made by Hasegawa et al. (264). They developed a compounding
technique for producing PA6/MMT nanocomposites by utilising Na+-MMT water
slurry as an option for producing organically treated MMT, as shown in Figure 22. PA6
was mixed with Na+-MMT slurry via an extruder, and then the water was eliminated.
An exfoliated nanocomposites structure was obtained when XRD and TEM were used
Chapter 2. Literature Review
41 | P a g e
to identify the internal structure. On the other hand, the PA6/ Na+-MMT did not show
any intercalation structure in the dry-compounding as proved by XRD.
Figure 22 The distribution of Na+-MMT slurry into nylon6 during compounding: (a) pumping the clay
to the softened matrix with strong stirring, (b-c) the slurry shrinkage to minute drops throughout the
mixing, and the water of the clay being evaporated when it touches the PA6 melt, (d) the vacuum
applied in order to eliminate the water with silicate layers distributed into the PA6 which soften as one
layer or multi layers (264). Reproduced from Hasegawa by permission of Elsevier Science Ltd., UK.
A further study was carried out by Zheng et al. (265) who utilised oligomerically
treated clay in order to produce PS/clay nanocomposites. This clay was prepared using
an ion-exchange with an oligomer. The oligomer consisted mainly of maleic anhydride
(MA), styrene (ST) and vinylbenzyltrimethyl ammonium chloride (VBTACl)
terpolymer. Thus it was termed MAST. The MAST was then dissolved in a solvent
which was acetone and was applied drop by drop to a distribution of clay in acetone
and distilled water. After this, the powder of MAST was shaped. The XRD represented
a peak at 1.8° of MAST clay which means 4.9 nm. On the other hand, the PS based
MAST nanocomposites reflected no peak which resulted in either an exfoliation
structure or immiscible nanocomposites were obtained. The used of TEM was to
permit the understanding of the right morphology of the nanocomposites. From both
XRD and TEM, it can be observed that the resulting structures were a mix between
immiscible, intercalated and exfoliated nanocomposites. The immiscible structure was
Chapter 2. Literature Review
42 | P a g e
formed as a result from the lack of dispersed clay. Otherwise, the structure formed an
intercalated or delaminated system.
Kotek et al. (266) have produced the PP/ Cloisite 15A nanocomposites by melt mixing.
The polarity of polypropylene can be increased by inviting CI and SO2Cl groups via a
reaction with sulfuryl chloride which is below UV irradiation. High, medium, and low
amounts of CI and SO2Cl were used in order to know the effect of these groups into the
intercalation level and find an optimal amount. In addition, two preparation methods
were used in this experiment. The first one was to mix the PP, Chlorosulfonated PP,
and o-MMT in one step. The second method was to mix 75 wt.% Chlorosulfonated
polypropylene with 25 wt.% o-MMT in order to create a master batch. The master set
was subsequently mixed with polypropylene. The base layered silicate represented 3.15
nm as calculated by XRD. Both processes showed a good intercalation and exfoliation
nanocomposites structure at medium amount of SO2Cl group and at high amount of CI
which indicated that the chlorine was more effective in the o-MMT as had been
reported (267).
Polyethylene /clay nanocomposites by melt intercalation was studied by Hong S and
Rhim J (268). The layered silicate and the polymer were mixed together in the weight
ratio of 1:3 throughout high speed mixing in order to produce the master batch. The
resulting mixture was extruded by a twin extruder device. The d-spacing results
extracted from XRD showed an increase in the distance between layers indicating an
intercalation nanocomposites structure was obtained.
There were also many studies reported by this method such as poly(ethylene
terephthalate)/ H-S-A-MMT nanocomposites (269), polyamide 6 - styrene-butadiene-
acrylonitrile / Clay nanocomposites (270), Polystyrene (PS) /clay nanocomposites
(271), isotactic polypropylene/clay nanocomposites (272), and Polypropylene-MMT
nanocomposites (273).
2.7.4.3 Advantages of melt intercalation
1- Enlarges the commercial possibilities for nano-technology (62, 85);
2- Lower cost than in „in-situ‟ polymerisation;
3- Reduces the capital investment cost;
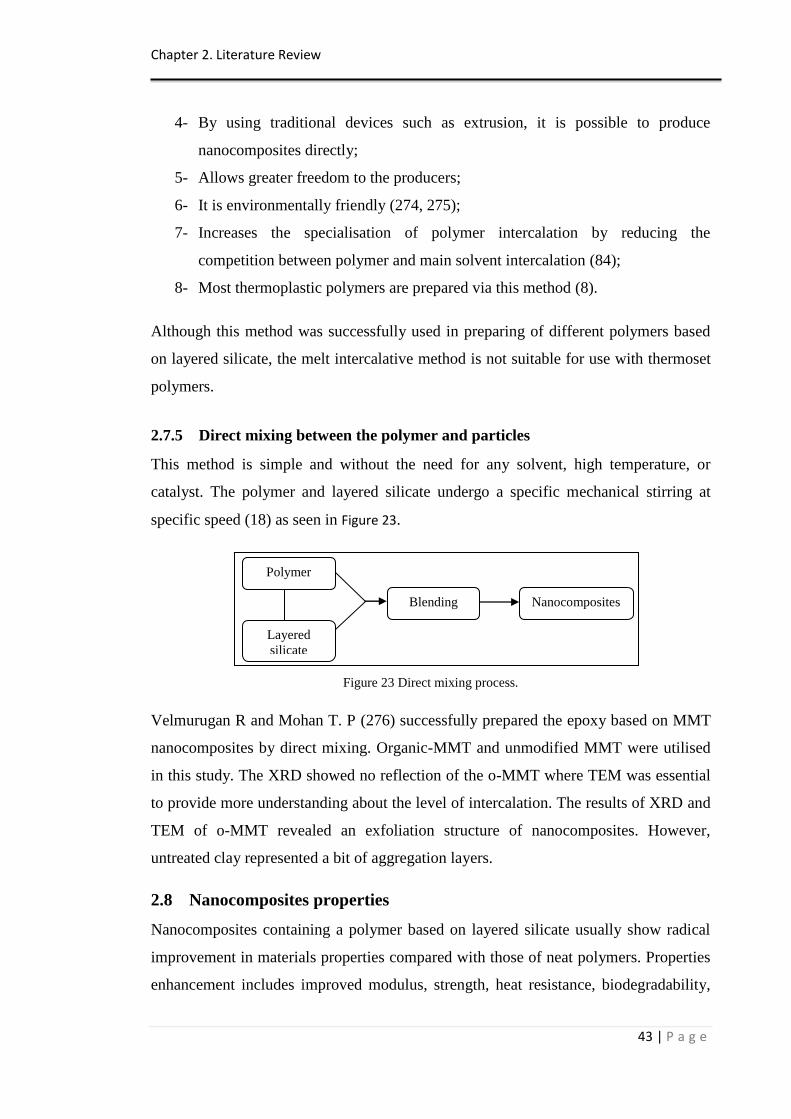
Chapter 2. Literature Review
43 | P a g e
4- By using traditional devices such as extrusion, it is possible to produce
nanocomposites directly;
5- Allows greater freedom to the producers;
6- It is environmentally friendly (274, 275);
7- Increases the specialisation of polymer intercalation by reducing the
competition between polymer and main solvent intercalation (84);
8- Most thermoplastic polymers are prepared via this method (8).
Although this method was successfully used in preparing of different polymers based
on layered silicate, the melt intercalative method is not suitable for use with thermoset
polymers.
2.7.5 Direct mixing between the polymer and particles
This method is simple and without the need for any solvent, high temperature, or
catalyst. The polymer and layered silicate undergo a specific mechanical stirring at
specific speed (18) as seen in Figure 23.
Figure 23 Direct mixing process.
Velmurugan R and Mohan T. P (276) successfully prepared the epoxy based on MMT
nanocomposites by direct mixing. Organic-MMT and unmodified MMT were utilised
in this study. The XRD showed no reflection of the o-MMT where TEM was essential
to provide more understanding about the level of intercalation. The results of XRD and
TEM of o-MMT revealed an exfoliation structure of nanocomposites. However,
untreated clay represented a bit of aggregation layers.
2.8 Nanocomposites properties
Nanocomposites containing a polymer based on layered silicate usually show radical
improvement in materials properties compared with those of neat polymers. Properties
enhancement includes improved modulus, strength, heat resistance, biodegradability,
Polymer
Layered
silicate
Blending
Nanocomposites
Chapter 2. Literature Review
44 | P a g e
and reduced gas flammability and permeability. The improvement is derived from the
high interfacial interaction between the polymer and the layered silicate.
2.8.1 Mechanical properties
2.8.1.1 The reinforcing mechanism of layered silicates
This primary mechanism, which has been stated to explain the reinforcing behaviour of
layered silicate, is the rigid fillers which are naturally opposed to elongating due to
their large moduli. Thus, when a quite softer polymer is reinforced with these kinds of
fillers and is located adjacent to the rigid fillers, the polymer will be restricted
mechanically. As a result, allowing a major amount of an applied force to be withstood
by the fillers will suppose that the bonding between the two phases is sufficient (277).
From these details, it can be seen that the higher the aspect ratio of the particles in
touch with the polymer, the bigger the reinforcing influence would be. This might
explain the reason that the layered silicate with high aspect ratio (800m2/g) leads to a
significant enhancement in modulus events with a small amount of particles in a
matrix. Therefore a low amount of particles in nanocomposites is preferable in order to
influence dramatic property enhancement (16).
The evidence of the influence of the level of exfoliation phase on the properties of
nanocomposites has been studied by Fornes and Paul (277). An analytical approach
was used in order to reveal how an insufficient exfoliation phase affected the stiffness
of nanocomposites. The modulus of a simple layered silicate stack in the parallel path
to its sheets was expressed by utilising the mixtures rule:
(1)
Where:
øMMT: Volume fraction of silicate layers in the stack;
EMMT: Modulus of MMT;
øgallery: Volume fraction of gallery space;
Chapter 2. Literature Review
45 | P a g e
Egallery: Modulus of the material in the gallery, which is expected to be much less than
EMMT.
øgallery can be expressed by X-ray basal spacing as follows:
(2)
Where:
d001: The repeat spacing between silicate particles;
tplatelet: The thickness of a silicate platelet.
Clearly, if the amount of platelets in a stack is equivalent to one, the structure will
confirm a separated exfoliation platelet.
2.8.1.2 Modulus and Strength
The reason for the layered silicate incorporation within the polymer matrix is to
enhance the modulus and strength of the materials. The enhancement of modulus and
strength of nanocomposites is attributed to the high modulus and strength of layered
silicate as well as the high aspect ratio which improves the interfacial interaction
between the polymer and layered silicate (74).
Poly(hexamethylene terephthalate) based on Cloisite 30B prepared by melt
intercalation and in-situ ring opening polymerization represented an increase in the
Young‟s modulus of about 20% and 25% respectively compared to virgin polymer
(278).
The preparation of the copolymer vinyl acetate based on nanocomposites was
undertaken by Peeterbroeck S et al. (279). Various types of layered silicate were used
which included Cloisite Na/ 20A/ 25A/30B, Nanofil 757/15, and Somasif ME100/
MAE. The organic modification process played an important role in the exfoliation
structure and properties. It was found that the addition of non-organo clays such as
Cloisite Na, Nanofil 757 and Somasif ME100 led to forming micro particles in the
resulting structure as confirmed by XRD. This result was expected because of the less
compatibility between the layered silicate and polymer which prevented the
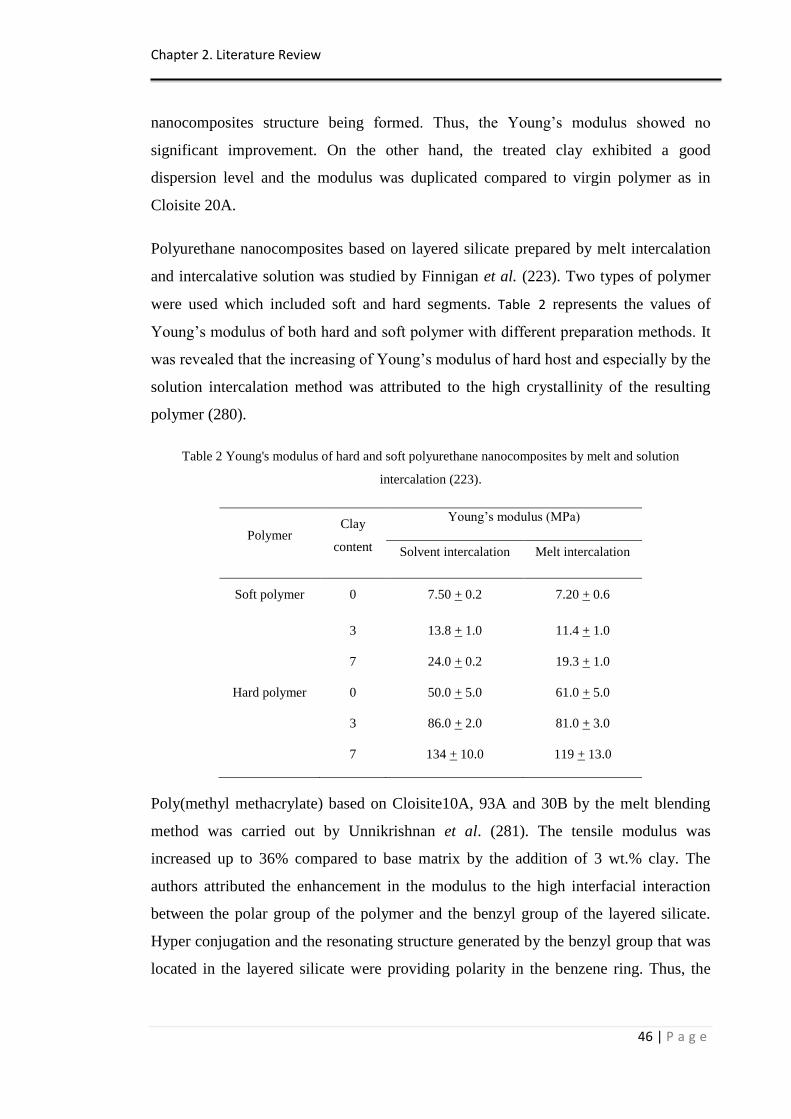
Chapter 2. Literature Review
46 | P a g e
nanocomposites structure being formed. Thus, the Young‟s modulus showed no
significant improvement. On the other hand, the treated clay exhibited a good
dispersion level and the modulus was duplicated compared to virgin polymer as in
Cloisite 20A.
Polyurethane nanocomposites based on layered silicate prepared by melt intercalation
and intercalative solution was studied by Finnigan et al. (223). Two types of polymer
were used which included soft and hard segments. Table 2 represents the values of
Young‟s modulus of both hard and soft polymer with different preparation methods. It
was revealed that the increasing of Young‟s modulus of hard host and especially by the
solution intercalation method was attributed to the high crystallinity of the resulting
polymer (280).
Table 2 Young's modulus of hard and soft polyurethane nanocomposites by melt and solution
intercalation (223).
Polymer Clay
content
Young‟s modulus (MPa)
Solvent intercalation Melt intercalation
Soft polymer 0 7.50 + 0.2 7.20 + 0.6
3 13.8 + 1.0 11.4 + 1.0
7 24.0 + 0.2 19.3 + 1.0
Hard polymer 0 50.0 + 5.0 61.0 + 5.0
3 86.0 + 2.0 81.0 + 3.0
7 134 + 10.0 119 + 13.0
Poly(methyl methacrylate) based on Cloisite10A, 93A and 30B by the melt blending
method was carried out by Unnikrishnan et al. (281). The tensile modulus was
increased up to 36% compared to base matrix by the addition of 3 wt.% clay. The
authors attributed the enhancement in the modulus to the high interfacial interaction
between the polar group of the polymer and the benzyl group of the layered silicate.
Hyper conjugation and the resonating structure generated by the benzyl group that was
located in the layered silicate were providing polarity in the benzene ring. Thus, the
Chapter 2. Literature Review
47 | P a g e
interaction between the benzene ring and the polymer took place and resulted in
increasing the interface between the clay and polymer.
Tensile strength before and after thermal ageing at 120 °C for 72 hours of sepiolite/PU
nanocomposites was carried out by Chen et al. (282). The improvements of tensile
strength before ageing were about 45% and 65% at 2% and 5% clay loading compared
to the neat polymer. In addition, it was reported that the thermal ageing had a strong
effect on the tensile strength which was attributed to the oxidation of double bonds that
helped to speed up the scission of the matrix chains. Moreover, the incorporation of
layered silicate can increase the mechanical properties even under thermal ageing, as
proved by the result of tensile strength under the thermal condition.
Shelley et al. (283) revealed a 175% enhancement in yield stress associated with a
200% enlargement in tensile modulus for a nylon 6 nanocomposite consisting of only 5
wt.% layered silicate. The reason for improvements was attributed to the increase of
the amount of constrained chains of the polymer with the clay sheets.
Yao et al. (284) carried out the preparation of novel polyurethane based on layered
silicate. It was observed that the incorporation of clay led to enlarging the tensile
strength from 5.9 MPa to 8.3 MPa at 21.5 wt.% clay volume. It was revealed that the
increase in elasticity was traced to the plasticity effect of the gallery onium ion that
provided a dangling chain formation in the polymer matrix.
Moreover, the study of polyethylene based on layered silicate with different
intercalation agents (PE/JS and PE/DM) by melt intercalation was undertaken by Zhao
et al. (285). The JS and DM referred to (N- γ -trimethoxylsilanepropyl)
octadecyldimethylammonium chloride and dioctadecyldimethylammonium chloride
respectively. It was suggested that the level of intercalation depended on the type of
intercalated agent used. An improvement of tensile strength of nanocomposites with
different intercalation agents compared to neat polymer was observed. However, a
higher enhancement in tensile strength was observed by the addition of the JS agent.
This was traced to the good intercalation level between the polymer and layered silicate
by the presence of the JS agent as proved by XRD.
Chapter 2. Literature Review
48 | P a g e
A recent study about the incorporation of layered silicate into the epoxy thermoset
matrix was carried out by Bashar et al. (286). A sodium montmorillonite layered
silicate was used in this study. The tensile modulus of neat epoxy was 2.88 GPa
whereas 3.15 and 3.33 GPa was seen for the epoxy based on MMT at 1 wt.% and 3
wt.% clay loading. Also, an improvement in tensile strength was observed. The
enhancement in tensile strength was 6.7% and 5.1% at 1% and 3% clay loading
respectively compared to virgin polymer. Likewise, enhancements in tensile strength
and modulus up to 25% and 34% respectively at 5% clay loading by the addition of
layered silicate into epoxy resin compared to the pristine polymer were obtained. The
authors traced these improvements to the interlocking and bridging of the layered
silicate with the matrix (287).
A modern report about the study of properties of polyamide 6 that was mixed with
layered silicate and melamine polyphosphate was carried out by Kiliaris et al. (288).
An enhancement in tensile strength and modulus on the nanocomposites compared to
the neat polymer was observed. The percentage of improvement in tensile modules was
12% and 17% at only 0.5% and 1.0% clay loading respectively. The tensile strength
was raised to 15% and 17% at 0.5% and 1% clay fraction volume.
In another new study, an exfoliation epoxy nanocomposites structure exhibited an
increase in tensile strength and modulus. The improvement of the strength and modulus
was 10% and 130% respectively at 5% clay loading compared to the pristine matrix.
The resulting enhancements in properties were attributed to the exfoliation
nanocomposites structure obtained from the new preparation method which was called
Nano-disassembling (289).
Rubbery and glassy epoxy based on different types of layered silicate including
Nanomer I.30E, I.28E, and Cloisite 10, 15, 20 A by in-situ polymerisation showed an
improvement in the tensile strength and elastic modulus of both rubbery and glassy
matrix at different clay types. It was observed that the glassy polymer exhibited a
marginal increase in mechanical properties which was attributed to the nature of the
material as the glassy polymer owned high strength and modulus which was difficult to
be improved (290).
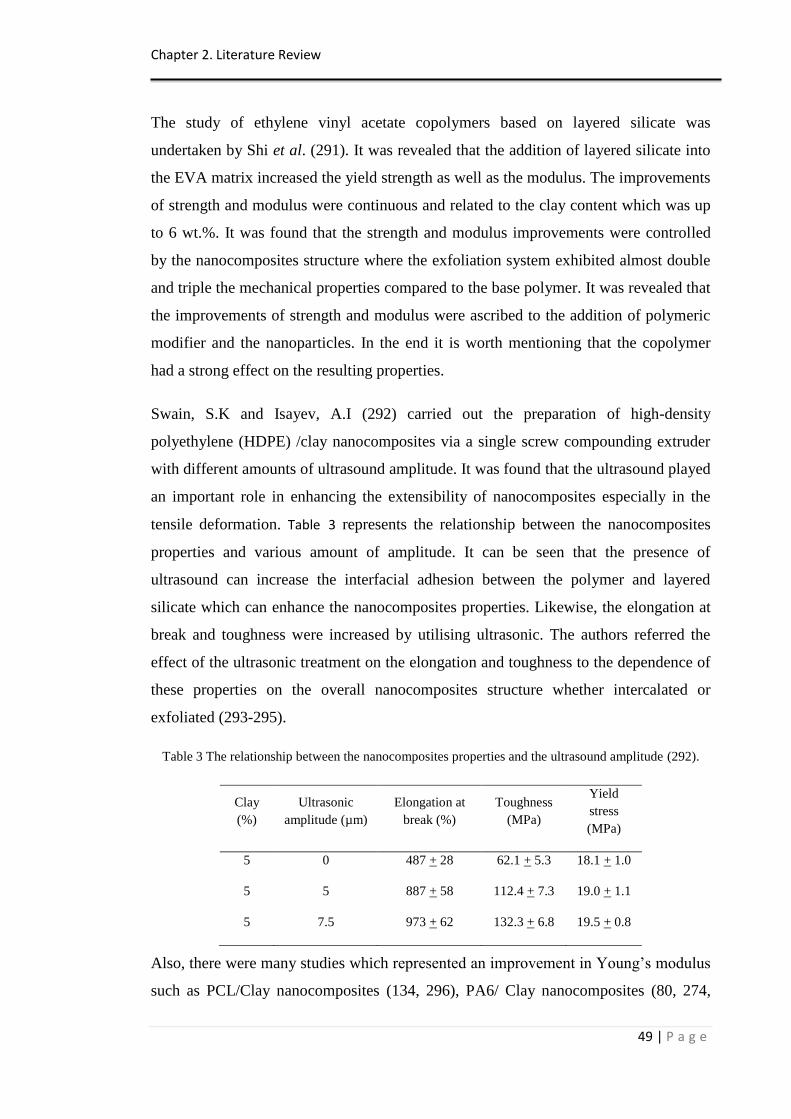
Chapter 2. Literature Review
49 | P a g e
The study of ethylene vinyl acetate copolymers based on layered silicate was
undertaken by Shi et al. (291). It was revealed that the addition of layered silicate into
the EVA matrix increased the yield strength as well as the modulus. The improvements
of strength and modulus were continuous and related to the clay content which was up
to 6 wt.%. It was found that the strength and modulus improvements were controlled
by the nanocomposites structure where the exfoliation system exhibited almost double
and triple the mechanical properties compared to the base polymer. It was revealed that
the improvements of strength and modulus were ascribed to the addition of polymeric
modifier and the nanoparticles. In the end it is worth mentioning that the copolymer
had a strong effect on the resulting properties.
Swain, S.K and Isayev, A.I (292) carried out the preparation of high-density
polyethylene (HDPE) /clay nanocomposites via a single screw compounding extruder
with different amounts of ultrasound amplitude. It was found that the ultrasound played
an important role in enhancing the extensibility of nanocomposites especially in the
tensile deformation. Table 3 represents the relationship between the nanocomposites
properties and various amount of amplitude. It can be seen that the presence of
ultrasound can increase the interfacial adhesion between the polymer and layered
silicate which can enhance the nanocomposites properties. Likewise, the elongation at
break and toughness were increased by utilising ultrasonic. The authors referred the
effect of the ultrasonic treatment on the elongation and toughness to the dependence of
these properties on the overall nanocomposites structure whether intercalated or
exfoliated (293-295).
Table 3 The relationship between the nanocomposites properties and the ultrasound amplitude (292).
Clay
(%)
Ultrasonic
amplitude (µm)
Elongation at
break (%)
Toughness
(MPa)
Yield
stress
(MPa)
5 0 487 + 28 62.1 + 5.3 18.1 + 1.0
5 5 887 + 58 112.4 + 7.3 19.0 + 1.1
5 7.5 973 + 62 132.3 + 6.8 19.5 + 0.8
Also, there were many studies which represented an improvement in Young‟s modulus
such as PCL/Clay nanocomposites (134, 296), PA6/ Clay nanocomposites (80, 274,
Chapter 2. Literature Review
50 | P a g e
297), PLA/MMT nanocomposites (298), and PP/ Clay nanocomposites (299), and
tensile strength such as PA6/ clay nanocomposites (274, 297), star shaped styrene–
butadiene block copolymer based on Cloisite Na and Microfloc XFB (300), and
starch/poly (vinyl alcohol)/MMT nanocomposites (301).
2.8.1.2.1 Factors that influence the strength and modulus
There are many factors that may affect the nanocomposites structure and properties.
The first factor which plays an important role in the output properties of
nanocomposites can be the clay concentration. It is generally acceptable that the clay
loading has an optimal level which should be identified for the tensile strength
nanocomposites (302). It was suggested that the clay loading affects the resulting
structure, as in some polymers the clay content should be less than 10 wt.% in order to
obtain exfoliation nanocomposites. However, with greater than 10 wt.% clay,
intercalated or partially exfoliated nanocomposites structures can be formed (16, 20).
Polyaniline/MMT nanocomposites prepared by the in-situ polymerisation method was
carried out by Soundararajah Y et al. (303). Different concentrations of layered silicate
were used. It was reported that the addition of layered silicate increased the Young‟s
modulus. There is a constant increase in modulus by the increasing of layered silicate
content up to 23 wt.%, however, more clay content resulted in decreasing the overall
properties. This was attributed to the level of dispersion and the nanocomposites
structure obtained.
The study of mechanical performance of PA66 produced by the melt intercalative
method was undertaken by Liu and Wu (258). Epoxy intercalated layered silicate was
used in this study. The result of the tensile strength rose significantly from 78 MPa of
neat polymer to 98 MPa of 5 wt.% clay content. However, a reduction was observed
when the clay was above 5%. The tensile modulus showed a similar result to the tensile
strength but there was a small enhancement in modulus after 5 wt.% clay loading. The
reduction or small enhancement in properties above 5 wt.% clay loading was ascribed
to the layered silicate aggregation as reported.
Besides the clay content that influences the modulus and strength output, the
compatiblizer of the polymer plays an important role in the term of properties. PP/clay
nanocomposites with two different types of compatiblizer, including polypropylene
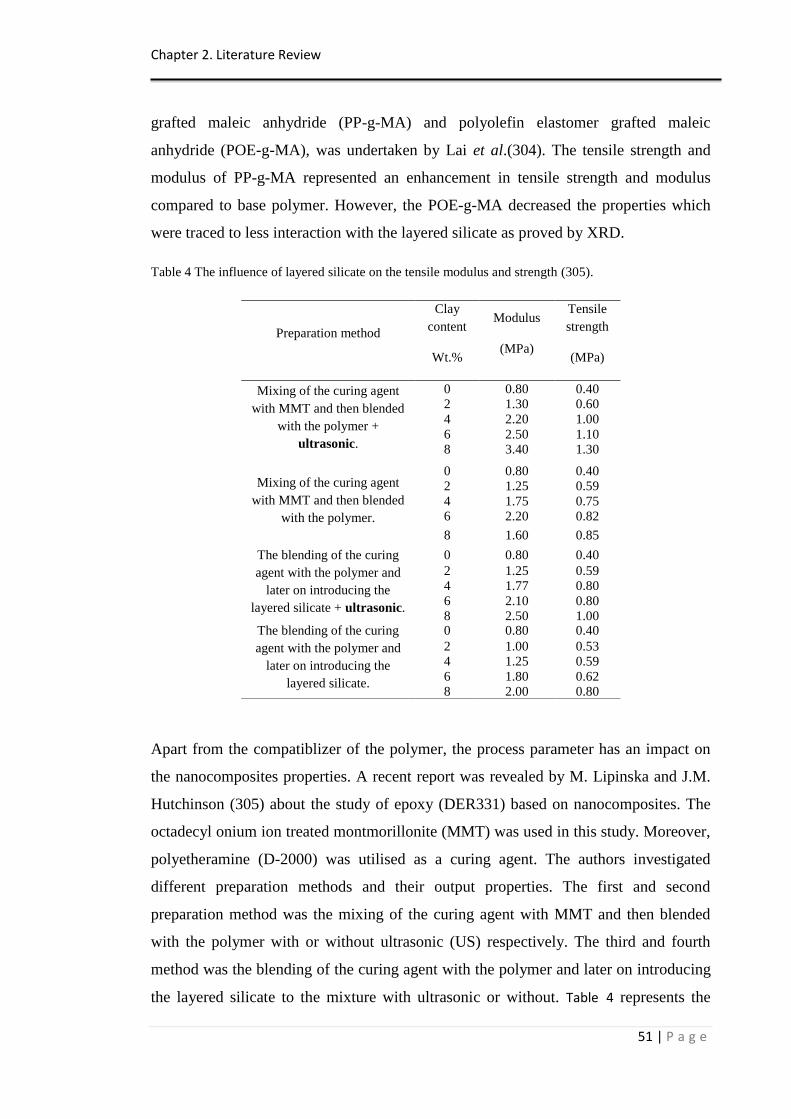
Chapter 2. Literature Review
51 | P a g e
grafted maleic anhydride (PP-g-MA) and polyolefin elastomer grafted maleic
anhydride (POE-g-MA), was undertaken by Lai et al.(304). The tensile strength and
modulus of PP-g-MA represented an enhancement in tensile strength and modulus
compared to base polymer. However, the POE-g-MA decreased the properties which
were traced to less interaction with the layered silicate as proved by XRD.
Table 4 The influence of layered silicate on the tensile modulus and strength (305).
Preparation method
Clay
content
Wt.%
Modulus
(MPa)
Tensile
strength
(MPa)
Mixing of the curing agent
with MMT and then blended
with the polymer +
ultrasonic.
0 0.80 0.40 2 1.30 0.60
4 2.20 1.00
6 2.50 1.10 8 3.40 1.30
Mixing of the curing agent
with MMT and then blended
with the polymer.
0 0.80 0.40 2 1.25 0.59
4 1.75 0.75 6 2.20 0.82
8 1.60 0.85
The blending of the curing
agent with the polymer and
later on introducing the
layered silicate + ultrasonic.
0 0.80 0.40
2 1.25 0.59 4 1.77 0.80
6 2.10 0.80 8 2.50 1.00
The blending of the curing
agent with the polymer and
later on introducing the
layered silicate.
0 0.80 0.40
2 1.00 0.53 4 1.25 0.59
6 1.80 0.62 8 2.00 0.80
Apart from the compatiblizer of the polymer, the process parameter has an impact on
the nanocomposites properties. A recent report was revealed by M. Lipinska and J.M.
Hutchinson (305) about the study of epoxy (DER331) based on nanocomposites. The
octadecyl onium ion treated montmorillonite (MMT) was used in this study. Moreover,
polyetheramine (D-2000) was utilised as a curing agent. The authors investigated
different preparation methods and their output properties. The first and second
preparation method was the mixing of the curing agent with MMT and then blended
with the polymer with or without ultrasonic (US) respectively. The third and fourth
method was the blending of the curing agent with the polymer and later on introducing
the layered silicate to the mixture with ultrasonic or without. Table 4 represents the
Chapter 2. Literature Review
52 | P a g e
effect of layered silicate content on the modulus and strength properties It was
observed that the blending of the curing agent with MMT directly helped to have better
properties with or without the ultrasonic. These improvements were assigned to
synergism between the layered silicate and curing agent. Thus, the preparation method
plays an important role in the resulting properties.
In addition, there are many factors that may influence the modulus and strength of the
nanocomposites. For instance, the nature of acid plays an important role in terms of
properties(20), the molecular weight (274), the organic-modification of layered silicate
and the catalyst used (306, 307), and the level of crystallinity (308).
2.8.1.2.2 Contradiction reports about the strength and modulus
Although there are many studies that reported drastic improvements in tensile strength
and modulus, different studies show a reduction in properties when the layered silicate
was introduced.
The study of the polyester matrix nanocomposites based on 5 and 10 wt.% layered
silicate was revealed by Chieruzzi et al. (309). Dellite®72T (D72T) and 43B (D43B)
types of clay were used. It was revealed that the introduction of the clay led to
decreasing the tensile strength because of the high viscosity of the mixture and the lack
of degassing. Thus, it was suggested that the addition of material helps to reduce the
viscosity. Fyrol® TEP based on triethyl phosphate was utilised as a viscosity reducer
(VR). However, after the addition of the VR, the properties were further reduced which
was attributed to the side effect of the chemical structure of the VR that reduced the Tg
and mechanical properties.
In addition, Polyethylene/MMT nanocomposites (310), Copolymer vinyl acetate
nanocomposites (279), and polyester/clay nanocomposites (311) represented a
reduction of mechanical properties by the addition of layered silicate.
In summary, clay loadings and sources, the nature of acid, the process parameters, the
molecular weight, layered silicate modification, catalyst, and the degree of crystallinity
can influence the level of exfoliation nanocomposites. Thus the amount of
improvement in either modulus or strength varies depending on the level of exfoliation.
Chapter 2. Literature Review
53 | P a g e
2.8.1.3 Flexural modulus and strength
There are many reports that have been done on the bending modulus and strength of
nanocomposites based on layered silicate.
The study of the properties of polyethylene nanocomposites was undertaken by Zhao et
al. (285). Various types of intercalation agents were used (PE/JS and PE/DM). With
regard to the kind of agents that were used, both nanocomposites samples showed an
improvement in flexural strength and modulus compared to virgin polymer.
A modern study of exfoliation epoxy nanocomposites based on layered silicate
structure exhibited an increase in flexural strength and modulus. The improvement of
the strength and modulus was 6% and 13% respectively at 5% clay loading compared
to the neat matrix. The resulting enhancements in properties were attributed to the
exfoliation nanocomposites structure obtained from the new preparation method which
was called Nano-disassembling (289). Similarly, Alamri, H and Low, I M (312) carried
out the study of mechanical properties of epoxy based on layered silicate. It was found
that at low contents of nano-fillers (1 wt.% clay loading), the flexural properties were
increased up to 58% and 77% for the strength and modulus respectively. The flexural
strength at 3 and 5 wt.% layered silicate showed no significant change compared to
base polymer. The strength of the materials is very sensitive to the level of
intercalation. So a lack of good dispersion will provide a negative side effect of the
strength outputs.
The investigation of the properties of unsaturated polyester based on clay
nanocomposites was carried out by Chieruzzi et al. (309). At 10 wt.% clay loading, the
flexural modulus was increased by 70% compared to virgin polymer.
2.8.1.4 Toughness
The debonding of layered silicate from the polymer matrix usually exhibits microvoids
in the nanocomposites structure which leads to provide the output material with
brittleness. This was examined by an accurate investigation for the cracking surface
and accompanied with transmission electron microscopy (TEM) (302, 313). For
example, Ethylene vinyl acetate based on clay nanocomposites showed a reduction in
toughness by the incorporation of different amounts of clay (291). Likewise, Poly
Chapter 2. Literature Review
54 | P a g e
(methyl methacrylate) - layered silicate nanocomposites represented a marginal
reduction in toughness at low nanofillers content. However, at high amounts of clay,
the reduction was very high (281).
Although many reports revealed a dramatic reduction in toughness properties for
nanocomposites when the layered silicate was introduced, other studies reported a
small decrease in toughness or no change when the clay was incorporated.
A recent study revealed that the amount of fracture toughness for pristine epoxy and
nanocomposites were almost the same. However, the initial clay loading exhibited a
marginal improvement. This study utilised the epoxy as a polymer and Na+-MMT as a
layered silicate. The virgin polymer was 0.78 MPa.m0.5
whereas at 1% clay volume it
was 0.79 MPa.m0.5
and the addition of layered silicate as in 3% clay loading reduced
the toughness to 0.77 MPa.m0.5
. It was suggested that the intercalation structure played
an important role in the enhancement of the toughness (286). Likewise, exfoliation
epoxy nanocomposites based on a layered silicate structure, exhibited an increase in
impact strength. The improvement of the strength was 5% at 5 wt.% clay loading
compared to the neat matrix (289). In addition, the study of the effect of layered silicate
on the EVA matrix by using a microcellular injection mould was carried out by Hwang
et al. (314). This report revealed an increase in the impact strength by the addition of
layered silicate.
Also, there are many studies showing an improvement in toughness or that the
nanocomposites were almost as same as the base polymer, such as PP (315), nylon
(316), and PA66 (258) nanocomposites.
The previous reports were surprising to the principle of nanocomposites. It is generally
accepted that the size of particle plays a major role in the toughness property. In
addition, the size that acts to provide a tough material is more than 0.1 µm which is not
preferable to the nanometer size. Also, it is argued that the nanoparticles are very tiny
to offer toughening of their structure. Thus, the complete exfoliation phase does not
provide toughening of the material. As a result, the enhancement may be attributed to
the interaction between clay and polymer in the intercalation structure which may
alleviate the argument (80).
Chapter 2. Literature Review
55 | P a g e
2.8.1.5 Strain at break
Different reports in terms of elongation for the nanocomposites were obtained. A
recent study about the investigation of the properties of polyamide 6 exhibited a
reduction in nanocomposites elongation compared to pristine polymer. The decreased
amount was 7% and 23% when the level of clay was at 0.5% and 1%. The reduction of
elongation amount was attributed to two reasons. First, with the attendance of clay, the
ability to change orientation of polymer molecules was restricted. The authors also
traced the arising of reduction to the debonding of clay sheets from the polymer matrix
(288).
Ethylene vinyl acetate based on clay nanocomposites showed a reduction in elongation
by the incorporation of different amounts of clay. The reduction of the elongation was
to be less in the exfoliation structure compared to intercalation nanocomposites (291).
Recently, the epoxy-MMT revealed a marginal reduction in elongation at low
nanofillers content. The elongation of neat epoxy was 8.5%. However, at 1% and 3%
clay loading the figures were 7.21% and 3.77% respectively. The reduction of the
elongation was assigned to the high rigidity and stiffness of the particles which reduced
the ductility of the material (286). In addition, Poly (methyl methacrylate) - layered
silicate nanocomposites represented a reduction in the elongation. The reduction of the
elongation was proportional to the clay content. The decreasing was traced to the stiff
fillers that were incorporated. The stiff fillers restricted the mobility environment of the
polymer chains (281).
The preparation of the copolymer vinyl acetate based on nanocomposites was
undertaken by Peeterbroeck et al. (279). Various types of layered silicate were used as
mentioned in section 2.8.1.2. It was observed that the addition of clay to the polymer
matrix led to decreasing the elongation at break. The authors agreed that the
nanocomposites properties depend on the origin of the clay, whether modified or not,
and the level of dispersion. Polyurethane/clay nanocomposites by melt intercalation
and intercalative solution were studied by Finnigan et al. (223). Two types of polymer
were used which included soft and hard segments. With regard to the types of
preparation method or polymer types, the addition of clay reduced the elongation of
nanocomposites compared to neat polymer.
Chapter 2. Literature Review
56 | P a g e
From the preceding reports, it can be seen that the addition of layered silicate provides
most of the polymers with brittleness. However, some results show an enhancement in
elongation at break. An enlargement in elongation at break is observed in the
incorporation of o-MMT into EVA12 polymer at low clay level, about 2%. The
increase was up to 2% clay loading and the addition of clay level leads to reduce the
strain as well as mechanical properties. This was assigned to the agglomeration of
layers (317).
The improvement in elongation for nanocomposites based on layered silicate was also
conducted by Yao et al. (284). The improvement in strain was up to 22.1% at 21.5%
clay content. The researchers assumed that the enhancement was ascribed in part to the
influence of plasticity of the intergallery onium ions which formed the dangling chain
in the polymer matrix.
A drastic enhancement in the tensile elongation with the addition of the clay into
poly(ε-caprolactone) was conducted by Chen and Evans (137). An unusual trend was
observed when the elongation exhibited a similar yield of neat polymer whereas the
ductility was much greater than the virgin one. However, the further addition of layered
silicate provides the material with brittleness and the yield area will be achieved.
Likewise, the improvement of the strain at break before and after thermal ageing at
120oC for 72 hours of sepiolite/PU nanocomposites was carried out by Chen et al.
(282). The improvements of elongation before ageing were about 35% and 50% at 2%
and 5% clay loading compared to the base polymer. In addition, it was found that the
thermal ageing had a strong effect on the elongation which was attributed to the
oxidation of double bonds that helped to speed up the scission of the matrix chains.
Moreover, the incorporation of layered silicate can increase the mechanical properties
even under thermal ageing, as proved by the result of strain at break under the thermal
condition. The rubbery epoxy based on layered silicate exhibited an improvement in
elongation at break. The improvement percentage of nanocomposites properties was
different which was attributed to the types and amounts of clay. However, the glassy
epoxy based on layered silicate showed a reduction in the strain at break (290). In
addition, the study of the poly(hexamethylene terephthalate)/ clay nanocomposites was
carried out by González-Vidal et al. (278). The incorporation of Cloisite 30B into the
matrix resulted in increasing the elongation at break from 2.58% to 3.46%.
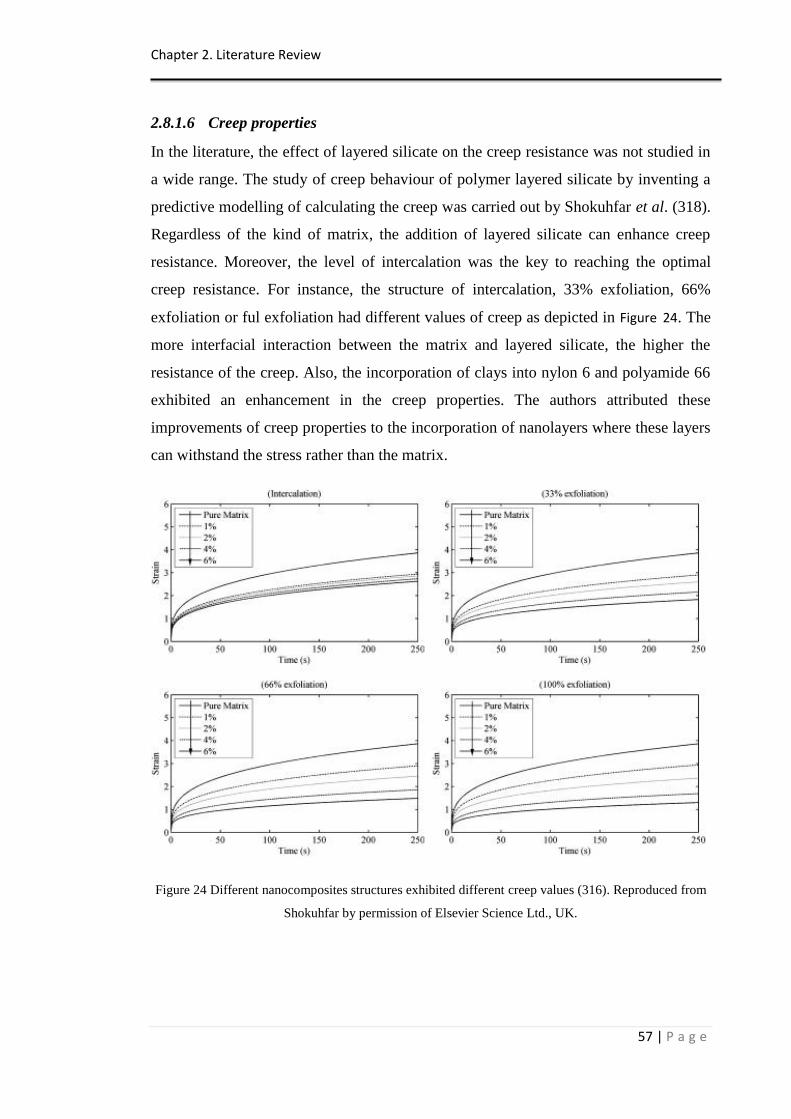
Chapter 2. Literature Review
57 | P a g e
2.8.1.6 Creep properties
In the literature, the effect of layered silicate on the creep resistance was not studied in
a wide range. The study of creep behaviour of polymer layered silicate by inventing a
predictive modelling of calculating the creep was carried out by Shokuhfar et al. (318).
Regardless of the kind of matrix, the addition of layered silicate can enhance creep
resistance. Moreover, the level of intercalation was the key to reaching the optimal
creep resistance. For instance, the structure of intercalation, 33% exfoliation, 66%
exfoliation or ful exfoliation had different values of creep as depicted in Figure 24. The
more interfacial interaction between the matrix and layered silicate, the higher the
resistance of the creep. Also, the incorporation of clays into nylon 6 and polyamide 66
exhibited an enhancement in the creep properties. The authors attributed these
improvements of creep properties to the incorporation of nanolayers where these layers
can withstand the stress rather than the matrix.
Figure 24 Different nanocomposites structures exhibited different creep values (316). Reproduced from
Shokuhfar by permission of Elsevier Science Ltd., UK.
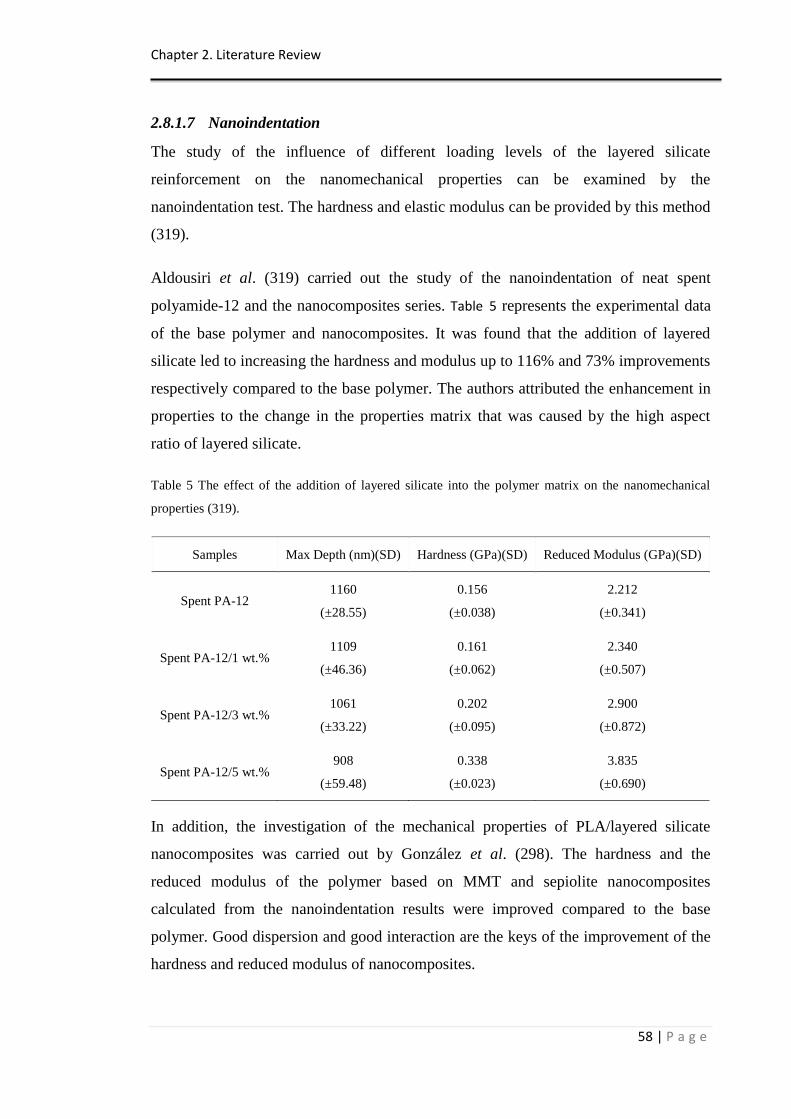
Chapter 2. Literature Review
58 | P a g e
2.8.1.7 Nanoindentation
The study of the influence of different loading levels of the layered silicate
reinforcement on the nanomechanical properties can be examined by the
nanoindentation test. The hardness and elastic modulus can be provided by this method
(319).
Aldousiri et al. (319) carried out the study of the nanoindentation of neat spent
polyamide-12 and the nanocomposites series. Table 5 represents the experimental data
of the base polymer and nanocomposites. It was found that the addition of layered
silicate led to increasing the hardness and modulus up to 116% and 73% improvements
respectively compared to the base polymer. The authors attributed the enhancement in
properties to the change in the properties matrix that was caused by the high aspect
ratio of layered silicate.
Table 5 The effect of the addition of layered silicate into the polymer matrix on the nanomechanical
properties (319).
Samples Max Depth (nm)(SD) Hardness (GPa)(SD) Reduced Modulus (GPa)(SD)
Spent PA-12 1160
(±28.55)
0.156
(±0.038)
2.212
(±0.341)
Spent PA-12/1 wt.% 1109
(±46.36)
0.161
(±0.062)
2.340
(±0.507)
Spent PA-12/3 wt.% 1061
(±33.22)
0.202
(±0.095)
2.900
(±0.872)
Spent PA-12/5 wt.% 908
(±59.48)
0.338
(±0.023)
3.835
(±0.690)
In addition, the investigation of the mechanical properties of PLA/layered silicate
nanocomposites was carried out by González et al. (298). The hardness and the
reduced modulus of the polymer based on MMT and sepiolite nanocomposites
calculated from the nanoindentation results were improved compared to the base
polymer. Good dispersion and good interaction are the keys of the improvement of the
hardness and reduced modulus of nanocomposites.
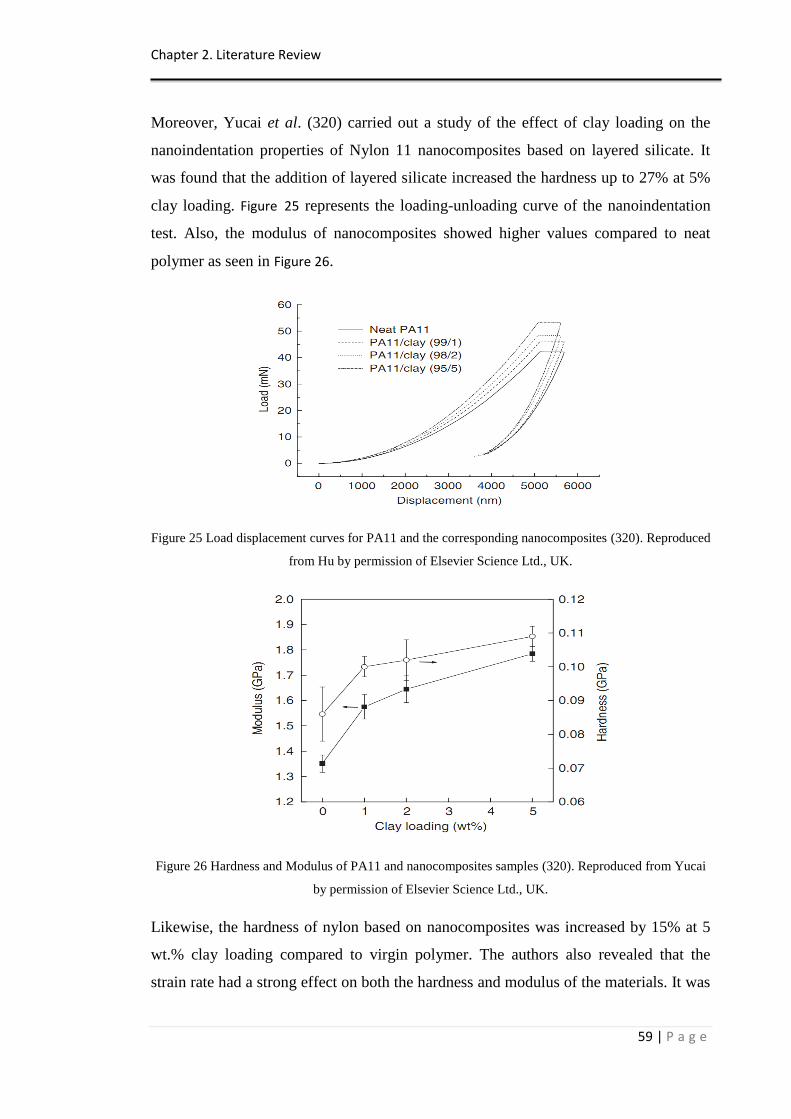
Chapter 2. Literature Review
59 | P a g e
Moreover, Yucai et al. (320) carried out a study of the effect of clay loading on the
nanoindentation properties of Nylon 11 nanocomposites based on layered silicate. It
was found that the addition of layered silicate increased the hardness up to 27% at 5%
clay loading. Figure 25 represents the loading-unloading curve of the nanoindentation
test. Also, the modulus of nanocomposites showed higher values compared to neat
polymer as seen in Figure 26.
Figure 25 Load displacement curves for PA11 and the corresponding nanocomposites (320). Reproduced
from Hu by permission of Elsevier Science Ltd., UK.
Figure 26 Hardness and Modulus of PA11 and nanocomposites samples (320). Reproduced from Yucai
by permission of Elsevier Science Ltd., UK.
Likewise, the hardness of nylon based on nanocomposites was increased by 15% at 5
wt.% clay loading compared to virgin polymer. The authors also revealed that the
strain rate had a strong effect on both the hardness and modulus of the materials. It was
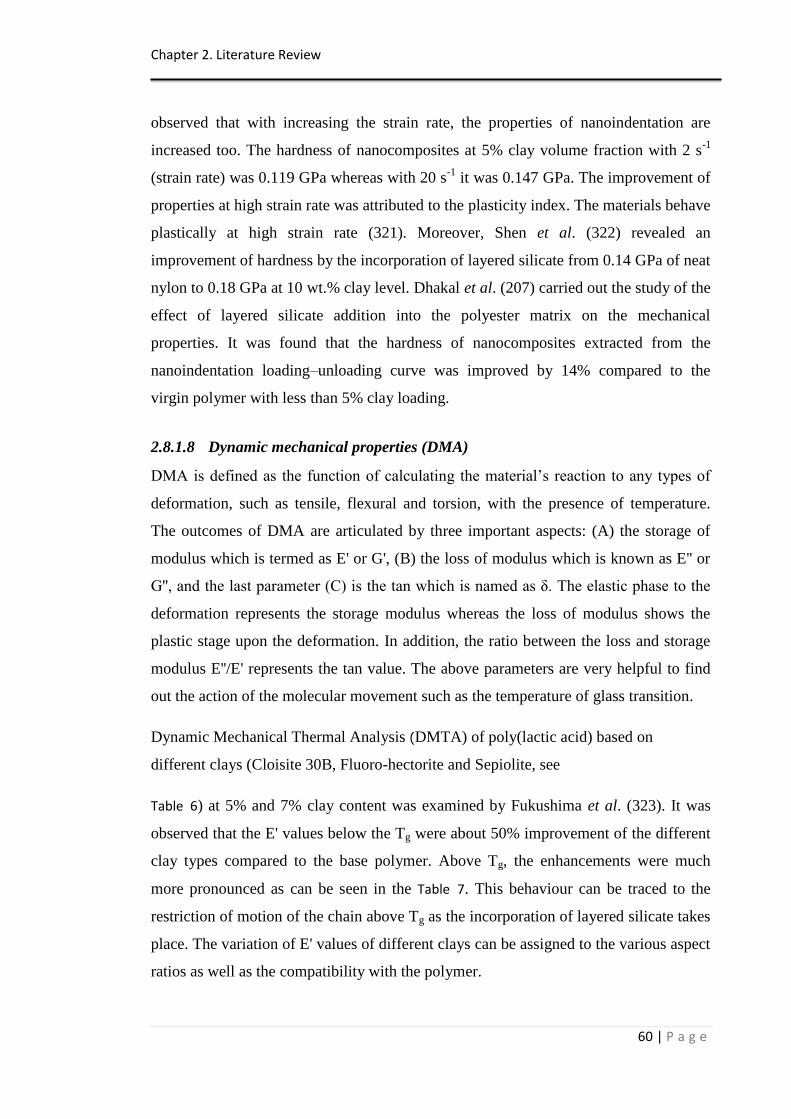
Chapter 2. Literature Review
60 | P a g e
observed that with increasing the strain rate, the properties of nanoindentation are
increased too. The hardness of nanocomposites at 5% clay volume fraction with 2 s-1
(strain rate) was 0.119 GPa whereas with 20 s-1
it was 0.147 GPa. The improvement of
properties at high strain rate was attributed to the plasticity index. The materials behave
plastically at high strain rate (321). Moreover, Shen et al. (322) revealed an
improvement of hardness by the incorporation of layered silicate from 0.14 GPa of neat
nylon to 0.18 GPa at 10 wt.% clay level. Dhakal et al. (207) carried out the study of the
effect of layered silicate addition into the polyester matrix on the mechanical
properties. It was found that the hardness of nanocomposites extracted from the
nanoindentation loading–unloading curve was improved by 14% compared to the
virgin polymer with less than 5% clay loading.
2.8.1.8 Dynamic mechanical properties (DMA)
DMA is defined as the function of calculating the material‟s reaction to any types of
deformation, such as tensile, flexural and torsion, with the presence of temperature.
The outcomes of DMA are articulated by three important aspects: (A) the storage of
modulus which is termed as E' or G', (B) the loss of modulus which is known as E'' or
G'', and the last parameter (C) is the tan which is named as δ. The elastic phase to the
deformation represents the storage modulus whereas the loss of modulus shows the
plastic stage upon the deformation. In addition, the ratio between the loss and storage
modulus E''/E' represents the tan value. The above parameters are very helpful to find
out the action of the molecular movement such as the temperature of glass transition.
Dynamic Mechanical Thermal Analysis (DMTA) of poly(lactic acid) based on
different clays (Cloisite 30B, Fluoro-hectorite and Sepiolite, see
Table 6) at 5% and 7% clay content was examined by Fukushima et al. (323). It was
observed that the E' values below the Tg were about 50% improvement of the different
clay types compared to the base polymer. Above Tg, the enhancements were much
more pronounced as can be seen in the Table 7. This behaviour can be traced to the
restriction of motion of the chain above Tg as the incorporation of layered silicate takes
place. The variation of E' values of different clays can be assigned to the various aspect
ratios as well as the compatibility with the polymer.
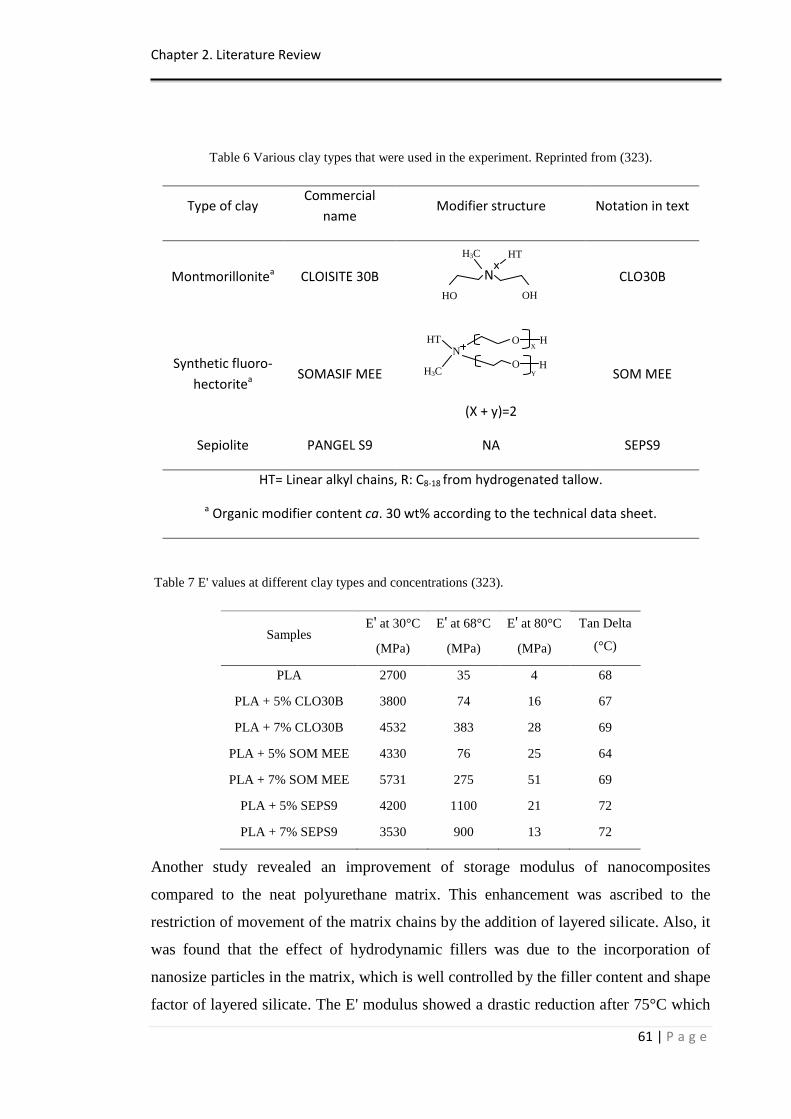
Chapter 2. Literature Review
61 | P a g e
Table 6 Various clay types that were used in the experiment. Reprinted from (323).
Type of clay Commercial
name Modifier structure Notation in text
Montmorillonitea CLOISITE 30B
CLO30B
Synthetic fluoro-
hectoritea SOMASIF MEE
(X + y)=2
SOM MEE
Sepiolite PANGEL S9 NA SEPS9
HT= Linear alkyl chains, R: C8-18 from hydrogenated tallow.
a Organic modifier content ca. 30 wt% according to the technical data sheet.
Table 7 E' values at different clay types and concentrations (323).
Samples E' at 30°C
(MPa)
E' at 68°C
(MPa)
E' at 80°C
(MPa)
Tan Delta
(°C)
PLA 2700 35 4 68
PLA + 5% CLO30B 3800 74 16 67
PLA + 7% CLO30B 4532 383 28 69
PLA + 5% SOM MEE 4330 76 25 64
PLA + 7% SOM MEE 5731 275 51 69
PLA + 5% SEPS9 4200 1100 21 72
PLA + 7% SEPS9 3530 900 13 72
Another study revealed an improvement of storage modulus of nanocomposites
compared to the neat polyurethane matrix. This enhancement was ascribed to the
restriction of movement of the matrix chains by the addition of layered silicate. Also, it
was found that the effect of hydrodynamic fillers was due to the incorporation of
nanosize particles in the matrix, which is well controlled by the filler content and shape
factor of layered silicate. The E' modulus showed a drastic reduction after 75°C which
O
H O
H X
Y
N HT
H3C
HO OH
N
H3C HT
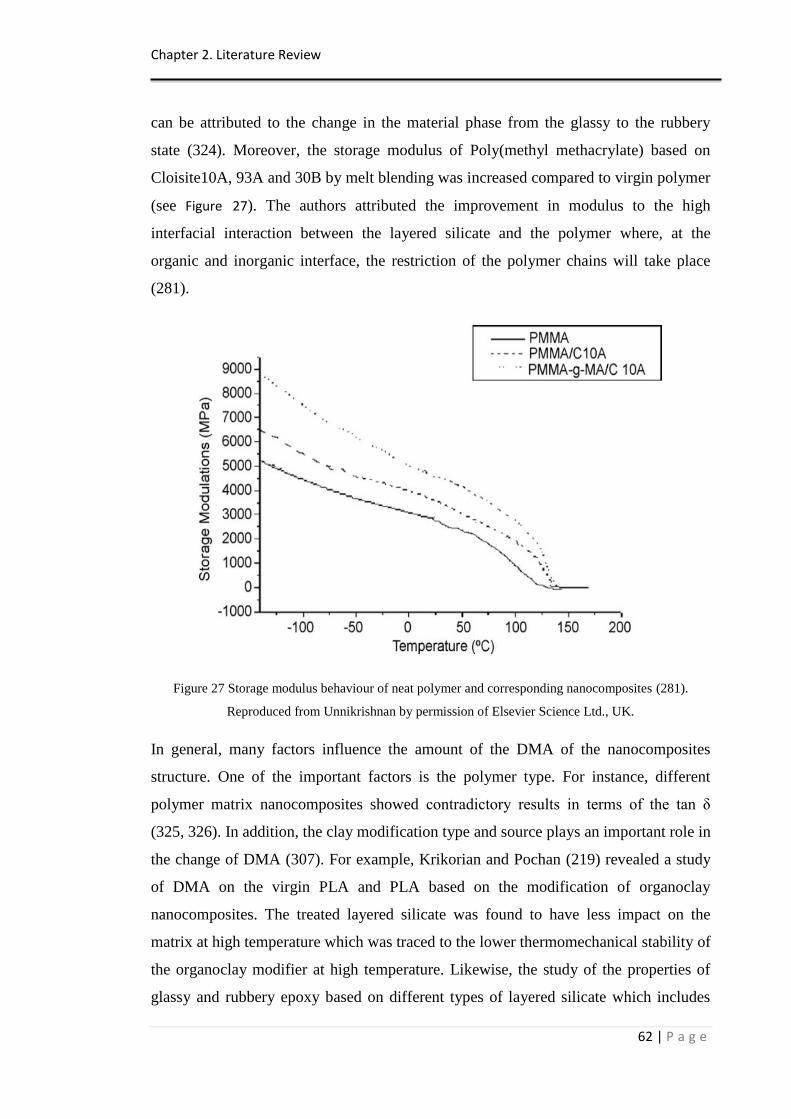
Chapter 2. Literature Review
62 | P a g e
can be attributed to the change in the material phase from the glassy to the rubbery
state (324). Moreover, the storage modulus of Poly(methyl methacrylate) based on
Cloisite10A, 93A and 30B by melt blending was increased compared to virgin polymer
(see Figure 27). The authors attributed the improvement in modulus to the high
interfacial interaction between the layered silicate and the polymer where, at the
organic and inorganic interface, the restriction of the polymer chains will take place
(281).
Figure 27 Storage modulus behaviour of neat polymer and corresponding nanocomposites (281).
Reproduced from Unnikrishnan by permission of Elsevier Science Ltd., UK.
In general, many factors influence the amount of the DMA of the nanocomposites
structure. One of the important factors is the polymer type. For instance, different
polymer matrix nanocomposites showed contradictory results in terms of the tan δ
(325, 326). In addition, the clay modification type and source plays an important role in
the change of DMA (307). For example, Krikorian and Pochan (219) revealed a study
of DMA on the virgin PLA and PLA based on the modification of organoclay
nanocomposites. The treated layered silicate was found to have less impact on the
matrix at high temperature which was traced to the lower thermomechanical stability of
the organoclay modifier at high temperature. Likewise, the study of the properties of
glassy and rubbery epoxy based on different types of layered silicate which includes
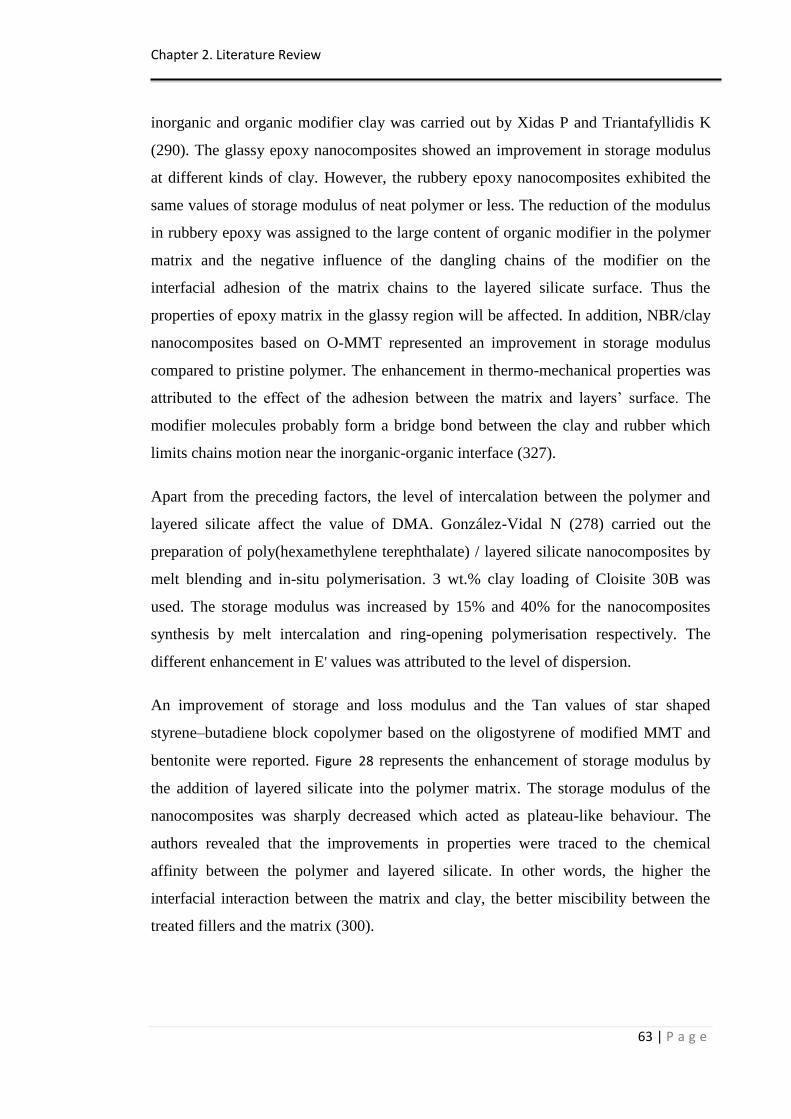
Chapter 2. Literature Review
63 | P a g e
inorganic and organic modifier clay was carried out by Xidas P and Triantafyllidis K
(290). The glassy epoxy nanocomposites showed an improvement in storage modulus
at different kinds of clay. However, the rubbery epoxy nanocomposites exhibited the
same values of storage modulus of neat polymer or less. The reduction of the modulus
in rubbery epoxy was assigned to the large content of organic modifier in the polymer
matrix and the negative influence of the dangling chains of the modifier on the
interfacial adhesion of the matrix chains to the layered silicate surface. Thus the
properties of epoxy matrix in the glassy region will be affected. In addition, NBR/clay
nanocomposites based on O-MMT represented an improvement in storage modulus
compared to pristine polymer. The enhancement in thermo-mechanical properties was
attributed to the effect of the adhesion between the matrix and layers‟ surface. The
modifier molecules probably form a bridge bond between the clay and rubber which
limits chains motion near the inorganic-organic interface (327).
Apart from the preceding factors, the level of intercalation between the polymer and
layered silicate affect the value of DMA. González-Vidal N (278) carried out the
preparation of poly(hexamethylene terephthalate) / layered silicate nanocomposites by
melt blending and in-situ polymerisation. 3 wt.% clay loading of Cloisite 30B was
used. The storage modulus was increased by 15% and 40% for the nanocomposites
synthesis by melt intercalation and ring-opening polymerisation respectively. The
different enhancement in E' values was attributed to the level of dispersion.
An improvement of storage and loss modulus and the Tan values of star shaped
styrene–butadiene block copolymer based on the oligostyrene of modified MMT and
bentonite were reported. Figure 28 represents the enhancement of storage modulus by
the addition of layered silicate into the polymer matrix. The storage modulus of the
nanocomposites was sharply decreased which acted as plateau-like behaviour. The
authors revealed that the improvements in properties were traced to the chemical
affinity between the polymer and layered silicate. In other words, the higher the
interfacial interaction between the matrix and clay, the better miscibility between the
treated fillers and the matrix (300).
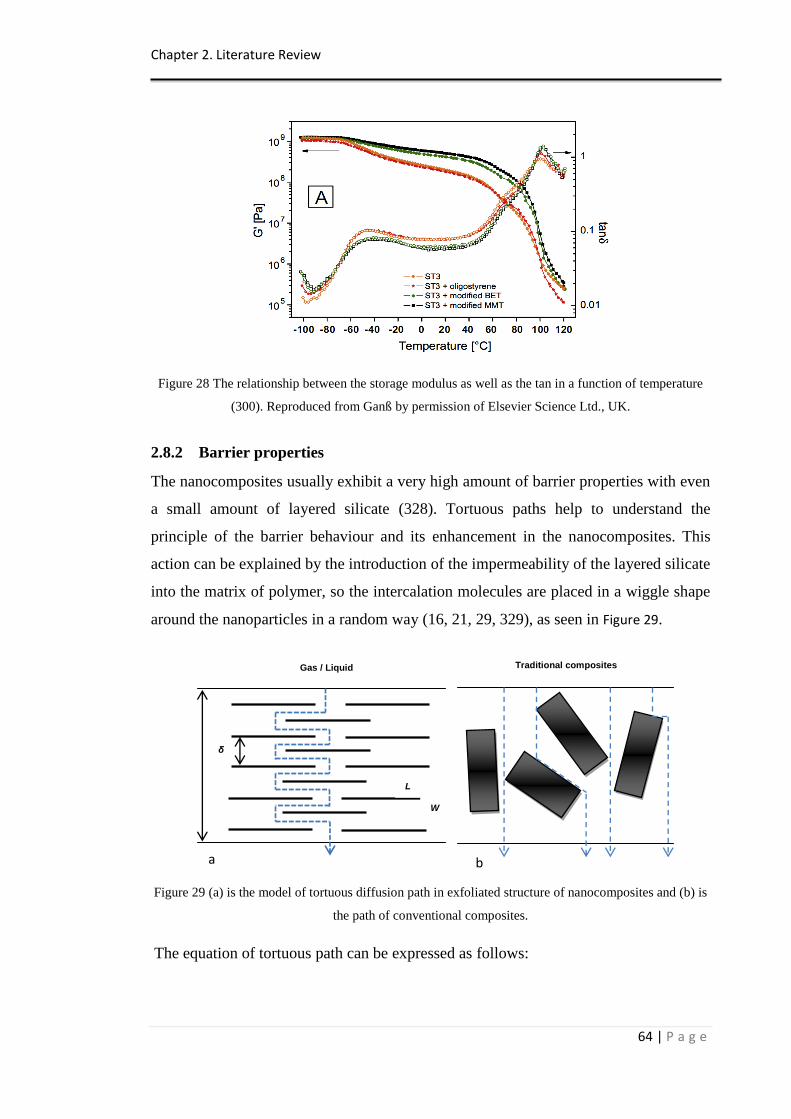
Chapter 2. Literature Review
64 | P a g e
Figure 28 The relationship between the storage modulus as well as the tan in a function of temperature
(300). Reproduced from Ganß by permission of Elsevier Science Ltd., UK.
2.8.2 Barrier properties
The nanocomposites usually exhibit a very high amount of barrier properties with even
a small amount of layered silicate (328). Tortuous paths help to understand the
principle of the barrier behaviour and its enhancement in the nanocomposites. This
action can be explained by the introduction of the impermeability of the layered silicate
into the matrix of polymer, so the intercalation molecules are placed in a wiggle shape
around the nanoparticles in a random way (16, 21, 29, 329), as seen in Figure 29.
Figure 29 (a) is the model of tortuous diffusion path in exfoliated structure of nanocomposites and (b) is
the path of conventional composites.
The equation of tortuous path can be expressed as follows:
Gas / Liquid Traditional composites
a b
L
W
δ
Chapter 2. Literature Review
65 | P a g e
(3)
Where:
d’: Term as an actual distance that the penetrant has to go throughout the shortest
distance;
d: The spacing between diffractional lattice planes;
L: The length of the sheets;
W: The width of the sheets;
s: Clay loading.
Because of the ratio of large length to width of the sheets, this type of clay will
enhance the path length when compared to different nanoparticles geometry (16, 20,
330). From the model that was proposed by Nielsen L E (331), the influence of
tortuosity on the permeability can be simulated as
(4)
Where:
PPCN: The permeability of the nanocomposites;
PP: The permeability of the virgin polymer.
The preceding formula was proposed for the dispersal of small molecular size such as
micro-molecular size in traditional composites, however it has also been used for the
nano scale as in the diffusion and permeability in nanocomposites structure. A
contradiction in the results obtained from experimental outcomes and the practical
experiment was observed which was probably ascribed to the insufficiency of the
model or the orientation of the layered silicate sheet that was located in the
nanocomposites film plane (306, 330). This model was proposed to the excellent
arrangement of sheets within the structure where the direction of dispersal is normal to
the way of layers. Obviously, the arrangement of these sheets leads to improve the
tortuous path, and if these arrangements are failed, the barrier properties are failed also
(16, 330).
Chapter 2. Literature Review
66 | P a g e
Apart from the tortuous path equation, the Nielsen, the Cussler (332), the Barrel (333)
and the power low (334) equations are based on the supposition that the layered silicate
does not influence the dispersal of the polymer matrix whereas these nanoparticles are
affected by the molecular mobility in the matrix which is reduced by clay introduction
as proved by experimental observation. This reduction of the mobility was attributed to
the close connection of molecular mobility to the mass transport properties. Thus, the
diffusivity of tiny molecular is reduced which is not taken into account in the idea of
the tortuous path model (8).
A drastic enhancement in the barrier properties by the incorporation of layered silicate
into the PA6 matrix was reported, more than 20 times improvement in the O2
permeability for the nanocomposites compared to virgin polymer. The authors
attributed the increasing of barrier properties to the exfoliation structure of
nanocomposites (335).
Moreover, the addition of various concentrations of layered silicate into the Soy protein
via the solution intercalative method increased dramatically the O2 permeability which
can be used for food packing as the barrier properties are a major concern (336).
The incorporation of layered silicate within the polymer matrix (epoxy), can decrease
the helium permeability up to 70% by comparison with the base matrix (337). Also, a
reduction of O2 permeability for nanocomposites up to 30% at 3% clay fraction volume
was observed. It was observed that the modifications of layered silicate can decrease
the uptake of water (338). Moreover, the tortuous path of clay when introduced to the
epoxy matrix was found to increase the barrier properties to the moisture permeability.
The enlargement of barrier properties was proportionally increased to the clay content
(339).
In addition, Swain, S.K and Isayev, I.A (292) revealed that the incorporation of
layered silicate into the HDPE increased the oxygen permeability. The addition of 10%
clay loading into the polymer matrix increased the O2 permeability up to 5% compared
to neat polymer. Also, it was suggested that the use of ultrasound amplitude at low clay
loading can enhance the interfacial interaction between the layered silicate and the
polymer matrix which increases the barrier properties.
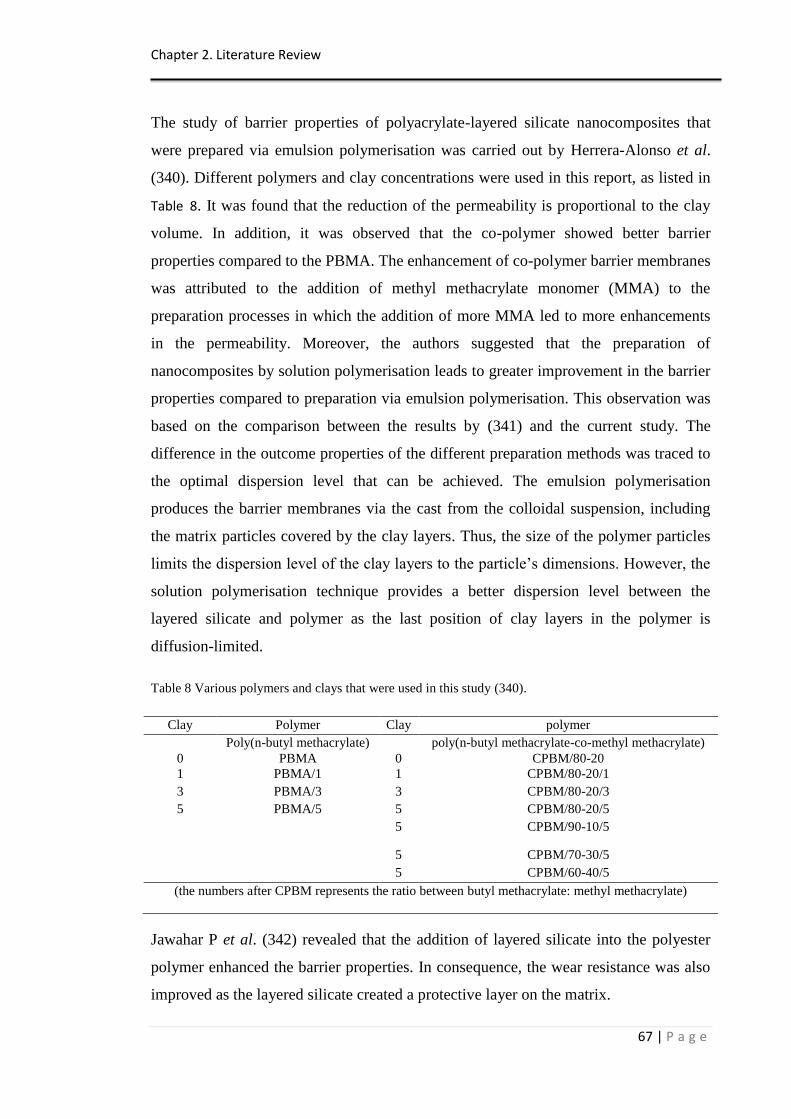
Chapter 2. Literature Review
67 | P a g e
The study of barrier properties of polyacrylate-layered silicate nanocomposites that
were prepared via emulsion polymerisation was carried out by Herrera-Alonso et al.
(340). Different polymers and clay concentrations were used in this report, as listed in
Table 8. It was found that the reduction of the permeability is proportional to the clay
volume. In addition, it was observed that the co-polymer showed better barrier
properties compared to the PBMA. The enhancement of co-polymer barrier membranes
was attributed to the addition of methyl methacrylate monomer (MMA) to the
preparation processes in which the addition of more MMA led to more enhancements
in the permeability. Moreover, the authors suggested that the preparation of
nanocomposites by solution polymerisation leads to greater improvement in the barrier
properties compared to preparation via emulsion polymerisation. This observation was
based on the comparison between the results by (341) and the current study. The
difference in the outcome properties of the different preparation methods was traced to
the optimal dispersion level that can be achieved. The emulsion polymerisation
produces the barrier membranes via the cast from the colloidal suspension, including
the matrix particles covered by the clay layers. Thus, the size of the polymer particles
limits the dispersion level of the clay layers to the particle‟s dimensions. However, the
solution polymerisation technique provides a better dispersion level between the
layered silicate and polymer as the last position of clay layers in the polymer is
diffusion-limited.
Table 8 Various polymers and clays that were used in this study (340).
Clay Polymer Clay polymer
Poly(n-butyl methacrylate) poly(n-butyl methacrylate-co-methyl methacrylate)
0 PBMA 0 CPBM/80-20
1 PBMA/1 1 CPBM/80-20/1
3 PBMA/3 3 CPBM/80-20/3
5 PBMA/5 5 CPBM/80-20/5
5 CPBM/90-10/5
5 CPBM/70-30/5
5 CPBM/60-40/5
(the numbers after CPBM represents the ratio between butyl methacrylate: methyl methacrylate)
Jawahar P et al. (342) revealed that the addition of layered silicate into the polyester
polymer enhanced the barrier properties. In consequence, the wear resistance was also
improved as the layered silicate created a protective layer on the matrix.
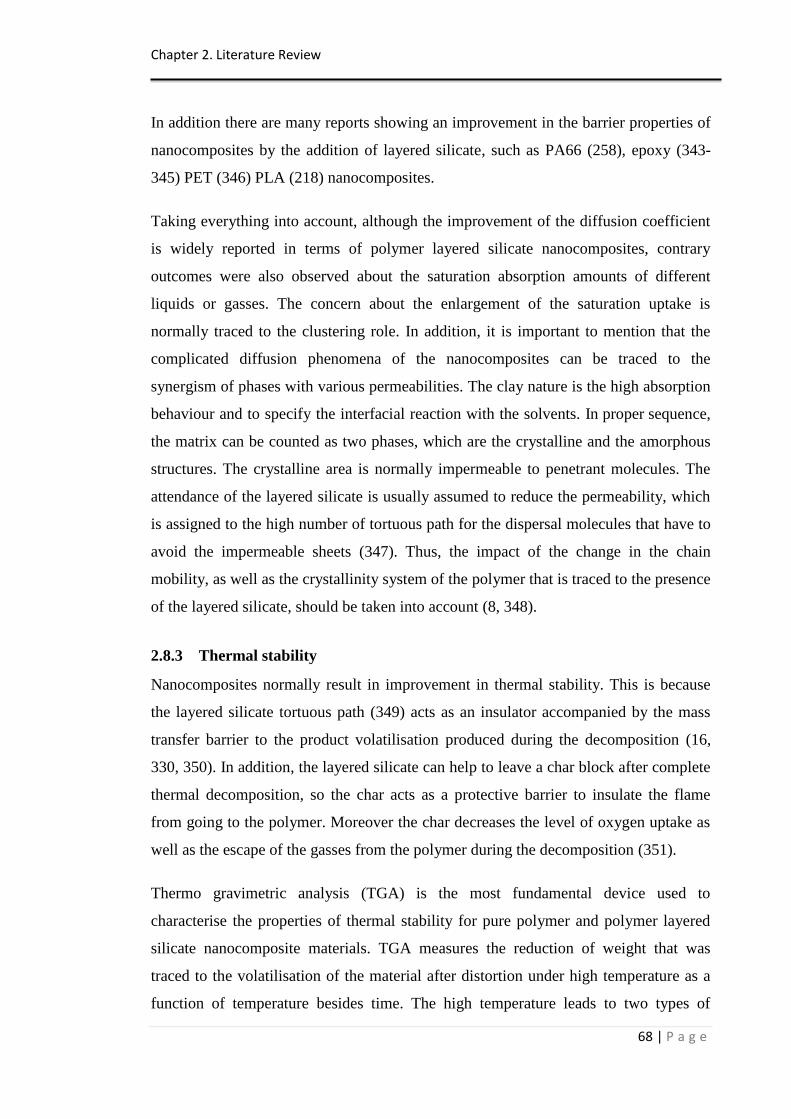
Chapter 2. Literature Review
68 | P a g e
In addition there are many reports showing an improvement in the barrier properties of
nanocomposites by the addition of layered silicate, such as PA66 (258), epoxy (343-
345) PET (346) PLA (218) nanocomposites.
Taking everything into account, although the improvement of the diffusion coefficient
is widely reported in terms of polymer layered silicate nanocomposites, contrary
outcomes were also observed about the saturation absorption amounts of different
liquids or gasses. The concern about the enlargement of the saturation uptake is
normally traced to the clustering role. In addition, it is important to mention that the
complicated diffusion phenomena of the nanocomposites can be traced to the
synergism of phases with various permeabilities. The clay nature is the high absorption
behaviour and to specify the interfacial reaction with the solvents. In proper sequence,
the matrix can be counted as two phases, which are the crystalline and the amorphous
structures. The crystalline area is normally impermeable to penetrant molecules. The
attendance of the layered silicate is usually assumed to reduce the permeability, which
is assigned to the high number of tortuous path for the dispersal molecules that have to
avoid the impermeable sheets (347). Thus, the impact of the change in the chain
mobility, as well as the crystallinity system of the polymer that is traced to the presence
of the layered silicate, should be taken into account (8, 348).
2.8.3 Thermal stability
Nanocomposites normally result in improvement in thermal stability. This is because
the layered silicate tortuous path (349) acts as an insulator accompanied by the mass
transfer barrier to the product volatilisation produced during the decomposition (16,
330, 350). In addition, the layered silicate can help to leave a char block after complete
thermal decomposition, so the char acts as a protective barrier to insulate the flame
from going to the polymer. Moreover the char decreases the level of oxygen uptake as
well as the escape of the gasses from the polymer during the decomposition (351).
Thermo gravimetric analysis (TGA) is the most fundamental device used to
characterise the properties of thermal stability for pure polymer and polymer layered
silicate nanocomposite materials. TGA measures the reduction of weight that was
traced to the volatilisation of the material after distortion under high temperature as a
function of temperature besides time. The high temperature leads to two types of
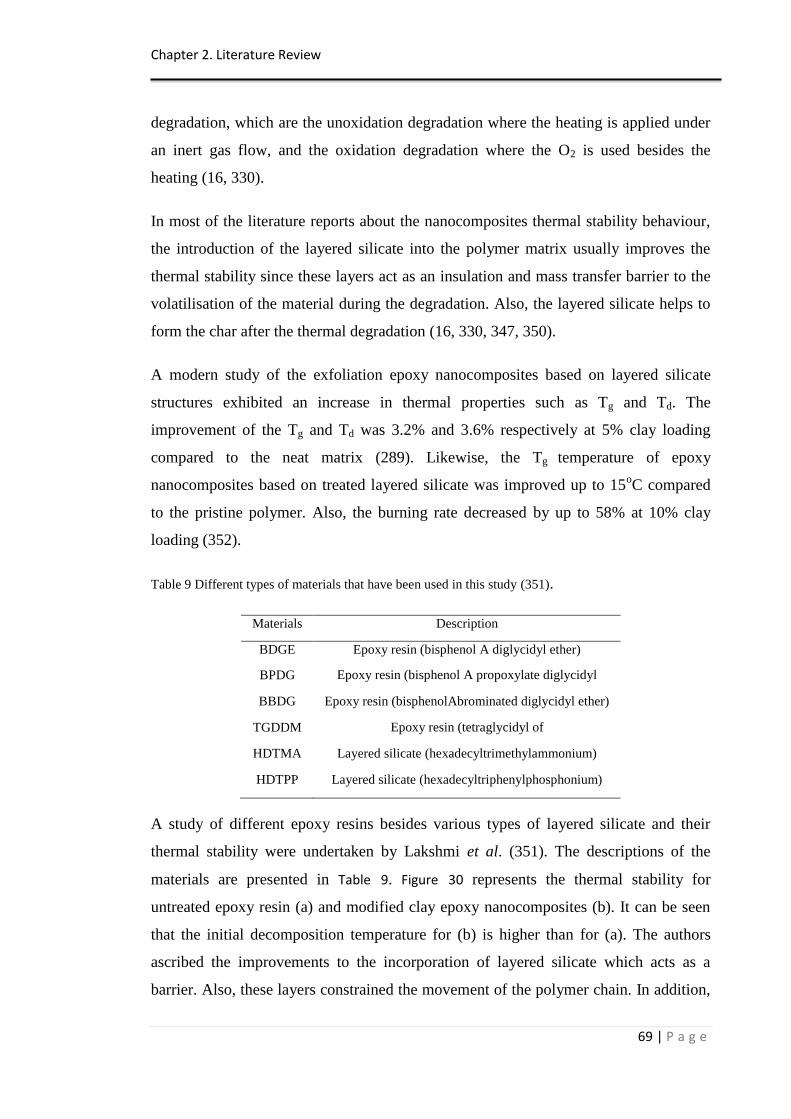
Chapter 2. Literature Review
69 | P a g e
degradation, which are the unoxidation degradation where the heating is applied under
an inert gas flow, and the oxidation degradation where the O2 is used besides the
heating (16, 330).
In most of the literature reports about the nanocomposites thermal stability behaviour,
the introduction of the layered silicate into the polymer matrix usually improves the
thermal stability since these layers act as an insulation and mass transfer barrier to the
volatilisation of the material during the degradation. Also, the layered silicate helps to
form the char after the thermal degradation (16, 330, 347, 350).
A modern study of the exfoliation epoxy nanocomposites based on layered silicate
structures exhibited an increase in thermal properties such as Tg and Td. The
improvement of the Tg and Td was 3.2% and 3.6% respectively at 5% clay loading
compared to the neat matrix (289). Likewise, the Tg temperature of epoxy
nanocomposites based on treated layered silicate was improved up to 15oC compared
to the pristine polymer. Also, the burning rate decreased by up to 58% at 10% clay
loading (352).
Table 9 Different types of materials that have been used in this study (351).
Materials Description
BDGE Epoxy resin (bisphenol A diglycidyl ether)
BPDG Epoxy resin (bisphenol A propoxylate diglycidyl
ether) BBDG Epoxy resin (bisphenolAbrominated diglycidyl ether)
TGDDM Epoxy resin (tetraglycidyl of
diaminodiphenylmethane) HDTMA Layered silicate (hexadecyltrimethylammonium)
HDTPP Layered silicate (hexadecyltriphenylphosphonium)
A study of different epoxy resins besides various types of layered silicate and their
thermal stability were undertaken by Lakshmi et al. (351). The descriptions of the
materials are presented in Table 9. Figure 30 represents the thermal stability for
untreated epoxy resin (a) and modified clay epoxy nanocomposites (b). It can be seen
that the initial decomposition temperature for (b) is higher than for (a). The authors
ascribed the improvements to the incorporation of layered silicate which acts as a
barrier. Also, these layers constrained the movement of the polymer chain. In addition,
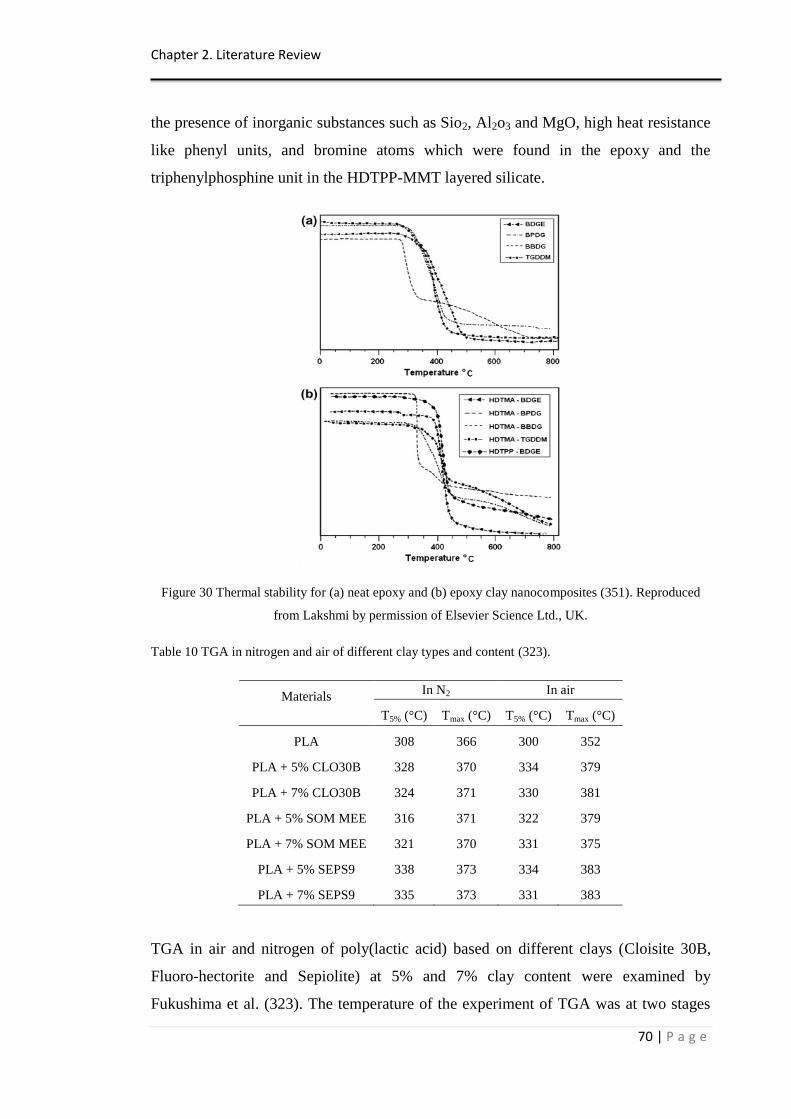
Chapter 2. Literature Review
70 | P a g e
the presence of inorganic substances such as Sio2, Al2o3 and MgO, high heat resistance
like phenyl units, and bromine atoms which were found in the epoxy and the
triphenylphosphine unit in the HDTPP-MMT layered silicate.
Figure 30 Thermal stability for (a) neat epoxy and (b) epoxy clay nanocomposites (351). Reproduced
from Lakshmi by permission of Elsevier Science Ltd., UK.
Table 10 TGA in nitrogen and air of different clay types and content (323).
Materials
In N2 In air
T5% (°C) Tmax (°C) T5% (°C) Tmax (°C)
PLA 308 366 300 352
PLA + 5% CLO30B 328 370 334 379
PLA + 7% CLO30B 324 371 330 381
PLA + 5% SOM MEE 316 371 322 379
PLA + 7% SOM MEE 321 370 331 375
PLA + 5% SEPS9 338 373 334 383
PLA + 7% SEPS9 335 373 331 383
TGA in air and nitrogen of poly(lactic acid) based on different clays (Cloisite 30B,
Fluoro-hectorite and Sepiolite) at 5% and 7% clay content were examined by
Fukushima et al. (323). The temperature of the experiment of TGA was at two stages
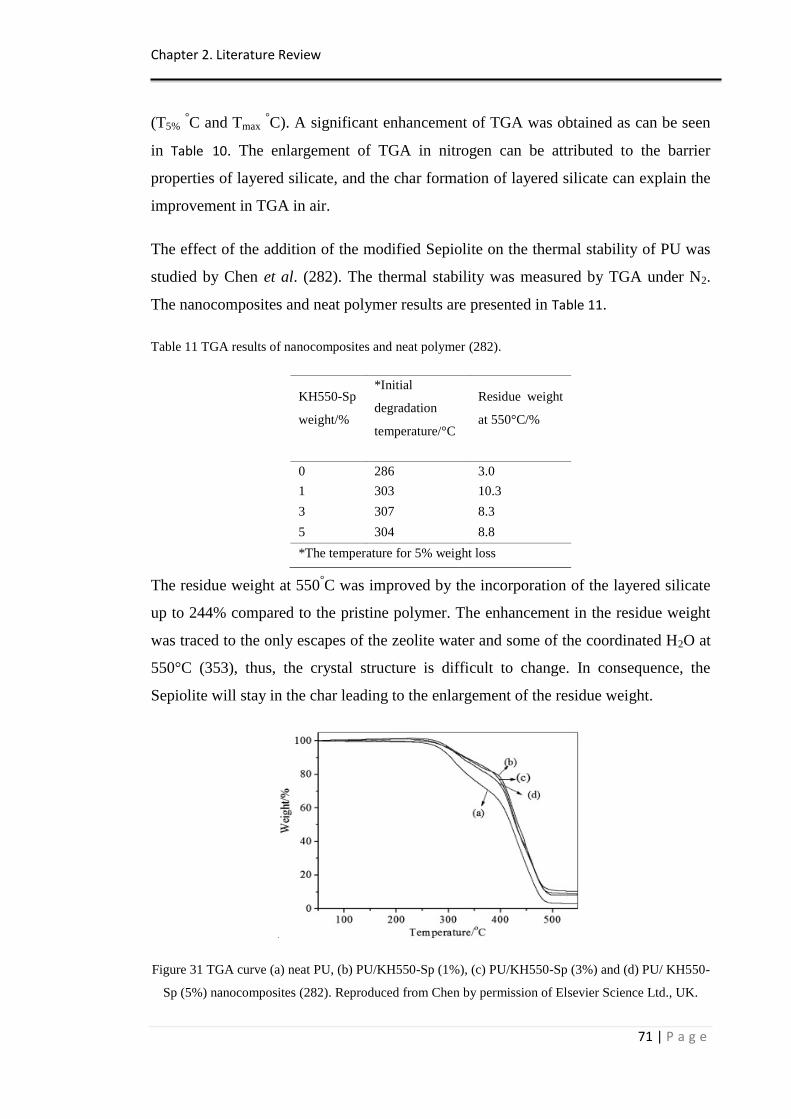
Chapter 2. Literature Review
71 | P a g e
(T5% °C and Tmax
°C). A significant enhancement of TGA was obtained as can be seen
in Table 10. The enlargement of TGA in nitrogen can be attributed to the barrier
properties of layered silicate, and the char formation of layered silicate can explain the
improvement in TGA in air.
The effect of the addition of the modified Sepiolite on the thermal stability of PU was
studied by Chen et al. (282). The thermal stability was measured by TGA under N2.
The nanocomposites and neat polymer results are presented in Table 11.
Table 11 TGA results of nanocomposites and neat polymer (282).
KH550-Sp
weight/%
*Initial
degradation
temperature/°C
Residue weight
at 550°C/%
0 286 3.0
1 303 10.3
3 307 8.3
5 304 8.8
*The temperature for 5% weight loss
The residue weight at 550°C was improved by the incorporation of the layered silicate
up to 244% compared to the pristine polymer. The enhancement in the residue weight
was traced to the only escapes of the zeolite water and some of the coordinated H2O at
550°C (353), thus, the crystal structure is difficult to change. In consequence, the
Sepiolite will stay in the char leading to the enlargement of the residue weight.
Figure 31 TGA curve (a) neat PU, (b) PU/KH550-Sp (1%), (c) PU/KH550-Sp (3%) and (d) PU/ KH550-
Sp (5%) nanocomposites (282). Reproduced from Chen by permission of Elsevier Science Ltd., UK.
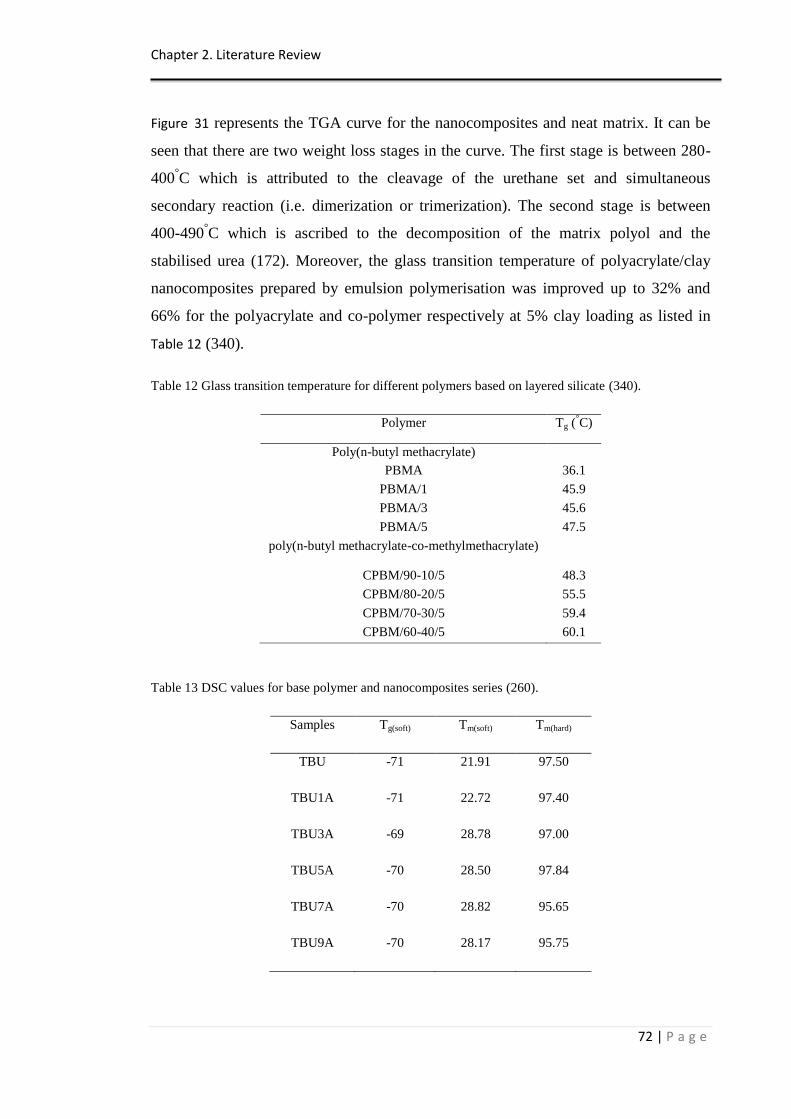
Chapter 2. Literature Review
72 | P a g e
Figure 31 represents the TGA curve for the nanocomposites and neat matrix. It can be
seen that there are two weight loss stages in the curve. The first stage is between 280-
400°C which is attributed to the cleavage of the urethane set and simultaneous
secondary reaction (i.e. dimerization or trimerization). The second stage is between
400-490°C which is ascribed to the decomposition of the matrix polyol and the
stabilised urea (172). Moreover, the glass transition temperature of polyacrylate/clay
nanocomposites prepared by emulsion polymerisation was improved up to 32% and
66% for the polyacrylate and co-polymer respectively at 5% clay loading as listed in
Table 12 (340).
Table 12 Glass transition temperature for different polymers based on layered silicate (340).
Polymer Tg (°C)
Poly(n-butyl methacrylate)
PBMA 36.1
PBMA/1 45.9
PBMA/3 45.6
PBMA/5 47.5
poly(n-butyl methacrylate-co-methylmethacrylate)
CPBM/90-10/5 48.3
CPBM/80-20/5 55.5
CPBM/70-30/5 59.4
CPBM/60-40/5 60.1
Table 13 DSC values for base polymer and nanocomposites series (260).
Samples Tg(soft) Tm(soft) Tm(hard)
TBU -71 21.91 97.50
TBU1A -71 22.72 97.40
TBU3A -69 28.78 97.00
TBU5A -70 28.50 97.84
TBU7A -70 28.82 95.65
TBU9A -70 28.17 95.75
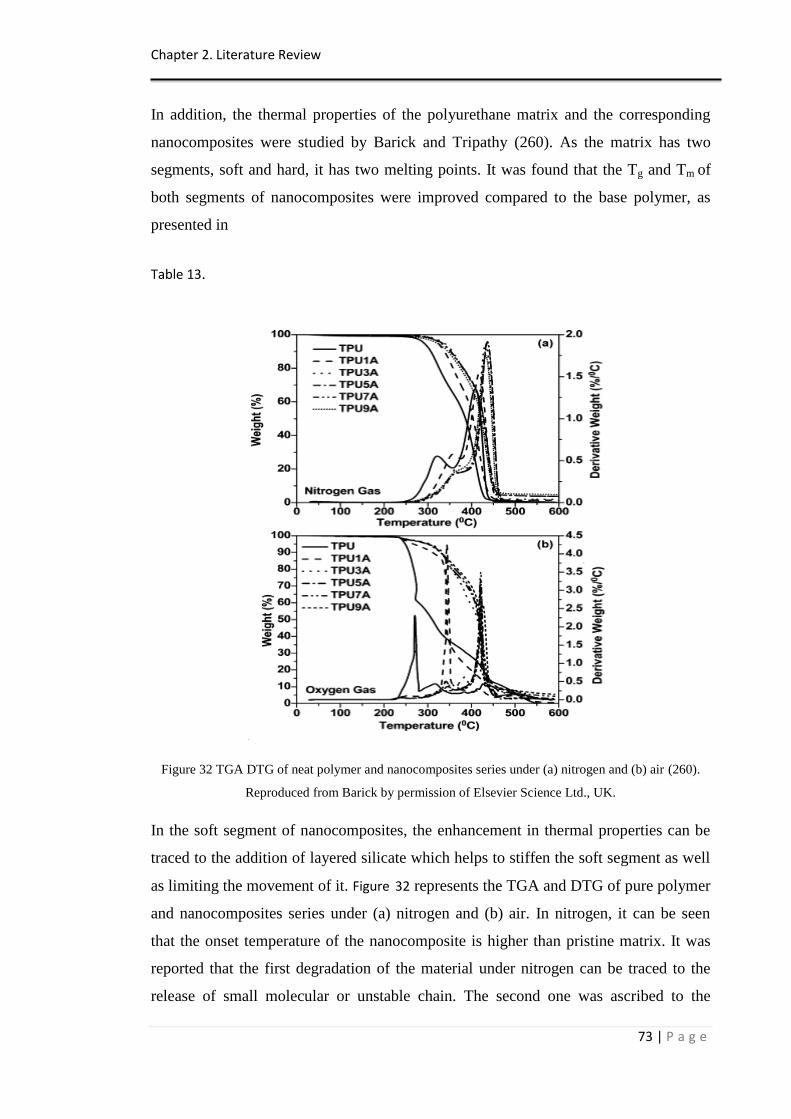
Chapter 2. Literature Review
73 | P a g e
In addition, the thermal properties of the polyurethane matrix and the corresponding
nanocomposites were studied by Barick and Tripathy (260). As the matrix has two
segments, soft and hard, it has two melting points. It was found that the Tg and Tm of
both segments of nanocomposites were improved compared to the base polymer, as
presented in
Table 13.
Figure 32 TGA DTG of neat polymer and nanocomposites series under (a) nitrogen and (b) air (260).
Reproduced from Barick by permission of Elsevier Science Ltd., UK.
In the soft segment of nanocomposites, the enhancement in thermal properties can be
traced to the addition of layered silicate which helps to stiffen the soft segment as well
as limiting the movement of it. Figure 32 represents the TGA and DTG of pure polymer
and nanocomposites series under (a) nitrogen and (b) air. In nitrogen, it can be seen
that the onset temperature of the nanocomposite is higher than pristine matrix. It was
reported that the first degradation of the material under nitrogen can be traced to the
release of small molecular or unstable chain. The second one was ascribed to the
Chapter 2. Literature Review
74 | P a g e
degradation of the matrix backbone. The residue was obtained at 500°C and enhanced
by the increasing of layered silicate.
TGA and DTG in air represented four degradation steps. The first was attributed to the
division of the urethane linkage to shape alcohols and isocyanates. The decomposition
of the polyol chain in O2 gas to yield volatile gaseous products (aldehydes, water,
carbon dioxide, etc) was the second stage of decomposition. This will help to hinder
the formation of metastable products which explains the decrease in their DTG peak.
The third stage was assigned to the prevention of completed volatilisation of the
resulting alcohol and isocyanates chain by dimerisation of isocyanates to carbodiimdes
which interact with the alcohol combinations to provide the stable urea that
decomposed. Higher amounts of residue in air were found at 400°C compared to the
nitrogen test. This was attributed to the formation of the metastable oxidation product
at that temperature. The last degradation was traced to the degradation of polymer
backbone.
Table 14 Chemical combinations and molecular weights of poly(HB/PCL-PEG-PCL) urethanes (354).
Sample code
Compositions a Mn
b/g
/
mol
Mw/Mnb
PHB/
wt.%
PCL/wt.
%
PEG/wt.
%
Connect
unit/wt.
% UPCL-PEG-PCL-HB30 (A1) 29.1 52.3 11.8 6.8 41.50
0
2.4
UPCL-PEG-PCL-HB50 (A2) 49.5 36.4 7.8 6.3 37.20
0
2.3
UPCL-PEG-PCL-HB70 (A3) 68.9 20.7 4.6 5.8 31.00
0
2.6 a Determined from 1 HNMR spectra, expected error 3%.
b Determined from GPC in CHCl3 at 30 °C.
A recent study on the thermal stability behaviour under nitrogen of poly(PHB/PCL-
PEG-PCL) urethanes based on organic MMT modification was carried out by Naguib
et al. (354). TGA and DTGA tests were used to evaluate the samples. Different
polymer compositions were utilised as can be seen in Table 14. Figure 33 represents the
TGA and DTGA curves of the A2 neat sample and the corresponding nanocomposites
samples of 5% and 10% modified MMT. It can be seen that the addition of layered
silicate to the polymer matrix can improve the thermal stability. The thermal
degradation of A1, A2 and A3 neat as well as nanocomposites samples are listed in
Table 15. The char yield was improved by the enlargement of clay loading. The
improvement in thermal stability was ascribed to the nature of layered silicate that
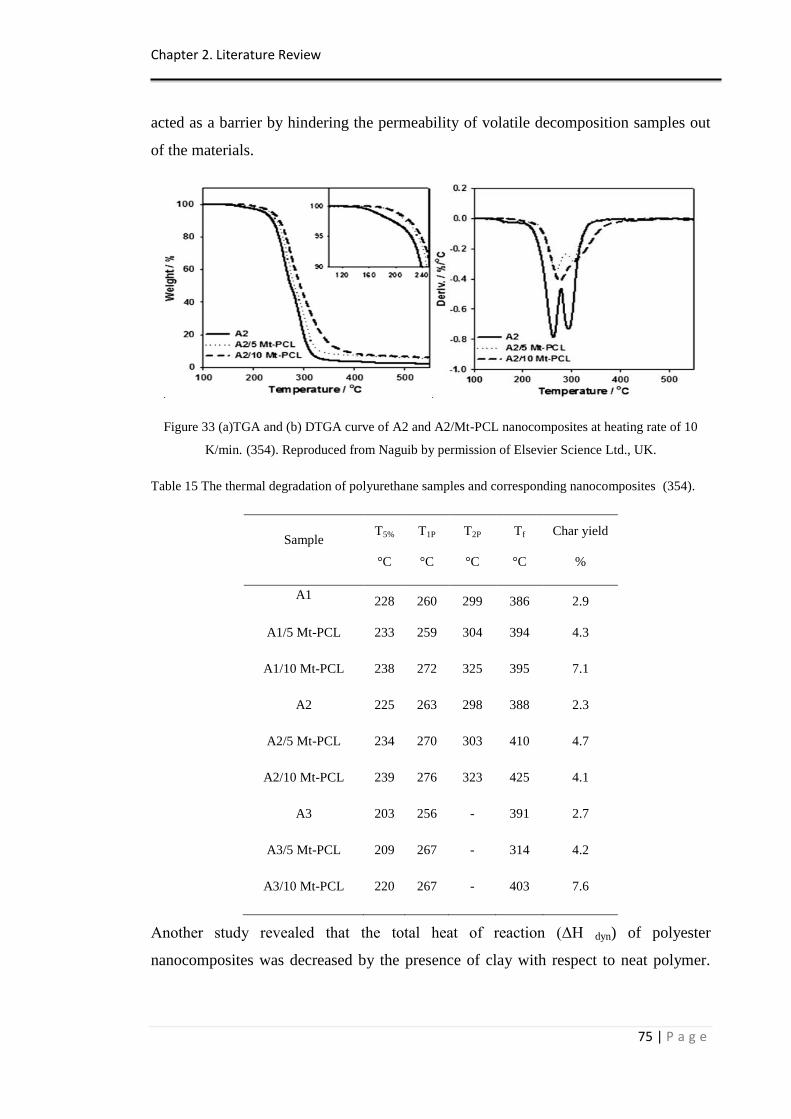
Chapter 2. Literature Review
75 | P a g e
acted as a barrier by hindering the permeability of volatile decomposition samples out
of the materials.
Figure 33 (a)TGA and (b) DTGA curve of A2 and A2/Mt-PCL nanocomposites at heating rate of 10
K/min. (354). Reproduced from Naguib by permission of Elsevier Science Ltd., UK.
Table 15 The thermal degradation of polyurethane samples and corresponding nanocomposites (354).
Sample T5%
°C
T1P
°C
T2P
°C
Tf
°C
Char yield
%
A1 228 260 299 386 2.9
A1/5 Mt-PCL 233 259 304 394 4.3
A1/10 Mt-PCL 238 272 325 395 7.1
A2 225 263 298 388 2.3
A2/5 Mt-PCL 234 270 303 410 4.7
A2/10 Mt-PCL 239 276 323 425 4.1
A3 203 256 - 391 2.7
A3/5 Mt-PCL 209 267 - 314 4.2
A3/10 Mt-PCL 220 267 - 403 7.6
Another study revealed that the total heat of reaction (ΔH dyn) of polyester
nanocomposites was decreased by the presence of clay with respect to neat polymer.
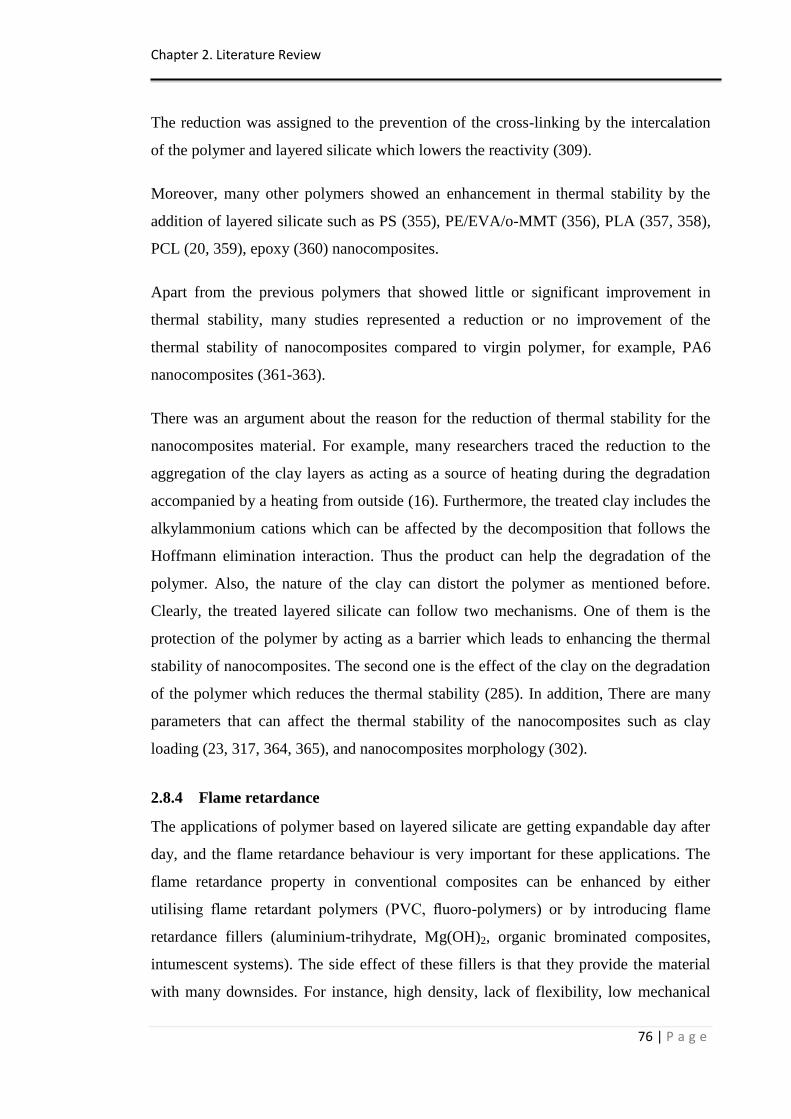
Chapter 2. Literature Review
76 | P a g e
The reduction was assigned to the prevention of the cross-linking by the intercalation
of the polymer and layered silicate which lowers the reactivity (309).
Moreover, many other polymers showed an enhancement in thermal stability by the
addition of layered silicate such as PS (355), PE/EVA/o-MMT (356), PLA (357, 358),
PCL (20, 359), epoxy (360) nanocomposites.
Apart from the previous polymers that showed little or significant improvement in
thermal stability, many studies represented a reduction or no improvement of the
thermal stability of nanocomposites compared to virgin polymer, for example, PA6
nanocomposites (361-363).
There was an argument about the reason for the reduction of thermal stability for the
nanocomposites material. For example, many researchers traced the reduction to the
aggregation of the clay layers as acting as a source of heating during the degradation
accompanied by a heating from outside (16). Furthermore, the treated clay includes the
alkylammonium cations which can be affected by the decomposition that follows the
Hoffmann elimination interaction. Thus the product can help the degradation of the
polymer. Also, the nature of the clay can distort the polymer as mentioned before.
Clearly, the treated layered silicate can follow two mechanisms. One of them is the
protection of the polymer by acting as a barrier which leads to enhancing the thermal
stability of nanocomposites. The second one is the effect of the clay on the degradation
of the polymer which reduces the thermal stability (285). In addition, There are many
parameters that can affect the thermal stability of the nanocomposites such as clay
loading (23, 317, 364, 365), and nanocomposites morphology (302).
2.8.4 Flame retardance
The applications of polymer based on layered silicate are getting expandable day after
day, and the flame retardance behaviour is very important for these applications. The
flame retardance property in conventional composites can be enhanced by either
utilising flame retardant polymers (PVC, fluoro-polymers) or by introducing flame
retardance fillers (aluminium-trihydrate, Mg(OH)2, organic brominated composites,
intumescent systems). The side effect of these fillers is that they provide the material
with many downsides. For instance, high density, lack of flexibility, low mechanical
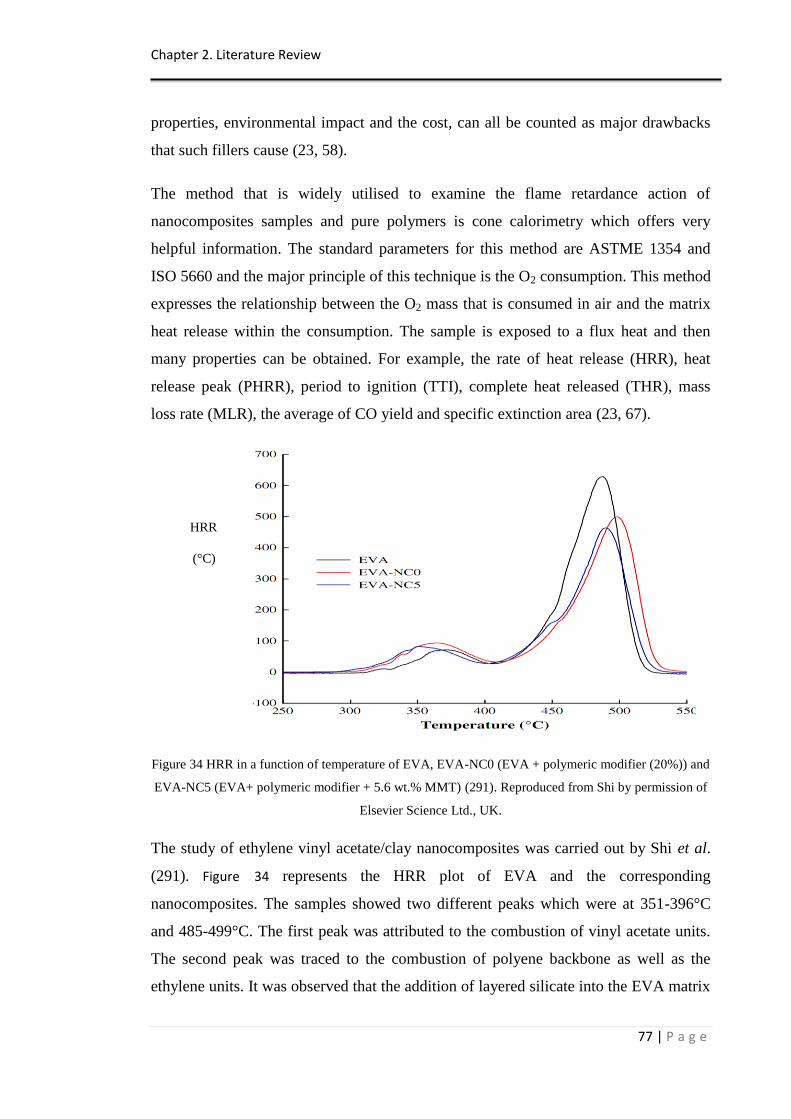
Chapter 2. Literature Review
77 | P a g e
properties, environmental impact and the cost, can all be counted as major drawbacks
that such fillers cause (23, 58).
The method that is widely utilised to examine the flame retardance action of
nanocomposites samples and pure polymers is cone calorimetry which offers very
helpful information. The standard parameters for this method are ASTME 1354 and
ISO 5660 and the major principle of this technique is the O2 consumption. This method
expresses the relationship between the O2 mass that is consumed in air and the matrix
heat release within the consumption. The sample is exposed to a flux heat and then
many properties can be obtained. For example, the rate of heat release (HRR), heat
release peak (PHRR), period to ignition (TTI), complete heat released (THR), mass
loss rate (MLR), the average of CO yield and specific extinction area (23, 67).
Figure 34 HRR in a function of temperature of EVA, EVA-NC0 (EVA + polymeric modifier (20%)) and
EVA-NC5 (EVA+ polymeric modifier + 5.6 wt.% MMT) (291). Reproduced from Shi by permission of
Elsevier Science Ltd., UK.
The study of ethylene vinyl acetate/clay nanocomposites was carried out by Shi et al.
(291). Figure 34 represents the HRR plot of EVA and the corresponding
nanocomposites. The samples showed two different peaks which were at 351-396°C
and 485-499°C. The first peak was attributed to the combustion of vinyl acetate units.
The second peak was traced to the combustion of polyene backbone as well as the
ethylene units. It was observed that the addition of layered silicate into the EVA matrix
HRR
(°C)
Chapter 2. Literature Review
78 | P a g e
led to decrease the HRR value. In addition the THR which helps to maintain the
amount of fire hazard was decreased by the addition of layered silicate up to 16%.
Moreover, the authors revealed that the intercalation and exfoliation nanocomposites
structure exhibited almost the same amount of HRR and THR which indicated that the
flame retardance properties did not depend on the nanocomposites structure like other
properties.
Wang et al. (366) used a reactive phosphorous beside the layered silicate 5% based on
epoxy resin. The particles provide an enhancement in the limiting oxygen index, so
these fillers help to improve the flame retardance properties. The authors traced the
improvement of the flame retardance properties for nanocomposites compared to the
neat polymer to the synergism influence of phosphonium ions and the layered silicate.
Also, the exfoliation structure of nanocomposites that was obtained helps to improve
their properties. Moreover, an enhancement in the flame retardance behaviour of
nanocomposites can be obtained by the addition of epoxy carbon fibre composites
beside the layered silicate (367).
There are many studies that revealed an improvement of flame retardance for the
nanocomposites with respect to the neat matrix. For instance epoxy/clay (168, 368), PS
and PU based on a polymeric flame retardant and layered silicate (369), PLA/MMT
and Sepiolite (298), PP/ organoclay (370), PE / organoclay (285, 371), and EVA /
organoclay (371, 372) nanocomposites.
From the preceding information it can be easily understood that the reason for the
enhancement of the flame retardance properties for nanocomposites materials is
because the char formation acts as a barrier to protect the matrix. Also, to reduce the
heat and mass transfer from the flame to the polymer (23, 58) as well as slowing down
the matrix O2 uptake accompanied with the reduction of volatiles (23, 58, 328, 373-
375). In the polymer matrix nanocomposites based on layered silicate, the char
formation can be seen as a ceramic layer after the combustion of silicate layers (328,
356, 374). The char formation which was counted as a ceramic layer was obtained
from the intercalated nanocomposites structure as examined via XRD and TEM (373).
Chapter 2. Literature Review
79 | P a g e
In conclusion, although the satisfactory testing of the flame retardance on the
nanocomposites samples was in place, many reports need to be done in order to find
out the usage and limitation of these materials in a practical way (58).
2.8.5 Optical property
The traditional composites usually exhibit a dark colour to the final product which
decreases the optically property (376). However, the nanocomposites normally do not
affect the optical property of the materials. This is attributed to the size of the sheets of
the layered silicate which is 1 nm thick. Thus, the incorporation of layered silicate into
the polymer does not have a strong influence on the clarity of the samples (11, 328).
Also, it was observed that the nanoparticles influence the overall optical properties;
however, the effect is still reasonable with respect to conventional composites. In
addition, at small amounts of layered silicate (i.e. 1-3 wt.%), there is not much change
in colour and optical properties. The exfoliation structure of nanocomposites being
optically clear which is traced to the thickness of each clay layer that is smaller than
the wavelength of visible light (216, 377).
2.8.6 Rheological properties
In order to understand the processibility of the materials, the calculation of the
rheological properties, including dynamic oscillatory shear or steady shear, should take
place (16, 330). The study of rheological behaviour of nanocomposites based on
layered silicate is very important for two objectives. The first one is the
nanocomposites preparation sometimes includes melt processing, such as injection
moulding. The second objective is that the nanocomposites materials are sensitive to
the morphology, fillers‟ size, shape, and surface features of the incorporation phase.
Thus, the rheological properties provide better understanding of dispersion in
nanocomposites and can act as a complement to conventional methods of the materials‟
characterisation (230, 275, 330).
The study of the effect of layered silicate on the EVA and EVA-g-MA matrix by using
a microcellular injection mould was carried out by Hwang et al. (314). This report
revealed the relationship between the shear of viscosity and rate at 190°C. Also, the
shear thinning was investigated. It was found that the shear thinning of grafted EVA
Chapter 2. Literature Review
80 | P a g e
exhibited was influenced by the clay volume. At low shear rate, the nanocomposites
represented a clay dependent behaviour whereas nanocomposites showed clay
independent action at high shear rate. The addition of layered silicate did not change
the shear thinning but affected the viscosity extent. In the case of EVA
nanocomposites, the same shear thinning behaviour for the neat and nanocomposites
samples were observed, but the viscosity was decreased by the increasing of clay
content which was attributed to the weak bonding between the matrix and layered
silicate. The results of shear viscosity and thinning were obtained by the power low
model and Rabinowitsch correction equations respectively.
Work was done by Franchini et al. (378) about the study of the rheological properties
of epoxy based on different types of layered silicate. It was revealed that the viscosity
depended on the kind of clay or the modifiers. In addition, the processing parameters
affected the resulting mixture.
In addition, the shear thinning of PA6 nanocomposites at high shear rates was almost
the same as the virgin polymer. Moreover, the melt viscosity of the nanocomposites
was lower than the neat matrix. The authors attributed the reduction in the viscosity to
slip between the polymer matrix and the exfoliation clay sheets during the large
amount of shear rate or the reduction of the molecular weight of the nylon due to the
hydrolysis in the presence of the nanofillers (275). Likewise, the incorporation of
layered silicate into medium and low molecular weight of nylon polymer reduced the
viscosity of the material (274).
2.9 Advantages of nanocomposites based on layered silicate
From the extensive literature, the matrix nanocomposites based on layered silicate
usually show better properties compared to traditional composites. For example,
thermal stability, barrier properties, flame retardance, as well as mechanical properties
such as stiffness, strength and DMA (379). These improvements in different properties
in nanocomposites materials can be achieved by only a small layered silicate fraction
volume. Thus, these materials provide much lighter weight compared to micro or
macro composites, which make them useful in applications for some specific
requirements (16). In addition, the nanocomposites materials can be achieved at the
final stage of processing, such as injection or extrusion, by introducing the layered
Chapter 2. Literature Review
81 | P a g e
silicate which indicates that there is a preferable thermodynamic interaction between
the two phases (the polymer and clay). Therefore, a matrix based on nanocomposites is
commercially preferable because of their flexibility in manufacturing (328). Most
traditional composites have trade-off properties such as weight, mechanical properties
and cost. However, nanocomposites materials that contain layered silicate normally
have a lack of trade-off properties. Also, these materials can be created without
compromising other important properties (8, 379, 380). Apart from these advantages,
the weight of polymer based on nanocomposites has a strong effect on the recycling of
products and environmental concerns. It was agreed that the wide use of these
materials could reduce the consumption of gasoline by up to 1.5 billion litres, which in
turn decreases CO2 emissions. The barrier properties play an important role in the
advantages of nanocomposites materials. For example, the packing of food is one of
the applications for nanocomposites (381). In addition, the transparency of the
nanocomposites is the same as virgin polymer (382). Clays seems to behave as a
nucleating agent, which induces a larger level of polymer crystallinity beside the
crystallization rate (260, 323). In addition, the incorporation of layered silicate enlarges
the biodegradation of the resulting materials (209, 383). This action can be ascribed to
the hydrophilicity of layered silicate which attracts water molecules to the mixture and
ends up speeding up the hydrolytic degradation of the polymer. Another reason can be
the different pHs that occur in the mixture from the nanofillers after water absorption
which can catalyse the enzymatic activity of de-composition and provide more
biodegradable materials (384).
2.10 Nanocomposites applications
From the preceding advantages of nanocomposites materials, different possible
manufacturing applications were recommended. Due to the high enhancement of
different kinds of properties of nanocomposites such as mechanical, thermal and
barrier properties, these composites can be used for various applications in aerospace,
defence, the automobile industries, building sections, food wrapping, adhesives,
tooling, sealants, moulding, electronics, casting and construction (74, 292, 385, 386).
In addition, the nanocomposites based on layered silicate can be known as anti-
corrosive materials (338). Thus, it can be used in the coating of anticorrosive
applications on aircraft.
Chapter 2. Literature Review
82 | P a g e
Nanocomposites based on layered silicate can be used on the building of bulk-modified
sensors for the anions detection. The particles will provide the electronic conductivity
to the system. Due to the use of such a study being natural, the product will act in an
environmentally friendly way (387). In addition the nanocomposites are used in the
field of electrochemical biosensors (388).
The use of Nylon-6/MMT helps to improve the flame retardant properties. Thus, this
kind of nanocomposite was found to be used in the floor sheet of the vehicles of
Japanese railways (389).
A combination of thermoplastic, olefin-layered silicate nanocomposites was designed
to be used for an external automotive body part (step-assistance). The utilisation of
2.5% layered silicate level was put in place. The weight of this product was much
lighter than normal composites by up to 10 times. This study was announced by
General Motors and partners Basell, Southern Clay Products and Blackhawk
Automotive Plastics. The reduction in weight was up to 20% of conventional
composites which depend on the nature of parts and materials that were substituted by
that combination of nanocomposites (8, 380).
2.11 Chapter Two summary
An extensive review which reveals recent studies in polymer nanocomposites based on
layered silicate is presented. The background, morphology, preparations and properties
of these materials are discussed. The review covers and discusses various modern
methods and equipment in the preparation of nanocomposites, deeply focussing on the
morphology of nanocomposites and its effect on the overall properties. Although
nanocomposites based on layered silicate have been known for a long time, they have
received far greater attention nowadays. This is because of the interesting study by the
Toyota Research Group into enhancing the properties of PA6 nanocomposites. It is
likely that this examination by Giannelis and his co-workers (84) enabled the creation
of nanocomposites by means of a simple melt-stirring of the polymer and clay. In
various conditions, the layered silicate must be treated before mixing with the polymer.
This is because it needs to be mixable with most polymers. The outcomes of different
structures, whether they form a nanocomposite or not, rely upon many factors. The
polymer, clay source and modification, and the type of preparation, are all factors that
Chapter 2. Literature Review
83 | P a g e
have an influence. With regard to the improvement of properties, most of the
exfoliation structure of nanocomposites gains by enhanced strength and modulus. Also,
the barrier properties, storage of modulus, thermal stability and flame retardance have
been improved, according to many reports. By contrast, there are concerns regarding
some properties such as elongation and toughness. In addition, some properties were
improved more by the intercalation structure compared to exfoliation nanocomposites,
such as toughening and impact. The aggregation of layered silicate imparted side
effects of the resulting properties such as in flame retardance where the aggregation
layers acted as a source of heating. Even though the number of nanocomposites papers
expand day by day, some reduction of the properties have not yet been understood.
Furthermore, the effect of the layered silicate reinforcement in the water absorption
behaviour seems to be not fully investigated in the current literature. Also, the
relationship between morphologies structure and its effect on the properties is not fully
studied and discussed.
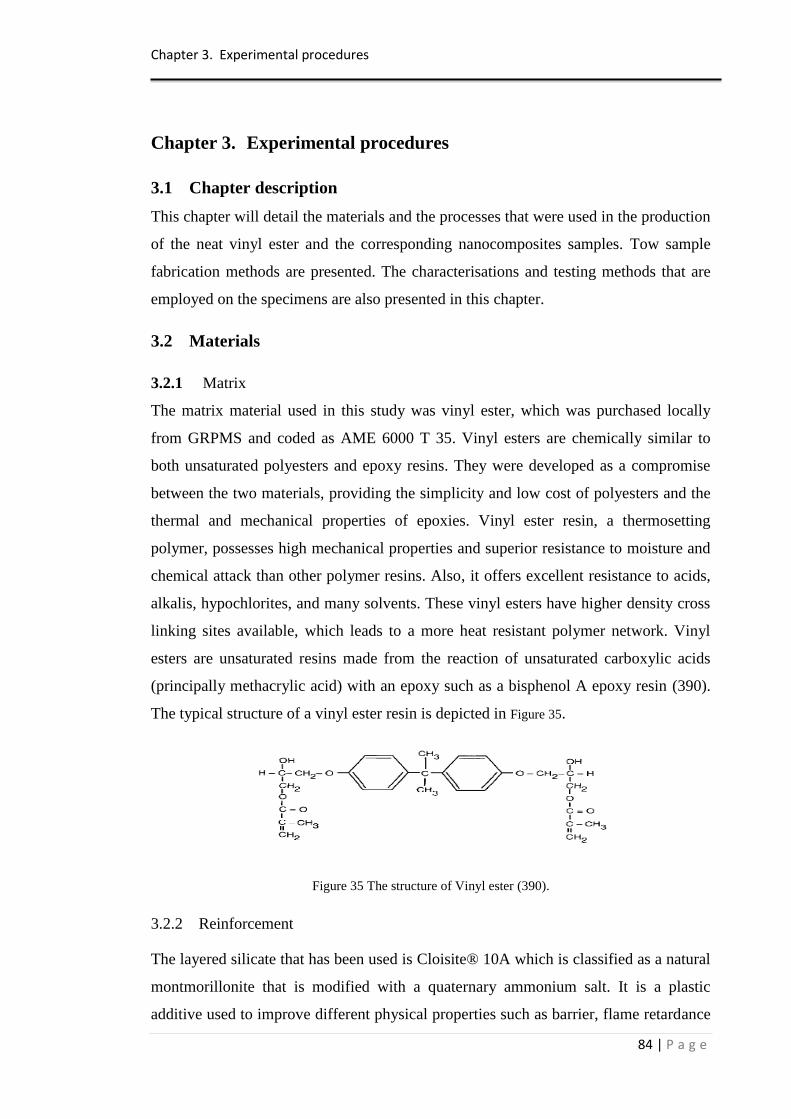
Chapter 3. Experimental procedures
84 | P a g e
Chapter 3. Experimental procedures
3.1 Chapter description
This chapter will detail the materials and the processes that were used in the production
of the neat vinyl ester and the corresponding nanocomposites samples. Tow sample
fabrication methods are presented. The characterisations and testing methods that are
employed on the specimens are also presented in this chapter.
3.2 Materials
3.2.1 Matrix
The matrix material used in this study was vinyl ester, which was purchased locally
from GRPMS and coded as AME 6000 T 35. Vinyl esters are chemically similar to
both unsaturated polyesters and epoxy resins. They were developed as a compromise
between the two materials, providing the simplicity and low cost of polyesters and the
thermal and mechanical properties of epoxies. Vinyl ester resin, a thermosetting
polymer, possesses high mechanical properties and superior resistance to moisture and
chemical attack than other polymer resins. Also, it offers excellent resistance to acids,
alkalis, hypochlorites, and many solvents. These vinyl esters have higher density cross
linking sites available, which leads to a more heat resistant polymer network. Vinyl
esters are unsaturated resins made from the reaction of unsaturated carboxylic acids
(principally methacrylic acid) with an epoxy such as a bisphenol A epoxy resin (390).
The typical structure of a vinyl ester resin is depicted in Figure 35.
Figure 35 The structure of Vinyl ester (390).
3.2.2 Reinforcement
The layered silicate that has been used is Cloisite® 10A which is classified as a natural
montmorillonite that is modified with a quaternary ammonium salt. It is a plastic
additive used to improve different physical properties such as barrier, flame retardance
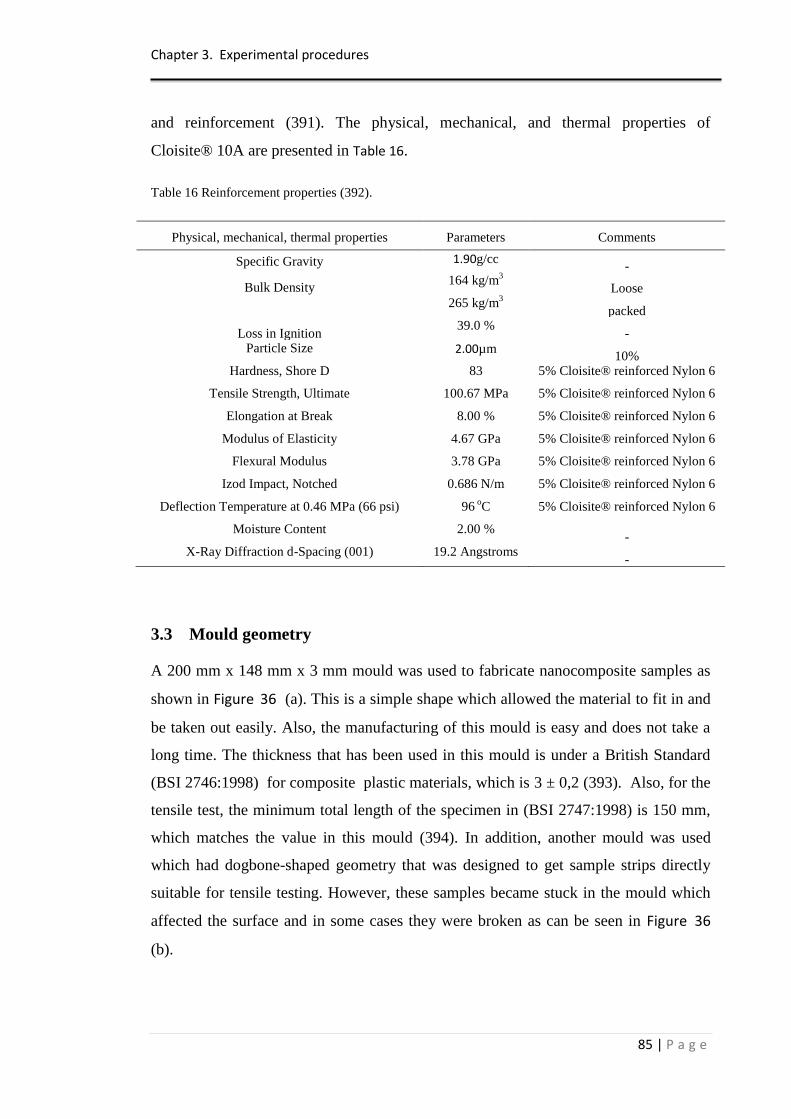
Chapter 3. Experimental procedures
85 | P a g e
and reinforcement (391). The physical, mechanical, and thermal properties of
Cloisite® 10A are presented in Table 16.
Table 16 Reinforcement properties (392).
Physical, mechanical, thermal properties Parameters Comments
Specific Gravity 1.90g/cc -
Bulk Density 164 kg/m
3
Loose 265 kg/m
3
packed
Loss in Ignition 39.0 %
- Particle Size 2.00µm
10% Hardness, Shore D 83 5% Cloisite® reinforced Nylon 6
Tensile Strength, Ultimate 100.67 MPa 5% Cloisite® reinforced Nylon 6
Elongation at Break 8.00 % 5% Cloisite® reinforced Nylon 6
Modulus of Elasticity 4.67 GPa 5% Cloisite® reinforced Nylon 6
Flexural Modulus 3.78 GPa 5% Cloisite® reinforced Nylon 6
Izod Impact, Notched 0.686 N/m 5% Cloisite® reinforced Nylon 6
Deflection Temperature at 0.46 MPa (66 psi) 96 oC 5% Cloisite® reinforced Nylon 6
Moisture Content 2.00 % -
X-Ray Diffraction d-Spacing (001) 19.2 Angstroms -
3.3 Mould geometry
A 200 mm x 148 mm x 3 mm mould was used to fabricate nanocomposite samples as
shown in Figure 36 (a). This is a simple shape which allowed the material to fit in and
be taken out easily. Also, the manufacturing of this mould is easy and does not take a
long time. The thickness that has been used in this mould is under a British Standard
(BSI 2746:1998) for composite plastic materials, which is 3 ± 0,2 (393). Also, for the
tensile test, the minimum total length of the specimen in (BSI 2747:1998) is 150 mm,
which matches the value in this mould (394). In addition, another mould was used
which had dogbone-shaped geometry that was designed to get sample strips directly
suitable for tensile testing. However, these samples became stuck in the mould which
affected the surface and in some cases they were broken as can be seen in Figure 36
(b).
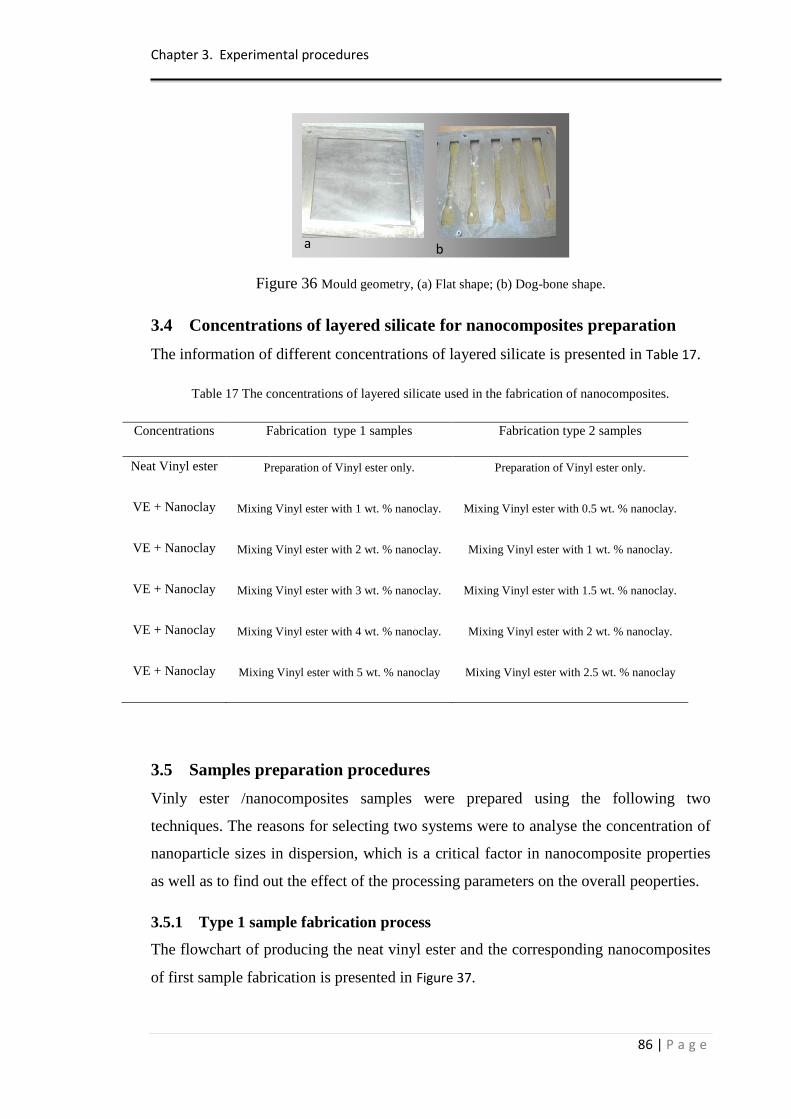
Chapter 3. Experimental procedures
86 | P a g e
Figure 36 Mould geometry, (a) Flat shape; (b) Dog-bone shape.
3.4 Concentrations of layered silicate for nanocomposites preparation
The information of different concentrations of layered silicate is presented in Table 17.
Table 17 The concentrations of layered silicate used in the fabrication of nanocomposites.
Concentrations Fabrication type 1 samples Fabrication type 2 samples
Neat Vinyl ester Preparation of Vinyl ester only. Preparation of Vinyl ester only.
VE + Nanoclay Mixing Vinyl ester with 1 wt. % nanoclay. Mixing Vinyl ester with 0.5 wt. % nanoclay.
VE + Nanoclay Mixing Vinyl ester with 2 wt. % nanoclay. Mixing Vinyl ester with 1 wt. % nanoclay.
VE + Nanoclay Mixing Vinyl ester with 3 wt. % nanoclay. Mixing Vinyl ester with 1.5 wt. % nanoclay.
VE + Nanoclay Mixing Vinyl ester with 4 wt. % nanoclay. Mixing Vinyl ester with 2 wt. % nanoclay.
VE + Nanoclay Mixing Vinyl ester with 5 wt. % nanoclay Mixing Vinyl ester with 2.5 wt. % nanoclay
3.5 Samples preparation procedures
Vinly ester /nanocomposites samples were prepared using the following two
techniques. The reasons for selecting two systems were to analyse the concentration of
nanoparticle sizes in dispersion, which is a critical factor in nanocomposite properties
as well as to find out the effect of the processing parameters on the overall peoperties.
3.5.1 Type 1 sample fabrication process
The flowchart of producing the neat vinyl ester and the corresponding nanocomposites
of first sample fabrication is presented in Figure 37.
a b
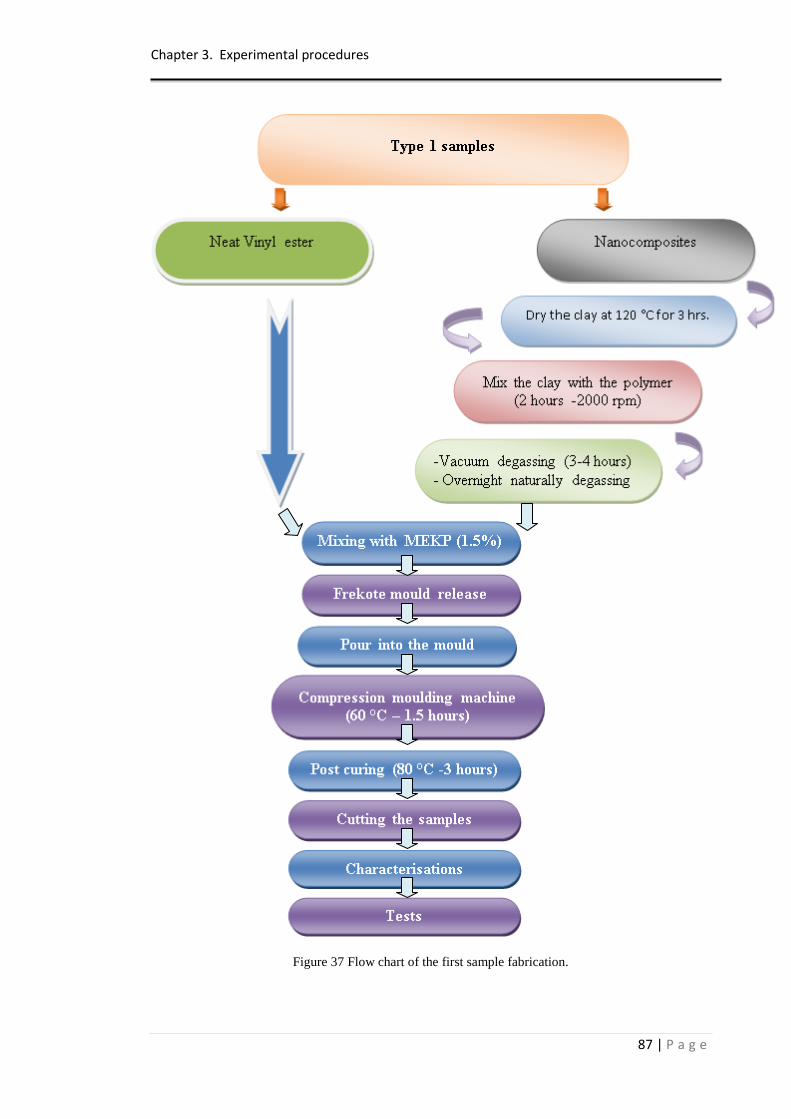
Chapter 3. Experimental procedures
87 | P a g e
Figure 37 Flow chart of the first sample fabrication.
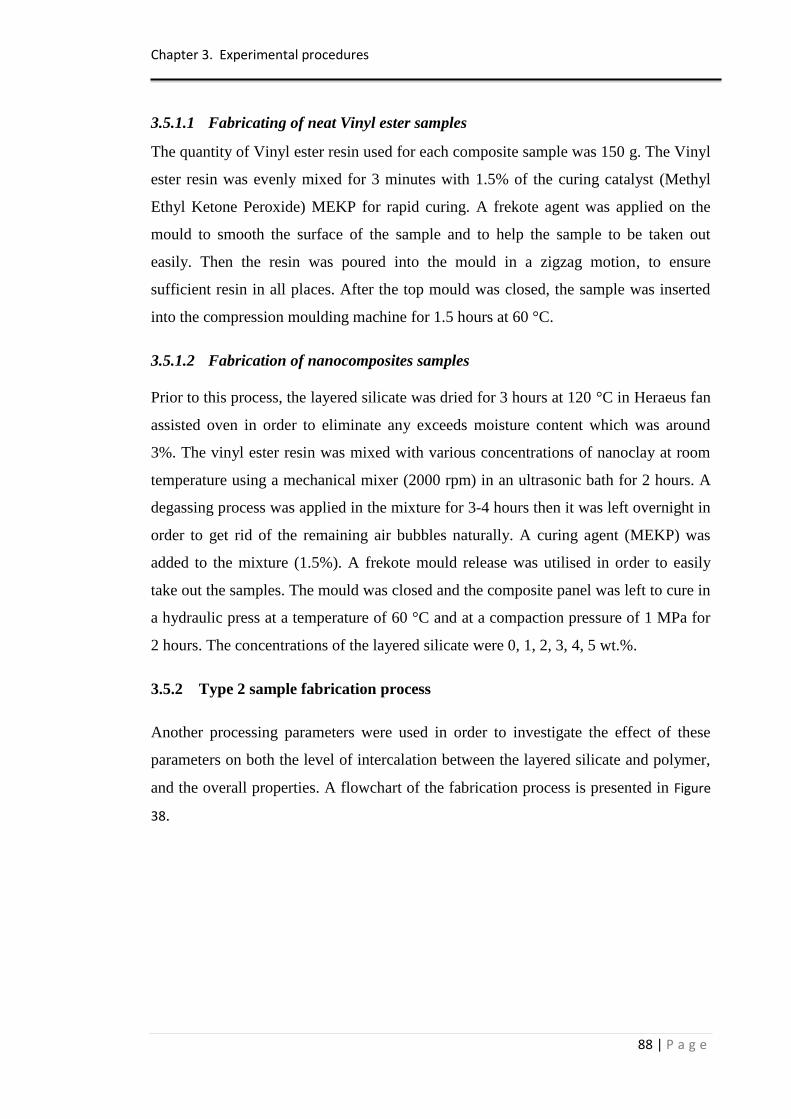
Chapter 3. Experimental procedures
88 | P a g e
3.5.1.1 Fabricating of neat Vinyl ester samples
The quantity of Vinyl ester resin used for each composite sample was 150 g. The Vinyl
ester resin was evenly mixed for 3 minutes with 1.5% of the curing catalyst (Methyl
Ethyl Ketone Peroxide) MEKP for rapid curing. A frekote agent was applied on the
mould to smooth the surface of the sample and to help the sample to be taken out
easily. Then the resin was poured into the mould in a zigzag motion, to ensure
sufficient resin in all places. After the top mould was closed, the sample was inserted
into the compression moulding machine for 1.5 hours at 60 °C.
3.5.1.2 Fabrication of nanocomposites samples
Prior to this process, the layered silicate was dried for 3 hours at 120 °C in Heraeus fan
assisted oven in order to eliminate any exceeds moisture content which was around
3%. The vinyl ester resin was mixed with various concentrations of nanoclay at room
temperature using a mechanical mixer (2000 rpm) in an ultrasonic bath for 2 hours. A
degassing process was applied in the mixture for 3-4 hours then it was left overnight in
order to get rid of the remaining air bubbles naturally. A curing agent (MEKP) was
added to the mixture (1.5%). A frekote mould release was utilised in order to easily
take out the samples. The mould was closed and the composite panel was left to cure in
a hydraulic press at a temperature of 60 °C and at a compaction pressure of 1 MPa for
2 hours. The concentrations of the layered silicate were 0, 1, 2, 3, 4, 5 wt.%.
3.5.2 Type 2 sample fabrication process
Another processing parameters were used in order to investigate the effect of these
parameters on both the level of intercalation between the layered silicate and polymer,
and the overall properties. A flowchart of the fabrication process is presented in Figure
38.
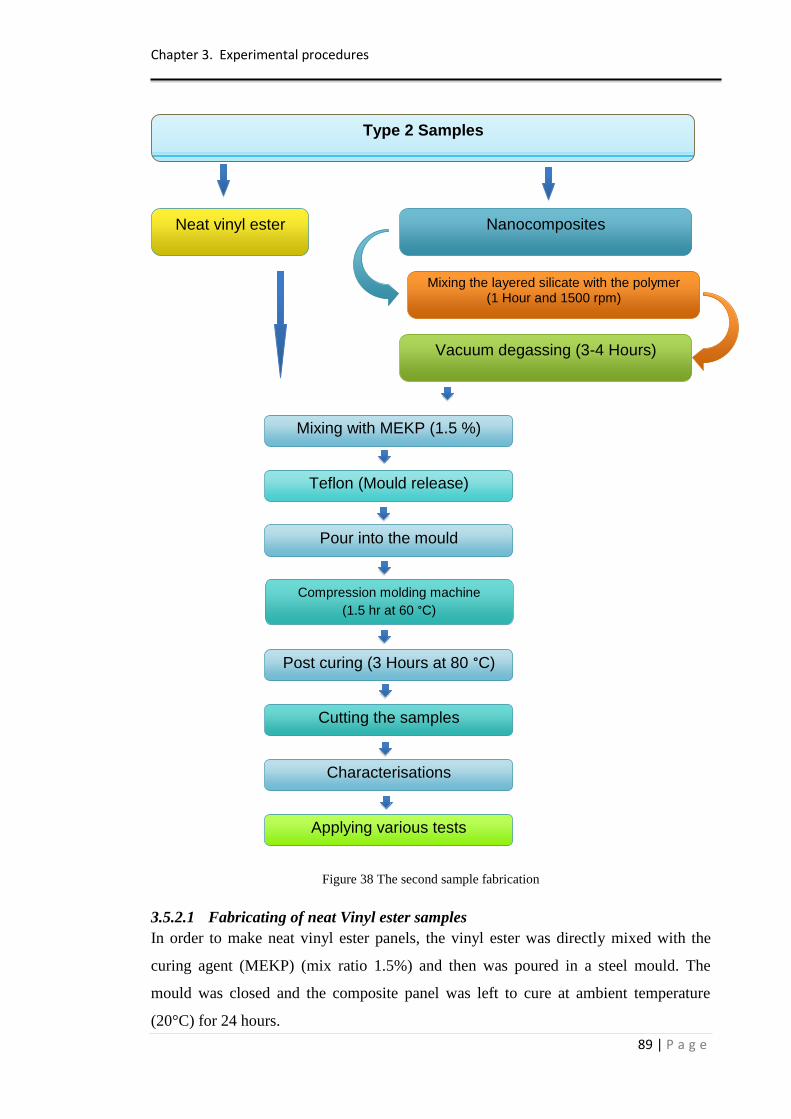
Chapter 3. Experimental procedures
89 | P a g e
Figure 38 The second sample fabrication
3.5.2.1 Fabricating of neat Vinyl ester samples
In order to make neat vinyl ester panels, the vinyl ester was directly mixed with the
curing agent (MEKP) (mix ratio 1.5%) and then was poured in a steel mould. The
mould was closed and the composite panel was left to cure at ambient temperature
(20°C) for 24 hours.
Type 2 Samples
Neat vinyl ester
Mixing with MEKP (1.5 %)
Teflon (Mould release)
Pour into the mould
Compression molding machine
(1.5 hr at 60 °C)
Post curing (3 Hours at 80 °C)
Cutting the samples
Characterisations
Applying various tests
Vacuum degassing (3-4 Hours)
Nanocomposites
Mixing the layered silicate with the polymer (1 Hour and 1500 rpm)
Chapter 3. Experimental procedures
90 | P a g e
3.5.2.2 Fabricating of Nanocomposites samples
The vinyl ester resin was mixed with various concentrations of nanoclay at room
temperature using a mechanical mixer in an ultrasonic bath for 1 hour. A degassing
process was applied in the mixture for 3-4 hours. A curing agent (MEKP) was added to
the mixture (1.5%) with further gentle mixing before transfer of the mixture to the steel
mould. The mould was closed and the composite panel was left to cure at ambient
temperature (20°C) for 24 hrs. The clay loadings of this fabrication lot were 0, 0.5, 1,
1.5, 2, and 2.5 wt.%.
3.5.3 Post curing
After all the sample fabrication steps of type 1 and type 2 were completed, all of the
samples were subjected to post curing through a fan oven for three hours at 85 0C
(Figure 39 (a)). The reason for post curing is that curing at low temperatures usually
does not happen evenly. Post curing resettles the samples uniformly and ensures that
all specimens have a complete curing. It also helps to settle the molecules and volatiles
of the composites. After the post curing, the colour of the samples changed which
indicated a fully post curing treatment (Figure 39 (b)).
Figure 39 Fan assisted oven for post curing; (a) before post curing, (b) after post curing.
3.5.4 Cutting preparation for various testing
Each test requires a specific cutting shape and dimensions. Table 18 represents the
different dimensions required for each test and characterisation. In the first, the water
jet method was used for cutting the samples, as illustrated in Figure 40 (a). However, as
the samples were brittle, the surface finish of the edges of the cut samples were
affected by the force of the water which lead to small cracks appearing, as shown in
Figure 40 (b). Thus the premature failure could exist in many samples. As a result,
(a) (b)
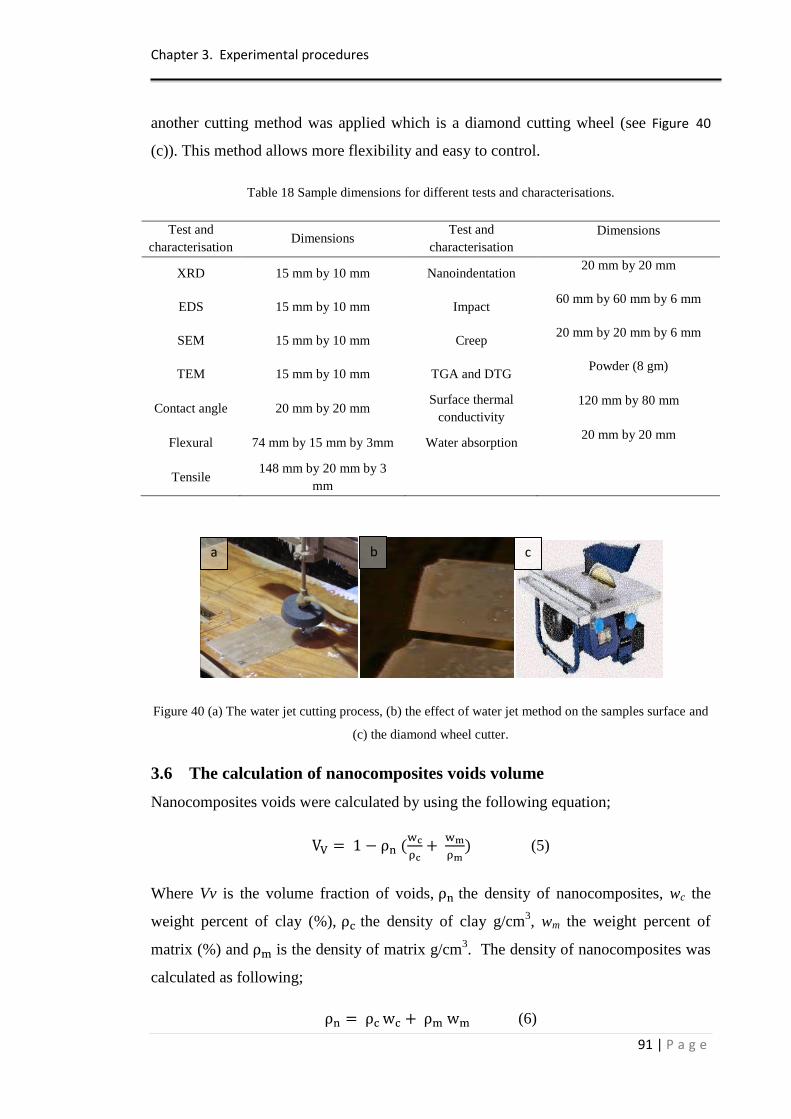
Chapter 3. Experimental procedures
91 | P a g e
another cutting method was applied which is a diamond cutting wheel (see Figure 40
(c)). This method allows more flexibility and easy to control.
Table 18 Sample dimensions for different tests and characterisations.
Test and
characterisation Dimensions
Test and
characterisation
Dimensions
XRD 15 mm by 10 mm Nanoindentation 20 mm by 20 mm
EDS 15 mm by 10 mm Impact 60 mm by 60 mm by 6 mm
SEM 15 mm by 10 mm Creep 20 mm by 20 mm by 6 mm
TEM 15 mm by 10 mm TGA and DTG Powder (8 gm)
Contact angle 20 mm by 20 mm Surface thermal
conductivity
120 mm by 80 mm
Flexural 74 mm by 15 mm by 3mm Water absorption 20 mm by 20 mm
Tensile 148 mm by 20 mm by 3
mm
Figure 40 (a) The water jet cutting process, (b) the effect of water jet method on the samples surface and
(c) the diamond wheel cutter.
3.6 The calculation of nanocomposites voids volume
Nanocomposites voids were calculated by using the following equation;
(5)
Where Vv is the volume fraction of voids, the density of nanocomposites, wc the
weight percent of clay (%), the density of clay g/cm3, wm the weight percent of
matrix (%) and is the density of matrix g/cm3. The density of nanocomposites was
calculated as following;
(6)
c a b
Chapter 3. Experimental procedures
92 | P a g e
3.7 Morphological Characterisations
3.7.1 Wide Angle X-ray Diffraction (WAXD)
WAXD analysis on compression-moulded specimens was used to determine the clay
intercalation and interlayer spacing utilising a Philips APD 1700 X-ray diffraction
system with Cu Kα radiation (λ = 1.542A) generated at 40 mA and 40 kV. The basal-
spacings (the d-spacing, in Angstroms, between layers) were calculated using Bragg‟s
Law.
3.7.2 Scanning electron microscopy (SEM)
The morphology of vinyl ester /nanocomposite systems was investigated in a Hitachi
S4500 SEM working at an operating voltage of 8 kV. Block faces were prepared from
each material then ultrathin sections (63 nm) were collected using a diamond knife in a
Reichert Ultracut E ultramicrotome. Plasma etching was used to preferentially remove
the vinyl ester matrix and leave the clay particles sitting proud of the surface. After
adhering to SEM stubs, a thin layer of gold/palladium was applied to the specimens
prior to examination in a Quanta 250 FEG SEM.
3.7.3 Energy Dispersive X-ray Spectrometry (EDS)
The morphology of the VE/nanocomposite structure was further examined using a Jeol
JSM 6060LV microscope working at an operating voltage of 8 kV. The degree of
dispersion between the layered silicate and the vinyl ester matrix of the nanocomposite
samples was measured using Energy Dispersive Spectroscopy (EDS), a by-product of
the back-scattered electrons off the specimen from the electron beam. The principle of
this method is that when electrons are directed at the sample, characteristic X-rays are
emitted for all atoms with an atomic number above that of Na. This enables an
elemental distribution map to be created for any element greater than Na (atomic
number 11); in this case, the Al and Si found in the layered silicate and the Cl from the
vinyl ester. By scanning the beam in television–like raster and showing the intensity of
the selected sample, a map (image) of the distribution of elements can be produced.
3.7.4 Transmission Electron Microscopy (TEM)
TEM measurements on vinyl ester/nanocomposite systems were performed using a
high-resolution transmission electron microscope (Phillips CM12 with an associated
Chapter 3. Experimental procedures
93 | P a g e
Gatan digital camera system). The same block faces used to produce the sections for
SEM examination were also used for TEM.
3.8 Mechanical testing
3.8.1 Flexural testing
The flexural properties (strength and modulus) of the neat vinyl ester and the
corresponding nanocomposites samples were investigated by using the 3-points
bending test process under the specification of BS EN 2747:1998 (393). A span of 48
mm length was utilised in a 30 kN load cell. The load was applied midway between the
supports. The speed of crosshead was 2 mm/minute. The neat and nanocomposites
samples were loaded until any failure was observed and then their average values were
calculated. Equation (7) represents the calculation of flexural stress. Flexural modulus
was calculated using equation (8).
(7)
Where:
f: is the flexural stress, in megapascals;
F: is the force applied, in newtons;
L: is the span, in millimeters;
b: is the width of the specimen, in millimeters;
h: is the thickness of the specimen, in millimeters.
(8)
where:
Ef: is the modulus, in megapascals;
L: is the span, in millimeters;
Chapter 3. Experimental procedures
94 | P a g e
b: is the width of the specimen, in millimeters;
h: is the thickness of the specimen, in millimeters;
F: is a chosen difference in force, in newtons;
d: is the difference in deflection corresponding to the difference in force F,in
millimeters.
3.8.2 Tensile testing
The tensile testing was performed to determine the tensile strength, modulus and
elongation of neat and nanocomposite samples. The tensile tests on neat polymer and
nanocomposites samples were performed at room temperature at a crosshead speed of
10 mm/minute using Zwick (Z030) accordance with BS EN 2747:1998. The tensile
test specimens were prepared by utilizing a diamond wheel cutter into rectangle beams
from the nanocomposites slabs fabricated by a compression moulding method. The
average and standard deviation were calculated at least from five samples.
The ultimate tensile strength was calculated according to the following equation (9).
(9)
where:
is the ultimate tensile strength, in megapascals,
F is the maximum load, in newtons,
b is the initial average width of the specimen, in millimetres,
h is the initial average thickness of the specimen, in millimeters
The tangent modulus was determined by using equation (10).
(10)
Et :is the tangent modulus, in megapascals;
Chapter 3. Experimental procedures
95 | P a g e
F1: is the change in load, in newtons ;
Lo: is the gauge length, in millimeters;
b: is the initial average width of the specimen, in millimeters;
h: is the initial average thickness of the specimen, in millimeters;
Z1: is the increase in the distance between reference points corresponding to the
difference in load F1 expressed in millimeters.
3.8.3 Nanoindentation
Nanoindentation was used to gather elastic modulus and hardness in a nanometer scale.
All the nanoindentation tests in this work were achieved by using a NanoTest apparatus
(Micro Materials, UK). A Berkovich (three sided pyramidal) diamond indenter tip was
utilised throughout. Twelve symmetrical indentations (in the form of a matrix, 30 μm
apart) were applied on each sample. The test coupons were cut from the
nanocomposites prepared by compression moulding with approximate dimensions of
20 × 20 × 3.2 mm. The specimens were then fixed onto the nano-indentation fixture
using a suitable adhesive. The parameters used for all measurements were as follows:
Initial load: 0.1 mN; the maximum load for all indents: 5 mN; loading and unloading
rate (strain rate): 2.00 mN/S; dwell time or holding time at maximum load: 5 s.
3.8.3.1 Hardness and elastic modulus.
The measurement of the resistance to the deformation or damage can be known as the
hardness (395). The calculation of the hardness during the nanoindentation test can be
achieved by determining the peak load and the project area of contact as seen in
Equation 11. The elastic modulus can be calculated by knowing the un-loading portion
of the indentation depth (Equation 12) (321).
(11)
Chapter 3. Experimental procedures
96 | P a g e
√
√ (12)
Where Pmax, S, Ac and V are the driving force of the indenter, materials stiffness,
contact area at the time that the material is in contact with the indenter with the load
Pmax, and the Passion‟s ratio, respectively.
3.8.4 Impact testing
The impact strength of the neat vinyl ester and the corresponding nanocomposites
samples were determined by an instrumented falling weight impact tester (Zwick
Roell, HIT230F). The annular hole diameter on the specimen fixture was
approximately 4 cm. The specimen dimension utilised for the impact test was 60 mm x
60 mm x 6 mm. The total mass (kg), work capacity (J), and the height of release of the
load (mm) were 23.11kg, 25J, and 110 mm respectively which are under British
Standard (BS 6603). This process was carried out at room temperature. The energy
absorption of the samples was calculated from the curve of the maximum force-
deformation. The incident energies were obtained from adjusting the drop height of the
impactor and calculated using typical energy equation:
E (13)
where, is incident impact energy, is mass of the impactor, is gravity and is
height.
3.8.5 Creep relaxation behaviour
The creep test was carried out with the following parameters: 60 N loads, 25°C and
60°C, and 96 hours period times. Neat polymer, 2 wt.%, and 4 wt.% nanocomposite
samples were investigated. The specimens were prepared as 20 mm x 20 mm x 6 mm.
This size sample was used in order to adequately fit in between the grip where the
diameter of grip was 30 mm. The initial and final strains of each sample were
calculated from the strain-time curve.
iE m g h
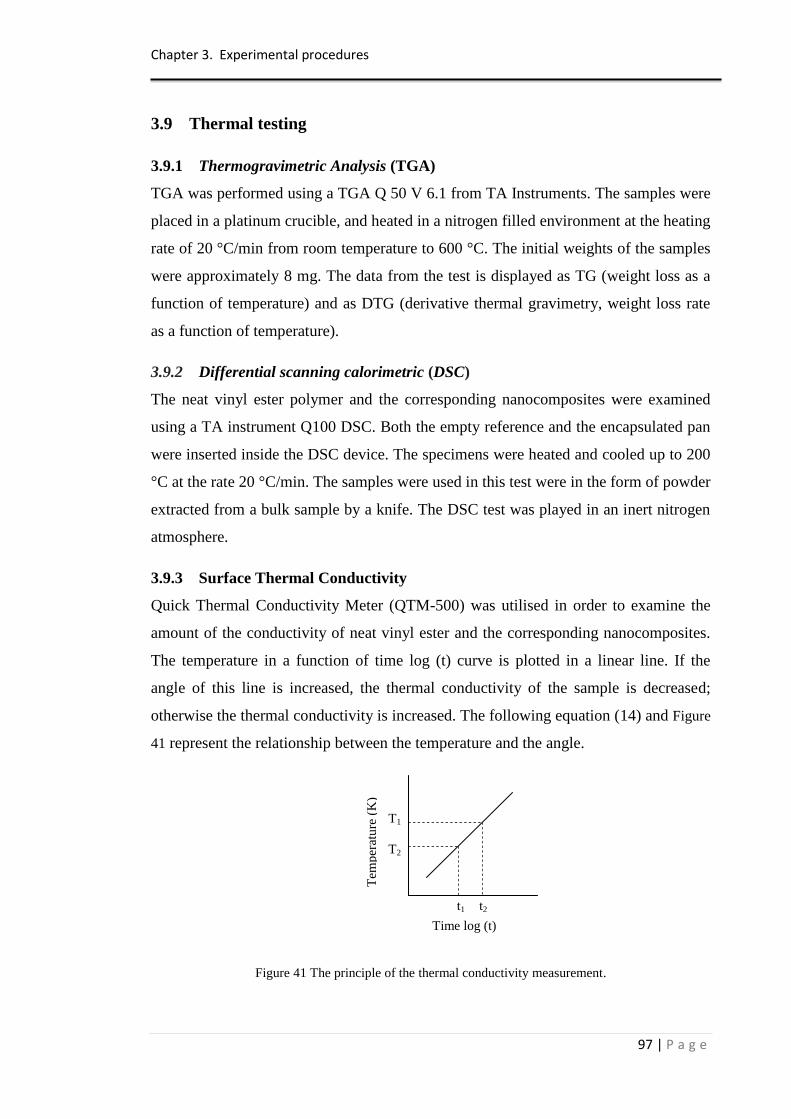
Chapter 3. Experimental procedures
97 | P a g e
3.9 Thermal testing
3.9.1 Thermogravimetric Analysis (TGA)
TGA was performed using a TGA Q 50 V 6.1 from TA Instruments. The samples were
placed in a platinum crucible, and heated in a nitrogen filled environment at the heating
rate of 20 °C/min from room temperature to 600 °C. The initial weights of the samples
were approximately 8 mg. The data from the test is displayed as TG (weight loss as a
function of temperature) and as DTG (derivative thermal gravimetry, weight loss rate
as a function of temperature).
3.9.2 Differential scanning calorimetric (DSC)
The neat vinyl ester polymer and the corresponding nanocomposites were examined
using a TA instrument Q100 DSC. Both the empty reference and the encapsulated pan
were inserted inside the DSC device. The specimens were heated and cooled up to 200
°C at the rate 20 °C/min. The samples were used in this test were in the form of powder
extracted from a bulk sample by a knife. The DSC test was played in an inert nitrogen
atmosphere.
3.9.3 Surface Thermal Conductivity
Quick Thermal Conductivity Meter (QTM-500) was utilised in order to examine the
amount of the conductivity of neat vinyl ester and the corresponding nanocomposites.
The temperature in a function of time log (t) curve is plotted in a linear line. If the
angle of this line is increased, the thermal conductivity of the sample is decreased;
otherwise the thermal conductivity is increased. The following equation (14) and Figure
41 represent the relationship between the temperature and the angle.
Figure 41 The principle of the thermal conductivity measurement.
t1 t2
Tem
per
atu
re (
K)
Time log (t)
T1
T2
Chapter 3. Experimental procedures
98 | P a g e
(14)
Where
λ= thermal conductivity of the sample (W/mK).
q= generated heat/unit length of sample /time (W/m).
t1,t2= measured time length (sec). T1, T2= Temperature at t1, t2 (K).
3.10 Environmental testing
3.10.1 Water absorption behaviours
3.10.1.1 Weight gain study
A water absorption test of neat polymer and nanocomposites was carried out by
making specimens of 20 mm × 20 mm × 3.2 mm under the specification of BS EN ISO
62:1999. Four specimens at each loading were used in order to meet the requirements
of the British Standard. All the specimens were dried in an oven at 55 °C and then were
left to cool at room temperature in a desiccator before weighing them to the nearest
0.1 mg. This process was repeated until a constant weight was observed. The weighing
of dry samples was the first step and then the samples were soaked in tap water at room
temperature. By utilising an electronic balance, the samples were taken out from the
water path at regular intervals (24 hours) and the excess water was removed in order to
measure them. Immediately, the samples were returned to the water path. An electronic
balance (JF-2004, China) with an accuracy of 0.0001 g was used in this experiment. In
order to calculate the values of water uptake and the diffusion coefficient, the
following equations were used.
(15)
where MD is the dry mass and Mt the weight of soaked samples at selected time t.
(16)
Where M∞ is the maximum water uptake (equilibrium state) and h is the sample
thickness.
Chapter 3. Experimental procedures
99 | P a g e
3.10.2 Contact angle measurements
Contact angle measurements were utilised in order to assess the affinity of the samples
used (neat and nanocomposites) with the plasticizers (water and gylcerol). In addition,
the study of the tension surface energy can be achieved by the contact angle
measurement. The angle of the droplet can be determined by the surface tension of the
liquid where the molecules in the bulk of the pure liquid are equally dragged in every
direction by the force of next liquid molecules, ending up creating a net force of zero.
However, if the affinity between the droplet molecules and the neighboring surface
molecules is not existed, the neighboring molecules will diffuse the droplet molecules
upward its surface. Thus, the contact angle measurement can understand the
thermodynamic issue related to the tension surface energy and wetting behaviour. 3 μl
volume drops of MilliQ grade water and glycerol were deposited on the surface of neat
and corresponding nanocomposites samples with a syringe. Pictures of the drops were
acquired through a digital camera positioned on a static contact angle analyzer. The θ
of the contact angle was measured automatically from the image setup. The image of
the solvent droplet can determine the diameter, D, and the height, h, and the following
equation was utilised in order to find out the contact angle of different surfaces.
(
)
(17)
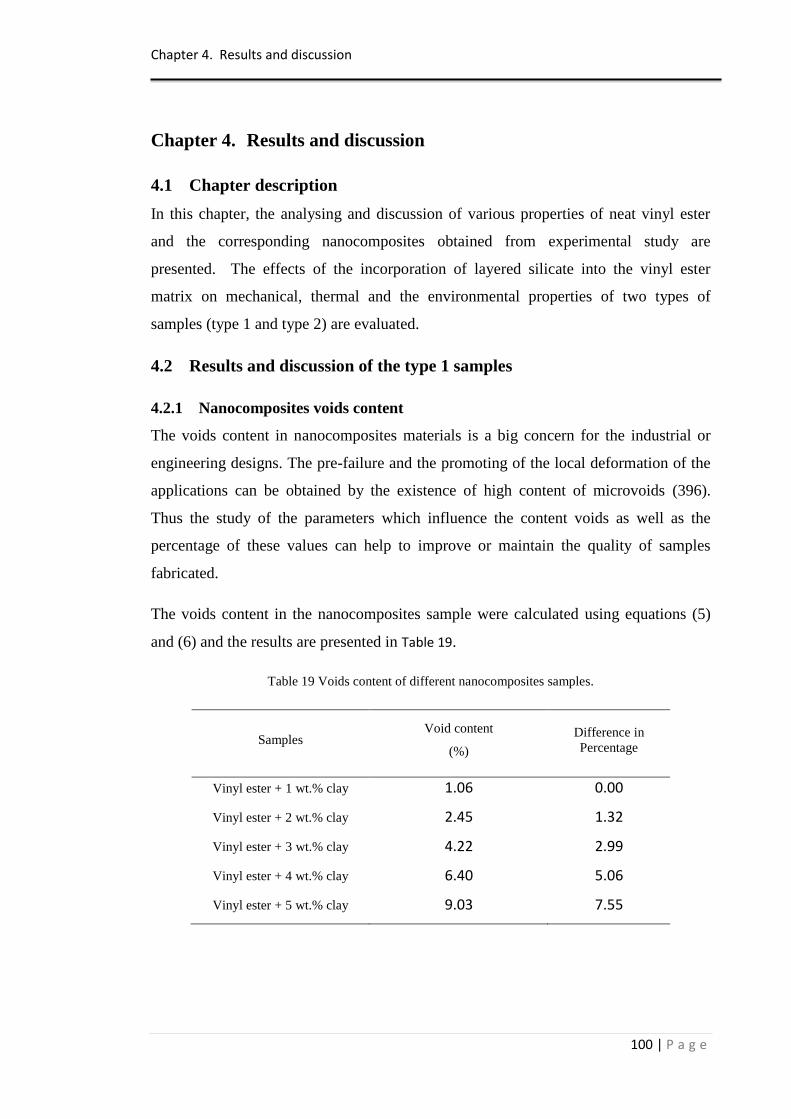
Chapter 4. Results and discussion
100 | P a g e
Chapter 4. Results and discussion
4.1 Chapter description
In this chapter, the analysing and discussion of various properties of neat vinyl ester
and the corresponding nanocomposites obtained from experimental study are
presented. The effects of the incorporation of layered silicate into the vinyl ester
matrix on mechanical, thermal and the environmental properties of two types of
samples (type 1 and type 2) are evaluated.
4.2 Results and discussion of the type 1 samples
4.2.1 Nanocomposites voids content
The voids content in nanocomposites materials is a big concern for the industrial or
engineering designs. The pre-failure and the promoting of the local deformation of the
applications can be obtained by the existence of high content of microvoids (396).
Thus the study of the parameters which influence the content voids as well as the
percentage of these values can help to improve or maintain the quality of samples
fabricated.
The voids content in the nanocomposites sample were calculated using equations (5)
and (6) and the results are presented in Table 19.
Table 19 Voids content of different nanocomposites samples.
Samples Void content
(%)
Difference in
Percentage
Vinyl ester + 1 wt.% clay 1.06 0.00
Vinyl ester + 2 wt.% clay 2.45 1.32
Vinyl ester + 3 wt.% clay 4.22 2.99
Vinyl ester + 4 wt.% clay 6.40 5.06
Vinyl ester + 5 wt.% clay 9.03 7.55
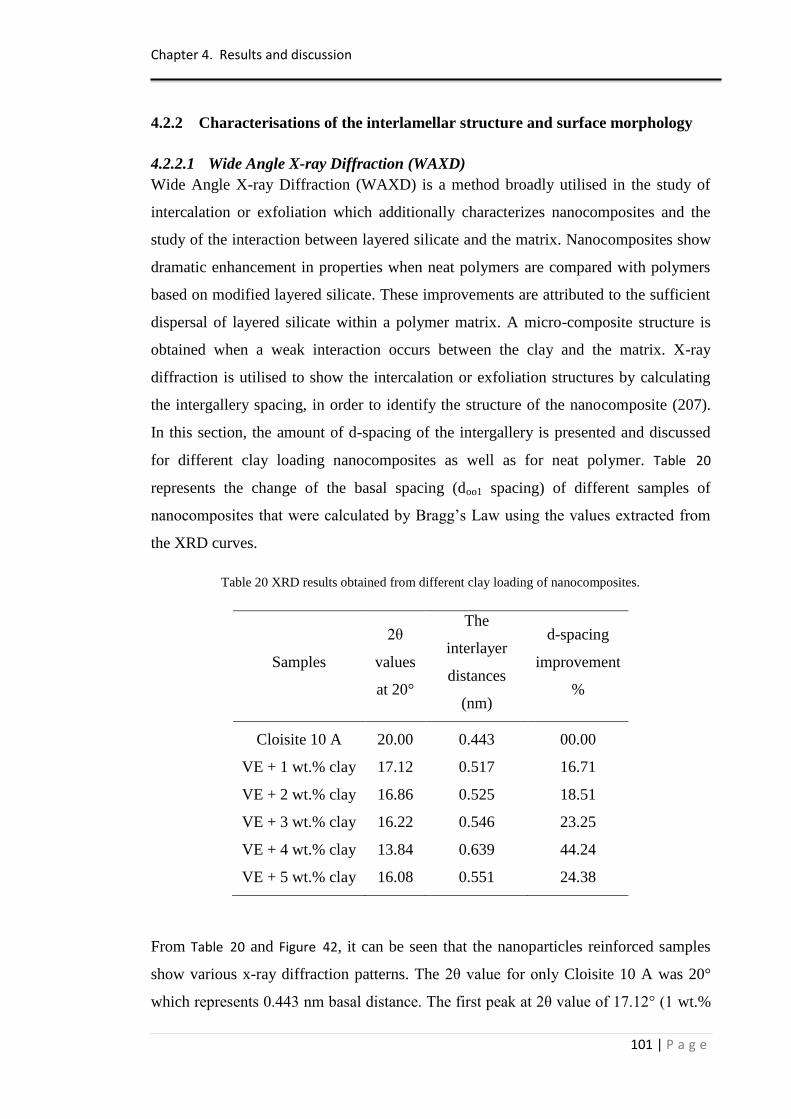
Chapter 4. Results and discussion
101 | P a g e
4.2.2 Characterisations of the interlamellar structure and surface morphology
4.2.2.1 Wide Angle X-ray Diffraction (WAXD)
Wide Angle X-ray Diffraction (WAXD) is a method broadly utilised in the study of
intercalation or exfoliation which additionally characterizes nanocomposites and the
study of the interaction between layered silicate and the matrix. Nanocomposites show
dramatic enhancement in properties when neat polymers are compared with polymers
based on modified layered silicate. These improvements are attributed to the sufficient
dispersal of layered silicate within a polymer matrix. A micro-composite structure is
obtained when a weak interaction occurs between the clay and the matrix. X-ray
diffraction is utilised to show the intercalation or exfoliation structures by calculating
the intergallery spacing, in order to identify the structure of the nanocomposite (207).
In this section, the amount of d-spacing of the intergallery is presented and discussed
for different clay loading nanocomposites as well as for neat polymer. Table 20
represents the change of the basal spacing (doo1 spacing) of different samples of
nanocomposites that were calculated by Bragg‟s Law using the values extracted from
the XRD curves.
Table 20 XRD results obtained from different clay loading of nanocomposites.
Samples
2θ
values
at 20°
The
interlayer
distances
(nm)
d-spacing
improvement
%
Cloisite 10 A 20.00 0.443 00.00
VE + 1 wt.% clay 17.12 0.517 16.71
VE + 2 wt.% clay 16.86 0.525 18.51
VE + 3 wt.% clay 16.22 0.546 23.25
VE + 4 wt.% clay 13.84 0.639 44.24
VE + 5 wt.% clay 16.08 0.551 24.38
From Table 20 and Figure 42, it can be seen that the nanoparticles reinforced samples
show various x-ray diffraction patterns. The 2θ value for only Cloisite 10 A was 20°
which represents 0.443 nm basal distance. The first peak at 2θ value of 17.12° (1 wt.%
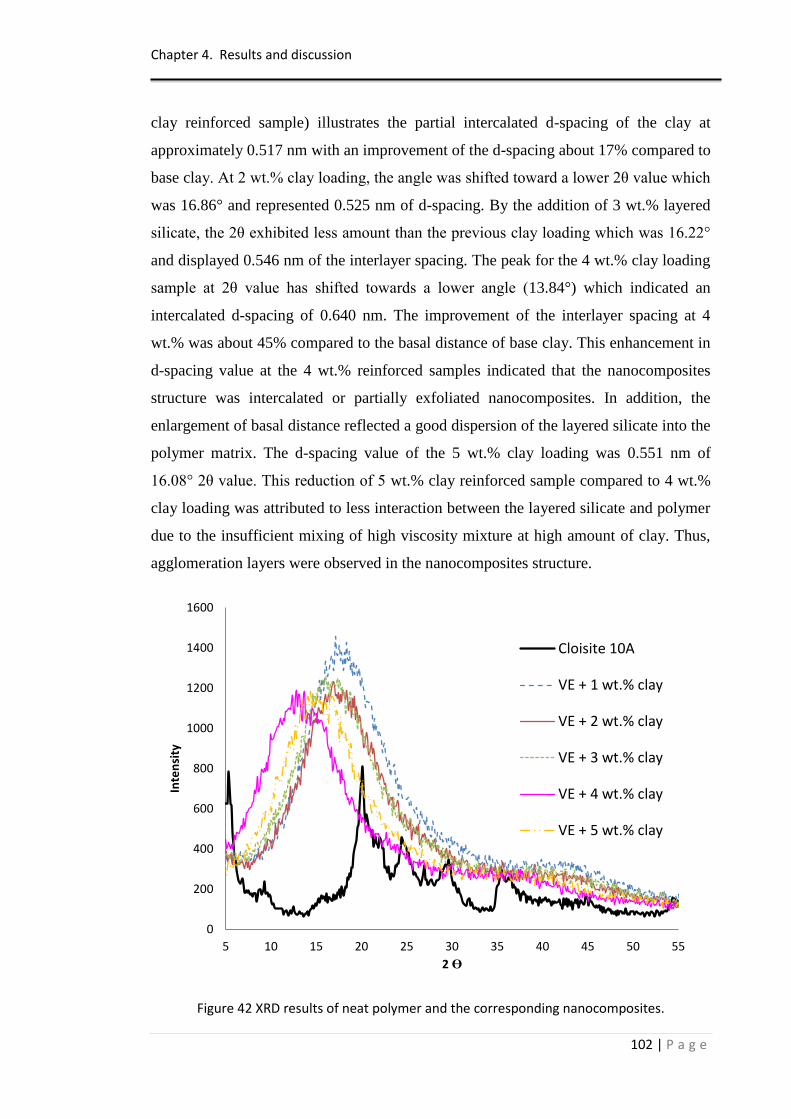
Chapter 4. Results and discussion
102 | P a g e
clay reinforced sample) illustrates the partial intercalated d-spacing of the clay at
approximately 0.517 nm with an improvement of the d-spacing about 17% compared to
base clay. At 2 wt.% clay loading, the angle was shifted toward a lower 2θ value which
was 16.86° and represented 0.525 nm of d-spacing. By the addition of 3 wt.% layered
silicate, the 2θ exhibited less amount than the previous clay loading which was 16.22°
and displayed 0.546 nm of the interlayer spacing. The peak for the 4 wt.% clay loading
sample at 2θ value has shifted towards a lower angle (13.84°) which indicated an
intercalated d-spacing of 0.640 nm. The improvement of the interlayer spacing at 4
wt.% was about 45% compared to the basal distance of base clay. This enhancement in
d-spacing value at the 4 wt.% reinforced samples indicated that the nanocomposites
structure was intercalated or partially exfoliated nanocomposites. In addition, the
enlargement of basal distance reflected a good dispersion of the layered silicate into the
polymer matrix. The d-spacing value of the 5 wt.% clay loading was 0.551 nm of
16.08° 2θ value. This reduction of 5 wt.% clay reinforced sample compared to 4 wt.%
clay loading was attributed to less interaction between the layered silicate and polymer
due to the insufficient mixing of high viscosity mixture at high amount of clay. Thus,
agglomeration layers were observed in the nanocomposites structure.
Figure 42 XRD results of neat polymer and the corresponding nanocomposites.
0
200
400
600
800
1000
1200
1400
1600
5 10 15 20 25 30 35 40 45 50 55
Inte
nsi
ty
2 Ө
Cloisite 10A
VE + 1 wt.% clay
VE + 2 wt.% clay
VE + 3 wt.% clay
VE + 4 wt.% clay
VE + 5 wt.% clay
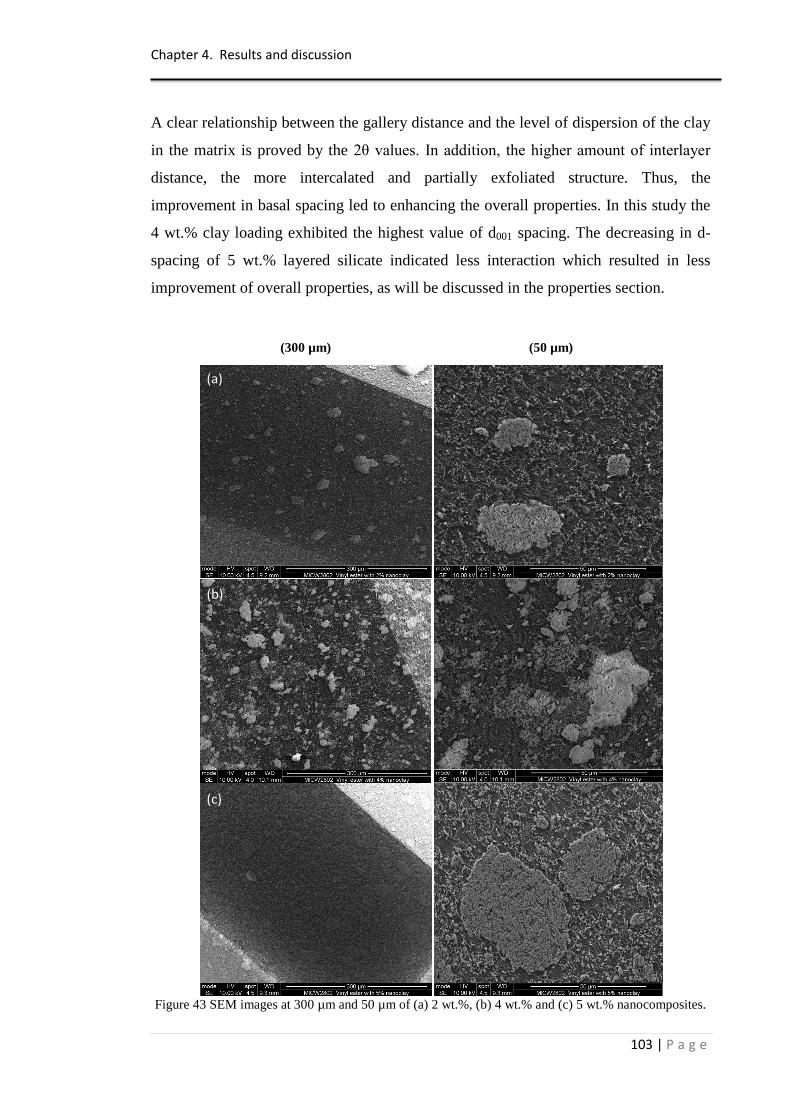
Chapter 4. Results and discussion
103 | P a g e
A clear relationship between the gallery distance and the level of dispersion of the clay
in the matrix is proved by the 2θ values. In addition, the higher amount of interlayer
distance, the more intercalated and partially exfoliated structure. Thus, the
improvement in basal spacing led to enhancing the overall properties. In this study the
4 wt.% clay loading exhibited the highest value of d001 spacing. The decreasing in d-
spacing of 5 wt.% layered silicate indicated less interaction which resulted in less
improvement of overall properties, as will be discussed in the properties section.
Figure 43 SEM images at 300 µm and 50 µm of (a) 2 wt.%, (b) 4 wt.% and (c) 5 wt.% nanocomposites.
(300 µm) (50 µm)
(a)
(b)
(c)
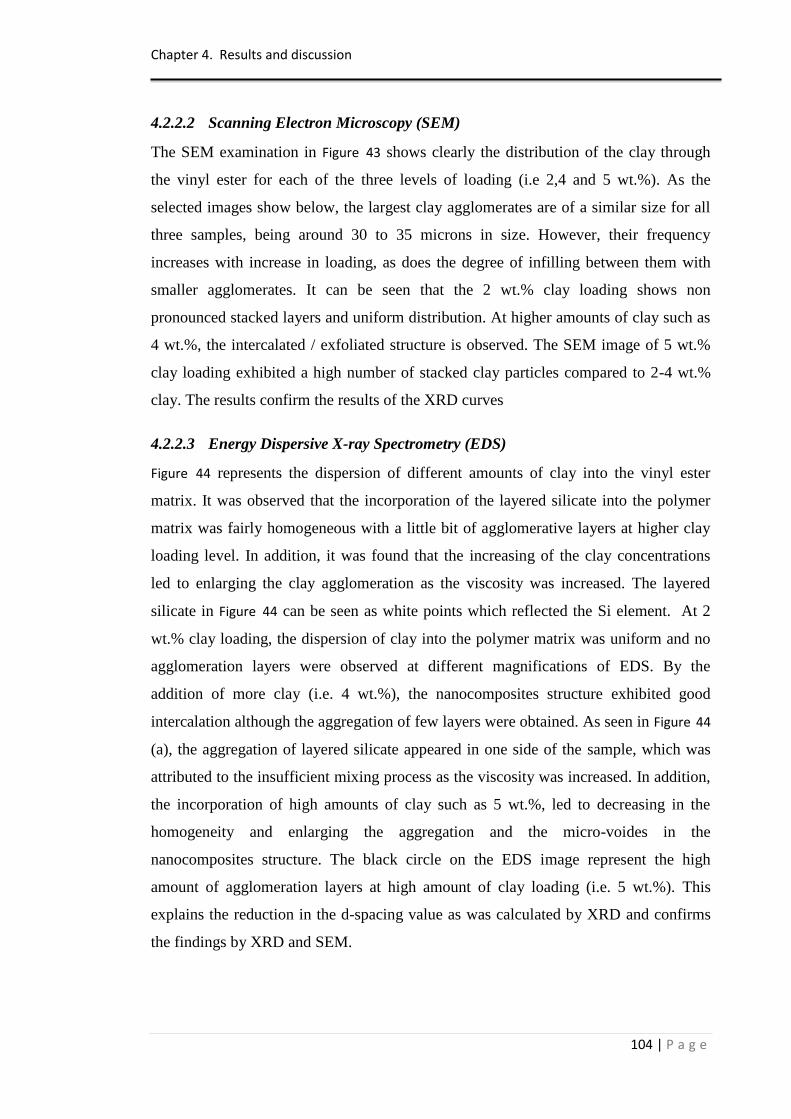
Chapter 4. Results and discussion
104 | P a g e
4.2.2.2 Scanning Electron Microscopy (SEM)
The SEM examination in Figure 43 shows clearly the distribution of the clay through
the vinyl ester for each of the three levels of loading (i.e 2,4 and 5 wt.%). As the
selected images show below, the largest clay agglomerates are of a similar size for all
three samples, being around 30 to 35 microns in size. However, their frequency
increases with increase in loading, as does the degree of infilling between them with
smaller agglomerates. It can be seen that the 2 wt.% clay loading shows non
pronounced stacked layers and uniform distribution. At higher amounts of clay such as
4 wt.%, the intercalated / exfoliated structure is observed. The SEM image of 5 wt.%
clay loading exhibited a high number of stacked clay particles compared to 2-4 wt.%
clay. The results confirm the results of the XRD curves
4.2.2.3 Energy Dispersive X-ray Spectrometry (EDS)
Figure 44 represents the dispersion of different amounts of clay into the vinyl ester
matrix. It was observed that the incorporation of the layered silicate into the polymer
matrix was fairly homogeneous with a little bit of agglomerative layers at higher clay
loading level. In addition, it was found that the increasing of the clay concentrations
led to enlarging the clay agglomeration as the viscosity was increased. The layered
silicate in Figure 44 can be seen as white points which reflected the Si element. At 2
wt.% clay loading, the dispersion of clay into the polymer matrix was uniform and no
agglomeration layers were observed at different magnifications of EDS. By the
addition of more clay (i.e. 4 wt.%), the nanocomposites structure exhibited good
intercalation although the aggregation of few layers were obtained. As seen in Figure 44
(a), the aggregation of layered silicate appeared in one side of the sample, which was
attributed to the insufficient mixing process as the viscosity was increased. In addition,
the incorporation of high amounts of clay such as 5 wt.%, led to decreasing in the
homogeneity and enlarging the aggregation and the micro-voides in the
nanocomposites structure. The black circle on the EDS image represent the high
amount of agglomeration layers at high amount of clay loading (i.e. 5 wt.%). This
explains the reduction in the d-spacing value as was calculated by XRD and confirms
the findings by XRD and SEM.
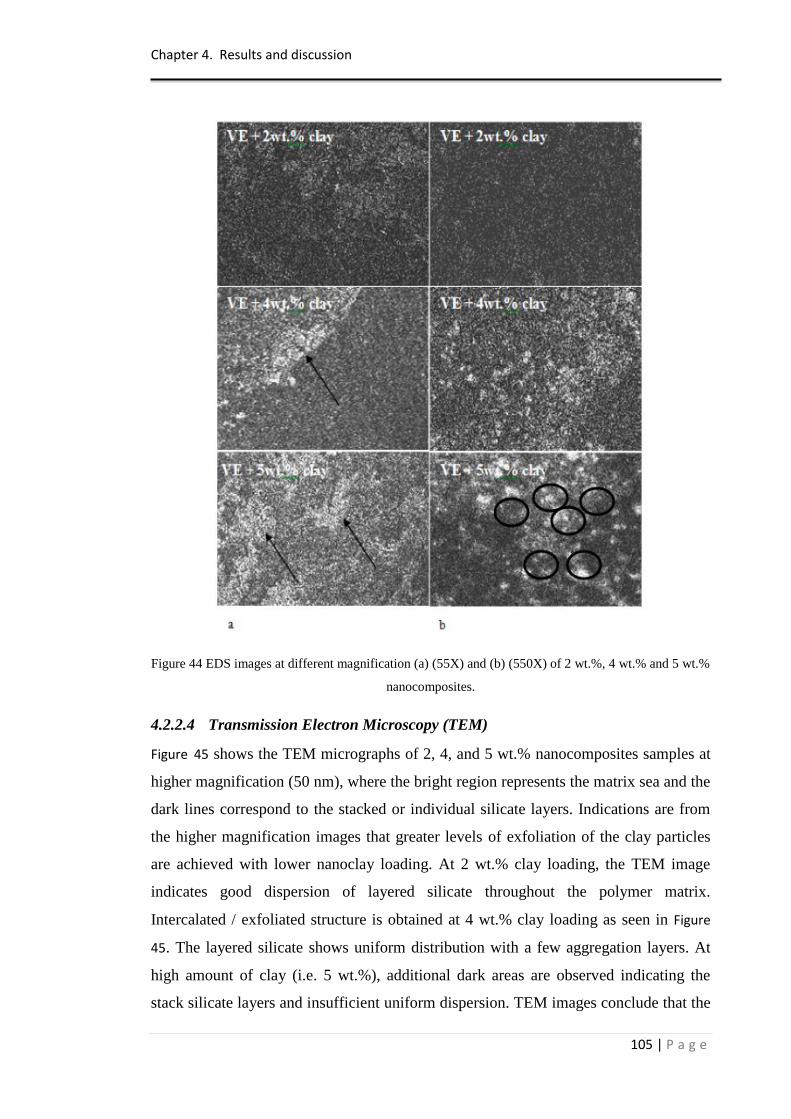
Chapter 4. Results and discussion
105 | P a g e
Figure 44 EDS images at different magnification (a) (55X) and (b) (550X) of 2 wt.%, 4 wt.% and 5 wt.%
nanocomposites.
4.2.2.4 Transmission Electron Microscopy (TEM)
Figure 45 shows the TEM micrographs of 2, 4, and 5 wt.% nanocomposites samples at
higher magnification (50 nm), where the bright region represents the matrix sea and the
dark lines correspond to the stacked or individual silicate layers. Indications are from
the higher magnification images that greater levels of exfoliation of the clay particles
are achieved with lower nanoclay loading. At 2 wt.% clay loading, the TEM image
indicates good dispersion of layered silicate throughout the polymer matrix.
Intercalated / exfoliated structure is obtained at 4 wt.% clay loading as seen in Figure
45. The layered silicate shows uniform distribution with a few aggregation layers. At
high amount of clay (i.e. 5 wt.%), additional dark areas are observed indicating the
stack silicate layers and insufficient uniform dispersion. TEM images conclude that the
Chapter 4. Results and discussion
106 | P a g e
particles lumps are increased by the incorporation of more than 4 wt.% clay loading.
This was attributed to the high viscosity of the mixture where the ability of dispersing
the layered silicate and the polymer is restricted. It is acceptable that the higher amount
of clay loading mixed with the polymer, the less exfoliated and aggregated
nanocomposites structure (315, 397). These findings support the results by XRD, SEM,
and EDS.
Figure 45 TEM micrographs at 20 nm magnification of (a) 2 wt.%, (b) 4 wt.% and (c) 5 wt.%
nanocomposites.
4.2.2.5 Characterisation summary
From the characterisation results, it can be concluded that the higher the aspect ratio of
the particles in touch with the polymer, the bigger the reinforcing influence would be.
Therefore a low amount of particles in nanocomposites is preferable in order to
influence dramatic property enhancement. XRD, SEM, EDS and TEM showed that the
intercalation/ exfoliation nanocomposites structure was relation to the clay content up
to 4 wt.%. Addition of more layered silicate resulted in increasing the stack layers as
seen in the different characterisation techniques used which will reduce the exfoliation
and intercalation structure level as also proved by equation (1) page 44.
4.2.3 Mechanical properties
4.2.3.1 Flexural strength and modulus
The average results obtained from the four specimens tested are represented in Table
21.The results show a significant improvement in flexural strength and modulus for
nanocomposites compared to neat vinyl ester samples. The flexural strength and
modulus for the neat sample were 56.67 MPa and 2.87 GPa, whereas for 1 wt.% the
figures were 74.16 MPa and 4.67 GPa which was an improvement of about 30.86 %
(a) (b) (c)
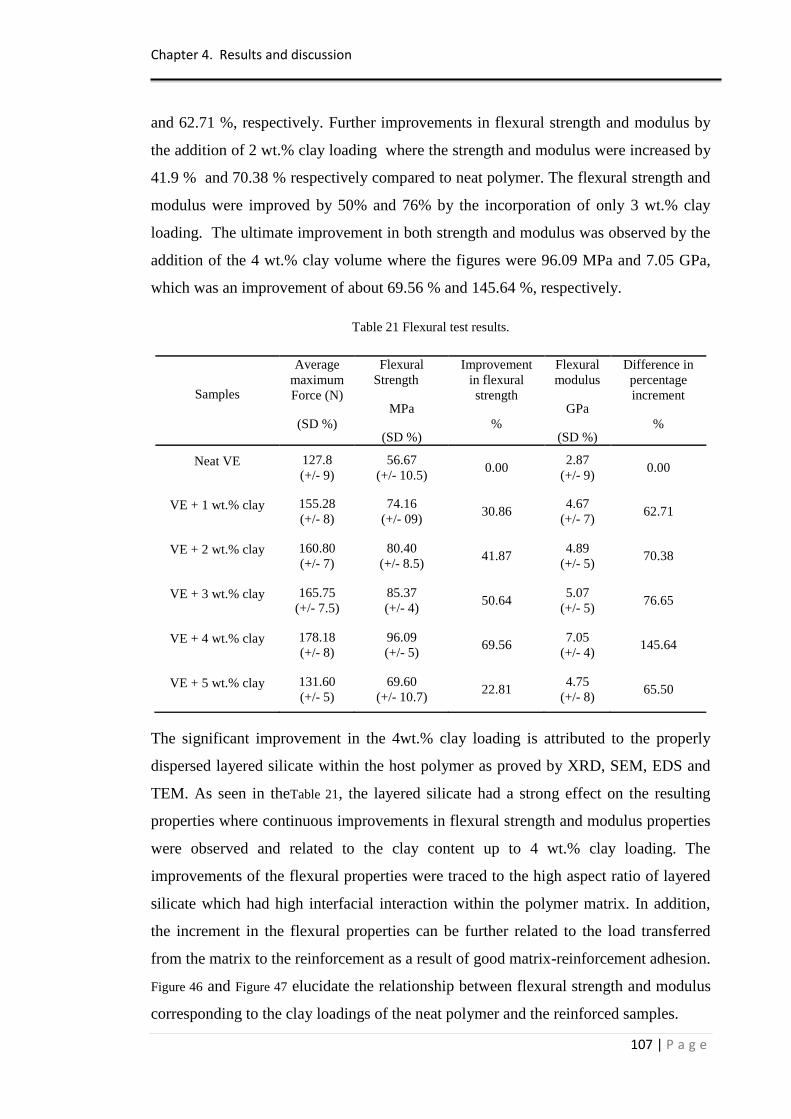
Chapter 4. Results and discussion
107 | P a g e
and 62.71 %, respectively. Further improvements in flexural strength and modulus by
the addition of 2 wt.% clay loading where the strength and modulus were increased by
41.9 % and 70.38 % respectively compared to neat polymer. The flexural strength and
modulus were improved by 50% and 76% by the incorporation of only 3 wt.% clay
loading. The ultimate improvement in both strength and modulus was observed by the
addition of the 4 wt.% clay volume where the figures were 96.09 MPa and 7.05 GPa,
which was an improvement of about 69.56 % and 145.64 %, respectively.
Table 21 Flexural test results.
Samples
Average
maximum
Force (N)
(SD %)
Flexural
Strength
MPa
(SD %)
Improvement
in flexural
strength
%
Flexural
modulus
GPa
(SD %)
Difference in
percentage
increment
%
Neat VE 127.8
(+/- 9)
56.67
(+/- 10.5) 0.00
2.87
(+/- 9) 0.00
VE + 1 wt.% clay 155.28
(+/- 8)
74.16
(+/- 09) 30.86
4.67
(+/- 7) 62.71
VE + 2 wt.% clay 160.80
(+/- 7)
80.40
(+/- 8.5) 41.87
4.89
(+/- 5) 70.38
VE + 3 wt.% clay 165.75
(+/- 7.5)
85.37
(+/- 4) 50.64
5.07
(+/- 5) 76.65
VE + 4 wt.% clay 178.18
(+/- 8)
96.09
(+/- 5) 69.56
7.05
(+/- 4) 145.64
VE + 5 wt.% clay 131.60
(+/- 5)
69.60
(+/- 10.7) 22.81
4.75
(+/- 8) 65.50
The significant improvement in the 4wt.% clay loading is attributed to the properly
dispersed layered silicate within the host polymer as proved by XRD, SEM, EDS and
TEM. As seen in theTable 21, the layered silicate had a strong effect on the resulting
properties where continuous improvements in flexural strength and modulus properties
were observed and related to the clay content up to 4 wt.% clay loading. The
improvements of the flexural properties were traced to the high aspect ratio of layered
silicate which had high interfacial interaction within the polymer matrix. In addition,
the increment in the flexural properties can be further related to the load transferred
from the matrix to the reinforcement as a result of good matrix-reinforcement adhesion.
Figure 46 and Figure 47 elucidate the relationship between flexural strength and modulus
corresponding to the clay loadings of the neat polymer and the reinforced samples.
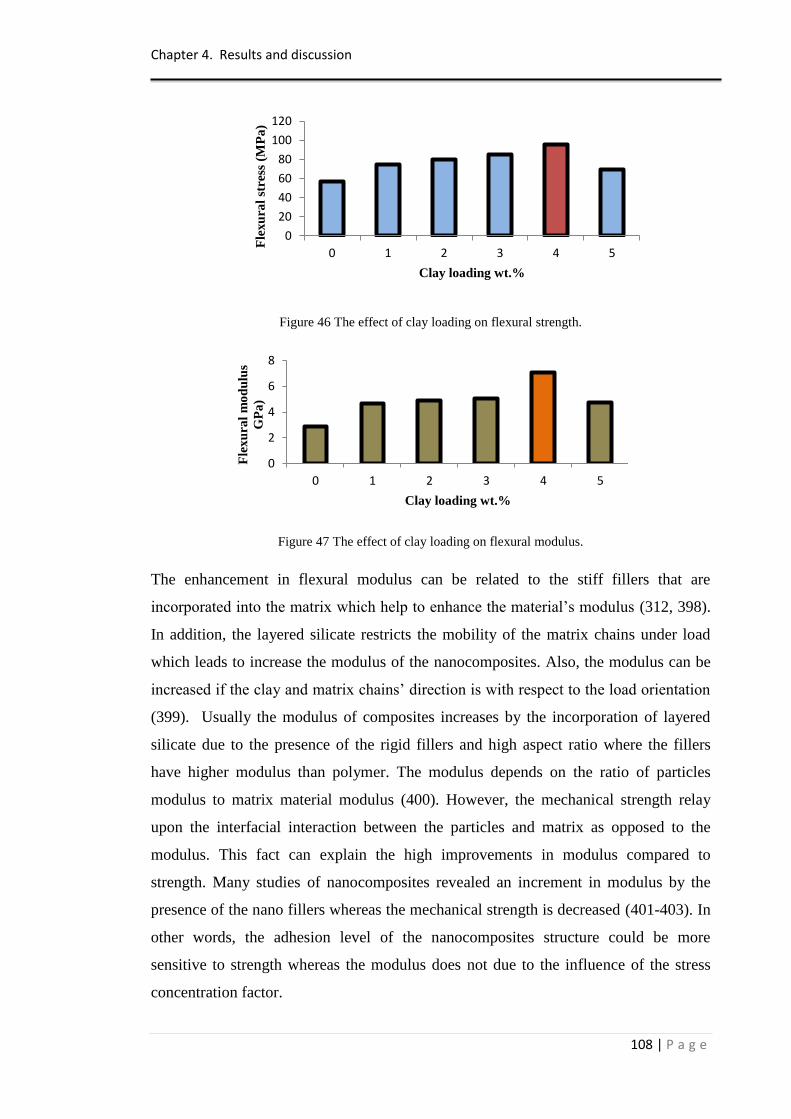
Chapter 4. Results and discussion
108 | P a g e
Figure 46 The effect of clay loading on flexural strength.
Figure 47 The effect of clay loading on flexural modulus.
The enhancement in flexural modulus can be related to the stiff fillers that are
incorporated into the matrix which help to enhance the material‟s modulus (312, 398).
In addition, the layered silicate restricts the mobility of the matrix chains under load
which leads to increase the modulus of the nanocomposites. Also, the modulus can be
increased if the clay and matrix chains‟ direction is with respect to the load orientation
(399). Usually the modulus of composites increases by the incorporation of layered
silicate due to the presence of the rigid fillers and high aspect ratio where the fillers
have higher modulus than polymer. The modulus depends on the ratio of particles
modulus to matrix material modulus (400). However, the mechanical strength relay
upon the interfacial interaction between the particles and matrix as opposed to the
modulus. This fact can explain the high improvements in modulus compared to
strength. Many studies of nanocomposites revealed an increment in modulus by the
presence of the nano fillers whereas the mechanical strength is decreased (401-403). In
other words, the adhesion level of the nanocomposites structure could be more
sensitive to strength whereas the modulus does not due to the influence of the stress
concentration factor.
0
20
40
60
80
100
120
0 1 2 3 4 5F
lexu
ral
stre
ss (
MP
a)
Clay loading wt.%
0
2
4
6
8
0 1 2 3 4 5
Fle
xu
ral
mo
du
lus
GP
a)
Clay loading wt.%
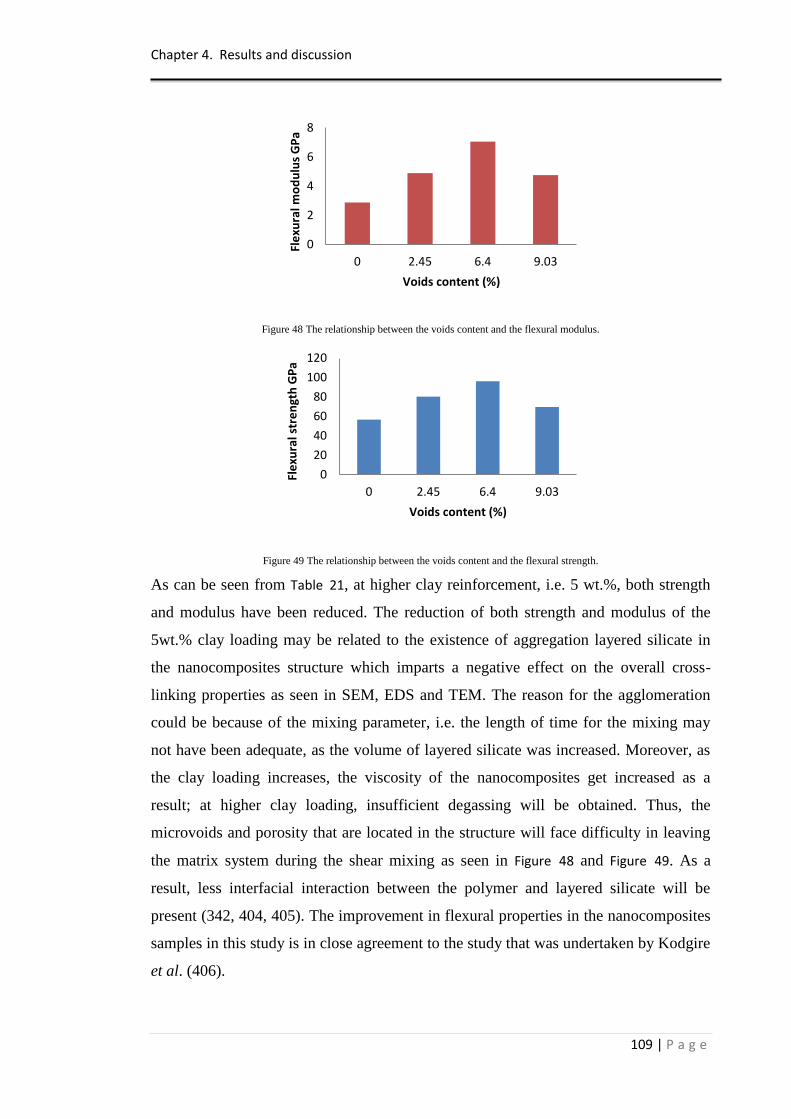
Chapter 4. Results and discussion
109 | P a g e
Figure 48 The relationship between the voids content and the flexural modulus.
Figure 49 The relationship between the voids content and the flexural strength.
As can be seen from Table 21, at higher clay reinforcement, i.e. 5 wt.%, both strength
and modulus have been reduced. The reduction of both strength and modulus of the
5wt.% clay loading may be related to the existence of aggregation layered silicate in
the nanocomposites structure which imparts a negative effect on the overall cross-
linking properties as seen in SEM, EDS and TEM. The reason for the agglomeration
could be because of the mixing parameter, i.e. the length of time for the mixing may
not have been adequate, as the volume of layered silicate was increased. Moreover, as
the clay loading increases, the viscosity of the nanocomposites get increased as a
result; at higher clay loading, insufficient degassing will be obtained. Thus, the
microvoids and porosity that are located in the structure will face difficulty in leaving
the matrix system during the shear mixing as seen in Figure 48 and Figure 49. As a
result, less interfacial interaction between the polymer and layered silicate will be
present (342, 404, 405). The improvement in flexural properties in the nanocomposites
samples in this study is in close agreement to the study that was undertaken by Kodgire
et al. (406).
0
2
4
6
8
0 2.45 6.4 9.03
Fle
xura
l mo
du
lus
GP
a
Voids content (%)
0
20
40
60
80
100
120
0 2.45 6.4 9.03
Fle
xura
l str
en
gth
GP
a
Voids content (%)
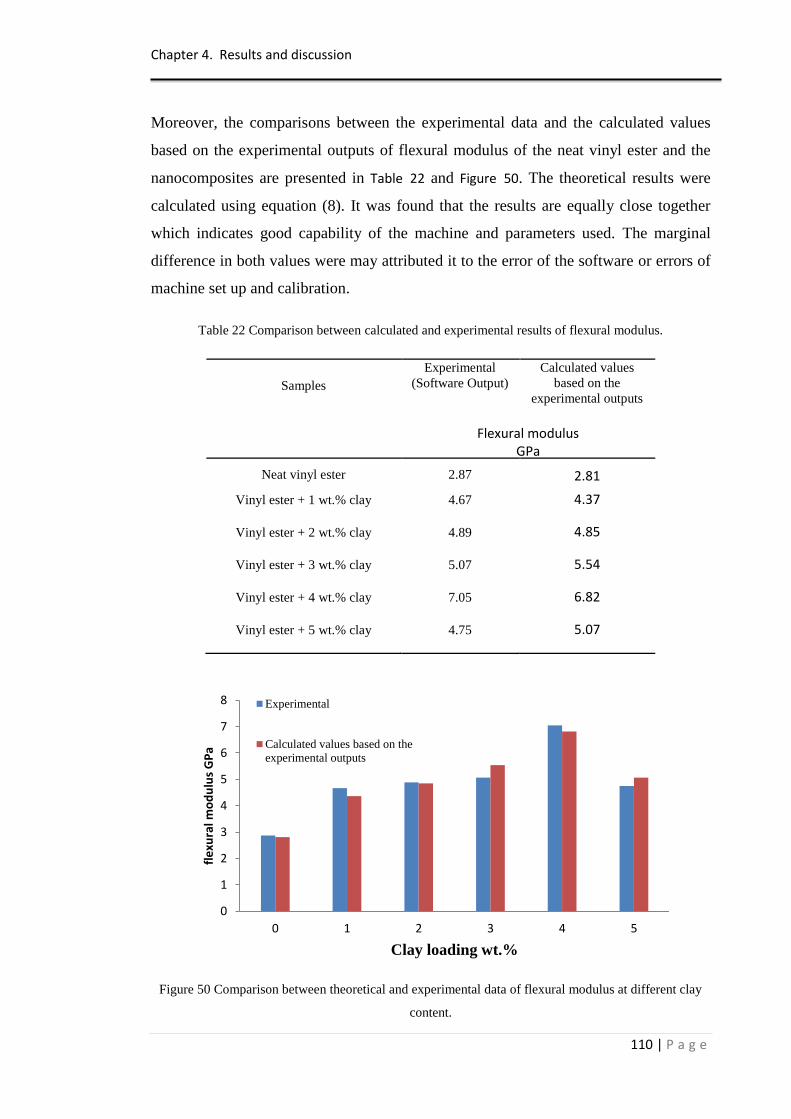
Chapter 4. Results and discussion
110 | P a g e
Moreover, the comparisons between the experimental data and the calculated values
based on the experimental outputs of flexural modulus of the neat vinyl ester and the
nanocomposites are presented in Table 22 and Figure 50. The theoretical results were
calculated using equation (8). It was found that the results are equally close together
which indicates good capability of the machine and parameters used. The marginal
difference in both values were may attributed it to the error of the software or errors of
machine set up and calibration.
Table 22 Comparison between calculated and experimental results of flexural modulus.
Samples
Experimental
(Software Output)
Calculated values
based on the
experimental outputs
Flexural modulus GPa
Neat vinyl ester 2.87 2.81
Vinyl ester + 1 wt.% clay 4.67 4.37
Vinyl ester + 2 wt.% clay 4.89 4.85
Vinyl ester + 3 wt.% clay 5.07 5.54
Vinyl ester + 4 wt.% clay 7.05 6.82
Vinyl ester + 5 wt.% clay 4.75 5.07
Figure 50 Comparison between theoretical and experimental data of flexural modulus at different clay
content.
0
1
2
3
4
5
6
7
8
0 1 2 3 4 5
fle
xura
l mo
du
lus
GP
a
Clay loading wt.%
Experimental
Calculated values based on the
experimental outputs
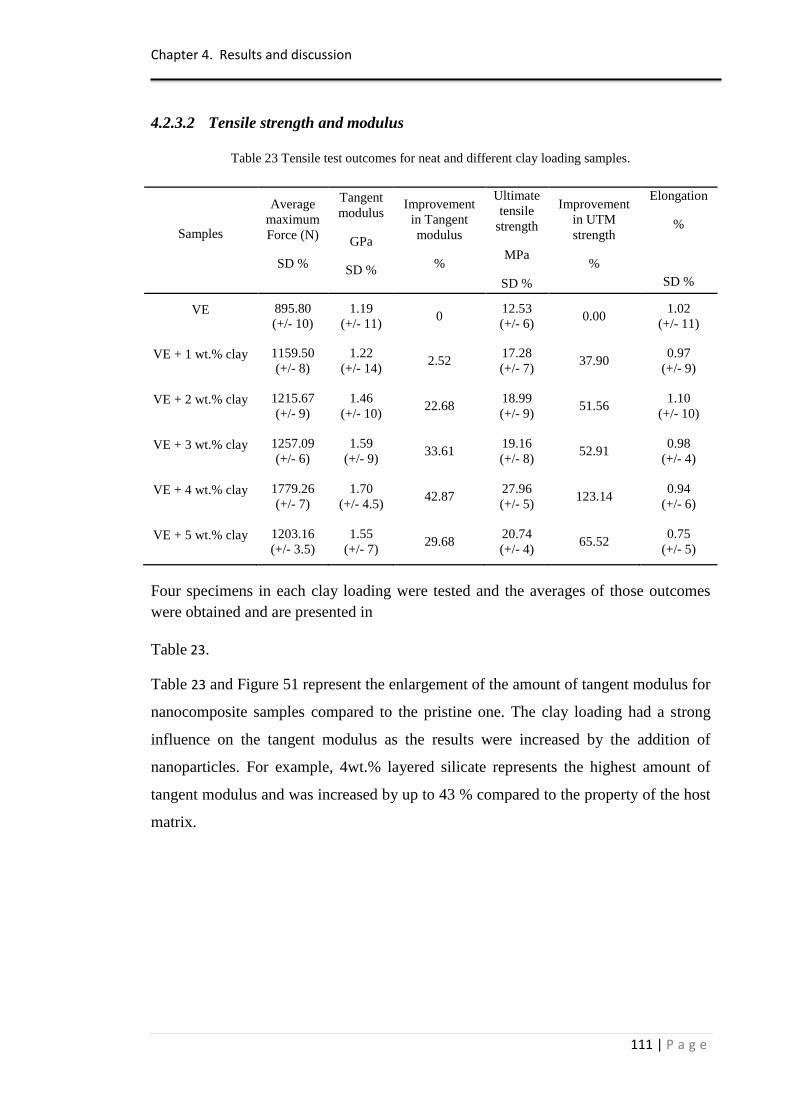
Chapter 4. Results and discussion
111 | P a g e
4.2.3.2 Tensile strength and modulus
Table 23 Tensile test outcomes for neat and different clay loading samples.
Samples
Average
maximum
Force (N)
SD %
Tangent
modulus
GPa
SD %
Improvement
in Tangent
modulus
%
Ultimate
tensile
strength
MPa
SD %
Improvement
in UTM
strength
%
Elongation
%
SD %
VE 895.80
(+/- 10)
1.19
(+/- 11) 0
12.53
(+/- 6) 0.00
1.02
(+/- 11)
VE + 1 wt.% clay 1159.50
(+/- 8)
1.22
(+/- 14) 2.52
17.28
(+/- 7) 37.90
0.97
(+/- 9)
VE + 2 wt.% clay 1215.67
(+/- 9)
1.46
(+/- 10) 22.68
18.99
(+/- 9) 51.56
1.10
(+/- 10)
VE + 3 wt.% clay 1257.09
(+/- 6)
1.59
(+/- 9) 33.61
19.16
(+/- 8) 52.91
0.98
(+/- 4)
VE + 4 wt.% clay 1779.26
(+/- 7)
1.70
(+/- 4.5) 42.87
27.96
(+/- 5) 123.14
0.94
(+/- 6)
VE + 5 wt.% clay 1203.16
(+/- 3.5)
1.55
(+/- 7) 29.68
20.74
(+/- 4) 65.52
0.75
(+/- 5)
Four specimens in each clay loading were tested and the averages of those outcomes
were obtained and are presented in
Table 23.
Table 23 and Figure 51 represent the enlargement of the amount of tangent modulus for
nanocomposite samples compared to the pristine one. The clay loading had a strong
influence on the tangent modulus as the results were increased by the addition of
nanoparticles. For example, 4wt.% layered silicate represents the highest amount of
tangent modulus and was increased by up to 43 % compared to the property of the host
matrix.
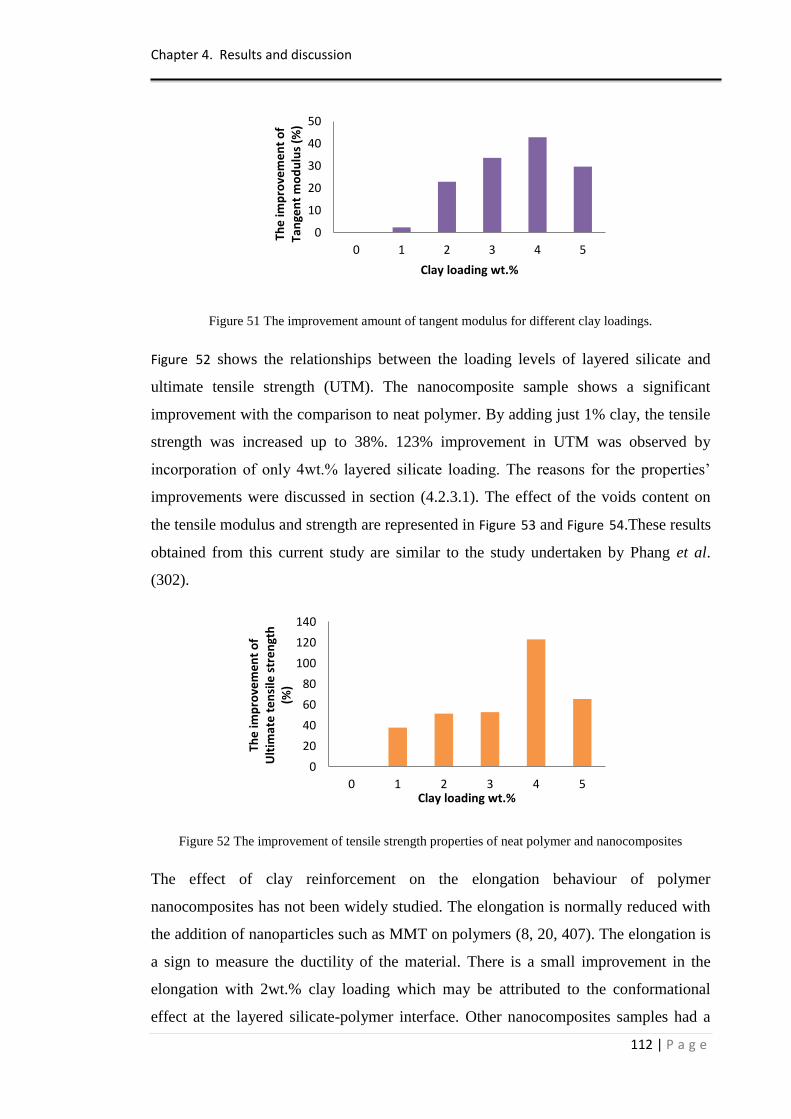
Chapter 4. Results and discussion
112 | P a g e
Figure 51 The improvement amount of tangent modulus for different clay loadings.
Figure 52 shows the relationships between the loading levels of layered silicate and
ultimate tensile strength (UTM). The nanocomposite sample shows a significant
improvement with the comparison to neat polymer. By adding just 1% clay, the tensile
strength was increased up to 38%. 123% improvement in UTM was observed by
incorporation of only 4wt.% layered silicate loading. The reasons for the properties‟
improvements were discussed in section (4.2.3.1). The effect of the voids content on
the tensile modulus and strength are represented in Figure 53 and Figure 54.These results
obtained from this current study are similar to the study undertaken by Phang et al.
(302).
Figure 52 The improvement of tensile strength properties of neat polymer and nanocomposites
The effect of clay reinforcement on the elongation behaviour of polymer
nanocomposites has not been widely studied. The elongation is normally reduced with
the addition of nanoparticles such as MMT on polymers (8, 20, 407). The elongation is
a sign to measure the ductility of the material. There is a small improvement in the
elongation with 2wt.% clay loading which may be attributed to the conformational
effect at the layered silicate-polymer interface. Other nanocomposites samples had a
0
10
20
30
40
50
0 1 2 3 4 5
The
imp
rove
me
nt
of
Tan
gen
t m
od
ulu
s (%
)
Clay loading wt.%
0
20
40
60
80
100
120
140
0 1 2 3 4 5
The
imp
rove
me
nt
of
Ult
imat
e t
en
sile
str
en
gth
(%
)
Clay loading wt.%
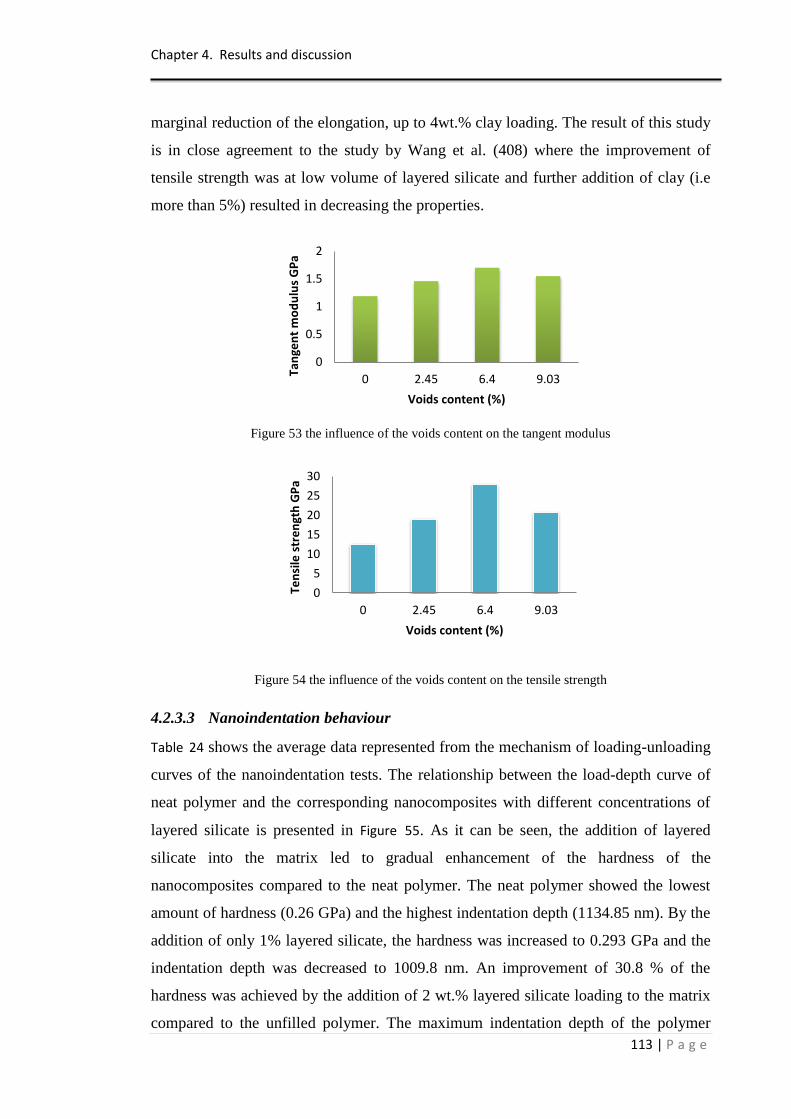
Chapter 4. Results and discussion
113 | P a g e
marginal reduction of the elongation, up to 4wt.% clay loading. The result of this study
is in close agreement to the study by Wang et al. (408) where the improvement of
tensile strength was at low volume of layered silicate and further addition of clay (i.e
more than 5%) resulted in decreasing the properties.
Figure 53 the influence of the voids content on the tangent modulus
Figure 54 the influence of the voids content on the tensile strength
4.2.3.3 Nanoindentation behaviour
Table 24 shows the average data represented from the mechanism of loading-unloading
curves of the nanoindentation tests. The relationship between the load-depth curve of
neat polymer and the corresponding nanocomposites with different concentrations of
layered silicate is presented in Figure 55. As it can be seen, the addition of layered
silicate into the matrix led to gradual enhancement of the hardness of the
nanocomposites compared to the neat polymer. The neat polymer showed the lowest
amount of hardness (0.26 GPa) and the highest indentation depth (1134.85 nm). By the
addition of only 1% layered silicate, the hardness was increased to 0.293 GPa and the
indentation depth was decreased to 1009.8 nm. An improvement of 30.8 % of the
hardness was achieved by the addition of 2 wt.% layered silicate loading to the matrix
compared to the unfilled polymer. The maximum indentation depth of the polymer
0
0.5
1
1.5
2
0 2.45 6.4 9.03
Tan
gen
t m
od
ulu
s G
Pa
Voids content (%)
0
5
10
15
20
25
30
0 2.45 6.4 9.03
Ten
sile
str
en
gth
GP
a
Voids content (%)
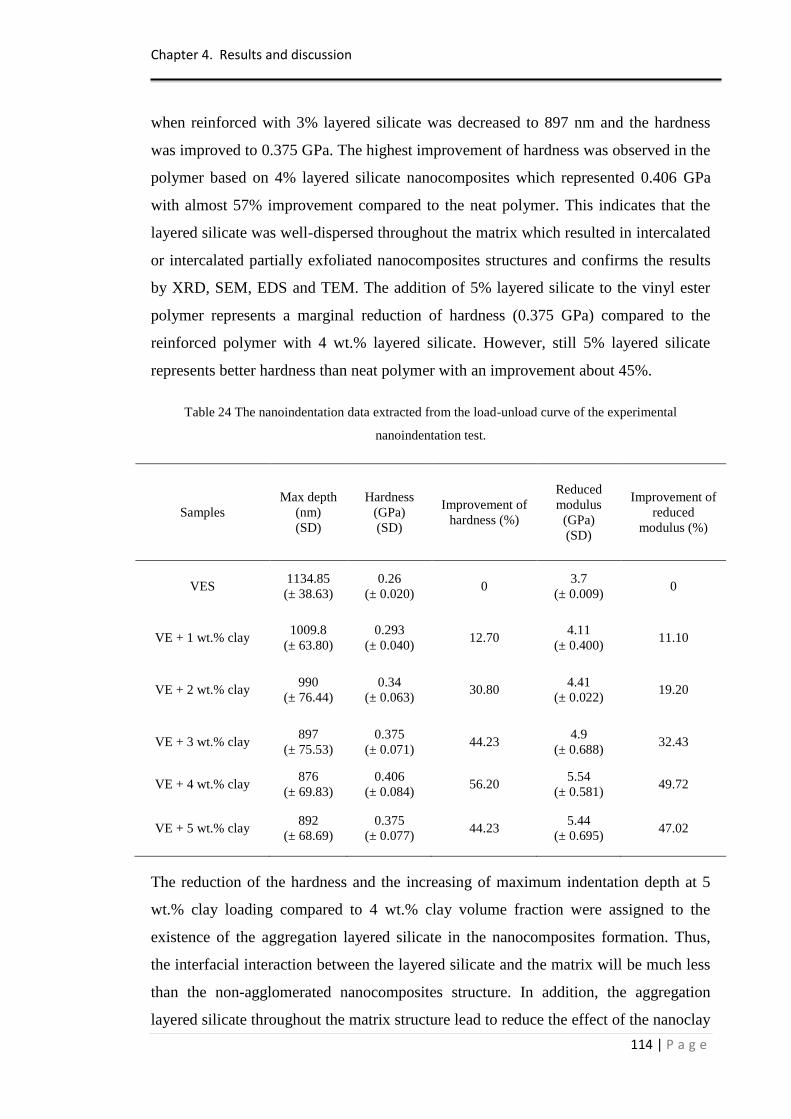
Chapter 4. Results and discussion
114 | P a g e
when reinforced with 3% layered silicate was decreased to 897 nm and the hardness
was improved to 0.375 GPa. The highest improvement of hardness was observed in the
polymer based on 4% layered silicate nanocomposites which represented 0.406 GPa
with almost 57% improvement compared to the neat polymer. This indicates that the
layered silicate was well-dispersed throughout the matrix which resulted in intercalated
or intercalated partially exfoliated nanocomposites structures and confirms the results
by XRD, SEM, EDS and TEM. The addition of 5% layered silicate to the vinyl ester
polymer represents a marginal reduction of hardness (0.375 GPa) compared to the
reinforced polymer with 4 wt.% layered silicate. However, still 5% layered silicate
represents better hardness than neat polymer with an improvement about 45%.
Table 24 The nanoindentation data extracted from the load-unload curve of the experimental
nanoindentation test.
Samples
Max depth
(nm)
(SD)
Hardness
(GPa)
(SD)
Improvement of
hardness (%)
Reduced
modulus
(GPa)
(SD)
Improvement of
reduced
modulus (%)
VES 1134.85
(± 38.63)
0.26
(± 0.020) 0
3.7
(± 0.009) 0
VE + 1 wt.% clay 1009.8
(± 63.80)
0.293
(± 0.040) 12.70
4.11
(± 0.400) 11.10
VE + 2 wt.% clay 990
(± 76.44)
0.34
(± 0.063) 30.80
4.41
(± 0.022) 19.20
VE + 3 wt.% clay 897
(± 75.53)
0.375
(± 0.071) 44.23
4.9
(± 0.688) 32.43
VE + 4 wt.% clay 876
(± 69.83)
0.406
(± 0.084) 56.20
5.54
(± 0.581) 49.72
VE + 5 wt.% clay 892
(± 68.69)
0.375
(± 0.077) 44.23
5.44
(± 0.695) 47.02
The reduction of the hardness and the increasing of maximum indentation depth at 5
wt.% clay loading compared to 4 wt.% clay volume fraction were assigned to the
existence of the aggregation layered silicate in the nanocomposites formation. Thus,
the interfacial interaction between the layered silicate and the matrix will be much less
than the non-agglomerated nanocomposites structure. In addition, the aggregation
layered silicate throughout the matrix structure lead to reduce the effect of the nanoclay
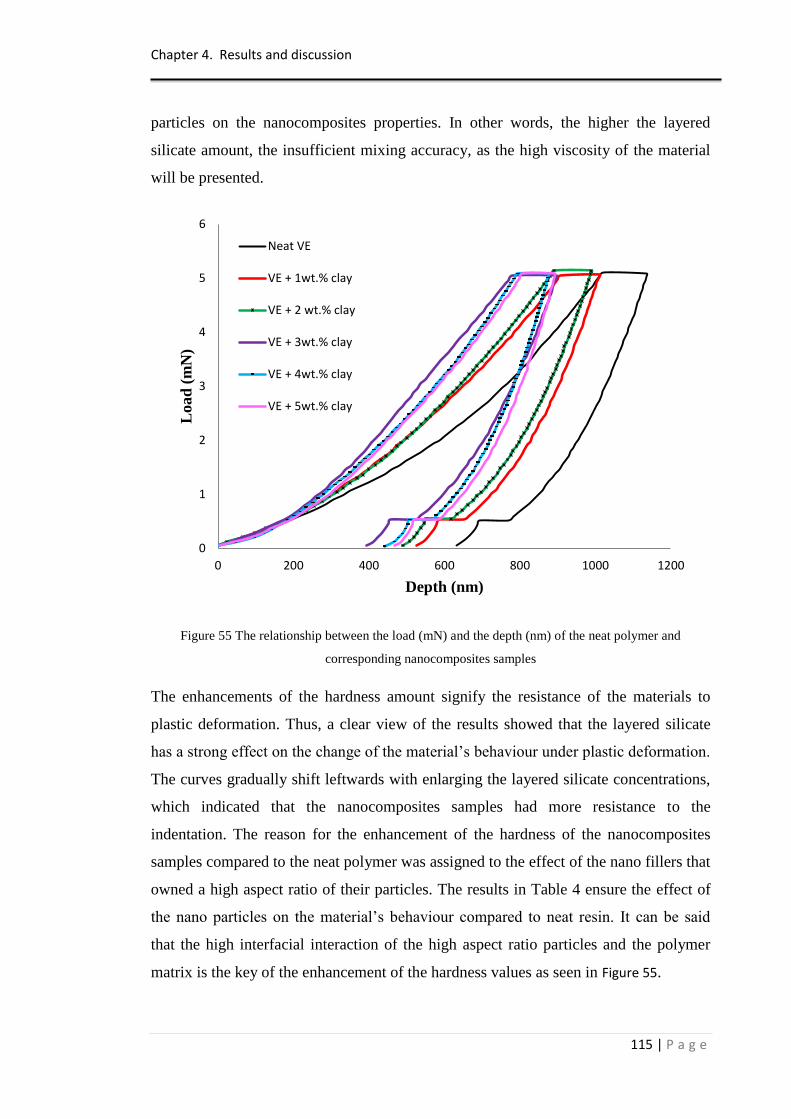
Chapter 4. Results and discussion
115 | P a g e
particles on the nanocomposites properties. In other words, the higher the layered
silicate amount, the insufficient mixing accuracy, as the high viscosity of the material
will be presented.
Figure 55 The relationship between the load (mN) and the depth (nm) of the neat polymer and
corresponding nanocomposites samples
The enhancements of the hardness amount signify the resistance of the materials to
plastic deformation. Thus, a clear view of the results showed that the layered silicate
has a strong effect on the change of the material‟s behaviour under plastic deformation.
The curves gradually shift leftwards with enlarging the layered silicate concentrations,
which indicated that the nanocomposites samples had more resistance to the
indentation. The reason for the enhancement of the hardness of the nanocomposites
samples compared to the neat polymer was assigned to the effect of the nano fillers that
owned a high aspect ratio of their particles. The results in Table 4 ensure the effect of
the nano particles on the material‟s behaviour compared to neat resin. It can be said
that the high interfacial interaction of the high aspect ratio particles and the polymer
matrix is the key of the enhancement of the hardness values as seen in Figure 55.
0
1
2
3
4
5
6
0 200 400 600 800 1000 1200
Load
(m
N)
Depth (nm)
Neat VE
VE + 1wt.% clay
VE + 2 wt.% clay
VE + 3wt.% clay
VE + 4wt.% clay
VE + 5wt.% clay
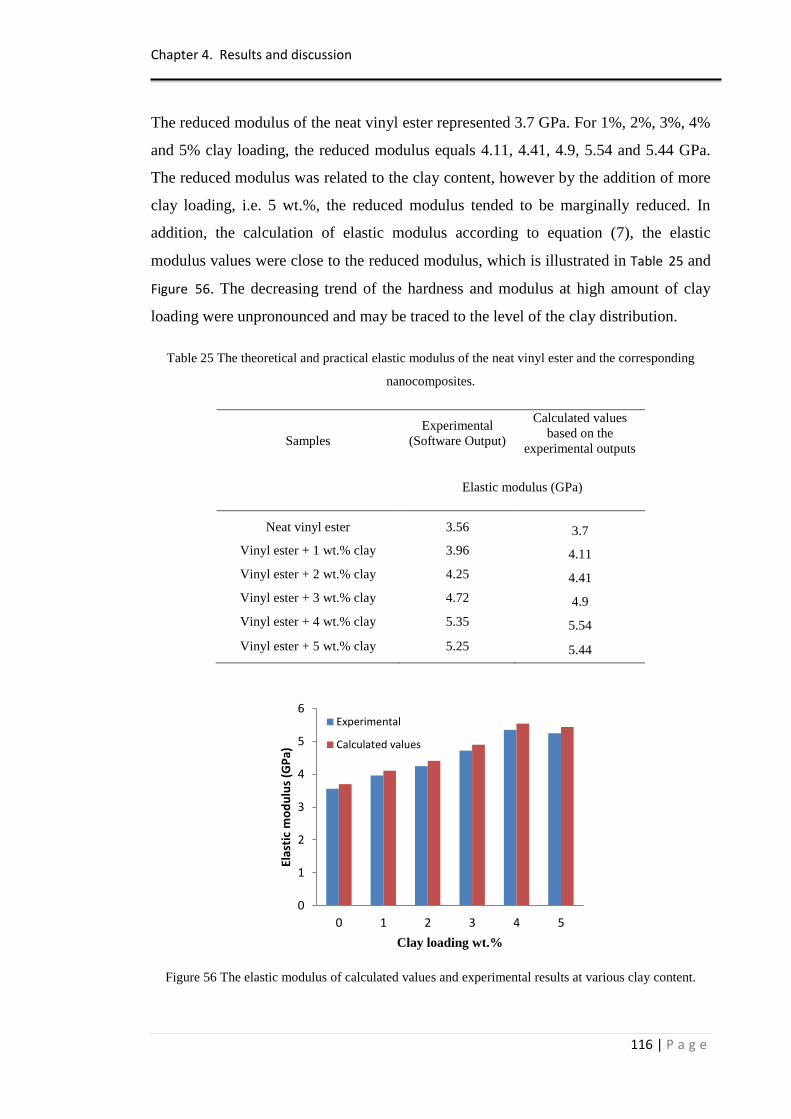
Chapter 4. Results and discussion
116 | P a g e
The reduced modulus of the neat vinyl ester represented 3.7 GPa. For 1%, 2%, 3%, 4%
and 5% clay loading, the reduced modulus equals 4.11, 4.41, 4.9, 5.54 and 5.44 GPa.
The reduced modulus was related to the clay content, however by the addition of more
clay loading, i.e. 5 wt.%, the reduced modulus tended to be marginally reduced. In
addition, the calculation of elastic modulus according to equation (7), the elastic
modulus values were close to the reduced modulus, which is illustrated in Table 25 and
Figure 56. The decreasing trend of the hardness and modulus at high amount of clay
loading were unpronounced and may be traced to the level of the clay distribution.
Table 25 The theoretical and practical elastic modulus of the neat vinyl ester and the corresponding
nanocomposites.
Samples
Experimental
(Software Output)
Calculated values
based on the
experimental outputs
Elastic modulus (GPa)
Neat vinyl ester 3.56 3.7
Vinyl ester + 1 wt.% clay 3.96 4.11
Vinyl ester + 2 wt.% clay 4.25 4.41
Vinyl ester + 3 wt.% clay 4.72 4.9
Vinyl ester + 4 wt.% clay 5.35 5.54
Vinyl ester + 5 wt.% clay 5.25 5.44
Figure 56 The elastic modulus of calculated values and experimental results at various clay content.
0
1
2
3
4
5
6
0 1 2 3 4 5
Elas
tic
mo
du
lus
(GP
a)
Clay loading wt.%
Experimental
Calculated values
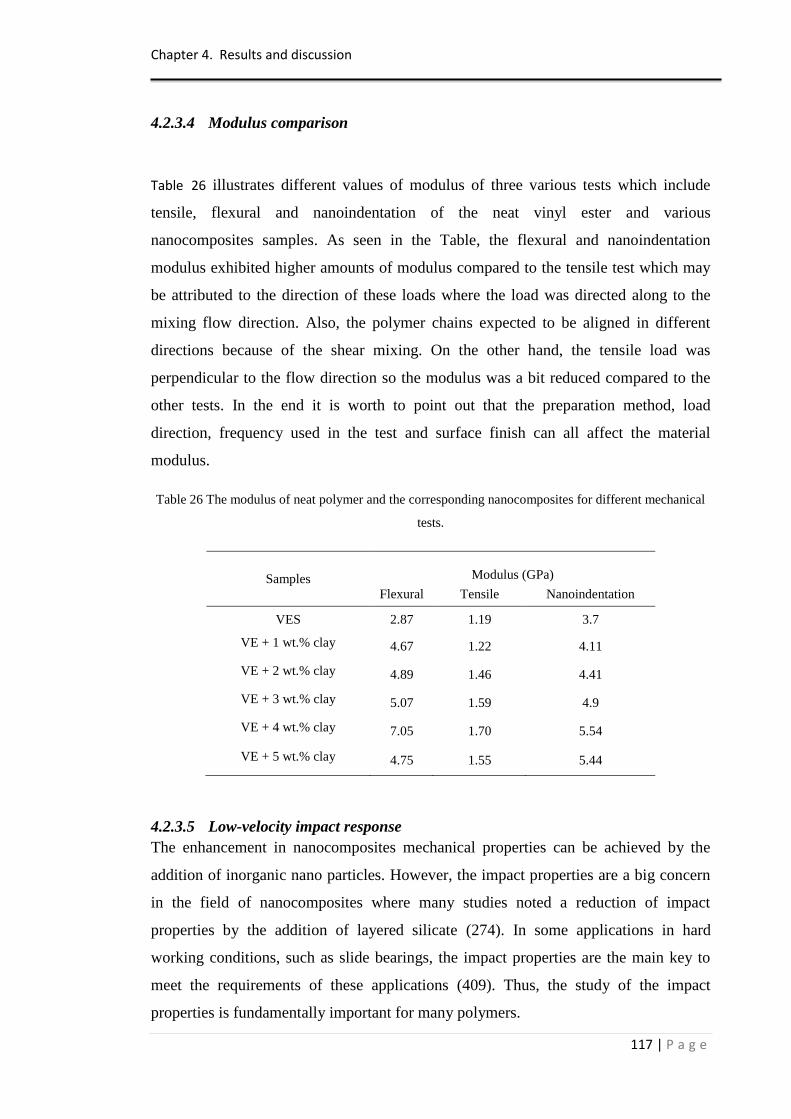
Chapter 4. Results and discussion
117 | P a g e
4.2.3.4 Modulus comparison
Table 26 illustrates different values of modulus of three various tests which include
tensile, flexural and nanoindentation of the neat vinyl ester and various
nanocomposites samples. As seen in the Table, the flexural and nanoindentation
modulus exhibited higher amounts of modulus compared to the tensile test which may
be attributed to the direction of these loads where the load was directed along to the
mixing flow direction. Also, the polymer chains expected to be aligned in different
directions because of the shear mixing. On the other hand, the tensile load was
perpendicular to the flow direction so the modulus was a bit reduced compared to the
other tests. In the end it is worth to point out that the preparation method, load
direction, frequency used in the test and surface finish can all affect the material
modulus.
Table 26 The modulus of neat polymer and the corresponding nanocomposites for different mechanical
tests.
Samples
Modulus (GPa)
Flexural Tensile Nanoindentation
VES 2.87 1.19 3.7
VE + 1 wt.% clay 4.67 1.22 4.11
VE + 2 wt.% clay 4.89 1.46 4.41
VE + 3 wt.% clay 5.07 1.59 4.9
VE + 4 wt.% clay 7.05 1.70 5.54
VE + 5 wt.% clay 4.75 1.55 5.44
4.2.3.5 Low-velocity impact response
The enhancement in nanocomposites mechanical properties can be achieved by the
addition of inorganic nano particles. However, the impact properties are a big concern
in the field of nanocomposites where many studies noted a reduction of impact
properties by the addition of layered silicate (274). In some applications in hard
working conditions, such as slide bearings, the impact properties are the main key to
meet the requirements of these applications (409). Thus, the study of the impact
properties is fundamentally important for many polymers.
Chapter 4. Results and discussion
118 | P a g e
Figure 57 Zwick/Roell HIT230F drop weight impact tower and specimen clamping.
In this study, the falling weight impact tests (see Figure 57) were carried out on the neat
vinyl ester and the corresponding nanocomposites. Different clay concentrations were
used which included 2, 4, and 5 wt.% clay loading. The impact test was used in order
to analyse and evaluate the effect of the incorporation of layered silicate into the
polymer matrix. Many parameters can be calculated from this test, such as the
maximum force (N) and energy absorption (J) in a function of time (ms) curve. Four
specimens from each group were tested and the average values were calculated as seen
in Table 27.
Table 27 Impact test results of neat polymer and the corresponding of nanocomposites.
Samples Fmax (N)
Improvement
of the peak load
(%)
Energy (J)
Improvement of
the energy
absorption (%)
Neat vinyl ester 1327 + 9.00 0 1.54 + 0.38 0
VE+ 2 wt.t % clay loading 1501 + 8.80 13.11 1.83 + 0.31 18.9
VE+ 4 wt.t % clay loading 1885 + 9.00 42.05 2.46 + 0.30 59.74
VE+ 5 wt.t % clay loading 1655 + 10.0 24.72 1.95 + 0.33 21.03
It can be seen from Table 27, the incorporation of the layered silicate into the vinyl ester
matrix resulted in enhancing the impact properties. The maximum force and energy
absorption were increased up to 42% and 59.74% respectively at 4 wt.% clay loading.
The improvements of the maximum load and energy were related to the amount of the
clay loading; however, at higher amounts of clay loading such as 5 wt.%, the force and
Impactor
mass
Specimen
clamping
system
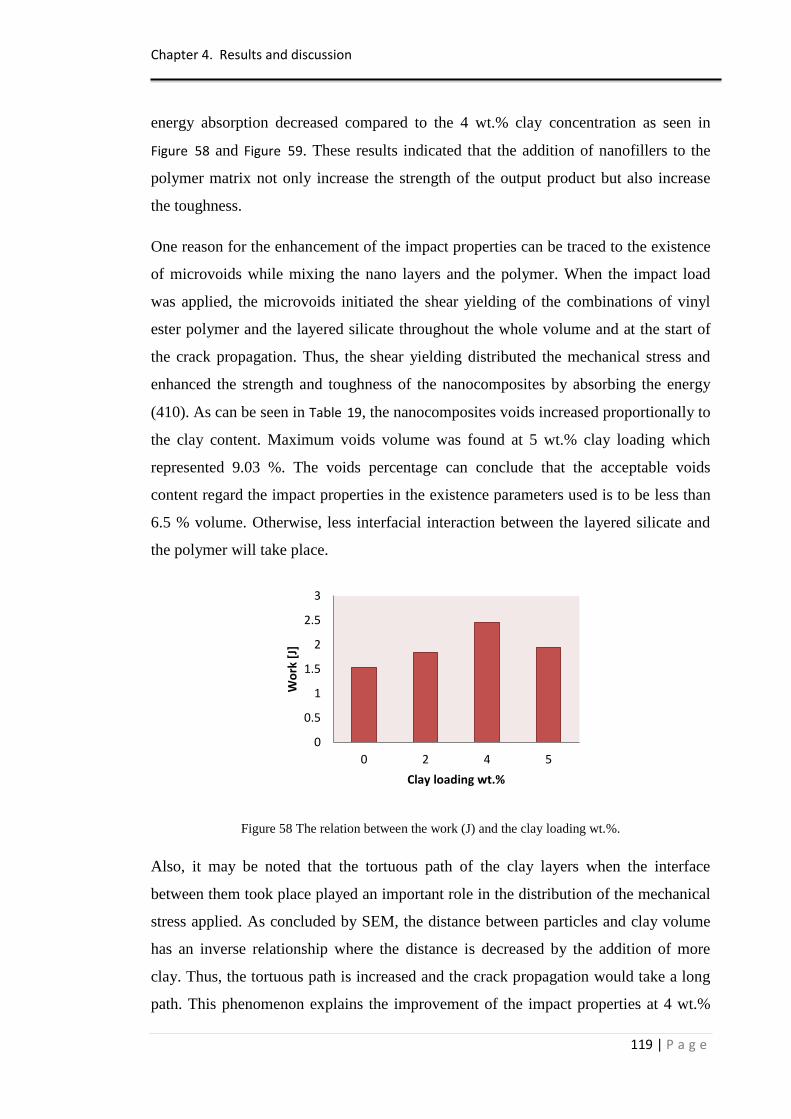
Chapter 4. Results and discussion
119 | P a g e
energy absorption decreased compared to the 4 wt.% clay concentration as seen in
Figure 58 and Figure 59. These results indicated that the addition of nanofillers to the
polymer matrix not only increase the strength of the output product but also increase
the toughness.
One reason for the enhancement of the impact properties can be traced to the existence
of microvoids while mixing the nano layers and the polymer. When the impact load
was applied, the microvoids initiated the shear yielding of the combinations of vinyl
ester polymer and the layered silicate throughout the whole volume and at the start of
the crack propagation. Thus, the shear yielding distributed the mechanical stress and
enhanced the strength and toughness of the nanocomposites by absorbing the energy
(410). As can be seen in Table 19, the nanocomposites voids increased proportionally to
the clay content. Maximum voids volume was found at 5 wt.% clay loading which
represented 9.03 %. The voids percentage can conclude that the acceptable voids
content regard the impact properties in the existence parameters used is to be less than
6.5 % volume. Otherwise, less interfacial interaction between the layered silicate and
the polymer will take place.
Figure 58 The relation between the work (J) and the clay loading wt.%.
Also, it may be noted that the tortuous path of the clay layers when the interface
between them took place played an important role in the distribution of the mechanical
stress applied. As concluded by SEM, the distance between particles and clay volume
has an inverse relationship where the distance is decreased by the addition of more
clay. Thus, the tortuous path is increased and the crack propagation would take a long
path. This phenomenon explains the improvement of the impact properties at 4 wt.%
0
0.5
1
1.5
2
2.5
3
0 2 4 5
Wo
rk [
J]
Clay loading wt.%
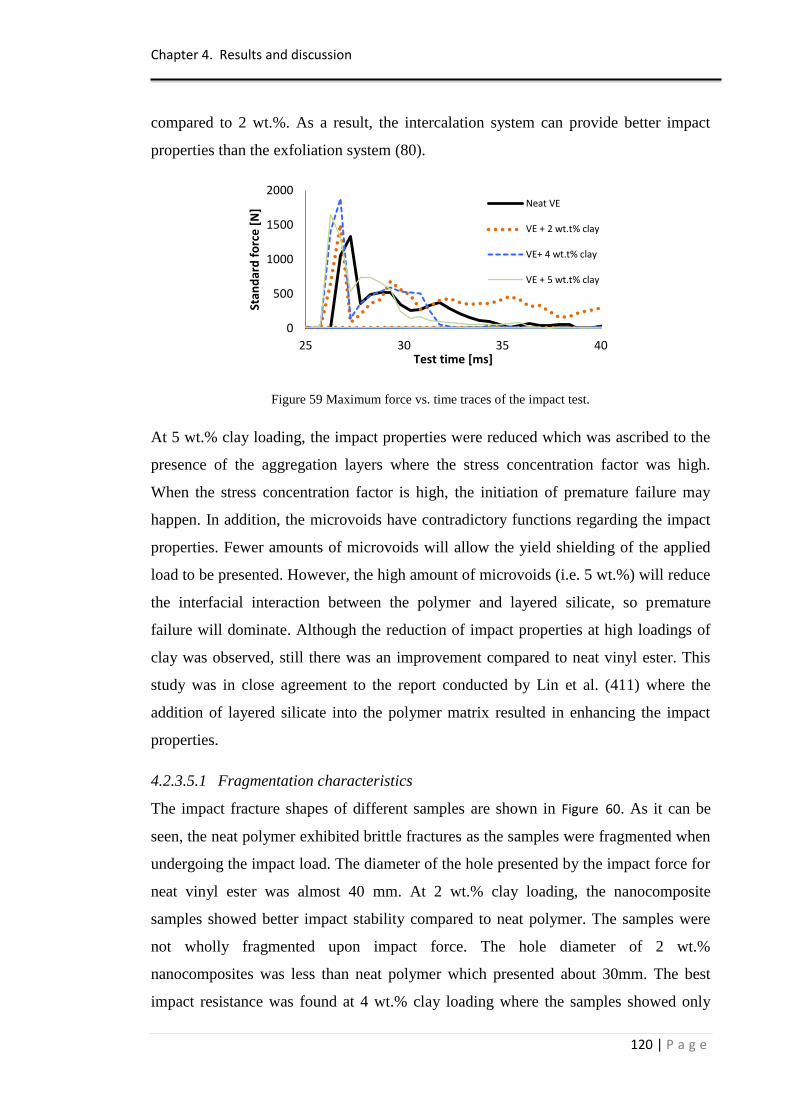
Chapter 4. Results and discussion
120 | P a g e
compared to 2 wt.%. As a result, the intercalation system can provide better impact
properties than the exfoliation system (80).
Figure 59 Maximum force vs. time traces of the impact test.
At 5 wt.% clay loading, the impact properties were reduced which was ascribed to the
presence of the aggregation layers where the stress concentration factor was high.
When the stress concentration factor is high, the initiation of premature failure may
happen. In addition, the microvoids have contradictory functions regarding the impact
properties. Fewer amounts of microvoids will allow the yield shielding of the applied
load to be presented. However, the high amount of microvoids (i.e. 5 wt.%) will reduce
the interfacial interaction between the polymer and layered silicate, so premature
failure will dominate. Although the reduction of impact properties at high loadings of
clay was observed, still there was an improvement compared to neat vinyl ester. This
study was in close agreement to the report conducted by Lin et al. (411) where the
addition of layered silicate into the polymer matrix resulted in enhancing the impact
properties.
4.2.3.5.1 Fragmentation characteristics
The impact fracture shapes of different samples are shown in Figure 60. As it can be
seen, the neat polymer exhibited brittle fractures as the samples were fragmented when
undergoing the impact load. The diameter of the hole presented by the impact force for
neat vinyl ester was almost 40 mm. At 2 wt.% clay loading, the nanocomposite
samples showed better impact stability compared to neat polymer. The samples were
not wholly fragmented upon impact force. The hole diameter of 2 wt.%
nanocomposites was less than neat polymer which presented about 30mm. The best
impact resistance was found at 4 wt.% clay loading where the samples showed only
0
500
1000
1500
2000
25 30 35 40
Stan
dar
d f
orc
e [
N]
Test time [ms]
Neat VE
VE + 2 wt.t% clay
VE+ 4 wt.t% clay
VE + 5 wt.t% clay
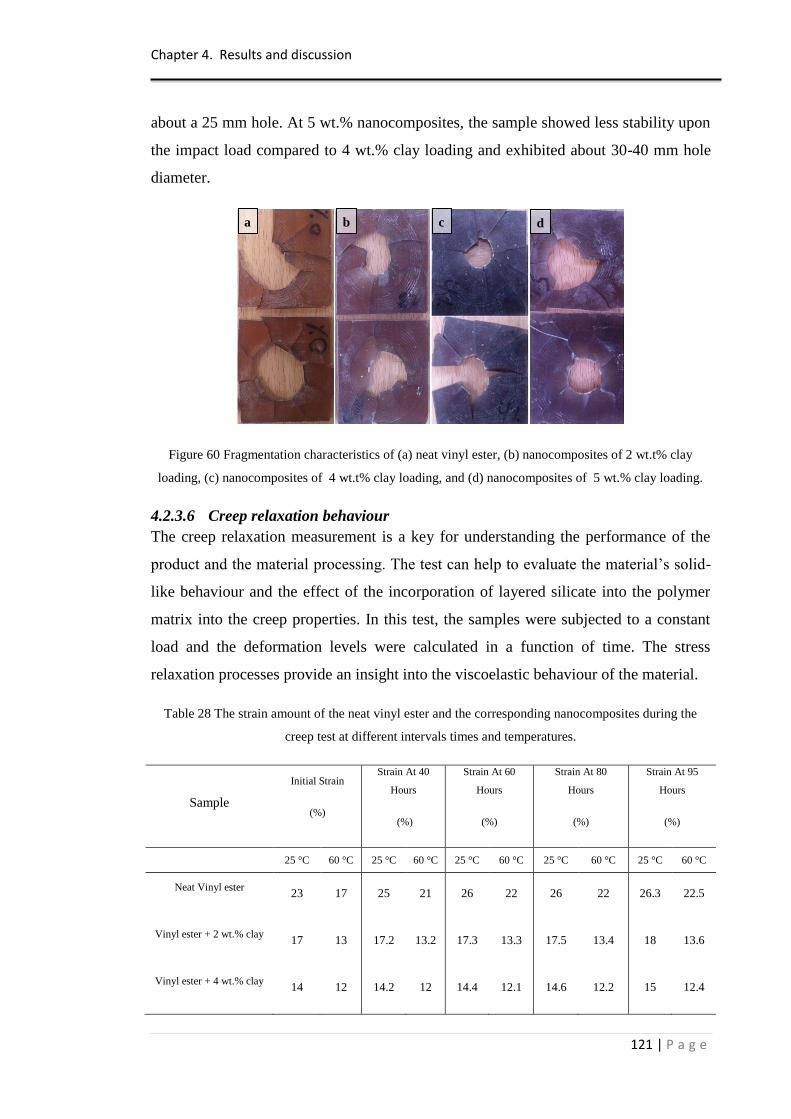
Chapter 4. Results and discussion
121 | P a g e
about a 25 mm hole. At 5 wt.% nanocomposites, the sample showed less stability upon
the impact load compared to 4 wt.% clay loading and exhibited about 30-40 mm hole
diameter.
Figure 60 Fragmentation characteristics of (a) neat vinyl ester, (b) nanocomposites of 2 wt.t% clay
loading, (c) nanocomposites of 4 wt.t% clay loading, and (d) nanocomposites of 5 wt.% clay loading.
4.2.3.6 Creep relaxation behaviour
The creep relaxation measurement is a key for understanding the performance of the
product and the material processing. The test can help to evaluate the material‟s solid-
like behaviour and the effect of the incorporation of layered silicate into the polymer
matrix into the creep properties. In this test, the samples were subjected to a constant
load and the deformation levels were calculated in a function of time. The stress
relaxation processes provide an insight into the viscoelastic behaviour of the material.
Table 28 The strain amount of the neat vinyl ester and the corresponding nanocomposites during the
creep test at different intervals times and temperatures.
Sample
Initial Strain
(%)
Strain At 40
Hours
(%)
Strain At 60
Hours
(%)
Strain At 80
Hours
(%)
Strain At 95
Hours
(%)
25 °C 60 °C 25 °C 60 °C 25 °C 60 °C 25 °C 60 °C 25 °C 60 °C
Neat Vinyl ester 23 17 25 21 26 22 26 22 26.3 22.5
Vinyl ester + 2 wt.% clay 17 13 17.2 13.2 17.3 13.3 17.5 13.4 18 13.6
Vinyl ester + 4 wt.% clay 14 12 14.2 12 14.4 12.1 14.6 12.2 15 12.4
a b c d
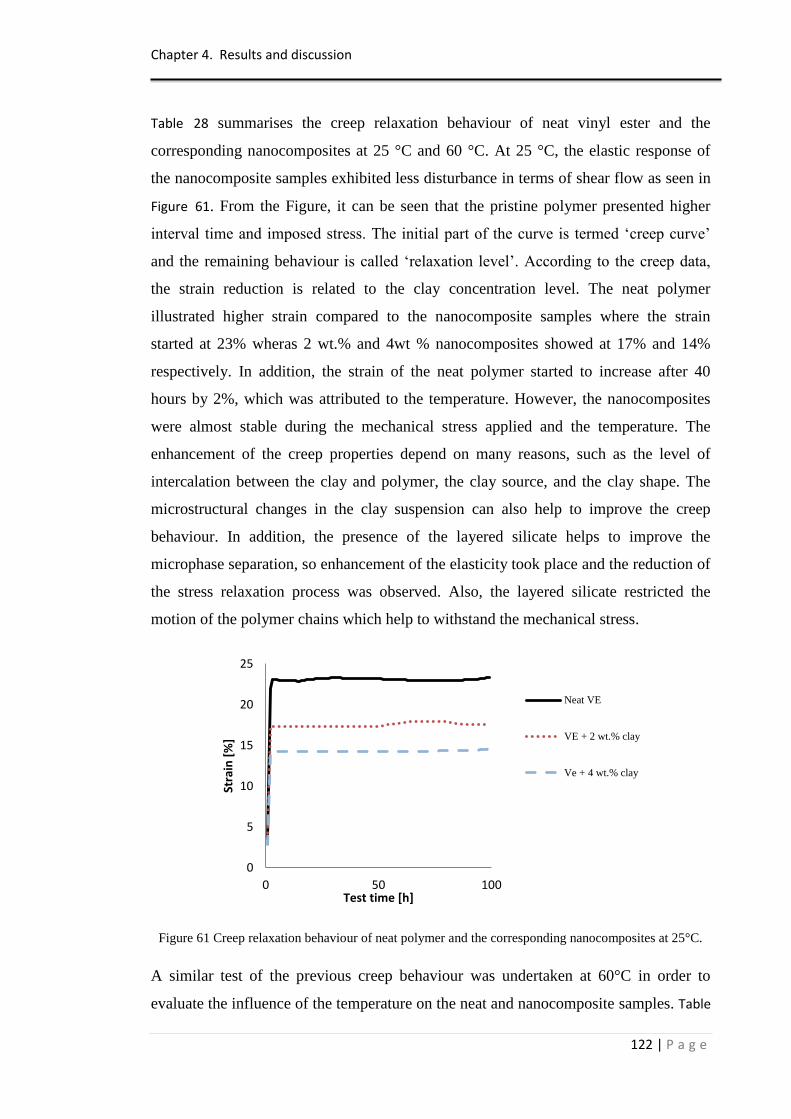
Chapter 4. Results and discussion
122 | P a g e
Table 28 summarises the creep relaxation behaviour of neat vinyl ester and the
corresponding nanocomposites at 25 °C and 60 °C. At 25 °C, the elastic response of
the nanocomposite samples exhibited less disturbance in terms of shear flow as seen in
Figure 61. From the Figure, it can be seen that the pristine polymer presented higher
interval time and imposed stress. The initial part of the curve is termed „creep curve‟
and the remaining behaviour is called „relaxation level‟. According to the creep data,
the strain reduction is related to the clay concentration level. The neat polymer
illustrated higher strain compared to the nanocomposite samples where the strain
started at 23% wheras 2 wt.% and 4wt % nanocomposites showed at 17% and 14%
respectively. In addition, the strain of the neat polymer started to increase after 40
hours by 2%, which was attributed to the temperature. However, the nanocomposites
were almost stable during the mechanical stress applied and the temperature. The
enhancement of the creep properties depend on many reasons, such as the level of
intercalation between the clay and polymer, the clay source, and the clay shape. The
microstructural changes in the clay suspension can also help to improve the creep
behaviour. In addition, the presence of the layered silicate helps to improve the
microphase separation, so enhancement of the elasticity took place and the reduction of
the stress relaxation process was observed. Also, the layered silicate restricted the
motion of the polymer chains which help to withstand the mechanical stress.
Figure 61 Creep relaxation behaviour of neat polymer and the corresponding nanocomposites at 25°C.
A similar test of the previous creep behaviour was undertaken at 60°C in order to
evaluate the influence of the temperature on the neat and nanocomposite samples. Table
0
5
10
15
20
25
0 50 100
Stra
in [
%]
Test time [h]
Neat VE
VE + 2 wt.% clay
Ve + 4 wt.% clay
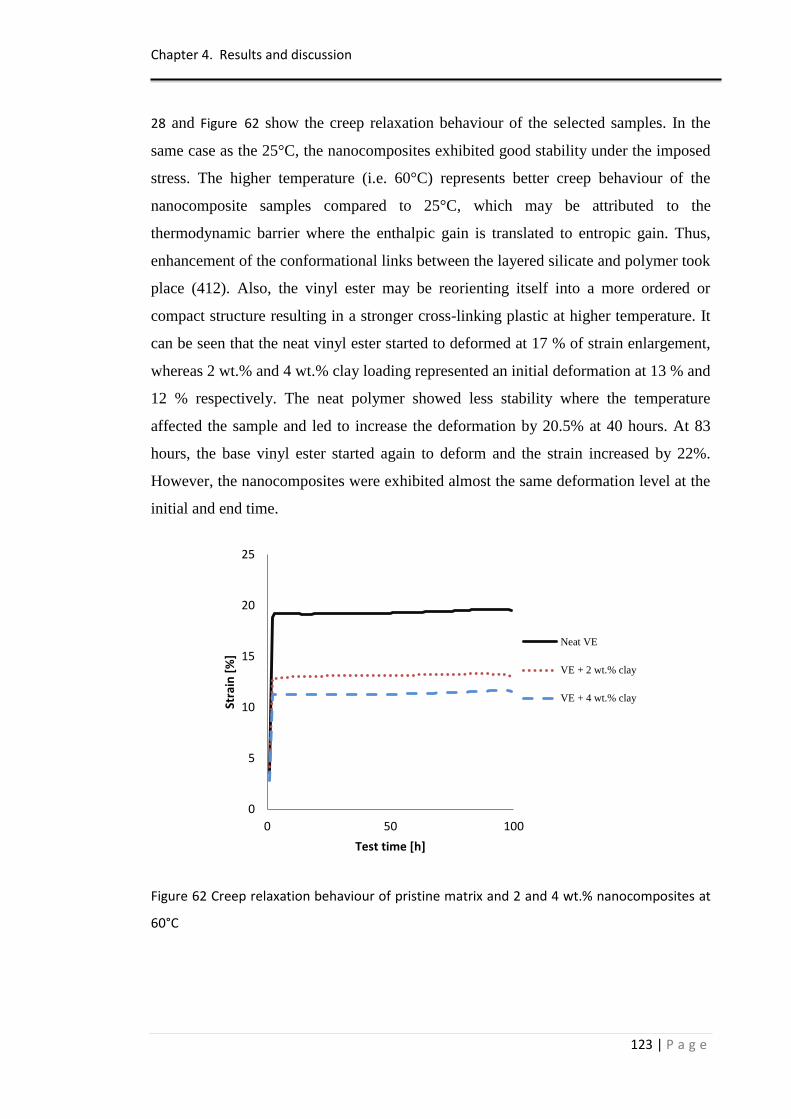
Chapter 4. Results and discussion
123 | P a g e
28 and Figure 62 show the creep relaxation behaviour of the selected samples. In the
same case as the 25°C, the nanocomposites exhibited good stability under the imposed
stress. The higher temperature (i.e. 60°C) represents better creep behaviour of the
nanocomposite samples compared to 25°C, which may be attributed to the
thermodynamic barrier where the enthalpic gain is translated to entropic gain. Thus,
enhancement of the conformational links between the layered silicate and polymer took
place (412). Also, the vinyl ester may be reorienting itself into a more ordered or
compact structure resulting in a stronger cross-linking plastic at higher temperature. It
can be seen that the neat vinyl ester started to deformed at 17 % of strain enlargement,
whereas 2 wt.% and 4 wt.% clay loading represented an initial deformation at 13 % and
12 % respectively. The neat polymer showed less stability where the temperature
affected the sample and led to increase the deformation by 20.5% at 40 hours. At 83
hours, the base vinyl ester started again to deform and the strain increased by 22%.
However, the nanocomposites were exhibited almost the same deformation level at the
initial and end time.
Figure 62 Creep relaxation behaviour of pristine matrix and 2 and 4 wt.% nanocomposites at
60°C
0
5
10
15
20
25
0 50 100
Stra
in [
%]
Test time [h]
Neat VE
VE + 2 wt.% clay
VE + 4 wt.% clay
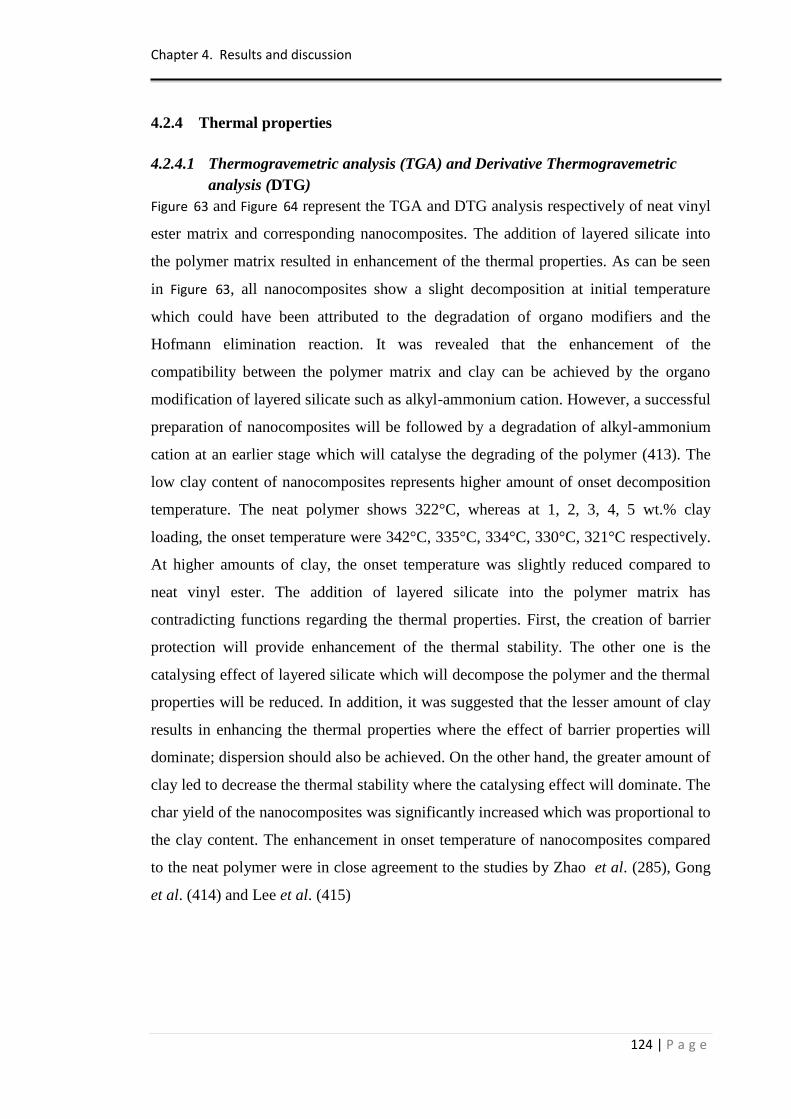
Chapter 4. Results and discussion
124 | P a g e
4.2.4 Thermal properties
4.2.4.1 Thermogravemetric analysis (TGA) and Derivative Thermogravemetric
analysis (DTG)
Figure 63 and Figure 64 represent the TGA and DTG analysis respectively of neat vinyl
ester matrix and corresponding nanocomposites. The addition of layered silicate into
the polymer matrix resulted in enhancement of the thermal properties. As can be seen
in Figure 63, all nanocomposites show a slight decomposition at initial temperature
which could have been attributed to the degradation of organo modifiers and the
Hofmann elimination reaction. It was revealed that the enhancement of the
compatibility between the polymer matrix and clay can be achieved by the organo
modification of layered silicate such as alkyl-ammonium cation. However, a successful
preparation of nanocomposites will be followed by a degradation of alkyl-ammonium
cation at an earlier stage which will catalyse the degrading of the polymer (413). The
low clay content of nanocomposites represents higher amount of onset decomposition
temperature. The neat polymer shows 322°C, whereas at 1, 2, 3, 4, 5 wt.% clay
loading, the onset temperature were 342°C, 335°C, 334°C, 330°C, 321°C respectively.
At higher amounts of clay, the onset temperature was slightly reduced compared to
neat vinyl ester. The addition of layered silicate into the polymer matrix has
contradicting functions regarding the thermal properties. First, the creation of barrier
protection will provide enhancement of the thermal stability. The other one is the
catalysing effect of layered silicate which will decompose the polymer and the thermal
properties will be reduced. In addition, it was suggested that the lesser amount of clay
results in enhancing the thermal properties where the effect of barrier properties will
dominate; dispersion should also be achieved. On the other hand, the greater amount of
clay led to decrease the thermal stability where the catalysing effect will dominate. The
char yield of the nanocomposites was significantly increased which was proportional to
the clay content. The enhancement in onset temperature of nanocomposites compared
to the neat polymer were in close agreement to the studies by Zhao et al. (285), Gong
et al. (414) and Lee et al. (415)
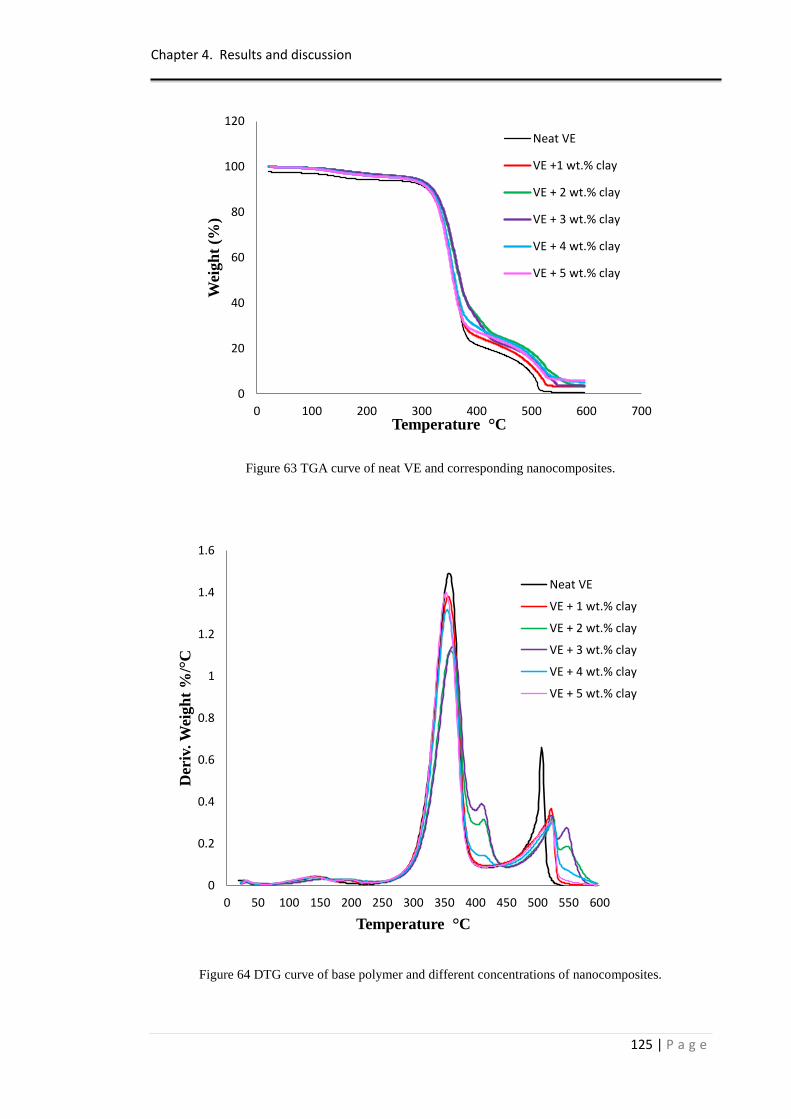
Chapter 4. Results and discussion
125 | P a g e
Figure 63 TGA curve of neat VE and corresponding nanocomposites.
Figure 64 DTG curve of base polymer and different concentrations of nanocomposites.
0
20
40
60
80
100
120
0 100 200 300 400 500 600 700
Wei
gh
t (%
)
Temperature °C
Neat VE
VE +1 wt.% clay
VE + 2 wt.% clay
VE + 3 wt.% clay
VE + 4 wt.% clay
VE + 5 wt.% clay
0
0.2
0.4
0.6
0.8
1
1.2
1.4
1.6
0 50 100 150 200 250 300 350 400 450 500 550 600
Der
iv. W
eigh
t %
/°C
Temperature °C
Neat VE
VE + 1 wt.% clay
VE + 2 wt.% clay
VE + 3 wt.% clay
VE + 4 wt.% clay
VE + 5 wt.% clay
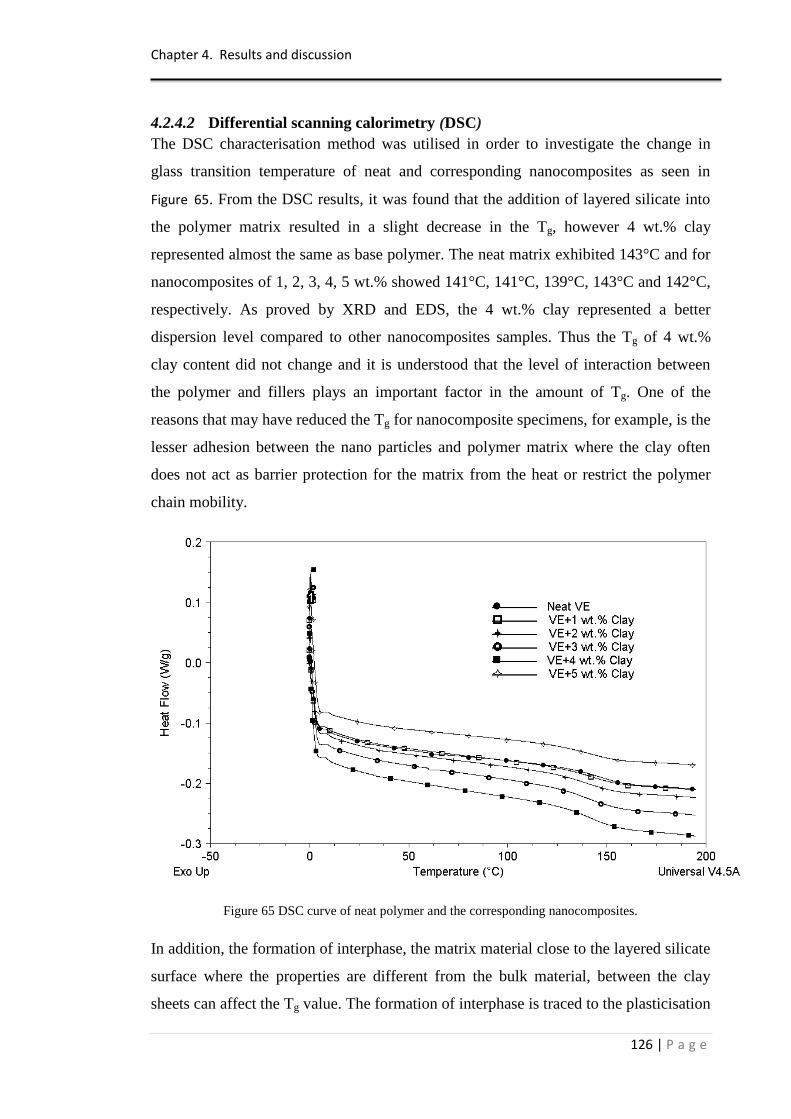
Chapter 4. Results and discussion
126 | P a g e
4.2.4.2 Differential scanning calorimetry (DSC)
The DSC characterisation method was utilised in order to investigate the change in
glass transition temperature of neat and corresponding nanocomposites as seen in
Figure 65. From the DSC results, it was found that the addition of layered silicate into
the polymer matrix resulted in a slight decrease in the Tg, however 4 wt.% clay
represented almost the same as base polymer. The neat matrix exhibited 143°C and for
nanocomposites of 1, 2, 3, 4, 5 wt.% showed 141°C, 141°C, 139°C, 143°C and 142°C,
respectively. As proved by XRD and EDS, the 4 wt.% clay represented a better
dispersion level compared to other nanocomposites samples. Thus the Tg of 4 wt.%
clay content did not change and it is understood that the level of interaction between
the polymer and fillers plays an important factor in the amount of Tg. One of the
reasons that may have reduced the Tg for nanocomposite specimens, for example, is the
lesser adhesion between the nano particles and polymer matrix where the clay often
does not act as barrier protection for the matrix from the heat or restrict the polymer
chain mobility.
Figure 65 DSC curve of neat polymer and the corresponding nanocomposites.
In addition, the formation of interphase, the matrix material close to the layered silicate
surface where the properties are different from the bulk material, between the clay
sheets can affect the Tg value. The formation of interphase is traced to the plasticisation
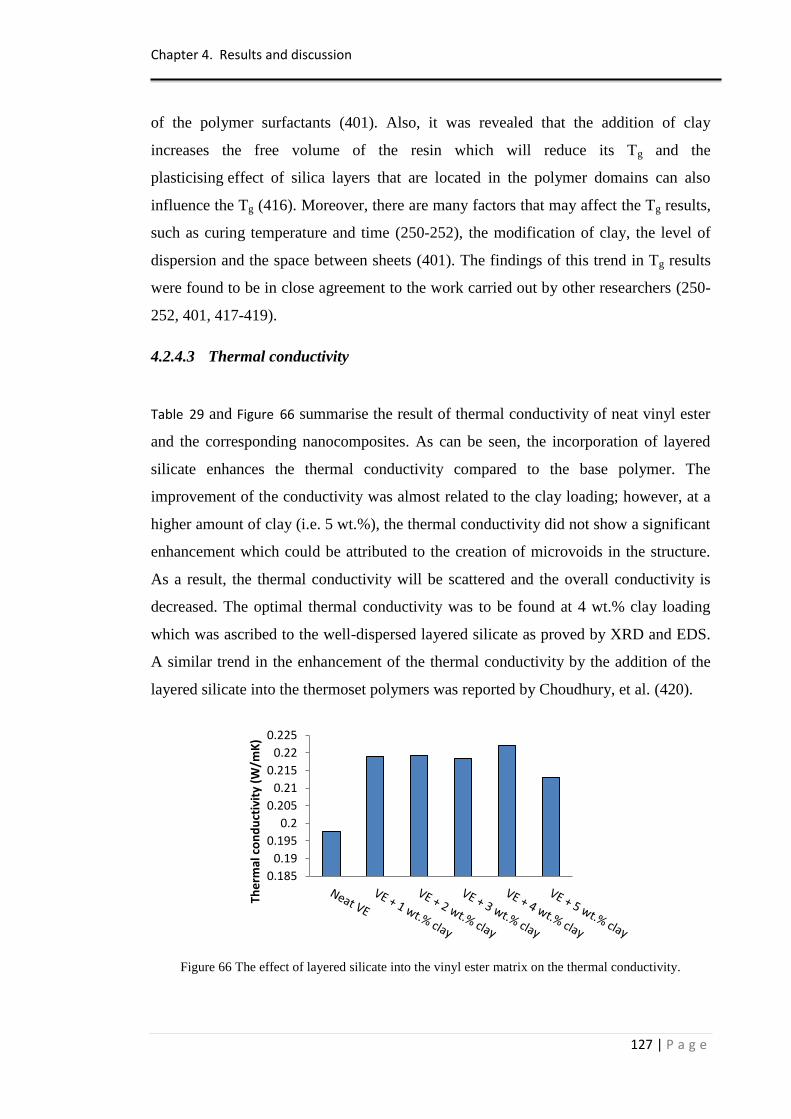
Chapter 4. Results and discussion
127 | P a g e
of the polymer surfactants (401). Also, it was revealed that the addition of clay
increases the free volume of the resin which will reduce its Tg and the
plasticising effect of silica layers that are located in the polymer domains can also
influence the Tg (416). Moreover, there are many factors that may affect the Tg results,
such as curing temperature and time (250-252), the modification of clay, the level of
dispersion and the space between sheets (401). The findings of this trend in Tg results
were found to be in close agreement to the work carried out by other researchers (250-
252, 401, 417-419).
4.2.4.3 Thermal conductivity
Table 29 and Figure 66 summarise the result of thermal conductivity of neat vinyl ester
and the corresponding nanocomposites. As can be seen, the incorporation of layered
silicate enhances the thermal conductivity compared to the base polymer. The
improvement of the conductivity was almost related to the clay loading; however, at a
higher amount of clay (i.e. 5 wt.%), the thermal conductivity did not show a significant
enhancement which could be attributed to the creation of microvoids in the structure.
As a result, the thermal conductivity will be scattered and the overall conductivity is
decreased. The optimal thermal conductivity was to be found at 4 wt.% clay loading
which was ascribed to the well-dispersed layered silicate as proved by XRD and EDS.
A similar trend in the enhancement of the thermal conductivity by the addition of the
layered silicate into the thermoset polymers was reported by Choudhury, et al. (420).
Figure 66 The effect of layered silicate into the vinyl ester matrix on the thermal conductivity.
0.185
0.19
0.195
0.2
0.205
0.21
0.215
0.22
0.225
The
rmal
co
nd
uct
ivit
y (W
/mK
)
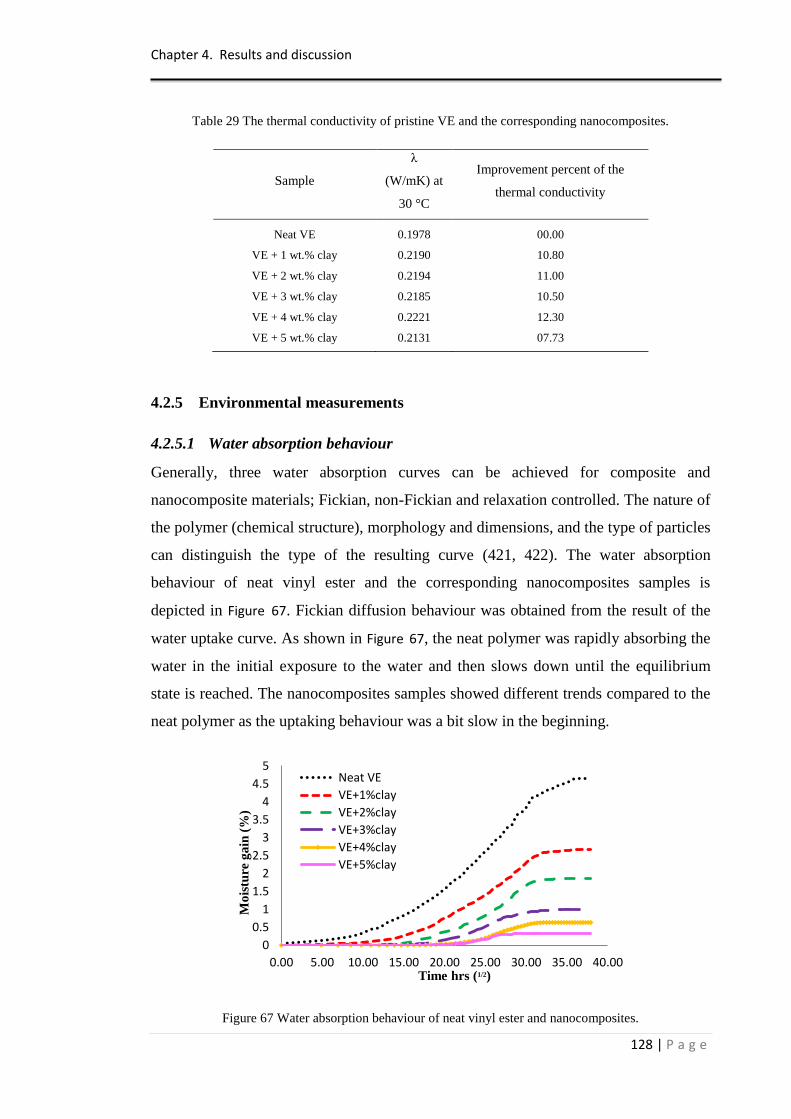
Chapter 4. Results and discussion
128 | P a g e
Table 29 The thermal conductivity of pristine VE and the corresponding nanocomposites.
Sample
λ
(W/mK) at
30 °C
Improvement percent of the
thermal conductivity
Neat VE 0.1978 00.00
VE + 1 wt.% clay 0.2190 10.80
VE + 2 wt.% clay 0.2194 11.00
VE + 3 wt.% clay 0.2185 10.50
VE + 4 wt.% clay 0.2221 12.30
VE + 5 wt.% clay 0.2131 07.73
4.2.5 Environmental measurements
4.2.5.1 Water absorption behaviour
Generally, three water absorption curves can be achieved for composite and
nanocomposite materials; Fickian, non-Fickian and relaxation controlled. The nature of
the polymer (chemical structure), morphology and dimensions, and the type of particles
can distinguish the type of the resulting curve (421, 422). The water absorption
behaviour of neat vinyl ester and the corresponding nanocomposites samples is
depicted in Figure 67. Fickian diffusion behaviour was obtained from the result of the
water uptake curve. As shown in Figure 67, the neat polymer was rapidly absorbing the
water in the initial exposure to the water and then slows down until the equilibrium
state is reached. The nanocomposites samples showed different trends compared to the
neat polymer as the uptaking behaviour was a bit slow in the beginning.
Figure 67 Water absorption behaviour of neat vinyl ester and nanocomposites.
0
0.5
1
1.5
2
2.5
3
3.5
4
4.5
5
0.00 5.00 10.00 15.00 20.00 25.00 30.00 35.00 40.00
Mo
istu
re g
ain
(%
)
Time hrs (1/2)
Neat VE
VE+1%clay
VE+2%clay
VE+3%clay
VE+4%clay
VE+5%clay
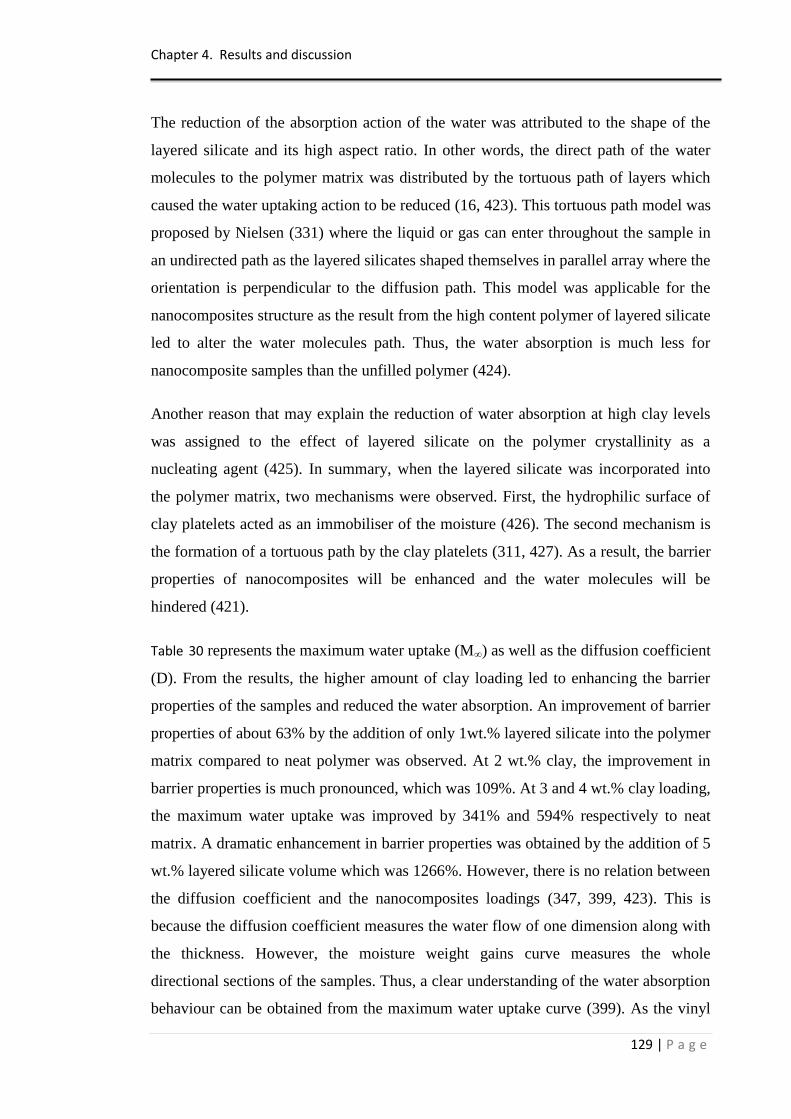
Chapter 4. Results and discussion
129 | P a g e
The reduction of the absorption action of the water was attributed to the shape of the
layered silicate and its high aspect ratio. In other words, the direct path of the water
molecules to the polymer matrix was distributed by the tortuous path of layers which
caused the water uptaking action to be reduced (16, 423). This tortuous path model was
proposed by Nielsen (331) where the liquid or gas can enter throughout the sample in
an undirected path as the layered silicates shaped themselves in parallel array where the
orientation is perpendicular to the diffusion path. This model was applicable for the
nanocomposites structure as the result from the high content polymer of layered silicate
led to alter the water molecules path. Thus, the water absorption is much less for
nanocomposite samples than the unfilled polymer (424).
Another reason that may explain the reduction of water absorption at high clay levels
was assigned to the effect of layered silicate on the polymer crystallinity as a
nucleating agent (425). In summary, when the layered silicate was incorporated into
the polymer matrix, two mechanisms were observed. First, the hydrophilic surface of
clay platelets acted as an immobiliser of the moisture (426). The second mechanism is
the formation of a tortuous path by the clay platelets (311, 427). As a result, the barrier
properties of nanocomposites will be enhanced and the water molecules will be
hindered (421).
Table 30 represents the maximum water uptake (M∞) as well as the diffusion coefficient
(D). From the results, the higher amount of clay loading led to enhancing the barrier
properties of the samples and reduced the water absorption. An improvement of barrier
properties of about 63% by the addition of only 1wt.% layered silicate into the polymer
matrix compared to neat polymer was observed. At 2 wt.% clay, the improvement in
barrier properties is much pronounced, which was 109%. At 3 and 4 wt.% clay loading,
the maximum water uptake was improved by 341% and 594% respectively to neat
matrix. A dramatic enhancement in barrier properties was obtained by the addition of 5
wt.% layered silicate volume which was 1266%. However, there is no relation between
the diffusion coefficient and the nanocomposites loadings (347, 399, 423). This is
because the diffusion coefficient measures the water flow of one dimension along with
the thickness. However, the moisture weight gains curve measures the whole
directional sections of the samples. Thus, a clear understanding of the water absorption
behaviour can be obtained from the maximum water uptake curve (399). As the vinyl
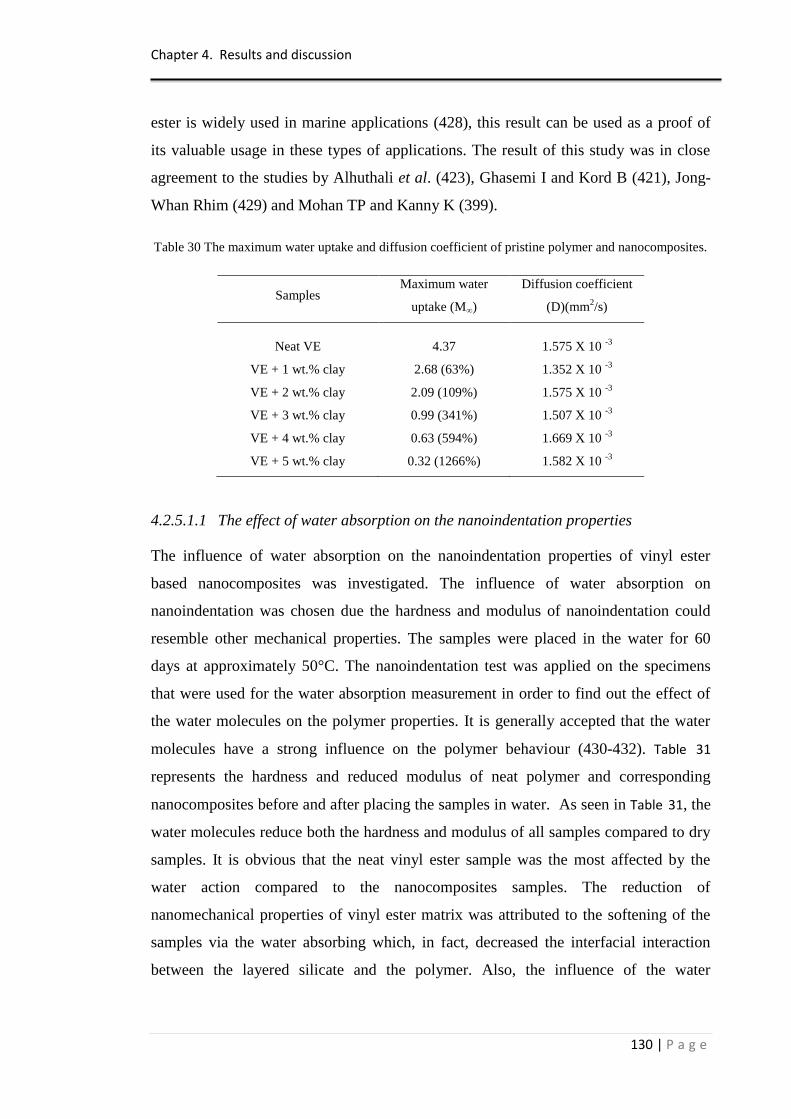
Chapter 4. Results and discussion
130 | P a g e
ester is widely used in marine applications (428), this result can be used as a proof of
its valuable usage in these types of applications. The result of this study was in close
agreement to the studies by Alhuthali et al. (423), Ghasemi I and Kord B (421), Jong-
Whan Rhim (429) and Mohan TP and Kanny K (399).
Table 30 The maximum water uptake and diffusion coefficient of pristine polymer and nanocomposites.
Samples Maximum water
uptake (M∞)
Diffusion coefficient
(D)(mm2/s)
Neat VE 4.37 1.575 X 10 -3
VE + 1 wt.% clay 2.68 (63%) 1.352 X 10 -3
VE + 2 wt.% clay 2.09 (109%) 1.575 X 10 -3
VE + 3 wt.% clay 0.99 (341%) 1.507 X 10 -3
VE + 4 wt.% clay 0.63 (594%) 1.669 X 10 -3
VE + 5 wt.% clay 0.32 (1266%) 1.582 X 10 -3
4.2.5.1.1 The effect of water absorption on the nanoindentation properties
The influence of water absorption on the nanoindentation properties of vinyl ester
based nanocomposites was investigated. The influence of water absorption on
nanoindentation was chosen due the hardness and modulus of nanoindentation could
resemble other mechanical properties. The samples were placed in the water for 60
days at approximately 50°C. The nanoindentation test was applied on the specimens
that were used for the water absorption measurement in order to find out the effect of
the water molecules on the polymer properties. It is generally accepted that the water
molecules have a strong influence on the polymer behaviour (430-432). Table 31
represents the hardness and reduced modulus of neat polymer and corresponding
nanocomposites before and after placing the samples in water. As seen in Table 31, the
water molecules reduce both the hardness and modulus of all samples compared to dry
samples. It is obvious that the neat vinyl ester sample was the most affected by the
water action compared to the nanocomposites samples. The reduction of
nanomechanical properties of vinyl ester matrix was attributed to the softening of the
samples via the water absorbing which, in fact, decreased the interfacial interaction
between the layered silicate and the polymer. Also, the influence of the water
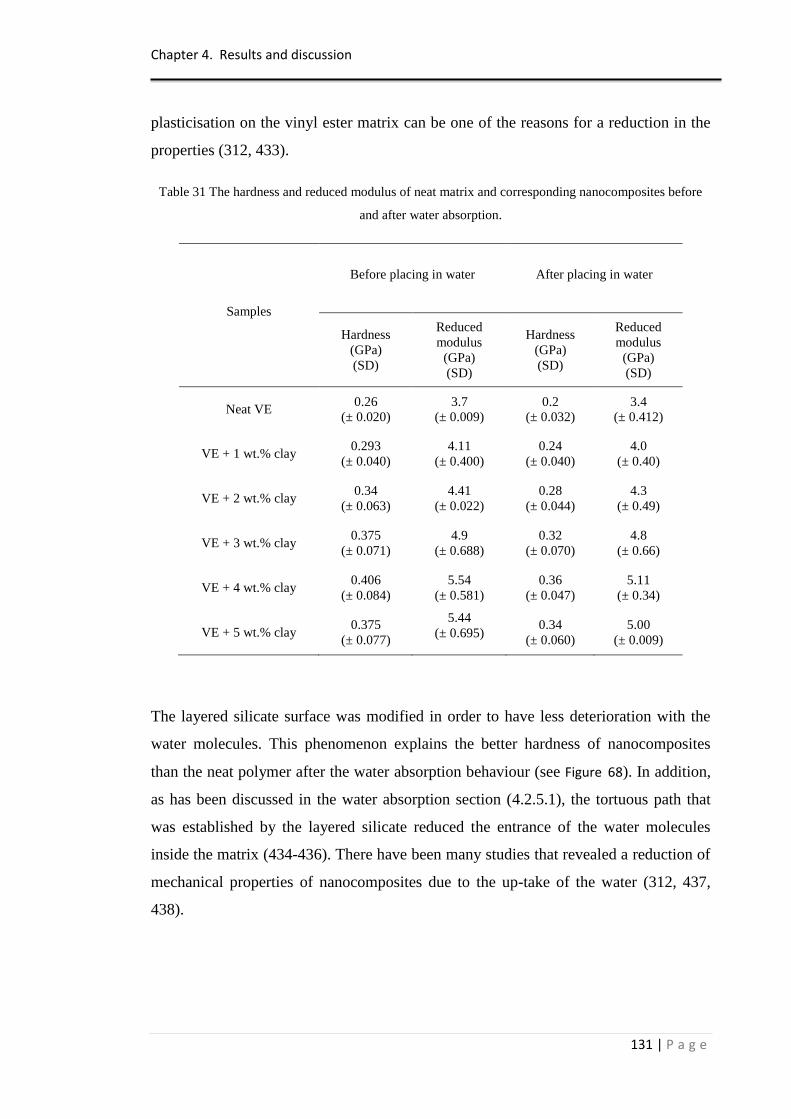
Chapter 4. Results and discussion
131 | P a g e
plasticisation on the vinyl ester matrix can be one of the reasons for a reduction in the
properties (312, 433).
Table 31 The hardness and reduced modulus of neat matrix and corresponding nanocomposites before
and after water absorption.
Samples
Before placing in water After placing in water
Hardness
(GPa)
(SD)
Reduced
modulus
(GPa)
(SD)
Hardness
(GPa)
(SD)
Reduced
modulus
(GPa)
(SD)
Neat VE 0.26
(± 0.020)
3.7
(± 0.009)
0.2
(± 0.032)
3.4
(± 0.412)
VE + 1 wt.% clay 0.293
(± 0.040)
4.11
(± 0.400)
0.24
(± 0.040)
4.0
(± 0.40)
VE + 2 wt.% clay 0.34
(± 0.063)
4.41
(± 0.022)
0.28
(± 0.044)
4.3
(± 0.49)
VE + 3 wt.% clay 0.375
(± 0.071)
4.9
(± 0.688)
0.32
(± 0.070)
4.8
(± 0.66)
VE + 4 wt.% clay 0.406
(± 0.084)
5.54
(± 0.581)
0.36
(± 0.047)
5.11
(± 0.34)
VE + 5 wt.% clay 0.375
(± 0.077)
5.44
(± 0.695)
0.34
(± 0.060)
5.00
(± 0.009)
The layered silicate surface was modified in order to have less deterioration with the
water molecules. This phenomenon explains the better hardness of nanocomposites
than the neat polymer after the water absorption behaviour (see Figure 68). In addition,
as has been discussed in the water absorption section (4.2.5.1), the tortuous path that
was established by the layered silicate reduced the entrance of the water molecules
inside the matrix (434-436). There have been many studies that revealed a reduction of
mechanical properties of nanocomposites due to the up-take of the water (312, 437,
438).
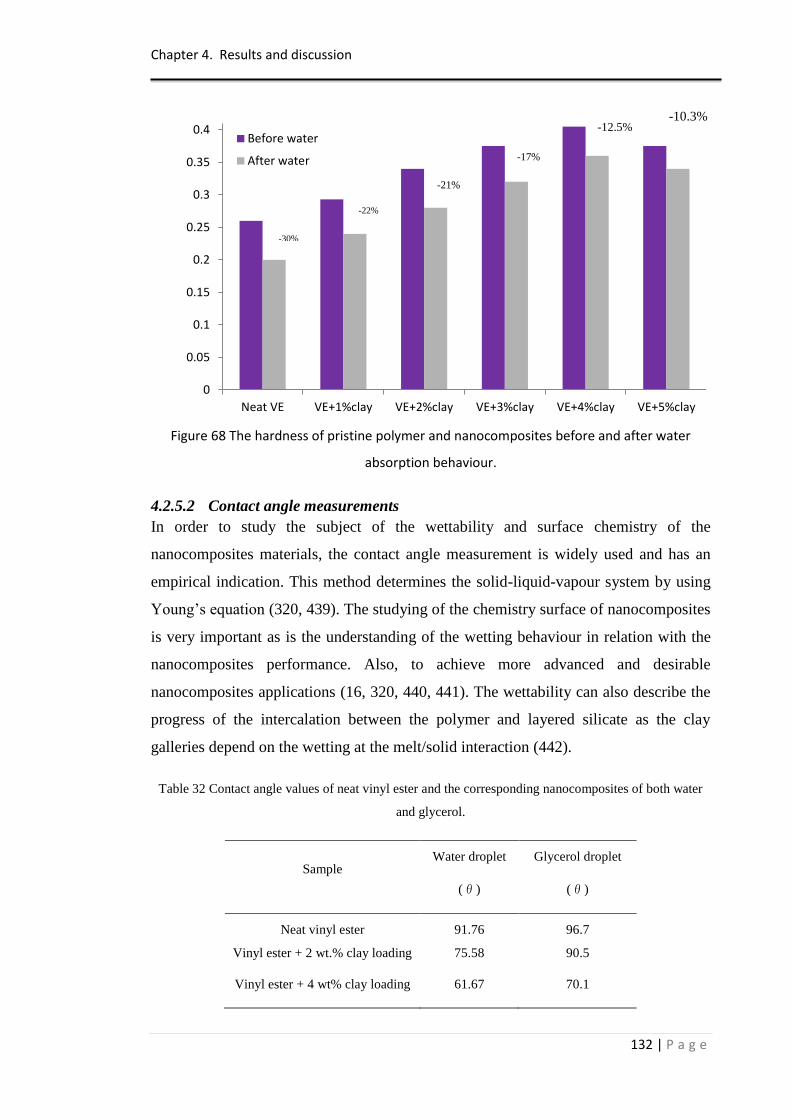
Chapter 4. Results and discussion
132 | P a g e
0
0.05
0.1
0.15
0.2
0.25
0.3
0.35
0.4
Neat VE VE+1%clay VE+2%clay VE+3%clay VE+4%clay VE+5%clay
Before water
After water
-10.3% -12.5%
-17%
-22%
-30%
-21%
Figure 68 The hardness of pristine polymer and nanocomposites before and after water
absorption behaviour.
4.2.5.2 Contact angle measurements
In order to study the subject of the wettability and surface chemistry of the
nanocomposites materials, the contact angle measurement is widely used and has an
empirical indication. This method determines the solid-liquid-vapour system by using
Young‟s equation (320, 439). The studying of the chemistry surface of nanocomposites
is very important as is the understanding of the wetting behaviour in relation with the
nanocomposites performance. Also, to achieve more advanced and desirable
nanocomposites applications (16, 320, 440, 441). The wettability can also describe the
progress of the intercalation between the polymer and layered silicate as the clay
galleries depend on the wetting at the melt/solid interaction (442).
Table 32 Contact angle values of neat vinyl ester and the corresponding nanocomposites of both water
and glycerol.
Sample Water droplet
(θ)
Glycerol droplet
(θ)
Neat vinyl ester 91.76 96.7
Vinyl ester + 2 wt.% clay loading 75.58 90.5
Vinyl ester + 4 wt% clay loading 61.67 70.1
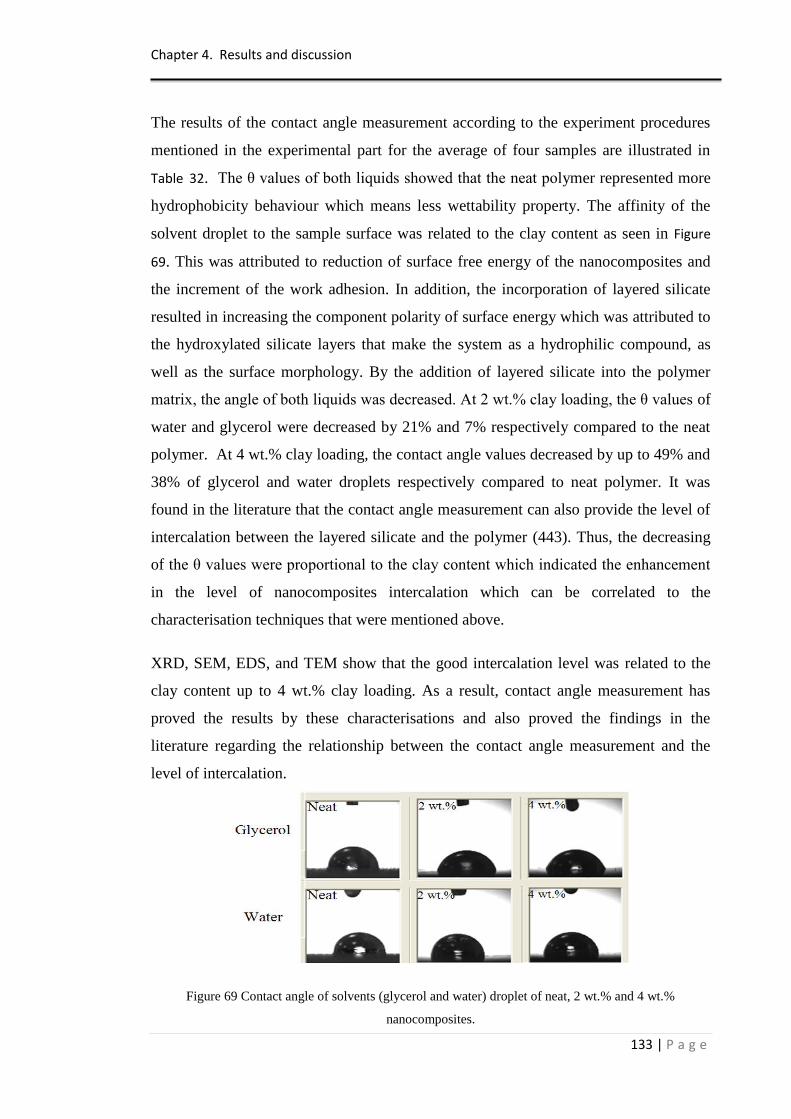
Chapter 4. Results and discussion
133 | P a g e
The results of the contact angle measurement according to the experiment procedures
mentioned in the experimental part for the average of four samples are illustrated in
Table 32. The θ values of both liquids showed that the neat polymer represented more
hydrophobicity behaviour which means less wettability property. The affinity of the
solvent droplet to the sample surface was related to the clay content as seen in Figure
69. This was attributed to reduction of surface free energy of the nanocomposites and
the increment of the work adhesion. In addition, the incorporation of layered silicate
resulted in increasing the component polarity of surface energy which was attributed to
the hydroxylated silicate layers that make the system as a hydrophilic compound, as
well as the surface morphology. By the addition of layered silicate into the polymer
matrix, the angle of both liquids was decreased. At 2 wt.% clay loading, the θ values of
water and glycerol were decreased by 21% and 7% respectively compared to the neat
polymer. At 4 wt.% clay loading, the contact angle values decreased by up to 49% and
38% of glycerol and water droplets respectively compared to neat polymer. It was
found in the literature that the contact angle measurement can also provide the level of
intercalation between the layered silicate and the polymer (443). Thus, the decreasing
of the θ values were proportional to the clay content which indicated the enhancement
in the level of nanocomposites intercalation which can be correlated to the
characterisation techniques that were mentioned above.
XRD, SEM, EDS, and TEM show that the good intercalation level was related to the
clay content up to 4 wt.% clay loading. As a result, contact angle measurement has
proved the results by these characterisations and also proved the findings in the
literature regarding the relationship between the contact angle measurement and the
level of intercalation.
Figure 69 Contact angle of solvents (glycerol and water) droplet of neat, 2 wt.% and 4 wt.%
nanocomposites.
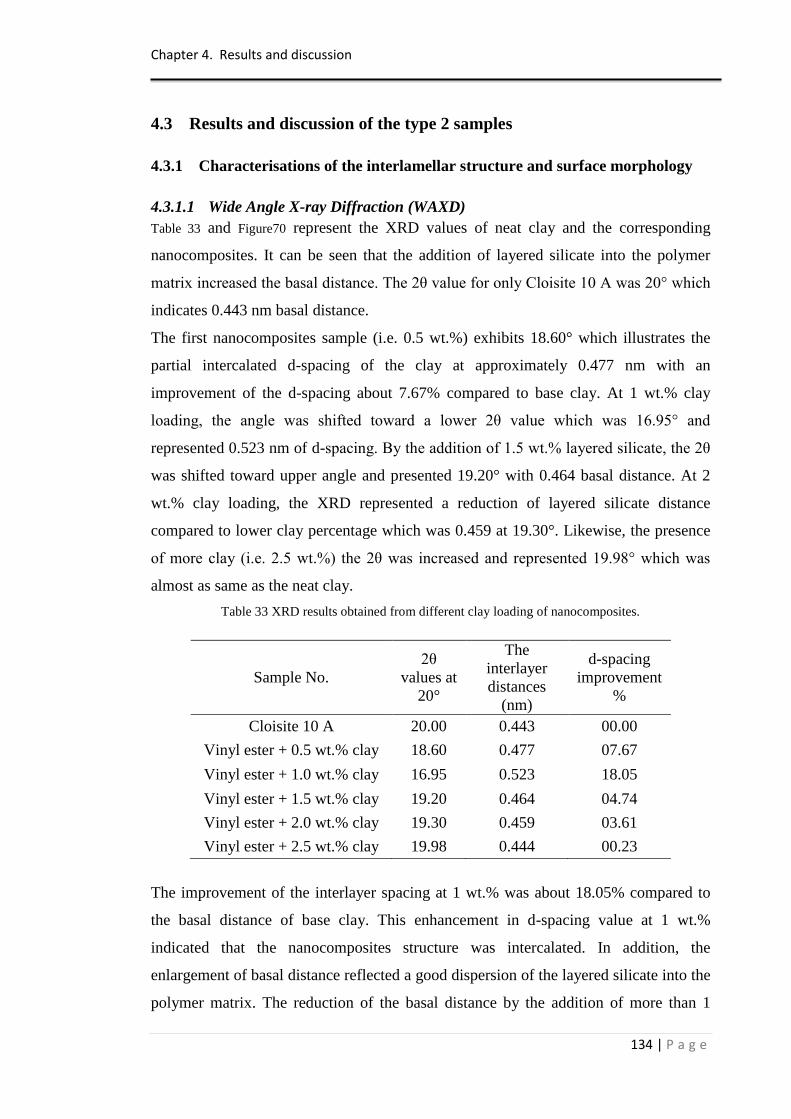
Chapter 4. Results and discussion
134 | P a g e
4.3 Results and discussion of the type 2 samples
4.3.1 Characterisations of the interlamellar structure and surface morphology
4.3.1.1 Wide Angle X-ray Diffraction (WAXD)
Table 33 and Figure70 represent the XRD values of neat clay and the corresponding
nanocomposites. It can be seen that the addition of layered silicate into the polymer
matrix increased the basal distance. The 2θ value for only Cloisite 10 A was 20° which
indicates 0.443 nm basal distance.
The first nanocomposites sample (i.e. 0.5 wt.%) exhibits 18.60° which illustrates the
partial intercalated d-spacing of the clay at approximately 0.477 nm with an
improvement of the d-spacing about 7.67% compared to base clay. At 1 wt.% clay
loading, the angle was shifted toward a lower 2θ value which was 16.95° and
represented 0.523 nm of d-spacing. By the addition of 1.5 wt.% layered silicate, the 2θ
was shifted toward upper angle and presented 19.20° with 0.464 basal distance. At 2
wt.% clay loading, the XRD represented a reduction of layered silicate distance
compared to lower clay percentage which was 0.459 at 19.30°. Likewise, the presence
of more clay (i.e. 2.5 wt.%) the 2θ was increased and represented 19.98° which was
almost as same as the neat clay.
Table 33 XRD results obtained from different clay loading of nanocomposites.
Sample No.
2θ
values at
20°
The
interlayer
distances
(nm)
d-spacing
improvement
%
Cloisite 10 A 20.00 0.443 00.00
Vinyl ester + 0.5 wt.% clay 18.60 0.477 07.67
Vinyl ester + 1.0 wt.% clay 16.95 0.523 18.05
Vinyl ester + 1.5 wt.% clay 19.20 0.464 04.74
Vinyl ester + 2.0 wt.% clay 19.30 0.459 03.61
Vinyl ester + 2.5 wt.% clay 19.98 0.444 00.23
The improvement of the interlayer spacing at 1 wt.% was about 18.05% compared to
the basal distance of base clay. This enhancement in d-spacing value at 1 wt.%
indicated that the nanocomposites structure was intercalated. In addition, the
enlargement of basal distance reflected a good dispersion of the layered silicate into the
polymer matrix. The reduction of the basal distance by the addition of more than 1
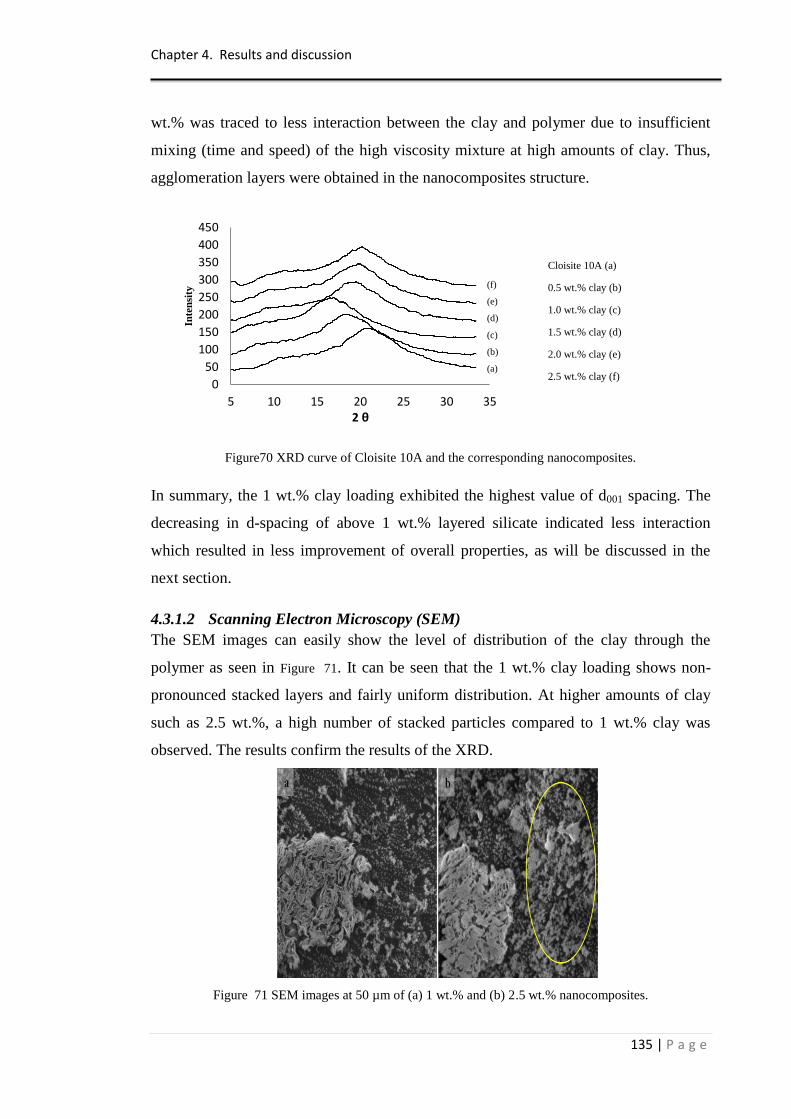
Chapter 4. Results and discussion
135 | P a g e
wt.% was traced to less interaction between the clay and polymer due to insufficient
mixing (time and speed) of the high viscosity mixture at high amounts of clay. Thus,
agglomeration layers were obtained in the nanocomposites structure.
Figure70 XRD curve of Cloisite 10A and the corresponding nanocomposites.
In summary, the 1 wt.% clay loading exhibited the highest value of d001 spacing. The
decreasing in d-spacing of above 1 wt.% layered silicate indicated less interaction
which resulted in less improvement of overall properties, as will be discussed in the
next section.
4.3.1.2 Scanning Electron Microscopy (SEM)
The SEM images can easily show the level of distribution of the clay through the
polymer as seen in Figure 71. It can be seen that the 1 wt.% clay loading shows non-
pronounced stacked layers and fairly uniform distribution. At higher amounts of clay
such as 2.5 wt.%, a high number of stacked particles compared to 1 wt.% clay was
observed. The results confirm the results of the XRD.
Figure 71 SEM images at 50 µm of (a) 1 wt.% and (b) 2.5 wt.% nanocomposites.
0
50
100
150
200
250
300
350
400
450
5 10 15 20 25 30 35
Inte
nsi
ty
2 θ
Cloisite 10A (a)
0.5 wt.% clay (b)
1.0 wt.% clay (c)
1.5 wt.% clay (d)
2.0 wt.% clay (e)
2.5 wt.% clay (f)
(f)
(e)
(d)
(c)
(b)
(a)
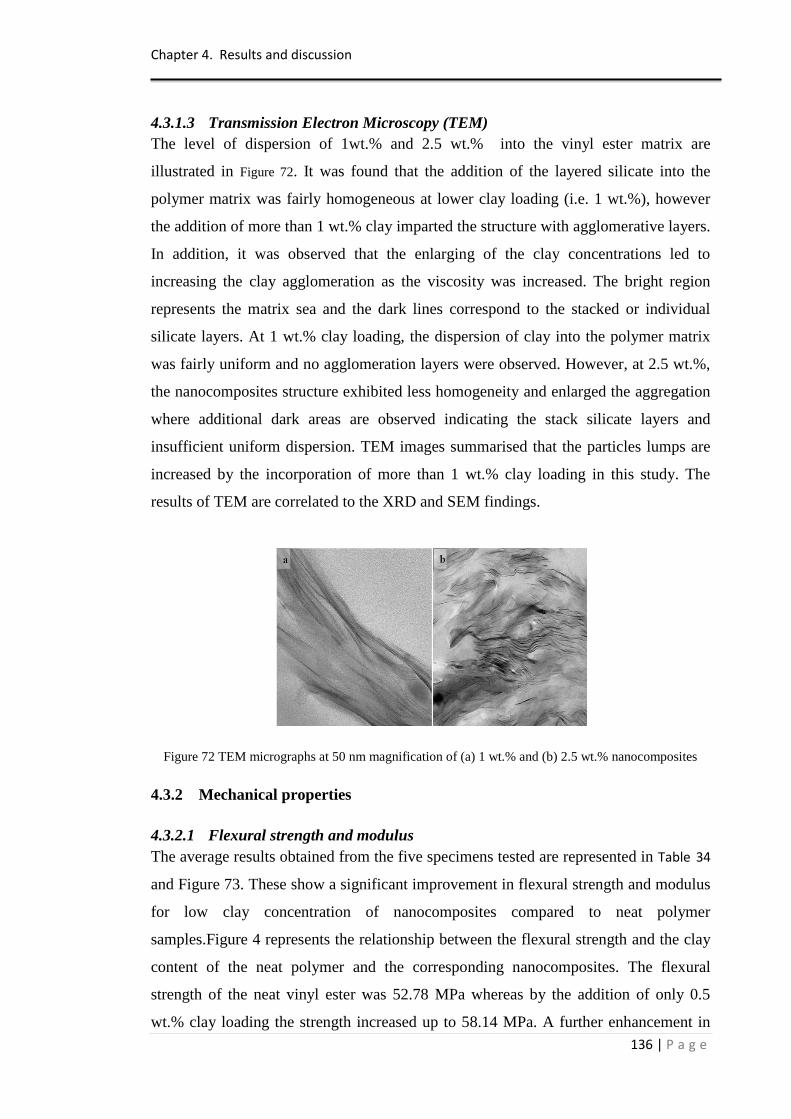
Chapter 4. Results and discussion
136 | P a g e
4.3.1.3 Transmission Electron Microscopy (TEM)
The level of dispersion of 1wt.% and 2.5 wt.% into the vinyl ester matrix are
illustrated in Figure 72. It was found that the addition of the layered silicate into the
polymer matrix was fairly homogeneous at lower clay loading (i.e. 1 wt.%), however
the addition of more than 1 wt.% clay imparted the structure with agglomerative layers.
In addition, it was observed that the enlarging of the clay concentrations led to
increasing the clay agglomeration as the viscosity was increased. The bright region
represents the matrix sea and the dark lines correspond to the stacked or individual
silicate layers. At 1 wt.% clay loading, the dispersion of clay into the polymer matrix
was fairly uniform and no agglomeration layers were observed. However, at 2.5 wt.%,
the nanocomposites structure exhibited less homogeneity and enlarged the aggregation
where additional dark areas are observed indicating the stack silicate layers and
insufficient uniform dispersion. TEM images summarised that the particles lumps are
increased by the incorporation of more than 1 wt.% clay loading in this study. The
results of TEM are correlated to the XRD and SEM findings.
Figure 72 TEM micrographs at 50 nm magnification of (a) 1 wt.% and (b) 2.5 wt.% nanocomposites
4.3.2 Mechanical properties
4.3.2.1 Flexural strength and modulus
The average results obtained from the five specimens tested are represented in Table 34
and Figure 73. These show a significant improvement in flexural strength and modulus
for low clay concentration of nanocomposites compared to neat polymer
samples.Figure 4 represents the relationship between the flexural strength and the clay
content of the neat polymer and the corresponding nanocomposites. The flexural
strength of the neat vinyl ester was 52.78 MPa whereas by the addition of only 0.5
wt.% clay loading the strength increased up to 58.14 MPa. A further enhancement in
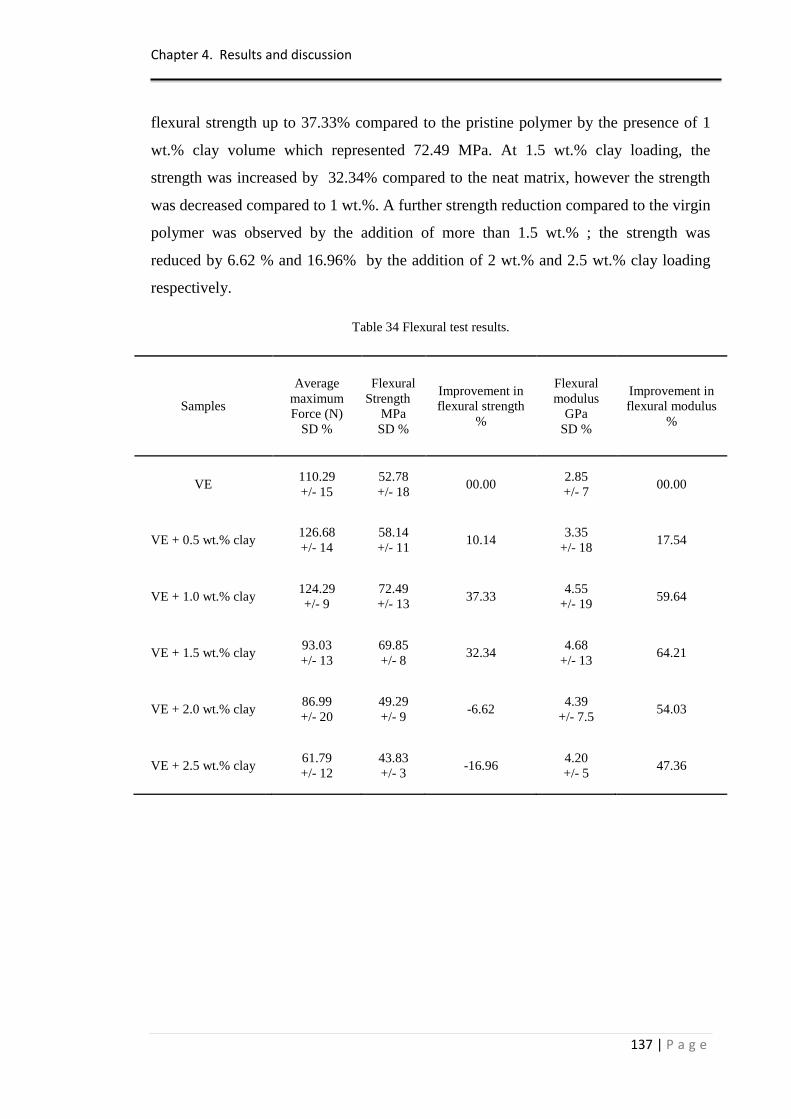
Chapter 4. Results and discussion
137 | P a g e
flexural strength up to 37.33% compared to the pristine polymer by the presence of 1
wt.% clay volume which represented 72.49 MPa. At 1.5 wt.% clay loading, the
strength was increased by 32.34% compared to the neat matrix, however the strength
was decreased compared to 1 wt.%. A further strength reduction compared to the virgin
polymer was observed by the addition of more than 1.5 wt.% ; the strength was
reduced by 6.62 % and 16.96% by the addition of 2 wt.% and 2.5 wt.% clay loading
respectively.
Table 34 Flexural test results.
Samples
Average
maximum
Force (N)
SD %
Flexural
Strength
MPa
SD %
Improvement in
flexural strength
%
Flexural
modulus
GPa
SD %
Improvement in
flexural modulus
%
VE 110.29
+/- 15
52.78
+/- 18 00.00
2.85
+/- 7 00.00
VE + 0.5 wt.% clay 126.68
+/- 14
58.14
+/- 11 10.14
3.35
+/- 18 17.54
VE + 1.0 wt.% clay 124.29
+/- 9
72.49
+/- 13 37.33
4.55
+/- 19 59.64
VE + 1.5 wt.% clay 93.03
+/- 13
69.85
+/- 8 32.34
4.68
+/- 13 64.21
VE + 2.0 wt.% clay 86.99
+/- 20
49.29
+/- 9 -6.62
4.39
+/- 7.5 54.03
VE + 2.5 wt.% clay 61.79
+/- 12
43.83
+/- 3 -16.96
4.20
+/- 5 47.36
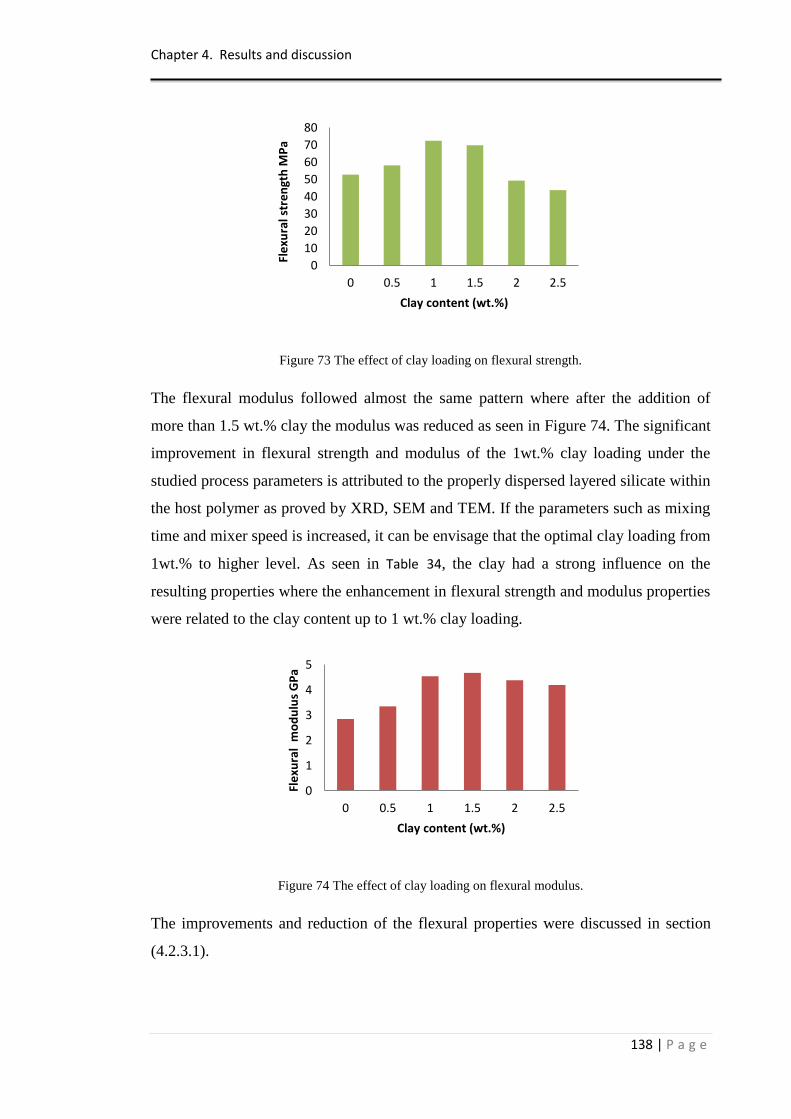
Chapter 4. Results and discussion
138 | P a g e
Figure 73 The effect of clay loading on flexural strength.
The flexural modulus followed almost the same pattern where after the addition of
more than 1.5 wt.% clay the modulus was reduced as seen in Figure 74. The significant
improvement in flexural strength and modulus of the 1wt.% clay loading under the
studied process parameters is attributed to the properly dispersed layered silicate within
the host polymer as proved by XRD, SEM and TEM. If the parameters such as mixing
time and mixer speed is increased, it can be envisage that the optimal clay loading from
1wt.% to higher level. As seen in Table 34, the clay had a strong influence on the
resulting properties where the enhancement in flexural strength and modulus properties
were related to the clay content up to 1 wt.% clay loading.
Figure 74 The effect of clay loading on flexural modulus.
The improvements and reduction of the flexural properties were discussed in section
(4.2.3.1).
0
10
20
30
40
50
60
70
80
0 0.5 1 1.5 2 2.5Fl
exu
ral s
tre
ngt
h M
Pa
Clay content (wt.%)
0
1
2
3
4
5
0 0.5 1 1.5 2 2.5
Fle
xura
l m
od
ulu
s G
Pa
Clay content (wt.%)
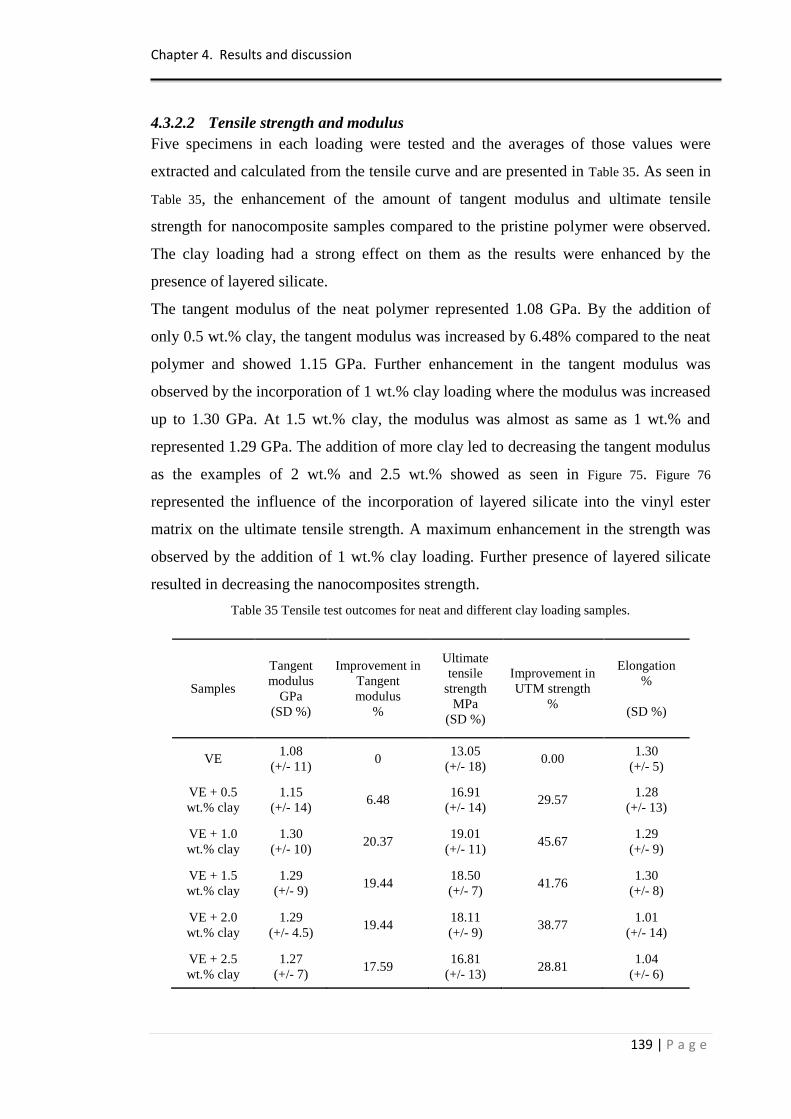
Chapter 4. Results and discussion
139 | P a g e
4.3.2.2 Tensile strength and modulus
Five specimens in each loading were tested and the averages of those values were
extracted and calculated from the tensile curve and are presented in Table 35. As seen in
Table 35, the enhancement of the amount of tangent modulus and ultimate tensile
strength for nanocomposite samples compared to the pristine polymer were observed.
The clay loading had a strong effect on them as the results were enhanced by the
presence of layered silicate.
The tangent modulus of the neat polymer represented 1.08 GPa. By the addition of
only 0.5 wt.% clay, the tangent modulus was increased by 6.48% compared to the neat
polymer and showed 1.15 GPa. Further enhancement in the tangent modulus was
observed by the incorporation of 1 wt.% clay loading where the modulus was increased
up to 1.30 GPa. At 1.5 wt.% clay, the modulus was almost as same as 1 wt.% and
represented 1.29 GPa. The addition of more clay led to decreasing the tangent modulus
as the examples of 2 wt.% and 2.5 wt.% showed as seen in Figure 75. Figure 76
represented the influence of the incorporation of layered silicate into the vinyl ester
matrix on the ultimate tensile strength. A maximum enhancement in the strength was
observed by the addition of 1 wt.% clay loading. Further presence of layered silicate
resulted in decreasing the nanocomposites strength.
Table 35 Tensile test outcomes for neat and different clay loading samples.
Samples
Tangent
modulus
GPa
(SD %)
Improvement in
Tangent
modulus
%
Ultimate
tensile
strength
MPa
(SD %)
Improvement in
UTM strength
%
Elongation
%
(SD %)
VE 1.08
(+/- 11) 0
13.05
(+/- 18) 0.00
1.30
(+/- 5)
VE + 0.5
wt.% clay
1.15
(+/- 14) 6.48
16.91
(+/- 14) 29.57
1.28
(+/- 13)
VE + 1.0
wt.% clay
1.30
(+/- 10) 20.37
19.01
(+/- 11) 45.67
1.29
(+/- 9)
VE + 1.5
wt.% clay
1.29
(+/- 9) 19.44
18.50
(+/- 7) 41.76
1.30
(+/- 8)
VE + 2.0
wt.% clay
1.29
(+/- 4.5) 19.44
18.11
(+/- 9) 38.77
1.01
(+/- 14)
VE + 2.5
wt.% clay
1.27
(+/- 7) 17.59
16.81
(+/- 13) 28.81
1.04
(+/- 6)
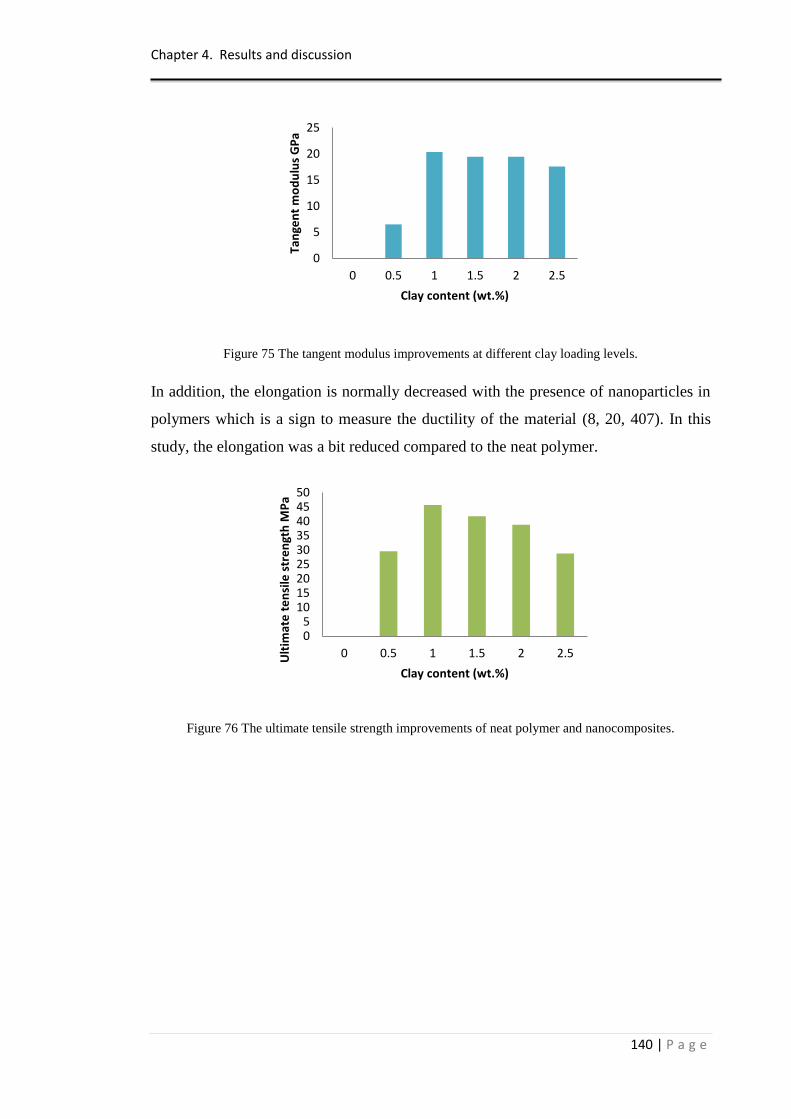
Chapter 4. Results and discussion
140 | P a g e
Figure 75 The tangent modulus improvements at different clay loading levels.
In addition, the elongation is normally decreased with the presence of nanoparticles in
polymers which is a sign to measure the ductility of the material (8, 20, 407). In this
study, the elongation was a bit reduced compared to the neat polymer.
Figure 76 The ultimate tensile strength improvements of neat polymer and nanocomposites.
0
5
10
15
20
25
0 0.5 1 1.5 2 2.5
Tan
gen
t m
od
ulu
s G
Pa
Clay content (wt.%)
05
101520253035404550
0 0.5 1 1.5 2 2.5Ult
imat
e t
en
sile
str
en
gth
MP
a
Clay content (wt.%)
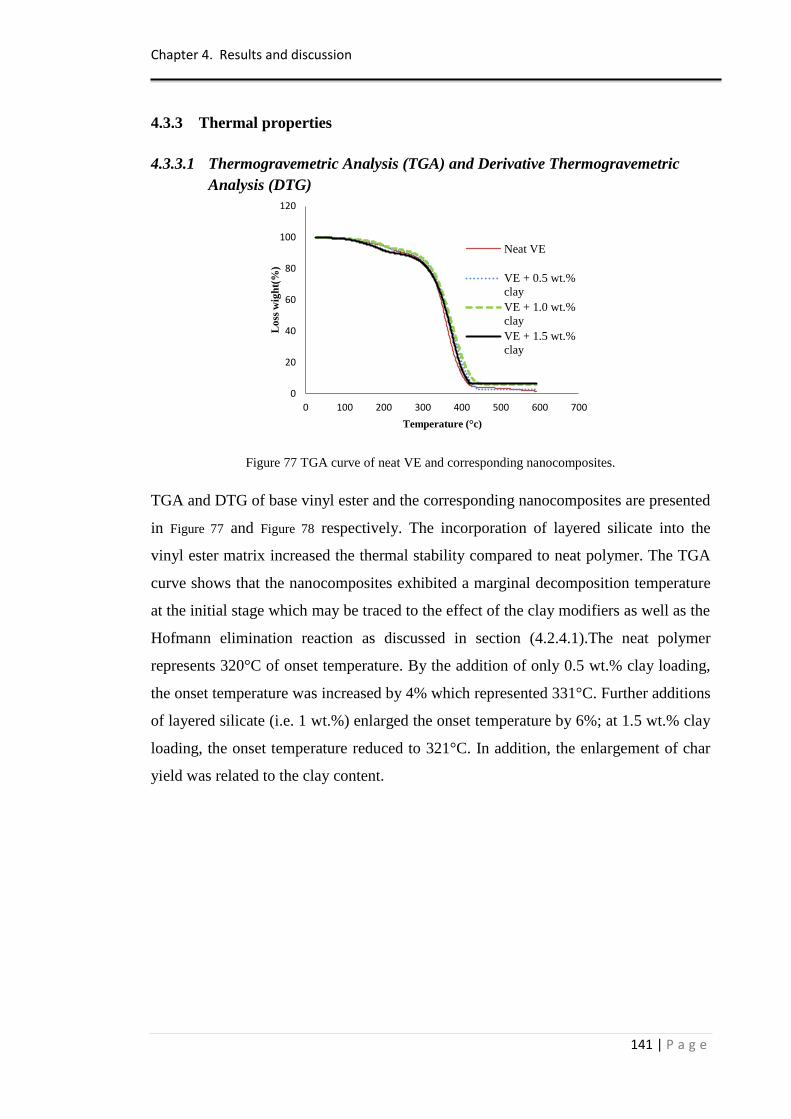
Chapter 4. Results and discussion
141 | P a g e
4.3.3 Thermal properties
4.3.3.1 Thermogravemetric Analysis (TGA) and Derivative Thermogravemetric
Analysis (DTG)
Figure 77 TGA curve of neat VE and corresponding nanocomposites.
TGA and DTG of base vinyl ester and the corresponding nanocomposites are presented
in Figure 77 and Figure 78 respectively. The incorporation of layered silicate into the
vinyl ester matrix increased the thermal stability compared to neat polymer. The TGA
curve shows that the nanocomposites exhibited a marginal decomposition temperature
at the initial stage which may be traced to the effect of the clay modifiers as well as the
Hofmann elimination reaction as discussed in section (4.2.4.1).The neat polymer
represents 320°C of onset temperature. By the addition of only 0.5 wt.% clay loading,
the onset temperature was increased by 4% which represented 331°C. Further additions
of layered silicate (i.e. 1 wt.%) enlarged the onset temperature by 6%; at 1.5 wt.% clay
loading, the onset temperature reduced to 321°C. In addition, the enlargement of char
yield was related to the clay content.
0
20
40
60
80
100
120
0 100 200 300 400 500 600 700
Lo
ss w
igh
t(%
)
Temperature (°c)
Neat VE
VE + 0.5 wt.%
clay
VE + 1.0 wt.%
clay
VE + 1.5 wt.%
clay
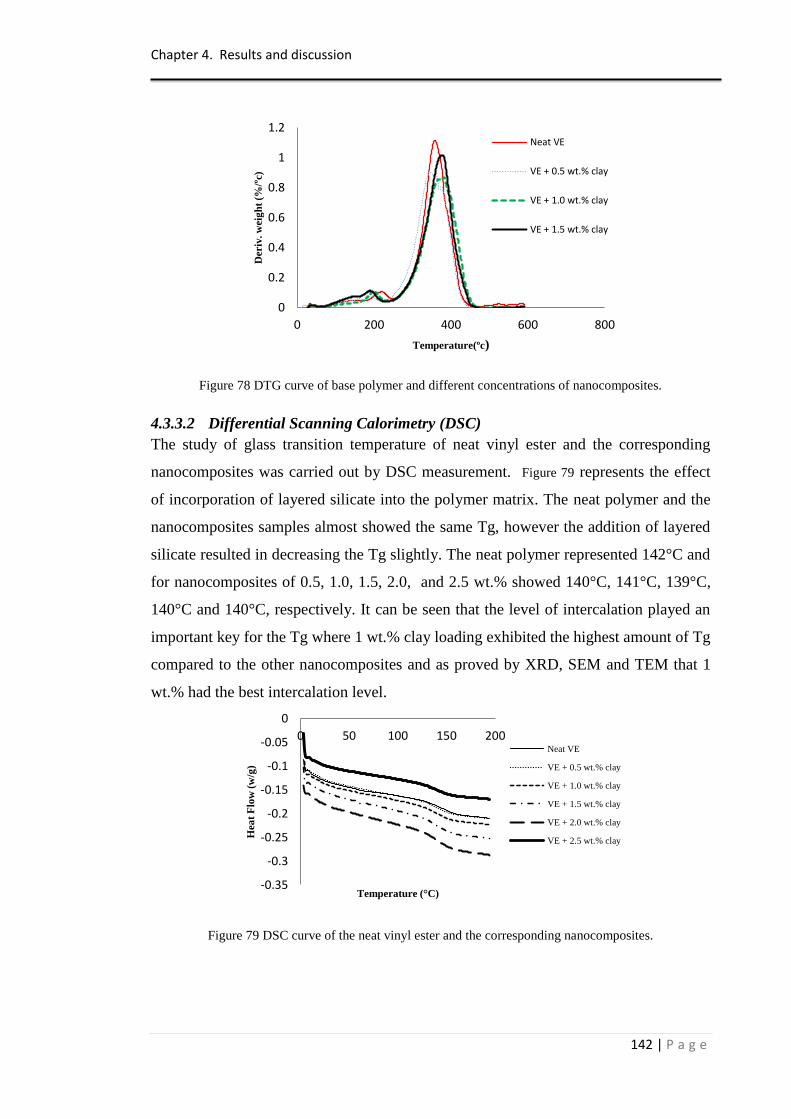
Chapter 4. Results and discussion
142 | P a g e
Figure 78 DTG curve of base polymer and different concentrations of nanocomposites.
4.3.3.2 Differential Scanning Calorimetry (DSC)
The study of glass transition temperature of neat vinyl ester and the corresponding
nanocomposites was carried out by DSC measurement. Figure 79 represents the effect
of incorporation of layered silicate into the polymer matrix. The neat polymer and the
nanocomposites samples almost showed the same Tg, however the addition of layered
silicate resulted in decreasing the Tg slightly. The neat polymer represented 142°C and
for nanocomposites of 0.5, 1.0, 1.5, 2.0, and 2.5 wt.% showed 140°C, 141°C, 139°C,
140°C and 140°C, respectively. It can be seen that the level of intercalation played an
important key for the Tg where 1 wt.% clay loading exhibited the highest amount of Tg
compared to the other nanocomposites and as proved by XRD, SEM and TEM that 1
wt.% had the best intercalation level.
Figure 79 DSC curve of the neat vinyl ester and the corresponding nanocomposites.
0
0.2
0.4
0.6
0.8
1
1.2
0 200 400 600 800
Deriv
. w
eig
ht
(%/º
c)
Temperature(ºc)
Neat VE
VE + 0.5 wt.% clay
VE + 1.0 wt.% clay
VE + 1.5 wt.% clay
-0.35
-0.3
-0.25
-0.2
-0.15
-0.1
-0.05
0
0 50 100 150 200
Hea
t F
low
(w
/g)
Temperature (°C)
Neat VE
VE + 0.5 wt.% clay
VE + 1.0 wt.% clay
VE + 1.5 wt.% clay
VE + 2.0 wt.% clay
VE + 2.5 wt.% clay
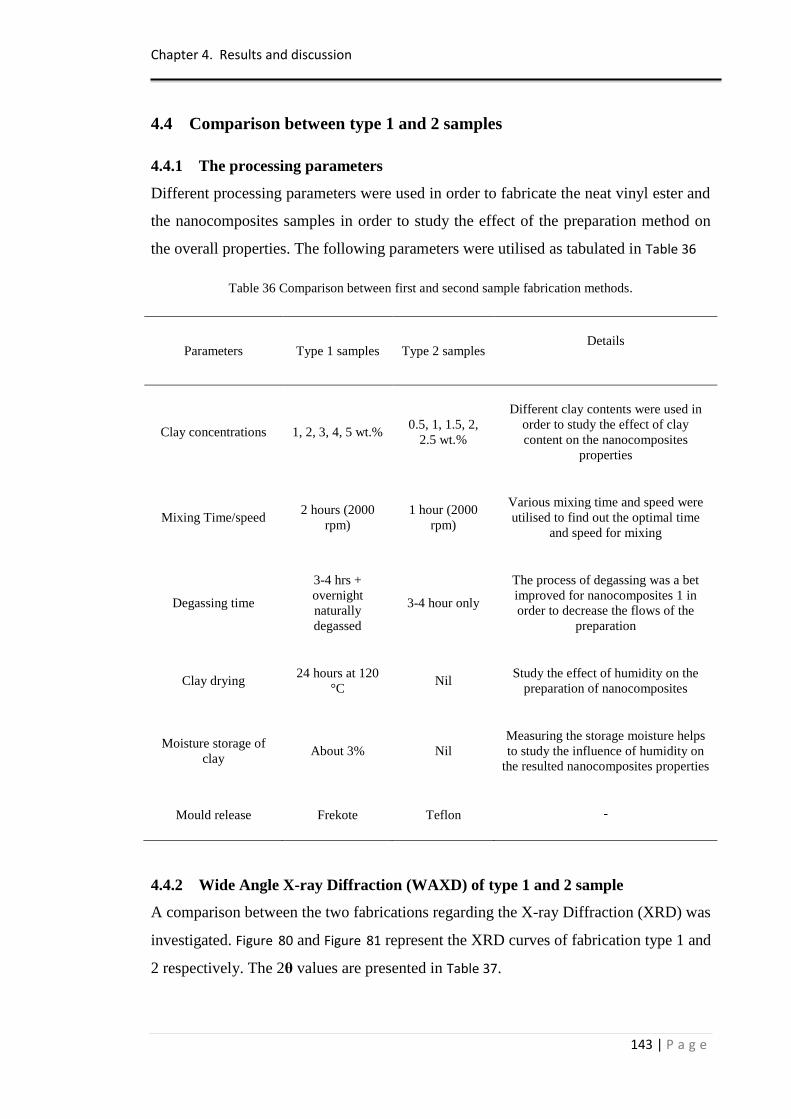
Chapter 4. Results and discussion
143 | P a g e
4.4 Comparison between type 1 and 2 samples
4.4.1 The processing parameters
Different processing parameters were used in order to fabricate the neat vinyl ester and
the nanocomposites samples in order to study the effect of the preparation method on
the overall properties. The following parameters were utilised as tabulated in Table 36
Table 36 Comparison between first and second sample fabrication methods.
Parameters Type 1 samples Type 2 samples Details
Clay concentrations 1, 2, 3, 4, 5 wt.% 0.5, 1, 1.5, 2,
2.5 wt.%
Different clay contents were used in
order to study the effect of clay
content on the nanocomposites
properties
Mixing Time/speed 2 hours (2000
rpm)
1 hour (2000
rpm)
Various mixing time and speed were
utilised to find out the optimal time
and speed for mixing
Degassing time
3-4 hrs +
overnight
naturally
degassed
3-4 hour only
The process of degassing was a bet
improved for nanocomposites 1 in
order to decrease the flows of the
preparation
Clay drying 24 hours at 120
°C Nil
Study the effect of humidity on the
preparation of nanocomposites
Moisture storage of
clay About 3% Nil
Measuring the storage moisture helps
to study the influence of humidity on
the resulted nanocomposites properties
Mould release Frekote Teflon -
4.4.2 Wide Angle X-ray Diffraction (WAXD) of type 1 and 2 sample
A comparison between the two fabrications regarding the X-ray Diffraction (XRD) was
investigated. Figure 80 and Figure 81 represent the XRD curves of fabrication type 1 and
2 respectively. The 2θ values are presented in Table 37.
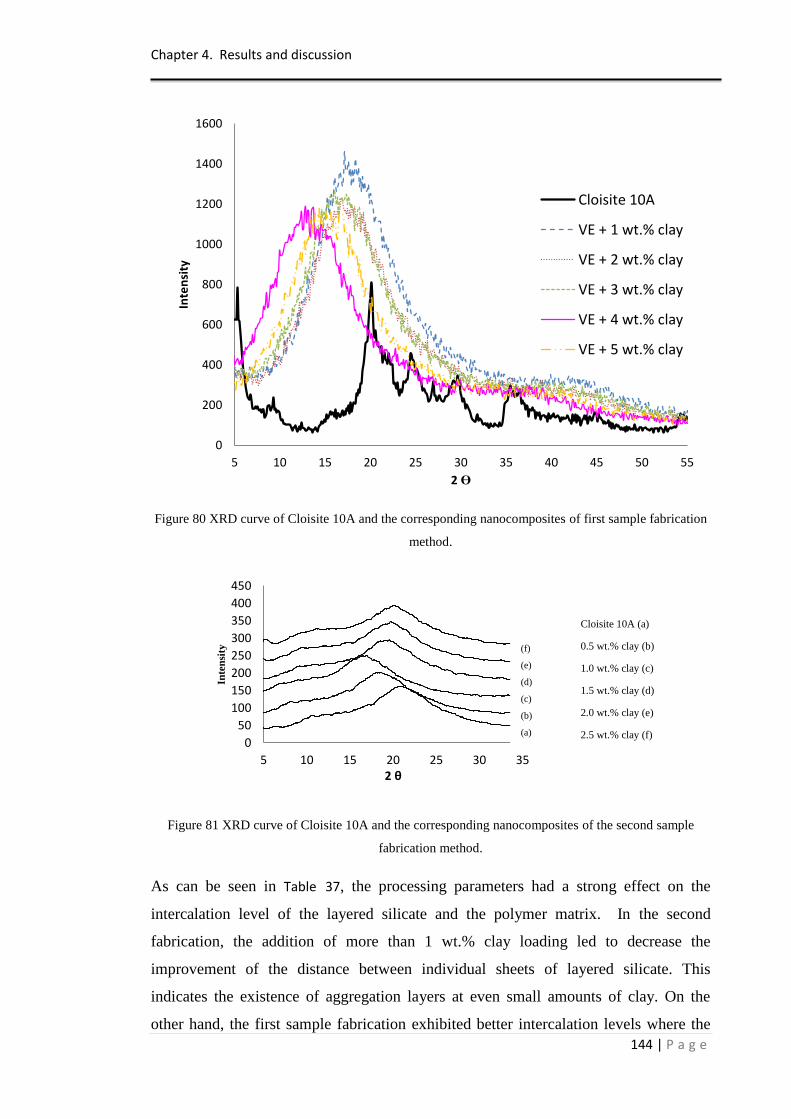
Chapter 4. Results and discussion
144 | P a g e
Figure 80 XRD curve of Cloisite 10A and the corresponding nanocomposites of first sample fabrication
method.
Figure 81 XRD curve of Cloisite 10A and the corresponding nanocomposites of the second sample
fabrication method.
As can be seen in Table 37, the processing parameters had a strong effect on the
intercalation level of the layered silicate and the polymer matrix. In the second
fabrication, the addition of more than 1 wt.% clay loading led to decrease the
improvement of the distance between individual sheets of layered silicate. This
indicates the existence of aggregation layers at even small amounts of clay. On the
other hand, the first sample fabrication exhibited better intercalation levels where the
0
200
400
600
800
1000
1200
1400
1600
5 10 15 20 25 30 35 40 45 50 55
Inte
nsi
ty
2 Ө
Cloisite 10A
VE + 1 wt.% clay
VE + 2 wt.% clay
VE + 3 wt.% clay
VE + 4 wt.% clay
VE + 5 wt.% clay
0
50
100
150
200
250
300
350
400
450
5 10 15 20 25 30 35
Inte
nsi
ty
2 θ
Cloisite 10A (a)
0.5 wt.% clay (b)
1.0 wt.% clay (c)
1.5 wt.% clay (d)
2.0 wt.% clay (e)
2.5 wt.% clay (f)
(f)
(e)
(d)
(c)
(b)
(a)
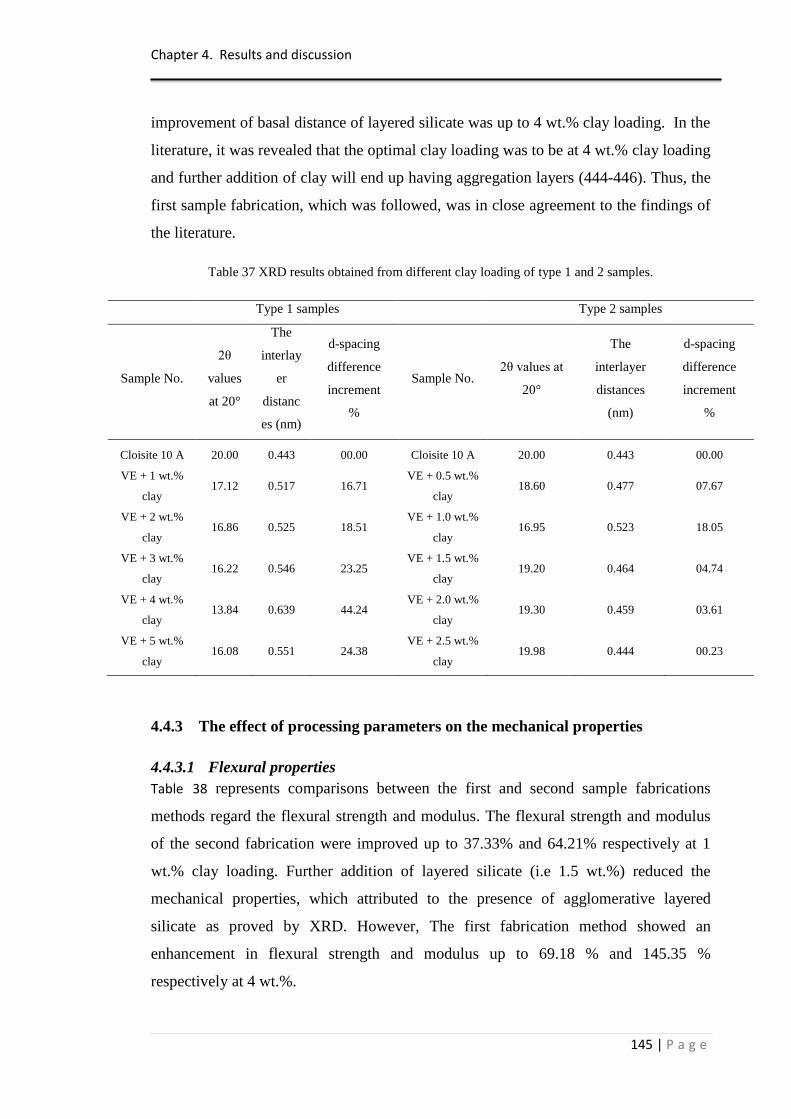
Chapter 4. Results and discussion
145 | P a g e
improvement of basal distance of layered silicate was up to 4 wt.% clay loading. In the
literature, it was revealed that the optimal clay loading was to be at 4 wt.% clay loading
and further addition of clay will end up having aggregation layers (444-446). Thus, the
first sample fabrication, which was followed, was in close agreement to the findings of
the literature.
Table 37 XRD results obtained from different clay loading of type 1 and 2 samples.
Type 1 samples Type 2 samples
Sample No.
2θ
values
at 20°
The
interlay
er
distanc
es (nm)
d-spacing
difference
increment
%
Sample No. 2θ values at
20°
The
interlayer
distances
(nm)
d-spacing
difference
increment
%
Cloisite 10 A 20.00 0.443 00.00 Cloisite 10 A 20.00 0.443 00.00
VE + 1 wt.%
clay 17.12 0.517 16.71
VE + 0.5 wt.%
clay 18.60 0.477 07.67
VE + 2 wt.%
clay 16.86 0.525 18.51
VE + 1.0 wt.%
clay 16.95 0.523 18.05
VE + 3 wt.%
clay 16.22 0.546 23.25
VE + 1.5 wt.%
clay 19.20 0.464 04.74
VE + 4 wt.%
clay 13.84 0.639 44.24
VE + 2.0 wt.%
clay 19.30 0.459 03.61
VE + 5 wt.%
clay 16.08 0.551 24.38
VE + 2.5 wt.%
clay 19.98 0.444 00.23
4.4.3 The effect of processing parameters on the mechanical properties
4.4.3.1 Flexural properties
Table 38 represents comparisons between the first and second sample fabrications
methods regard the flexural strength and modulus. The flexural strength and modulus
of the second fabrication were improved up to 37.33% and 64.21% respectively at 1
wt.% clay loading. Further addition of layered silicate (i.e 1.5 wt.%) reduced the
mechanical properties, which attributed to the presence of agglomerative layered
silicate as proved by XRD. However, The first fabrication method showed an
enhancement in flexural strength and modulus up to 69.18 % and 145.35 %
respectively at 4 wt.%.
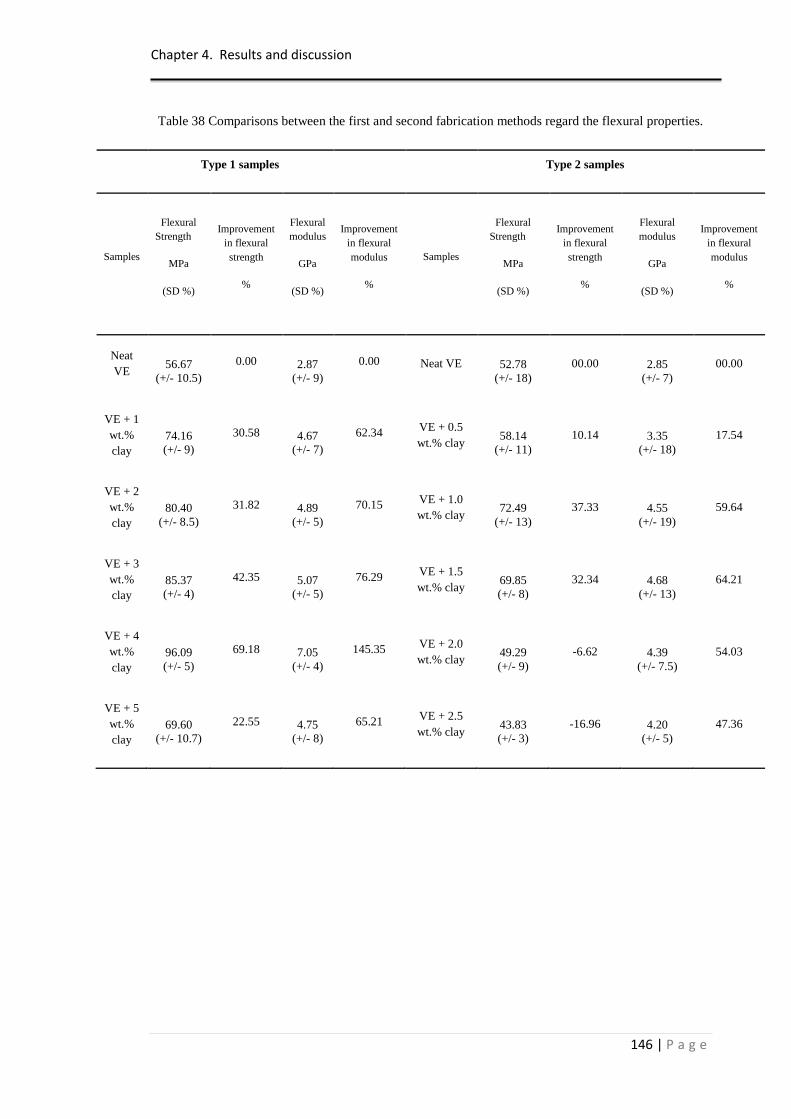
Chapter 4. Results and discussion
146 | P a g e
Table 38 Comparisons between the first and second fabrication methods regard the flexural properties.
Type 1 samples Type 2 samples
Samples
Flexural
Strength
MPa
(SD %)
Improvement
in flexural
strength
%
Flexural
modulus
GPa
(SD %)
Improvement
in flexural
modulus
%
Samples
Flexural
Strength
MPa
(SD %)
Improvement
in flexural
strength
%
Flexural
modulus
GPa
(SD %)
Improvement
in flexural
modulus
%
Neat
VE 56.67
(+/- 10.5)
0.00 2.87
(+/- 9)
0.00 Neat VE 52.78
(+/- 18)
00.00 2.85
(+/- 7)
00.00
VE + 1
wt.%
clay
74.16
(+/- 9)
30.58 4.67
(+/- 7)
62.34 VE + 0.5
wt.% clay 58.14
(+/- 11)
10.14 3.35
(+/- 18)
17.54
VE + 2
wt.%
clay
80.40
(+/- 8.5)
31.82 4.89
(+/- 5)
70.15 VE + 1.0
wt.% clay 72.49
(+/- 13)
37.33 4.55
(+/- 19)
59.64
VE + 3
wt.%
clay
85.37
(+/- 4)
42.35 5.07
(+/- 5)
76.29 VE + 1.5
wt.% clay 69.85
(+/- 8)
32.34 4.68
(+/- 13)
64.21
VE + 4
wt.%
clay
96.09
(+/- 5)
69.18 7.05
(+/- 4)
145.35 VE + 2.0
wt.% clay 49.29
(+/- 9)
-6.62 4.39
(+/- 7.5)
54.03
VE + 5
wt.%
clay
69.60
(+/- 10.7)
22.55 4.75
(+/- 8)
65.21 VE + 2.5
wt.% clay 43.83
(+/- 3)
-16.96 4.20
(+/- 5)
47.36
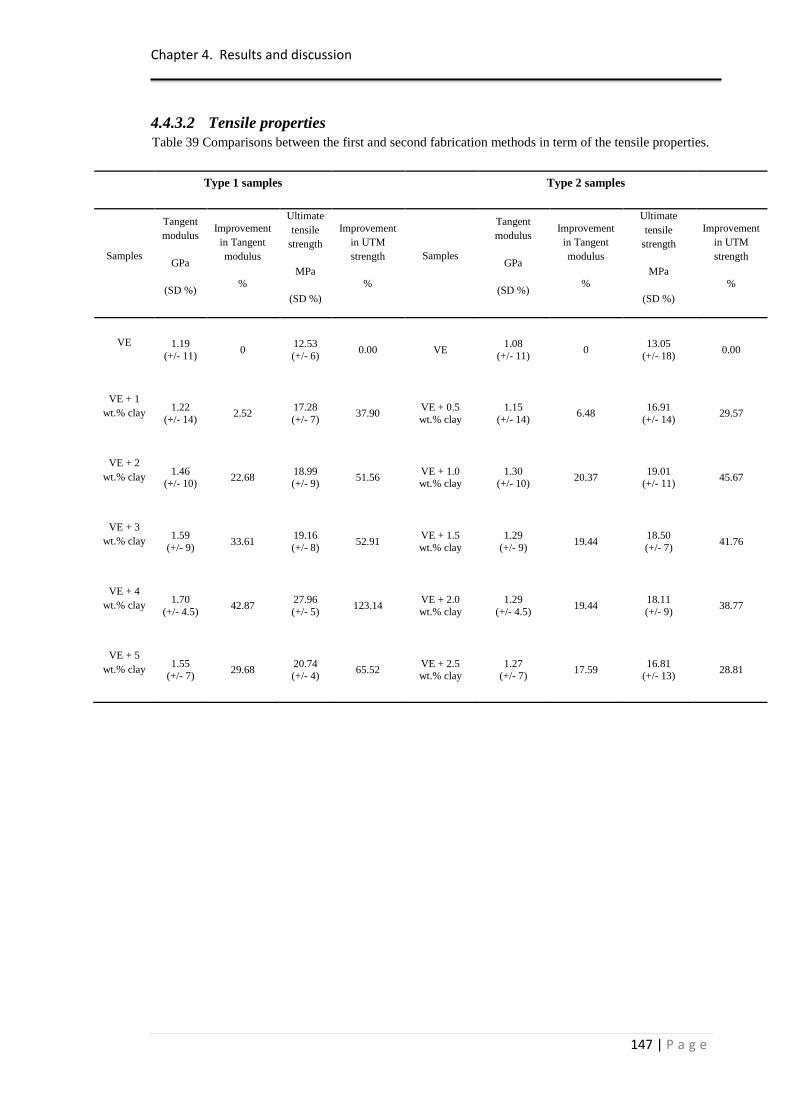
Chapter 4. Results and discussion
147 | P a g e
4.4.3.2 Tensile properties
Table 39 Comparisons between the first and second fabrication methods in term of the tensile properties.
Type 1 samples Type 2 samples
Samples
Tangent
modulus
GPa
(SD %)
Improvement
in Tangent
modulus
%
Ultimate
tensile
strength
MPa
(SD %)
Improvement
in UTM
strength
%
Samples
Tangent
modulus
GPa
(SD %)
Improvement
in Tangent
modulus
%
Ultimate
tensile
strength
MPa
(SD %)
Improvement
in UTM
strength
%
VE 1.19
(+/- 11) 0
12.53
(+/- 6) 0.00 VE
1.08
(+/- 11) 0
13.05
(+/- 18) 0.00
VE + 1
wt.% clay 1.22
(+/- 14) 2.52
17.28
(+/- 7) 37.90
VE + 0.5
wt.% clay
1.15
(+/- 14) 6.48
16.91
(+/- 14) 29.57
VE + 2
wt.% clay 1.46
(+/- 10) 22.68
18.99 (+/- 9)
51.56 VE + 1.0 wt.% clay
1.30 (+/- 10)
20.37 19.01
(+/- 11) 45.67
VE + 3
wt.% clay 1.59
(+/- 9) 33.61
19.16
(+/- 8) 52.91
VE + 1.5
wt.% clay
1.29
(+/- 9) 19.44
18.50
(+/- 7) 41.76
VE + 4
wt.% clay 1.70
(+/- 4.5) 42.87
27.96
(+/- 5) 123.14
VE + 2.0
wt.% clay
1.29
(+/- 4.5) 19.44
18.11
(+/- 9) 38.77
VE + 5
wt.% clay 1.55
(+/- 7) 29.68
20.74 (+/- 4)
65.52 VE + 2.5 wt.% clay
1.27 (+/- 7)
17.59 16.81
(+/- 13) 28.81
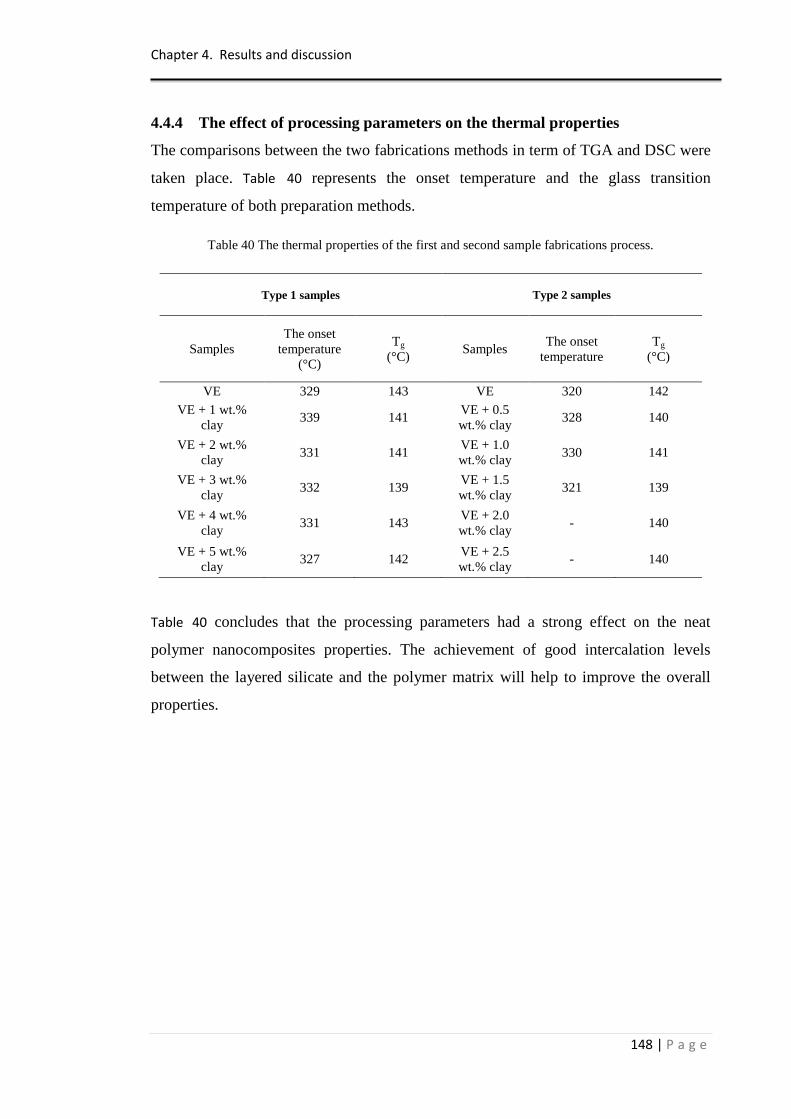
Chapter 4. Results and discussion
148 | P a g e
4.4.4 The effect of processing parameters on the thermal properties
The comparisons between the two fabrications methods in term of TGA and DSC were
taken place. Table 40 represents the onset temperature and the glass transition
temperature of both preparation methods.
Table 40 The thermal properties of the first and second sample fabrications process.
Type 1 samples
Type 2 samples
Samples
The onset
temperature
(°C)
Tg
(°C) Samples
The onset
temperature
Tg
(°C)
VE 329 143 VE 320 142
VE + 1 wt.%
clay 339 141
VE + 0.5
wt.% clay 328 140
VE + 2 wt.%
clay 331 141
VE + 1.0
wt.% clay 330 141
VE + 3 wt.%
clay 332 139
VE + 1.5
wt.% clay 321 139
VE + 4 wt.%
clay 331 143
VE + 2.0
wt.% clay - 140
VE + 5 wt.%
clay 327 142
VE + 2.5
wt.% clay - 140
Table 40 concludes that the processing parameters had a strong effect on the neat
polymer nanocomposites properties. The achievement of good intercalation levels
between the layered silicate and the polymer matrix will help to improve the overall
properties.
Chapter 5. Conclusions and recommendation for future research
149 | P a g e
Chapter 5. Conclusions and recommendation for future research
5.1 Conclusions
5.1.1 Morphology of nanocomposites
Nanocomposites morphology information is important for a full understanding of the
solid-state structure and its correlation to their physical properties. Thus, various
characterisation techniques, including XRD, SEM, EDS, and TEM, were utilised in
order to study the morphology of nanocomposites and the correlation between the
intercalation level and the overall properties. It was found that the addition of layered
silicate into the vinyl ester matrix was uniformly distributed up to 4 wt.% clay loading.
Further addition of clay resulted in increasing the percentage of aggregation layers and
the voids content. This can explain the relationship between the parameters and the
threshold level of layered silicate content. Thus, a low amount of nanofillers in
nanocomposites is preferable in order to influence dramatic property enhancement.
5.1.2 Mechanical properties
In this study, mechanical testing including tensile, flexural nanoindentation, impact,
and creep of a vinyl ester matrix based on layered silicate was investigated. The
layered silicate had a strong effect on the polymer properties. The higher the amount of
clay loadings, the better the matrix properties achieved, up to 4 wt.% clay. The reason
for the ultimate improvement found at 4 wt.% was traced to the high level of
intercalation and interfacial interaction between the layered silicate and the polymer
chains, as proved by the XRD, SEM, EDS and TEM.
The ultimate improvement of flexural and tensile strength of nanocomposite
samples was at 4 wt.% clay loading, which revealed increases of 69.56 % and
123.14 % respectively compared to the neat vinyl ester. The improvement of
the strength could be related to the large interface between the fillers and matrix
due the high aspect ratio of layered silicate. Also, the mechanical load can be
diverted from the soft matrix to the stiff fillers, which improves the mechanical
strength.
The flexural and tensile modulus were also affected and increased by the
incorporation of layered silicate. 145.64 % and 42.87 % were the improvements
Chapter 5. Conclusions and recommendation for future research
150 | P a g e
for flexural and tensile modulus at 4 wt.% clay loading compared to the neat
vinyl ester. These enhancements can be due to the adhesion of polymer chains
to the stiff fillers by strong physisorption forces then the polymer chains will be
as one portion with the fillers and increase the modulus.
The nanoindentation test showed that the hardness and elastic modulus
improvements were related to the amount of clay loading up to 4 wt.%. The
enhancements of the hardness amount signify the resistance of the materials to
plastic deformation. Thus, a clear view of the results showed that the layered
silicate has a strong effect on the change in the material‟s behaviour under
plastic deformation.
The impact resistance of nanocomposites, which includes the maximum force
(N) and energy absorption (J), was dramatically improved by the addition of
layered silicate, by up to 42% and 60% respectively at 4 wt.% compared to neat
polymer. The enhancements of impact properties could be related to the yield
shielding formed by the existence of microvoids. In addition, the tortuous path
of the layered silicate played an important role in the distribution of the applied
mechanical stress, if the interfacial interaction between the layered silicate and
polymer is adequate. Also, theses paths helped to act as a crack deflection.
The creep processes provide an insight into the viscoelastic behaviour of the
material. The creep relaxation process was measured at 25°C and 60°C. Under
the creep and relaxation curve at both temperatures, the nanocomposite
exhibited less disturbance in terms of shear flow compared to the neat vinyl
ester. The strain reduction of the nanocomposite was proportional to the clay
concentration level. The addition of layered silicate into the polymer matrix
resulted in increasing the microphase separation where the elasticity of material
will be increased. As a result, the reduction of the stress relaxation process is
observed. At 60°C the creep properties were better than at 25°C, which may be
assigned to the thermodynamic changes in the morphology of nanocomposites
where the entropy gain is compensated by an enthalpy gain; in turn, the
increment of the linkage between the layered silicate and the polymer took
place. Also, the vinyl ester could be reorienting itself into a more ordered or
compact system resulting in a stronger cross-linking plastic at higher
temperature.
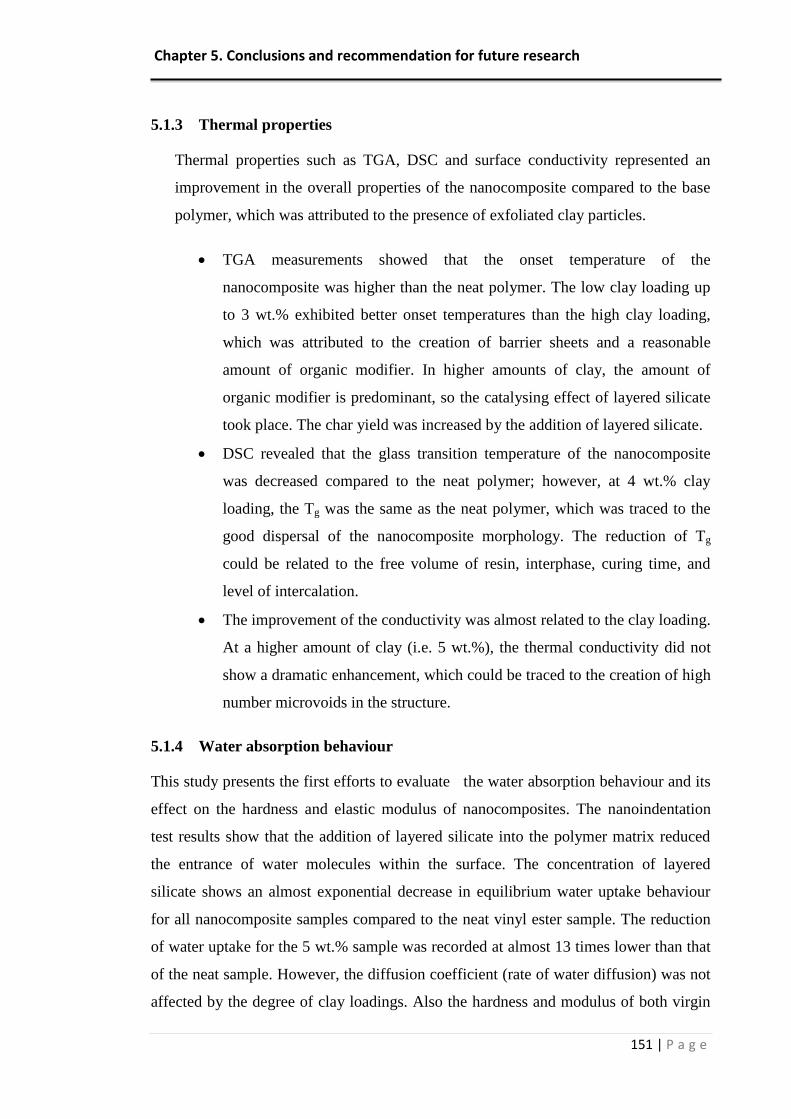
Chapter 5. Conclusions and recommendation for future research
151 | P a g e
5.1.3 Thermal properties
Thermal properties such as TGA, DSC and surface conductivity represented an
improvement in the overall properties of the nanocomposite compared to the base
polymer, which was attributed to the presence of exfoliated clay particles.
TGA measurements showed that the onset temperature of the
nanocomposite was higher than the neat polymer. The low clay loading up
to 3 wt.% exhibited better onset temperatures than the high clay loading,
which was attributed to the creation of barrier sheets and a reasonable
amount of organic modifier. In higher amounts of clay, the amount of
organic modifier is predominant, so the catalysing effect of layered silicate
took place. The char yield was increased by the addition of layered silicate.
DSC revealed that the glass transition temperature of the nanocomposite
was decreased compared to the neat polymer; however, at 4 wt.% clay
loading, the Tg was the same as the neat polymer, which was traced to the
good dispersal of the nanocomposite morphology. The reduction of Tg
could be related to the free volume of resin, interphase, curing time, and
level of intercalation.
The improvement of the conductivity was almost related to the clay loading.
At a higher amount of clay (i.e. 5 wt.%), the thermal conductivity did not
show a dramatic enhancement, which could be traced to the creation of high
number microvoids in the structure.
5.1.4 Water absorption behaviour
This study presents the first efforts to evaluate the water absorption behaviour and its
effect on the hardness and elastic modulus of nanocomposites. The nanoindentation
test results show that the addition of layered silicate into the polymer matrix reduced
the entrance of water molecules within the surface. The concentration of layered
silicate shows an almost exponential decrease in equilibrium water uptake behaviour
for all nanocomposite samples compared to the neat vinyl ester sample. The reduction
of water uptake for the 5 wt.% sample was recorded at almost 13 times lower than that
of the neat sample. However, the diffusion coefficient (rate of water diffusion) was not
affected by the degree of clay loadings. Also the hardness and modulus of both virgin
Chapter 5. Conclusions and recommendation for future research
152 | P a g e
polymer and nanocomposite was reduced after the water absorption; however, the
higher amount of layered silicate led to a lesser reduction in hardness. The hardness of
5 wt.% nanocomposite was reduced by 10%, however a reduction of 30% in hardness
of the neat polymer was observed.
5.1.5 Surface energy characteristics
Studying the wettability and surface behaviour of the nanocomposite and the neat
polymer by contact angle measurement showed that the addition of layered silicate into
the polymer matrix reduced the angle of both water and glycerol droplet. The neat
polymer provided a hydrophobicity behaviour which means less wettability property as
the angle of water and glycerol droplet were high (θ 91.7 and θ 96.7 respectively).
The enlargement of the clay content increased the affinity between the droplet and the
surface of the sample which indicated higher wettability compared to the neat polymer.
This proved the finding in the literature regarding the relationship between the level of
intercalation and the wettability.
In summary, the reduction in properties by adding more than 4 wt.% clay loading can
be assigned to following reasons:
The amount of layered silicate at more than the threshold level can lead to
decrease the enhancements of the mechanical properties which are due to the
reduction in the intercalation level.
The flaws which occurred, such as trapped air bubbles and weak boundaries in
the preparation of the nanocomposite, can be two of the important reasons for
the reduction in properties. At high clay loading, the viscosity of the mixture
will increase due to the high interfacial between the layered silicate and the
polymer, so the number of these flaws will also increase. As a result, less
homogeneity of the structure will be observed.
5.2 Recommendations for future work
This PhD research work presents effort to determine different properties of layered
silicate based nanocomposites using various characterisation and testing
techniques. Analysis of experimental results reveal a promising prospects in
layered silicate based materials and technology.
Chapter 5. Conclusions and recommendation for future research
153 | P a g e
The processing parameters could be improved in order to study the effect of the
incorporation of high clay loading into the polymer matrix on the overall
properties.
The most advanced and available characterisations in the nowadays were used in
this project which include XRD, SEM, EDS, and TEM. However further
investigation by other characterisations may be utlised such as Atomic force
microscopy (AFM) in order to study more the morphology of the nanocompoistes.
The benefit of AFM that the sample does not need special preparation and can
provide with high resolution compared to TEM.
Compare properties obtained in this study against other clay types.
154 | P a g e
Chapter 6. References
1. Martin JW. Materials for engineering. 2nd ed. ed. Leeds: Maney publishing for the Institute of Materials; 2002. 2. Mandelkern L. Crystallization of polymers. 2nd ed. ed: Cambridge : Cambridge University Press, 2002-; 2002. 3. Shishir S, Vinay K. Polymer Systems and Applications. Delhi, IND Global Media 2010. 4. Yu T, Li Y, Ren J. Preparation and properties of short natural fiber reinforced poly(lactic acid) composites. Transactions of Nonferrous Metals Society of China. 2009;19, Supplement 3(0):s651-s5. 5. Pinnavaia TJ, Beall GW. Polymer-clay nanocomposites. Chichester: John Wiley; 2000. xx, 349 p., [1] leaf of plates p. 6. Utracki LA. Clay-containing polymeric nanocomposites. Shrewsbury: Rapra Technology Limited; 2004. 2 v. (xii, 785 p.) p. 7. Ajayan PM, Schadler LS, Braun PV. Nanocomposite science and technology. Weinheim ; [Great Britain]: Wiley-VCH; 2003. ix, 230 p. p. 8. Pavlidou S, Papaspyrides CD. A review on polymer–layered silicate nanocomposites. Progress in Polymer Science. 2008;33:1119–98. 9. Danikas M, Tanaka T. Nanocomposites-a review of electrical treeing and breakdown. Electrical Insulation Magazine, IEEE. 2009;25(4):19-25. 10. Becker O. Inorganic polymeric nanocomposites and membranes. Berlin ; London: Springer; 2005. 220 p. p. 11. Wang S, Huang Y, Zheng M, Wei Y, Huang S, Gu Y. Synthesis of MS (M= Zn, Cd, and Pb)–chitosan nanocomposite film via a simulating biomineralization method. Advances in Polymer Technology. 2011;30(4):269-75. 12. Morgan AB, Gilman JW. Characterization of polymer-layered silicate (clay) nanocomposites by transmission electron microscopy and X-ray diffraction: A comparative study. Journal of Applied Polymer Science. 2003;87(8):1329-38. 13. Chen H, Zheng M, Sun H, Jia Q. Characterization and properties of sepiolite/polyurethane nanocomposites. Materials Science and Engineering: A. 2007;445–446(0):725-30. 14. Feijoo JL, Cabedo L, Gimenez J, Lagaron M, Saura JJ. Development of amorphous PLA-montmorillonite nanocomposites. Journal of Materials Science. 2005;40(7):1785-8. 15. Okamoto M. Polymer/layered silicate nanocomposites. Shrewsbury: Rapra Technology Limited; 2003. 166 p. p. 16. Suprakas Sinha R, Masami O. Polymer/layered silicate nanocomposites: a review from preparation to processing. Prog Polym Sci. 2003;28:1539–641. 17. Cui HW, Du GB. Preparation and characterization of exfoliated nanocomposite of polyvinyl acetate and organic montmorillonite. Advances in Polymer Technology. 2012. 18. Camargo PHC, Satyanarayana KG, Wypych F. Nanocomposites: synthesis, structure, properties and new application opportunities. Materials Research. 2009;12(1):1-39. 19. Ding C, Jia D, He H, Guo B, Hong H. How organo-montmorillonite truly affects the structure and properties of polypropylene. Polymer Testing. 2005;24(1):94-100. 20. Alexandre M, Dubois P. Polymer-layered silicate nanocomposites: preparation, properties and uses of a new class of materials. Materials Science and Engineering: R: Reports. 2000;28(1-2):1-63. 21. Giannelis EP. Polymer Layered Silicate Nanocomposites. Advanced Materials. 1996;8(1):29-35. 22. Chin I-J, Thurn-Albrecht T, Kim H-C, Russell TP, Wang J. On exfoliation of montmorillonite in epoxy. Polymer. 2001;42(13):5947-52.
155 | P a g e
23. Beyer G. Nanocomposites: a new class of flame retardants for polymers. Plastics, Additives and Compounding. 2002;4(10):22-8. 24. Kim GM, Lee DH, Hoffmann B, Kressler J, Stöppelmann G. Influence of nanofillers on the deformation process in layered silicate/polyamide-12 nanocomposites. Polymer. 2001;42(3):1095-100. 25. Dennis HR, Hunter DL, Chang D, Kim S, White JL, Cho JW, et al. Effect of melt processing conditions on the extent of exfoliation in organoclay-based nanocomposites. Polymer. 2001;42(23):9513-22. 26. Wu D, Zhou C, Yu W, Fan X. Effect of flocculated structure on rheology of poly(butylene terephthalate)/clay nanocomposites. Journal of Polymer Science Part B: Polymer Physics. 2005;43(19):2807-18. 27. Fu X, Qutubuddin S. Polymer-clay nanocomposites: exfoliation of organophilic montmorillonite nanolayers in polystyrene. Polymer. 2001;42(2):807-13. 28. Krishnamoorti R, Giannelis E. Rheology of End-Tethered Polymer Layered Silicate Nanocomposites. Macromolecules. 1997;30(14):4097-102. 29. LeBaron PC, Wang Z, Pinnavaia TJ. Polymer-layered silicate nanocomposites: an overview. Applied Clay Science. 1999;15(1-2):11-29. 30. Vaia RA, Giannelis EP. Lattice model of polymer melt intercalation in organically-modified layered silicates. Macromolecules. 1997;30(25):7990-9. 31. Challa G. Polymer chemistry: an introduction: Ellis Horwood Ltd; 1993. 32. Harper CA, Baker A-M. Modern plastics handbook: McGraw-Hill New York; 2000. 33. Stevens MP. Polymer chemistry : an introduction. 3rd ed. ed. New York ; Oxford: Oxford University Press; 1999. xix,551p. p. 34. Bolker HI. Natural and synthetic polymers: an introduction. 1974. 35. Stevens MP. Polymer chemistry: Oxford University Press New York, NY; 1990. 36. Barrett KEJ. Dispersion polymerization in organic media: Wiley-Interscience; 1974. 37. Matyjaszewski K, Davis TP, Wiley J. Handbook of radical polymerization: Wiley Online Library; 2002. 38. Strong AB, Strong B. Plastics: materials and processing: Prentice Hall; 1996. 39. Fried J. Polymer science and technology: Pearson Education; 2003. 40. Holden G. Thermoplastic elastomers: Wiley Online Library; 2002. 41. Bower CA. Studies on the forms and availability of soil organic phosphorus: Agricultural Experiment Station, Iowa State College of Agriculture and Mechanic Arts; 1949. 42. Carter LW, Hendricks JG, Bolley DS. Elastomer reinforced with a modified clay. US Patent 2,531,396; 1950. 43. Hauser EA. CLAY COMPLEXES WJTH CONJUGATED UNSAT. Google Patents; 1960. 44. Uskov IA. Filled polymers III. Polymerization of methyl methacrylate during dispersion of sodium bentonite. Vysokomolekulyarnye Soedineniya. 1960;2:926–30. 45. Blumstein A. Etude des polymerisations en couche adsorbee. Bull Chim Soc. 1961:899–906. 46. Greenland DJ. Adsorption of polyvinyl alcohols by montmorillonite. Journal of Colloid Science. 1963;18(7):647-64. 47. Nalsia PG. Organoclay-polyolefin compositions. Google Patents; 1963. 48. Tanihara K, Nakagawa M. Flocculation treatment of waste water containing montmorillonite: IV. Interlamellar complex formation between various ion forms of montmorillonite and poly(ethylene oxide) or polyacrylamide. Nippon Kagaku Kaishi. 1975;5:782–9. 49. Fujiwara S, Sakamoto T. Method for Manufacturing a Clay-Polyamide Composite: Kokai Patent Application, 1976, no. Sho. 1976;51:109998. 50. Mehta RKS, Weiss P. Bentonite/halogen flame retarding additive. Google Patents; 1978. 51. Bradbury JA, Rowlands R, Tipping JW. Network of bonded expanded polystyrene beads having chemically delaminated vermiculite impregnant. Google Patents; 1984.
156 | P a g e
52. Shain AL. Flame retardant thermoplastic multi-block copolyester elastomers. Google Patents; 1986. 53. Usuki A, Kojima Y, Kawasumi M, Okada A, Fukushima Y, Kurauchi T, et al. Synthesis of nylon 6-clay hybrid. Journal of Materials Research. 1993;8(5):1179-84. 54. Usuki A, Koiwai A, Kojima Y, Kawasumi M, Okada A, Kurauchi T, et al. Interaction of nylon 6-clay surface and mechanical properties of nylon 6-clay hybrid. Journal of Applied Polymer Science. 1995;55(1):119-23. 55. Okada A, Usuki A. The chemistry of polymer-clay hybrids. Materials Science and Engineering: C. 1995;3(2):109-15. 56. Okada A, Fukushima Y, Kawasumi M, Inagaki S, Usuki A, Sugiyama S, et al. Composite material and process for manufacturing same. Google Patents; 1988. 57. Vaia RA, Wagner HD. Framework for nanocomposites. Materials Today. 2004;7(11):32-7. 58. Porter D, Metcalfe E, Thomas MJK. Nanocomposite fire retardants — a review. Fire and Materials. 2000;24(1):45-52. 59. Vaia RA, Price G, Ruth PN, Nguyen HT, Lichtenhan J. Polymer/layered silicate nanocomposites as high performance ablative materials. Applied Clay Science. 1999;15(1-2):67-92. 60. Biswas M, Ray S. Recent Progress in Synthesis and Evaluation of Polymer-Montmorillonite Nanocomposites. New Polymerization Techniques and Synthetic Methodologies. Advances in Polymer Science. 155: Springer Berlin / Heidelberg; 2001. p. 167-221. 61. Vaia RA, Jandt KD, Kramer EJ, Giannelis EP. Microstructural Evolution of Melt Intercalated Polymer−Organically Modified Layered Silicates Nanocomposites. Chemistry of Materials. 1996;8(11):2628-35. 62. Vaia RA, Giannelis EP. Polymer Melt Intercalation in Organically-Modified Layered Silicates: Model Predictions and Experiment. Macromolecules. 1997;30(25):8000-9. 63. Ma J, Xu J, Ren J-H, Yu Z-Z, Mai Y-W. A new approach to polymer/montmorillonite nanocomposites. Polymer. 2003;44(16):4619-24. 64. VanderHart DL, Asano A, Gilman JW. NMR Measurements Related to Clay-Dispersion Quality and Organic-Modifier Stability in Nylon-6/Clay Nanocomposites. Macromolecules. 2001;34(12):3819-22. 65. Loo LS, Gleason KK. Fourier Transform Infrared Investigation of the Deformation Behavior of Montmorillonite in Nylon-6/Nanoclay Nanocomposite. Macromolecules. 2003;36(8):2587-90. 66. Wu H-D, Tseng C-R, Chang F-C. Chain Conformation and Crystallization Behavior of the Syndiotactic Polystyrene Nanocomposites Studied Using Fourier Transform Infrared Analysis. Macromolecules. 2001;34(9):2992-9. 67. Zanetti M, Lomakin S, Camino G. Polymer layered silicate nanocomposites. Macromol Mater Eng. 2000;279(1):1-9. 68. Jeon K, Lumata L, Tokumoto T, Steven E, Brooks J, Alamo RG. Low electrical conductivity threshold and crystalline morphology of single-walled carbon nanotubes - high density polyethylene nanocomposites characterized by SEM, Raman spectroscopy and AFM. Polymer. 2007;48(16):4751-64. 69. Loos J, Alexeev A, Grossiord N, Koning CE, Regev O. Visualization of single-wall carbon nanotube (SWNT) networks in conductive polystyrene nanocomposites by charge contrast imaging. Ultramicroscopy. 2005;104(2):160-7. 70. Cahill LS, Yao Z, Adronov A, Penner J, Moonoosawmy KR, Kruse P, et al. Polymer-Functionalized Carbon Nanotubes Investigated by Solid-State Nuclear Magnetic Resonance and Scanning Tunneling Microscopy. The Journal of Physical Chemistry B. 2004;108(31):11412-8. 71. Miranda-Trevino JC, Coles CA. Kaolinite properties, structure and influence of metal retention on pH. Applied clay science. 2003;23(1):133-9.
157 | P a g e
72. Dixon JB. Roles of clays in soils. 1991;5(5-6):489-503. 73. Manias E, Touny A, Wu L, Strawhecker K, Lu B, Chung T. Polypropylene/Montmorillonite Nanocomposites. Review of the Synthetic Routes and Materials Properties. Chem Mater. 2001:3516–23. 74. Azeez AA, Rhee KY, Park SJ, Hui D. Epoxy clay nanocomposites- processing, properties and applications: a review. Composites Part B: Engineering. 2012(0). 75. Aranda P, Ruiz-Hitzky E. Poly(ethylene oxide)-silicate intercalation materials. Chem Mate. 1992:1395–403. 76. Giannelis E, Krishnamoorti R, Manias E. Polymer-Silicate Nanocomposites: Model Systems for Confined Polymers and Polymer Brushes. Polymers in Confined Environments. Advances in Polymer Science. 138: Springer Berlin / Heidelberg; 1999. p. 107-47. 77. Yebassa D, Balakrishnan S, Feresenbet E, Raghavan D, Start PR, Hudson SD. Chemically functionalized clay vinyl ester nanocomposites: Effect of processing parameters. 2004;42(6):1310-21. 78. Xie W, Gao Z, Liu K, Pan W-P, Vaia R, Hunter D, et al. Thermal characterization of organically modified montmorillonite. Thermochimica Acta. 2001;367-368:339-50. 79. Kornmann X, Lindberg H, Berglund LA. Synthesis of epoxy-clay nanocomposites: influence of the nature of the clay on structure. Polymer. 2001;42(4):1303-10. 80. Zerda AS, Lesser AJ. Intercalated clay nanocomposites: Morphology, mechanics, and fracture behavior. Journal of Polymer Science Part B: Polymer Physics. 2001;39(11):1137-46. 81. Blumstein A. Polymerization of adsorbed monolayers. II. Thermal degradation of the inserted polymer. Journal of Polymer Science Part A: General Papers. 1965;3(7):2665-72. 82. Theng BKG. Formation and properties of clay-polymer complexes. Amsterdam ; Oxford: Elsevier Scientific; 1979. xi,362p. p. 83. Brindly S, Brown G. Crystal structure of clay minerals and their X-ray diffraction. London: Mineralogical Society; 1980. 84. Vaia RA, Ishii H, Giannelis EP. Synthesis and properties of two-dimensional nanostructures by direct intercalation of polymer melts in layered silicates. Chemistry of Materials. 1993;5(12):1694-6. 85. Huang J-C, Zhu Z-k, Yin J, Qian X-f, Sun Y-Y. Poly(etherimide)/montmorillonite nanocomposites prepared by melt intercalation:morphology, solvent resistance properties and thermal properties. Polymer. 2001;42(3):873-7. 86. Lagaly G. Interaction of alkylamines with different types of layered compounds. Solid State Ionics. 1986;22(1):43-51. 87. Fischer HR, Gielgens LH, Koster TPM. Nanocomposites from polymers and layered minerals. Acta Polymerica. 1999;50(4):122-6. 88. Ovid’ko IA, Pande CS, Krishnamoorti R, Lavernia E, Skandan G, editors. Mechanical Properties of Nanostructured Materials and Nanocomposites. MRS Symp Proc; 2004. 89. Kornmann X. Synthesis and characterization of thermoset-clay nanocomposites. Introduction, Lulea Tekniska Universite. 1999. 90. Wang KH, Choi MH, Koo CM, Choi YS, Chung IJ. Synthesis and characterization of maleated polyethylene/clay nanocomposites. Polymer. 2001;42(24):9819-26. 91. Gelfer MY, Song HH, Liu L, Hsiao BS, Chu B, Rafailovich M, et al. Effects of organoclays on morphology and thermal and rheological properties of polystyrene and poly(methyl methacrylate) blends. Journal of Polymer Science Part B: Polymer Physics. 2003;41(1):44-54. 92. Butcher SS. Global biogeochemical cycles: Academic Press; 1992. 93. Hackman I, Hollaway L. Epoxy-layered silicate nanocomposites in civil engineering. Composites Part A: Applied Science and Manufacturing. 2006;37(8):1161-70. 94. Ishida H, Campbell S, Blackwell J. General approach to nanocomposite preparation. Chemistry of materials. 2000;12(5):1260-7. 95. Wypych F, Satyanarayana KG. Functionalization of single layers and nanofibers: a new strategy to produce polymer nanocomposites with optimized properties. Journal of colloid and interface science. 2005;285(2):532-43.
158 | P a g e
96. Zerda AS, Caskey TC, Lesser AJ. Highly Concentrated, Intercalated Silicate Nanocomposites: Synthesis and Characterization. Macromolecules. 2003;36(5):1603-8. 97. Su S, Wilkie CA. Exfoliated poly(methyl methacrylate) and polystyrene nanocomposites occur when the clay cation contains a vinyl monomer. Journal of Polymer Science Part A: Polymer Chemistry. 2003;41(8):1124-35. 98. Costache MC, Wang D, Heidecker MJ, Manias E, Wilkie CA. The thermal degradation of poly (methyl methacrylate) nanocomposites with montmorillonite, layered double hydroxides and carbon nanotubes. Polymers for advanced technologies. 2006;17(4):272-80. 99. Lin J, Wu J, Yang Z, Pu M. Synthesis and Properties of Poly(acrylic acid)/Mica Superabsorbent Nanocomposite. Macromolecular Rapid Communications. 2001;22(6):422-4. 100. Chinellato AC, Vidotti SE, Hu GH, Pessan LA. Compatibilizing effect of acrylic acid modified polypropylene on the morphology and permeability properties of polypropylene/organoclay nanocomposites. Composites Science and Technology. 2010;70(3):458-65. 101. Choi YS, Wang KH, Xu M, Chung IJ. Synthesis of Exfoliated Polyacrylonitrile/Na−MMT Nanocomposites via Emulsion Polymerization. Chemistry of Materials. 2002;14(7):2936-9. 102. Gatos KG, Karger-Kocsis J. Effect of the aspect ratio of silicate platelets on the mechanical and barrier properties of hydrogenated acrylonitrile butadiene rubber (HNBR)/layered silicate nanocomposites. European polymer journal. 2007;43(4):1097-104. 103. Zeng QH, Wang DZ, Yu AB, Lu GQ. Synthesis of polymer montmorillonite nanocomposites by in situ intercalative polymerization. Nanotechnology. 2002;13(5):549–53. 104. Beyer FL, Beck Tan NC, Dasgupta A, Galvin ME. Polymer−Layered Silicate Nanocomposites from Model Surfactants. Chemistry of Materials. 2002;14(7):2983-8. 105. Gilman JW, Awad WH, Davis RD, Shields J, Harris RH, Davis C, et al. Polymer/Layered Silicate Nanocomposites from Thermally Stable Trialkylimidazolium-Treated Montmorillonite. Chemistry of Materials. 2002;14(9):3776-85. 106. Zhang Z, Zhang L, Li Y, Xu H. New fabricate of styrene–butadiene rubber/montmorillonite nanocomposites by anionic polymerization. Polymer. 2005;46(1):129-36. 107. Zhang F, Guo Z, Gao H, Li Y, Ren L, Shi L, et al. Synthesis and properties of sepiolite/poly (acrylic acid-co-acrylamide) nanocomposites. Polymer Bulletin. 2005;55(6):419-28.
108. Yen MH, Lin KF. Atypical transition temperature dependence of poly (N‐
isopropylacrylamide) and poly (N‐isopropylacrylamide‐co‐acrylamide) nanocomposites on the content of exfoliated montmorillonites. Journal of Polymer Science Part B: Polymer Physics. 2009;47(5):524-30.
109. Şen S, Nugay N, Nugay T. Structural effects of type of intercalant in poly (4‐vinylpyridine) nanocomposites: compatible homopolymer or block copolymer. Polymer International. 2006;55(5):552-7. 110. Zhang B-Q, Chen G-D, Pan C-Y, Luan B, Hong C-Y. Preparation, characterization, and thermal properties of polystyrene-block-quaternized poly(4-vinylpyridine)/Montmorillonite nanocomposites. Journal of Applied Polymer Science. 2006;102(2):1950-8.
111. Liang J, Huang Y, Zhang L, Wang Y, Ma Y, Guo T, et al. Molecular‐Level Dispersion of Graphene into Poly (vinyl alcohol) and Effective Reinforcement of their Nanocomposites. Advanced Functional Materials. 2009;19(14):2297-302. 112. Lu H, Wilkie CA, Ding M, Song L. Flammability performance of poly(vinyl alcohol) nanocomposites with zirconium phosphate and layered silicates. Polymer Degradation and Stability. 2011;96(7):1219-24. 113. Gultek A, Seckin T, Onal Y, Icduygu MG. Preparation and phenol captivating properties of polyvinylpyrrolidone-montmorillonite hybrid materials. Journal of Applied Polymer Science. 2001;81(2):512-9. 114. Koo CM, Ham HT, Choi MH, Kim SO, Chung IJ. Characteristics of polyvinylpyrrolidone-layered silicate nanocomposites prepared by attrition ball milling. Polymer. 2003;44(3):681-9.
159 | P a g e
115. Nisha A, Rajeswari MK, Dhamodharan R. Intercalative redox polymerization and characterization of poly(n-vinyl-2-pyrrolidinone) in the gallery of vermiculite: A novel inorganic–organic hybrid material. Journal of Applied Polymer Science. 2000;76(12):1825-30. 116. Sengwa RJ, Choudhary S, Sankhla S. Low frequency dielectric relaxation processes and ionic conductivity of montmorillonite clay nanoparticles colloidal suspension in poly (vinyl pyrrolidone)-ethylene glycol blends. Express Polymer Letters. 2008;2(11):800-9. 117. Campbell K, Craig DQM, McNally T. Poly (ethylene glycol) layered silicate nanocomposites for retarded drug release prepared by hot-melt extrusion. International journal of pharmaceutics. 2008;363(1):126-31. 118. Priya L, Jog JP. Intercalated poly(vinylidene fluoride)/clay nanocomposites: Structure and properties. Journal of Polymer Science Part B: Polymer Physics. 2003;41(1):31-8. 119. Buckley J, Cebe P, Cherdack D, Crawford J, Ince BS, Jenkins M, et al. Nanocomposites of poly (vinylidene fluoride) with organically modified silicate. Polymer. 2006;47(7):2411-22. 120. Oriakhi CO, Zhang X, Lerner MM. Synthesis and luminescence properties of a poly(p-phenylenevinylene)/montmorillonite layered nanocomposite. Applied Clay Science. 1999;15(1-2):109-18. 121. Liu W, Yang C-L, Zhu Y-T, Wang M-s. Interactions between single-walled carbon nanotubes and polyethylene/polypropylene/polystyrene/poly (phenylacetylene)/poly (p-phenylenevinylene) considering repeat unit arrangements and conformations: a molecular dynamics simulation study. The Journal of Physical Chemistry C. 2008;112(6):1803-11. 122. Hsu SL-C, Chang K-C. Synthesis and properties of polybenzoxazole-clay nanocomposites. Polymer. 2002;43(15):4097-101.
123. Hsu SLC, Lin CY, Chuang SW. Positive‐working aqueous base developable photosensitive polybenzoxazole precursor/organoclay nanocomposites. Journal of applied polymer science. 2005;97(6):2350-6. 124. Kim SW, Jo WH, Lee MS, Ko MB, Jho JY. Preparation of clay-dispersed poly(styrene-co-acrylonitrile) nanocomposites using poly([epsilon]-caprolactone) as a compatibilizer. Polymer. 2001;42(24):9837-42.
125. Li Y, Shimizu H. Co‐continuous Polyamide 6 (PA6)/Acrylonitrile‐Butadiene‐Styrene (ABS) Nanocomposites. Macromolecular rapid communications. 2005;26(9):710-5. 126. Stretz HA, Paul DR, Cassidy PE. Poly (styrene-< i> co</i>-acrylonitrile)/montmorillonite organoclay mixtures: a model system for ABS nanocomposites. Polymer. 2005;46(11):3818-30. 127. Artzi N, Nir Y, Narkis M, Siegmann A. Melt blending of ethylene-vinyl alcohol copolymer/clay nanocomposites: Effect of the clay type and processing conditions. Journal of Polymer Science Part B: Polymer Physics. 2002;40(16):1741-53. 128. Ren J, Silva AS, Krishnamoorti R. Linear Viscoelasticity of Disordered Polystyrene−Polyisoprene Block Copolymer Based Layered-Silicate Nanocomposites. Macromolecules. 2000;33(10):3739-46. 129. Mitchell CA, Krishnamoorti R. Rheological properties of diblock copolymer/layered-silicate nanocomposites. Journal of Polymer Science Part B: Polymer Physics. 2002;40(14):1434-43. 130. Litina K, Miriouni A, Gournis D, Karakassides MA, Georgiou N, Klontzas E, et al. Nanocomposites of polystyrene-< i> b</i>-polyisoprene copolymer with layered silicates and carbon nanotubes. European polymer journal. 2006;42(9):2098-107. 131. Lim S-H, Dasari A, Wang G-T, Yu Z-Z, Mai Y-W, Yuan Q, et al. Impact fracture behaviour of nylon 6-based ternary nanocomposites. Composites Part B: Engineering. 2010;41(1):67-75. 132. Tung J, Gupta RK, Simon GP, Edward GH, Bhattacharya SN. Rheological and mechanical comparative study of in situ polymerized and melt-blended nylon 6 nanocomposites. Polymer. 2005;46(23):10405-18. 133. Utracki LA, Simha R, Garcia-Rejon A. Pressure−Volume−Temperature Dependence of Poly-ε-caprolactam/Clay Nanocomposites. Macromolecules. 2003;36(6):2114-21.
160 | P a g e
134. Gorrasi G, Tortora M, Vittoria V, Pollet E, Lepoittevin B, Alexandre M, et al. Vapor barrier properties of polycaprolactone montmorillonite nanocomposites: effect of clay dispersion. Polymer. 2003;44(8):2271-9. 135. Wu T-M, Cheng J-C, Yan M-C. Crystallization and thermoelectric behavior of conductive-filler-filled poly([epsilon]-caprolactone)/poly(vinyl butyral)/montmorillonite nanocomposites. Polymer. 2003;44(8):2553-62. 136. Perez CJ, Alvarez VA, Vazquez A. Creep behaviour of layered silicate/starch–polycaprolactone blends nanocomposites. Materials Science and Engineering: A. 2008;480(1):259-65. 137. Chen B, Evans JRG. Poly(ε-caprolactone)−Clay Nanocomposites: Structure and Mechanical Properties. Macromolecules. 2006;39(2):747-54. 138. Ke Y, Long C, Qi Z. Crystallization, properties, and crystal and nanoscale morphology of PET–clay nanocomposites. Journal of Applied Polymer Science. 1999;71(7):1139-46. 139. Sekelik DJ, Stepanov EV, Nazarenko S, Schiraldi D, Hiltner A, Baer E. Oxygen barrier properties of crystallized and talc-filled poly(ethylene terephthalate). Journal of Polymer Science Part B: Polymer Physics. 1999;37(8):847-57. 140. Davis CH, Mathias LJ, Gilman JW, Schiraldi DA, Shields JR, Trulove P, et al. Effects of melt-processing conditions on the quality of poly(ethylene terephthalate) montmorillonite clay nanocomposites. Journal of Polymer Science Part B: Polymer Physics. 2002;40(23):2661-6. 141. Imai Y, Nishimura S, Abe E, Tateyama H, Abiko A, Yamaguchi A, et al. High-Modulus Poly(ethylene terephthalate)/Expandable Fluorine Mica Nanocomposites with a Novel Reactive Compatibilizer. Chemistry of Materials. 2002;14(2):477-9. 142. Xu X, Ding Y, Qian Z, Wang F, Wen B, Zhou H, et al. Degradation of poly (ethylene terephthalate)/clay nanocomposites during melt extrusion: effect of clay catalysis and chain extension. Polymer Degradation and Stability. 2009;94(1):113-23. 143. Costache MC, Heidecker MJ, Manias E, Wilkie CA. Preparation and characterization of poly (ethylene terephthalate)/clay nanocomposites by melt blending using thermally stable
surfactants. Polymers for advanced technologies. 2006;17(9‐10):764-71. 144. Liu Z, Yan D, Chen K. Preparation of poly(trimethylene terephthalate)/montmorillonite nanocomposite by melt intercalation. Polymer Preprints. 2003;44(1):1138-9. 145. Duan Q, Yan D. Poly(trimethylene terephthalate)–montmorillonite nanocomposite made by in situ polymerization. Polymer Preprints. 2003;44(1):1140-1. 146. Drown EK, Mohanty AK, Parulekar Y, Hasija D, Harte BR, Misra M, et al. The surface characteristics of organoclays and their effect on the properties of poly (trimethylene terephthalate) nanocomposites. Composites Science and Technology. 2007;67(15):3168-75. 147. Chisholm BJ, Moore RB, Barber G, Khouri F, Hempstead A, Larsen M, et al. Nanocomposites Derived from Sulfonated Poly(butylene terephthalate). Macromolecules. 2002;35(14):5508-16. 148. Wu D, Zhou C, Hong Z, Mao D, Bian Z. Study on rheological behaviour of poly (butylene terephthalate)/montmorillonite nanocomposites. European polymer journal. 2005;41(9):2199-207. 149. Huang X, Lewis S, Brittain WJ, Vaia RA. Synthesis of Polycarbonate-Layered Silicate Nanocomposites via Cyclic Oligomers. Macromolecules. 2000;33(6):2000-4. 150. Mitsunaga M, Ito Y, Ray SS, Okamoto M, Hironaka K. Intercalated Polycarbonate/Clay Nanocomposites: Nanostructure Control and Foam Processing. Macromolecular Materials and Engineering. 2003;288(7):543-8. 151. Wu J, Lerner MM. Structural, thermal, and electrical characterization of layered nanocomposites derived from sodium-montmorillonite and polyethers. Chemistry of Materials. 1993;5(6):835-8. 152. Hackett E, Manias E, Giannelis EP. Computer Simulation Studies of PEO/Layer Silicate Nanocomposites. Chemistry of Materials. 2000;12(8):2161-7.
161 | P a g e
153. Kuppa V, Manias E. Computer Simulation of PEO/Layered-Silicate Nanocomposites: 2. Lithium Dynamics in PEO/Li+ Montmorillonite Intercalates. Chemistry of Materials. 2002;14(5):2171-5. 154. Wang L, Rocci-Lane M, Brazis P, Kannewurf CR, Kim Y-I, Lee W, et al. α-RuCl3/Polymer Nanocomposites: The First Group of Intercalative Nanocomposites with Transition Metal Halides. Journal of the American Chemical Society. 2000;122(28):6629-40. 155. Burnside SD, Giannelis EP. Synthesis and properties of new poly(dimethylsiloxane) nanocomposites. Chemistry of Materials. 1995;7(9):1597-600. 156. Wang S, Long C, Wang X, Li Q, Qi Z. Synthesis and properties of silicone rubber/organomontmorillonite hybrid nanocomposites. Journal of Applied Polymer Science. 1998;69(8):1557-61. 157. Takeuchi H, Cohen C. Reinforcement of Poly(dimethylsiloxane) Elastomers by Chain-End Anchoring to Clay Particles. Macromolecules. 1999;32(20):6792-9. 158. Bokobza L, Nugay N. Orientational effect of mica in fumed silica reinforced composites. Journal of Applied Polymer Science. 2001;81(1):215-22. 159. Osman MA, Atallah A, Müller M, Suter UW. Reinforcement of poly(dimethylsiloxane) networks by mica flakes. Polymer. 2001;42(15):6545-56. 160. Nugay N, Küsefoğlu S, Erman B. Swelling and static–dynamic mechanical behavior of mica-reinforced linear and star-branched polybutadiene composites. Journal of Applied Polymer Science. 1997;66(10):1943-52. 161. Akelah A, El-Borai MA, Abd El-Aal MF, Rehab A, Abou-Zeid MS. New catalytic systems based on intercalated polymer-montmorillonite supports. Macromolecular Chemistry and Physics. 1999;200(5):955-63. 162. Zhang L, Wang Y, Wang Y, Sui Y, Yu D. Morphology and mechanical properties of clay/styrene-butadiene rubber nanocomposites. Journal of Applied Polymer Science. 2000;78(11):1873-8. 163. Wang Y, Zhang L, Tang C, Yu D. Preparation and characterization of rubber–clay nanocomposites. Journal of Applied Polymer Science. 2000;78(11):1879-83. 164. Manna AK, Tripathy DK, De PP, De SK, Chatterjee MK, Peiffer DG. Bonding between epoxidized natural rubber and clay in presence of silane coupling agent. Journal of Applied Polymer Science. 1999;72(14):1895-903. 165. Vu YT, Mark JE, Pham LH, Engelhardt M. Clay nanolayer reinforcement of cis-1,4-polyisoprene and epoxidized natural rubber. Journal of Applied Polymer Science. 2001;82(6):1391-403. 166. Park JH, Jana SC. Mechanism of Exfoliation of Nanoclay Particles in Epoxy−Clay Nanocomposites. Macromolecules. 2003;36(8):2758-68. 167. Park JH, Jana SC. The relationship between nano- and micro-structures and mechanical properties in PMMA-epoxy-nanoclay composites. Polymer. 2003;44(7):2091-100. 168. Kaynak C, Nakas GI, Isitman NA. Mechanical properties, flammability and char morphology of epoxy resin/montmorillonite nanocomposites. Applied Clay Science. 2009;46(3):319-24. 169. Wang H, Zhao T, Zhi L, Yan Y, Yu Y. Synthesis of Novolac/Layered Silicate Nanocomposites by Reaction Exfoliation Using Acid-Modified Montmorillonite. Macromolecular Rapid Communications. 2002;23(1):44-8. 170. Natali M, Kenny J, Torre L. Phenolic matrix nanocomposites based on commercial grade resols: Synthesis and characterization. Composites Science and Technology. 2010;70(4):571-7. 171. Wang Z, Pinnavaia TJ. Nanolayer Reinforcement of Elastomeric Polyurethane. Chemistry of Materials. 1998;10(12):3769-71. 172. Berta M, Lindsay C, Pans G, Camino G. Effect of chemical structure on combustion and thermal behaviour of polyurethane elastomer layered silicate nanocomposites. Polymer Degradation and Stability. 2006;91(5):1179-91.
162 | P a g e
173. Xu R, Manias E, Snyder AJ, Runt J. New Biomedical Poly(urethane urea)−Layered Silicate Nanocomposites. Macromolecules. 2000;34(2):337-9. 174. Subramani S, Lee J-Y, Kim JH, Cheong IW. Crosslinked aqueous dispersion of silylated poly (urethane–urea)/clay nanocomposites. Composites Science and technology. 2007;67(7):1561-73. 175. Magaraphan R, Lilayuthalert W, Sirivat A, Schwank JW. Preparation, structure, properties and thermal behavior of rigid-rod polyimide/montmorillonite nanocomposites. Composites Science and Technology. 2001;61(9):1253-64. 176. Delozier DM, Orwoll RA, Cahoon JF, Ladislaw JS, Smith Jr JG, Connell JW. Polyimide nanocomposites prepared from high-temperature, reduced charge organoclays. Polymer. 2003;44(8):2231-41. 177. Liang Z-M, Yin J, Xu H-J. Polyimide/montmorillonite nanocomposites based on thermally stable, rigid-rod aromatic amine modifiers. Polymer. 2003;44(5):1391-9. 178. Park C, Smith Jr JG, Connell JW, Lowther SE, Working DC, Siochi EJ. Polyimide/silica hybrid-clay nanocomposites. Polymer. 2005;46(23):9694-701. 179. Kim J, Ahmed R, Lee SJ. Synthesis and linear viscoelastic behavior of poly(amic acid)–organoclay hybrid. Journal of Applied Polymer Science. 2001;80(4):592-603. 180. Lee T, Park SS, Jung Y, Han S, Han D, Kim I, et al. Preparation and characterization of polyimide/mesoporous silica hybrid nanocomposites based on water-soluble poly (amic acid) ammonium salt. European Polymer Journal. 2009;45(1):19-29. 181. Sur GS, Sun HL, Lyu SG, Mark JE. Synthesis, structure, mechanical properties, and thermal stability of some polysulfone/organoclay nanocomposites. Polymer. 2001;42(24):9783-9. 182. Mondragón I, Solar L, Nohales A, Vallo CI, Gómez CM. Properties and structure of cyanate ester/polysulfone/organoclay nanocomposites. Polymer. 2006;47(10):3401-9. 183. Kumar S, Sun LL, Caceres S, Li B, Wood W, Perugini A, et al. Dynamic synergy of graphitic nanoplatelets and multi-walled carbon nanotubes in polyetherimide nanocomposites. Nanotechnology. 2010;21(10):105702. 184. Vora RH, Pallathadka PK, Goh SH, Chung T-S, Lim YX, Bang TK. Preparation and
Characterization of 4,4′-Bis(4-aminophenoxy)diphenyl Sulfone Based Fluoropoly(ether-imide)/Organo-Modified Clay Nanocomposites. Macromolecular Materials and Engineering. 2003;288(4):337-56.
185. Vora RH, Vora M. 1, 2′-Bis (4-aminophenoxy) benzene based designed fluoro-poly (ether-imide)/MMT clay nanocomposites: Synthesis and properties for high performance applications. Materials Science and Engineering: B. 2006;132(1):90-102. 186. Motamedi P, Bagheri R. Investigation of the nanostructure and mechanical properties of polypropylene/polyamide 6/layered silicate ternary nanocomposites. Materials & Design. 2010;31(4):1776-84. 187. Sharma SK, Nayak SK. Surface modified clay/polypropylene (PP) nanocomposites: Effect on physico-mechanical, thermal and morphological properties. Polymer Degradation and Stability. 2009;94(1):132-8. 188. Bafna A, Beaucage G, Mirabella F, Mehta S. 3D Hierarchical orientation in polymer-clay nanocomposite films. Polymer. 2003;44(4):1103-15. 189. Chrissopoulou K, Altintzi I, Anastasiadis SH, Giannelis EP, Pitsikalis M, Hadjichristidis N, et al. Controlling the miscibility of polyethylene/layered silicate nanocomposites by altering the polymer/surface interactions. Polymer. 2005;46(26):12440-51. 190. Lee J-H, Jung D, Hong C-E, Rhee KY, Advani SG. Properties of polyethylene-layered silicate nanocomposites prepared by melt intercalation with a PP-g-MA compatibilizer. Composites science and technology. 2005;65(13):1996-2002. 191. Osman MA, Seyfang G, Suter UW. Two-Dimensional Melting of Alkane Monolayers Ionically Bonded to Mica. The Journal of Physical Chemistry B. 2000;104(18):4433-9. 192. Zanetti M, Camino G, Thomann R, Mülhaupt R. Synthesis and thermal behaviour of layered silicate-EVA nanocomposites. Polymer. 2001;42(10):4501-7.
163 | P a g e
193. Valera-Zaragoza M, Ramirez-Vargas E, Medellin-Rodriguez FJ, Huerta-Martinez BM. Thermal stability and flammability properties of heterophasic PP–EP/EVA/organoclay nanocomposites. Polymer degradation and stability. 2006;91(6):1319-25. 194. Gupta RK, Pasanovic-Zujo V, Bhattacharya SN. Shear and extensional rheology of EVA/layered silicate-nanocomposites. Journal of non-newtonian fluid mechanics. 2005;128(2):116-25. 195. Usuki A, Tukigase A, Kato M. Preparation and properties of EPDM-clay hybrids. Polymer. 2002;43(8):2185-9. 196. Ahmadi SJ, Huang Y, Li W. Fabrication and physical properties of EPDM–organoclay nanocomposites. Composites science and technology. 2005;65(7):1069-76. 197. Wanjale SD, Jog JP. Poly(1-butene)/clay nanocomposites: Preparation and properties. Journal of Polymer Science Part B: Polymer Physics. 2003;41(10):1014-21. 198. Causin V, Marega C, Marigo A, Ferrara G, Idiyatullina G, Fantinel F. Morphology, structure and properties of a poly (1-butene)/montmorillonite nanocomposite. Polymer. 2006;47(13):4773-80. 199. Sinha Ray S, Yamada K, Okamoto M, Ueda K. Polylactide-Layered Silicate Nanocomposite: A Novel Biodegradable Material. Nano Letters. 2002;2(10):1093-6. 200. Sinha Ray S, Maiti P, Okamoto M, Yamada K, Ueda K. New Polylactide/Layered Silicate Nanocomposites. 1. Preparation, Characterization, and Properties. Macromolecules. 2002;35(8):3104-10. 201. Pluta M, Paul MA, Alexandre M, Dubois P. Plasticized polylactide/clay
nanocomposites. I. The role of filler content and its surface organo‐modification on the
physico‐chemical properties. Journal of Polymer Science Part B: Polymer Physics. 2006;44(2):299-311. 202. Pluta M, Jeszka JK, Boiteux G. Polylactide/montmorillonite nanocomposites: Structure, dielectric, viscoelastic and thermal properties. European Polymer Journal. 2007;43(7):2819-35. 203. Park SH, Lim ST, Shin TK, Choi HJ, Jhon MS. Viscoelasticity of biodegradable polymer blends of poly(3-hydroxybutyrate) and poly(ethylene oxide). Polymer. 2001;42(13):5737-42. 204. Maiti P, Batt C. Renewable plastics: synthesis and properties of PHB nanocomposites. Polymeric Materials Science and Engineering. 2003;88:58-9. 205. Cabedo L, Plackett D, Gimenez E, Lagaron JM. Studying the degradation of
polyhydroxybutyrate‐co‐valerate during processing with clay‐based nanofillers. Journal of Applied Polymer Science. 2009;112(6):3669-76. 206. Maiti P, Batt CA, Giannelis EP. New biodegradable polyhydroxybutyrate/layered silicate nanocomposites. Biomacromolecules. 2007;8(11):3393-400. 207. Dhakal HN, Zhang ZY, Richardson MOW. Nanoindentation behaviour of layered silicate reinforced unsaturated polyester nanocomposites. Polymer Testing. 2006;25(6):846-52. 208. Haq M, Burgueño R, Mohanty AK, Misra M. Bio-based unsaturated polyester/layered silicate nanocomposites: Characterization and thermo-physical properties. Composites Part A: Applied Science and Manufacturing. 2009;40(4):540-7. 209. Lee S-R, Park H-M, Lim H, Kang T, Li X, Cho W-J, et al. Microstructure, tensile properties, and biodegradability of aliphatic polyester/clay nanocomposites. Polymer. 2002;43(8):2495-500. 210. Lepoittevin B, Pantoustier N, Alexandre M, Calberg C, Jerome R, Dubois P. Polyester layered silicate nanohybrids by controlled grafting polymerization. Journal of Materials Chemistry. 2002;12(12):3528-32. 211. Balabanovich AI, Pospiech D, Korwitz A, Häußler L, Harnisch C. Pyrolysis study of a phosphorus-containing aliphatic–aromatic polyester and its nanocomposites with layered silicates. Polymer Degradation and Stability. 2009;94(3):355-64.
164 | P a g e
212. Ray SS, Bousmina M. Poly (butylene sucinate-< i> co</i>-adipate)/montmorillonite nanocomposites: effect of organic modifier miscibility on structure, properties, and viscoelasticity. Polymer. 2005;46(26):12430-9. 213. Ray SS, Bousmina M, Okamoto K. Structure and Properties of Nanocomposites Based
on Poly (butylene succinate‐co‐adipate) and Organically Modified Montmorillonite. Macromolecular Materials and Engineering. 2005;290(8):759-68. 214. Fornes TD, Yoon PJ, Hunter DL, Keskkula H, Paul DR. Effect of organoclay structure on nylon 6 nanocomposite morphology and properties. Polymer. 2002;43(22):5915-33. 215. Lagaly G. Introduction: from clay mineral-polymer interactions to clay mineral-polymer nanocomposites. Applied Clay Science. 1999;15(1):1-9. 216. Romero RB, Leite CAP, Gonçalves MdC. The effect of the solvent on the morphology of cellulose acetate/montmorillonite nanocomposites. Polymer. 2009;50(1):161-70. 217. Tan H, Han J, Ma G, Xiao M, Nie J. Preparation of highly exfoliated epoxy–clay nanocomposites by sol–gel modification. Polymer Degradation and Stability. 2008;93(2):369-75. 218. Chang J-H, An YU, Sur GS. Poly(lactic acid) nanocomposites with various organoclays. I. Thermomechanical properties, morphology, and gas permeability. Journal of Polymer Science Part B: Polymer Physics. 2003;41(1):94-103. 219. Krikorian V, Pochan DJ. Poly (l-Lactic Acid)/Layered Silicate Nanocomposite: Fabrication, Characterization, and Properties. Chemistry of Materials. 2003;15(22):4317-24. 220. Choi HJ, Kim SG, Hyun YH, Jhon MS. Preparation and Rheological Characteristics of Solvent-Cast Poly(ethylene oxide)/Montmorillonite Nanocomposites. Macromolecular Rapid Communications. 2001;22(5):320-5. 221. Hyun YH, Lim ST, Choi HJ, Jhon MS. Rheology of Poly(ethylene oxide)/Organoclay Nanocomposites. Macromolecules. 2001;34(23):8084-93. 222. Lim SK, Kim JW, Chin I, Kwon YK, Choi HJ. Preparation and Interaction Characteristics of Organically Modified Montmorillonite Nanocomposite with Miscible Polymer Blend of Poly(Ethylene Oxide) and Poly(Methyl Methacrylate). Chemistry of Materials. 2002;14(5):1989-94. 223. Finnigan B, Martin D, Halley P, Truss R, Campbell K. Morphology and properties of thermoplastic polyurethane nanocomposites incorporating hydrophilic layered silicates. Polymer. 2004;45(7):2249-60. 224. Oya A, Kurokawa Y, Yasuda H. Factors controlling mechanical properties of clay mineral/polypropylene nanocomposites. Journal of Materials Science. 2000;35(5):1045-50. 225. Advani SG. Processing and Properties of Nanocomposites. River Edge, NJ, USA: World Scientific; 2006. 226. Gu Z, Song G, Liu W, Wang B, Li J. Preparation and properties of organo-montmorillonite/cis-1,4-polybutadiene rubber nanocomposites by solution intercalation. Applied Clay Science. 2009;45(1–2):50-3. 227. Herrera-Alonso JM, Marand E, Little JC, Cox SS. Transport properties in polyurethane/clay nanocomposites as barrier materials: Effect of processing conditions. Journal of Membrane Science. 2009;337(1–2):208-14. 228. Yano K, Usuki A, Okada A, Kurauchi T, Kamigaito O. Synthesis and properties of polyimide–clay hybrid. Journal of Polymer Science Part A: Polymer Chemistry. 1993;31(10):2493-8. 229. Strawhecker KE, Manias E. Structure and Properties of Poly(vinyl alcohol)/Na+ Montmorillonite Nanocomposites. Chemistry of Materials. 2000;12(10):2943-9. 230. Solomon MJ, Almusallam AS, Seefeldt KF, Somwangthanaroj A, Varadan P. Rheology of Polypropylene/Clay Hybrid Materials. Macromolecules. 2001;34(6):1864-72. 231. Tasdelen MA, Kreutzer J, Yagci Y. In situ synthesis of polymer/clay nanocomposites by living and controlled/living polymerization. Macromolecular Chemistry and Physics. 2010;211(3):279-85.
165 | P a g e
232. Oral A, Tasdelen MA, Demirel AL, Yagci Y. Poly (methyl methacrylate)/clay nanocomposites by photoinitiated free radical polymerization using intercalated monomer. Polymer. 2009;50(16):3905-10. 233. Peng H, Tjiu WC, Shen L, Huang S, He C, Liu T. Preparation and mechanical properties of exfoliated CoAl layered double hydroxide (LDH)/polyamide 6 nanocomposites by in situ polymerization. Composites Science and Technology. 2009;69(7–8):991-6. 234. Reichert P, Kressler J, Thomann R, Müllhaupt R, Stöppelmann G. Nanocomposites based on a synthetic layer silicate and polyamide-12. Acta Polymerica. 1998;49(2-3):116-23. 235. Patra SK, Prusty G, Swain SK. Ultrasound assisted synthesis of PMMA/clay nanocomposites: Study of oxygen permeation and flame retardant properties. Bulletin of Materials Science. 2012;35(1):27-32. 236. Greesh N, Hartmann PC, Cloete V, Sanderson RD. Impact of the clay organic modifier on the morphology of polymer–clay nanocomposites prepared by in situ free-radical polymerization in emulsion. Journal of Polymer Science Part A: Polymer Chemistry. 2008;46(11):3619-28. 237. Wu F, Yang G. Poly(butylene terephthalate)/organoclay nanocomposites prepared by in-situ bulk polymerization with cyclic poly(butylene terephthalate). Materials Letters. 2009;63(20):1686-8. 238. Tasdelen MA. Poly(epsilon-caprolactone)/clay nanocomposites via “click” chemistry. European Polymer Journal. 2011;47(5):937-41. 239. Sun T, Garcés JM. High-Performance Polypropylene–Clay Nanocomposites by In-situ Polymerization with Metallocene/Clay Catalysts. Advanced Materials. 2002;14(2):128-30. 240. Baniasadi H, Ramazani S.A A, Javan Nikkhah S. Investigation of in situ prepared polypropylene/clay nanocomposites properties and comparing to melt blending method. Materials & Design. 2010;31(1):76-84. 241. Qin X, Wu Y, Wang K, Tan H, Nie J. In-situ synthesis of exfoliated nanocomposites by photopolymerization using a novel montmorillonite-anchored initiator. Applied Clay Science. 2009;45(3):133-8. 242. Oral A, Tasdelen MA, Demirel AL, Yagci Y. Poly(cyclohexene oxide)/clay nanocomposites by photoinitiated cationic polymerization via activated monomer mechanism. Journal of Polymer Science Part A: Polymer Chemistry. 2009;47(20):5328-35. 243. Katoch S, Kundu PP. Thermal and mechanical behavior of unsaturated polyester [derived from poly(ethylene terephthalate) waste] and montmorillonite-filled nanocomposites synthesized by in situ polymerization. Journal of Applied Polymer Science. 2011;122(4):2731-40. 244. Agag T, Akelah A, Abdelwahab M, Takeichi T, Muto H. Vinylester resin-clay hybrids using various intercalating agents. Journal of Applied Polymer Science. 2010;115(4):2060-8. 245. S. Bergman J, W. Coates G, Chen H, P. Giannelis E, G. Thomas M. Synthesis and characterization of polyolefin-silicate nanocomposites: a catalyst intercalation and in situ polymerization approach[dagger]. Chemical Communications. 1999(21):2179-80. 246. Heinemann J, Reichert P, Thomann R, Mülhaupt R. Polyolefin nanocomposites formed by melt compounding and transition metal catalyzed ethene homo- and copolymerization in the presence of layered silicates. Macromolecular Rapid Communications. 1999;20(8):423-30. 247. Messersmith PB, Giannelis EP. Synthesis and Characterization of Layered Silicate-Epoxy Nanocomposites. Chemistry of Materials. 1994;6(10):1719-25. 248. Lan T, Kaviratna PD, Pinnavaia TJ, editors. Synthesis characterization and mechanical properties of epoxy-clay nanocomposites. Polymeric Materials Science and Engineering Fall Meeting 1994; 1994. 249. Lan T, Kaviratna PD, Pinnavaia TJ. Mechanism of Clay Tactoid Exfoliation in Epoxy-Clay Nanocomposites. Chemistry of Materials. 1995;7(11):2144-50. 250. Zilg C, Mülhaupt R, Finter J. Morphology and toughness/stiffness balance of nanocomposites based upon anhydride-cured epoxy resins and layered silicates. Macromolecular Chemistry and Physics. 1999;200(3):661-70.
166 | P a g e
251. Lan T, Pinnavaia TJ. Clay-Reinforced Epoxy Nanocomposites. Chemistry of Materials. 1994;6(12):2216-9. 252. Becker O, Varley R, Simon G. Morphology, thermal relaxations and mechanical properties of layered silicate nanocomposites based upon high-functionality epoxy resins. Polymer. 2002;43(16):4365-73. 253. Kornmann X, Berglund LA, Sterte J, Giannelis EP. Nanocomposites based on montmorillonite and unsaturated polyester. Polymer Engineering & Science. 1998;38(8):1351-8. 254. Messersmith PB, Giannelis EP. Synthesis and barrier properties of poly(ε-caprolactone)-layered silicate nanocomposites. Journal of Polymer Science Part A: Polymer Chemistry. 1995;33(7):1047-57. 255. Shah AP, Gupta RK, Gangarao HVS, Powell CE. Moisture diffusion through vinyl ester nanocomposites made with montmorillonite clay. Polymer Engineering & Science. 2002;42(9):1852-63. 256. Le Pluart L, Duchet J, Sautereau H. Epoxy/montmorillonite nanocomposites: influence of organophilic treatment on reactivity, morphology and fracture properties. Polymer. 2005;46(26):12267-78. 257. Sepehr M, Utracki LA, Zheng X, Wilkie CA. Polystyrenes with macro-intercalated organoclay. Part I. Compounding and characterization. Polymer. 2005;46(25):11557-68. 258. Liu X, Wu Q. Polyamide 66/Clay Nanocomposites via Melt Intercalation. Macromolecular Materials and Engineering. 2002;287(3):180-6. 259. Balazs AC, Singh C, Zhulina E. Modeling the Interactions between Polymers and Clay Surfaces through Self-Consistent Field Theory. Macromolecules. 1998;31(23):8370-81. 260. Barick AK, Tripathy DK. Thermal and dynamic mechanical characterization of thermoplastic polyurethane/organoclay nanocomposites prepared by melt compounding. Materials Science and Engineering: A. 2010;527(3):812-23. 261. Fukushima K, Murariu M, Camino G, Dubois P. Effect of expanded graphite/layered-silicate clay on thermal, mechanical and fire retardant properties of poly(lactic acid). Polymer Degradation and Stability. 2010;95(6):1063-76. 262. Dominkovics Z, Hári J, Fekete E, Pukánszky B. Thermo-oxidative stability of polypropylene/layered silicate nanocomposites. Polymer Degradation and Stability. 2011;96(4):581-7. 263. González-Vidal N, Muñoz-Guerra S, Martínez de Ilarduya A, Benali S, Peeterbroeck S, Dubois P. Poly(hexamethylene terephthalate)–layered silicate nanocomposites. European Polymer Journal. 2010;46(2):156-64. 264. Hasegawa N, Okamoto H, Kato M, Usuki A, Sato N. Nylon 6/Na-montmorillonite nanocomposites prepared by compounding Nylon 6 with Na-montmorillonite slurry. Polymer. 2003;44(10):2933-7. 265. Zheng X, Jiang DD, Wilkie CA. Polystyrene nanocomposites based on an oligomerically-modified clay containing maleic anhydride. Polymer Degradation and Stability. 2006;91(1):108-13. 266. Kotek J, Kelnar I, Studenovský M, Baldrian J. Chlorosulfonated polypropylene: preparation and its application as a coupling agent in polypropylene–clay nanocomposites. Polymer. 2005;46(13):4876-81. 267. Kim Y, White JL. Melt-intercalation nanocomposites with chlorinated polymers. Journal of Applied Polymer Science. 2003;90(6):1581-8. 268. Hong SI, Rhim JW. Preparation and properties of melt-intercalated linear low density polyethylene/clay nanocomposite films prepared by blow extrusion. LWT-Food Science and Technology. 2012. 269. Wen B, Xu X, Gao X, Ding Y, Wang F, Zhang S, et al. Highly exfoliated poly (ethylene terephthalate)/clay nanocomposites via melt compounding: Effects of silane grafting. Polymer-Plastics Technology and Engineering. 2011;50(4):362-71.
167 | P a g e
270. As’ habi L, Jafari SH, Khonakdar HA, Baghaei B. Morphological, rheological and thermal studies in melt processed compatibilized PA6/ABS/clay nanocomposites. Journal of Polymer Research. 2011;18(2):197-205. 271. Arora A, Choudhary V, Sharma DK. Effect of clay content and clay/surfactant on the mechanical, thermal and barrier properties of polystyrene/organoclay nanocomposites. Journal of Polymer Research. 2011;18(4):843-57. 272. Reichert P, Nitz H, Klinke S, Brandsch R, Thomann R, Mülhaupt R. Poly(propylene)/organoclay nanocomposite formation: Influence of compatibilizer functionality and organoclay modification. Macromolecular Materials and Engineering. 2000;275(1):8-17. 273. Kato M, Matsushita M, Fukumori K. Development of a new production method for a polypropylene-clay nanocomposite. Polymer Engineering & Science. 2004;44(7):1205-11. 274. Fornes TD, Yoon PJ, Keskkula H, Paul DR. Nylon 6 nanocomposites: the effect of matrix molecular weight. Polymer. 2001;42(25):09929-40. 275. Cho JW, Paul DR. Nylon 6 nanocomposites by melt compounding. Polymer. 2001;42(3):1083-94. 276. Velmurugan R, Mohan TP. Epoxy-clay nanocomposites and hybrids: Synthesis and characterization. Journal of Reinforced Plastics and Composites. 2009;28(1):17-37. 277. Fornes TD, Paul DR. Modeling properties of nylon 6/clay nanocomposites using composite theories. Polymer. 2003;44(17):4993-5013. 278. González-Vidal N, Muñoz-Guerra S, Martínez de Ilarduya A, Benali S, Peeterbroeck S, Dubois P. Poly (hexamethylene terephthalate)–layered silicate nanocomposites. European Polymer Journal. 2010;46(2):156-64. 279. Peeterbroeck S, Alexandre M, Jérôme R, Dubois P. Poly(ethylene-co-vinyl acetate)/clay nanocomposites: effect of clay nature andorganic modifiers on morphology, mechanical and thermal prop-erties. Polymer Degradation and Stability. 2005;90(2):288-94. 280. Miller JA, Lin SB, Hwang KKS, Wu KS, Gibson PE, Cooper SL. Properties of polyether-polyurethane block copolymers: effects of hard segment length distribution. Macromolecules. 1985;18(1):32-44. 281. Unnikrishnan L, Mohanty S, Nayak SK, Ali A. Preparation and characterization of poly (methyl methacrylate)–clay nanocomposites via melt intercalation: Effect of organoclay on thermal, mechanical and flammability properties. Materials Science and Engineering: A. 2011;528(12):3943-51. 282. Chen H, Lu H, Zhou Y, Zheng M, Ke C, Zeng D. Study on thermal properties of polyurethane nanocomposites based on organo-sepiolite. Polymer Degradation and Stability. 2012;97(3):242-7. 283. Shelley JS, Mather PT, DeVries KL. Reinforcement and environmental degradation of nylon-6/clay nanocomposites. Polymer. 2001;42(13):5849-58. 284. Yao KJ, Song M, Hourston DJ, Luo DZ. Polymer/layered clay nanocomposites: 2 polyurethane nanocomposites. Polymer. 2002;43(3):1017-20. 285. Zhao C, Qin H, Gong F, Feng M, Zhang S, Yang M. Mechanical, thermal and flammability properties of polyethylene/clay nanocomposites. Polymer Degradation and Stability. 2005;87(1):183-9. 286. Bashar M, Sundararaj U, Mertiny P. Microstructure and mechanical properties of epoxy hybrid nanocomposites modified with acrylic tri-block-copolymer and layered-silicate nanoclay. Composites Part A: Applied Science and Manufacturing. 2012(0). 287. Chan M-l, Lau K-t, Wong T-t, Ho M-p, Hui D. Mechanism of reinforcement in a nanoclay/polymer composite. Composites Part B: Engineering. 2011;42(6):1708-12. 288. Kiliaris P, Papaspyrides CD, Xalter R, Pfaendner R. Study on the properties of polyamide 6 blended with melamine polyphosphate and layered silicates. Polymer Degradation and Stability. 2012(0).
168 | P a g e
289. Li X, Zhan Z-J, Peng G-R, Wang W-K. Nano-disassembling method—A new method for preparing completely exfoliated epoxy/clay nanocomposites. Applied Clay Science. 2012;55(0):168-72. 290. Xidas PI, Triantafyllidis KS. Effect of the type of alkylammonium ion clay modifier on the structure and thermal/mechanical properties of glassy and rubbery epoxy–clay nanocomposites. European Polymer Journal. 2010;46(3):404-17. 291. Shi Y, Kashiwagi T, Walters RN, Gilman JW, Lyon RE, Sogah DY. Ethylene vinyl acetate/layered silicate nanocomposites prepared by a surfactant-free method: Enhanced flame retardant and mechanical properties. Polymer. 2009;50(15):3478-87. 292. Swain SK, Isayev AI. Effect of ultrasound on HDPE/clay nanocomposites: rheology, structure and properties. Polymer. 2007;48(1):281-9. 293. Lapshin S, Swain SK, Isayev AI. Ultrasound aided extrusion process for preparation of polyolefin–clay nanocomposites. Polymer Engineering & Science. 2008;48(8):1584-91. 294. Lapshin S, Isayev AI. Continuous process for melt intercalation of PP–clay nanocomposites with aid of power ultrasound. Journal of Vinyl and Additive Technology. 2006;12(2):78-82.
295. Lapshin S, Isayev AI. Ultrasound‐aided extrusion process for preparation of polypropylene–clay nanocomposites. Journal of Vinyl and Additive Technology. 2007;13(1):40-5. 296. Tortora M, Vittoria V, Galli G, Ritrovati S, Chiellini E. Transport Properties of Modified Montmorillonite-Poly(ε-caprolactone) Nanocomposites. Macromolecular Materials and Engineering. 2002;287(4):243-9. 297. Kojima Y, Usuki A, Kawasumi M, Okada A, Kurauchi T, Kamigaito O. Sorption of water in nylon 6-clay hybrid. Journal of Applied Polymer Science. 1993;49(7):1259-64. 298. González A, Dasari A, Herrero B, Plancher E, Santarén J, Esteban A, et al. Fire retardancy behavior of PLA based nanocomposites. Polymer Degradation and Stability. 2012;97(3):248-56. 299. Hasegawa N, Kawasumi M, Kato M, Usuki A, Okada A. Preparation and mechanical properties of polypropylene-clay hybrids using a maleic anhydride-modified polypropylene oligomer. Journal of Applied Polymer Science. 1998;67(1):87-92. 300. Ganß M, Satapathy BK, Thunga M, Staudinger U, Weidisch R, Jehnichen D, et al. Morphology and mechanical response of S–B star block copolymer< i>–</i> Layered silicate nanocomposites. European Polymer Journal. 2009;45(9):2549-63. 301. Majdzadeh-Ardakani K, Nazari B. Improving the mechanical properties of thermoplastic starch/poly (vinyl alcohol)/clay nanocomposites. Composites Science and Technology. 2010;70(10):1557-63. 302. Phang IY, Liu T, Mohamed A, Pramoda KP, Chen L, Shen L, et al. Morphology, thermal and mechanical properties of nylon 12/organoclay nanocomposites prepared by melt compounding. Polymer International. 2005;54(2):456-64. 303. Soundararajah QY, Karunaratne BSB, Rajapakse RMG. Montmorillonite polyaniline nanocomposites: Preparation, characterization and investigation of mechanical properties. Materials Chemistry and Physics. 2009;113(2–3):850-5. 304. Lai SM, Chen WC, Zhu XS. Melt mixed compatibilized polypropylene/clay nanocomposites: Part 1 – the effect of compatibilizers on optical transmittance and mechanical properties. Composites Part A: Applied Science and Manufacturing. 2009;40(6–7):754-65. 305. Lipinska M, Hutchinson JM. Elastomeric epoxy nanocomposites: Nanostructure and properties. Composites Science and Technology. 2012;72(5):640-6. 306. Hotta S, Paul DR. Nanocomposites formed from linear low density polyethylene and organoclays. Polymer. 2004;45(22):7639-54. 307. Xiong J, Liu Y, Yang X, Wang X. Thermal and mechanical properties of polyurethane/montmorillonite nanocomposites based on a novel reactive modifier. Polymer Degradation and Stability. 2004;86(3):549-55.
169 | P a g e
308. Gopakumar TG, Lee JA, Kontopoulou M, Parent JS. Influence of clay exfoliation on the physical properties of montmorillonite/polyethylene composites. Polymer. 2002;43(20):5483-91. 309. Chieruzzi M, Miliozzi A, Kenny JM. Effects of the nanoparticles on the thermal expansion and mechanical properties of unsaturated polyester/clay nanocomposites. Composites Part A: Applied Science and Manufacturing. 2012. 310. Goettler L. Overview of property development in layered sil-icate polymer nanocomposites. Ann Tech Confr Soc Plast Eng. 2005:1980-2. 311. Bharadwaj RK, Mehrabi AR, Hamilton C, Trujillo C, Murga M, Fan R, et al. Structure–property relationships in cross-linked polyester–clay nanocomposites. Polymer. 2002;43(13):3699-705. 312. Alamri H, Low IM. Effect of water absorption on the mechanical properties of nano-filler reinforced epoxy nanocomposites. Materials & Design. 2012;42(0):214-22. 313. Morawiec J, Pawlak A, Slouf M, Galeski A, Piorkowska E, Krasnikowa N. Preparation and properties of compatibilized LDPE/organo-modified montmorillonite nanocomposites. European Polymer Journal. 2005;41(5):1115-22. 314. Hwang S-s, Liu S-p, Hsu PP, Yeh J-m, Yang J-p, Chen C-l. Morphology, mechanical, and rheological behavior of microcellular injection molded EVA–clay nanocomposites. International Communications in Heat and Mass Transfer. 2012;39(3):383-9. 315. Liu X, Wu Q. PP/clay nanocomposites prepared by grafting-melt intercalation. Polymer. 2001;42(25):10013-9. 316. Liu L, Qi Z, Zhu X. Studies on nylon 6/clay nanocomposites by melt-intercalation process. Journal of Applied Polymer Science. 1999;71(7):1133-8. 317. Pramanik M, Srivastava S, Samantaray B, Bhowmick A. EVA/clay nanocomposite by solution blending: Effect of aluminosilicate layers on mechanical and thermal properties. Macromolecular Research. 2003;11(4):260-6. 318. Shokuhfar A, Zare-Shahabadi A, Atai A-A, Ebrahimi-Nejad S, Termeh M. Predictive modeling of creep in polymer/layered silicate nanocomposites. Polymer Testing. 2012;31(2):345-54. 319. Aldousiri B, Dhakal HN, Onuh S, Zhang ZY, Bennett N. Nanoindentation behaviour of layered silicate filled spent polyamide-12 nanocomposites. Polymer Testing. 2011;30(6):688-92. 320. Hu Y, Shen L, Yang H, Wang M, Liu T, Liang T, et al. Nanoindentation studies on Nylon 11/clay nanocomposites. Polymer Testing. 2006;25(4):492-7. 321. Shen L, Phang IY, Liu T, Zeng K. Nanoindentation and morphological studies on nylon 66/organoclay nanocomposites. II. Effect of strain rate. Polymer. 2004;45(24):8221-9. 322. Shen L, Tjiu WC, Liu T. Nanoindentation and morphological studies on injection-molded nylon-6 nanocomposites. Polymer. 2005;46(25):11969-77. 323. Fukushima K, Tabuani D, Camino G. Poly(lactic acid)/clay nanocomposites: effect of nature and content of clay on morphology, thermal and thermo-mechanical properties. Materials Science and Engineering: C. (0). 324. Siliani M, López-Manchado MA, Valentín JL, Arroyo M, Marcos A, Khayet M, et al. Millable Polyurethane/Organoclay Nanocomposites: Preparation, Characterization, and Properties. Journal of Nanoscience and Nanotechnology. 2007;7(2):634-40. 325. Noh MW, Lee DC. Synthesis and characterization of PS-clay nanocomposite by emulsion polymerization. Polymer Bulletin. 1999;42(5):619-26. 326. Nam PH, Maiti P, Okamoto M, Kotaka T, Hasegawa N, Usuki A. A hierarchical structure and properties of intercalated polypropylene/clay nanocomposites. Polymer. 2001;42(23):9633-40. 327. Ahmadi SJ, G’Sell C, Huang Y, Ren N, Mohaddespour A, Hiver JM. Mechanical properties of NBR/clay nanocomposites by using a novel testing system. Composites Science and Technology. 2009;69(15):2566-72.
170 | P a g e
328. Manias E. Origins of the materials properties enhancements in polymer/clay nanocomposites. Nanocomposites. 2001. 329. Sinha Ray S, Yamada K, Okamoto M, Ogami A, Ueda K. New Polylactide/Layered Silicate Nanocomposites. 3. High-Performance Biodegradable Materials. Chemistry of Materials. 2003;15(7):1456-65. 330. Sinha Ray S, Bousmina M. Biodegradable polymers and their layered silicate nanocomposites: In greening the 21st century materials world. Progress in Materials Science. 2005;50(8):962-1079. 331. Nielsen L. Models for the permeability of filled polymer systems. J Macromol Sci. 1967;A1:929-42. 332. Cussler EL, Hughes SE, Ward Iii WJ, Aris R. Barrier membranes. Journal of Membrane Science. 1988;38(2):161-74. 333. Petrovicova E, Knight R, Schadler LS, Twardowski TE. Nylon 11/silica nanocomposite coatings applied by the HVOF process. II. Mechanical and barrier properties. Journal of Applied Polymer Science. 2000;78(13):2272-89. 334. Mitsuhiro F, Satoru K. Molecular-dynamics simulation of moisture diffusion in polyethylene beyond 10 ns duration. J Chem Phys. 1997;107(6):2149-60. 335. Swain SK, Isayev AI. PA6/clay nanocomposites by continuous sonication process. Journal of Applied Polymer Science. 2009;114(4):2378-87. 336. Swain SK, Priyadarshini PP, Patra SK. Soy Protein/Clay Bionanocomposites as Ideal Packaging Materials. Polymer-Plastics Technology and Engineering. 2012;51(12):1282-7. 337. Campbell SG, Johnston C. Polymer/Silicate Nanocomposites Used to Manufacture Gas Storage Tanks With Reduced Permeability. NASA Glenn’s Research and Technology reports, 2004. 338. Mittal V. Epoxy—Vermiculite Nanocomposites as Gas Permeation Barrier. Journal of Composite Materials. 2008;42(26):2829-39. 339. Kim J-K, Hu C, Woo RSC, Sham M-L. Moisture barrier characteristics of organoclay–epoxy nanocomposites. Composites Science and Technology. 2005;65(5):805-13. 340. Herrera-Alonso JM, Sedláková Z, Marand E. Gas transport properties of polyacrylate/clay nanocomposites prepared via emulsion polymerization. Journal of Membrane Science. 2010;363(1–2):48-56. 341. Herrera-Alonso JM, Sedlakova Z, Marand E. Gas barrier properties of nanocomposites based on in situ polymerized poly(n-butyl methacrylate) in the presence of surface modified montmorillonite. Journal of Membrane Science. 2010;349(1–2):251-7. 342. Jawahar P, Gnanamoorthy R, Balasubramanian M. Tribological behaviour of clay – thermoset polyester nanocomposites. Wear. 2006;261(7–8):835-40. 343. Liu W, Hoa SV, Pugh M. Fracture toughness and water uptake of high-performance epoxy/nanoclay nanocomposites. Composites Science and Technology. 2005;65(15–16):2364-73. 344. Ogasawara T, Ishida Y, Ishikawa T, Aoki T, Ogura T. Helium gas permeability of montmorillonite/epoxy nanocomposites. Composites Part A: Applied Science and Manufacturing. 2006;37(12):2236-40. 345. Bagherzadeh MR, Mahdavi F. Preparation of epoxy–clay nanocomposite and investigation on its anti-corrosive behavior in epoxy coating. Progress in Organic Coatings. 2007;60(2):117-20. 346. Ke Z, Yongping B. Improve the gas barrier property of PET film with montmorillonite by in situ interlayer polymerization. Materials Letters. 2005;59(27):3348-51. 347. Becker O, Varley RJ, Simon GP. Thermal stability and water uptake of high performance epoxy layered silicate nanocomposites. European Polymer Journal. 2004;40(1):187-95. 348. Osman MA, Mittal V, Lusti HR. The Aspect Ratio and Gas Permeation in Polymer-Layered Silicate Nanocomposites. Macromolecular Rapid Communications. 2004;25(12):1145-9.
171 | P a g e
349. Camino G, Sgobbi R, Zaopo A, Colombier S, Scelza C. Investigation of flame retardancy in EVA. Fire and Materials. 2000;24(2):85-90. 350. Zhu J, Uhl FM, Morgan AB, Wilkie CA. Studies on the Mechanism by Which the Formation of Nanocomposites Enhances Thermal Stability†. Chemistry of Materials. 2001;13(12):4649-54. 351. Lakshmi MS, Narmadha B, Reddy BSR. Enhanced thermal stability and structural characteristics of different MMT-Clay/epoxy-nanocomposite materials. Polymer Degradation and Stability. 2008;93(1):201-13. 352. Kaya E, Tanoğlu M, Okur S. Layered clay/epoxy nanocomposites: Thermomechanical, flame retardancy, and optical properties. Journal of Applied Polymer Science. 2008;109(2):834-40. 353. Frost RL, Ding Z. Controlled rate thermal analysis and differential scanning calorimetry of sepiolites and palygorskites. Thermochimica Acta. 2003;397(1–2):119-28. 354. Naguib HF, Abdel Aziz MS, Sherif SM, Saad GR. Thermal properties of biodegradable poly(PHB/PCL-PEG-PCL) urethanes nanocomposites using clay/poly(ε-caprolactone) nanohybrid based masterbatch. Applied Clay Science. 2012;57(0):55-63. 355. Vyazovkin S, Dranca I, Fan X, Advincula R. Kinetics of the Thermal and Thermo-Oxidative Degradation of a Polystyrene–Clay Nanocomposite. Macromolecular Rapid Communications. 2004;25(3):498-503. 356. Zanetti M, Bracco P, Costa L. Thermal degradation behaviour of PE/clay nanocomposites. Polymer Degradation and Stability. 2004;85(1):657-65. 357. Bandyopadhyay S, Chen R, Giannelis E. Biodegradable organic inorganic hybrids based on poly(L-lactic acid). J Macromol Sci Rev. 1999;81:159-60. 358. Thellen C, Orroth C, Froio D, Ziegler D, Lucciarini J, Farrell R, et al. Influence of montmorillonite layered silicate on plasticized poly(l-lactide) blown films. Polymer. 2005;46(25):11716-27. 359. Lepoittevin B, Pantoustier N, Devalckenaere M, Alexandre M, Kubies D, Calberg C, et al. Poly(ε-caprolactone)/Clay Nanocomposites by in-Situ Intercalative Polymerization Catalyzed by Dibutyltin Dimethoxide. Macromolecules. 2002;35(22):8385-90. 360. Zhang K, Wang L, Wang F, Wang G, Li Z. Preparation and characterization of modified-clay-reinforced and toughened epoxy-resin nanocomposites. Journal of Applied Polymer Science. 2004;91(4):2649-52. 361. Dabrowski F, Bourbigot S, Delobel R, Le Bras M. Kinetic modelling of the thermal degradation: of polyamide-6 nanocomposite. European Polymer Journal. 2000;36(2):273-84. 362. Jang BN, Wilkie CA. The effect of clay on the thermal degradation of polyamide 6 in polyamide 6/clay nanocomposites. Polymer. 2005;46(10):3264-74. 363. Davis RD, Gilman JW, VanderHart DL. Processing degradation of polyamide 6/montmorillonite clay nanocomposites and clay organic modifier. Polymer Degradation and Stability. 2003;79(1):111-21. 364. Dutta SK, Bhowmick AK, Mukunda PG, Chaki TK. Thermal degradation studies of electron beam cured ethylene-vinyl acetate copolymer. Polymer Degradation and Stability. 1995;50(1):75-82. 365. Paul M-A, Alexandre M, Degée P, Henrist C, Rulmont A, Dubois P. New nanocomposite materials based on plasticized poly(l-lactide) and organo-modified montmorillonites: thermal and morphological study. Polymer. 2003;44(2):443-50. 366. Wang WS, Chen HS, Wu YW, Tsai TY, Chen-Yang YW. Properties of novel epoxy/clay nanocomposites prepared with a reactive phosphorus-containing organoclay. Polymer. 2008;49(22):4826-36. 367. Ávila AF, Yoshida MI, Carvalho MGR, Dias EC, de Ávila Junior J. An investigation on post-fire behavior of hybrid nanocomposites under bending loads. Composites Part B: Engineering. 2010;41(5):380-7.
172 | P a g e
368. Wu GM, Schartel B, Bahr H, Kleemeier M, Yu D, Hartwig A. Experimental and quantitative assessment of flame retardancy by the shielding effect in layered silicate epoxy nanocomposites. Combustion and Flame. 2012. 369. Tai Q, Yuen RKK, Song L, Hu Y. A novel polymeric flame retardant and exfoliated clay nanocomposites: Preparation and properties. Chemical Engineering Journal. 2012. 370. Szustakiewicz K, Kiersnowski A, Gazioska M, Bujnowicz K, Pigłowski J. Flammability, structure and mechanical properties of PP/OMMT nanocomposites. Polymer Degradation and Stability. 2011;96(3):291-4. 371. Zanetti M, Costa L. Preparation and combustion behaviour of polymer/layered silicate nanocomposites based upon PE and EVA. Polymer. 2004;45(13):4367-73. 372. Duquesne S, Jama C, Le Bras M, Delobel R, Recourt P, Gloaguen JM. Elaboration of EVA–nanoclay systems—characterization, thermal behaviour and fire performance. Composites Science and Technology. 2003;63(8):1141-8. 373. Gilman JW, Kashiwagi T, Giannelis EP, Manias E, Lomakin SM, Lichtenhan JD, et al. Nanocomposites: Radiative Gasification and Vinyl Polymer Flammability. The Royal Society of Chemistry. 1998:203-21. 374. Preston CML, Amarasinghe G, Hopewell JL, Shanks RA, Mathys Z. Evaluation of polar ethylene copolymers as fire retardant nanocomposite matrices. Polymer Degradation and Stability. 2004;84(3):533-44. 375. Kashiwagi T, Harris Jr RH, Zhang X, Briber RM, Cipriano BH, Raghavan SR, et al. Flame retardant mechanism of polyamide 6–clay nanocomposites. Polymer. 2004;45(3):881-91. 376. Schmidt G, Malwitz MM. Properties of polymer–nanoparticle composites. Current Opinion in Colloid & Interface Science. 2003;8(1):103-8. 377. Landry V, Blanchet P, Riedl B. Mechanical and optical properties of clay-based nanocomposites coatings for wood flooring. Progress in Organic Coatings. 2010;67(4):381-8. 378. Franchini E, Galy J, Gérard J-F. Sepiolite-based epoxy nanocomposites: Relation between processing, rheology, and morphology. Journal of Colloid and Interface Science. 2009;329(1):38-47. 379. Schmidt D, Shah D, Giannelis EP. New advances in polymer/layered silicate nanocomposites. Current Opinion in Solid State and Materials Science. 2002;6(3):205-12. 380. Kim JH, Koo CM, Choi YS, Wang KH, Chung IJ. Preparation and characterization of polypropylene/layered silicate nanocomposites using an antioxidant. Polymer. 2004;45(22):7719-27. 381. Liang JZ, Wu CB. Fractal characterization of impact fracture surface of polypropylene nanocomposites. Advances in Polymer Technology. 2012. 382. Zeng Q, Yu A, Lu G, Paul D. Clay-based polymer nanocomposites: Research and commercial development. American Scientific Publishers. 2005;5(10):1533-4880. 383. Paul MA, Delcourt C, Alexandre M, Degée P, Monteverde F, Dubois P. Polylactide/montmorillonite nanocomposites: study of the hydrolytic degradation. Polymer Degradation and Stability. 2005;87(3):535-42. 384. Vilaplana F, Strömberg E, Karlsson S. Environmental and resource aspects of sustainable biocomposites. Polymer Degradation and Stability. 2010;95(11):2147-61. 385. Sancaktar E, Kuznicki J. Nanocomposite adhesives: Mechanical behavior with nanoclay. International Journal of Adhesion and Adhesives. 2011;31(5):286-300. 386. William Gacitua E, Aldo Ballerini A, Zhang J. Polymer nanocomposites: synthetic and natural fillers. 2005;7(3):159-78. 387. Darder M, Colilla M, Ruiz-Hitzky E. Chitosan–clay nanocomposites: application as electrochemical sensors. Applied Clay Science. 2005;28(1–4):199-208. 388. Rajesh, Ahuja T, Kumar D. Recent progress in the development of nano-structured conducting polymers/nanocomposites for sensor applications. Sensors and Actuators B: Chemical. 2009;136(1):275-86.
173 | P a g e
389. Ito M, Sakamoto T, Uehara M, Tsuruta K, Tamura K, Mutoh H, et al. Combustion behavior and application of polyolefin-based floor sheet laminated with Nylon-6/clay nanocomposites film. Fire and Materials. 2011;35(3):171-81. 390. Peters ST. Handbook of composites. 2nd ed. / edited by S.T. Peters. ed. London: Chapman & Hall; 1998. xiv, 1118p. p. 391. Southern Clay Products I. Cloisite® 10A [cited 2011 11]. 12]. Available from: http://www.scprod.com/product_bulletins/PB Cloisite 10A.pdf. 392. matweb. Southern Clay Products Cloisite® 10A Nanoclay 2012 [cited 2011 12]. Available from: http://www.matweb.com/search/datasheettext.aspx?matguid=7db9da09875a4260bde97b33c2793bf8. 393. Institution BS. Glass fibre reinforced plastics — Flexural test — Three point bend method uk1998. 2746:[Available from: http://www.standardsuk.com/products/BS-EN-2746-1998.php. 394. Institution BS. Glass fibre reinforced plastics — Tensile test uk1998. 2747:[Available from: http://www.standardsuk.com/products/BS-EN-2747-1998.php. 395. Arranz-Andrés J, Pérez E, Cerrada ML. Smectic polyester/layered silicate nanostructured hybrids: Effect of modified nanoclay in the phase transitions. Polymer. 2012;53(2):386-94. 396. Ladeveze P. A damage computational approach for composites: Basic aspects and micromechanical relations. Computational Mechanics. 1995;17(1-2):142-50. 397. Jordan J, Jacob KI, Tannenbaum R, Sharaf MA, Jasiuk I. Experimental trends in polymer nanocomposites—a review. Materials Science and Engineering: A. 2005;393(1):1-11. 398. Alamri H, Low IM. Microstructural, mechanical, and thermal characteristics of recycled cellulose fiber-halloysite-epoxy hybrid nanocomposites. Polymer Composites. 2012;33(4):589-600. 399. Mohan TP, Kanny K. Water barrier properties of nanoclay filled sisal fibre reinforced epoxy composites. Composites Part A: Applied Science and Manufacturing. 2011;42(4):385-93. 400. Isik I, Yilmazer U, Bayram G. Impact modified epoxy/montmorillonite nanocomposites: synthesis and characterization. Polymer. 2003;44(20):6371-7. 401. Yasmin A, Luo JJ, Abot JL, Daniel IM. Mechanical and thermal behavior of clay/epoxy nanocomposites. Composites Science and technology. 2006;66(14):2415-22. 402. Abot JL, Yasmin A, Daniel IM, editors. Mechanical and thermoviscoelastic behavior of clay/epoxy nanocomposites. Materials Research Society symposium proceedings; 2003: Cambridge Univ Press. 403. Choi WJ, Kim SH, Jin Kim Y, Kim SC. Synthesis of chain-extended organifier and properties of polyurethane/clay nanocomposites. Polymer. 2004;45(17):6045-57. 404. Ashori A, Nourbakhsh A. Characteristics of wood–fiber plastic composites made of recycled materials. Waste Management. 2009;29(4):1291-5. 405. Avella M, Buzarovska A, Errico M, Gentile G, Grozdanov A. Eco-Challenges of Bio-Based Polymer Composites. Materials. 2009;2(3):911-25. 406. Kodgire P, Kalgaonkar R, Hambir S, Bulakh N, Jog JP. PP/clay nanocomposites: Effect of clay treatment on morphology and dynamic mechanical properties. Journal of Applied Polymer Science. 2001;81(7):1786-92. 407. Kaneko MLQA, Romero RB, de Paiva REF, Felisberti MI, Gonçalves MC, Yoshida IVP. Improvement of toughness in polypropylene nanocomposite with the addition of organoclay/silicone copolymer masterbatch. Polymer Composites. 2013. 408. Wang D, Parlow D, Yao Q, Wilkie CA. PVC-clay nanocomposites: Preparation, thermal and mechanical properties. Journal of Vinyl and Additive Technology. 2001;7(4):203-13. 409. Wetzel B, Haupert F, Friedrich K, Zhang MQ, Rong MZ. Impact and wear resistance of polymer nanocomposites at low filler content. Polymer Engineering & Science. 2002;42(9):1919-27.
174 | P a g e
410. Hartwig G. Fracture Behavior of Polymers. Polymer Properties at Room and Cryogenic Temperatures: Springer; 1994. p. 187-218. 411. Lin J-C, Chang LC, Nien MH, Ho HL. Mechanical behavior of various nanoparticle filled composites at low-velocity impact. Composite Structures. 2006;74(1):30-6. 412. Ganß M, Satapathy BK, Thunga M, Weidisch R, Pötschke P, Janke A. Temperature dependence of creep behavior of PP–MWNT nanocomposites. Macromolecular rapid communications. 2007;28(16):1624-33. 413. Kiliaris P, Papaspyrides CD. Polymer/layered silicate (clay) nanocomposites: An overview of flame retardancy. Progress in Polymer Science. 2010;35(7):902-58. 414. Gong F, Feng M, Zhao C, Zhang S, Yang M. Thermal properties of poly(vinyl chloride)/montmorillonite nanocomposites. Polymer Degradation and Stability. 2004;84(2):289-94. 415. Lee WD, Im SS, Lim H-M, Kim K-J. Preparation and properties of layered double hydroxide/poly(ethylene terephthalate) nanocomposites by direct melt compounding. Polymer. 2006;47(4):1364-71. 416. Liu Y-L, Hsu C-Y, Wei W-L, Jeng R-J. Preparation and thermal properties of epoxy-silica nanocomposites from nanoscale colloidal silica. Polymer. 2003;44(18):5159-67. 417. Lee A, Lichtenhan JD. Thermal and viscoelastic property of epoxy–clay and hybrid inorganic–organic epoxy nanocomposites. Journal of Applied Polymer Science. 1999;73(10):1993-2001. 418. Zhang H, Zhang Z, Friedrich K, Eger C. Property improvements of in situ epoxy nanocomposites with reduced interparticle distance at high nanosilica content. Acta Materialia. 2006;54(7):1833-42. 419. Bakar M, Kostrzewa M, Hausnerová B, Sar K. Preparation and property evaluation of
nanocomposites based on polyurethane‐modified epoxy/montmorillonite systems. Advances in Polymer Technology. 2010;29(4):237-48. 420. Choudhury M, Mohanty S, Nayak SK. Effect of surface modification of aluminum nitride on electrical and thermal characterizations of thermosetting polymeric nanocomposites. Polymer Composites. 2013;34(1):1-14. 421. Ghasemi I, Kord B. Long-term Water Absorption Behaviour of Polypropylene/Wood Flour/Organoclay Hybrid Nanocomposite. Iranian Polymer Journal. 2009;18(9):683-91. 422. Chiou JS, Paul DR. Sorption equilibria and kinetics of ethanol in miscible poly(vinylidene fluoride)/poly(methyl methacrylate) blends. Polymer Engineering & Science. 1986;26(17):1218-27. 423. Alhuthali A, Low IM, Dong C. Characterisation of the water absorption, mechanical and thermal properties of recycled cellulose fibre reinforced vinyl-ester eco-nanocomposites. Composites Part B: Engineering. 2012. 424. Choudalakis G, Gotsis AD. Permeability of polymer/clay nanocomposites: A review. European Polymer Journal. 2009;45(4):967-84. 425. Srinath G, Gnanamoorthy R. Sliding wear performance of polyamide 6–clay nanocomposites in water. Composites Science and Technology. 2007;67(3–4):399-405. 426. Rana HT, Gupta RK, GangaRao HVS, Sridhar LN. Measurement of moisture diffusivity through layered-silicate nanocomposites. AIChE Journal. 2005;51(12):3249-56. 427. Alexandre B, Marais S, Langevin D, Médéric P, Aubry T. Nanocomposite-based polyamide 12/montmorillonite: relationships between structures and transport properties. Desalination. 2006;199(1–3):164-6. 428. Zhu J, Imam A, Crane R, Lozano K, Khabashesku VN, Barrera EV. Processing a glass fiber reinforced vinyl ester composite with nanotube enhancement of interlaminar shear strength. Composites Science and Technology. 2007;67(7–8):1509-17. 429. Rhim J-W. Effect of clay contents on mechanical and water vapor barrier properties of agar-based nanocomposite films. Carbohydrate Polymers. 2011;86(2):691-9. 430. St. Lawrence S, Willett JL, Carriere CJ. Effect of moisture on the tensile properties of poly(hydroxy ester ether). Polymer. 2001;42(13):5643-50.
175 | P a g e
431. Scaffaro R, Tzankova Dintcheva N, La Mantia FP. A new equipment to measure the combined effects of humidity, temperature, mechanical stress and UV exposure on the creep behaviour of polymers. Polymer Testing. 2008;27(1):49-54. 432. Ehrenstein GW. Polymeric materials : structure - properties - applications. Munich: Hanser; 2001. 433. Zhao H, Li RKY. Effect of water absorption on the mechanical and dielectric properties of nano-alumina filled epoxy nanocomposites. Composites Part A: Applied Science and Manufacturing. 2008;39(4):602-11. 434. d’Almeida JRM, de Almeida RC, de Lima WR. Effect of water absorption of the mechanical behavior of fiberglass pipes used for offshore service waters. Composite Structures. 2008;83(2):221-5. 435. Hodzic A, Kim JK, Lowe AE, Stachurski ZH. The effects of water aging on the interphase region and interlaminar fracture toughness in polymer–glass composites. Composites Science and Technology. 2004;64(13–14):2185-95. 436. Rajeesh KR, Gnanamoorthy R, Velmurugan R. Effect of humidity on the indentation hardness and flexural fatigue behavior of polyamide 6 nanocomposite. Materials Science and Engineering: A. 2010;527(12):2826-30. 437. Abacha N, Kubouchi M, Tsuda K, Sakai T. Performance of epoxy-nanocomposite under corrosive environment. eXPRESS Polymer Letters. 2007;1(6):364–9. 438. Buehler FU, Seferis JC. Effect of reinforcement and solvent content on moisture absorption in epoxy composite materials. Composites Part A: Applied Science and Manufacturing. 2000;31(7):741-8. 439. Giannelis EP. Polymer-layered silicate nanocomposites: Synthesis, properties and applications. John Wiley & Sons, Ltd. 1998;12:675-80.
440. Newman BA, Sham TP, Pae KD. A high‐pressure x‐ray study of Nylon 11. Journal of Applied Physics. 1977;48(10):4092-8. 441. Pinnavaia TJ, Beall GW. Polymer-clay nanocomposites. Chichester: John Wiley; 2000. 349 p. 442. Mehrabzadeh M, Burford RP. Impact modification of polyamid 11. Journal of Applied Polymer Science. 1996;61(13):2305-14. 443. Alateyah AI, Dhakal HN, Zhang ZY. Processing, Properties, and Applications of Polymer Nanocomposites Based on Layer Silicates: A Review Advances in Polymer Technology. 2013;32(4). 444. Sinha Ray S, Yamada K, Okamoto M, Ueda K. New polylactide-layered silicate nanocomposites. 2. Concurrent improvements of material properties, biodegradability and melt rheology. Polymer. 2003;44(3):857-66. 445. Chang J-H, An YU, Cho D, Giannelis EP. Poly (lactic acid) nanocomposites: comparison of their properties with montmorillonite and synthetic mica (II). Polymer. 2003;44(13):3715-20. 446. Chang JH, An YU. Nanocomposites of polyurethane with various organoclays: Thermomechanical properties, morphology, and gas permeability*. Journal of Polymer Science Part B: Polymer Physics. 2002;40(7):670-7.

176 | P a g e
Chapter 7. Appendix