“At least one” problem with “some” formal reasoning paradigms
Upload
independentCategory
view
1download
0
CHAPTER ONE
THE PROBLEM AND ITS SCOPE
1.1Background of the Study
Socio-economic Status (SES) depends on a combination of
variables, including occupation, education, income, wealth, and
place of residence. It has been generally observed that people
are not equal in terms of status and achievements (Galobardes et
al., 2007). The existence of many strata in the society is thought
to be natural. It is believed that socio-economic status of the
parents has a great influence on their attitude towards objects
and phenomena of their children. Strohschein, (2005) emphasized
that socio-economic status of a person affects his or her
attitude and life chances (Barrett and Turner, 2005). SES of the
parents was determined by their education, job, income, political
power and prestige in society (Parson et al., 2001). Income was one
of the most commonly used attributes of a household to determine
its class status (Galobardes et al., 2007).
The relationship between incomes, which mostly arises from the
scarcity of a certain skill, however, proves to be more complex
than initially perceived (McLeod and Shanahan, 1996). A family's
socioeconomic status was based on family income, parental
education level, parental occupation, and social status in the
community (Demarest et al, 1993). Families with high socio-economic
status often have more success in preparing their young children
1

for school because they typically have access to a wide range of
resources to promote and support young children's development
(Akanle, 2007). Men and women tend to have different socio-
economic profiles within an economy in terms of the positions
they occupied, the activities they engage in and their overall
economic status (Corwyn and Bradley, 2000). Inequality was
especially in access to a wide range of economic, human and
social capital assets that comprises key poverty dimensions in
Africa (Capraro, 2000).
The World’s total number of vulnerable children does not exist,
yet approximations number of most vulnerable children in the
World is 428 million. Children age 0–17 years. 150 million girls
have experienced sexual abuse, 2 million children live in
institutional care, and 218 million children engage in various
forms of exploitative labor this due to many parents to be low in
socio-economic status (USG, 2009).
In United State of America (U.S.A) more than half (61 percent) of
the children (771,700 children) were victims of neglect, meaning
a parent or guardian failed to provide for the child's basic
needs (World Bank, 2006). U.S. Census Bureau, (2001) reported
that American children remained the poorest population by age
group. Of these approximately 12 million children, one third
lives in extreme poverty in families with incomes below 50% of
the poverty line. The problem of vulnerability in Louisiana was
2
the second highest in the United States (Hoff, 2002) and the
highest in the South at 29% (Bennett & Lu, 2000).
Data from 22 European countries suggest that greater inequality
in household income is positively associated with both self-
reported and measured child overweight prevalence. Moreover,
seven studies from four countries reported on the influence of
socioeconomic factors on the contribute of child vulnerability
over time. Where there is evidence of a widening social gradient
in child vulnerability, it is likely that the changes in
lifestyles and dietary habits involved in the increase in the
prevalence of overweight have had a less vulnerable impact in low
socio-economic status groups than in the rest of the population
(Bennett & Lu, 2000). Decreasing occupational status in Finland,
Belgium and Norway, while for Ireland the highest odds ratio was
found in the middle occupational status category while Hungry low
socio-economic status was found (World Bank, 2007).
In Asia there is high range of socio-economic status of the
parents, meanwhile, the number of vulnerable children among the
courtiers are positively differ. For instance, Bangladesh has one
of the highest rates of child-marriage in the world. 66 per cent
of women (aged 20 to 24) were married before they turned 18. 13
per cent of children are involved in child labor. Child laborers
are frequently denied an education and are vulnerable to violence
and abuse. Bangladesh has one of the lowest rates of birth
registration in the world. This makes it difficult to protect
3
children from trafficking, child labor and child marriage. In
India economic status has been classified as a low-income country
with majority of the population at or below the poverty line
(UNDP, 2009). The total number of vulnerable children in Haiti
was estimated at 1,210,000 or between 20 and 25%, among the
parents more than half have low socio-economic status (USAID,
2010).
In Australia found that there is increase of 50% of children who
need care out of home. Of whom more taken by government and
responsible agencies. There are more children removed from
unsafe homes, given that approximately 25% of Aboriginal children
living in remote communities are under-nourished according to
growth measures.
In sub-Saharan Africa the number of most vulnerable children was
high. This due to accounts for the highest HIV prevalence in the
world combined with structural risk factors, including high
poverty rates, low life expectancy, high infant and child
mortality. Meanwhile, low education levels and low socio-economic
status, of parents/guardians particularly among women and girls
was another factors (World Bank, 2007). Zambia is one of the
worst affected countries in the African continent. The percent of
most vulnerable children was 36.9%.
The 2005 Demographic Health Survey of the Rwandan government
found that 29% of children under the age of 18 surveyed were
4

considered to be vulnerable children (UNICEF, 2008). Uganda has a
total of 2.43 million out of 17.1 million children under age 18
who considered as most vulnerable (Kalibala and Elson, 2009). The
percentage of children considered as most vulnerable in Kenya is
estimated at approximately 60% (USAID, 2010). Kenya’s economic
performance was impressive up to the early 1980s, when it started
declining reaching negative growth rate of -0.3% in 2000. The
economy recovered significantly from a 2.9% growth rate in 2003
to 7.0% in 2007. The economy has slowly recovered to 2.6% and
5.3% in 2009 and 2010 (World Bank, 2010). National absolute
poverty levels in Kenya remain high, although it declined from
52.3% in 1997 to 45.9% in 2005/06. One in five Kenyans has
consumption levels that were inadequate to meet basic food needs
(Kalibala and Elson, 2009).
Tanzania's child population was extremely large, with more than
half of the total population roughly 21 million under the age of
18. Approximately two million were classified as Most Vulnerable
Children (MVC), and 40% were estimated to be orphans as a result
of HIV/AIDS. Nationally, more than a third of MVC live below the
basic needs poverty line (United Republic of Tanzania, 2010). In
Tanzania women experience lower socioeconomic status, with few
exceptions, women have a lower standard of living than do men.
Generally, boys were valued more than girls. Only women descended
from ruling tribal families, successful businesswomen, or women
politicians enjoy privileges equal to that of men (Inshengoma,
2010).
5

Children vulnerability in Unguja and Pemba were mainly due to
poverty, cultural practices and lack of systems to provide care
support and protection of the children. The Home Basic Services
(HBS) show that 49 percent of the Zanzibar cannot meet their
daily basic needs. The situation of Basic Needs Poverty was worst
both in rural and urban areas where the ratios were 54.6 and 40.5
respectively (Mhamba and Hemed, 2008).
1.2 Statement of the Problem
The number of parents who are in low Socio-economic status in
North ‘A’ District continues to increase. In most cases the
parents are poor consequently; meeting the core needs of the
children at the household level remains a challenge. Socio-
economic status and vulnerability to a multitude of other risk
factors is primarily a result of weak human capabilities (Mhamba
and Hemed, 2008). The overall situation of Socio-economic status
and children’s vulnerability is complex and needs to be analyzed
within specific country and local contexts (Gilborn, 2001).
According to the Household Basic Services (HBS) 2004/05, it was
estimated that 49 percent of people in Zanzibar live below the
basic needs poverty line. (Revolutionary Government of Zanzibar,
2008). About 21.4 percent of all households in Zanzibar were
female headed. Poverty among female-headed households was
slightly higher than for male-headed households with 51 and 49
percent respectively. Poverty was related to household size and
6

the vulnerability of the children. The majority of poor
households have a larger number of dependents while the head of
the household has very low or no education at all (RGZ, 2009).
Therefore, the low socio-economic status of parents and the
vulnerability of their children is the driving force of this
study. The shortage of basic needs such as meals, casual clothes,
shelter, health care and educational services for many families
due to extreme poverty is among the reasons that initiated this
study.
Currently there is a number of parents in North ’A’ District who
live below the poverty line without the basic needs. Similarly,
this has caused high number of children to drop out from school
and suffer from malnutrition. Meanwhile, lack of existence
effort from the community to support the parents who have low
socio-economic status and their children has contributed to
increase the problem.
1.3 Purpose of the Study
The purpose of this study was to determine the extent to which
parent’s socio-economic status is related to children
vulnerability. The study was also give highlights on weaknesses
identified and recommended appropriate steps to be taken in the
elimination of the problems from the local to national level.
7

1.4 Research Objectives
i. To examine the Socio-economic Status of the parents in North
‘A’ District Zanzibar.
ii. To determine the level of vulnerability in North ‘A’District Zanzibar.
iii. To establish relationship between parent’s socio-economic
status and children’ vulnerability in North ‘A’ District
Zanzibar.
iv. Recommend the best methods which can help to reduce the
problem of children
vulnerability in the study area.
1.5 Research Questions
i. What are the socio-economic status of the parents in North
‘A’ District Zanzibar?
ii. What is the level of vulnerability in the North ‘A’ District
Zanzibar?
iii. Is there relationship between parent’s socio-economic status
and children vulnerability in North ‘A’ District Zanzibar?
iv. What are the methods can be used to reduce the problem of
vulnerability of children in the North ‘A’ District
Zanzibar?
1.6 Scope
1.6.1 Geographical scope
8
The study was conducted in North ‘A’ District Unguja, Zanzibar.
The district is about 211 square kilometers with three major
physical features; an extensive coral section of the North West,
the plateau and ridge areas of the central, straddled by the
valleys. It lies in the northern part of Ungula Island. It is
bounded by North ‘B’ district to the south and Indian Ocean to
the North, West and East.
1.6.2 Content scope
The research was examine parents’ level of education, nature of
job, family size, educational level of children, capacity of the
family, total income by all sources and nature of accommodation.
Among the key content areas covered in the study area were level
of socio-economic status of parents, occupational, income of the
parents, education of parents and children and children
vulnerability. Significantly, issues such as economic status,
income, and the impact of vulnerability in the study area were
examined.
1.6.3 Theoretical scope
This study was base on stratification theory developed by Karl
Marx and Max Weber (1920) and three classes theory of socio
stratification developed by Marx
and Engels in (1848).
1.7 Significance of the Study
9
The results of the study will be useful tool in establishing
policies, decisions making and strategic plan on the allocation
of resources towards the parents and their children who are below
poverty line and alleviate children vulnerability. Meanwhile, the
study is focused to help the International and Local Non
Governmental Organization (NGOs) which provide services to the
parent and children to improve the situation of socio-economic
status in the study area.
This study will help the Local, Central Government, and Internal
Organizations to know the situation of the socio-economic status
and children vulnerability in the study area and their priority
needs. This will be important for them to cheap in and contribute
to help and increase the S.E.S of people in Zanzibar especially
North ‘A’ District.
1.8 Operational Definitions of Key Terms
Parent/Guardian: The person, adult or child primarily responsible
for providing care, watching over or safeguarding to a child or
negotiating care or support on behalf of a child.
Socio-economic status: Socio-economic Status (SES) is the term
used to distinguish between people’s relative position in the
society in terms of family income, political power, educational
back ground and occupational prestige. OR Socio-economic status
10
refers to the social and economic position occupied by parents in
the society.
Education: Children of school age who ever attended and are
currently attending (by total children and by vulnerable
children) and the status education of parents/Guardians.
Children: A young person of either sex especial one between
infancy and youth; or biologically, a child is generally a human
between the stages of birth and puberty.
Vulnerability: A vulnerable child is defenseless; exposed to
behavior, conditions or circumstances that he or she is powerless
to manage; and is susceptible and accessible to a threatening
parent or caregiver. OR The term vulnerability is defined as “the
characteristics of a person or group and their situation that
influence their capacity to anticipate, cope with, resist and
recover from the impact of a natural hazard” (UNICEF, 2008).
According to this study vulnerability is situation whereby
children lack the basing needs such as food, shelter, casual
clothes, health services, psychosocial support and education.
This may general expose child to a powerless situation
(vulnerable child).
11

CHAPTER TWO
REVIEW OF LITERATURE
2.0 Introduction
This chapter was composed of the theoretical review and reviews
some of the works of different authors that related to this
study. The more consideration in the review was parent’s level of
socio-economic status, parent’s education level, income level of
the parents and occupational prestige. Meanwhile, it examines
children’s vulnerability at different aspects and educational
status of children.
2.1 Concepts, Opinions, Ideas from Authors/ Experts
2.1.1 Socio-economic status of parents
Socio-economic status refers to the social and economic position
occupied by parents in the society (McLeod and Shanahan, 1996).
SES it is a level made up of individuals who deem themselves
equal due to similarities in family background, level of
12

education, occupation, race and attitude towards social issues.
Socio-economic status is usually a measure of the income and
occupation of the individual, irrespective of his or her
educational or social standing (Guo and Harris, 2000).
Exposure to adverse social conditions has been proven to affect
the psychological health of children (McLeod & Shanahan, 1996).
To date, most studies have emphasized that the limited resources
and unequal distribution of wealth in a society act as a
mediating force to increase the risk of psychological effects of
people living within the lower socio-economic groups (Evans,
2004; McLeod & Shanahan, 1993, 1996).
World Vision International, (2005) noted that children with low
socio-economic status and their families were confronted with
severe threats to their well-being including isolation, loss of
income, educational access, shelter, nutrition and other
essential necessities. When families and children were forced to
focus on daily basic needs to decrease their suffering, attention
was diverted from factors that contribute to long-term health and
well-being (Duke, 2000). It was widely recognized that most of
the problems faced by children with low socio-economic status and
households result either directly or indirectly from the economic
impact of AIDS (Currie and Moretti, 2007).
2.1.2 The level of vulnerability of children.
13

UNICEF, (2008) reported that large number of children made
vulnerable by food insecurity, poverty, and high illiteracy
rates. Public health vulnerabilities were further increased by
polygamy and early marriage (Duke, 2000). The loss of parents
through death or desertion was an important aspect of
vulnerability.
The level of vulnerability between children in urban and rural
areas and between families to family was varied. Vulnerable
children in urban areas were significantly higher than in rural
areas (18 percent vs. 14 percent. While the level of
vulnerability tend to be higher in the rural areas (43 percent
moderately vs. 52 percent critically vulnerable (Entwisle, 1994).
Overall levels of vulnerability appear to be highest in the
Northern region, perhaps reflecting the long period of conflict,
combined with the violent cattle-rustling culture of Karamoja.
(Kalibala and Elson, 2009). There is some suggestion that
regional variation in vulnerability may correlate with wealth
distribution. Higher levels of poverty in the conflict-affected
North, and relatively more affluence in the Central region
(Kalibala and Elson, 2009).
Variation rates of vulnerability it shows that rates of
vulnerable children range between 11 percent of children in the
Eastern region and 17 percent of children in the Central region.
Meanwhile, the percentage of children categorized as “moderately”14
vulnerable ranges between 34 percent in the Central region and 54
percent in the North (Kalibala and Elson, 2009).
USAID, (2010) reported that Twenty-six point five percent of all
households were caring for orphans only, 36.7% were caring for
vulnerable children only and 36.9% were caring for both orphans
and vulnerable children. This varies by district with Livingstone
having the most households caring for orphans only (29.3%),
Lusaka caring for vulnerable children more often (42.6%), and
Mongu having the largest percent of households caring for both
orphans and vulnerable children (46.4%).
USAID, (2010) reported that vulnerability was an important policy
area that requires further work due to its causes of various
forms of socio-economic status and poverty. The extremely
vulnerable groups are likely to be members from the following
social groups: children, people with disabilities, individuals
carrying out high-risk jobs, elderly people, youths and women.
2.1.3 Relationship between parent’s socio-economic status and
children’s vulnerability.
Akanle, (2007) said that it is worth to note that the nature and
extent of vulnerability differs among different groups, depending
on the nature and character of impoverishing forces facing them.
For example, while children under 5 years of age are mostly
vulnerable to diseases, malnutrition, and inadequate care, young
15

women faces risks of early pregnancy, neglect, poor ante natal
care, etc.
UNICEF, (2008) reported that large number of children made
vulnerable by food insecurity, poverty, and high illiteracy
rates. Public health vulnerabilities were further increased by
polygamy and early marriage (Duke, 2000). The loss of a parent
through death or desertion was an important aspect of
vulnerability. Additional factors leading to vulnerability
included severe chronic illness of a parent or caregiver,
poverty, hunger, lack of access to services, inadequate clothing
or shelter, overcrowding, deficient caretakers, and factors
specific to the child, including disability, direct experience of
physical or sexual violence, or severe chronic illness (UNICEF,
2008).
Richter et al., (2004) states that the practice of older men
marrying teenage girls also contributes a lot to family
dysfunction. Due to an old age, such a man might not be able to
carefully raise his young children as he should and eventually
become vulnerable. The mother was also too young to have mature
motherly skills to lead the children in the right way, in the
process, these children end up being improperly raised up to know
right from wrong and end up hanging out with wrong people, or
drop out from school (Babbie, 1989).
Among adolescents, low SES is often associated with poor adaptive
functioning, an increased likelihood of depression, and
16

delinquent behavior (McLoyd, 1997). Data from Britain and
California show that low SES children are more likely to have low
birth weight than high SES children. Maternal reports of overall
child health from the U.S., Britain and Canada all show that the
health gap between high and low SES children continues through
early childhood and beyond (USAID, 2010).
Low-SES parents are less likely to purchase reading and learning
materials for their children, less likely to take their children
to educational and cultural events, and less likely to regulate
the amount of TV their children watch. As a result, low-SES
children more frequently experience school failure (even in the
early grades), which moves them on a trajectory of either conduct
problems or withdrawal behaviors (UNAIDS, 1999; Engle, 2008).
McLeod and Shanahan, (1996) reported that when families were
constrained by fewer resources and there were differences in boys
and girls access to resources, children’s livelihood was
consequently affected. Akanle, (2007) states that Parental income
not to be sufficient to sustain the daily life and personal
social life. This to a large extent affects the psychological
balance or homeostatic balance in home and in class room, which
causes low concentration, low perception, frustration, sickness
and emotional disability (Capraro et al., 2000).
It explained that in urban areas, most poor families can hardly
afford the cost of water, resulting in children from poor
17

families being sent on long treks in search of water, often
having to stand in long queues and consequently being late or
absent from school (Bugembe et al., 2005). USAID, (2010) reported
that 32.4% of poor children suffer from a chronic condition,
compared to 26.5% of non-poor children, a gap that would likely
be even larger if differences in diagnosis probabilities were
accounted for. In United State 82% of all households, 16% of
those in the top quintiles, had two income earners the
discrepancy between household and personal income was quite
considerable. In 2005 the top 95% of income earners made $12,500
or more, while 18% of households had incomes over $100,000.
Personal income was largely the result of scarcity (UNICEF,
2008).
Mhamba and Hemed, (2008) noted that Divorce was also another
factor for children entering into vulnerability situation
especially among the disadvantaged families. The problem becomes
even more severe if the divorced wife was a teenager below the
age of 18 year. It was estimated that around 21% and 22% of the
households in rural and urban areas respectively, were female
headed (Bennett and Lu, 2000).
2.1.4 The methods of reducing the vulnerability
Increased community mobilization and capacity building and
partnership between communities and key stakeholders including
government agencies, religious organizations, community leaders,
18

NGOs and other community groups are crucial in the response to
socio-economic needs of orphans, other vulnerable children and
their families (Akanle, 2007).
State-of-the-art microfinance programs have shown good potential
for increasing economic resilience among poor households in
sustainable, cost-effective manner (Mackenbach et al., 2000)
Village banking was perhaps the best known of such programs. One
of the critical elements in the use of these types of
interventions was that they were provided by established
microfinance organizations and geographically overlaps with
programs children with low socio-economic status (Galobardes et
al., 2007).
Psychosocial support helps children deal with grief and
bereavement and with the stigma, discrimination, and maltreatment
they may experience at the hands of foster caregivers and/or
members of the community (UNAIDS, 1999; Engle, 2008). The
psychological needs of these children include love, recognition
and acceptance, protection, being valued, encouragement, comfort,
and participation in important life events (Mhamba and Hemed,
2008).
Education for primary school children about their rights was
conducted by social workers on an annual basis through after-
school MVC clubs. Social workers further educate guardians and
19

community members about children’s rights during caregiver
support groups and community meetings (USAID, 2010).
To promote MVC education in schools, social workers train primary
school teachers in life skills education and encourage them to
lead after-school MVC clubs. These clubs serve as a forum to
disseminate health information, implement group counseling and
facilitate skills development relating to self-esteem and risk
reduction (Ainsworth and Filmer, 2002).
MVC guardians encouraged to participate in caregiver support
groups that provide social support and were often linked to
income generating activities. Guardians were further provided
with general household support during home visits including basic
counseling and help with household chores (Richter et al., 2004).
2.2 Theoretical Perspectives
This research was based on the following theories:-
2.2.1 Stratification theory: This theory was developed by Karl
Marx and Max Weber, (1920). According to Marx, people’s
relationship to the means of production was the sole factor in
determining their social class. They either belong to the
20

bourgeoisie (those who owned the means of production) or the
proletariat (those who work for the owners).
According to Weber, Marx’s typology was too limiting since, in
actuality, social class, as well as people’s social class
standing, consists of three interrelated components: property,
prestige, and power (Alisa and Gregg, 2012).
2.2.2 Three classes Theory” of social stratification: The theory
was developed by Marx and Engels in (1848). According to this
theory society was divided into three classes, the “upper class”,
“middle class” and the “lower class”. The upper class composed of
a relatively few individuals who hold the top most positions in
society; a middle class composed of persons of lesser status but
of relatively comfortable means; and a lower class was of persons
who have a bare existence when measured by the given society
standards (Avison, 2012).
“Three class Theory” of social stratification was very popular.
According to this theory society is divided into three classes,
the “upper class”, “middle class” and the “lower class”. The
upper class composed of a relatively few individuals who hold the
top most positions in society; a middle class composed of persons
of lesser status but of relatively comfortable means; and a lower
class was of persons who have a bare existence when measured by
the given society standards. The chief criticism of this theory
21

was that it does not draw a sharp dividing line between
individuals of different classes in society (Ajakaiye and Mwabu,
2009).
The middle class for instance, may run the whole range from
semiskilled workers to owners of relatively large business
enterprises as well as highly paid professionals. Such criticisms
have led to the five and six class theories of social
stratification. The six class theory holds that the upper class
was divided in to an upper-middle and a lower upper class, and
the middle class was divided in to an upper middle and a lower
middle class and that the lower class was divided in to an upper
lower class and a lower class. The five class theory generally
used to categories people in social classes. These classes were
named as upper class, upper middle class, middle class, lower
middle class and lower class.
2.2.3 Diathesis–stress theory: This theory was developed by
Professor James Potesh (1982).This theory attempts to explain
behavior as a predisposition vulnerability together with stress
from life experiences. The term diathesis derives from the Greek
term for disposition, or vulnerability. However, the diathesis–
stress model was not introduced and utilized to describe the
development of psychopathology until it was used to explain
schizophrenia in the 1960.
22

Vulnerability makes it more or less likely that an individual
will succumb to the development of psychopathology if a certain
stress is encountered. Diatheses are considered inherent within
the individual and are typically conceptualized as being stable,
but not unchangeable, over the lifespan. They are also often
considered latent (i.e. dormant), because they are harder to
recognize unless provoked by stressors.
This theory explain that early life experiences such as the loss
of a parent, lack of psychosocial support, extreme poverty and
lack of education can be conceptualized as situational factors,
such as low socio-economic status or having a parent unwealth
depression as are major factors that leads vulnerability.
2.3 Related Studies
In this section, the researcher sought to know what other
researchers have found out about socio-economic status of
parents, parents level of education, income level and
occupational prestige in relation to children’s vulnerability.
Wilson et al., (2002) stated that access to adequate food and
nutrition was crucial for children’s physiological and emotional
development. According to the children response review carried
out by Tanzania Commission for AIDS (TACAIDS) in February 2004,
23
after education, caregivers and community leaders mentioned food
as the second major problem they face. Children often mention
their need for food before they mention education (UNICEF, 2008).
Kalibala and Elson, (2009) described that a large number of
children made vulnerable by food insecurity, poverty, and high
illiteracy rates. Lack of adequate rainfall and rocky soil
inhibit food production, contributing to high levels of poverty.
Public health vulnerabilities were further increased by polygamy
and early marriage (Bennett and Lu, 2000).
According to Subbarao et al., (2001) observed in Haiti that
children move in and out of various groups of vulnerability as
their life circumstances change. The number of children who were
placed in vulnerable situations, either through employment or
exposure to risky environments, was invariably increased.
According to Ainsworth and Filmer, (2002) in Zambia children from
lower income households were less likely to enroll at school,
regardless of their orphan status. Among children living in low
income households, double orphans were around 15% less likely to
have enrolled at school compared to either single parent orphans
(Thurman et al., 2007).
World Bank, (2006) reported that emotional, physical and sexual
abuse faced by children within the home was one of the main
reasons why children may be removed from family care (by State
authorities) or choose to run away from their family. World
24

Vision International, (2005) state that girls face increased risk
of sexual abuse, whilst boys face increased physical violence 88%
of the children in SOS Children’s villages in Croatia have
suffered physical or sexual abuse within their biological family,
75% in Belarus and 55% of children in Lithuania.
Capraro, (2000) states that the influence of socio-economic
status at the individual level was still prevalent expectations
had a somewhat stronger influence than did the economic
variables. Cultural effects of a race and gender interaction for
African American males among elementary school-aged children were
stronger than socioeconomic status in predicting reading
achievement (Diamond and Onwuegbuzie, 2001). African and American
children (33.1%) are more likely to live in poverty than white
children (13.5%). They were also more likely to have single
parents, and more likely to be welfare dependent (Rector et al.,
2001). African American children were also disproportionately
represented in title schools (Currie and Moretti, 2007). Racial
minority status was more likely to be correlated with lower
teacher qualifications such as certification and years of
experience (Darling-Hammond, 1999).
Duke, (2000) noted that poverty played a significant role in the
print environment and experience of children in first-grade
classrooms in the greater Boston area. Poor classes had less
exposure to and experience with extended text, and less time
engaged in activities in which students had a high degree of25

authorship. The reverse was true of classes with more financial
support (Subbarao, 2001).
Akanle, (2007) reported that identified Parental income in work
to be a cogent factor upon which the academic/vocational
successes of secondary school students lie. Parental income not
to be sufficient to sustain the academic and personal social life
of the student in sub rural school areas. To a large extent
affects the psychological balance or homeostatic balance in the
class room. This situation reported to causes low concentration,
low perception, frustration, sickness and emotional disability in
academic performance of the students (Diamond and Onwuegbuzie,
2001).
Therefore when a child is deprived of the essential needs he may
be found to perform poorly in his school work. In urban areas,
most poor families can hardly afford the cost of water, resulting
in children from poor families being sent on long treks in search
of water, often having to stand in long queues and consequently
being late or absent from school (Bugembe et al, 2005). UNDP,
(2009) stated that social and cultural factors influence high
rates of poverty and vulnerability. Vulnerability was often a
complex interplay of different factors, including gender rela-
tions, discrimination and power imbalance.
Gender inequality was pervasive in the region: the 2007/08
Gender-related Development Index (GDI) finds 12 WCA countries in
the 20 lowest ranking countries. Girls grow up vulnerable to male
26

violence, ill-health, early marriage and maternal death, and
faced limited work opportunities and persistent poverty due to
lack of education. Bradley et al., (2001), Corwyn & Bradley, (2000)
data from the National Longitudinal Survey of Youth and the
National Household Education Survey. Indicate that children from
poor families have less access to a wide variety of different
recreational and learning materials from infancy through
adolescence. They are less likely to go on trips, visit a library
or museum, attend a theatrical performance, or be given lessons
directed at enhancing their skills.
Access to such material and cultural resources mediates the
relation between SES (or family income) and children’s
intellectual and academic achievement from infancy through
adolescence (Bradley & Corwyn, 2001, Brooks-Gunn et al., 1995,
Entwisle et al., 1994, Guo & Harris, 2000). The impact becomes
greater as the number of negative life events (e.g., family
dissolution, loss of employment) and risk conditions (e.g.,
household crowding, presence of a mentally ill parent) increases
(Guo & Harris, 2000).
McLeod and Shanahan, (1996) noted that parents with $5,000 per
annum was regarded as high economic status parents, $2,000-
$5,000 as medium socio-economic parents and less than $2,000 as
low socio-economic parents. Generally, SES influences the life-
27

chances of people, affecting their social position in the society
and the access to the possibilities related to that position.
Access to financial services was critical for economic
empowerment of any population and it varies across gender. This
includes levels of savings, access to credit, insurance services
and remittances. Experiences and evidence from other countries,
for instance, point out that loosening of economic constraint
imposed on women can have immense consequences on development
(Rector et al., 2001).
Battin-Pearson et al., (2000) noted that low-SES parents are less
likely to purchase reading and learning materials for their
children, less likely to take their children to educational and
cultural events, and less likely to regulate the amount of TV
their children watch (Bradley et al., 2001a, Hess et al., 1982). As a
result, low-SES children more frequently experience school
failure (even in the early grades), which moves them on a
trajectory of either conduct problems or withdrawal behaviors
(Evans, 2004).
USAID, (2010) noted that income generation activities were
promoted among parents and children age 15 and older involved in
associations and caregiver support groups. Initially,
participants were encouraged to generate an informal rotating
savings and loans system (Strohschein, 2005). The groups are
28

encouraged to maintain a separate pool of money that was not
loaned to members, but used as a social fund in case of sickness
or family need (Advig, 2000).
In a vulnerable children’s project in two local government areas
in Benue State in Nigeria, 250 households with orphans and
vulnerable children were receiving support through income-
generating activities and microcredit schemes, and 350 orphans
and vulnerable children were receiving education and vocational
training (Desmond and Gow, 2001).
UNICEF, (2008) states that occupational prestige as one component
of SES, encompasses both income and educational attainment.
Occupational status reflects the educational attainment required
to obtain the job and income levels that vary with different jobs
and within ranks of occupations. Additionally, it shows
achievement in skills required for the job. Occupational status
measures social position by describing job characteristics,
decision making ability and control, and psychological demands on
the job.
Desmond and Gow, (2001) reported that social vulnerability is
partially the product of social inequalities those social factors
that influence or shape the susceptibility of various groups to
harm and that also govern their ability to respond. It is,
however, important to note that social vulnerability is not
29

registered by exposure to hazards alone, but also resides in the
sensitivity and resilience of the system to prepare, cope and
recover from such hazards (Andvig, (2000).
According to Jeremy Suizo, (2010) analysis of Lareau’s book,
‘Unequal Childhoods: Class, Race, and Family Life’, there is a
clear distinction between the parenting styles of the working
class families and the middle class. The middle class, practices
a method she dubs "concerted cultivation" while the working class
use a style called the accomplishment of natural growth.
Ainsworth and Filmer, (2002) observed that, middle class parents
had a greater presence in the lives of their children; primarily
through organizing the child's daily life. For middle class
families, there was a heavy emphasis on scheduling and
participating in various extracurricular activities and sports.
Middle class parents also encouraged their children to ask
questions and to be self-reliant. Children under the concerted
cultivation method tended to participate in sibling rivalry and
because of the heavy scheduling, middle class children rarely
visited extended family and had little free time (USAID, 2010).
Australian Commission on Social Determinants of Health, (2007)
states that socioeconomic position as an aggregate concept that
includes both resource-based and prestige-based measures, as
linked to both childhood and adult social class position.
30

Resource-based measures refer to material and social resources
and assets, including income, wealth, and educational
credentials. Terms they used to describe inadequate resources
include “poverty” and “deprivation”. Prestige-based measures
refer to individuals’ rank or status in a social hierarchy,
typically evaluated with reference to people’s access to and
consumption of goods, services, and knowledge (Currie and
Moretti, 2007). Educational level creates differences between
people in terms of access to information and the level of
proficiency in benefiting from new knowledge, whereas income
creates differences in access to scarce material goods. In
conducting this study, parents’ education level, income and
occupation were taken as the independent variables (Wilson et al.,
2002).
Kalibala and Elson, (2009) noted that lower parents’ occupations
prestige, the most vulnerable tends to be. The correlation
coefficient between parents’ occupation and children
vulnerability was found to be 0.875. Chauhan, (1996) states that
adolescents found out that a child’s particular socio-economic
inheritance may have a direct and important effect on the career
open or attractive to him that does his physical inheritance. The
economic and occupational level of the home affects the
vocational goals of youths by influencing their aspirations to be
similar to those held by their parents and by discouraging
31

aspiration to level much above or below the parental occupational
status (Duke, 2000).
The Jamaican socioeconomic system primarily emerging from slavery
and colonialism has created an arena for segregation and social
stratification of the Jamaican society (Bryan, 2000). This
stratification chiefly predetermined the privileges and benefits
afforded to each social group (Thompson, 1997). Consequently,
those living within the lower socioeconomic groups have less
access to social and economic benefits.
A substantial body of evidence reveals that there is a clear
demarcation between the various socioeconomic groups, such that,
parents of children with high educational attainment and
prestigious occupation was at a greater advantage of offering
their children opportunities for higher education, access to
wealth, use of stimulating resources (Brooks-Gunn et al., as cited
in Bradley et al., 2002; Galobardes, et al., 2007; Strohschien, 2005),
and homes in safer residential communities. Typically, the
privileges afforded to children of higher socioeconomic groups
magnify their chances of experiencing more wholesome life styles
than those of the lower socioeconomic groups (Brook-Gunn et al.,
1997).
Socioeconomic status affects both health care consumption and
health human capital (Ajakaiye and Mwabu, 2009). Better-off
people tend to be in better health (Thomas, 2009). As incomes
32

increase, individuals invest in better diets, improve sanitation
and allocate more resources to health care, thereby improving
their health human capital. As they become healthier, their SES
improves since they were less susceptible to diseases, more
energetic, more productive and worker longer and command higher
earnings (Thomas, 2009). At the individual level, health and SES
drive each other. Thomas, (2009) observes that there was a strong
inter-generational correlation in education and SES, such that
children born of parents with lower SES have lower educational
attainment in adulthood.
There were several indicators for socio-economic position, and
that the most important were occupational status, level of
education and income level. Each indicator covers a different
aspect of social stratification, and it was therefore preferable
to use all three instead of only one (Samms-Vaughan, 2006). They
add that the measurement of these three indicators was far from
straightforward, and due attention should be paid to the
application of appropriate classifications, for example,
children, women and economically inactive people, for whom one or
more of these indicators may not be directly available (Bryan,
2000). Information on education, occupation and income may be
unavailable, and it may then be necessary to use proxy measures
of socio-economic status such as indicators of living standards
(Rector et al., 2001).
33

Socioeconomic position as an aggregate concept that includes both
resource-based and prestige-based measures, as linked to both
childhood and adult social class position (Evans, 2004).
Resource-based measures refer to material and social resources
and assets, including income, wealth, and educational
credentials. Terms they used to describe inadequate resources
include “poverty” and “deprivation”. Prestige-based measures
refer to individuals’ rank or status in a social hierarchy
(Mackenbach et al., 2002). Prestige-based measure was linked to
occupational prestige, income, and educational level (Thompson,
1997). Educational level creates differences between people in
terms of access to information and the level of proficiency in
benefiting from new knowledge, whereas income creates differences
in access to scarce material goods (Bugembe et al., 2005).
Some sociologists consider the higher income and prestige of
higher ranked jobs to simply be incentives to encourage members
of society to obtain the skills necessary to perform important
work. This is an important mechanism in the economic theory of
capitalism, and is compatible with the notion that class is
mutable and determined by a combination of choices and
opportunities (World Bank, 2006). Status inconsistency was a
situation where an individual's social positions have both
positive and negative influences on his or her social status. For
example, a teacher may have a positive societal image (respect,
34

prestige) which increases their status but may earn little money,
which simultaneously decreases their status (Barrett at el., 2005).
CHAPTER THREE
METHODOLOGY
3.0 Introduction
This chapter presents the major methodological aspects that were
used in this study on which results, interpretations, discussion,
conclusions and recommendations were based.
3.1 Research Design
The research used a descriptive research design and correlational
Research design in order to obtain information concerning the
current status of socio economic status of parents and children
vulnerability. Kajembe et al., (2004) notes that descriptive design
enables the researcher to obtain an accurate profile of the
people, events or situations. The descriptive design is
advantageous for the researcher due to its flexibility, this
method can use either qualitative or quantitative data or both,
giving the researcher greater options in selecting the instrument
for data-gathering (Ishengoma, 2004; Babbie, 1989). Correlational35

Research design was used to determine the relationship between
parents socio-economic status and vulnerability of their
children.
3.2 Research Population
According to the population and housing census of 2002; North
‘A’ (NAD) has a total of 84,147 people where by 40,580 were males
and 43,567 were females (NBS, 2002). The population is assumed to
have increased since 2002. The district occupies an area of 211
square kilometer with a population density of 399 people per
square. The district has a total of 36 wards (Shehia) with a
total of 17,415 households having an average household’s size
(person per households) of 4.8 persons (RGZ, 2009).
The mean household size of NAD rose from 4.9 members in 2002 to
5.3 in 2004/2005 and mean number of persons per sleeping room was
2.3 (RGZ, 2004; RGZ, 2008). Purposively eight (8) wards (shehia)
out of 36 were selected to give the target population. The eight
shehia has 5,149 households. Therefore, the total target
population of this study was 5,149.
3.3 Sample Size
The sample size of this study consisted of five hundred and
fifteen (515) households drawn from a total households of five
thousand, one hundred and forty nine (5,149) from eight wards
(shehia) of the North ‘A’ District. Table one (1) provides the
population and the sample size.
36

Table 1: Population and Sample size
District Shehia Population Sample size % of sample
size
Kilindi 505 51 9.9 North Kigunda 412 41 8.0 Kisongoni 265 27 5.2 South Kikobweni 1000 100 19.4 Mkwajuni 928 93 18.1 Central Kibeni 690 69 13.4 East Kijini 725 72 14.0
West Potoa 624 62 12.0 TOTAL 5,149 515 100
Source: Survey Primary Data 2011
37

3.4 Sampling Procedure
The study was conducted in eight wards (shehia) in North ‘A’
District. Stratified random sampling technique was adopted to
select two shehia in North namely: Kilindi and Kigunda, and two
shehia in South and Central each namely: Kisongoni, Kikobweni,
Mkwajuni and Kibeni respectively. One shehia from East known as
Kijini and one from West known as Potoa.
A representative sample for the study from each shehia was based
on Boyd’s formula n/N x 100 = C, whereby C represents a figure
greater or equal to ten percent (10%) of the shehia household
population, N is the total households in the shehia and n is the
number of selected households (Boyd et al., 1981).
A fixed whole number of the households was selected and
calculated by using Boyd’s formula resulting to 10% or closest to
10% (as long as it is above 10%) of the total households in the
shehia. Eventually we obtained 515 as our sample size. These
households were used to get the information needed in the basic
survey (data collection).
3.5 Research Instrument
The primary data were collected by using structured questionnaire
and observation. Before data collection preliminary survey was
adopted to obtain general information about the wards (shehia)
38
and for familiarization and introduction of the study objective
to the local government and villagers.
Questionnaires
The study used both structured and unstructured questionnaires.
The structured questionnaires were based on Likert five point
scale (i.e strongly agree, agree, neutral, disagree and strongly
disagree) of which the respondents were to agree on the
statements related to the study. Unstructured questionnaires were
open ended whereby the respondents were required to give their
suggestion and opinion on what they knew and feel about the
questions given.
Research assistants were trained to administer an informed
consent procedure for both parents/guardians and children. A
survey was used to collect standardized information from a
carefully selected sample of households. Surveys often collect
comparable information for a relatively large number of people in
particular target groups (Advig, 2000; Kajembe, 2004; Ishengoma,
2010).
Observation
Observation was primarily used to tie together the more discrete
element of data collected by other methods. Thus, an iterative
process between observation and other methods occurred. The most
important tools during the observation were curiosity,
willingness to learn from other people and ability to adapt to
39
the rhythm and lifestyle of local people (Kajembe et al., (2004).
The The observed data on what was happening in the homes and
fields and general appearance of the area was noted in a notebook
for
additional information.
Secondary data
Secondary data were obtained from report, books, journals,
magazines and other documents from various offices within the
district.
3.6 Validity and Reliability of the Instrument
Validity of the instrument:
The main reason of test-retest was to identify any shortcomings
and assist in making modifications in some questions before the
actual data collection. Observation was done in advance to assess
the situation in order to achieve the objectives. The
questionnaires were given to experts who went through and made
some correction before the final copy was taken to the field.
Reliability of the Instrument:
The instruments that were used for data collection were test-
retested in order to ensure their reliability. An average of ten
questionnaires was given to respondents in each of the shehia.
The response to the questionnaires was analyzed first. After two
weeks, the same average questionnaires were re-issued to the
40

respondents in each of the shehia. After which the results were
analyzed. When we compared with the first and second results we
obtained a positive correlation of 0.89 in which we concluded
that the instrument was valid and reliable. Those questions which
were not well understood were corrected before the final copy was
made to be used in the field.
3.7 Data Gathering Procedures
The researcher was received the letter from School of
Postgraduate Studies and Research (SPGSR) to ensure that
authority and permission from the study area was obtained.
Meanwhile, the respondents and community was considered.
The leader of the Community members from each Shehia was
conducted and informed about the research. They were involved in
encouraging people to give in their responses. The researcher
assured them of that the information provided by them was meant
for academic purpose only. During the data collection the
villagers were involved full and emphasized to show their
boundaries of its shehia in order to enable the researcher to get
accurate data for each shehia.
3.8 Data Analysis
After data gathering the researcher analyzed the data to obtain
findings and conclusions. In order to obtain descriptive
statistical, the data was analyzed using the percentages,
41
frequencies, graphs, average, and range by the aid of Statistic
package for Social Scientist.
3.9 Ethical Considerations
As this study requires the participation of
human respondents, specifically human resource, certain ethical
issues were addressed. The consideration of these ethical issues
was necessary for the purpose of ensuring the privacy as well as
the safety of the participants. Among the significant ethical
issues that were considered in the research process included
consent and confidentiality. In order to secure the consent of
the selected participants, the researcher relayed all important
details of the study, including its aim and purpose. By
explaining these important details, the respondents were able to
understand the importance of their role in the completion of the
research.
The respondents were advised that they could withdraw from the
study even during the process. With this, the participants were
not forced to participate in the research. The confidentiality of
the participants also were ensured by not disclosing their names
or personal information in the research. Only relevant details
that helped in answering the research questions were included.
3.10 Limitation of the Study
One of the major challenges in
collecting information was absence of compiled up to date
42

information in the District office. The solution to this problem
was met after a discussion with relevant Officers. Some of the
respondents were busy for their activities that did not have time
to respond to questionnaires. Much effort was done to reduce
these limitations like encouraging people and visiting them
during weekends and also was take in the evening. Another
limitation is that of the 36 wards (shehia) only stratified
selected eight wards were selected for the study. The findings
may be biased because not all the wards were selected.
CHAPTER FOUR.
PRESENTATION, ANALYSIS AND INTERPRETATION OF DATA
4.0 Introduction.
This chapter deals with the presentation and analysis of the
major findings from the research instruments that were used for
collecting the data with specific emphasis on the parent’s socio-
economic status and the vulnerability of their children in North
‘A’ District Zanzibar. In order to conceptualize the situation,
the study represented the following tables as shown below. 43

Table 2: Number of head of households by gender and marital
status.
Married % Single %
Total %
Males 306 89.7 15
8.6 321 62.3
Females 35 10.3 159
91.4 194 37.6
Total 341 100 174
100 515 100
Source: Survey Field Data
Total samples of 515 households were surveyed. The majority
(62.3%) of the heads of households were males as shown in table-3
above. The mean age of the heads of households was 38.6 years;
the youngest head of household is 14 years while the oldest 87
years.
The number of female-headed households (37.6%) (n=194) was lower
than for male-headed households (62.3%) (n=321). However in
shehia level there was only one shehia that had higher number of
female-headed households (51.8%) where male-headed households was
(48.1%), this was Kisongoni Shehia. The result indicates that
there was significant different among the shehia level between
male-headed households and female-headed households.
44

Figure 1: Marital status of head of households.
Married Single0
50
100
150
200
250
300
350
MalesFemales
A total of 342 (66.2%) head of households reported being
currently married and 174 (33.8%) were currently single (Figure-
1). Among the 33.8% who were single (n=174), the majority were
widowed. The mean age at first marriage was 21 years old for male
and 19 years old for females. Therefore, the result indicates
that there was a significant difference between married head of
households and single head of households in the study area.
45

Table 3: Educational status of parents/guardians
Level of education Males % Females
% Total % Post graduate 0 0.00 0.0 0 0.0
Bachelors degree 10 3.15 2.6 15 3.0 Diploma 23 7.311 5.7 34 6.6
Certificate 37 11.46 3.1 43 8.3
Secondary 68 21.230 15.4 98 19.0
Primary 92 28.797 50.0 189 36.7
Adult education 35 10.917 8.8 52 10.1
Not gone to school 56 17.428 14.4 84 16.3 Total 321 100
194 100 515 100Source: Survey Field Data
46

The result in table-3 indicates that majority of parents in the
study area have primary education level (28.6% for males and
50.0% for females). There were no parents with the levels of
education beyond first degree where by the percent of first
degree of males and females were 3.1% and 2.6% respectively.
Those with Diploma were 7.3% for males and 5.7% for females while
11.4% males and 3.1% females have got certificate education.
Those with of secondary education were 21.1% males and 15.4%
females while 10.8% males and 8.8% females have got adult
education. Those who have not gone to school were 17.7% males and
14.4 females. However, almost in all level female respondents
were dominant.
Table 4: Social classes of the parents/guardians
Shehia First class Middle class
Lower class M % F % M % F %
M % F % Total
47

Kilindi 4 8.1 1 14.3 10 10.1 4 6.7 20 11.4 12 9.4 51
Kigunda 5 10.2 0 0.0 8 8.0 6 10.3 12 6.8 10 7.8 41
Kisongoni 3 6.1 0 0.0 3 3.0 5 8.4 7 4.0 9 7.1 27
Kikobweni 14 28.6 3 42.8 20 20.3 13 22.0 30 17.2 20 15.7 100
Kijini 2 4.1 0 0.0 15 15.2 7 11.8 22 13.0 26 20.6 72
Potoa 6 12.3 1 14.3 11 11.1 10 16.9 19 10.9 15 11.8 62
Mkwajuni 11 22.4 0 0.0 18 18.2 9 15.3 36 20.7 19 14.9 93
Kibeni 4 8.2 2 28.6 14 14.1 5 8.6 28 16.0 16 12.7 69 Total 49 100 7 100 99 100 59 100 174
100 127 100 515Overall 56 158301 515 total Percent 10.9 30.7
58.4 100Source: Field study data
Note that F stand for female and M stand for male
48
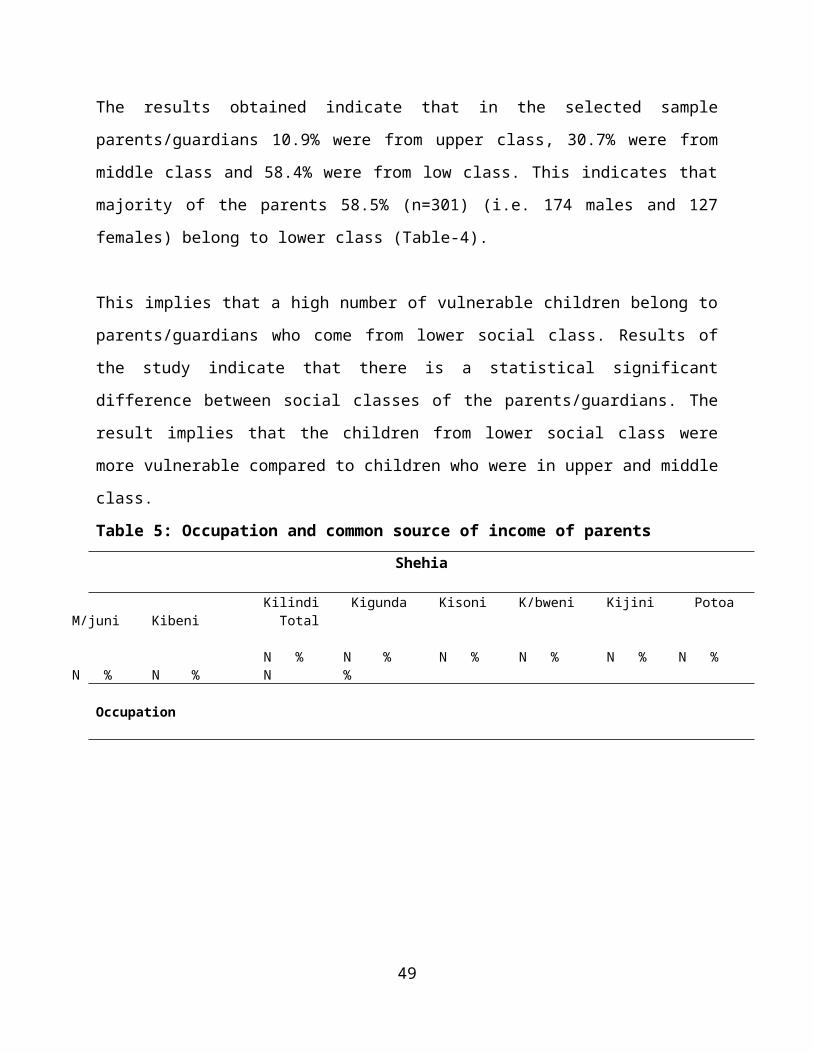
The results obtained indicate that in the selected sample
parents/guardians 10.9% were from upper class, 30.7% were from
middle class and 58.4% were from low class. This indicates that
majority of the parents 58.5% (n=301) (i.e. 174 males and 127
females) belong to lower class (Table-4).
This implies that a high number of vulnerable children belong to
parents/guardians who come from lower social class. Results of
the study indicate that there is a statistical significant
difference between social classes of the parents/guardians. The
result implies that the children from lower social class were
more vulnerable compared to children who were in upper and middle
class.
Table 5: Occupation and common source of income of parentsShehia
Kilindi Kigunda Kisoni K/bweni Kijini Potoa M/juni Kibeni Total
N % N % N % N % N % N % N % N % N %
Occupation
49

Farming/L. keeping 14 27.5 15 36.6 21 77.8 14 14.0 27 37.5 9 14.5 26
27.9 14 20.3 140 27.2
Fishing 10 19.6 8 19.5 0 0.0 12 12.0 19 26.4 10 16.1 23 24.7 4 5.8 86 16.7
Trading 9 17.6 5 12.2 2 7.4 37 37.0 7 9.7 15 24.217 18.3 22 31.9 114 22.1
Employed/S.-employed 15 29.4 9 21.9 3 11.1 32 32.0 9 12.6 22 35.5 22
23.7 26 37.7 138 26.8
No work 3 5.9 4 9.8 1 3.7 5 5.0 10 13.8 6 9.7 5 5.4 3 4.3 37 7.2
Total 51 100 41 100 27 100 100 100 72 100 62 100 93 100 69 100 515 100
Source: Field Survey data
The result from table-5 above shows that out of 515 respondents
who were asked the question regarding sources of income, 27.2%
received income through farming/livestock keeping and another
26.7% through formal occupation such as teaching and self-
employed. Where 22.1% receive income through trading goods and
another 16.7% through fishing. Only 7.2% of the respondents
reported that they have no source of income. From the results,
indicates that the number of parents who have no work is high and
existed in all shehia.
50
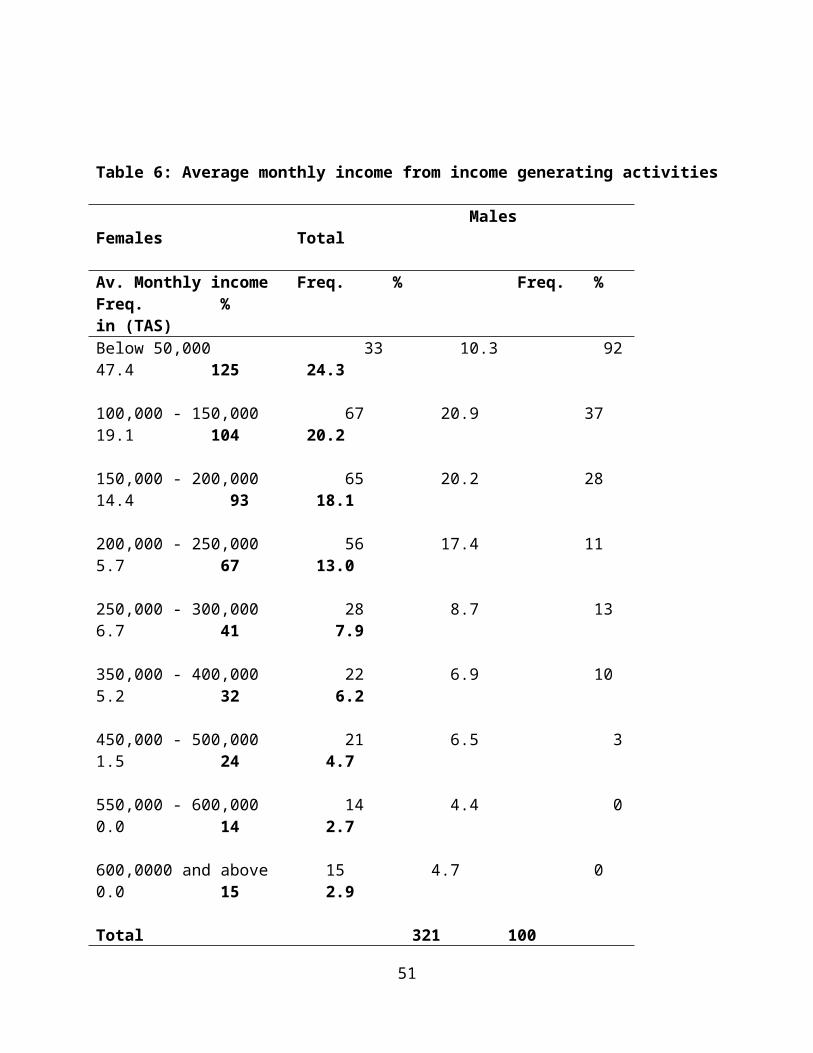
Table 6: Average monthly income from income generating activities
Males Females Total
Av. Monthly income Freq. % Freq. % Freq. % in (TAS)Below 50,000 33 10.3 9247.4 125 24.3
100,000 - 150,000 67 20.9 37 19.1 104 20.2
150,000 - 200,000 65 20.2 28 14.4 93 18.1
200,000 - 250,000 56 17.4 11 5.7 67 13.0
250,000 - 300,000 28 8.7 13 6.7 41 7.9
350,000 - 400,000 22 6.9 10 5.2 32 6.2
450,000 - 500,000 21 6.5 31.5 24 4.7
550,000 - 600,000 14 4.4 00.0 14 2.7
600,0000 and above 15 4.7 0 0.0 15 2.9
Total 321 100
51

194 100 515 100
Percent 62.3 37.7 100 Source: Field survey data.
1 US $ is equivalent to about 1,600 TAS.
The table-6 indicates the mean monthly income for all respondents
was TAS. 165,213 (Equivalent to 103.25 US dollars).The average
monthly household income for male-headed households was TAS.
194,099 (Equivalent to 121.31 US dollars) and for female-headed
households it was TAS. 117,268 (Equivalent to 73.29 US dollars).
Table 7: Household’s members. Male
Female
Shehia Frequency % Frequency
% Total
52

Kilindi 175 12.0 198 11.8 373
Kigunda 135 9.2 105 6.2 240
Kisongoni 95 6.4 92 5.0 187
Kikobweni 303 21.0 32720.0 630
Kijini 210 14.3 228 14.0 438
Potoa 190 13.0 202 12.0 392
Mkwajuni 176 12.0 30218.0 478
Kibeni 179 12.1
219 13.0 398
Total 1,463 100
1,673 100 3,136
Source: Field Survey Data
53

The result on table-7 shows that there were a total of 3,136
household members 46.7% males (n=1,463) while 53.3% females
(n=1673). According the result the number of household members
was significantly difference among the shehia. Kikobweni shehia
has 20.1% (n=630) followed by Kijini 13.95% (n=438) where
Kisongoni and Kigunda the household members were 5.9% (n=187) and
7.7% (n=240) respectively. The average mean of the household
members was 392 and the range was 443. According to the result
obtained indicates that the ration between males and females was
differing significantly.
Table 8: Children under 18 years old.
Male Female
Shehia Frequency % Frequency %Total
Kilindi 139 12.0 14512.0 284
Kigunda 98 8.4 89 7.0 187
Kisongoni 46 4.0 56 4.4 102
Kikobweni 211 18.2 224 18.0 435
54

Kijini 176 15.2 207 16.4 383
Potoa 150 13.0 166 13.1 316
Mkwajuni 188 16.2 199 15.4 387
Kibeni 148 13.0 173 13.7 321 Total 1,156 100 1,259 100 2,415
Source: Field Survey Data
According to the result indicates that there was a total of 2,415
children under 18 years where by 47.9% (n=1,156) were males and
52.1% (n=1,259) were females (Table-8). This result shows that
there was high numbers of people in the study area above 18 years
who depend on their parents/guardians. Similarly the result shows
that there was a significant difference among the shehia on the
number of children less than 18 years.
Table 9: Critical Vulnerable children
Status of
Vulnerability
55

Male
Female
Shehia Frequency Percent Frequency
Percent Total
Kilindi 27 10.3 37 11.7 64
Kigunda 25 9.6 22 6.9 47
Kisongoni 9 3.4 16 5.2 25
Kikobweni 46 17.6 63 20.0 109
Kijini 57 21.8 49 15.5 106
Potoa 31 11.8 43 13.7 74
Mkwajuni 37 14.3 44 13.9 81
Kibeni 29 11.2 56

41 13.1 70 Total 261 100
315 100 576
Percent 45.3
54.7 100
Source: Field Survey Data
Out of 1,884 vulnerable children (VC) 30.6% (n= 576) were
critically vulnerable. Result in table-9 indicates that 45.3% of
respondents were males and 54.7% of respondents were females.
This result shows that there was significant different between
males and females on level of vulnerability.
Result shows that there were some differences in the distribution
of vulnerability among children in the study area. Almost in all
shehia females has high number of critical vulnerable children
except Kigunda and Kijini. This indicates that there was
significant different of vulnerable children among shehia in the
study area.
57

Table 10: Moderate Vulnerable Children Status of
Vulnerability
Male
Female
Shehia Frequency % Frequency %
Total %
58

Kilindi 86 12.4 7912.9 165 12.6
Kigunda 57 8.2 49 8.0 106 8.1
Kisongoni 35 5.0 28 4.6 63 4.8
Kikobweni 111 15.9 102 16.7 213 16.3
Kijini 122 17.6 113 18.5 235 17.9
Potoa 97 13.9 85 13.8 182 14.0
Mkwajuni 99 14.3 82 13.4 181 13.8
Kibeni 89 12.7 74 12.1 163 12.5
Total 696 100 612 100 1,308 100
Percent 53.2 46.8 100
Source: Field Survey Data
59
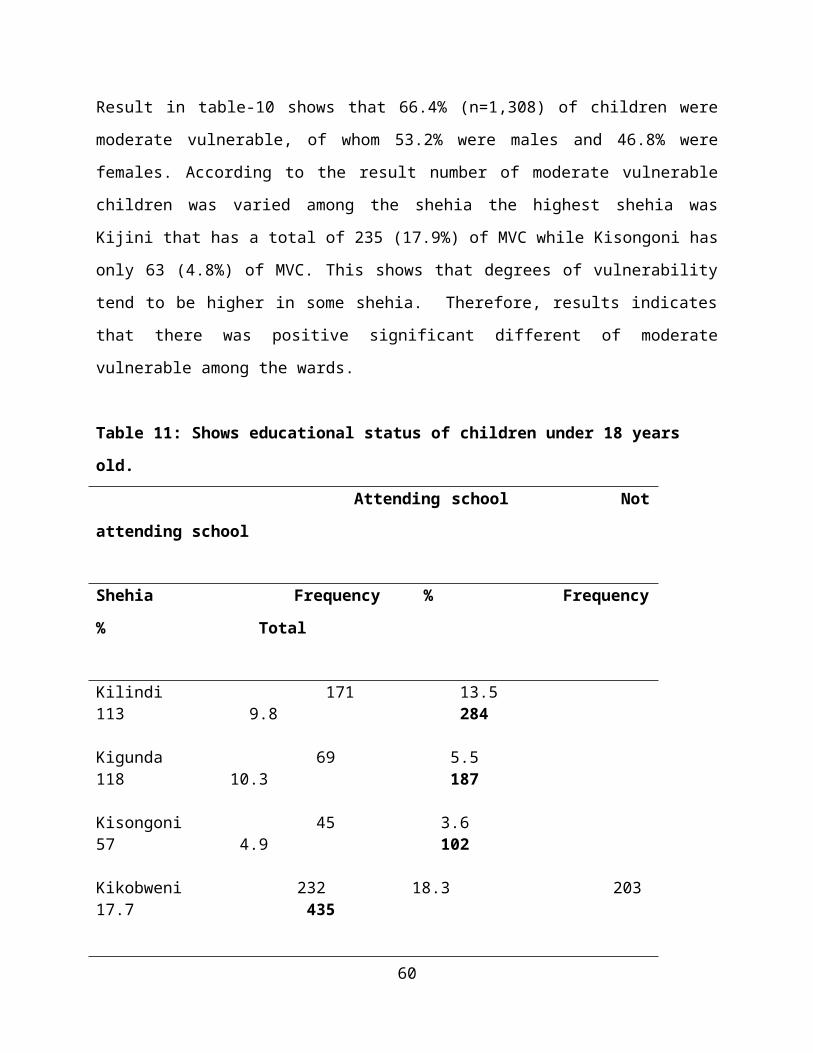
Result in table-10 shows that 66.4% (n=1,308) of children were
moderate vulnerable, of whom 53.2% were males and 46.8% were
females. According to the result number of moderate vulnerable
children was varied among the shehia the highest shehia was
Kijini that has a total of 235 (17.9%) of MVC while Kisongoni has
only 63 (4.8%) of MVC. This shows that degrees of vulnerability
tend to be higher in some shehia. Therefore, results indicates
that there was positive significant different of moderate
vulnerable among the wards.
Table 11: Shows educational status of children under 18 years
old.
Attending school Not
attending school
Shehia Frequency % Frequency
% Total
Kilindi 171 13.5 113 9.8 284
Kigunda 69 5.5 118 10.3 187
Kisongoni 45 3.6 57 4.9 102
Kikobweni 232 18.3 203 17.7 435
60

Kijini 151 11.9 232 20.3 383
Potoa 188 14.9 128 11.1 316
Mkwajuni 209 16.5 178 15.4 387
Kibeni 200 15.8 121 10.5 321
Total 1,265 100 1,150100 2,415
Source: Field Survey Data
The result on table-11 indicates that out of 2,415 children 52.4%
(n= 1,265) were attending school while 47.6% (n= 1,150) never
gone to school. Out of 1,265 children who were attending school
548 were males and 717 were females. Similarly, reported that
1,150 children never gone to school of whom 608 males and 542
were females. The result shows that there was significant
difference between children who were attending school and those
who never gone to school.
Meanwhile, table-11 shows variation of educational status among
the shehia. Some shehia has high number of children who were gone
to school, for instance Kikobweni were 18.3% (n= 232) whereby 107
males and 125 females. Meanwhile, Kisongoni has the lowest number
of children who were attending school that was 3.6% (n= 45) where
19 were males and 26 were females.
61

Figure 2: Perception of respondents on vulnerable children.
S. Agree42%
Agree30%
Neutral12%
Disagree9%
S. Disagree6%
The result on figure-2 indicates that 42% and 30% of respondents
strongly agree and agree that there were vulnerable children in
the community respectively. Where only 6% and 9% strongly
disagree and disagree that there were no vulnerable children in
the community while 12% of respondents were neutral.
Figure 3: Knowledge of parents on the causes of vulnerability.
62

S. Agree35%
Agree33%
Neutral13%
Disagree11%
S. Disagree8%
Out of 515 respondents who were asked the question regarding
causes of vulnerability. The result in figure-3 indicates that
35% and 33% respondents were strongly agreed and agree
respectively. They reported that major causes of vulnerability
were extreme poverty, divorce, early marriage, polygamy and child
labour. Only 11% and 8% were disagree and strongly disagree while
a total of 13% respondents were neutral.
63
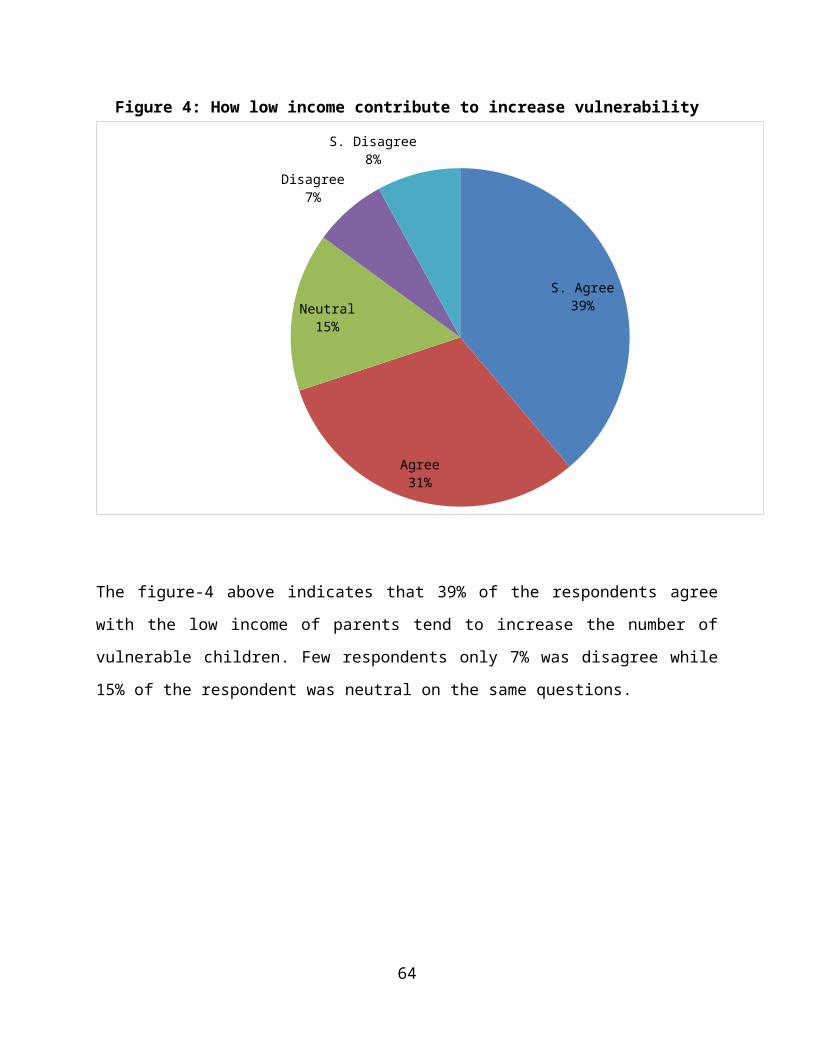
Figure 4: How low income contribute to increase vulnerability
S. Agree39%
Agree31%
Neutral15%
Disagree7%
S. Disagree8%
The figure-4 above indicates that 39% of the respondents agree
with the low income of parents tend to increase the number of
vulnerable children. Few respondents only 7% was disagree while
15% of the respondent was neutral on the same questions.
64

Figure 5: Government and Community support.
S. Agree33%
Agree32%
Neutral18%
Disagree10%
S. Disagree8%
Result in figure-5 shows that lack of government and community
support positively increases the lower class parent and
vulnerable children. From the figure-13 only 10% and 8% of
respondents disagreed and strongly disagreed on this opinion.
This result implies that there was significant difference between
government support and vulnerable children.
65

Figure 6: Socio-economic class in the community.
S. Agree40%
Agree32%
Neutral11%
Disagree9%
S. Disagree9%
Result in figure-6 indicates that 40% of respondents were
strongly agree and 32% were agree while only 9% were strongly
disagree on the question said that the major socio-economic
classes are upper, middle and lower classes.
66

On the other hand the percentage of disagree and strongly
disagree were 8% and 9% respectively whereby the percentage of
respondents indicated neutral was 11%. Therefore, according to
this study in the study area there was three major classes were
upper, middle and lower classes.
Figure 7: Lack of basic needs.
S. Agree34%
Agree27%
Neutral21%
Disagree10%
S. Disagree8%
The result from figure-7 shows that 34% of respondents were
strongly agree and 27% were agree that lower class family
affected by lack of basic needs and economically weak. While 10%
67
of respondents were disagree and 8% were strongly disagree. This
result shows that there was significant different of income among
the people in the community.
Figure 8: Wealth of parents to purchase clothes for their
children.
68

S. Agree10%
Agree10%
Neutral19%
Disagree28%
S. Disagree34%
The results in Figure-8 summarize the characteristic of parent’s
income on purchasing clothes for their children. The status of
purchase clothes for children was difficult. The finding
indicates that most respondents did not manage to purchase
clothes for their children. Only 10% strongly agree that they
managed to purchase clothes while 33% strongly disagree that they
did not managed to purchase clothes.
69

Figure 9: How parents/guardians manage to pay school fees.S. Agree
9%
Agree11%
Neutral19%
Disagree28%
S. Disagree33%
Figure-9 shows that 33% and 28% of respondents were strongly
disagree and disagree about the payment of school fees for their
children respectively. Only 9% and 11% of respondents were
strongly agree and agree that they able to pay the school fess
for their children while 19% were neutral. This indicates that
majority of parents in the study area were poor and live in
poverty line.
70

Figure 10: Knowledge of respondents on factors that reduce socio-
economic classes and vulnerable children.
S. Agree36%
Agree28%
Neutral18%
Disagree9%
S. Disagree9%
Figure-10 indicates that 36% and 28% of respondents were strongly
agree and agree respectively on the question said that.
Initiation of microfinance small business and contribution
groups, conducting vocational training and providing psychosocial
support can reduce socio-economic classes and vulnerable
71

children. While 9% of respondents were disagree and 9% were
strongly disagree and 18% were neutral. According this result
shows that socio-economic classes and vulnerable children can be
reduced if special measures will taken.
CHAPTER FIVE
FINDINGS, CONCLUSIONS AND RECOMMENDATIONS
5.0 Introduction
This chapter summarizes the main findings, conclusion and
recommendation obtained in the field as per objectives of this
study.
5.1 Findings
Result in table-17 indicates that families with low socio-
economic status often lack the financial, social, and educational
supports that characterize families with high socioeconomic
status. Poor families also may have inadequate or limited access
to community resources that promote and support children's
development and school readiness. The study conducted by Akanle,
(2007) reported that children from families with low socio-
economic status are at greater risk to be in vulnerable group72

than their peers from families with median or high socioeconomic
status.
According this study some causes of low socio-economic status and
vulnerability of children were poverty of extreme parents, low
education of parent, and shortage of employment and lack of
Government support. The table-17 demonstrated that there was high
number of parents/guardians of lower class and middle class and
few from upper class. Of whom 58.4% (=302) parents/guardians from
lower class where 57.9% (n=175) males and 42.1% (n=127) were
females. The percent of middle class was 30.7% (n=158) by whom 99
males and 59 females. While the percent of upper class was 10.9%
(n=56) where 49 males and 7 females (Figure-15).
Kikobweni was the first shehia that has high number of upper and
middle class parents/guardians followed by Mkwajuni. On the other
hand Kijini was the last shehia comprised the lowest number of
upper class parents, they were only 3.4% followed by Kisongoni
5.4%. For the case of lower class Mkwajuni scored the highest
43.3% (n= 55) followed by Kikobweni that scored 39.3% (n=50).
Kisongoni scored the lowest number for the case of low class,
12.6% (n=16) followed by Kigunda that scored 17.3% (n= 22). A
result of this study indicates that extreme poverty tends to
increase the gap between upper and lower classes.
Most head of households depend on farming/livestock keeping and
employed/self-employed as a source of income. There was no73

female-headed household reported that depending on fishing as a
source of income. However, high number of males-headed household
depending on fishing as a source of their income. In the study
conducted in Morogoro Tanzania by Kajembe et al., (2004) reported
that most of respondents were typically peasant farmers in
subsistence crop production with 92.5% and 95.0% surveyed
households at Ruvu Fuelwood Pilot Project and Hifadhi Ardhi
Shinyanga respectively. Engle, (2008) stated that out of 1009
respondents who were asked the question regarding sources of
income, 40% received income through trading goods and another
11.1% through general labour. Only 3.7% receive income from
friends and family, and 1.6% earns money from a formal occupation
such as teaching.
The result table-7 indicates that the mean monthly income for all
respondents was TAS. 165,213 (Equivalent to 103.25 US dollars).
The average monthly household income for male-headed of
households was TAS. 194,099 (Equivalent to 121.31 US dollars) and
for female-headed households it was TAS. 117,268 (Equivalent to
73.29 US dollars). In all eight shehia, the total regular income
earned by female-headed households was almost half that earned by
male-headed households. According to the results many females’
head of households receive monthly income of below TAS. 50, 000
(31.25 US dollars), this indicate that high number of head of
household were poor. Inshengoma, (2010) reported that, women, due
to lack of access to household income, (being dominated by men),
74

they have engaged themselves in small income generating
activities. The income generated was generally low, about 60%
respondents were getting between, Tanzanian Shillings 501-3,000/=
per week which is equivalent to US $ 0.5-3 per week. Therefore,
the findings in this study related to employment and income
reinforce the need for strengthening economic security at the
household level identified as a priority. The strengthening of
economic security is crucial for families affected by low socio-
economic status and vulnerable children if they are to be able to
provide adequate care for themselves and their children. Given
the relationship between household economic strengthening and the
capacity of communities to support those lower socio-economic
status parents and vulnerable children.
The finding indicates that the overall vulnerability in the study
area was higher. The result indicates that 78.0% (n=1884) were
vulnerable children. Of whom 49.2% (n=927) were males and 50.8%
(n=957) were females. The percentage of critical vulnerable was
30.6% (n=576) and 69.4% (n=1,308) was moderate vulnerable. In the
study done by Kalibala and Elson, (2009) in Uganda indicates that
96 percent of children in Uganda considered vulnerable, with 8
percent (1.4 million) critically vulnerable, 43 percent (7.4
million) moderately vulnerable, and 45 percent generally
vulnerable (7.7 million). USAID, (2010) noted that in Uganda
67.5% of children below 18 years old were vulnerable children.
75

The degrees of vulnerability tend to be higher in some shehia,
whereby Kijini has the highest number 66.1% (n= 341) whereby 179
male and 162 female. Of whom 45.5% moderately vulnerable and
20.5% critically vulnerable. While Kisongoni has the lowest
number of vulnerable children only 17.1% (n= 88). Of whom 12.2%
moderately and 4.8% critically vulnerable. Therefore, the result
demonstrates that there was significant difference of
vulnerability within the shehia. URT, (2010) reported that number
of vulnerable children was continuing to increase in many
communities. World Vision International, (2005) noted that in
most cases the caregivers are poor consequently; meeting the core
needs of VC at the household level remains a challenge.
Respondents reported that they perceived an ever-increasing
number of vulnerable children in the study area because some of
them have lost their parents, and also because households are too
poor to feed and care properly for children. Other causes were
early marriage, abandoned women, low level of education among the
parents and lack of support from local and central Government.
Frequently children are involved in risk-taking activities such
as taking drugs and alcohol, gambling, Children born out of
wedlock and Teenage girls with children out of wedlock were also
reported during the survey.
Furthermore, divorce was mentioned as a major factor that
contributes vulnerability in the study area. USAID, (2010) report
76

in Uganda found that social, political and economical processes
and structures that lead to vulnerable conditions. Kalibala and
Elson, (2009) described that a large number of children made
vulnerable by food insecurity, poverty, and high illiteracy
rates. Lack of adequate rainfall and rocky soil inhibit food
production, contributing to high levels of poverty. Furthermore,
divorce was mentioned as a major factor that contributes
vulnerability in the study area.
The finding shows that the most important needs of vulnerable
children included basic material needs (e.g., food and clean
water), shelter, education (e.g., access to scholastic materials
and uniforms), and health care services. The findings of this
study correlated with those reported by Elgbeleye and Olasupo,
(2011) suggested that food, casual clothes, shelter and education
were mention as basic needs by respondents.
The results from table-17 indicate that there is positive
relationship between parental socio-economic status (PSES) and
children vulnerability. Figuer-6 shows that 34% of respondents
come from lower class affected by lack of basic need while only
8% from upper class were affected. This implies that there was
significant relationship between PSES and children vulnerability.
it Rector et al., (2001) documented that there was positive
relationship between parent’s socio-economic status and children
vulnerability. Thomos (2009) presented evidence that the
77
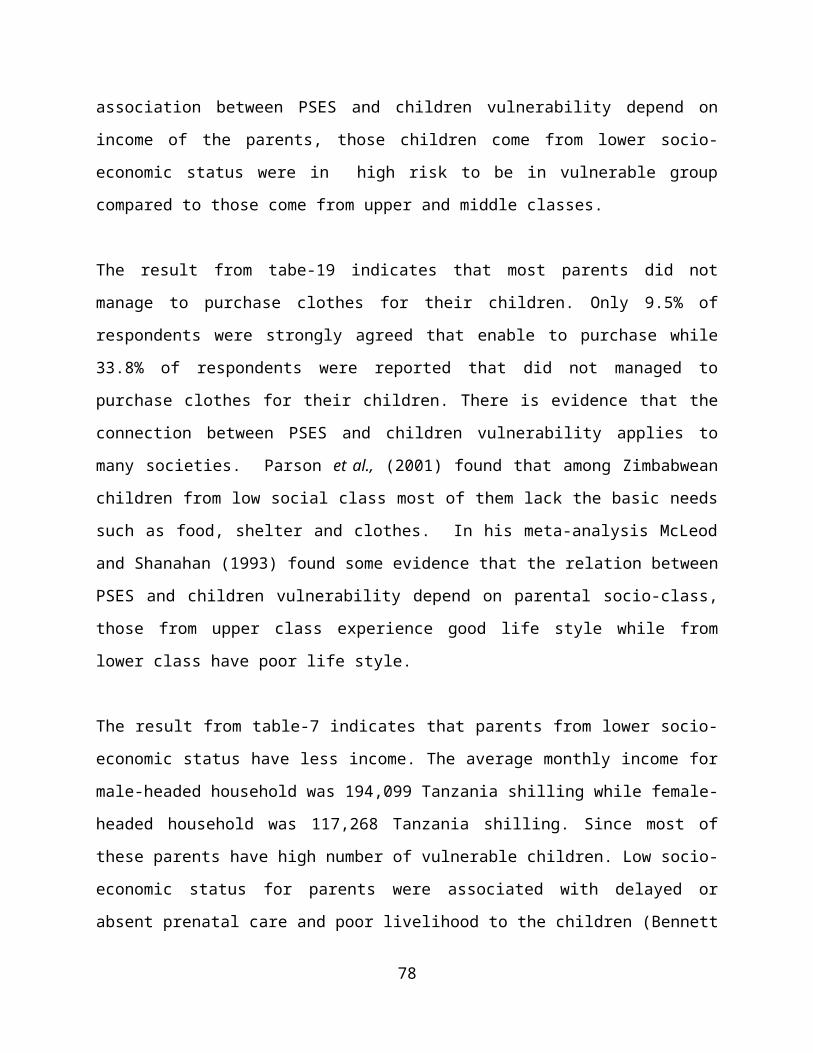
association between PSES and children vulnerability depend on
income of the parents, those children come from lower socio-
economic status were in high risk to be in vulnerable group
compared to those come from upper and middle classes.
The result from tabe-19 indicates that most parents did not
manage to purchase clothes for their children. Only 9.5% of
respondents were strongly agreed that enable to purchase while
33.8% of respondents were reported that did not managed to
purchase clothes for their children. There is evidence that the
connection between PSES and children vulnerability applies to
many societies. Parson et al., (2001) found that among Zimbabwean
children from low social class most of them lack the basic needs
such as food, shelter and clothes. In his meta-analysis McLeod
and Shanahan (1993) found some evidence that the relation between
PSES and children vulnerability depend on parental socio-class,
those from upper class experience good life style while from
lower class have poor life style.
The result from table-7 indicates that parents from lower socio-
economic status have less income. The average monthly income for
male-headed household was 194,099 Tanzania shilling while female-
headed household was 117,268 Tanzania shilling. Since most of
these parents have high number of vulnerable children. Low socio-
economic status for parents were associated with delayed or
absent prenatal care and poor livelihood to the children (Bennett
78

and Lu, 2000). Low social status may limit one’s social ties
(capital) and lead to feelings of helplessness and lack of
control, the first reducing one’s protection from potential
threats to well-being, the second limiting one’s own efforts to
deal effectively with those threats (Barrett, 2005).
This study shows that children from upper class have good life
while those from lower class experience poor life style. Those
children from upper class often have adequate food, good shelter
and enough clothes. Evans (2004) reported that most children
found in vulnerable group comes from lower socio-economic status,
likewise, poor houses belongs to parents from lower class.
Bradley & Corwyn (2000) also found that access to stimulating
materials and experiences mediated the relation between PSES and
children’s vulnerability. The connection between PSES,
stimulating experiences, and children’s vulnerability functioning
is well established (Alisa and Gregg, 2010, Clones, 1992, Currie
and Moetti, 2007).
The result of the study demonstrate that out of 2,415 school age
children 5-18 years old (from nursery school) only 52.4%
(n=1,265) was attending school among them 43.3% (n=548) were
males and 56.7% (n= 717) were females. While 47.6% (n=1,150)
never attended school by whom 52.8% (n=608) were males and 47.1%
(n=542) were females (Table-12).
79

Skills training, material support and psychosocial support were
reported as among the methods that can reduce the vulnerability
of children in the study are. Similarly, coordination of support
activities for vulnerable children and ensuring collaboration
among implementers was a key role in reduction of vulnerability.
(UNAIDS,1999; Engle, 2008). The psychological needs of these
children include love, recognition and acceptance, protection,
being valued, encouragement, comfort, and participation in
important life events.
According to respondents the national and district level
coordination of service provision for vulnerable children was
functioning in some districts. There was also limited
coordination between the central government and local elected
leaders. Sustainability an effort was reported as key for reduce
vulnerability. Sustainability refers to the extent to which
organizations are making attempts to ensure care for vulnerable
children beyond the life of the current situation was oversee by
the shehia, district and Central Government.
It is important to train communities in insurance mechanisms for
the most vulnerable groups and also for unexpected incidents. For
example, Uganda has experimented with some ‘insurance’ programs
which encourage solidarity groups to include a member who have
HIV positive. Individual solidarity groups need to make plans for
80
unexpected incidents such as an illness or funeral to ensure that
members do not dip into their principle (USAID, 2010).
5.2 Conclusion
Based on the findings of this study, it is indicates that upper
socio-economic status parents have much influence on children
value such as basic needs, education, health and their
livelihood. The children from upper and middle socio-economic
status groups preferred to continue and aspire higher for high
yielding jobs than those of the low socio-economic status who do
not wish to continue their education due to poverty.
A family's socioeconomic status is based on family income,
parental education level, parental occupation, and social status
in the community. Less educated Parents may have inadequate
skills for such activities as reading to and with their children,
and having inadequate resources and limited access to available
resources. Hence, this situation can negatively affect families
on decisions regarding their young children’s development. As a
result of the financial and material issues surrounding working
class families, low income parents are most concerned with
providing basic survival needs like food and shelter.
Education concerning vulnerable children for community is a tool
in the process of addressing and reducing the vulnerable
children. The findings from this study reveals of the lack of
81

accessibility of basic needs, poverty and lack of government and
community support on parents who have low socio-economic status
and vulnerable children was very minimal.
There is a positive relationship between economic status and
vulnerability of children in the society. Children from low
economic status are more vulnerable than those from better
economic status.
5.3 Recommendations
From this study the following recommendations are pertinent:
There is need to involve single parents special widows in
decision-making and improve their accessibility to resources.
Women should be assisted to engage themselves in income
generating activities. Meanwhile, establishment of widow support
groups and services through a variety of local mechanisms and
organizations is very important in reduction of poverty for the
aims of control vulnerability.
Provision of material support including food, clothing, medical
services and education for low socio-economic status parents is
urgently required in the study area.
82
Particular efforts need to be made to create opportunities for
those at risk at different stages of the lifecycle to access
policy and channels in order to express their views on their
needs, priorities and realities. A greater focus on vulnerability
and low socio-economic parents.
It is important for the Government, NGOs, CBOs and FBCs to
facilitate training of parents and youth on entrepreneurship and
business skills, including credit management in order to raise
income of low socio-economic status parents.
Area for Further Research
Further research is required that look the effect of low socio-
economic status on performance of students.
Additional specific research is needed that assess the impacts of
socio-economic classes in the community.
REFERENCES
Alisa G and Gregg P. (2010). Poorer children’s educational attainment: how
important are attitudes and behaviour? Retrieves on 10 February 2012.
83

AKanle, O.B. (2007). Socio-economic factors influencing student’s academic
performance in Nigeria.
Ainsworth, M., and Filmer, D. (2002). "Poverty, AIDS, and
Children’s Schooling: Targeting Dilemma." Paper presented at
the annual meetings of the Population Association of America.
Atlanta, Ga., 9–11 May 2002 (revised 23 May 2002).
Andvig, J. S. (2000). An essay on child Labor in Sub-SaharanAfrica: Zambia. ILO.
Ajakaiye, O and Mwabu, G. (2009). The Causal Effect of
Socioeconomic Status and Supply-Side Factors on Health and
Demand for Health Services: A Survey of Methods and Findings.
Paper Presented at the AERC Health, Economic Growth and
Poverty Reduction in Africa Framework Workshop, Accra, and
April, 2009.
Australian Commission on Social Determinants of Health. (2007). A
conceptual framework for action on the social determinants of health.
Discussion paper for the commission on social determinants of
health draft April 2007.
Boyd, M., Goyder, J., Joneys, F. E., and McRoberts, H. (1981).
Cross Section and Penal. Belgium. Principal Investigator.
Babbie, Earl. (1989). The practice of Social Research. 5
Editions. Wadsworth Belmont.
84

Bennett, N. G., & Lu, H. (2000). Child poverty in the states: Levels and
trends from 1979 to 1998 (Childhood Poverty Research Brief 2). New
York: National Center for Children in Poverty.
Bugembe, B. Joseph R. Richard and Kagugube J. (2005). Children in
abject poverty in Uganda: Study of criteria and status of those in and out of school
in selected districts in . Retrieved on 08/02/2012.
Barrett, A.E. & Turner, R.J. (2005). Family structure and mental
health: The mediating effects of Socioeconomic Status, Family
Process, and Social Stress. Journal of Health and Social
Behavior, vol. 46 (2), 156-169. American Sociological
Association.
Battin-Pearson S, Newcomb MD, Abbott RD, Hill KG, Catalano RF,
Hawkins JD. (2000). Predictors of early high school drop-
out: a test of five theories. J. Educ. Psychol. 92: 568–82
Bradley RH, Corwyn RF, McAdoo HP, Garcia Coll C. (2001b). The
home environments of children in the United States. Part 1:
variations by age, ethnicity, and poverty status. Child Dev. In
press
Brooks-Gunn J, Klebanov PK, Liaw F. (1995). The learning,
physical, and emotional environment of the home in the
85

context of poverty: The Infant Health and Development
Program. Child. Youth Serv. Rev. 17:251–76
Capraro, M. M., Capraro, R. M., & Wiggins, B. B. (2000). An
investigation of the effect of gender, socioeconomic status, race and grades on
standardized test scores. Paper presented at the meeting of the
Southwest Educational Research Association, Dallas.
Clones, P.J. (1992). The Link between Gender Issues and the
Fragile Environments of Sub-Saharan Africa. Women in
Development Unit. Poverty and Social Policy Division.
Technical Department. Africa region. The World Bank. pp 19.
Currie, J. and Moretti, E. (2007). Biology as destiny? short and
long-run determinants of intergenerational transmission of
birth weight. Journal of Labor Economics 25, 231-264.
Corwyn RF, Bradley RH. (2000). Developmental accomplishments and family-
child activities of preschoolers in the United States: comparisons across three
major ethnic groups and poverty status. Presented at Meet. Southwest.
Soc. Res. Hum. Dev., Eureka Springs, AR, April 13–15
Chauhan, S. S. (1996). Advance Psychology, New Delhi: Vani
Educational Books.
Desmond, C., and Gow, J. (2001). “The cost-effectiveness of 6
models of care
86

for orphans and other vulnerable children.” South Africa.
UNICEF.
Diamond, P. J., & Onwuegbuzie, A. J. (2001). Factors associated
with reading achievement and attitudes among elementary
school-aged students. Research in the Schools, 8(1), 1-11.
Duke, N. K. (2000). For the rich it’s richer: Print experiences
and environments offered to children in very low- and very
high-socioeconomic status first-grade classrooms. American
Educational Research Journal, 17, 441-478.
Engle, P. (2008). “National Plans of Action for Orphans and
Vulnerable Children in sub-Saharan Africa: Where Are the
Youngest Children?” Working Paper No. 50. The Hague, The
Netherlands: Bernard van Leer Foundation.
Evans, G. (2004). The environment of childhood poverty. American
Psychological Association, vol. 59(2), 77-92.
Elgbeleye, O.S and Olasupo M.O. (2011). Parental Socio-economic
Status as Correlates of Child labour in Ile-lfe, Nigeria An
International Journal 8 (2): 139-147.
Foster, G., Makufa, C., Drew, R., and E. Krahre, E. (1997).
"Factors Leading to the Establishment of Child-Headed
Households: The Case of Zimbabwe."
Health Transition Review 7 (supply 2): 155–168.
87

Gilborn, L. (2001). "Influencing of Family and Community in
School Attendance and Performance of Children Affected by
HIV/AIDS in Sub-Saharan Africa." Washington, D.C. USAID.
Galobardes, B., Lynch, J., & Smith, G. (2007). Measuring socio-
economic position in health research. Oxford University
Press. British Medical Bulletin, 1-17.
Gilson, L. and D. McIntyre. (2005). ‘Removing User Fees for
Primary Care in Africa: The Need for Careful Action’, British
Medical Journal 331: 762-5.
George. Z. (2001). Socio-economic status of Children and Women on
Commercial farm. UNICEF. Zimbabwe.
Guo G, Harris KM. (2000). The mechanisms mediating the effects of
poverty on children’s intellectual development. Demography
37:431–47.
Hoff, D. (2002, January 10). State of the states: Louisiana.Education Week: Quality Counts 2002, 21(17), 120.
Inshengoma, C.G. (2010). Accessibility of Resources by Gender.
The case study of Morogoro Region Tanzania. Morogoro. Sokoine
University of Agriculture.
88
Kajembe, G.C., Kessy, J.F., Nduwamungu, J., Mndolwa, M., Msuya,
T., Bakengesa, S., and Maduka, S. (2004). Best Method for
Dissemination of Agroforestry Intervention at HASH/ICRAF and
Ruvufuelwood Pilot Project. Morogoro. Tanzania Forestry
Research Institute (TAFORI).
Kalibala, S., and Elson, L. (2009). Protecting Hope Situation
Analysis of Vulnerable Children in Uganda, New York.
Population Council.
Mhamba, R., and Hemed, M. (2008). Zanzibar Most Vulnerable
Children Situation
Analysis. Zanzibar. Ministry of Health and Social Welfare.
Zanzibar.
Mackenbach JP, Bakker MJ, Kunst AE, and Diderichsen F. (2002).
Socio-economic inequalities in health in Europe – An
overview. In Reducing inequalities in health a European perspective.
Routledge. London:
McLeod, D., & Shanahan, M. (1996). Trajectories of poverty and
children’s mental health. Journal of Health and Social
Behaviour, vol. 37(3), 207-220.
McLeod, D., & Shanahan, M. (1993). Trajectories of poverty and
children’s mental health. Journal of Health and Social
Behaviour, vol. 27(6), 206-124.
89

National Bureau of Statistics Tanzania. (2002). Population and
Housing Census.
Tanzania. National Bureau of Statistics Tanzania. Parson, R. D., Hinson, S. L., Sardo-Brown, D. (2001). Educational
Psychology: A Practitioner- Researcher Model of Teaching.
Singapore: Thomson Learning Inc.
Revolutionary Government of Zanzibar. (2009). North ‘A’ District
Strategic Plan. Zanzibar. Revolutionary Government of
Zanzibar.
Revolutionary Government of Zanzibar. (2008). North ‘A’ district
Profile. Revolutionary. Zanzibar. Revolutionary Government of
Zanzibar.
Revolutionary Government of Zanzibar. (2004). Institutional
Analysis. Ministry of Zanzibar. Finance and Economic Affairs
Zanzibar.
Richter, L., Manegold, J., and Pather, R. (2004). Family and
Community Interventions for Children Affected by Aids.
New York. HSRC Publishers.
Rector, R., Johnson, K. A., & Fagan, P. F. (2001). Understanding
differences in Black and White child poverty rates (Report No. CDA01-04.
90

The Heritage Center for Data Analysis). Washington, DC: The
Heritage Foundation.
Subbarao, K., Mattimore., A and Plangemann, K. (2001). "Social
Protection of Africa’s Orphans and Other Vulnerable Children:
Issues and Good Practice Program Options." Human Development
Working Paper series, Africa Region. Washington D.C.: World
Bank, August.
Strohschein, L. A. (2005). Household income histories and child
mental health
trajectories. Journal of Health and Social Behavior 46, 359-375.
Thurman, T.R., Hoffman, A., Chatterji., M and Brown, L. (2007).
Kilifi orphans
and Vulnerable Children. Kenya. Catholic Relief Services.
Thompson, A.O. (1997). The haunting Past: Politics, economics and
race in the Caribbean. Jamaica. Ian Randal Publisher.
Thomas, D. (2009). The Causal Effect of Health on Social and
Economic Prosperity: Methods and Findings. Department of
Economics and Duke Global Health Institute, Duke University
Mimeo (Paper Presented at the AERC Health, Economic Growth
and Poverty Reduction in Africa Framework Workshop, Accra,
April, 2009).
91

UNAIDS (United Nations Programme on HIV/AIDS) and UNICEF (United
Nations Children’s Fund), (1999). “Children orphaned by AIDS:
Frontline Responses from Eastern and Southern Africa”. New York and
Washington D.C. USAID.
United Nations Children’s Fund (UNICEF). (2006). Early Childhood
Kenya. Nairobi Kenya. UNICEF.
UNICEF. (2008). Care for Orphans and vulnerable children.
Tanzania. Department of Social Welfare Tanzania.
USAID. (2010). Review of Orphan and Vulnerable Children (OVC) in
HIV/AIDS to fight against Tuberculosis and Malaria.
Washington. United State Agency.
UNDP. (2009). Human Development Report 2009. Overcoming Barriers: Human
mobility and development. UNDP New York.
U.S. Census Bureau. (2001). Poverty in the United States: 2000 (Report No.
P60-214). Retrieved March 4, 2012, from
http://www.census.gov/hhes/poverty.
World Bank. (2006). Ensuring Education Access for the Orphans and
Vulnerable Children. 2nd Edition. London. World Bank.
Wilson, T., Giese, So., Meitjes, H., Croke, R., and Chamberlein,
R. (2002). A conceptual Framework for the Identification,
support and Monitoring of children experiencing Orphanhood.
UK. Save the Children. 92

World Vision International. (2005). Guide to Mobilizing and
Strengthening Orphans and Vulnerable Children. Uganda. World
Vision International.
LIST OF APPENDICES
APPENDIX I: TRANSMITTAL LETTER
93
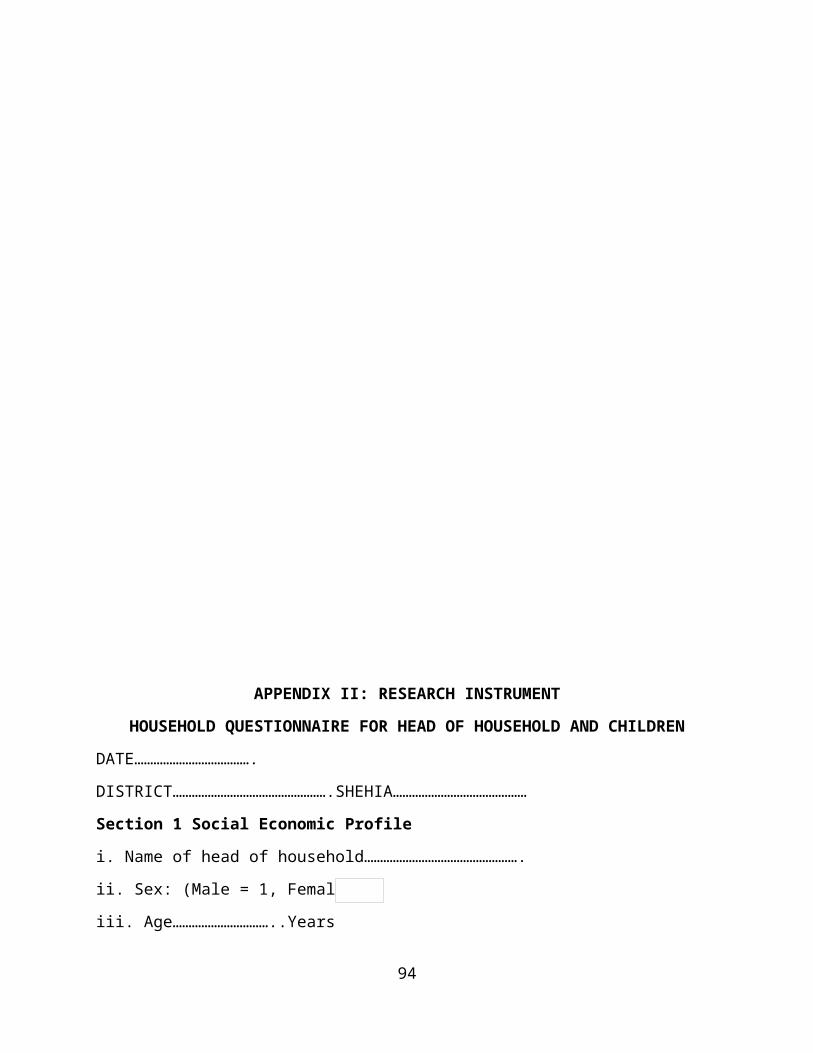
APPENDIX II: RESEARCH INSTRUMENT
HOUSEHOLD QUESTIONNAIRE FOR HEAD OF HOUSEHOLD AND CHILDREN
DATE……………………………….
DISTRICT………………………………………….SHEHIA……………………………………
Section 1 Social Economic Profile
i. Name of head of household………………………………………….
ii. Sex: (Male = 1, Female =2)
iii. Age…………………………..Years
94

iv. Marital Status: Tick mark one (√)
1. Single
2. Married
3. Divorced
4. Widowed
5. Separated
v. How many wives are in this family? Write down the number of
wives
vi. Educational status of parent/ guardian: Tick mark one (√)
1. No formal education
2. Adult education
3. Primary education
4. Secondary education
5. College
vii. Total number of household members…………..Males…………Females………
viii. Total number of children under 18 years……….Males……….Females…………
xi. Those attending school…………Males………..Females…………
x. Those not attending school............Males………..Females…………..
Section 2 Occupational and Income of the Parents
1. Occupation of the head of household. Which of the following
statements about 95

occupational status applies to you? Tick mark one (√)
1. Farming
2. Livestock keeping
3. Fishing
4. Business
5. Employed
6. Self-employed
7. No work
2. What is the monthly household income, net income after
deductions?
Below 50,000 T.sh
50,000 – 100,000 T.sh
100,000- 150,000 T.sh 150,000- 200,000 T.sh 200,000- 250,000 T.sh 250,000- 300,000 T.sh 300,000- 350,000 T.sh 350,000- 400,000 T.sh 400,000- 500,000 T.sh 500,000-550,000 T.sh 550,000-600,000 T.sh
96

600,000 and more
3. Which kind of income you receive?
i) Earning from employment or self-employment
ii) State retirement pension
iii) Pension from former employer
iv) Child benefits
vi) Income Support
vii) Family Credit
viii) Housing Benefit
xi) Other state benefits
x) Interest from savings and investments (e.g. stocks & shares)
xii) No source of income
4. Does anyone else in the household have an income from any
source?
1= Yes
2= No
5. If yes which type of work?
i) Employed
ii) Self-employed
iii) Business
97

6. How many times do you manage to provide food for your family
per day?
i) One
ii) Two
iii) Three
iv) Some day passes without any food
7. State the priority needs for your children i)………………………………………………. ii)………………………………………………. iii)………………………………………………. 8. Are your children vulnerable? 1=Yes 2=No
9. If yes write the problems that face in their everyday life
i)………………………………………………………………………………………………………………
ii)………………………………………………………………………………………………………………
iii)……………………………………………………………………………………………………………..
10. The major causes of vulnerability of children are: - Circle
the correct, you
may circle more than one.
i. Chronically illness of parents 1ii. Chronically illness of Children 2
iii. Disabilities 3iv. Extreme poverty 4v. Death of parents 5vi. Early marriage 6
vii. Drug abuse 7viii. Prostitution 8
ix. Extraneous child labour 9x. Other……………………….. 10
98

11. How many socio-classes are there in this community? Mark one
tick (√) in
the box.
i) One
ii) Two
iii) Three
12. Choose your class level. Mark one tick (√) in the box.
i) First class
ii) Middle class
iii) Lower class
HOUSEHOLD QUESTIONNAIRE FOR HEAD OF HOUSEHOLD
Section 3 Household Economic Status
From the following statements Tick mark (√) one as per your
economic status.
No Questions Strongly Agree
Agree Neutral
Disagree
StronglyDisagree
Q. 13
There are vulnerable children inthis community. 1 2 3 4 5
Q. 14
Extreme poverty, divorce, earlymarriage, polygamy and childlabour are major causes ofvulnerability.
1 2 3 4 5
99
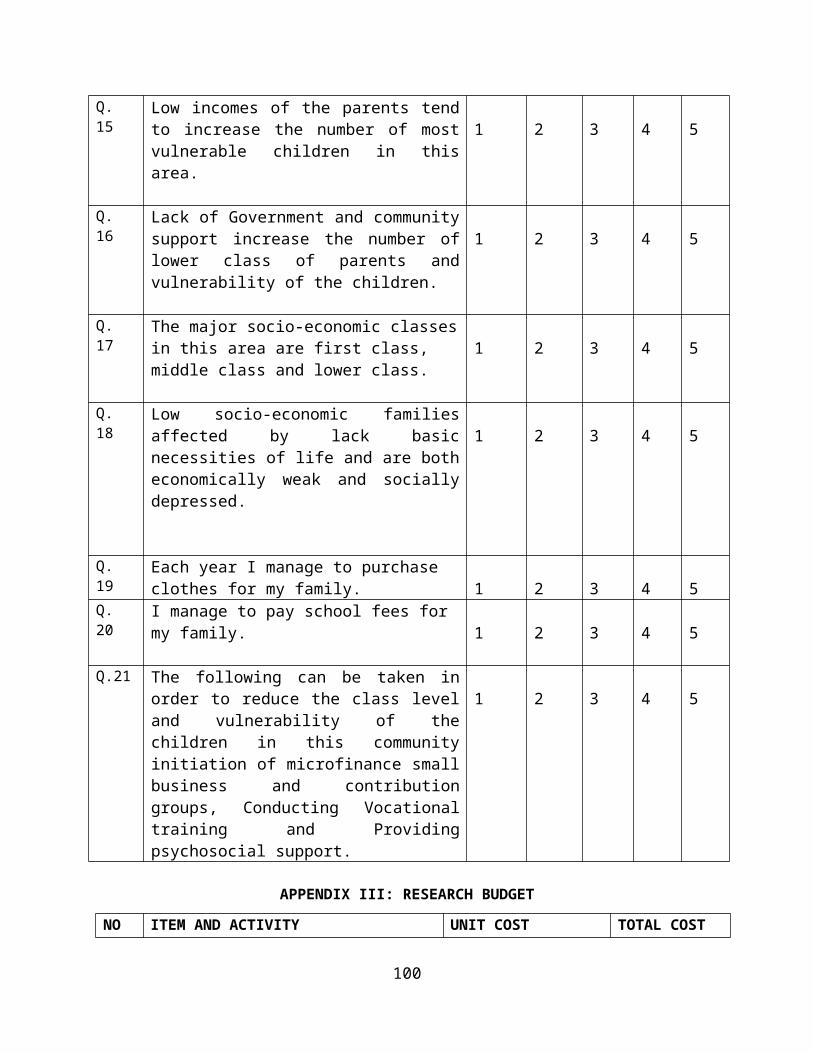
Q. 15
Low incomes of the parents tendto increase the number of mostvulnerable children in thisarea.
1 2 3 4 5
Q. 16
Lack of Government and communitysupport increase the number oflower class of parents andvulnerability of the children.
1 2 3 4 5
Q. 17
The major socio-economic classesin this area are first class, middle class and lower class.
1 2 3 4 5
Q. 18
Low socio-economic familiesaffected by lack basicnecessities of life and are botheconomically weak and sociallydepressed.
1 2 3 4 5
Q. 19
Each year I manage to purchase clothes for my family. 1 2 3 4 5
Q. 20
I manage to pay school fees for my family. 1 2 3 4 5
Q.21 The following can be taken inorder to reduce the class leveland vulnerability of thechildren in this communityinitiation of microfinance smallbusiness and contributiongroups, Conducting Vocationaltraining and Providingpsychosocial support.
1 2 3 4 5
APPENDIX III: RESEARCH BUDGET
NO ITEM AND ACTIVITY UNIT COST TOTAL COST
100
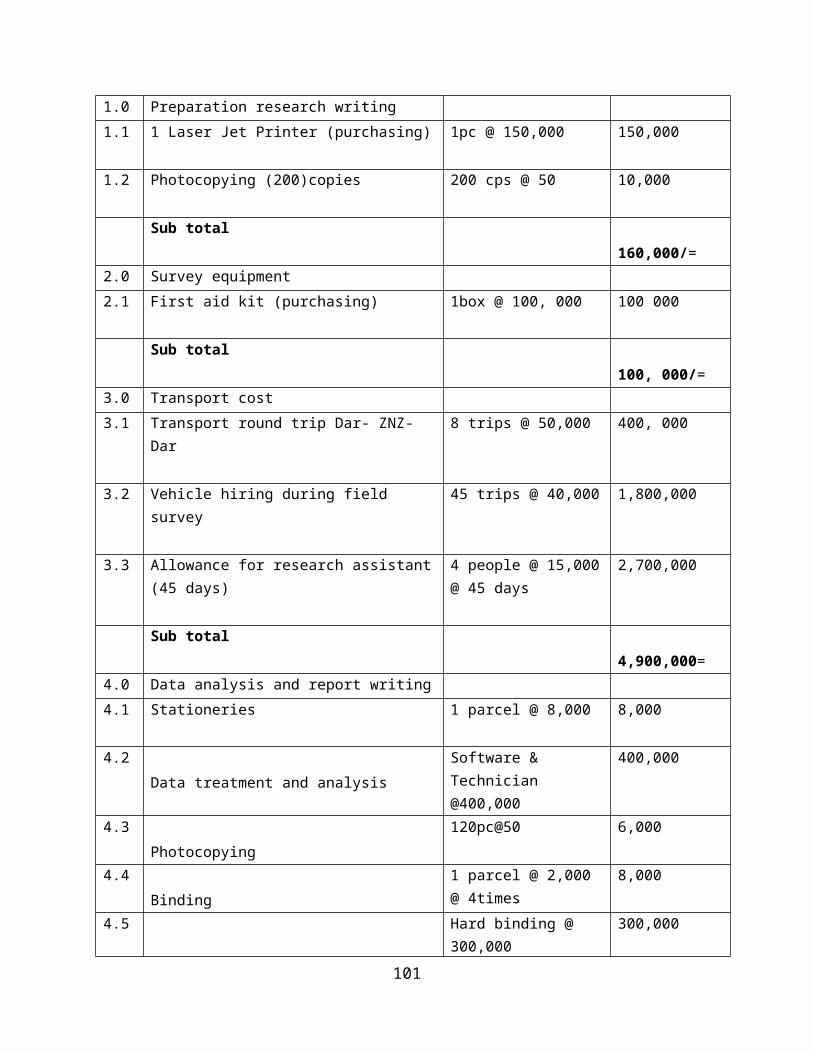
1.0 Preparation research writing1.1 1 Laser Jet Printer (purchasing) 1pc @ 150,000 150,000
1.2 Photocopying (200)copies 200 cps @ 50 10,000
Sub total160,000/=
2.0 Survey equipment2.1 First aid kit (purchasing) 1box @ 100, 000 100 000
Sub total100, 000/=
3.0 Transport cost3.1 Transport round trip Dar- ZNZ-
Dar8 trips @ 50,000 400, 000
3.2 Vehicle hiring during field survey
45 trips @ 40,000 1,800,000
3.3 Allowance for research assistant(45 days)
4 people @ 15,000@ 45 days
2,700,000
Sub total4,900,000=
4.0 Data analysis and report writing4.1 Stationeries 1 parcel @ 8,000 8,000
4.2Data treatment and analysis
Software & Technician @400,000
400,000
4.3Photocopying
120pc@50 6,000
4.4Binding
1 parcel @ 2,000 @ 4times
8,000
4.5 Hard binding @ 300,000
300,000
101
Final production (binding)
Sub total 722,000/=
GRAND TOTAL 5,882,000/=
APPENDIX IV: CURRICULUM VITAE
ALI MOHAMED ALI
P.O.BOX 873LUMUMBA SECONDARY CSHOOL
ZANZIBAR, TANZANIAMobile: +255-777-864086
Email: [email protected]
Family status: Married with children
Nationality: Tanzanian
Date and place of birth: 05th November, 1972 Zanzibar
Gender: Male
PROFESSION: Teacher, Major subjects are Biology andChemistry
Education2001-2004 Chukwani University College
Zanzibar, Tanzania
Bachelor Degree of Science with Education (BSc. Ed)
102

1995-1997 Nkrumah Teacher Training College
Zanzibar, Tanzania
Grade ‘A’ Teacher Certificate
Secondary Education
1998-2000 Lumumba Secondary school
Zanzibar, Tanzania
A- Level certificate of Secondary Education
1992-1994 Lumumba Secondary school
Zanzibar, Tanzania
O- Level Certificate of Secondary Education
Primary Education
1982-1992 Mkwajuni Primary School
Zanzibar, Tanzania
Standard one to form three
Employment Experiences
Ministry of Education
1997-2000 Mkwajuni Primary School
Zanzibar, Tanzania
2000-2004 Potoa Secondary School
Zanzibar, Tanzania
103
2004-2007 Nkrumah Teacher Training College
Zanzibar, Tanzania
2007-to now Lumumba Secondary School
Zanzibar, Tanzania
TUNAJALI (WE CARE)
2008-2010 MVC/HBC Focal Person
Zanzibar, Tanzania
Africa Muslim Agency
2008-2010 Al-Ihsan Girl Secondary School
Zanzibar, Tanzania
Currently: I’m Student in Kampala International
University, I pursuing
Master degree of Project Planning
and Management.
Already completed course work and
now I’m in research.
Training
2011 Proposal writing training which
sponsored by ReCOMAP
Zanzibar, Tz
104

2009 Report writing training of
identification of MVC
sponsored by FHI, USAID and Sight
Server International
Zanzibar, Tz
2009 Life skills and care of PLWHA and MVC
sponsored by
TUNAJALI.
Kibaha, Tanzania
Other Skills and Experiences
2004-2005 I was Zanzibar Election Officer in North ‘A’
District.
Zanzibar, Tanzania
2006 Participate in Preparation of Biology
books for Zanzibar
Schools sponsored by USAID.
Zanzibar, Tanzania
I’m Executive Secretary for
Mnarani Natural Aquarium
105
since 2004 up to now.
Languages
i) Kiswahili (Read, speak and write excellent)
ii) English (Read, speak and write excellent)
106
Copyright © 2022 FDOKUMEN