
CHAPTER ONE Introduction - Research UNE
288
1 CHAPTER ONE Introduction 1.1 Introduction It is acknowledged that financial institutions in any developed or transition economy ease the credit flow in the economy (Richard 2011). Financial sectors play an important role for economic growth in any country (Rajaraman and Vasishtha 2002). Effective performance of financial institutions reflects the prosperity and growth of the nation whereas weak performances hamper the economic growth of a country (Khan and Senhadji 2001). This is evidenced by many banking failures all over the world. The consequence of these banking failures in the economy is to reduce the credit flow in the country which ultimately affects the efficiency and productivity of the business units (Chijoriga 1997). According to Brownbridge (1998), many empirical researchers have shown that most of the time banking failures or banking crises are caused by Non-performing Loan (NPL) and lower bank performance. NPL booked as expenses by the bank directly affects the bank’s performance. All these bank failures, high incidence of loan default, bank insolvency, bank’s lower performance have lighted the importance of investigation of determinants of NPL and bank performance. At present, minimizing and investigating the degree of systemic risk in banking is a major concern of policymakers (Demirgüç-Kunt and Detragiache 1998). Among the various risks in banks, credit risk is the primary cause of bank failure (Bhattacharya and Roy 2008). It has found that effective credit risk management is essential for banking in order to minimize credit losses (Santomero 1997). Besides this, the corporate governance also plays a critical role in the long term financial survival of any firm (Stanwick and Stanwick 2010). However, when putting an effective risk management in place, some loans turn to be in distress in the due course of time for various reasons. It, therefore, understands the drivers of NPL and impact of corporate governance on bank performance which is a major issue for financial stability. In Nepal, the commercial bank has the dominant position in the financial system and a total 31 commercial banks are providing various facilities to the Nepalese people. Considering the various risks faced by banks, the Nepal Rastra Bank (NRB) i.e. the central bank is issuing
-
Upload
khangminh22 -
Category
Documents
-
view
0 -
download
0
Transcript of CHAPTER ONE Introduction - Research UNE
1
CHAPTER ONE
Introduction
1.1 Introduction
It is acknowledged that financial institutions in any developed or transition economy ease the
credit flow in the economy (Richard 2011). Financial sectors play an important role for
economic growth in any country (Rajaraman and Vasishtha 2002). Effective performance of
financial institutions reflects the prosperity and growth of the nation whereas weak
performances hamper the economic growth of a country (Khan and Senhadji 2001). This is
evidenced by many banking failures all over the world. The consequence of these banking
failures in the economy is to reduce the credit flow in the country which ultimately affects the
efficiency and productivity of the business units (Chijoriga 1997). According to Brownbridge
(1998), many empirical researchers have shown that most of the time banking failures or
banking crises are caused by Non-performing Loan (NPL) and lower bank performance. NPL
booked as expenses by the bank directly affects the bank’s performance. All these bank
failures, high incidence of loan default, bank insolvency, bank’s lower performance have
lighted the importance of investigation of determinants of NPL and bank performance.
At present, minimizing and investigating the degree of systemic risk in banking is a major
concern of policymakers (Demirgüç-Kunt and Detragiache 1998). Among the various risks in
banks, credit risk is the primary cause of bank failure (Bhattacharya and Roy 2008). It has
found that effective credit risk management is essential for banking in order to minimize
credit losses (Santomero 1997). Besides this, the corporate governance also plays a critical
role in the long term financial survival of any firm (Stanwick and Stanwick 2010). However,
when putting an effective risk management in place, some loans turn to be in distress in the
due course of time for various reasons. It, therefore, understands the drivers of NPL and
impact of corporate governance on bank performance which is a major issue for financial
stability.
In Nepal, the commercial bank has the dominant position in the financial system and a total
31 commercial banks are providing various facilities to the Nepalese people. Considering the
various risks faced by banks, the Nepal Rastra Bank (NRB) i.e. the central bank is issuing
2
various guidelines and directives such as the Capital Adequacy Framework 2007, Risk
Management Guidelines 2010, Corporate Governance directives and also modifying them
from time to time for risk management purposes (NRB 2010 'a'). Despite the substantial
progress made in terms of improving the efficiency and competitiveness related with the
financial system in the Nepal, some of the commercial banks such as Nepal Bank Limited,
Rastriya Banijya Bank, Nepal Bangladesh Bank Limited are facing the NPL problem (Dahal
2009). Various studies (Demetriades and Luintel 1996; Acharya 2003; Shrestha 2005;
Pokhrel 2006; Ferrari, Jaffrin et al. 2007) related to financial and banking sector services,
policies, liberalization and development have been done in context of Nepal. To the best of
my knowledge, no in-depth studies have been conducted to investigate the determinants of
NPL and the role of corporate governance mechanism on bank performance in Nepalese
bank. This research intends to fill a gap in research as the first in-depth study in to the
determinants of NPL and the role of corporate governance on bank performance in Nepal.
1.2 Background of the Studies and Statement of the Problem
Banks do transactions with other people's money as a way of balancing the relationship
between saver and borrower. Banks have an obligation to provide liquidity demand of
depositors through checking accounts and to extend credit to their borrowers through lines of
credit (Kashyap, Rajan et al. 2002; Cebenoyan and Strahan 2004). Modern economies are
often known as “credit-based” economies, where money plays an important role as a means
of exchange. Extension of credit is one of the tasks of financial intermediaries and support for
the development and performance of financial intermediaries (Stals 1998). Credit
corresponds to the size of the bank’s assets portfolio (Kitua 1996; Richard, Chijoriga et al.
2008). Banks face several risks which include credit risk, interest rate risk, liquidity risk,
market risk, foreign risk and political risk. Banking, therefore, is a business that always has to
face risk and deal with it (Campbell 2007). A bank’s asset portfolio adds up to a large
proportion of the credit risk which is often measured as NPL to total loans as it accounts for
10-15 times the equity of a bank (Kitua 1996; Richard, Chijoriga et al. 2008). Internal
variables as potential determinants of risk measured as the unsystematic risk (Hassan 1993;
Brewer 1996; Gallo, Apilado et al. 1996; Angbazo 1997; Berger and DeYoung 1997; Ahmad
and Ariff 2007) and change in external variables in the financial markets, regulation and
economic conditions as affecting the systematic bank risk (Hassan, Karels et al. 1994;
Corsetti, Pesenti et al. 1998; Ahmad and Ariff 2007). Both variables provide evidence of
3
significant relationships between the internal variables, external factors and bank risk
(Ahmad and Ariff 2007).
Considering all this, regulators make sure that depositors do not lose money and borrowers
return money and that the economy does not suffer in any way. Unlike non-financial
institutions, banks are subject to dual monitoring: one by the regulatory bodies and the other
by the bank’s governance. The monitoring and oversight of the regulators and the compliance
of banks with regulatory requirements provides an alternative governance mechanism which
is absent in the non-financial industry (Adams and Mehran 2003). It follows that effective
supervision of the banking industry by the regulators can work as a complementary force for
good governance. Apart from monitoring, regulators such as the central bank of a country
intervene in the management of banks in terms of makeup of the board of directors and their
responsibilities relating to supervision of banking activities. The broad framework and
detailed guidance for credit risk assessment and management is provided by the Basel New
Capital Accord which is now widely followed internationally (Campbell 2007). Most
countries are implementing the ‘better wait’ and gradual approaches, in the face of huge
challenges posed by Basel II. A significant number of countries have it in mind to suspend
the execution of Basel II or decide on simple approaches for determining credit risk
(Gottschalk 2007).
The development of the financial sector in Nepal has been influenced by overall low
economic standards. However, in the last two decades, the financial sector background
changed significantly in terms of the depth of financial services offered as well as in terms of
the range and number of financial intermediaries which forced the financial sector into
becoming one of the most dynamic sectors in the Nepalese economy (Joras 2008).
The country’s financial system is highly dominated by the banking sector (Pokhrel 2006).
The country’s banking system is composed of commercial banks, development banks,
finance companies and micro-credit banks which come into the financial institute category.
There are some co-operative and Non-government Organizations (NGO) licensed to
undertake limited banking activities as non-classified financial institutions (NRB 2010 'a').
The commercial banking sector is the largest component of the financial system (Pokhrel
2006). The commercial bank has been classified in both the public and private sector, where
private banks can be further re-grouped into local private banks and foreign joint venture
private banks. As of July 2009, there were 26 private sector commercial banks i.e. 16 local
4
private banks, 7 foreign joint venture private banks, and 3 public banks. They were
represented by a total 752 branches, out of which 309 branches belonged to public banks and
the rest belonged to private sector commercial banks. Private bank access to the countryside
or rural area is limited whereas the public sector bank is still the largest bank in all aspects for
both deposit and credit mobilization (NRB 2010 'a').
There has been a paradigm shift in the Nepalese financial system in recent times. Before
liberalization i.e. 1984, various norms set down as part of the central bank rules and
regulations such as regulated interest rate, cash reserve ratio and statutory liquidity ratio
interfered with the portfolio choice of the bank directed by central bank were obstacles for
the development of the financial sector. Only two banks were the main players in the banking
sector and the credit information system was too weak. As a result, defaulters could get a
loan from other banks (Shrestha 2005). In late 2007, a global financial challenge appeared in
the world context. At the same time, global concerns were raised about the stability of the
financial sector which became a central challenge to bank regulators and supervisors (NRB
2010 'a'). Financial liberalization may be of assistance for the development of the domestic
financial system in terms of size and efficiency (Khanal 2007), which paved the way for the
establishment of new banks and non-bank financial institutions in the country (NRB 2009).
Removal of entry barriers, interest deregulation, freedom in setting of deposit and loan rates,
issuance of prudential norms for capital adequacy requirements, loan classification, loan loss
provision, interest rate recognition, single borrower limits and account disclosure were the
main outcomes of financial liberalization in the country (Shrestha 2005).
It is a belief of some macro-economists that only real macro-economic matters are behind the
causes of the banking crises (De-Juan 1996). Macro-economic instability, lending booms and
asset price bubbles, and inadequate preparation of financial liberalization are the factors
usually behind banking crises (Goldstein and Turner 1996). Many bankers support this view
as they never considered themselves to be blamed for poor management (De-Juan 1996).
Systemic banking sector problems are not solely related to a weak macro-economic
environment. Although all banks in a country face the same macro-economic conditions,
generally not all of them fail. Sometimes the structural characteristics of the banking sector
and of the economic environment also play a role (Demirguc-Kunt and Huizinga 1998).
Problems with failed banks are almost never simply the result of depressed economic
conditions. It is the international experience that, even in the midst of an economic

5
depression, good banks can manage satisfactorily. On the other hand, in even prosperous
economies, there are banks that go under (De-Juan 1996). For example, bad lending practices
fuelled by poor supervision and regulation leading to rapid lending growth and extreme risk
taking behavior are the main problems faced by the Asian banking system (Mishkin 1999). In
Spain, some well managed banks adjusted their policies during an economic slump, and
simultaneously a deep and widespread banking crisis occurred in the late 1970s and early
1980s and they became stronger than before, actually very strong. However, in the same
country, in a satisfactory economic context during the late 1980s and early 1990s, a large
bank, Banesto, failed due to poor management practices rather than systemic problems. A
1968 survey on bank failure, based on an analysis of the behavior of banks which failed
between 1979 and 1987, concluded that poor asset quality and bank management practices,
not economic factors, were the major causes of the decline for problem banks (De-Juan
1996).
In Nepal, the Nepal Rastra Bank (NRB) is performing a crucial role providing technical
assistance and support from international experts in improving the overall control and
supervision of the financial system (Ramamurthy 2004). Credit problems have been
identified as the major drivers behind banking difficulties which are created by a weakness in
credit risk management (Richard, Chijoriga et al. 2008). A board of directors and senior
management of each bank have the responsibility to approve the credit risk strategy and any
policies relating to credit risks and their management (Basel 2006). Banks should have a
clearly established process for management of credit risk when approving new credit as well
as extending existing credit (Basel 1999). For this process, the Nepal Rastra Bank (NRB) is
taking a serious look at improving credit risk management practices (NRB 2010 'a'). Various
directives on capital adequacy, prudential norms, provisioning requirements, corporate
governance guidelines and the credit risk management methods have been issued by the
NRB. However, banks within the country continue to suffer from NPL and poor corporate
governance (Ramamurthy 2004).
A bank very frequently suffers from poor lending practices (Koford and Tschoegl 1999).
Monitoring and other appropriate steps are necessary to control or mitigate the risk of
connected lending when it goes to companies or individuals (Basel 1999). Therefore, the
NRB has issued guidelines with attention to general principles that are prepared for
governing the implementation of more detailed lending procedures and practices within the

6
bank. The NRB has issued some criteria, such as the credit assessment of borrowers (macro-
economic factors and firm specific analysis), the purpose of credit, track records, repayment
capacity, liquidity status of collateral for new credit, as well as the renewal and expansion of
existing credit. The bank has exclusive access to a continuous stream of borrower data that
helps it to monitor the borrower, namely the firm's transactions in the bank (Mester,
Nakamura et al. 1998).
The Credit Information Bureau, under the auspices of the NRB, is the provider of information
on the borrowings in the financial system. It is mandatory for the bank and financial
institutions to seek information about the borrower before sanctioning/ enhancing/ reviewing
any credit facilities beyond NPR.1 million, per party (Ramamurthy 2004). It is mandatory for
a bank to prepare Credit Policy Guidelines for making investments and lending decisions and
which reflect a bank tolerance for credit risk. Prior to consent to a credit facility, the bank
should make an assessment of the risk profile of its customers such as of their business, and
which can be done through the credit procedure (NRB 2010).
Information asymmetry is the main problem faced by bankers at the first stage in a process of
assessment of a lending application (Binks and Ennew 1996; Binks and Ennew 1997). Many
business decisions rely significantly on accounting information and also include the very
important area of bank lending (Danos, Holt et al. 1989). Financial statement information
plays a major role in the credit evaluation phase of the commercial loan decision (Libby
1979). The bank requires a balance sheet, and most prefer an audited financial report for the
estimation of credit risk (Koford and Tschoegl 1999). Summarized financial data helps the
lenders to gain a high level of confidence in their credit granting decision very early in the
evaluation process (Danos, Holt et al. 1989). Similarly, the most important step in
commencing any new business enterprise, or expanding an existing one, is the construction of
a business plan. The business plan is the feasibility report of a business giving the
entrepreneur his first and often only probability of impressing potential sources of finance
with the quality of a proposal (Barrow, Barrow et al. 2005).
As a part of credit evaluation, almost all banks require prospective borrowers to submit a
business plan and a credit officer then critically assesses the plan. One problem with any
business plan is that the client they may not have any idea of how to prepare such a plan, and
the officers themselves end up teaching the borrower (Koford and Tschoegl 1999). A second
7
issue is that firms appear to be genuinely either too optimistic about the possibilities of their
business or mostly arbitrary (Koford and Miller 1995).
Nepalese banks are facing problems surrounding sound accounting and reporting standards,
which are necessary primary prerequisites for commercial activities (ADB 2010). It is helpful
to lenders to assess the need for the loan, its purpose and the quality of the borrower’s
organization through the provision of sound accounting data (Danos, Holt et al. 1989).
Financial statements, either unaudited or audited, do not necessarily reflect a “true and fair”
transaction of the business entity due to imaginative accounting in the country and also do not
reveal details relating to a company’s accounting policies and status of income tax
assessments (Ramamurthy 2004). Information available to lenders is often incomplete or
expensive to establish because it is believed that many companies in Nepal submit the
required financial information with a few years delay, while continuing their businesses
without much penalty due to insufficient supervision. As a result, credit is granted on the
basis of collateral and personal guarantees instead of on a credit analysis which relies on
financial statements and business plans (ADB 2010). It is believed that accounting
professionals are not doing their duty as per their ethics. The Governor of the Central Bank
of Nepal has criticized the practice of preparing two types of financial reports for companies
by their accountants (Kantipur 2010), which reflects the belief that business plans or
accounting statements submitted by entrepreneurs are not always reliable. Besides that, it is
generally felt that Nepal’s tax policies, particularly for income tax, have many deficiencies
which allow tax officers to perform optional powers, resulting in arbitrary tax assessment.
Many companies maintain different books and accounts for different purposes, such as one
for tax assessment and a separate one for credit applications (ADB 2010). Due to the lack of
exchange of information about credit facilities availing from entities, the financial system is
not served efficiently. This reflects a high degree of credit risk within the country
(Ramamurthy 2004).
The problem of defaulters and NPL is massive as are the related issues of loan recovery
problems (Singh 2004; Joras 2008). The NPL comprised NPR.13954.96 million (1USD
194.73 million) in 2010 January down from NPR.32095 million (USD 447.88 million) in
1 USD 1 is equivalent to Nepalese Currency (NPR) 71.66 as per exchange rates of date 07/03/2011

8
2003 (NRB 2010'b'). The volume of NPL thus needed to be broken down to better understand
the reasons for the existing levels of NPL (NRB 2010 'a'). It seems that the industry is putting
much effort into the recovery of the bad loans (Panta 2007). The NPL were 28.68 percent in
2003 which was reduced to 3.01 percent in 2009 (NRB 2010'b'). In reality, the reduction is
mainly due to ever greening of loans and huge write-offs by commercial banks. If this
problem is unmanaged the overall health of the country’s financial system will suffer (Panta
2007). For management of this problem, a few banks have in place good credit risk
management systems and procedures, while the rest of them are in the process of doing so.
Advanced forms of loan grading and credit portfolio management models are not used by the
Nepalese commercial bank (Khanal 2007).
Nepal is an emerging economy in South Asia, where the institutional, regulatory and legal
environment is different than those in force in developed economies. In order to promote
good governance in the banking sector, regulatory response was provided by the NRB and
other regulatory organizations. The Company Act is the law which mainly governs
incorporated entities in Nepal. The Act provides for certain supervisory functions and rights
to the shareholders to attend meetings, appoint and remove directors, and to obtain financial
information as well as to approve the balance sheet annually. The other prominent legal and
regulatory frameworks were provided by the Bank and Financial Institution Act (BAFIA),
Securities Exchange (SE) Act. These legal and regulatory frameworks were found to be
inadequate and inefficient for promoting good governance in the Nepalese banking sector.
NRB promulgated a code of corporate governance for banks in 2006. It distilled rules and
regulations relating to responsibilities and authorities of the chairman, Chief Executive
Officer (CEO), and board of directors. Other prominent features of this bank governance is
related to instituting committees such as audit committees and guidelines for appointment of
bank directors. However, the performance of Nepalese commercial bank is still weak due to
practice of poor corporate governance.
Considering the NPL problem faced by the bank, the NRB issues various norms and
directives from time to time for the commercial bank. In spite of the substantial progress
made in terms of improving the efficiency and competitiveness of the financial system, a
concern of policymakers remains in terms of the high NPL and poor corporate governance.
9
1.3 Objectives of the Study
The main objective of this thesis is to identify the determinants of NPL and influence of
corporate governance on NPL and performance in Nepalese commercial banks
Under the main objectives, this thesis is trying to explore the following sub objectives:
a. What are the macro-economic determinants of NPL in Nepalese commercial banks?
b. What are the bank specific determinants of NPL in Nepalese commercial banks?
c. What are the combined macro-economic and bank specific determinants of NPL in
Nepalese commercial banks?
d. What are the impact of governance on NPL and performance in Nepalese commercial
banks?
1.4 Significance of the Study
Financial development is an outstandingly robust determinant of income growth (Levine and
Zervos 1993; Benhabib and Spiegel 2000) and believed by many economists to be of leading
importance for output growth (Levine 1997). Financial intermediaries are successful elements
of the financial system and play a key role in improving the performance of any economy
(Morawski 2007). Assets of the financial intermediary sector and domestic credit are
positively correlated with economic growth (King and Levine 1993; Aghion, Howitt et al.
2005). Similarly, at the business level, it has been shown that firms in countries with more
financial development efficiently obtain more external funding and, thereby, grow faster
(Demirgüç-Kunt, Detragiache et al. 2006; Das and Ghosh 2007). It can also be shown that
financial backwardness may hold back the ability of agents to invest (Benhabib and Spiegel
2000). In particular, government restrictions on the banking system, such as interest rate
regulation, high reserve requirements and direct lending programs may provide obstacles to
financial development and reduce output growth (McKinnon 1973; Christopoulos and
Tsionas 2004). However, banks can provide important triggers for economic growth and
remain also the most important source of finance for a majority of the real sectors while
playing a dominant role in their financial system (Godlewski 2006). In this context,
commercial banks are financial institutions which assist services such as the provision of
credit to borrowers in emergent economies where the people have no access to the capital
market (Van Greuning and Bratanovic 2000). Efficient commercial banks boost economic
growth whereas inefficient commercial banks hinder economic progress and exacerbate
poverty (Barth and Caprio 2004).

10
In Nepal, commercial banks alone held more than 80.08 percent of the total assets of the
financial system in 2010 January (NRB 2010'b'). With a broad network of branches, the state-
owned commercial banks have an important role to play in the provision of financial
infrastructure but other players, including the private commercial banks, also have essential
contributions to make (Joras 2008). The deposit and credit ratio to Gross Domestic Product
(GDP) reflects the importance of a banking system in the economy of country, and a greater
ratio indicates the expansion of the role of credit as a source of funding for economic
activities in the country (Acharya 2003). However, performance of the state owned banks is a
major challenge for the country’s financial sector (Joras 2008). State owned banks still hold
more than 30 percent of total banking sector assets and also have the largest branch network,
even though there is rapid entry of new private banks (Peiris 2008). The commercial banks
hold the dominant share of the major balance sheet components of the financial system. Of
the total deposits in 2010 January, the commercial banks owned 81.9 percent of their share
(NRB 2010'b'). Total assets of the commercial banks stood at 88 percent of GDP in January
2010, increasing from 62 percent of GDP 2001 (NRB 2010'b'). Credit growth accelerated
from below 20 percent in 2007 to over 30 percent in 2010 (Pitt, Ariyapruchya et al. 2010).
The rapid increase in credit and asset prices over the past few years may have adversely
affected the loan quality down the line which itself has led to a buildup of systemic risks (Pitt,
Ariyapruchya et al. 2010). One bank’s loan may wind up as another bank’s deposit (Tobin
1964). Therefore, policymakers are often urged to strengthen macro-economic discipline and
to improve the soundness of the financial system as a series of preventive measures (Pandey
2004).
Measures were introduced in 2009 for the strengthening of the financial sector and risk
mitigation in the financial system (Pitt, Ariyapruchya et al. 2010). Various steps were
established for risk mitigation such as the establishment of a Debt Recovery Tribunal (DRT)
for debt collection from wilful defaulters, while self-assessment of Basel Core Principles was
completed in January 2007. Similarly, the central bank issued a revised licensing policy that
also addresses some of the deficiencies noted in their self-assessment, and expanded the role
of external auditors by requiring them to include in their ‘long-form’ reports an assessment of
compliance with the central bank’s directives (Peiris 2008). However, political involvement,
lack of sound accounting and reporting standards, insufficient supervision, and poor
corporate governance are still the major issues in the Nepalese banking industry (ADB 2010).

11
It is common belief of bankers and economist in Nepal that both the macro-economic
conditions and political disturbances are behind the cause of higher NPL and the poor
performance of banks (NRB, 2010’a’). Sometimes, they fail to consider the poor
management of bank’s internal mechanisms and corporate governance. This is because
systemic banking sector problems are linked with more than simply the weak macro-
economic conditions. Specifically, the central bank of Nepal reported severe lapses in
corporate governance in every bank. Despite issuing directives to strengthen corporate
governance in 2005, the results were not improved and banks performance is still under the
satisfactory level (NRB, 2010). So, a concern of bankers, economists and policy makers
remains in understanding the drivers of NPL and performance of Nepalese banks.
Besides the above-mentioned problems and issues, this study is also significant in Nepal for
the following reasons. Firstly, investigation of drivers of NPL in financial institutions is a
vital requirement for providing a more efficient system of asset allocation. In Nepal, the
efficiency in credit flow is more important for management of NPL and, as a result, the
efficiency of a bank may increase which becomes the supportive infrastructure for economic
development. Secondly, there is lack of transparency and a complexity inherent to the
banking system and studies on the topic of corporate governance in the Nepalese banking
system are less developed in comparison to the international studies. The research in hand
will add additional insight to the existing body of knowledge of corporate governance from
the perspective of developing economies, and Nepal in particular. Thirdly, this study
addresses a contemporary policy issue in relation to market structure, and is essential in
providing evidence for policy changes related to market competition. Fourthly, the findings
and recommendations of this study will be useful to researchers and policy makers to help
achieve the targeted goal of financial reforms and good corporate governance in the context
of Nepal. Thus, the significance of the study as proposed is both applicable to the literature
as these are no in-depth studies in this area in the literature, and it has an applied application
that will impact on the banks in Nepal and benefit the economy as a whole.
1.5 Scope and Limitation of the Study
The scope of the study is confined to a research framework which assesses exposure of bank
non-performing loans in Nepal and the identification of the factors affecting NPL and
performance in the Nepalese banking sector. This thesis examines how macro-economic,
bank specific and governance variables affect the NPL and performance in Nepalese banking.
12
In the investigation process, this thesis examines the relationship of macro-economic and
bank specific variables on NPL from 2001-2011. In the case of governance variables, this
thesis examines the relationship of governance variables on bank NPL and performance from
2005 to 2011.
This study is limited to secondary data sources which are mainly from audited bank annual
reports. Moreover, the study was limited to banks rather than to all financial institutions. On
the other hand, this study takes only domestic and foreign banks as samples and excludes
government banks due to unavailability of data.
1.6 Summary of Research Methodology
This study uses secondary data in establishing the relationship of macro-economic, bank
specific and corporate governance on bank NPL and performance of 29 commercial banks
listed in the Nepal Stock Exchange. The secondary data is obtained basically from published
annual reports of these banks and some data is obtained from the World Bank data base.
Books and other related materials especially of the Central Bank of Nepal and the Nepal
Stock Exchange were also reviewed. The sample of banks used in this study is listed on the
Nepal Stock Exchange observed over eleven years from 2001-2011 to examine the
determinants of NPL. Next, this thesis observed seven years data from 2005-2011 to examine
the corporate governance determinants of NPL and bank performance. Accordingly, this
thesis employs a panel data regression model. Under this, the thesis has used Ordinary Least
Squares (OLS), Fixed Effect (FE), Random Effect (RE) and General Momentum Method
(GMM). The outcome from the analysis provides evidence on the relationship of macro-
economic, bank specific and governance on bank NPL and performance.
1.7 Structure of the Study
The remainder of this thesis is organized as follows. Chapter 2 describes about the Nepalese
economy and financial system. Chapter 3 presents the corporate governance in the Nepalese
banking sector. Chapter 4 reviews previous evidence on NPL, performance determinants of
NPL and the relationship of governance mechanism on performance. Chapter 5 presents the
conceptual framework of this thesis and hypothesis development. Chapter 6 presents the
methodology which explains the sample used in this thesis and measurement of variables.
Chapter 7 presents the main findings and discussion of macro-economic, bank specific and
corporate governance determinants of NPL. The findings and discussion of the influence of
13
corporate governance on bank performance are presented in Chapter 8. Finally, Chapter 9
presents the conclusion, the implications and limitations of the study followed by suggestions
for future research.
1.8 Summary
The chapter provides an overview of the role of financial intermediation in the economic
growth in Nepal and the impact of failure of financial intermediaries in the nation. The
chapter described various problems that Nepalese banks are facing in the present context and
various efforts of the Central bank of Nepal for management of such problems. This chapter
detailed the importance of the investigation of determinants of NPL and the role of corporate
governance in the Nepalese banking industry.

14
CHAPTER TWO
Overview of the Nepalese Economy and Financial System
2.1 Introduction
This chapter provides a general overview about the Nepalese economy and financial system,
specifically the Nepalese banking sector. This overview aims to provide an understanding of
the banking system, its characteristics and the risks involved in the Nepalese setting. Section
2.2 highlights a brief history of the Nepalese economy and macro-economic activities over
the 2001 to 2011 study period. Section 2.3 describes the financial system. The development
of the financial sector, supervision frame-work for the banking sector, development of the
capital market, legal framework for investor protection and resolution of problem loans and
performance of commercial bank has been described with a focus on the banking sector in
Nepal. Lastly, Section 2.4 summarizes this chapter.
2.2 The Nepalese Economy
2.2.1 A Brief History of the Nepalese Economy
The Federal Democratic Republic of Nepal, common known as Nepal, is a sovereign,
independent, relatively small and landlocked republic country in South Asia with its northern
border to China and east, west and south border to India. Nepal has a total geographical area
of 147,000 square kilometers. The total population of the country was 30 million in 2011
(CIA 2011). The per capita income is recorded US$642 per annum which places the country
as one of the least developed countries in the world (CBS 2011).
Before 1768 AD, Nepal was separated into different small territories which were
accomplished into the unification kingdom by King Prithivi Narayan Shah through
conquering these territories. Until that time, the country was limited to only Kathamandu
valley, which had three different territories in it. Since the union, the kingdom escaped from
the British occupation as well as colonization of other countries and known as a sovereign
country.
After the freedom and political changes from Rana hegemony in 1951, the general public
elected Matrika Prasad Koirala as the first prime minster. The country started various
15
reforms, institution building and development works from 1952 to 1959 under three prime
ministers. The country has, however, made improvement towards sustainable growth since
the 1950s and is dedicated to a program of economic liberalization. The country had started a
series of five-year plans in an attempt to make progress in economic development in 1956. A
number of geo-political and structural limitations such as land-lockedeness, rugged
landscape, inadequate means, low income, low savings and higher rate of population growth,
limited transportation facilities, limited infrastructure and unstable political system were the
main obstacles for the economic development of the country and to uplift the economic
condition of the people to a desired level. A multiparty political system was followed by the
country from 1959 but that political system had a short life of about two years. A one party
political system existed in the kingdom from 1961 to 1991. The country again implemented a
multiparty political system after the popular movement of 1991 (Kraemer 1999). The country
was facing the low economic growth and unequal income distribution which was the main
feature of the Nepalese economy. As a result of short outcomes in performance of the
multiparty system, failure of the government to improve the economic status of general
public, serious political crisis was faced by the country. In this environment, Maoist rebels
started a guerilla war against the government and the monarchy in 1996.
The Prince Gyanendra, brother of King Birendra, became the new king in June 2001 after the
royal palace massacre. The new prince suspended the elected House of Representative and
designated a cabinet to operate the country’s administration in October 2002. With the
objectives of control of the Maoist movement, the king fired the entire government and
assumed full executive powers on 1 February 2005 (BBC 2013). However, the action was
unsuccessful because the Maoists had already expanded their force in large extent to the
country side which could make it difficult to remove the military from numerous towns and
the largest cities. In September 2005, the Maoist rebels declared a unilateral cease-fire which
ended in January 2006.
The Guerilla’s ten year insurgency ended in November 2006 when Maoist rebels and seven
political parties signed the peace agreement. Then, the Maoists supported the movement
organized by seven political parties. In response to this movement, the King agreed to give up
sovereign power to the people but it was rejected as their demand was the restoration of
parliament and a referendum to redraft the constitution. On 28 December 2007, a bill was
passed in parliament to amend for replacing of “Provision regarding the King” by “Provision
16
of the Head of the State” declared Nepal a federal republic, and thereby abolishing the
monarchy. The new parliament, quickly diminished the king’s powers, selected Girija Prasad
Koirala as prime minster (BBC 2013).
In 2008, the general public turned out to elect a government with the hope that the new
government will write a new constitution. The Maoists won 50 percent of seats in the election
(BBC 2013). At that time, it was announced that Nepal had become a secular and inclusive
democratic republic. After that, the situation forced the king to vacate the Naraynhiti royal
palace which was re-opening as a public museum. King Gyanendra vacated Narayanhiti
palace in June and began life as a commoner. So far, Nepal is facing the political disturbance
and consequent power-sharing battles. The country initiated a liberalization policy in 1992
and then Nepal became a member of World Trade Organization in April 2004. Since then,
economic performance has not resulted in the strong development Nepal needs. Various main
factors such as political disturbance from 1996 to 2006 were obstacles for GDP growth.
Considering the importance of trade in sustainable economic growth and improving the living
standards of the people and reducing the poverty, the country started further programs to
create a more open business environment and support for its exports to become more
competitive (WTO 2011).
2.2.2 Macro-economic Activities
The Nepalese economy is suffering through a downgrading situation which is creating
poverty and stagnation due to various constraints such as the land locked situation which
places obstacles for access to sea for international trade, increasing lending rates, high tax
burdens and high business costs. As a result of high inequality in income and inflation, trade
deficit, lower domestic saving and high dependency on agricultural income, the country is
facing the problem with its economic growth. Good remittance inflow and target of
Millennium Development Goals by 2015 helped to minimize the poverty rates even in the
country which was facing some problems such as political insurgency, weak governance and
poor investment climate. A low level of outstanding public debt is supporting the country for
utilization of more resources at present (NPC 2012). The country started to implement the ten
year plan for reduction of poverty. However, this effort was not helpful and the country still
stands as a least developed country with a rank of 157th position out of 187 countries with
human development index of 0.463 in 2012 (UNDP 2012). The country has total share of
trade of 67 percent with India showing the higher dependency upon India. Macro-economic

17
indicators show that merchandise trade exports with India and other overseas countries have
declined rapidly which resulted in a higher trade deficit. The economy shows a negative
balance of payment situation. Besides this, the degree of gross international reserves is in
decline, and imports of merchandise goods and services is only about 7.3 percent (NRB
2012'a').
The country’s economy is mainly dependent upon agriculture which accounts for 33.43
percent of GDP and this sector is limited to survival level farming. The growth rate 3.9
percent in 2011 proves a very low growth rate in the country if compared with its neighboring
countries. It is recorded that China has been achieving a double-digit growth rate since 2005
whereas India is about to reach double-digit growth. Nepal could not recognize the spillover
effects of the high growth in its neighbors India and China.
2.2.2.1 Gross Domestic Product
The growth of GDP fluctuated over the past ten years which has remained below 5 percent
from 2001 to 2007. It was recorded at 4.8 percent in 2001, which recorded the lowest growth
in 2002 at 0.1 percent. The monetary authority had targeted to achieve GDP growth of 4.5
percent in 2011. However the country achieved the growth at 3.90 percent which was a
satisfactory level. The highest GDP growth rate reached 6.1 percent in 2008. The various
factors such as labor problems, irregularity in electricity supply, constraints in bank credit,
slow remittance flow hampered the non-agriculture sectors and as a result the GDP growth
was not achieved by the country as per the target.
Figure 2.1: Trend of GDP Growth
Source: World Bank (2011)
4.80
0.10
3.90 4.70
3.10 3.70 3.40
6.10 4.50 4.80
3.90
0.00%1.00%2.00%3.00%4.00%5.00%6.00%7.00%
2001 2002 2003 2004 2005 2006 2007 2008 2009 2010 2011
18
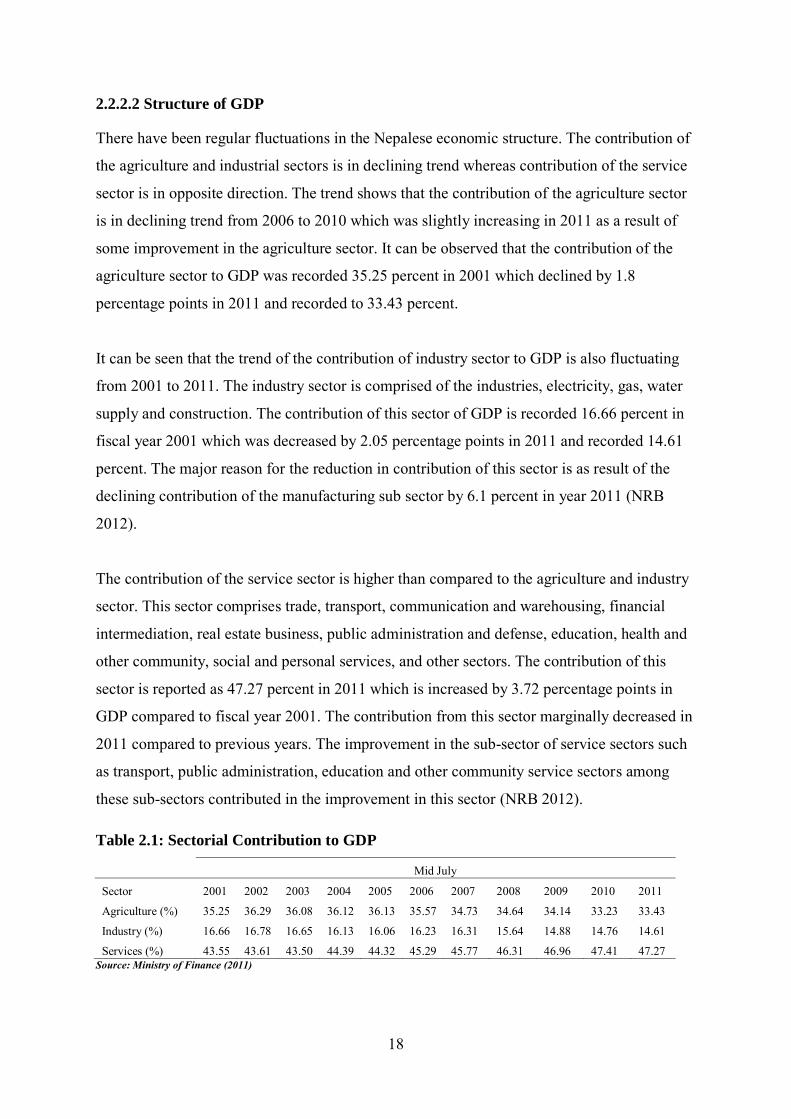
2.2.2.2 Structure of GDP
There have been regular fluctuations in the Nepalese economic structure. The contribution of
the agriculture and industrial sectors is in declining trend whereas contribution of the service
sector is in opposite direction. The trend shows that the contribution of the agriculture sector
is in declining trend from 2006 to 2010 which was slightly increasing in 2011 as a result of
some improvement in the agriculture sector. It can be observed that the contribution of the
agriculture sector to GDP was recorded 35.25 percent in 2001 which declined by 1.8
percentage points in 2011 and recorded to 33.43 percent.
It can be seen that the trend of the contribution of industry sector to GDP is also fluctuating
from 2001 to 2011. The industry sector is comprised of the industries, electricity, gas, water
supply and construction. The contribution of this sector of GDP is recorded 16.66 percent in
fiscal year 2001 which was decreased by 2.05 percentage points in 2011 and recorded 14.61
percent. The major reason for the reduction in contribution of this sector is as result of the
declining contribution of the manufacturing sub sector by 6.1 percent in year 2011 (NRB
2012).
The contribution of the service sector is higher than compared to the agriculture and industry
sector. This sector comprises trade, transport, communication and warehousing, financial
intermediation, real estate business, public administration and defense, education, health and
other community, social and personal services, and other sectors. The contribution of this
sector is reported as 47.27 percent in 2011 which is increased by 3.72 percentage points in
GDP compared to fiscal year 2001. The contribution from this sector marginally decreased in
2011 compared to previous years. The improvement in the sub-sector of service sectors such
as transport, public administration, education and other community service sectors among
these sub-sectors contributed in the improvement in this sector (NRB 2012).
Table 2.1: Sectorial Contribution to GDP
Mid July
Sector 2001 2002 2003 2004 2005 2006 2007 2008 2009 2010 2011
Agriculture (%) 35.25 36.29 36.08 36.12 36.13 35.57 34.73 34.64 34.14 33.23 33.43
Industry (%) 16.66 16.78 16.65 16.13 16.06 16.23 16.31 15.64 14.88 14.76 14.61
Services (%) 43.55 43.61 43.50 44.39 44.32 45.29 45.77 46.31 46.96 47.41 47.27 Source: Ministry of Finance (2011)
19
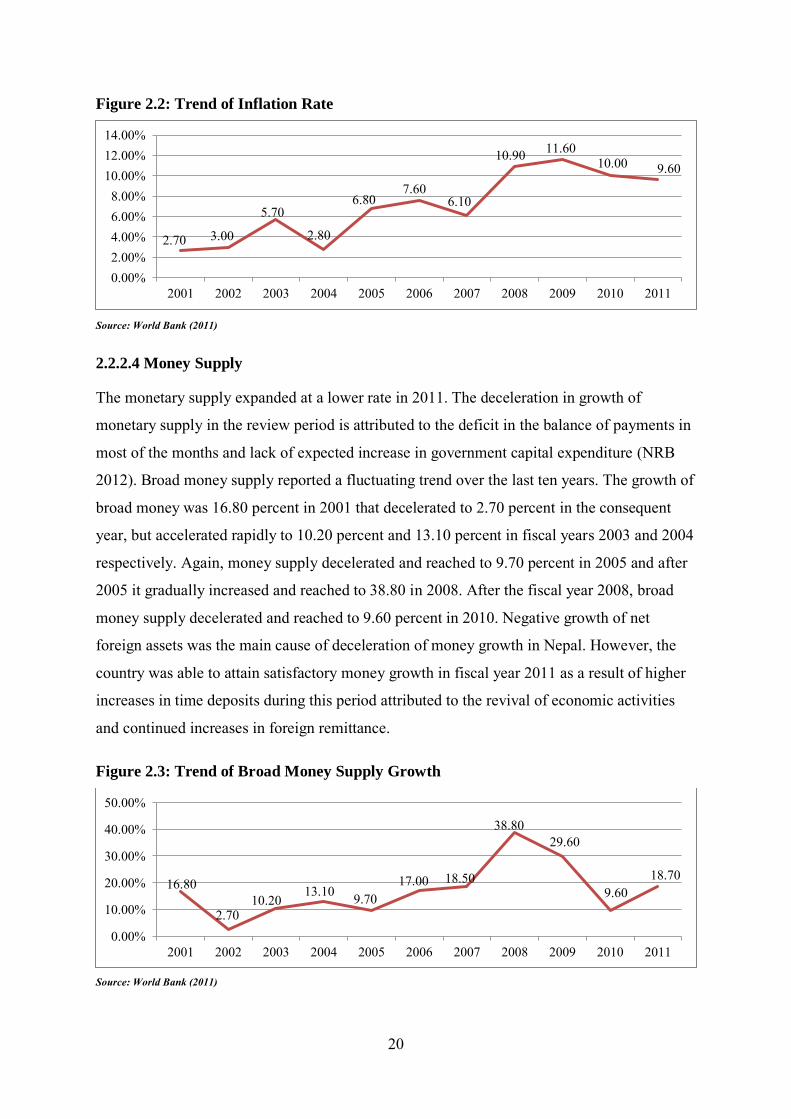
2.2.2.3 Inflation
The rate that had earlier shown a rising trend since the fiscal year 2006 and attained its
highest point 11.6 percent in fiscal year 2009 has come down in the last two fiscal years.
Although, the inflation rate stood below 6 percent for about half a decade prior to the fiscal
year 2006, both the internal and external causes have influenced the rise in inflation rate in
the past few years.
Frequent closures, strikes, load-shedding and political instability that have an adverse impact
on productive activities and the supply situation have been the dominant internal factors,
while the price increase in petroleum products and impact of Indian inflation are the major
external factors. Additional causes of the apparent impact of the Indian boarder between these
two countries, Nepal’s foreign exchange rate is pegged with Indian the currency, and has
almost about two-thirds of the trade with India. Nepal has been facing high (double digit)
inflation from fiscal year 2008 to 2010. On the other hand, the inflation was recorded low
throughout fiscal year 2001 to 2007. The reason behind lower inflation rate was good macro-
economic performance and fiscal and monetary measures to control inflationary pressure.
A disaggregated analysis of the inflation rate in Nepal reveals that during fiscal year 2001 to
fiscal year 2011, inflation rate saw an increasing trend. The point-to-point inflation rate
increased significantly from 2.7 percent in fiscal year 2001 to 9.6 percent in fiscal year 2011.
The point-to-point inflation showed a steady rise since 2001 and reached its highest at 11.6
percent in fiscal year 2009. By the end of fiscal year 2011, this rate declined to 9.6 percent.
An extensively considered possible reason of high inflation in Nepal is the adverse effect of
global price increases. This global price increase has a direct impact on imports of food and
petroleum products which are the country’s main import items. The global price of fuel and
food was in increasing trend since the beginning of current decade up to 2008 which directly
transferred into the country’s domestic economy. As a result of the global meltdown and the
resultant price fall of major commodities in the global market, there has been some break
from high inflationary pressure towards the end of 2008 and 2009. With the turn-around of
the global economy from the recession towards the end of 2009 and beginning of 2010,
inflation started to increase rapidly. This trend was also observed in Nepal.
20
Figure 2.2: Trend of Inflation Rate
Source: World Bank (2011)
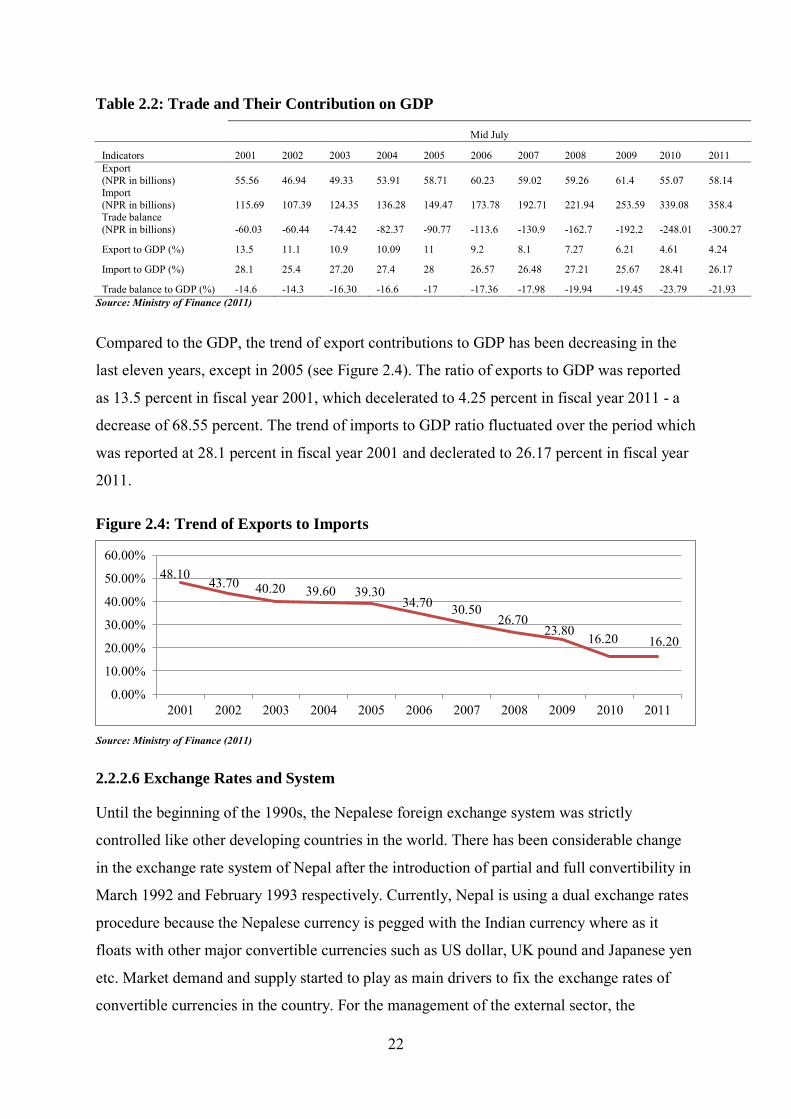
2.2.2.4 Money Supply
The monetary supply expanded at a lower rate in 2011. The deceleration in growth of
monetary supply in the review period is attributed to the deficit in the balance of payments in
most of the months and lack of expected increase in government capital expenditure (NRB
2012). Broad money supply reported a fluctuating trend over the last ten years. The growth of
broad money was 16.80 percent in 2001 that decelerated to 2.70 percent in the consequent
year, but accelerated rapidly to 10.20 percent and 13.10 percent in fiscal years 2003 and 2004
respectively. Again, money supply decelerated and reached to 9.70 percent in 2005 and after
2005 it gradually increased and reached to 38.80 in 2008. After the fiscal year 2008, broad
money supply decelerated and reached to 9.60 percent in 2010. Negative growth of net
foreign assets was the main cause of deceleration of money growth in Nepal. However, the
country was able to attain satisfactory money growth in fiscal year 2011 as a result of higher
increases in time deposits during this period attributed to the revival of economic activities
and continued increases in foreign remittance.
Figure 2.3: Trend of Broad Money Supply Growth
Source: World Bank (2011)
2.70 3.00
5.70
2.80
6.80 7.60
6.10
10.90 11.60 10.00 9.60
0.00%2.00%4.00%6.00%8.00%
10.00%12.00%14.00%
2001 2002 2003 2004 2005 2006 2007 2008 2009 2010 2011
16.80
2.70 10.20
13.10 9.70 17.00 18.50
38.80 29.60
9.60 18.70
0.00%
10.00%
20.00%
30.00%
40.00%
50.00%
2001 2002 2003 2004 2005 2006 2007 2008 2009 2010 2011

21
2.2.2.5 Trade
Since the country adopted liberal economic policies from the beginning of the 1990s, the
government of Nepal has promoted private investment and encouraged foreign direct
investment with several institutional and economic reforms (Thapa 2012). Nepal officially
obtained the World Trade Organizatioin membership in 2004 as 147th member. It was highly
anticipated that Nepal’s membership in such a rules-based trading regime would intergrate
the national economy to the global mainstream and expand trade and market access
opportunities, thereby expanding its trade opportunities, facilitating competition and
absorbing knowledge (Kafle 2011). Nepal is facing trade deficit from 2001 to 2011. The
trade sector has a great role to improve the economic growth and reduce poverty.The
increasing trend of the trade deficit may create severe challenges to the various economic
structures of the nation. Insufficient setup as well as the lack of raw materials and innovation
in technology is a main cause of accelerating the trade deficit in the country. Nepal’s imports
have increased sharply relative to its export volumes since 2001. The rapid growth in imports
is mainly due to Nepal’s increasing imports from India.
Nepal’s external sector has historically been weak. The imported commodities range from
basic goods to luxurious goods as well labor intensive goods to capital intensive goods. Being
an agriculture country, Nepal imports large amounts of agriculture goods from India and
China.
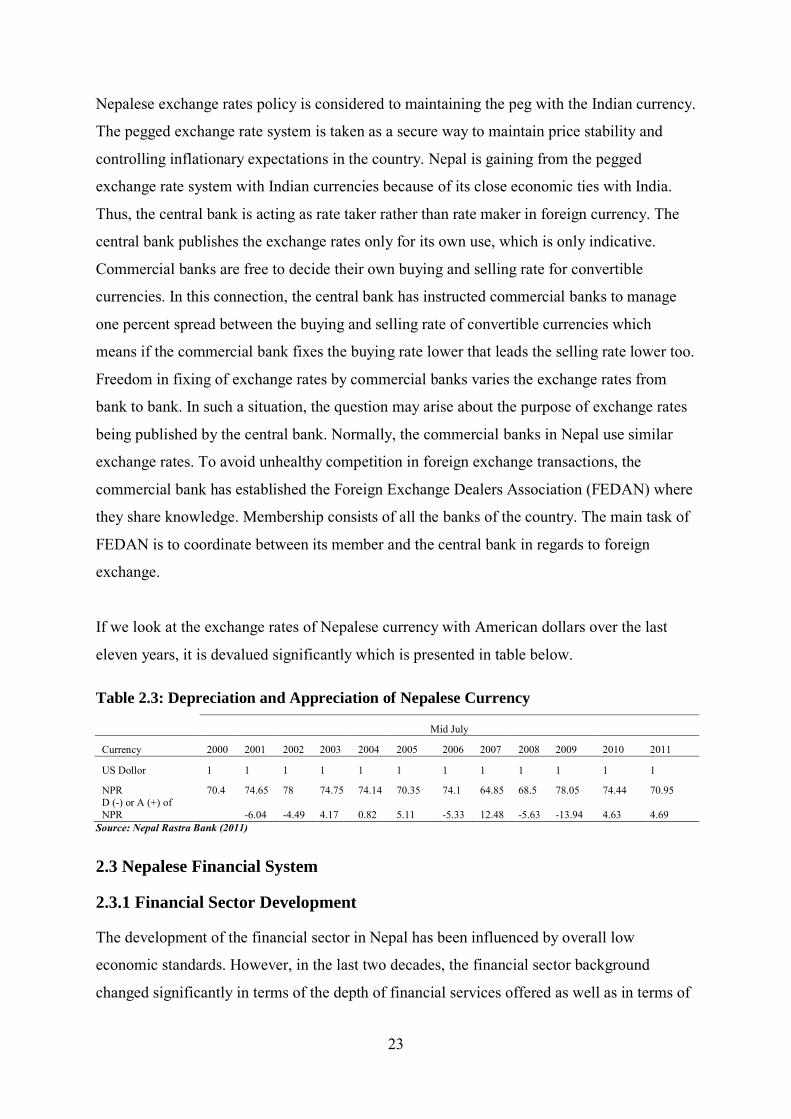
The details picture of Nepal’s international trade for the last eleven years from fiscal year
2001 to 2011 has been presented in Table 2.2 where the trade balance over the period was
always in deficit and in increasing trend. Average annual growth rate in exports during the
period was 0.75 percent and that of imports is 11.86 percent. The ratio of total exports to
imports was reported 48.10 percent in fiscal year 2001 which has decelerated to 16.34 percent
in fiscal year 2011.
22
Table 2.2: Trade and Their Contribution on GDP
Mid July
Indicators 2001 2002 2003 2004 2005 2006 2007 2008 2009 2010 2011 Export (NPR in billions) 55.56 46.94 49.33 53.91 58.71 60.23 59.02 59.26 61.4 55.07 58.14 Import (NPR in billions) 115.69 107.39 124.35 136.28 149.47 173.78 192.71 221.94 253.59 339.08 358.4 Trade balance (NPR in billions) -60.03 -60.44 -74.42 -82.37 -90.77 -113.6 -130.9 -162.7 -192.2 -248.01 -300.27
Export to GDP (%) 13.5 11.1 10.9 10.09 11 9.2 8.1 7.27 6.21 4.61 4.24
Import to GDP (%) 28.1 25.4 27.20 27.4 28 26.57 26.48 27.21 25.67 28.41 26.17
Trade balance to GDP (%) -14.6 -14.3 -16.30 -16.6 -17 -17.36 -17.98 -19.94 -19.45 -23.79 -21.93 Source: Ministry of Finance (2011)
Compared to the GDP, the trend of export contributions to GDP has been decreasing in the
last eleven years, except in 2005 (see Figure 2.4). The ratio of exports to GDP was reported
as 13.5 percent in fiscal year 2001, which decelerated to 4.25 percent in fiscal year 2011 - a
decrease of 68.55 percent. The trend of imports to GDP ratio fluctuated over the period which
was reported at 28.1 percent in fiscal year 2001 and declerated to 26.17 percent in fiscal year
2011.
Figure 2.4: Trend of Exports to Imports
Source: Ministry of Finance (2011)
2.2.2.6 Exchange Rates and System
Until the beginning of the 1990s, the Nepalese foreign exchange system was strictly
controlled like other developing countries in the world. There has been considerable change
in the exchange rate system of Nepal after the introduction of partial and full convertibility in
March 1992 and February 1993 respectively. Currently, Nepal is using a dual exchange rates
procedure because the Nepalese currency is pegged with the Indian currency where as it
floats with other major convertible currencies such as US dollar, UK pound and Japanese yen
etc. Market demand and supply started to play as main drivers to fix the exchange rates of
convertible currencies in the country. For the management of the external sector, the
48.10 43.70 40.20 39.60 39.30
34.70 30.50 26.70
23.80 16.20 16.20
0.00%
10.00%
20.00%
30.00%
40.00%
50.00%
60.00%
2001 2002 2003 2004 2005 2006 2007 2008 2009 2010 2011
23
Nepalese exchange rates policy is considered to maintaining the peg with the Indian currency.
The pegged exchange rate system is taken as a secure way to maintain price stability and
controlling inflationary expectations in the country. Nepal is gaining from the pegged
exchange rate system with Indian currencies because of its close economic ties with India.
Thus, the central bank is acting as rate taker rather than rate maker in foreign currency. The
central bank publishes the exchange rates only for its own use, which is only indicative.
Commercial banks are free to decide their own buying and selling rate for convertible
currencies. In this connection, the central bank has instructed commercial banks to manage
one percent spread between the buying and selling rate of convertible currencies which
means if the commercial bank fixes the buying rate lower that leads the selling rate lower too.
Freedom in fixing of exchange rates by commercial banks varies the exchange rates from
bank to bank. In such a situation, the question may arise about the purpose of exchange rates
being published by the central bank. Normally, the commercial banks in Nepal use similar
exchange rates. To avoid unhealthy competition in foreign exchange transactions, the
commercial bank has established the Foreign Exchange Dealers Association (FEDAN) where
they share knowledge. Membership consists of all the banks of the country. The main task of
FEDAN is to coordinate between its member and the central bank in regards to foreign
exchange.
If we look at the exchange rates of Nepalese currency with American dollars over the last
eleven years, it is devalued significantly which is presented in table below.
Table 2.3: Depreciation and Appreciation of Nepalese Currency
Mid July
Currency 2000 2001 2002 2003 2004 2005 2006 2007 2008 2009 2010 2011
US Dollor 1 1 1 1 1 1 1 1 1 1 1 1
NPR 70.4 74.65 78 74.75 74.14 70.35 74.1 64.85 68.5 78.05 74.44 70.95 D (-) or A (+) of NPR -6.04 -4.49 4.17 0.82 5.11 -5.33 12.48 -5.63 -13.94 4.63 4.69
Source: Nepal Rastra Bank (2011)
2.3 Nepalese Financial System
2.3.1 Financial Sector Development
The development of the financial sector in Nepal has been influenced by overall low
economic standards. However, in the last two decades, the financial sector background
changed significantly in terms of the depth of financial services offered as well as in terms of
24
the range and number of financial intermediaries which forced the financial sector into
becoming one of the most dynamic sectors in the Nepalese economy (Joras 2008). The
Nepalese financial system has undergone rapid structural change in the last two and half
decades (NRB 2010'b'). The development of the Nepalese financial system does not have a
very long history, starting just from the early twentieth century. The history of Nepalese
banking, from initiation to the present, can be divided into three distinct phases. The
paradigm swing in these phases is determined by different indicators: the first indicator is the
establishment of the NRB in 1956- this determines the shift from the first to the second
phase; similarly, the second indicator is the promulgation of the current NRB Act 2002- this
determines the shift from the second phase to the ongoing third phase.
2.3.1.1 The First Phase
This phase relates to the commencement of a formal domestic banking system in Nepal until
the establishment of NRB in 1956. Nepal’s formal financial system had a late start and began
less than one and a half centuries ago. Similar to other countries, goldsmith, merchant and
money-lenders were the ancient bankers of Nepal (Dahal 2009). The establishment of
Tejarath Adda in 1880 AD was a first step and can be viewed as the institutional
development of banking for the credit mobilization in Nepal. Although, this institution is
formally established, the institution was not allowed to provide banking facilities such as
collect the deposits from and extend credit to the general public. The government used to
provide funds to this institution, which was only for credit to government employees and
landlords. However, as it had been only a credit institution, it did not play the essential role of
financial intermediation (Pant 2010) which fulfills the needs of all people. Modern banking
started with the inception of Nepal Bank Limited on 15 November 1937 under Nepal Bank
Act 1937 which started to provide financial services to the general public. So, the
establishment of Nepal Bank Limited is signified as the commencement of a formal banking
system in Nepal.
2.3.1.2 The Second Phase
The government’s realization of requirement for developing a banking service to every part
of the country, ending dual currency system and stabilizing highly unstable exchange rates
gave birth to NRB in this phase (Dahal 2009). The NRB was established on 26 April 1956 as
central bank under the NRB Act 1955. Since then, NRB has made it easier for the
establishment of bank and financial institutions across the country. However, this phase can
25
be advanced into two sub-periods: The first sub-period “A” was the period where the
Nepalese payment system was considered as “predominantly a cash-economy”, but the
establishment of Nepal Arab Bank Limited as the first joint venture bank in 1984 under the
financial liberalization policy turned this phase in a different direction. This sub-period saw a
more lead role of NRB in terms of credit control through a directed lending program and
control of different categories under the full ownership of the Government of Nepal. As the
necessities of these programs, Nepal Industrial Development Corporation in 1959, Rastriya
Banijya Bank in 1966 and Agriculture Development Bank, Nepal in 1968 were established.
The second sub-period (or second phase B) received greater financial liberalization that
practically started from 1984 until the enactment of the new NRB Act in 2002. This sub-
period resembles the complete economic liberalization policy of the Government of Nepal
after the country experienced continued balance of payments crisis in the early 1980s. The
later sub-period saw major changes in the policy measures such as: removal of entry barriers,
deregulation of interest rates, introduction of various prudential norms such as capital
adequacy requirement, loan classification, loan loss provisioning, interest income
recognition, single borrower limits etc. Nepal Indosuez Bank (later named as Nepal
Investment Bank) and Nepal Grindlays Bank (currently Standard Chartered Bank Nepal)
were established in 1986 and 1987 respectively as the second and third joint-venture banks
during this second sub-period.
The entry of other development banks, finance companies, micro-credit development banks,
saving and credit cooperatives and NGOs for limited banking transactions started after 1992
under three major acts namely, Finance Company Act 1985, Company Act 1964 and
Development Bank Act 1996.
2.3.1.3 The Third Phase
The current NRB Act 2002 replaced NRB Act 1955 in this phase and allowed NRB to be
more independent in decision making for the formulation of monetary and foreign exchange
policy as well as monitoring and regulating bank and financial institutions across the country.
However, it was experienced that the existing situation of different acts under the banking
and financial institution sectors was not effective for enhancement of regulation and
monitoring systems. As a result and as a process of financial sector reform program, BAFIA,
2006 grouped all diversified acts. This Act, also known as the Umbrella Act, categorized all
26
the bank and financial institutions under four heads on the basis of responsibility differences:
Group A as commercial bank; Group B as development bank; Group C as finance company;
and Group D as micro-credit development bank. The other two forms of institutions, namely
savings and credit cooperatives and NGOs, both allowed by NRB for limited banking
transactions are, however, not put in any of those groups and are being operated under
specific directives and rules.
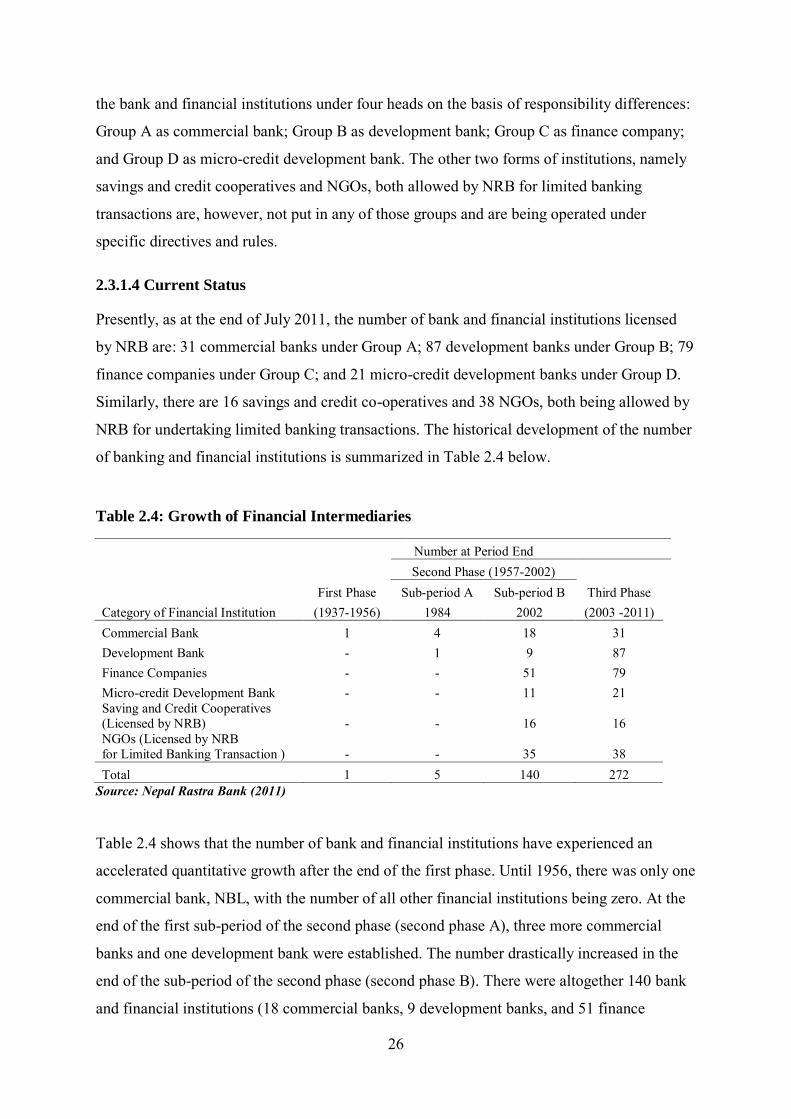
2.3.1.4 Current Status
Presently, as at the end of July 2011, the number of bank and financial institutions licensed
by NRB are: 31 commercial banks under Group A; 87 development banks under Group B; 79
finance companies under Group C; and 21 micro-credit development banks under Group D.
Similarly, there are 16 savings and credit co-operatives and 38 NGOs, both being allowed by
NRB for undertaking limited banking transactions. The historical development of the number
of banking and financial institutions is summarized in Table 2.4 below.
Table 2.4: Growth of Financial Intermediaries
Number at Period End
Second Phase (1957-2002)
First Phase Sub-period A Sub-period B Third Phase Category of Financial Institution (1937-1956) 1984 2002 (2003 -2011) Commercial Bank 1 4 18 31 Development Bank - 1 9 87 Finance Companies - - 51 79 Micro-credit Development Bank - - 11 21 Saving and Credit Cooperatives (Licensed by NRB) - - 16 16 NGOs (Licensed by NRB for Limited Banking Transaction ) - - 35 38 Total 1 5 140 272
Source: Nepal Rastra Bank (2011)
Table 2.4 shows that the number of bank and financial institutions have experienced an
accelerated quantitative growth after the end of the first phase. Until 1956, there was only one
commercial bank, NBL, with the number of all other financial institutions being zero. At the
end of the first sub-period of the second phase (second phase A), three more commercial
banks and one development bank were established. The number drastically increased in the
end of the sub-period of the second phase (second phase B). There were altogether 140 bank
and financial institutions (18 commercial banks, 9 development banks, and 51 finance
27
companies with the establishment of savings and credit cooperatives and NGOs). The growth
scenario in terms of number has reached 272 bank and financial institutions with 31
commercial banks and 87 development banks and 79 finance companies with the
establishment of savings and credit cooperatives and NGOs as shown in Table 2.4 as at the
end of July 2011. The accelerated growth of financial institutions in second phase B and the
current third phase is purely from the private and/or joint-venture sector with no participation
of the Government of Nepal. This has resulted from greater reform initiatives. This reform
includes ease of licensing policies, statutory requirements, foreign exchange exposure, and
cash reserve ratios; liberalization of the interest rates; full convertibility of current account
and other prudential rules and regulatory reforms. With these quantitative developments in
the financial sector, NRB has changed its role from simply focusing on the provisioning of
financial services to regulation and supervision aspects in an open and liberalized
environment (Bhattarai 2005).
2.3.2 Supervision Framework
Supervision of bank and financial institutions is one of the key tasks of the supervisory
authority. Effective supervision of banks and financial institutions is an important constituent
of a strong economic environment. Banks are supervised so as to achieve both long-term
financial strength and sector efficiency. Effective supervision can be done through the
advancement of safe and efficient banking practices. The weakness in legal framework and
supervision provide the opportunity for inefficient and unsafe banking practices which
increase the risk of bank failure. Considering all of the above motives, the NRB has adopted
off-site and on-site inspection methods to monitor and supervise the financial health of
financial institutions. However, NRB’s main methodologies to supervising banking
institutions are to focus on corporate governance, market discipline and management
oversight.
2.3.2.1 Present Status of NRB Supervision
2.3.2.1.1 Promulgation of NRB Act, 2001
The new NRB Act, 2002 has been promulgated with the objectives of strengthening NRB
supervision as one of the main objectives of this Act. This Act has made NRB fully
independent from government interference. This Act has prepared several requirements for
mitigation of political interference and practice of professionalism in the NRB board by
required qualification and code of conduct for governor, deputy governor and other directors
28
along with the provision of an audit committee to enhance good corporate governance in
NRB. Similarly, various other provisions to assist effective supervision have been unified in
the Act. This Act authorizes NRB to conduct on-site and off-site inspection of all the bank
and financial institutions at any time through internal and external manpower. For
enhancement of effective supervision, NRB has specified the time period for submission of a
report and also specified the provision for inspection reports to be presented in NRB for
necessary comment regarding the corrective measure. The Act has also unified several
financial as well as legal penalty provisions in case of non-compliance of NRB regulations
and mandatory provisions by the bank and financial institutions to the ultimate provision of
cancellation of the operating license along with the authority to suspend the board of the
concerned institutions and take it over by NRB vide Sections 86, 99 and 100. Similarly, the
new Act has also provided legal protection to supervisors in case of conduct of their duties in
good faith by Section 107. The recent amendment in Section 86 of the same Act has further
strengthened the supervisory authorities of NRB. It has given better power to NRB with
additional enforcement authority in the case of bank and financial institutions that have been
identified as troubled institutions by NRB Supervision.
2.3.2.1.2 Promulgation of an Umbrella Act
For proper and smooth operation of bank and financial institutions, an Umbrella Act named
the Bank and Financial Institutions Ordinance, 2004 has been promulgated so as to avoid
regulatory fragmentation in the operation of different financial institutions. All the
fragmented provisions relating to supervisory authority of NRB have been brought into one
place which had previously been scattered in different enactments. This has made possible
the concerted and converged supervision. This Act has made enough provisions so as to
ensure good corporate governance mechanism and financial discipline in the banking and
financial institutions. The Act has also incorporated various provisions for ensuring
professionalism in their boards and management teams. It has also given better power to the
central bank with enough supervisory and enforcement authorities so as to ensure
strengthened supervisory functions on the part of NRB. Similarly, it has also made enough
provisions to ensure adequate risk management systems in those institutions.
2.3.2.1.3 Issuance of Prudential Regulations
NRB has issued several sets of prudential regulations in line with international standards to
address and mitigate risks in financial businesses. These regulations include disclosure on
29
assets quality and connected lending, capital adequacy requirement, loan classification and
provisioning, single borrowing limits, accounting policies and financial statements, credit
concentration, risk management, corporate governance and code of conduct. NRB has also
lately released other regulations concerning periodical reporting requirements and mechanism
for divestment of shares by the promoters of the bank and financial institutions. Similarly,
NRB is also taking the initiative to the amendment of the licensing requirement which helps
to promote strict standards of appropriate and suitable tests for the promoters along with other
requirements. All these regulations have been delivered in discussion with World Bank
consultants advising NRB and are principally guided by the Core Principles of Bank
Supervision prescribed by the Bank for International Settlements (BIS).
2.3.3 Capital Markets
The history of Nepal’s capital markets began with the flotation of security by Biratnagar Jute
Mills in 1936 and Nepal Bank Limited in 1937. The Nepal Government issued the Company
Act in 1964 and the first issue of government bonds was made in the same year through NRB
to collect the developmental expenditures as well as other landmarks in the development in
the stock market. The Nepal Government announced the Industrial Policy in 1974 and, as a
result, the Securities Marketing Center was established in 1976 under this policy in order to
facilitate the trading of government securities - development bonds and national saving
bonds, and corporate securities of a few companies. Then, the Securities Market Center was
converted into the Securities Exchange Center (SEC) in 1984 under SE Act 1983 with the
objectives of promoting the growth of capital markets. Considering the importance of
protection of individual and institutional investors, public participation in various firms and
companies, systematic and favorite environment for securities, the SEC started to list and
trade in corporate securities (Gurung 2004).
Two investment vehicles i.e. Citizen Investment Fund and NIDC Capital Market were
established in the corporate sector after the initiation of financial reforms. The main
objectives of the two organizations were to collect the investment funds in the corporate
sector (Gurung 2004). The country became more competitive due to the privatization and
economic liberalization policies which changed the operation of SEC to compete with the
changing economic system. This situation lead the Nepal government to change the structure
of SEC and divide it into different entities i.e. Securities Board of Nepal (SEBON) and Nepal
30
Stock Exchange Limited (NEPSE) at the policy level in 1993. Since then, they are operating
as the main constitutions of securities market in Nepal.
The main task of the Securities Board Nepal is to service the development of an active and
competitive capital market and continue its integrity, objectivity, competence, transparency
and responsiveness under the SE Act 1983 (SEBON 2001). It is the top regulator of the
securities market in Nepal. It registers the securities and approves the public issues.
Moreover, SEBON sets the policies and programs needed to monitor the securities markets,
provide licenses to operate stock exchange businesses and stock brokers and supervisors, and
monitor the stock exchange operation and securities business operatives.
NEPSE is a non-profit organization and the SE Act 1983 guides the duties and operation of
NEPSE. The basic objective of NEPSE is to communicate free marketability and liquidity to
the government and corporate securities by facilitating transactions in its trading floor
through market intermediaries such as brokers and market makers, etc. NEPSE opened its
trading floor on 13 January 1994. The trading floor is restricted to listed corporate securities
and government bonds with the market intermediaries in buying and selling of such
securities.
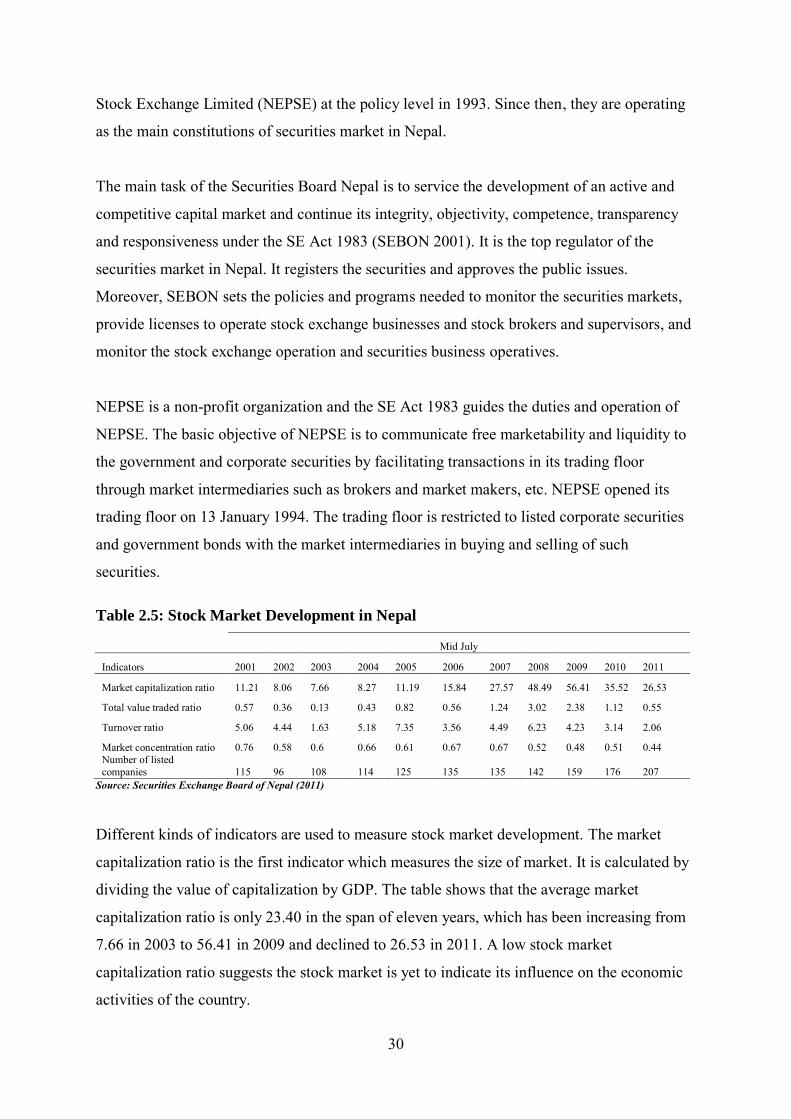
Table 2.5: Stock Market Development in Nepal
Mid July
Indicators 2001 2002 2003 2004 2005 2006 2007 2008 2009 2010 2011
Market capitalization ratio 11.21 8.06 7.66 8.27 11.19 15.84 27.57 48.49 56.41 35.52 26.53
Total value traded ratio 0.57 0.36 0.13 0.43 0.82 0.56 1.24 3.02 2.38 1.12 0.55
Turnover ratio 5.06 4.44 1.63 5.18 7.35 3.56 4.49 6.23 4.23 3.14 2.06
Market concentration ratio 0.76 0.58 0.6 0.66 0.61 0.67 0.67 0.52 0.48 0.51 0.44 Number of listed companies 115 96 108 114 125 135 135 142 159 176 207
Source: Securities Exchange Board of Nepal (2011)
Different kinds of indicators are used to measure stock market development. The market
capitalization ratio is the first indicator which measures the size of market. It is calculated by
dividing the value of capitalization by GDP. The table shows that the average market
capitalization ratio is only 23.40 in the span of eleven years, which has been increasing from
7.66 in 2003 to 56.41 in 2009 and declined to 26.53 in 2011. A low stock market
capitalization ratio suggests the stock market is yet to indicate its influence on the economic
activities of the country.

31
Total value traded ratio which is taken as market liquidity indicator, is measured as the total
value of shares traded in the stock market as a percentage of GDP. This ratio indicates how
easily securities can be traded in the market. The table shows that the ratio is below to 1
during 2001 to 2006 and increased to 3.02 in 2008 then decreased to the same level as 2001.
The table shows that the ratio is very low compared to the ratio of developed stock markets
where this ratio is greater than 40. A low ratio suggests illiquid markets in Nepal and so such
trading is more costly and difficult.
The next indicator of share market development is turnover ratio which is the measure of
total value of shares traded divided by the average market capitalization. The table shows this
ratio is below 8 during the period of 2001 to 2011, which is very low compared to developed
stock markets where the standard ratio is closer to 100. This low turnover ratio reflects high
transaction costs and it is relatively difficult to trade securities in the Nepalese capital market.
The next indicator of share market development is the market concentration ratio which
measures by market value of shares of the ten largest companies to total market value of
shares. The 2.5 shows that the average concentration ratio is 0.59 which indicates that the
market value of shares account for 59 percent which is very high compared to developed
stock markets where the standard of this ratio is 20 percent. The number of listed companies
indicates the size of stock market. The table 2.5 shows that the number of companies listed is
NEPSE is 207 in 2011 which is increased from 96 in 2002. Of the increase in the number of
companies, only about 12 percent of the companies registered Company Register Office as
public limited companies are listed on NEPSE during 15 year period (KC 2010) which
indicates the firm tends to avoid the stock market as an alternative source of long-term
capital.
2.3.4 Legal Framework for Investors’ Protection in Nepal
Initiation of economic reforms by the government has influenced the functioning and
governance of the capital market. Liberalization processes also changed the structure of the
Nepalese capital market. Investor protection is one of the necessary functions of regulatory
bodies to assist those who participated in the financial market. Stock markets act as a major
role in the financial market. Investor protection is necessary for the development of financial
markets which helps to mobilize funds in the market. Every nation follows their own
legislation framework for the stock market which varies from country to country.

32
Considering the importance of increasing investor protection, the regulatory bodies
implemented several measures to improve the fairness of the capital market. In Nepal, to
bring about protection of investor interest in a better way, the country needs effective
regulation of the stock market. Considering these objectives, various legislations are designed
to regulate the stock market and participants of the stock market. Among other legislations
the Company Act 2006, SE Act 1983 has a direct bearing on regulation and investor
protection.
2.3.4.1 Company Act 2006
The Company Act 2006 is a comprehensive piece of legislation administering all the
companies in Nepal. The objective of the Act is to provide all the legislative procedure,
restriction, rules and regulations and other information related to companies. One of the
objectives of the Act is to protect the legitimate interest of the owners and shareholders by
ensuring effective participation and control. It provides legislative standards to reduce the
risk of the shareholders.
In Nepal, any person likely to form private or public companies, associations and
partnerships, has to be registered as a company under this act. Every company which collects
deposits from depositors shall request to the tribunal if any default is made by it in repayment
of any such deposit. Every company has to make an application to the stock exchange for
permission to issue shares before the issue of a prospectus. All public companies intending to
issue shares must issue a prospectus by providing details about the company. A Prospectus is
any document including any notice, circular, advertisement or other document inviting
deposits from the public or inviting offers from the public for the subscription or purchase of
any shares, debentures, and a body corporate.
Every prospectus issued by a company shall state the following general information about the
company, such as name and address of the company, capital structure of the company, details
about the board members etc. The director, promoter or every person authorizing the issue of
the prospectus is responsible for any loss or damage which occurs due to an untrue statement
included in the prospectus. If any company defaults with the registration particulars while
filing its application with the registrar, the company and every officer of the company or
other person who is in default, shall be punishable.
33
Every public company is obligated to hold its first annual general meeting within one year
from the date of incorporation. If any company fails to hold a meeting within one year, it is
required to hold the meeting within six months from the expiry of its financial year. The
regulator may give direction to call the annual general meeting of such a company which fails
to hold a meeting within the three months after the finish of the fiscal year. The shareholders
have a right to make a petition, setting out the matter, to the court where such petition is made
if the company fails to call the annual general meeting even again after three months. In such
a situation, the court may either cause to hold the annual general meeting or issue any other
appropriate order.
Every public company is obligated to make provision and publish a notice in a national daily
newspaper at least twenty days prior to the holding of the annual general meeting. This
provision helps shareholders to inspect and obtain the annual audited financial report and
director’s report. The company has to provide a copy of the audited financial report and
director’s report to shareholders upon their request. Every public company shall prepare a
report with prescribed information and submit the same to the office at least twenty one days
before the holding of the annual general meeting.
2.3.4.2 Securities Exchange Board of Nepal
Securities Exchange Board of Nepal (SEBON) was set up as an administrative arrangement
in 1993 under SE 1983. The SE Act gave legal standing to SEBON. It mandates SEBON to
execute functions twofold: regulation of the securities market for investor protection and
promoting the development of this market. The SE Act has assigned most of the functions
and powers to SEBON which bought stock exchanges, their members, as well as contracts in
securities which could be traded under the regulation of the Ministry of Finance. In addition
to registering and regulating intermediaries and service providers, the SE Act has also
assigned the power to SEBON to issue directives to any person related to the securities
market or to companies with concern to the issue of capital, securities transfer and disclosure.
SEBON also has powers to review books and records, suspend registered entities and cancel
registration.
This SE Act requires share traders to obtain a license from the board for operation of the
stock exchange. In order to protect investors, any stock exchange established under this Act
shall create and manage a compensation fund as may be prescribed by the board. If a stock
34
exchange fails to create and manage the compensation fund or does not pay or fails to pay the
amount of compensation to be payable as prescribed, the Securities Exchange Board may
create and manage the compensation fund or make required provision in relation to the
payment of the amount of compensation required to be paid as prescribed.
Nepal has well regulated legislation framework to run the market in a systematic way. The
Company Act 2006 prevents initial misleading and also systemizes the companies and finally
provides the guidelines to do business by starting a company. SE Act controls the business
dealing of the stock market; the transactions are monitored and prevent fraudulent dealings.
The SE Act 1983 was incorporated especially to protect the investor and promote the
business.
2.3.5 Legal Framework in Dealing with Problem Bank in Nepal
Mostly, the liquidity or solvency problem characterizes the bank as a problem bank. Besides
this, a bank which required improving its financial resources, risk profile, risk management
capabilities and quality of management is also characterized as a problem bank. This situation
gives attention on the threat of systematic risk which can be minimized by appropriate
remedial action.
At present in Nepalese banking, some Acts like BAFIA, 2006, The NRB Act, 2002, The
Company Act, 2006, The Solvency Act, 2006 and The Unified Directives, 2005 (the
prudential norms and regulation issued by the NRB to bank) deal with the remedial action for
the problem bank.
All the above acts have their different legal framework for dealing with problem companies.
However, the provision of the NRB Act 2002 and BAFIA, 2006 is especially for the financial
institutions. The NRB has power to declare banks as problematic under section of 86B of the
NRB Act.
2.3.5.1 Role and Responsibilities of Different Regulatory Bodies in the Resolution of
Problem Banks
2.3.5.1.1 Nepal Rastra Bank
The NRB follows a different way for the resolution of a problem bank. In the first case, the
problems of the banking institution come to light through the regular off-site supervision and

35
on-site inspection. Accordingly, the issues are addressed by the supervisory authorities. The
Act has prescribed various corrective actions and the bank is instructed to fulfill the
addressed issue within the timeframe. However, supervisory authorities give sufficient time
to the bank to take remedial action with suitable strategies and planning. In the meantime, the
NRB conducts discussions with the board of directors of the bank.
If the bank is unable to correct the shortcoming within the time frame and after declaring as
problematic, then NRB can carry out several reform steps in order to save the bank from
falling into insolvency and finally liquidation. When the NRB declares a banking institution
as problematic, it can initiate two types of modalities for correction and one type of modality
for liquidation:
a. In the first step, the NRB initiates corrective action pursuant to Section 86c of the
NRB Act, 2002.
b. NRB can initiate reform actions by taking control of the bank on its own pursuant to
Section 86 d & e of the NRB Act, 2002
c. In the final stage, NRB can appeal in Appellate Court for liquidation if all the
corrective and reform measures fail.
2.3.5.1.2 Debt Recovery Tribunal
In Nepal, there is a complex and lengthy legal process to recover bad loans of banks and
financial institutions. For the minimization of this problem, an institutional framework was
introduced in 2002. To deal with the loan recovery cases, the government established Debt
Recovery Tribunal (DRT) under the Financial Sector Reform Program. The legal authority
assigned the power to DRT to obtain borrowers’/ guarantors’ other assets which are not
pledged to the concerned bank. DRT is also authorized to dispose the acquired assets through
auction in order to recover the bank’s loan. Problem banks have brought many cases before
the establishment of DRT and are seeing some results.
The support of the court is necessary to banking and financial institutions to recover bank
NPL quickly. If a bank is unable to recover their NPL, this impacts the ability of the bank to
pay their depositors. Adequate and skillful commercial lawyers help to do litigation work to
deal with loan recovery cases. Moreover, it is necessary for special legislation bodies to deal
with commercial cases.
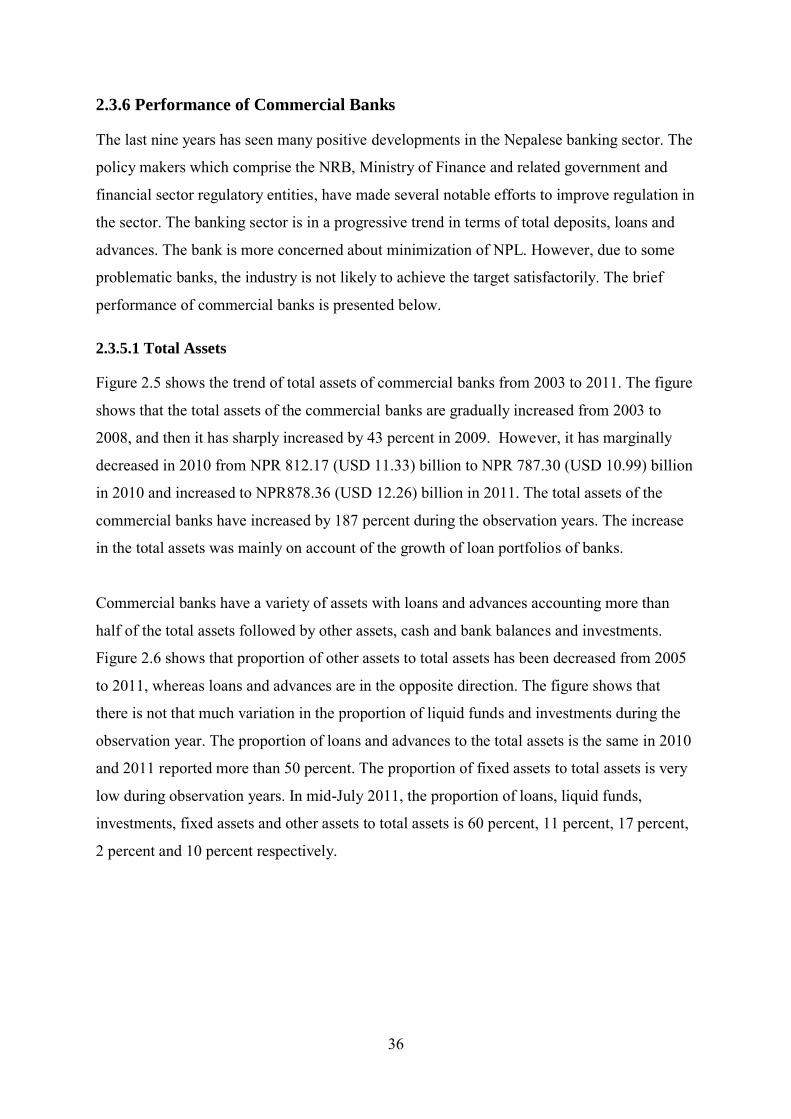
36
2.3.6 Performance of Commercial Banks
The last nine years has seen many positive developments in the Nepalese banking sector. The
policy makers which comprise the NRB, Ministry of Finance and related government and
financial sector regulatory entities, have made several notable efforts to improve regulation in
the sector. The banking sector is in a progressive trend in terms of total deposits, loans and
advances. The bank is more concerned about minimization of NPL. However, due to some
problematic banks, the industry is not likely to achieve the target satisfactorily. The brief
performance of commercial banks is presented below.
2.3.5.1 Total Assets
Figure 2.5 shows the trend of total assets of commercial banks from 2003 to 2011. The figure
shows that the total assets of the commercial banks are gradually increased from 2003 to
2008, and then it has sharply increased by 43 percent in 2009. However, it has marginally
decreased in 2010 from NPR 812.17 (USD 11.33) billion to NPR 787.30 (USD 10.99) billion
in 2010 and increased to NPR878.36 (USD 12.26) billion in 2011. The total assets of the
commercial banks have increased by 187 percent during the observation years. The increase
in the total assets was mainly on account of the growth of loan portfolios of banks.
Commercial banks have a variety of assets with loans and advances accounting more than
half of the total assets followed by other assets, cash and bank balances and investments.
Figure 2.6 shows that proportion of other assets to total assets has been decreased from 2005
to 2011, whereas loans and advances are in the opposite direction. The figure shows that
there is not that much variation in the proportion of liquid funds and investments during the
observation year. The proportion of loans and advances to the total assets is the same in 2010
and 2011 reported more than 50 percent. The proportion of fixed assets to total assets is very
low during observation years. In mid-July 2011, the proportion of loans, liquid funds,
investments, fixed assets and other assets to total assets is 60 percent, 11 percent, 17 percent,
2 percent and 10 percent respectively.
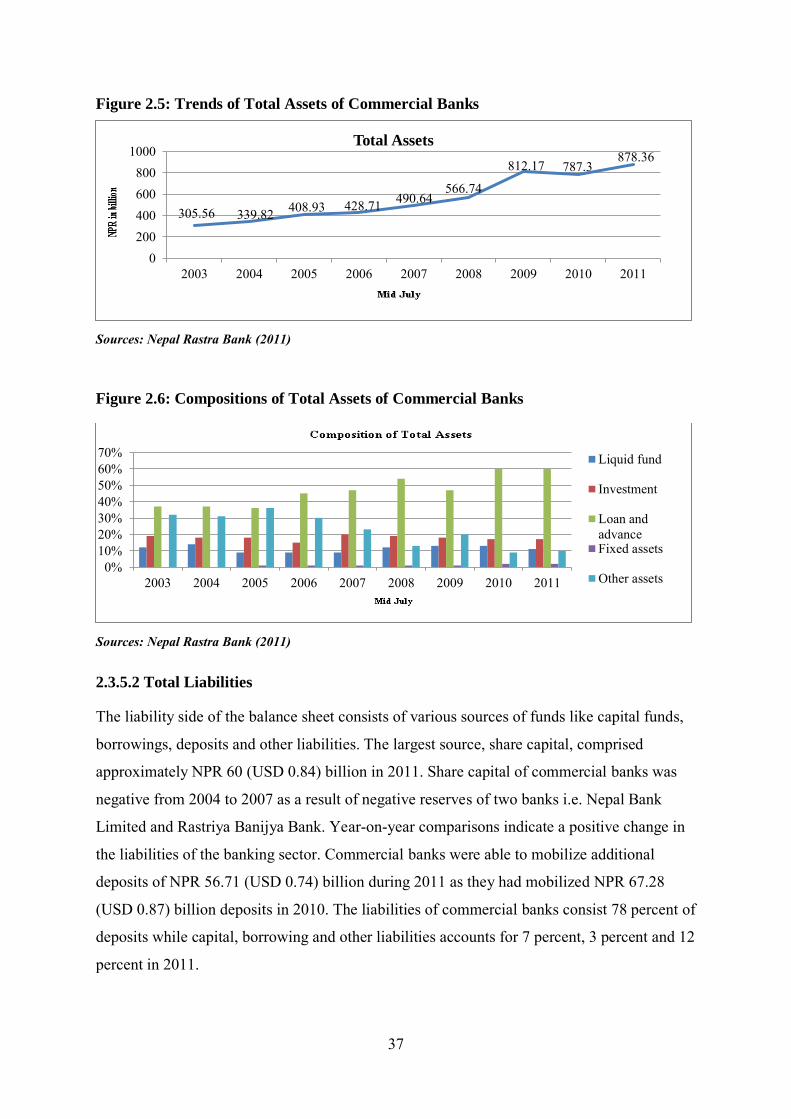
37
Figure 2.5: Trends of Total Assets of Commercial Banks
Sources: Nepal Rastra Bank (2011)
Figure 2.6: Compositions of Total Assets of Commercial Banks
Sources: Nepal Rastra Bank (2011)
2.3.5.2 Total Liabilities
The liability side of the balance sheet consists of various sources of funds like capital funds,
borrowings, deposits and other liabilities. The largest source, share capital, comprised
approximately NPR 60 (USD 0.84) billion in 2011. Share capital of commercial banks was
negative from 2004 to 2007 as a result of negative reserves of two banks i.e. Nepal Bank
Limited and Rastriya Banijya Bank. Year-on-year comparisons indicate a positive change in
the liabilities of the banking sector. Commercial banks were able to mobilize additional
deposits of NPR 56.71 (USD 0.74) billion during 2011 as they had mobilized NPR 67.28
(USD 0.87) billion deposits in 2010. The liabilities of commercial banks consist 78 percent of
deposits while capital, borrowing and other liabilities accounts for 7 percent, 3 percent and 12
percent in 2011.
305.56 339.82 408.93 428.71 490.64 566.74
812.17 787.3 878.36
0200400600800
1000
2003 2004 2005 2006 2007 2008 2009 2010 2011
Total Assets
0%10%20%30%40%50%60%70%
2003 2004 2005 2006 2007 2008 2009 2010 2011
Liquid fund
Investment
Loan andadvanceFixed assets
Other assets
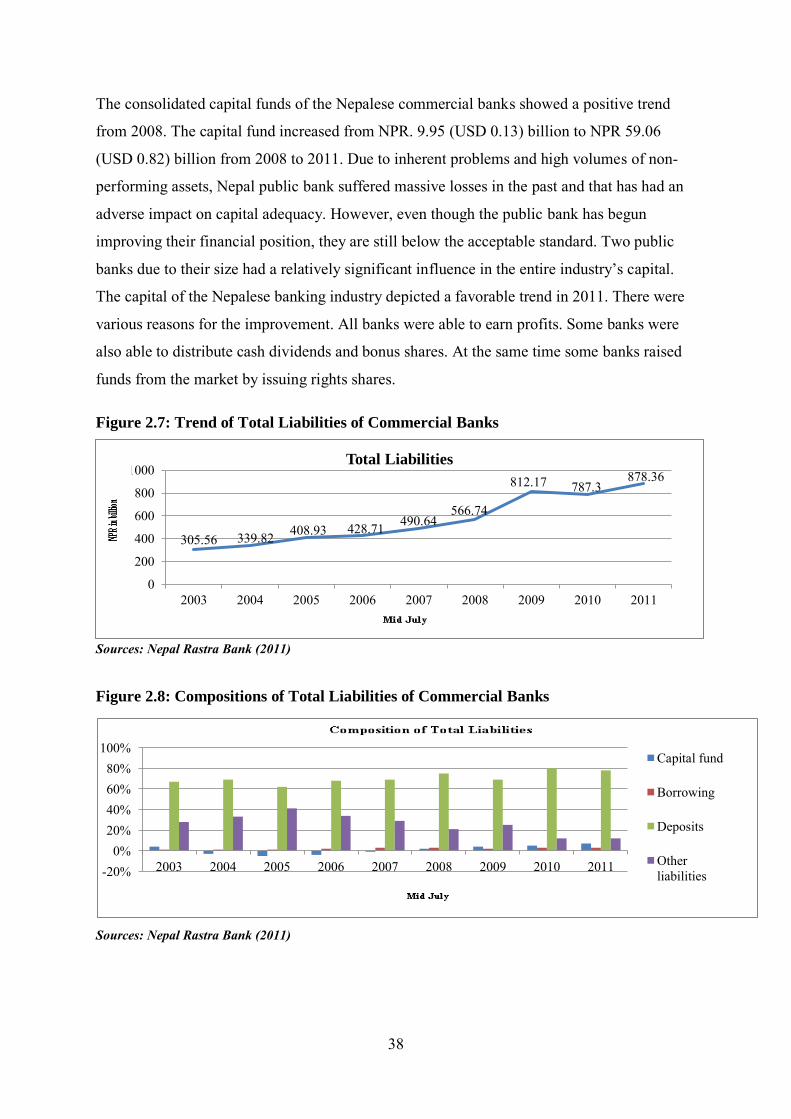
38
The consolidated capital funds of the Nepalese commercial banks showed a positive trend
from 2008. The capital fund increased from NPR. 9.95 (USD 0.13) billion to NPR 59.06
(USD 0.82) billion from 2008 to 2011. Due to inherent problems and high volumes of non-
performing assets, Nepal public bank suffered massive losses in the past and that has had an
adverse impact on capital adequacy. However, even though the public bank has begun
improving their financial position, they are still below the acceptable standard. Two public
banks due to their size had a relatively significant influence in the entire industry’s capital.
The capital of the Nepalese banking industry depicted a favorable trend in 2011. There were
various reasons for the improvement. All banks were able to earn profits. Some banks were
also able to distribute cash dividends and bonus shares. At the same time some banks raised
funds from the market by issuing rights shares.
Figure 2.7: Trend of Total Liabilities of Commercial Banks
Sources: Nepal Rastra Bank (2011)
Figure 2.8: Compositions of Total Liabilities of Commercial Banks
Sources: Nepal Rastra Bank (2011)
-20%0%
20%40%60%80%
100%
2003 2004 2005 2006 2007 2008 2009 2010 2011
Capital fund
Borrowing
Deposits
Otherliabilities
305.56 339.82 408.93 428.71 490.64 566.74
812.17 787.3 878.36
0
200
400
600
800
1000
2003 2004 2005 2006 2007 2008 2009 2010 2011
Total Liabilities
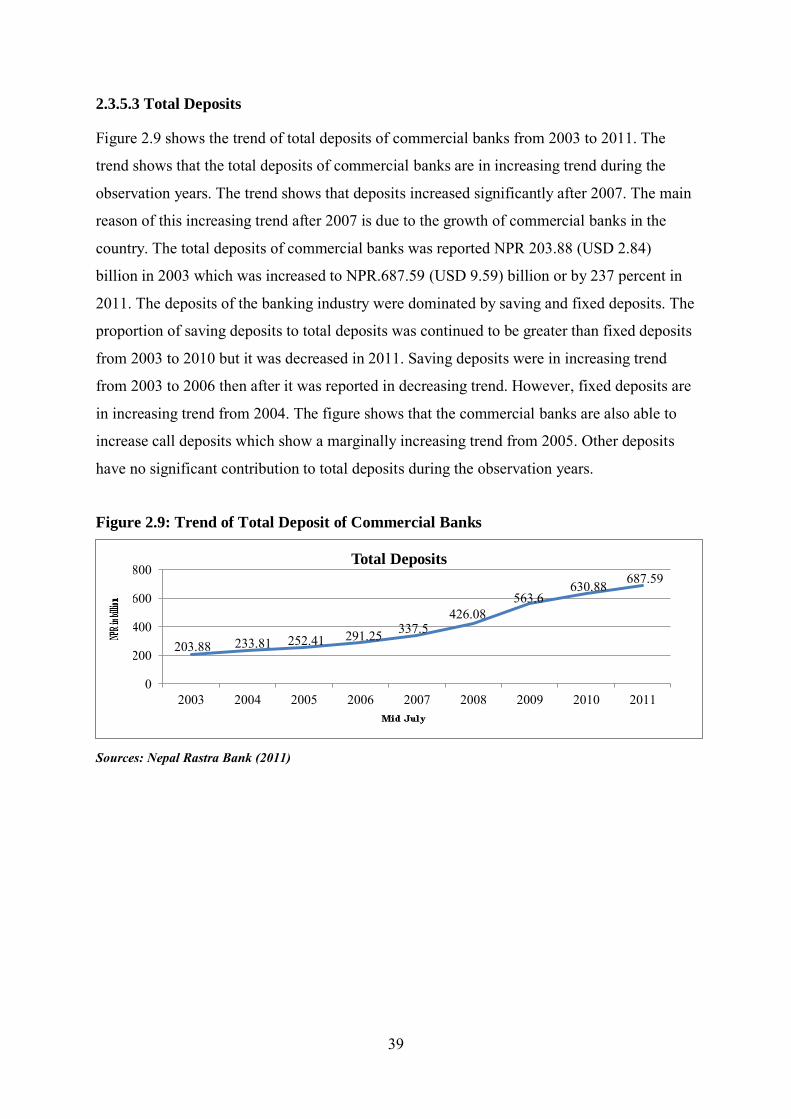
39
2.3.5.3 Total Deposits
Figure 2.9 shows the trend of total deposits of commercial banks from 2003 to 2011. The
trend shows that the total deposits of commercial banks are in increasing trend during the
observation years. The trend shows that deposits increased significantly after 2007. The main
reason of this increasing trend after 2007 is due to the growth of commercial banks in the
country. The total deposits of commercial banks was reported NPR 203.88 (USD 2.84)
billion in 2003 which was increased to NPR.687.59 (USD 9.59) billion or by 237 percent in
2011. The deposits of the banking industry were dominated by saving and fixed deposits. The
proportion of saving deposits to total deposits was continued to be greater than fixed deposits
from 2003 to 2010 but it was decreased in 2011. Saving deposits were in increasing trend
from 2003 to 2006 then after it was reported in decreasing trend. However, fixed deposits are
in increasing trend from 2004. The figure shows that the commercial banks are also able to
increase call deposits which show a marginally increasing trend from 2005. Other deposits
have no significant contribution to total deposits during the observation years.
Figure 2.9: Trend of Total Deposit of Commercial Banks
Sources: Nepal Rastra Bank (2011)
203.88 233.81 252.41 291.25 337.5 426.08
563.6 630.88 687.59
0
200
400
600
800
2003 2004 2005 2006 2007 2008 2009 2010 2011
Total Deposits
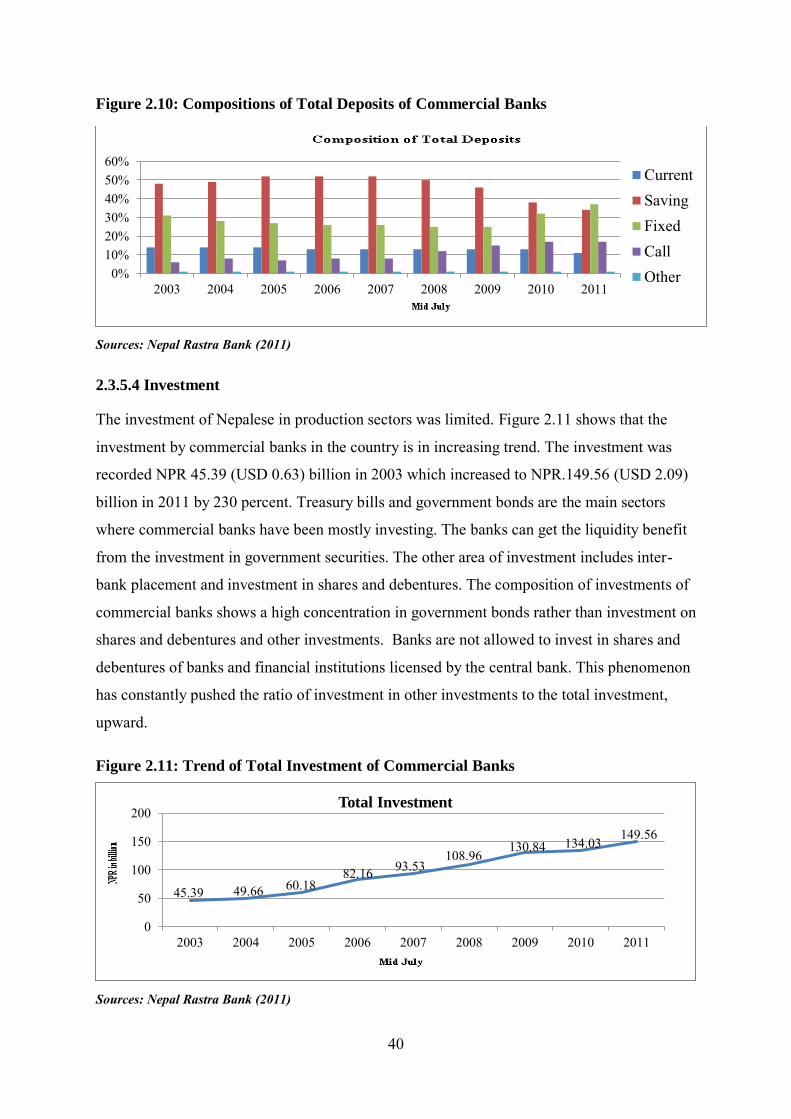
40
Figure 2.10: Compositions of Total Deposits of Commercial Banks
Sources: Nepal Rastra Bank (2011)
2.3.5.4 Investment
The investment of Nepalese in production sectors was limited. Figure 2.11 shows that the
investment by commercial banks in the country is in increasing trend. The investment was
recorded NPR 45.39 (USD 0.63) billion in 2003 which increased to NPR.149.56 (USD 2.09)
billion in 2011 by 230 percent. Treasury bills and government bonds are the main sectors
where commercial banks have been mostly investing. The banks can get the liquidity benefit
from the investment in government securities. The other area of investment includes inter-
bank placement and investment in shares and debentures. The composition of investments of
commercial banks shows a high concentration in government bonds rather than investment on
shares and debentures and other investments. Banks are not allowed to invest in shares and
debentures of banks and financial institutions licensed by the central bank. This phenomenon
has constantly pushed the ratio of investment in other investments to the total investment,
upward.
Figure 2.11: Trend of Total Investment of Commercial Banks
Sources: Nepal Rastra Bank (2011)
0%10%20%30%40%50%60%
2003 2004 2005 2006 2007 2008 2009 2010 2011
CurrentSavingFixedCallOther
45.39 49.66 60.18 82.16 93.53
108.96 130.84 134.03
149.56
0
50
100
150
200
2003 2004 2005 2006 2007 2008 2009 2010 2011
Total Investment
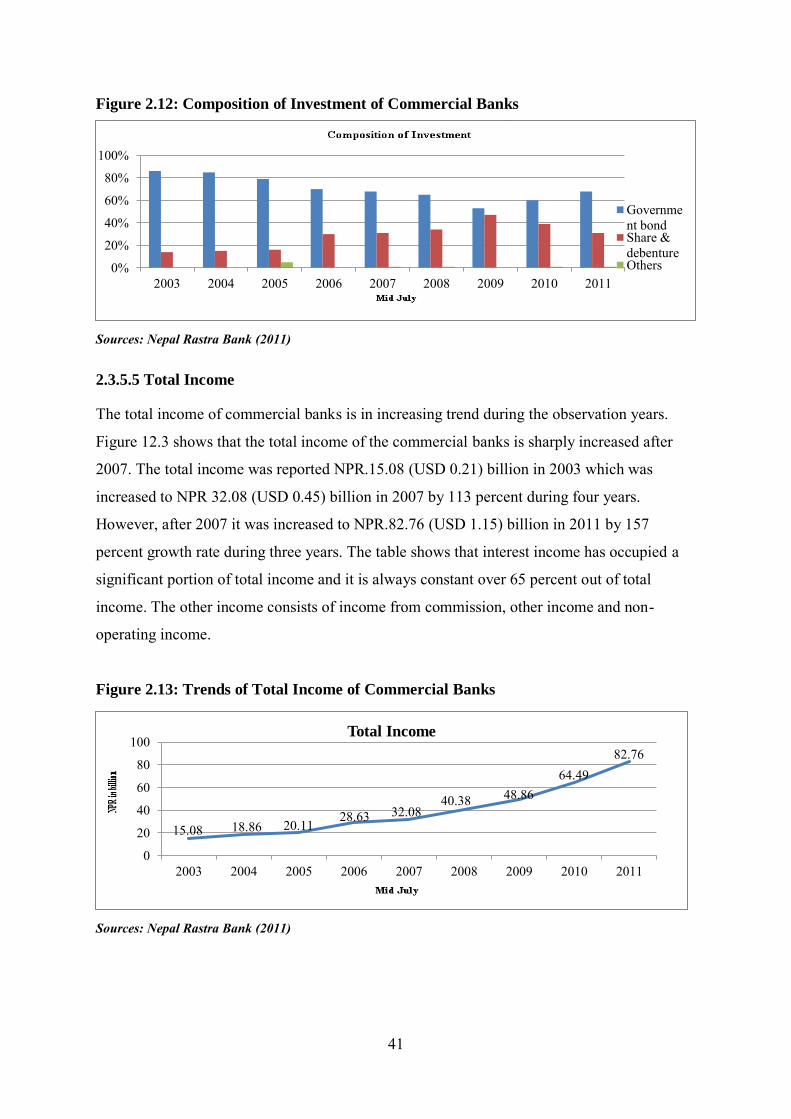
41
Figure 2.12: Composition of Investment of Commercial Banks
Sources: Nepal Rastra Bank (2011)
2.3.5.5 Total Income
The total income of commercial banks is in increasing trend during the observation years.
Figure 12.3 shows that the total income of the commercial banks is sharply increased after
2007. The total income was reported NPR.15.08 (USD 0.21) billion in 2003 which was
increased to NPR 32.08 (USD 0.45) billion in 2007 by 113 percent during four years.
However, after 2007 it was increased to NPR.82.76 (USD 1.15) billion in 2011 by 157
percent growth rate during three years. The table shows that interest income has occupied a
significant portion of total income and it is always constant over 65 percent out of total
income. The other income consists of income from commission, other income and non-
operating income.
Figure 2.13: Trends of Total Income of Commercial Banks
Sources: Nepal Rastra Bank (2011)
0%
20%
40%
60%
80%
100%
2003 2004 2005 2006 2007 2008 2009 2010 2011
Government bondShare &debentureOthers
15.08 18.86 20.11 28.63 32.08
40.38 48.86 64.49
82.76
0
20
40
60
80
100
2003 2004 2005 2006 2007 2008 2009 2010 2011
Total Income
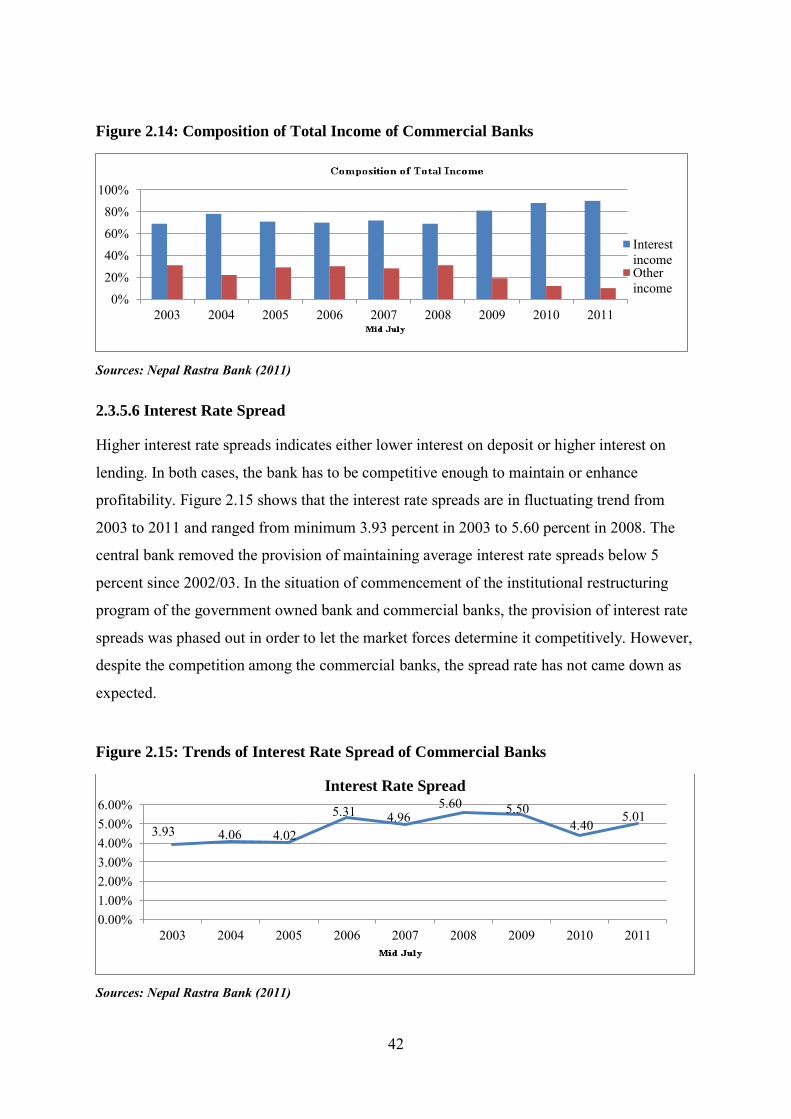
42
Figure 2.14: Composition of Total Income of Commercial Banks
Sources: Nepal Rastra Bank (2011)
2.3.5.6 Interest Rate Spread
Higher interest rate spreads indicates either lower interest on deposit or higher interest on
lending. In both cases, the bank has to be competitive enough to maintain or enhance
profitability. Figure 2.15 shows that the interest rate spreads are in fluctuating trend from
2003 to 2011 and ranged from minimum 3.93 percent in 2003 to 5.60 percent in 2008. The
central bank removed the provision of maintaining average interest rate spreads below 5
percent since 2002/03. In the situation of commencement of the institutional restructuring
program of the government owned bank and commercial banks, the provision of interest rate
spreads was phased out in order to let the market forces determine it competitively. However,
despite the competition among the commercial banks, the spread rate has not came down as
expected.
Figure 2.15: Trends of Interest Rate Spread of Commercial Banks
Sources: Nepal Rastra Bank (2011)
0%
20%
40%60%
80%100%
2003 2004 2005 2006 2007 2008 2009 2010 2011
InterestincomeOtherincome
3.93 4.06 4.02
5.31 4.96 5.60 5.50
4.40 5.01
0.00%1.00%2.00%3.00%4.00%5.00%6.00%
2003 2004 2005 2006 2007 2008 2009 2010 2011
Interest Rate Spread

43
2.3.5.7 Non-performing Loan
Figure 2.16 shows that the NPL of commercial banks is in decreasing trend from 2003 to
2010. However, it was increased in 2011 and reached to NPR.16.87 (USD 0.23) billion. The
NPL is reported from maximum NPR.32.09 (USD 0.45) billion in 2003 to minimum
NPR.11.22 (USD 0.16) billion in 2010. NPL is reported very high in 2003 as result of two
government owned banks which occupied total NPL of NPR.26.97 (USD 038) billion.
However, these two banks reduced the NPL to NPR.5.43 (USD 0.07) billion in 2011.
Figure 2.17 shows that the banks are able to reduce the NPL since 2003 to 2010. The NPL is
in decreasing trend as a result of ever greening of loans rather than recovery. The trend shows
that the banks are able to recover only 50 percent of NPL during the observation years.
Among the banks, Rastriya Banijya Bank Limited, Agriculture Development Bank Limited,
Nepal Bank Limited and Nepal Bangladesh Bank Limited contributed more than five percent
of NPL to the total loan. The high volume of NPL is largely due to the portfolios of public
banks.
Figure 2.16: Trends of Non-performing Loan of Commercial Banks
Sources: Nepal Rastra Bank (2011)
32.09 28.93 27.88
25.58 24.22
16.85 13.57 11.22
16.87
05
101520253035
2003 2004 2005 2006 2007 2008 2009 2010 2011
Non-performing Loan
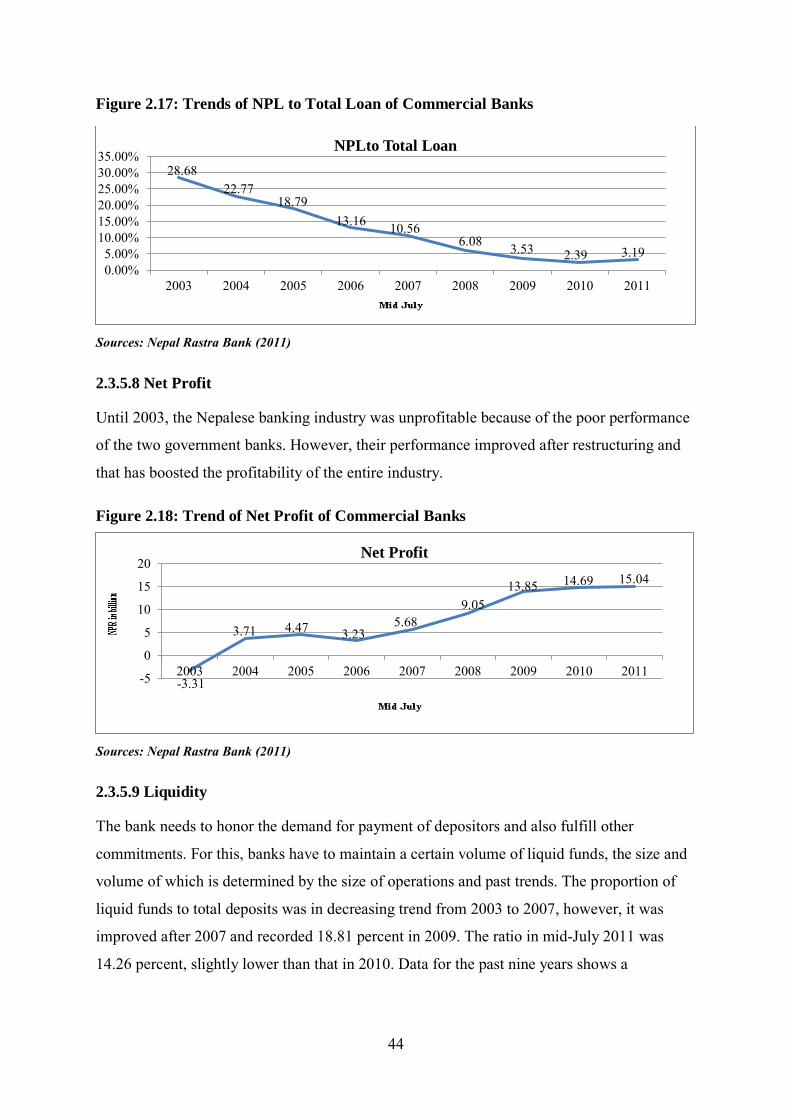
44
Figure 2.17: Trends of NPL to Total Loan of Commercial Banks
Sources: Nepal Rastra Bank (2011)
2.3.5.8 Net Profit
Until 2003, the Nepalese banking industry was unprofitable because of the poor performance
of the two government banks. However, their performance improved after restructuring and
that has boosted the profitability of the entire industry.
Figure 2.18: Trend of Net Profit of Commercial Banks
Sources: Nepal Rastra Bank (2011)
2.3.5.9 Liquidity
The bank needs to honor the demand for payment of depositors and also fulfill other
commitments. For this, banks have to maintain a certain volume of liquid funds, the size and
volume of which is determined by the size of operations and past trends. The proportion of
liquid funds to total deposits was in decreasing trend from 2003 to 2007, however, it was
improved after 2007 and recorded 18.81 percent in 2009. The ratio in mid-July 2011 was
14.26 percent, slightly lower than that in 2010. Data for the past nine years shows a
28.68 22.77
18.79 13.16 10.56
6.08 3.53 2.39 3.19 0.00%5.00%
10.00%15.00%20.00%25.00%30.00%35.00%
2003 2004 2005 2006 2007 2008 2009 2010 2011
NPLto Total Loan
-3.31
3.71 4.47 3.23 5.68
9.05 13.85 14.69 15.04
-5
0
5
10
15
20
2003 2004 2005 2006 2007 2008 2009 2010 2011
Net Profit

45
weakening of the liquidity position of the banking industry and could also indicate the intent
of banks to earn more profits rather then hold liquid assets.
Figure 2.19: Trend of Liquid Funds to Total Deposits of Commercial Banks
Sources: Nepal Rastra Bank (2011)
2.4 Summary
This chapter described the details about the brief history of the Nepalese economy where the
performance of macro-economic indicators such as GDP, inflation, monetary supply, trade
balance and exchange rates and system were evaluated from the 2001 to 2011 time span. The
macro-economic indicators of Nepal show lower growth of GDP and higher inflation
pressure. Similarly, the trade deficit continued from 2001 to 2011. Thereafter, the growth of
the Nepalese financial system was described with the supervision framework in which
various Acts were explained in brief. Before the financial liberalization, only one financial
intermediary was established but this was increased after financial liberalization and reached
to 272 in 2011.
Next in the process of evaluation of financial markets, the history and performance of capital
markets was presented. Various directives and Acts such as the Nepal Rastra Bank Act, 2001
and Umbrella Act were issued to strengthen the supervision framework of the central bank of
Nepal. The development of market share shows that the market capitalization ratio is in
fluctuation trend over the last eleven years. However, the number of listed companies is in
increasing trend. Considering the importance of investor protection, the Company Act 2006
and the Securities Exchange Board of Nepal are playing a direct role to strengthen the
supervision of companies in Nepal. At last considering the importance of investor protection,
the role of legislative bodies for the resolution of NPL and investor protection were also
presented in brief which shows that Nepal Rastra Bank Act 2002, BAFIA, 2006 and Debt
20.15 19.78 15.20
13.34 13.06 15.70
18.81 16.29
14.26
0.00%
5.00%
10.00%
15.00%
20.00%
25.00%
2003 2004 2005 2006 2007 2008 2009 2010 2011
Liquid Funds to Total Deposits

46
Recovery Tribunal have important roles for the resolution of NPL in Nepal. The chapter
briefly described the performance of commercial banks in the country. During the
observation years, it is found that total deposits are dominated by savings and fixed deposits,
whereas bank investment is highly concentrated on government bonds. Interest rate spreads
have not decreased as expected even though there is high competition among commercial
banks. NPL have been decreased during the observation years; however, it is above 2 percent
in 2011. Interest income has been the main income of commercial banks which is in
increasing trend during the observation years.
47
CHAPTER THREE
Corporate Governance in Nepalese Banking Sector
3.1 Introduction
This chapter highlights the improvement in corporate governance regulation. Awareness of
the importance of corporate governance is growing. The central bank of Nepal has introduced
corporate governance standards for banks and other financial companies as part of a wider
program of financial sector reform. Accounting and auditing standards are being developed.
Various laws have been drafted for deepening the reform process. The central bank of Nepal
has emerged as an important leader in corporate governance reform in the banking sector. To
examine the influence of governance in performance of the Nepalese banking sector, this
chapter discusses corporate governance in Nepal especially in the banking sector. The main
objectives are to provide a comprehensive description of corporate governance mechanisms
in the Nepalese banking sector. This chapter is organized as follows: Section 3.2 defines the
corporate governance; Section 3.3 discusses why the bank is different and special features of
corporate governance especially for bank; Corporate governance mechanisms especially for
the banks is identified in Section 3.4; Section 3.5 and 3.6 explain the corporate governance
and its recent development in Nepal respectively; Section 3.7 summarizes this chapter.
3.2 Defining Corporate Governance
It is acknowledged that the term ‘corporate governance’ is highlighted as an independent
field of study since last three decades (Keasey and Short 1999; Denis 2001). The scope of
corporate governance has also been extended to different disciplines including accounting,
economics, ethics, finance, law, management, organizational behavior, and politics, among
others, with no universally accepted definition (Solomon 2007). As a result, there exists a
large number of definitions of corporate governance (Cadbury 1992; Shleifer and Vishny
1997; Solomon 2007). Despite there being mixed definitions, however, researchers normally
categorize the existing corporate governance definitions as either ‘narrow’ or ‘broad’.
Shleifer and Vishny (1997) defined the corporate governance narrowly. Corporate
governance is the way where the investors receive the assurance of getting the return from
their investment in a corporation. In this view, the corporation acts as an intermediary and its

48
main aim is to provide goods or services to customers with the objectives of maximization of
wealth to its owners (West 2006). Cadbury (1992) has also defined corporate governance
narrowly that corporate governance is the system which directs and controls the companies.
Similarly, it is the system which provides the trust to the directors of the company regarding
responsibilities and duties related with the affairs of the company (Sheikh and Chatterjee
1995) or system of assurance which ensures that the action and agent of the company which
is established by corporation shareholders are directed to achieving the objectives of the
company (Sternberg 2004).
These definitions suggest that roles of boards of directors, general assembly of shareholders
and an executive management are the three key corporate governance structures which
maximize the wealth of owners (Letza, Sun et al. 2004; West 2006). In this case, the
corporation is principally responsible to shareholders and as such they have the power to
appoint directors and to satisfy themselves that the right governance mechanisms have been
instituted (Rossouw, Vander et al. 2002). Also, and at least in theory, the shareholders have
the right to reject the board’s decision and to dissolve the board through a general meeting.
So the board of directors has the responsibility such as to set the company’s strategic aims,
appointing, supervising and terminating the management team and reporting the owners of
the corporation on their stewardship (Rossouw, Vander et al. 2002). So, governance structure
can be accepted as a narrow view which mainly concentrates on how the internal mechanism
of corporate governance works to maximize the wealth of shareholders rather than for other
possible stakeholders, for example customers, employees, creditors, suppliers and the local
community.
Many authors include a broad sense of corporate governance. In a broad sense, corporate
governance is a set of relationships between a company’s board, its shareholders and other
stakeholders (OECD 2004) and ensures that the company is operating in a proper way which
effectively uses the society’s resources (Allen 2005). It concentrates on the objectives of the
company and tries to attain those objectives with performance through monitoring and also it
is a system of maintaining external and internal balance to companies which gives assurance
to all their stake holders and society that the companies are acting and discharging their
responsibility properly (Solomon 2007).

49
The above definitions imply that the role of corporate governance is not only limited in
immediate internal corporate structure, it is also concentrated on external corporate
governance mechanism and stakeholders (OECD 2004; Gillan 2006; Mallin 2007). Typically,
it has been explained above that mechanism of corporate governance is only limited to
shareholders, boards of directors and executive management. By contrast, corporate
governance may consist of legal systems, the market for managerial labor and corporate
control, regulators, local communities, cultural, political, social and economic policies, and
institutions within which corporations operate. So, the terms corporate governance provide an
outline where corporate objectives are set and performance is monitored due to relationships
among management, the board of directors, shareholders and other stockholders (Mehran
2004). It also delivers a mechanism by which the company sets its objectives, and the
resources of getting those objectives and monitoring performances are set. Good corporate
governance delivers appropriate incentives for the board and management to follow
objectives in which the company and shareholders are interested and also enable effective
monitoring which encourages firms to use resources more efficiently. In this case, the
corporation is considered as a social institution which focuses on the accountability and
responsibility to different stakeholders, shareowners, creditors, suppliers, customers,
employees, management, government and the local community (Freeman and Reed 1983;
West 2006; Mallin 2007).
The aim of corporate governance is to assist in the effective utilization of resources by
minimizing fraud and mismanagement with the view not only to maximize but also to align
the often-conflicting interests of all stakeholders (Cadbury 1999). In brief, and in contrast to
the ‘narrow’ characterization, a ‘broad’ corporate governance structure’s central pre-
occupation is to examine how both external and internal governance mechanisms can be run
to maximize firm value and/or performance for the mutual advantage of shareholders and
other potential stakeholders. As a result, most studies generally describe corporate
governance in terms of two differing models i.e. narrow and broad e.g. (Rossouw, Vander et
al. 2002; Agle, Donaldson et al. 2008). On the narrow point of view, corporate governance
usually focuses on ‘shareholding’ because it considers the objectives of companies are
primarily responsible and accountable to their shareholders whereas as in contrast, in the
broad sense, extends the corporate governance role to stake holding. Essentially, the both
models depend upon country and legal origin. Specifically, it has been suggested that narrow
models tend to be common in Anglo-American countries such as the UK and US with

50
common law origin, whilst the broad model is usually found in Continental Europe and Asia,
like Germany and Japan with civil law origin (Aguilera and Cuervo-Cazurra 2009).
3.3 Corporate Governance in the Banking Sector
Corporate governance has received much attention in the current studies all over the world
especially after many corporate scandals and the failures of some of the biggest firms around
the world such as Enron, Adelphia and World Com. Corporate governance of banks seems to
be more important than other industries because the banking sector plays a crucial financial
intermediary role in any economy. Even in developed markets, there is a great debate on how
bad or good the current corporate governance mechanisms are in banks. The characteristic of
banks is different to other non-financial firms which suggest a different corporate governance
mechanism.
3.3.1 Why does Corporate Governance Differ in the Banking Sector?
The Financial sector which is the main element of economy has received much interested
topic in recent times (Arun and Turner 2004; Das and Ghosh 2004; Hackethal, Schmidt et al.
2005; Mallin, Andy et al. 2005). Within the financial sector, the banking sector is the most
important sector so that the focus on the banking sector is the most important issue for
academic and policy makers (Basel 1999; Macey and O'hara 2003). Financial stability is the
main issue worldwide so the central bank is faced with setting the proper policy which
promotes the banking sector and helps to boost financial stability. Moreover, in order to
perform corporate governance functions effectively, the financial sector itself must be
efficient (Mallin, Andy et al. 2005). Therefore, the banking sector is regarded as a
challenging sector in developing economies and Nepal is also included in this situation.
Banking is critically linked to the industrial growth, the firm’s corporate governance and
capital allocation (Kaplan and Minton 1994; Levine 1997; Levine 2004). Banks stimulate
productivity growth through the efficient mobilization and allocation of funds, which helps
lower the cost of capital to firms (Levine 2004). Thus, the functioning of banks has
ramification for the operation of firms and the wealth of nations (Levine 1997). Different
features make the banks different from other non-financial firms.
The bank plays a role as monitor of their borrowers (Diamond 1984). In a contract between
the lender and borrower, only borrowers know the ex-post information asymmetry problem

51
which links the realized output of their businesses and therefore, they would not give
attention to it unless he has an incentive to do so. In contrast, if the lender knows detailed
information about the borrower, in this situation the lender can overcome this disadvantage
and minimize agency costs. Due to monitoring costs, it makes it easy for investors to lend to
a specialized agent i.e. an intermediary who can monitor the borrower on behalf of the
investor and monitoring costs will be cheaper to the investor rather than investing directly
with borrowers.
Another feature in a bank is that opacity is more concentrated in banks than other non-
financial sectors of the economy because outside investors are less informed than bankers
about the utilization of their funds (Levine and Caprio Jr 2002). Evidence suggests that
information asymmetries are deep rooted in banks compared to other sectors (Furfine 2001).
Furfine (2001) added that in a banking transaction, the quality of loans is not easily
noticeable and can be manipulated for a long time. Moreover, banks can adjust the risk
arrangement of their loans more quickly than most non-financial sectors, and they can
immediately conceal problems by sanctioning loans to doubtful clients. Secondly, banks are
normally very highly controlled and the government enforces a detailed range of regulations
on them because of their importance in the economy, opacity of assets and activities, and
ready source of fiscal revenue (Furfine 2001).
The next feature in a bank is the capital structure which is different than other non-financial
firms. Banks tend to have very little equity relative to other firms. More than 90 percent of a
bank funding is typically depended upon from debts (Macey and O'hara 2003). A bank’s
liquidity production function makes them special because their liabilities are largely in the
form of deposits which are available to their creditors/depositors on demand, while their
assets often take the form of loans that have longer maturities. The mechanism of liquidity
production may create a collective action problem among depositors because banks maintain
only a certain portion of deposits on reserve at any one time (Diamond and Dybvig 1983).
Banks are critical elements in a country’s financial system and their health is very important
for the economy. In addition, banking crises significantly announce the massive
consequences of poor governance of banks (Levine 2004). The fact that the public deposits
money in a bank on the trust, the corporate governance mechanism for banks should give
focus to them as well as shareholders. The depositors are generally not informed about the

52
loan portfolio of banks because that information is not easily communicable and also very
expensive to disclose. This opportunity encourages banks to invest in risky assets rather than
as originally promised. In this situation, if the investors are ill-informed then all the returns
from investments go to the bank owners whereas the cost of investment is borne by
depositors (Hellman, Murdock et al. 2000). According to Arun and Turner (2004), if
depositors are supposed to be sensible then owners of banks bear the agency cost in the form
of higher compensating risk premiums. So, this scenario creates the problem of
inconsistency, the response that the bank may fail to offer reliable assurance to depositors
(Diamond and Dybvig 1983). This problem can be solved through the investment by the
assurance of governments which insist individuals and companies deposit their funds in a
bank with the hope of substantial part of the moral hazard cost borne by the deposit insurer,
for example the government. In this situation when the government undertakes the assurance
of deposit funds, then the mechanism of corporate governance may be a more interested
subject for the government. In fact, good corporate governance in the banking sector uses the
deposit funds which are deposited by the general public as insured deposit which is important
in order to control conflict of interest (Witherell 2003). So, policy makers are more interested
to improve the ability and incentive of creditors and other market members to screen banks
which improves corporate governance of financial intermediaries, especially banking
companies (Caprio and Levine 2002). According to Caprio and Levine (2002), the
governance problem in banking is rigorous but it is not impossible.
Besides this discussion, another related issue is the role of the central bank. The central bank
tries to maintain effective risk management for the financial stability which is important for
sustainable growth in a country. For the banking stability, a central bank performs three
major functions i.e. lender of last resort, to help to maintain short to medium-term liquidity
problems of banks which helps to avoid a banking crisis in a country. Development and
implementation of good regulatory and efficient monitoring is also a most important job
which the central bank performs. In recent years, corporate governance has become one of
the important drivers of determination of the health of a financial system which helps to
absorb economic shocks.
It is evident that the bank plays an important role in the financial sector which reflects the
importance of corporate governance particularly in banks or financial institutions. In the
present scenario, risk in the banking system is increasing due to globalization, deregulation
53
and technological advances. Most of funds managed by banks belong to their creditors or
depositors which is not common in non-financial firms (Macey and O’Hara 2003). Due to
this fact, the failure of banks may have created systemic risk on the stability of other banks
not only to stakeholders of a particular bank. Theory suggests that agency problems and
conflict of interest between owners and managers is a cause of information asymmetry which
can be solved through the design of good corporate governance. Further, government
regulation and regular involvement minimizes the incentive for effective monitoring and
makes supervision less effective. In this context, the corporate governance of a bank becomes
a more important challenge and different as compared to other firms.
3.3.2 Special Characteristics of Corporate Governance in the Banking Sector
The fact about the specificity of banks is that their creditors are in the form of depositors
which causes free rider problems related to monitoring of widely held banks (Freixas and
Rochet 1997). They state that the majority of debt in non-financial firms is held by
professional investors such as bank or “informed” private investors but in the case of bank
“uninformed” small agents for example households, they hold the debt and bear less
monitoring role about the bank. So strict monitoring is necessary to solve this problem in
banks relative to other non-financial firms.
On the other hand, compliance with regulation in the banking industry has an important
influence on the governance of banks (Llewellyn 2001), so that banking regulation raises new
questions and uses specific regulatory instruments compared to other regulated non-financial
industries (Freixas and Rochet 1997). Considering it from a different point of view, if the
presence of particular directives on the banking sector provides the way to the option of
interaction between private and public governance systems, it can also be claimed that this
interaction does not only mean that banks are affected by regulation but that they can
influence it too. In the situation of high regulation, it can be imagined that banks are trying to
influence national regulation in order to improve their competitiveness in relation to foreign
banks because better investor protection can boost up corporate valuation (La Porta, Lopez-
de-Silane et al. 2002).
So far, it seems like that the basic features of banks and their regulated condition are possibly
to have an impact on the specific arrangement of their corporate governance model. Prowse
(1995) analyses the usefulness of different approaches of corporate mechanisms for a sample
54
of US commercial bank holding companies considering different measures of performance,
ownership structure, and board composition. In the analyses, hostile takeover and
intervention by the board of directors are found as weaker governance mechanisms in the
banking industry compared to firms from other sectors of the economy. He found that these
two mechanisms make the governance of the bank holding companies a more serious issue to
deal with by regulators than in the case of non-financial firms.
The research conducted by Adams and Mehran (2003) is helpful to understand the difference
in the function of corporate governance in banks compared to other industries. The study
shows that board size, the number of outside directors in the board, the number of committees
and the frequency of reunion of the board are, in all cases, larger for bank holding companies
than for firms in the manufacturing sector. Conversely, the proportion of CEO stock pay to
salary plus bonuses, the percentage and market values of direct CEO equity holdings and
block ownership appear to be smaller for bank holding companies relative to manufacturing
firms. This study confirms that governance structures are industry-specific. Investors are not
only interested in the bank’s activities but also regulators and depositors are too. Realizing
the importance of the effect of bank performance on the overall economic situation,
regulators are particular interested in the governance mechanism of banks. The regulation has
an important role in the process of design of corporate governance mechanisms in banks.
Executive pay is another mechanism of corporate governance which varies with company
size, industry and country (Murphy 1999). Basically, a CEO of the financial firm gets a
higher level of the pay than other sectors of the economy. According to Murphy (1999), firms
in regulated industries (including financial services firms) present lower pay-performance
sensitivities than other corporations belonging to other economic sectors.
3.4 The Corporate Governance Mechanism
Governance mechanisms are the way that principals pay incentives for the monitoring and
controlling agents. Corporate governance mechanisms are therefore used for the assurance
that the appointed agent is performing the task in the manner in the best interest of their
principals (Hill and Jones 2004). Mixed internal and external governance mechanisms help to
govern the company and the importance of this mechanism depends upon the context of the
institution. Anglo-Saxon economies in specific are considered by strong external governance
mechanism whereas the Rhineland and Japanese governance mechanism displays more belief
on internal control devices.
55
3.4.1 Internal Governance
Internal governance consists of board of directors, executive compensation schemes and
internal audit. These mechanisms are explained briefly in this section.
3.4.1.1 Board of Directors
The role of a board of directors is as mediator between principal and agent who are the
controllers of a corporation and they have important relations between the shareholders who
deliver capital, and the managers who are agents and allocate such capital for wealth
maximization (Monks and Minow 2001 p.81). Shareholders elect the board of directors and
set the role to fulfill their responsibilities such as appointing, and terminating and
compensating employees and advising top management (Denis 2001). The board also takes
the responsibilities of quality audit control which shows the actual financial performance of
the company (Hill and Jones 2004 p.386). Boards can be structured as a combination of
inside and outside directors. Inside directors are those who control shareholders and senior
positions for example the executive director in the firm. Internal directors are important for
firms because they are experienced about the company’s activities which help the board to
perform its monitoring role. Next, outside directors are not related with the company and
generally represent industry experts. The outside directors are also known as non-executive
or independent directors. Experience which they hold for wealth maximization of the firm
helps them to be a valuable director on the board. Since the majority of board members hold
full-time positions in the organization, then they invest the necessary time and effort to meet
the objectives of the company.
3.4.1.2 Executive Compensation Schemes
The level of executive pay and the sensitivity of pay to performance are the main two
principles of setting executive compensation (Denis 2001). Salary, bonuses, stock options and
long-term incentive plans are the elements of compensation. Managerial ownership and stock
options are the main element of executive compensation and amount of compensation can
play as significant mechanisms to attach managerial interests to those of the minority
shareholders. Stock options are agreements that provide recipients the right to buy a portion
of stock at pre-specified ‘exercise’ or ‘strike’ price for pre-specified terms (Murphy 1999).
Since stock options create direct connection between managerial rewards and share-price
maximization, they are a better instrument to provide managers with incentives to perform.
This function is beneficial to a company so that the managers try to select the less risky
56
project to get the good return with the expectation of an increase in stock price. In other
words, stock options add convexity to managers’ payoff functions (Denis 2001). The
manager also offers an attractive way to reschedule taxable income and is largely invisible
from corporate accounting statements (Murphy 1999). However, there is little evidence that
aggressive performance based compensation plans are helpful for good returns for the
company (Murphy 1999). Several studies on CEO compensation plans are available in the
context of the US. International evidence regarding executive pay as a form of good
corporate governance mechanism to minimize the risk in companies is just starting to
accumulate in the context of other developing economies.
3.4.1.3 Internal Audit
Internal auditing is a primary element of the corporate governance mechanism in public as
well as in private sectors (Cohen, Krishnamoorthy et al. 2002). Internal audit has been
believed as a monitoring function, Morgan (1979), considered as an important element of
organizational control but supposed dutiful to the accomplishment of most important
corporate objectives.
According to Konrath (1996), internal auditing is an independent judgment job which is
supposed to enable an organization to examine and evaluate organizational activities. Internal
auditing is an important managerial control device which measures and evaluates the
effectiveness of organizational control (Carmichael, Willingham et al. 1996), and is linked to
the structure and rules of the organization (Cai 1997).
IIA (2004) states the extended role of internal auditing is the activity of appraising and
adding to the enhancement of risk management, control and governance, and of identifying
the guarantee and conferring with responsibility of internal auditing in corporate governance.
In the business setting, internal auditors are now supplying a wider range of information
about the activities of organizational financial, operational and compliance which helps to
improve effectiveness, efficiency, and economy of management performance (Rezaee 1996).
With the help of audit committees in organizations, internal auditing contributes to corporate
governance by providing information about any fraudulent activities or irregularities (Rezaee
and Lander 1993) and encourages audit committees to perform periodic evaluations of its
activities and ensures that auditing procedures are consistent with leading practices (Sawyer,

57
Dittenofer et al. 2003).
3.4.2 External Governance
Involvement of takeovers and the influence of the regulatory environment can be further
categorized as external corporate governance mechanisms. External governance is briefly
explained below:
3.4.2.1 Takeovers
Prior to the 1980s, corporate governance mechanism was structured in a way that shareholder
interests were hardly ever the most important agenda for the management. Very less interest
was given to shareholder interest and management was devoted to the company rather than
shareholders (Holmstrom and Kaplan 2001). However, the 1980s and 1990s the US faced the
problem of free-cash flow and poor performance of conglomerate firms where takeovers were
seen as a way to correct this problem. By acquiring control of the firm through purchase of
stock, an acquirer can improve the operations of the firm and realize a profit on the increased
value of the acquired shares (Denis 2001). It has been seen that takeovers minimize
governance problems and that they boost the joint worth of the target and acquiring firm. The
use of takeovers as a governance mechanism is gathering pace internationally. However,
Shleifer and Vishny (1997) note that takeovers also have their limitation. Firstly, they can be
excessively costly and time consuming to succeed. As a result, large variations between the
present value and the possible value are inducements for management to have adequate
incentives to increase a takeover. They need a way in to huge financial resources. Secondly,
as an alternative of controlling agency costs, they can promote these when management
overpays for acquisitions that result in the right to use to personal benefits of control. Thirdly,
serving managers frequently actively lobby to circulate anti-takeover legislations. The
problem of losing prospective jobs means that managers frequently use a massive selection of
takeover defenses to stop takeovers from succeeding.
3.4.2.2 Ownership Structure
Several dimensions can be involved to define ownership structures and which have important
implications for corporate governance. The following sections outline some of these.

58
3.4.2.2.1 Concentration
The nature of ownership concentration is different around the world. La Porta, Lopez-de-
Silane et al. (1998) argue corporate ownership is extremely concentrated in the United States
and United Kingdom and elsewhere around the world. In the present context of around the
world, there are three points of view to consider on the differences in ownership
concentration. The first one is ‘over-regulation’ Black (1990) and Roe (1994) are the leading
advocates of the over-regulation prospective. Black (1990) argues that regulation creates the
expenses to block holders and, as a result, shareholders become passive in the United States.
Whereas Roe (1994) contends that regulation helps to prevent potentially important investors
from holding blocks of shares in the United States. Secondly, La Porta, Lopez-de-Silane et al.
(1998) present the difference of ownership concentration from the investor protection
perspective. He states that inadequate protection of investors is the cause of ownership
concentration. The countries which have good protection of investors have lower levels of
ownership concentration, and vice versa.
3.4.2.3 Identity
The issue of shareholder’s identity has important implications for corporate governance
because different shareholders bear the different objectives and attitude in which they use
their power which is reflected in the company’s strategy to meet profit targets, dividends,
capital structure and growth rates (Thomsen and Pedersen 2000). Prior research has not
dedicated sufficient consideration to this issue (Thomsen and Pedersen 2000; Gugler 2001;
Odegaard and Bohren 2004). Two characteristics i.e. inside or outside, are shown to
categorized the identity of shareholders.
Managerial holdings and block holdings by controlling owners is known as Inside owners
whereas Outside holdings are usually shares held by institutions and/or block holdings
outside the range of control of the controlling owner. Next, the nature of relationships with
the firm where they invest in also determines the identity of insiders and outsiders. Brickley,
Lease et al. (1988) use such a categorizing arrangement and classify owners as pressure-
sensitive, pressure-resistant and pressure-indeterminate. In the case of pressure-sensitive
shareholders, shareholders are liable to the authority which they get from the management of
the firm. They have possibly extensive relations with firms. On the other hand, those owners
who have clear performance objectives and any non-investor dealing with concerned firms
59
come under pressure-resistant owners whereas if there is no any clearly defined role for the
investor, they come under pressure-intermediate investors. Pressure-intermediate investors do
not have a clearly defined role. Activity of pressure-intermediate investors depends upon the
circumstances where they act in. They could be passive or active depending on the
circumstances. Considering the importance of the owner’s identity, the issue is investigated in
following section.
3.4.2.3.1 Block Shareholders
Block shareholdings minimize the free-riding problems linked with numerous atomistic
shareholders. These shareholders are able to address the agency problem because they have
interest in profit maximization (Shleifer and Vishny 1986). Generally, outsiders held this
shareholding. The problem created through the separation of ownership and control, large
managerial shareholdings help to minimize the problem which is created through the
separation of ownership and control (Jensen and Meckling 1976). However, a down side
related to a high level of owner-manager holdings is the probability of entrenchment
consequences setting in (Barberis, Boycko et al. 1996; Stulz 1988;) and minimized risk
taking (Dharwadkar, George et al. 2000) at high levels of ownership mainly in the context of
a developing economy. Individual, corporation and institutional holdings can be characterized
as block holders and their character could have a meaningful bearing on their influences. The
monitoring role of this shareholding can be significantly enhanced if they are experienced in
the same industry (Allen and Phillips 2000). This is the conflict between block holders and
minority stockholders. Problems, however, result from personal benefits enlarged at the
expense of other shareholders. As a result, the effect of these shareholdings can then be
negative, mostly if they qualify the regulating owner to practice pyramidal and cross-holding
structures that improve control and expropriation possibilities (Denis and McConnell 2003).
These problems can be mainly rigorous in developing economies where the weak regulatory
and legal structure and ineffective implementation of laws exist.
3.4.2.3.2 Debt Holders
Large debt holders have large investments in the company and their objectives are to get an
adequate return from their investment which motivates them for close monitoring of the
company. As Shleifer and Vishny (1997) mentioned, their influence is because of three
motives: firstly, the debt holder gets a variety of control right when a firm defaults; secondly,
certain debt holders lend on a short term basis and companies have to move toward these

60
lenders at short term time for more funds; and thirdly, the necessity of quick cash payments
provides the company’s management with more incentive for efficient operation for
generation of more cash flow (Denis 2001). All these activities and situations lead to
minimize the agency cost of free cash flow. In several countries, banks are linked with
business group structures. This results in an included element in examining the control of
these debt holders on firm governance. This trend is often referred to as relationship banking.
Relationship banking can have both helpful as well as risky effects. The helpful effects are
the minimization of information asymmetries vis à vis arms-length lending, while the harmful
effects are created with the effect of capital misallocation and the failure to dismiss
borrowers’ credit limitations due to lenders’ rent extraction (Claessens and Fan 2002). La
Porta, Lopez-de-Silane et al. (2003) consider a similar phenomenon i.e. related lending where
banks are controlled by those persons or big business groups who own certain part or interest
in non-financial firms and in turn they receive significant amounts of loan from the same
bank. Such structures are common practice in emerging economies. However, business group
structures, where groups try to control over the bank and this situation leads to the problem of
diversion of resources from depositors and/or minority shareholders to controlling owners.
3.4.2.3.3 Family Holding
Family holding is characterized as inside holding which denotes holding of a significant
portion of the equity stake. Claessens, Djankov et al. (2000) found strong existence of family
ownership in Asia as well as other developed economies. They found the ten largest families
control a third of the corporate sector in countries such as Indonesia, Philippines and
Thailand. Due to the dual role of family owners in the firm as owner and manager, they seem
to be the most dedicated and long-term investors in the firm. This situation linked the
family’s wealth with the concerned firm and longer-term view outcomes in family managed
firms being less probable to decline larger investment opportunities to improve current
earnings. Schulze, Lubutkin et al. (2001) present a view based on an unselfish attitude
regarding family members. This view argues that unselfishness generates a self – supporting
arrangement of incentives that inspire family members to come to a mutual understanding
and maintain the family relationship. This inspiration helps to reduce costs related to
monitoring (Schulze, Lubatkin et al. 2001).
However, block family holdings could result in risk avoider outstanding to the inconsistent
share of the family’s wealth being invested in the firm (Thomsen and Pedersen 2000). Biased

61
selection of managers and directors which drive to lower values relative to non-family firms
may be the result of higher levels of family ownership (Gomez-Mejia, Nunez-Nickel et al.
2001). Especially those family managed firms, which are connected to business group
structures, seems to be pursued by expropriation distresses.
3.4.2.3.4 Institutional Holdings
A unique feature of institutional holdings which compare to other groups of owners is that
they perform as intermediary owners for the final agents. Institutional owners are also
relatively varied and signify pension funds (public and private), mutual funds, bank and
insurance companies (Chaganti and Damanpour 1991). The attention has been given to
institutional ownership due to the large holding among institutional owners particularly in the
US and UK and also due to the series of scandals of corporate governance on both sides of
the Atlantic. These shareholders are frequently perceived as possibly one of the most
important agents to supervise the management of firms (Shleifer and Vishny 1986). However,
the manner and objectives of these owners results in meaningful heterogeneity in their
transaction behavior and their relationship to the performance of firms as a result of
combination in their arrangement. Institutional holdings are influenced to be involved in a
high degree of activism because they are completely independent and do not have any
commercial relationship with the company in which they invest (Holderness and Sheehan
1988). This character or situation makes them pressure-resistant and have a high degree of
activism. In contrast, insurance companies and banks seem to be particularly pressure-
sensitive in the situation of when most of their business comes from those corporations in
which they hold equity positions. Moderate level of activism exists in mutual funds and
private pension funds. The activism of private pension funds seems to be mitigated as a result
of greater focus on financial performance when they have a long-term horizon. Some
researchers see the institutional shareholder as the best owner (Monks and Minow 2001)
because they have unique characteristics and are highly motivated with vision and are active
to face rising governance issues. However, the results of this increased activism are at best
ambiguous.
3.4.2.3.5 Foreign Holding
There is an important issue for firms regarding foreign holdings which is linked to the
performance of the firm. Foreign ownership created the differences in the performance of
firms due to accumulated firm-specific advantages. These firm specific rewards derive from
62
managerial skills, export relations, coordinated relationships with suppliers and customers
and reputation (Aitken and Harrison 1999). Empirical studies support such an assumption.
Boardman, Shapiro et al. 1997 found significant differences in performance among
multinational companies and domestic firms in Canada. In the context of emerging
economies, Willmore (1986) found foreign firms to have higher ratios of value-added to
output, labor productivity and greater capital intensity in Brazil. Similarly, Wiwattanakantang
(2001) found the firm controlled by foreign ownership has superior performance in Thailand.
Foreign or institutional investors can, therefore, perform in a way that is extensively different
from foreign corporate investors. Fund managers decide to trade shares of domestic firms
whose performance is measured by the stock market indices or the performance of the firm in
a similar industry in the case of foreign financial institutions. These institutions have long
term investments and they focus on market based measures of performance. They have the
necessary motivations to sell their stakes unless a firm can maintain short-term capital market
gains. Foreign fund managers also diversify investments in different industries to obtain the
return associated with diversification of investment portfolios.
3.4.2.4 External Audit
Corporate auditing is the most reliable way of assurance to the investors and other
stakeholders about the company. To conduct the audit into the affairs of a corporation is the
major feature of guaranteeing effective corporate governance including transparency,
accountability and integrity. Under the corporate governance structure, management is
accountable to prepare detailed financial reports of the organization. However, financial
statements may not be reliable and shareholders may not trust the information enclosed
therein. To solve the problem of reliability of financial statements, management appoints
independent auditors to inspect the information which is included in financial statements and
report any discrepancies to the shareholders (Al-Thuneibal, Issa et al. 2011). In the process of
this audit function, the independent auditor promotes the belief to the public and gives
confidence to trust about the truth and fairness of financial statements (Sikka 2009).
According to Hopt (2007), the result of the Enron collapse emphasized the involvement of
external auditors for improvement of corporate governance. So involvement of external
auditors in the corporate governance mechanism is one of the best measures to contribute
corporate governance effort in addressing the agency problem. Corporate audit through
external auditing is made enforceable by laws to deal with agency problems which take place
from the separation of ownership from corporate management (Solomon 2007). Statutory
63
legislation enforces the appointment of an external auditor for investigation of financial
statements of a company and the expectation of independent opinions of the auditor about the
fairness of financial statements.
3.5 Corporate Governance in Nepal
Even though the capital market is small in Nepal, it is active with hundreds of thousands of
retail investors. Capital market developments have been hindered due to the weakness in the
overall framework for investor protection and corporate governance (World Bank 2005). As
for other developing countries, the role of banks is important in the Nepalese economy as the
major financier for the industrial and commercial activities. Some policies such as interest
rate deregulation, decentralization, provision for domestic and foreign bank have been
implemented in the 1990s to reform the financial sector. However, the efficiency of banking
institutions was not satisfactory. The sector witnessed less efficiency in profitability,
increasing NPL, lack in credit appraisal, shortfall in capital, slow recovery rate, ineffective
supervisory and regulatory role. Low accounting systems and audit qualities also hampered
the internal control system. All of these problems have been characterized as a lack of sound
corporate governance among the banks.
Considering the role of corporate governance in the financial sector, the central bank
launched corporate governance standards for banks and other financial companies with a
financial sector reform program. In the same way, accounting and auditing standards are
developed (World Bank 2005).
With the longer-term goal to promote sustainable growth and reduce poverty as well as with a
medium-term goal to improve corporate governance in the financial sector, the Asian
Development Bank approved the Corporate and Financial Governance Project on 22
November 2000 to Nepal. To meet the longer-term and medium-term goal, the project
targeted to strengthen the capability the SEBON, the Nepal Stock Exchange (NEPSE), the
Companies Registrar’s Office (CRO) in the Department of Industries, and the Central
Depository System. This project came into effect in 2001 with the target. Besides this, the
project also targeted to improve legal enforcement capacity and infrastructure by establishing
the National Judicial Academy (NJA), a legal information center and secured transaction
registry. This project became effective on 28 November 2001 (ADB 2010).
64
At the first stage of the project, financial sector of Nepal was fragile and ineffective and did
not contribute a significant role in mobilizing savings for productive investments. State
control, limited competition and poor governance were obstacles for improvement in the
banking industry. However, during the project preparation members involved in this project
agreed to give focus to improving corporate governance and developing the capital market
(ADB 2010).
With the support of the World Bank, the financial sector reformation project started in 2002
(Adhikary, Pant et al. 2007). Then NRB Act 2002, Bank and Financial Institution Act-2006
and Company Act-2006 were enforced. These acts have completely given power to NRB to
licensing, supervising and regulating all banks that are incorporated in Nepal except
cooperative organizations, employee provident funds and the Citizen Investment fund. The
NRB Act-2002 has, in this regard, arranged the fundamental legal and operational proposals
by which it can be run as an independent and autonomous central banking organization. This
feature can be imagined in the legal conditions setting out the structure of the board and areas
of responsibilities. The NRB Act- 2002 has made several provisions regarding the
appointment of professional and experienced members of boards of directors. The specific
educational qualification and experience are division for appointment and conflict of interest
has guaranteed that the bank and financial institutions can be run with good corporate
governance and manner with trust.
Later, the BAFIA -2006 made the NRB more powerful. It has repealed five statutory laws
and their powers and included them in the single Umbrella Act for the purpose of improving
the NRB as a central bank of Nepal. The Company Act-2006 has emphasized good corporate
governance among its major characteristics. It has focused on protection of the interest of
shareholders, the company itself, the influencing stakeholders and the larger society. It has
separated administrative and judicial functions respectively to the company registrars’ office
and the court. Besides the Company Act-2006, the Competition Act, and the Security
Exchange Act also has focused on the concepts such as accountability, responsibility and
financial transparency in the companies. In this context, the Security Exchange Board,
Management Association of Nepal, Federation of Nepalese Chambers of Commerce, and
other NGO’s, international NGOs have all conducted a study project for the purpose of
promoting good corporate governance in Nepal.

65
The Institute of Chartered Accountants Nepal started to issue accounting and auditing
standards through the affiliated Accounting Standard Board. The number of standards
remains to be an issue and the Institute of Chartered Accountants Nepal recommended to
follow the standards based on International Financial Reporting Standards and International
Accounting Standards (World Bank 2005).
3.5.1 Recent Developments in Corporate Governance in Nepal
As discussed earlier, financial sector reform processes started first in the 1990s and then in
2000 with some success. For the financial sector stability, the NRB issued Corporate
Governance guidelines for the banking sector. The main focus of the project was to create
awareness in stakeholders, capacity building and networking with other developing
economies. To overcome these problems, the NRB issued Unified Directives 6 for provisions
relating to good corporate governance. Guidelines for boards of directors, managers and
shareholders were the main objectives of this handbook. This handbook was prepared on the
basis of recommendations and guidelines made by the Basel Committee on corporate
governance and the Organization for Economic Co-operation and Development (OECD),
which has covered the four more important areas such as boards of directors, management,
financial disclosure, and auditors. The recommendations made in this handbook are
summarized below.
3.5.1.1The Board of Directors
A single tier board system is common practice in Nepal. Boards in general have some
members not related with the same family and separation of chairman and managing director
is practiced in most companies (World Bank 2005). As per the Bank and Financial Institute
Act (BAFIA) 2006, annual general meetings and articles of association appoint the directors
for banks and financial institutions. In the case of a vacancy of a director before a general
meeting, the promoter appoints the director for the remainder of term. In the case of
professional directors, the board appoints the professional director from the list of
professional experts maintained by the central bank. In the case of educational background,
BAFIA 2006 has specified for directors to have at least a bachelor’s degree with five years of
experience in those institutions which are related with governmental, or banking, or financial,
or corporate sectors. However, there is no restriction in education for directors who are
elected from the general public or shareholders. Articles of association mention the tenure of
office of a director to be not exceeding four years. In the case of retirement on tenure, they

66
are eligible to be reappointed to the office of director. In the case of stipend, the director only
gets the meeting allowance when they attend a board meeting. Other stipends are to be paid
to them when they are involved in a transaction of the bank or financial institution as
mentioned in the article of association. Except for this stipend, if a director is found to have
any other stipend that director shall be believed to have committed an offence and such
stipend shall be recovered from him or her.
BAFIA 2006 has also specified details about the board size, independence and board
diligence. Under the BAFIA 2006, every bank or financial institution has to maintain the
board size with not less than five and not more than nine directors, and also appoint at least
one professional director from the list maintained by the central bank. The board may hand
over its authority to the chairperson, any director, CEO or any person, firm, company or body
acting as the CEO on the condition that such powers shall be exercised under its supervision
or direction. The board can form one or more sub-committees for any specific purpose as
may be required. In the case of diligence, the board shall hold meetings at least twelve times
per year with the interval between any two meetings not to exceed two months. If at least
two-thirds of the directors request for the board meeting in writing, the chairperson can call a
meeting at any time. At least fifty-one percent of the total number of directors is required for
the board meeting. BAFIA 2006 has also specified the responsibilities of boards of directors
as mentioned below.
Directors are prohibited to do anything for personal benefit in the course of
performing the function of the bank or financial institution. If any director is found to
have derived a personal benefit, the bank or financial institution shall recover that
benefit from such director.
Prior to appointment to take over the duties of the board, if there was any financial or
personal interest of any director in the business of the bank of financial institution,
that matter can be disclosed to the board.
If any director performs any action beyond his or her jurisdiction, the bank or
financial institution shall not be responsible for this situation.
If any person performs any transaction with any director knowing that this is a
personal interest of the director, or cause to harm to the bank or financial institution,
such person shall not be considered for any claim against the bank or financial
institution in connection with such transaction.

67
All directors are prohibited to interfere with the regular work relating to the
management of the bank or financial institution.
3.5.1.2 Management
The BAFIA 2006 has specified the responsibilities and appointment criteria of management.
The appointment condition of the CEO is the same as appointment of a member of the board
of directors. The board appoints the CEO of the bank and financial institution under this Act
and memorandum and articles of association. The board has to appoint a qualified person as
CEO who has at least a bachelor’s degree in any subject and with at least five years of
experience of the office of director, or of the executive level in banking, financial or
corporate sector. The post of any governmental, banking and financial, corporate sector or
any international financial institution, organization or any level which is up to or higher than
such officer level, are defined as executive level. The CEO can be reappointed. However, the
tenure of CEO should not be more than four years. The board prescribes conditions for the
remuneration and other conditions of service of CEO. BAFIA 2006 has also specified the
duties and powers of the CEO. This Act has made the CEO accountable to the board for all of
the functions performed by him or her. Under this Act and memorandum and article of
association, the CEO has to supervise and control the activities for implementation of the
board’s decision. In this process, the CEO has to prepare annual budgets and action plans of
the bank or financial institution and present them for the board approval before
implementation.
In addition BAFIA 2006, Unified Directive issued by the central bank regarding code of
corporate governance has specified additional qualities about the CEO. The appointed CEO
should not have been declared bankrupt or convicted of an offence involving dishonesty or
fraud. Besides this, he or she should not have also been blacklisted (or from having
completed three years from being released) if blacklisted. If the situation of absence of the
CEO on leave or travelling abroad, the bank has to inform the legislative bodies prior to
appointing the person to officiate as the CEO. Such person shall be fully responsible, able
and qualified. The directives have also prohibited the CEO to work as an executive in any
other licensed institution.
68
3.5.1.3 Audit Committee
The Company Act 2006, BAFIA 2006 and Unified Directives issued by the central bank
regarding provision of a code of corporate governance have specified the audit committee
size, independence and duties. As per the Company Act 2006, every company whose capital
is listed with thirty million Nepalese currencies and which is fully or partly owned by the
government of Nepal, shall form an audit committee under the chairmanship of the non-
executive director who is not involved in day to day transactions of the company. Under this
Act, the committee shall consist of at least three members on the audit committee. This Act
has prohibited the person to be an audit committee member who is the close relative of the
CEO of a company. Similarly, the Unified Directive issued by the central bank regarding
code of corporate governance has specified that the CEO of a bank or financial institution
cannot be member of the audit committee. However, he can participate as an invitee
whenever necessary. The Company Act 2006 has mentioned that at least one member on the
audit committee should be an experienced person with a professional certificate in accounting
or having gained experience in accounting and financial fields after having obtained at least a
bachelor’s degree in accounting, commerce, management, finance or economics.
As per the Unified Directive issued by the central bank regarding the code of corporate
governance, in the process of implementation of day to day work, this audit committee shall
evaluate the financial condition of institutions, mechanisms of internal control and issue
necessary guidelines to the management of the institution, and also supply the findings of the
internal audit to the board of directors for the necessary action. This audit committee has also
responsibility to review the remarks contained in the external audit report and take initiation
for necessary corrective actions. It is also the responsibility of the audit committee to inform
the board of directors about the accuracy and fairness of accounts with adequacy of provision
for contingencies and classified credit. The audit committee also reviews the compliance of
the regulation issued by legislative bodies to the bank.
3.5.1.4 External Auditors
Under the Company Act 2006, every company shall have to appoint an auditor to audit the
company’s financial position. If the company has a branch office outside of the country, the
appointed auditor can audit that branch also if the foreign country’s law allows. As per this
Act, the company can appoint an auditor from amongst the licensed auditors by the general
69
meeting and in accordance with the provisions as contained in the memorandum and article
of association. However, the board of directors may also appoint the auditor prior to the first
annual general meeting. Under this Act, BAFIA 2006 specified that the appointed auditor for
banks and financial institutions should be from amongst the auditor included in the list of
auditors approved by the central bank. As per BAFIA 2006, the general meeting of the bank
and financial institution cannot appoint the same auditor for more than three consecutive
terms. In the process of appointment of auditor from among the auditors listed in the auditors
list approved by the central bank, the auditors should be a chartered accountant in case of
licensed institutions of Class “A” (commercial bank), ‘B” (development bank) or “C”
(finance company) and a chartered accountant or registered auditor in the case of licensed
institutions of Class “D” (co-operative). The central bank is authorized to remove any auditor
from the list of auditors who fails to fulfil the duty entitled to audit the accounts of licensed
institutions.
3.6 Summary
This chapter defined about corporate governance. The chapter highlighted the importance of
corporate governance as its scope is widespread in different disciplines including accounting,
economics, finance, law etc. Two perspectives i.e. narrow and broad - of corporate
governance are followed by organizations to strengthen their corporate governance practices.
Different perspectives such as narrow and broad for corporate governance has been
described. In the process of understanding corporate governance, special features of banks
and other non-financial firms in regards to corporate governance are analyzed in this chapter.
It is found that corporate governance is different for banks other than non-financial firms due
to their complexity such as opacity, liquidity production function, less informative etc. So,
internal and external governance mechanisms are the way to minimize the agency problem in
any organization. The main internal (board of director, CEO scheme, internal audit) and
external corporate governance mechanisms (takeovers, ownership structure, external audit)
are defined to understand the mechanism of corporate governance. Considering the
importance of corporate governance in any country, the present scenario and recent
development of corporate governance especially in the Nepalese banking sector in regards to
boards of directors, management, audit committees and external auditors is also explained.
BAFIA (2006) has specified the mandatory requirements for boards of directors such as their
appointment, allowances and responsibilities. Similarly, this Act has also specified the
procedure for appointment of management and external auditors. This chapter highlighted

70
that as part of a broader reform of the financial sector, the NRB has been given the authority
to oversee corporate governance standards for banks and other financial companies.

71
CHAPTER FOUR
Literature Review
4.1 Introduction
The main objectives of this study are to examine the determinants of Non-performing Loans
(NPL) and the influence of corporate governance on bank NPL and performance according to
the available Nepalese literature in this industry, of which there is virtually nothing. To
understand the theoretical framework, this chapter’s attention on reviews of previous studies
that examine issues which have an impact on bank NPL and the influence of corporate
governance on bank NPL and performance. Section 4.2 presents the financial intermediaries’
theory, agency theory and diversification theory which are related to bank risk and
performance. Section 4.3 and 4.4 present the existence of different risk in banks and also a
brief knowledge about the efficiency of banks. The theoretical link and previous empirical
findings of macro-economic and bank specific determinants of NPL and influence of
corporate governance on NPL and performance is explained in Section 4.5. Section 4.6
summarizes this chapter.
4.2 General Theories of Banking
The diversity and complexity of banking activities makes it difficult to define banks. The
studies on the field of several banking theories were developed to explain the existence of
banks in the economy. Certain concepts such as monitoring, information processing, liquidity
transformation, smoothing of consumption and commitment methods starts to define these
theories. Understanding the role banks have in the financial system is one of the fundamental
themes in economic and financial theory.
4.2.1 The Theory of Financial Intermediation
Although this thesis is specifically focusing on banks, it is necessary to address the broad role
of financial intermediaries in the market as banks, at first, are a special group of financial
intermediaries. In order to understand what a bank does, firstly we should make it clear why
financial intermediaries exist.
72
Conventionally, understanding the existence of financial intermediaries leads from market
deficiencies. Financial intermediaries act as the agents that transfer funds from people who
have a surplus of funds to people who have a shortage of funds (Mishkin 2007). The financial
intermediaries would be unnecessary in the situation of non-existence of transaction costs in
cases of perfect market situation where both borrowers and lenders have perfect knowledge.
But, these assumptions do not exist in the real world. As the existence of friction such as
transaction costs and information asymmetries in the market rationalize the existence of
financial intermediaries (Mace 1979; Allen and Santomero 2005; Matthews and Thompson
2005; Scholes, Benston et al. 2012).
Many researchers suggest that financial intermediation can be understood by looking at the
role of transaction costs (Gurley and Shaw 1966; Scholes, Benston et al. 2012). Financial
intermediaries have the ability of minimizing various transaction costs such as search,
verification, monitoring and enforcement costs (Matthews and Thompson 2005) and also
affect consumers’ inter- and intra-temporal decisions (Scholes, Benston et al. 2012).
An alternative rationalization of financial intermediation focuses on the argument of
information asymmetry. Some argue that information-based theories of intermediation
provide a more fundamental interpretation than some other approaches (Bhattacharya and
Thakor 1993; Brealey, Leland et al. 2012). Brealey, Leland et al. (2012) argue that moral
hazard prevents direct information transfer between market participants. Borrowers have
better knowledge about their project than lenders as lenders have to face the problem of costs
to get information and it is difficult to ascertain the quality of information. In this situation,
financial intermediaries can solve both these problems if they act as information sharing
coalitions that buy and hold assets on the basis of their specialized information (Matthews
and Thompson 2005; Brealey, Leland et al. 2012).
The existence of financial intermediaries is based on minimization of transaction cost and
information asymmetry. However, the reasons for intermediation are complex (Santomero
1984). In addition, dramatic and rapid changes in the financial market improved the functions
of financial intermediation. The function of financial intermediaries is not only limited to
minimizing transaction costs and information asymmetry (Allen and Santomero 1997; Allen
and Santomero 2005). Allen and Santomero (2005) argue that in recent decades,
intermediation is an increasing trend even though transaction costs and asymmetric
73
information is in declining trend. Some then suggest that, nowadays, the main role of the
financial intermediaries is risk management (Allen and Santomero 1997). In this viewpoint,
financial intermediaries have the ability of transforming more risky assets into less risky ones
(Fabozzi, Modigliani et al. 1994).
Whatever new functions a financial intermediary performs, it basically is an economic agent
that specializes in providing brokerage (e.g. transactions services, financial advice, and
insurance, etc.) and qualitative asset transformation services (e.g. divisibility offered by
mutual funds, and liquidity provided by bank funding, etc.) (Bhattacharya and Thakor 1993).
There are different kinds of financial intermediaries in the financial market such as building
societies, credit unions, insurance companies (life and general), and banks, etc. Compared
with non-bank financial intermediaries that often specialize in one or more of brokerage and
asset transformation services, banks provide virtually all of the above services (Bhattacharya
and Thakor 1993).
The debate of whether a market-based model or bank intermediation-based model is desirable
has lasted for several decades. Some researchers argue that the market-based system is to
some extent more advanced than the bank intermediation-based system (Allen and Gale
1995). For example, market-based financial systems provide various instruments through
price mechanisms, and hence improve the asset allocation process (Canals 2011). This system
is also efficient in terms of risk diversification (Canals 2011; Levine 2012), and provides a
high degree of liquidity (Holmstrom and Tirole 1996; Canals 2011). On the contrary, others
argue that bank intermediation offers some advantages compared with the capital markets.
Apart from the benefits of reducing transaction costs and transforming information that have
been outlined before, a significant advantage that bank intermediation has is to solve a major
part of the agency problem by performing a company-monitoring function (Diamond 1984;
Canals 2011). Moreover, banks have a comparative advantage of providing investment
opportunities for small investors (Canals 2011).
In market-based financial systems where the capital market has a lead role in transferring
funds, some argue that bank-like intermediaries are not important and may be in the process
of disappearing. However, Canals (2011) points out that a market-based system has a
significant disadvantage, that is, it is difficult to monitor and supervise companies due to the
complete separation between capital markets and the company. In this sense, banks as

74
“delegated monitors” (Diamond 1984) that operate in financial markets can provide ongoing
information about the borrowers to the lenders. In addition, banks as a mechanism for
delegated monitoring can dominate direct lending by using their own capital to reduce default
risk as well (Winton 1995).
The efficiency hypothesis suggests that technological development could increase scale
economies over time and allow larger banks to be managed more efficiently compared with
smaller banks. For example, on the lending side of the bank, because large banks have a
comparative advantage in using hard-information that is based on quantitative data, such as
valuations of collateral, financial ratios and credit scores (Berger, Molyneux et al. 2010), they
are better in micro-business lending, asset-based lending, and financial statement lending
than are small banks. However, on the other hand, large banks have a comparative
disadvantage relative to small banks in collecting and acting on soft-information that is based
mainly on qualitative information (e.g. character and reliability of the owner of the firm), and
thus small banks are likely to be better in relationship lending than large banks (Cole,
Goldberg et al. 2004).
As banks are important in the financial market and the real economy, it is crucial for banks to
rethink their business models to cope with the changes in the competitive environment as
bank strategies are of critical value to the stability of the sector. After the most severe
financial crisis since the Great Depression (Brunnermeier 2008), commercial and residential
real estate values continue to fall, avenues for bank financing via the securitization business
and interbank markets have dried up and major banks have suffered large losses of capital
(Berger, Molyneux et al. 2010). Wilson, Casu et al.(2010) suggest that it is necessary to re-
examine the scale, scope, governance, performance, and the safety and soundness of financial
institutions.
4.2.2 Agency Theory
Economists explored risk sharing among individual and groups during the 1960s and early
1970s (Wilson 1968). Different attitudes of cooperating parties towards risk create the risk-
sharing problem. Agency theory extended this risk-sharing problem as an agency problem
which results from different objectives and division of labour of cooperating parties (Ross
1973; Jensen and Meckling 1976). Specifically agency theory is guided at the pervasive
agency relationship in which one party (the Principal) assigns responsibility to another (the

75
Agent), who executes that work. Agency theory tries to define the relationship using the offer
of contract (Jensen and Meckling 1976). Agency theory deals with the relationship between
the agent (manager) and the principal (shareholders) under which shareholders assign
responsibilities to the manager to run their business. This theory argues that when both
parties are expected to maximise their utility, there is good reason to believe that the agent
may engage in opportunistic behaviour at the expense of the principal’s interest.
Agency theory tries to solve two problems in the agency relationship. The first problem is
concerned with the different desires and goals of principal and agent. The second problem is
verification of the agent’s work and whether or not it is in the interest of the principal because
this process increases the monitoring cost. The problem arises in an agency relationship
because the principal and agent may follow different actions due to their different risk
preferences. Jensen and Meckling (1976) describe this situation as an agency relationship
where the inability of the principal to directly monitor the agent’s action could lead to moral
hazard, thus increasing the agency cost.
In large corporations with a diverse shareholding, management actions deviate significantly
from satisfying shareholders’ interests and tend to seek to maximize their own personal
interest at the expense of the shareholders (Davis, Schoorman et al. 1997). Because
management often has little or no capital invested in corporations that they manage, they tend
to exploit shareholders’ wealth. This exploitation usually takes the form of higher salaries,
bonuses and consumption of prerequisites. This is referred to as the agency cost.
Management is often referred to as the agent and the shareholders as principals. The
principal-agent relationship is based on a symbiotic scheme whereby principals have capital
and lack managerial skills while managers have the skills but lack the capital. They, thus,
come together since they both complement each other for a business to be a reality (Adams
and Ferreira 2009) but, unfortunately, human nature is so possessive that self-interest prevails
and erodes trust between the two parties.
Next, agency theory is based on the assumption of man as being a rational actor who seeks to
maximize their individual benefits. In agency theory, both the agent and the principal seek to
benefit as much as possible with the least possible expenditure but each always seeks the
option that is most beneficial to their individual utilities. Principals incur agency costs when
76
there is divergence between the interest of shareholders and agents because agents will
rationally seek to maximize their own utilities (Davis, Schoorman et al. 1997).
Agency theory is criticized on the claim that it assumes that a rational man is self-interested
and acts only to satisfy their egos. This implies that there is no trust and a form of moral
scepticism which is not helpful in building systems of applied ethics (Heath 2009). The
objectives of agency theory are to minimize the agency costs incurred by principals through
the internal controls in order to check agents’ egoistic behaviour (Davis, Schoorman et al.
1997).
To reduce the conflict, it was suggested that managers own shares of the firm so that their
interests are in line with shareholder wealth maximisation. The traditional manager-
shareholder conflict, however, is not as relevant to firms with highly concentrated ownership.
Large shareholders can more easily monitor managers because they have more access to
information and thus have more knowledge of decision making (Shleifer and Vishny 1986).
However, since the large shareholders’ investment is less diversified and they thus have
limited liquidity, they are exposed to financial loss if the firm experiences difficulties. This
constraint may encourage them to extract a private benefit at the expense of the minority
shareholders. As large owners have effective control of the firm and also because they
oversee the financial reporting policies of the firm (Fan and Wong 2002), they can, and will,
conceal any expropriation from the financial reports and other investors. Leuz, Nanda et al.
(2003) affirmed that the incentive to avoid external monitoring and loss of reputation to
encourage the dominant shareholders to conceal their behaviour.
In addition, agency theory points out the role of the board of directors to monitor both the
majority shareholders and management; and to protect minority shareholders’ interests (Fama
and Jensen 1983). It was suggested that the board of directors could help reduce agency costs
because it holds ultimate control over management even though some of the decision
functions are entrusted to top management. Sound corporate governance should be
considered as a vital means in reducing agency conflict especially when it functionally
accommodates the interest of all shareholders. Complementing the board role in monitoring
the management, resource dependence theory suggests the board be represented by outside
directors to enhance the flow of information and to reduce uncertainty and secure firms’
resources. Pfeffer and Salancik (2003) suggested that the board acts as a ‘co-operatives’

77
mechanism that links firms with the external environment in accessing resources, exchanging
information, developing inter-firm commitment and establishing legitimacy.
Managerial hegemony theory views the board of directors as a legal fiction that is ineffective
in reducing agency conflict, if the management dominates the board (Mace 1979). As a ‘co-
optatives’ mechanism, the board is flexible and easy to implement as management may
control the selection of the outside directors (Pfeffer and Salancik 2003). Management may
appoint outside directors who have less knowledge about the business, hence making them
dependent on the information supplied by the managers or the outside directors who are
motivated merely by the financial incentive from the board seat and desire the reputation
associated with board membership (Kosnik 1987). Directors who have less knowledge about
the business are less likely to challenge the management decision.
4.2.3. Diversification Theory
Due to competitive pressures, banks pursue diversification strategies in order take advantage
of asset growth, realization of efficiency gains, reduction in idiosyncratic risk and increased
profitability (Wilson, Casu et al. 2010). The concept of diversification to minimize risk is
3originated principally from portfolio theory. The primary principle of portfolio theory in
finance recommends that diversified investments balance risk. Diversification assists to
minimize risk in the situation of non-perfect correlation of cash flow and total risk (Markham
1973). However, this view was assessed by Levy and Sarnat (2012) and reasoned that a firm
should not diversify without operating synergies because the firm value would not be
improved. Their arguments are founded on the Capital Assets Pricing Model (CAPM) with
the hypothesis that there are no benefits to diversification that shareholders cannot obtain by
diversifying their own portfolio of financial assets. Lewellen (2012) and Higgins and Schall
(2012) give the financial justifications for diversification because, through the diversification,
the firm can minimize the cost of capital by obtaining cheaper debt because of a reduced
threat of bankruptcy or by minimizing taxes.
Traditional portfolio and banking theory suggested that diversification actually improves the
performance or reduces risk and consequently imparts greater safety on the part of banks
(Hayden, Porath et al. 2007). The banks are affected by several regulations which create
incentives either to diversify or to focus their portfolios, i.e. the imposition of capital
requirements tied to the risk of the bank’s assets or asset investment restrictions. This kind of

78
regulation gives the importance of “focus versus diversification” issues in the bank. So,
policymakers should be especially concerned to understand whether or not banks can achieve
the advantages from diversification (Hayden, Porath et al. 2007). Professionals in financial
institutions mostly argue that highly leveraged banks should diversify their portfolios to
minimize their costly financial distress. Furthermore, some models of intermediation theory
recommend that diversification helps the institution to achieve integrity in their role as
screeners or monitors of borrowers (Diamond 1984; Boyd and Prescott 1986).
Diversification involves entering into different economic sectors or different geographical
regions other than the bank’s home base. It is argued that the entrance of banks in new areas
may create the adverse selection in its pool of borrowers (Gehrig 1998). Thus, general
diversification is further likely to be unattractive, mostly when the bank’s home sector loans
have either low or high downside risk.
One argument always in favour of diversification is that the bank with lending activities in
different markets is always safer than the bank lending in a single market. Diversifying
lending activities into more markets/sectors or regions lets banks spread risk across regions,
and if loan earnings across regions are not perfectly correlated, geographically diversified
banks are safer because they are less exposed to shocks that hit individual areas (Diamond
1984; Demsetz and Strahan 1997; Morgan, Rime et al. 2003). The risks taken by banks
depend upon the market structure that could change as the result of diversification across the
market due to competition of banks in the market. The expansion of banks decreases a bank’s
rents, erodes its charter value and, therefore, provides incentives to take more risk as result of
competition for borrowers (Keeley 1990). Besides this, high competition might also drive to
lower loan interest rates or reduce any moderation to acceptable levels of risk that minimize
the degree of borrowers’ risk shifting incentives and thus reduces a bank’s exposure to risk of
failure (Boyad and Gertler 1993).
Diversification theory hypothesizes that a well-diversified portfolio can minimize risk which
can be in the form of assets or geographic locations. Therefore, if a bank can diversify its
loan portfolio among many borrowers, or spread the loan into several sectors and/or in many
geographic locations, the lending bank can reduce its risk exposure, resulting in increased
safety for its depositors.
79
Hence, for a diversified firm to function effectively, both core competences across multiple
businesses within the same corporation and the corporate parenting advantage must be
identified, developed, and matched together on a dynamic basis. For our theoretical synthesis,
this aspect will be referred to as the resource-based explanation of the diversification and
performance relationship.
4.3 Different Types of Risk Faced by Banks
There are many definitions of risk that vary by specific application and situational context.
Risk is usually considered as reproducing a deviation in the allocation of likely outcomes
from an assumed investment (March and Shapira 1987). Risk is also expressed as the
possibility that real benefits from holding a security will depart from the projected benefit;
the greater magnitude of deviation and the greater probability of its occurrence, the greater
risk (Saunders and Cornet 2008). Risk is a situation under which there is a probability of an
opposing departure from a projected outcome that is estimated. Thus, risk can be defined as a
measure of the possibility that the future outcome may be unpredictably different from that
which we expected.
Banks are financial firms pursuing the objectives of maximization of the value of equity and
wealth of shareholders (Bauer and Ryser 2004). Hence, banks take risks so as to realize a
return. Banks are risky by their nature. In other words, banking is the management of risk
(Gup, Avram et al. 2007). Bessis (2002) defines risk as uncertainties resulting in adverse
variation of profitability or in losses. There are so many potential risks which impact on bank
returns such as credit risk, liquidity risk, interest rate risk, market risk, foreign exchange risk
and political risk (Campbell 2007).
4.3.1 Credit Risk
Credit risk which is the risk of a customer or counterparty defaulting is the biggest risk the
financial intermediaries are facing (Gray, Cassidy et al. 1997). Credit risk is the risk that a
credit that has been disbursed by a bank will not be repaid, either partially or in full, at the
maturity. In some situations, payment may fully repay after the maturity date of loan. In some
situations, the bank will have to face the bad debts due to the borrower’s situation of non-
payment of loan on maturity (Campbell 2007). Whereas, Gup, Avram et al. (2007) define
credit risk as the borrower failing to meet their obligation which is related to the earnings and
80
capital of the bank. Sobehart, Keenan et al. (2003) define credit risk as the possible risk that
relates to the failure of the borrower or counter party to meet their obligation as per a signed
contract regarding loan repayment.
The authors classify credit risk into firm specific credit risk and systematic credit risk. Firm
specific risk is the risk of default connected with the specific types of risks taken by that firm.
While a change in external variables in the financial markets, regulation and economic
conditions are associated with systematic credit risk (Hassan, Karels et al. 1994; Corsetti,
Pesenti et al. 1998; Ahmad and Ariff 2007) which affects all borrowers.
4.3.2 Liquidity Risk
Liquidity risk is the risk which arises from the inability to achieve reasonable returns
(Muranaga and Ohsawa 2002). Basel (1997) stated, liquidity risks are created from the failure
of a bank to accommodate a decrease in liabilities or to fund an increase in assets. The bank
cannot collect adequate funds either by increasing liabilities or by transforming assets quickly
enough and at a reasonable cost if the bank faces the liquidity problem which directly affects
the profitability of the bank. There are some drivers such as promised based deposits and
long-term lending that create massive liquidity problems for banks (Kashyap, Rajan et al.
2002). Liquidity risk can be divided in two risks - market liquidity and funding risk (Decker
2000). Market liquidity risk is related to the problem of selling assets due to a lack of
liquidity in the market and this risk is a sub-set of market risk as well. Next, is funding
liquidity risk when the liabilities cannot be met as they fall due or it may be paid at an
uneconomic price.
It is found that liquidity risk created various consequences for banks following the subprime
mortgage crisis. Following the credit crunch of 2007, many banks were reminded of the
importance of liquidity risk. Considering the importance of liquidity risk in the future, it is
essential for banks to strengthen liquidity risk management.
4.3.3 Market Risk
On the other hand, market risk results from the movements in the market factors such as the
interest rate and foreign exchange changes. It is also sometimes called systematic risk or un-
diversifiable risk. Bessis (2002) defines market risk as arising from adverse deviations in the
value of trading portfolios as a result of market movements. While Saunders, Cornett et al.
(2006) define market risk as the risk related to the uncertainty of bank earnings on their
81
trading portfolio caused by the change in market conditions. Previous definitions show that
market risk is closely related to interest rate and foreign exchange risk. In fact, the market
risk increases when bank trade assets and liabilities rather than hold them for a long term
investment or funding purposes. In other words, banks face market risk when interest rates
and foreign exchange movements combine with trading activities (Gallati 2003). In contrast,
interest rate and foreign exchange risks are not limited by trading activities. They are
resulting from the movement of interest rate and foreign exchange rates, and affect assets and
liabilities in general.
4.3.4 Operational Risk
The risk which is related with business strategy, internal mechanisms and operations,
technology and mismanagement is defined as operational risk (Sun and Chang 2011). As one
of the innovations proposed by Basel II, operational risk is defined by Basel (2001, p.2) as
“the risk of direct or indirect loss resulting from inadequate or failed internal processes,
people and systems or from external events”. This approach is in accordance with other
opinions (Santomero 1997) that consider operational risk associated with the problems of
accurately processing, setting and taking or making delivery on trades in exchange for cash.
However, the Basel Committee suggested that the bank should not depend on this general
definition of operational risk because size, nature and complexity of these activities have
unique definitions of operational risk. The Committee believes that lack of understanding and
managing operational risk which are almost inherent in all bank mechanisms and transactions
might, to a large extent, minimize the possibility of identifying and controlling some of the
risk. So operational risk is a term that has a variety of meanings within the banking industry
and, therefore, for internal purposes banks may choose to adopt their own definitions of
operational risk. This internal definition should respect the individual situation of every bank
such as its size and sophistication. The nature and complexity of its activities in an economic
manner, considering the full range of material operational risk facing the bank, captures the
most significant causes of severe operational losses. As a result, sound operational risk
management is a reflection of the board’s and senior management’s effectiveness in
managing its product portfolios, activities, mechanisms and systems.
82
4.4 Definition of Efficiency
4.4.1 Efficiency
In the present context, efficiency is one of the most important objectives for the manager and
most valuable destination of all organizations (Hoseininassab, Yavari et al. 2012). Efficiency
is the important target commercial banks are striving for as efficiency reflects a bank’s
resource allocation performance and is also the result of evaluation of all input as well as
output (Kang 2013). The company injects the resources for the output which is known as
efficiency. Through the injection of limited resources, the company sets a target to obtain
maximum output. Efficiency tells not only the things reflected in financial statements but also
the business performance which financial analysis has difficulty to explain (Kang 2013).
Therefore, bank efficiency is an indicator that shows what part of the capital of the bank was
used to cover the additional operational and management cost of the bank. Similarly, from an
income point of view, a bank’s efficiency indicator shows what income is generated by banks
from their activities (Lakstutiene 2008) and evaluating both the bank’s core ability or
competence and future sustainable development ability. Analysis of bank efficiency will help
us to find what the bank is not doing well and propose corresponding solutions to improve
management performance.
4.4.2 Non-performing Loans
The main function of a bank is to collect deposits from customers and lend those deposits to
the borrower (Warue 2013). In the process of lending, it is difficult for a bank to predict
whether a loan will be paid in full or not. This process creates default risk in lending. Banks
use diversification and other credit risk management techniques, such as screening borrowers
for minimization of loan default rates, consequently they are able to minimize levels of NPL.
Basel (2006) recommended banks to categorize NPL according to days at risk and set the
provision for loans when analyzing NPL. The committee recommends the loan loss provision
as follows:
Normal: 1 percent provision for loans less than 30 days at risk.
Watch: 3 percent provision for loans with principal or interest due and unpaid for 30 to 90
days.
Substandard: 20 percent provision for loans past due more than 90 days but less than 180
days.

83
Doubtful: 50 percent provision for loans past due for more than 180 days but less than one
year.
Loss: 100 percent provision for loans and past due for 360 and above.
The risk classification using days at risk is used to calculate NPL. This is of the general
opinion that a high proportion of NPL reflect that banks use less resources than common
practice in their credit evaluation and loan monitoring process (Karim, Chan et al. 2010).
Several researchers including Altunbas, Liu et al. (2000), Fan and Shaffer (2004) and
Girardone, Molyneux et al. (2004) found that NPL minimize the efficiency in the banking
sector. Similarly, Altunbas, Liu et al. (2000) also found that the level of NPL is negatively
related with bank efficiency. Berger and DeYoung (1997) and DeYoung (1998) highlighted
that efficient banks manage credit risk in better ways. When the bank books the loan amount
for recovery, banks will bear additional operating costs from non-value added activities to
manage and supervise the collection process which minimizes the efficiency (Karim, Chan et
al. 2010).
4.5 Determinants of Non-performing Loan
The literature of determinants of NPL identifies two sets of factors to explain the evolution of
NPL over time. One group focuses on external events such as the overall macro-economic
conditions which are likely to affect borrowers’ capacity to repay their loan, while the second
group which looks more at the variability of NPL across banks, attributes the level of NPL to
bank level factors. Empirical evidence, however, finds support for both sets of factors.
4.5.1 Macro-economic Variables
The financial crisis in different time periods has identified the cost that the economy has to
bear as a result of banking crises (Agnello, Furceri et al. 2011; Agnello and Sousa 2012).
Considering this cost, it has also inspired some economists to explore the drivers that may
trigger a banking crisis (De-Grauwe 2008; Laeven and Valencia 2008; Laeven and Valencia
2010). Llewellyn (2002) found that interaction between the economic, financial and structural
weaknesses are the main determinants of a banking crisis. Likewise, movements in economic
situations from a growth cycle to a recession led the banking crisis in many countries.
Research on determinants of credit risk which is often measured by NPL has shown that the
macro-economic factors are the main drivers which influence risk in all sorts of investments
(Crouhy, Galai et al. 2000; Saunders, Cornett et al. 2006). The degree of investment credit
84
risk is highly influenced by changes in economic policies, political changes and the goals of
leading political parties (Belkin, Suchower et al. 1998; Saunders, Cornett et al. 2006).
Changes in monetary and tax policies, economic legislation changes, as well as import
restrictions and export stimulation, signify that economic policy changes also influence the
range of investment credit risk (Saunders, Cornett et al. 2006). Macro-economic factors
include the growth in domestic product, inflation rate, the employment rate, stock index, and
exchange rate movements in the economy (Aver 2008).
4.5.1.1 Economic Activity
The theoretical link
Many studies of bank risk conceived risk as forming from economic activity. The nature of
banking business is to function as an intermediary for the real sector which is closely related
to economic conditions that largely determine the aggregate health of the real sector. The risk
in intermediaries tends to rise during stagnation and recession periods because these
situations worsen the business condition. Adverse selection and moral hazard of borrowers
are high during business cycle troughs that led the bank to vulnerable situations (Baele,
Vander et al. 2005). Loan quality is sensitive to economic cycles (Hadad, Santoso et al.
2006). There is a correlation between economic activity and loan quality (Kalirai and
Scheicher 2002). Worsening economic activity decelerates the income and accelerates the
payment difficulties and more businesses are adversely affected which will result in higher
default risk. Therefore, the cyclical variable the GDP growth, is projected to be negatively
related to NPL. Koch and McDonald (2003) suggest that good economic conditions build the
confidence of both borrower and lender about the investment project and their ability to repay
their loans. This confidence of borrowers encourages banks to relax credit standards and
accept more risk. In contrast, during recession periods when NPL and provisions for loans
increase, banks might be very conservative and tighten credit requirements and only
borrowers with high credit ratings get new loans. Thus, lending during recessions is safer
which leads to low NPL. Furthermore, declining economic situations are responsible for
having a negative effect on profitability of banks because low interest rates in recessions
contribute to the reduction of bank interest margins. In summary, it can be estimated that the
business cycle is negatively correlated with bank risk accelerating at times when economic
activity slows down.
85
By contrast, it is also noticed that cyclical downturns are not always the cause of higher
riskiness in banking; they can also help improve the efficiency in bank risk structures that
were built up during business cycle upturns. There is evidence that financial systems tend to
behave pro-cyclically, that is business and financial cycles co-move (Borio, Furfine et al.
2001). During good economic conditions, collateral value is high and banks lend funds more
readily and asset growth accelerates. By nature the bank is a risk taker and often takes
excessive credit risk which is apparent in subsequent recession periods when the bank’s
earnings from borrowers, payment of principal and collateral value decline. Thus it is very
important to check the degree of risk that is already reported on bank loan portfolios and its
concurrent risk taking behavior. For example in business recessions, the bank may behave
more risk-aversely by tightening credit conditions for new borrowers while the risk connected
with its assets-acquired previously may still increase due to factors mentioned above.
Bhattacharya and Roy (2008) and Salas and Saurina (2002) suggest the opposite. During
boom periods, economic activities in general are increasing and the volume of cash held for
either businesses or households is increasing. These conditions contribute to the increased
ability of borrowers to repay loans which leads to reducing credit risk for banks. When
growth is down or even negative, cash inflow of businesses and households is reducing which
in turn, increases the likelihood of delaying their financial obligations. Moreover, during
economic downturns, the value of collateral usually falls. This could increase the problem of
moral hazard and adverse selection of borrowers (Arpa, Giulini et al. 2001). As a result, bank
NPL exposure increases.
Empirical findings
An investigation of the relationship between economic cycles and bank risk exposure shows
that the relationship is dialectical (Jiménez and Saurina 2006). The empirical evidence shows
that bank risk is closely related to the economic and business cycle.
The impact of economic growth on bank failure was studied by Richard (1999). He assumed
that a slower or negative growth would probably increase NPL, financial stress and reduce
bank profitability. He found a significant and negative relationship between the real GDP
growth and bank failure. Das and Ghosh (2007) investigated the drivers of problem loans in
the Indian stated owned bank during 1994 to 2005. They found a significant and negative
relationship between problem loans and GDP growth which indicates problem loans are
86
mainly the result from downturns in the economic activity. Similarly, Thiagarajan, Auuapan
et al. (2011) examined the relationship between current GDP and one year lag GDP with NPL
in the Indian banking sector and found a negative relationship between current GDP growth
and NPL, and found no significant relationship between one year lag of GDP growth and
NPL. The same relationship was found by Jiménez and Saurina (2006) and Salas and Saurina
(2002) who studied the determinants of problem loans in the Spanish banking sector.
According to Jiménez and Saurina (2006), the elasticity of GDP growth shows an increase of
one percent as the rate of GDP growth decreases the NPL ratio by 0.03 percent.
Similarly, other studies conducted by Zribi and Boujelbene (2011), Gunsel (2012), Ali and
Daly (2010) and Castro (2012) in the case of the commercial bank of Tunisia, North Cyprus,
Australia and GIPSI (Greece, Ireland, Portugal, Spain and Italy) respectively, and found a
negative relationship between GDP and credit risk. Saba, Kouser et al. (2012) and Fofack
(2005) examined the relationship between GDP per capita as an economic condition and
credit risk in the US and Sub Saharan Africa respectively and found the same result.
However, Fofack (2005) found no significant influence of GDP growth on NPL in Sub
Saharan Africa. The same result was found by Aver (2008) and Kalirai and Scheicher (2002)
in the case of the Slovenian and Austrian banking sector respectively. In contrast to all above
results, a study conducted by Bofondi and Ropele (2011) in the Italian banking sector showed
that GDP is positively related to credit risk lag of three and four quarters in firm lending and
household lending respectively.
4.5.1.2 Inflation
The theoretical link
Inflation is another macro-economic factor which affects the efficiency of the banking sector.
Inflation depreciates the value of money which reduces the rate of return in general. As a
result, the financial sector makes fewer loans, resource allocation is less efficient, and the
intermediary role is reduced with a negative impact on capital investment. The reduction in
the capital investment negatively affects economic performance (Boyd, Levine et al. 2001).
Inflation is important for banks because they typically deal in nominal financial instruments
that is, instruments denominated in fixed amounts. For example, when a bank makes a loan, it
accepts nominal financial instruments (notes, mortgages, commercial paper and other
financial securities) as evidence of the debtor’s obligation to the bank. When a bank borrows,
it issues nominal financial instruments to creditors (deposit liabilities, acceptance and
87
debentures) as evidence of its obligation. While nominal financial instruments differ from
one another in many respects, they share one important characteristic: their payments are
fixed in nominal value that is, in terms of currency. Nominal instruments make up the bulk of
bank assets and liabilities. Furthermore, bank is typically net creditors in nominal instruments
because their nominal assets exceed their nominal liabilities (Kessel 1956; Kessel and
Alchian 1962). An increase in anticipated inflation raises the nominal interest rate. This
increases the number of currencies that creditors or debtors who are transacting in nominal
financial instruments expect to receive or pay when loans mature. If this expectation is
realized, all nominal values will be higher at maturity.
In the banking area, Athanasoglou, Brissimis et al. (2008) suggest that the impact of inflation
on bank profitability depends on whether the operating expenses increase at a faster rate than
inflation. Since inflation reduces the future value of money, it pays people (both potential
borrowers and lenders) to try to forecast inflation over the relevant time period. This forecast
is called anticipated inflation (Kessel and Alchian 1962). When banks accurately forecast
inflation, bank managers can appropriately adjust the interest rate in order to increase their
revenues faster than the cost which mitigates the negative impact of inflation. If borrowers
and lenders expect the value of the currency to depreciate in terms of the goods it will buy
over the life of the loan (i.e. if they anticipate inflation), the nominal interest rate specified in
the loan contract will take account of this. The nominal interest rate quoted in financial
markets is formed in the process of contracting between borrowers and lenders. They indicate
the amount of currency the borrower must pay to the creditors in the future in exchange for a
given amount of present value. The interest rate will be sufficiently high to compensate for
the expected depreciation in the value of the currency (Sargent 1972).
As for the impact of changes in the inflation rate on the credit risk exposure of banks, Ahmad
and Ariff (2007) suggest that high levels of inflation lead to an increase in the price of
properties and real state. As a result, speculative activities in share trading increased by asset
price bubbles in properties and real estate. These activities could lead to high credit risk in the
absence of reform policies which aim to reduce the asset price bubbles due to high rates of
inflation. Thus, high interest rates increase the costs of borrowing which leads to an increase
in the obligation of borrowers resulting in an increase in the NPL.
88
Empirical findings
The findings of previous studies indicate that a high rate of inflation affects negatively the
rate of real growth of the economy which affects the financial sector efficiency. A low and
stable inflation rate is essential for the future economic growth and gives a sense of
confidence in the future. Thiagarajan, Auuapan et al. (2011) examined the relationship
between current inflation and inflation with a one year lag with NPL and found a positive
relationship, and no relationship between inflation with one year lag and NPL in the case of
public sector banks. The result showed that there is no significant relationship between
inflation and credit risk in the case of private sector banks. Similarly, Gunsel (2012) and
Rinaldi and Sanchis-Arellano (2006) examined the influence of inflation to credit risk in
North Cyprus and Euro Zone countries respectively and found a positive relationship. By
contrast, Zribi and Boujelbene (2011) and Vogiazas and Nikolaidou (2011) when examining
the Tunisian and Romanian banking sector, found a negative relation between inflation and
credit risk. However, some other studies by Aver (2008), Bofondi and Ropele (2011) and
Castro (2012) in the case of the Slovenian, Italian, and GIPSI banking system, did not find
any influence of inflation on credit risk. Inflation has the dual effect of eroding the real value
of outstanding loans as well as reducing borrowers’ real income. As one effect is almost
terminated by the other, the ultimate effect of inflation on the credit risk is null (Castro 2012).
4.5.1.3 Money Supply
The theoretical link
Money supply is another macro-economic factor that has an impact on borrowers and thus on
NPL. The total amount of money in an economy in the form of coins, notes, and bank
deposits is known as the money supply. A change in the money stock can be generated in
several different ways (Arestis and Skouras 1985). There are two primary suppliers of
money: the monetary authorities and the banking system. The banking system supplies
deposit money through credit creation. In the context of the banking system, the focus is on
the liabilities side of the bank’s balance sheets, since the money supply consists mostly of
bank deposits. The bank multiplier is assumed to be stable. On the other hand, the money
demand is understood to be a stable function of income. On the liabilities side, the velocity of
circulation of deposits can be highly variable; any shortage of money can be partially offset
by a change in velocity. On the assets side, credit creation is the source of deposit liabilities.
89
Kaldor and Mirrlees (1962) argued that the endogenous money supply helps the financial
system to be stable. According to Kaldor and Mirrlees (1962), a credit loan is different to
other products. As the requirement for granting a loan, the bank creates the deposit. The
changes in the bank’s credit demand are endogenously responsive to the supply of deposit
money. Credit growth by banks in the market accelerates the demand for deposits.
Expansionary monetary policy increases the money supply which stimulates credit demand
directly by minimizing the cost of funds indirectly by a potentially positive effect on the
activities of the economy (Eickmeier, Hofmann et al. 2009). The changes in money supply in
the economy affect the behavior of borrowers and this behavior impacts on the relationship of
money supply to credit risk. The money supply increases if the central bank follows the
expansionary monitory policy because this lowers the required reserve rate and reduces the
discount rate. Increases in money supply assists investment and consumption which directly
increases the productivity and profitability. Moreover, increasing the money supply will
decrease interest rates and increase the opportunity of the public to have cheaper funds. These
conditions increase the ability of borrowers to pay back their obligations and contribute to
decreasing bank exposure to credit risk (Ahmad and Ariff 2007). Accelerating money supply
growth can act as an indicator of future growth potential (Berk and Bikker 1995).
Empirical findings
Money supply is an important factor that affects the economy. The impact of money supply
on credit risk was examined by Ahmad (2003). She examined factors contributing to risk
formation in 65 deposit taking institutions in Malaysia. She found a significant and negative
relationship between broad money supply (M3) as a proxy of money supply, and credit risk.
A similar result was found by Vogiazas and Nikolaidou (2011) and Kalirai and Scheicher
(2002) in the Romanian and Austrian banking systems. Bofondi and Ropele (2011) examined
the relationship of money supply on bank NPL in household lending and firm lending in
Italy. His result showed that money supply is negatively related with NPL if banks lend to
firms, and found no significant relationship if bank lending is to households. Similarly,
Fofack (2005) found no significant relationship between money supply and credit risk in Sub-
Saharan African bank.
4.5.1.4 Exchange Rates
Exchange rates are also one of macro-economic debates in the literature for developing
markets and volatility of exchange rates is one of the main sources of economic instability

90
(Zameer and Siddiqi 2010). The volatility in exchange rates that was found to have an
important role in inducing banking crises in many countries, at first weakens economic and
financial stability (Lindgren, Garcia et al. 1996). The inter-relation between currency
movement and bank foreign exchange exposure drives the effect of exchange rate
fluctuations on bank risk. The exchange rate measures the relative worth of a domestic
currency in terms of another (Zameer and Siddiqi 2010). The depreciation of a domestic
currency is supposed to harm that bank whose foreign exchange liabilities significantly go
beyond their assets denominated in foreign currencies. However, Lindgren, Garcia et al.
(1996) argued the importance of the relationship between the exchange rates and NPL is to
impact on the performance of bank borrowers which reduces the bank’s profitability. Overall,
devaluation of a domestic currency is expected to increase and decrease credit risk for bank
loans extended to importers and exporting sectors respectively.
The devaluation of a local currency against a foreign currency is the main problem a firm
faces that makes it difficult to retain local customers because the high prices of imported
products tend to affect the prices of final products sold locally (Sirpal 2009). As the domestic
price of foreign exchange rates rises (depreciates), it becomes more expensive to procure
foreign products and services as their cost would have increased thereby requiring more units
of domestic currency to acquire the same quantity of foreign goods and services than before.
This result leads to an increase in the demand for bank credit to support finances for covering
the additional expenditure required as a result of exchange rates depreciation (Ngerebo 2011)
and reduces the firm’s profitability. If the firm’s profitability decreases, the firm faces the
problem to service its interest and principal on loans. A real depreciation is supposed to have
a good effect on the operating profit of a firm which is involved in exporting and the opposite
effect on those firms which are involved in importing (Nucci and Pozzolo 2001). By contrast,
a large currency depreciation may worsen the firm’s net worth through the balance sheet
effect, as the dollar-denominated debt burden of firms increases (Pratap and Urrutia 2004).
In the case of nominal exchange rates, depreciation of the local currency leads the borrowers
to repay less than they borrowed initially which improves the net real position of borrowers.
With regards to exports, a lower domestic currency is taken as positive. So, depreciation of
the local currency leads to lower loan defaults and losses if the country’s trade is based on
exports. In contrast, this situation may be the opposite for those borrowers who borrow
91
foreign funds and can stand to profit if the domestic currency appreciates (Kalirai and
Scheicher 2002).
Empirical findings
In general, the relationship between the exchange rates and loan losses is unclear (Kalirai and
Scheicher 2002). Castro (2012) conducted a study in GIPSI (Greece, Ireland, Portugal, Spain
and Italy) from 1997 to 2011 and found a negative relationship between real effective
exchange rates and credit risk. He argued that increases in exchange rates i.e. the goods and
services produced in a country may be relatively more expensive as a result of the
appreciation of the domestic currency. This situation weakens the competitiveness of export-
oriented firms and affects adversely their ability to service their debts. Zribi and Boujelbene
(2011) conducted a study in Tunisia and used the ratio of risk weighted assets to total assets
as a proxy of credit risk and found a negative relationship between exchange rates and credit
risk. Similar results were found by Gunsel (2012) as well. Some researchers including Aver
(2008) and Kalirai and Scheicher (2002) in Slovenia and Austria did not find any significant
relationships between foreign exchange fluctuations and credit risk. However, these authors
used different measurements for credit risk rather than NPL. Vogiazas and Nikolaidou (2011)
found real effective exchange rates with a three quarter lag are negatively related with NPL in
Bulgaria between 2001to 2010 which was also found by Fofack (2005) in Sub-Saharan
Africa.
4.5.1.5 Share Price Indices
The theoretical link
Stock market indices provide an indication of cyclical trends of the macro-economy and
within industry sectors. Increasing stock market indices supply higher profits to investors
which minimizes the probability of loan defaults (Kalirai and Scheicher 2002). This linkage
is captured at the level of an individual firm in the benchmark model of (Merton 2012). The
trend of share market indices gives the picture of general financial conditions of companies
and sectors in the market. The growth of share prices indicates an improvement of the
financial position of the firm which may contribute to minimizing credit defaults. Good stock
market performance contributes to reduce the credit risk. A high share market index denotes
a high return for investors and hence, lowers the credit risk (Hadad, Santoso et al. 2006).
Growth rates of share price indices reflect a positive outlook on a firm’s profitability;
moreover, an increase in financial wealth is expected to decrease the probability of
92
households defaulting on loans since it gives them additional means for servicing their debts
(Bofondi and Ropele 2011).
Empirical findings
Aver (2008) examined the influence of stock exchanges in the credit risk of the Slovenian
banking system and found a positive relationship. Kalirai and Scheicher (2002) found a fall in
the stock index amounted to an increase in the credit risk in Austria. Bofondi and Ropele
(2011) found no relationship in growth of share indices and credit risk in Italian banks if the
loan is disbursed in households, and found an inverse relationship if the loan is disbursed to
firms. Castro (2012) conducted a study in GIPSI (Greece, Ireland, Portugal, Spain and Italy)
from 1997 to 2011 and found a negative relationship between share price indices and credit
risk. Beck, Jakubik et al. (2013) also found a negative relationship between share price
indices and loan quality. Increases in share prices reflect an improvement in the financial
condition and contribute to a reduction in the rate of NPL.
4.5.1.6 Market Interest Rate
The theoretical link
The interest rate is also one of the important factors which affect the NPL because it impacts
on the debt burden. As the consequences of market interest rates affect the debt burden, it is
positively related with NPL. In fact, rising interest rates increase the debt burden and lead to
higher rates of NPL (Aver 2008; Nkusu 2011; Louzis, Vouldis et al. 2012).
Market interest rates which are a central source of market risk for banks, drive the interest
rate for banks. Increasing interest rates directly affect the profitability of banks and it bears
the danger of increased credit risk. Asymmetric information theories claim that higher
interest rates taken as the problem of adverse selection in the credit granting process, and also
high interest rates create the chance of selection of adverse projects which creates risk in
banks. High interest rates discourage good borrowers who have good projects and this
situation shifts bad applications toward risk. Moreover, increasing interest rates change the ex
post incentives for borrowers encouraging them to take on riskier projects (borrowers’ moral
hazard) (Stiglitz and Weiss 1981). Thus, in setting information asymmetries, a rise in interest
rates will ceteris paribus increase credit risk on bank balance sheets.
Koch and McDonald (2003) suggest a negative relationship between interest rates and credit
risk. In time, when interest rates are low, good economic performance stimulates firms to
93
achieve good earnings and banks tend to be less restricted in their credit standards. However,
some new borrowers may not provide important information to banks for the credit
assessment process. These conditions lead to an adverse selection problem which increases
NPL in banks and finally leads to higher credit risk. Similarly, Das and Ghosh (2007) suggest
that high real interest rates raise the cost of funds for borrowers which increase their
obligations. As a result, the borrowers will face difficulties to repay their loans on time.
These conditions increase the probability of default for borrowers and increases bank credit
risk exposure.
Empirical findings
Interest rates are an important macro-economic factor that affects bank risk and profitability.
Richard (1999) found a significant negative impact of real interest rates which is measured by
nominal interest rate on three year treasury notes minus the inflation rate on bank failure. A
similar result was found by Fofack (2005) in Sub-Saharan Africa and found a positive
relationship between real interest rates and credit risk. This suggests that the rising interest
rate, to the extent that the increase of the cost of deposits at the commercial bank, may have
contributed to a decrease in bank profits. On the other hand, Jiménez and Saurina (2006) used
interbank interest rates to measure the impact of interest rates on problem loans. They found a
significant and positive relationship between interest rates and problem loans. The same
relationship was found between the interest rates measured by ten year Italian Treasury bonds
and the loan loss provisions (Quagliariello 2007). Castro (2012) conducted a study in GIPSI
(Greece, Ireland, Portugal, Spain and Italy) from 1997 to 2011 and found a positive
relationship between long term interest rates and NPL. Similar positive relationships between
interest rates and NPL were also found by Aver (2008), Nkusu (2011), and Beck, Jakubik et
al. (2013). This supports the idea that high interest rates increase the obligation of borrowers
and thus increases bank NPL. Ali and Daly (2010) found no significant relationship between
short-term interest rates and NPL in Australia.
4.5.2. Bank Specific Variables
The determinants of NPL should not be sought exclusively in macro-economic factors which
are viewed as exogenous forces influencing the banking industry. On the contrary, the
distinctive features of the banking sector and the policy choice of each particular bank with
respect to their efforts for maximum efficiency and improvement in their risk management
are expected to exert a decisive influence on the evolution of NPL. In the previous section,

94
some of the macro-economic determinants of NPL are discussed. However, bank specific
variables may provide much richer insight into the determinants of NPL. Even though macro-
economic conditions may offer a valuable contribution to explain credit risk at an aggregate
level, it is the bank’s specific financial situation that will ultimately determine whether it will
default on its liabilities. Taking bank specific variables may provide a clearer understanding
of which factors drive NPL. A strand in the literature has examined the connection between
bank specific factors and NPL.
4.5.2.1 Non-performing Loans Lag
The theoretical link
For most banks, the loan account represents a half or more their total assets and about half or
more of their revenue. Hence, banks are looking for ways to keep the quality of their loans
high in order to generate higher returns. An increase of NPL is a major problem that faces
most banks. A high level of NPL causes banks to increase spending on monitoring, working
out and possibly becoming more careful in managing the part of their loan portfolio that is
currently performing (Sanjeev 2007). If the risk is not identified quickly this leads to
reducing the quality of loans and thus, increases problem loans. When such low quality loans
grow, a large amount of them become NPL. A high proportion of NPL reflects a decrease in
the quality of loans which finally increases bank exposure to credit risk (Campbell 2007).
Higher credit losses are naturally associated with higher levels of NPL. So management of
NPL has always been a point of concern for regulators and researchers. The lagged NPL can
positively influence the current NPL levels because the problem loans of one year are not
completely written off and have a carryover effect (Thiagarajan 2013).
Empirical findings
A study to examine the influence of previous year NPL to current year NPL was conducted
by Salas and Saurina (2002) in context of Spanish commercial and saving bank between 1985
and1997. They found a positive relationship of one year lag NPL with current year NPL. In
the same direction, Das and Ghosh (2007) also found the same result in Indian state-owned
bank. A recent study was conducted by Thiagarajan (2013) in the commercial banking sector
of Belize to examine the relationship of one year NPL lag with current NPL. He also found a
positive relationship between the two variables.

95
4.5.2.2 Loan Loss Provision
The theoretical link
Provision for loan losses shows management’s perception of the quality of bank loans. Loan
loss provision is important in assessing the financial system which contributes to a fluctuation
in bank profitability and capital position (Beatty and Liao 2009). Loan loss provision
measures the credit risk from a bank’s portfolio generated within one year and correlated
positively. Loan-loss reserves serve to cover NPL and thus the ratio of NPL. The risk in bank
portfolios builds up during the expansion period. In recessions, the ex ante credit risk
increases ex post in credit losses. It is important for banks to identify the increase in credit
risk/credit losses in their loan portfolios when it is building up.
Loan loss provision is an accounting tool which is used to cover credit losses. An appropriate
identification of credit risk and credit losses along the lending cycle will improve the
soundness of each and help to control pro-cyclicality in lending. The estimated amount of
loan loss provision should be adequate to bring the balance of allowance of loan losses to an
adequate level to absorb expected loan losses (Koch and McDonald 2003; Quagliariello
2007).
Based on the performance of quality of loan portfolios, banks set the loan loss provision. The
decision to set aside provisions depends on certain credit risk considerations: default risk, risk
tolerance and the macro-economic environment. In most countries, setting the provisions are
based on losses on individually assessed loans or the amount of defaulted loans and are also
based on a portfolio of loans. This system varies across the countries (Borio and Lowe 2001).
Pérez, Salas-Fumás et al. (2008) note that during an economic upturns, banks lend more loans
which increases the loan loss provision during this period. With the materialization of risk,
loan loss provisions increase in cases of riskier companies during downturns which lead to
setting higher loan loss provisions. Loan loss provisions are generally at a minimum level
during most of a boom period which start to occur at the end of the expansion period and
report very high levels in a downturn. Banks set low loan loss provisions during good
economic conditions because a higher loan loss provision is perceived by shareholders as a
signal of low credit quality (Quagliariello 2007). Goldstein (1998) noted that reorganization
of bad loans can be considerable, if it is classified on the basis of loan payment status rather
the borrower’s creditworthiness or market value of collateral. If the bank can recognize NPL

96
systematically, then the loan loss provisions are apt to be too low and bank net income and
capital will be systematically overstated.
Empirical findings
A study to examine the behavior of loan loss accounting disclosure of banks in Hong Kong,
Malaysia, and Singapore from 1993 through 2000 was done by Eng and Nabar (2007). They
found that loan loss provisions are positively and significantly related with both of beginning
loans outstanding and change in NPL. This suggests that firms increase their provisions in
response to an increase in credit risk. Ahmad and Ariff (2007) conducted a multi country
study and found a positive relationship between loan loss provision and credit risk in
Australia, Japan, Mexico and Thailand. The same result was found by Fischer, Gyeyie et al.
(2000) and Bikker and Metzemakers (2005). This indicated that the higher loan loss provision
ratio signals potentially higher credit risk on banks needing to make greater provision against
potentially greater NPL.
4.5.2.3 Loan Growth
The theoretical link
Rapid credit growth can generate distress in banking sectors through shocks in macro-
economic conditions and loan quality because loan assessment may suffer due to huge
amounts of new credit granted (Duenwald, Gueorguiev et al. 2005). It is an obvious reason
that the business cycle impact on loan growth which may be the cause of loan losses.
Business expansion requires the bank to increase the loan which can turn into loan losses
during business contractions. Thus, rapid credit growth as the result of business cycles may
naturally be inclined to continue high loan losses (Keeton 1999). Das and Ghosh (2007)
suggest that rapid credit growth contributes to a decrease in the quality of loans which are
considered one of the most important causes of problem loans. Economic expansion periods
require the bank to engage in competition for market share in loans which results to rapid
credit growth rates. Lending credit facilities to lower credit quality borrowers is the best way
to gain market share on loans (De-Lis, Pagés et al. 2001) which eventually deteriorates asset
quality during the next economic downturn. If the bank enters a new market or product in this
situation, this kind of market share strategy may be harmful to banks due to informational
disadvantage (Shaffer 1998). Keeton (1999) suggests that banks have to lower their loan rate
and credit quality if they are more willing to lend. As a consequence of this, more borrowers
may request loans which then increase the volume of loans. However, loan losses will take a
97
few years to respond because generally the tendency of loan losses cannot be examined in the
same year. In the different situation, if there is a high demand for credit in the market, the
bank can raise loan rates and increase the assessment process of loans which minimizes the
credit growth. However, this leads to future loan losses and increases the credit worthiness of
borrowers.
In some situations, for example, high demand for loans and credit growth, other than a shift
in supply may not lead to higher loan losses. If there is not any relation between credit
demand and borrowers’ underlying creditworthiness then the rapid credit growth may not
transform into loan losses. Next, if in the market there is the possibility of an increase in
return on investment, this may boost the demand of credit which increases the capacity of
borrowers to repay the loan. So, in the above situation, the rapid credit growth may not result
in loan losses (Keeton 1999).
Empirical findings
Loans represent the main use of funds in most banks, and thus they are the main source of
income for banks. Therefore, banks are looking for ways to increase their lending. In contrast,
rapid credit growth could lead to an increase in bank credit risk exposure. Salas and Saurina
(2002) used percentage change in loan growth rates lagged three periods as a proxy for credit
growth. They found a positive and significant relationship between the rapid growth of loans
and problem loans. The same result was found by Jimenez and Saurina (2006). This indicates
that banks which have aggressive growth policies have a greater tendency for an increase in
problem loans. Similarly, Das and Ghosh (2007) found a strongly significant and positive
relationship between lagged credit growth and problem loans. Accordingly, credit growth
today will convert into a problem loan after one year. In contrast, Altunbas et al. (2007) used
the ratio of net loans to total assets as a proxy of net lending. They found a significant and
negative relationship between bank risk measured by loan loss reserves and net lending.
Vogiazas and Nikolaidou (2011) found loan growth is negatively related to credit risk in
Bulgaria. Castro (2012) conducted a study in GIPSI (Greece, Ireland, Portugal, Spain and
Italy) from 1997 to 2011 and found a positive relationship between loan growth and credit
risk. Extensive credit growth may be a sign that several risky loans are being approved
increasing the number of possible failures to pay in future. Vogiazas and Nikolaidou (2011)

98
conducted a study in Romania from 2001 to 2010 and found a negative relationship between
credit growth and credit risk which is measured by loan loss provision to total loans.
Kraft and Jankov (2005) analyzed the phase of credit boom during the transition period in the
Croatian banking system and did not find a strong relationship between rapid credit growth
and credit quality.
4.5.2.4 Capital
The theoretical link
The capital account of the bank plays several important roles in supporting daily operations
and ensuring its long run viability. One of the capital functions is to provide a cushion against
the risk of failure by absorbing the financial and operating losses until the management can
address the bank’s risk. The bank capital and risk are related to each other. When the
borrower fails to pay its obligations, the defaulted amount results in losses that can eventually
reduce the bank’s capital (Bessis 2002). The nature of a financial intermediary requires that it
holds capital that is sufficient to reduce the probability that it will default on its debt to a
minimum level (Gascón and González Méndez 2000). Existing theories justify capital
regulation of banks as moral hazard problems.
Several studies have been done on the subject of capital. With the portfolio approach which is
used by Hart and Jaffee (1974) and Pyle (2012), banks are treated as utility-maximizing units.
Koehn and Santomero (2012) stated that banks maintain higher leverage ratios to divert their
portfolio to riskier assets. To solve this situation, Kim and Santomero (2012) recommended
the correct measurement of risk by regulators is the calculation of solvency ratios. Bichsel
and Blum (2004) suggest two channels of how the capital ratio of the bank affects its
possibility of failure. The first channel is adequate capital which has superior cushion to
manage an adverse shock and hence reduce the probability of failure. The second channel is a
negative correlation between capitalization and probability of default. The negative
relationship implies that an improvement in capitalization leads to decreasing the probability
of default. Cannata and Quagliariello (2006) suggest that the relationship between capital and
risk under minimum regulatory requirements is supported by one of the following of two
explanations. Firstly, those banks try to increase more capital assuming more risk taking in
future and to maintain expected profitability levels. Secondly, the bank’s reaction to capital
increases depends on the initial capital base. Well capitalized banks tend to maintain existing
99
levels of capital, and poorly capitalized banks react either by increasing capital or reducing
risk in order to build capital reserves.
Empirical findings
The capital of a bank is an important factor that covers losses resulting from risks with which
banks deal, and support growth opportunities. A study to investigate the relationship between
change in risk and change in leverage of 19 Swiss banks for the period 1990 to 2002 was
done by Bichsel and Blum (2004). A positive and highly significant correlation was found
between change in capital and risk. Altunbas et al. (2007) studied a number of banks
operating in 15 European countries between 1992 and 2000. They found a significant and
positive relationship between capital level and bank risk. The bank with higher loan loss
reserves tends to have a higher capital level. Ahmad and Ariff (2007) conducted a multi
country study and found positive relationships between capital and credit risk in Japan,
Malaysia and Mexico. This reflects that banks would be required to maintain adequate capital
as a safeguard to absorb significant losses that might arise because of increased credit risk.
Berger and DeYoung (1997) also found the result in the same direction and rationalized that
large banks have the capability to absorb the losses through their capital so they tend to invest
with risky borrowers for lucrative returns whereas Godlewski (2006) found a significantly
negative correlation between capital ratio and credit risk which is proxy by NPL to total
assets ratio. Zribi and Boujelbene (2011) conducted a study of 10 commercial banks in
Tunisia and found that the prudential regulation of bank capital also negatively influenced the
level of bank credit risk. By using annual data of Italian bank during 1994-2003, Cannata and
Quagliariello (2006) found a negative significant relationship between change of capital
levels and bank risk in terms of those banks whose relative capital ratio is close to regulatory
requirements but the result was not supported in the case of banks with large capital levels.
Different to the above studies, Aggarwal and Jacques (2001) found no significant relationship
between capital and loan portfolio risk.
4.5.2.5 Profitability
The theoretical link
Efficient banks are better at managing their NPL as highlighted by Berger and De Young
(1997). Banks tend to experience a decrease in their scale profitability level after controlling
for risk factors. Inefficient banks performing poor screening and monitoring of borrowers
will tend to have inferior portfolio quality. Kwan and Eisenbis (1997) demonstrate that higher
100
levels of bank profitability can minimize problem loan ratios of banks. Any efficient bank
management strives to keep the growth of revenues which come mainly from bank loans and
investment and service fees. At the same time, the management has to manage the rising
costs which are the interest paid on deposits and borrowing from the money market in
addition to the operational expenditure such as the employee salaries and benefits (Koch and
McDonald 2003). The bank manages its profitability through different ways. Firstly, cost
efficiency which measures management flexibility to adjust costs to changes in the business
development signaled by revenue. It shows how well management and staff have been able to
keep the growth of revenue which mainly comes from the bank’s loans in advance of rising
costs mostly comes from interest on deposits. A decrease in margins can prompt banks to
adopt ‘gamble for resurrection’ strategies, resulting in the creation of loan portfolios with
higher probability of default in the future (Das and Ghosh 2007).
According to Angbazo (1997), one of the revenues the bank earns comes from the interest
margin which produces profit in order to increase capital which absorbs the increasing risk
exposure. Hence, the bank with highly risky loans will need high net profits to compensate
for higher credit risk or NPL.
Empirical findings
As for the relationship between the bank’s profitability and risk exposure, Angbazo (1997)
found that the relationship between credit risk exposure measured by the net charge off,
which is the difference between loans that are actually written off and recoveries divided by
the total loan and net interest margin, is significant and positive. This indicates that the bank
with a higher interest margin increases risky loans. On the other hand, Fan and Shaffer (2004)
analyzed profitability of large commercial banks in the US by accounting for NPL. They
found that although bank profitability is negatively related to NPL, it is not statistically
significant.
In contrast, Das and Ghosh (2007) who studied the relationship between net interest margin
and credit risk found a significant and negative relationship between the two variables. Salas
and Saurina (2007) conducted a study of the relationship between inefficiency as a proxy for
operating expenses to operating margin and NPL, and found a significantly positive
relationship in the case of savings banks. Similarly, they also examined the relationship
between interest margins and performance with two and three lag and non-performing lag
101
and found interest margins with a three year lag are negatively related with NPL in savings
banks.
4.5.2.6 Branch Growth
The theoretical link
The effect of geographic diversification on bank returns and risk is a more debatable issue
among researchers. Researchers argue that geographic diversification helps the bank to
achieve a lower cost of funds by enlarging their geographic deposit marketing and when they
diversified geographically they can increase their revenue by accessing more profitable
products and maintain expected profitability. In addition, geographic diversification assists
the managers to extend their expertise on operations and benefiting from scale and scope
economies and improve bank earnings. Deposit marketing, branch networks and branching in
different sectors is a basic element of diversification (Hughes, Lang et al. 1996).
In some cases, diversification does not imply safer banks. Bank preference is also important
so that in some situations, the bank can follow the policy of safe investment by taking risk
through increasing leverage and the holding of risk assets, or both (Morgan and Samolyk
2003). It is also supported by the theoretical literature about banking regulation that bank
branching networks lead to a more stable banking system by helping banks to diversify their
assets and broaden their deposit base (Hubbard 1994). Similarly, geographically diversified
loans can be expected to minimize the credit risk in loan portfolios (Hughes, Lang et al.
1996). An argument usually created in the study is that branch banking stabilizes banking
systems by minimizing their vulnerability to local economic shocks whereas limitations on
branching have been connected to the volatility of the banking system (Carlson and
Mitchener 2005). Volatility of returns on bank loan portfolios can be minimized by
geographical diversification (Hughes, Lang et al. 1996). However, the close relationship
between the bank and the borrower provides comprehensive and important information about
borrowers; hence the lack of necessary credit risk management expertise probably leads to
more problem loans. In some cases, when banks increase their volume of loans, they are
likely to face problems if the credit expansion is made to a new sector or geographical area
which the bank does not have experience in the conditions. As a result, the adverse selection
problem will increase (Jiménez and Saurina 2006).
102
Empirical findings
Conventional wisdom would argue that banking instability in the United States in the 1930s
would have been less severe had the US allowed extensive branch banking (Calomiris 2000).
Similarly, Friedman and Schwartz (1971) suggest that the severity of banking panic during
the great depression in the US was the result of the absence of branching. Numerous studies
about bank failure from the depression state that permitted branch banking had lower failure
rates than unit banking (Wheelock 1995). Similarly, studies regarding individual banks
showed that banks that had branches were more stable than unit (or single office) banks
(Calomiris and Mason 2000; Carlson 2004).
The various studies regarding the effect of bank branching at the aggregate level
hypothesized that branch banking increased systemic stability. Wheelock (1995) examined
the impact of different regulations on bank failure during the 1929 to 1932 period in different
states and found lower failure rates of banks in the states which allowed branch banking.
Mitchener (2006) found the same result in states with legalized branching which had lower
failure rates during the Depression. Grossman (1994) compared 25 different countries during
the Great Depression and found the same result. Large branching network banks were less
likely to experience a banking crisis. Also, using data on individual state banks from the
depression period, Carlson (2004) examined three states where branch banking was relatively
widespread and found that branched banks were more likely to fail than unit banks. Instead,
he found that branch banks used diversification to reduce their reserves rather than lower the
risk of their portfolio - a strategy that worked poorly during the global shock of the Great
Depression. Thiagarajan, Auuapan et al.(2011) examined the Indian banking sector and found
no significant relationship between branch expansion and credit risk. Salas and Saurina
(2002) found the growth policy of banks negatively affects the level of problem loans and has
a statistically significant coefficient of branch expansion with a three year lag. Commercial
banks with more aggressive growth policies and branch expansion suffer an increase in
problem loans three years later. Das and Ghosh (2007) conducted a study in Indian state
owned banks and found no relationship between branch growth and NPL.
4.5.2.7 Size
The theoretical link
The scholars in the banking studies tend to assume that when risk is calculated as ex ante risk
taking incentive, size and safety do not go hand in hand. They provide many results that

103
larger banks are not safer than smaller banks even if they have better diversified asset
portfolio composition. Large banks follow the policy to gain their diversification advantage
by lending in risky assets and use less capital. However, they are not safer than smaller banks
in overall risk (Lee 2008). Generally, large banks recognize a cost benefit over small banks
because they have the ability to operate with less capital. They usually have the same opinion
that less capital may bring the risk into the firm because of both a leverage effect and a moral
hazard incentive of stock holders. Furthermore, there is belief by investors that the regulators
protect large banks from failure because of their importance in the economy; the regulators
would not have a great incentive to monitor the risk taking behavior of large banks (Lee
2008). So the large bank gets the opportunity to take more risk due to less monitoring by
investors (McAllister and McManus 1993) which shows that large banks operate with lower
capital ratios.
Empirical findings
Empirical results show that the size of bank has a major effect on the bank’s operations.
According to Das and Ghosh (2007), bigger banks have more ability to control problem loans
by diversifying their loans compared to smaller banks. Nevertheless, they found a significant
and positive relationship between size measured by a natural log of value of the total assets
and problem loans. Salas and Saurina (2002) used the ratio between the assets of a chosen
bank in a chosen year, and the total assets of all banking in the same year as a measure of
size. They suggested that big banks have more possibilities of promotion, have more power
and higher management salaries. They found a significant and negative relationship between
problem loans and size. This indicates that larger banks appear to have fewer problem loans
than smaller banks. The size provides more diversification opportunities for banks; fewer
concentrated portfolios is the reason for the negative relationship. The same result was found
by Altunbas et al. (2007) who measured size by a natural log of dollar value of the total assets
in the European bank. They suggested that small banks tend to deal with higher moral hazard
activities by pledging highly risky projects.
4.5.2.8 Interest Rate Spread
The theoretical link
Financial institutions assist in savings mobilization, diversification, risk taking, and resource
allocation. The bank incurs certain costs as a result of non-synchronization of deposit and
loans (Ngugi 2001). They fix the deposit and loan interest rate as their intermediary service
104
charge under uncertainty. The difference between borrowing rates and lending rates defines
the intermediary cost (Rhyne 1998). The policy environment and market microstructure
characteristics of the banking sector define the interest rate (Ngugi 2001). Risk-averse banks
operate with a smaller spread than risk-neutral banks since risk aversion raises the bank’s
optimal interest rate and reduces the amount of credit supplied. Actual spreads, which
incorporate the pure spread, are, in addition, influenced by macro-economic variables
including monetary and fiscal policy activities (Emmanuelle 2003).
The banking firm tries to maximize the utility of their profit or expected profit with the trend
of market structure and risk management. So, the component of interest rate spread fluctuates
with market structure. For example, interest rates are outlined using the variation in loan rate
if there is competitive deposit rate and market power in the loan market. But interest rate
simply denotes the difference between the lending rate and the deposit rate if there is market
power in both the loan and deposit markets (Collins and Wanjau 2011). Interest rate measures
the profitability between cost of funds and return on investments. These costs are normally
transferred to the borrower who might, with time, be in a position of not repaying the loan
(Collins and Wanjau 2011). When there is high intermediation cost, reflected in the high
interest rate spread, the borrower may be unable to repay his/her loan due to the cost of such
borrowings. This leads to a high risk of loan default and hence, non-performance (Chand
2002).
Empirical findings
Das and Ghosh (2007) measured interest rate spreads as interest income minus interest
expenses and found no significant relationship in Indian state owned banks. Ahmad and Ariff
(2007) conducted a multi country study and found a negative relationship between interest
rate spread (total interest income/total earnings assets minus total interest expenses/total
earnings assets) and credit risk in India and Thailand but positive for banks in France. They
also found no significant relationship for banks in Malaysia, Korea, Mexico, US and
Australia. The opposite relationship implies that the higher spread rate may well discourage
less qualified borrowers to borrow, thus minimizing the bank’s credit risk exposure.
4.5.3 Corporate Governance Variables
Previous studies in the area of corporate governance present the details of many-sided nature
and behavior of the companies. It is argued that that there is no one theoretical perspective
105
that can fully summarize the complicities of an organization (Martin and Cullen 2006). This
requires different theories to offer better reasons for corporate governance characteristics and
mechanisms for a different point of view and different dimensions. Daily, Dalton et al. (2003)
stated that a multi-theoretic approach to corporate governance is important distinguishing
many mechanisms and structure that might suitably improve organizational functioning. As
the governance literature suggests, the study will explain the complicities of relevant
governance mechanisms in the light of the two corporate governance theories - agency
theory, and stewardship theory of which agency theory will dominate and the other one is
situational explanatory. The effect of governance mechanisms to control the effect which
agency problems have on company financial efficiency has been the subject of a number of
empirical studies. A case of banks in Germany conducted by Lowengrub, Luedecke et al.
(2003), supports that the larger role of corporate governance can solve the agency problem in
particular banking firms. One of the facts regarding the importance of corporate governance
in banking firms is that the governance mechanism would be able to minimize the
expropriation of bank resources and promote bank efficiency (Caprio, Laeven et al. 2007).
This section summarizes the studies that have been based on corporate governance
mechanisms (Board characteristics, Audit Committees characteristics, ownership structure
and CEO compensation) and on financial efficiency of firms.
4.5.3.1 Board of Directors Characteristics
Fama and Jensen (1983) suggest that the board of directors represents the higher form of
internal control to monitor top management including the CEO. Board size, board
composition and board diligence are among important attributes of the board. Jensen (1993)
argued that these factors influenced the board’s role in monitoring managers.
4.5.3.1.1 Board Size
The theoretical link
Corporate board size is believed to be one of the most important structural variables in
corporate governance. There is no conformity which board size either small or large is better
for a firm. The assumption originated from agency theory is that smaller a board is
recommended to minimize the agency cost by effective control over the management,
whereas larger boards might have a large number of possible interactions and conflicts
among the group members (Yoshikawa and Phan 2003). Jensen (1993) argued that when a
board gets too big, it does not only become difficult to co-ordinate but also comparatively

106
easier to control by dominant CEOs due to associated directors shirking and free-riding.
Lipton and Lorsch (1992) and Jensen (1993) suggested that corporate board size must
preferably fall between eight and nine directors. According to Lipton and Lorsch (1992), a
board size of more than nine directors is less likely to criticize the policies of top managers,
hence are subject to CEO control. Further, larger boards tend to involve less meaningful
discussion since too many directors are involved in the discussion, making it both time
consuming and difficult to achieve cohesiveness. A large board is less effective due to
slowness in decision making, is more risk averse and creates a free rider problem i.e. one
member is dependent on other members to monitor management. Further, larger boards
seemed to be sluggish in decision making (Yermack 1996) because due to limited time
available in board meetings, larger boards face greater difficulties in expressing their
opinions (Lipton and Lorsch 1992).
In opposing arguments, Dalton and Dalton (2005) suggested that a large board offers a
broader pool of knowledge and expertise but Jensen (1993) argued that that problem of
coordination in large boards can outweigh the benefit. Also Dalton and Dalton (2005) argued
that fewer members on the board occupied themselves with decision making, and hence
became less effective in monitoring the management. According to Di Pietra, Grambovas et
al. (2008), large boards reduce firm value in small and medium firms but not significantly in
large firms. Based on the complexity of the firm’s business Coles, Daniel et al. (2008) argued
that a large board was beneficial in a complex firm because they have greater advisory needs,
a larger degree of diversification, and higher financial leverage. Pfeffer (1973) and Zahra and
Pearce (1989) suggested that large boards have a variety of skills to make decisions for a
company as the CEO cannot direct a large board because the joint power of its members is
higher and it can oppose the unreasonable decisions of the CEO. However, Coles, Daniel et
al. (2008) argue that the relationship between board size and performance also depends upon
in which economic environment the firm is operating.
However, there is another school of thought in favor of larger boards. The company with a
bigger board size has the capability to force the managers to track lower costs of debt because
creditors view these firms as having more effective monitors of their financial accounting
processes and increased performance (Anderson, Mansi et al. 2004). Wen, Rwegasira et al.
(2002) supports those large boards with superior monitoring ability to attract higher leverage
to raise the firm’s valuation.
107
Empirical findings
Empirically, the evidence regarding the association between board size and firm performance
is conflicting (Yermack 1996; Beiner, Drobetz et al. 2004; Adams and Mehran 2008; Guest
2009). Yermack (1996) is one of the first to investigate the relationship between board size
and financial performance in a sample of 452 large US industrial corporations between 1984
and 1991. Generally, he reports an inverse relationship between corporate board size and
performance. His results show that investors’ valuation of companies declines steadily over a
range of board sizes between 4 and 10. Beyond a board size of 10, he finds no relationship
between board size and market valuation. Recent US evidence by Vafeas (1999), Cheng
(2008), and Coles, Daniel et al. (2008), and non-US evidence of Eisenberg, Sundgren et al.
(1998), and Guest (2009) is largely consistent with those of Yermack (1996) that, on average,
smaller boards tend to perform better than larger ones.
Using a large sample of 2,746 UK listed firms from 1981 to 2002, Guest (2009) reported a
statistically significant and negative relationship between board size and performance.
Haniffa and Hudaib (2006) report a negative relationship between board size and financial
performance measured by Tobin’s Q. In a sample of 347 Malaysian listed firms, Staikouras,
Staikouras et al. (2007) and Rashid, DeZoysa et al. (2010) also found a negative relationship
between board size and accounting return of the firm.
Sierra, Talmor et al. (2006) suggest that strong boards improve bank performance. Adams
and Mehran (2008) also found a positive relationship between bank board size and
performance in US listed banking firms from 1959 to 1995. Similarly, for a sample of 69
commercial banks from six OECD countries including US, Andres and Vallelado (2008)
found a positive but non-linear, inverse U-shaped relation between both bank board size and
performance.
Some studies did not find any relationship between board size and performance. A study
conducted by Wintoki, Linck et al. (2009) used a panel of more than 6,000 firms between
1991 and 2003 and found no relation between board size and firm performance. Beiner,
Drobetz et al. (2004) conducted a study over companies listed on the Swiss Stock Exchange
and did not find a significant relationship between board size and firm valuation, as measured
by Tobin’s Q. Topak (2011) examined the relationship between the board size and financial
108
performance of the 122 Turkish firms in Turkey for the period of 2004-2009 and found there
is no relation between the board size and the firm’s performance. Nyor and Mejabi (2013)
and Liang, Xu et al. (2013) conducted a study in Nigerian deposit money bank and Chinese
commercial bank respectively and found no significant relationship between board size and
bank performance which is measured by NPL to total loan.
4.5.3.1.2 Board Independence
Theoretical links
One of the internal corporate governance mechanisms that the theoretical literature suggests
can be used in reducing agency and information asymmetry problems in modern firms is the
appointment of independent directors (Fama 1980; Lipton and Lorsch 1992; Jensen 1993).
There are two theoretical views with regard to independent directors: those who are in favor
of more independent directors on the board, and those who prefer more executive directors.
The involvement of independent directors in boards is important to make rational decisions
and create value for the shareholders. From monitoring the manager and minimizing the
agency cost perspective, board composition is perceived as an important element in firms
(Choe and Lee 2003). Although the executive directors have specific talents, knowledge and
important knowledge of the firm’s operating policies and day-to-day activities, the firm can
get the fresh ideas, independence, objectivity and experience in a specific field by the
involvement of independent directors on the board (Weir 1997; Firth, Fung et al. 2002; Choe
and Lee 2003).
Related to a separate system of control and decision, Fama and Jensen (1983) acknowledged
that internal managers dominate the board because they can perform better if they are in the
capacity to control and make decisions. However, they further noted that dominant insiders
are less likely to survive in a competitive business because of a lack of separation between
decision making and decision control. Hence, it was suggested that the presence of
independent directors on the board ensures board independence from the management as it
clearly segregates the management and control task. In addition, independent directors can
solve disagreements among the internal managers or between the internal managers and
residual claimants. Thus, boards comprising independent directors will provide a counter
balance so that the insiders do not take advantage of their position and sacrifice shareholders’
wealth. Based on resource dependent views of Pfeffer and Salancik (2003), the presence of
independent directors on the board will enhance the flow of information, and hence protect
109
the firm’s resources and reduce uncertainty. Independent directors are important for banks as
they help to improve earnings quality and provide well-suited compensation incentives to the
managers (Mishra and Nielsen 2000; Cornett, McNutt et al. 2009).
By contrast, high levels of executive directorships are connected with high access to
information which leads to high quality decision-making (Nicholson and Geoffrey 2003).
This can impact positively on financial performance. Crucially, independent directors would
usually not have the same access to informal sources of information and knowledge within
the firm. As a result, decisions made by a board controlled by independent directors would be
of an inferior quality and this would in turn lead to lower firm performance. Further, it has
been argued that corporate boards controlled by independent directors tend to smother
managerial plans and strategic actions which arise from excessive managerial supervision
(Haniffa and Hudaib 2006). Likewise, inside directors who have firm specific knowledge,
may be beneficial for those banks where the high information asymmetry problem is present
(Fama and Jensen 1983). Therefore, as suggested by theoretical models of Raheja (2005),
Harris and Raviv (2008) and Adams and Ferreira (2009) banks with high information
asymmetry should not depend only on outside directors.
Empirical findings
Consistent with the conflicting nature of the theoretical literature on independent directors,
prior empirical evidence regarding the relationship between the percentage of independent
directors and firm performance is mixed. It is often supposed that if the proportion of
independent directors increases on a board, the board becomes more independent (John and
Senbet 1998). A strand of the empirical literature reports that boards dominated by
independent directors deliver higher performance. A study conducted by Baysinger and
Butler (1985) of 266 US corporations; found that a higher number of independent directors
are expected to pursue activities which realize higher performance. In a similar study,
Ezzamel and Watson (1993) found that outside directors are positively associated with
profitability among a sample of United Kingdom firms. In the same way, using a sample of
311 UK listed firms from 1994 to 1996, Weir (1997) also found a positive relationship
between board independence and firm performance i.e. Tobin’s Q. Recently, El-Mehdi
(2007), and Mangena and Tauringana (2008) reported evidence which is entirely consistent
with prior research that boards dominated by independent directors perform better for a
sample of Tunisian and Zimbabwean listed firms, respectively. Liang, Xu et al. (2013) found

110
involvement of independent directors improved the loan quality and minimized the NPL in
the context of Chinese commercial banks.
By contrast, a group of researchers report that the percentage of independent directors is
negatively correlated with performance (Agrawal and Knoeber 1996; Yermack 1996). In a
sample of 25 Canadian firms from 1976 to 2005, Bozec (2005) found a negative relationship
between board independence and performance. Similarly, Sanda, Mikailu et al. (2005) report
that Nigerian firms with a low percentage of outside directors performed better than those
with more non-executive directors. Bhagat and Bolton (2008), Fauzi and Locke (2012) and
Wang, Tsai et al. (2013) also found a negative relationship between board independence and
performance. This suggests that whilst independent directors can bring independence,
objectivity and experience to bear upon board decisions, they may also stifle managerial
initiative through excessive monitoring.
While some studies show neither positive nor negative relation between board independence
and performance, Fosberg (1989), and Bhagat and Black (2001) failed to find a significant
relationship between board independence and performance. Similarly, Rashid, DeZoysa et
al. (2010), Staikouras, Staikouras et al. (2007) and Al-Saidi and Al-Shammari (2013) did not
find any significant relationship between board independence and accounting returns.
Hermalin and Weisbach (1991) also found no association between the proportion of outside
directors and Tobin’s Q.
4.5.3.1.3 Board Diligence
The theoretical link
The association between the board diligence and firm financial efficiency is another internal
corporate governance issue that gives rise to concern for policy-makers and researchers.
Board diligence is an important determinant of the board's effectiveness (Vafeas 1999).
Board diligence is related to factors that include the number of board meetings and its
members’ qualifications (Carcello, Hermanson et al. 2002). De Zoort, Hermanson et al.
(2002) suggest that the frequency of meetings can be a proxy of diligence. One view is that
board meeting are beneficial to shareholders. Meetings are believed to be an important signal
of time which the directors use to monitor managerial activities (Vafeas 1999) and also as an
important resource in improving the effectiveness of a board (Lipton and Lorsch 1992).
Board meetings measure the intensity of the board’s activities, and the quality or

111
effectiveness of its monitoring (Conger, Finegold et al. 1998). All else being equal, a higher
frequency of board meetings will result in a higher quality of managerial monitoring which
can impact positively on financial efficiency. It has been contended that regular meetings
allow directors more time to confer, set strategy, and to appraise managerial performance
(Vafeas 1999). A more diligent board will be concerned with devoting more time for
supervision of the manager’s activity to achieve the shareholders’ expectations. Moreover,
more frequent meetings inform the board about the relevant performance of the company and
make them aware in advance to take and direct the appropriate action to address the issue if
any (Abbott, Parker et al. 2003). In fact, Sonnenfeld (2002) suggested that regular meeting
attendance is considered a hallmark of the conscientious director. Also, frequent meetings
intermingled with informal sideline interactions can create and strengthen cohesive bonds
among directors (Lipton and Lorsch 1992).
An opposing theoretical view is that board meetings are not necessarily beneficial to
shareholders. Vafeas (1999) argues that limited time is not useful to directors for the
meaningful exchange of ideas among themselves. Instead, routine tasks such as presentation
of management reports and various formalities absorb much of the meeting. This reduces the
amount of time that outside directors would have to effectively monitor management (Lipton
and Lorsch 1992). Secondly, board meetings are costly in the form of managerial time, travel
expenses, refreshments and directors’ meeting fees (Vafeas 1999). Vafeas (1999) also notes
that an increase in board meetings is actually the result from the poor performance of the firm
which confirms the suggestion of Jensen (1993) that meetings were reactive responses and
not proactive measures. However, Vafeas (1999) also found that the number of board
meetings increases after a crisis for the improvement of the company’s performance.
In fact, Jensen (1993) contends that boards in well-functioning companies should be
relatively inactive and exhibit little conflict. He suggests that rather than necessarily
organizing frequent board meetings, it will be more profitable for corporate boards to
establish a system that is responsive to their specific challenges. For example, directors can
increase the frequency of meetings during a crisis or when shareholders’ interests are visibly
in danger, such as when replacing the CEO or fighting hostile takeovers. Consistent with
Jensen’s (1993) suggestions, Vafeas (1999) argued that companies that are efficient in setting
the right frequency of board meetings, depending on its operating context, will enjoy
economies of scale in agency costs.

112
Empirical findings
Firstly, there is limited evidence on the relationship between the frequency of board meetings
and firm financial performance. Secondly, the limited evidence is also conflicting which
makes the frequency of board meeting-financial performance association a productive area
for further research. For 307 US listed firms over the 1990-1994 period, Vafeas (1999)
reported a statistically significant and negative association between the frequency of board
meeting and financial performance, as proxied by Tobin’s Q. By contrast, he found that
operating performance significantly improved following a year of abnormal board activity.
This suggested that while directors who confer more regularly can make better decisions and
engage in active monitoring, the potential benefits of such intense monitoring are expected to
reflect in future years’ performance.
On the contrary, Karamanou and Vafeas (2005) examined the impact of board meetings on
management earnings forecasts in 275 US listed firms and found a weak positive relationship.
Hermalin and Weisbach (1991), Klein (1998), Bhagat and Black (2001), Andres and
Vallelado (2008), Brick and Chidambaran (2010) and Velnampy (2013) also did not find a
significant relationship between board diligence and bank performance. Menon and Williams
(1994) also argued that frequency of board meetings is just a rough signal of activity and not
a sign of the work accomplished during these meetings. Thus, unclear consequence of higher
board activity is a corporate response to poor performance of firms. So, differing conflicting
views about the board activity raises the question of the importance of board meeting
frequency for the performance of firms. Evidence about the importance of board meeting
frequency carries possible important governance implications. Fich and Shivdasani (2006)
offer evidence which is in line with the results of prior research that more frequent board
meeting are valued less by the market in a sample of US listed firms from 1989 to 1995.
4.5.3.2 Audit Committee Characteristics
An audit committee is a sub-committee of the board of directors. An audit committee
performs the important role to provide assurance as to the quality of financial reporting and
corporate accountability (Carcello and Neal 2000). An audit committee bridges the
information asymmetry between external auditors and the board which helps them to monitor
the firm (Klein 1998), and makes an auditor independent from management (Mautz and
Neumann 1977). A well-functioning audit committee is thus critical in enhancing effective

113
oversight of the financial reporting process and achieving high quality financial controls.
Since the Securities Exchange Commission has become concerned that the audit committees
are failing to do their job properly (Lublin and MacDonald 1999), the Blue Ribbon
Committee recommendation addressed the importance of audit committee composition and
operational characteristics such as their size, independence, financial literacy and activities.
4.5.3.2.1 Audit Committee Size
Theoretical link
Agency theory suggests that the management (agent) may not always act in the interest of
owners (principals) so shareholders require protection. To overcome this agency problem,
boards take for granted oversight roles that naturally engage in monitoring of the CEO and
other executives, approving the strategy of the corporation and also monitoring the internal
control system. Due to diverse duties, the board of directors hands over some of its oversight
to the audit committee (Jensen and Meckling 1976). Next, the complexity of a firm’s
accounting and financial substances require audit committee members to invest substantial
effort. The audit committee implements the duties for the firm’s financial reporting process
(Bradbury, Mak et al. 2006). Audit committee performance has come under close analysis
from a variety of policy-makers, interest groups and researchers (DeZoort 1997). The
literature states that the number of members on an audit committee, which measures the audit
committee size, has a positive impact on audit committee effectiveness. This is because it is
likely that larger audit committees have better resources than smaller audit committees (De
Zoort, Hermanson et al. 2002).Researchers also argue that more people involved in activity
significantly boosts group performance and decreases the chance for misconduct because
collusion becomes more difficult (Cummings, Huber et al. 1974; Burton, Pathak et al. 1977).
Thus, it can be argued that decision-making in large audit committees is of better quality than
in smaller audit committees. However, upon satisfying the minimum size requirement, a large
committee may suffer from the free-rider problem where individual members may not exert
their opinion forcefully. So Mohiuddin and Karbhari (2010) suggest that the audit committee
should consist of independent directors, experts and knowledgeable members with adequate
authority.
Empirical findings
There is mixed result regarding audit committee size and firm performance. A larger audit
committee size faces more difficulties to reach conclusions. However, it provides stricter
114
monitoring. Klein (2002) examined the 695 publicly traded US firms and found a positive
relationship between audit committee size and monitoring role. Similarly, Coleman-
Kyereboah (2007) examined 103 listed firms from Ghana, South Africa, Nigeria and Kenya
between 1997 and 2001 and found a positive relationship between audit committee size and
performance i.e. ROA and Tobin’s Q. In the same way, using 51 companies in Malaysia in
the financial year 2007, AlBeera (2009) found a positive relationship between audit
committee size and performance i.e. ROA and operating cash flows. By contrast, Al-Matari,
Al-Swidi et al. (2012) found a negative relationship between audit committee size and firm
performance in Saudi Arabian listed companies.
However, other studies find no relation between an audit committee size and efficiency.
Using 50 UK life insurance companies for the period 1994 -1999, Hardwick, Adams et al.
(2003) found no relationship between audit committee size and efficiency. Similarly, in the
case of developing economies, Kajola (2008) examined a sample of twenty Nigerian listed
firms between 2000 and 2006 and found no relationship between audit committee size and
performance. Similarly, Rouf (2011), Ghabayen (2012) and Hamdan, Sarea et al. (2013) also
found the same result as Kajola (2008) in the case of developing economies Bangladesh,
Saudi Arabia and Jordan respectively.
4.5.3.2.2 Audit Committee Independence
Theoretical link
Independent directors involved in the audit committee are more interested to demand higher
audit quality for protection of their reputation (Abbott, Park et al. 2000; Carcello and Neal
2000). Reputational capital enhancement theory explains that independent directors hold a
high reputation within the business community and they perceived the directorship as a path
of further developing their name as a specialist in decision making (Fama and Jensen 1983).
Specifically, Beasley (1996) indicated that outside directors use their directorship to signal
both to outsiders (e.g. investors) and external auditors that (1) they are decision experts, (2)
they understand the importance of decision controls, and (3) they can work with such
controls. The independent audit committee monitors managers better because they have no
economic or personal relationship with management. In addition, they are decision experts
and good at decision control (Abbott, Parker et al. 2004).
115
Next, independent directors tend not to have psychological ties with companies because,
unlike executive directors, they are not economically dependent on the company.
Consequently, such directors would also be more willing to question management’s
decisions.
As contended by Beasley, Carcello et al. (2000), independent directors’ decisions are
arguably less unfair over an entity’s financial outcome and they would oppose any
mismanagement of resources that is negatively related with a firm’s financial performance.
Likewise, Baysinger and Butler (1985) also found that independent audit committees were
interested to investigate the variety of management issues. For instance, when a firm faces the
financial reporting issue, then the independent audit committee seeks in-depth audit coverage.
The independence of audit committees allows internal and external auditors to audit and
assess financial information more objectively and, thereby, strengthen internal control
functions. Thus, audit committee independence can reduce financial fraud (Abbott, Parker et
al. 2004), but Mustafa and Youssef (2010) reported that audit committee independence was
not effective unless the independent directors are also financial experts.
Empirical findings
The empirical result on the relationship between audit committee independence and firm
performance is ambiguous. Erickson, Park et al. (2005) suggest the independent directors can
reduce the agency problem. Similarly, an independent audit committee can also reduce
agency problems. They find a positive relationship between audit committee independence
and firm performance. In contrast, Klein (2002) and Weiss (2005) did not find a positive
relationship between audit committee independence and firm performance. The study by
Klein (2002) showed a negative correlation between earnings, management and audit
committee independence. Kajola (2008) used Nigerian data on twenty firms. The results
show the audit committee occupied by a majority of outside members has no influence on the
firm’s performance.
A study of 103 listed firms from Ghana, South Africa, Nigeria and Kenya conducted by
Kyereboah-Coleman (2007) found no significant relationship between audit committee
independence and firm performance. However, the study found a significant negative
relationship between audit committee independence and Tobin’s Q in a sub-sample of
Ghanaian and Nigerian firms. This proposes that it is possibly significant to employ people
116
with the technical knowledge and those who have had something to do with an organization’s
value creation.
4.5.3.2.3 Audit Committee Diligence
Theoretical links
Effective monitoring mechanisms can be achieved through a more active audit committee.
Since, the intensity of audit committee activity is a sign of good governance; this increases a
firm’s efficiency. As best practice, the firm holds an audit committee meeting at least once a
year without involvement of executive board members. However, the company’s terms of
reference and the complexity of the firm’s operations can determine the number of audit
committee meetings.
Governance practice guidelines assist the audit committee to be diligent for fulfillment of
their jobs (Beasley, Carcello et al. 1999). The number of meetings held during the year is
perceived as the signal of audit committee diligence. Previous studies also propose that
increased frequency of audit committee meetings minimizes the risk which arises from
financial reporting. Frequent meetings with external auditors and managers, inform the audit
committee about accounting and risk management issues, and also about difficult accounting
and audit issues (Raghunandan, Rama et al. 1998). The coordination between the audit
committee and management is supposed to improve risk management approaches to provide
a balanced flow of information to the firm’s decision makers.
Abbott, Parker et al. (2003) suggest that increasing the number of audit committee meetings
can improve the process of financial accounting which leads to better performance. However,
they argue that the number of audit committee meetings may not enhance the performance of
a firm if there is a lack of quality in the meeting. A survey conducted by KPMG (2008)
suggested that audit committees feel that overloaded agendas and activities on compliance
may be hampered negatively impacting their effectiveness.
Empirical findings
The result of previous research of audit committee diligence and firm performance is mixed.
Empirical evidence by Huang, Lai et al. (2008) found no relationship between audit diligence
and firm performance. In the sample of Ghanaian firms, Kyereboah-Coleman (2007) found a
117
negative significant relationship between audit meeting frequency and ROA which justified
that these meetings were for crisis fixing.
4.5.3.3 Ownership Structure
One important issue for governance is the nature of the relationship between ownership
structure and financial performance. Some corporate governance studies such as Jensen and
Meckling (1976), Lichtenberg and Pushner (1994) and Mehran (1995) support the presence
of a linear or monotonic relationship between ownership and performance while other studies
including Morck, Shleifer et al. (1988) and McConnell and Servaes (1990) support a non-
linear or non-monotonic relationship between them. Based on the norms that ownership is
exogenous, both sets of studies accept a uni-directional relationship between ownership and
performance. This idea was examined by Demsetz (1983), and Demsetz and Lehn (1985),
who argue that ownership structure is endogenously related to firm performance with no
direct relationship expected between the two. Some of the recent empirical studies broaden
this debate.
4.5.3.3.1 Institutional Ownership
Theoretical links
The existing literature recognizes that institutional investors serve a significant role as
external monitors in the stock market (Agrawal and Knoeber 1996). Investments made by
institutional investors are so large that they do not have the ability to divest their holdings
without severely affecting the share price (Pound 1993). As a result, institutional investors
have a strong long-term interest in the financial success of the companies (see Holderness and
Sheehan 1988; Gilson and Kraakman 1991; Smith 2012) and may play an active role in
monitoring top management (Hoskisson, Johnson et al. 1994).
There is alternative view that institutional investors have failed to monitor managers. This
perception seems to arise from two sources: (i) the dispersed nature of institutional
shareholdings, and (ii) being short-term return focused. While institutional investors hold a
large number of companies, the fraction of shares held for each company is very small in
proportion to their total shareholding. This is seen as a consequence of both portfolio
diversification and regulatory constraints placed on majority ownership. The portfolio
diversification view seems to outweigh the maximization of returns view at the expense of
good corporate governance. Another view exists that institutional investors are predominately

118
concerned with short-term earnings. Institutional investors are represented by managers
whose primary objectives are to maximize current returns because of their own reward
systems which emphasize quarterly performance (see Starks 1987). Managers receive a
percentage of the value of assets and a bonus or penalty based on how their funds perform
relative to an index calculated quarterly. This pressure for short-term profitability, coupled
with the potential difficulty of selling large blocks of stock without loss, may result in a
preference for projects with a high probability of short-term payoff.
The traditional view that the ownership structure of a firm has no influence on the value of
the firm has been challenged by Jensen and Meckling (1976) and Berle and Means (1991).
Further, Holderness and Sheehan (1988) found a positive relationship between majority block
trades and stock return. Accordingly, a higher percentage of institutional ownership could
contribute to lower the risk of the firms because stock ownership should be a better incentive
mechanism when firm risk is high (Sanders 1999). In addition, Bhojraj and Sengupta (2003)
found that due to the monitoring power of the institutional owners on the firm’s risk,
institutional ownership enjoys lower bond yields and a higher bond rating. Pound (1988)
showed that institutional investors can work out the operation of a firm at a lower cost
because they have more experience. Oviatt (1988) advocated that monitoring costs are
comparatively less where the higher proportion of institutional ownership is due to
institutional investors who own specialized talents. They have experience about information
channels which allows them higher performance in the work at management level which
relate to the monitoring of investment targets.
Empirical findings
After examining 40 manufacturing industries in the US, Chaganti and Damanpour (1991)
found that firms in which outside institutional investors held the highest percent of stock did
show higher ROA. Similarly, Han and Suk (1998) also found a positive relationship between
institutional ownership and stock returns indicating that institutional owners have skills in
monitoring management. Another study also conducted by McConnell and Servaes (1990)
with a sample of 1,173 firms for 1976, and 1,093 firms for 1986, found a significant
relationship between Tobin’s Q and institutional investors.
Some other researchers examined the negative relationship between institutional ownership
and performance. A study conducted by Craswell, Taylor et al. (1997) found a negative

119
relationship between institutional ownership and performance. Loderer and Martin (1997)
also examined the influence of outside block holders of financial institutions and firm
performance and found no important relationship. Agrawal and Knoeber (1996) and Li and
Qian et al. (2006) did not find a significant relationship of institutional ownership on
performance. Enobakhare (2010) found institutional ownership has a negative impact on loan
quality of Nigerian banks.
4.5.3.3.2 Foreign Ownership
Theoretical links
It is mostly believed that foreign ownership acts as an important role in firm performance in
the context of developing and transitional economies (Görg and Greenaway 2004). Numerous
studies regarding corporate governance focus on the issue of shareholder identity (Shleifer
and Vishny 1997). If 50 percent or more of a bank’s capital is held by foreign residents, it is
known as foreign (Claessens, Demirgüç-Kunt et al. 2001) and a majority of voting rights or
effective management control by foreigners is also taken as a foreign bank. (Crystal, Dages et
al. 2002). De Young and Nolle (1996) define a foreign bank as if they hold foreign
ownership of more than 10 percent. Foreign ownership is believed to be the best tool for
improvement in corporate governance practice and firm performance. These kinds of
investors invest in other countries for good returns and need effective monitoring of
management to minimize any managerial expropriation. These investors may be from those
countries where the best corporate governance is in place and they like to follow the same
best practice where they invest. For this, clear disclosure and transparency plays an important
role. According to Stulz (1999), lower agency costs always exist if foreign ownership. The
process of this strict control improves the firm performance. Superior techniques,
organization and financial resources are the main important element which is always involved
in foreign ownership companies. For instance, Chhibber and Majumdar (1999) found that the
extent of a foreign firm’s control over a domestic firm is positively associated with the degree
of resource commitment to technology transfer. Djankov and Hoekman (2000) found foreign
ownership is linked to generic and specific knowledge.
Empirical findings
Several studies give support to the relative importance of foreign ownership versus domestic
ownership of banks. De Young and Nolle (1996), Vennet (1996) and Genay, Udell et al.
(2000) have studied the relative importance of foreign banks versus domestic banks in the

120
context of industrial countries where, some research (Bonin, Hasan et al. 2005 and Clarke,
Cull et al. 1999) has been done in the context of developing economies. A majority of these
studies have concluded that foreign banks are more profitable than domestic banks in
developing countries and less profitable in industrial countries. Goldberg, Dages et al. (2000)
have conducted a comparative study of performance of foreign and Latin American countries
from 1995 to 2000 and found that foreign banks are better than domestic banks in terms of
profitability. A similar result found by Jeon, Miller et al. (2006) shows that they are more
likely to earn higher ROA and ROE than domestic banks. In the same way, using a sample of
54 firms listed at the Nairobi Stock Exchange, Ongore and K'Obonyo (2011) found a positive
relationship between foreign ownership and performance.
4.5.3.4 CEO Remuneration
Theoretical links
Company executives act as agents for shareholders who believe their appointed manager has
superior skills in managing the resources of the firm (Murphy 1999). The agency problems
associated with this separation of ownership and control have been well documented (Jensen
and Meckling 1976). An efficient employment contract is considered the preferred solution to
this agency conflict (Beatty and Zajac 1994) and tying some component of managerial
compensation to the wealth and performance of the firm allows much of these agency
problems to be resolved (Jensen and Murphy 1990). CEO compensation has drawn
considerable attention from the media, trade unions, investors and politicians (Murphy 1999).
The recent Global Financial Crisis has again brought much attention and scrutiny to CEO
remuneration with claims that CEO remuneration was one of the causes of the Global
Financial Crisis (Fels 2010). While the level of remuneration has been heavily criticized,
Jensen and Murphy (1990) argue that while there are significant issues with CEO pay as a
core problem, investors, researchers and politicians are calling on corporate leaders to
redesign executive compensation programs to better focus on long-term value creation (PMP
2010). Executive remuneration includes a combination of elements including cash, shares,
granting options, and bonus payments. These can be constructed to devise a compensation
contract to motivate managers to act in the interest of shareholders (Shleifer and Vishny
1997). Beatty and Zajac (1987) give importance to understand the factors which motivate the
CEO to act in the way that the firm can achieve performance. From the organizational point
of view, compensation is believed as the best control mechanism to motivate managers. As a
result, the firm can achieve the expected profitability. For example, Lawler and Lawlor

121
(1981) raise equity theory so Adams (1966) argues that individuals satisfied with his/her
compensation motivates them to perform better.
Jensen and Meckling (1976) highlighted that the operating decisions which the manager takes
in the day to day activities maximizes his utility in the form of pecuniary and non-pecuniary
returns. The lack of information to shareholders about the manager’s activities makes them
difficult to check whether the managers are working in the best of interest of shareholders. It
has been hypothesized that equity-based compensation links executives’ wealth to the stock
price which motivates them to fulfil their own interest with the shareholders’ interests (Jensen
and Meckling 1976). However, Walker (2010) indicated that stock option based
compensation diverts executives’ focus from a long-term outlook to short-term gains.
Further, Mehran (1995) stated that there is little empirical evidence on whether corporations
using more equity-based compensation perform better.
Agency theory seeks to determine the most efficient contract governing the manager-
shareholders relationship. Specifically, the question is: is a behavior-oriented contract (e.g.
salaries) more efficient than an outcome oriented contract (e.g. ownership, stock option)
affecting firm performance (Eisenhardt 1989).
Empirical findings
Researchers have conducted some studies in the context of developed countries to examine
the relationship between CEO compensation and firm performance. Bulan, Sanyal et al.
(2005) conducted a study among US manufacturing firms and found CEO equity ownership
enhances the firm’s productivity. Similarly, Rampling (2011) also a found positive
relationship between CEO compensation and performance in the US, UK and Australia,
whereas Zajac (1990) found CEO compensation is not a significant predictor of firm
performance in the largest US corporations. Buck, Liu et al. (2008) conducted a study in
China and found the effectiveness of cash executive pay as motivation to achieve improved
firm performance at least. In the same way, Lin (2005) examined the CEO and firm
performance relationship in Taiwan and found a positive relationship. Based on the literature,
executive pay packages are supposed to motivate CEO efforts which lead to performance.
122
4.6 Summary
This chapter described the details and definition of the efficiency, NPL and also various risks
applying in banks such as credit risk, liquidity risk, market risk and operational risk.
Thereafter, different theories have been presented in detail which is related with the risk in
banks. To check the relationship of macro-economic and bank specific indicators to NPL,
previous literature has been presented. This chapter also described the literature about the
relationship of corporate governance mechanisms to NPL and performance.
In conclusion, it is found that various theories such as financial intermediaries, agency theory
and diversification theory exist in financial intermediation. Financial intermediation theory
helps the financial intermediaries to minimize transaction costs and information asymmetry
problems, whereas agency theory helps the bank to minimize the problem of agency
relationship. It is assumed that the attitude of principal and agent may be different which can
occur with the agency relationship. Similarly, to minimize the transaction cost and to gain
competitive advantage, diversification theory helps banks to diversify their business in
different geographical areas which helps them to cover the market and increase their income.
Due to the nature of their business, banks take risks so as to realize a return. So, different
types of risk exist in the banking business which is credit risk, liquidity risk, market risk and
operational risk. So in other words, banking is the management of different kinds of risk. On
the basis of the previous literature regarding the determinants of NPL, this chapter concludes
that the macro-economic conditions of the country are the drivers of NPL. The different
literature in different economies concludes that good economic conditions of the nation help
banks to improve credit quality as recession periods have an adverse effect on loan quality of
banks. Besides the macro-economic conditions, bank specific variables are also an important
indicator which defines NPL. This chapter concludes that in the same economic environment
some banks are performing better than others due to the bank’s internal mechanisms.
Similarly, bank corporate governance is also concluded on the basis of previous literature as a
determinant of NPL and performance of the bank. So it is concluded that the corporate
governance practice is good in context of developed economies, whereas in the context of
developing economies, corporate governance practice is still an ongoing process. In
conclusion, it is found that most of the previous research has been conducted in the context of

123
developed economies. In the context of developing economies, studies are limited. Studies in
relation to Nepal, where the banking system is still in the developing stage are very rare.
Indeed, there are no studies delving in depth into NPL, bank performance and corporate
governance. The study addressed the lack of literature that is reviewed in this field. So the
previous literature which discusses developed economies may not be in line with the findings
of this study which is analyzing banks in Nepal.

124
CHAPTER FIVE
Hypothesis Development
5.1 Introduction
This chapter presents the theoretical framework of this thesis and presents the hypothesis to
be tested in relation to the objectives of this thesis. In this regard, the hypothesis has been set
for objectives that examine the influence of macro-economic and bank specific variables to
Non-performing Loans (NPL) and, in the next stage, to examine the influence of governance
variables on NPL and performance. There are three main hypotheses to be tested in relation
to the effect of macro-economic, bank specific and governance variables on NPL and bank
performance. Section 5.2 presents and discusses the conceptual framework employed in this
thesis. Section 5.3 presents the hypothesis according to the independent variables presented in
the conceptual framework. Section 5.4 summarizes this chapter.
5.2 Conceptual Framework
Figures 5.1 and 5.2 show the conceptual framework of the study where different categories of
independent variables are used to check the impact of macro-economic, bank specific and
governance variables with NPL and performance of Nepalese commercial banks. The three
variables NPL, Return on Assets (ROA) and Tobin’s Q have been used as dependent
variables and independent variables were classified into three groups i.e. macro-economic,
bank specific and governance. Macro-economic variables are included in the first group.
These variables are: GDP growth, one year lag of GDP growth, inflation, one year lag of
inflation, broad money supply growth, appreciation and depreciation of the foreign exchange
rates, growth of share price indices, and the inter-bank rate. The second group contains bank
specific variables. These variables are: one year lag of NPL, loan growth, branch growth, and
earnings before tax to total assets, equity capital to total assets, interest rate spread, loan loss
provisions and total assets. The third and last group contains corporate governance variables.
These variables are: board size, board independence, board meeting, audit committee size,
audit committee independence, audit meeting, foreign ownership, institutional ownership,
and CEO remuneration.
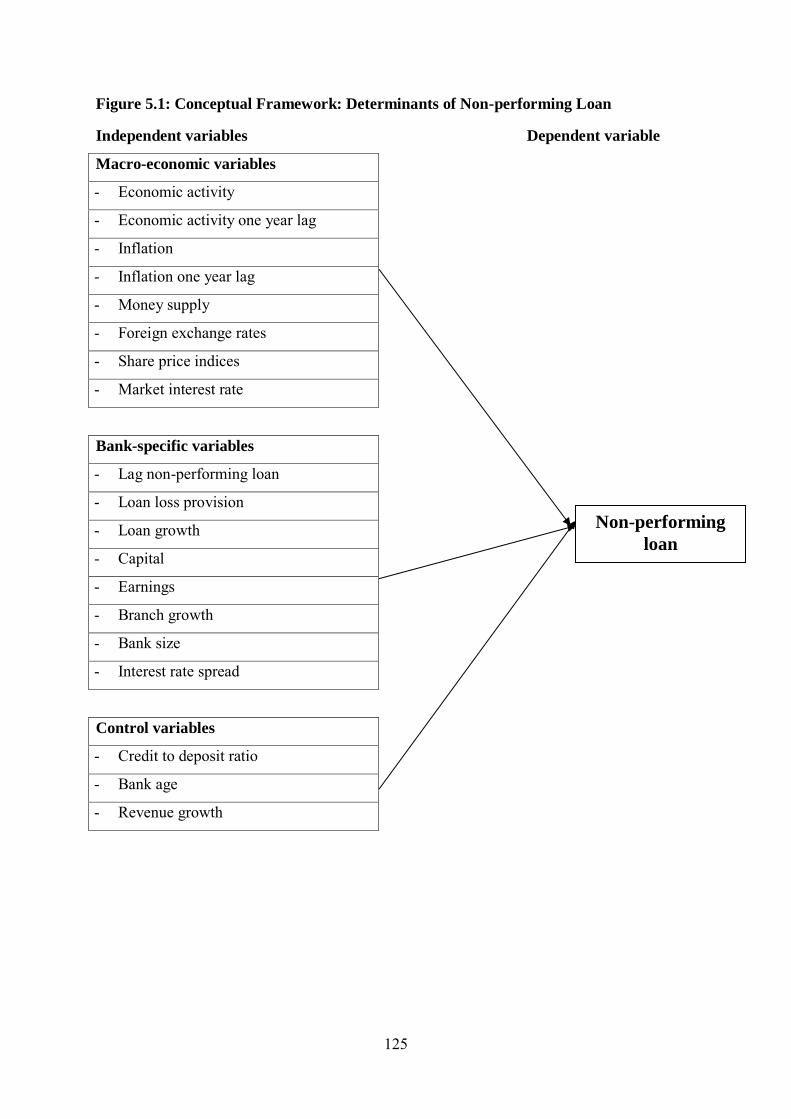
125
Figure 5.1: Conceptual Framework: Determinants of Non-performing Loan
Independent variables Dependent variable
Macro-economic variables
- Economic activity
- Economic activity one year lag
- Inflation
- Inflation one year lag
- Money supply
- Foreign exchange rates
- Share price indices
- Market interest rate
Bank-specific variables
- Lag non-performing loan
- Loan loss provision
- Loan growth
- Capital
- Earnings
- Branch growth
- Bank size
- Interest rate spread
Control variables
- Credit to deposit ratio
- Bank age
- Revenue growth
Non-performing
loan

126
Figure 5.2: Conceptual Framework: Influence of Corporate Governance of Bank
Performance
Independent variables Dependent variables
Governance variables
- Board size
- Board independence
- Board diligence
- Audit committee size
- Audit committee independence
- Audit committee diligence
- Institutional ownership
- Foreign ownership
- CEO remuneration
Control variables
- Loan loss provision
- Bank size
- Capital
- Revenue growth
- Credit deposit ratio
- Bank age
5.3 Hypothesis Development
This thesis aims to address several issues related to bank NPL exposure in Nepal. The main
purpose of this investigation is the identification of the key variables that have a significant
impact on NPL and performance of banks, taking into account influences of macro-economic,
bank specific variables and corporate governance variables. As a prelude to the hypothesis
development, the following research questions are raised:
Do macro-economic variables change the influence the NPL of the Nepalese banks?
Do the Nepalese banks’ internal bank specific variables influence the NPL of
Nepalese banks?
a. Non-performing loan
b. ROA
c. Tobin Q

127
Do the Nepalese banks’ internal corporate governance variables influence the NPL
and performance of Nepalese banks?
Under this primary hypothesis, this thesis tests the twenty three sub-hypotheses.
5.3.1 Macro-economic Characteristics
5.3.1.1 Economic Activity
Economic activities of the country affect the banks’ risk exposure. It has been hypothesized
that both consumers and firms gain a satisfactory income and revenue to manage their debt in
an expansionary phase of the economy which minimizes NPL. Boom periods increase the
spending of customers and capital expenditures of firms, As a result, both customer and firm
intentions to invest in order to achieve high earnings and benefits in the situation of positive
economic conditions. Thus, the high income increases the ability of the borrowers to repay
their obligations which reduces the bank NPL exposure. However, during the expansionary
phase, loans are granted to lower-quality debtors and NPL increase when the recession sets
in. Besides this, cash inflow of businesses and households decrease during recession periods
which makes it difficult for the customer to repay their obligations. So the economic activity
of the state is an important systematic determinant of loan loss rates (Carey 1998). Thus, it is
hypothesized that:
H1 (A): There is a negative relationship between the aggregate economic activity and bank
NPL.
H1 (B): There is negative relationship between the lag of aggregate economic activity and
bank NPL.
5.3.1.2 Inflation
Inflation is another factor which directly affects the level of NPL. Inflation is related with
devaluation of money which minimizes the performance in general (Boyd, Levine et al.
2001). The bank uses the interest rate for pricing of loans on the basis of inflation. Inflation
increases the nominal interest rate or reduces the future value of money which increases the
borrower’s obligation at the maturity and resulting in non-performance of the loan (Kessel
1956; Kessel and Alchian 1962). In other words, an increase in CPI forces monetary
regulators to increase interest rates through contractionary measurement to control inflation.
This activity by monetary regulators increases the cost of borrowing and causes NPL to some
extent. Thus, an increase in the inflation rate raises interest rates charged on loans and a
decrease in the inflation rate decreases the interest rate paid by the borrowers. Hence, high
128
inflation rates increase costs of borrowed money which would increase the default rate of
borrowers and thus increase the NPL (Ahmad and Ariff 2007). Thus, the next hypothesis is
stated as follows:
H2 (A): There is positive relationship between the inflation rate and bank NPL.
H2 (B): There is positive relationship between lag of inflation rate and bank NPL.
5.3.1.3 Money Supply
The relationship between money supply and NPL appears through the behavior of borrowers
resulting from change in money supply in the economy. The growth of money supply reduces
the cost of funds which stimulates credit demand (Eickmeier, Hofmann et al. 2009). Besides
this, increasing the money supply accelerates productivity and profitability which in turn
stimulates investment and consumption which increases income. Moreover, increasing the
money supply will decrease interest rates which motivates the public to hold cheaper funds.
This condition increases the ability of borrowers to pay back their obligation and contributes
to decreasing the bank exposure to NPL (Ahmad and Ariff 2007). Decreasing the money
supply increases interest rates which leads to an increase in the obligations of borrowers. This
consequently increases their default rate and the bank NPL. Hence, the third hypothesis is
stated as follows:
H3: There is a negative relationship between money supply and bank NPL.
5.3.1.4 Foreign Exchange
Depreciation of the domestic currency becomes more expensive to import foreign products
and services and as a result firms require more money to import the same products and
services than before. This process forces the firm to demand more credit facilities from bank,
to support finances for covering the additional expenditure required as a result of the
exchange rates depreciation which minimizes the profitability of firms (Ngerebo 2011). If the
firm’s profitability decreases, then firms face the problem to service interest and principal of
debt. A real depreciation is likely to have positive effects by increasing the operating profit in
the export sector but lead to a contraction in the import sector due to opposing reasons
(Kalirai and Scheicher 2002). Hence, it is expected that a depreciation in domestic currency
due to exchange rate, fluctuations leads to higher loan defaults and losses. Thus, the
hypothesis is as follows:
H4: There is positive relationship between the depreciation of the domestic currency and
bank NPL, or vice versa.

129
5.3.1.5 Share Price Indices
Increasing stock markets provides a reasonable benefit to investors which help them to
service their debt obligations and consequently lowers the probability of defaults (Hadad,
Santoso et al. 2006). Increasing share price indices are the symbol of financial strength of a
company which helps to minimize credit defaults. In other words, good share market indices
increase the profitability of firms which, as expected, minimizes loan defaults (Bofondi and
Ropele 2011). The Nepal Stock Exchange index has been used as the share market index of
Nepal. Thus, the hypothesis is stated as follows:
H5: There is negative relationship between the growth of share price indices and bank NPL.
5.3.1.6 Market Interest Rate
Interest rate is another important macro-economic factor of NPL because it affects the debt
burden which leads to the debt default (Aver 2008; Ngerebo 2011; Nkusu 2011; Louzis,
Vouldis et al. 2012). Higher interest rates also increase the cost of funds to borrowers which
creates difficulties to pay their obligations on time (Das and Ghosh 2007). Besides this,
higher interest rates discourage good borrowers and pool bad borrowers which lead the bank
to take on more risky projects (Stiglitz and Weiss 1981). In contrast, low interest rates
stimulate the demand for loans which motivates economic activities that increases business
and household earnings. These conditions increase borrowers’ ability to repay their loans.
The market interest rate in Nepal is the weighted average interbank rate and refers to the
central bank benchmark interest rate. Usually, the central bank benchmark interest rate is the
overnight rate at which the central banks make loans to the commercial banks under their
jurisdiction. Thus, the hypothesis to be tested is as follows:
H6: There is a positive relationship between market interest rate and bank NPL.
5.3.2 Bank Specific Characteristics
5.3.2.1 Lag Non-performing Loans
A NPL is an indicator of the quality of loans (Vogiazas and Nikolaidou 2011). A high
proportion of NPL reflects a bad quality of loans and the accumulation of NPL increases
bank credit risk. The ratio of problem loans of one period is closely related to that of the
previous period since the problem loans are not immediately written down (Salas and Saurina
2002) but are, in fact, carried forward in the balance sheet. This suggests that the current NPL
130
could be transferred to the next accounting periods and subsequently, to the next financial
year. Thus, the next hypothesis is stated as follows:
H7: There is a positive relationship between one year lag NPL and bank current NPL.
5.3.2.2 Loan Loss Provision
The provision for loan losses is determined according to the past management experience and
its expectation about the future conditions. Firms increase their provisions in response to an
increase in credit risk (Eng and Nabar 2007). Therefore, banks allocate large portions of their
profits for provision of loan losses during the contraction period, and reduce their loan loss
provision during the economic expansion period. Banks which assume high default rates in
their loan portfolios allocate large provisions for loan losses (Ahmad 2003). Thus, it is
hypothesized as follows:
H8: There is a positive relationship between the loan loss provisions and bank NPL.
5.3.2.3 Loan Growth
Rapid credit growth could be a cause of problem loans (Clair 1992) because it contributes to
decreasing the quality of loans. Banks can increase their lending by expanding the volume of
granting loans through different ways firstly, by relaxing bank credit standards that reduce the
borrower’s credibility (Salas and Saurina 2002) and secondly, it requires the bank to engage
in a new area in which it does not have experience, and also due to adverse selection (Shaffer
1998). All the previous ways contribute to an increase in bank credit risk exposures. Relaxing
credit standards leads them to grant riskier loans which in the final stage could become NPL,
and also to enter into new geographic areas which increase the possibility of adverse
selection. Thus, the hypothesis is expressed as:
H9: There is positive relationship between loan growth and bank NPL.
5.3.2.4 Capital
Banks use capital to finance their operations and expansion, and to serves as a cushion to
absorb unexpected operating losses (Bichsel and Blum 2004). When a borrower fails to make
some or all of their promised interest and principal payments, these defaulted loans result in
losses which can eventually reduce the bank’s capital. Hence, banks which assume more risks
increase their capital (Altunbas et al. 2007). More capital implies a bigger cushion to avoid
failure resulting from higher risk (Ahmad and Ariff 2007). The calculation of capital (for use

131
in capital adequacy ratios) is Tier I (ordinary share) and Tier II (subordinated debt) which
generally absorbs losses. Thus, the hypothesis to be tested is as follows:
H10: There is negative relationship between bank capital and bank NPL.
5.3.2.5 Earnings
Interest income from the loan is the main income of banks and interest expenses on deposits
are the main expenses. Besides this, banks also spend income on overhead expenses. So the
earnings after deduction of all expenses reflect the net earnings of banks. Inefficient
management would not be able to increase earnings of a bank as they have to spend money
on monitoring borrowers, and the bank has more problem loans. Higher level of bank
earnings minimizes problem loans and inefficient banks are more prone to risk taking (Kwan
and Eisenbis 1997). Hence, management is trying to increase income and minimize expenses
in order to absorb losses resulting from the bank’s risk exposure. Thus, it is hypothesized as
follows:
H11: There is a negative relationship between bank earnings and bank NPL.
5.3.2.6 Branch Growth
The credit risk of loan portfolios can be minimized through a strategy of geographic
diversification of its branches (Hughes, Lang et al. 1996). It is argued that a strategy of
branch banking helps banks to reduce their vulnerability to local economic shocks and this
strategy enables banks to diversify their loans and deposits over a wider geographical area or
customer base (Carlson and Mitchener 2005). Restrictions on branching have been linked to
the instability of the banking system. Thus, it is hypothesized as follows:
H12: There is a negative relationship between branch growth and bank NPL.
5.3.2.7 Size
Bank size is usually measured by the total assets or total deposits. It is a key factor in banking
studies. This study measures the bank size by total assets. A big balance sheet allows the
managers to invest in different geographical or business segments to deal with asymmetric
shocks (Salas and Saurina 2002). Large banks with large resources have more risk hedging
tools and have more ability to diversify their loans than the smaller banks. In addition, big
incentive benefits for the managers of large banks stimulate them to achieve high incomes.
Thus, the hypothesis is expressed as:
H13: There is a negative relationship between bank size and bank NPL.

132
5.3.2.8 Interest Rate Spread
Interest rate spread is a measure of profitability between the cost of short term borrowing and
the return on long term lending. These costs are normally transferred to borrowers who
might, with time, be in a position of not repaying the loan (Collins and Wanjau 2011). When
there is high intermediation cost, reflected in the high interest rate spread, the borrower may
be unable to repay his/her loan owing to the cost of such borrowings. This leads to a high risk
of loan defaults, hence non-performance. Thus, the hypothesis is expressed as follows:
H14: There is positive relationship between the interest rate spread and bank NPL.
5.3.3 Governance Characteristics
5.3.3.1 Board Size
Empirical evidence on board size suggests that larger board size in most cases reduces board
effectiveness in monitoring management (Yoshikawa and Phan 2003). A larger board creates
a free rider problem, slow decision making and members are less likely to criticize the
decision of top managers (Jensen 1993). Additionally, a large board is less involved with
strategic decision making and leads to coordination problems. Some studies argue the
opposite, that a larger board has a broader pool of knowledge and has better monitoring
capacity but the risk of having too many members may outweigh the benefits (Dalton and
Dalton 2005). Thus, the hypothesis is expressed as:
H15 (A): There is a negative relationship between board size and bank NPL.
H15 (B): There is negative relationship between board size and bank performance in terms of
accounting measurement.
H15 (C): There is negative relationship between board size and bank performance in terms of
market measurement.
5.3.3.2 Board Independence
The characteristic of a strong board of directors relates to representation by independent
directors. It has been suggested in the literature that independent directors may be credited for
being more experienced and for giving independent judgment over the board’s decisions
(Weir 1997; Firth, Fung et al. 2002; Choe and Lee 2003). The involvement of independent
directors on boards reduces fraud on financial statements. The composition of a board is
designed for better monitoring which minimizes the agency conflict. This activity provides
133
early warning of any possible future losses and also assists the board to control any
opportunistic behavior by managers. Thus, the hypothesis is expressed as:
H16 (A): There is negative relationship between board independence and bank NPL.
H16 (B): There is positive relationship between board independence and bank performance in
terms of accounting measurement.
H16(C): There is positive relationship between board independence and bank performance in
terms of market measurement.
5.3.3.3 Board Diligence
One view is that board meetings are beneficial to shareholders. A more diligent board is
concerned with devoting more time for supervision of management activity to achieve
shareholders’ expectations (Conger, Finegold et al. 1998). Moreover, regular board meetings
helps the board keep informed and knowledgeable about the relevant performance of the
company, and also leads them to take or influence and direct appropriate action to address
any issues (Abbott, Parker et al. 2003). Thus, the hypothesis is expressed as:
H17 (A): There is negative relationship between board diligence and bank NPL.
H17 (B): There is positive relationship between board diligence and bank performance in
terms of accounting measurement.
H17 (C): There is positive relationship between board diligence and bank performance in
terms of market measurement.
5.3.3.4 Audit Committee Size
The literature suggests that audit committee size measured as the number of committee
members has a positive impact on the audit committee’s effectiveness. Audit committee size
is measured by the number of members on the audit committee. It is likely to be accepted that
larger audit committees have better resources than smaller audit committees. (De Zoort,
Hermanson et al. 2002). The decision making literature has argued that increasing the number
of people involved in an activity substantially increases group performance and mitigates the
chance of wrongdoing because collusion becomes more difficult (Cummings, Huber et al.
1974; Burton, Pathak et al. 1977). Hence it is hypothesized that:
H18 (A): There is negative relationship between audit committee size and bank NPL.
H18 (B): There is positive relationship between audit committee size and bank performance
in terms of accounting measurement.

134
H18 (C): There is positive relationship between audit committee size and bank performance
in terms of market measurement.
5.3.3.5 Audit Committee Independence
Previous studies argued that independent directors on the audit committee improve
governance because they can resolve disagreement among internal managers (Fama and
Jensen 1983). In addition, the literature suggests that they may also be experts in decision
making and control (Abbott, Parker et al. 2004). Independent directors on the audit
committee provide fair decisions over a firm’s financial outcome and always disagree with
any mismanagement that is directly related to firm performance (Beasley, Carcello et al.
2000). For instance, independent audit committees focus on in-depth audit coverage when the
firm faces issues of financial reporting, and also concerns on a variety of management issues
(Baysinger and Butler 1985). Evidence indicates that agency conflict can be reduced through
the involvement of independent directors on the audit committee; this is beneficial for firms
in terms of monitoring and financial reporting. Thus, the hypothesis is expressed as:
H19 (A): There is negative relationship between audit committee independence and bank
NPL.
H19 (B): There is positive relationship between audit committee independence and bank
performance in terms of accounting measurement.
H19 (C): There is positive relationship between audit committee independence and bank
performance in terms of market measurement.
5.3.3.6 Audit Committee Diligence
The frequency of audit committee meetings is an indication of the diligence of the audit
committee members as they would normally resolve issues with the auditors in a formal
meeting. Frequent meetings reflect active committee members (Raghunandan, Rama et al.
1998). Frequent audit committee meetings lead to lower cost of debt and reduce the
possibility of restatement and lower fraud occurrence. Accordingly, it is perceived that audit
committees who hold meetings frequently are concerned with the quality of the financial
reports which minimize the manipulation in the reports. Thus, the hypothesis is expressed as:
H20 (A): There is negative relationship between audit committee diligence and bank NPL.
H20 (B): There is positive relationship between audit committee diligence and bank
performance in terms of accounting measurement.

135
H20 (C): There is positive relationship between audit committee diligence and bank
performance in terms of market measurement.
5.3.3.7 Institutional Ownership
Previous researchers argue that a firm’s risk can be minimized through stock ownership
because it is a better mechanism when the firm faces high risks (Sanders 1999). As
institutional owners have better monitoring power, the firm can enjoy lower bond yields and
a higher bond rating (Bhojraj and Sengupta 2003). Institutional investors can work out the
operations of firm at a lower cost because the literature suggests that they have more
experience (Pound 1988). Hence, the hypothesis is expressed as:
H22 (A): There is negative relationship between institutional ownership and bank NPL.
H22 (B): There is positive relationship between institutional ownership and bank
performance in terms of accounting measurement.
H22 (C): There is positive relationship between institutional ownership and bank
performance in terms of market measurement.
5.3.3.8 Foreign Ownership
Foreign investors bring financial resources to promote the capital base of the local companies
which support them to gain the required assets and the human resources required to boost
their performance. The previous literature suggested that companies with foreign corporate
shareholdings are expected to offer superior technical, organizational and financial resources
(Stulz 1999). For instance, the degree of a foreign firm’s control over a domestic firm is
positively related with the degree of resource commitment to technology transfer (Chhibber
and Majumdar 1999). Foreign investment can be inferred to be related to the provision of
generic knowledge (management skills and quality systems) and specific knowledge (which
cannot be transferred at arm’s length) (Djankov and Hoekman 2000). Thus, the hypothesis is
expressed as:
H21 (A): There is negative relationship between foreign ownership and bank NPL.
H21 (B): There is positive relationship between foreign ownership and bank performance in
terms of accounting measurement.
H21 (C): There is positive relationship between foreign ownership and bank performance in
terms of market measurement.
136
5.3.3.9 CEO Remuneration
Shareholders believe a company’s executive as their agent who holds superior skills to
manage the resource of the company in an effective way (Murphy 1999). The organizational
argument generally views compensation as a control mechanism for increasing individual
motivation and achievement (Lawler and Lawlor 1981). For example, an individual who is
satisfied with his/her compensation is motivated to perform better. Thus, the hypothesis is
expressed as:
H23 (A): There is negative relationship between CEO remuneration and bank NPL.
H23 (B): There is positive relationship between CEO remuneration and bank performance in
terms of accounting measurement.
H23 (C): There is positive relationship between CEO remuneration and bank performance in
terms of market measurement.
5.4 Summary
The first part of this chapter presented the conceptual framework in this thesis. Three main
independent variables were identified which are the macro-economic, bank specific, and
governance characteristics. The predicted effect of macro-economic and bank specific
variables on NPL, and next the governance effect on NPL and performance, was explained
under the hypothesis development. There are twenty three hypotheses altogether. The first six
hypotheses test the relationship between macro-economic variables and NPL. The second
eight hypotheses test the relationship between bank specific variables and NPL. The last nine
hypotheses test the relationship of corporate governance variables and NPL and performance.
The chapter concludes with three primary hypotheses on the basis of the previous literature
that good macro-economic conditions of the country improve the loan quality, whereas poor
economic conditions of the country have a negative impact on loan quality. Similarly, even
the macro-economic conditions of the country are important indicators of loan quality. Bank
internal variables are also one of the drivers of bank NPL which have a significant impact on
loan quality. It is also concluded on the basis of previous studies that good corporate
governance practices also define the NPL, and poor corporate governance has a negative
impact on NPL and bank performance.
137
CHAPTER SIX
Research Methodology
6.1 Introduction
This thesis explored macro-economic, bank specific determinants of Non-performing Loans
(NPL) in Nepalese banks. Besides this, this thesis also tried to find out the influence of
corporate governance on bank NPL and performance. In this process, this chapter presents
the methodology developed to identify the influence of macro-economic and bank specific
variables on NPL. The methodology is also developed to identify the influence of governance
on NPL and performance of Nepalese commercial banks. To examine the stated objectives,
this thesis used secondary data. Firstly, it explains the sampling method and sources of data.
Next, it describes proxies and the measurement of the variables. Lastly, this thesis employed
a panel data methodology; hence, a procedure to examine the panel data is also presented.
6.2 Sampling
The sample banks were extracted from the population of all banks licensed by the Central
Bank of Nepal and listed on Nepal Stock Exchange. The sample of the study consists of 29
banks out of 31 banks in Nepal, seven of which are joint ventures with foreign banks. The
two state owned banks were excluded because of the unavailability of their data. Thus, as
shown below, twenty nine commercial banks were selected as a sample of the study.
Name of Bank Commencement Date
Nabil Bank Limited 16/07/1984
Nepal Investment Bank Limited 27/02/1986
Standard Chartered Bank Nepal Limited 30/01/1987
Himalayan Bank Limited 18/01/1993
Nepal SBI Bank Limited 07/07/1993
Nepal Bangladesh Bank Limited 05/06/1993
Everest Bank Limited 18/10/1994
Bank of Kathmandu Limited 12/03/1995
Nepal Credit and Commerce Bank Limited 14/10/1996
Lumbini Bank Limited 17/07/1998
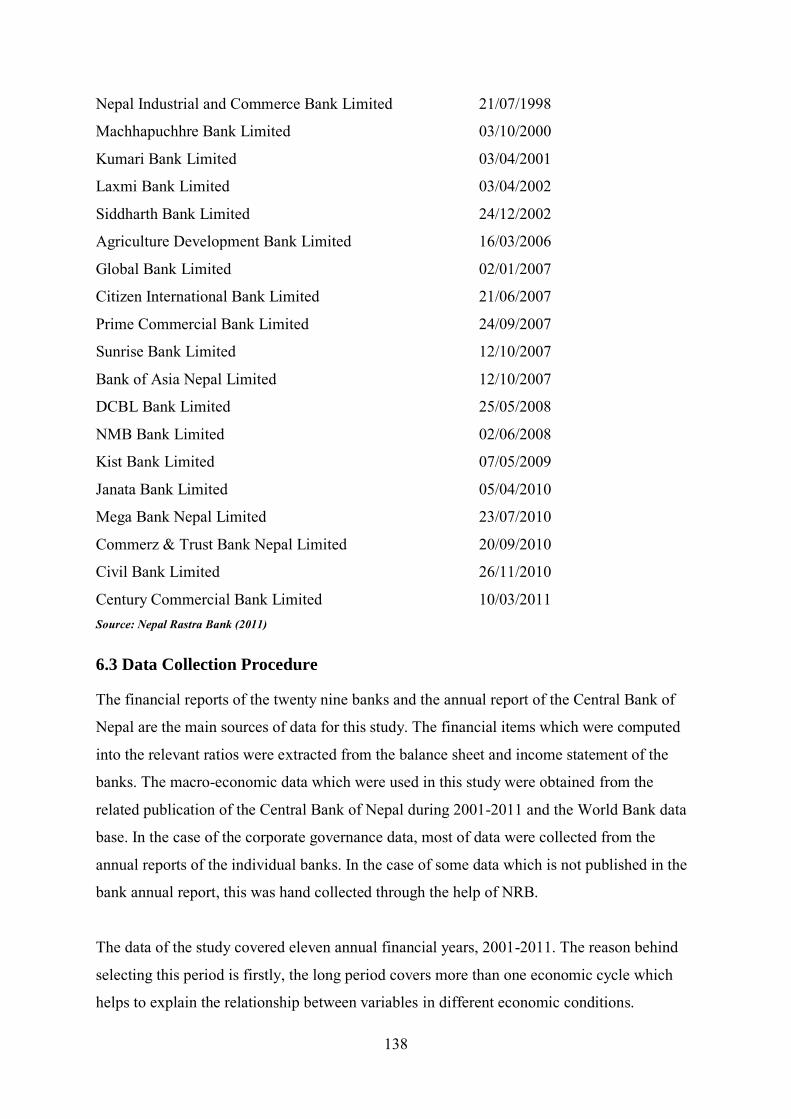
138
Nepal Industrial and Commerce Bank Limited 21/07/1998
Machhapuchhre Bank Limited 03/10/2000
Kumari Bank Limited 03/04/2001
Laxmi Bank Limited 03/04/2002
Siddharth Bank Limited 24/12/2002
Agriculture Development Bank Limited 16/03/2006
Global Bank Limited 02/01/2007
Citizen International Bank Limited 21/06/2007
Prime Commercial Bank Limited 24/09/2007
Sunrise Bank Limited 12/10/2007
Bank of Asia Nepal Limited 12/10/2007
DCBL Bank Limited 25/05/2008
NMB Bank Limited 02/06/2008
Kist Bank Limited 07/05/2009
Janata Bank Limited 05/04/2010
Mega Bank Nepal Limited 23/07/2010
Commerz & Trust Bank Nepal Limited 20/09/2010
Civil Bank Limited 26/11/2010
Century Commercial Bank Limited 10/03/2011 Source: Nepal Rastra Bank (2011)
6.3 Data Collection Procedure
The financial reports of the twenty nine banks and the annual report of the Central Bank of
Nepal are the main sources of data for this study. The financial items which were computed
into the relevant ratios were extracted from the balance sheet and income statement of the
banks. The macro-economic data which were used in this study were obtained from the
related publication of the Central Bank of Nepal during 2001-2011 and the World Bank data
base. In the case of the corporate governance data, most of data were collected from the
annual reports of the individual banks. In the case of some data which is not published in the
bank annual report, this was hand collected through the help of NRB.
The data of the study covered eleven annual financial years, 2001-2011. The reason behind
selecting this period is firstly, the long period covers more than one economic cycle which
helps to explain the relationship between variables in different economic conditions.
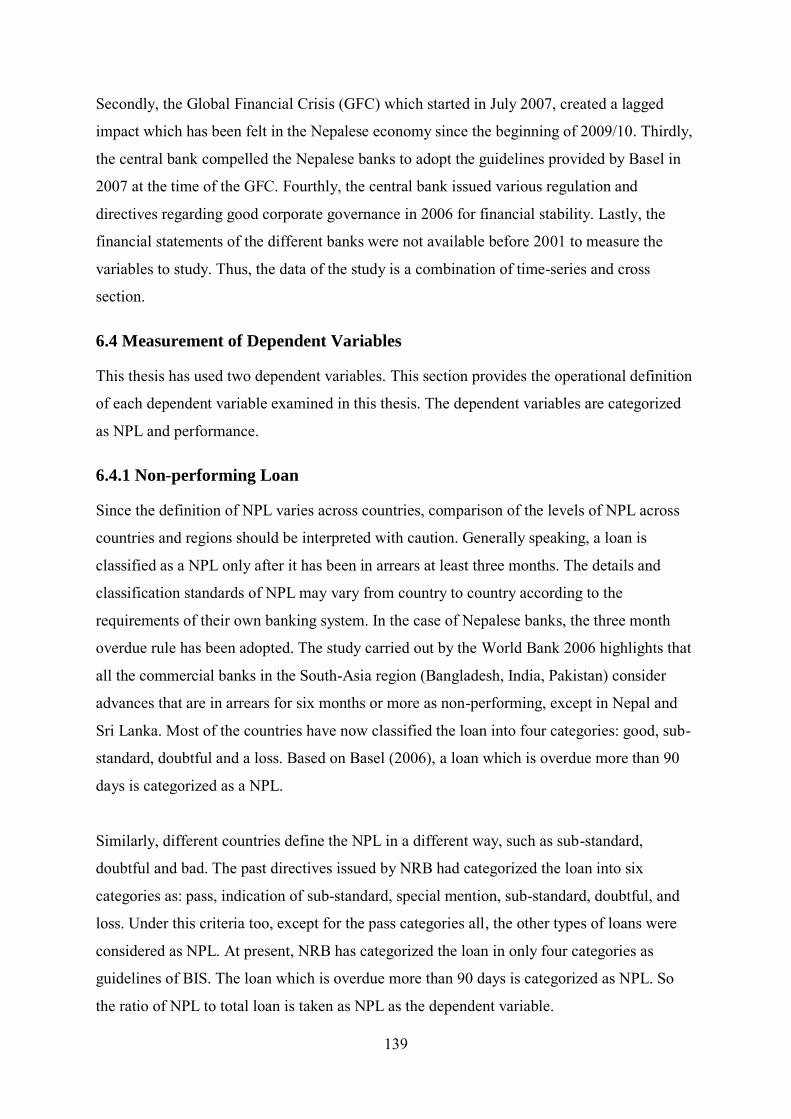
139
Secondly, the Global Financial Crisis (GFC) which started in July 2007, created a lagged
impact which has been felt in the Nepalese economy since the beginning of 2009/10. Thirdly,
the central bank compelled the Nepalese banks to adopt the guidelines provided by Basel in
2007 at the time of the GFC. Fourthly, the central bank issued various regulation and
directives regarding good corporate governance in 2006 for financial stability. Lastly, the
financial statements of the different banks were not available before 2001 to measure the
variables to study. Thus, the data of the study is a combination of time-series and cross
section.
6.4 Measurement of Dependent Variables
This thesis has used two dependent variables. This section provides the operational definition
of each dependent variable examined in this thesis. The dependent variables are categorized
as NPL and performance.
6.4.1 Non-performing Loan
Since the definition of NPL varies across countries, comparison of the levels of NPL across
countries and regions should be interpreted with caution. Generally speaking, a loan is
classified as a NPL only after it has been in arrears at least three months. The details and
classification standards of NPL may vary from country to country according to the
requirements of their own banking system. In the case of Nepalese banks, the three month
overdue rule has been adopted. The study carried out by the World Bank 2006 highlights that
all the commercial banks in the South-Asia region (Bangladesh, India, Pakistan) consider
advances that are in arrears for six months or more as non-performing, except in Nepal and
Sri Lanka. Most of the countries have now classified the loan into four categories: good, sub-
standard, doubtful and a loss. Based on Basel (2006), a loan which is overdue more than 90
days is categorized as a NPL.
Similarly, different countries define the NPL in a different way, such as sub-standard,
doubtful and bad. The past directives issued by NRB had categorized the loan into six
categories as: pass, indication of sub-standard, special mention, sub-standard, doubtful, and
loss. Under this criteria too, except for the pass categories all, the other types of loans were
considered as NPL. At present, NRB has categorized the loan in only four categories as
guidelines of BIS. The loan which is overdue more than 90 days is categorized as NPL. So
the ratio of NPL to total loan is taken as NPL as the dependent variable.

140
6.4.2 Performance
Another dependent variable in this study is bank financial performance. In line with Klapper
and Love (2004), Haniffa and Hudaib (2006) and Guest (2009), two measurements, namely
ROA and Tobin’s Q (TQ) are used as proxies for accounting and market based measures of
financial performance respectively. An accounting-based performance measure, ROA, has
been used by Fich and Shivdasani (2006) andAdams and Mehran (2012). Tobin’s Q as the
financial performance measure is commonly used as a dependent variable by Agrawal and
Knoeber (1996) and Adams and Mehran (2012).
The decision to use the two measures of financial performance is underpinned by two main
reasons. Firstly, prior evidence suggests that insiders and outsiders value corporate
governance differently (Black, Jang et al. 2006). As such, the accounting based measure of
performance, ROA attempts to capture the wealth effects of corporate governance
mechanisms from the perspective of company management (insiders), while the market based
measure, Tobin’s Q represents financial valuation of corporate governance structure by
investors (outsiders). Secondly, each measure has its own strength and weaknesses with no
consensus within the literature on a particular measure as being the ‘best’ proxy for financial
performance (Haniffa and Hudaib 2006). Hence, using the two measures represents an
attempt to examine the robustness of the results against both accounting and market based
measures of financial performance.
This thesis has calculated ROA as the ratio of net income to book value of assets at the end of
the financial year (Yermack 1996; Fich and Shivdasani 2006). It measures how efficiently
and effectively a firm manages its operations and uses its assets to generate profits (Ross,
Westerfield et al. 1998). On average, higher ROA suggests effective and efficient use of a
firm’s assets in maximizing the value of its shareholders’ investment by management (i.e.
internal corporate governance structure). ROA is an effective measure of performance
because it eliminates the problem of size which makes it easier for comparisons to be drawn
across firms (Lev and Saunder 1979). Demsetz and Lehn (1985) and suggests that as
accounting profit, ROA may reflect year to year fluctuations in underlying business
conditions better than stock market rates of return. This is because stock market rates of
return reflect expected future development that may mask current fluctuations in business

141
conditions. It has also been used widely by prior corporate governance studies (Klapper and
Love 2004; Haniffa and Hudaib 2006).
Tobin’s Q is usually used as the primary measure of financial performance as a proxy for the
market valuation of the quality of a firm’s internal corporate governance structures.
Generally, the Tobin’s Q ratio measures the effectiveness with which a firm’s management is
able to use its assets to generate value for shareholders. Like ROA, a higher Tobin’s Q ratio
suggests greater effectiveness of a firm’s internal corporate governance structure, as well as a
better perception of a company’s financial performance by the market (Haniffa and Hudaib
2006).
The concept of Tobin’s Q has great intuitive appeal and it is of immense theoretical and
practical relevance (Chung and Pruitt 1994). As such, it has been used extensively as a proxy
for financial performance not only in the corporate governance literature but also within the
large corporate finance literature. This thesis has calculated Tobin’s Q as a ratio of bank
market value to its book value of assets. The bank market value is calculated as book value of
assets minus book value of equity plus market value of equity, as used by (Adams and
Mehran 2012).
6.5 Measurement of Independent Variables
This section provides the operational definition of each independent variable examined in this
thesis. The independent variables are categorized as macro-economic, bank specific,
governance, and control variables. Table 6.1 provides a summary of measurements used in
this thesis.
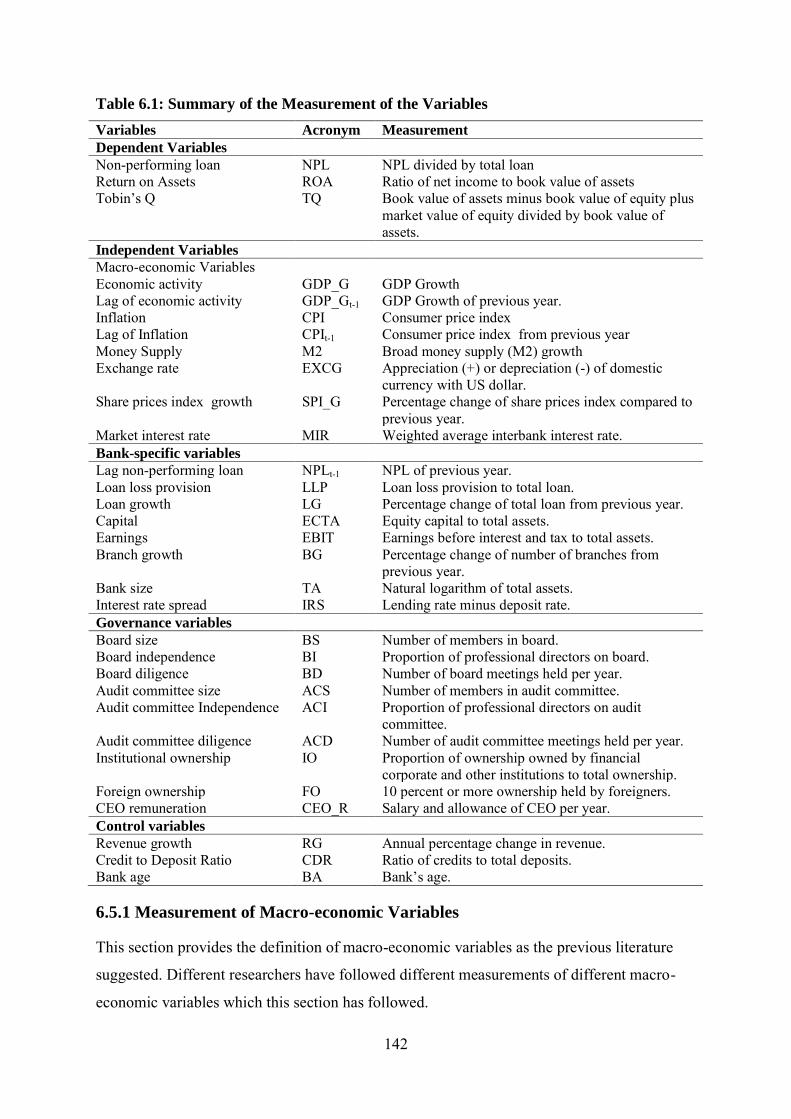
142
Table 6.1: Summary of the Measurement of the Variables
Variables Acronym Measurement
Dependent Variables
Non-performing loan NPL NPL divided by total loan Return on Assets ROA Ratio of net income to book value of assets Tobin’s Q TQ Book value of assets minus book value of equity plus
market value of equity divided by book value of assets.
Independent Variables
Macro-economic Variables Economic activity GDP_G GDP Growth Lag of economic activity GDP_Gt-1 GDP Growth of previous year. Inflation CPI Consumer price index Lag of Inflation CPIt-1 Consumer price index from previous year Money Supply M2 Broad money supply (M2) growth Exchange rate EXCG Appreciation (+) or depreciation (-) of domestic
currency with US dollar. Share prices index growth SPI_G Percentage change of share prices index compared to
previous year. Market interest rate MIR Weighted average interbank interest rate. Bank-specific variables Lag non-performing loan NPLt-1 NPL of previous year. Loan loss provision LLP Loan loss provision to total loan. Loan growth LG Percentage change of total loan from previous year. Capital ECTA Equity capital to total assets. Earnings EBIT Earnings before interest and tax to total assets. Branch growth BG Percentage change of number of branches from
previous year. Bank size TA Natural logarithm of total assets. Interest rate spread IRS Lending rate minus deposit rate. Governance variables Board size BS Number of members in board. Board independence BI Proportion of professional directors on board. Board diligence BD Number of board meetings held per year. Audit committee size ACS Number of members in audit committee. Audit committee Independence ACI Proportion of professional directors on audit
committee. Audit committee diligence ACD Number of audit committee meetings held per year. Institutional ownership IO Proportion of ownership owned by financial
corporate and other institutions to total ownership. Foreign ownership FO 10 percent or more ownership held by foreigners. CEO remuneration CEO_R Salary and allowance of CEO per year. Control variables Revenue growth RG Annual percentage change in revenue. Credit to Deposit Ratio CDR Ratio of credits to total deposits. Bank age BA Bank’s age.
6.5.1 Measurement of Macro-economic Variables
This section provides the definition of macro-economic variables as the previous literature
suggested. Different researchers have followed different measurements of different macro-
economic variables which this section has followed.

143
6.5.1.1 Economic Activity
It is widely accepted that GDP is the better indicator of aggregate economic activity. Various
authors Salas and Saurina (2002), Bhattacharya and Roy (2008), Jiménez and Saurina (2006)
and Das and Ghosh (2007) used growth of GDP as a proxy of aggregate economic activity. In
addition, GDP is highly informative about changes in unemployment, real wages and real
interest rates (Salas and Saurina 2002). Annual percentage growth rates of GDP at market
prices based on constant local currency, is the aggregate economic activity of the country.
This thesis measures GDP as the sum of gross value added by all resident producers in the
economy plus any product taxes, minus any subsidies not included in the value of the
products. It is calculated without making a deduction for depreciation of fabricated assets or
for depletion and degradation of natural resources. This study includes the current GDP
growth rate as well as a one year lag of GDP growth to gauge the timing.
6.5.1.2 Inflation
In the economy, the purchasing power of the currency is reduced when general price levels of
goods and services increases. Some economists say inflation denotes the increase in the
amount of money in circulation. Inflation can be measured through the rate of change of the
consumer price index (Boyd, Levine et al. 2001). The consumer price index reflects the
annual percentage change in costs to the average consumer of acquiring a basket of goods
and services that may be fixed or changed at specified intervals, such as yearly. This provides
a relatively accurate indication of the average level of prices in the economy.
The consumer price index is used in this study as the proxy for inflation. Also, it is the most
comprehensive measure of inflation defined as a change in the price of consumer goods and
services purchased by households. This study used the consumer price index to measure the
inflation rate with a base year 2000/01published by the World Bank.
6.5.1.3 Money Supply
Money supply is the total stock of money available in any economy during a specified time.
Money supply is in three forms: Reserve Money, Narrow Money and Broad Money. Two
measures of money supply are available in Nepal: these are narrow money and broad money.
Narrow money includes currency held by banks and demand deposits held at the monetary
sector. Broad money consists of narrow money and time deposits held by commercial banks.

144
In Nepal, an issue of selecting a suitable intermediate monetary target variable has come up.
not very long dates back. The selection is to be made from the two available monetary
measures: narrow money and broad money. Past empirical studies support the narrow money
as a better intermediate monetary target variable because it has a relatively stronger
relationship with other economic variables including price. However, people are more
interested to be a used to banking habit. This shows that deposits held by banks are available
for and easily withdrawn on demand. In this context, both measures of money supply are
used for this study. The change in the money supply is measured as the difference in end-of-
year totals relative to the level of M2 in the preceding year.
6.5.1.4 Foreign Exchange
The rate which is used to exchange one currency with another is known as the exchange rate.
Continuous foreign exchange markets are the vehicle of determination of exchange rates.
These markets are open for 24 hours a day except weekends and comprise of wide range of
different types of currency traders. This exchange currency is largely influenced by the
exchange of capital goods and services across borders called international trade.
At the present time, Nepal is following the dual exchange rate system because its currency is
pegged with the Indian currency whereas it floats with other major convertible currencies
such as the US dollar, UK pound etc. However, Nepal trades with other countries except
India in US dollars. So this study took exchange rates with the US dollar as a proxy of
exchange rates as published by NRB.
6.5.1.5 Share Prices Index
It is expected that good share market performance will contribute to reduce the credit risk.
Hadad, Santoso et al. (2006), Aver (2008), Bofondi & Ropele, (2011) and Castro (2012) have
used growth of the share prices index as an indicator of stock market performance which tries
to mitigate the credit risk in banks. The Nepal Stock Exchange (NEPSE) has been operating
as the main controller of the stock market in Nepal. The data of wholesale share prices index
is gathered from the annual reports of the NEPSE. Hence, the growth of the share prices
index as used by past scholars is the change in wholesale market share prices index compared
to previous years and is used as the growth of share prices index in Nepal which this thesis
used.

145
6.5.1.6 Market Interest Rate
The market interest rate was measured by different measurements by past scholars.
Quagliariello (2007) used the interest on ten year Treasury bonds as a proxy of market
interest rate. The interbank interest rate was used to measure interest rates by Ahmad (2003)
and Das and Ghosh (2007). Cebula (2001) used the difference between three year Treasury
notes and inflation rates to measure the market interest rate.
This thesis used weighted average interbank interest rates as a proxy of the market interest
rate. The reason behind selecting this proxy is that this study is concerned with studying the
impact of the market interest rate on bank credit risk exposure. However, banks use the
interbank interest rate as a primary factor in pricing their loans. This means that this factor
has a direct impact on the interest rate that will be paid by the borrower. Hence, using the
weighted average interbank interest rate is the appropriate proxy to capture the impact of the
market interest rate on credit risk.
6.5.2 Measurement of Bank Specific Variables
This section provides the definition of bank specific variables as the previous literature
suggested. Different researchers have followed different measurements of different proxies of
bank specific variables, which are explained in this section.
6.5.2.1 Lag Non-performing Loans
The ratio of problem loans of one period is closely related to that of the previous period since
problem loans are not immediately written down (Salas and Saurina 2002) but are, in fact,
carried forward in the balance sheet. The empirical results of previous studies show that the
impact of current NPL needs to be carried forward to the next accounting year. The NPL ratio
with lag (NPLt-1) was used to measure the impact of previous years of NPL as in Das and
Ghosh (2007) and Jimenez and Saurina (2006) which this thesis has also used.
6.5.2.2 Loan Loss Provision
The estimated provision of loan losses reflects a perception of a bank’s management of loan
quality. The higher quality of loans reduces the provision of loan losses, and low quality of
loans increases provision of loan losses (Eng and Nabar 2007). The ratio of provision of loan
losses to the total loans was used to measure the impact of provision for loan losses on bank
NPL in this study.

146
6.5.2.3 Loan Growth
Excessive lending by commercial banks is often identified as an important determinant of
NPL (Salas and Saurina 2002; Jimenez and Saurina 2005; Sinkey and Greenwalt 1991;
Keeton 1999). The rapid growth of loans has an impact on the quality of loans; the bank with
high loan growth assumes more NPL (Das and Ghosh 2007). The credit growth in one year
can have an influence on the loan defaults in the subsequent years since credit appetite of
banks during boom periods over-looks strict credit criteria. The variable to capture loan
growth is constructed by the previous literature as the annual percentage change in the loan
portfolio of each bank.
6.5.2.4 Capital
Since the bank has applied Basel agreement standards, the capital is divided into primary or
core capital, and supplementary capital. Both core and supplementary capital are used as a
cushion against risk. Hence, the ratio of total equity capital to total assets was used to
measure the relationship between the level of capital and NPL by Altunbas et al., (2007),
Bichsel and Blum (2004) and Godlewski (2005). This thesis also applied the same
measurement as a proxy of capital.
6.5.2.5 Earnings
Many studies use different proxies for earnings. Some studies are based on income and some
are based on net income. Salas and Saurina (2002) and Louzis (2010) measured the earnings
of banks as operating income. Some researchers also used net interest income as a proxy of
earnings of banks, for example Das and Ghosh (2007). The net interest income ratio is a
rough measure for a risk taking measure. The main income of the bank comes from interest
where the bank manages the other operating expenses (Koch and McDonald 2003). This
thesis has used the earnings before income and tax as a proxy of earnings of banks where all
other operating expenses have been deducted.
6.5.2.6 Branch Growth
To check the relationship between branch growth and NPL, different authors have applied
different ways to measure branch growth. Salas and Saurina (2002) used the branch growth
rate as the change in number of branches compared to the previous year. He used the branch
growth with three year lag. Similarly, Das and Ghosh (2007) and Thiagarajan, Auuapan et al.
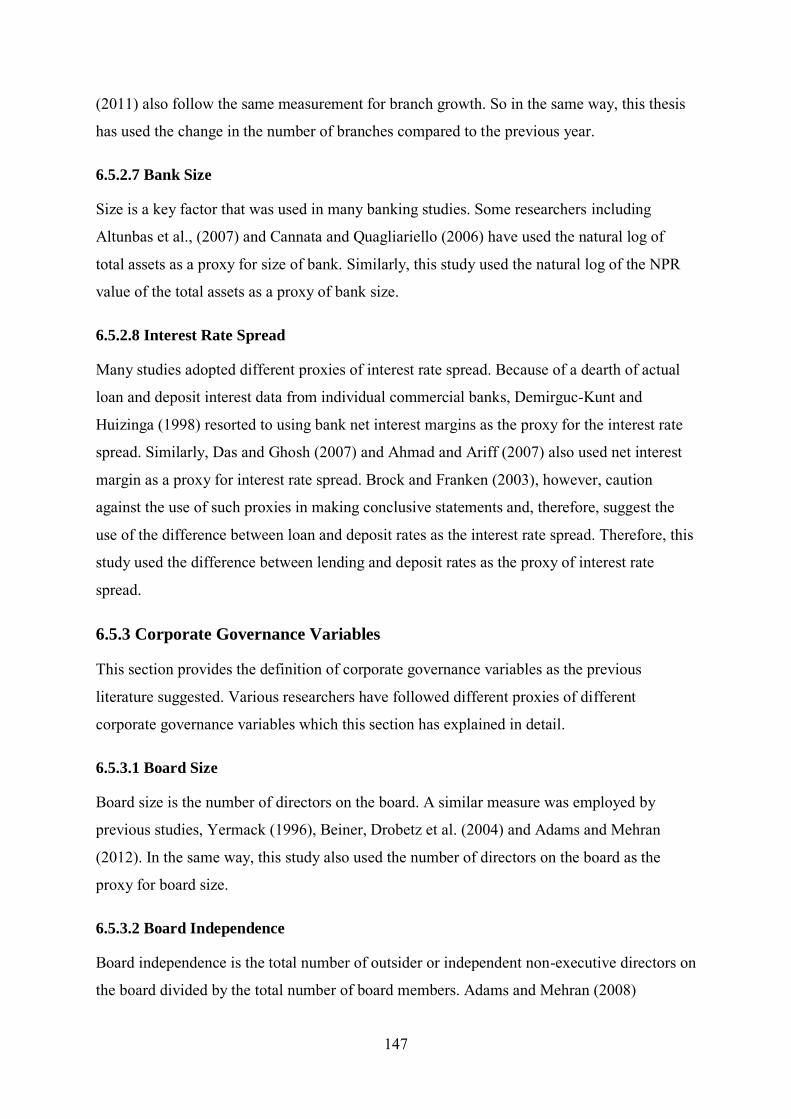
147
(2011) also follow the same measurement for branch growth. So in the same way, this thesis
has used the change in the number of branches compared to the previous year.
6.5.2.7 Bank Size
Size is a key factor that was used in many banking studies. Some researchers including
Altunbas et al., (2007) and Cannata and Quagliariello (2006) have used the natural log of
total assets as a proxy for size of bank. Similarly, this study used the natural log of the NPR
value of the total assets as a proxy of bank size.
6.5.2.8 Interest Rate Spread
Many studies adopted different proxies of interest rate spread. Because of a dearth of actual
loan and deposit interest data from individual commercial banks, Demirguc-Kunt and
Huizinga (1998) resorted to using bank net interest margins as the proxy for the interest rate
spread. Similarly, Das and Ghosh (2007) and Ahmad and Ariff (2007) also used net interest
margin as a proxy for interest rate spread. Brock and Franken (2003), however, caution
against the use of such proxies in making conclusive statements and, therefore, suggest the
use of the difference between loan and deposit rates as the interest rate spread. Therefore, this
study used the difference between lending and deposit rates as the proxy of interest rate
spread.
6.5.3 Corporate Governance Variables
This section provides the definition of corporate governance variables as the previous
literature suggested. Various researchers have followed different proxies of different
corporate governance variables which this section has explained in detail.
6.5.3.1 Board Size
Board size is the number of directors on the board. A similar measure was employed by
previous studies, Yermack (1996), Beiner, Drobetz et al. (2004) and Adams and Mehran
(2012). In the same way, this study also used the number of directors on the board as the
proxy for board size.
6.5.3.2 Board Independence
Board independence is the total number of outsider or independent non-executive directors on
the board divided by the total number of board members. Adams and Mehran (2008)
148
measured the outside directors who are not former officers of the firm, generally the CEO or
Chairman. Other researchers, Baysinger and Butler (1985) and Ezzamel and Watson (1993),
measure the board indpendence as the proportion of indpendent directors to total directors.
The Central bank of Nepal defines independent directors as the professional director who is
independent from the management, and free from any business or other relationship which
could interfere with the exercise of independent judgment, or the ability to act in the best
interest of stakeholders. So, this thesis uses the proportion of the number of professional
directors as nominated by the Central bank of Nepal to total directors on board as a proxy for
board independence.
6.5.3.3 Board Diligence
Board diligence is an important determinant of board effectiveness (Vafeas 1999). Board
diligence is related to factors that include the number of board meetings (Carcello et al. 2002)
and De Zoort et al. (2002). They suggest that frequency of meetings can be a proxy of
diligence. So this thesis used the number of board meetings in year as a proxy for board
diligence.
6.5.3.4 Audit Committee Size
Audit committee size is measured by the number of members on the audit committee. The
same measure was followed by various researchers Klein (2002), Coleman-Kyereboah (2007)
and Hardwick, Adams et al. (2003). So, this study measures audit committee size as the
number of members involved in the audit committee.
6.5.3.5 Audit Committee Independence
Audit committee composition is the proportion of independent directors on the audit
committee. Audit Committee independence was computed by Klein (2002), Weiss (2005),
Kyereboah-Coleman (2007) and Erickson, Park et al. (2005) as the total number of
independent directors on the audit committee divided by the total number of audit committee
members This thesis has used the proportion of professional directors on the audit committee.
6.5.3.6 Audit Committee Diligence
Audit committee diligence is measured as the number of audit committee meetings held
during the year. Audit committee meetings was measured as the number of meetings held by
the audit committee per year. The same measure had been used by previous studies as a
149
proxy for the diligence of the audit committee e.g. Huang, Lai et al. (2008) and Kyereboah-
Coleman (2007). So, in the same way, this thesis uses the number of audit committee
meetings per year as the proxy for audit committee diligence.
6.5.3.7 Ownership Structure
This section provides the definition of ownership variables examined in this study. The
ownership variables are categorized: institutional and foreign. Previous researchers
mentioned the different proxies for ownership variables which this thesis has also followed.
6.5.3.7.1 Institutional Ownership
Various researchers have measured the institutional ownership as shares held by institutions
Chaganti and Damanpour (1991) and Han and Suk (1998). An institution consists of financial
institutions and organized institutions. Similarly, this thesis measures the institutional
ownership as shareholding by financial institute, commercial bank and organized institutions.
6.5.3.7.2 Foreign Ownership
Various researchers have defined the bank as foreign in different ways. Claessens, Demirguc-
Kunt et al. (2001) defined the bank as foreign if the bank held 50 percent of its capital by
foreign residents. Similarly, DeYong and Nolle (1996) defined the bank as foreign if the bank
held only 10 percent of its capital by foreign ownership. So, this study followed DeYong and
Nolle (1996) and measured the foreign ownership as if the bank held 10 percent of its capital
with foreign ownership.
6.5.3.8 CEO Remuneration
CEO compensation is usually composed of multiple types of pay including salary, cash
bonus, stock bonuses, and stock options, among others (Zajac 1990). Empirical studies about
the relationship between CEO compensation and firm performance has usually attempted to
gauge this linkage by measuring the dollar value levels of a CEO yearly compensation in
terms of salary and bonus, including stock option (Benston 1985; Coughlan and Schmidt
1985). While this approach has well-known measurement difficulties (Kerr and Bettis 1987),
this study measured the CEO remuneration in terms of salary and allowances, and bonuses
excluding a stock option which is hand collected from the Central bank of Nepal.
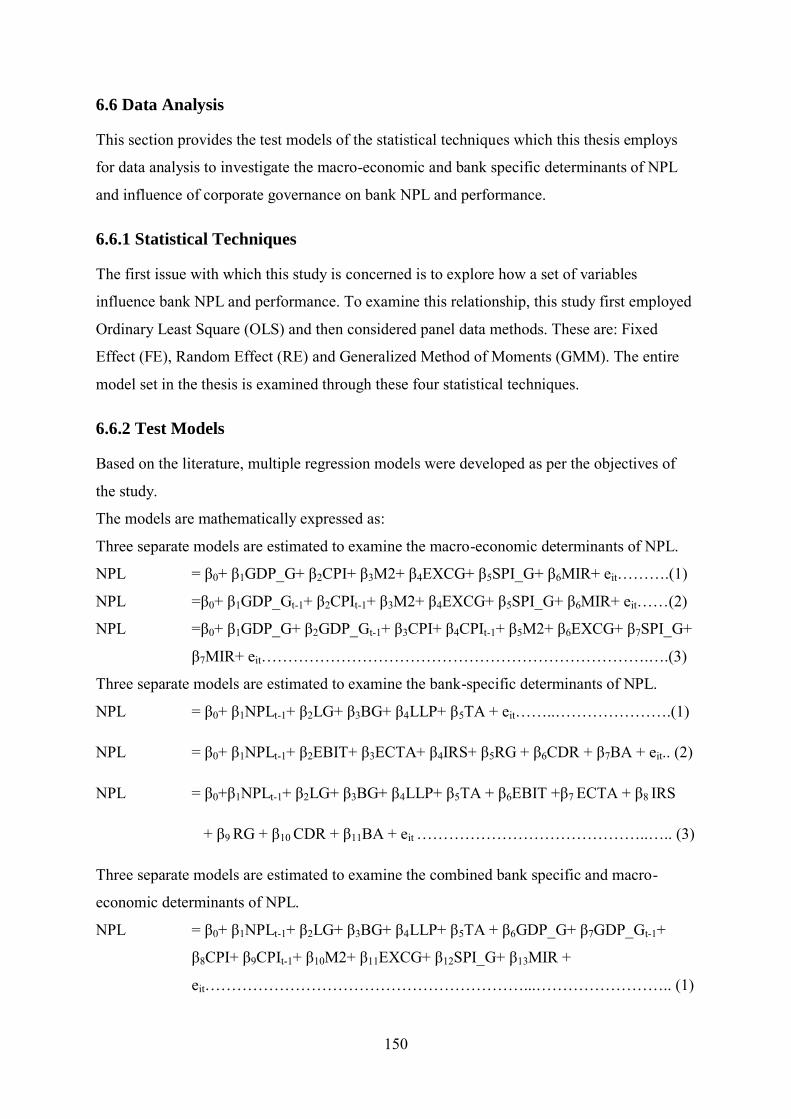
150
6.6 Data Analysis
This section provides the test models of the statistical techniques which this thesis employs
for data analysis to investigate the macro-economic and bank specific determinants of NPL
and influence of corporate governance on bank NPL and performance.
6.6.1 Statistical Techniques
The first issue with which this study is concerned is to explore how a set of variables
influence bank NPL and performance. To examine this relationship, this study first employed
Ordinary Least Square (OLS) and then considered panel data methods. These are: Fixed
Effect (FE), Random Effect (RE) and Generalized Method of Moments (GMM). The entire
model set in the thesis is examined through these four statistical techniques.
6.6.2 Test Models
Based on the literature, multiple regression models were developed as per the objectives of
the study.
The models are mathematically expressed as:
Three separate models are estimated to examine the macro-economic determinants of NPL.
NPL = β0+ β1GDP_G+ β2CPI+ β3M2+ β4EXCG+ β5SPI_G+ β6MIR+ eit……….(1)
NPL =β0+ β1GDP_Gt-1+ β2CPIt-1+ β3M2+ β4EXCG+ β5SPI_G+ β6MIR+ eit……(2)
NPL =β0+ β1GDP_G+ β2GDP_Gt-1+ β3CPI+ β4CPIt-1+ β5M2+ β6EXCG+ β7SPI_G+
β7MIR+ eit……………………………………………………………….….(3)
Three separate models are estimated to examine the bank-specific determinants of NPL.
NPL = β0+ β1NPLt-1+ β2LG+ β3BG+ β4LLP+ β5TA + eit……..………………….(1)
NPL = β0+ β1NPLt-1+ β2EBIT+ β3ECTA+ β4IRS+ β5RG + β6CDR + β7BA + eit.. (2)
NPL = β0+β1NPLt-1+ β2LG+ β3BG+ β4LLP+ β5TA + β6EBIT +β7 ECTA + β8 IRS
+ β9 RG + β10 CDR + β11BA + eit ……………………………………..….. (3)
Three separate models are estimated to examine the combined bank specific and macro-
economic determinants of NPL.
NPL = β0+ β1NPLt-1+ β2LG+ β3BG+ β4LLP+ β5TA + β6GDP_G+ β7GDP_Gt-1+
β8CPI+ β9CPIt-1+ β10M2+ β11EXCG+ β12SPI_G+ β13MIR +
eit……………………………………………………...…………………….. (1)

151
NPL = β0+ β1NPLt-1+ β2EBIT+ β3ECTA+ β4IRS+ β5RG + β6CDR + β7BA +
β8GDP_G+ β9GDP_Gt-1+ β10CPI+ β11CPIt-1+ β12M2+ β13EXCG+ β14SPI_G+
β15MIR+ eit……………………………………………………………….. (2)
NPL = β0+β1NPLt-1+ β2LG+ β3BG+ β4LLP+ β5TA + β6EBIT +β7 ECTA + β8 IRS +
β9 RG + β10 CDR + β11BA+ β12GDP_G+ β13GDP_Gt-1+ β14CPI+ β15CPIt-1+
β16M2+ β17EXCG+ β18SPI_G+ β19MIR + eit ………………………….... (3)
Four separate models are estimated to examine the corporate governance determinants of
NPL.
NPL = β0+ β1BS+ β2BI+ β3BD+ β4NPLt-1 + β5LLP + β6 LG + β7 ECTA + β8 EBIT + β9BG+
β10TA+ β11IRS+ β12RG+ β13CDR+ β14BA + eit………………………………….. (1)
NPL = β0+ β1ACS+ β2ACI+ β3ACD+ β4NPLt-1 + β5LLP + β6 LG + β7 ECTA + β8 EBIT +
β9BG+ β10TA+ β11IRS+ β12RG+ β13CDR+ β14BA + eit…………………………. (2)
NPL = β0+ β1IO+ β2FO+ β3CEO_R + β4NPLt-1 + β5LLP + β6 LG + β7 ECTA + β8 EBIT +
β9BG+ β10TA+ β11IRS+ β12RG+ β13CDR+ β14BA + eit…………………………. (3)
NPL = β0+ β1BS+ β2BI+ β3BD+ β4ACS+ β5ACI+ β6ACD + β7IO+ β8FO+ β9CEO_R+
β10NPLt-1 + β11LLP + β12 LG + β13 ECTA + β14 EBIT + β15BG+β16TA+ β17IRS+
β18RG+β19CDR+β20BA+β21GDP_G+β22CPI+β23M2+β24EXCG+β25SPI_G+
β26MIR+eit…………………………………………………………………………...(4)
Where NPL= Non-performing loan, NPLt-1= Lag non-performing loan, LLP= Loan loss
provision, LG= Loan growth, ECTA= Equity capital to total assets, EBIT = Earnings before
interest & tax to total assets, BG= Branch growth, TA= Total assets in NPR, IRS= Interest
rate spread, RG= Revenue growth, CDR= Credit deposit ratio, BA= Bank age, GDP_G=
GDP growth, GDP_Gt-1= lag GDP growth, CPI= Inflation rate, CPIt-1= lag inflation rate,
M2= Broad money supply growth, EXCG= Exchange rate, SPI_G= Share prices index -
growth, MIR= Market interest rate.
Four separate models are estimated to examine the corporate governance determinants of
performance.

152
2Performance = β0+β1BS+β2BI+β3BD+ β4LLP +β5TA+β6ECTA+ β7GDP_G+β8CPI+β9M2
+eit…………………………………………………………………………. (1)
Performance =β0+β1ACS+β2ACI+β3ACD+β4LLP+β5TA+β6ECTA+β7GDP_G+β8CPI+β9M2
+eit………………………………………………………………………….. (2)
Performance =β0+β1IO+β2FO+β3CEO_R+β4LLP+β5TA+β6ECTA+β7GDP_G+β8CPI+β9M2
+eit………………………………………………………………………….. (3)
Performance=β0+β1BS+β2BI+β3BD+β4ACS+β5ACI+β6ACD+β7IO+β8FO+β9CEO_R+
β9LLP+ β9TA+ β9ECTA+ β9GDP_G+ β9CPI+ β9M2 +eit………………….(4)
Where BS= Board size, BI= Board independence, BD= Board diligence, ACS= Audit
committee size, ACI= Audit committee independence, ACD= Audit committee diligence,
IO= Institutional ownership, FO= Foreign ownership, CEO_R= CEO remuneration, GDP_G=
GDP growth, CPI= Inflation rate, M2= Broad money supply growth, LLP= Loan loss
provision, TA= Total assets in NPR, ECTA= Equity capital to total assets
6.7 Research Design
This section discusses the research design. First, it attempts to provide a comprehensive
description of the data analysis and the research model used in this study. The next step in
this section is to explain clearly the rationale for the various data and model choices made at
every step of the study. Further, the next step of this section is about the diagnosis testing
which is significant for the data analysis.
6.7.1 Panel Data Analysis
Panel data methodology has been used to examine the relationship of independent variables
on NPL, ROA and TQ. Many researchers, for example Banker, Devaraj et al. (2002),
Bhattacharya, Daouk et al. (2003), Leng (2004), Schiehll (2006), Sanchez-Ballesta and
Garcia-Meca (2007), and Ming and Gee (2008) used this methodology in previous
accounting studies. STATA statistical software has been used to analyze the data as it is
suitable for panel data regression.
2Performance is measured by accounting and market measurement i.e. ROA and Tobin’s Q.

153
Panel data, which is also known as longitudinal data, consist of a time-series for each cross-
sectional member in the data set (Wooldridge 2009 pp 10). Panel data recommend that the
subject such as countries, states, firms or individuals under study is heterogeneous. Even the
nature of some variables change with subject and time and there may be some other variables
that may be subject-invariant or time-invariant. Time-invariant variables are those variables
which are unique to the subject. So it is important to include such variables in the model
equation otherwise the result estimates may be biased. The panel data methodology supplies a
resolution to manage these invariant factors which are not controlled either in cross-sectional
or time-series studies. Another motivational factor to use panel data is to solve the omitted
variables problem (Wooldridge 2002 p.247).
Advantage of Panel Data
Hsio (2003) and Baltagi (2008) have discussed the advantage of panel data over pure cross-
sectional and pure time-series data as mentioned below:
a. Panel data check the multiple observations on cross-sectional units which give the
proper information. Thus, panel data give estimations of parameters efficiently and
also gives more variability. The informative data also provides more consistent
estimates and checks a more difficult behavioral model with less limiting
assumptions.
b. Panel data is useful to reduce the multicollinearity problem. In pure time-series data,
there is the existence of serious multicollinearity among the independent variables
mainly when current period independent variables are highly correlated with those in
the previous year. To minimize the problem of collinearity, differences in the
dependent variables across cross-sectional units can be used.
c. Panel data controls the individual heterogeneity problem. The impact of omitted
variables is controlled by this method. Panel data contains information on both the
inter-temporal dynamics and the individuality of the entities and may help researchers
to control the effects of missing or unobserved variables.
d. Panel data enables the researcher to identify an otherwise unidentified model which
under usual circumstances may be undetectable due to measurement errors.
6.7.1.2 Ordinary Least Square
The ordinary least squares (OLS) approach to multiple linear regressions was introduced by
Gauss in 1974 (Brand 2003). The OLS procedure is the simplest type of estimation procedure

154
used in statistical analysis. However, in order to benefit from the well-behaved properties of
an OLS estimate, a number of assumptions must be satisfied. The simple OLS regression
does not account for heterogeneity and assumes that the sample firms were homogeneous.
Jager (2008) investigated panel data analysis through OLS regression techniques and found
two different results which imply that OLS techniques on panel data lead to incorrect
inferences. As the result of individual unique factors which remain constant over time, panel
data observation cannot be assumed as independently distributed across time (Wooldridge
2002; Baddeley and Barrowclought 2009).
Therefore, pooled OLS assumes homogeneity in pure cross-sectional or times series analysis,
if estimates on panel data may lead to misleading inferences (Baddeley and Barrowclought
2009). In simple pooling on panel data, no adjustment is made for firm specific factors,
resulting in autocorrelation because, in each year under study, the firm unique factor was left
in the residual. Additionally, it also results in heterogeneity bias in terms of omitted variables
bias because the firm unique factor is not included in the deterministic part of the model
(Baddeley and Barrowclought 2009).
Panel regression models control for the heterogeneity effect in panel data using either a FE
model or RE model. The main difference between the two methods is that the unobserved
effects (the error terms) are correlated with included independent variables (Wooldridge
2002).
6.7.1.3 Fixed Effects Model
Each firm bears its own individual characteristics which are constant across time. Dependent
variables may or may not be affected by that individual characteristic. In the process of
investigation of relationships between dependent and independent variables within an entity,
fixed effect control and unobserved individual characteristics of each firm may affect or bias
the dependent variables. Following the assumption underlying the use of a fixed effects (FE)
method that the error term is correlated with the independent variables, this method removes
the effect of unobserved time-invariant characteristics from the independent variables, so that
the net effect of independent variables is assessable. Therefore, the FE method is unbiased as
it controls for unobserved time-invariant factors but it may be inefficient if the correlation
that it assumes is really zero (Allison 2009).

155
The Haussmann Test is carried out to choose the FE model. The FE method can be
implemented either by dummy variables or through the mean deviation method. The dummy
variables method is implemented by creating a set of dummy variables for each entity in the
data set. The coefficient of the entity’s dummy variables produced upon analysis represents
an estimate of the unobserved time-invariant factors. However, Wooldridge (2002) suggested
that this method is not practical for data sets with many cross-sectional observations. Allison
(2009) pointed out that this method imposes difficulties as it may be beyond the capacity of
the accounting software. The mean deviation method is an alternative to estimate FE
regression which is simple to perform using accounting software. The mean deviation method
implies that mean values for all time-varying variables are identified for each entity.
Subsequently, the entity’s specific mean is subtracted from the observed value for each
variable. In this method, estimated coefficients for the time-invariant independent variables
are not given, since their values are constant for each entity; subtracting the entity-specific
mean of time-invariant variables from the individual values yields a value of zero for all
entities. Accordingly, the time-invariant independent variables are dropped out of the
equation; nevertheless their effect has been controlled (Allison 2009).
6.7.1.3 Random Effects Model
This technique which is equally known as the Error Component Model is an alternative to the
FE technique (Nickell 1981). The advantage of random effect (RE) is that it is economical in
degrees of freedom than FE. The RE technique is suitable in cases where the (random)
intercept of each cross-sectional unit is uncorrelated with the regressors. Basically, the RE
estimator assumes that the intercept of an individual unit is a random component that is
drawn from a larger population with a constant mean value. The individual intercept is then
expressed as a deviation from this constant mean value. This is because the analyst does not
have to estimate N cross-sectional intercepts but just only the mean value of the intercept and
its variance. Since there is no significant correlation between the unobserved units of
observation, specific random effects and the regressors mean the RE model may be more
appropriate. However, based on variation in the capital base and share capital of the bank
under review, the intercept of each bank is said to be a random component. Therefore, this
study adopted the RE method of the panel data regression analysis. The advantage of a RE
model over the FE model is that time-constant independent variables are allowed and can be

156
examined in a regression model. These results from the assumption that the unobserved effect
is not correlated with the independent variables, whether or not they are fixed over time.
Similarly, as with the FE model, the Haussmann Test is carried out to choose the RE model.
Accordingly, a RE model allows time-constant independent variables and does not drop them
out of the regression model. However, if it violates the assumption that FE are not correlated
with the disturbance reflected in the between effects, it may produce biased results.
6.7.1.4 Generalized Method of Moments
In the banking literature, it is generally preferable to employ FE and/or RE for panel data.
However, if the lag dependent variables or possibly other regressors are important, these
models face the problem particularly in the case of short time periods and large observation
(Nickell 1981). If the regressors are correlated with the lagged dependent variables to some
extent, their coefficient may also be seriously biased.
To minimize this problem, Arellano and Bond (1991) developed the difference generalized
method of moment (GMM) model by differentiating all regressors. Arellano and Bover
(1995) and Blundell and Bond (1998) augment the difference GMM model by developing the
system GMM estimator which includes lagged levels as well as lagged differences. The
system GMM estimator assumes that first differences of instrumental variables are
uncorrelated with the FE. It allows the introduction of more instruments, and can
substantially improve efficiency.
Roodman (2006) argues that both difference and system GMM estimators are suitable for
situations with “small T, large N” panels; independent variables that are not strictly
exogenous, fixed individual effects, heteroskedasticity and autocorrelation. One of the main
advantages of GMM is that it controls for endogeneity in the model.
We run models using several specifications. First, we fit an OLS model with lags of the
dependent variable as explanatory variables. Arellano and Bond (1991) indicated that with
the lagged dependent variable included in the set of explanatory variables, the least squares
estimator becomes biased for small values of T. We try alternative specifications of the FE
model. We also use the one-step GMM developed by Arellano and Bond (1991) in model.

157
Since the panel data cover many heterogeneous bank and time period, the possible correlation
between the regressors and bank specific effect, the endogeneity of regressors with respect to
idiosyncratic shock and the heteroscedasticity of the disturbance term (idiosyncratic shock)
would result in a biased and inconsistent estimation with the OLS estimation technique.
6.7.2 Diagnostic Test
This section explains the diagnostic test performed on the data employed in this thesis. First,
the diagnostic tests on the data distribution in terms of normality, extreme outliers and
multicollinearity are discussed. Secondly, diagnostic tests specifically for the panel data are
presented, namely heteroskedasticity and autocorrelation.
6.7.2.1 Normality
Normality shows the shape of the distribution of data of individual quantitative data variables
and its correspondence to the normal distribution. Multivariate analysis is based on the
assumption that large deviations from normality will lead to biased statistical results (Hair,
Black et al. 2006). It is an assumption in multivariate analysis that the residual, which is the
difference between the observed and predicated value, is to be independent and normally
distributed. It is unnecessary to check normality of individual variables if the residual is
normally distributed (Tabachnick and Fidell 2007).
Normality can be tested with skewness and kurtosis which is a common statistical test.
Skewness reflects the balance of the distribution. Skewness of non-normal distributed
variables shifts to one side, either left or right. Kurtosis refers to “peakedness” or “flatness”
of the distribution compared to the normal distribution. Significant values of skewness or
kurtosis reflect that the analysis does not deviate from normality.
6.7.2.2 Outliers
Transformation is one of the choices to minimize normality problems cause by the outliers.
However, some authors do not support this choice. Grissom (2000) argued that the means of
transformed data can sometimes inverse the difference of means of the original data.
Tabachnick and Fidell (2007) do not recommended data transformation, although there is a
possibility of minimization of outliers and failures of normality. This thesis detected some
multivariate outliers. Extreme points were deleted from the data set. Upon deletion of the

158
outliers, the initial sample of 29 banks observed from 2001 to 2011 (207 bank-year
observations) was reduced to 168 bank-year observations.
6.7.2.3 Multicollinearity
According to Tabachnick and Fidell (2007) and Hair et al. (2006), correlation values more
than 0.9 indicate a multicollinearity problem between independent variables. The Pearson
correlation shown in the correlation matrix table in chapters 7 and 8 indicates that the
correlation among independent variables is less than 0.90 which shows no multicollinearity
problem between independent variables.
Hamilton (2009) suggested that the matrix of correlations between variables cannot
necessarily detect multicollinearity so the Variance Inflation Factor (VIF) is preferred to
check this issue. VIF is an indicator of the effect that the other independent variables have on
the standard errors of a regression coefficient. A VIF which exceeds 10 suggests collinearity
problems. The VIF test ran on the independent variables used in this thesis showed that the
highest VIF was 9.172 for inflation. The above correlation and VIF values suggest that there
is no multicollinearity problem between the independent variables; hence these variables can
be fitted into one regression model.
6.7.2.4 Heteroskedasticity
Homoskedasticity exists in such situations where the error process is independently and
identically distributed and its variance may differ across units (Baum 2001). Baltagi (2008)
stated that every unit has its own individual characteristics or heterogeneity which remains
constant overtime, so assuming homoskedasticity in regression disturbance of panel data is a
restrictive assumption.
Baltagi (2008) further indicated that overlooking the existence of heteroskedasticity made a
consistent but inefficient estimate of the regression coefficients, and the standard errors of
these estimates would be biased. To solve this problem, system GMM estimators are used
which is suitable for situations with independent variables that are not strictly exogenous,
fixed individual effects, heteroskedasticity (Roodman 2006).

159
6.7.2.5 Autocorrelation
Autocorrelation, also known as serial correlation, refers to the correlation of error
components across time periods. This condition violates the classical assumption of
regression analysis but it is a reasonable characteristic of error terms in time-series analysis
(Wooldridge 2003). Autocorrelation is likely to have more substantial influences on the
estimated covariance matrix of the least squares estimator than is heteroskedasticity (Greene
2008). To solve this problem, as for the heteroskedasiticy problem, GMM estimators are
used.
6.8 Summary
This chapter discussed the research method employed in this thesis. In order to meet the
objectives of this thesis, macro-economic, bank specific and corporate governance data were
obtained from different sources i.e. World Bank, annual reports of individual banks, and
various publications of the Central Bank of Nepal. NPL and performance have been chosen
as dependent variables. The attributes of performance in this thesis were ROA and Tobin’s Q.
In respect of independent variables, macro-economic variables, bank specific and corporate
governance variables were used. The attributes of macro-economic variables examined in this
thesis were gross domestic growth, inflation, broad money supply growth, foreign exchange,
share prices index growth, indebtedness and market interest rates. In the case of bank specific
variables, this thesis has used non-performing one year lag, loan growth, branch growth, loan
loss provision, size, earnings, capital, and interest rate spread. In respect of corporate
governance variables, the attributes of the board of directors examined in this thesis were
covering board size, board independence and board diligence. Three attributes of the audit
committee explored in this thesis were audit committee size, independence, and diligence.
Another three variables, foreign ownership, institutional ownership, and CEO remuneration
were also used as corporate governance variables.
This thesis used first, OLS and then, considered the panel data method i.e. FE, RE, and
GMM. Diagnostic tests on the data in respect to normality, outliers and multicollinearity were
run. Additionally, diagnostic tests specifically on panel data were carried out to determine an
appropriate panel regression model that will produce robust standard errors.
160
CHAPTER SEVEN
Results and Discussion
7.1 Introduction
This chapter discusses the empirical results and seeks to achieve three main objectives of this
study. The main findings of macro-economic and bank specific determinants of NPL are
discussed. In the second stage, this chapter also discusses the findings of the influence of
corporate governance on bank NPL and bank performance. In this regard, this chapter first
presents the OLS results. In a further step, the chapter presents the RE regression results. RE
are chosen on the basis of the Haussmann test. To examine the relationship of independent
variables on NPL, this chapter discusses the results on the basis of the RE which is used to
check the influence of independent variables on bank performance which this chapter has
discussed. This chapter has also presented the GMM result which is just compared with other
results derived from OLS and RE.
The rest of the section is as follows: Section 7.2 presents the descriptive and correlation
results. Section 7.3 presents the regression results and discussion of macro-economic, bank
specific and corporate governance determinants of NPL. Section 7.4 summarizes the overall
findings and discussion of this study.
7.2 Descriptive and Correlation Results of Bank Specific and Macro-economic
Variables
Table 7.1 presents the descriptive statistics of the dependent and independent variables
(macro-economic and bank specific). The mean value of NPL and NPL one year lag is 4.2
percent and 4.8 percent respectively which range from 0 percent to 40.1 percent. The
maximum NPL is 40.1 percent which is for the Nepal Bangladesh Bank Limited which has
remained under NRB control since 2006 to 2009 while the bank was in financial trouble as a
result of mismanagement at the hands of its key promoter (Dhungana 2008). The mean value
of loan loss provision is 4.9 percent which is almost the same as NPL. The maximum loan
loss provision is 38.2 percent which is the same for the problematic bank Nepal Credit and
Commerce Bank Limited which reported a very high NPL i.e. 40 percent in 2002. The mean
value of loan growth is 26.3 percent which is widely ranged from -59.7 percent to 180
161
percent. The maximum loan growth is almost five times the mean value as a result of
increases in loans of some banks following the year of establishment. The mean value of
capital ratio is 9.5 percent. This result is consistent with the commitment of Nepalese banks
to Basel I Accord for the capital adequacy ratio, which requires banks to have a minimum
capital adequacy ratio by 8 percent. The mean value of earnings before interest and tax to
total assets is 1.9 percent, which is ranged from -8.6 percent to 9.0 percent. The negative
highest value of earnings before tax to total assets is only due to some problematic banks
such as Nepal Bangladesh Bank Limited, Nepal Credit Commerce Bank Limited and
Lumbini Bank Limited in the observation years. The growth of bank branches is a maximum
of 250 percent which is reported with a minimum of 57 percent. The result shows that banks
in Nepal followed the expansionary policy during the study period. The mean value of total
assets is NPR 16780.34 (USD 234.16) million whereas the minimum and maximum is
NPR.384.30 (USD 5.36) and NPR.59322.20 (USD 827.82) million respectively. The
minimum value of total assets is very low due to the first year of establishment of some
banks. The mean value of interest rate spread is 3.8 percent which is ranged from 1.8 percent
to 6.5 percent. The results show that due to high growth of banks and competition after 2007,
the banks are following a much lower interest rate spread.
The mean value of revenue growth is 23.9 percent which is ranged from a minimum -22.5
percent to a maximum 139.5 percent. The negative revenue growth is present in the
observation year due to some banks being declared problematic. The maximum value of
credit to deposit ratio of banks during the observation year is 160 percent whereas the
minimum value is 31.6 percent with a mean value of 80.4 percent. The minimum value of
this ratio is less than 50 percent due to some banks following just a deposit collection strategy
in the establishment year rather than to extend credit. The mean value of the age of banks is
9.30 years which indicates that the development of the banking industry is not very long.
The mean GDP growth over 11 years is 4.1 percent, with the highest growth in 2008 of 6.1
percent and the lowest growth of 0.1 percent in 2002. The high performance during the year
2008 was a result of expansion in the agriculture sector. The mean of inflation measured by
the consumer price index is 7.7 percent, which is recorded highest at 11.6 percent in 2009.
The inflation rate in 2009 soared up to a record high in 2009 for 11 years. The pressure on
food prices continued to rise despite a sharp decline of international commodity prices. The
decline in agriculture products, poor distribution and supply channels, transport syndication,

162
increases in salary and wage rates created pressures in the overall price levels in Nepal. All
these factors have posed challenges to the banks to achieve primary objectives of maintaining
price stability. Broad money supply reflects the domestic liquidity in the economy. The mean
growth of broad money supply is 18.1 percent which recorded a minimum 2.7 percent in
2002 and a maximum 38.8 percent in 2008. The highest money supply growth in 2008 was
due to the effect of domestic credit expansion on net foreign assets. The mean value of
foreign exchange fluctuation is -0.3 percent. The depreciation of the Nepalese currency
against the US dollar of -14 percent is highest in 2009. The pegged exchange rate system of
the Nepalese currency with the Indian currency was responsible for the depreciation of the
Nepalese currency against the US dollar. The minimum decline in share prices index is -36.2
percent in 2010. The Nepalese economy is facing a decline in the NEPSE index from 2008
which can be attributed to a weakening of investor confidence, increasing investment is real
estate, increase in supply of shares through the issuance of rights and bonus shares to meet
the specific levels of paid up capital, tightening in margin lending, and the decreasing
possibility of capital gain. The maximum market interest rate is 8.2 percent which is recorded
in 2011 as a result of liquidity contraction in the country, which was 0.7 percent in 2004.

163
Table 7.1: Descriptive Statistics of Macro-economic and Bank Specific Variables
NPL= Non-performing loan, NPLt-1= Lag non-performing loan, LLP= Loan loss provision, LG= Loan growth, ECTA= Equity capital to total assets, EBIT = Earnings before interest & tax to total assets, BG= Branch growth, TA= Total assets in NPR, IRS= Interest rate spread, RG= Revenue growth, CDR= Credit deposit ratio, BA= Bank age, GDP_G= GDP growth, GDP_Gt-1= lag GDP growth, CPI= Inflation rate, CPIt-1= lag inflation rate, M2= Broad money supply growth, EXCG= Exchange rate, SPI_G= Share prices index - growth, MIR= Market interest rate. Table 7.2 presents the descriptive statistics of governance variables. The average board size
was found in this thesis to be seven directors. As per the Bank and Financial Act (BAFIA)
2006, every bank or financial institution shall have a board of directors which shall consist of
not less than five and not more than nine directors. The results show that minimum board size
is four in the observation period which is for the Nepal Bangladesh Bank Limited. The
central bank had taken over the management of this bank from 2006 to 2009 and established
the board with four members to handle the management. The mean value of board
independence indicated that banks had complied with recommendations of the BAFIA 2006
to have at least one director who should be appointed to the bank board from the professional
list issued by Central bank of Nepal. The mean value of board independence of 12.5 percent,
however, indicated that 87.5 percent of the board composition in Nepalese banks was
dominated by the insiders. The minimum value of board independence is 0 percent which
shows that Nepalese commercial banks started to follow the corporate governance and
involvement of professional directors on boards after 2006 when the Central bank of Nepal
Variables Observation Mean Median Minimum Maximum Skewness Kurtosis
NPL 207 0.042 0.016 0.000 0.401 2.666 8.797 NPLt-1 188 0.048 0.021 0.000 0.401 2.325 6.688 LLP 204 0.049 0.028 0.010 0.382 2.822 9.072 LG 203 0.263 0.193 -0.597 1.800 1.744 4.792 ECTA 204 0.095 0.082 -0.170 0.429 1.433 6.967 EBIT 205 0.019 0.018 -0.086 0.090 -0.378 6.032 BG 200 0.253 0.106 -0.571 2.500 2.646 9.135 TA 207 16780.34 13035.80 384.30 59322.20 1.298 1.119 IRS 207 0.038 0.038 0.018 0.065 0.543 0.773 RG 179 0.246 0.207 -0.225 1.574 1.549 4.647 CDR 207 0.804 0.806 0.316 1.606 0.208 2.560 BA 207 9.333 8.000 0.000 27.000 0.541 -0.603 GDP_G 207 0.041 0.039 0.001 0.061 -1.367 2.913 GDP_Gt-1 207 0.042 0.045 0.001 0.062 -1.203 1.957 CPI 207 0.077 0.076 0.027 0.116 -0.406 -1.199 CPIt-1 207 0.071 0.068 0.025 0.116 -0.064 -1.432 M2 207 0.181 0.170 0.027 0.388 0.773 -0.180 EXCG 207 -0.003 0.010 -0.140 0.120 -0.336 -0.720 SPI_G 207 0.030 -0.100 -0.362 0.760 0.660 -0.750 MIR 207 0.044 0.037 0.007 0.082 0.422 0.444
164
issued NRB directives No.6 The average board meeting is twenty times per year indicating
that banks had complied with the recommendation of BAFIA to hold board meetings at least
12 times in a year.
The average audit committee size and independence indicated that the bank has established
audit committees chaired by a non-executive director as per the recommendation of the NRB
Act 2002 (first amendment in 2006) and BAFIA 2006. The average number of audit
committee meetings held per year was four times. The statistics showed that the majority of
Nepalese banks have active members in the audit committee. The minimum zero value of
board and audit committee independence, meeting and audit committee size indicated that
some banks have not complied with the recommendation of BAFIA 2006 and the Company
Act. Examination on a yearly basis revealed that the minimum value of board and audit
committee independence occurred from 2005-2007, which were the transition periods before
banks fully complied with the code of corporate governance which was implemented in 2005
(now known as Unified Directives). Similarly, zero value of audit committee size and
meetings is from the Nepal Bangladesh Bank Limited which was declared as chronic. The
central bank took over the management from 2006 to 2009 (Dhungana 2008). The mean
value of institutional ownership indicated that the bank is not highly concentrated on
institutional ownership. The zero minimum value of institutional ownership indicated that
some banks in the observation period have concentrated into general public ownership. The
mean value of foreign ownership is 11.6 percent, indicating that Nepalese banks have
concentrated institutional ownership compared to foreign ownership. There is a zero
minimum value of foreign ownership. As a result of this, there are only seven foreign
ownership banks operating in Nepal. The average CEO remuneration is NPR.1.82 (USD 003)
million per year which ranged from a minimum NPR.1.40 (USD 0.02) million to a maximum
NPR.23.30 (USD 0.33) million.
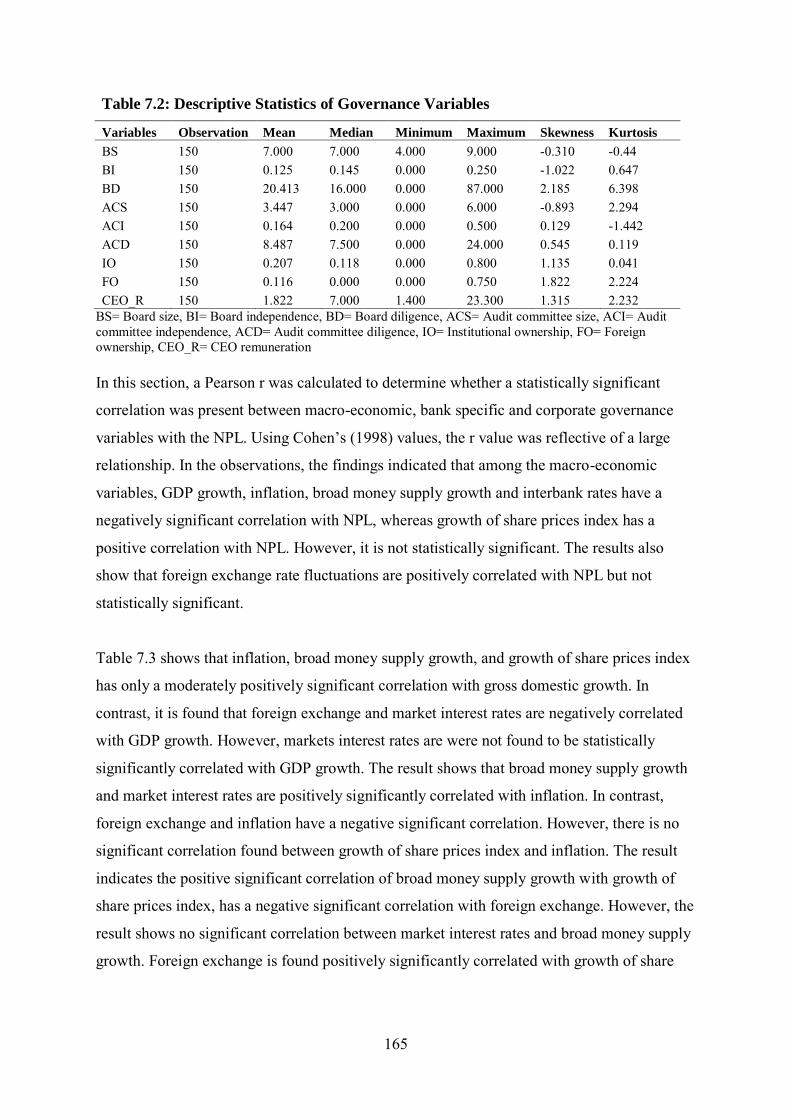
165
Table 7.2: Descriptive Statistics of Governance Variables
Variables Observation Mean Median Minimum Maximum Skewness Kurtosis
BS 150 7.000 7.000 4.000 9.000 -0.310 -0.44 BI 150 0.125 0.145 0.000 0.250 -1.022 0.647 BD 150 20.413 16.000 0.000 87.000 2.185 6.398 ACS 150 3.447 3.000 0.000 6.000 -0.893 2.294 ACI 150 0.164 0.200 0.000 0.500 0.129 -1.442 ACD 150 8.487 7.500 0.000 24.000 0.545 0.119 IO 150 0.207 0.118 0.000 0.800 1.135 0.041 FO 150 0.116 0.000 0.000 0.750 1.822 2.224 CEO_R 150 1.822 7.000 1.400 23.300 1.315 2.232
BS= Board size, BI= Board independence, BD= Board diligence, ACS= Audit committee size, ACI= Audit committee independence, ACD= Audit committee diligence, IO= Institutional ownership, FO= Foreign ownership, CEO_R= CEO remuneration
In this section, a Pearson r was calculated to determine whether a statistically significant
correlation was present between macro-economic, bank specific and corporate governance
variables with the NPL. Using Cohen’s (1998) values, the r value was reflective of a large
relationship. In the observations, the findings indicated that among the macro-economic
variables, GDP growth, inflation, broad money supply growth and interbank rates have a
negatively significant correlation with NPL, whereas growth of share prices index has a
positive correlation with NPL. However, it is not statistically significant. The results also
show that foreign exchange rate fluctuations are positively correlated with NPL but not
statistically significant.
Table 7.3 shows that inflation, broad money supply growth, and growth of share prices index
has only a moderately positively significant correlation with gross domestic growth. In
contrast, it is found that foreign exchange and market interest rates are negatively correlated
with GDP growth. However, markets interest rates are were not found to be statistically
significantly correlated with GDP growth. The result shows that broad money supply growth
and market interest rates are positively significantly correlated with inflation. In contrast,
foreign exchange and inflation have a negative significant correlation. However, there is no
significant correlation found between growth of share prices index and inflation. The result
indicates the positive significant correlation of broad money supply growth with growth of
share prices index, has a negative significant correlation with foreign exchange. However, the
result shows no significant correlation between market interest rates and broad money supply
growth. Foreign exchange is found positively significantly correlated with growth of share
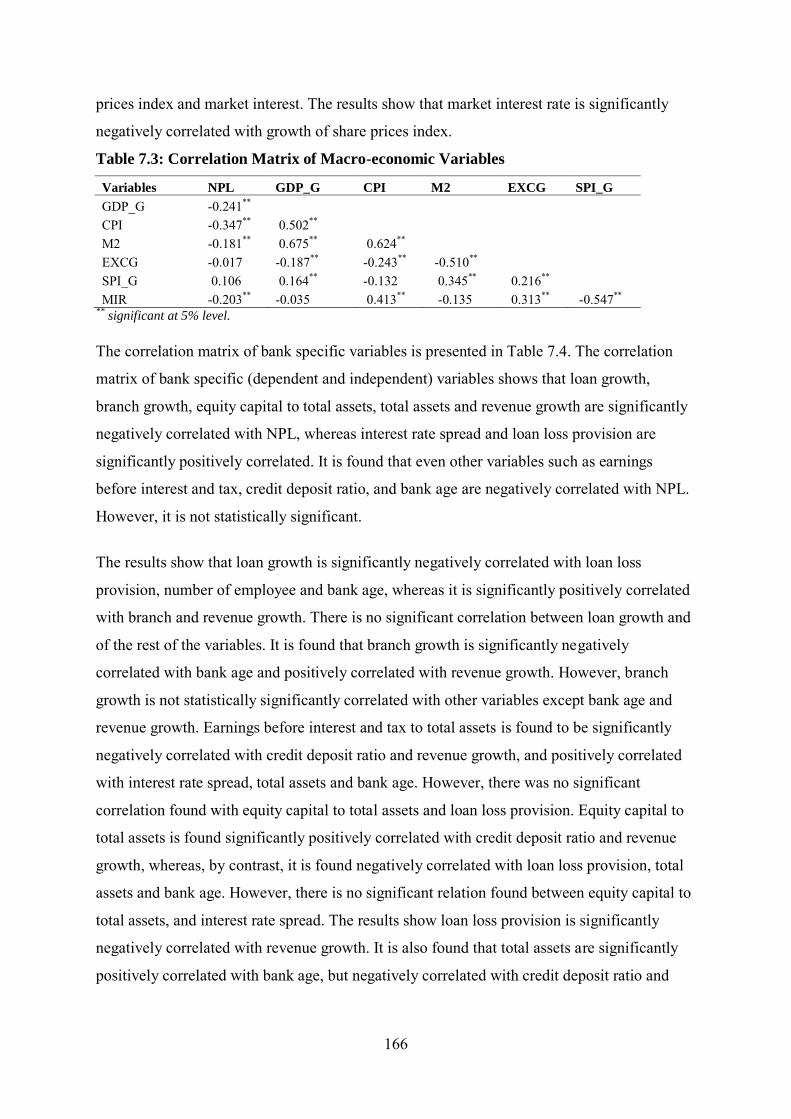
166
prices index and market interest. The results show that market interest rate is significantly
negatively correlated with growth of share prices index.
Table 7.3: Correlation Matrix of Macro-economic Variables
Variables NPL GDP_G CPI M2 EXCG SPI_G
GDP_G -0.241** CPI -0.347** 0.502**
M2 -0.181** 0.675** 0.624** EXCG -0.017 -0.187** -0.243** -0.510**
SPI_G 0.106 0.164** -0.132 0.345** 0.216** MIR -0.203** -0.035 0.413** -0.135 0.313** -0.547**
** significant at 5% level.
The correlation matrix of bank specific variables is presented in Table 7.4. The correlation
matrix of bank specific (dependent and independent) variables shows that loan growth,
branch growth, equity capital to total assets, total assets and revenue growth are significantly
negatively correlated with NPL, whereas interest rate spread and loan loss provision are
significantly positively correlated. It is found that even other variables such as earnings
before interest and tax, credit deposit ratio, and bank age are negatively correlated with NPL.
However, it is not statistically significant.
The results show that loan growth is significantly negatively correlated with loan loss
provision, number of employee and bank age, whereas it is significantly positively correlated
with branch and revenue growth. There is no significant correlation between loan growth and
of the rest of the variables. It is found that branch growth is significantly negatively
correlated with bank age and positively correlated with revenue growth. However, branch
growth is not statistically significantly correlated with other variables except bank age and
revenue growth. Earnings before interest and tax to total assets is found to be significantly
negatively correlated with credit deposit ratio and revenue growth, and positively correlated
with interest rate spread, total assets and bank age. However, there was no significant
correlation found with equity capital to total assets and loan loss provision. Equity capital to
total assets is found significantly positively correlated with credit deposit ratio and revenue
growth, whereas, by contrast, it is found negatively correlated with loan loss provision, total
assets and bank age. However, there is no significant relation found between equity capital to
total assets, and interest rate spread. The results show loan loss provision is significantly
negatively correlated with revenue growth. It is also found that total assets are significantly
positively correlated with bank age, but negatively correlated with credit deposit ratio and
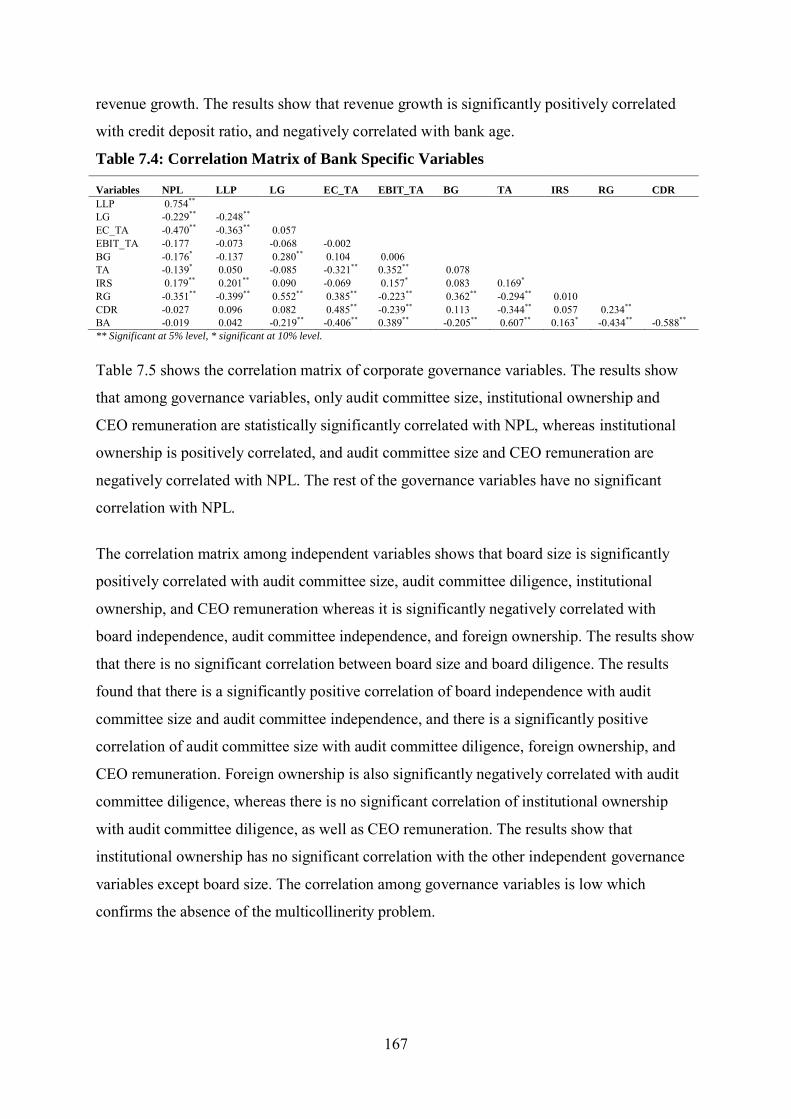
167
revenue growth. The results show that revenue growth is significantly positively correlated
with credit deposit ratio, and negatively correlated with bank age.
Table 7.4: Correlation Matrix of Bank Specific Variables
Variables NPL LLP LG EC_TA EBIT_TA BG TA IRS RG CDR
LLP 0.754**
LG -0.229** -0.248**
EC_TA -0.470** -0.363** 0.057
EBIT_TA -0.177 -0.073 -0.068 -0.002
BG -0.176* -0.137 0.280** 0.104 0.006
TA -0.139* 0.050 -0.085 -0.321** 0.352** 0.078
IRS 0.179** 0.201** 0.090 -0.069 0.157* 0.083 0.169*
RG -0.351** -0.399** 0.552** 0.385** -0.223** 0.362** -0.294** 0.010
CDR -0.027 0.096 0.082 0.485** -0.239** 0.113 -0.344** 0.057 0.234**
BA -0.019 0.042 -0.219** -0.406** 0.389** -0.205** 0.607** 0.163* -0.434** -0.588** ** Significant at 5% level, * significant at 10% level.
Table 7.5 shows the correlation matrix of corporate governance variables. The results show
that among governance variables, only audit committee size, institutional ownership and
CEO remuneration are statistically significantly correlated with NPL, whereas institutional
ownership is positively correlated, and audit committee size and CEO remuneration are
negatively correlated with NPL. The rest of the governance variables have no significant
correlation with NPL.
The correlation matrix among independent variables shows that board size is significantly
positively correlated with audit committee size, audit committee diligence, institutional
ownership, and CEO remuneration whereas it is significantly negatively correlated with
board independence, audit committee independence, and foreign ownership. The results show
that there is no significant correlation between board size and board diligence. The results
found that there is a significantly positive correlation of board independence with audit
committee size and audit committee independence, and there is a significantly positive
correlation of audit committee size with audit committee diligence, foreign ownership, and
CEO remuneration. Foreign ownership is also significantly negatively correlated with audit
committee diligence, whereas there is no significant correlation of institutional ownership
with audit committee diligence, as well as CEO remuneration. The results show that
institutional ownership has no significant correlation with the other independent governance
variables except board size. The correlation among governance variables is low which
confirms the absence of the multicollinerity problem.
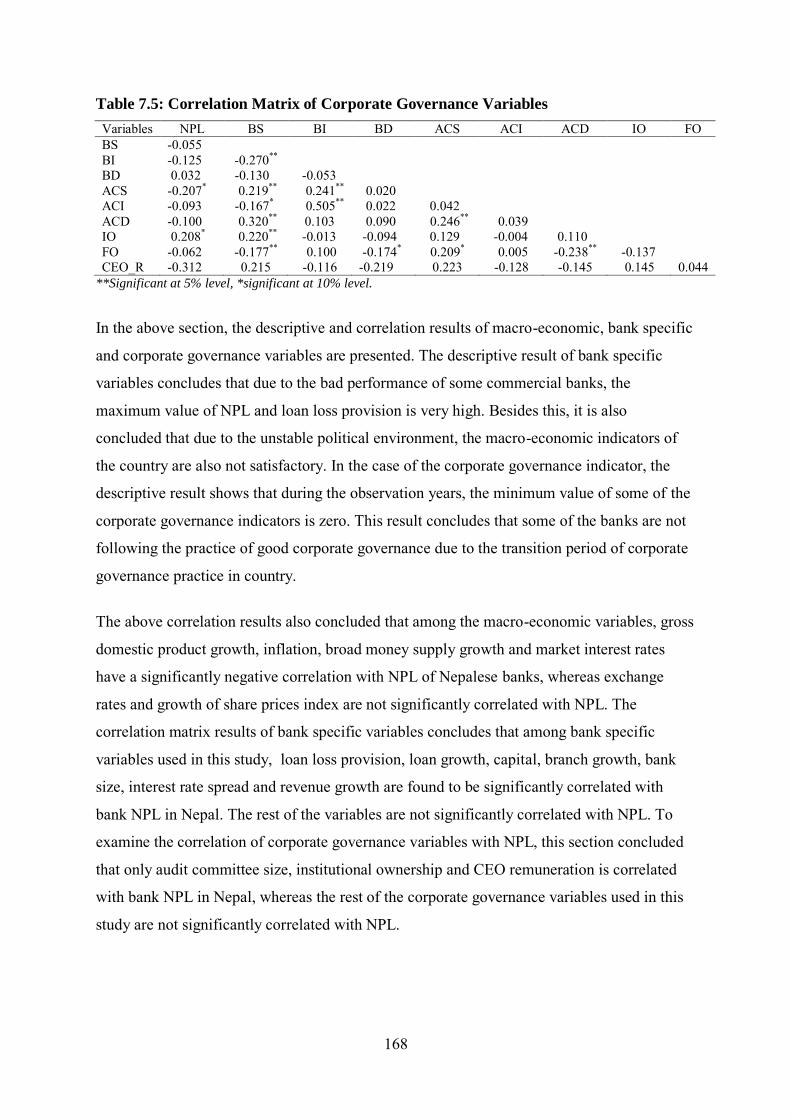
168
Table 7.5: Correlation Matrix of Corporate Governance Variables
Variables NPL BS BI BD ACS ACI ACD IO FO BS -0.055
BI -0.125 -0.270** BD 0.032 -0.130 -0.053
ACS -0.207* 0.219** 0.241** 0.020 ACI -0.093 -0.167* 0.505** 0.022 0.042
ACD -0.100 0.320** 0.103 0.090 0.246** 0.039 IO 0.208* 0.220** -0.013 -0.094 0.129 -0.004 0.110
FO -0.062 -0.177** 0.100 -0.174* 0.209* 0.005 -0.238** -0.137 CEO_R -0.312 0.215 -0.116 -0.219 0.223 -0.128 -0.145 0.145 0.044
**Significant at 5% level, *significant at 10% level.
In the above section, the descriptive and correlation results of macro-economic, bank specific
and corporate governance variables are presented. The descriptive result of bank specific
variables concludes that due to the bad performance of some commercial banks, the
maximum value of NPL and loan loss provision is very high. Besides this, it is also
concluded that due to the unstable political environment, the macro-economic indicators of
the country are also not satisfactory. In the case of the corporate governance indicator, the
descriptive result shows that during the observation years, the minimum value of some of the
corporate governance indicators is zero. This result concludes that some of the banks are not
following the practice of good corporate governance due to the transition period of corporate
governance practice in country.
The above correlation results also concluded that among the macro-economic variables, gross
domestic product growth, inflation, broad money supply growth and market interest rates
have a significantly negative correlation with NPL of Nepalese banks, whereas exchange
rates and growth of share prices index are not significantly correlated with NPL. The
correlation matrix results of bank specific variables concludes that among bank specific
variables used in this study, loan loss provision, loan growth, capital, branch growth, bank
size, interest rate spread and revenue growth are found to be significantly correlated with
bank NPL in Nepal. The rest of the variables are not significantly correlated with NPL. To
examine the correlation of corporate governance variables with NPL, this section concluded
that only audit committee size, institutional ownership and CEO remuneration is correlated
with bank NPL in Nepal, whereas the rest of the corporate governance variables used in this
study are not significantly correlated with NPL.
169
7.3 Regression Results and Discussion
This thesis started the empirical analysis emphasizing the impact of macro-economic and
bank specific determinants of NPL. This study, first checks the influence of macro-economic
conditions on bank NPL. Considering that although all banks in a country face the same
macro-economic conditions, generally not all of them fail. Sometimes the structural
characteristics of the banking sector and of the economic environment also play a role
(Demirguc-Kunt and Huizinga 1998).
Secondly, in the next step, this study also examined the relationship of bank specific variables
and NPL, which is the approach also followed by Salas and Saurina (2002) and Das and
Ghosh (2007) in their study. In the third stage, this study considered the impact of corporate
governance variables on NPL and bank performance. Despite the problems mentioned
regarding the traditional panel data estimators in a dynamic framework, this thesis presents
firstly, the results from the Ordinary Least Square (OLS), then presents the results from the
Random Effect (RE). The support for the RE model is obtained from the Hausman test. The
Hausman test shows the Chi Square of 25.67 with the p value of 0.177 for NPL. Given this,
the results and discussion are focused on the outcome provided by the RE model. The
General Moment Method (GMM) is considered to account for the endogeneity and the
simultaneity issue.
7.3.1 Results and Discussion of Determinants of NPL
This section first presents the OLS, RE and GMM results of macro-economic determinants of
NPL in Nepalese banks. In the next stage, this section presents the results of bank specific
determinants of NPL. In the third stage, the results of the combined effect of macro-
economic and bank specific variables on bank NPL is presented. From the objectives of this
study, this thesis also presents in this section the influence of corporate governance on bank
NPL. After the presentation of results, this section also discusses and compares the results of
determinants of NPL in Nepalese banking and the influence of corporate governance on bank
NPL in Nepalese banking. The discussion of results is mainly based on results derived from
the RE model and OLS; GMM is discussed for comparison of results with RE.
170
7.3.1.1 Results of Macro-economic Determinants of NPL
The following three separate models are estimated to examine the influence of macro-
economic variables on NPL. In the first model, macro-economic variables of GDP growth,
inflation, broad money supply growth, exchange rates, growth of the share prices index and
market interest rates are included. In the next step, GDP growth and inflation are replaced by
lag of GDP growth and inflation in model 2. The third model is expanded with lag of GDP
growth and inflation. The same models are employed in OLS, RE and GMM. The first results
pertaining to OLS analyses are presented below:
NPL = β0+β1GDP_G+ β2CPI+ β3M2+ β4 EXCG+ β5SPI_G+ β6MIR + eit (1)
NPL = β0+β1GDP_Gt-1+β2CPIt-1+ β3M2+ β4 EXCG+ β5SPI_G+ β6MIR + eit (2)
NPL = β0+ β1GDP_G+ β2GDP_Gt-1 + β3CPI+ β4CPIt-1 + β5M2+ β6 EXCG+
Β7SPI_G+ β8MIR + eit (3
Where NPL= Non-performing loan, GDP_G= GDP growth, GDP_Gt-1= lag GDP growth,
CPI= Inflation rate, CPIt-1= lag inflation rate, M2= Broad money supply growth, EXCG=
Exchange rate, SPI_G= Share prices index - growth, MIR= Market interest rate.
The OLS result in Table 7.6 shows that among all macro-economic variables, inflation, broad
money supply growth, exchange rates, growth of share prices index, and market interest rates
have a significant influence on NPL. The rest of the variables have no significant influence.
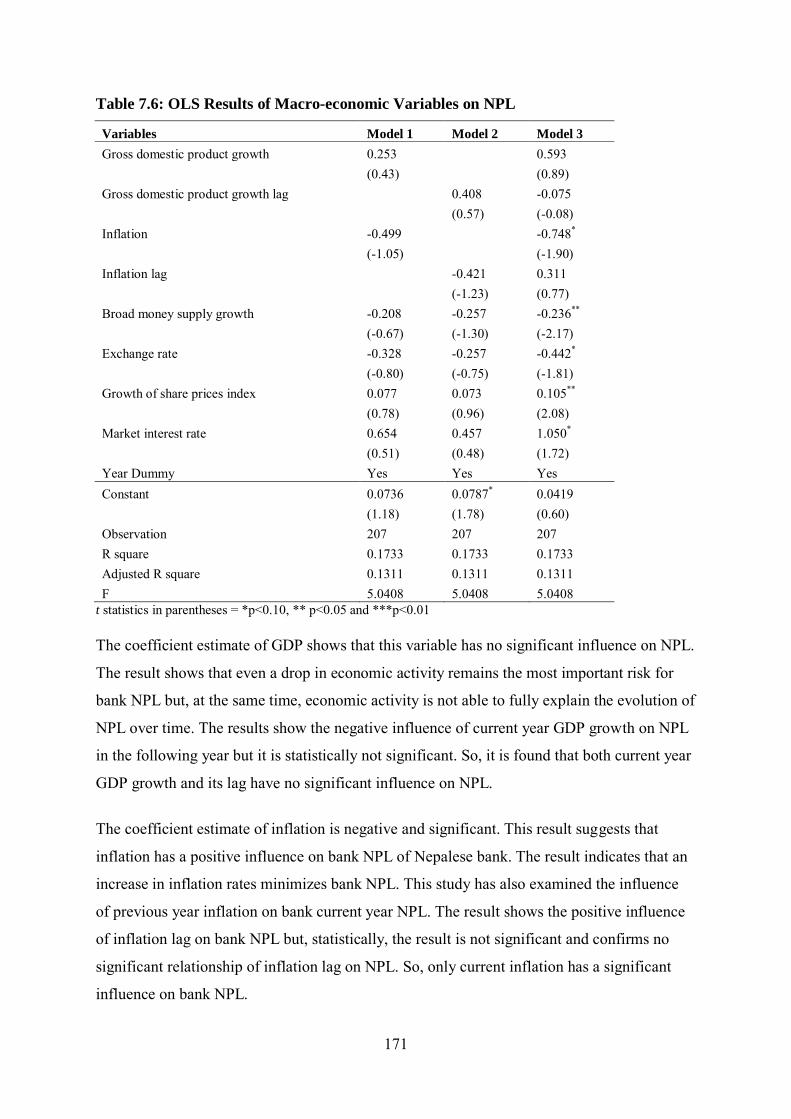
171
Table 7.6: OLS Results of Macro-economic Variables on NPL
Variables Model 1 Model 2 Model 3
Gross domestic product growth 0.253
0.593
(0.43)
(0.89)
Gross domestic product growth lag
0.408 -0.075
(0.57) (-0.08)
Inflation -0.499
-0.748*
(-1.05)
(-1.90)
Inflation lag
-0.421 0.311
(-1.23) (0.77)
Broad money supply growth -0.208 -0.257 -0.236**
(-0.67) (-1.30) (-2.17)
Exchange rate -0.328 -0.257 -0.442*
(-0.80) (-0.75) (-1.81)
Growth of share prices index 0.077 0.073 0.105**
(0.78) (0.96) (2.08)
Market interest rate 0.654 0.457 1.050*
(0.51) (0.48) (1.72)
Year Dummy Yes Yes Yes Constant 0.0736 0.0787* 0.0419
(1.18) (1.78) (0.60)
Observation 207 207 207 R square 0.1733 0.1733 0.1733 Adjusted R square 0.1311 0.1311 0.1311 F 5.0408 5.0408 5.0408
t statistics in parentheses = *p<0.10, ** p<0.05 and ***p<0.01 The coefficient estimate of GDP shows that this variable has no significant influence on NPL.
The result shows that even a drop in economic activity remains the most important risk for
bank NPL but, at the same time, economic activity is not able to fully explain the evolution of
NPL over time. The results show the negative influence of current year GDP growth on NPL
in the following year but it is statistically not significant. So, it is found that both current year
GDP growth and its lag have no significant influence on NPL.
The coefficient estimate of inflation is negative and significant. This result suggests that
inflation has a positive influence on bank NPL of Nepalese bank. The result indicates that an
increase in inflation rates minimizes bank NPL. This study has also examined the influence
of previous year inflation on bank current year NPL. The result shows the positive influence
of inflation lag on bank NPL but, statistically, the result is not significant and confirms no
significant relationship of inflation lag on NPL. So, only current inflation has a significant
influence on bank NPL.

172
Broad money supply growth was found to be negatively related with NPL in model 1 and 2
but the result is not statistically significant. In model 3 when it is expanded with more
variables, it was found that broad money supply growth is significant and negatively related
with NPL. The result indicates that increases in broad money supply minimize the NPL.
Thus, the result suggests that the high growth of the money supply leads to a reduction in the
interest rate. As a result, borrowers will have cheap funds which contribute to an increase in
their ability to repay their financial obligation.
Foreign exchange was found to be negatively related with NPL in model 1 and 2 but the
result is not statistically significant. In model 3 when it is expanded with more variables, it
was found to be significant and negatively related with NPL. The result indicates that
depreciation in the domestic currency maximizes the NPL, and vice versa. The result
suggests that if the domestic currency depreciates, additional currency may require
purchasing the same quantity of foreign product than before. This situation demands more
credit facilities from banks to support additional expenses due to foreign fluctuations and a
reduction in firm profitability. If the firm expects to earn a higher expected profit than before,
then they face the problem of servicing interest and principal of the debt.
Growth of the share prices index was found to be positively related with NPL in model 1 and
2 but the result is not statistically significant in model 3 when it is expanded with more
variables, it is found that growth of share prices is significant and positively related with
NPL. The result indicates that improvement in the stock market index maximizes the NPL.
Thus, the results suggest that the growth of the share prices leads to default rates and does not
support the idea that a drop in share prices might lead to more default rates via wealth effects
and declines in the value of collateral.
The coefficient value of market interest rate is found to be positive in model 1 and 2 but the
result is found not statistically significant. In the overall model, it is found significant and
positively related with NPL. The result shows that increases in market interest rates lead to
the high NPL.
In summary, the OLS result shows that among the macro-economic variables, current year
inflation, broad money supply growth, exchange rate, growth of share price index and
market interest rate are the main significant factors influencing the NPL. Among the
significant variables, current year inflation, broad money supply, and exchange rates were
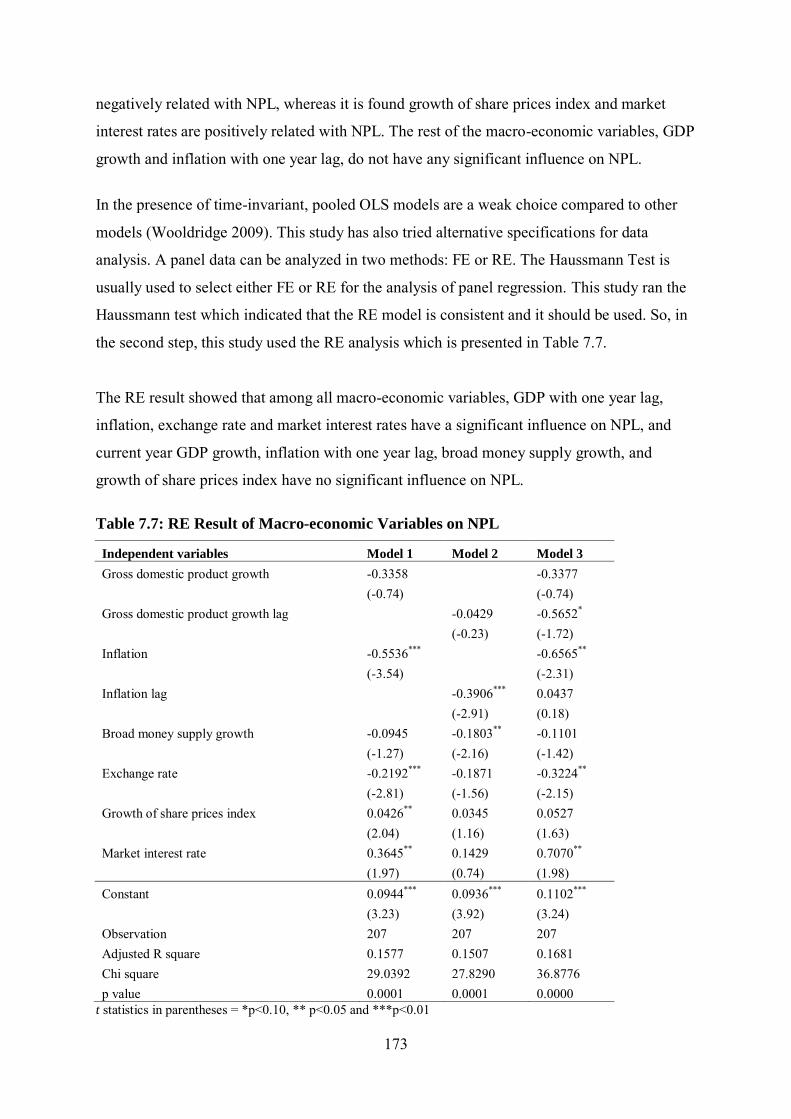
173
negatively related with NPL, whereas it is found growth of share prices index and market
interest rates are positively related with NPL. The rest of the macro-economic variables, GDP
growth and inflation with one year lag, do not have any significant influence on NPL.
In the presence of time-invariant, pooled OLS models are a weak choice compared to other
models (Wooldridge 2009). This study has also tried alternative specifications for data
analysis. A panel data can be analyzed in two methods: FE or RE. The Haussmann Test is
usually used to select either FE or RE for the analysis of panel regression. This study ran the
Haussmann test which indicated that the RE model is consistent and it should be used. So, in
the second step, this study used the RE analysis which is presented in Table 7.7.
The RE result showed that among all macro-economic variables, GDP with one year lag,
inflation, exchange rate and market interest rates have a significant influence on NPL, and
current year GDP growth, inflation with one year lag, broad money supply growth, and
growth of share prices index have no significant influence on NPL.
Table 7.7: RE Result of Macro-economic Variables on NPL
Independent variables Model 1 Model 2 Model 3
Gross domestic product growth -0.3358
-0.3377
(-0.74)
(-0.74)
Gross domestic product growth lag
-0.0429 -0.5652*
(-0.23) (-1.72)
Inflation -0.5536***
-0.6565**
(-3.54)
(-2.31)
Inflation lag
-0.3906*** 0.0437
(-2.91) (0.18)
Broad money supply growth -0.0945 -0.1803** -0.1101
(-1.27) (-2.16) (-1.42)
Exchange rate -0.2192*** -0.1871 -0.3224**
(-2.81) (-1.56) (-2.15)
Growth of share prices index 0.0426** 0.0345 0.0527
(2.04) (1.16) (1.63)
Market interest rate 0.3645** 0.1429 0.7070**
(1.97) (0.74) (1.98)
Constant 0.0944*** 0.0936*** 0.1102***
(3.23) (3.92) (3.24)
Observation 207 207 207 Adjusted R square 0.1577 0.1507 0.1681 Chi square 29.0392 27.8290 36.8776 p value 0.0001 0.0001 0.0000
t statistics in parentheses = *p<0.10, ** p<0.05 and ***p<0.01
174
The RE analysis also shows the same result as OLS in the case of inflation and its one year
lag, exchange rate and market interest rates. However, the result which is different from OLS
is explained as follows.
The negative coefficient estimate of current year gross domestic growth shows that NPL is
lower during good economic conditions and higher during economic recessions. But the
result is not statistically significant which confirms that current year GDP growth has no
significant influence on NPL. The result suggests that during good economic conditions,
banks may behave more risk-aversely by tightening credit policy which may not significantly
impact on default rates. The coefficient estimate of GDP growth with one year lag is
significant and negatively related to NPL. The results show that the current year GDP growth
influences negatively in the loan quality of banks in the following year.
The negative coefficient of broad money supply growth shows that it is negatively related to
NPL but the result is not statistically significant. So the result confirms that there is no
significant relationship between broad money supply growth and NPL. The result departed
from the suggestion that increasing the money supply decreases interest rates and increases
the opportunity of the public to have cheaper funds which increases the ability of borrowers
to pay back their obligations and contribute to decreasing banks’ exposure to NPL.
The coefficient value of growth of share prices index is positive and statistically significant in
model 1. But overall, the model does not show a significant influence of growth of share
prices index on NPL. This result is also not in line with suggestions that growth of the share
prices index increases the revenue of investors and increases their ability to pay debt. Due to
some difficulty in FE and/or RE, if the regressors are correlated with lagged dependent
variables, their coefficient may be biased. So for the robustness check, this study also
performed the regression model by GMM.
The GMM results in Table 7.8 show that among all macro-economic variables only inflation
with one year lag has no significant relationship with NPL which is consistent with the result
from OLS and RE. However, the result which is different than OLS and RE is explained as
follows. The GMM analysis only found different results to OLS and RE in the case of the
current year GDP growth. The coefficient estimate of GDP growth is significant and negative
at 0.001 accepted levels, which shows that GDP growth is inversely related to NPL. This
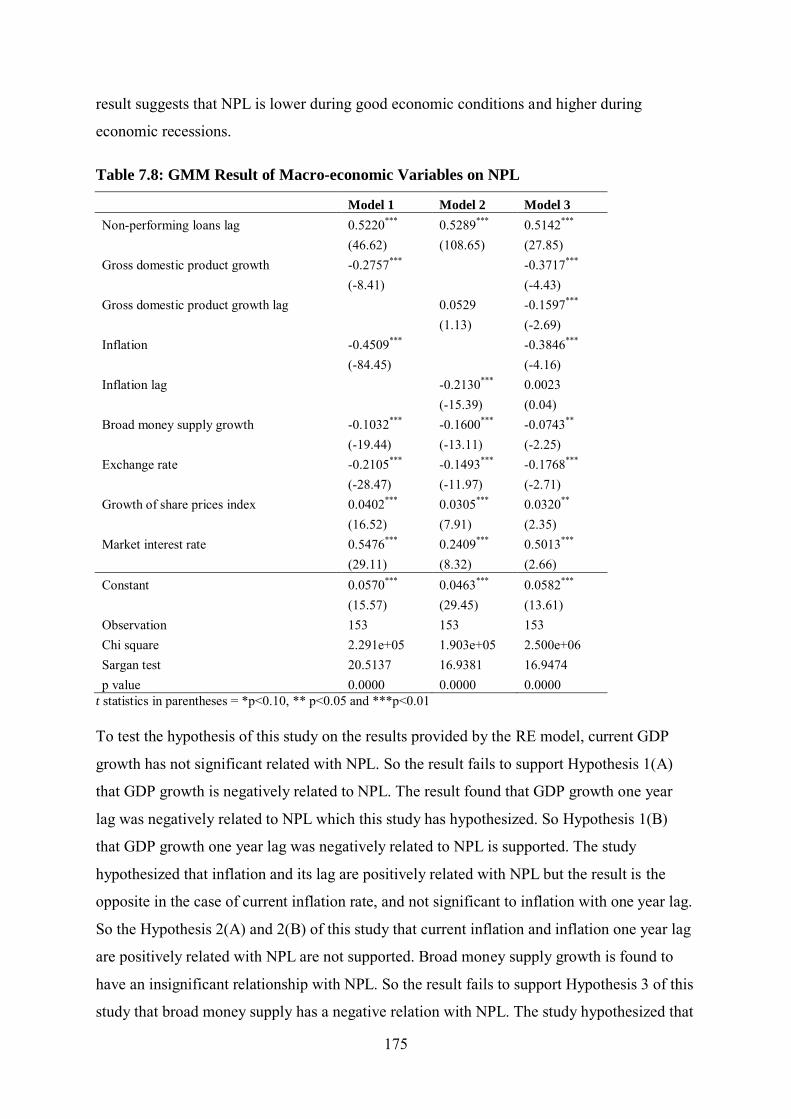
175
result suggests that NPL is lower during good economic conditions and higher during
economic recessions.
Table 7.8: GMM Result of Macro-economic Variables on NPL
Model 1 Model 2 Model 3
Non-performing loans lag 0.5220*** 0.5289*** 0.5142***
(46.62) (108.65) (27.85)
Gross domestic product growth -0.2757***
-0.3717***
(-8.41)
(-4.43)
Gross domestic product growth lag
0.0529 -0.1597***
(1.13) (-2.69)
Inflation -0.4509***
-0.3846***
(-84.45)
(-4.16)
Inflation lag
-0.2130*** 0.0023
(-15.39) (0.04)
Broad money supply growth -0.1032*** -0.1600*** -0.0743**
(-19.44) (-13.11) (-2.25)
Exchange rate -0.2105*** -0.1493*** -0.1768***
(-28.47) (-11.97) (-2.71)
Growth of share prices index 0.0402*** 0.0305*** 0.0320**
(16.52) (7.91) (2.35)
Market interest rate 0.5476*** 0.2409*** 0.5013***
(29.11) (8.32) (2.66)
Constant 0.0570*** 0.0463*** 0.0582***
(15.57) (29.45) (13.61)
Observation 153 153 153 Chi square 2.291e+05 1.903e+05 2.500e+06 Sargan test 20.5137 16.9381 16.9474 p value 0.0000 0.0000 0.0000
t statistics in parentheses = *p<0.10, ** p<0.05 and ***p<0.01 To test the hypothesis of this study on the results provided by the RE model, current GDP
growth has not significant related with NPL. So the result fails to support Hypothesis 1(A)
that GDP growth is negatively related to NPL. The result found that GDP growth one year
lag was negatively related to NPL which this study has hypothesized. So Hypothesis 1(B)
that GDP growth one year lag was negatively related to NPL is supported. The study
hypothesized that inflation and its lag are positively related with NPL but the result is the
opposite in the case of current inflation rate, and not significant to inflation with one year lag.
So the Hypothesis 2(A) and 2(B) of this study that current inflation and inflation one year lag
are positively related with NPL are not supported. Broad money supply growth is found to
have an insignificant relationship with NPL. So the result fails to support Hypothesis 3 of this
study that broad money supply has a negative relation with NPL. The study hypothesized that
176
foreign exchange is negatively related to NPL which is supported with the results of this
study. Growth of share prices index was found insignificantly related to NPL. So Hypothesis
5 of this study which is that growth of share prices index is negatively related with NPL is not
supported. The Hypothesis 6 is that market interest rate has a positive relationship with NPL
is supported with the results. The results found a significant and positive relationship between
market interest rate and NPL.
In Summary, as mention above, the result and discussion is focused on the outcome provided
by the RE model. Both OLS and GMM analysis have been presented for the comparison of
the result. In conclusion, the results show that among all macro-economic variables, GDP
growth with one year lag, inflation, market interest rate and exchange rate have a significant
influence on bank NPL in Nepal. The results found limited evidence in the case of broad
money supply growth and growth of share prices index as the OLS result found these
indicators a significant influence on NPL, but RE does not show a significant relationship.
The other macro-economic variables, GDP growth and inflation with one year lag have no
significant influence on bank NPL of Nepalese banks.
7.3.1.2 Discussion of Result of Macro-economic Determinants of NPL
The previous section described the results of macro-economic determinants of NPL derived
from OLS, RE and GMM. As per the objectives of this thesis to investigate the macro-
economic determinants of NPL in Nepalese banks, this section presents the discussion and
analysis of the result of macro-economic determinants of NPL in Nepalese commercial
banks.
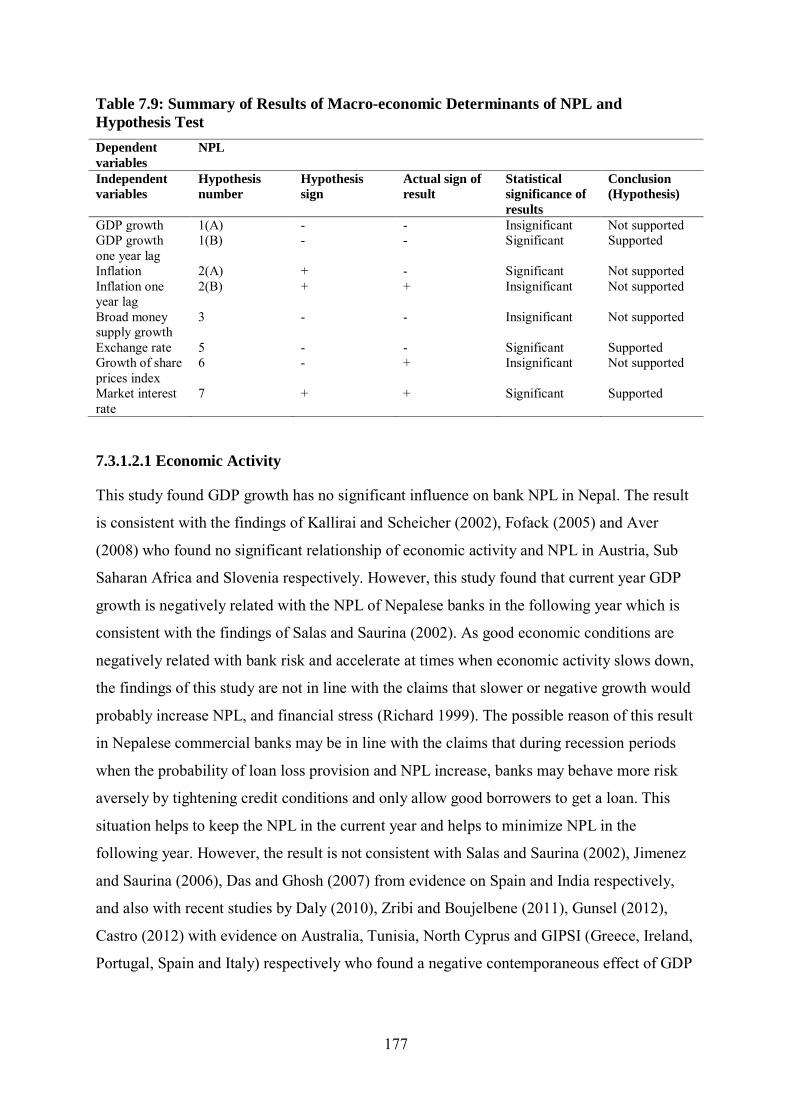
177
Table 7.9: Summary of Results of Macro-economic Determinants of NPL and
Hypothesis Test
Dependent
variables
NPL
Independent
variables
Hypothesis
number
Hypothesis
sign
Actual sign of
result
Statistical
significance of
results
Conclusion
(Hypothesis)
GDP growth 1(A) - - Insignificant Not supported GDP growth one year lag
1(B) - - Significant Supported
Inflation 2(A) + - Significant Not supported Inflation one year lag
2(B) + + Insignificant Not supported
Broad money supply growth
3 - - Insignificant Not supported
Exchange rate 5 - - Significant Supported Growth of share prices index
6 - + Insignificant Not supported
Market interest rate
7 + + Significant Supported
7.3.1.2.1 Economic Activity
This study found GDP growth has no significant influence on bank NPL in Nepal. The result
is consistent with the findings of Kallirai and Scheicher (2002), Fofack (2005) and Aver
(2008) who found no significant relationship of economic activity and NPL in Austria, Sub
Saharan Africa and Slovenia respectively. However, this study found that current year GDP
growth is negatively related with the NPL of Nepalese banks in the following year which is
consistent with the findings of Salas and Saurina (2002). As good economic conditions are
negatively related with bank risk and accelerate at times when economic activity slows down,
the findings of this study are not in line with the claims that slower or negative growth would
probably increase NPL, and financial stress (Richard 1999). The possible reason of this result
in Nepalese commercial banks may be in line with the claims that during recession periods
when the probability of loan loss provision and NPL increase, banks may behave more risk
aversely by tightening credit conditions and only allow good borrowers to get a loan. This
situation helps to keep the NPL in the current year and helps to minimize NPL in the
following year. However, the result is not consistent with Salas and Saurina (2002), Jimenez
and Saurina (2006), Das and Ghosh (2007) from evidence on Spain and India respectively,
and also with recent studies by Daly (2010), Zribi and Boujelbene (2011), Gunsel (2012),
Castro (2012) with evidence on Australia, Tunisia, North Cyprus and GIPSI (Greece, Ireland,
Portugal, Spain and Italy) respectively who found a negative contemporaneous effect of GDP
178
growth on NPL, and infer the quick transmission of macro-economic development to the
ability of economic agents to service their loans.
7.3.1.2.2 Inflation
This study found a negative relationship between current year inflation and NPL in Nepalese
banks. The result is consistent with the findings of Zribi and Boujelbene (2011) and Vogiazas
and Nikolaidou (2011) from evidence in Tunisia and Romania who found the negative
relationship of inflation on NPL. The result is not consistent with the claim that inflation
increases the interest rate which leads to an increase in the obligation of borrowers resulting
in an increase in the credit risk. However, the study is not in line with the findings of Rinaldi
and Sanchis-Arellano (2006) and Gunsel (2012) who found a positive relationship of inflation
and NPL. The possible reason of the finding of this study of Nepalese banks is that if the
bank is able to anticipate inflation pressures and if the growth rate of inflation is lower than
operating expenses of the bank, there may be a positive impact of inflation on bank efficiency
(Revell 1979).
7.3.1.2.3 Broad Money Supply Growth
Broad money supply growth is found to be an insignificant determinant of NPL in Nepalese
banks. It is theorized that money supply growth in the country decreases the interest rate and
the public can get cheaper funds which help them service their debt. However, the results of
this study are not consistent with this theory. The results of this study are consistent with
Fofack (2005) who did not find any significant influence of money supply growth on NPL in
Sub Saharan Africa, which is a similar developing economy as Nepal. The result is also
consistent with Bofondi and Ropele (2011) who did not find any influence of money supply
growth on NPL in the context of Italy. However, the economy of Italy is different to that of
Nepal. The possible reason of these findings in context of Nepalese banks may be that money
supply decreases the interest rate which leads to higher credit demand in the market. This
situation stimulates the bank to compromise in credit assessment and to start lending to the
low quality borrowers without investigating their current debt status or credit rating and debt
repayment ability. So this situation may not lead to minimization of NPL of banks.
7.3.1.2.4 Exchange Rate
This study found the results in line with the statements that depreciation of the domestic
currency increases the price of imported products which creates the problem to acquire more
179
credit to pay for the same unit of product which further creates a burden for the borrower to
pay additional principal and interest. The study is consistent with the previous research
conducted by Castro (2012), Zribi and Boujelbene (2011) and Gunsel (2012) who found the
negative impact of depreciation of domestic currency on NPL. However, this study found
conflicting results with Aver (2008) who found no influence of foreign exchange fluctuations
on NPL. This can be attributed to the differences between developed and a less developed
country in terms of financial sector structure and deepening. Nepal has faced a trading deficit
from 2001. So the next possible reasons for the results may be that in Nepalese banks, is that
depreciation of the domestic currency can be supposed to harm banks because their foreign
exchange liabilities are significantly higher than assets denominated in foreign currencies.
7.3.1.2.5 Share Prices Index
This study found that growth of the share prices index is not a significant determinant of NPL
in Nepalese banks. The results of this study are consistent with the findings of Bofondi and
Ropele (2011) who found that share prices have no significant impact on the loan quality.
Similarly, the results are similar the findings of Beck, Jakubik et al. (2013) who found that
decline of the stock market can negatively affect bank asset quality, in particular in countries
with large stock markets relative to GDP, but it is not the case for those countries where the
capital market is small which also applies in Nepal that the Nepalese capital market is still in
developing stages and small. The results of this study are not consistent with several studies
Castro (2012) and Kalirai and Scheicher (2002), who found that a drop in share prices might
lead to more defaults. So the findings of this study do not support the claim that increases in
share prices reflect an improvement in the financial condition and contribute to a reduction of
the rate of NPL.
7.3.1.2.6 Market Interest Rate
As with the previous research, this study found that market interest rates are positively related
with bank NPL in Nepalese. Information asymmetry theory suggests that higher interest rates
motivate the banks to invest in adverse projects which create the credit risk in banks. In line
with this theory, the result of this study supports the claim that the market interest rate drives
the interest rate of banks and, as a result, banks tend to be less restricted in their credit
standards and face adverse selection which leads high NPL. The study found the results in
line with Jimenez and Saurina (2006), Aver (2008), Nkusu (2011), Castro (2012) and Beck,
180
Jakubik et al. (2013) who found that interest rates charged by banks is positively related with
bank NPL.
The above section elaborated the discussion of the results of macro-economic determinants of
NPL of Nepalese banks. The discussion concludes that among the macro-economic variables
used in the study, only GDP growth with one year lag, current inflation, foreign exchange
fluctuations and market interest rates have a significant influence on NPL of the Nepalese
banking industry which is in line with previous research. However, current year GDP growth,
inflation with one year lag, broad money supply growth and growth of share prices index did
not show any significant influence on NPL which is also supported by previous research.
7.3.1.3 Result of Bank Specific Determinants of NPL
As with the approach adopted by previous researchers Salas and Saurina (2002) and Das and
Ghosh (2007), this thesis has estimated three separate models to examine the influence of
bank specific variables on NPL. NPL with one year lag is included in all models. Besides
this, in model one, this study has included loan growth, branch growth, loan loss provision
and total assets. The second model included earnings before interest and tax to total assets,
equity capital to total assets, and interest rate spread. In addition to this, the second model
also included some control variables such as revenue growth, credit deposit ratio and bank
age. In the third and overall model, all bank specific variables have been included along with
control variables. The same models are employed in OLS, RE and GMM. The first results
pertaining to OLS analyses are presented below.
NPL = β0+ β1NPLt-1+ β2LG+ β3BG+ β4LLP+ β5TA + eit……………………….. (1)
NPL = β0+ β1NPLt-1+ β2EBIT+ β3ECTA+ β4IRS+ β5RG + β6CDR + β7BA + eit.. (2)
NPL = β0+β1NPLt-1+ β2LG+ β3BG+ β4LLP+ β5TA + β6EBIT +β7 ECTA + β8 IRS
+ β9 RG + β10 CDR + β11BA + eit ………………………………………… (3)
Where NPL= Non-performing loan, NPLt-1= Lag non-performing loan, LLP= Loan loss
provision, LG= Loan growth, ECTA= Equity capital to total assets, EBIT = Earnings before
interest & tax to total assets, BG= Branch growth, TA= Total assets in NPR, IRS= Interest
rate spread, RG= Revenue growth, CDR= Credit deposit ratio, BA= Bank age,

181
The OLS result in Table 7.10 shows that among all bank specific variables, NPL lag, loan
growth, loan loss provision, earnings and interest rate spread have a significant influence on
NPL, and the other variables have no significant influence.
Table 7.10: OLS Result of Bank Specific Variables on NPL
Independent variables Model 1 Model 2 Model 3
Non-performing loans lag 0.4518*** 0.6194*** 0.4477***
(4.92) (10.45) (5.69)
Loan Growth -0.0162
-0.0160*
(-1.59)
(-1.75)
Branch Growth -0.001
-0.003
(-0.28)
(-1.24)
Loan loss provision 0.3543***
0.3000***
(3.16)
(2.81)
Bank size -0.0075*
-0.0071
(-1.82)
(-1.61)
Earnings
-0.6281*** -0.4542***
(-2.85) (-2.76)
Capital
-0.1291* -0.0555
(-1.78) (-0.97)
Interest rate spread
0.4223* 0.4194*
(1.87) (1.79)
Revenue growth
-0.0241* 0.003
(-1.78) (0.21)
Credit deposit ratio
0.0203 -0.0168
(1.45) (-1.04)
Bank age
-0.0002 -0.0001
(-0.56) (-0.39)
Year dummies Yes Yes Yes Constant 0.1018*** 0.036 0.1095**
(2.72) (1.32) (2.17)
Observation 175 177 168 R square 0.7957 0.8083 0.8774 Adjusted R square 0.7764 0.7878 0.8597 F statistics 27.7705 17.1742 38.5975
t statistics in parentheses = *p<0.10, ** p<0.05 and ***p<0.01
As expected, NPL one year lag is significant with a positive coefficient value. The result
suggests that the NPL of the current period is closely related to that of the previous period.
The result shows that loan growth is significant and negatively related to NPL but has a weak
relationship with other significant variables. The result explains that an increase in loan
growth contributes to minimize NPL. A possible reason for loan growth which is negatively
related to the NPL is that when the banks increase their lending as a result of high demand for
credit, they tighten their credit standards and keep loans under control, which reduces the
possibility of the banks’ exposure to an adverse selection problem, hence reducing the banks’
NPL.
182
The negative coefficient estimate of branch growth shows the negative relationship between
branch growth and NPL, but the result is not statistically significant. The result indicates the
branch expansion policy followed by banks in Nepal has no significant influence on bank
NPL. The results suggest that the more aggressive growth policy of banks affects the level of
problem loans but not in the current year but may impact with the passage of time.
The results show the coefficient estimate of loan loss provision is significant and positively
related with NPL. The result explains why an increase in loan loss provision levels is an
indication of deterioration of loan quality and potentially increases in NPL. Thus, a positive
relation suggests that a higher loan loss provision indicates potentially higher NPL because
banks which assume high default rates in their loan portfolios allocate large provisions for
loan losses.
The coefficient estimate of bank size which is measured by total assets is significant and
negative in model 1 but, overall in the model, it is positive but not statistically significant.
The result shows that size has no significant relationship with NPL. The result does not
support the idea that the large banks with large resources have more risk heading tools and
have more ability to diversify their loans in more profitable sectors.
The results found earnings which are measured by ‘before interest and tax to total assets’ is
significant and negatively related with NPL. The result explains that increases in the earnings
of banks contribute to minimize the NPL. The result suggests that a decrease in earnings can
prompt banks to adopt ‘gamble for resurrection’ strategies, resulting in the creation of loan
portfolios with a higher probability of default in the future.
The coefficient estimate of capital is significant and negative and significant only in model 2
but, overall in the models, it is not statistically significant. The result explains why capital has
no significant influence on bank NPL. The result is not in line with the statement that banks
which assume more risks increase their capital. A possible reason for capital which has not a
significant relationship with NPL is that sometimes the bank reaction to capital increase
depends on the initial capital base. Another reason may be that well capitalized banks tend to
maintain existing levels of capital, and poorly capitalized banks react either by increasing
capital or reducing risk in order to build capital reserves.
The result show that coefficient estimate of interest rate spread is strongly significant and
positively related with NPL in all models. The result shows that increases in interest rate

183
spread leads to higher NPL. Thus study suggests that high interest rate spread as result of
high intermediation costs leads the borrower to be unable to repay their loan owing to the cost
of such borrowing. This leads to high risk of loan default.
The study also used a control variable in the analysis. The OLS result shows that revenue
growth contributes to minimize NPL in the second model but, overall in the model, revenue
growth has no significant relationship with NPL. Similarly, other control variables of credit
deposit ratio and bank age is negatively related to NPL but the result is not statistically
significant. So, credit deposit ratio and bank age have also no significant relationship with
NPL.
The RE result in Table 7.11 shows that among all bank specific variables NPL lag, loan
growth, loan loss provision, bank size measured by total assets, earnings before interest and
tax to total assets, have a significant influence on NPL; the other variables have no significant
influence. The RE analysis also shows the same result as OLS in the case of NPL lag, loan
growth, branch growth, loan loss provision, earnings before interest and tax to total assets,
and capital. Interest rate spread is found strongly positively related with NPL which is the
same as the OLS result but statistically not significant.
In the case of control variables, the RE result found that revenue growth is significant and
negatively related with NPL in model 2 but in the overall model, it is not significantly related.
Credit deposit ratio is found significantly negatively related with NPL which shows that
higher credit provided by banks helps to minimize NPL. Bank age is found insignificant in all
models and confirms that bank age has no impact on NPL of bank.
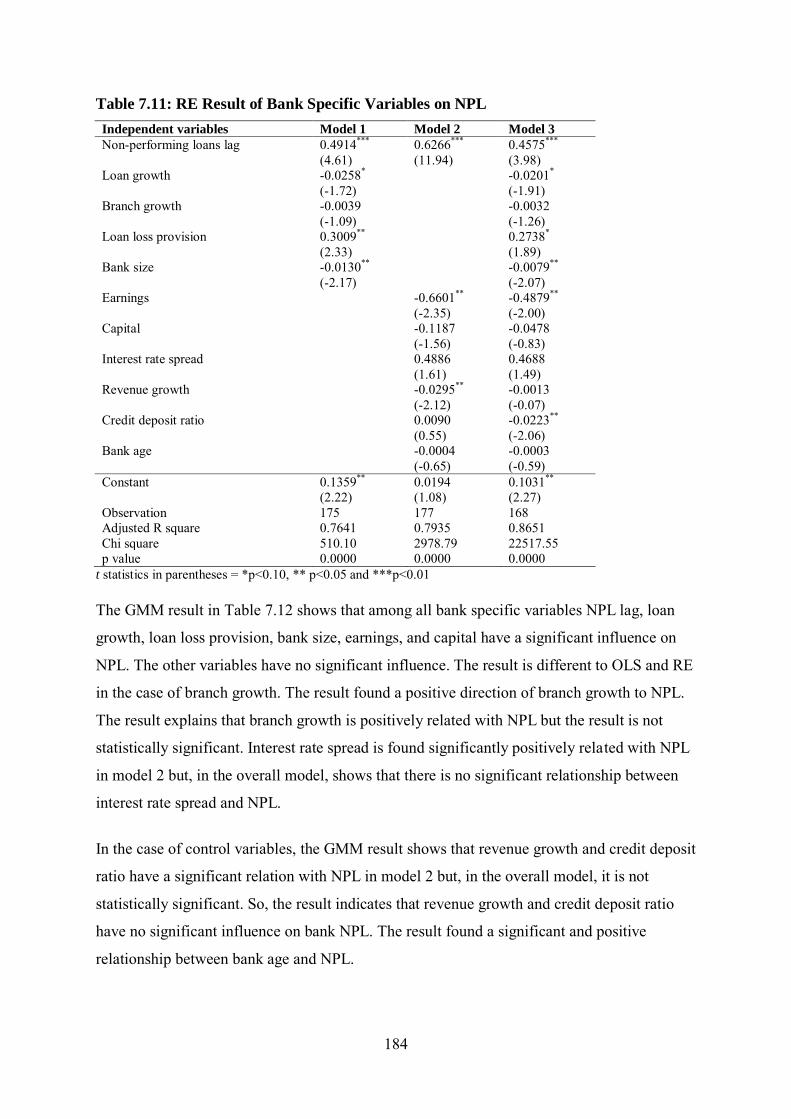
184
Table 7.11: RE Result of Bank Specific Variables on NPL
Independent variables Model 1 Model 2 Model 3
Non-performing loans lag 0.4914*** 0.6266*** 0.4575***
(4.61) (11.94) (3.98)
Loan growth -0.0258*
-0.0201*
(-1.72)
(-1.91)
Branch growth -0.0039
-0.0032
(-1.09)
(-1.26)
Loan loss provision 0.3009**
0.2738*
(2.33)
(1.89)
Bank size -0.0130**
-0.0079**
(-2.17)
(-2.07)
Earnings
-0.6601** -0.4879**
(-2.35) (-2.00)
Capital
-0.1187 -0.0478
(-1.56) (-0.83)
Interest rate spread
0.4886 0.4688
(1.61) (1.49)
Revenue growth
-0.0295** -0.0013
(-2.12) (-0.07)
Credit deposit ratio
0.0090 -0.0223**
(0.55) (-2.06)
Bank age
-0.0004 -0.0003
(-0.65) (-0.59)
Constant 0.1359** 0.0194 0.1031**
(2.22) (1.08) (2.27)
Observation 175 177 168 Adjusted R square 0.7641 0.7935 0.8651 Chi square 510.10 2978.79 22517.55 p value 0.0000 0.0000 0.0000
t statistics in parentheses = *p<0.10, ** p<0.05 and ***p<0.01 The GMM result in Table 7.12 shows that among all bank specific variables NPL lag, loan
growth, loan loss provision, bank size, earnings, and capital have a significant influence on
NPL. The other variables have no significant influence. The result is different to OLS and RE
in the case of branch growth. The result found a positive direction of branch growth to NPL.
The result explains that branch growth is positively related with NPL but the result is not
statistically significant. Interest rate spread is found significantly positively related with NPL
in model 2 but, in the overall model, shows that there is no significant relationship between
interest rate spread and NPL.
In the case of control variables, the GMM result shows that revenue growth and credit deposit
ratio have a significant relation with NPL in model 2 but, in the overall model, it is not
statistically significant. So, the result indicates that revenue growth and credit deposit ratio
have no significant influence on bank NPL. The result found a significant and positive
relationship between bank age and NPL.
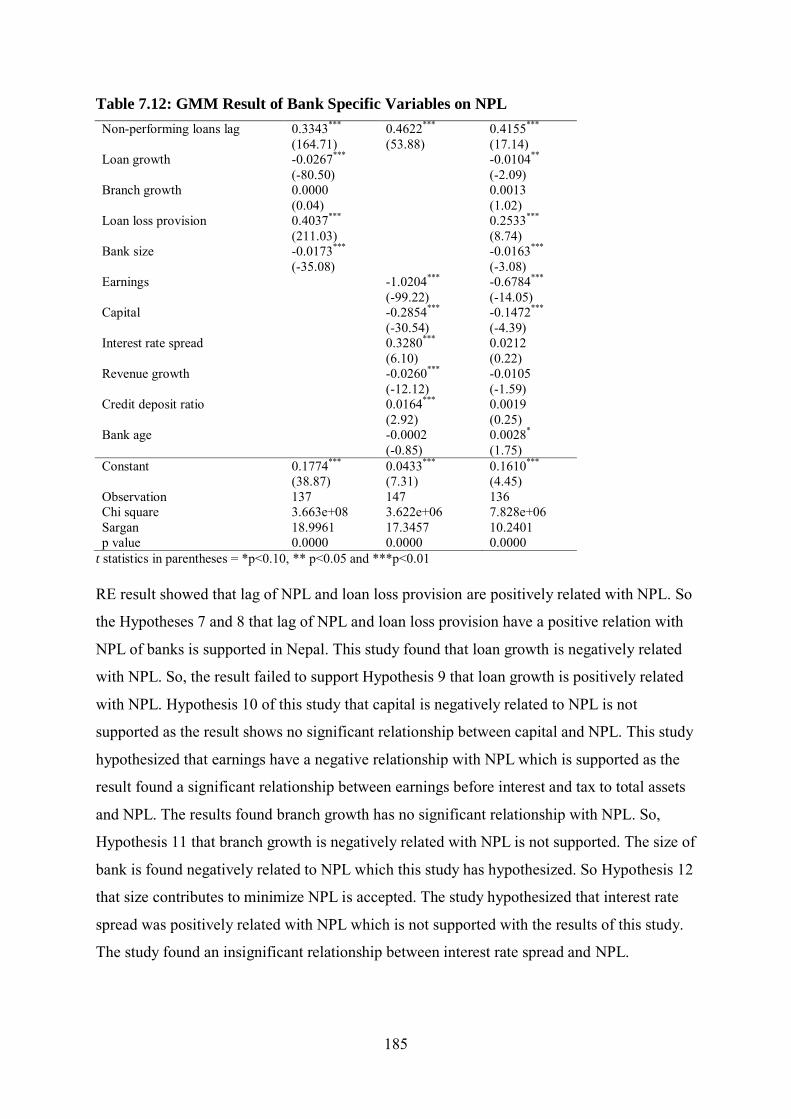
185
Table 7.12: GMM Result of Bank Specific Variables on NPL Non-performing loans lag 0.3343*** 0.4622*** 0.4155***
(164.71) (53.88) (17.14)
Loan growth -0.0267***
-0.0104**
(-80.50)
(-2.09)
Branch growth 0.0000
0.0013
(0.04)
(1.02)
Loan loss provision 0.4037***
0.2533***
(211.03)
(8.74)
Bank size -0.0173***
-0.0163***
(-35.08)
(-3.08)
Earnings
-1.0204*** -0.6784***
(-99.22) (-14.05)
Capital
-0.2854*** -0.1472***
(-30.54) (-4.39)
Interest rate spread
0.3280*** 0.0212
(6.10) (0.22)
Revenue growth
-0.0260*** -0.0105
(-12.12) (-1.59)
Credit deposit ratio
0.0164*** 0.0019
(2.92) (0.25)
Bank age
-0.0002 0.0028*
(-0.85) (1.75)
Constant 0.1774*** 0.0433*** 0.1610***
(38.87) (7.31) (4.45)
Observation 137 147 136 Chi square 3.663e+08 3.622e+06 7.828e+06 Sargan 18.9961 17.3457 10.2401 p value 0.0000 0.0000 0.0000
t statistics in parentheses = *p<0.10, ** p<0.05 and ***p<0.01
RE result showed that lag of NPL and loan loss provision are positively related with NPL. So
the Hypotheses 7 and 8 that lag of NPL and loan loss provision have a positive relation with
NPL of banks is supported in Nepal. This study found that loan growth is negatively related
with NPL. So, the result failed to support Hypothesis 9 that loan growth is positively related
with NPL. Hypothesis 10 of this study that capital is negatively related to NPL is not
supported as the result shows no significant relationship between capital and NPL. This study
hypothesized that earnings have a negative relationship with NPL which is supported as the
result found a significant relationship between earnings before interest and tax to total assets
and NPL. The results found branch growth has no significant relationship with NPL. So,
Hypothesis 11 that branch growth is negatively related with NPL is not supported. The size of
bank is found negatively related to NPL which this study has hypothesized. So Hypothesis 12
that size contributes to minimize NPL is accepted. The study hypothesized that interest rate
spread was positively related with NPL which is not supported with the results of this study.
The study found an insignificant relationship between interest rate spread and NPL.

186
In conclusion, the results from OLS, RE and GMM show that among all bank specific
variables, NPL lag, loan loss provision, earnings and interest rate spread are the strongest
variables which influence the NPL, whereas loan growth and capital have found a very weak
significant relationship with NPL. The results show that branch growth has no significant
influence on NPL. However, the study summarized the result on the basis of results provided
by the RE model and confirm that, among bank specific variables, NPL lag, loan loss
provision, loan growth, earnings and bank size have a significant influence on bank NPL in
the case of Nepal. Whereas NPL lag and loan loss provision are positively related with NPL
and loan growth, size and earnings are found to be negatively related with NPL. The other
variables, branch growth, capital and interest rate spread rate have no significant indicator
which impacts on NPL in the case of Nepal.
7.3.1.4 Discussion of Result of Bank Specific Determinants of NPL
The previous section described the results of macro-economic determinants of NPL derived
from OLS, RE and GMM. As per the second objectives of this thesis to investigate the bank
specific determinants of NPL in Nepalese banks, this section presents the discussion and
analysis of results of bank specific determinants of NPL in Nepalese commercial banks.
Table 7.13: Summary of Results and Hypothesis Test
Dependent
Variables
NPL
Independent
Variables
Hypothesis
Number
Expected sign Actual sign of
result
Statistical
significance of
results
Conclusion
(Hypothesis)
NPL one year lag
7 + + Significant Supported
Loan loss provision
8 + + Significant Supported
Loan growth 9 + - Significant Not supported Capital 10 - - Insignificant Not supported Earnings 11 - - Significant Supported Branch growth 12 - - Insignificant Not supported Bank size 13 - - Significant Supported Interest rate spread
14 + + Insignificant Not supported
Control
Variables
Revenue growth - Insignificant Credit deposit ratio
- Significant
Bank age - Insignificant
187
7.3.1.4.1 NPL One Year Lag
The results of this thesis are consistent with the findings of Salas and Saurina (2002), Das and
Ghosh (2007) Thiagarajan (2013) from evidence on Spain, India and Belize respectively. The
result is in line with the claim of Campbell (2007) that a high proportion of NPL reflects a
decrease in the quality of loans which finally increase bank exposure to NPL. So this study
also supports the argument that previous year NPL can positively influence the current NPL
levels because the problem loans of one year are not completely written off and have a
carryover effect.
7.3.1.4.2 Loan Loss Provision
Loan loss provision is found positively related to bank NPL in the context of Nepal as with
other countries. The results of this study show that the banks increase or decrease their
provision in response to NPL. The higher loan loss provision signals potentially a higher NPL
on banks and they need to make greater provision against potentially greater NPL. The result
is consistent with previous research by Fisher, Gueyie and Ortiz (2002), Ahmad (2007) and
Bikker and Matzemakers (2004). However, in countries where risk control is more effective
and considered as an essential component of the bank strategy, they have other means such as
credit derivate markets to hedge future exposure of credit risk along with loan loss provision.
In the context of developing economies like Nepal, loan loss provisions are most often a tool
to hedge future exposure to NPL.
7.3.1.4.3 Loan Growth
This study found that loan growth is negatively related to bank NPL in context of Nepal. The
results of this study are consistent with Vogiazas and Nikolaidou (2011) who found credit
growth is negatively related with credit risk in Bulgaria. This result also is in line with ‘loan
seasoning’ hypothesis that borrowers do not immediately default after they have received a
bank loan (Berger and Udell 2004). This hypothesis suggests that loans materialize into NPL
with a lag of several years. Previous research by Salas and Saurina (2002), Jimenez and
Saurina (2006) and Das and Ghosh (2007) found their results as the hypothesis suggested.
The results of this study suggest that in some situations such as a high demand of loans, loan
growth, other than a shift in supply, may not lead to higher loan losses. If there is not any
relation between credit demand and the borrower’s underlying credit worthiness then the
rapid loan growth may not transform into loan losses. Next, if in the market there is a
possibility of an increase in return on investment that may boost the demand for credit which
188
increases the capacity of borrowers to repay their loan. So, in the above situation, loan growth
may not result in loan losses. Possible reasons for this result may be that the loan losses of
banks in Nepalese context are masked by ever greening of loans (IMF 2010).
7.3.1.4.4 Capital
The findings of this study do not show that capital is a significant determinant of bank NPL
in Nepal. The results of this study are different to the moral hazard hypothesis that under
capitalized banks respond to moral hazard incentives by increasing the riskiness of their loan
portfolios, which in turn results in higher NPL in the future. The result is consistent with the
findings of Aggrawal and Jacques (2001) that bank loan portfolios is influenced by bank
capital levels; the study does suggest that prompt corrective action has been effective in
getting banks simultaneously to increase their capital ratios and reduce their level of portfolio
risk. This result is not consistent with findings of Berger and DeYoung (1997) and Salas and
Saurina (2002) who claim that excess loan rates were prominent among banks that had
relatively low equity to assets ratio. This finding is consistent with claims that banks that take
more risk may not necessarily hold more capital if they believe all depositors are insured or if
they underestimate the adverse systemic implication of bank failure. Possible reasons for this
result may be in context of Nepal that banks tend to increase their capital ratio, as it
approaches the minimum regulatory level, rather than to absorb the shock. Adjustments by
banks in their capital ratios are affected primarily by boosting their capital rather than through
systematic substitution away from high risk loans. Capitalized and undercapitalized banks
increase their capital ratios and the rate at which they adjusted are the same in response to the
prompt corrective action.
7.3.1.4.5 Earnings
As suggested by theory, this study found a negative relationship between bank earnings and
NPL in context of Nepal. The findings are in line with the argument of De Young (1997) and
Kwan and Eisenbis (1997) that efficient banks are better at managing their NPL and higher
levels of bank inefficiency can lead to an increase in problem loan ratios of banks. The
finding of this study is also consistent with Salas and Saurina (2007) and Das and Ghosh
(2007) with evidence in Spain and India. Banks try to improve their efficiency by increasing
revenue which mainly comes from interest on loans. In the same way, the bank manages its
operating cost such as interest expenses and other overhead expenses. This process increases
the earnings of banks which boost up their capital which contributes to absorbing the risk in

189
the loan portfolio. A decrease in bank earnings stimulates banks to follow high lending
strategies which invite the moral hazard problem. This situation leads to creation of loan
portfolios with higher probability of default with the passage of time. So, a higher
profitability has less incentive to generate income and, therefore, banks are less constrained
to engage in risk activities such as granting risky loans. Instead, inefficient banks are obliged
to grant credit considered risky and subsequently achieve high levels of impaired loans.
7.3.1.4.6 Branch Growth
This study is unable to find that branch growth is a significant determinant of bank NPL in
Nepal. The result of this study is in line with the findings of Thiagarajan, Auuapan et al.
(2011) and Dash and Ghosh (2007) who found branch growth or its lag has no influence on
NPL in the Indian commercial banking sector. Similarly, the previous researchers argue in
two ways, firstly, the argument which is in favor of bank branching networks leading to a
more stable banking system by helping banks to diversify their assets and broaden their
deposit base whereas, by contrast, bank branch expansion into a new area can have an
influence on the problem loans due to lack of familiarity with the customer base in the new
locality. If the increase in loans is made in a traditional geographical market in which the
managers of banks are well known, the impact of problem loans can be kept under control.
However, if the bank enters into a new geographical market with opening new branches,
adverse selection could be important. The possible reason of the result of this study may be
that in Nepalese banks, the banking business is mainly concentrated in the capital city where
the banks are permitted to open branches on the condition by firstly opening two branches
outside of the capital. So, the objective of branch networking is different in context of Nepal
which does not seem to relate with maximization of performance.
7.3.1.4.7 Bank Size
The results of this study support the previous findings about the positive relationship between
bank size and risk which means that the large banks are safer than smaller banks. The result is
consistent with the claim that the big banks have large resources to evaluate their loans which
improves the quality of loans, and greater opportunities for portfolio diversification more
than smaller banks. However, this study does not support the claim that large banks are not
safer than small banks as they follow the policy of diversification advantage by lending in
risky assets. This result is in line with previous findings of Salas and Saurina (2002), Das and
Ghosh (2007) and Altunbas et al (2007).

190
7.3.1.4.8 Interest Rate Spread
The results do not support the argument that high interest rate spread increases the
intermediation cost which transfers to the borrower and, as a result, they face problems to
service interest and principal of loans. The result is in in line with Dash and Ghosh (2007)
who found that net interest income has no relationship with NPL in Indian state owned banks.
The possible reason for the findings of this study may be that it helps the bank to maintain
loan quality, since the cost of loans influences the performance of a loan, if banks assess their
clients carefully and follow the policy of regular monitoring of their borrowers and charge
interest rates accordingly. Most often, only ineffective interest rate policies and ineffective
credit risk assessment influence the NPL rather than high interest rate spread.
7.3.1.4.9 Other Control Variables
The revenue growth of Nepalese banks was not found as a significant factor to help minimize
NPL in banks. Revenue which comes primarily from loans, investment, and service fees
measures the bank efficiency, and indicates how well management and staff have been able
to keep the growth of this revenue continue. It is expected that revenue growth indicates the
bank efficiency in lending which minimizes the ratio of NPL. The results of this thesis are not
in line with the statement that revenue growth contributes to minimize NPL.
This study found a negative relationship between credit to deposit ratio and bank NPL in
Nepal. The loan to deposit ratio predicts that the bigger the loan portfolio relative to deposit
size the higher should be the probability of default. The result is not consistent with this claim
and supports the idea that if the bank is following good credit assessment and management
processes and lending on good projects, then the high credit deposit ratio helps the bank to
increase its efficiency. The result is consistent with the findings of Ahamd and Ariff (2007)
who found higher credit deposit ratios minimize the level of credit risk evidence as found in
Mexico and India.
Bank age was argued by previous researchers as the influencing factor on NPL. However,
this study failed to find a significant relationship of bank age and bank NPL in Nepal. One
stream of research suggests that older firms can enjoy learning advantages and which leads to
superior performance due to their more experience, abilities and skills (Majumdar 1997).
Another stream of research argues that due to bureaucratic ossification, older firms are inert,
without any flexibility to adapt to new situations and, therefore, are likely to be outperformed
by younger, more flexible firms. Besides the above, as firms get older, they benefit from
191
dynamic economies of scale and from having good reputations that allowed them to earn a
higher margin. On the other hand, older firms present difficulty in adapting to changes which
lead to lower performance (Glancey 1998). The results of this study are not in line with
claims that older firms have better performance than newer firms. This is consistent with
findings which show bank age has no significant relation with minimization of NPL in
Malaysia and Singapore (Karim, Chan et al. 2010). One possible reason of this finding in
context of Nepal is that success induces firms to codify their approach through organization
and processes, a regulation that can become blocked over time. This behavior seems
increasingly to entangle firms in structural and process-related rigidities that are difficult to
discard (Leonard-Barton 1992). Another possible reason for the result may be that after the
bank reaches some age, the incremental effect of experience will be non-significant.
In conclusion, the above section elaborated the discussion of the results of bank specific
determinants of NPL in the Nepalese banking sector. The discussion shows that among the
bank specific variables used in the study, loan growth, earnings and size of bank influence
positively to minimize NPL in context of Nepal, whereas NPL lag and loan loss provision are
found negatively to influence a deterioration of loan quality. Other bank specific variables
have not shown any significant influence to NPL. The findings of this study are supported by
previous researchers in both similar, as well as in different economies.
7.3.1.5 Regression Results of Combined Macro-economic and Bank Specific
Determinants of NPL
Using the approach adopted by previous researchers Salas and Saurina (2002) and Das and
Ghosh (2007), this thesis has estimated three separate models to examine the combined
macro-economic and bank specific determinants of NPL. NPL with a one year lag is included
in all models where in model one, this thesis has included loan growth, branch growth, loan
loss provision and total assets as bank specific variables. The same model also included GDP
current year growth, GDP growth with one year lag, current inflation rate, inflation rate with
one year lag, broad money supply growth, exchange rate, growth of share price index, and
market interest rate as macro-economic variables. The second model included earnings before
interest and tax, capital, interest rate spread, revenue growth, credit deposit growth, bank age
as bank specific variables. All macro-economic variables included in the first model have
been also included in this model. The third model included all macro-economic and bank

192
specific variables along with control variables. The same models are employed in OLS, RE
and GMM. The results pertaining to OLS analyses are firstly, presented below.
NPL = β0+ β1NPLt-1+ β2LG+ β3BG+ β4LLP+ β5TA + β6GDP_G+ β7GDP_Gt-1+ β8CPI+
β9CPIt-1+ β10M2+ β11EXCG+ β12SPI_G+ β13MIR+ eit …………………………...(1)
NPL = β0+ β1NPLt-1+ β2EBIT+ β3ECTA+ β4IRS+ β5RG + β6CDR + β7BA + β8GDP_G+
β9GDP_Gt-1+ β10CPI+ β11CPIt-1+ β12M2+ β13EXCG+ β14SPI_G+ β15MIR+ eit….(2)
NPL = β0+β1NPLt-1+ β2LG+ β3BG+ β4LLP+ β5TA + β6EBIT +β7 ECTA + β8 IRS + β9 RG
+ β10 CDR + β11BA+ β12GDP_G+ β13GDP_Gt-1+ β14CPI+ β15CPIt-1+ β16M2+
β17EXCG+ β18SPI_G+ β19MIR + eit …………………………............................... (3)
Where NPL= Non-performing loan, NPLt-1= Lag non-performing loan, LLP= Loan loss
provision, LG= Loan growth, ECTA= Equity capital to total assets, EBIT = Earnings before
interest & tax to total assets, BG= Branch growth, TA= Total assets in NPR, IRS= Interest
rate spread, RG= Revenue growth, CDR= Credit deposit ratio, BA= Bank age, GDP_G=
GDP growth, GDP_Gt-1= lag GDP growth, CPI= Inflation rate, CPIt-1= lag inflation rate,
M2= Broad money supply growth, EXCG= Exchange rate, SPI_G= Share prices index -
growth, MIR= Market interest rate.
The OLS results are presented in Table 7.14. The results show the same as the previous
result; non-performing loans one year lag, loan growth, loan loss provision, earnings and
interest rate spread have a significant determinant on NPL in Nepalese banks. The OLS
results show that among significant bank specific variables, non-performing loans with one
year lag, loan loss provision and interest rate spread are positively related with NPL of
Nepalese banks, whereas loan growth and earnings are negatively related with NPL. The
other bank specific variables branch growth, bank size, capital, revenue growth, credit deposit
ratio and bank age have no significant influence on bank NPL in the Nepalese context.
The OLS results show that all bank specific variables along with macro-economic variables,
only market interest rate has a significant positive influence on bank NPL in context of
Nepal. The other macro-economic variables GDP growth, GDP growth with one year lag,
inflation, inflation with one year lag, broad money supply, exchange rate and growth of share
prices index do not have a significant influence on NPL.

193
Table 7.14: OLS Result of Combined Macro-economic and Bank Specific Variables on
NPL
Model 1 Model 2 Model 3
Non-performing loans lag 0.4518*** 0.6194*** 0.4477***
(4.92) (10.45) (5.69)
Loan growth -0.0162
-0.0160*
(-1.59)
(-1.75)
Branch growth -0.001
-0.003
(-0.28)
(-1.24)
Loan loss provision 0.3543***
0.3000***
(3.16)
(2.81)
Bank size -0.0075*
-0.0071
(-1.82)
(-1.61)
Earnings
-0.6281*** -0.4542***
(-2.85) (-2.76)
Capital
-0.1291* -0.0555
(-1.78) (-0.97)
Interest rate spread
0.4223* 0.4194*
(1.87) (1.79)
Revenue growth
-0.0241* 0.003
(-1.78) (0.21)
Credit deposit ratio
0.0203 -0.0168
(1.45) (-1.04)
Bank age
-0.0002 -0.0001
(-0.56) (-0.39)
Gross domestic product growth 0.3477 0.4719 0.4489
(0.92) (0.78) (0.81)
Gross domestic product growth lag 0.2131 0.3825 0.2574
(0.67) (0.85) (0.75)
Inflation -0.4061** -0.3617 -0.3758
(-2.23) (-1.18) (-1.43)
Inflation lag 0.2724 0.1509 0.2918
(1.65) (0.70) (1.58)
Broad money supply growth -0.1223** -0.0658 -0.0969
(-2.50) (-0.85) (-1.47)
Exchange rate -0.2309** -0.1177 -0.195
(-2.56) (-0.78) (-1.61)
Growth of share prices index 0.0498** 0.0368 0.048
(2.48) (1.03) (1.57)
Market interest rate 0.7630*** 0.599 0.7536*
(2.83) (1.21) (1.75)
Year Dummy Yes Yes Yes Constant 0.0501 -0.0261 0.0471
(1.08) (-0.61) (0.96)
Observation 175 177 168 R square 0.7957 0.8083 0.8774 Adjusted R square 0.7764 0.7878 0.8597 F statistics 27.7705 17.1742 38.5975 t statistics in parenthesis= p<0.10*, p<0.05 and *** p<0.01
The RE results in Table 7.15 show a different result than that of OLS in the case of loan
growth and interest rate spread. From the RE result, these two variables have no significant
influence on NPL in context of Nepalese banks. The RE result also found the same result as
OLS in that non-performing loans with one year lag, loan loss provision and earnings have a
significant influence on bank NPL. RE also found that among macro-economic variables only
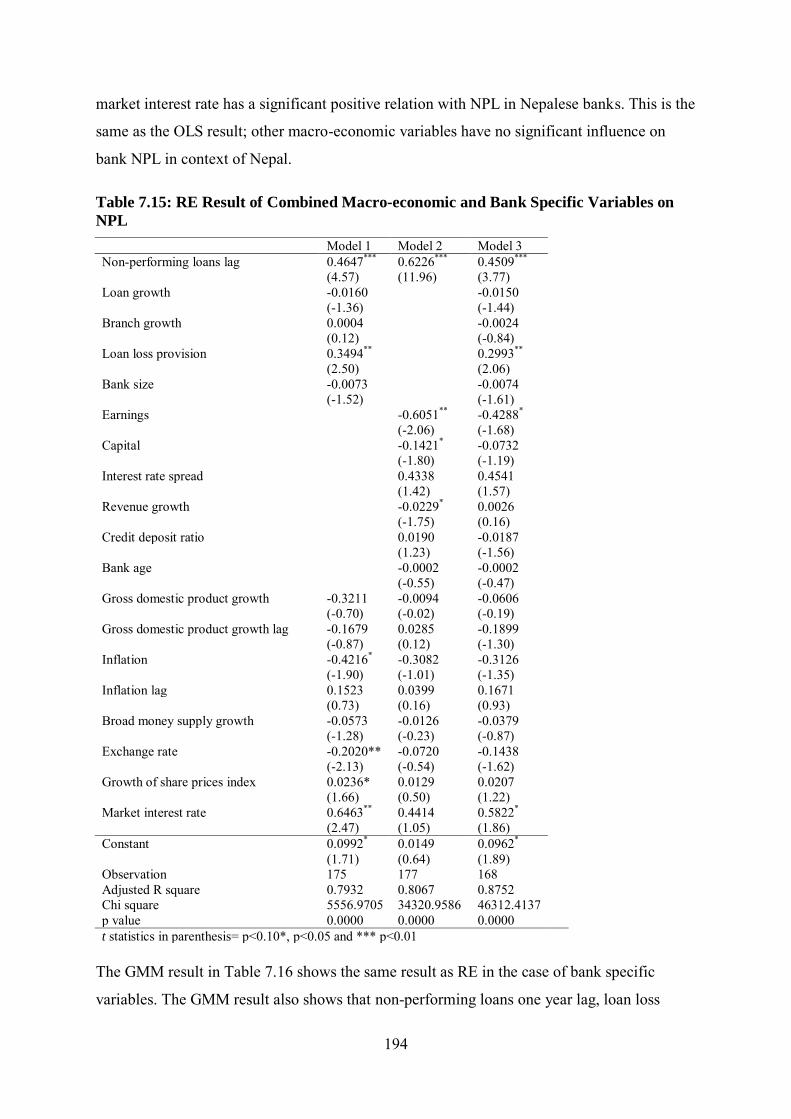
194
market interest rate has a significant positive relation with NPL in Nepalese banks. This is the
same as the OLS result; other macro-economic variables have no significant influence on
bank NPL in context of Nepal.
Table 7.15: RE Result of Combined Macro-economic and Bank Specific Variables on
NPL
Model 1 Model 2 Model 3
Non-performing loans lag 0.4647*** 0.6226*** 0.4509***
(4.57) (11.96) (3.77)
Loan growth -0.0160
-0.0150
(-1.36)
(-1.44)
Branch growth 0.0004
-0.0024
(0.12)
(-0.84)
Loan loss provision 0.3494**
0.2993**
(2.50)
(2.06)
Bank size -0.0073
-0.0074
(-1.52)
(-1.61)
Earnings
-0.6051** -0.4288*
(-2.06) (-1.68)
Capital
-0.1421* -0.0732
(-1.80) (-1.19)
Interest rate spread
0.4338 0.4541
(1.42) (1.57)
Revenue growth
-0.0229* 0.0026
(-1.75) (0.16)
Credit deposit ratio
0.0190 -0.0187
(1.23) (-1.56)
Bank age
-0.0002 -0.0002
(-0.55) (-0.47)
Gross domestic product growth -0.3211 -0.0094 -0.0606
(-0.70) (-0.02) (-0.19)
Gross domestic product growth lag -0.1679 0.0285 -0.1899
(-0.87) (0.12) (-1.30)
Inflation -0.4216* -0.3082 -0.3126
(-1.90) (-1.01) (-1.35)
Inflation lag 0.1523 0.0399 0.1671
(0.73) (0.16) (0.93)
Broad money supply growth -0.0573 -0.0126 -0.0379
(-1.28) (-0.23) (-0.87)
Exchange rate -0.2020** -0.0720 -0.1438
(-2.13) (-0.54) (-1.62)
Growth of share prices index 0.0236* 0.0129 0.0207
(1.66) (0.50) (1.22)
Market interest rate 0.6463** 0.4414 0.5822*
(2.47) (1.05) (1.86)
Constant 0.0992* 0.0149 0.0962*
(1.71) (0.64) (1.89)
Observation 175 177 168 Adjusted R square 0.7932 0.8067 0.8752 Chi square 5556.9705 34320.9586 46312.4137 p value 0.0000 0.0000 0.0000 t statistics in parenthesis= p<0.10*, p<0.05 and *** p<0.01
The GMM result in Table 7.16 shows the same result as RE in the case of bank specific
variables. The GMM result also shows that non-performing loans one year lag, loan loss

195
provision and earnings are a significant determinant of NPL in context of Nepal if we regress
macro-economic and bank specific variables together. In the case of macro-economic
variables, the GMM result found a different result than OLS and RE. The GMM result found
that among macro-economic variables, gross domestic product growth with one year lag is
negatively related to NPL in context of Nepal. The other macro-economic variables used in
this study have no significant influence on NPL in Nepalese banks.
Table 7.16: GMM Result of Combined Macro-economic and Bank Specific Variables on
NPL
Model 1 Model 2 Model 3
Non-performing loans lag 0.1621*** 0.3660*** 0.3069*
(3.90) (8.67) (1.69)
Loan growth -0.0086**
-0.0024
(-2.01)
(-0.33)
Branch growth -0.0014
0.0011
(-1.31)
(0.39)
Loan loss provision 0.5442***
0.4000***
(28.46)
(2.69)
Bank size 0.0166**
-0.0081
(-2.44)
(-0.67)
Earnings
-0.7771*** -0.5570*
(-5.69) (-1.92)
Capital
-0.3756*** -0.0511
(-5.89) (-0.55)
Interest rate spread
0.2007 0.1614
(1.33) (0.84)
Revenue growth
-0.0172*** 0.0018
(-4.50) (0.20)
Credit deposit ratio
0.0119 -0.0006
(0.80) (-0.02)
Bank age
-0.0094 0.0016
(-1.61) (0.24)
Gross domestic product growth -0.8067*** 0.2969 -0.3021
(-6.47) (0.98) (-0.87)
Gross domestic product growth lag -0.2082*** -0.0958 -0.2604**
(-3.86) (-0.59) (-2.05)
Inflation 0.1179* -0.3720** -0.0049
(1.90) (-2.39) (-0.04)
Inflation lag -0.3808*** 0.4525 -0.0015
(-3.19) (1.51) (-0.00)
Broad money supply growth 0.0579*** 0.0273 0.0196
(4.36) (1.02) (0.44)
Exchange rate 0.1212*** -0.0958 0.0112
(2.98) (-1.58) (0.16)
Growth of share prices index -0.0405*** 0.0189 -0.0109
(-4.72) (1.10) (-0.51)
Market interest rate -0.6202*** 1.0537* -0.0037
(-3.08) (1.84) (-0.01)
Constant -0.0759 0.0846*** 0.0913
(-1.55) (4.00) (0.77)
Observation 137 147 136 Chi square 1.23E+05 3.69E+07 6.67E+05 Sargan 9.2761 8.8907 2.9292 p value 0.000 0.000 0.000 t statistics in parenthesis= p<0.10*, p<0.05 and *** p<0.01

196
7.3.1.6 Discussion of Result of Combined Macro-economic and Bank Specific
Determinants of NPL
The previous section described the results of combined macro-economic and bank specific
determinants of NPL derived from OLS, RE and GMM. As with the third objective of this
thesis to investigate the combined macro-economic and bank specific determinants of NPL in
Nepalese banks, this section presents the discussion and analysis of results of combined
macro-economic and bank specific determinants of NPL in Nepalese commercial banks.
Table 7.17: Summary of Results (Macro-economic and Bank Specific Determinants of
NPL) Dependent
variables
NPL
Independent
variables
Hypothesis
number
Expected sign Actual sign of
result
Statistical
significance of
results
Conclusion
(Hypothesis)
Macro-
economic
variables
GDP growth 1(A) - - Insignificant GDP growth one year lag
1(B) - - Insignificant
Inflation 2(A) + - Insignificant Inflation one year lag
2(B) + + Insignificant
Broad money supply growth
3 - - Insignificant
Exchange rate 5 + - Insignificant Growth of share prices index
6 - + Insignificant
Market interest rate
+ + Significant
Bank specific
variables
NPL one year lag
7 + + Significant
Loan loss provision
8 + + Significant
Loan growth 9 + - Insignificant Capital 10 - - Insignificant Earnings before interest and tax
11 - - Significant
Branch growth 12 - - Insignificant Total assets 13 - - Insignificant Interest rate spread
14 + + Insignificant
Control
Variables
Revenue growth + Insignificant Credit deposit ratio
- Insignificant
Bank age - Insignificant
197
The results of this study found that when we check the combined effects of macro-economic
and bank specific variables to NPL, among the macro-economic variables, only market
interest rate has a significant negative influence on NPL. Besides this, when we check the
influence of bank-specific variables, the study found lag of NPL, loan loss provision and
earnings are found as expected from this study, has a significant influence on NPL in the
Nepalese banking industry.
7.3.1.7 Regression Result of Corporate Governance Determinants of NPL
Five separate models are estimated to examine the influence of governance variables on NPL.
In the first model, this study included board size, independence and diligence as governance
variables. The second model included audit committee size, independence and diligence. The
third model was estimated with institutional ownership, foreign ownership and CEO
remuneration. In the fourth model, the analysis included all governance variables. Besides
this, the study also included bank specific and macro-economic variables in the models as
control variables. The analysis in thesis has included bank specific variables in models 1, 2
and 3 as control variables. The final model, or model 4, has included all governance and bank
specific variables along with macro-economic variables. The same models are employed in
OLS, RE and GMM. Firstly, the results pertaining to the OLS analyses are presented below.
NPL = β0+ β1BS+ β2BI+ β3BD+ β4NPLt-1 + β5LLP + β6 LG + β7 ECTA + β8 EBIT + β9BG+
β10TA+ β11IRS+ β12RG+ β13CDR+ β14BA + eit…………………………………. (1)
NPL = β0+ β1ACS+ β2ACI+ β3ACD+ β4NPLt-1 + β5LLP + β6 LG + β7 ECTA + β8 EBIT +
β9BG+ β10TA+ β11IRS+ β12RG+ β13CDR+ β14BA + eit…………………………. (2)
NPL = β0+ β1IO+ β2FO+ β3 CEO_R + β4NPLt-1 + β5LLP + β6 LG + β7 ECTA + β8 EBIT +
β9BG+ β10TA+ β11IRS+ β12RG+ β13CDR+ β14BA + eit………………………… (3)
NPL = β0+ β1BS+ β2BI+ β3BD+ β4ACS+ β5ACI+ β6ACD + β7IO+ β8FO+ β9 CEO_R+
β10NPLt-1 + β11LLP + β12 LG + β13 ECTA + β14 EBIT + β15BG+β16TA+ β17IRS+
β18RG+β19CDR+β20BA+β21GDP_G+β22CPI+β23M2+β24EXCG+β25SPI_G+
β26MIR+eit………………………………………………………………………….(4)
Where BS= Board size, BI= Board independence, BD= Board diligence, ACS= Audit
committee size, ACI= Audit committee independence, ACD= Audit committee diligence,
IO= Institutional ownership, FO= Foreign ownership, CEO_R= CEO remuneration, GDP_G=
GDP growth, CPI= Inflation rate, M2= Broad money supply growth, EXCG= Foreign

198
exchange, SPI_G= Growth of share price index, MIR= Market interest rate, NPLt-1 = Non-
performing loans lag, LLP= Loan loss provision, LG= Loan growth, TA= Total assets in
NPR, ECTA= Equity capital to total assets, EBIT= Earnings before interest and tax, BG=
Branch growth, IRS= Interest rate spread, RG= Revenue growth, CDR= Credit deposit ratio,
BA= Bank age.
OLS estimation in Table 7.18 shows that only board independence and audit committee size
have a significant influence on NPL whereas other governance variables have no significant
impact on NPL. The results show that board size has a negative relation with NPL but is
statistically not significant. The results indicate that in context of Nepal, board size has no
significant influence on bank NPL or board size does not contribute to minimize the bank
NPL.
The results show that the coefficient estimate of board independence is significant and
negatively related with NPL. The results show that there is a negative relationship between
board independence and bank NPL in context of Nepal. The results indicate that involvement
of more independent directors in boards contributes to minimizing bank NPL because they
can solve the information asymmetry problem and reduce uncertainty.
The negative coefficient of board diligence shows the negative relationship between
frequency of board meetings and bank NPL but the result is not statistically significant. The
result explains that frequency of board meetings has no significant influence on NPL. The
results suggest that regular meetings of the board of directors failed to monitor managers and
contribute to minimize the NPL. The results indicate the importance of quality in meetings
rather than frequency.
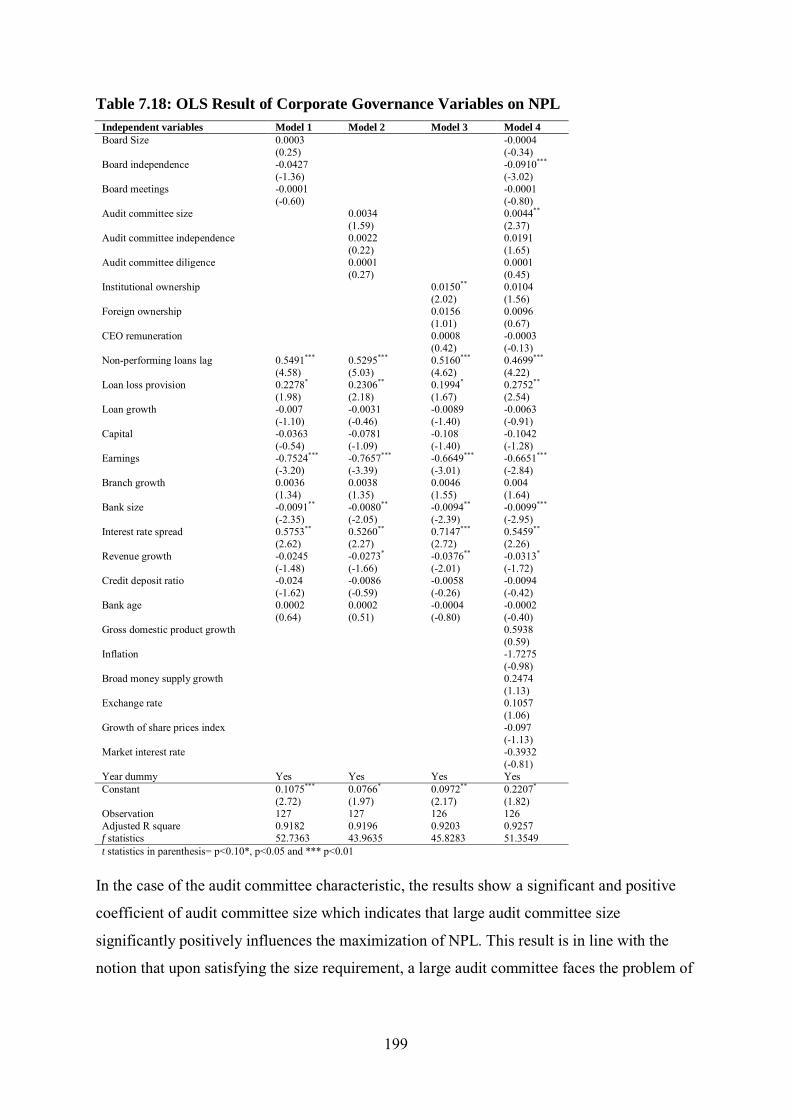
199
Table 7.18: OLS Result of Corporate Governance Variables on NPL
Independent variables Model 1 Model 2 Model 3 Model 4
Board Size 0.0003
-0.0004
(0.25)
(-0.34)
Board independence -0.0427
-0.0910***
(-1.36)
(-3.02)
Board meetings -0.0001
-0.0001
(-0.60)
(-0.80)
Audit committee size
0.0034
0.0044**
(1.59)
(2.37)
Audit committee independence
0.0022
0.0191
(0.22)
(1.65)
Audit committee diligence
0.0001
0.0001
(0.27)
(0.45)
Institutional ownership
0.0150** 0.0104
(2.02) (1.56)
Foreign ownership
0.0156 0.0096
(1.01) (0.67)
CEO remuneration
0.0008 -0.0003
(0.42) (-0.13)
Non-performing loans lag 0.5491*** 0.5295*** 0.5160*** 0.4699***
(4.58) (5.03) (4.62) (4.22)
Loan loss provision 0.2278* 0.2306** 0.1994* 0.2752** (1.98) (2.18) (1.67) (2.54) Loan growth -0.007 -0.0031 -0.0089 -0.0063
(-1.10) (-0.46) (-1.40) (-0.91)
Capital -0.0363 -0.0781 -0.108 -0.1042 (-0.54) (-1.09) (-1.40) (-1.28) Earnings -0.7524*** -0.7657*** -0.6649*** -0.6651*** (-3.20) (-3.39) (-3.01) (-2.84) Branch growth 0.0036 0.0038 0.0046 0.004
(1.34) (1.35) (1.55) (1.64)
Bank size -0.0091** -0.0080** -0.0094** -0.0099***
(-2.35) (-2.05) (-2.39) (-2.95)
Interest rate spread 0.5753** 0.5260** 0.7147*** 0.5459**
(2.62) (2.27) (2.72) (2.26)
Revenue growth -0.0245 -0.0273* -0.0376** -0.0313*
(-1.48) (-1.66) (-2.01) (-1.72)
Credit deposit ratio -0.024 -0.0086 -0.0058 -0.0094
(-1.62) (-0.59) (-0.26) (-0.42)
Bank age 0.0002 0.0002 -0.0004 -0.0002
(0.64) (0.51) (-0.80) (-0.40)
Gross domestic product growth
0.5938
(0.59)
Inflation
-1.7275
(-0.98)
Broad money supply growth
0.2474
(1.13)
Exchange rate
0.1057
(1.06)
Growth of share prices index
-0.097
(-1.13)
Market interest rate
-0.3932
(-0.81)
Year dummy Yes Yes Yes Yes Constant 0.1075*** 0.0766* 0.0972** 0.2207*
(2.72) (1.97) (2.17) (1.82)
Observation 127 127 126 126 Adjusted R square 0.9182 0.9196 0.9203 0.9257 f statistics 52.7363 43.9635 45.8283 51.3549 t statistics in parenthesis= p<0.10*, p<0.05 and *** p<0.01
In the case of the audit committee characteristic, the results show a significant and positive
coefficient of audit committee size which indicates that large audit committee size
significantly positively influences the maximization of NPL. This result is in line with the
notion that upon satisfying the size requirement, a large audit committee faces the problem of

200
free-ride where individual members may not work properly for resource maximization (Sun, ,
Lan, et al. 2014).
The coefficient of audit committee independence is positive but statistically not significant.
The positive coefficient shows that there is a positive relationship of involvement of
independent directors in audit committees to NPL. However, the insignificant result of audit
committee independence to NPL explains that there is no significant influence of audit
committee independence on NPL. The result is supported with the idea that financial experts
in audit committees are useful, rather than the involvement of independent directors in audit
committees.
The same result was found in the case of audit committee diligence. The result shows that
there is a positive relationship between audit committee diligence and NPL, but the
relationship is very weak and insignificant. This result supports the view of Abbott, Parker et
al. (2003) that frequency of audit committee meetings may not improve the efficiency of
firms if there is lack of quality in meetings.
The results of OLS show no significant relationship of ownership structure on NPL. The
coefficient of institutional ownership is significant and positive in model 3 but, overall, the
model shows a positive but not statistically significant relationship with NPL. This result
shows that there is no influence of institutional ownership on NPL. The result is not
supported with the idea that institutional owners have more experience and can operate the
firm at lower cost and support the idea that sometimes institutional investors may fail to
monitor managers due to the dispersed nature of institutional shareholdings and being short-
term return focus.
The same result is also found in the case of foreign ownership. The positive coefficient
estimate of foreign ownership shows the positive relationship between foreign ownership and
NPL but the result is not significant. The result indicates that there is no significant influence
of foreign ownership on NPL. The result suggests that foreign investors should be from those
countries where the best corporate governance practices are in place and follow the same
practice where they invest.
201
The results found a negative coefficient estimate of CEO remuneration. This estimate shows
that there is a negative relationship between CEO remuneration and NPL. However, the result
is not statistically significant. This result explains that there is no significant influence of
CEO remuneration on NPL. The result suggests that perception of CEO is also very
important conceptually, since compensation/performance is sometimes not clearly visible and
thus not motivating to the targeted individuals.
In the case of the control variables, the results show that only some of the bank specific
variables have a significant influence on NPL. Among bank specific variables, the results
show that NPL lag, loan loss provision, bank size, earnings, interest rate spread and revenue
growth have a significant influence on bank NPL. Among these significant variables, NPL
lag, loan loss provision and interest rate spread have a positive relation with NPL. Bank size,
earnings and revenue growth are negatively related with NPL. The results show that macro-
economic variables have no significant influence on bank NPL when it is used as control
variables.
The RE results are presented in Table 7.19 which show the same results as the OLS
estimation. In addition, of the significant governance variables in OLS, the RE results found
audit committee independence and institutional ownership have a significant and positive
relationship to NPL which was not significant in the OLS results.
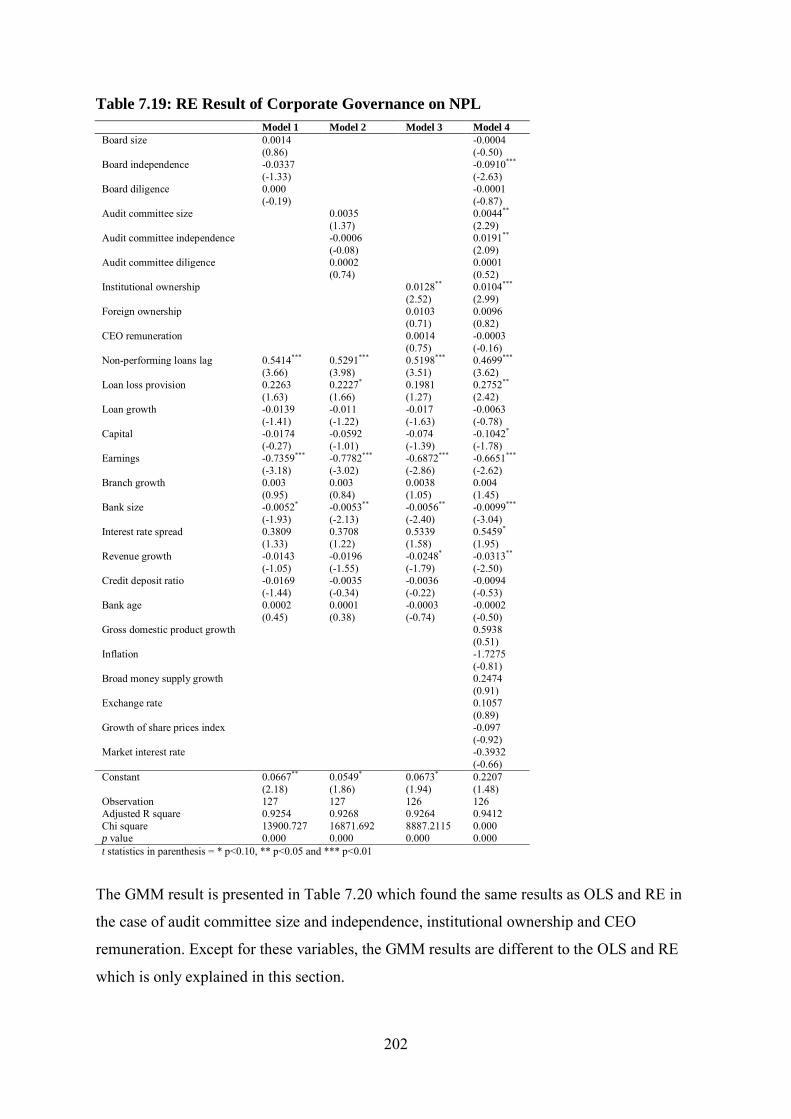
202
Table 7.19: RE Result of Corporate Governance on NPL
Model 1 Model 2 Model 3 Model 4
Board size 0.0014
-0.0004
(0.86)
(-0.50)
Board independence -0.0337
-0.0910***
(-1.33)
(-2.63)
Board diligence 0.000
-0.0001
(-0.19)
(-0.87)
Audit committee size
0.0035
0.0044**
(1.37)
(2.29)
Audit committee independence
-0.0006
0.0191**
(-0.08)
(2.09)
Audit committee diligence
0.0002
0.0001
(0.74)
(0.52)
Institutional ownership
0.0128** 0.0104***
(2.52) (2.99)
Foreign ownership
0.0103 0.0096
(0.71) (0.82)
CEO remuneration
0.0014 -0.0003
(0.75) (-0.16)
Non-performing loans lag 0.5414*** 0.5291*** 0.5198*** 0.4699***
(3.66) (3.98) (3.51) (3.62)
Loan loss provision 0.2263 0.2227* 0.1981 0.2752**
(1.63) (1.66) (1.27) (2.42)
Loan growth -0.0139 -0.011 -0.017 -0.0063
(-1.41) (-1.22) (-1.63) (-0.78)
Capital -0.0174 -0.0592 -0.074 -0.1042*
(-0.27) (-1.01) (-1.39) (-1.78)
Earnings -0.7359*** -0.7782*** -0.6872*** -0.6651***
(-3.18) (-3.02) (-2.86) (-2.62)
Branch growth 0.003 0.003 0.0038 0.004
(0.95) (0.84) (1.05) (1.45)
Bank size -0.0052* -0.0053** -0.0056** -0.0099***
(-1.93) (-2.13) (-2.40) (-3.04)
Interest rate spread 0.3809 0.3708 0.5339 0.5459*
(1.33) (1.22) (1.58) (1.95)
Revenue growth -0.0143 -0.0196 -0.0248* -0.0313**
(-1.05) (-1.55) (-1.79) (-2.50)
Credit deposit ratio -0.0169 -0.0035 -0.0036 -0.0094
(-1.44) (-0.34) (-0.22) (-0.53)
Bank age 0.0002 0.0001 -0.0003 -0.0002
(0.45) (0.38) (-0.74) (-0.50)
Gross domestic product growth
0.5938
(0.51)
Inflation
-1.7275
(-0.81)
Broad money supply growth
0.2474
(0.91)
Exchange rate
0.1057
(0.89)
Growth of share prices index
-0.097
(-0.92)
Market interest rate
-0.3932
(-0.66)
Constant 0.0667** 0.0549* 0.0673* 0.2207
(2.18) (1.86) (1.94) (1.48)
Observation 127 127 126 126 Adjusted R square 0.9254 0.9268 0.9264 0.9412 Chi square 13900.727 16871.692 8887.2115 0.000 p value 0.000 0.000 0.000 0.000 t statistics in parenthesis = * p<0.10, ** p<0.05 and *** p<0.01
The GMM result is presented in Table 7.20 which found the same results as OLS and RE in
the case of audit committee size and independence, institutional ownership and CEO
remuneration. Except for these variables, the GMM results are different to the OLS and RE
which is only explained in this section.

203
Table 7.20: GMM Result of Corporate Governance Variables on NPL
Independent variables Model 1 Model 2 Model 3 Model 4
Board size 0.0014
0.0303**
(0.53)
(2.33)
Board independence -0.0379
1.2982**
(-0.77)
(2.09)
Board diligence -0.0005***
-0.0038**
(-2.78)
(-2.01)
Audit committee size
0.0015
0.0321*
(0.53)
(1.66)
Audit committee independence
-0.0039
0.0266
(-0.16)
(0.45)
Audit committee diligence
0.000
-0.0040*
(-0.03)
(-1.67)
Institutional ownership
0.0556 0.1627
(0.76) (0.81)
Foreign ownership
0.156 7.3017*
(0.65) (1.80)
CEO remuneration
-0.0049 -0.0094
(-0.63) (-0.56)
Non-performing loans lag 0.3749*** 0.2537** 0.1142 1.7057**
(4.85) (2.40) (0.70) (2.31)
Loan loss provision 0.3218** 0.3258* 0.3849*** 0.4299
(2.33) (1.73) (3.40) (1.44)
Loan growth 0.0008 0.0104 0.0026 0.0456
(0.19) (1.39) (0.54) (1.36)
Capital 0.0047 -0.2505 -0.2342*** 1.3496
(0.02) (-1.51) (-2.59) (1.30)
Earnings -0.6156*** -0.7407* 0.0596 0.000
(-3.10) (-1.86) (0.17) (0.00)
Branch growth 0.0025** 0.0026 0.0019 0.0321*
(2.12) (0.87) (0.76) (1.88)
Bank size -0.0164 -0.0385* -0.0133 0.1367
(-0.88) (-1.76) (-0.75) (1.03)
Interest rate spread -0.1897 0.6444* -0.0548 0.000
(-0.70) (1.70) (-0.10) (0.00)
Revenue growth -0.0248*** -0.0252*** -0.0408*** -0.2608*
(-3.75) (-5.00) (-4.09) (-1.94)
Credit deposit ratio -0.0477*** -0.0374 -0.006 0.5244*
(-4.05) (-1.56) (-0.24) (1.68)
Bank age 0.0047 0.0098** 0.0025 -0.0236
(1.47) (2.14) (0.62) (-1.12)
Gross domestic product growth
(-0.24)
(-0.99)
Inflation
0.000
(0.00)
Broad money supply growth
-0.4933
(-1.50)
Exchange rate
-0.4205
(-1.39)
Growth of share prices index
0.1246
(1.33)
Market interest rate
0.4149
(0.80)
Constant 0.1763 0.3183* 0.1323 -2.9045
(1.02) (1.66) (0.78) (-1.45)
Observation 100 100 99 99 Chi square 36068.434 12915.292 16320.029 31667.391 Sargan text 3.9348 13.1169 9.0234 0.000 p value 0.000 0.000 0.000 0.000 t statistics in parentheses = * p<0.10, ** p<0.05 and *** p<0.01
The coefficient estimate of board size is significant and positive as opposed to the prediction
of this study. The results show that board size has a positive significant influence on NPL.
The results explain that increasing the number of members in the board maximizes the NPL.
The results support the idea that large boards involved in less meaningful discussion due to
involvement of many directors makes it difficult to achieve a target. Similarly, in the case of
204
board independence, the GMM results show the opposite result than OLS and RE. The results
show a significant and positive coefficient of board independence. This result indicates that
the involvement of more independent directors contributes to maximizing NPL. This result
suggests that whilst independent directors bring independence, objectivity and experience to
bear upon board decisions, they may also stifle managerial initiative through excessive
monitoring. The coefficient estimate of board meetings is significant and negative which was
not found significant in OLS and RE. The results show that board diligence has a negative
relation with NPL. This result explains that increasing the frequency of numbers of board
meetings helps to minimize NPL through effective monitoring. The results show the
coefficient estimate of foreign ownership is positive and the same as the OLS and RE result,
but it was found significant in GMM. This result shows that foreign ownership has a positive
relation with NPL.
The hypothesis of this study is tested on the basis of results provided by the RE model as
mentioned previously. The study has hypothesized that board size has a negative relation with
NPL but the result is not in line with the hypothesis of this study. Therefore, Hypothesis
15(A) is not supported. The results show that board independence has a negative relation with
NPL in context of Nepal. Hypothesis H 16(A) that board independence is negatively related
with NPL is supported. The results found an insignificant negative relationship between
board diligence and NPL. Hypothesis H 17(A) of this study that board diligence minimizes
the NPL is not supported in the context of Nepalese banks. The results show the significant
positive relationship of audit committee size and independence with NPL which is in contrast
to Hypotheses 18(A) and 19(A) of this study that audit committee size and audit committee
independence are negatively related with NPL. The hypothesis in the case of audit committee
size and independence is not supported. The study hypothesized that audit committee
diligence is negatively related with NPL. However, the results do not show a significant
relationship. The results failed to support Hypothesis 20(A) that board meeting frequency is
negatively related with NPL and is not supported in the context of Nepalese banks. It is
hypothesized in this study that institutional and foreign ownership have a negative relation
with NPL but the results show that institutional ownership has a positive relation with NPL,
whereas foreign ownership has no significant relation with NPL. Hypotheses H21 (A) and
H22 (A) that institutional ownership and foreign ownership have a negative relation with
NPL respectively are not supported. The results show that CEO remuneration is negatively

205
related with NPL but it is statistically not significant. Hypothesis 23(A) of this study that
CEO remuneration is negatively related with NPL is not supported.
In conclusion, board independence, audit committee size and independence, and institutional
ownership found no significant relationship with NPL in OLS. RE result shows that board
independence has a negative relationship with NPL, whereas a positive relationship is found
in the case of audit committee size and independence and institutional ownership. The results
show that other variables have no significant influence on NPL. The GMM result shows quite
a difference to OLS and RE in the case of some variables. The GMM results show board size,
independence, diligence, audit committee size, diligence and foreign ownership have a
significant influence on NPL. The result explains the positive relationship of board size,
independence, audit committee size and foreign ownership with NPL whereas other
significant variables are negatively related to NPL.
7.3.1.8 Discussion of Corporate Governance Determinants of NPL
The above section presented the results and discussion of macro-economic and bank specific
determinants of NPL in context of Nepalese banks. Besides this, results of corporate
governance determinants of NPL in the Nepalese banking industry are also presented in the
above section. This section discusses the results of corporate governance determinants of
NPL in context of Nepalese banks.

206
Table 7.21: Summary of Results and Hypothesis Test
Dependent
Variables
NPL
Independent
Variables
Hypothesis
Number
Expected sign Actual sign of
result
Statistical
significance of
results
Conclusion
(Hypothesis)
Board size 15 (A) - - Insignificant Not supported Board Independence
16(A) - - Significant Supported
Board diligence 17(A) - - Insignificant Not supported Audit committee size
18(A) - + Significant Not supported
Audit committee independence
19(A) - + Significant Not supported
Audit committee diligence
20(A) - + Insignificant Not supported
Institutional ownership
- + Significant Not supported
Foreign ownership
- + Insignificant Not supported
CEO Remuneration
23(A) - - Insignificant Not supported
Control
variables
NPL one year lag
+ Significant
Loan loss provision
+ Significant
Loan growth - Insignificant Capital - Insignificant Earnings before interest and tax
- Significant
Branch growth + Insignificant Total assets - Significant Interest rate spread
+ Significant
Revenue growth - Significant Credit deposit ratio
- Insignificant
Bank age - Insignificant GDP growth + Insignificant Inflation - Insignificant Broad money supply growth
+ Insignificant
Exchange rate + Insignificant Growth of share prices index
- Insignificant
Market interest rate
- Insignificant
7.3.1.8.1 Board Size
It is acknowledge from the previous research that board size has a significant influence on
bank NPL. However, the findings of this study discovered that board size has no influence on
NPL in Nepalese context which is consistent with Nyor and Mejabi (2013) and Liang, Xu and

207
Jiraporn (2013) in context of Nigerian deposit money bank and Chinese commercial bank
respectively. Theoretically, it implies that large boards are less effective. A possible reason
for this result in the context of Nepal may be that board appointments may be made in order
to meet affirmative action provisions such as employment equity targets rather than for the
quality of their contribution to board decisions. It also implies that the recommendations of
the Nepalese corporate governance code that board size must be between five to nine
members is not empirically supported to minimize NPL of banks.
7.3.1.8.2 Board Independence
This study found board independence has a positive influence on a bank loan quality in
context of Nepalese commercial banks. The finding gives support to the expectation of many
corporate governance codes which promote the inclusion of more independent directors on
boards. The result is consistent with previous findings of Liang, Xu and Jiraporn (2013) who
found inclusion of more independent directors improves the loan quality and minimizes NPL.
So, the results of this study suggest that the board which is controlled by more independent
directors tend to other managerial plans and strategic actions, which arises from excessive
managerial supervision. Besides this, the results support the argument that adding outside
directors to the board improves the supervision of management and reduces the conflict of
interest among stakeholders. Besides, if a bank appoints a new outside director with advisory
capabilities, strategic decisions should improve since the counselling skills of the directors
complement those of the CEO. We should, therefore, expect to see a minimizing of bank
NPL.
7.3.1.8.3 Board Diligence
The results found a negative relationship of board diligence to NPL in context of Nepalese
commercial banks. The results support the expectation that bank board meetings play a role
that is more proactive than reactive. Thus, an increase in the frequency of board meetings
would be a response to a search for strategic decisions to improve value, rather than a
response to poor results. However, such a relationship of board meetings lacks a statistically
significant influence. Thus, it is accepted that in context of Nepal, there is no significant
positive influence of board meetings in minimizing of NPL. This result also implies that the
recommendation of the central bank that bank boards must hold a minimum of twelve
meetings in a year is not empirically supported or that this frequency helps to minimize NPL.
The possible reason of this result in context of Nepalese banks is that board meetings may be
208
just fixing the crises rather than trying to address any strategic decisions which contribute to
banks minimizing their NPL. Empirically, this finding is consistent with the results of Andres
and Vallelado (2008) who report a statistically insignificant association between frequency of
board meetings and bank performance for a sample of 69 commercial banks from six OECD
countries from 1996-2006.
7.3.1.8.4 Audit Committee Size
The positive relationship of audit committee size and bank NPL in context of Nepal is in the
opposite direction of agency theory. The prediction made about strong audit committees to
minimize NPL was found to be inaccurate in the Nepalese banking context. The result is
consistent with findings of Al-Matari, Al-Swidi et al. (2012) in context of Saudi Arabia listed
companies. A plausible interpretation of the negative influence of audit committee size on
bank NPL may be attributed to institutional theory, focusing on the process and system by
which they acquire collective meaning and legitimization. In other words, the findings may
be referred to this theory which suggests that companies might adopt practices or regulation
as a result of a notice from a legislator to impose some practice in order to improve bank
effectiveness. However, there is no prediction that the adoption of these regulations will
improve bank effectiveness in Nepal. The results support the argument that smaller audit
committees can improve the loan quality as the smaller size can increase audit committee
vigilance over board decisions and curtail potential managerial opportunism (Yermack 1996).
7.3.1.8.5 Audit Committee Independence
This study found involvement of an independent director in audit committees has positive
related with bank NPL in context of Nepal which is opposite of agency theory. The result
does not support the statement that concerning the presence of outside directors in the audit
committee deserves some consideration. It can be argued that the presence of outside
directors in audit committees fails to facilitate the strategic and monitoring role of a board
and presence of outside directors entails costs to the firm that take the form of fees, travel
expenses, stock and stock-options, with a negative influence on bank efficiency (Belkhir
2009). The possible reason for this result in context of Nepal may be consistent with the
argument of Ruigrok et al. (2006) that independent directors have only limited time they can
invest in any individual board mandate and they consequently lack much of the intimate
knowledge and expertise on the way things are done and decisions are reached in the firm.

209
7.3.1.8.6 Audit Committee Diligence
The result is not in line with the agency theory that the activity of the audit committee might
mitigate agency problems leading to reduced agency costs by aligning the interests of
controlling owners with those of the firm. The results show that the audit committee has no
significant influence to improve the loan quality and minimize NPL of banks in the Nepalese
context. The results are consistent with findings of Huang, Lai et al. (2008) who reported that
audit committee meetings have no significant influence on firm performance. This result is
not consistent with the claim that frequency of audit committee meetings can improve the
process of financial accounting which leads to better performance (Abbott, Parker et al.
2003). The possible reason of this finding in context of Nepal may be supported with the
claim that the number on the audit committee may not enhance bank effectiveness if there is a
lack of quality in the meeting. The results follow the suggestion of KPMG (2008) that audit
committees feel overloaded from agendas and activities with limited time in meetings which
may hamper their effectiveness.
7.3.1.8.7 Foreign Ownership
Foreign ownership of banks is not found as a significant determinant of bank NPL in context
of Nepal which is not consistent with Clarke, Cull et al. (1999) and Bonin, Hasan et al.
(2005) who claim that foreign ownership has positively influenced bank effectiveness in
developing countries. The results show that foreign ownership does not lend support to
minimize NPL in Nepalese context.
The ability of foreign banks to take full advantage of local opportunities depends upon
cultural connections (Clarke et al. 2001). Similarly, culture helps the greater chances of
achieving market closeness (Ford 1989). So, with cultural similarity there is an important
factor of a bank’s effectiveness to assess the needs and requirements of various stakeholders
(Holden and Burgess 1994). It may even be the substance in the interaction process. While
trust and experience are only achieved or lost through interaction, cultural similarity can be
significant before relations begin (Swift 1999). Therefore, the results suggest in Nepalese
commercial banks that foreign ownership of bank headquarters in distant countries with a
very different market environment, language, culture, and supervisory/regulatory structure
could be at higher disadvantage from those located within Nepal. Besides this, banks with
higher foreign ownership rely on deposits to finance their loan portfolios and it is likely that
210
in countries with heavy government involvement in the banking system like Nepal, foreign
banks face more restrictions when tapping into the local deposit market.
7.3.1.8.8 Institutional Ownership
This study found a positive relationship between institutional ownership and bank NPL in
Nepal. The results of this study are consistent with the findings of Enobakhare (2010) who
found a negative influence of institutional shareholding on NPL of bank in Nigeria, which is
also a developing economy like Nepal. The previous findings by researchers suggest that
large institutional shareholdings in a firm prevent mangers from pursing opportunistic
earnings management through discretionary accrual choices (Chung, Firth et al. 2002).
Indeed, Shleifer and Vishny (1986) note that large institutional shareholders may have a
greater incentive to monitor mangers than members of the board of directors, who may have
little or no wealth invested in the firm. The results of this study are not supported with the
above statement. The results support the argument that size of institutional shareholding
motivates an institution to use their ability to influence corporate decisions. If institutions
hold a relatively small portion of shares in a firm, in the case of a poor performance of the
firm, they can easily liquidate their investments and, therefore, have less incentive to monitor.
So, institutional investors’ aims of continuing the liquidity of their holdings and their desire
for short-term profits, outweighs the benefit of monitoring management in the hope of
eliciting higher long-term profitability (Coffee 1991; Maug 1998). So, the possible reason of
this result in the context of Nepal may be institutional shareholdings represented by
individuals who are not skilled in the act of banking; hence their inability to contribute
positively to the quality of risk assets being created.
7.4.1.4.9 CEO Remuneration
CEO remuneration is not found as a significant determinant of NPL in Nepalese commercial
banks. Based on the previous studies, it is generally accepted that executive remuneration is
supposed to motivate their effort, that is, pay leads performance and satisfied individuals with
their compensation motivates them to perform better (Adams 1966). However, the results of
this study do not support this statement in Nepalese banks. The result is consistent with Zajac
(1990) that CEO compensation has no significant influence on a firm’s performance. The
findings of this study are in line with the argument of Falk et al. (2004) that boards should
design rules that give appropriate incentives to the executive to act in the best interest of the
shareholder. It is generally accepted that delegating the management of the firm to the

211
executive creates an agency problem since, in the absence of the right incentives, executives
could base their decisions on short-term or personal objectives which imply immediate
reward, rather than trying to serve the interest of the stockholders by increasing the long-term
value of the firm (Jarque 2008).
7.3.1.8.10 Control Variables
As control variables, among the bank specific variables used in this study, NPL lag, loan loss
provision, earnings and revenue growth are found as significant explanations of the NPL of
banks in Nepal. Similarly, in the process of examining the influence of corporate governance
on banks NPL in Nepal, this study also used macro-economic indicators as well. However,
macro-economic attributes did not show any influence on bank NPL in Nepal.
In conclusion, the findings of the role of corporate governance on minimization of level of
NPL, only board independence contributed in Nepalese banks. Audit committee size,
independence and institutional ownership are found significant governance variables which
deteriorate loan quality and maximize NPL. The other corporate governance variables used in
this study have not played any significant role to help in minimizing the level of NPL in
Nepalese banks.
7.5 Summary
The results and discussion of macro-economic, bank specific and corporate governance
determinants of bank NPL in Nepal is presented and discussed in this chapter. The
relationship of macro-economic, bank specific and corporate governance in the hypothesis,
which was tested for statistical significance, was discussed in relation to the theory, literature
and context of the study. Results confirmed that among macro-economic variables, GDP with
one year lag, inflation, market interest rate and exchange rate are significant determinants
which explain the NPL in Nepalese banks. Other macro-economic variables used in this study
including current GDP growth, inflation lag, broad money supply growth, and growth of
share prices index have no significant influence on NPL. In the process of predicting the
effect of bank specific variables to NPL of Nepalese bank, NPL lag, loan loss provision, loan
growth, earnings and bank size were found significant determinants of NPL, whereas other
bank specific variables capital, branch growth and interest rate spread were not found to be
significant determinants of NPL.
212
The relationship of corporate governance and NPL of Nepalese banks was also examined in
this study. The study found only board independence, audit committee size, audit committee
independence and institutional ownership are a significant determinant of NPL in banks.
Other corporate governance variables used in this study have are not found to be significant
determinants.
Overall, the results conclude that bank NPL is influenced by macro-economic, bank specific
and governance variables in context of Nepal. Among the macro-economic variables, it is
found that gross domestic growth with one year lag, inflation rate, exchange rates and market
interest rate are an influencing factor of NPL, whereas other macro-economic variables,
current GDP growth, inflation with one year lag, broad money supply growth and growth of
share price index have not significant determinants of NPL. In the case of bank specific
variables, NPL with lag, loan loss provision, loan growth, bank size and earnings are found as
significant determinists of NPL in Nepalese commercial banks. Other bank specific variables,
branch growth, capital, interest rate spread are not found as significant determinants of NPL.
When this thesis examined the corporate governance determinants of NPL with controlling
macro-economic and bank specific variables, board independence, audit committee size,
audit committee independence and institutional ownership were found as significant
governance determinants of NPL. The other governance variables, board size and diligence,
audit committee diligence, foreign ownership and CEO remuneration are found as
insignificant variables of determinants of NPL in Nepalese banks.

213
CHAPTER EIGHT
Results and Discussion
8.1 Introduction
The previous chapter presented the results and discussion of macro-economic, bank specific
and corporate governance determinants of NPL in Nepalese bank. The next objective of this
study is to examine the corporate governance determinants of bank performance. To examine
this objective, this study explored the influence of corporate governance on Nepalese bank
performance. So this chapter reports the findings of corporate governance determinants of
bank performance and also provides discussion of the findings. Section 8.2 presents the
description and correlation results of corporate governance variables and performance.
Section 8.3 presents the regression results of corporate governance determinants of bank
performance and hypothesis test. Section 8.4 presents the discussion of results. Section 8.5
summarizes the overall findings and discussion of corporate governance determinants of bank
performance.
8.2 Descriptive and Correlation Results
Table 8.1 shows the descriptive statistics of governance variables and bank performance. The
results show that the mean value of Return on Assets (ROA) is 1.2 percent which ranges from
minimum -18.9 percent to maximum 18 percent. The negative minimum value of ROA
shows that due to unfavorable macro-economic conditions of Nepal from 2008 to 2011 for
example low economic growth, political disturbance etc. The acceleration in inflation and
deceleration in GDP growth, some bank faced the problem of losses. Similarly, the
profitability of commercial bank was also decreased in 2006 and then profitability was
improved marginally. The Tobin’s Q ranges from minimum 0.009 to maximum 0.044 percent
with the average value 0.014 during the observation years from 2005-2011. The average
board size in Nepalese banks is 7 where in average 12.5 percent of members on boards are
dominated by professional directors. The average board and audit committee diligence is
20.43 percent and 8.48 percent respectively. The average audit committee size is 3.44 percent
which is dominated by professional directors at 16.4 percent. The mean value of foreign
ownership and institutional ownership is 11.6 percent and 20.7 percent respectively. The
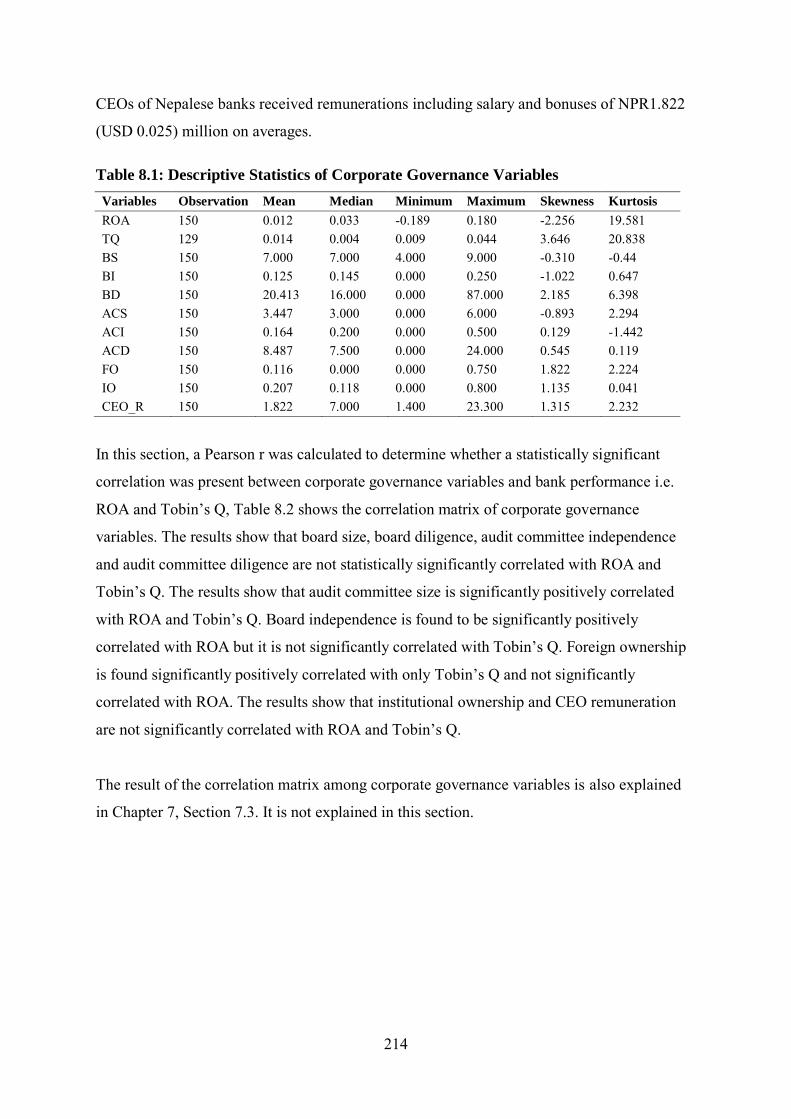
214
CEOs of Nepalese banks received remunerations including salary and bonuses of NPR1.822
(USD 0.025) million on averages.
Table 8.1: Descriptive Statistics of Corporate Governance Variables
Variables Observation Mean Median Minimum Maximum Skewness Kurtosis
ROA 150 0.012 0.033 -0.189 0.180 -2.256 19.581 TQ 129 0.014 0.004 0.009 0.044 3.646 20.838 BS 150 7.000 7.000 4.000 9.000 -0.310 -0.44 BI 150 0.125 0.145 0.000 0.250 -1.022 0.647 BD 150 20.413 16.000 0.000 87.000 2.185 6.398 ACS 150 3.447 3.000 0.000 6.000 -0.893 2.294 ACI 150 0.164 0.200 0.000 0.500 0.129 -1.442 ACD 150 8.487 7.500 0.000 24.000 0.545 0.119 FO 150 0.116 0.000 0.000 0.750 1.822 2.224 IO 150 0.207 0.118 0.000 0.800 1.135 0.041 CEO_R 150 1.822 7.000 1.400 23.300 1.315 2.232
In this section, a Pearson r was calculated to determine whether a statistically significant
correlation was present between corporate governance variables and bank performance i.e.
ROA and Tobin’s Q, Table 8.2 shows the correlation matrix of corporate governance
variables. The results show that board size, board diligence, audit committee independence
and audit committee diligence are not statistically significantly correlated with ROA and
Tobin’s Q. The results show that audit committee size is significantly positively correlated
with ROA and Tobin’s Q. Board independence is found to be significantly positively
correlated with ROA but it is not significantly correlated with Tobin’s Q. Foreign ownership
is found significantly positively correlated with only Tobin’s Q and not significantly
correlated with ROA. The results show that institutional ownership and CEO remuneration
are not significantly correlated with ROA and Tobin’s Q.
The result of the correlation matrix among corporate governance variables is also explained
in Chapter 7, Section 7.3. It is not explained in this section.

215
Table 8.2: Correlation Matrix of Corporate Governance Variables
Variables ROA TQ BS BI BD ACS ACI ACD FO IO
BS 0.038 0.029
BI 0.260** -0.043 -0.270**
BD -0.040 -0.061 -0.130 -0.053
ACS 0.237** 0.230** 0.219** 0.241** 0.020
ACI 0.143 -0.032 -0.167* 0.505** 0.022 0.042
ACD 0.160 -0.159 0.320** 0.103 0.090 0.246** 0.039
FO 0.114 0.240** -0.177* 0.100 -0.174* 0.209* 0.005 -0.238** IO -0.033 -0.090 0.220** -0.013 -0.094 0.129 -0.004 0.110 -0.137
CEO_R 0.060 0.140 0.215** -0.116 -0.219** 0.223** -0.128 -0.043 0.044 0.145 **Significant at 5% level, *significant at 10% level.
8.3 Regression Results and Discussion of Influence of Corporate Governance on
Bank Performance
This section starts the empirical analysis emphasizing the impact of corporate governance
determinants on bank performance. Despite the problems mentioned regarding the traditional
panel data estimators in a dynamic framework, this thesis presents, first the results from the
Ordinary Least Square (OLS). Secondly, this section presents the results from the Fixed
Effect (FE). The support for the FE model was obtained from the Haussmann test. The
Haussmann test shows a Chi square of 37.98 with p value 0.004, and Chi square of 30.67
with p value 0.04, for ROA and Tobin’s Q respectively. Given this result, the results and
discussion are focused on the outcome provided by the FE model.
8.3.1 Result of Influence of Corporate Governance on Bank Performance
Four separate models are estimated to examine the influence of governance variables on bank
performance which is measured by ROA and Tobin’s Q. In model one, this study included
board size, independence and diligence as governance variables. The second model included
audit committee size, independence and diligence. The third model was estimated with
foreign ownership, institutional ownership and CEO remuneration. The fourth model was
estimated with all corporate governance variables used in models 1, 2 and 3. Besides this, this
study has included three bank specific variables, namely loan loss provision, bank size and
capital, and three macro-economic variables, namely GDP growth, inflation and broad money
supply growth as control variables in all models. The same model is employed in Ordinary
Least Square (OLS) and Fixed Effect (FE).
The first results pertaining to OLS analysis is presented below.
Performance=β0+β1BS+β2BI+β3BD+ β4LLP +β5TA+β6ECTA+ β7GDP_G+β8CPI+β9M2 +
eit………………………………………………………………………………………. (1)

216
Performance=β0+β1ACS+β2ACI+β3ACD+β4LLP+β5TA+β6ECTA+β7GDP_G+β8CPI+β9M2
+ eit…………………………………………………………………………………….. (2)
Performance=β0+β1IO+β2FO+β3 CEO_R+β4LLP+β5TA+β6ECTA+β7GDP_G+β8CPI+β9M2
+ eit……………………………………………………………………………………... (3)
Performance=β0+β1BS+β2BI+β3BD+β4ACS+β5ACI+β6ACD+β7IO+β8FO+β9CEO_R+
β10LLP +β11TA+β12ECTA+ β13GDP_G+β14CPI+β15M2 + eit…………………………..(4)
Where BS= Board size, BI= Board independence, BD= Board diligence, ACS= Audit
committee size, ACI= Audit committee independence, ACD= Audit committee diligence,
IO= Institutional ownership, FO= Foreign ownership, CEO_R= CEO remuneration, GDP_G=
GDP growth, CPI= Inflation rate, M2= Broad money supply growth, LLP= Loan loss
provision, TA= Total assets in NPR, ECTA= Equity capital to total assets,
8.3.1.1 Result Based on Accounting Measurement
OLS estimation in Table 8.3 shows that among corporate governance variables, board size,
audit committee diligence, foreign ownership and CEO remuneration have a significant
influence on bank performance if measured by accounting base i.e. ROA. The other corporate
governance variables, board independence and diligence, audit committee size and
independence, and institutional ownership have no significant influence on bank
performance.

217
Table 8.3: OLS Result of Corporate Governance Variables on ROA
Independent variables Model 1 Model 2 Model 3 Model 4
Board size -0.0038
-0.0040*
(-1.45)
(-1.93) Board independence 0.0254
0.0506
(0.66)
(0.74) Board diligence -0.0003
-0.0003
(-1.06)
(-1.51) Audit committee size
-0.0006
-0.0025
(-0.14)
(-0.64) Audit committee independence
0.0001
-0.0052
(0.00)
(-0.25) Audit committee diligence
0.0001
0.0007**
(0.19)
(2.25) Institutional ownership
0.0028 0.0069
(0.44) (1.03) Foreign ownership
0.0163** 0.0196**
(2.32) (2.32) CEO remuneration
0.0031 0.0053*
(1.29) (1.91) Loan loss provision 0.0407 0.0275 0.0476 0.0612
(0.73) (0.63) (0.86) (1.47) Bank size 0.0081** 0.0097** 0.0071* 0.0053
(2.45) (2.25) (1.77) (1.44) Capital 0.0824* 0.0693* 0.0798** 0.1052**
(1.96) (1.69) (2.01) (2.46) Gross domestic product growth 1.5628 3.843 3.2204 2.2238
(0.67) (1.29) (1.03) (0.81) Inflation -0.5045 -1.8864 -1.4123 -0.7358
(-0.36) (-1.11) (-0.77) (-0.46) Broad money supply growth 0.0686 0.2268 0.179 0.0965
(0.44) (1.13) (0.83) (0.53) Year dummy Yes Yes Yes Yes Constant -0.0701** -0.1008*** -0.0987*** -0.0688**
(-2.21) (-2.84) (-2.71) (-2.02) Observation 146 146 145 145 Adjusted R square 0.1148 0.0425 0.0761 0.1412 f statistics 1.4329 2.729 2.5903 2.8252 p value 0.1586 0.0025 0.004 0.0004 t statistics in parenthesis = * p<0.10, ** p<0.05 and *** p<0.01
The significant and negative coefficient of board size shows that board size is significant and
negatively related with bank performance. The results indicate that in Nepal, increasing the
members on boards has negatively influenced bank performance. The results suggest that
larger boards of Nepalese banks are less effective.
The results show that the coefficient estimate of board independence is positive which shows
the positive relationship between board independence and bank performance. However, the
218
result is statistically not significant. So, the result indicates that board independence has no
significant influence on bank performance. The result suggests that involvement of
independent directors on boards does not significantly contribute to improved bank
performance in Nepal.
The negative coefficient of board diligence shows the negative relationship between
frequency of board meetings and bank performance but the result is statistically not
significant. The result explains that frequency of board meetings has no significant influence
on performance in Nepalese bank. The results suggest that regular meetings of the board of
directors have failed to monitor managers or contribute to maximizing the performance of
bank. The results also imply that firms meet regularly and that this has no influence either
positive or negative on the performance of firms as the coefficient is not statistically
significant.
In the case of audit committee characteristics, the results show that audit committee size and
independence is negatively related with bank performance. However, the result is not
statistically significant. The result indicates that both audit committee size and independence
have no significant influence on improvement in bank performance in Nepal. The result
suggests that the “free rider” problem always exists in larger groups so the large audit
committee does not perform their duties to the expected level. Besides this, the results also
suggest the importance of financial experts in audit committees rather than chaired by an
independent director.
The results show the significant and positive coefficient of frequency of audit committee
meetings and bank performance. The results explain that there is a positive relationship
between audit committee meetings and bank performance. The results indicate that frequency
of audit committee meetings has a positive influence on bank performance. However, the
relationship is very weak.
The coefficient of institutional ownership is positively related to bank performance but the
result is statistically not significant. The result indicates that institutional ownership has no
significant influence on bank performance. The results suggest that institutional investors
may fail to monitor mangers due to the dispersed nature of institutional shareholdings.
219
The coefficient of foreign ownership is significant and positive in all models. The result
indicates that the banks owned by foreign ownership positively impacts on the performance
as they can gain technology advantages from their home country and apply the same where
they invest.
The result shows the significant and positive coefficient of CEO remuneration. The result
indicates that CEO remuneration has a positive influence on bank performance. The result
suggests that better pay motivates the manager to perform better.
To examine the relationship between corporate governance and bank performance, this thesis
has also used the control variables. The result shows that loan loss provision has no
significant influence on bank performance. The coefficient of bank size is positive in models
1, 2 and 3 respectively, but in the final model, it is not significant. The result suggests that
there is no influence of bank size with performance. Capital is found significant and
positively related with bank performance in all models. The result indicates that the capital
contributes to improve bank performance. Macro-economic variables i.e. GDP growth,
inflation, and broad money supply have no significant influence in bank performance in all
models.
The FE result is presented in Table 8.4. The FE result shows the same result as OLS in the
case of board size, independence, diligence, audit committee size, audit committee
independence, and institutional ownership. The result shows that audit committee meetings
have a negative influence on bank performance. However, the result is not statistically
significant. The result indicates the importance of quality meetings rather than the number of
meetings. The FE result found a positive relationship between foreign ownership and bank
performance but the result is not statistically significant. The result indicates that it is not
necessary that foreign investors may enhance the bank performance if they are interested in
the short term return rather than the long term due to less concentrated ownership. The result
found a positive relationship between CEO remuneration and bank performance but the result
is not statistically significant. The result shows that the CEO remuneration has no significant
influence on enhancing the bank performance. The result indicates that the CEO
remuneration may have an influence on bank performance only in the initial years as the
early years are related with the CEO’s career.
220
In the case of control variables, the FE result found different results only for bank size than
OLS result. The result shows that bank size has a positive impact on bank performance. The
result indicates that bigger bank have more opportunity of diversification of their loan
portfolio than do smaller bank. This minimizes the risk and enhances the performance.
The hypothesis of this study is tested on the basis of results provided by the FE model as
mentioned previously. The study has hypothesized that board size has a negative relation with
ROA but the result is in line with the hypothesis of this study. So Hypothesis 15(B) that
board size is negatively related with bank performance in context of Nepalese banks, is
supported. This study has hypothesized that board independence and diligence, audit
committee size, independence and diligence, institutional ownership, foreign ownership and
CEO remuneration has a positive relation to bank performance as measured by ROA. The
result shows all these variables have no significant influence on bank performance. So on the
basis of the results, Hypotheses 16(B), 17(B), 18(B), 19(B), 20 (B), 21(B), 22(B) and 23(B)
that board independence, board diligence, audit committee size, audit committee
independence, audit committee diligence, institutional ownership, foreign ownership and
CEO remuneration are positively related with bank performance in Nepal, is not supported.
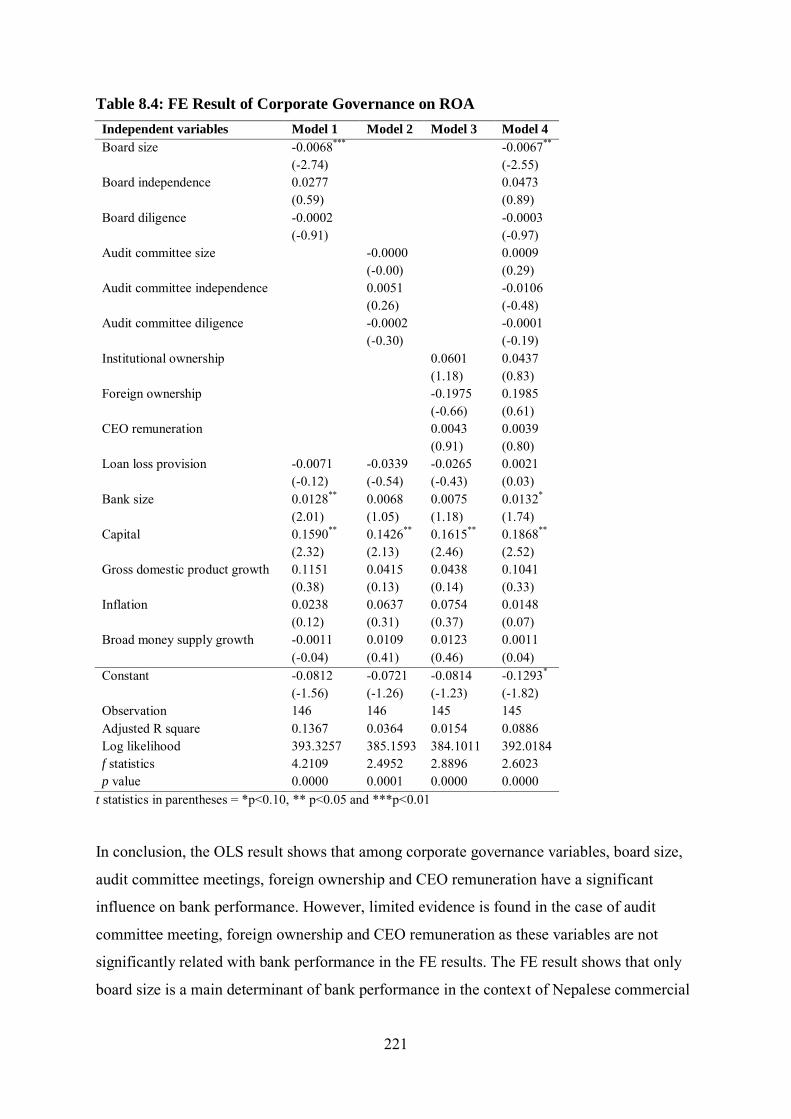
221
Table 8.4: FE Result of Corporate Governance on ROA
Independent variables Model 1 Model 2 Model 3 Model 4
Board size -0.0068***
-0.0067**
(-2.74)
(-2.55) Board independence 0.0277
0.0473
(0.59)
(0.89) Board diligence -0.0002
-0.0003
(-0.91)
(-0.97) Audit committee size
-0.0000
0.0009
(-0.00)
(0.29) Audit committee independence
0.0051
-0.0106
(0.26)
(-0.48) Audit committee diligence
-0.0002
-0.0001
(-0.30)
(-0.19) Institutional ownership
0.0601 0.0437
(1.18) (0.83) Foreign ownership
-0.1975 0.1985
(-0.66) (0.61) CEO remuneration
0.0043 0.0039
(0.91) (0.80) Loan loss provision -0.0071 -0.0339 -0.0265 0.0021
(-0.12) (-0.54) (-0.43) (0.03) Bank size 0.0128** 0.0068 0.0075 0.0132*
(2.01) (1.05) (1.18) (1.74) Capital 0.1590** 0.1426** 0.1615** 0.1868**
(2.32) (2.13) (2.46) (2.52) Gross domestic product growth 0.1151 0.0415 0.0438 0.1041
(0.38) (0.13) (0.14) (0.33) Inflation 0.0238 0.0637 0.0754 0.0148
(0.12) (0.31) (0.37) (0.07) Broad money supply growth -0.0011 0.0109 0.0123 0.0011
(-0.04) (0.41) (0.46) (0.04) Constant -0.0812 -0.0721 -0.0814 -0.1293*
(-1.56) (-1.26) (-1.23) (-1.82) Observation 146 146 145 145 Adjusted R square 0.1367 0.0364 0.0154 0.0886 Log likelihood 393.3257 385.1593 384.1011 392.0184 f statistics 4.2109 2.4952 2.8896 2.6023 p value 0.0000 0.0001 0.0000 0.0000
t statistics in parentheses = *p<0.10, ** p<0.05 and ***p<0.01
In conclusion, the OLS result shows that among corporate governance variables, board size,
audit committee meetings, foreign ownership and CEO remuneration have a significant
influence on bank performance. However, limited evidence is found in the case of audit
committee meeting, foreign ownership and CEO remuneration as these variables are not
significantly related with bank performance in the FE results. The FE result shows that only
board size is a main determinant of bank performance in the context of Nepalese commercial

222
banks and other board characteristics, audit committee characteristics, ownership and CEO
remuneration have not a significant influence on bank performance in Nepal.
8.3.1.2 Result Based on Market Measurement
OLS estimation shows that among governance variables, board size, board diligence, audit
committee diligence, foreign ownership and CEO remuneration have a significant influence
on bank performance. The result does not find a significant relationship of other governance
variables, board independence, audit committee size, audit committee independence and
institutional ownership with bank performance.
Table 8.5: OLS Result of Corporate Governance on Tobin's Q
Individual variables Model 1 Model 2 Model 3 Model 4
Board size 0.0853*
0.0920*
(1.76)
(1.74) Board independence 0.1855
-0.7629
(0.24)
(-1.06) Board diligence -0.0093*
-0.0111**
(-1.69)
(-2.06) Audit committee size
0.0569
0.0100
(1.65)
(0.30) Audit committee independence
-0.2199
0.4400
(-1.21)
(1.49) Audit committee diligence
-0.0025
0.0123*
(-0.29)
(1.69) Institutional ownership
0.0965 0.0193
(0.97) (0.19) Foreign ownership
0.7643*** 1.0410***
(6.13) (6.05) CEO remuneration
0.1488*** 0.0982**
(3.52) (2.17) Loan loss provision -0.2859 -0.8127 -0.0156 0.9592
(-0.39) (-1.20) (-0.03) (1.33) Bank size 0.0839 0.0894 -0.0428 -0.1217*
(1.33) (1.36) (-0.65) (-1.85) Capital 2.1567 1.2122 2.1105 2.8210
(1.10) (0.63) (1.19) (1.50) Gross domestic product growth 171.6623*** 158.4065*** 131.6627*** 126.8659***
(3.31) (3.53) (3.36) (2.76) Inflation -92.0925*** -85.6333*** -66.0249*** -61.0449**
(-3.11) (-3.38) (-2.96) (-2.33) Broad money supply growth 11.4978*** 10.5431*** 8.5213*** 8.4545***
(3.32) (3.50) (3.25) (2.81) Year dummy Yes Yes Yes Yes Constant -0.3839 0.0853 0.5772 0.4767
(-0.59) (0.13) (1.09) (0.89) Observation 141 141 140 140 Adjusted R square 0.2557 0.1942 0.3233 0.4222 f statistics 6.1732 7.0951 16.6330 12.5913 p value 0.0000 0.0000 0.0000 0.0000 t statistics in parentheses = *p<0.10, **p<0.05 and *** p<0.01

223
The OLS result in table 8.5 shows a significant and positive coefficient of board size. The
results indicate that board size is significantly positively related with bank performance. The
result explains that the bigger board size positively impacts on the bank performance in the
context of Nepalese commercial banks. The result suggests that markets perceive the bank as
a complex business and support the large boards which can solve the complexity in a firm.
The result shows the negative relationship between the board independence and bank
performance but the result is statistically insignificant. The result indicates that board
independence has no significant influence on bank performance. The result suggests that
independent directors are less conflicted than inside directors but they are less informed about
the company than insider directors which may not enhance the performance of the bank.
The result shows a significant and negative relationship between board diligence and bank
performance. The result indicates that frequency of board meetings has a negative influence
on bank performance. The result suggests that the market perceives board meetings as just
fixing the existing problems of banks.
The result found a positive relationship between audit committee size and bank performance.
The result indicates that larger audit committee size has a positive influence on bank
performance. However, the result is not statistically significant. The result suggests that audit
committee size has no significant influence on bank performance in Nepal. The result
suggests that audit committee effectiveness is important rather than their size. The same
insignificant relationship is found in the case of audit committee independence which
indicates that involvement or if chaired by the audit committee with an independent director
does not help to enhance the bank performance. The result suggests considering the quality
and proper authority of independent directors is important in audit committees for
enhancement of bank performance.
The results found a significant and positive relationship between audit committee diligence
and bank performance. The result indicates that the frequency of audit committee meetings
has a positive impact on bank performance. The results suggest that markets perceive audit
committee meetings as better monitoring tools and provide reliable information to the market.
The positive coefficient of institutional ownership shows a positive relationship between
institutional ownership and bank performance, but the result is not statistically significant.
The result indicates that institutional ownership has no significant influence on bank

224
performance. The coefficient of foreign ownership is significant and positive in all models.
This implies that the foreign ownership has a positive influence on bank. The result suggests
that markets perceive foreign investors as a good mechanism as they bring the knowledge and
experience from those countries where the corporate governance is in best practice.
The result found a positive coefficient of CEO remuneration which shows the positive
relationship between CEO remuneration and bank performance. The result indicates that
better pay of CEOs has a positive influence on bank performance. The result suggests that
markets perceive that better pay motivates the manager to perform better which improves the
performance of banks.
The FE results are presented in Table 8.6 which shows the same result in the case of board
size, board diligence, audit committee size, audit committee independence and institutional
ownership.
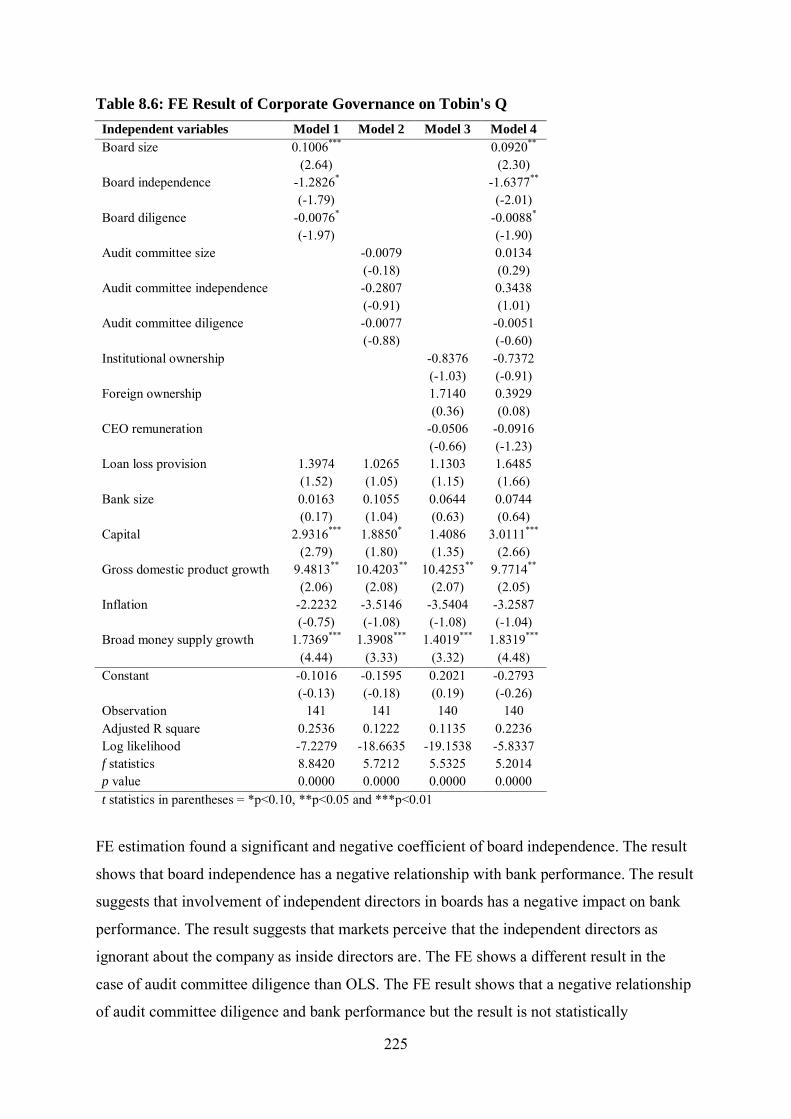
225
Table 8.6: FE Result of Corporate Governance on Tobin's Q
Independent variables Model 1 Model 2 Model 3 Model 4
Board size 0.1006***
0.0920**
(2.64)
(2.30) Board independence -1.2826*
-1.6377**
(-1.79)
(-2.01) Board diligence -0.0076*
-0.0088*
(-1.97)
(-1.90) Audit committee size
-0.0079
0.0134
(-0.18)
(0.29) Audit committee independence
-0.2807
0.3438
(-0.91)
(1.01) Audit committee diligence
-0.0077
-0.0051
(-0.88)
(-0.60) Institutional ownership
-0.8376 -0.7372
(-1.03) (-0.91) Foreign ownership
1.7140 0.3929
(0.36) (0.08) CEO remuneration
-0.0506 -0.0916
(-0.66) (-1.23) Loan loss provision 1.3974 1.0265 1.1303 1.6485
(1.52) (1.05) (1.15) (1.66) Bank size 0.0163 0.1055 0.0644 0.0744
(0.17) (1.04) (0.63) (0.64) Capital 2.9316*** 1.8850* 1.4086 3.0111***
(2.79) (1.80) (1.35) (2.66) Gross domestic product growth 9.4813** 10.4203** 10.4253** 9.7714**
(2.06) (2.08) (2.07) (2.05) Inflation -2.2232 -3.5146 -3.5404 -3.2587
(-0.75) (-1.08) (-1.08) (-1.04) Broad money supply growth 1.7369*** 1.3908*** 1.4019*** 1.8319***
(4.44) (3.33) (3.32) (4.48) Constant -0.1016 -0.1595 0.2021 -0.2793
(-0.13) (-0.18) (0.19) (-0.26) Observation 141 141 140 140 Adjusted R square 0.2536 0.1222 0.1135 0.2236 Log likelihood -7.2279 -18.6635 -19.1538 -5.8337 f statistics 8.8420 5.7212 5.5325 5.2014 p value 0.0000 0.0000 0.0000 0.0000 t statistics in parentheses = *p<0.10, **p<0.05 and ***p<0.01
FE estimation found a significant and negative coefficient of board independence. The result
shows that board independence has a negative relationship with bank performance. The result
suggests that involvement of independent directors in boards has a negative impact on bank
performance. The result suggests that markets perceive that the independent directors as
ignorant about the company as inside directors are. The FE shows a different result in the
case of audit committee diligence than OLS. The FE result shows that a negative relationship
of audit committee diligence and bank performance but the result is not statistically
226
significant. The result indicates that frequency of audit committee meetings has not a
significant influence on bank performance. The result suggests that the quality of meetings is
an important governance mechanism rather than the number of meetings. In comparison to
the OLS result, the FE result shows a positive relationship between foreign ownership and
bank performance but the result is not statistically significant. The FE result shows that
foreign ownership has no significant influence on bank performance. The result suggests the
importance of concentrated foreign ownership for the long term performance of bank. The FE
estimation shows a negative relationship between CEO remuneration and bank performance
but the result is not statistically significant. The result indicates that the pay of the CEO has
no significant influence on bank performance. The result suggests that the board submits a
compensation report to shareholders for approval before such compensation packages are
implemented.
To examine the relationship between corporate governance and bank performance measured
on a market value basis rather than book value basis, this thesis has also used the control
variables. The result shows that loan loss provision has no significant influence on bank
performance. The coefficient of bank size is not statistically significant which shows that
bank size has no significant influence on bank performance. Capital is found significant and
positively related with bank performance. The result indicates that the capital maintained by
bank has a positive determinant on bank performance.
The result shows that macro-economic variables have a significant influence on bank
performance. The significant and positive significant coefficient of GDP growth in all models
shows that GDP growth has a positive influence on bank performance. The result suggests
that with the improvement in economic activity, bank performance will also improve. The
result found that inflation has a negative influence on bank performance but the result is not
statistically significant. The result suggests that if the bank is able to anticipate inflation, it
may not significantly impact bank performance. The same applies to GDP growth while
broad money supply growth has a positive influence on bank performance.
The hypothesis of this study is tested on the basis of results provided by the FE model. The
study has hypothesized that board size has a negative relation with Tobin’s Q but the result is
in contrast with the hypothesis of this study. The result shows that large board size has a
positive impact on bank performance measured on a market value basis. The result fails to
227
support Hypothesis 15(C). This study has hypothesized that board independence and
diligence are positively related with bank performance but the result is the opposite of the
hypothesis. The result shows that board independence and diligence has a negative impact on
bank performance. The result fails to support Hypotheses 15 (C) and 16 (C) that board
independence and diligence is positively related to bank performance.
This study hypothesized that audit committee size, independence and diligence, institutional
ownership, foreign ownership and CEO remuneration is positively related with bank
performance measured by Tobin’s Q. But the result shows all these variables have no
significant influence on bank performance. So, on the basis of the results, Hypotheses 17(C),
18(C), 19(C), 20 (C), 21(C), 22(C) and 23(C) that audit committee size, audit committee
independence, audit committee diligence, institutional ownership, foreign ownership and
CEO remuneration are positively related with bank performance measured by Tobin’s Q is
not supported.
The overall result of this study shows that only board size has a negative influence on ROA,
whereas it positively impacts Tobin’s Q in Nepalese banks. Other corporate governance
variables used in this study have no significant determinants of ROA. The result shows that
board independence and diligence have the negative influence on Tobin’s Q and the other
corporate governance variables used in this study have no significant influence on Tobin’s Q.
Overall, the result shows that audit committee size, independence and diligence, institutional
ownership, foreign ownership and CEO ownership are not significant determinants of bank
performance measured by either accounting or market base.
8.4.1 Discussion of Influence of Governance on Bank Performance
The previous section described the results of corporate governance determinants of bank
performance i.e. ROA and Tobin’s Q, and tested the hypotheses of this study. This section
provides the discussion and analysis of the results.

228
Table 8.7: Summary of Results and Hypothesis Test
Dependent
Variables
ROA
Independent
Variables
Hypothesis
Number
Hypothesis
sign
Actual sign of
result
Statistical
significance of
results
Conclusion
(Hypothesis)
Board size 15(B) - - Significant Supported Board independence
16(B) + + Insignificant Not supported
Board diligence 17(B) + - Insignificant Not supported Audit committee size
18(B) + + Insignificant Not supported
Audit committee independence
19(B) + - Insignificant Not supported
Audit committee diligence
20(B) + - Insignificant Not supported
Foreign ownership
21(B) + + Insignificant Not supported
Institutional ownership
22(B) + + Insignificant Not supported
CEO remuneration
23(B) + + Insignificant Not supported
Control
variables
Loan loss provision
- + Insignificant
Size + + Significant Capital + + Significant GDP growth + + Insignificant Inflation - + Insignificant Broad money supply growth
+ + Insignificant
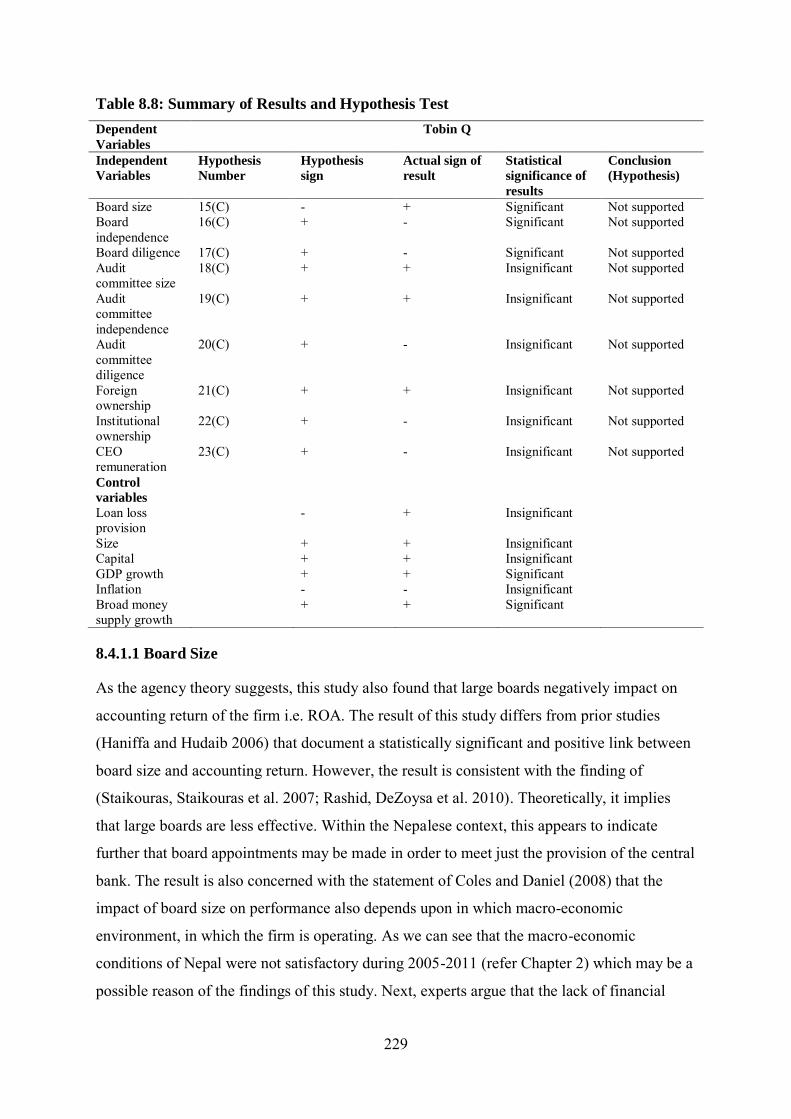
229
Table 8.8: Summary of Results and Hypothesis Test Dependent
Variables
Tobin Q
Independent
Variables
Hypothesis
Number
Hypothesis
sign
Actual sign of
result
Statistical
significance of
results
Conclusion
(Hypothesis)
Board size 15(C) - + Significant Not supported Board independence
16(C) + - Significant Not supported
Board diligence 17(C) + - Significant Not supported Audit committee size
18(C) + + Insignificant Not supported
Audit committee independence
19(C) + + Insignificant Not supported
Audit committee diligence
20(C) + - Insignificant Not supported
Foreign ownership
21(C) + + Insignificant Not supported
Institutional ownership
22(C) + - Insignificant Not supported
CEO remuneration
23(C) + - Insignificant Not supported
Control
variables
Loan loss provision
- + Insignificant
Size + + Insignificant Capital + + Insignificant GDP growth + + Significant Inflation - - Insignificant Broad money supply growth
+ + Significant
8.4.1.1 Board Size
As the agency theory suggests, this study also found that large boards negatively impact on
accounting return of the firm i.e. ROA. The result of this study differs from prior studies
(Haniffa and Hudaib 2006) that document a statistically significant and positive link between
board size and accounting return. However, the result is consistent with the finding of
(Staikouras, Staikouras et al. 2007; Rashid, DeZoysa et al. 2010). Theoretically, it implies
that large boards are less effective. Within the Nepalese context, this appears to indicate
further that board appointments may be made in order to meet just the provision of the central
bank. The result is also concerned with the statement of Coles and Daniel (2008) that the
impact of board size on performance also depends upon in which macro-economic
environment, in which the firm is operating. As we can see that the macro-economic
conditions of Nepal were not satisfactory during 2005-2011 (refer Chapter 2) which may be a
possible reason of the findings of this study. Next, experts argue that the lack of financial

230
expertise of board members also negatively impacts on bank performance which may be also
be a possible cause in Nepal.
In contrast to accounting return, board size is found to be positively related to the market base
measurement of performance and statistically significant. It also supports past evidence that
documents a statistically significant and positive nexus between board size and Tobin’s Q
(Beiner et al. 2006; Adams and Mehran 2008; Rashid,DeZoysa et al. 2010). However, it
contradicts the results of past studies that report statistically significant and a negative link
between board size and Tobin’s Q (Yermack 1996; Vefeas 1999; Haniffa and Hudaib 2006;
Coles et al. 2008; Guest 2009). The result argues that as the bank is more opaque and
complex than other non-financial firms and markets perceive that large boards are suited to
deal with organizational opaqueness and complexity as large boards may consist of
subsidiary directorships.
8.4.1.2 Board Independence
The result of this study is not consistent with the growing literature suggesting that board
independence plays an important role to mitigating the agency problem by monitoring and
controlling the opportunistic behavior of management and improves the firm performance.
The result is consistent with Fosberg (1989), Hermalin and Weisbach (1991), Bhagat and
Black (2001) and Rashid, DeZoysa et al. (2010) who don’t support the board independence as
an indicator of firm performance on the basis of accounting measurement in the case of non-
financial firms. In the case of the banking literature, the result is consistent with Staikouras,
Staikouras et al. (2007) and Al-Saidi and Al-Shammari (2013) for evidence on Europe,
Malaysia and Kuwait respectively.
In contrast to accounting return, board independence is found to be negatively related to the
market based measure of performance and statistically significant which is consistent with
findings of Bhagat and Bolton (2008) Fauzi and Locke (2012); Wang, Tsai et al. (2013). The
result contrasts the findings of Staikouras, Staikouras et al. (2007) who found a positive
relationship to board composition and bank performance as measured by market base.
The non-significant relationship of board independence and accounting return of Nepalese
banks supports the argument of Klein (1998) that independent directors may not have the
necessary knowledge, experience, time and skills to be effective monitors. The possible

231
reason for this result may be in Nepalese banks that all professional directors in the
professional list issued by the central bank may not have gained adequate experience and
skills in banking. The other possible reason is that the independent directors are appointed
through the central bank in Nepal from the professional list. Even though they are less
conflicted, they may be ignorant about the bank. Another possible reason is that generally,
professional directors who are in the professional list maintained by the central bank are
retired personnel from banks or other organizations. In this regard, age may matter, too. Older
directors, at some point, are likely to become less effective.
8.4.1.3 Board Diligence
This study found no significant relationship of board diligence to accounting return ROA in
Nepalese banks. The result is not consistent with agency theory which suggests that corporate
boards that meet more frequently have increased capacity to effectively advise, monitor and
discipline management, and thereby improve corporate financial performance. The study is
consistent with Hermalin and Weisbach (1991), Klein (1998), Bhagat and Black (2000),
Andres and Vallelado (2008), Brick and Chidambaran (2010) and Velnampy (2013) who
examined the influence of board monitoring on accounting returns of firms and failed to find
any relationship. Theoretically, frequent board meetings are not necessarily beneficial. A
higher frequency of board meetings, for example, can result in higher costs in the form of
managerial time, travel expenses, refreshment and directors’ meetings fees. The result is
consistent with the claim of Vefeas (1999) that frequent board meetings might imply either
the inefficiency of the board in making decisions leading to low firm performance, or the
board endeavoring to deal with existing problems. The result supports the argument of
Menon and Williams (1994) that frequency of board meetings is just a rough signal of
activity and not supporting any sign of the work accomplished during these meetings. It is
also argued that quality of time directors spend in board meetings is important rather the
quantity of time. The possible reason of this result in Nepalese banks may be supported with
the argument of DeZoorth (1997) that working experience and/or financial background of
directors, board members must have accounting and audit experience. In general, it can be
argued that the financial literacy of the directors helps them to better understand the
performance of firms and they can efficiently reach any strategic decision.
In terms of market base measurement, the result is consistent with Vafeas (1999), Carcello,
Hermanson et al. (2002) and Fich and Shivdasani (2006) who found a negative relationship
232
between board meetings and Tobin’s Q. Possible reasons for this finding may be that in
context of Nepal, markets perceive frequent board meetings as a signal of poor performance
of firms who claim that impact of boards is to help identify valuable investment
opportunities.
8.4.1.4 Audit Committee Size
This study found audit committee size does not have a significant contribution to bank
performance i.e. ROA and Tobin’s Q in Nepal. The result is not similar to many previous
studies in the literature which provide a significant positive relationship between audit
committee size and corporate performance, for example Klien (2002) in context of developed
economies the US. The other studies in context of developing economies, Coleman-
Kyereboah (2007) and AlBeera (2009) also reported the same result. All the above studies are
conducted in the context of non-financial firms which are different in nature to banks.
However, the findings of this study are consistent with Hamdan, Sarea et al. (2013), Rouf
(2011) and Ghabayen (2012) evidenced on Jordan, Bangladesh and Saudi Arabia
respectively. The findings of this study state that the proper size of audit committees is still
debatable in the corporate governance studies. Some empirical studies find that the normal
size of the audit committee in the UK and USA is about three to five members (Davidson,
Xie et al. 2004) whereas in Nepal it is ranged from three to six members. This study supports
the claim of such authors who argue that larger sizes of audit committees may delay the
decision making and cause avoidable debates. The result supports the argument that
effectiveness of audit committees, rather than size, is an important factor in enhancing the
firm’s performance. The result also supports the claim of Mohiuddin and Karbhari (2010)
that the audit committee should involve independent, expert, and knowledgeable members
who have adequate authority. The possible reason of this result in context of Nepal may be
affected by this problem mentioned by Mohiuddin and Karbhari (2010).
8.4.1.5 Audit Committee Independence
This study found there is not a significant contribution of audit committee independence on
bank performance in Nepal and this is not supported by agency theory. Most of the previous
authors suggest that independent directors can reduce the agency problem. As a result, audit
committee independence also reduces the agency problem in firms (Erickson, Park et al.
2005). The author suggests the importance of audit committee independence as independent
directors on the audit committee have no economic or personal relationship with
233
management. As a result, they perform their task effectively (Abbott, Parker et al. 2004).
However, the finding of this study does not support that audit committee independence
improves the firm performance. The finding is in line with of Kajola (2008) and Coleman-
Kyereboah (2007) who do not find any significant relationship of audit committee
independence on performance. This finding supports the argument of Byrd and Hickman
(1992) that to maintain the impression of active monitoring among shareholders, high-caliber
CEOs may dress up their firm’s board with professional directors. The finding supports the
conventional wisdom to appoint professionals with high credentials to serve on the audit
committee. Mustafa and Youssef (2010) also reported the same argument that audit
committee independence should not be effective unless the independent director is a financial
expert. The possible reasons of this finding may be supported with the claim of Mustafa and
Youssef (2010) in Nepalese bank. Besides this, Chan and Li (2008) also found that if the
audit committee is served by fifty percent of independent directors, this positively impacts on
firm value. In Nepalese banks, the audit committee is not served by fifty percent of
professional directors in all banks. This situation may be also affecting the effectiveness of
audit committees.
8.4.1.6 Audit Committee Diligence
This study was unable to find a significant impact of audit committee diligence on bank
performance which is in line with the findings of Wen-Yen and Pongpitch (2010) and Huang,
Lai et al. (2008) who were also unable to find a significant relationship between frequency of
audit meeting and bank performance. Most of the previous researchers such as Menon and
Williams (1994), Beasley et al. (2000), Xie et al. (2003), Abbott et al. (2004) and Anderson et
al. (2004) noted that frequency of audit committee meetings monitor the internal control and
provides reliable information to the shareholders, and have a positive impact on firm
performance which is not found in Nepalese banks. The result supports the argument of
Abbott Parker (2003) that the number of audit committee meetings may not enhance the
performance of firms if there is lack of quality in the meeting. The possible reason for this
finding may be that in complex firms, audit committees feel overloaded and agendas and
activities on compliance may be hampered by the audit committee effectiveness, as suggested
by KPMG (2008). Other possible reasons for this result may be in the context of Nepal that
the bank may fulfil the specified directives for just the compliance purposes with the purpose
of avoiding any disciplinary action by the regulators. However, meeting the minimum
requirements of audit committee meetings as directed by the regulator does not by itself

234
guarantee the effectiveness of an audit committee to improve the firm performance. Other
qualitative factors also play significant roles for the effectiveness of audit committees such as
the level of audit committee members, quality of discussion during meetings, qualification of
audit committee members, and organizational work environment may all have an influence
on audit committee performance.
8.4.1.7 Institutional Ownership
This study found institutional ownership does not have a significant influence on bank
performance in Nepal. The findings of this study are consistent with Agrawal and Knoeber
(1996), Loderer and Martin (1997) and Li and Qian et al.(2006) who found no significant role
of institutional ownership on firm performance. The finding of this study is distinct from the
results of other studies which support that hypothesis that higher institutional ownership has a
strong long term interest in the financial success of the companies and may play an active
role in monitoring top management (Baysinger and Hoskisson 1990;Chaganti and
Damanpour 1991;Han and Suk 1998). The result shows that even short-term performance
may not always benefit from an increase in institutional ownership. The result supports the
view that whether the increase in institutional ownership will improve firm performance, it
may not improve long-term performance because institutional investors may not always
represent the best interest of shareholders. External monitoring by teams of institutional
ownership does not always result in greater profitability or better corporate governance. The
study finds that only institutional ownership cannot be effective to enhance the operating
performance by interfering in the activities of management as the role is given to the board of
directors.
8.4.1.8 Foreign Ownership
The result of this study states that foreign ownership does not have a significant impact on
bank performance. The result is not supported by agency theory that foreign ownership
minimizes the agency cost which helps to maximize the firm performance. While examining
the impact of foreign ownership on firm performance, most studies for example, DeYoung
and Nolle (1996), Genay, Udell et al. (2000) and Ongore and K'Obonyo (2011) indicate
positive impacts of foreign ownership on performance. The result is not consistent with those
of most previous studies in other countries. Hence, the results concluded that the monitoring
role of foreign ownership does not work in Nepalese banks. The result is not supported with
the argument that foreign ownership can substitute for debt and help firms better by reducing

235
agency costs of equity by monitoring managers. The results conclude that concentrated
foreign ownership only plays a monitoring role because it lets the owners access qualified
information and sets up an efficient monitoring mechanism in the firms (Diaz-Diaz et al.
2008). Investors may only focus on short-term goals rather than long term returns in the
absence of concentrated ownership. In Nepalese banks, the foreign ownership is quite low
and divergent, thus the monitoring of foreign ownership on banking activities may not be
considerable.
8.4.1.9 CEO Remuneration
The result shows that the pay of CEO in Nepalese banks has no significant contribution to
bank performance. The result is not consistent with the rational behavior hypothesis that the
CEO is paid more to motivate them more and works harder to improve the financial
performance of the corporation that he/she leads. However, the finding of this study is not
supported with this argument in context of Nepalese commercial banks. This finding suggests
the bank think about the role of the CEO compensation as an incentive for improving bank
performance whether the designed CEO compensation actually affects the bank profitability
of this scale. The board members must make sure of the representation of shareholders while
designing the CEO remuneration. The result supports the argument of Lewellen and
Huntsaman (1970) that the management is not necessarily self-conscious to act with the
owner’s welfare in mind, and suggest that the board member’s goal is to figure out a way to
compensate to the CEO fairly while still giving him the incentive to look out for the best
interest of the bank. This dilemma minimizes the principal-agent problem. The principal-
agent relationship is in two parts that the agent (manager) is always looking out for his best
interests for good remuneration as much as possible whereas the principal (shareholder) owns
a stake in the company which helps them for the better performance of the company as much
as it can. So this study suggests that the board member must choose that way for the CEO
compensation which motives them for the better performance of firm. One theory is to use an
incentive-based contract where the CEO is paid a base salary and is rewarded with a
performance-based bonus. According to Murphy (1986) the level of managerial effort will
depend on an executive’s incentive contract. The possible reason for this finding in the
context of Nepal may be consistent with the argument of Murphy (1986) that pay and
performance are both heavily linked during the initial years of an executive’s career.

236
8.4.1.10 Control Variables
As a control variable, loan loss provision is found to have no significant effect on bank
performance. This implies that the size of loan loss provision as a measure of management’s
risk taking behavior does not have any significant effect on bank performance. This situation
may be supported with the fact that income from new granted loans compensates the risk of
uncollectable loans. The finding of this study is consistent with (Fanta, Kemal et al. 2013).
The result of this study found that bank size has a positive effect on bank performance;
implying larger banks enjoy better profits than smaller banks in terms of accounting
measurement. This benefit is likely to be due to economies of scale and larger market share
possessed by the larger bank which is in line with previous studies.
The finding of this study is consistent with claims of Berger (1995) that well capitalized
banks face lower costs of funding which reduces the risk incurred by the bank. Similarly, the
results support the argument of Sufian and Habibullah (2009) that strong capital structure
provides additional strength to withstand financial constraints and increased safety for
depositors during unstable macro-economic conditions particularly for banks operating in the
banking sector of developing economies. They can, therefore, afford to maintain the same
level of risk of investing in riskier assets whose expected return is of course higher. This
results in better performance.
In a scenario where balance sheets and conventional analytical tools becomes less
informative, macro-economic instability allows controlling shareholders to expropriate
minority shareholders and other stakeholders easily, as the ability to monitor the company
and its manager is seriously undermined.
The effect of GDP growth on bank performance is different depending on whether to
consider ROA and Tobin’s Q. In the first case, when ROA is considered, the effect is positive
but not significant. This situation shows that, generally, banks adjust their interest rate as the
trend of economic activity to maintain their profitability. But in the case of Tobin’s Q, GDP
growth is significantly positively related. This result shows that stock and bond investors are
always trying to predict uncertainty in the future and assess the risk and outcomes related
with growth, shifting resources back and forth between fixed income and co-ownership as
237
they forecast either bust or boom respectively. Equity risk premiums are much more a matter
of forecasted future growth differential than they are of past or even present.
The finding reveals that inflation has no significant impact on bank performance in both
measurement i.e. accounting and market. The result suggests that the effect of inflation on
bank returns depends upon whether it is anticipated or unanticipated. In the situation of
anticipated inflation, the bank can adjust their interest rate which keeps the bank on target for
their profitability. In the case of market measurement, the stock traders have professionals on
stock trades and do transactions of stocks with the hope of profit making from changes in
share prices. They are interested in short-term profitability rather than long-term profitability
or the value of assets of the company. The prediction that others will buy shares in future
motivates the stock traders to buy shares with the hope to sell the share with high price. If
others believe the same thing, then the wave of buying pressure will, in fact, cause the price
to rise.
This study found that money supply growth has no significant impact on profitability of
banks in the context of Nepal. The results argue that although money supply is basically
determined by the central bank policy, it could also be affected by the behavior of households
that hold money, and banks in which money is held. Similarly, it is argued by previous
researchers that the broad money supply impacts on the stock market as well. So, the finding
of this study supports this argument that monetary policy influences stock returns by the
discount rate (the weighted average cost of capital) and the future stream of cash flows.
Tightening of the monetary policy raises the rate of interest which reduces net profits. Hence,
it may be concluded that tightening of monetary policy helps to minimize the inflation rate
and also stock prices as it leaves less money for individuals to demand goods or to buy
stocks.
Using accounting based performance, only board size is found significant and negatively
impacts on bank performance in Nepal, whereas other corporate governance variables used in
this study do not show any important or significant influence on bank performance. This is
also proved by previous research in context of developed as well as in developing economies.
In contradiction to accounting based performance, the study shows board size has a positive
influence on bank performance on market based measurement, whereas board independence
and diligence has a negative influence on bank performance.

238
8.5 Summary
The results and discussion of corporate governance determinants of bank performance is
discussed in this chapter. The relationship of corporate governance and bank performance in
Nepal from the hypothesis, which was tested for statistical significance, was discussed in
relation to the theory, literature and context of the study. The results revealed that among the
corporate governance variables, board size were found as a significant determinant of
accounting return i.e. ROA of the bank. Other governance variables used in this study have
no significant influence on bank accounting return ROA in Nepal. In addition to board size,
board independence and diligence have a significant influence on bank performance
measured by market base and the other governance variables used in this study are not related
as significant determinants of bank performance. In summary, the results show that board
size, in the case of accounting return and board size, independence and diligence in case of
market return, are the only significant determinants of bank performance. The results
conclude that Nepalese banks started to follow the corporate governance practice after the
issuance of directives by the central bank in 2005. This shows that still the Nepalese
commercial banks are in a transition period to adopt good corporate governance practice
which is proved by the results of this study. Most of the corporate governance variables such
as audit committee size, independence, diligence, institutional ownership, foreign ownership,
and CEO remuneration have no significant influence on bank performance in Nepalese
banks.
239
CHAPTER NINE
Conclusions and Recommendations
9.1 Introduction
This chapter discusses the economic and political environment in which banks perform in
Nepal. It also discusses the strategies firms have used to counteract the adverse effects of the
volatile economic and political environment which have resulted in the resilience of the
economy. The findings of the study are based on various theoretical perspectives and the
empirical literature about corporate governance practices of both developed and developing
countries. Furthermore, this chapter provides a summary of the conclusions drawn from the
determinants of Non-performing Loan (NPL) and the influence of corporate governance on
NPL and bank performance. Finally, recommendations for the code of best practice and the
proposed conceptual framework for future research are summarized.
The structure of the chapter is organized as follows: Section 9.2 provides an overview of the
research question and Section 9.3 provides the focus of study. Section 9.4 presents the
findings of the study and Section 9.5 discusses the implications of the study. Section 9.6
discusses the limitation of the study and recommendations for future research. Section 9
concludes the study.
9.2 Overview of the Research Questions
The research questions of this thesis were as mentioned under
a. What are the macro-economic determinants of NPL in Nepalese banks?
b. What are the bank specific determinants of NPL in Nepalese banks?
c. What are the combined macro-economic and bank specific determinants of NPL in
Nepalese banks?
d. What are the influences of corporate governance on NPL in Nepalese banks?
e. What are the relationships between corporate governance and bank performance in
context of Nepalese banks?
Nepal relies on local and foreign investment and international trade to mobilize the economy.
Understanding the determinants of NPL and good corporate governance are essential to

240
building depositor confidence. Successfully attracting investment from both local and foreign
investors provides a stimulus to the economy which results in increased productivity and
growth. As a result, regulatory reforms in corporate governance were developed in Nepal
through the introduction of a code of best practice in 2006.
The economy of Nepal i.e. its GDP growth grew by an impressive 6.10 percent in 2008 in the
midst of a number of serious challenges including adverse weather conditions, political
disturbances and frequent insurgency. The economy’s resilience to these adverse conditions
was reflected in the growth of the service, industrial and agriculture sectors.
Survival strategies of the banks to maintain a healthy profitability amidst the economic and
political adversities were extremely important to the economy of Nepal. Banks were
undertaking strategies to mitigate risk by diversification into new products and new markets
and undertaking emergency reassessment of the short-term goals in the backdrop of a
worsening country scenario. Some high performing banks have ventured into new businesses.
One of the factors for the good performance of some banks that operated in a highly volatile
environment is their effective risk management practice. Furthermore, stock market
performance showed share prices in Nepal were also driven by speculative activities but
governance practices in Nepal are trying to provide accountability to shareholders.
9.3 Focus of Study
The magnitude of NPL is a key element in the initiation and progression of financial and
banking crises. Ahmad (2002) reported a significant relationship between NPL and financial
crises and concluded that credit risk which is often measured by NPL had already started to
build up before the onset of 1997. Laeven and Valencia (2008) counted 124 systemic banking
crises over the period 1970 to 2007. The Asian financial crisis had become more serious as
NPL increased. Further, the current impending global financial crisis which began in the
United States is attributed to the August 2007 collapse of the sub-prime mortgage market. In
fact, there is evidence that the level of NPL in the US started to increase substantially in early
2006 in all sectors (Greenidge and Grosvenor 2010). NPL are, therefore, a measure of the
stability of the banking system, and thereby the financial stability of a country. In addition,
banking crises have significant costs. Honohan and Klingebiel (2000) found that developing
countries spent 14.3 percent of GDP to clean up their financial systems from the
consequences of such crises. Thus, the first step of building a stable and strong financial

241
system is to minimize NPL or bad debt levels (Campbell 2007; and Sanjeev 2007). So the
research on determinants of NPL is motivated by the above discussion.
Besides the above factors, research in corporate governance was motivated by renewed
public interest after high profile corporate failures and scandals occurred internationally.
There were strong calls for greater accountability and transparency concerning the way
corporations are controlled and managed. In response, a range of laws impacting corporate
governance were passed in several countries. The codes or principles and guidelines were
basically a non-binding set of principles, standards or best practices, issued by a collective
body and relate to the internal governance corporations (Well and Manges 2003). The view
taken was that the codes/principles based governance approaches allow companies and/or
industries to develop governance structures that are specific to their context.
To improve the standard of governance practiced in Nepal, the central bank issued NRB
directives regarding corporate governance for bank which are supported by suggestions or
guidelines as to how the principles should be implemented. It was assumed that the adoption
of principles and guidelines would result in good governance practices leading to improved
financial performance. It was recognized that the board of directors is an important internal
governance mechanism and can play a more proactive part in discharging a fiduciary role for
improving a company’s financial performance. In this regard, the NRB directives regarding
corporate governance focused on making boards more independent of management by having
an independent chair, and professional directors as members of board committees such as
audit, remuneration and risk management.
This thesis, firstly reports an investigation of determinants (macro-economic and bank
specific) of NPL in Nepalese commercial banks. Secondly, an examination of whether or not
governance variables influence NPL in the context of Nepalese commercial banks has also
been a focus of this study. The governance factors implemented through board independence
and activity, and board committees recommended by Central Bank of Nepal are of particular
interest in this regard.
This research also examined the influence of corporate governance mechanisms on bank
performance in the context of Nepal. These mechanisms include board size, board
independence, board diligence, audit committee size, audit committee independence and

242
audit committee diligence. In addition to this mechanism, this study also included ownership
structure and CEO remuneration as part of the analysis of influence of these variables on
Nepalese bank performance. In regards to performance of commercial banks, the research
adopts accounting and market based measurements i.e. ROA and Tobin’s Q.
The data for the bank are obtained from Annual Reports for the period 2001 to 2011 and also
hand collected from individual banks in regards to corporate governance variables. For the
macro-economic variables, the study used monetary policy reports, various publications and
reports of Central Bank of Nepal, and World Bank data bases as sources. Ordinary Least
Square (OLS) regression techniques on pooled data are used to test the hypotheses. The FE
and RE regression technique is used to control for unobserved heterogeneity. GMM is
employed in the context of NPL to control endogeneity.
9.4 Summary of the Findings
This section summarizes the finding of this thesis. In the process of this, this section
summarizes the results of macro-economic and bank specific determinants of NPL of
Nepalese banks. Besides this, the influence of corporate governance on Nepalese bank NPL
and performance is also summarized in this section.
9.4.1 Macro-economic Determinants of Non-performing Loan
The financial intermediaries’ model explains that banks predict the macro-economic
conditions of a country to forecast possible returns on lending, whilst businesses use macro-
economic analysis to determine whether their operation will be welcomed by the market. This
study has hypothesized that macro-economic conditions of Nepal are the main factors
affecting the NPL of bank to fulfill the research question. The relevant variables that were
hypothesized as a macro-economic predictor of NPL are: GDP growth, GDP growth one year
lag, inflation, inflation one year lag, broad money supply growth, exchange rates, growth of
share prices index, and market interest rates. However, among all macro-economic variables
used in this study, four variables were found to be statistically significantly related to NPL in
context of Nepalese banks.
According to the theory the study found that GDP growth one year lag, foreign exchange and
market interest rates have a positive impact on loan quality of banks and help to minimize
NPL. By contrast, the study found that inflation has a negative relation to NPL in the context

243
of Nepal. The study found other macro-economic variables including current GDP growth,
inflation lag, money supply growth and growth of share prices index have no significant
influence on bank NPL which is supported by theory.
9.4.2 Bank Specific Determinants of Non-performing Loan
This study hypothesized eight potential bank specific variables to meet the objectives of the
study. Apart from macro-economic economic variables, bank specific variables may also be
explained as determinants of NPL. The financial intermediaries’ theory and agency theory
suggest that the bank specific factors such as NPL one year lag, loan growth, loan loss
provision, and interest rate spread have a positive relationship with bank NPL. The study
found this result is in line with the theory that NPL lag and loan loss provisions have a
maximize bank NPL. A negative relationship was found in the case of loan growth which is
in contrast to the expected theory. Similarly, the result does not support the theory that a
higher interest rate spread has a negative impact on loan quality and increases NPL, as the
study found no significant impact on NPL in the case of Nepal.
Similarly, the study supports the theory that branch growth, bank size, earnings and capital
have a negative relationship with NPL and contribute to minimize NPL of banks. However,
the study found that bank size and earnings have a positive impact on loan quality and
minimize NPL, which is in line with the theory as suggested. The findings of this study do
not support the theory that branch network and capital are negatively related to bank NPL. So
the study found that NPL lag, loan growth, loan loss provision, bank size and earnings are
determinants of NPL in context of Nepalese banks.
9.4.3 Influence of Governance on Non-performing Loan
To examine the objective of this study that corporate governance has a significant influence
on bank NPL, the relevant variables that were hypothesized are: board size, independence
and diligence, audit committee size, independence and diligence, institutional ownership,
foreign ownership, and CEO remuneration. Other bank specific and macro-economic
variables have been used as control variables. Based on agency theory and the previous
literature, this study hypothesized that board size has a positive relationship with NPL,
whereas other corporate governance variables used in this study had a negative relationship
with NPL. The study found the results were in line with the theory that board independence
has positive impact on loan quality and minimize the bank NPL, whereas audit committee

244
size, audit committee independence and institutional ownership were found positively related
to NPL which is in contrast to theory.
The result is not supported with the theory that board size, board diligence, audit committee
diligence, foreign ownership and CEO remuneration have a significant influence on bank
NPL in the context of Nepal.
9.4.4 Influence of Governance on Bank Performance
The study used nine corporate governance variables to examine their influence on bank
performance. The study used two measurement of bank performance, namely accounting
base measurement (ROA) and market base measurement (Tobin’s Q). The study also used
loan loss provision, bank size, capital, GDP, inflation and broad money supply as control
variables.
As per agency theory, this study hypothesized that board size had a negative impact on bank
performance, whereas other corporate governance variables used in this study have a positive
impact on bank performance. The regression results showed that only board size is a
significantly negative influence on ROA, in context of banks in Nepal in accordance with the
theory. Other variables have no significant influence on bank performance as measured by
ROA, and is not supported by the theory. However, when the study considers the market
based measurement performance of banks, board size was found a positive influence on bank
performance which is contradiction with the theory. This study also found the result
contrasted with the theory that board independence and board diligence have a negative
influence on bank performance. The other governance variables such as audit committee size,
audit committee independence, audit committee diligence, foreign ownership, institutional
ownership, and CEO remuneration have no significant influence on bank performance in both
measurement i.e. accounting and market, which does not support the theory, in context of
Nepalese commercial banks.
In conclusion, this study found that the Nepalese commercial banks need to pay attention to
bank specific variables and corporate governance variables rather than just blaming the
macro-economic condition of the country. This study shows that among the macro-economic
variables used in this study, GDP with one year lag, inflation, market interest rate and the
fluctuations in the exchange rate are the significant variables that drive the banks’ NPL in
245
Nepal. With these macro-economic variables, other bank specific variables NPL lag, loan
loss provision, loan growth, earnings and bank size were significant variables to explain NPL.
Considering the importance of governance to minimize the risk in the banks in Nepal, this
study also found that board independence, audit committee size, audit committee
independence and institutional ownership were important variables which also influenced
bank NPL in Nepal, along with macro-economic and bank specific variables.
In the case of bank performance, the study revealed that only one corporate governance
variable that is board size, was found as a significant determinant of accounting return, ROA.
In addition to board size, board independence and diligence have a significant influence on
bank performance measured by market return. The study concludes that board size is a
significant variable which influence the bank performance in terms of both accounting return
and market return. Board independence and diligence are the additional significant variables
that influence the bank performance in terms of market return.
9.5 Implication of the Study
This section discusses the implication of this thesis. This section presents the implication of
this study for theory, practitioners, policy makers and regulatory agencies.
9.5.1 Implication for Theory
This study was accomplished to broaden the framework of theories. The theory of financial
intermediation focuses on an intermediary role of banks where they are delegated to
monitoring depositors’ money as well as checking borrowers’ activities on behalf of
depositors to ensure that they have all the necessary information to reduce an asymmetric
information problem. Our findings concerning the relationship between NPL and rapid rate of
growth of loans and earnings of banks have proven that the implications of this study support
the theory of financial intermediation. However, when management of a bank relaxes their
credit standards or takes on excessive risk, the probability of an adverse selection and moral
hazard activities increases, which leads to an increase in the NPL.
The findings regarding the impact of bank size on their NPL exposure supports the portfolio
theory that the larger bank has more diversification opportunities compared with the smaller
bank. As a result, they have low NPL and they are safer.

246
Capital assets pricing theory suggests that systematic risk results from external factors
whereas unsystematic risk results from internal factors. The findings are consistent with the
capital assets pricing theory. We found that aggregate economic activity, inflation, market
interest rate and exchange rate which are (systematic variables) by their nature, have
significant impacts on NPL. Moreover, the study found that lag NPL, loan loss provision,
loan growth, efficiency and bank size, which are unsystematic by their nature, have a
significant impact on NPL.
Agency theory suggests that good corporate governance reduces the agency cost for
shareholder wealth maximization to creating shareholder value and protecting the interests of
all stakeholders. Good corporate governance practices are important for accountability to
shareholders and other stakeholders. The results show the size of boards of directors is an
important element of corporate governance which maximizes the bank performance and stock
performance. However, the result regarding other corporate governance variables,
specifically board independence, board diligence, audit committee size, independence and
diligence, ownership structure and CEO remuneration on bank performance, contradicts
agency theory.
9.5.2 Implication for Practitioners, Policy Makers and Regulatory agencies
The results leave several implications for banks in Nepal. Viewing evidence about what
drives bank NPL will help Nepalese banks understand which economic and financial factors
are critical to track and analyze in order to attain operational success and forecast their NPL
in the future. The study also supports the convention that commercial banks should pay
attention to the performance of the real economy when providing loans so as to reduce the
magnitude of NPL. In an effort to control the magnitude of NPL in Nepal, bank regulators
should seek to implement measures designed to ensure that bank maintain adequate provision
and conservative credit standards during instances of economic growth in order to mitigate
the effect of increased NPL during periods of recession.
Moreover, the practical implication of this study is to provide a guideline for the bank’s in
Nepal that should be taken in terms of the formulation of strategies and credit policies. The
bank should follow a prudent credit policy during good economic conditions, not a lenient
policy. Although the ability of the borrowers to repay their financial obligations increases
during boom periods, the study found that NPL resulting during good economic conditions

247
are carried forward to the period following the recession periods. These lags heightened the
NPL problems during recession periods. In addition, the bank should not reduce stringent
credit standards during the low interest periods because of the positive conditions associated
with the low interest rates. This leads to an increase in the probability of an asymmetric
information problem which contributes to raising bank exposure to NPL. Besides this, policy
makers can have a “bird’s eye view” regarding the results of their decisions previously taken.
They also can make prudent judgments in preparing further NPL minimizing policy.
For practitioners to mitigate their overall bank exposure to NPL, they have to align their bank
capital with their NPL exposure. The results show bigger banks manage their risk better than
smaller banks. The results emphasize the role of bank capital in increasing their soundness
and safety. The capital of banks represents the first line of defense against risks that could
affect the income of banks, negatively. The banks which have a higher capital ratio have
lower probability of insolvency. Hence, banks should maintain a strong capital base capable
of absorbing various types of risk. On the other hand, the findings stress the important
function of the central bank in monitoring and guiding the bank to ensure the soundness and
stability of the financial system. In this aspect, the central bank should keep up with the latest
international development in the field of banking. For example, the results show that the
commitment of banks to comply with the instructions of the central bank for Basel standards
in capital adequacy increases the stability of banks.
A lag of NPL was found to be positively related to the NPL in this study. Hence, the bank
should take remedial actions to address the bank loan problem without any delay. If the bank
does not take corrective actions immediately, the problem will be more complicated. When
banks transfer problem loans to the next periods, this will increase the duration of the
negative impact on the bank profitability. The continued success of the Nepalese banking
sector depends on its efficiency, profitability, and competitiveness. In view of the increasing
competition attributed to the more liberalized banking sector, bank management as well as
the policymakers will be more inclined to find ways to obtain the optimal utilization of their
capacities as well as making the best use of their resources, so that these resources are not
wasted during the production of banking products and services. Thus, from the regulatory
perspective, the performance of banks will be based on their efficiency and profitability. The
policy direction will be directed towards enhancing the resilience and efficiency of the

248
financial institution with the aim of intensifying the robustness and stability of the banking
sector in Nepal.
To improve accountability and transparency of managerial decision making to shareholders,
the central bank directives recommended that boards should be comprised of professional
directors and have audit committees whose members should be independent. However, the
availability of a small pool of directors for board positions in banks has created three
different types of problems: (i) difficulty in finding directors who are totally independent; (ii)
the creation of an “over boarding problem” where some directors sit on too many Boards of
different companies; and (iii) the appointment of independent directors who lack appropriate
skills.
The problem of selection of board members in banks tends to affect board performance and
financial performance. Important areas for the future reform of bank boards should include an
increased emphasis on selecting board members based on skills required. Similarly, it is very
important to include financial expertise in audit committees of banks for good governance
practices. Addressing these issues will lead to an improvement in the application of a
principle-based governance approach.
9.6 Limitation of the Study
This study has significantly contributed to our understanding that macro-economic, bank
specific and governance impact on NPL and performance of banks. However, as with any
research, this study is subject to a number of limitations as listed below.
The sample in this study has excluded the state owned banks. Hence, the outcome from this
study cannot be generalized to state owned banks. The study explored the macro-economic
determinants of NPL consisting of only six variables i.e. GDP growth, inflation, broad money
supply growth, foreign exchange, market interest rates, and growth of the share prices index.
The future research may extend these variables by considering other variables, for example
unemployment rate, terms of trade, indebtedness etc. Similarly, when considering bank
specific variables, this study has not considered the loan concentration which is also one of
the important determinants of NPL. So, it is recommended to include this variable also in
future research. In the case of examining the impact of corporate governance on NPL and
249
bank performance, the study has considered data only for seven years. The results may differ
if multiple years are considered for analysis.
Data used in this thesis were extracted from the financial annual reports of the banks.
Financial account reports suffer from the following errors: they are subject to manipulation,
they may systematically undervalue assets; they may produce alterations due to the nature of
depreciation methods implemented, the method of inventory valuation, and the treatment of
certain revenue and expenditure items.
Besides the selected characteristics, this study does not investigate the impact of other
qualitative factors such as the culture and dynamics of boards of directors and audit
committees which may have an influence on bank performance. For instance, relationships
between members of the board with those of the audit committee, or shareholders, are not
explored. As such, the effectiveness of their activities, the scope of reference for the audit
committee or support given by the internal auditor on the audit committee, which may have
an impact on the bank performance, are not included in this study. This thesis explores four
important governance mechanisms namely; board of directors, audit committee, ownership
structure, and CEO remuneration. Among the corporate governance variables, the study has
not included the board expertise and audit committee expertise which may also drive the bank
performance. Similarly, in the case of ownership structure, the research may extend the
variables with ownership mix and concentration. While this study checked only internal
governance mechanisms, it is possible that external governance factors not explored in this
study also determine the NPL and performance of bank.
I hope that these limitations do not compromise on the validity or conclusions drawn based
on the results.
9.7 Conclusion
This concluding chapter has discussed briefly the overview of the research question of this
study. To address the research question, this chapter described the importance of
investigation of determinants of NPL. Similarly, the role of corporate governance in the bank
performance of Nepal is also discussed. The chapter presented the summary of findings of
this study. It was found that both macro-economic and bank specific variables are important
indicators which influence NPL in the context of Nepal. Similarly, corporate governance

250
variables are also considered as predictors of NPL. However, corporate governance variables
are not important predictors for bank performance, in the context of Nepal as expected. Only
board size, board independence and audit committee size are considered as main predictors of
bank performance. The results and what they imply for theory and practitioners, policy
makers and regulators are also discussed. It was suggested that future research should be
carried out considering qualitative factors with an extended time span, and some more macro-
economic, bank specific and corporate governance variables where this thesis has some
limitations. The main contribution of this study is to help the policy makers, practitioners and
researchers to understand better the determinants of NPL and role of corporate governance, in
context of developing economies such as Nepal by which commercial banks in Nepal manage
their NPL and performance and regulatory bodies safeguard the stability and integrity of the
financial system.

251
List of References
Abbott, L. J., Park, Y. & Parker, S. (2000). “The Effects of Audit Committee Activity and
Independence on Corporate Fraud.” Managerial Finance 26(11): 55-68.
Abbott, L. J., Parker, S. and Peters, G.F. (2004). “Audit Committee Characteristics and
Restatements.” Auditing 23(1): 69-88.
Abbott, L. J., Parker, S., Peters, G.F. and Rahunandan, K. (2003). “The Association Between
Audit Committee Characteristics and Audit Fees.” Auditing 22(2): 17-32.
Acharya, M. (2003). “Development of the Financial System and Its Impact on Poverty
Alleviation in Nepal” Economic Review, Occassional Paper, Nepal Rastra Bank (15):
1-32.
Adams, J. S. (1966). “Inequity in Social Exchange.” Advances in Experimental Social
Psychology 2: 267-299.
Adams, R. B. and Ferreira, D. (2009). “Women in the Boardroom and Their Impact on
Governance and Performance.” Journal of Financial Economics 94(2): 291-309.
Adams, R. B. and Mehran, H. (2003). “Is Corporate Governance Different for Bank Holding
Companies.” Economic Policy Review 9(1): 123-142.
Adams, R. B. and Mehran, H. (2008). Corporate Performance, Board Structure, and their
Determinants in the Banking Industry. New York, Federal Reserve Bank of New
York: 1-49.
Adams, R. B. and Mehran, H. (2012). “Bank Board Structure and Performance: Evidence for
Large Bank Holding Companies.” Journal of Financial Intermediation 21(2): 243-267.
ADB (2010). Nepal: Corporate and Financial Governance Project. Asian Development Bank.
Manila, Asian Development Bank Project number 28332.
ADB (2010). Nepal: Corporate and Financial Governane Project ADB, Completion Report
Asian Development Bank, Philipinnes.
Adhikary, D. K., Pant, R. and Dhungana, B.R. (2007). “Study on Financial Sector Reform in
Nepal: Overall Impact and Public Ownership of Financial Institution.” Prepared for:
South Asian Network of Economic Institutues (SANEI) Project Research &
Management Associates P.Ltd., Kathamandu, Nepal.
Aggarwal, R. and Jacques, K.T. (2001). “The Impact of FDICIA and Prompt Corrective
Action on Bank Capital and Risk: Estimates Using a Simultaneous Equation Model.”
Journal of Banking & Finance 25(6): 1139-1160.
252
Aghion, P., Howitt, P. and Mayer-Foulkes, D. (2005). “The Effect of Financial Development
on Convergence: Theory and Evidence.” Quarterly Journal of Economics 120(1):
173-222.
Agle, B. R., Donaldson, T., Freeman, R.E., Jensen, M.C., Mitchell, R.K. and Wood, D.J.
(2008). “Toward Superior Stakeholder Theory.” Business Ethics Quarterly 18(2):
153-190.
Agnello, L., Furceri, D. and Sousa, R.M. (2011). Fiscal Policy Discretion, Private Spending,
and Crisis Episodes. NIPE, Working Papers, WP31, University of Minho.
Agnello, L. and Sousa, R.M. (2012). “How Do Banking Crises Impact on Income
Inequality?” Applied Economics Letters 19(15): 1425-1429.
Agrawal, A. and C. R. Knoeber (1996). “Firm Performance and Mechanisms to Control
Agency Problems Between Managers and Shareholders.” Journal of Financial and
Quantitative Analysis 31(3): 377-397.
Aguilera, R. and Cuervo-Cazurra, A. (2009). “Code of Good Governance.” Corporate
Governance: An International Review 17(3): 376-387.
Ahmad, N. H. (2003). Formation Credit risk, Regulatory Price Effect and the Path Linking
Credi to Total Risk. Thesis Doctor of Philosophy, University Utara Malaysia.
Ahmad, N. H. and Ariff, M. (2007). “Multi-country Study of Bank Credit Risk
Determinants.” The International Journal of Banking and Finance 5(1): 135-152.
Aitken, B. J. and Harrison, A.E. (1999). “Do Domestic Firms Benefit from Direct Foreign
Investment: Evidence from Venezuela.” American Economic Review 89(3): 605-618.
Al-Matari, Y. A., Al-Swidi, A.K. and Fadzil, F.H. (2012). “Board of Directors, Audit
Committee Characteristics and Performance of Saudi Arabia Listed Companies”
International Review of Management and Marketing 2(4): 241-251.
Al-Saidi, M. and Al-Shammari (2013). “Board Composition and Bank Performance in
Kuwait: An Empirical Study.” Managerial Auditing Journal 28(6): 472-494.
Al-Thuneibal, A. A., Issa, R.T.I. and Baker, R.A.A. (2011). “Do Audit Tenure and Firm Size
Contribute to Audit Quality? Empirical Evidence from Jordan.” Managerial Auditing
Journal 26(4): 317-334.
AlBeera, A. E. (2009). Corporate Governance Structure and Firm Performance: Evidence
From Consumer Product Firms in Malaysia. Master of Science, University of Utara
Malaysia.
253
Ali, A. and Daly, K. (2010). “Macroeconomic Determinants of Credit Risk: Recent Evidence
from a Cross Country Study.” International Review of Financial Analysis 19(3): 165-
171.
Allen, F. (2005). “Corporate Governance in Emerging Economies” Oxford Review of
Economic Policy 21(2): 164-177.
Allen, F. and Gale, D. (1995). “A Welfare Comparison of Intermediaries and Financial
Markets in Germany and the US.” European Economic Review 39(2): 179-209.
Allen, F. and Santomero, A.M. (1997). “The Theory of Financial Intermediation.” Journal of
Banking & Finance 21(11): 1461-1485.
Allen, F. and Santomero, A.M. (2005). “What Do Financial Intermediaries Do?” Journal of
Banking and finance 25(2): 271-294.
Allen, J. W. and Phillips, G.M. (2000). “Corporate Equity Ownership, Strategic Alliances,
and Product Market Relationship.” Journal of Finance 55(6): 2791-2815.
Allison, P. D. (2009). Fixed Effects Regression Models. California, Sage Publications.
Altunbas, Y., Liu, M., Molyneux, P. and Seith, R. (2000). “Efficiency amd Risk in Japanese
Banking.” Journal of Banking & Finance 24(10): 1605-1628.
Anderson, R. C., Mansi, S.A. and Reeb, D.M. (2004). “Board Characteristics, Accounting
Report Integrity, and the Cost of Debt.” Journal of Accounting and Economics 37(3):
315-342.
Andres, P. and Vallelado, E. (2008). “Corporate Governance in Banking: The Role of the
Board of Directors.” Journal of Banking & Finance 32(12): 2570-2580.
Angbazo, L. (1997). “Commercial Bank Net Interest Margins, Default risk, Interest-rate Risk,
and Off-balance Sheet Banking.” Journal of Banking & Finance 21(1): 55-87.
Arellano, M. and Bond, S.R. (1991). “Some Test of Specification for Panel Data: Monte
Carlo Evidence and an Application to Employment Equations.” Review of Economic
Studies 58(2): 277-297.
Arellano, M. and Bover, O. (1995). “Another Look at the Instrumental-variable Estimation of
Error-component Models.” Journal of Econometric 68(1): 29-52.
Arestis, P. and Skouras, T. (1985). Post Keynesian Economic Theory: A Challenge to Neo
Classical Economics, ME Sharpe Inc.
Arpa, M., Giulini, I., Ittner, A. and Pauer, F. (2001). “The Influence of Macroeconomic
Development on Austrian Banks: Implicaiton for Banking Supervisin.” BIS papers:
91-116.
254
Arun, T. G. and Turner, J.D. (2004). “Corporate Governance of Banks in Developing
Economies: Concepts and Issues.” Corporate Governance: An International Review
12(3): 371-377.
Athanasoglou, P. P., Brissimis, S.N. and Delis, M.D. (2008). “Bank-specific, Industry-
specific and Macroeconomic Determinants of Bank Profitability.” Journal of
International Financial Markets, Institutions and Money 18(2): 121-136.
Aver, B. (2008). “An Empirical Analysis of Credit Risk Factors of the Slovenian Banking
System.” Managing Global Transitions 6(3): 317-334.
Baddeley, M. C. and Barrowclought, D.V. (2009). Running Regressions: A Practical Guide
to Quantiative Research in Economics, Finance and Development Studies. New York,
Cambridge University Press.
Baele, L., Vander, V. and Landschoot, A.V. (2005). “Bank Behaviour Across the Business
Cycle.” Retreived from http://finprop.de/Paper4_Baele_Vennet.pdf.
BAFIA(2006). Bank and Financial Institution Act 2006, Nepal Rastra Bank
Baltagi, B. H. (2008). Econometric Analysis of Panel Data, John Wiley & Sons, Ltd., New
York, USA.
Banker, R. D., Devaraj, S., Schroeder, R.G. and Sinha, K.K. (2002). “Performance Impact of
the Elimination of Direct Labor Variance Reporting: A Filed Study.” Journal of
Accounting Research 40(4): 1013-1036.
Barberis, N., Boycko, M., Shleifer, A. and Tsukanova, N. (1996). “How Does Privatization
Work? Evidence From the Russian Shops.” Journal of political Economy 104(4): 764-
790.
Barkema, H. G. and Gomez-Mejia, L.R. (1998). “Managerial Compensation and Firm
Performance: A General Research Framework.” Academy of Management Journal
41(2): 135-145.
Barrow, C., Barrow, P. and Brown, R. (2005). The Business Plan Workbook, Kogan Page
Ltd.
Barth, J. R. and Caprio, G. (2004). “Bank Regulation and Supervision: What Works Best?”
Journal of Financial Intermediation 13(2): 205-248.
Basel (1997). “Core Principle for Effective Banking Supervision.” Bank for International
Settlements, Switzerland.
Basel (1999). Enhancing Corporate Governance for Banking Organization. Bank for
International Settlements, Switzerland.
255
Basel (1999). “Principles for the Management of Credit Risk” Consultive paper issued by
Basel Committee on Banking Supervision, Basel.
Basel (2001). “Operational Risk Management” Consultive paper issued by Basel Committee
on Banking Supervision, Basel, Switzerland.
Basel (2006). “International Convergence of Capital Measurement and Capital Standards.” A
revised framework, Basel Committee on Banking Supervision, Basel, Switezerland.
Bauer, W. and Ryser, M. (2004). “Risk Management Strategies for Banks.” Journal of
Banking & Finance 28(2): 331-352.
Baum, C. F. (2001). “Residual Diagnostics for Cross-section Time Series Regression
Models.” The Stata Journal 1(1): 101-104.
Baysinger, B. and Hoskisson, R.E. (1990). “The Composition of Boards of Directors and
Strategic Control: Effects on Corporate Strategy.” Academy of Management Review
15(1): 72-87.
Baysinger, B. D. and Butler, H.N. (1985). “Corporate Governance and the Board of
Directors: Performance Effects of Changes in Board Composition.” Journal of Law,
Economics, & Organization 1(1): 101-124.
BBC (2013). “News South Asia.” Retrieved 12/12/2013, 2013, from
http://www.bbc.co.uk/news/world-south-asia-12499391.
Beasley, M. S. (1996). “An Empirical Analysis of the Relation Between the Board of
Director Composition and Financial Statement Fraud.” Accounting Review 71(4):
443-465.
Beasley, M. S., Carcello, J.V. and Hermanson, D.R. (1999). “Fraudulent Financial Reporting:
1987-1997: An Analysis of US Public Companies.” The Auditor's Report 22(3): 15-
17.
Beasley, M. S., Carcello, J.V., Hermanson, D.R. and Lapides, P.D. (2000). “Fraudulent
Financial Reporting Consideration of Industry Traits and Corporate Governance
Mechanisms.” Accounting Horizons 14(4): 441-454.
Beatty, A. and Liao, W.Y.S. (2009).” Regulatory Capital Ratios, Loan Loss Provisioning and
Pro-cyclicality.” Ohio, The Ohio State University.
Beatty, R. P. and Zajac, E.J. (1987). “CEO Change and Firm Performance in Large
Corporations: Succession Effects and Manager Effects.” Strategic Management
Journal 8(4): 305-317.
256
Beatty, R. P. and Zajac, E.J. (1994). “Managerial Incentives, Monitoring, and Risk Bearing:
A study of Executive Compensation, Ownership, and Board Structure in Initial Public
Offerings.” Administrative Science Quarterly 39(2): 313-335.
Beck, R., Jakubik, P. and Piloiu, A. (2013). “Non-performing Loan What Matters in Addition
to the Economic Cycle?” Working Paper Series 1515. European Central Bank,
Germany.
Beiner, S., Drobetz, W., Schmid, F. and Zimmermann, H. (2004). “Is Board Size an
Independent Corporate Governance Mechanism?” KYKLOS 57(3): 327-356.
Belkin, B., Suchower, S. and Forest, L.R. (1998). “The Effect of Systematic Credit risk on
Loan Portfolio Value-at-risk and Loan Pricing.” Credit Metrics Monitor 1: 17-28.
Benhabib, J. and Spiegel, M.M. (2000). “The Role of Financial Development in Growth and
Investment.” Journal of Economic Growth 5(4): 341-360.
Benston, G. J. (1985). “The Self-serving Management Hypothesis: Some Evidence.” Journal
of Accounting and Economics 7(1-3): 67-84.
Berger, A. (1995). “The Relationship Between Capital and Earnings in Banking” Journal of
Money, Credit & Banking 27(2): 432-456.
Berger, A. N. and DeYoung, R. (1997). “Problem Loans and Cost Efficiency in Commercial
Banks.” Journal of Banking & Finance 21(6): 849-870.
Berger, A. N., Goldberg, L.G. and White, L.J. (2007). “Cometition from Large, Multi-
market, Firms and the Performance of Small, Single-market Firms: Evidence from the
Banking Industry.” Journal of Money, Credit & Banking 39(2-3): 331-368.
Berger, A. N., Molyneux, P., Wilson, J.O.S., Berger, A. and Wilson, J. (2010). Banking–an
overview. Oxford, Oxford University Press, Oxford.
Berk, J. M. and Bikker, J.A. (1995). “International Interdependence of Business Cycle in
Manufacturing Industry: The Use of Leading Indicators for Analysis and
Forecasting.” Journal of Forecasting 14(1): 1-23.
Berle, A. A. and Means, G.C. (1991). The Modern Corporation and Private Property,
Transaction Pub.
Bessis, J. (2002). Risk Management in Banking. Australia, John Wiley and Sons Ltd.
Bhagat, S. and Black, B. (2001). “Non-Correlation between Board Independence and Long-
Term Firm Performance.” Journal of Corporation Law 27: 231-273.
Bhagat, S. and Bolton, B. (2008). “Corporate Governance and Firm Performance.” Journal of
Corporate Finance 14(1): 257-273.

257
Bhattacharya, B. and Roy, T. (2008). “Macroeconomic Determinants of Asset Quality of
Indian Public Sector Banks: A Recursive VAR Approach.” Journal of Bank
Management 7(1): 20-40.
Bhattacharya, S. and Thakor, A.V. (1993). “Contemporary Banking Theory.” Journal of
Financial Intermediation 3(1): 2-50.
Bhattacharya, U., Daouk, H. and Welker, M. (2003). “The World Price of Earnings Opacity.”
The Accounting Review 78(3): 641-678.
Bhattarai, B. N. (2005). “Nepal Rastra Bank: A Journey of Fifty Years.” In NRB, Milestones.
Kathmandu, Nepal.
Bhojraj, S. and Sengupta, P. (2003). “Effect of Corporate Governance on Bond Ratings and
Yields: The Role of Institutional Investors and Outside Directors.” Journal of
Business 76(3): 455-475.
Bichsel, R. and Blum, J. (2004). “The Relationship Between Risk and Capital in Swiss
Commercial Banks: A Panel Study.” Applied Financial Economics 14(8): 591-597.
Bikker, J. A. and Metzemakers, P.A.J. (2005). “Bank Provisioning Behaviour and
Procyclicality” Journal of International Financial Markets, Institutions and Money
15(2): 141-157.
Binks, M. R. and Ennew, C.T. (1996). “Growing Firms and The Credit Constraint.” Small
Business Economics 8(1): 17-25.
Binks, M. R. and Ennew, C.T. (1997). “The Relationship Between UK Banks and Their
Small Business Customers.” Small Business Economics 9(2): 167-178.
Black, B., Jang, H. and Kim, W. (2006). “Does Corporate Governance Predict Firm's Market
Values? Evidence from Korea.” Journal of Law, Economics, & Organization 22(2):
366-413.
Black, B. S. (1990). “Shareholder Passivity Reexamined.” Michigan Law Review 89(3): 520-
608.
Blundell, R. and Bond, S.R. (1998). “Initial Conditions and Moment Restrictions in Dynamic
Panel Data Models.” Journal of Econometric 87(1): 115-143.
Boardman, A. E., Shapiro, D.M. and Vining, A.R. (1997). “The Role of Agency Costs in
Explaining the Superior Performance of Foreign MNE Subsidiaries.” International
Business Review 6(3): 295-317.
Bofondi, M. and Ropele, R. (2011). “Macroeconomic Determinants of Bad Loans: Evidence
from Italian Banks.” Bank of Italy Occasional Paper (89).

258
Bonin, J. P., Hasan, I and Wachtel, P. (2005). “Bank Performance, Efficiency and Ownership
in Transition Countries.” Journal of Banking & Finance 29(1): 31-53.
Borio, C., Furfine, C.H. and Lowe, P. (2001). “Procyclicality of the Financial System and the
Financial Stability: Issues and Policy Option.” BIS Papers 1: 1-57.
Borio, C. and Lowe, P. (2001). “To Provision or Not to Provision.” BIS Quarterly Review:
36-48.
Boyad, J. H. and Gertler, M. (1993). “U.S. Commercial Banking: Trends, Cycles, and
Policy.” NBER Working Paper 8(4404): 319-377.
Boyd, J. H., Levine, R. and Smith, B.D. (2001). “The Impact of Inflation on Financial Sector
Performance.” Journal of Monetary Economics 47(2): 221-248.
Boyd, J. H. and Prescott, E.C. (1986). “Financial Intermediary-coalitions.” Journal of
Economic Theory 38(2): 211-232.
Bozec, R. (2005). “Boards of Directors, Market Discipline and Firm Performance” Journal of
Business Finance & Accounting 32(9): 1921-1960.
Bradbury, M., Mak, Y.T. and Tan, S. (2006). “Board Characteristics, Audit Committee
Characteristics and Abnormal Accruals.” Pacific Accounting Review 18(2): 47-68.
Brand, B.B.(2003). Gauss’ Method of Least Squares: An Historically-Based Introduction,
Master Dissertation, Louisiana State University.
Brealey, R., Leland, H.E. and Pyle, D.H. (2012). “Informational Asymmetries, Financial
Structure, and Financial Intermediation.” The Journal of Finance 32(2): 371-387.
Brewer, E. (1996). “Risk, Regulation, and S & L Diversification into Nontraditional Assets.”
Journal of Banking & Finance 20(4): 723-744.
Brick, I. E. and Chidambaran, N.K. (2010). “Board Meetings, Committee Structure and Firm
Value.” Journal of Corporate Finance 16(1): 533-553.
Brickley, J. A., Lease, R.C. and Smith, Jr.C.W. (1988). “Ownership Structure and Voting on
Antitakeover Amendments.” Journal of Financial Economics 20: 267-291.
Brock, P. and Franken, H. (2003). “Measuring the Determinants of Average and Marginal
Bank Interest Rate Spread in Chile, 1994-2001.” Working Paper no.25, University of
Washington, Department of Economics.
Brownbridge, M. (1998). The Causes of Financial Distress in Local Banks in Africa and
Implications for Prudential Policy, UNCTAD.
Brunnermeier, M. K. (2008). “Deciphering the Liquidity and Credit Crunch 2007-08.”
National Bureau of Economic Research.
259
Buck, T., Liu, X. and Skovoroda, R. (2008). “Top Executive Pay and Firm Performance in
China.” Journal of International Business Studies 39(5): 833-850.
Bulan, L., Sanyal, P. and Yan, Z. (2005). CEO Incentives and Firm Productivity. Working
Paper Series Brandeis University.
Burton, G. E., Pathak, D.S. and Zigli, R.M. (1977). “The Effect of Organizational
Communication on Job Satisfaction and Motivation Factors for Management.”
Journal of management 2(2): 17-23.
Byrd, J. W. and Hickman, K.A. (1992). “Do Outside Directors Monitor Managers?” Journal
of Financial Economics 32(2): 195-221.
Cadbury (1992). Committee on the Financial Aspects of Corporate Governance. Report with
Code of Best Practice. G. P. London.
Cai, C. (1997). “On the Function and Objectives of Internal Audit and Their Underlying
Conditions.” Managerial Auditing Journal 12(4): 247-250.
Calomiris, C. W. (2000). United States Bank Deregulation in Historical Perspective,
Cambridge University Press.
Calomiris, C. W. and Mason, J.R. (2000). Causes of US Bank Distress During the
Depression, National Bureau of Economic Research.
Campbell, A. (2007). “Bank Insolvency and The Problem of Nonperforming Loans.” Journal
of Banking Regulation 9(1): 25-45.
Canals, J. (2011). “Universal banking: international comparisons and theoretical
perspectives.” OUP Catalogue.
Cannata, F. and Quagliariello, M. (2006). “Capital and Risk in Italian Banks: A Simultaneous
Equation Approach.” Journal of Banking Regulation 7(3): 283-297.
Caprio, G., Laeven, L. and Levine, R. (2007). “Governance and Bank Valuation.” Journal of
Financial Intermediation 16(4): 584-617.
Caprio, G. and Levine, R. (2002). Corporate Governance in Finance: Concepts and
International Observations. World Bank, IMF, and Brookings Institution Conference.
Carcello, J. V., Hermanson, D.R., Neal, T.L. & Riley, J.R.A. (2002). “Board Characteristics
and Audit Fees.” Contemporary Accounting Research 19(3): 365-384.
Carcello, J. V. and Neal, T.L. (2000). “Audit Committee Composition and Auditor
Reporting” The Accounting Review 75(4): 453-467.
Carey, M. (1998). “Credit Risk in Private Debt Portfolio.” the Journal of Finance 53(4):
1363-1387.
260
Carlson, M. (2004). “Are Branch Banks Better Survivors? Evidence from the Depression
Era.” Economic Inquiry 42(1): 111-126.
Carlson, M. and Mitchener, K.J. (2005). Branch Banking, Bank Competition, and Financial
Stability, National Bureau of Economic Research.
Carmichael, D. R., Willingham, J.J. and Schaller, C.A. (1996). Auditing Concepts and
Methods. A Guide to Current Theory and Practice, McGraw-Hill 6th edition pp 25.
Castro, V. (2012). “Macroeconomic Determinants of the Credit Risk in the Banking System:
The Case of the GIPSI.” Economic Modelling 31: 672-683.
CBS (2011). “Population Census of Nepal-2011.” Central Bureau of Statistics, Nepal
(preliminary findings).
Cebenoyan, A. S. and Strahan, P.E. (2004). “Risk Management, Capital Structure and
Lending at Banks.” Journal of Banking & Finance 28(1): 19-43.
Chaganti, R. and Damanpour, F. (1991). “Institutional Ownership, Capital Structure, and
Firm Performance.” Strategic Management Journal 12(7): 479-491.
Chan, K. C. and Li, J. (2008). “Audit Committee and Firm Value: Evidence on Outside Top
Executive as Expert-Independent Directors.” Corporate Governance 16(1): 16-31.
Chand, S. (2002). “Financial Sector Development and Economic Growth in Pacific Island
Countries.” Pacific economic bulletin 17(2): 117-133.
Cheng, S. (2008). “Board Size and the Variability of Corporate Performance.” Journal of
Financial Economics 87(1): 157-176.
Chhibber, P. K. and Majumdar, S.K. (1999). “Foreign Ownership and Profitability: Property
Rights, Control, and the Performance of Firms in Indian Industry.” Journal of Law
and Economics 42(1): 209.
Chijoriga, M. M. (1997). An Application of Credit Scoring and Financial Distress Perdiction
Model to Commercial Bank Lending: The Case of Tanzania. PhD Dissertation, Wirts
Chaftsnnversitat Wien (WU), Vienna.
Choe, H. and Lee, B.S. (2003). “Korean Bank Governance Reform After the Asian Financial
Crisis.” Pacific-Basin Finance Journal 11(4): 483-508.
Christopoulos, D. K. and Tsionas, E.G. (2004). “Financial Development and Economic
Growth: Evidence from Panel Unit Root and Cointegration Tests.” Journal of
Development Economics 73(1): 55-74.
Chung, K. H. and Pruitt, S.W. (1994). “A Simple Approximation of Tobin's Q.” Financial
Management 23(3): 70-74.

261
Chung, R., Firth, M. and Kim, J. (2002). “Institutional Monitoring and Opportunistic Earning
Management.” Journal of Corporate Finance 8(1): 29-48.
CIA. (2011). “The World Fact Book” Retrieved January 15, 2011, 2011, from
https://www.cia.gov/library/publications/the-world-factbook/geos/np.html.
Claessens, S., Demirgüç-Kunt, A. and Huizinga, H. (2001). “How Does Foreign Entry Affect
Domestic Banking Markets?” Journal of Banking & Finance 25(5): 891-911.
Claessens, S., Djankov, S. and Lang, L.H.P. (2000). “The Separation of Ownership and
Control in East Asian Corporations.” Journal of Financial Economics 58(1-2): 81-112.
Claessens, S. and Fan, J.P.H. (2002). “Corporate Governance in Asia: A Survey.”
International Review of Finance 3(2): 71-103.
Coffee, J. C. (1991). “Liqudity Versus Control: The Institutional Investor as Corporate
Monitor.” Columbia Law Review 91(6): 1277-1368.
Cohen, J., Krishnamoorthy, G. and Wright, A.M. (2002). “Corporate Governance and the
Audit Process.” Contemporary Accounting Research 19(4): 573-594.
Cole, R. A., Goldberg, L.G. and White, L.J. (2004). “Cookie Cutter vs. Character: The Micro
Structure of Small Business Lending by Large and Small Banks.” Journal of Financial
and Quantitative Analysis 39(2): 227-251.
Coleman-Kyereboah, A. (2007). Corporate Governance and Firm Performance in Africa: A
Dynamic Panel Data Analysis. A Paper Prepared for the International Conference on
Corporate Governance in Emerging Markets. Istanbul, Turkey, Global Corporate
Governance Forum and Asian Institute of Corporate Governance
Coles, J. L., Daniel, N.D. and Naveen, L. (2008). “Boards: Does One Size Fit All.” Journal of
Financial Economics 87(2): 329-356.
Collins, N. J. and Wanjau, K. (2011). “The Effect of Interest Rate Spread on the Level of
Non-performing Assets: A Case of Commercial Banks in Kenya.” International
Journal of Business and Public Management 1(1): 58-65.
Conger, J. A., Finegold, D. and Lawler, E. (1998). “Appraising Boardroom Performance.”
Harvard Business Review 76(1): 136-164.
Cornett, M. M., McNutt, J.J. and Tehranian, H. (2009). “Corporate Governance and Earnings
Management at Large US Bank Holding Companies.” Journal of Corporate Finance
15(4): 412-430.
Corsetti, G., Pesenti, P. and Roubini, N. (1998). Fundamental Determinants of the Asian
Crisis: A preliminary Empirical Assessment. New York, Yale University and
University of Bologna, Federal Reserve Bank of New York and NBER.
262
Coughlan, A. T. and Schmidt, R.M. (1985). “Executive compensation, management turnover,
and firm performance: An empirical investigation.” Journal of Accounting and
Economics 7(1-3): 43-66.
Craswell, A. T., Taylor, S.L. and Saywell, R.A. (1997). “Ownership Structure and Corporate
Performance: Australian Evidence.” Pacific-Basin Finance Journal 5(3): 301-323.
Crouhy, M., Galai, D. and Mark, R. (2000). Risk Management. New Youk, McGraw-Hill.
Crystal, J. S., Dages, B.G. and Goldberg, L.S. (2002). “Has Foreign Bank Entry Led to
Sounder Banks in Latin America?” Current Issues in Economics and Finance 8(1): 1-
6.
Cummings, L. L., Huber, G.P. and Arendt, E. (1974). “Effects of Size and Spatial
Arrangements on Group Decision Making.” Academy of Management Journal 17(3):
460-475.
Dahal, B. (2009). “Experience of the Nepalese Commercial Banks and Challenge Ahead :
Nepalese Financial System : Growth and Challenges.” Nepalese Financial System,
Nepal Rastra Bank: 50-63.
Daily, C. M., Dalton, D.R. and Cannella, A.A. (2003). “Corporate Governance: Decades of
Dialogue and Data.” Academy of Management Review 46(2): 151-158.
Dalton, C. M. and Dalton, D.R. (2005). “Boards of Directors: Utilizing Empirical Evidence in
Developing Practical Prescriptions.” British Journal of Management 16(1): 91-S97.
Danos, P., Holt, D.L. and Imhoff, E.A. (1989). “The Use of Accounting Information in Bank
Lending Decisions.” Accounting, Organizations and Society 14(3): 235-246.
Das, A. and Ghosh, S.(2004). “Corporate Governance of Banking System: An Empirical
Investigation.” Economic and Political Weekly12(March 20): 1263-1266.
Das, A. and Ghosh, S. (2007). “Determinants of Credit Risk in Indian State-owned Banks:
An Empirical Investigation.” Economic Issues 12 (2): 27-46.
Davidson, W., Xie, B.N. and Xu, W. (2004). “Market Reaction to Voluntary Announcement
of Audit Committee Appointments: The Effect of Financial Expertise” Journal of
Accounting and Public Policy 23(4): 279-293.
Davis, J. H., Schoorman, F.D. and Donaldson, L. (1997). “Toward a Stewardship Theory of
Management.” Academy of Management Review 22(1): 20-47.
De-Grauwe, P. (2008). The Banking Crisis: Causes, Consequences and Remedies, Centre for
European Policy Studies.

263
De-Juan, A. (1996). The Roots of Banking Crises: Microeconomic Issues and Supervision
and Regulation. in Hausmann and Rojas-Suarez (Eds. 1996), Banking Crises in Latin
America. U.S.: 83-102.
De-Lis, S. F., Pagés, J.M. and Saurina, J. (2001). Credit Growth, Problem Loans and Credit
Risk Provisioning in Spain, Marrying the Macro- and Microprudential Dimensions of
Financial Stability, BASLE, Bank for Internatioanl Settlement, Switzerland: 331-353.
De Young, R. and Nolle, D. (1996). “Foreign-owned Banks in the US Earning Market Share
or Buying It?” Journal of Money, Credit & Banking 28(4): 622-636.
De Zoort, F. T., Hermanson, D.R., Archambeault, D.S. and Reed, S.A. (2002). “Audit
Committee Effectiveness: A Synthesis of the Empirical Audit Committee Literature.”
Journal of Accounting Literature 21: 38-75.
Decker, P. A. (2000). The Changing Character of Liquidity and Liquidity Risk Management:
A Regulator's Perspective. Working Paper. Federal Reserve Bank of Chicago Banking
Supervision and Regulation Research.
Demetriades, P. O. and Luintel, K.B. (1996). “Banking Sector Policies and Financial
Development in Nepal.” Oxford Bulletin of Economics and Statistics 58(2): 355-372.
Demirgüç-Kunt, A. and Detragiache, E. (1998). “The Determinants of Banking Crises in
Developing and Developed Countries.” International Monetary Fund Staff Papers
45(1): 81-109.
Demirgüç-Kunt, A., Detragiache, E. and Gupta, P. (2006). “Inside The Crisis: An Empirical
Analysis of Banking Systems in Distress.” Journal of International Money and
Finance 25(5): 702-718.
Demirguc-Kunt, A. and Huizinga, H. (1998). Determinants of Commercial Bank Interest
Margins and Profitability: Some International Evidence. World Bank Policy Research
Working Paper, WPS 1900.
Demsetz, H. (1983). “The Strucutre of Ownership and The Theory of the Firm.” Journal of
Law and Economics 26(2): 375-390.
Demsetz, H. and Lehn, K. (1985). “The Structure of Corporate Ownership: Causes and
Consequences.” The Journal of Political Economy 93(6): 1155-1177.
Demsetz, R. S. and Strahan, P.E. (1997). “Diversification, Size, and Risk at Bank Holding
Companies.” Journal of Money, Credit, and Banking 29(3): 300-313.
Denis, D. J. (2001). “Twenty-five Years of Corporate Governance Research... and Counting.”
Review of Financial Economics 10(3): 191-212.
264
Denis, D. K. and McConnell, J.J. (2003). “International Corporate Governace” Journal of
Financial and Quantitative Analysis 38(1): 1-36.
DeYoung, R. (1998). “X-Efficiency and Management Quality in National Banks.” Journal of
Financial Services Research 13(1): 5-22.
DeZoort, F. (1997). “An investigation of Audit Committees' Oversight Responsibilities.”
Abacus 33(2): 208-227.
Dharwadkar, R., George, G. and Brandes, P. (2000). “Privatization in Emerging Economies:
An Agency Theory Perspective.” The Academy of Management Review 25(3): 650-
669.
Dhungana, B. R. (2008). Problem Bank Identification, Intervention and Resolution in Nepal.
Comparison of Problem Bank Identification Intervention and Resolution in The
Seacen Countries Kuala Lumpur, Malaysia, The South East Asian Central Banks
(SEACEN): 127-128.
Di Pietra, R., Grambovas, C.A., Raonic, I. and Riccaboni,, A. (2008). “The Effects of Board
Size and ‘Busy’Directors on the Market Value of Italian Companies.” Journal of
Management and Governance 12(1): 73-91.
Diamond, D. W. (1984). “Financial Intermediation and Delegated Monitoring.” The Review
of Economic Studies 51(3): 393-414.
Diamond, D. W. and Dybvig, P.H. (1983). “Banks Runs, Deposit Insurance, and Liquidity.”
Journal of Political Economy 91(3): 401-419.
Djankov, S. and Hoekman, B. (2000). “Foreign Investment and Productivity Growth in
Czech Enterprises.” The World Bank Economic Review 14(1): 49-64.
Duenwald, C., Gueorguiev, N. and Schaechter, A. (2005). Too Much of a Good Thing?
Credit Booms in Transition Economies: The Cases of Bulgaria, Romania and
Ukraine. Working Paper no. WP/05/128
Eickmeier, S., Hofmann, B. and Worms, A. (2009). “Macroeconomic Fluctuations and Bank
Lending: Evidence for Germany and the Euro Area.” German Economic Review
10(2): 193-223.
Eisenberg, T., Sundgren, S. and Wells, M.T. (1998). “Larger Board Size and Decreasing Firm
Value in Small Firms.” Journal of Financial Economics 48(1): 35-54.
Eisenhardt, K. M. (1989). “Agency Theory: An Assessment and Review.” Academy of
Management Review 14(1): 57-74.

265
El-Mehdi, I. K. (2007). “Empirical Evidence on Corporate Governance and Corporate
Performance in Tunisia.” Corporate Governance: An International Review 15(6):
1429-1441.
Emmanuelle, N. Y. S. (2003). A European Study of Bank Interest Margins: Is Net Fees
Revenue A Determinant. Doctoral University of Birmingham.
Eng, L. L. and Nabar, S. (2007). “Loan Loss Provisions by Banks in Hong Kong, Malaysia
and Singapore.” Journal of International Financial Management & Accounting 18(1):
18-38.
Enobakhare, A. (2010). Corporate Governance and Bank Performance in Nigeria. Master
Discertation, University of Stellenbosch.
Erickson, J., Park, Y.W., Reising, J. and Shin, H.H. (2005). “Board Composition and Firm
Value Under Concentrated Ownership: The Canadian Evidence.” Pacific-Basin
Finance Journal 13(4): 387-410.
Ezzamel, M. and Watson, R. (1993). “Organizational Form, Ownership Structure and
Corporate Performance: A Contextual Empirical Analysis of UK Companies1.”
British Journal of Management 4(3): 161-176.
Fabozzi, F. J., Modigliani, F. and Ferri, M.G. (1994). Foundations of Financial Markets and
Institutions, Prentice Hall.
Fama, E. F. (1980). “Banking in the Theory of Finance.” Journal of Monetary Economics
6(1): 39-57.
Fama, E. F. and Jensen, M.C. (1983). “Separation of Ownership and Control.” Journal of
Law and Economics 26(2): 301-325.
Fan, J. P. H. and Wong, T.J. (2002). “Corporate Ownership Structure and the Informativeness
of Accounting Earnings in East Asia.” Journal of Accounting and Economics 33(3):
401-425.
Fan, L. and Shaffer, S. (2004). “Efficiency Versus Risk in Large Domestic US Banks.”
Managerial Finance 30(10): 1-10.
Fanta, A. B., Kemal, K.S. and Waka, Y.K. (2013). “Corporate Governance and Impact on
Bank Performance.” Journal of Financial and Accounting 1(1): 19-26.
Fauzi, F. and Locke, S. (2012). “Board Structure, Ownership Structure and Firm
Performance: A Study of New Zealand Listed-Firms.” Asian Academy of
Management Journal of Accounting and Finance 8(2): 43-67.
Fels, A. (2010). “Executive Remuneration in Australia.” Australian Accounting Review
20(1): 76-82.

266
Ferrari, A., Jaffrin, G. and Shrestha, S. (2007). Access to Financial Services in Nepal, World
Bank Publications.
Fich, E. M. and Shivdasani, A. (2006). “Are Busy Boards Effective Monitors?” Journal of
Finance (2): 689-724.
Firth, M., Fung, P.M.Y. and Rui, O.M. (2002). Simultaneous Relationships Among
Ownership, Corporate Governance, and Financial Performance. Lingnan University,
Tuen Mun, working paper.
Fischer, K. P., Gyeyie, J.P. and Ortiz, E. (2000). Risk-taking and Charter Value of
Commercial Banks' from the NAFTA Countries 1st International Banking and
Finance Conference Kuala Lumpur, Malaysia
Fofack, H. (2005). Nonperforming Loans in Sub-Saharan Africa: Causal Analysis and
Macroeconomic Implications, World Bank Policy Research
Fosberg, R. H. (1989). “Outside Directors and Managerial Monitoring.” Akron Business and
Economic Review 20(2): 24-33.
Freeman, R. E. and Reed, D.L. (1983). “Stockholders and Stakeholders: A New Perspective
on Corporate Governance.” California Management Review 25(3): 88-106.
Freixas, X. and Rochet, J.C. (1997). Microeconomic of Banking, MIT Press, Cambridge,
Nassachusetts, London, England.
Friedman, M. and Schwartz, A. J. (1971). A Monetary History of the United States, 1867-
1960, Princeton University Press.
Furfine, C. H. (2001). “Banks as Monitors of Other Banks: Evidence from the Overnight
Federal Funds Markets.” Journal of Business 74(1): 33-57.
Gallati, R. R. (2003). Risk Management and Capital Adequacy. New York, USA, McGraw-
Hill.
Gallo, J. G., Apilado, V.P. and Kolari, J.W. (1996). “Commercial Bank Mutual Fund
Activities: Implications for Bank Risk and Profitability.” Journal of Banking &
Finance 20(10): 1775-1791.
Gascón, F. and González Méndez, V. (2000). Diversification, Size and Risk at Spanish banks.
Athens, Working Paper, EFMA, Athens, retrieved on date 20 September, 2013 from
http//:ssrn.com/abstract=233656.
Gehrig, T. (1998). “Screening, Cross-border Banking, and the Allocation of Credit.”
Research in Economics 52(4): 387-407.
267
Genay, H., Udell, G.F., DeYoung, R. and Berger, A.N. (2000). “Globalization of Financial
Institutions: Evidence from Cross-border Banking Performance.” Brookings-Wharton
papers on financial services2000(1): 23-120.
Ghabayen, M. A. (2012). “Board Characteristics and Firm Performance: Case of Saudi
Arabia.” International Journal of Accounting and Financial Reporting 2(2): 168-200.
Gillan, S. L. (2006). “Recent Development in Corporate Governance: An Overview.” Journal
of Corporate Finance 12(3): 381-402.
Gilson, R. and Kraakman, R. (1991). “Gilson, Ronald and Reiner Kraakman,” Reinvesting
the Outside Director: An Agenda lor Institutional Investors.” Stanley Literature
Review 43: 863-817.
Girardone, C., Molyneux, P. and Gardener, E.P.M. (2004). “Analysing the Determinants of
Bank Efficiency: The Case of Italian Banks.” Applied Economics 36(3): 215-227.
Glancey, K. (1998). “Determinants of Growth and Profitability in Small Entrepreneurial
Firms” International Journal of Entrepreneurial Behaviour & Research 4(1): 18-27.
Godlewski, C. J. (2006). “Regulatory and Institutional Determinants of Credit Risk Taking
and a Bank's Default in Emerging Market Economies.” Journal of Emerging Market
Finance 5(2): 183-206.
Goldberg, L. S., Dages, B.G. and Kinney, D. (2000). “Foreign and Domestic Bank
Participation in Emerging Markets: Lessons from Mexico and Argentina.” FRBNY
Economic Policy Review 6(3): 17-36.
Goldstein, M. (1998). The Asian Financial Crisis: Causes, Cures, and Systemic Implications,
Peterson Institute.
Goldstein, M. and Turner, P. (1996). “Banking Crises in Emerging Economies : Origins and
Policy Options” BIS Economic Papers 46.
Gomez-Mejia, L. R., Nunez-Nickel, M. and Gutierrez, I. (2001). “The Role of Family Ties in
Agency Contracts.” Academy of Management Journal 44(1): 81-95.
Görg, H. and Greenaway, D. (2004). “Much Do About Nothing? Do Domestic Firms Really
Benefit from Foreign Direct Investment?” The World Bank Research Observer 19(2):
171-197.
Gottschalk, R. (2007). “Basel II Implementation in Developing Countries and Effects on
SME Development.” Paper presented in ICRIER-InWent Conference on Financial
Globalisation and Domestic Financial Sector Development, New Delhi, India, 22-23
November 2007.

268
Gray, B., Cassidy, C. and RBA (1997). Credit Risk in Banking : Proceedings of a Conference
at H.C. Coombs Centre for Financial Studies, 1-2 May 1997. [Melbourne?], Reserve
Bank of Australia, Bank Supervision Dept.
Greenidge, K. and Grosvenor, T. (2010). “Forecasting Non-performing Loan in Barbados.”
Journal of Business, Finance and Economics in Emerging Economies 5(1): 80-107.
Grissom, R. J. (2000). “Heterogeneity of Variance in Clinical Data.” Journal of Consulting
and Clinical Psychology 68(1): 155-165.
Grossman, R. S. (1994). “The Shoe that Didn’t Drop: Explaining Banking Stability During
the Great Depression.” Journal of Economic History 54(3): 654-682.
Guest, P. M. (2009). “The Impact of Board Size on Firm Performance: Evidence from the
UK.” The European Journal of Finance 15(4): 385-404.
Gugler, K. (2001). Corporate Governance and Economic Performance, Oxford University
Press.
Gunsel, N. (2012). “Micro and Macro Determinants of Bank Fragility in North Cyprus
Economy.” African Journal of Business Management 6(4): 1323-1329.
Gup, B. E., Avram, K., Beal, D., Lambert, R. and Kolari, J.W. (2007). Commercial Banking:
The Management of Risk Australia, John Wiley and Sons Ltd.
Gurley, J. G. and Shaw, E.S. (1966). Money in a Theory of Finance, Brookings Institution.
Gurung, J. B. (2004). “Growth and Performance of Securities Market in Nepal.” The Journal
of Nepalese Business Studies 1(1): 85-92.
Hackethal, A., Schmidt, R.H. and Tyrell, M. (2005). “Banks and German Corporate
Governance: On the way to a Capital Market-Based System?” Corporate Governance:
An International Review 13(4): 397-407.
Hadad, M. D., Santoso, W., Santoso, B., Besar, D.S. and Rulina, I. (2006). Macroeconomic
Stress Testing for the Indonesian Banking System, Loughborough Univ. Banking
Centre.
Hair, J. F., Black, W.C., Babin, B.J., Anderson, R.E. and Tatham, R.L. (2006). Multivariate
Data Analysis, Pearson Prentica Hall, 6th ed.
Hamdan, A. M., Sarea, A.M. and Reyad, S.M.R. (2013). “The Impact of Audit Committee
Characteristics on the Performance: Evidence from Jordan.” International
Management Review 9(1): 32-42.
Hamilton, L. C. (2009). Statistics with Stata Belmont, USA, Brooks/COLE CENGAGE
Learning
269
Han, K. C. and Suk, D.Y. (1998). “The Effect of Ownership Structure on Firm Performance:
Additional Evidence.” Review of Financial Economics 7(2): 143-155.
Haniffa, R. and Hudaib, M. (2006). “Corporate Governance Structure and Performance of
Malaysian Listed Companies.” Journal of Business Finance & Accounting 33(7-8):
1034-1062.
Hardwick, P., Adams, M. and Zou, H. (2003). “Corporate governance and cost efficiency in
the United Kingdom life insurance industry.” European Business Management School
Working Paper 1.
Harris, M. and Raviv, A. (2008). “A Theory of Board Control and Size.” Review of Financial
Studies 21(4): 1797.
Hart, O. D. and Jaffee, D.M. (1974). “On the Application of Portfolio Theory to Depository
Financial Intermediaries.” The Review of Economic Studies 41(1): 129-147.
Hassan, M. K. (1993). “Capital Market Tests of Risk Exposure of Loan Sales Activities of
Large U.S. Commercial Banks.” Quarterly Journal of Business and Economics 32(1):
27-49.
Hassan, M. K., Karels, G.V. and Peterson, M.O. (1994). “Deposit Insurance, Market
Discipline and Off-balance Sheet Banking Risk of Large US Commercial Banks.”
Journal of Banking & Finance 18(3): 575-593.
Hayden, E., Porath, D. and Westernhagen, N. (2007). “Does Diversification Improve the
Performance of German Banks? Evidence from Individual Bank Loan Portfolios.”
Journal of Financial Services Research 32(3): 123-140.
Heath, J. (2009). “The Uses and Abuses of Agency Theory.” Business Ethics Quarterly19(4):
497-528.
Hellman, T. F., Murdock, K. and Stiglitz, J.E. (2000). “Liberalisation, Moral Hazard in
Banking, and Prudential Regulation: Are Capital Requirement Enough?” American
Economic Review 90(1): 147-165.
Hermalin, B. E. and Weisbach, M.S. (1991). “The Effects of Board Composition and Direct
Incentives on Firm Performance.” Financial management 20(4): 101-112.
Higgins, R. C. and Schall, L.D. (2012). “Corporate Bankruptcy and Conglomerate Merger.”
The Journal of Finance 30(1): 93-113.
Hill, C. W. L. and Jones, G.R. (2004). Strategic management: An integrated Approach.
Houghton, Mifflin, Boston.
270
Holderness, C. G. and Sheehan, D.P. (1988). “The Role of Majority Shareholders in Publicly
Held Corporations: An Exploratory Analysis.” Journal of Financial Economics 20(1-
2): 317-346.
Holmstrom, B. and Kaplan, S.N. (2001). “Corporate Governance and Merger Activity in The
United States: Making Sense of the 1980s and 1990s.” Journal of Economic
Perspectives 15(2): 121-144.
Holmstrom, B. and Tirole, J. (1996). Private and Public Supply of Liquidity, Woking Paper
No.5817, National Bureau of Economic Research.
Hopt, K. J. (2007). “Modern Company and Capital Market Problems: Improving European
Corporate Governance after Enron”, Journal of Corporate Law Studies, retrievedon
date 20 September 2013 from http//:heinonline.org/HOL?landingPage?handle=
hein.journal/corplstd3&div=15id
Hoseininassab, E., Yavari, E., Mehregan, N. and Khoshsima, R. (2012). “Effects of Risk
Parameters (Credit, Operational, Liquidity and Market Risk) on Banking System
Efficiency (Studying 15 Top Banks of Iran's). “ Journal of Basic and Applied
Scientific Research 2(6): 5466-5477.
Hoskisson, R. E., Johnson, R.A. and Moesel, D.D. (1994). “Corporate Divestiture Intensity in
Restructuring Firms: Effects of Governance, Strategy, and Performance.” Academy of
Management Journal: 1207-1251.
Hsio, C. (2003). Analysis of Panel Data Cambridge University Press.
Huang, L. Y., Lai, G.C. and Wen, M.M. (2008). The Effect of Corporate Governance and
Auditor Independence on the Efficiency Performance of the U.S. Life Insurance
Industry. Sydney, Australia, Asia-Pacific Risk and Insurance Association, 12th
Annual Conference.
Hubbard, R. G. (1994). Money, The Financial System, and The Economy, Addison-Wesley
Reading, MA.
Hughes, J. P., Lang, W., Mester, L.J. and Moon, C.G. (1996). “Efficient Banking Under
Interstate Branching.” Journal of Money, Credit and Banking 28(4): 1045-1071.
IIA (2004). “International Standards for the Professional Practice of Internal Auditing.” The
Institute of Internal Auditors. Retrieved on date 20 June, 2013 from
http//theiia.org/standards-guidance/Public%20Documents/IPPF% 202013%20
English.pdf.
IMF (2010). Nepal: Selected Issues. I. M. Fund. Washington, D.C., International Monetary
Fund, Washington D.C.

271
Jager, P. D. (2008). “Panel Data Techniques and Accounting Research.” Meditari
Accoutancy Research 16(2): 53-68.
Jensen, M. C. (1993). “The Modern Industrial Revolution, Exit, and the Failure of Internal
Control Systems.” Journal of Finance 48(3): 831-831.
Jensen, M. C. and Meckling, W.H. (1976). “Theory of the Firm: Managerial Behavior,
Agency Costs and Ownership Structure.” Journal of Financial Economics 3(4): 305-
360.
Jensen, M. C. and Murphy, K.J. (1990). “Performance Pay and Top-Management
Incentives.” Journal of Political Economy 98(2): 225-264.
Jeon, Y., Miller, S.M. and Natke, P.A. (2006). “Do Foreign Bank Operations Provide a
Stabilizing Influence in Korea?” The Quarterly Review of Economics and Finance
46(1): 82-109.
Jiménez, G. and Saurina, J. (2006). “Credit Cycles, Credit Risk, and Prudential Regulation.”
International Journal of Central Banking 2(2): 65-98.
John, K. and Senbet, L.W. (1998). “Corporate Governance and Board Effectiveness.” Journal
of Banking & Finance 22(4): 371-403.
Joras, U. (2008) ““ Financial peacebuilding”: Impacts of the Nepalese Conflict on the
Financial Sector and its Potential for Peacebuilding.” International Network for
Economics and Conflict, United States Institute of Peace.
Li, J., Lam, K., Qian, G. and Fang,Y. (2006). “The Effects of Institutional Ownership on
Corporate Governance and Performance: An Empirical Assessment in Hong Kong.”
Management International Review 46(3): 259-276.
Kafle, N. P. (2011). “WTO and Nepalese Financial Institution” Banking Journal 1(1): 13-18.
Kajola, S. O. (2008). “Corporate Governance and Firm Performance: The Case of Nigerian
Listed Firms.” European Journal of Economics, Finance and Administrative Science
14: 16-28.
Kaldor, N. and Mirrlees, J.A. (1962). “A New Model of Economic Growth.” The Review of
Economic Studies 29(3): 174-192.
Kalirai, H. and Scheicher, M. (2002). “Macroeconomic Stress Testing: Preliminary Evidence
for Austria.” Financial Stability Report 3(1): 58-74.
Kang, L. (2013). “The Research on Efficiency of Commercial Banks Based on Network DEA
Approach - Empirical Evidence from Chinese Commercial Banks.” Journal of
Information and Computational Science 10(17): 5681-5690.

272
Kantipur (2010). “Dui Khale Bitiya Prativedan Banauna Chad ( Nepalese Language )” Stop
to prepare two types of financial report, in English.” Kantipur Daily National, Nepal.
Kaplan, S. and Minton, B. (1994). “Outside Interventions in Japanese Companies: Its
determinants and its implication for Manager.” Journal of Financial Economics
36(2): 225-258.
Karamanou, I. and Vafeas, N. (2005). “The Association Between Corporate Boards, Audit
Committees, and Management Earnings Forecasts: An Empirical Analysis.” Journal
of Accounting Research 43(3): 453-486.
Karim, M. Z. A., Chan, S. and Hassan, S. (2010). “Bank Efficiency and Non-performing
Loans: Evidence from Malaysia and Singapore.” Working Paper, Parague Economic
Papers 2: 118-132.
Kashyap, A. K., Rajan, R. and Stein, J.C. (2002). “Banks as Liquidity Providers : An
Explanation for the Co-existence of Lending and Deposit-taking.” Journal of Finance
54(1): 33-73.
KC, Bijay. (2010). “Stock Market Development in Nepal: Issues and Challenges for Reform”
SEBON Journal 4: 77-94.
Keasey, K. and Short,H. (1999). “Corporate Governance: From Accountability to
Enterprise.” Accounting and Business Research 29(4): 337-352.
Keeley, M. C. (1990). “Deposit Insurance, Risk, and Market Power in Banking.” The
American Economic Review 80(5): 1183-1200.
Keeton, W. R. (1999). “Does Faster Loan Growth Lead to Higher Loan Losses?” Economic
Review 84(2): 57-76.
Kerr, J. and Bettis, R.A. (1987). “Boards of directors, top management compensation, and
shareholder returns.” Academy of Management Journal 30(4): 645-664.
Kessel, R. A. (1956). “Inflation-caused Wealth Redistribution: A Test of a Hypothesis.” The
American Economic Review46(1): 128-141.
Kessel, R. A. and Alchian, A.A. (1962). “Effects of Inflation.” The Journal of Political
Economy 70(6): 521-537.
Khan, M. S. and Senhadji, S.A. (2001). “Threshold Effects in the Relationship Between
Inflation and Growth.” IMF Stafff Papers 48(1).
Khanal, S. (2007). “Banking and Insurance Services Liberalization and Development in
Bangladesh, Nepal and Malaysia : A Comparative Analysis.” Working Papers.
Federal Reserve Bank of Atlanta.

273
Kim, D. and Santomero, A.M. (2012). “Risk in Banking and Capital Regulation.” The
Journal of Finance 43(5): 1219-1233.
King, R. G. and Levine, R. (1993). “Finance and Growth: Schumpeter Might Be Right.” The
Quarterly Journal of Economics 108(3): 717-737.
Kitua, D. Y. (1996). Application of Multiple Discriminant Analysis in Developing a
Commercial Banks Loan Classification Model and Assessment of Significance of
Contributing Varialbles : A Case of National Bank of Commerce MBA thesis,
UDSM, , Dar es Salaam.
Klapper, L. and Love, I. (2004). “Corporate Governance, Investor Protection and
Performance in Emerging Markets.” Journal of Corporate Finance 10(5): 703-728.
Klein, A. (1998). “Firm Performance and Board Committee Structure.” Journal of Law and
Economics 41(1): 275-303.
Klein, A. (2002). “Audit Committee, Board of Director Characteristics, and Earnings
Management.” Journal of Accounting and Economics 33(3): 375-400.
Koch, T. W. and McDonald, S.S. (2003). Bank Management. 3rd edition,Sydney, Thomson.
Koehn, M. and Santomero, A.M. (2012). “Regulation of Bank Capital and Portfolio Risk.”
The Journal of Finance 35(5): 1235-1244.
Koford, K. J. and Miller, J.B.(1995). Contracts in Bulgaria: How Firms Cope When Property
Rights are Incomplete, Center for Institutional Reform and the Informal Sector,
University of Maryland at College Park.
Koford, K. J. and Tschoegl, A.E. (1999). “Problems of Bank Lending in Bulgaria:
Information Asymmetry and Institutional Learning.” Economic Policy in Transitional
Economies 9(2): 123-152.
Konrath, L. F. (1996). Auditing Concept and Applications. USA, West Publishing Company
pp 730.
Kosnik, R. D. (1987). “Greenmail: A Study of Board Performance in Corporate
Governance.” Administrative Science Quarterly 32(2): 163-185.
KPMG. (2008). “Audit Committee Put Risk Management at the Top of their Agenda.”
Retrieved 05 January, 2012, 2012, from www.kpmg.co.uk/news/detail.cfm?pr=3120.
Kraemer, K. H. (1999). “Democratization and Political Parties in Nepal.” from
http://nepalresearch.org/publication/harvard_9903.htm.
Kraft, E. and Jankov, L. (2005). “Does Speed Kill? Lending Booms and Their Consequences
in Croatia.” Journal of Banking & Finance 29(1): 105-121.
274
Kyereboah-Coleman, A. (2007). Corporate Governance and Firm Performance in Africa: A
Dynamic Panel Data Analysis. International Conference on Corporate Governance in
Emerging Markets. Sabanci University, Istanbul, Turkey.
La Porta, R., Lopez-de-Silane, F. Shleifer, A. and Vishny, R. (1998). “Law and Finance.”
Journal of political Economy 106(6): 1113-1155.
La Porta, R., F. Lopez-de-Silane, et al. (2002). “Investor Protection and Corporate Valuation”
The Journal of Finance 57(3): 1147-1170.
La Porta, R., Lopez-de-Silane, F. and Zamarripa, G. (2003). “Related Lending.” Quarterly
Journal of Economics 118(1): 231-268.
Laeven, L. and Valencia, F. (2008). “Systemic Banking Crises : A New Database.”
International Monetary Fund Report, Working Paper 08/224.
Laeven, L. and Valencia, F. (2010). Resolution of Banking Crises: The Good, the Bad, and
the Ugly, International Monetary Fund.
Lakstutiene, A. (2008). “Correlation of the Indicators of the Financial System and Gross
Domestic Product in European Union Countries” Engineering Economics 3(58): 7-18.
Lawler, E. E. and Lawlor, E.E. (1981). Pay and Organization Development, Addison-Wesley
Reading, Mass.
Lee, S. W. (2008). “Asset Size, Risk-taking and Profitability in Korean Banking Industry.”
Banks and Bank systems 3(4): 50-54.
Leng, A. C. A. (2004). “The impact of corporate governance practices on firms' financial
performance: Evidence from Malaysian companies.” ASEAN economic bulletin: 308-
318.
Leonard-Barton, D. (1992). “Core Capabilities and Core Rigidities: A Paradox in Managing
New Product Development.” Strategic Management Journal 13(1): 111-125.
Letza, S., Sun, X. and Kirkbride, J. (2004). “Shareholding Versus Stakeholding: A Critical
Review of Corporate Governance.” Corporate Governance: An International Review
12(3): 242-262.
Leuz, C., Nanda, D. and Wysocki, P.D. (2003). “Earnings Management and Investor
Protection: An International Comparison.” Journal of financial economics 69(3): 505-
527.
Lev, B. and Saunder, S. (1979). “Methodological Issues in the Use of Financial Ratio.”
Journal of Accounting and Economics 1(1): 187-210.
Levine, R. (1997). “Financial Development and Economic Growth: Views and Agenda.”
Journal of Economic Literature 35(2): 688-726.

275
Levine, R. (2004). “The Corporate Governance of Banks : A Concise Discussion of Concepts
and Evidence.” World Bank Research Working Paper 3404.
Levine, R. (2012). “Stock Markets, Growth, and Tax Policy.” The Journal of Finance 46(4):
1445-1465.
Levine, R. and Caprio J.C. (2002). “Corporate Governance of Banks: Concepts and
International Observation.” Global Corporate Governance Forum, Research Network
MeetingApril 5, University of Minnesota.
Levine, R. and Zervos, S.J. (1993). “What We Have Learned About Policy and Growth From
Cross-country Regressions?” The American Economic Review 83(2): 426-430.
Levy, H. and Sarnat, M. (2012). “Diversification, Portfolio Analysis and the Uneasy Case for
Conglomerate Mergers.” The Journal of Finance 25(4): 795-802.
Lewellen, W. G. (2012). “A Pure Financial Rationale for the Conglomerate Merger.” The
Journal of Finance 26(2): 521-537.
Lewellen, W.G. and Huntsman, B. (1970). “Managerial Pay and Corporate Performance.”
The Americal Economic Review 60(4): 710-720
Liang, Q., Xu, P. and Jiraporn, P (2013). “Board Characteristics and Chinese Bank
Performance” Journal of Banking & Finance 37(8): 2953-2968.
Libby, R. (1979). “The Impact of Uncertainty Reporting on the Loan Decision.” Journal of
Accounting Research 17(4): 35-57.
Lichtenberg, F. and Pushner, G.M. (1994). “Ownership Structure and Corporate Performance
in Japan.” Japan and the World Economy6(3): 239-261.
Lin, Y. F. (2005). “Corporate governance, Leadership Structure and CEO Compensation:
Evidence from Taiwan.” Corporate Governance: An International Review 13(6): 824-
835.
Lindgren, C. J., Garcia, G.G. and Saal, M.I. (1996). Bank Soundness and Macroeconomic
Policy, International Monetary Fund.
Lipton, M. and Lorsch, J.W. (1992). “Modest Proposal for Improved Corporate Governance.”
The Business Lawyer 48(1): 59-77.
Llewellyn, D. T. (2001). “A Regulatory Regime for Financial Stability.” Oesterreichische
Nationalbank (Austrian Central Bank).
Llewellyn, D. T. (2002). “An Analysis of the Causes of Recent Banking Crises.” The
European Journal of Finance 8(2): 152-175.
Loderer, C. and Martin, K. (1997). “Executive Stock Ownership and Performance Tracking
Faint Traces.” Journal of Financial Economics 45(2): 223-255.
276
Louzis, D. P., Vouldis, A.T. and Metaxas, V.L. (2012). “Macroeconomic and Bank-specific
Determinants of Non-performing Loans in Greece: A Comparative Study of
Mortgage, Business and Consumer Loan Portfolios.” Journal of Banking & Finance
36(4): 1012-1027.
Lowengrub, P., Luedecke, T. and Melvin, M. (2003). “Does Corporate Governance Matter in
the Market Response to Merger Announcements.” Financial Management Association
Meeting, retrievedon date 20/09/2013 from
http://www.public.asu.edu/~mmelvin/LLMdraftfinal.pdf
Lublin, J. and MacDonald, E. (1999). More Independent Audit Committees are Sought. The
Wall Street Journal NewYork, pg.A2.
Mace, M. L. (1979). “Directors: Myth and reality-ten years later.” Rutgers Law Reviww 32:
293.
Macey, J. R. and O'hara, M. (2003). “The Corporate Governance of Banks.” Federal Reserve
Bank of New YorkEconomic Policy Review(April): 91-107.
Majumdar, S. K. (1997). “The Impact of Size and Age on Firm-Level Performance: Some
Evidence from India.” Review of industrial Organization 12(2): 231-241.
Mallin, C. A. (2007). Corporate Governance 2nd edition, Oxford University Press, Oxford.
Mallin, C. M., Andy, M. and Wihlborg, C. (2005). “The Financial Sector and Corporate
Governance: The UK Case.” Corporate Governance: An International Review 13(4):
532-541.
Mangena, M. and Tauringana, V. (2008). Corporate Boards, Ownership Structure and Firm
Performance in an Enviornment of Severe Political and Economic Uncertainty.
British Accounting Association Conference. Blackpool, UK.
March, J. G. and Shapira, Z. (1987). “Managerial perspectives on risk and risk taking.”
Management science: 1404-1418.
Markham, J. W. (1973). Conglomerate enterprise and public policy, Division of Research,
Graduate School of Business Administration, Harvard University.
Martin, K. D. and Cullen, J.B. (2006). “Continuties and Extensions of Ethical Climate
Theory: A Meta-analytic Review.” Journal of Business Ethics 69(2): 175-194.
Matthews, K. and Thompson, J.L. (2005). The Economics of Banking, John Wiley.
Maug, E. (1998). “Large Shareholders as Monitors: Is There a Trade-Off between Liquidity
and Control?” The Journal of Finance 53(1): 65-98.
Mautz, R. and Neumann, F. (1977). Corporate Audit Committee: Policies and Practices.
Cleveland, OH, Ernst and Ernst.
277
McAllister, P. H. and McManus, D. (1993). “Resolving the Scale Efficiency Puzzle in
Banking.” Journal of Banking & Finance 17(2): 389-405.
McConnell, J. J. and Servaes, H. (1990). “Additional Evidence on Equity Ownership and
Corporate Value.” Journal of Financial Economics 27(2): 595-612.
McKinnon, R. I. (1973). Money and Capital in Economic Development. Washington,
Brookings Institution Press.
Mehran, H. (1995). “Executive Compensation Structure, Ownership, and Firm Performance.”
Journal of Financial Economics 38(2): 163-184.
Mehran, H. (2004). “Corporate governance in the banking and financial services industries.”
journal of Financial Intermediation 13(1): 1-5.
Menon, K. and Williams, J.D. (1994). “The use of audit committees for monitoring.” Journal
of Accounting and Public Policy 13(2): 121-139.
Merton, R. C. (2012). “On the Pricing of Corporate Debt: The Risk Structure of Interest
Rates.” The Journal of Finance 29(2): 449-470.
Mester, L. J., Nakamura, L. and Renault, M. (1998). Checking Accounts and Bank
Monitoring Working Papers USA, Economic Research Division Federal Reserve
Bank of Philadelphia.
Ming, T. C. and Gee, C.S. (2008). “The Influence of Ownership Structure on the Corporate
Performance of Malaysian Public Listed Companies.” ASEAN Economic Bulletin
25(2): 195-208.
Ministry of Finance (2011). Economic Survey 2011, Ministry of Finance, Government of
Nepal, Nepal.
Ministry of Law (2006). Bank and Financial Insitution Act 2006 (BAFIA 2006),
Kathamandu, Nepal.
Mishkin, F. S. (1999). “Lessons From the Asian Crisis.” Journal of International Money and
Finance 18(4): 709-723.
Mishkin, F. S. (2007). The Economics of Money, Banking, and Financial Markets, Pearson
education.
Mishra, C. S. and Nielsen, J.F. (2000). “Board Independence and Compensation Policies in
Large Bank Holding Companies.” Financial Management 29(3): 51-69.
Mitchener, K. J. (2006). Are Prudential Supervision and Regulation Pillars of Financial
Stability? Evidence from the Great Depression, National Bureau of Economic
Research.
278
Mohiuddin, M. and Karbhari, Y. (2010). “Audit Committee Effectiveness: A Critical
Literature Review.” AIUB Journal of Business and Economics 9(1): 97-125.
Monks, R. A. G. and Minow, N. (2001). Corporate Governance Blackwell, Malden, MA.
Morawski, A. (2007). The Role of Financial Intermediaries and the Increased Need for
Regulation of Financial Markets. Term Paper EC247, Financial Instruments and
Capital Markets.
Morck, R., Shleifer, A. and Vishny, R. (1988). “Management Ownership and Market
Valuation: An Empirical Analysis.” Journal of Financial Economcs 20(1): 193-315.
Morgan, D., Rime, B. and Strahan, P. (2003). Bank Integration and State Business Cycles,
National Bureau of Economic Research.
Morgan, D. P. and Samolyk, K. (2003). Geographic Diversification in Banking and Its
Implications for Bank Portfolio Choice and Performance. Unpublished Paper. New
York, Federal Reserve Bank of New York.
Morgan, G. (1979). “Internal Audit Role Conflict: A Pluralist View.” Managerial Finance
5(2): 160-170.
Muranaga, J. and Ohsawa, M. (2002). Measurement of Liqudity Risk in the Context of
Market Risk Calculation. Working paper. Institute for Monetary and Economic
Studies, Bank of Japan, Tokyo.
Murphy, K. J. (1999). “Executive compensation.” Handbook of labor economics 3: 2485-
2563.
Mustafa, S. T. and Youssef, N.B. (2010). “Audit Committee Financial Expertise and
Misappropriation of Assets.” Managerial Auditing Journal 25(3): 208-225.
Ngerebo, T. A. (2011). “The Impact of Foreign Exchange Fluctuation on the Intermediation
of Banks in Nigeria (1970-2004). “ African Journal of Business Management 6(11):
3872-3879.
Ngugi, R. (2001). An Empirical Analysis of Interest Rate Spread in Kenya, African
Economic Research Consortium.
Nicholson, G. J. and Geoffrey, K.C. (2003). “Can Directors Impact Performance? A Case-
based Test of Three Theories of Corporate Governance” Corporate Governance: an
International Perspective 15(4): 585-608.
Nickell, S. (1981). “Biases in Dynamic Models with Fixed Effects.” Econometrica49(6):
1417-1426.
Nkusu, M. (2011). “Nonperforming Loans and Macrofinancial Vulnerabilities in Advanced
Economies.” IMF Working Papers WP/11/161: 1-27.

279
NPC (2012). Millennium Development Goals Consistent, Macroeconomic Model
(MDGcMEM), Nepal. N. P. C. Government of Nepal, Kathmandu, Nepal.
NRB (2009). “Banking and Financial Statistics.” Bank and Financial Institution Regulation
Department, Statistics Division, Nepal Rastra Bank, Nepal 53.
NRB (2010). Risk Management Guidelines B. Bank Supervision Deparment, Kathmandu
Nepal. Kathmandu, Nepal, Nepal Rastra Bank.
NRB (2010'b'). “Banking and Financial Statistics.” Bank and Financial Institution Regulation
Department, Statistics Division, Nepal Rastra Bank, Nepal 54.
NRB (2010 'a'). Bank Supervision Report Kathamandu, Nepal Bank Supervision Department,
Nepal Rastra Bank.
NRB (2012). “Monetary Policy for fiscal year 2011/12.” Nepal Rastra Bank, Kathmandu,
Nepal.
NRB (2012'a'). Annual Report: Nepal Rastra Bank N. R. Bank. Baluwatar, Kathmandu,
Nepal, Research Department, Nepal Rastra Bank
Nucci, F. and Pozzolo, A.F. (2001). “Investment and the Exchange Rate: An Analysis With
Firm-level Panel Data.” European Economic Review 45(2): 259-283.
Nyor, T. and Mejabi, S.K. (2013). “Impact of Corporate Governance on Non-performing
Loans of Nigerian Deposit Money Banks.” Journal of Business Management 2(3): 12-
21.
Odegaard, B. A. and Bohren, O. (2004). Governance and Performance Revisited. ECGI-
Finance Working Paper no.28: EFA 2003 Annual Conference paper no.252.
OECD (1999). OECD Principles of Corporate Governance OECD Publication Service.
OECD (2004). Principles of Corporate Governance. France, OECD Publication Service.
Ongore, V. O. and K'Obonyo, P.O. (2011). “Effect of Selected Corporate Governance
Characteristics on Firm Performance: Empirical Evidence from Kenya.” International
Journal of Economics and Financial Issues 1(3): 99-122.
Oviatt, B. M. (1988). “Agency and Transaction Cost Perspectives on the Manager-
Shareholder Relationship: Incentives for Congruent Interests.” Academy of
Management Review 13(2): 214-225.
Pandey, R. P. (2004). “The Fallout of 9/11 on Asian Economies : Policy Options.” Economic
Review, Nepal Rastra Bank, Nepal. 16.
Pant, B. (2010). “Enhancing FDI Flows to Nepal Durign the Period of Post-conflict
Transition and Global Recession.” Economic Review, Nepal Rastra Bank.(22): 19-39.
280
Panta, R. (2007). “Challenges in Banking: A Nepalese Diaspora.” Socio-Economic
Development Panorama 1(2): 9-22.
Peiris, S. J. (2008). “Nepal : Selected Issues.” International Monetary Fund Report 08/182.
Pérez, D., Salas-Fumás, V. and Saurina, J. (2008). “Earnings and Capital Management in
Alternative Loan Loss Provision Regulatory Regimes.” European Accounting Review
17(3): 423-445.
Pfeffer, J. (1973). “Size, Composition, and Function of Hospital Boards of Directors: A study
of Organization-Environment Linkage.” Administrative Science Quarterly 18(3): 349-
364.
Pfeffer, J. and Salancik, G. (2003). The External Control of Organizations: A Resource
Dependence Perspective, Stanford Business Books.
Pitt, A., Ariyapruchya, K., Maino, R. and Yu, J. (2010). “Nepal : Selected Issues.”
International Monetary Fund Report 10/184.
PMP (2010). PM&P on Compensatin Planning: Looking Ahead to Executive Pay Practices in
2010 – Executive Summary, Pearl Mayer and Partners, retrievedon date 22
September, 2013 from http://www.pearlmeyer.com
Pokhrel, D. R. (2006). “Banking System Development in Nepal : A Comparative Analysis.”
Osaka Sangyo University Journal of Economics 7(2): 215-256.
Pound, J. (1988). “Proxy Contests and the Efficiency of Shareholder Oversight.” Journal of
Financial Economics 20(1): 237-265.
Pound, J. (1993). “Rise of the Political Model of Corporate Governance and Corporate
Control.” New York University Law Review 68: 1003.
Pratap, S. and Urrutia, C. (2004). “Firm Dynamics, Investment and Debt Portfolio: Balance
Sheet Effects of the Mexican Crisis of 1994.” Journal of Development Economics
75(2): 535-563.
Prowse, S. (1995). Alternative Methods of Corporate Control in Commercial Banks. Working
Paper 95-07, Federal Reserve Bank of Dallas.
Pyle, D. H. (2012). “On the Theory of Financial Intermediation.” The Journal of Finance
26(3): 737-747.
Quagliariello, M. (2007). “Banks’ Riskiness Over the Business Cycle: A Panel Analysis on
Italian Intermediaries.” Applied Financial Economics 17(2): 119-138.
Raghunandan, K., Rama, D.V. and Scarbrough, D.P. (1998). “Accounting and Auditing
Knowledge Level of Canadian Audit Committees: Some Empirical Evidence.”
Journal of International Accounting, Auditing and Taxation 7(2): 181-194.
281
Raheja, C. G. (2005). “Determinants of Board Size and Composition: A Theory of Corporate
Boards.” Journal of Financial and Quantitative Analysis 40(2): 283-306.
Rajaraman, I. and Vasishtha, G. (2002). “Non-performing Loans of PSU Banks.” Economic
and Political Weekly 37(5): 429-435.
Ramamurthy, C. B. (2004). “Trends and Developments in Insolvency System and Risk
Management : Experience of Nepal” Forum on Asian Insolvency Reform 2004.
Rampling, P. N. (2011). CEO and Executive Director Remuneration and Firm Performance.
Working Paper, Southern Cross University, Australia.
Rashid, A., DeZoysa, A., Lodh, S. and Rudkin, K. (2010). “Board Composition and Firm
Performance: Evidence from Bangladesh.” Australian Accounting Business and
Finance Journal 4(1): 76-95.
Rezaee, Z. (1996). “Improving the Quality of Internal Audit Functions Through Total Quality
Management.” Managerial Auditing Journal 8(3): 30-40.
Rezaee, Z. and Lander, G. (1993). “The Internal Auditor's Relationship With the Audit
Committee.” Managerial Auditing Journal 8(3): 35-40.
Rhyne, E. (1998). “The Yin and Yang of Microfinance: Reaching the Poor and
Sustainability.” MicroBanking Bulletin 2(1): 6-8.
Richard, E. (2011). “Factors that Cause Non-performing Loans in Commercial Banks in
Tanzania and Strategies to Resolve Them.” Journal of Management Policy and
Practice 12(7): 50-58.
Richard, E., Chijoriga, M., Kaijage, E., Peterson, C. and Bohman, H. (2008). “Credit Risk
Management System of a Commercial Bank in Tanzania.” International Journal of
Emerging Markets 3(3): 323-332.
Richard, J. C. (1999). “New Evidence on Determinants of Bank Failures in The US.” Applied
Economics Letters 6(1): 45-47.
Rinaldi, L. and Sanchis-Arellano, A. (2006). “Household debt sustainability: What explains
household non-performing loans? An empirical analysis.” ECB Working Paper No.
570.
Roe, M. J. (1994). Strong Managers, Weak Owners: The Political Roots of American
Corporate Finance. Princeton, NJ, Princeton University Press.
Roodman, D. (2006). How to do Xtabond2: An Introduciton to Difference and System GMM
in Stata. Working Paper, 103.
Ross, S. A. (1973). “The Economic Theory of Agency: The Principal's Problem.” The
American Economic Review 63(2): 134-139.
282
Ross, S. A., Westerfield, R.W. and Jordan, B.D. (1998). Fundamental of Corporate Finance
New York, USA, McGraw-Hill Comapanies Inc,.
Rossouw, G. J., Vander, W. and Malan, D.P. (2002). “Corporate Governance in South
Africa.” Journal of Business Ethics 37(1): 289-302.
Rouf, A. (2011). “The Relationship Between Corporate Governance and Value of the Firm in
Developing Countries: Evidence from Bangladesh.” The International Journal of
Applied Economics and Finance 5(3): 237-244.
Saba, I., Kouser, R. and Azeem, M. (2012). “Determinants of Non Performing Loans: Case of
US Banking Sector” The Romanian Economic Journal15(44): 125-136.
Salas, V. and Saurina, J. (2002). “Credit Risk in Two Institutional Regimes: Spanish
Commercial and Savings Banks.” Journal of Financial Services Research 22(3): 203-
224.
Sanchez-Ballesta, J. P. and Garcia-Meca, E. (2007). “Ownership Structure, Discretionary
Accruals and the Informativeness of Earnings.” Corproate Governance: An
International Review 15(4): 677-691.
Sanda, A., Mikailu, A.S. and Garba, T. (2005). “Corporate Governance Mechanism and Firm
Financial Performance in Nigeria.” Afro-Asian Journal of Finance and Accounting
2(1): 22-39.
Sanders, W. G. (1999). “Incentive Structure of CEO Stock Option Pay and Stock Ownership:
The Moderating Effects of Firm Risk.” Managerial Finance 25(10): 61-75.
Sanjeev, G. M. (2007). “Bankers' Perceptions on Causes of Bad Loans in Banks.” Journal of
Management Research 7(1): 40.
Santomero, A. M. (1984). “Modeling the Banking Firm: A Survey.” Journal of Money,
Credit and Banking16(4): 576-602.
Santomero, A. M. (1997). “Commercial Bank Risk Management: An Analysis of the
Process.” Journal of Financial Services Research 12(2): 83-115.
Sargent, T. J. (1972). “Anticipated Inflation and The Nominal Rate of Interest.” The
Quarterly Journal of Economics 86(2): 212-225.
Saunders, A. and Cornet, M.M. (2008). Financial Institutions Management. A Risk
Management Approach. Boston, McGraw-Hill Irwin.
Saunders, A., Cornett, M.M., McGraw, P.A. and Anne, P. (2006). Financial Institutions
Management: A Risk Management Approach, McGraw-Hill.

283
Sawyer, B. L., Dittenofer, M.A., Scheiner, J.H. (2003). Sawyer's Internal Auditing. The
Practise of Modern Internal Auditing, The Institute of Internal Auditors Research
Foundation 5th edition, Florida, USA
Schiehll, E. (2006). “Ownership Structure, Large Inside/Outside Shareholders and Firm
Performance: Evidence from Canada.” Corporate Ownership and Control 3(3): 96-
112.
Scholes, M., Benston, G.J. and Smith, C.W. (2012). “A Transactions Cost Approach to The
Theory of Financial Intermediation.” The Journal of Finance 31(2): 215-231.
Schulze, W. S., Lubatkin, M.H. and Dino, R.N. (2001). “Altruism, Agency and The
Competitiveness of Family Firms.” Managerial and Decision Economics 23(4-5):
247-259.
Schulze, W. S., Lubutkin, M.H., Dino, R.N. and Buchholtz, A.K. (2001). “Agency
Relationship in Family Firms: Theory and Evidence.” Organization Science 12(2):
99-116.
SEBON (2001). Annual Report 2000/01. Securities Exchange Board of Nepal, Kathamandu,
Nepal.
SEBON (2011). Annual Report 2010/11. Securities Exchange Board of Nepal, Kathamandu,
Nepal.
Shaffer, S. (1998). “The Winner's Curse in Banking.” Journal of Financial Intermediation
7(4): 359-392.
Sheikh, S. and Chatterjee, S. (1995). Perspective on Corporate Governance. In Sheikh,
S.(ed.), Corporate Governance and Corporate Control. London, Cavendish Publishing
Limited.
Shleifer, A. and Vishny, R.W. (1986). “Large Shareholders and Corporate Control.” The
Journal of Political Economy 94(3): 461-488.
Shleifer, A. and Vishny, R.W. (1997). “A Survey of Corporate Governance.” Journal of
Finance 52(2): 737-783.
Shrestha, M. B. (2005). Financial Liberalisation in Nepal, . PhD Thesis, University of
Woolngong
Sierra, G. E., Talmor, E. and Wallace, J.S. (2006). “An Examination of Multiple Governance
Forces Within Bank Holding Companies.” Journal of Financial Services Research
29(2): 105-123.
Sikka, P. (2009). “Financial Crisis and The Silence of The Auditors.” Accounting ,
Organisations and Society 34(6/7): 868-873.

284
Singh, N. (2004). “Willing to Go After Defaulters.” Nepali Times. (227).
Sirpal, R. (2009). “Method of Payment and Foreign-exchange Risk Management Among
Firms in Brunei Darussalam.” The Journal of Risk Finance 10(4): 377-392.
Smith, M. P. (2012). “Shareholder Activism by Institutional Investors: Evidence from
Calpers.” The Journal of Finance 51(1): 227-252.
Sobehart, J. R., S. C. Keenan, et al. (2003). Complexities and Validation of Default Risk
Models ( Frontiers in Credit Risk: Concept and Techniques for Applied Credit risk
Measurement. Singapore, Wiley.
Solomon, J. (2007). Corporate Governance and Accountability, John Wiley & Sons Inc.
Sonnenfeld, J. A. (2002). “What Makes Great Boards Great.” Harvard Business Review
80(9): 106-113.
Staikouras, P. K., Staikouras, C.K. and Agoraki, M.K. (2007). “The effect of Board Size and
Composition on European Bank Performance” European Journal of Law Economics
23(1): 1-27.
Stals, C. (1998). “Importance of Credit Extension for Macroeconomic Financial Stability.”
Meeting discussion of the Institute of Credit Management in Johannesburg.
Stanwick, P. A. and Stanwick, S.D. (2010). “The Relationship Between Corporate
Governance and Financial Performance: An Empirical Study of Canadian Firms.” The
Business Review, Cambridge16(2): 35-49.
Starks, L. T. (1987). “Performance Incentive Fees: An Agency Theoretic Approach.” Journal
of Financial and Quantitative Analysis 22(1): 17-32.
Sternberg, E. (2004). Corporate Governance: Accountability in The Marketplace. London,
Institute of Economic Affairs.
Stiglitz, J. E. and Weiss, A. (1981). “Credit Rationing in Markets With Imperfect
Information.” The American Economic Review 71(3): 393-410.
Stulz, R. M. (1988). “Managerial Control of Voting Rights: Financing Policies and The
Market for Corporate Control.” Journal of Financial Economics 20(1-2): 25-54.
Stulz, R. M. (1999). “Globalization, Corporate Finance and The Cost of Capital.” Journal of
Applied Corporate Finance 12(3): 8-25.
Sufian, F. and Habibullah, M.S. (2009). “Bank Specific and Macro-economic Determinants
of Bank Profitability: Empirical Evidence from the China Banking Sector.” Frontiers
of Economic in China 4(2): 274-291.
285
Sun, L. and Chang, T. (2011). “A Comprehensive Analysis of the Effects of Risk Measures
on Bank Efficiency: Evidence from Emerging Asian Countries.” Journal of Banking
& Finance 35(7): 1727-1736.
Sun, J., Lan, G. and Liu, G. (2014). “Independent Audit Committee Characteristics Real
Earnings Management.” Managerial Auditing Journal 29(2): 153-172
Tabachnick, B. G. and Fidell, L.S. (2007). Using Multivariate Statistics, Allyn and Bacon,
Boston, 5th ed.
Thapa, S. B. (2012). “Nepal's Trade Flows: Evidence From Gravity Model.” NRB Economic
Review24(1): 16-27.
Thiagarajan, S. (2013). “Determinants of Credit Risk in the Commercial Banking Sector of
Belize.” Research Journal of Social Science and Management 3(4): 84-90.
Thiagarajan, S., Auuapan, S. and Ramachandan, A. (2011). “Credit Risk Determinants of
Public and Private Sector Banks in India.” European Journal of Economics, Finance
and Administrative Science (34): 147-154.
Thomsen, S. and Pedersen, T. (2000). “Ownership Structure and Economic Performance in
The Largest European Companies.” Strategic Management Journal 21(6): 689-705.
Tobin, J. (1964). Commercial Banks as Creators of “money”, Cowles Foundation for
Research in Economics at Yale University.
Topak, M. S. (2011). “The Effect of Board Size on Firm Performance: Evidence from
Turkey.” Middle Eastern Finance and Economics (14): 119-127.
UNDP (2012). “National Human Development Reports for Nepal.” International Human
Development Indicators. United Nation Development Program (UNDP)
Vafeas, N. (1999). “Board Meeting Frequency and Firm Performance.” Journal of Financial
Economics 53(1): 113-142.
Van Greuning, H. and Bratanovic, S.B. (2000). “Analyzing Banking Risk: A Framework For
Assessing Corporate Governance and Financial Risk Management.” WORLD BANK,
WASHINGTON, DC(USA). 305: 305.
Velnampy, T. (2013). “Corporate Governance and Firm Performance: A Study of Sri Lankan
Manufacturing Companies” Journal of Economics and Sustainable Development 4(3):
228-235.
Vennet, R. V. (1996). “The Effect of Mergers and Acquisitions on The Efficiency and
Profitability of EC Credit Institutions.” Journal of Banking & Finance 20(9): 1531-
1558.

286
Vogiazas, S. D. and Nikolaidou, E. (2011). Credit risk determinants in the Bulgarian banking
system and the Greek twin crises. MIBES, South East European Research Centre:
177-189.
Vogiazas, S. D. and Nikolaidou, E. (2011). “Investigating the determinants of nonperforming
loans in the Romanian Banking System: An empirical study with reference to the
Greek crisis.” Economics Research International, Article ID214689.
Walker, D. I. (2010). “Challenge of Improving the Long-Term Focus of Executive Pay.”
Boston College Law Review 51(2): 435.
Wang, Y., Tsai, J. and Lin, H.W. (2013). “The Influence of Board Structure on Firm
Performance.” The Journal of Global Business Management 9(2): 7-14.
Warue, B. N. (2013). “The Effect of Bank Specific and Macro-economic Factors on Non-
performing Loans in Commercial Banks in Kenya: A Comparative Panel Data
Analysis.” Advances in Management & Applied Economics 3(2): 135-164.
Weir, C. (1997). “Corporate Governance, Performance and Take-overs: An Empirical
Analysis of UK Mergers.” Applied Economics 29(11): 1465-1475.
Weiss, R. (2005). Audit Committee Characteristics and Monitoring Effectiveness. Doctoral
Dissertation. , The City University of New York.
Wen-Yen, H. and Pongpitch, P. (2010). “The Impact of Corporate Governance on the
Efficiency Performance of the Thai Non-Life Insurance Industry.” Geneva Papers on
Risk and Insurance 35(1): 28-49.
Wen, Y., Rwegasira, K. and Bilderbeek, J. (2002). “Corporate Governance and Capital
Structure Decisions of The Chinese Listed Firms.” Corporate Governance: An
International Review 10(2): 75-83.
West, A. (2006). “Theorising South Africa's Corporate Governance.” Journal of Business
Ethics 68(4): 433-448.
Wheelock, D. (1995). “Regulation, Market Structure and The Bank Failures of The Great
Depression.” Review(Mar): 27-38.
Willmore, L. N. (1986). “The Comparative Performance of Foreign and Domestic Firms in
Brazil.” World Development 14(4): 489-502.
Wilson, J. O. S., Casu, B., Giradone, C. and Molyneus, P. (2010). “Emerging Themes in
Banking: Recent Literature and Directions for Future Research.” The British
Accounting Review 42(3): 153-169.
Wilson, R. (1968). “The Theory of Syndicates.” Econometrica: Journal of the Econometric
Society 36(1): 119-132.

287
Wintoki, M. B., Linck, J.S. and Netter, J.M. (2009). “Endogeneity and the dynamics of
corporate governance.” from Availabe at SSRN <http://ssrn.com/abstract=970986>
viewed on 9 November 2011.
Winton, A. (1995). “Delegated Monitoring and Bank Structure in a Finite Economy.” Journal
of Financial Intermediation 4(2): 158-187.
Witherell, B. (2003). The Roles of Market Discipline and Transparency in Corporate
Governance Policy. Paper presented at the Banque de France International Monetary
Seminar, 16 May, 2003.
Wiwattanakantang, Y. (2001). “Controlling Shareholders and Corporate Value: Evidence
from Thailand.” Pacific-Basin Finance Journal 9(4): 323-362.
Wooldridge, J. M. (2002). Econometric Analysis of Cross Section and Panel Data.
Cambridge, MA:MIT Press.
Wooldridge, J. M. (2009). Introductory Econometrics: A Modern Approach. OH, USA,
South-Western Cengage Learning
World Bank (2005). “Corporate Governance Country Assessment Nepal” Report on the
observation of standards and codes (ROSC), corporate governance, The World Bank.
World Bank (2006). Financial Performance and Soundness Indicators for the South Asia
Region, Finance and Private Sector Development Unit, South Asia Region, World
Bank.
World Bank (2011). World Bank Data Base, World Bank. Washington D.C., US.
WTO (2011). Trade Policy Review, Nepal. World Trade Organization, WT/TPR/S257: 1-92.
Yermack, D. (1996). “Higher Market Valuation of Companies With a Small Board of
Directors.” Journal of Financial Economics 40(2): 185-211.
Yoshikawa, T. and Phan, P.H. (2003). “The Performance Implications of Ownership-driven
Governance Reform.” European Management Journal 21(6): 698-706.
Zahra, S. A. and Pearce, J.A. (1989). “Boards of Directors and Corporate Financial
Performance: A Review and Integrative Model.” Journal of Management 15(2): 291-
334.
Zajac, E. J. (1990). “CEO Selection, Succession, Compensation and Firm Performance: A
Theoretical Integration and Empirical Analysis.” Strategic Management Journal
11(3): 217-230.
Zameer, S. and Siddiqi, M.W. (2010). “The impact of Export, FDI and External Debt on
Exchange Rate Volatility in Pakistan.” International Journal of Contemporary
Research in Business 2(7): 337-354.

288
Zribi, N. and Boujelbene, Y. (2011). “The Factors Influencing Bank Credit Risk: The Case of
Tunisia.” Journal of Accounting and Taxtation 3(4): 70-78.