Vanuatu Infrastructure Strategic Investment Plan 2015 – 2024

1
CHAPTER III - MULTIDIMENSIONAL POVERTY IN
VANUATU AND SOLOMON ISLANDS
1.1. Introduction
In its common economic usage, poverty refers to a level of material well-being below a minimum
acceptable threshold. Against this backdrop, poverty measures identify who is poor and
aggregate this information into a summary statistic. Poverty measures are also a central feature
of vulnerability analyses, given that vulnerability is usually couched in terms of the likelihood
of falling into poverty in the future (see Chapter 6). The accurate measurement of poverty is
therefore of critical importance for the effective targeting of social protection policies – both in
terms of alleviating the current incidence of poverty as well as preventing it from occurring in
the future.
Poverty is ordinarily measured against a benchmark of the monetary resources needed to
maintain a minimally-acceptable standard of living. Across most developing countries this
benchmark is the extreme poverty line. Fixed at the local-currency equivalent of US$1.25 per
day, this provides a consistent and objective assessment of those that lack the financial
wherewithal to meet their most basic human needs.
However, poverty in PICs, including Vanuatu and Solomon Islands, is somewhat different to
that observed in other developing country contexts. In particular, there is little of the abject
destitution and hunger that is typically attendant with extreme monetary poverty.
Yet while extreme poverty may not resonate in the Pacific context, a variety of human
development metrics suggest that living conditions in PICs are on par with some of the world’s
poorest countries. Reflecting this, poverty and disadvantage in the region has been re-
characterised in terms of relative “hardship” (Abbott and Pollard, 2004, pxi). This view has been
widely accepted in the region and even operationalised in national poverty lines, which are
tailored to reflect the cost of a minimally nutritious diet plus basic non-food needs in different
locations, rather than being a standardised measure of absolute destitution.
However, the current national poverty lines of Vanuatu and Solomon Islands have also been
criticised for misrepresenting the geographical distribution of poverty between urban and rural

2
areas (Narsey, 2012). By continuing to use money as the relevant proxy for well-being, these
measures are unlikely to fully account for key non-market production and exchange that
underpins households’ livelihoods and the fact that markets for essential services are sometimes
altogether missing. Each of these issues is particularly pertinent in rural areas.
The puzzle between the lack of observed extreme destitution on the one hand and the low levels
of human development on the other, as well as the distinctiveness of rural and urban areas, casts
doubt on the suitability of unidimensional, monetary-based measures to accurately identify
poverty in the Melanesian context.
This chapter argues that multidimensional measures that directly focus on human capabilities
and functioning may instead be better attuned to measuring poverty in Vanuatu and Solomon
Islands and comparing living standards in urban and rural areas. It tests this by using information
from a single survey of households in both countries to replicate the Multidimensional Poverty
Index (MPI) – a widely-used non-monetary measure of household poverty devised by Alkire and
Foster (2011a). This marks the first time that the MPI is reported for Solomon Islands and the
first time that the measure has been reported at the sub-national level in either country.
In addition to identifying the incidence, depth and geographical distribution of MPI poverty in
Vanuatu and Solomon Islands, this chapter makes a further contribution by tailoring the MPI to
suit the local Melanesian context. The resultant Melanesian MPI (MMPI) arguably provides an
even more accurate perspective on household poverty given that it explicitly incorporates
important information on unique Melanesian aspects of well-being that are overlooked in the
standard MPI measure.
The rest of this chapter proceeds as follows: Section 3.2 explores the literature on poverty and
the Pacific as well as the multidimensional poverty measures; Section 3.3 calculates the MPI for
each of the twelve communities surveyed, before calculating an MMPI; Section 3.4 then
discusses the results; and Section 3.5 concludes.
1.2. Literature review
1.2.1. Poverty measures and their applicability to PICs
Poverty is generally considered to be a level of material well-being below a level that society
deems to be a reasonable minimum standard (Ravallion, 1992). Operationally, poverty tends to

3
be measured in monetary terms (usually income or consumption).1 Two key assumptions
underpin monetary-based assessments of well-being: firstly, that money is a universally
convertible asset that can be translated into satisfying an individual’s needs; and secondly that
monetary well-being is strongly correlated with other dimensions of well-being (Ataguba et al.
2013). Alkire and Santos (2013) characterise such monetary-based approaches as being an
“indirect” poverty measurement, and juxtapose these with more “direct” poverty measures that
focus on the actual failures of the poor to meet minimum standards of living. Chambers (2007)
notes that while poverty measures tend to be reductionist and non-contextual, they nonetheless
appeal to policymakers because of their simplicity, and the fact they can be quantified and
compared across time and space.2
Speaking about poverty measures in general, Haughton and Khandker (2009, pp. 3-4) suggest
that there are at least four important reasons why the quantification of poverty is important.
Firstly, a credible measure of poverty can be a powerful instrument for focusing the attention of
policymakers on the living conditions of the poor. That is, without an explicit measure of
poverty, the poor and disenfranchised risk being statistically invisible. Secondly, in order to
target poverty alleviation policies, one must know who and where the poor are. Thirdly, poverty
analyses are central to evaluating the success of policies and programs designed to help poor
people. Fourthly, poverty measures provide an important benchmark for gauging the success of
international undertakings, such as the MDGs.
The accurate measurement of poverty is also important from the perspective of assessing
household vulnerability. To the extent that vulnerability assessments typically focus on the
likelihood of a household becoming poor in the future, or remaining in poverty if already poor,
an accurate and consistent indicator of what poverty represents in a given context is an essential
feature of a credible vulnerability estimate – this is the focus of Chapter 6.
The World Bank also notes that quantifying poverty provides policymakers with information on
the spatial distribution of well-being. In the 2009 edition of its World Development Review
devoted to the topic, the World Bank opined that the concept of economic geography can explain
why economic activity (and poverty) is seldom balanced within or across regions. In particular,
at the early stages of development, distance to markets and infrastructure and service hubs – i.e.
1 In developing countries, consumption is generally preferred over income as a measure of well-being, given the inherent difficulties of measuring income as well as the fact that income is often derived from domestic agriculture (Haughton and Khandker, 2011, p190). 2 Qualitative participatory approaches using information on peoples’ lived experiences are also used to characterise poverty (Chambers, 2007). While these approaches have been prominent in anthropological literature and are used extensively by civil society to contextualise poverty, quantitative economic approaches remain dominant and, as such, are the focus of this analysis.

4
“the ease, or difficulty, for goods, services, labor, capital and ideas to traverse space” is a key
driver of the spatial distribution of poverty within countries and regions (2009, p75).3 In this
sense, the authors argue that accurately measuring poverty is an important first step in the spatial
calibration of anti-poverty policies, which can be a critical factor in reducing inequality between
regions and speeding up convergence in living standards.
Sen (1976) notes that there are two primary dimensions to a credible poverty measure: being
able to identify the poor amongst the total population, and then being able to aggregate that
information into a meaningful measure. Thus, in any given context it is of critical importance
that a poverty measure is able to accurately determine who is poor. As stated above, this is
usually defined relative to a pre-existing benchmark for sustaining a minimally acceptable
standard of living, known as a poverty line. Poverty lines can be considered in both absolute
terms (where the line is fixed in terms of the living standards indicator and fixed over the entire
domain of the poverty comparison) as well as in relative terms (where the line is tailored to suit
the relevant context and can be revised as circumstances change) (Ravallion, 1992, p25).
Absolute poverty measures are more widely used in developing countries. In large part this
reflects the prevalence of objective levels of destitution in these contexts (Ravallion, 1992) and
the fact that absolute poverty benchmarks are so low as to make them meaningless in developed
countries (Narsey, 2012). For instance, the most prominent absolute poverty measure is the
international poverty line of US$1.25 per day, measured in the local currency using Purchasing
Power Parity (PPP) rates (Chen and Ravallion, 2010). The authors calculate this as the mean of
the national poverty lines of the 15 poorest countries in terms of consumption per capita.4 Insofar
as this represents the poorest of the poor, and characterises abject destitution and the deprivation
of the most basic human needs, it provides an internationally comparable measure of extreme
poverty and an important MDG target 5
However, across most PICs, including Vanuatu and Solomon Islands, the abject destitution that
is often attendant with extreme monetary poverty is rare. This has generally been attributed to
the predominance of domestic food cultivation and the entrenched informal safety nets that
ensure resources are distributed to those who need them (Abbott and Pollard, 2004). Indeed the
combination of fertile lands, the centrality of domestic agriculture in diets and the lack of outright
3 Distance, in this context, is an economic rather than Euclidean (spatial) concept. 4 This represents an update on the original work calculating an international poverty line by Ravallion et al. (1991) who estimated a poverty line of consumption level of $31 per month in 1985 US dollars (PPP). This was considered by the authors to be a representative poverty line for low income countries, and thus of “extreme poverty”. This became known as the $1-a-day poverty line. 5 Target 1a of the MDGs is to halve, between 1990 and 2015, the proportion of people whose income is less than $1, in purchasing power parity (PPP) terms, a day.

5
destitution have led a number of authors to conclude that households in PICs are the beneficiaries
of “subsistence affluence” (PIFS, 2012; UNESCAP, 2004). Initially coined by Fisk (1971) to
describe the economic circumstances of rural farmers in PNG, the term has been broadened to
include other parts of Melanesia and refers to subsistence producers having ample endowments
of environmental resources and the ability to selectively apply labor to produce as much as is
needed whenever they require it.
However, “subsistence affluence” is a contested term. Cox et al. (2007, p4) contends that it
underpins households’ resilience and provides security against material hardship and social
unrest – though they acknowledge that this is limited to rural regions. In contrast, Morris (2011,
p4) argues the term is based on “narrow” evidence and questions whether it had any empirical
validity to begin with. Similarly, Jayaraman (2004, p3) contends that the term has been “much
romanticised” in the region, despite being inconsistent with restricted availability and access to
basic infrastructure services and disparities in incomes. Morris (2011, p4) further notes the stark
contrast between “subsistence affluence” and the “appalling results in social indicators” that are
evident in many PICs. Indeed, despite having relatively low rates of extreme poverty in a
monetary sense, both Vanuatu and Solomon Islands share a number of other official
development characteristics with countries where extreme poverty is prevalent. According to the
UN’s HDI Vanuatu ranks amongst the poorest third of all countries and Solomon Islands
amongst the poorest quarter – with the latter considered to have “Low Human Development”.
Pockets of malnutrition and hunger, while rare, are also known to exist (MICS, 2007) and neither
country is on track to meet all of its MDG commitments (PIFS, 2013).6 Moreover, the
considerable structural shifts being wrought by increasing urbanisation and monetisation in
Vanuatu and Solomon Islands means that any “subsistence affluence” that did exist has arguably
become redundant for many households (see Chapter 4 for a detailed discussion of these
structural shifts).
The upshot is that the term “hardship” has emerged to describe a level of well-being below a
socially acceptable level in Vanuatu and Solomon Islands. The term originates from the seminal
Participatory Assessments of Hardship (PAH) study carried out by the ADB in communities in
a number of PICs. The results indicated that disadvantage in PICs is best characterised as
“inadequate levels of sustainable human development through access to essential public goods
and services and access to income-earning opportunities” (Abbott and Pollard 2004, pxi). The
6 Though Vanuatu is on track to meet its Target 1a – to “halve, between 1990 and 2015, the proportion of the population living below the basic
needs poverty line” (emphasis added) (PIFS, 2013)
6
authors go on to note that poverty, in this context, “is generally viewed as a lack of or poor
services like transport, water, primary health care, and education. It means not having a job or
source of steady income to meet the costs of school fees and other important family
commitments” (2004, p3).
To some extent the results of the PAH square the circle between the lack of extreme monetary
poverty and the low levels of human development in PICs. Accordingly, the study has been
instrumental in shaping the characterisation of poverty in the region. “Hardship” has emerged as
the accepted definition of Pacific poverty; being reflected in the way that countries themselves
characterise the term as well as the way it is measured.7 Many PICs, including Vanuatu and
Solomon Islands, now estimate national poverty according to a “basic needs approach” (GoV,
2008; GoSI, 2008). Indeed the Pacific is unique in that basic needs poverty has become the
relevant benchmark for assessing progress toward achieving the poverty targets in the MDGs,
rather than extreme poverty (PIFS, 2011).8 The basic needs poverty line (BNPL), upon which
poverty estimates are based, is defined as a “relative measure of hardship that assesses the basic
costs of a minimum standard of living in a particular society and measures the number of
households, and the proportion of the population that are deemed not to be able to meet these
needs” (GoV, 2008, pii).
The BNPL, therefore, provides a practical way to describe the unique characteristic of “hardship”
in Vanuatu and Solomon Islands – though it remains firmly ensconced in the tradition of
measuring well-being in monetary terms. Poor households are identified as those with
insufficient monetary resources to meet their minimum dietary requirements as well as their
basic non-food needs (such as shelter, health care, education, clothing, transport and cultural
obligations) (GoSI, 2008, pp10-11).9 Poverty estimates are separately obtained for capital cities,
non-capital city metropolitan regions and rural areas, with the respective BNPLs calculated to
account for the differences in respective livelihood activities and the varying costs of basic needs.
7 At the 2010 Pacific Island Forum Meeting in Port Vila, Forum countries released a communique that has since become known as “The Port Vila Declaration” that touched on the applicability of poverty measures to PICs. Speaking at the release of the Declaration, Secretary General of the Pacific Islands Forum Secretariat, Tuiloma Neroni Slade, noted that “searching for an accepted definition of poverty in the Pacific has been problematic, as international norms of poverty fail to account for cultural social safety nets and subsistence lifestyles prevalent in the region. Poverty, or hardship, in the Pacific has therefore been defined as inadequate access to basic services such as health and education, as well as inadequate access to income opportunities” (Slade, 2011). 8 Morris (2011, p6) also notes that in practice, the $1.25 a day poverty measure is not calculated for many PICs because of a lack of PPP data. 9 Strictly speaking, the BNPL is the combination of two poverty lines, the Food Poverty Line (FPL) which is the cost of a minimally-nutritious, low-cost diet which delivers a minimum of 2,100 calories (Kcal) per day and a Non-Food Poverty Line (NFPL) line which is the cost of essential non-food items. Haughton and Khandker (2009) acknowledge there is disagreement in the precise method for calculating the BNPL as well as a number of practical challenges, including accounting for differences in preferences between rural and urban residents, as well as relative prices between food and non-food items.
7
1.2.2. Alternative measures of poverty in the Pacific context – the role for
multidimensional poverty analyses
While conceptualising poverty in terms of inadequate financial resources is intuitively attractive,
generally comparable, and widely used, it has become increasingly acknowledged that it is not
the only way to understand poverty. Instead, as Sen (1999, p20) notes, income-based measures
are necessary but incomplete and “the role of income and wealth … has to be integrated into a
broader and fuller picture of success and deprivation”. In fact, through his scholarship over
several decades, Sen has been instrumental in shifting the conceptual understanding of poverty.
He argues that an individual’s well-being reflects their capability to function effectively in
society, and that while this may include a certain minimum level of material resources it is also
likely to include access to adequate education, health status, power to make choices, and rights
such as freedom of speech – none of which are adequately captured by income alone (Sen, 1985;
2000).10 Moreover, Sen noted that there are a number of practical limitations to measuring
poverty solely in terms of a minimum level of income, for instance, heterogeneity in
consumption preferences and prices, instability in relative prices and the fact that markets for
essential services such as health, education and water are often missing in low income contexts
(Sen, 1981).
More broadly, Alkire (2011, p2) notes that poverty measures that are confined to any single
space, such as income or consumption, risk abstracting from the multiple, yet individually
important, levels of deprivations that can adversely affect poor individuals. She cites the
observed empirical mismatch between income measures and key social indicators, such as
health, education (and even happiness) in developing countries as an example of the inability of
unidimensional monetary measures to convey information on broader, and often
multidimensional, layers of well-being.
In addition to these conceptual shifts in the characterisation of poverty, there are also practical
reasons why broadening the scope of poverty beyond monetary metrics may have merit in
Vanuatu and Solomon Islands. In particular, both countries are dominated by rural livelihoods
with a high level of subsistence production and sporadic small-scale peddling of surplus produce
in local markets, as well as traditional economic systems in which distribution and exchange are
determined by social mores (Sillitoe, 2006; Regenvanu, 2009; GoSI, n.d.). The Government of
Vanuatu (GoV, 2008) acknowledged the difficulty in estimating the value of such unrecorded
10 This has become known as “Sen’s capabilities approach” (IEP, 2014).

8
economic activity and suggests it may be missed entirely in some instances. Jerven (2013) echoes
this point, arguing that such measurement challenges can cast doubt on the accuracy of GDP per
capita estimates in developing countries more broadly.
The propensity of income-based measures to mis-specify poverty in Melanesia is highlighted by
Narsey (2012, p25) who argues that the 2009 basic needs poverty assessment in Vanuatu paints
an “incongruous” picture of poverty. He argues that the findings of that analysis, which indicates
that the incidence of poverty is three times higher in urban areas than in rural areas, is
inconsistent with the relatively lower living standards observed in rural areas and the continued
strong patterns of rural-to-urban migration.11 Clarke (2007, p2) draws a similar conclusion in
Solomon Islands, noting that the concentration of basic needs poverty in urban areas is
inconsistent with the substantially lower living standards of rural households when measured in
terms of housing quality, energy used for cooking, and access to electricity, water and sanitation.
Cox et al. (2007) use qualitative information to suggest that, in urban areas of Vanuatu, a new
kind of poverty may be emerging that closely parallels the experience of extreme poverty, which
would be consistent with the relatively high rates of urban published poverty statistics. However,
they limit this to urban migrants living in settler communities in Port Vila. Nevertheless, Narsey
(2012) stresses the importance of accurately measuring the spatial distribution of poverty given
that misrepresentations can have significant implications for the allocation of poverty alleviation
resources, and risks creating a perverse cycle where already poor sectors are deprived while
standards in less-poor areas are further improved.
1.2.3. Alternative approaches to poverty measurement: the Multidimensional
Poverty Index (MPI)
In response to Sen’s work, as well as that of a number of other influential authors,12 there has
been increased interest in the development of non-monetary measures of poverty that account
for the multidimensional nature of well-being (Kakwani and Silber, 2008). Stiglitz et al. (2008,
pp.15-16) suggest that measures that account for the joint distribution of the different domains
of well-being are critical to developing policy and thus recommend that they be included in
poverty analysts’ toolkits. UNICEF (2012) acknowledged the importance of multiple
11 Narsey (2012) argues that while the methodology used to calculate the BNPL attempts to account for the relatively cheaper per calorie costs of food in rural areas, and lower housing costs, it ignores the fact that the costs of all other purchased items are higher in rural areas. The approach also fails to account for the differences in food composition, and nutritional quality, between urban and rural areas. The result, Narsey argues, is that the FPL and, by implication, the BNPL, are underestimated in rural Vanuatu (and overestimated in urban areas) resulting in an inappropriately low level of poverty in rural areas (and an inappropriately high level in urban areas). 12 This includes Nussbaum’s work on central human capabilities (Nussbaum, 1988; 1992; 2000), Doyal and Gough’s intermediate human needs (Doyal and Gough, 1991) and Narayan et al. (2000) on axiological needs, among many others.
9
deprivations in their analysis of child poverty in Vanuatu, which was part of a broader global
study into child poverty. In addition to relying on income-based measures of basic needs poverty,
the report included a measure of absolute poverty, which implied a child was exposed to two or
more severe deprivations (across shelter, sanitation, drinking water, information, food, education
and health). However, they stopped short of aggregating this information into a formal index.
At the international level, as relevant data has become increasingly available, there has been a
gradual shift toward capturing multidimensional aspects of well-being in a single index. The
three most significant developments in assessing multidimensional well-being that have emerged
include: the HDI, the international community’s commitment to the MDGs and the recently
devised MPI.
This thesis concentrates on the household-level measure of poverty, the MPI, and its
applicability to Vanuatu and Solomon Islands. A number of features of the MPI make it
potentially well suited to identifying poverty in these countries. The MPI is probably the most
prominent of recent international efforts to reorient household poverty assessments beyond the
monetary domain and account for the multidimensionality of well-being.13 It is certainly the
most widely applied, having now been estimated for 109 countries (accounting for 79 per cent
of the global population), with the results published annually alongside the HDI in the UNDP
Human Development Report (HDR) since 2010 (UNDP, 2010). Vanuatu was included in this
list in 2011 (though only at an aggregate country level) using information drawn from the most
recent Multiple Indicator Cluster Survey (MICS, 2007). Data limitations mean that no such
estimate currently exists for Solomon Islands. Based on an approach devised by Alkire and
Foster (2011a), the MPI represents an important departure from unidimensional monetary-based
poverty measures. It is also distinguishable from the HDI in that the MPI is focused on
households, it includes more indicators, and eschews any explicit measure of income (the HDI
is usually calculated at a country level using macro-level data: life expectancy, years of schooling
and GNI per capita). Further, while the HDI was intended to be used to measure the overall
progress of a country’s development, the MPI is concerned exclusively with a particular segment
of the population, namely the poor, and thus excludes information about the non-poor (Alkire
and Santos, 2010, p10).
13 There is no shortage of possible approaches and methodologies that have been utilised in this endeavour. Measures using the techniques of information theory (Deutsch and Silber, 2005), fuzzy set theory (Lemmi and Betti, 2006), latent variable analysis (Kakawani and Silber, 2008), multiple correspondence analysis (Asselin and Tuan Anh, 2008), alternative counting approaches (Subramanian, 2007), alternative axiomatic approaches (Bossert et al. 2007), and dominance theory (Duclos et al. 2006) have all been suggested or applied.

10
In its reduced form, the MPI is calculated in a given region using the following formula:
MPI = H x A 3.1
where H is the headcount or the percentage of people who are identified as multidimensionally
poor and A is the average intensity of poverty amongst the poor. The MPI is an absolute measure
of poverty, and is therefore useful for inter-temporal and inter-spatial comparisons of poverty.
The headcount measure (H) is akin to the widely-known and intuitive headcount poverty ratio
introduced by Foster et al. (1984). It therefore has the advantage of being easy to communicate
and allows for comparisons with existing poverty measures.14 The inclusion of the average
intensity (A) ensures that the MPI simultaneously concerns itself with identifying the incidence
of poverty as well as the depth of the deprivation being experienced.
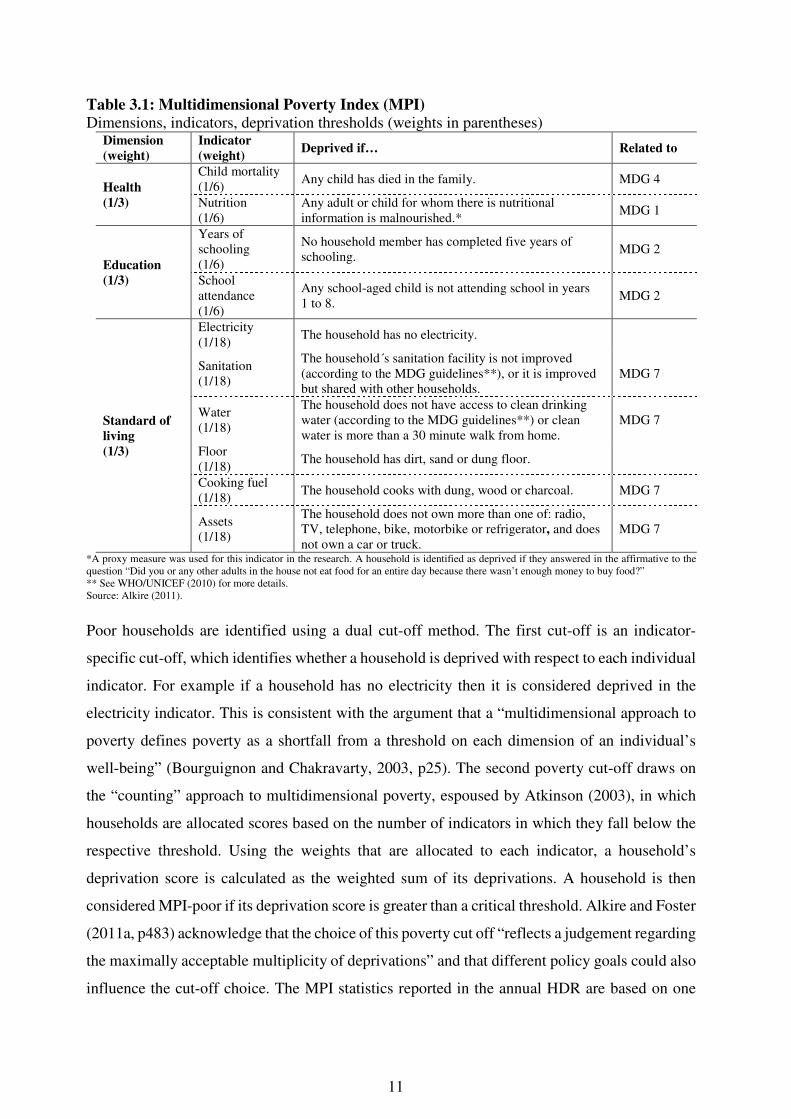
The MPI includes information on ten indicators of well-being, which are grouped into three
equally-weighted dimensions (health, education and a non-monetary standard of living). Eight
indicators are directly based on the MDGs (Alkire and Foster, 2010, p8). By linking the MPI
with the MDGs, Alkire and Santos (2013, p19) consider the measure to be an “acute measure of
poverty conveying information about those households that do not meet internationally agreed
standards in multiple indicators of basic functions, simultaneously”. The implicit assumption is
that individuals within a household share deprivations.15 Table 3.1 provides the dimensions,
indicators, deprivation thresholds and weights for the MPI as it is reported in the HDR.
14 Alkire and Santos (2010, p30) find that the MPI headcounts fall between $1.25 and $2.00/day headcounts. The authors cite this as justification that the MPI is broadly comparable with existing poverty measures. 15 For example, with years of schooling, if the household has at least one adult that has successfully achieved five years of schooling, the household, and all the individuals within it, are considered to be non-deprived. Alkire and Santos (2010, pp.13-14) acknowledge that while this does not capture quality of education, nor the knowledge attained, it is a robust and widely-available proxy of the functionings that require education – literacy, numeracy and comprehension of information. The authors then draw on the notion of effective literacy from Basu and Foster (1998) to suggest that all household members benefit from the abilities of a literate person in the household. Gibson (2001) estimates that the size of this intra-household externality in PNG is 0.76 – that is, an illiterate person living with a literate person reaps 76 per cent of the benefits of a fully literate person.
11
Table 3.1: Multidimensional Poverty Index (MPI)
Dimensions, indicators, deprivation thresholds (weights in parentheses) Dimension
(weight)
Indicator
(weight) Deprived if… Related to
Health
(1/3)
Child mortality (1/6)
Any child has died in the family. MDG 4
Nutrition (1/6)
Any adult or child for whom there is nutritional information is malnourished.*
MDG 1
Education
(1/3)
Years of schooling (1/6)
No household member has completed five years of schooling.
MDG 2
School attendance (1/6)
Any school-aged child is not attending school in years 1 to 8.
MDG 2
Standard of
living
(1/3)
Electricity (1/18)
The household has no electricity.
Sanitation (1/18)
The household´s sanitation facility is not improved (according to the MDG guidelines**), or it is improved but shared with other households.
MDG 7
Water (1/18)
The household does not have access to clean drinking water (according to the MDG guidelines**) or clean water is more than a 30 minute walk from home.
MDG 7
Floor (1/18)
The household has dirt, sand or dung floor.
Cooking fuel (1/18)
The household cooks with dung, wood or charcoal. MDG 7
Assets (1/18)
The household does not own more than one of: radio, TV, telephone, bike, motorbike or refrigerator, and does not own a car or truck.
MDG 7
*A proxy measure was used for this indicator in the research. A household is identified as deprived if they answered in the affirmative to the question “Did you or any other adults in the house not eat food for an entire day because there wasn’t enough money to buy food?” ** See WHO/UNICEF (2010) for more details. Source: Alkire (2011).
Poor households are identified using a dual cut-off method. The first cut-off is an indicator-
specific cut-off, which identifies whether a household is deprived with respect to each individual
indicator. For example if a household has no electricity then it is considered deprived in the
electricity indicator. This is consistent with the argument that a “multidimensional approach to
poverty defines poverty as a shortfall from a threshold on each dimension of an individual’s
well-being” (Bourguignon and Chakravarty, 2003, p25). The second poverty cut-off draws on
the “counting” approach to multidimensional poverty, espoused by Atkinson (2003), in which
households are allocated scores based on the number of indicators in which they fall below the
respective threshold. Using the weights that are allocated to each indicator, a household’s
deprivation score is calculated as the weighted sum of its deprivations. A household is then
considered MPI-poor if its deprivation score is greater than a critical threshold. Alkire and Foster
(2011a, p483) acknowledge that the choice of this poverty cut off “reflects a judgement regarding
the maximally acceptable multiplicity of deprivations” and that different policy goals could also
influence the cut-off choice. The MPI statistics reported in the annual HDR are based on one

12
specific interpretation, in which a household is identified as poor if its weighted deprivation
score is greater than or equal to one third (0.33).
According to Alkire and Foster (2011a) a key advantage of identifying the poor on the basis of
the dual cut-off method is that it militates against the extremes of either the “union” or
“intersection” methods for identifying multidimensional poverty. The “union” method identifies
a household as poor if it is deprived in any single dimension of poverty while according to the
“intersection” method a household is poor only if it is deprived across all dimensions. Datt
(2013) criticises the dual cut off approach, suggesting that it violates the transfer axiom, in that
a regressive transfer within a single dimension (i.e. from a relatively poorer household to a
relatively richer household) can decrease poverty.16 He advocates, therefore, for the union
approach which obviates this issue and captures the “essentiality” of all deprivations.17
Nonetheless, by basing the dual cut-off on the counting approach, the MPI builds on a long
history of empirical implementation (see Mack and Lansley, 1985; Gordon et al. 2003) and
provides a nuanced assessment of poverty. To illustrate, Alkire (2011) shows that when applied
to the entire sample of countries for which an MPI estimate is available, the union and
intersection methods yield average poverty rates of 58 per cent and 0 per cent, respectively;
whereas the MPI indicated poverty was 38 per cent.
While the dual cut-off method addresses Sen’s criteria for a credible poverty measure in that it
is able to identify the poor amongst the total population, it is not sufficient as a measure of
multidimensional poverty. In particular, it fails a key axiom of dimensional monotonicity. Alkire
and Foster (2011a, p479) explain this intuitively as “if poor person i becomes newly deprived in
an additional dimension, then overall poverty should increase”. However, headcount measure of
MPI is insensitive to a poor household becoming deprived in an additional dimension.18 The
inclusion of the average intensity component (A), which measures the cumulative sum of
deprivations in which the average poor household is deprived, addresses this shortcoming. It
ensures that if a poor household becomes deprived in an additional dimension then overall
poverty will increase (Alkire, 2011).19
16 The axiomatic approach to characterising the necessary properties of poverty measures was pioneered by Sen (1976). 17 Datt (2013) also argues that MPI measures could account for cross-dimensional convexity in which greater weight is given to the multiplicity of deprivations of a household; thus reflecting the welfare cost of compounding deprivations and the reinforcing nature of multidimensional poverty. 18 Put another way, a poor household can never be made non-poor by an improvement in a non-deprived indicator, while a non-poor household can never be made poor by a decrease in an already deprived indicator. 19 This is in addition to satisfying a number of other key axiomatic properties of multidimensional poverty measurement. These include replication invariance, symmetry, poverty focus, deprivation focus, weak monotonicity, non-triviality and weak re-arrangement (Alkire and Foster, 2011a).
13
The MPI, therefore, has a number of important characteristics that make it particularly useful for
poverty measurement in Vanuatu and Solomon Islands. By focusing directly on households’
actual deprivations it means that money is not relied upon as the proxy measure of well-being.
That the MPI also represents a reorientation toward Sen’s (1993) view that poverty is a
deprivation of human capabilities and uses indictors with explicit links to internationally-agreed
standards of living means it also has sound theoretical foundations and policy relevance. Further,
the fact that the MPI focuses on the joint significance of multiple deprivations means that it
identifies households that fail to reach the minimum standards in several indicators at the same
time – a task that tends to be beyond unidimensional perspectives of poverty.
In addition, the MPI provides a richness of information that eludes existing poverty statistics.
Data for the MPI is sourced from a single survey, which links each indicator to a single
household. This represents an important departure from some of the more commonly used
instruments to ascertain well-being in Vanuatu and Solomon Islands, which are based on
aggregated survey data from HIES, Censes and Demographic Health Surveys. Crucially, from
the perspective of examining the importance of economic geography on poverty in Vanuatu and
Solomon Islands, the MPI can also be decomposed into regional sub-groups. It can also be
broken down to highlight which dimensions of poverty are most severe for the entire population
or any sub-group.
The MPI is not without its detractors. Rippin (2011) argues that the measure fails to account for
the correlation between indicators. Ravallion (2010) also criticises the MPI from a number of
flanks, including the arbitrary assignment of weights to its components and the lack of an explicit
linkage to conceptual analysis. More broadly, Ravallion argues that scalar indices of well-being,
such as the Physical Quality of Life Index (PQLI) (Morris, 1979), the HDI and the MPI are
opaque, have hidden costs and downside risks that can lead to the distortion of poverty
alleviation policies.20 While he acknowledges that poverty is multidimensional, he argues that
the conflation of information from various sources into a single number is often determined by
data availability rather than a clear conceptual framework. In the case of the MPI he suggests
that the weights used to aggregate deprivations lack the conceptual clarity regarding the marginal
rates of substitution between deprivations that are ordinarily discerned from relative prices. He
20 Ravallion borrows a web term, “mashup”, to describe these indices and cites other examples that collapse various data into a composite without an explicit link to theory or practice, including the Economic Freedom of the World Index, the Worldwide Governance Indicators, Ease of Doing Business Index, and the Environmental Performance Index.

14
proposes, instead, a “dashboard approach” to multidimensional poverty, in which all indicators
are considered in stand-alone terms, rather than in a single index (p247).
In response, defenders emphasise that the MPI has strong theoretical roots and is transparent in
its construction. OPHI (n.d.) link the MPI directly to Sen’s capabilities approach and justify
tracking each indicator separately since each represents an intrinsically important functioning.
Others, such as Alkire (2011) and Alkire and Foster (2011b), demonstrate the index’s robustness
to a range of poverty cut-offs and defend the equal weighting of each dimension of poverty as
being both intuitively appealing and consistent with the proposition of Atkinson et al. (2002,
p25) that “the interpretation of the set of indicators is greatly eased where the components have
degrees of importance that, while not necessarily exactly equal, are not grossly different”. Equal
weighting is also consistent with the approach used in existing measures such as the HDI.
Ferreira (2011, p494) also argues that a dashboard approach to multidimensional poverty risks
overlooking the joint distribution of a households’ deprivations, which can often contain more
information than marginal distributions. He therefore concludes that the scalar approach of the
MPI is superior and notes that it has the added benefit of permitting rank ordering based on the
level, location and composition of poverty.
1.3. Multidimensional Poverty Indices for households in Vanuatu and Solomon
Islands
A single household survey, designed to measure the MPI, was administered in twelve separate
communities of Vanuatu and Solomon Islands (see Chapter 2). The survey collected data on
each of the individual indicators of deprivation used in the MPI, with the exception of
malnutrition since collecting accurate anthropometric measurements was not possible.21 Alkire
and Santos (2010, p14) note that health is the most difficult dimension of poverty to measure
and comparable indicators of health for all household members are generally missing from
household surveys. A proxy measure was therefore used to indicate the presence of a
malnourished adult in the household, based on information regarding the food security situation
of each household. This is based on the strong (albeit incomplete) link between food insecurity
and malnutrition (Black et al. 2008). Health survey questions from the US Food Security module
(a self-reported indicator of behaviors, experiences and conditions related to food insecurity),
21 Recall, the nutrition deprivation cut off in the index is if any adult or child for whom there is nutritional information is malnourished (Alkire, 2011). Adults are considered to be malnourished in the MPI if their Body Mass Index (BMI) is below 18.5 m/kg2. The BMI is a combination of anthropometric indicators, requiring scales to measure weight and tape to measure height. Neither of these were permitted as part of the household survey or provided to survey enumerators.

15
were used in the household survey. The US Food Security Module has been shown to be an
inexpensive and easy-to-use analytical tool for evaluating food insecurity (Rafiei et al. 2009).
Moreover, it has been successfully adapted for use in a wide variety of cultural and linguistic
settings around the world – in particular in Asia and the Pacific (Derrickson et al. 2000).
The specific indicator of food security used was a household’s answer to the question “did you
or any other adults in the house not eat food for an entire day because there wasn’t enough money
to buy food?” Food is generally the most pressing of priorities for any human being and to have
gone without food for an entire day suggests severe food insecurity – particularly in Vanuatu
and Solomon Islands, where subsistence agriculture is prevalent, social networks are strong and
gift-giving is an ingrained cultural norm. Accordingly, if any household member is unable to
draw upon these customary coping mechanisms for an entire day then the households’ food
insecurity situation is probably acute. Adults were chosen as the appropriate referent object for
food insecurity since the original index threshold asks whether there is “any adult or child” that
is malnourished.22 Given the tendency of parents to feed their children before feeding
themselves, it was judged that should children be the focus of food security then the results
would be capturing a more severe form of deprivation than intended by the MPI (that is, one can
doubtless infer that if a child in a household has gone without food, then so too have adults, but
not vice-versa).
1.3.1. Calculating a “Melanesian” MPI (MMPI)
Alkire and Santos (2010) acknowledge that in order to ensure that the MPI is internationally
comparable only generic data can be included. Consequently, important local determinants of
well-being are excluded from the analysis. This is particularly pertinent for poverty measurement
in places such as Melanesia, where a fertile environment and strong systems of social support
contribute towards the lack of absolute destitution, while lack of access to essential services
underpins views of “hardship” in the region. However, each of these important factors is
excluded from the calculation of the conventional MPI.
Alkire and Foster (2011b, p291) therefore consider the existing MPI to be a “generalized
framework for measuring multidimensional poverty”. They note that “[w]hile this flexibility
makes [the MPI] particularly useful for measurement efforts at a country level, [decisions on
22 It should also be acknowledged that malnutrition can occur when an individual’s BMI is overly high. Indeed, obesity is a particularly pressing health problem in developing countries, including PICs. However, obesity is not considered in the calculation of the MPI measure and a tool for measuring obesity was not included in the household survey.

16
dimensions, cut offs and weights] can fit the purpose of the measure and can embody normative
judgments of what it means to be poor”.
To date the framework methodology devised by Alkire and Foster has been applied with
modifications to also identify local aspects of well-being in a number of different country
contexts. These include the Gross National Happiness Index in Bhutan, which augments
conventional metrics of human welfare with information on culture, psychological well-being
and economic resilience (Ura et al. 2012). In Mexico, an index of multidimensional poverty is
based on the set of social rights and levels of economic well-being enshrined in the Mexican
Constitution. The poverty measure thus combines indicators of basic human functioning with
access to social security, social cohesion and per capita household income. The measure then
segments individuals according to whether they are poor due to insufficient economic well-
being, insufficient social rights or both (CONEVAL, 2010). While in Nepal a Multidimensional
Exclusion Index is under construction, which augments the MPI with indicators of agency /
influence (Bennett and Parajuli, 2011). Participatory approaches have also been used to identify
the relevant indicators of deprivation for the local context. Trani and Cannings (2013) consulted
with aid workers and local parents to devise the specific indicators for identifying child poverty
in conflict zones of Darfur in Sudan, while in El Salvador, focus groups were recently held
throughout the country with a view to formalising a multidimensional measure of national
poverty (OPHI, 2013).
This chapter takes advantage of this flexibility by tailoring the MPI to include further
information relevant to the nature of poverty in the Melanesian countries of Vanuatu and
Solomon Islands. It constructs a Melanesian Multidimensional Poverty Index (MMPI) by
including a new dimension of welfare – that of “access”. This follows closely Abbott and
Pollard’s (2004) assertion that poverty in the Pacific is not destitution, per se, but rather poverty
of opportunity and a dearth of access to key services. Within the access dimension three separate
indicators of poverty have been identified that reflect the literature on well-being in the region.
These include the produce garden, the existence of a strong social support network and access
to services.
In modifying the MPI to account for these local characteristics, an attempt is made to follow the
existing MPI methodology as closely as possible. Alkire (2008) notes that there are various
approaches one can take when constructing multidimensional poverty indices, including the
choice of indicators and the weights allocated to each indicator. In this research, indicators are

17
chosen that are objective and quantifiable, have clearly-defined thresholds and can be
categorised in binary space. Moreover, in the absence of any reliable empirical data regarding
individuals’ values regarding an appropriate weighting structure, the existing (and widely used)
MPI methodology is deemed to be the most suitable. Accordingly, each of the four dimensions
of well-being in the MMPI (i.e. health, education, standard of living and access) accounts for
one quarter of the total weighting (compared with the one third that the three incumbent
dimensions are each given in the conventional MPI) (Table 3.2). The individual indicators for
each respective dimension are then re-weighted accordingly. The poverty cut off of one third is
also retained.
Table 3.2: Melanesian Multidimensional Poverty Index (MMPI)
Dimensions, indicators, deprivation thresholds (weights in parentheses) Dimension (weight) Indicator (weight) Deprived if…
Health
(1/4)
Child mortality (1/8)
Any child has died in the family.
Nutrition (1/8)
Any adult or child for whom there is nutritional information is malnourished.*
Education
(1/4)
Years of schooling (1/8)
No household member has completed five years of schooling.
School attendance (1/8)
Any school-aged child is not attending school in years 1 to 8.
Standard of living
(1/4)
Electricity (1/24)
The household has no electricity.
Sanitation (1/24)
The household´s sanitation facility is not improved (according to the MDG guidelines**), or it is improved but shared with other households.
Water (1/24)
The household does not have access to clean drinking water (according to the MDG guidelines**) or clean water is more than a 30 minute walk from home.
Floor (1/24)
The household has dirt, sand or dung floor.
Cooking fuel (1/24)
The household cooks with dung, wood or charcoal.
Assets (1/24)
The household does not own more than one of: radio, TV, telephone, bike, motorbike or refrigerator, and does not own a car or truck.
Access
(1/4)
Garden (1/12)
The household does not have access to a garden.
Social support (1/12)
Household has no one to rely upon in a time of financial difficulty.
Services (1/12)
> 30 minutes travelled to health clinic or secondary school or central market.
*A proxy measure was used for this indicator. A household is deprived if they answered in the affirmative to the question “Did you or any other adults in the house not eat food for an entire day because there wasn’t enough money to buy food?” ** See WHO/UNICEF (2010) for more details. Source: Author, modified from Alkire (2011).
The remaining part of this section provides additional information on each of the individual
deprivation indicators in the access dimension.
18
Gardens are of central importance to households in both Vanuatu and Solomon Islands. Much
of Melanesian culture revolves around the garden, both in terms of its produce and the practice
of gardening itself (MNCC, 2012). Households that do not have access to a garden and its
produce are isolated from an important cultural activity and, more practically, must rely on the
cash economy (or extended family favors) for their food (Chung and Hill, 2002; Maebuta and
Maebuta, 2009; UNICEF, 2012b). A household is therefore considered deprived if it reports not
having access to a garden.
Strong social support networks and the system of reciprocity are hallmarks of the informal safety
net in Melanesia (Regenvanu, 2009; AusAID 2012a; AusAID, 2012b). Despite some evidence
that these networks are breaking down (see Chapter 5) they remain central to well-being in the
local context. A situation where a household cannot rely upon anyone in a time of need is
therefore likely to be an indicator of its exclusion from a risk-sharing network and thus its
deprivation of the redistributive effects and risk-management functions provided by informal
social security. This is based on the findings of Fafchamps and Lund (2003) that gifts and
remittances tend to be channelled through social networks rather than as general insurance, at a
village level. Households were therefore asked how many people they could rely on (outside the
household) during a time of financial difficulty. If they nominated zero individuals then they are
considered to be deprived in the social support indicator. It is recognised that there is no objective
measure of financial difficulty in this instance, and that the number of people relied upon is
necessarily imprecise, but this indicator should nevertheless provide a sense of the integrity of
the local safety net and those households that are protected by it.23
As identified by the ADB’s PAH, the remoteness of essential services such as publically-
provided education and health is an important dimension of hardship in the Pacific (Abbott and
Pollard, 2004). Remoteness, in this sense, is a function of the geographical distance of many
villages from urban centres, coupled with inadequate transport networks and the funding
constraints facing policymakers, which tends to limit the extent to which essential services are
provided outside of urban areas (Cox et al. 2007). Additionally, limited access to centralised
markets in which individuals can buy and sell a range of differentiated goods and services
constrains the range of basic goods available for purchase, and their price, and thus limits
income-earning opportunities.
23 It was decided against arbitrarily choosing a number of people that would qualify as a sufficiently large network and instead chose zero as the deprivation threshold. While this is a low hurdle requirement it is likely to overcome measurement errors related to the size of the network. While an individual may not know the size of their network if they get into trouble, they are likely to know whether a network does, in fact exist.

19
A household is therefore considered deprived in access to services if it takes more than half an
hour to travel from the dwelling to a health service (hospital or clinic), a secondary school or to
a market.24 The choice of these three essential services reflects qualitative information provided
by communities themselves.25 The decision to use travel time as the specific measure follows
Gibson and Rozelle (2003, p166) who consider travel time an important proxy indicator of a
households’ access to services.26 They note that the combination of poor roads and high travel
time often makes assessing education and health prohibitively expensive, particularly in rural
areas. Households were asked the average time that it took, using the most common form of
transport (which could be walking, public transport or private vehicles) to travel to each of the
three key services. While the access to essential services might be partially picked up by other
indicators of the index (in particular the health and education dimensions) this will not always
be the case.27
1.3.2. Analysis of the Multidimensional Poverty Indices in Vanuatu and
Solomon Islands
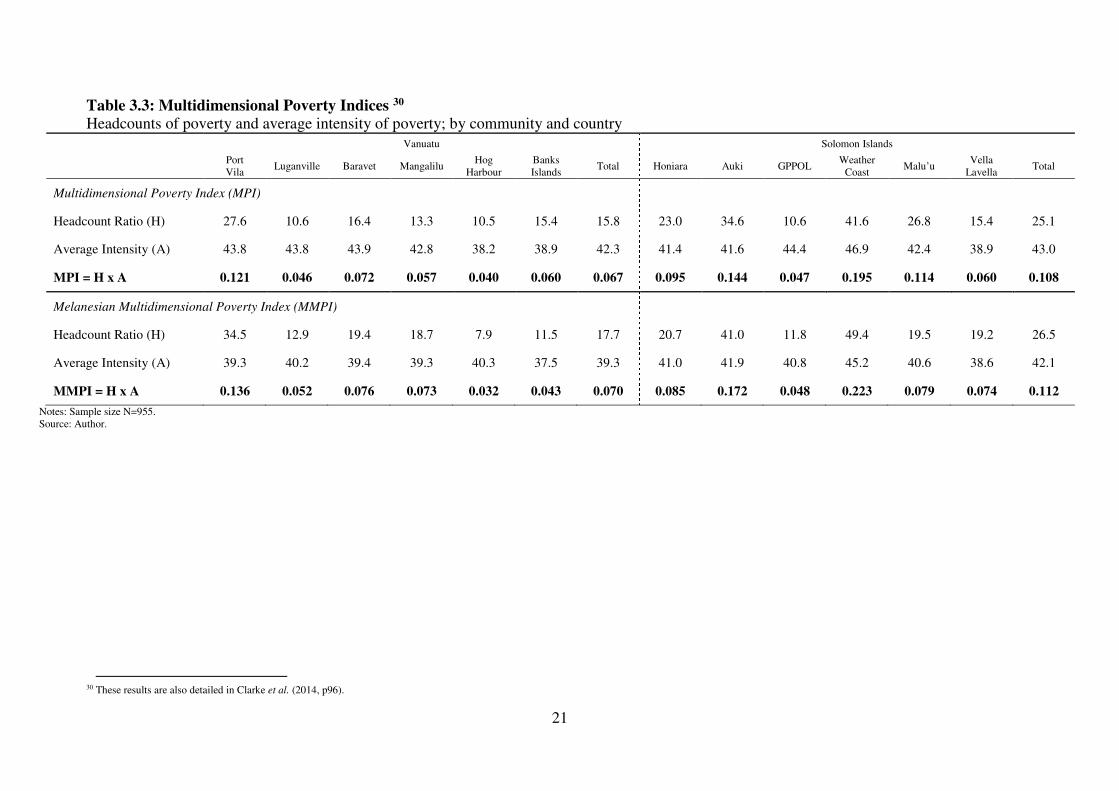
Table 3.3 records the incidence of poverty (H), the average intensity of poverty (A) and the index
values for both the MPI and MMPI at a community and country level in Vanuatu and Solomon
Islands. Figures 3.1 and 3.2 plot the incidence of poverty and the index values while Appendix
C details the deprivations rates of each indicator in each community.
At a country level, Solomon Islands has a higher MPI score than Vanuatu (0.108 compared with
0.067, respectively). This reflects the greater headcount poverty in Solomon Islands (25 per cent)
than in Vanuatu (16 per cent) given that the average intensity of deprivation faced by the poor
(A), was broadly similar in both countries.28 While the national poverty scores are slightly higher
24 The combination of multiple components within a single indicator is consistent with the original methodology of the MPI; specifically the Assets indicator, which includes eight separate assets. 25 Access to a secondary (rather than primary) school is assessed for a number of reasons. Primary school education is (notionally) free in Vanuatu and Solomon Islands and enrolment rates are generally high. Consequently, remoteness from a primary school (if it exists) does not appear to be a common constraint. In contrast, secondary schools are much less widely available. Thus, when a secondary school is not nearby, families are often required to send their children to school as long-term boarders (AusAID, 2012). Indeed, having no secondary school close by was a very common complaint made by focus group participants and key informants. Similar complaints were not registered against the proximity of primary schools – even in the most remote and rural areas. Additionally, the financial costs and time spent getting to central markets were major complaints of focus group participants and key informant interviews (see Feeny, 2014 for more details on qualitative data collected). While small local markets exist in all communities, for example at roadsides as well as at kava bars in Vanuatu and betel nut markets in Solomon Islands, better income earning opportunities are available in central markets. 26 Of course, this presupposes that the main constraint on households’ access to essential services is geographical distance. There are also likely to be instances where households are geographically proximate yet lack the financial resources to be able to pay for these services (such as out-of-pocket co-payments for health services or school fees). For instance, this would be particularly pertinent if these services were predominantly provided in private markets. The analysis is based upon the assumption that schools, health services and markets are generally publically provided in Vanuatu and Solomon Islands. Other barriers to access are beyond the scope of this analysis. 27 A correlation analysis indicates that each of the indicators contained within the health and education dimensions are not highly correlated with the access dimension. While this may indicate that they are capturing different dimensions of the same problem, it could also be the case that child mortality and education attainment and adult education are functions of historical, rather than current service access. In addition, the child school attendance indicator is likely to be targeted at primary school education, whereas the access dimension is focused on secondary school. 28 National estimates are derived using an unweighted average of the six respective communitiessurveyed in each country.

20
in each country according to the MMPI, the respective relativities between the two countries
remain broadly constant. That the prevalence of poverty is generally higher in Solomon Islands
compared with Vanuatu is consistent with the relatively poorer performance of Solomon Islands
according to other measures of well-being, including the HDI, GNI per capita and basic needs
poverty assessments. Comparing the MPI across countries, poverty in Solomon Islands is
equivalent to that observed in Bhutan and Guatemala, while in Vanuatu it is akin to Tajikistan
and Mongolia.29
29 The results of this analysis can be compared with the Vanuatu MPI estimate published by the UNDP in its HDR. This study suggests that Vanuatu’s MPI score is 0.067, which is around half that reported in the HDR (0.129). This discrepancy between the two measures reflects the lower headcount rate of poverty in this study (16 per cent, compared with 30 per cent) as the average intensity of poverty amongst the poor in both measures was broadly similar. The differences in the observed rates of multidimensional poverty could stem from a number of factors (or a combination of factors). Firstly, there is a possibility of measurement error in one (or both) of the surveys. Secondly, the difference may be a function of economic development between 2007 and the time this study was done in 2011 (the Vanuatu economy grew, in nominal terms, by almost 29 per cent between 2007 and 2010). Thirdly, the differences may also reflect the different sample composition (the national estimates in this research include a 37 per cent urban share while the published estimate in the UNDP is based on an urban share of 45 per cent from the 2007 Multiple Indicator Cluster Survey). Fourthly, the discrepancy could reflect the fact the two approaches are capturing different dimensions of malnutrition. The MICS estimate only uses child weight-for-age data (with adult BMI data unavailable). In contrast this study uses a measure of adult food insecurity. To the extent that adults may shield children from food insecurity it is possible that this study is capturing a leading indicator of malnutrition, rather than a contemporaneous measure of malnutrition.
21
Table 3.3: Multidimensional Poverty Indices 30
Headcounts of poverty and average intensity of poverty; by community and country
Vanuatu Solomon Islands
Port Vila Luganville Baravet Mangalilu Hog
Harbour Banks Islands Total Honiara Auki GPPOL Weather
Coast Malu’u Vella Lavella Total
Multidimensional Poverty Index (MPI)
Headcount Ratio (H) 27.6 10.6 16.4 13.3 10.5 15.4 15.8 23.0 34.6 10.6 41.6 26.8 15.4 25.1
Average Intensity (A) 43.8 43.8 43.9 42.8 38.2 38.9 42.3 41.4 41.6 44.4 46.9 42.4 38.9 43.0
MPI = H x A 0.121 0.046 0.072 0.057 0.040 0.060 0.067 0.095 0.144 0.047 0.195 0.114 0.060 0.108
Melanesian Multidimensional Poverty Index (MMPI)
Headcount Ratio (H) 34.5 12.9 19.4 18.7 7.9 11.5 17.7 20.7 41.0 11.8 49.4 19.5 19.2 26.5
Average Intensity (A) 39.3 40.2 39.4 39.3 40.3 37.5 39.3 41.0 41.9 40.8 45.2 40.6 38.6 42.1
MMPI = H x A 0.136 0.052 0.076 0.073 0.032 0.043 0.070 0.085 0.172 0.048 0.223 0.079 0.074 0.112
Notes: Sample size N=955. Source: Author.
30 These results are also detailed in Clarke et al. (2014, p96).

McDonald, L. (2014) THE VULNERABILITY AND RESILIENCE OF HOUSEHOLDS IN VANUATU AND
SOLOMON ISLANDS TO GLOBAL MACROECONOMIC SHOCKS, PhD Thesis
22
In both Vanuatu and Solomon Islands the aggregate rates of headcount multidimensional poverty
are broadly comparable to the published rates of basic needs income poverty at a national level
(Table 3.4). However, important differences emerge between the measures when the sample
from this research is equated to the way poverty is reported at a sub-national level in each
country. This is most stark in rural areas, where the rate of basic needs poverty in both countries
is considerably lower than that specified by either multidimensional measure. While this may
reflect the specific sample of this research, the relatively high rate of rural poverty, using both
the MPI and MMPI, is consistent with the results of UNICEF (2012), which found that when
poverty was measured using actual deprivations, rather than in monetary terms, children in rural
households experienced three times the rate of severe deprivations than urban households.
Importantly, the results lend some credence to Narsey’s (2012) criticisms regarding the potential
misspecification of rural poverty in Vanuatu (and, by implication, also in Solomon Islands)
according to the basic needs approach.
Table 3.4: Headcount poverty rates
Based on the geographical characterisation of basic needs poverty used by the Government of Vanuatu and the Government of Solomon Islands
Basic needs poverty MPI poverty* MMPI poverty*
Vanuatu national average 15.9 15.8 17.7
Port Vila (capital city) 32.8 27.6 34.5 Luganville 10.9 10.6 12.3 Rural 10.8 15.0 14.2
Solomon Islands national average 22.7 25.0 26.5
Honiara (capital city) 32.2 23.0 20.7 Provincial-Urban 13.6� 34.6 41.0 Rural 18.8 23.3 24.5 �“Provincial-Urban” in Solomon Islands is assumed to be the equivalent to Auki, though will also likely include other provincial towns, such as Gizo in the Western Province. * “National average” is the arithmetic mean of the six communities surveyed in each country; “Rural” is the arithmetic mean of all non-capital city and non-second city communities in the survey sample. Sources: Author; GoV 2008; GoSI 2008.
In any case, the results in this analysis may be most suited to providing a sense of poverty at a
sub-regional, rather than national level. Further research, with larger sample sizes, may be
required to generate nationally representative poverty estimates.
Looking at the poverty profile at the individual community level, some further interesting trends
emerge. In the vast majority of developing countries, poverty is predominantly a rural issue, in
large part reflecting the relatively limited opportunities households have to engage in diverse
higher-value adding activities. In Vanuatu and Solomon Islands, this also seems to be the case,
though there are some important nuances. In general, headcount poverty rates were highest in
the most geographically remote rural areas (such as the Weather Coast in Solomon Islands and
Baravet in Vanuatu). The Weather Coast had an MPI score that placed it on par with the sub-

McDonald, L. (2014) THE VULNERABILITY AND RESILIENCE OF HOUSEHOLDS IN VANUATU AND
SOLOMON ISLANDS TO GLOBAL MACROECONOMIC SHOCKS, PhD Thesis
23
Saharan African countries of Swaziland and the Republic of Congo. However, poverty was also
relatively high in the squatter communities in the urban areas of Auki, Port Vila, and Honiara.
In contrast, with the exception of Luganville, the least-poor communities were rural (such as the
GPPOL villages, Hog Harbour and Mangalilu) with poverty rates between 11 and 13 per cent.
The result is that when communities are aligned broadly in terms of their remoteness from main
markets, a distinctive “U-shape” pattern emerges in the distribution of poverty (see Figures 3.1
and 3.2).31
Figure 3.1: Headcount multidimensional poverty
Percentage of households in multidimensional poverty by location and country*
*Communities have been assembled, broadly, in terms of their increasing remoteness from central markets. Source: Author.
31 In determining the remoteness of each community from main markets, a judgement has been made based upon the concept of economic distance, (i.e. “the ease, or difficulty, for goods, services, labour, capital and ideas to traverse space” World Bank, 2009, p32). This, in turn, is based upon the author’s assessment of the availability, timeliness and reliability of transport networks garnered while conducting field work. Appendix B provides a summary of the transport issues in each community. To the extent that each of the urban communities in the sample (i.e. capital cities and urban provincial centres) is considered a “main market”, these have been sorted in descending order according to headcount poverty.
0
5
10
15
20
25
30
35
40
45
50
55
60
0
5
10
15
20
25
30
35
40
45
50
55
MPI (H) MMPI (H)
% %

McDonald, L. (2014) THE VULNERABILITY AND RESILIENCE OF HOUSEHOLDS IN VANUATU AND
SOLOMON ISLANDS TO GLOBAL MACROECONOMIC SHOCKS, PhD Thesis
24
Figure 3.2: Multidimensional poverty indices
Headcount multiplied by average intensity; by location and country*
*Communities have been assembled, broadly, in terms of their increasing remoteness from central markets (as per Figure 3.1). Source: Author.
The commonality amongst those communities in rural areas with the highest rates of poverty is
their geographical remoteness combined with inadequate transport links to main markets. Much
of the transport infrastructure in Vanuatu and Solomon Islands is poor, with few all-weather
roads, and shipping and air services that are both expensive and unreliable (Clarke, 2007).
AusAID (2006) suggest that inadequate infrastructure constrains development opportunities,
while Feeny (2004, pp.8-9) notes that poor transportation networks prevent rural communities
from benefiting from urban-based growth. Confirming the link between economic remoteness
and household poverty, individuals in each of the communities with the highest rates of poverty
face long and costly journeys to central markets, with poor roads (as is the case in Malu’u) and
very long boat journeys (Vella Lavella, Weather Coast, Baravet and Banks Islands) a major
barrier to access.
In contrast, the commonality among those communities with the lowest rates of poverty in the
sample is their rural character (including physical separation from towns, accessibility of
environmental resources and close-knit communities) coupled with their accessibility to good
quality transport infrastructure. In Vanuatu the recently completed Efate Ring Road provides
direct road links for rural communities on the island of Efate, such as Mangalilu, to central
markets in Port Vila, while the East Coast Santo road has opened up the markets in Luganville
0.000
0.025
0.050
0.075
0.100
0.125
0.150
0.175
0.200
0.225
0.250
0.275
0.300
0.000
0.025
0.050
0.075
0.100
0.125
0.150
0.175
0.200
0.225
0.250
0.275
0.300
MPI Score (H x A) MMPI Score (H x A)

McDonald, L. (2014) THE VULNERABILITY AND RESILIENCE OF HOUSEHOLDS IN VANUATU AND
SOLOMON ISLANDS TO GLOBAL MACROECONOMIC SHOCKS, PhD Thesis
25
to the community of Hog Harbour. Key informant interviews from Mangalilu and Hog Harbour
suggest that the construction of these roads has facilitated opportunities to earn income, by
increasing market access (for both agriculture and tourism) stimulating the supply of transport
and reducing travelling times, costs and / or passengers.32 Similarly, the GPPOL villages are
directly linked to central markets in Honiara via the Kukum Highway, which also links the
nearby palm oil factory with the main port in Honiara; thus providing a direct link to export
markets.
The correlation between transport infrastructure and multidimensional poverty confirms the
findings of other studies that travelling time is a significant determinant of poverty in Melanesia.
It is also consistent with the World Bank (2009, p15) view that better infrastructure tends to
reduce economic distance. In their analysis of PNG, Gibson and Rozelle (2003) found that
transport time – a proxy for cost – increased poverty by decreasing the returns from value-adding
economic activities in central markets (and thus reinforcing autarkic subsistence agriculture) and
increasing the price of staples in stores in local communities. UNICEF (2012) also found that
the highest rates of severe deprivations in children in Vanuatu were concentrated in the most
geographically distant provinces of Vanuatu. Good access to urban areas should also reduce the
costs of accessing essential services, such as hospitals and secondary schools, given they tend to
be concentrated in urban areas. The latter effect is a key reason why the MMPI explicitly includes
access to services as an indicator of deprivation (see Section 3.3.3).
The high rates of observed poverty in urban areas are likely to be partially the result of the sample
consisting of squatter settlements, which are renowned for their lack of access to services,
employment and their relatively high rates of monetary poverty (see Chapter 2). Importantly, the
consistency between the multidimensional measures of poverty and the basic needs assessments
in portraying relatively high urban poverty provide a useful cross-check on the applicability of
multidimensional poverty indices in urban areas. Thus, unlike basic needs assessments, the MPI
is applicable in both rural and urban areas.
A further interesting feature of the geographical distribution of poverty in these countries is the
divergent characteristics of the two respective second cities: Auki in Solomon Islands and
Luganville in Vanuatu. Specifically, the rate of observed poverty in Auki tends to more closely
resemble the characteristics of the squatter settlements of the capital cities while Luganville is
32 The increase in vehicles resulting from the completion of the MCC-sponsored roads was documented by Morosiuk (2011). On some sections of the road, traffic increased four-fold between 2008 and 2010.
McDonald, L. (2014) THE VULNERABILITY AND RESILIENCE OF HOUSEHOLDS IN VANUATU AND
SOLOMON ISLANDS TO GLOBAL MACROECONOMIC SHOCKS, PhD Thesis
26
more akin to a well-connected rural community. In part, this may reflect the divergent economic
fortunes of the two cities: in particular the steady stream of tourism to the east coast of Santo,
which funnels through Luganville, is largely absent from Auki’s island of Malaita. Indeed, it is
likely to be no coincidence that Hog Harbour, which is connected to Luganville via the East
Santo road, also has relatively low levels of poverty.
An additional useful feature of the MPI is its ability to be decomposed into its component
dimensions. This provides an important insight into the structure of poverty in a given region.
Figure 3.3 provides the breakdown of the contribution that each dimension makes to
multidimensional poverty in both Vanuatu and Solomon Islands (Appendix D shows the
breakdown in each community).33 The standard of living dimension contributes the most to the
MPI in each community, accounting for almost half of total poverty in both Vanuatu and
Solomon Islands, though at the community level the contribution ranges from 42 per cent of
poverty in GPPOL to 58 per cent in Weather Coast. The next most important dimension in most
communities is health, which generally contributes just under one third of poverty, followed by
education. The exception is in both Banks Islands and Weather Coast, where health makes only
a modest contribution to poverty and education is more prominent. In general, the contribution
to poverty made by the standard of living and education dimensions tends to increase in line with
a community’s remoteness, while the contribution of the health dimension tends to fall (perhaps
reflecting the fact that the highest incidence of food insecurity is concentrated in urban areas).
33 The contribution each dimension makes to overall poverty is the sum of the percentage contributions that each component indicator within that dimension makes to overall poverty. Contributions are calculated using a “censored headcount” matrix for each indicator, which censors the deprivations of households that are deprived, but not poor. This censored matrix leaves only those households that are both deprived in a given indicator as well as in multidimensional poverty. For each indicator, the censored headcount ratio is then scaled by its respective weight and expressed as a proportion of overall poverty.

McDonald, L. (2014) THE VULNERABILITY AND RESILIENCE OF HOUSEHOLDS IN VANUATU AND
SOLOMON ISLANDS TO GLOBAL MACROECONOMIC SHOCKS, PhD Thesis
27
Figure 3.3: Dimensions of multidimensional poverty
Percentage contributions of each dimension of well-being to total poverty; by community*
* Communities have been assembled, broadly, in terms of their increasing remoteness from central markets (as per Figure 3.1). Source: Author.
1.3.3. The Melanesian Multidimensional Poverty Index (MMPI)
The levels and distribution of headcount poverty changed when poverty was characterised in
terms of the MMPI. This demonstrates the importance of access (or lack thereof) to markets,
services and support to multidimensional poverty. Across the total sample, and in each country
at a national level, the MMPI measure led to an upward revision in poverty compared with the
MPI. This largely reflects an upward revision to the headcount rate of poverty in eight of the
twelve communities surveyed, with the average upward revision in the order of 4.6 percentage
points – a statistically significant amount (see Figures 3.1 and 3.2). In the four communities
where the MMPI resulted in a downward revision to poverty – Hog Harbour and the Banks
Islands in Vanuatu and Malu’u and Honiara in Solomon Islands – the average downward revision
to the headcount rate of poverty was a statistically significant 4.0 percentage points.
An important test of the consistency of the two measures of multidimensional poverty is to
examine whether the same households that are MMPI poor are MPI poor as well. If a household
is not considered poor when only the MPI is used, but is MMPI poor, then there is a chance that
they may be erroneously excluded from anti-poverty programs if only the conventional MPI
measure is applied.
0
10
20
30
40
50
60
70
80
0
10
20
30
40
50
60
70Health Standard of LivingEducation
% %

McDonald, L. (2014) THE VULNERABILITY AND RESILIENCE OF HOUSEHOLDS IN VANUATU AND
SOLOMON ISLANDS TO GLOBAL MACROECONOMIC SHOCKS, PhD Thesis
28
Table 3.5 suggests that, generally, the two poverty measures identify the same households as
being poor but that a non-trivial share of households is reclassified as poor when the MMPI is
applied. The left panel shows the proportion of households in the poor and non-poor category
for each poverty measure while the right side shows the conditional probabilities expressed in
terms of MMPI poverty. The results suggest that there is a 22 per cent chance that a household
that is MMPI poor will not be classified as MPI poor.34
Table 3.5: MMPI poverty vs. MPI poverty
Crosstab of MMPI and MPI poverty Conditional probability (given MMPI poverty)
Not MPI poor
MPI poor
Total Not MPI poor
MPI poor
Not MMPI Poor 74.7 3.1 77.8 Not MMPI Poor 0.96 0.04
MMPI Poor 4.8 17.4 22.2 MMPI Poor 0.22 0.78
Total 79.5 20.5 100.0 Source: Author.
An example of the practical importance of local indicators in determining a households’ poverty
status can be seen when the focus is narrowed to urban communities and the relationship between
poverty and access to gardens. Studies that have examined well-being in urban squatter
settlements in each country have shown that being alienated from gardening land is a common
feature of urban poverty (Chung and Hill, 2002; Maebuta and Maebuta, 2009; Cox et al. 2007).
Yet according to the MPI the headcount poverty rate for urban households without a garden is
17.6 per cent – much lower than the prevailing rate of poverty for those with a garden, 26.4 per
cent. However, when the MMPI is applied, which explicitly accounts for garden access, the
poverty rate of households without a garden rises to 31.3 per cent – a statistically significant
upward revision, according to t-tests.
Further illustrating the importance of accounting for access when mapping poverty in Melanesia,
and of tailoring poverty indices to country specific circumstances more broadly, the additional
access dimension makes a considerable contribution to MMPI poverty – larger, in almost all
communities, than each of education and health. In aggregate, the access dimension contributed
around 27 per cent of MMPI poverty in both Vanuatu and Solomon Islands (Figure 3.4).
Unsurprisingly, the four communities where MMPI poverty is lower than MPI poverty tend to
also have a relatively low incidence of deprivations across the access dimension. The average
34 On the flipside there is a 4 per cent chance that a MPI-poor household will be reclassified as non-poor when the MMPI is applied.

McDonald, L. (2014) THE VULNERABILITY AND RESILIENCE OF HOUSEHOLDS IN VANUATU AND
SOLOMON ISLANDS TO GLOBAL MACROECONOMIC SHOCKS, PhD Thesis
29
contribution in these communities was 23 per cent – well below the 29 per cent average
contribution of the remaining communities (Appendix D).
Figure 3.4: Dimensions of multidimensional poverty
Percentage contributions of each dimension of well-being to total poverty; by country
Source: Author.
Looking at the individual indicators of the access dimension, in turn, urban communities stand
out in terms of their lack of access to gardens. 28 per cent of households, on average, in the four
urban locations are deprived in access to gardens compared with only three per cent in rural
communities (see Appendix C).
Remoteness from centres of governance appears to play an important role in households’ access
to services The geographically remote communities of Weather Coast, Vella Lavella and Baravet
each recorded rates of deprivation in excess of 80 per cent, reflecting a general lack of access to
hospitals, secondary schools and markets (though access to a market in Banks Islands was much
better than in the other two locations).35 The provincial government sub-station of Malu’u, on
the relatively populous island of Malaita in Solomon Islands, had the lowest rate of deprivation
in the access to services indicator, on account of the fact it is well serviced by a hospital,
secondary school and market places – despite being economically remote (MPGRD, 2001). In
35 Somewhat surprisingly, in the Banks Islands, a particularly remote community, the deprivation rate in the access to markets indicator was the lowest of all the communities surveyed. This probably illustrates one of the potential shortcomings of different perceptions of what a market constitutes. However, this is unlikely to substantially bias the results since the market component is but one of three indicators of services access (which, in turn only comprises one twelfth of the MMPI) and the Banks Islands had a relatively high proportion of households that were deprived according to the access to education indicator.
0
10
20
30
40
50
60
70
80
90
100
110
0
10
20
30
40
50
60
70
80
90
100
Solomon Islands
MPI
Vanuatu MPI Solomon Islands
MMPI
Vanuatu MMPI
Access Education Health Standard of Living
% %

McDonald, L. (2014) THE VULNERABILITY AND RESILIENCE OF HOUSEHOLDS IN VANUATU AND
SOLOMON ISLANDS TO GLOBAL MACROECONOMIC SHOCKS, PhD Thesis
30
Vanuatu, the communities along the East Santo road, Luganville and Hog Harbour, clearly had
the lowest deprivation in access to services; once again illustrating the importance of transport
infrastructure.
There was little geographic pattern to the access to support indicator – potentially reflecting a
combination of the idiosyncratic nature of traditional social protection in each community, as
well as measurement error.36
1.3.4. Multidimensional poverty and vulnerability
A further advantage of the MPI is that it can be decomposed by intensity, which is particularly
useful for policymakers interested in identifying poor, as well as vulnerable, households. Using
a disaggregation technique suggested by Alkire and Foster (2011a) the index is split into four
separate groups: (i) severely poor households that have weighted deprivations greater than or
equal to 0.50; (ii) less-severe poor households that that have a weighted deprivation greater than
or equal to 0.33 (the original poverty cut off) and less than 0.50; (iii) “vulnerable” households
that, while strictly non-poor are near-poor with a weighted average of deprivations greater than
or equal to 0.20 and less than 0.33; and (iv) the non-poor, non-vulnerable with a deprivation
score below 0.20. Quizilbash (2003, p52) suggests that identifying a cohort that is close to being
identified as definitely poor provides a somewhat rudimentary, though useful, perspective on
vulnerability than the ordinary characterisation of vulnerability in the economic literature, which
is the estimated probability of being poor in the future (see Chapter 6 for a more detailed
discussion). Therefore, in addition to examining the observed rate of poverty, multidimensional
indices also have the advantage of identifying those households that might be at risk of being
tipped into poverty in the future – a particularly pertinent policy consideration in nations such as
Vanuatu and Solomon Islands where households often experience a raft of covariate and
idiosyncratic shocks (see Chapter 4). Results from this exercise are presented, at an aggregate
level, in Figure 3.5 (and for each community in Appendix E).
36 This is a somewhat surprising finding, given that support is often reported to have deteriorated in urban areas (see Chapters 4 and 5 for a discussion). It may reflect the imprecision in the way support is measured in this context.
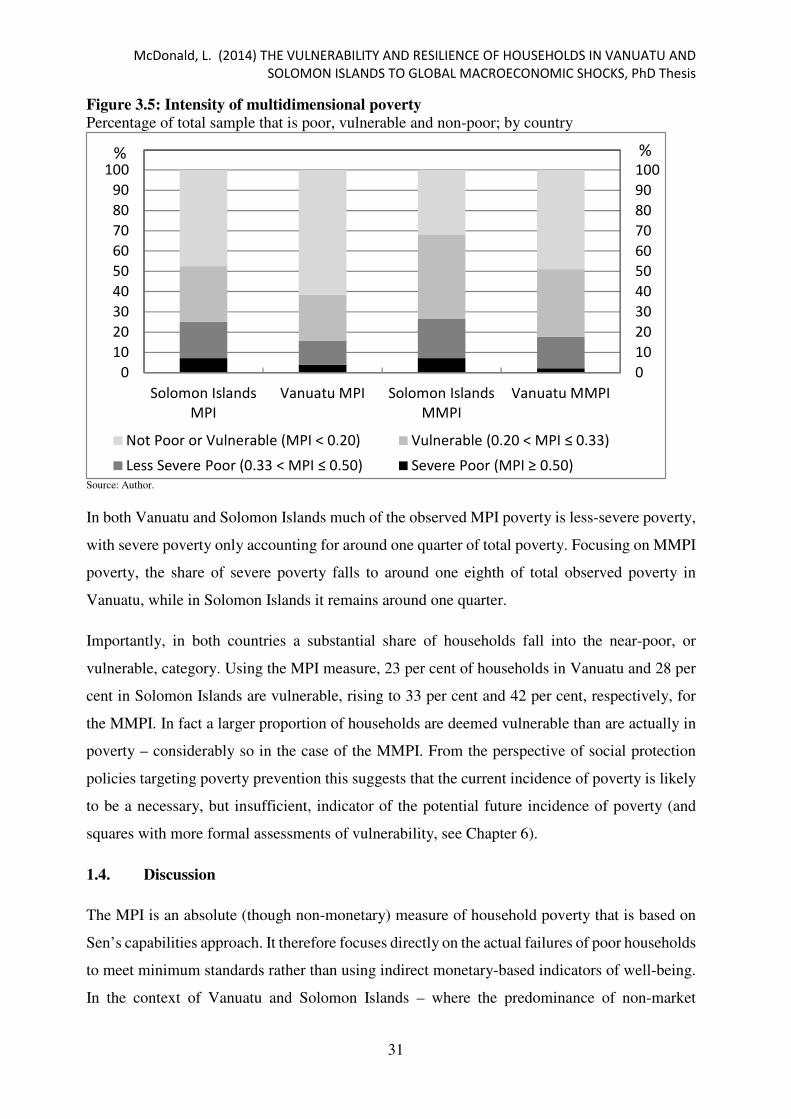
McDonald, L. (2014) THE VULNERABILITY AND RESILIENCE OF HOUSEHOLDS IN VANUATU AND
SOLOMON ISLANDS TO GLOBAL MACROECONOMIC SHOCKS, PhD Thesis
31
Figure 3.5: Intensity of multidimensional poverty
Percentage of total sample that is poor, vulnerable and non-poor; by country
Source: Author.
In both Vanuatu and Solomon Islands much of the observed MPI poverty is less-severe poverty,
with severe poverty only accounting for around one quarter of total poverty. Focusing on MMPI
poverty, the share of severe poverty falls to around one eighth of total observed poverty in
Vanuatu, while in Solomon Islands it remains around one quarter.
Importantly, in both countries a substantial share of households fall into the near-poor, or
vulnerable, category. Using the MPI measure, 23 per cent of households in Vanuatu and 28 per
cent in Solomon Islands are vulnerable, rising to 33 per cent and 42 per cent, respectively, for
the MMPI. In fact a larger proportion of households are deemed vulnerable than are actually in
poverty – considerably so in the case of the MMPI. From the perspective of social protection
policies targeting poverty prevention this suggests that the current incidence of poverty is likely
to be a necessary, but insufficient, indicator of the potential future incidence of poverty (and
squares with more formal assessments of vulnerability, see Chapter 6).
1.4. Discussion
The MPI is an absolute (though non-monetary) measure of household poverty that is based on
Sen’s capabilities approach. It therefore focuses directly on the actual failures of poor households
to meet minimum standards rather than using indirect monetary-based indicators of well-being.
In the context of Vanuatu and Solomon Islands – where the predominance of non-market
0
10
20
30
40
50
60
70
80
90
100
110
0
10
20
30
40
50
60
70
80
90
100
Solomon Islands
MPI
Vanuatu MPI Solomon Islands
MMPI
Vanuatu MMPI
Not Poor or Vulnerable (MPI < 0.20) Vulnerable (0.20 < MPI ≤ 0.33)
Less Severe Poor (0.33 < MPI ≤ 0.50) Severe Poor (MPI ≥ 0.50)
% %

McDonald, L. (2014) THE VULNERABILITY AND RESILIENCE OF HOUSEHOLDS IN VANUATU AND
SOLOMON ISLANDS TO GLOBAL MACROECONOMIC SHOCKS, PhD Thesis
32
transactions and missing markets for essential services makes measuring poverty in monetary
terms particularly challenging – this arguably makes the MPI better suited to measuring poverty
than conventional monetary-based basic needs approaches.
This analysis calculates MPIs in six separate communities in both Vanuatu and Solomon Islands.
The results provide a unique insight into the incidence, intensity and geographical distribution
of household poverty in each country in a single measure. These estimates can then be compared
with similar geographic breakdowns in the respective official poverty statistics.
The results go some way to resolving the puzzle between the general lack of observed extreme
destitution in Vanuatu and Solomon Islands and the low scores according to various human
development indicators. The analysis of poverty using the MPI suggests that, in line with basic
needs poverty measures, a considerable proportion of households in urban squatter settlements
of capital cities are currently experiencing poverty. However, unlike the monetary-based
measures, which suggest that poverty is concentrated in urban regions, MPI poverty is, instead,
more geographically nuanced in that poverty is most prevalent at both ends of the urban-rural
continuum – that is, in both inner urban squatter settlements and geographically distant
communities. This results in a distinctive “U-shaped” curve of poverty when communities are
ordered according to their remoteness.
The augmentation of the MPI to account for local aspects of well-being through the MMPI has
also made an important contribution to understanding the experience of poverty in Vanuatu and
Solomon Islands. It also reflects a broad trend toward contextualising the MPI in a range of
different locations. Importantly, the rates of poverty changed when the MMPI was applied,
suggesting that indicators of access to essential services, gardens and support made a meaningful
difference to the identification of poverty in the local context. A non-trivial share of non-poor
households according to the MPI measure is also reclassified as poor when the MMPI is used,
further highlighting the unique contribution of the MMPI. Furthermore, the broad “U-shape” of
poverty persists when communities are arranged in terms of their remoteness according to the
MMPI – suggesting it is a robust finding.
These results have three important policy implications.
Firstly, poverty is a pressing policy issue in both Vanuatu and Solomon Islands. National
estimates of MPI poverty in each country are on par with countries with a similar level of human
development, despite the general lack of extreme monetary poverty. The results of this analysis

McDonald, L. (2014) THE VULNERABILITY AND RESILIENCE OF HOUSEHOLDS IN VANUATU AND
SOLOMON ISLANDS TO GLOBAL MACROECONOMIC SHOCKS, PhD Thesis
33
show that while severe poverty is modest, poverty itself is prevalent. A substantial share of the
total sample in each country is also near-poor (being greater, in both cases, than the cohort of
poor households). This is consistent with the results of the more formal vulnerability analysis
(see Chapter 6) and indicates that vulnerability, in addition to current poverty, is an important
social protection policy issue.
Secondly, the results show that stylised views of poverty are likely to be insufficient in Vanuatu
and Solomon Islands. In particular, while monetary-based measures may well be adept at
identifying poverty in urban communities, they are less appropriate for identifying poverty in
rural areas. On the flipside, romanticised views of “subsistence affluence” are equally inadequate
to characterise living standards in all rural areas. While the term may still appropriately refer to
the existence of fertile land and, at the margin, intermittent labour supply and potentially high
reservation wages, it does not reflect the reality that the cash economy has rapidly penetrated
into rural areas. Moreover, it ignores the fact that households increasingly need to supplement
their domestic food production with cash incomes to pay for necessities, such as imported fuel,
school fees, clothing and, increasingly, imported foodstuffs as preferences change (Cox et al.
2007; Chapter 4). Indeed, it is this very intersection of increasing household demands for cash
and limited economic opportunities in rural areas (combined with the fact that government
services tend to be concentrated in capital cities) that is at the crux of what Abbott and Pollard
(2004) espoused as “hardship” in PICs.
Thirdly, the results of this analysis indicate that rural areas are far from monolithic. Economic
geography appears to play a critical role in determining both the incidence and depth of rural
poverty. The lowest rates of headcount poverty in both countries are observed in communities
that are essentially rural in character, yet have good transport links to larger markets. In contrast
some of the highest rates of poverty were observed in remote rural communities.
The relative prosperity of rural and well-connected communities therefore appears to be built
upon readily-available land that characterise rural communities, as well as the lack of barriers to
accessing markets. Indeed, these communities appear to be situated in a Melanesian “sweet
spot”; at the juncture of so-called “subsistence affluence” and interconnectedness with larger
and more diversified markets.
Insofar as effective transport reduces economic distance to major economic centres, there are
likely to be a number of benefits accruing to households in these “sweet spot” communities that
are eluding households in more remote areas. Gibson and Nero (2003) found that in PNG

McDonald, L. (2014) THE VULNERABILITY AND RESILIENCE OF HOUSEHOLDS IN VANUATU AND
SOLOMON ISLANDS TO GLOBAL MACROECONOMIC SHOCKS, PhD Thesis
34
interconnectedness with markets simultaneously increased the economic return from production
and placed downward pressure on the prices of consumables. Better spatial integration may also
be allowing households to move beyond subsistence production to access important new sources
of income. Each of these factors can help increase households’ disposable income and fund
welfare-enhancing expenditures, including consumables (such as rice, salt and soap), school fees
and inter-island transport.37 In addition, better transport links decrease the cost of accessing
essential services such as hospitals and schools, which may explain the relatively low rate of
non-monetary deprivations in these areas.
The MPI (and thus, by implication the MMPI) suffers from a number of shortcomings. In
particular, it has been criticised for its lack of transparency and the adequacy of its weighting
structure. Moreover, the purposive selection of urban squatter communities in the sample is
likely to influence the aggregated rates of national poverty. However, the MPI is rapidly
becoming a key indicator of household poverty, evidenced by its annual publication in the
UNDP’s annual HDR. To the extent that most PICs, including Solomon Islands, are excluded
from this annual analysis, and no PIC has yet had the MPI calculated at a sub-national level, this
analysis marks an important first step in widening the analytical lens of multidimensional
poverty management to the Pacific more broadly, and to Melanesia in particular. It also provides
an important critique of the suitability of basic needs approaches to measuring poverty in rural
areas.
1.5. Conclusion
Identifying poverty through multidimensional measures such as the MPI and MMPI is a valuable
addition to the suite of well-being measures in Vanuatu and Solomon Islands and should be
included in poverty analysts’ toolkits.
By examining the incidence and depth of poverty in various locations in Vanuatu and Solomon
Islands, this analysis has shed important light on the nature of the poverty problem that may have
gone unnoticed by conventional poverty measures. The results indicate, for the first time in a
single multidimensional measure, that the geographical distribution of poverty is nuanced at the
sub-national level in both countries.
37 Better spatial integration with markets and social networks also facilitates greater risk mitigation diversification (see Fafchamps et al. 1998,
and the discussion in Section 5.2.1 in Chapter 5).

McDonald, L. (2014) THE VULNERABILITY AND RESILIENCE OF HOUSEHOLDS IN VANUATU AND
SOLOMON ISLANDS TO GLOBAL MACROECONOMIC SHOCKS, PhD Thesis
35
These results also highlight the utility of alternative non-monetary measures of poverty from the
perspective of geographically targeting social protection policies. Indeed, while the prevailing
national assessments of basic needs poverty indicate that resources should be skewed toward
urban areas, both the MPI and MMPI indicate that the focus should be on both urban-settler and
geographically distant communities.
In addition to identifying the geographical distribution of poverty, the ability to decompose the
MPI and MMPI into sub-groups and intensity makes each measure particularly useful from the
perspective of targeting social protection policies within each region. Each measure is able to
identify those households that are in severe poverty and in critical need of supportive structures.
Moreover, it can help identify near-poor households; that is, households that are non-poor but
may be vulnerable to being tipped into poverty should they experience an adverse shock.
Arguably, because it better reflects what is important to well-being in the local context, the
MMPI ultimately holds the greatest potential for an accurate, all-encompassing, single measure
of poverty in Melanesia. In its present form, the MMPI is a useful initial attempt to make the
MPI measure more contextually relevant for Melanesia. This research presents one possible
specification of the MMPI, which is based upon the literature on well-being in the Pacific. Future
research should therefore focus on fine-tuning the MMPI to improve the robustness of this
measure. In particular, the support indicator is inherently subjective and may be prone to
measurement error. The weights applied to each indicator are also subjective; efforts could
therefore be made to calibrate the indicators and weights to reflect what is important to citizens.
The example of El Salvador where the local population themselves determine the relevant
indicators is instructive. Future work should also take heed of the important work being done in
the local context to articulate indigenous indicators of well-being.
Copyright © 2022 FDOKUMEN