CHAPTER – I
248
1 CHAPTER – I DESIGN AND EXECUTION OF THE STUDY 1.1 INTRODUCTION Agriculture accounts for nearly one-fourth of India's GDP and more importantly about two-third of the country's population is dependent on agriculture and allied activities for their livelihood. India has inherited a rich and flourishing civilization spanning over thousands of years. Over 70% of the population is looking for agriculture, for their sustenance. It provides food to millions of people and raw materials to our industries. India lives in villages and agriculture is the backbone of the Indian economy. In an agrarian based economy like India, agriculture is the dominant sector and it occupies an important place in the economic development. With all efforts at rapid industrialization, agriculture continues to be the pivot of the Indian economy. The country is amongst the top three world producers of rice, wheat, milk, poultry products, vegetables, coconut, tea, spices, marine and fresh water products including shrimp and fish. Agricultural development promotes general economic development. About half of the country's National Income is derived from agriculture and allied activities. It absorbs nearly three-fourth of its working force. The development of agriculture seems to hold the key to the progress of our economy as a whole. It is therefore necessary that it
-
Upload
khangminh22 -
Category
Documents
-
view
1 -
download
0
Transcript of CHAPTER – I

1
CHAPTER – I
DESIGN AND EXECUTION OF THE STUDY
1.1 INTRODUCTION
Agriculture accounts for nearly one-fourth of India's GDP and more
importantly about two-third of the country's population is dependent on
agriculture and allied activities for their livelihood. India has inherited a
rich and flourishing civilization spanning over thousands of years. Over
70% of the population is looking for agriculture, for their sustenance. It
provides food to millions of people and raw materials to our industries.
India lives in villages and agriculture is the backbone of the Indian
economy. In an agrarian based economy like India, agriculture is the
dominant sector and it occupies an important place in the economic
development. With all efforts at rapid industrialization, agriculture
continues to be the pivot of the Indian economy. The country is amongst
the top three world producers of rice, wheat, milk, poultry products,
vegetables, coconut, tea, spices, marine and fresh water products including
shrimp and fish. Agricultural development promotes general economic
development.
About half of the country's National Income is derived from
agriculture and allied activities. It absorbs nearly three-fourth of its
working force. The development of agriculture seems to hold the key to
the progress of our economy as a whole. It is therefore necessary that it

2
should be given due importance in terms of marketing of agricultural inputs
especially fertilizers which boost up the agriculture as a whole.
1.2. BACKGROUND OF THE STUDY
Agricultural progress is normally regarded as a prerequisite of
economic development. It is true that the economic development in the
modern times has come to be associated with industrialization:
nevertheless, it is generally accepted that industrialization can follow only
on the sound heels of agriculture. Agriculture is the foundation on which
the entire superstructure of the growth of industrial and other sectors of the
economy has to stand. In order to raise the level of productivity a new
agricultural strategy was adopted in India. This resulted in what came to be
known as the “Green Revolution”.
Green Revolution
Agriculture in India has long been carried out only in a traditional
manner. Special attention has been paid to modernize agriculture sine
Independence. The use of improved seeds, artificial manures, better
irrigation facilities and increased adoption of productive measures have
resulted in increased agricultural production. The changes have gone with
the name of "Green Revolution".
The Green Revolution attempts to produce food grains on a massive
scale in the shortest period. The yield per acre increased tremendously in
the case of certain crops like wheat. For the first time in India, the farmers
have favorably responded to the new strategies of inputs. It kindled new

3
hopes and confidence for the future. There was change in the mental
attitude towards better farming. Farmers willingly applied science and
technology by using high yielding varieties. The fear of the farmers about
the vagaries of monsoon was removed by assured water supply.
However, the impact of "Green Revolution" has not been uniform
throughout the country and has been different among states and even
among different parts of the same state. Moreover it has not improved the
fortunes of the Indian farming community.
Agriculture in Economic Planning
It was in 1946, when Mahatma Gandhi, the Father of our Nation,
speaking in Noakhali said to the hungry, "God is Bread" and it is the duty
of the independent India to ensure that every individual is enabled to earn
his daily bread. He emphasized on "Food for all with human dignity".
Jawaharlal Nehru, the First Prime Minister of India responded to this call
and announced in 1948, "Everything else can wait but not agriculture".
Therefore agriculture got the top most priority in Indian Planning.
Five year plans in India
India has completed about six decades of economic planning (1951
to 2009). India‟s experience with economic planning especially with
agriculture is a unique one as she has been practicing economic planning
within the framework of a democratic mixed economy. The annual
average growth rate of agriculture during the various five year plans period
from 1985 is given in Table 1.1.

4
Deviations in food grains and agricultural output from its long term
trend are determined among other factors with variations of monsoon
around its long term trend. Furthermore, the negative impact of excess
rainfall on such output appears to be not as high as the adverse impact of
deficient rainfall.
The following table shows the annual average growth rate of
agriculture from 1985 to 2007.
Table 1.1
Annual Average Growth Rate of Agriculture
Five year plans Overall GDP
Growth Rate ( in %)
Agriculture
(in %)
Seventh Plan (1985-1990) 6.0 3.2
Annual Plan (1990-1992) 3.4 1.3
Eighth Plan (1992-1997) 6.7 4.7
Ninth Plan (1997-2002) 5.5 2.1
Tenth Plan (2002-2007) 7.6 2.3
2002-2003 3.8 -7.2
2003-2004 8.5 10
2004-2005 7.5 0.0
2005-2006 9.0 .0
2006-2007 9.2 2.7
Source: Ministry of Agriculture

5
With the asymmetric response of food grains production to monsoon
variability, the repetition of deficient rainfall in the monsoon in 2002, 2004
and 2006 during the Tenth Five Year Plan has led to poor agricultural
growth, reduction in the share of agriculture in GDP, creating inflationary
pressure in some primary products and reduction in the potential growth of
other sectors by dampening demand.
The structural weaknesses of agricultural sector reflected in low
level of public investment, exhaustion of the yield potential of new high
yielding varieties of wheat and rice, unbalanced fertilizer use, low seeds
replacement rate, inadequate incentive system and poor harvest value
addition were manifest in the lackluster agricultural growth during the new
millennium.
Eleventh Five Year Plan (2007-2012)
Great emphasis has been laid in the plan to revive agricultural
growth. The Plan has earmarked regaining agricultural dynamism as a
major challenge to the country‟s growth. It states “A second green
revolution is urgently needed to raise the growth rate of agricultural GDP
to around 4 Per cent.”
Production of agricultural crops
The development of agriculture in the past sixty years of
independence is impressive. The availability of new technology and
creation of necessary supportive infrastructure put the country's agriculture
on a fast growth track. The growth in food grain output consequently

6
started outpacing the population growth pushing the country steadily
towards food sufficiency and food security.
The various agricultural crops can be divided into two groups viz, (i)
food grains (ii) non-food grains. Food grains include both (a) cereals like
rice, wheat, jowar, maize, bajara etc. and (b) Pulses. Non-food grains
include cash crops like oilseeds, sugarcane, cotton, jute etc. The
production of food grains has increased from 54.92 million tonnes in 1950-
51 (agricultural year in India is from July to June) to an estimated all-time
high of 227.32 million tonnes in 2008-09.
During the last six decades the production of food grains in India has
multiplied by more than three times and the country has emerged as a
major exporter of food grains. The increase in production, however, has
been limited to cereals alone. The production of pulses has been almost
stagnant between 12 and 15 million tonnes. Among the non-food grain
crops, production of sugarcane and cotton has shown rising trends, whereas
oilseeds (except for some recent breakthroughs) and jute have been slow to
pick up.
The rate of growth of food grain crops is less than that of the non-
food grain crops during the first fifteen years of economic planning but
subsequently overtook the latter as would be seen from Table 1.2, which
highlights all India Compound Rates of Growth of Agricultural Production.

7
Table 1.2
All India Compound Rates of Growth of Agricultural Production
Agricultural production 1952-65 (in %)
1967-2008(in %)
Food grains 2.52 2.59
Non-food grains 3.87 2.59
All crops 2.90 2.56
Source: Computed from Economic survey (Annual numbers)
Agricultural inputs
Agriculture is mainly made up of cultivation practices by giving the
following inputs viz., Seeds, Irrigation, Fertilizers, Pesticides,
Mechanization and Power etc. Among them, fertilizers are to be considered
as main input in terms of marketing which helps the farmers to boost up
their cultivation.
Fertilizers
In India the use of fertilizers started towards the end of the last
century with fertilization of tea and coffee plantations. Fertilization of
major cereal crops followed and it was slow to pick up. Initially only a
small quantity of indigenously produced super phosphate and some
imported ammonium sulphate were essentially used by plantation industry.
The use of fertilizer on food crops started in forties with the free
distribution of ammonium sulphate to farmers under the "Grow more food

8
campaign". The progress was still slow during the post-war years till the
dawn of the planning era.
Farmers in India use the chemical fertilizers which can be classified
as three major groups namely,
Straight fertilizers
Complex fertilizers
Fertilizer mixtures.
They also use organic manures and bio-fertilizers.
Organic manures
Utilization of organic manures like cattle manures, rural and urban
wastes has an important role in increasing agricultural productivity. They
contain all the essential nutrients in balanced proportions. When it is
applied to soil it helps to improve soil certain, permeability, water and
nutrient holding capacity, aggregation and biological properties of the soil.
It also helps to improve the soil health by improving the toxic elements
form the root zone. Organic matter also acts as buffer and keeps the soil
within the desired range. Organic manures contain more or less all
nutrients required for plant growth.
An average dressing of 10 tonnes of organic manure per hectare (ha)
supplies about 123 kg of Nitrogen(N), Urban compost prepared from town
refuge is relatively richer and contains 1.4 per cent N, 1 Per cent phosphate
(P) and 1.4 per cent potash (K).

9
In India, at present, the rural population makes use of cow dung for
fuel purposes. It is estimated that in our country, nearly 6,500 million
tonnes of cow dung are burnt every year for fuel purposes. If they were
supplied with alternative cheap fuel like firewood in enough quantities, that
much of cow dung would be saved and released for agricultural purposes.
Bio-Fertilizers
Bio-fertilizers are the preparations containing active state of right
type of logical agents like bacteria, fungi, or algae, in adequate quantities
which have at potential to bridge the gulf of disparity between demand and
supply of nutrients. The bacterial fertilizer containing Rhizobia has the
unique ability to fix atmospheric N when in symbiotic association with
leguminous crop. Such a combination may add 80-100 kg/N per year to
soil.
Nitrogenous Fertilizers
It comprises calcium, ammonium sulphate, sodium nitrate, and Urea
etc. Nitrogenous fertilizer influences crop growth in many ways. It
encourages the development of foliage, imparts a green color to leaves. In
case of cereals, it tends to produce lumpiness in seeds and it tends to
produce succulence or tenderness in the plant. But if used in large quantity
nitrogen may prove harmful to the crop for it may increase resistance to
disease, and it may lower its quality. It may weaken the stems and cause
lodging in cereals.

10
Phosphate Fertilizers
Phosphate fertilizers are given to soil in the shape of
phosphorous, which is derived from various sources like bones and rock
phosphates. When powdered rock phosphate is applied to the soil,
phosphoric acid becomes readily available. Phosphorous helps the growth
of plantain many ways e.g., it hastens maturity of crop, it encourages root
development, decreases the ratio of straw to grain in cereals, it strengthens
stems and reduces the tendency to lodge in cereals, it increases the
resistance to diseases and it improves the quality of crops. Phosphorous
balance or offsets the harmful effects of excessive nitrogen and even it are
applied in excessive quantities it produces no bad effect on the crop.
Potassium fertilizers
Potassium fertilizers are given to the soil in the form of potassium
chloride and potassium sulphate. These fertilizers help the transference of
food materials from one part of the plant to another, they provide the
needed green colour to the leaves, they have to tend to increase plumpness
in grains and they tend to have a balancing effect between the first two
types of fertilizers. Its presence in large quantities in the soil produces no
detrimental effect on the crop. There is a wrong notation that sustainable
Eco friendly agriculture can be practiced using organic and bio fertilizers
and excluding chemical fertilizers. The nutrient needs are so large that no
single source can deliver the goods.
Integrated Nutrient Management (INM)
From technical, economical, logistical and environment
considerations, the best course is to practice Integrated Nutrient

11
Management (INM). This will harmoniously integrate the use of mineral
fertilizers, organic bio-fertilizers and recyclable wastes.
All of these need to be seen as active partners towards including
sustainable farming systems, which will stand the test of time. The INM
package should be technically sound, practically feasible, economically
attractive, socially acceptable and Eco Friendly. The chemical fertilizers
are and will continue, to be the mainstay of external nutrient supplies in
India in terms of effective fertilizers marketing.
Fertilizer Marketing
Marketing in practice does not refer to any single activity such as
selling, advertising or distribution. It involves the interaction of several
business activities whose ultimate objective is the gratification of customer
needs and desires. The marketing process does not end with the sale but
continues till the satisfaction of the customer is obtained.
It is now strongly held that marketing has a key role to play in
bringing economic and social changes in developing nations. In an
economy, which is geared to accelerated industrial development, it is not
only necessary that we should produce more but also see that the products
we produce reach the right places where they are needed at the right time
with minimum costs.
Without effective distribution, we cannot make better utilization of
our limited resources towards rapid economic growth of the country. But it
is surprising that there are many fertilizer firms in India which have no way

12
of evaluating their distribution system and no plan to decide what selling
efforts against their dealers in different markets.
Our lack of efficient marketing methods and practices is no doubt
partly responsible for our low productivity in agriculture. It is necessary to
assure an adequate supply of fertilizer to strengthen the pace of agricultural
development as fertilizer occupies an important position in agricultural
production. But fertilizer marketing in India still posed with many
problems.
Farming is still a subsistence attempt and not a commercial venture.
1.3. SIGNIFICANCE OF THE STUDY
In advanced countries, farming has long since been industrialized. In
developing countries as well as in India, farming remains largely a
subsistence sector. Some development, no doubt, is taking place in all
these countries but those countries have still a long way to go before their
agriculture will be viewed and managed as an industry.
In India most of the farmers are not sure whether they will make a
success of their venture in modern farming, even if they have adequate
resources. It is partly, due to the uncertainties involved in farming and
partly due to their lack of experience in employing modern farm
technology.
The agricultural sector is passing through a crisis due to various
reasons and problems. The prime task involved in the agriculture in India
is to make farmers feel safe about their own venture and feel assured of a

13
good return on their investment. With the increased assurance, his
propensity to take risk will go up. If package of technology is sound and if
the inputs are made available in time by marketing agencies, the risk
accepted by the farmer will amply pay off and make him a convert thus a
shift in the farmers' orientation from "Safety" to "Business" is the essence
of transition from "Tradition" to "Modernity" in Indian agriculture. This is
a very unique aspect of Fertilizers marketing.
The distribution of fertilizers has several problems because of its
unique characteristics. Several questions arise when we look at the
environmental conditions on which the farmers take up cultivation
especially in respect of the efficient distribution of fertilizer.
Whether farmers have ready access to the required fertilizers?
Whether the fertilizers marketed confirm to the quality requirements?
Whether there is any difference between marginal, small, medium and
large scale farmers in facing the difficulties in organizing inputs made to?
Hence an attempt is to find answers to these questions. However a
special study regarding the marketing of fertilizers with reference to the
distribution of fertilizers to the ultimate farmers will also be helpful in this
regard.
1.4. STATEMENT OF THE PROBLEM
Agriculture is the backbone of the Indian Economy, although its
relative significance has declined over the last decades. The rate of growth
in agriculture has been less than the rate of growth in other sectors of the
economy. The low rate of growth in agriculture is due to low level of
14
productivity in this sector. According to official statistics, about 200
million children, men and women go to bed undernourished every night.
This may be referred to "hidden-hunger" in the country. Therefore,
agriculture in India will have to go a long way.
The standard of living of Indian agriculturists is below poverty line.
They have limited resources. Very often the cultivators are not in a
position to get their inputs especially fertilizer in the proper manner. It is
therefore necessary that the fertilizers should be made available to them at
the right place, at right time in adequate quantity of proper quality and at
right prices. The distribution, infrastructure facilities, promotion and mass
communication of these inputs are not adequate. The market and consumer
of these products are unique.
The business of fertilizer marketing in developing countries like
India must be understood and attended to accordingly, because it is a
specialized job in terms of marketing. It is necessary to make farmers feel
safe about their agriculture and feel assured of a good return on their
investment. Thus the problem of study is confined to the problems of the
farmers in getting fertilizers efficiently and problems of the suppliers in
supplying the fertilizers efficiently.
1.5. OBJECTIVES OF THE STUDY
The following objectives were established for the purpose of the
present study in order to make a comparative analysis on fertilizers
marketing and consumption patterns of farmers in different ecological
zones viz., Semi arid zone (Perambalur District) and Delta zone (Thanjavur

15
District). Such a comparison will help both the zones to identify the
missing links and bridge the gaps of fertilizer marketing system.
1. To investigate into the specific nature of fertilizer marketing and
the fertilizer distribution network system.
2. To study the production, consumption and distribution patterns of
fertilizers in the study area.
3. To analyze the difficulties of farmers in the consumption of
fertilizers by making a comparative study.
4. To study the problems of the fertilizer dealers in order to improve
distribution channels and infrastructure facilities in marketing of
fertilizers.
5. To examine the effectiveness of fertilizers marketing by making
comparative study of a semi arid zone with a delta zone to
ascertain its impact on yield.
6. To make suggestions to ensure effective distribution and proper
delivery of fertilizers by improving the functioning of the
network system.
1.6. HYPOTHESES
To verify the validity of inferences that are derived from the analysis
of data, following hypotheses were formulated for this study.

16
1. There is a significant difference between the types of manures with
regard to overall yield.
2. There is a relationship between preference and usage of Urea.
3. There is a significant difference in yield by the usage of nutritious
fertilizers.
4. There is a significant difference in yield by not applying the
fertilizers at right time.
5. There is a relationship between total cost of production and
percentage of fertilizer usage.
6. There is an association between knowledge about authorized dealers
and getting fertilizers at control price.
7. There is a significant difference between Semi arid zone and Delta
zone with regard to,
Overall yield
Amount spent on chemical fertilizers
Total Cost of Production
Transport cost of fertilizers
Sources of procurement of fertilizers
Getting fertilizers at control price
Problems faced by farmers in procurement of fertilizers
Sources of obtaining credit

17
Reasons for delay in application of fertilizers
Overall satisfaction of fertilizer usage.
8. There is a significant difference among the various categories of
farmers in the overall problems of procurement of fertilizers.
1.7. METHODOLOGY
Sampling
The Cluster sampling technique is used where the entire population
is divided into groups or clusters and a random sample of these clusters are
selected. All observations in the selected clusters are included in the
sample. This technique may well be more practical and a cluster sample
could be taken by identifying the different groups as clusters in the study
area.
A Semi-arid Zone and a Delta Zone have been chosen as the survey
areas. The farmers and the fertilizer dealers have been grouped as per the
prescribed terminologies and a random sample of these groups were
selected for the purpose of research. A comparative study has been made in
both districts.
Terminology used
Two different types of Schedules were used. One for fertilizer
traders and another for farmers (consumers) for collecting the necessary
primary data by clustering them as per the following terminology.

18
1. Channels of Distribution of Fertilizers
The fertilizers are being distributed with the help of private dealers
and the co-operative Societies.
Private Dealers – Selling fertilizers either through wholesale
business or retail business or both
Co-operatives – Primary Agricultural Co-operative Credit
Societies selling fertilizers as retail business by getting
fertilizers through co-operative federations
2. Category of farmers
Big farmers – those farmers who cultivate more than 5 acres
of wet land and may be the real owner or registered tenant of
the land.
Medium farmers – those farmers who cultivate more than 3
acres and less than 5 acres of wet land and he may be the real
owner or registered tenant of that land.
Small farmers – those farmers who cultivate more than an
acre but less than 3 acres of wet land and he may be the real
owner or registered tenant of the land.
Marginal farmers – those farmers who cultivate one or less
than one acre of wet land. He may be the real owner or
registered tenant of the land
Selection of Study area
Perambalur District (a Semi-arid zone) and Thanjavur District (a
Delta zone) have been selected for the study.

19
A Semi -Arid zone – Perambalur District
A Semi-arid or climate or Steppe climate generally describes
climatic regions that receive low annual rainfall (250-500 mm or 10-20 in).
A more precise definition is given by the Koppen Climate Classification
that treats Steppe Climates (BS) as intermediates between the Desert
Climates (BW) and Humid Climates in ecological characteristics and
agricultural potential. The Koppen Climate Classification allows
adjustments for temperature and for excluding forested regions. Semi-arid
zone receives low rainfall.
Profile of the Study area
In Tamil Nadu, Perambalur District ranked the third position
contributing 55% of the geographical area and got the first position in the
production of cereals. Perambalur District is a centrally located inland
district of Tamil Nadu spread over 3690.07 sq. kms which was trifurcated
from the erstwhile composite Tiruchirappalli District and formed on 1st
November 1993. The district is bounded by Cuddalore District in the
North, Tiruchirappalli District in South, Thanjavur in the East and
Namakkal and Tiruchirappalli Districts in the West.
The total geographical area of the district is 3,69,007 hectare and Net
sown area and Gross sown area are 2,16,422 hectare and 23,27,136
hectare respectively. The net area under irrigation is 71,624 ha. The total
population of the district as per 2001 census is 11,81,029 of which 5,88,441
are males and 5,92,588 were females.

20
The district lies in the southern plateau and hill zone or agro-climate
regional planning with characteristics of semi arid climate. The soil is
predominantly red loamy and black soil. The normal rainfall of the district
is 908 mm which is less than 946.9 mm, the normal rainfall of the state.
The precipitation during North East monsoon, South West monsoon and
remaining water and hot weather periods account for 52%, 34% and 14%
of annual rainfall respectively.
The major crops grown in the district are paddy, groundnut,
sugarcane and millets. Cashew is the major plantation crop. In all the four
directions of the district, all kinds of food grains such as sugarcane, cotton,
corn, chilies, cereals, groundnut, paddy etc are cultivated. Though it is an
industrial district, especially in Cements, it gives the remarkable yield in all
food grains throughout the year.
In the Government Orders G.O (Ms) No.656, Revenue, Dated
29.12.2000, the Government have ordered in 2007 that the Perambalur
District be bifurcated into two Districts i.e. Perambalur District with
headquarters at Perambalur and Ariyalur District with headquarters at
Ariyalur. Perambalur District is categorized as Semi-arid Zone which is
adjacent to a Delta zone (Thanjavur). It stands first in the production of
cereals. Hence in this area the study was conducted by collecting data from
fertilizer traders and farmers.
The areas covered for the purpose of the study in Perambalur District
are Veppanthattai, Kunnam, Ariyalur, Perambalur, and Udayapalayam.

21
A Delta zone – Thanjavur District
A Delta is a Landform where the mouth of a river flows into an
ocean, sea, estuary, lake or another river. A delta is formed only when a
channel deposits sediment into another body of water and is favorable for
cultivation practices. It builds up sediment outwards into the flat area
which the river‟s flow encounters (as a deltaic deposit) transported by the
water and set down as the currents slow. Deltaic deposits of larger, heavily-
laden river are characterized by the main channel dividing amongst often
substantial land masses into multiple streams known as distributaries.
These divide and come together again to form a maze of active and inactive
channels. This hydro geologic formation is known as a delta.
Profile of the Study Area
Thanjavur District lies as the East Coast of Tamil Nadu. The District
is bounded on the north by the coloroon which separate it from Perambalur
and Tiruchirappalli district, and on the East it is bounded by Thiruvarur and
Nagapattinam Districts, and on the South by the Pudukkottai District and
on the west by Pudukkottai and Tiruchirappalli Districts. The total area of
the District is 3348.45 sq. mts.
The district can be divided into two district divisions, viz., the deltaic
region, the non-deltaic region. The deltaic region covers the whole
northern and eastern portions of the district where the Cauvery with its
wide network of branches irrigate more than half of the district. The rest of
the southern and western areas of the district are non-deltaic region. A
good portion of upland regions which was dry has now been brought under

22
irrigation with the help of Grand Anaicut canal, fed by the Cauvery-Mettur
project and by extension of the Vadavar River.
The major crops cultivated in Thanjavur district are paddy, pulses,
Gingelly, groundnut and sugarcane. The minor crops like Maize,
Soyabeans, and Red gram are also grown. Cultivation of oil and
Soyabeans is also carried out in this district wherever assured water supply
and drainage facilities are available.
Paddy is the principal crop grown in three season‟s viz., Kuruvai,
Samba and Thaladi. Pulses like Black gram, Green gram and cash crops
like cotton and gingelly are grown in rice fallows. In new delta area, the
Groundnut is the principal crop. Sugarcane is cultivated both in new delta
and old delta. Banana is primarily grown in Padugai lands. The soils of
new deltaic are amenable to a wide variety of crops such as Coconut,
Mango, Guava, Pulses, Cotton, Pulses, Gingelly, Groundnut, Banana etc.,
Thanjavur district is essentially a deltaic plain comprising old and
new delta. The old delta has a net work of canals and channels of the river
Cauvery and Vennar. Tapping of ground water is done considerably in this
area to advance the first cropping season Kuruvai to avoid damage due to
North East monsoon and to accommodate the two crops namely Kuruvai
and Thaladi. The river Cauvery with its wide network of branches irrigates
the District. Hence the study was made in Thanjavur District.
In Thanjavur District, the study was made by collecting the
necessary data from the fertilizer traders and farmers. The areas covered
for the purpose of the study in Thanjavur District are Thiruvaiyaru,

23
Kumbakonam, Orathanadu, Thanjavur and Pattukottai. This district is
proving as "Rice Bowl of Tamil Nadu" by sponsoring remarkable yield in
Paddy in every season.
Data Instrument
The data has been collected through two Schedules from the farmers
and the fertilizer dealers to get relevant information for the study.
Schedule I – for Fertilizer Traders
Schedule II – for farmers
Schedule for Fertilizer dealers
A Schedule was prepared to study the fertilizer marketing in the
study area. Questions were asked under the following headings : General
information, sources of finance, particulars relating to purchases, sales,
warehousing, transport, advertisement and sales promotion.
Schedule for farmers
Questions were asked to the farmers relating to their socio-
demographic details, types of manures used, consumption of chemical
fertilizers, sources of procurement, knowledge about authorized dealers,
transport used to bring the fertilizers and the transport cost, problems faced
by them in procurement of fertilizers, sources of obtaining credit, timing of
application of fertilizers, reasons for delay, preference and usage of brands,
overall satisfaction by usage of fertilizers.

24
Pilot Study
As a Pilot test, 120 farmers from both the zones, representing the
population filled in the schedule. The Pilot test led to some modifications
concerning the use of words and structures. All the 120 farmers were
included in the population in the Main study. 40 fertilizer traders i.e.,
private traders and co-operatives (10 in each category and in each area)
filled the Schedule in both districts. The Pilot study was conducted from
January 2008 to March 2008. A Reliability test was conducted using
Cronbach Alpha which gave 0.8361 for the variables in Schedule I and
0.8982 for the variables in Schedule II.
Data collection process
The researcher had personally visited all the selected areas to
conduct the survey. While meeting the various categories of farmers, most
of them answered with great interest. The questions given in the Schedule
were clearly explained to the farmers to get the required information.
The private dealers who were selling the fertilizers had been met by
the researcher. The relevant data had been collected through the Schedule.
The Primary Agricultural Co-operative Societies had been approached to
get the data through the same schedule because these societies are also
distributing the fertilizers to the farmers according to their need as the part
of their agricultural credit or for cash.
The Main study was conducted from April 2008 to March 2009. The
Survey Method has been followed in this study. The researcher collected
the necessary data from the dealers of both the districts with the help of

25
Schedule I and from the farmers of both the districts with the help of
Schedule II.
Schedule I – Dealers' Schedule
In Perambalur District 50 private dealers and 50 Primary
Agricultural Co-operative Societies (10 in each category in each area) had
been approached to collect the relevant data and hence 100 fertilizer
distributors were met. Similarly in Delta zone also the same method was
used in the data collection process by collecting the data from 100 fertilizer
dealers i.e., 50 private dealers and 50 Primary Agricultural Co-operative
Societies. (10 in each category in each area).
Schedule II – Farmers' Schedule
As per the terminology, the different categories of farmer‟s viz.,
Marginal Farmers (MF), Small Farmers (SF), Medium Farmers (Me.F) and
Big Farmers (BF) were met to collect the data. 125 farmers in each
category and hence 500 farmers had been taken through random sampling
in the study areas of Perambalur District (25 in each category in each area).
The same methodology was applied to Delta zone i.e., Thanjavur District
also (25 in each category in each area) by collecting the data from 125
farmers and hence from 500 farmers.
Analysis of the Data
After collecting the data, the researcher had turned to the task of
analyzing them. The analysis of data requires a number of closely related
operations such as establishment of categories, the application of these

26
categories to raw data through coding, tabulation and then drawing
statistical inferences. The following research tools had been applied by the
researcher for analyzing the data and drafting statistical conclusions to
meet the objectives of the study.
Chi-square test
Students „t‟ test
ANOVA followed by Duncan Multiple Range Test (DMRT)
Friedman test
Correlation co-efficient
Discriminant analysis
Statistical Package for Social Sciences (SPSS) was used to analyze
the data.
1.8. LIMITATIONS OF THE STUDY
Due to topographical variations, the bindings of the study are not
applicable to other districts of Tamil Nadu.
Repeated questioning with the farmers to get best information
consumed more time.
1.9. CHAPTER SCHEME
The present comparative study has been conducted with a view to
identify the problems of the farmers in procurement of fertilizers and the
hindrances of fertilizer dealers in Marketing of fertilizers.

27
Chapter I – Design and Execution of the Study
In Chapter I, a brief idea of the subject matter of the thesis was
given. The nature of the topic, the objectives of the study, the types of
fertilizers, the methods used for collection of data, the statistical tools used
and the chapter classification have also been presented. This chapter gives
a detailed outline about the Indian agricultural scenario with special
reference to fertilizers.
Chapter II – Review of Literature
This chapter portrays the earlier research studies both empirical and
descriptive studies attempted by various researchers in the relevant fields.
The second chapter traces out the related reviews of literature to the study.
Chapter III - Production, Consumption and Distribution Pattern of
Fertilizers
This chapter gives a brief description of an overview about the
production, consumption and distribution patterns of fertilizers. It gives an
outline about the fertilizer industry and its future prospects.
Chapter IV –Farmers‟ tribulations in Fertilizer Consumption
The fourth chapter deals with the comparative analysis of problems
of farmers in procurement of fertilizers viz., various brands used by the
farmers, knowledge about fertilizers and authorized dealers, sources of
procurement, distance traveled, price etc., in the study area (A Semi-arid
zone and a Delta zone).

28
Chapter V – Hindrances in Fertilizer Marketing
The Fifth chapter focuses the attention on the distribution system
and hurdles faced by the traders in marketing of fertilizers. It gives the
comparative analysis of the hindrances of fertilizers dealers in the study
area. (A Semi-arid zone and a Delta zone).
Chapter VI – Wrap Up
The last chapter gives the summary of the findings, suggestions and
conclusion. This is intended to make the whole thesis into a comprehensive
study with the beginning, middle and a proper end. A strategic model to
improve fertilizer marketing has been developed as the contribution of the
study.
1.10. CONCLUSION
Farmers‟ suicides across the country are a black mark for the
transforming Indian Agriculture. It is time to take bold decisions and quick
and efficient implementation, in the right direction on the part of the
responsible authorities. Our ultimate goal should be for the well-being of
the farmers and the entire society, through sustainable progress in
agriculture. Rapid agricultural growth is essential for poverty alleviation
and overall economic development. So we must strengthen our
competencies, find out the weaknesses, remove them immediately, explore
and exploit the strengths for accelerating the pace of development. It is not
the time to curse the darkness but the time to light a candle and give Indian
farmers a new successful vision in the days to come by effective fertilizer
distribution system.

29
CHAPTER II
REVIEW OF LITERATURE
2.1. INTRODUCTION
The agricultural sector has a vital role in the economic development
of the country. India has right now got the benefit of half a century of
planning on the farm front. One important way of assessing a country‟s
true independence is to critically examine how independent it is in terms of
food security. India has the potential to become the global leader in
agriculture. There is now over-whelming evidence available to prove that
India has higher competitive advantage in exporting many agricultural
products.
In this chapter, the researcher has made an attempt to study the
earlier studies in the field of fertilizer marketing and distribution system at
various dimensions. The purpose of examining these studies is to identify
certain hindrances of fertilizer traders and the problems of the farmers in
procurement of fertilizers.
Many studies related to agricultural problems, role of fertilizers in
agriculture, fertilizer usage, fertilizer consumption, fertilizer distribution
channels, fertilizer demand, fertilizer marketing etc., have been conducted
all over the country for the promotion and progress of agriculture in the
nation.

30
For the purpose of the research, the literature has been classified into
three sections namely,
Section I that shows the research studies about the role of
fertilizers in agriculture.
Section II that provides the related studies of consumption and
usage of fertilizers.
Section III that gives an outlook of the studies based on Co-
operatives agricultural movement.
SECTION I
2.2. ROLE OF FERTILZERS IN AGRICULTURE
Indian economy is basically an agricultural economy. Agriculture
is a large sector of the economy and has a vital role to play in India‟s
economic development by providing food grains, raw materials and
employment. Agriculture is the predominant activity in the Indian
Economy. The farmers of our country are hard working but their problems
and grievances remain un-redressed. This Section deals with the related
studies of fertilizers in agriculture.
R.C. Arora (1964), in his book “Development of Agriculture and
allied sectors” – An Integrated area approach”. According to him, if Indian
agriculture is to progress, it is necessary to raise the level of fertilizer
consumption higher and higher. He designed the study to explore farmers‟

31
attitudes to the use of fertilizers, besides other important factors that affect
the demand. He also stressed the need for using fertilizer for common
Indian crops, like wheat, rice, barley, and sugarcane and the availability of
fertilizer for the farmers.
P.C. Bansil (1975) in his book “Agricultural Problems of India”
mentioned that organic manures cannot possibly meet that full
requirements for replenishing the soils at higher levels of production
envisaged by the new technology. He says that Chemical fertilizers play a
vital role in any scheme for boosting agricultural output.
V.R. Mutalik Desai (1977) in his book “The strategy of Food and
Agriculture in India” felt that agriculture makes a positive contribution to
the regeneration of the entire economy of India. According to him,
application of fertilizers is essential. He advocated a massive production
programme for fertilizers.
H.R. Arakeri (1987), in his book “Indian Agriculture” inculcated
the need for increased attention paid to the aspect of fertilizer use
efficiency. He recommended that the required organizational structure
has to be built up to ensure timely and adequate supply of fertilizers and
also the equipments needed to apply the same by the recommended
methods.
P.G. Desai (1990) in the “Role of Agriculture in Economic
Development” traced the importance of Agriculture to Indian Economic
Development. He wanted that to achieve a rapid increase in incomes a

32
greater proportion of investment should be made in agriculture with
effective fertilizer consumption.
Karanjot Kaur Brar (1999), in his chapter “The economic, social
and political aspects of the Ecological implications of the Green
Revolution” stated that self sufficiency in food, general upliftment of the
agricultural classes, including their acquiring political clout, rapid
transformation of the country side and stimulus to agro based trade and
industry are listed among the positive outcomes of the Green Revolution.
Kirit Parikh (1999), in his article, “Food and Agricultural Policy:
The Challenges ahead” stated that because of globalization, countries will
be forced to concentrate on production of those commodities in which they
have comparative advantage in production, for countries like India, with
range population and lower purchasing power, the impact of globalization
on availability of food at relatively lower prices is concern both politically
and ethically.
C.H. Anumantha Rao (2001), in his article “WTO & viability of
Indian Agriculture” felt the need for the reforms at the grass root level and
to hold the key to improve the viability of Indian agriculture in the wake of
trade liberalization in favourable terms of supply of agricultural inputs.
Santhosh Sahe, B.P. Singh, Birendra Kumar and Dharmjith
Kumar (2004), in their study on “Effect of continuous cropping and
nutrient use on the availability of Phosphorous and Potassium in soil under
Maize- Wheat Sequence” observed the considerable build up in the

33
available P status with the incorporation of fertilizers, manures, either alone
or in conjunctive use over the unamended control. Continuous cropping
adversely affected the K status of soil and was depleted significantly where
no K had been applied, while application of fertilizers, manures improved
the K status. Application of lime depleted the availability of phosphorus
and potassium.
Jaya Vikas Kurthekar (2004), in his case study on “Comparative
study of soils with reference to the effect of agro chemicals” mentioned
that uncontrolled and excessive use of chemical fertilizers and pesticides
for increasing yield in agriculture has become a major problem in India.
Getting a moderate yield throughout, with sensible and appropriate use of
agro chemicals, seems to be a better idea.
S.S.Karavhantanal and J.S.Awaknavar (2006) in their article
“Impact of fertilizers on growth and development of Earthworm, Eeudrillus
Eugineae under in situ Vermiculture” stated that chemical residue in the
soil may have serious environmental effects if they are toxic to earthworms
which play major role in removing organic matter and maintaining soil
structure. Earthworms are useful agents for evaluating contamination of
the soil environment with toxic chemicals.
S.T. Girisha, M. Muniamma, and S. Umesha, (2006) in their study
on “Effect of sewage water and soil chemical composition” indicated that
the fertilizer recommendation for soil is made on the basis of soil analysis
and soil chemical fertility has been found to be one of the major constraints
for establishment and production.

34
K.Murugavelu (2006), in his article entitled “Information
Technology solutions in agricultural development” pointed out that the
existing cultivation land must be made to yield more. To achieve this
objective soil conservation, use of selected seeds, application of good
quality fertilizers and encouragement of the growth of leguminous crops
are essential.
R.K. Sivanappan (2007), in his study “Gateway to agricultural
Prosperity” stressed that the one of the main problems in agriculture are
deterioration of soil health/fertility of the soil. So he recommended that
soil health improvement programmes through integrated measures by
improving organic matter and macro and micro nutrient content have to be
undertaken.
S.S. Nagarajan (2007), in his article “Samba and Thaladi in
Cauvery Delta” stated the new method of application of fertilizers that
farmers must apply nearly one ton of ripe farmyard manure and carry out
dry ploughing for mixing of the manure with the soil. After letting the
canal water the land is pulled well, bunds trimmed and the land is leveled.
In the traditional method the seed rate used is nearly double that of the new
method.
S.Kanthimathinathan (2007), made “An overview of India‟s Food
Challenge”. He revealed that the solution for meeting future food demand
will be breakthroughs in Science and Technology since yield levels have
reached a plateau and are even showing signs of decline. The possibilities

35
through Bio-technology and genetic engineering are exciting and can
herald another “Green Revolution”
A.Noor Mohammed (2007), in his paper on “Rejuvenating the
agricultural sector” discussed the root causes of the problems and the
measures to be taken for rejuvenate the agricultural sector. He suggested
that direct access should be given to the farmers and contract farming
would help the farmers to have better inputs and technology.
S.Sundarrajan (2007), in his critique on “Dimensions of Indian
agricultural developments” analysed the problems of Indian agriculture. He
thrashed out about precision agriculture and sustainable development.
Precision agriculture is a systems approach to farming. It is based on the
development and use of new technologies including new computerized
equipment, machines and information management system for more
effective crop production and environmental protection through proper
fertilization.
A.Pandu (2007), in his article “Indian agriculture at 60 in deep
dilemma” concluded that sixty years independence and 10 Five-Years
Plans later, Indian agriculture is still at crossroads. In all probability, India
will once again import close to 5 million tones of wheat, as it imported 5.5
million tones last year. Instead of helping farmers grow more, the nation
lives on imported food.
N.Chithra (2008), in his cram entitled on “Prospects and problems
of agriculture in Tamilnadu” investigated the land holding pattern of the

36
farmers. Size of the land holding in terms of marginal, small, semi-medium
and large farms were discussed. She spotted out the critical problems
towards the supply of critical inputs (high yielding seeds, fertilizers, power
and technical know-how).
Rajesh Pal (2008), in his article “Food situation and National
Economy” discussed about the Marginalization process which has brought
about a major change in the production structure in agriculture. The
diminishing proportion of the large owners and reduction in their land
share could be in part due to their moving out of agriculture to more
lucrative opportunities in the sector and also performance for investment in
non-land capital rather than only further addition to size of holdings.
K.K.Lakshmanan (2008), in his study “New Agrarian Policy –Need
of the hour” portrayed that the main problem related to agriculture is high
input cost, increased cost of the food products with no monetary benefit to
the farmers. He stressed that strategies should be evolved to improve
farming with financial support, technical expertise to protect the soil
against wind erosion, pattern of cropping and efficient marketing system.
P.Sankaranarayanan and S.Sri Thanga Rama Krishnan (2008),
in their study on “E-Agriculture: A new trend in Indian agriculture
sector” discussed that the developed nations are using laser technology
instead of tractors to plough lands. This helps in optimizing the use of
various inputs such as water, seeds, fertilizers etc. The Government must
come in support for agricultural infrastructure with the help of
communication technology.
37
K.N. Ramanujam (2008), in his article „Transformation of
agriculture” stressed that a paradigm shift to see agriculture has become a
necessity, especially in the backdrop of globalization. He mentioned in
his study that the need now is to enhance productivity across varied agri-
eco regions and focus on a wider array of crops and sectors.
T.Kotti Reddy (2009), in his study “Indian Agriculture-An
Overview” mentioned that for the growth of agriculture, community
farming (i.e., place where farmers is an area come together to cultivate a
common crop) should be encouraged. Proper use of fertilizers and
pesticides should be pressed upon to minimize input cost and increase
yield.
A. Thilagaraj (2009), through his article “Green Revolution- for
nation‟s economy brought to light the green revolution as a healthiest
concept. The Green Revolution strategy has been called by various names,
modern agricultural technology, seed – fertilizer - water technology etc.
He stressed that the majority of the regions will be benefited through
another green revolution.
Anthony I Moyne - Emina (2009) in his study “Agricultural
Revival Strategies-An appraisal of the Nigerian Experience” listed the
problems of farmers such as shortage of finance, inadequate working
capital, institutional and organizational problems, labour constraints,
infrastructure constraints. He gave the necessary measures to develop the
agriculture with the help of improved storage system, rehabilitation of the
transport system and improvement of rural infrastructure

38
SECTION II
2.3. CONSUMPTION AND USAGE OF FERTILIZERS
In this Section the related studies of consumption and usage of
fertilizers have been discussed as under.
W.Hopper David (1964) in his article, The Economics of Fertilizer
Use-a Case study in Production Economics” presented a mathematical
equation to the experimental data for wheat by the technique of least
squares. The equation is of the quadratic form. The return to various
inputs and fertilizer use is also calculated. He found out the maximum
profit from fertilizer use.
A.F. Gusfatson (1980) in his “Handbook of fertilizers” has
expressed the view that for a well balanced normal growth and proper
development. Among the elements needed, for plant growth, fertilizer is
very important. He also dealt with the effects of fertilizers on crops and
soils. He had also suggested the method of applying fertilizers and gave
importance to side-dressing and top-dressing of fertilizers to plants.
Kumar Das Tapan and Bhattacharya Kanti (1981) in Chapter V
on “Rural Development experience of fertilizers” felt the need for
increasing food production to meet the demand for increasing population of
India. They said that block demonstration as a method of increasing the
fertilizer use was initiated by the cluster village concept. This method was
advocated by Indo-German Fertilizer Education Project of Hindustan
Fertilizers Corporation Ltd., launched in 1974.

39
Anderson (1982), in his work “The role of fertilizers” analyzed the
factors expected to restrict the contribution of fertilizers to food production
to an accelerated rate of increase in production and to remove the factors
with emphasis on the role of Public policy measures. He found out that
unavailability of fertilizers, lack of knowledge, risk and Uncertainty, lack
of credit and lack of complementary inputs are impediments to overcome.
K.C. Bhatnagar, G.L. Khurana and S.R. Bapat (1986) in their
article “Economics of Fertilizer Consumption-Application of Mustard”
attempted to examine the scope and extent of fertilizer application to
mustard cop in 3 states of Northern Region and found out that the return on
investment on fertilizers and said that fertilizer use is dependent upon
additional yield of the produce. They also found out the factors affecting
fertilizer use efficiency like variety, season and time sowing, water
management and plant protection measures.
Ramasamy.C. et. al (1986) in his article “Sustaining growth in
fertilizer use” stated the fertilizer usage depends largely on type of crop
growth. For cash crops such as sugarcane the fertilizer is used in large
quantities. Cash crops are mostly grown under irrigated conditions; there is
a need to develop sustainable dry land farming technology to promote
fertilizer usage in large rain fed areas throughout India.
T.C. Mohanam (1988) in his article “Growth rates of fertilizer
consumption- A district wise analysis in Tamil Nadu” analyzed the growth
rate and found out that the growth rate of fertilizer consumption in India
was nearly 18% during 1952-1966 (Pre-Green Revolution period) which

40
has decreased to 10% during 1966-1985 (Post Green Revolution period).
There were inter-district variations and almost clustered around the state
level growth rate.
B. Mishra (1989) in his article on “Computers‟ use of fertilizer
Advice and crop production” says that there are many possibilities of using
computers in crop production for saving time and increasing crop yields.
He also stressed that a good fertilizer recommendation should be site-
specific as well a situation-specific.
Deepak Kher and G.M. Bhat (1990) in their article, “Economics of
Fertilization in Maize and wheat; A study of Himachal Pradesh” have
analyzed the use of fertilizer and the relationship between fertilizer inputs
and yield outputs with regard to maize and wheat in Himachal Pradesh.
They have found out that the co-efficient determination R2 is significantly
high for both the crops.
H.S. Mishra, T.R. Rathore, R.C. Pant and R.P. Tripathi (1990)
in their article “Soil, water and fertilizer management for wheat cultivation
in Rice-wheat Rotation” studied the crop rotation among wheat and rice.
After the rice is harvested, the soil condition then is quite favorable for the
growth and yield of the subsequent crop like wheat. They concluded that
balanced application of nutrients is important for getting higher yield in
addition to irrigation and plant production.
Gulati Ashok (1990) in his article, “Fertilizer Subsidy, Is the
cultivator Net subsidized” indicated that economic subsidy on fertilizers to

41
Indian cultivators constitutes not more than 50% of what Government
delineates in its budget, (average of 1981-82 to 1989-90). He came to the
conclusion that the issue of fertilizer price in relation to the prices of major
crops such as rice, wheat and cotton, Indian cultivators do not appear, to
have been net subsidized on account of fertilizers.
P.C. Bansil (1993) in his work on manorial policy stressed the use
of cow-dung and bone for manorial purpose. He also suggested quick
growing fuel trees, which rural population will have to rely instead of cow-
dung for fuel. In addition he recommended the use of green legumes which
contain largest nitrogen. He suggested a crash plan for fertilizer to produce
more food grains.
Dholakia Ravindra and Majumdar Jagdip (1995) in their article
“Estimation of Price Elasticity of fertilizer demand at macro level in India”
made an attempt to overcome some of the shortcomings in estimating
fertilizer demand function in India. Both Static and dynamic models were
used in estimating demand function and price elasticity in the short run and
long run. They found out that fertilizer price in India is „Price in elastic‟ in
short run and in the long run.
P.Bhattacharya and U.C. Mishra (1995) in their article “Status of
Bio-fertilizer use in Andra Pradesh –Scope and limitation” studied the
scope of applying Bio-fertilizers plays a significant role as one of the
components of Integrated Plant Nutrient supply systems. They studied the
potential demand in Andhra Pradesh and stressed the need for the
combined efforts of Centre and State Government to meet the demand.

42
Gupta R.G. (1995), in his study on “Fertilizer Marketing Strategies”
suggested many strategies for the improvement of fertilizer marketing. The
type of crop grown and accessibility of credit were the important factors
influencing quantum of fertilizer usage. Therefore making credit more
accessible to the farmers by simplifying the procedure to obtain credit from
formal sources. While introducing the new fertilizers brands, it should be
informed to the farmers by means of direct farmer contacting methods.
S. Maheswari (1995) in her study on “Marketing and logistics of
fertilizers” stated that lack of knowledge of composition of fertilizers is one
among the major problems faced by the farmers. There is an immediate
need to educate the farmers in this regard by the Agricultural Department.
There is an emerging need for the co-ordination between fertilizer
manufacturing and distributing agencies.
D.M. Hedge, B.S. Dwivedi and S.N. Sudhakara Balu (1997) in
their article “Bio-fertilizers for cereal production in India - A Review”,
reviewed critically the performance of bio-fertilizers in cereal crops under
different ecologies. They studied the effect of Azospirillum with millets
and wheat Sorghum and found out the yield has increased. The bio-
fertilizers had greater influence on the yield of Cereal crops and they
supplement chemical fertilizers.
Patel,G.N., Patel,R.M., Patel,H.A., Khatra,R.C. Gondalia,V.K.,
(1997) in their study Marketing efficiency – A Case of Anand Vegetable
Market mentioned that the farmers are rational in purchase and use of

43
inputs such as fertilizers based on their experience. The analysis showed
that the factors nearly soil type, crops grown; amount and pattern of
rainfall, availability of credit were very important factors influencing the
fertilizer usage among the farmers.
B.C. Biswas, Naresh Prasad and Sonmithra Das (1998) in their
article on “Fertilizer use in some selected Agro Ecological zones of India”
attempted to examine their fertilizer use pattern of some selected agro-
ecological zones and also indicated the fertilizers use pattern for the future
taking into account their compound growth of fertilizer consumption. They
found out that fertilizer consumption varies widely in different agro-
ecological zones in India.
G.Bhemaiah, M.V.R., Subrahmanyam, Syed Ismail, S.Sridevi
and K. Radhika (1999) in their article, “Effect of Integrated application of
Green Leaf manures and fertilizers on growth and yield of summer
Groundnut under different cropping systems” found out that inter-cropping
of summer groundnut in 6 year old teak and Sissoo plantation did not prove
beneficial, while Popinac green leaf manuring was found effective in
increasing the yield of groundnut.
Indo British Fertilizer Education Project through Hindustan
Fertilizer Corporation (1999) emphasized on “Block Demonstration”
about modern technology for about 100 to 150 families in two villages in a
yea with 50% subsidy in West Bengal. From the second year, follow up
work was continued without any subsidy on any input. They had tested the
effect of Demonstration area over outside area and found out the increase
44
in the yield of Paddy. They studied the infrastructure facilities like
irrigation, storage, marketing of products, supply of inputs and retail point
seeds.
Ali T. Ayoub (1999), in his study “Fertilizers and the environment”
said that low soil fertility is considered as one of the most important
constraints on improved agricultural production. To sustain the future
world population, more fertilizers are required, which may become an
environmental hazard, unless adequate technical and socio-economic
measures are taken. It is estimated that, by the year 2020, at global level,
70% of plant nutrients will have to come from fertilizers. Fertilizers are
thus indispensable for sustained food production, but excessive use of
mineral fertilizers has roused environmental concerns.
H.Pathak, P.K. Aggarwal, Roetter, S.K.Bandyodhaya, (2003) in
their study “Modelling the quantitative evaluation of soil nutrient supply,
nutrient use efficiency and fertilizer requirements of wheat in India”
mentioned that the main reason for low productivity is delay in application
of fertilizers, improper fertilizer use, and imbalanced use of fertilizers.
They also mentioned that the estimation of fertilizer requirements based on
quantitative approaches can assist in improving wheat yields and increasing
nutrient use efficiently.
A.F. Gustafson, (2003) in their study on “Purchase and use of
fertilizers” stated about the fertilizer credit. Fertilizer Credit is granted on
the basis of the dealer‟s faith in the buyer‟s intention to pay in the belief
that he can use the fertilizer to good advantage which will enable him to

45
pay for it. The expected gross returns to the acre from a crop are the most
important single factor in determining the rate of application of fertilizers.
P.K. Gupta, (2003) in his chapter “Fertilizer policy issues for
(2000-2025)” frazzled the scientific and need based use of fertilizers. He
also mentioned that there is a great concern about the adverse effects on
soil health as well as productivity due to widening ratio of N:P:K
(8.7:2.5:1.0) due to unsound policy decision taken earlier. This has to be
corrected to some extent.
T.Gaiser, I.De.Barros, F.M. Lange and J.R. Williams, (2004) in
their study “Water use efficiency of a maize/cowpea intercrop on a highly
acidic tropical soil as affected by liming and fertilizer application” , proved
that the productivity of water in maize/cowpea intercropping system can
be increased by more than 100% through the application of NPK fertilizers
in combination with time.
A.M. Smith, (2004), in his article “The valuation and purchase of
fertilizers” stated that the trade in fertilizers is regulated by Fertilizers and
Feeding stuffs Act of 1926. Under this Act, the duty of administration is
placed upon the local authority, Country Council each of whom must
appoint an official analyst and an official sampler who will attend and take
samples of consignment of fertilizers, thus relieving the farmer from any
trouble. The farmer should also be careful to see that the invoice agrees
with the guarantee on which he bought.

46
R.D.Nigade and B.S. Jadhav (2006), in their article “Use of Bio-
fertilizers in Suru Sugarcane” mentioned that sugarcane crop needs
generous doses of fertilizer to meet its requirement and the balance use of
organic manures, bio fertilizers and chemical fertilizers played the prime
role in maintaining the phydisco-chemical properties of the soil.
Dr. A.Panneerselvam and Dr. S. Rajkumar (2007), in their study
on “Organic Farming: Farms of the future” stated that there is an urgent
need to develop farming techniques, which are sustainable from
environmental, production and social and economic points of view. They
concluded that the opportunity of utilizing the world organic food market is
now left with the farmers adopting organic method of cultivation with
certification from reputed agencies.
K.S. Vipin (2007), in his analysis on “Role of sulphur in Balanced
Fertilization of rice” identified that sulphur is found to be absorbed by the
rice crop in amounts equal to phosphorus and is considered essential for the
attainment of 90 per cent of optimum yield of rice and so Sulphur
application is considered highly profitable in sulphur deficient soils of
India. S.Seethalakshmi (2007), in her study “Fertilizer Consumption in
Paddy Cultivation” analyzed the benefits of fertilizer consumption. She
concluded that the consumption of the chemical fertilizers is giving way to
bio fertilizers and micro nutrients at par with drip irrigation replacing
multipurpose projects. This combination of changes in fertilizer and
irrigation has obtained a new concept called “Fertigation”.

47
H.D.Ramesh and D.Anand (2007), in their study ”Fertilizer Market
in Karnataka, A Micro level study of components and influencing
variables” studied the problems of farmers in procurement of fertilizers and
the influencing variables of Fertilizer Marketing. The lack of knowledge
of composition of fertilizers is one among the problems faced by the
farmers. They insisted that the fertilizer companies should rely more on
retailer oriented promotion of brands and direct farmer contacting methods,
which will be more effective in increasing sales of fertilizers.
D.K. Rai (2008), in his article “Environment Friendly Green
Agriculture on grand good commercial scale” stated that our major food
production area is now under serious ecological and economic problems.
He stressed that the only difference between the organic farming and the
green agriculture is that the green agriculture, unlike organic agriculture,
permits the use of the minimum essential chemical fertilizers and chemical
fertilizers as well. It also permits growing the G.M. (genetically modified)
crops.
S. Venkatraman (2008), in his study on “Fertilizer policy needs
clarity” mentioned that there are many other glaring anomalies in fertilizer
policies. The money actually required for the revival of the closed units
and the loss making existing units would be found to be more productive
expenditure both in short and long run, if compared with the money spent
by the government on importing urea often at high international prices.
S.Edison and V.Ramesh (2008), in their investigation on “Balanced
Fertilization for revitalizing Indian agriculture” concluded that two

48
important aspects of farming that must be addressed on a war footing are
implementation of a clear water-use policy and energizing its extension
activities. He stressed that for the sustainable crop production, Integrated
Nutrient Management (INM) is important.
SECTION III
2.4. CO-OPERATIVE AGRICULTURAL MOVEMENT
Co-operation is a form of organization in which persons voluntarily
associate together on a basis of equality for the promotion of their
economic interests. In this Section, the studies related to co-operative
agricultural movement and the functioning of Primary Agricultural Co-
operative Societies.
B.S. Mathur (1968), in his study on “Role of Institutional credit”
identified that there is a need for institutional agricultural credit and its
objective is to make a breakthrough in the vicious circle of poverty, reck-
renting, usury and debt and to stimulate the farmer to boost agricultural
productivity and it will lead to the conversion of static into dynamic credit.
Horase Belshaw (1970), in his study on “Increasing agricultural
productivity” mentioned that agriculture is affected with clear and
unquestionable public interest, and its status is a matter of national concern
calling for deliberate and far-sighted national policies, not only to conserve
the natural and human resources but also to provide for the national
security, but to provide national security, promote a well rounded
prosperity and secure social and political stability.

49
S.G. Beri (1972), in his study on “Reorganization of Agricultural
Credit Societies” stated that there was a general and growing conviction
that the agricultural credit movement had not yielded results corresponding
to the efforts made. It addressed itself to the solution of the problem of
credit only and did not simultaneously take up a campaign against the
causes which gave rise to it and made for unbalanced budget of the farmer.
P.K.Dubhashi (1977) made a study on “Agricultural credit system”
and stated in his study that the banks will be engaged in experimenting
with various schemes and setting the pace for promoting farm finance.
They should have to acquire the necessary knowledge of their clientele as
also of the areas, which will help them to evolve a suitable approach
towards financing agriculture.
Choubey (1977) in his study on “Role of Credit Cooperatives in
Agricultural Development” mentioned that the basic objective of the co-
operative movement in agriculture is to serve the farmers and other weaker
sections of the society. He insisted that the co-operative credit societies
should, therefore, re-orient their loan policies and procedures so that they
may increasingly serve the small farmers and weaker sections.
C.L. Dadhich (1980) in his article on “Cooperative Credit Policy
and weaker Sections – A Prospect” acknowledged the role of co-operative
societies for the upliftment and development of weaker sections of the
society. The credit policies must definitely be liberalized. Greatest
emphasis should be given for the rural development.

50
L.D. Vaikunthe (1988) in his study “utilization of Co-operative
credit in Agriculture” has observed that the per centage of borrowings is
higher in the case of big farmers in comparison to small and medium
farmers. Mostly all the size groups in the irrigated area, utilize the credit
for productive purpose. But misuse of credit is more in the non irrigated
areas compared to the irrigated area again in the non-irrigated area, the
small and medium farmers misused the credit more than the big farmers.
Jugale (1992) in his study on socio-economic and technological
impact of co-operative credit in agriculture found that renewal of loans
becomes generalized phenomenon, which makes the farmers perpetually
indebted in their attempts to adjust the repayment, and that the PACS have
become political campaigning centres in the Shirol Taluk of Maharashtra.
Suresh,K.A., and Vinalkumar (1993) “Economic viability of co-
operative – A case study of Primary Agricultural Credit Cooperatives in
Kerala” identified the factors that are responsible for the economic
viability of the co-operatives and suggested that the borrowers have to
repay loans in time. Co-operative principles and policies should be
explained to the members and others.
Sharma Prem.M. (1995), “Agricultural Inputs and Cooperative
Sector” mentioned that co-operative societies played a vital role in
distribution of agricultural inputs especially, seeds and fertilizers. But the
timely distribution of those inputs is necessary in order to avoid the delay
in application of the fertilizers by the farmers.

51
Manicka Mahesh (2000), “Role of agricultural Co-operative
Societies in rural Development” stated that there is a need for rejunevating
the agricultural sector for the betterment of the economic development of
the country. It is necessary to provide the credit to the farmers at needy
time. The lending procedures must be simplified in order to get the desired
loan at the time of need.
Dr.S.M. Krishnan (2003), “Agricultural Finance” analyzed the
various phases of agricultural finance. He listed the indirect advances
given to the farmers for the procurement of fertilizers by the co-operative
Societies. Still there is a gap persisting between the demand and supply of
rural credit in India. This call for a long range, careful and realistic plan
taking into account the existing operational deficiencies and problems.
Dr.V.M. Selvaraj and G. Sankaravadivoo (2007), in their study on
“Problems faced by Co-operative Agriculture and Rural Development
Banks in Tamil Nadu” stated that majority of the ARDBs are not
financially viable. Hence autonomy and accountability must be given to
them and make them free from the excessive Government control and
interference. Relaxation of norms for refinance by NABARD is also
needed. Non viable PCARDBs can be liquidated.
Dr.S. Chandramohan, Dr. S. Latha, and Mrs. M. Punitha, (2008)
in their article “Utilities of Management strategies to Co-operative and
Rural Ventures” mentioned that the co-operative enterprises have made a
remarkable quantitative growth but have failed in qualitative aspects.

52
M.Gopalan,(2008) in his study on “Conceptual Development
Strategy-A conceptual Framework for co-operatives” stated that the
strategy refers to short term and long term techniques covering specific
plans to realize the predetermined objectives is needed to attain the
cooperative development. He analyzed all the management strategies
starting from planning to control to be adopted in co-operative societies for
their betterment.
Dr.V.Darling Selvi (2009) in her article on “Lending to Agriculture-
A Scenario of Co-operative Banks in Kanyakumari District” mentioned
that the performance evaluation of banks in case of agriculture lending
shows that the performance of private banks is a good than commercial and
cooperative banks. The agricultural policies in India have been reviewed
from time to time to maintain pace with the changing requirements of the
agriculture sector, which forms an important segment of the priority sector
lending of co-operative banks.
2.5. HOW THIS STUDY VARIES FROM THE VARIOUS STUDIES
After the Review of Literature, the researcher observed that there
exist Studies on the role of fertilizers in agriculture, Consumption of
fertilizers, Fertilizer Subsidy, Fertilizer policies, Agricultural credit by the
Co-operative Societies, Agricultural inputs and co-operative sector, Role
of Primary Agricultural Co-operative Societies in agricultural development
etc.

53
Hence the researcher has identified a gap to be filled by deciding to
take up a comparative study on Marketing of Fertilizers. Due to the
following reasons the present study is being distinguished from the studies
of others.
The two different ecological zones, viz., Semi-arid zone and Delta zone
have been chosen as study area so that the outcome of the study will be
helpful to those districts which have any one of the above climatic
conditions and cultivation practices.
This is a comparative study of Fertilizer Marketing of two different
zones. This study will give a clear outline about the similarities and
disparities between the both. It is useful to analyze the various
favourable and adverse factors that are affecting the procurement of
fertilizers in each zone.
The major areas of Marketing of fertilizers such as Finance, Purchases,
Sales, Transportation, Warehousing, Advertisement and Sales
Promotion have been carefully analyzed.
The proper picture of the various distribution channels of Fertilizer
Marketing is made to study the business practices of private traders and
Primary Agricultural Co-operative Societies. This study analyzes
deeply the hindrances of marketing of fertilizers.
On the other side, the ultimate consumer of the fertilizers i.e., the
farmers has been approached to understand the problems in
procurement of fertilizers.

54
This study has been made to analyze the various categories of farmers
and their cultivation practices, their preferences, nature of consumption,
fertilizer usage etc.,
After making careful analysis of the problems of farmers and the
hindrances of the fertilizer traders, a strategic model has been developed
to strengthen the Fertilizer Marketing by efficient Marketing Mix.
All these conditions helped the researcher to present an altogether
new idea with a different approach to make a Comparative Study of
Fertilizer Marketing of a Semi-arid zone and a Delta zone to analyze the
problems of fertilizer traders and the farmers.

55
CHAPTER III
PRODUCTION, CONSUMPTION AND DISTRIBUTION OF
FERTILIZERS
3.1. INTRODUCTION
India is basically an agricultural country in which economy depends
largely upon its agrarian produce. Indian fertilizer industry has a
tremendous scope in and outside the country as it is one of the allied parts
of agriculture. Today, Indian Fertilizer Industry has been developing in
terms of technology. Indian manufacturers are adopting advanced
manufacturing processes to prepare innovative new products for Indian
agriculture. India has been entitled as the third largest producer and
exporter of nitrogenous fertilizer.
3.2. FERTILIZERS
Fertilizer is generally defined as "any material, organic or inorganic,
natural or synthetic, which supplies one or more of the chemical elements
required for the plant growth".
The Primary nutrients are normally supplied through the chemical
fertilizers. They are chemical compounds containing one or more of the
primary nutrients and are generally produced by the chemical reactions.
Whatever may be the chemical compounds, the most important ingredient
for plant growth is the nutrient content. The primary nutrients are nitrogen,
phosphorus and potassium.

56
In this chapter, the production, consumption and distribution
patterns of fertilizers have been analyzed.
The overall production, imports and consumption of fertilizers,
Prices of fertilizers; Fertilizer Subsidy, Fertilizer Distribution and Credit
have been discussed with the help of Secondary Data.
3.3. FERTILIZER PRODUCTION
At present, there are 64 large size fertilizer units in the country,
manufacturing a wide range of nitrogenous and phosphatic/complex
fertilizers. Of these, 39 units produce Urea, 18 units produce DAP and
complex fertilizers, 7 units produce low analysis straight Nitrogenous
Fertilizers and 9 of the above units produce Ammonium Sulphate as a by-
product. Besides, there are about 79 small and medium scale units
producing single Super Phosphate. The total installed capacity of fertilizer
production in the country which was 104.98 lakh tonnes of Nitrogen and
29.51 lakh tonnes of phosphate as on 1.4.98 have risen to 110.71 lakh
tonnes of nitrogen and 36.48 lakh tonnes of Phosphate as on 29.2.2000.
Domestic production of Nitrogenous (N) and Phospatic (P) fertilizer
showed an increasing trend over the years and was estimated to be 156.03
lakh tonnes in 2007-08. A joint venture project between IFFCO and
KRIBHCO and Oman Oilco has been set up under the name of OMIFCO at
Oman for production of 16.52 lakh tonnes of Urea and 2.48 lakh tonnes of
Ammonia per annum. The government has entered into a long-term
contract with OMIFCO to buy this Urea at fixed predetermined prices for a
period of 15 years. The execution of the project commenced on August 15,

57
2002 and the commercial production started in July 2005.The Urea us
priced as US Dollar 150 per tonne FOB against international prevailing
price of US dollar 235 per tonne FOB. This has led to substantial savings in
subsidy estimated to be around US$ 88million till December 2005.In
addition to Urea, the surplus ammonia will also be available under long
term Ammonia off take agreement with IFFCO.
3.4. GROWTH OF FERTILIZER INDUSTRY
Fertilizer industry in India has been meeting all the requirements of
agricultural industry since the time of its inception in 1906. The first plant
for fertilizers manufacture was set up in the same year in Ranipet, Chennai.
Then established the first two large-sized fertilizer plants, one was the
Fertilizer & Chemicals, Tranvancore India Ltd. (FACT) in Cochin, Kerala,
and another one was Fertilizers‟ Corporation of India (FCI) in Sindri,
Bihar. These two were established as pedestal fertilizer units to have self
sufficiency in the production of food grains. Afterwards, the industry
gained impetus in its growth due to green revolution in the late sixties,
followed by the seventies and the eighties when fertilizer industry
witnessed an incredible boom in the fertilizer production.
The installed capacity as on 30.01.2008 has reached a level of 121.10
lakh MT of Nitrogen (inclusive of an installed capacity of 208.42 lakh MT
of Urea after reassessment of capacity) and 53.60 lakh MT of Phosphatic
nutrient, making India the 3rd largest fertilizer producer in the world.

58
The following Table 3.1. shows the production, imports and
consumption of fertilizers.
Table 3.1.
Production, Imports and Consumption of Fertilizers
(thousands tonne of nutrients)
Fer
tili
zer
s
2001-0
2
2002-0
3
2003-0
4
2004-0
5
2005-0
6
2006-0
7
2007-0
8
Nitrogenous
Fertilizers
a. Production
b. Imports
c. Consumption
10890
833
11592
11044
154
10290
107771
269
11310
10560
67
10474
10634
132
11076
11338
295
11714
11480
555
12723
Phosphatic
Fertilizers
a.Production
b.Imports
c.Consumption
3399
1503
4799
3748
396
4215
3861
429
4382
3906
170
4019
3631
338
4124
4067
412
4624
4123
1389
5204
Potassic
Fertilizers
b.Imports
c.Consumption
1739
1678
1541
1567
1701
1667
1520
1601
1548
1598
2040
2060
1774
2413
All Fertilizers
(NPK)
a.Production
b.imports
c.Consumption
14289
4075
18069
14752
2090
16702
14632
2399
17630
14468
1757
16094
14625
2018
16798
15405
2753
18398
15603
3718
20340
Source: Ministry of Chemicals and Fertilizer

59
The rapid build-up of fertilizer production capacity in the country has
been achieved as a result of a favourable policy environment facilitating
large investments in the public, co-operative and private sectors. Presently,
there are 57 large-sized fertilizer plants in the country manufacturing a
wide range of Nitrogenous, Phosphatic and Complex fertilizers. Out of
these, 29 units produce Urea, 20 units produce DAP and complex
fertilizers 13 plants manufacture Ammonium Sulphate (AS), Calcium
Ammonium Nitrate (CAN) and other low analysis nitrogenous fertilizers.
There are about 64 medium and small-scale units in operation producing
SSP.
The tremendous demand of fertilizers has led the country to invest
hugely in the public, co-operative and in private sectors. At present, India
has more than 57 large-sized plants of fertilizers, manufacturing wide
assortment of fertilizers including nitrogenous, phosphatic, Ammonium
Sulphate (AS), Calcium Ammonium Nitrate (CAN) urea, DAP and
complex fertilizers. Apart from it, there are other 64 small and medium
scale Indian manufacturers producing fertilizers.
The list of some public sector Indian fertilizer industries;
- Madras Fertilizers Limited.,
- National Fertilizers Limited.,
- Hindustan Fertilizer Corporation Limited.,
- Steel Authority Of India Limited.,
- Fertilizers & Chemicals Travancore Limited.,
- Rashtriya Chemicals &Fertilizers Limited.,
- Paradeep Phosphates Limited.,

60
- Pyrites, Phosphates & Chemicals Limited.,
- Neyveli Lignite Corporation Limited.,
Some of the major private sector fertilizer companies in India are:
- Balaji Fertilizers Private Limited.,
- Ajay Farm-Chem Private Limited .,
- Chambal Fertilizers & Chemicals Limited.,
- Bharat Fertilizer Industries Limited.,
- Gujarat Narmada Valley Fertilizer Co. Limited.,
- Southern Petro Chemical Industries Corporation Limited.,
- Godavari Fertilizers & Chemical Limited.,
- Shri Amba Fertilizers (I) Private Limited.,
- Gujarat State Fertilizers & Chemicals Limited.,
- Maharashtra Agro Industrial Development Corporation.,
- Mangalore Chemicals & Fertilizers Limited.,
The speedy growth in the fertilizers‟ production ways the Indian
manufacturers to transform into Indian exporters, and helping them create a
long lasting impression on global consumers.
3.5. PRICES OF FERTILIZERS
As fertilizer is an essential input for agricultural production, the
Government‟s objective is to make this critical input available to the
farmers at affordable prices. Until 24th
August 1992, the prices of all the
fertilizers were controlled as the Government set the maximum retail prices
of various fertilizers. With effect from 25August 1992, the prices of

61
Phosphate and Potash fertilizers were decontrolled. The prices of Urea
continued to remain under control. Following decontrol, the prices of
Phosphatic and Potassic fertilizers rose sharply. Since 1997/98 the
Government has fixed indicative maximum retail prices of decontrolled
fertilizers, uniform throughout the country.
3.5.1. Pricing of fertilizers
The most important factor in the fertilizer industry is the
pricing of the fertilizer. In a country like India, where the average
farmer is proverbially a poor man, the price of the fertilizer should not
be beyond his reach. Inflated prices of fertilizer due to levying of
heavy duties would result in the reduction of fertilizer consumption
leading to a poor agricultural production. Further suitable price
incentives may be essential for the farmer‟s produce to encourage them
to use fertilizers continuously.
3.5.2. Objectives of Pricing Policy
The fertilizers‟ pricing policy of the Government of India has been
governed by the following objectives;
1. To make fertilizers available to the farming community at low and
affordable prices to encourage intensive cultivation with high
yielding varieties.
2. To ensure fair returns on the investment made to attract more capital
to the fertilizers‟ industry. i.e., from 1981 to 1991, the prices

62
received by the farmers for their agricultural produces had almost
been doubled.
To encourage balanced fertilizer use and make available
fertilizers to farmers at affordable prices, the Central Government notifies
the selling price of Urea as well as decontrolled P&K fertilizers, such as
Diammonium Phosphate (DAP), Muriate of Potash (MOP) and eleven
complex fertilizers, excluding Single Super Phosphate (SSP)in respect of
which the maximum retail price (MRP) is fixed by the State Governments.
To fulfil the former objectives, the government has been statutorily
keeping the selling prices of fertilizers largely static and uniformly low
level throughout the country. This has helped in increasing the demand for
fertilizers over the years.
In order to accomplish the latter objective, the Government under
Retention Price Scheme, introduced with effect from November 1, 1977
fixes a fair ex-factory retention price for the various products of different
manufactures. It allows the reimbursement of reasonable cost of production
including a marginal profit at 12% (Post Tax) on net worth, if the factory
utilizes 90% (earlier the limit was 80 %) of capacity from the second year
of plant and achieves certain norms with regard to consumption of raw
materials, utilities and other inputs.
3.5.3. Increase in prices in 1991
Since the burden of the fertilizer subsidy was very happy and
unmanageable, the Union Budget for 1991-92 increased the issue prices of
the fertilizers by 40 per cent in the average. Subsequently, the average
63
price increase on fertilizer was reduced by 10 per cent and the increase was
made only 30 per cent. The Small and Marginal farmers were exempted
from this price. The Government justified the increase of the fertilizer
price on the following grounds: Fertilizer subsidies have reached an
unmanageable level and the government could not meet the plan needs.
Fertilizer prices have almost remained unchanged for nearly a
decade. For instance, 2007-08 was estimated at Rs11,053.90 crore and on
decontrolled Phosphatic and Pottasic fertilizers at Rs.5,200.00 crore.
However, due to increased production/consumption during 2008-09 and
steep increase in feedstock raw material costs, this is likely to go up.
3.5.4. Retention Price Scheme
The erstwhile individual unit-oriented Retention Price Scheme
(RPS) in respect of Urea had been replaced in stages by a group based
pricing scheme under New Pricing Scheme (NPS) with effect from April
2003 and April 2004. For reviewing the effectiveness of Stage-I and II if
the NPS and for formulating policy for Urea units beyond Stage-II (April
1, 2006 onwards) including the milestones for conversion of existing
Naphtha and FO/LSHS based units to LNG/NG and method of
determination and payment of concessions to Urea units, the Department of
Fertilizers constituted a Working Group under the chairmanship of Dr.
Y.K. Alagh on December 10, 2004. Fluctuations in the prices of
phosphoric acid have, in the last one or two years led to difficulties in its
procurement and resultant bottlenecks in production of DAP.

64
The Department of Fertilizers had also constituted an Expert Group
under the chairmanship of Prof. Abhijit Sen, Member, Planning
Commission for benchmarking phosphoric acid price with international
price of DAP for purposes of determining the concession on DAP. The
Expert Group has recommended that the domestic DAP subsidy should be
benchmarked with international DAP prices in a transparent manner. The
department of Fertilizers is in the process of formulating a revised policy
for DAP keeping in view the recommendations of the Expert Group.
SSP is referred to as poor man‟s fertilizer and is the most important
sources for providing sulphur to the soil. SSP helps correct the agronomic
imbalances which create a deficit of Phosphates and Sulphur in the soil.
Due to increase in the price of inputs and no change in MRP and subsidy,
the production of SSP became unviable and the capacity utilization in this
industry came down sharply to 37per cent. As a measure of relief, the
Government has increased the adhoc concession rate in respect of all types
of SSP.
Table 3.2.
Selling Prices of Fertilizers
Sl. No. Name of the Fertilizer Maximum Retail Price
(Rs. Per ton)
1. Urea 5,000
2. DAP 9,720
3. Complex Fertilizers 7,540
4. Potash 4,600
Source: Primary Data

65
3.6. FERTILIZER SUBSIDY
Over the years, the aim of India has been to become and remain self-
sufficient in food grain production. Fertilizer is the key input that has made
this goal achievable. Historically, the prices of fertilizers have been kept
below the cost of production and import. The prices of fertilizers in India,
particularly of urea, are lower than in developed and neighbouring
developing countries.
The objective behind the low prices is to maintain a favourable
input-output ratio. The aim of the Government has been to ensure that the
farmer receives the price that makes the fertilizer use acceptable and
remunerative. The Government provides a fertilizer subsidy to fill the gap
between the cost of production / import cost plus distribution of fertilizers,
and their retail prices. The objective of the introduction of the fertilizer
subsidy was: (i) to provide food grains to the people at affordable prices;
(ii) to insulate farmers from variations in production costs and to ensure
reasonable returns from fertilizer use; and (iii) to ensure a reasonable return
to the fertilizer industry.
The subsidy on fertilizers is given to the farmers by routing it
through fertilizer manufacturers. Under the RPS, a normative cost of
production was worked out for each company. The difference between the
normative cost of production plus the distribution cost and the retail price
represents the subsidy to the farmers.

66
Table 3.3.
Fertilizers - Subsidies (Rs.in Crores)
Year Imported
Urea
Domestic
Urea
Decontrolled
P& K
Fertilizers
Total
1980-1989 335 170 -- 505
1990-1999 659 3730 -- 4389
2001-2002 1 9480 4219 13800
2002-2003 47 8044 4504 12595
2003-2004 0 7790 3224 11014
2004-2005 0 8521 3326 11847
2005-2006 493.9 10243.2 5142.2 15879.2
2006-2007 943.5 10110.4 5200 16523.9
Source: Ministry of Chemical Fertilizers
Effective from August 1992, P and K fertilizers were decontrolled.
This led to high prices of these fertilizers. The Government introduced a
concession scheme to mitigate the increased cost of production. However,
urea continued to be under the RPS until 31March 2003. Effective from
1April 2003, the RPS on urea was replaced by the Group Pricing Scheme
(GPS). The normative cost of production is now worked out on the GPS
basis. Table 3.3 shows the amount of subsidy provided by the Government
on urea and on the concession on P and K fertilizers in the last 5 years.

67
3.7. FERTILIZER DISTRIBUTION AND CREDIT
3.7.1 Fertilizer Distribution
In 1944, the Government of India established the “Central Fertilizer
Pool” as the official agency for the distribution of all available fertilizers at
fair prices throughout the country. All fertilizers, whether domestically
produced or imported, were pooled together and distributed through state
agencies. In 1966, manufacturers were allowed to market 50 percent of
their production. By 1969, the domestic manufacturers had been given
complete freedom in marketing. However, this was short-lived. Fertilizer
shortages in the early 1970s led the Government to pass the Fertilizer
Movement Control Order in 1973, brought the distribution of fertilizers
under government control.
In the mid-1970s, the supply and distribution of fertilizers were
regulated under the Essential Commodities Act (ECA). Manufacturers
were allocated a quantity of fertilizers in different states according to a
supply plan. All the fertilizers were distributed by the manufacturers
according to their ECA allocation during the two cropping seasons, kharif
and rabi. This system continued up to August 1992. Thereafter, all P and K
fertilizers were decontrolled. CAN and Ammonium Chloride (ACL) were
also decontrolled. All these fertilizers were free from distribution control.
Only Urea continued to remain under control.
With effect from 1 April 2003, the Government implemented the
“New Fertilizer Policy”, which allowed urea manufacturers to market
initially 25 percent and subsequently 50 percent of their production outside

68
the purview of distribution control. This practice continues today. Urea
manufacturers can now market 50 percent of their production as they wish.
The total quantity of fertilizer materials distributed annually increased from
0.3 million tonnes in 1951 to 34.9 million tonnes in 2007/08. This large
volume of fertilizer is distributed through a well-developed marketing
network spread throughout the country. Co-operatives supply almost 35
percent of the total quantity available from domestic production and
importation. Private channels distribute the balance (65 percent). As on 31
March 2009, the total number of sale points was 282 468. Of these, 77
percent were privately owned and 23 percent were in co-operatives and
other institutional channels.
Figure 3.1. Fertilizer Distribution Channels

69
Figure 3.1. shows the present system of fertilizer marketing and
distribution is presented. Indigenous fertilizers are distributed through
institutional channels (co-operative societies, agro-industry corporations,
state commodity federations, etc.) and private trade. The cooperative
marketing structure varies from State to State (two to four tiers). Handling
agents distribute imported Urea. State agencies and domestic
manufacturers distribute imported DAP and complex fertilizers, MOP and
SOP.
Currently, about 75 percent of the total quantity of fertilizer is
moved on rail and the remaining 25 percent on road. The average distance
of fertilizers moved on rail is about 850 km. However, within a radius of
200 – 250 km from the plant, most of the fertilizer materials are moved on
road. The economics of movement favours road transportation up to this
distance.
3.7.2. Components of Marketing Costs
The Marketing Cost of Urea is about Rs 1000/ton. Of this, the
freight accounts for 50 – 55 percent, the distribution margin accounts for
18 percent and the handling and storage for 10 percent while fertilizer
production is continuous throughout the year, its use is seasonal. In India,
there are two main cropping seasons: (i) kharif (April–September); and (ii)
rabi (October–March). Fertilizers are stored before the onset of each
season. Consumption is characterized by a peak period followed by lean
spells. Therefore, storage is an important factor in Fertilizer Marketing and
Distribution. There are about 2,060 Central and State warehouses with an

70
aggregate capacity of 30.1 million tonnes. In addition, the Food
Corporation of India has a storage capacity of 23.95 million tonnes. The
co-operatives have about 65 970 godowns with a capacity of about 14.12
million tonnes. These godowns are used for storage of food grains,
fertilizer and other commodities.
3.7.3. Credit
Most farmers cannot afford to purchase fertilizers on a cash basis.
Similarly, not every dealer can pay cash for fertilizers. Therefore, credit
plays an important role in fertilizer distribution and use. Generally, two
types of credit are available in the fertilizer sector for fertilizer distribution
and use. One type is Distribution Credit, which a dealer uses for buying
fertilizers from the manufacturer or wholesaler. The second type is
production credit, which a farmer uses for purchasing inputs, of which
fertilizer is the major one. Various agencies provide credit to the
agriculture sector in different forms. These include co-operative banks,
regional rural banks, commercial Banks and other agencies.
The handling of increasing quantities of fertilizers will put pressure
on the storage and the handling facilities and transport. Products and
practices that improve fertilizer-use efficiency will need a special
encouragement. Fertilizer promotion will have to include activities that
promote not only increased rates of use but also better balances between
the nutrients and higher efficiency. Attention also needs to focus on the
availability of credit, an essential factor in ensuring the availability of
fertilizers to farmers.

71
India will continue to be a major importer of raw materials,
intermediates as well as finished products. The fertilizer product pattern is
unlikely to change in the near future, and Urea and DAP will continue to
dominate over fertilizer production. Attention will need to focus on
ensuring the availability of good-quality micronutrient fertilizers.
3.8. MARKETING OF FERTILIZERS
Peter Drucker strongly argues that "Marketing might by itself go far
towards changing the entire economic tone of the existing system without
any change in the methods of production distribution of population or of
income".
A similar view is expressed by W.J. Emlen, "Production may be the
door to economic growth of the developing nations, but marketing is the
key that turns the lock".
3.8.1. The Marketing Concept
Marketing concept is also an attitude by which products are matched
with markets. In its fullest sense, “the marketing concept is a philosophy
of business that states that the customers‟ want satisfaction is the economic
and social justification for a firm‟s existence”. With the growth of business
activities, the marketing concept underwent various orientations over a
period of time viz., the exchange, the production, the product, the sales, the
marketing and the societal marketing concepts.

72
3.8.2. The Marketing Mix
“The Marketing Mix is the term used to describe the combination
of the four inputs which constitute the core of a company‟s marketing
system – the product, the price structure, the promotional activities and the
distribution system” – Stanton.
The term, „Marketing Mix‟ is used to describe a combination of four
elements –the Product, the Price, the Physical distribution and the
Promotion. These are popularly known as “Four Ps”.
The Marketing Mix will have to be changed at the change of
marketing conditions like economical, political, social, etc. Marketing Mix
is developed to satisfy the anticipated needs of the identified markets. The
elements of Four Ps are interrelated with complementary and mutually
supporting ingredients. Thus Marketing Mix is used as a tool towards the
customers in order to ascertain their needs, tastes, preferences etc.
Marketing Mix must face competition. It must satisfy the demands of the
society. Then firms can attain the objectives- profit, market share, return
on investment, sale-volume and so on.
3.8.3. Fertilizer Market
Fertilizers are compounds which promote plant growth. Fertilizers
can be naturally-occurring compounds such as peat or mineral deposits, or
manufactured through natural processes (Composting) or chemical
processes (Haber process). A market is a social arrangement that allows
buyers and sellers to discover information and carry out a voluntary
exchange of goods or services. Fertilizer market is a typical example of

73
exploitation of potential of rural market. Marketing of fertilizers was
highly controlled by Government regulations in India.
Both Essential Commodities Act (ECA) and Fertilizer Control Order
(FCO) govern fertilizers. Under these Acts, fertilizers have to be marketed
only on the Generic name and not by any trade or Brand Name. What the
companies normally do is to add their company name with Generic name
like VIJAY Urea; in addition they also add a symbol or logo so that rural
consumers can recognize the brand.
In 1944, the Government of India established the “Central Fertilizer
Pool” as the official agency for the distribution of all available fertilizers at
fair prices throughout the country. All fertilizers, whether domestically
produced or imported, were pooled together and distributed through state
agencies. Fertilizer shortages in the early 1970s led the Government to
pass the Fertilizer Movement Control Order in 1973, which brought the
distribution of fertilizers under government control. With effect from 1
April 2003, the Government implemented the “New Fertilizer Policy”,
which allowed the Urea manufacturers to market initially 25 % and
subsequently 50 % of their production outside the purview of the
distribution control. The Urea, manufacturers can now market 50% of their
production as they wish. It is imperative to assure an adequate supply of
the fertilizer to strengthen the pace of the agricultural development as the
fertilizer occupies a pre-eminent position in the agricultural production. By
analyzing the special characteristics of the Fertilizer Marketing, its unique
features can be identified.
74
3.8.4. Special characteristics of Fertilizers Marketing
The product, the place, the price and the promotional activities
involved in the marketing of fertilizers have some special, unique
characteristics.
Markets for fertilizers are very large, but difficult to tap
The fertilizers markets in India are extensively vast in present size
and future potential. They hold out great opportunities for marketing
people. Studies conducted in several developing countries have not only
revealed that farm output has increased enormously in these countries in
the last ten or fifteen years, but also 75 per cent more of modern
agricultural inputs. It is true about India also. Though the markets for
fertilizers in India are large and attractive, marketing of these fertilizers is
highly difficult and complex operation. Its complexity arises from the
complexity inherent in converting traditional farming into a commercial
venture. In addition to this complexity, there are several special features
arising out of the inherent nature of fertilizers. The other special features
emanate from the market characteristics and infra-structural characteristics
that are peculiar to India.
Marketing of fertilizers is a specialized job
Today, all marketing experts concede that from the marketing
viewpoint "Consumer Goods", "Industrial Goods" and "Service" vary
considerably from one another. They recognize that marketing job in
respect of each of these three types of goods calls for certain specialized
knowledge, experience and background, even though the basic principles

75
and techniques of marketing will apply equally to all the types of goods.
This recognition has taken roots in India as well. Accordingly marketing
experts in all parts of the world accept that the Marketing of each of these
types of goods must be practiced as a specialized job.
The Fertilizer Market is unique
In the first place, the market for Fertilizers is quite different from the
urban consumer goods market where traditionally, the marketing men have
concentrated in all their efforts. The entire market for fertilizers is in the
rural areas and it is well-known that the characteristics of the rural market
are vastly different from the hose of the urban market. The rural
consumers, by and large are more cautious and skeptical in their
approaches to buying, their purchase decisions are slow and delayed.
There is significant difference in buyer motives, buying habits and buying
psychology between the rural and urban consumers. The rural consumers
in India are a "Study in contrast" from their urban counterparts. They like
to give a trial in the first instance and only on the basis of personal
satisfaction and conviction they are likely to adopt the product. The
consumer segments in the rural areas are extremely vast compared to the
urban segments. They are also scattered and disparate unlike the urban
consumers who are usually clustered closely.
The Fertilizer is unique
The products are quite unique like the consumers in marketing of
Fertilizers. The Fertilizer cannot be classified either with industrial goods
(producer goods) or with the consumer goods. Though it is in essence a

76
"producer goods", it is very different from the commonly producer goods.
As far as the consumer is concerned, the products are just with which,
hopefully, he seeks to increase his agricultural inputs group by itself is of
any help. Again the package of inputs has to be accompanied by a
"Package of Technology" since in real terms; it is the modern farm
technology which brings about the yield.
The agricultural inputs marketing may not be able to stop with
supply of the fertilizer or the pesticides. He has to transfer the technology
to the farming community along with the supply of his product to them. If
this is not done, the satisfaction expected from the purchase of the input
will not materialize. In real terms, the agricultural inputs salesman does
not sell any commodity at all. He sells the "technology of training". More
than that he sells "prosperity" to the farmer. He has to wean away the
farmer from traditional farming to modern farming. This requires continues
and integrated pre and after-sales service to the farmer. In fact the job does
not stop with mere training and technology transfer either. In the context of
India, a convention of farmer has to be accomplished before the modern
agricultural inputs are sold to him.
Distribution and Infrastructure
Marketers of fertilizers in India usually have to face a number of
problems in distribution infrastructure, such as storage, transport sub-
distribution and retailing. Reaching the rural consumers is a real challenge
unlike reaching the urban consumers. It will be far easier to reach 10,000
urban consumers than to reach 500 rural consumers, since the latter are so
much scattered. Transport facilities and communication facilities are

77
generally poor. Some parts of the market are just not accessible during
some periods of the year because of bad weather and other factors. Choice
of channel and development of outlets in the interior part of the dealers
pose a host of problems.
Promotion and Mass Communication Problems are Unique
Advertising, sales promotion and mass communication are perhaps
the most challenging parts of the marketing job in the rural areas of India.
The print media though available to an extent, has only a limited use,
because of the high degree of illiteracy. Other familiar communication
techniques also have limitations, in the rural context, in terms of reach cost,
coverage and effectiveness. Visual and Audio-visual media have generally
greater scope, so also "Word of mouth communication" through retail
dealers and opinion leaders. Rural marketing in India will involve many
innovations in promotion and mass-communication. Several new methods
and improvisations will have to be found and practiced. As marketing men
gain experience, revolutionary techniques are to emerge in rural mass
communication in India.
The adage that "Markets not found but built" is true for the rural
markets than for the urban markets of India. Thus, fertilizer is one of the
principal agricultural inputs. The marketing of this input is specialized jobs
since there have been several characteristics unique to this job.

78
Other Special Characteristics
Apart from the unique characteristics in terms of the market, the
product, the consumer, the distribution, the infrastructure, the promotional
and the communication techniques explained above, the fertilizers
marketing job is unique in several other prospects. The important among
them are personal selling techniques, pre-sale and after– sale service, credit
management, training of the dealers and so on.
3.9. FERTILIZER CONSUMPTION
In spite of the massive increase in fertilizer consumption, the fact
remains that fertilizers used per hectare of land in India is still much less
than in many countries of the world.
Constraints on Fertilizer Use
The major constraints on the fertilizer use can be identified as
follows:
1. High Prices of Fertilizers and shortage of Capital
The Small and Marginal Farmers do not use the fertilizers because of
their high prices. These farmers do not have enough capital to make this
type of investment in fertilizer use.
2. Risk Element
Risk element implies the fear of heavy losses in case of failure of
crops due to failure of rains. This sort of fear is experienced even by big
farmers.

79
3. Returns Non-remunerative
The use of fertilizers is considered non-remunerative in the case of
inferior cereals.
4. Non-availability of fertilizers
A significant proportion of farmers could not use fertilizers because
of their non-availability. This largely represents the failure of the delivery
system.
5. Regional Imbalances
While the above factors constitute the overall constraints on the
fertilizer use in the country, the differences across States/regions may be
attributed mainly to the following factors:
a) The uneven spread of HYV seeds;
b) Regional variations in the availability of irrigation facilities;
c) Differences in the type of irrigation facilities available in different
regions-fertilizer used per hectare has been observed to be higher in areas
irrigated by wells rather than in canal or tank irrigated regions;
d) Infrastructural disparities, specially relating to the following;
effectiveness of agricultural extension services, credit for purchasing
fertilizers, assured markets for output, and efficiency of fertilizer
distribution network.

80
6. Imbalanced Fertilization
Presently, there is no price parity among N, P and K fertilizer
considering the price per kg. of nutrient. Thus, the farmers are tempted to
use excess N as these are available comparatively at lesser price than P and
K. For maintaining the soil fertility and the crop productivity, balanced
fertilization is an absolute necessity.
3.10. FUTURE PROSPECTS
India's food grain requirement to feed the estimated population of
1,400 million by 2025 will be 300 million tonnes (based on rice, i.e.
unhusked paddy rice). There will be a corresponding increase in the
requirement of the other crops such as cotton, sugarcane, fruits and
vegetables. The country will require about 45 million tonne of nutrients (30
million tonnes for food grains and 15 million tonnes of nutrients for other
crops) from various sources of plant nutrients, i.e. fertilizers, organic
manures and bio fertilizers. The further increase in crop production will
have to come from an increase in yields as there is only a limited scope for
increasing the cultivated area. The yields of the majority of the crops are
relatively low and there is great potential for increasing them through the
increased use of inputs such as fertilizers.
The handling of increasing quantities of fertilizers will add pressure
on the storage, the handling facilities and the transport. Products and
practices that improve fertilizer-use efficiency will need special
encouragement. Fertilizer promotion will have to include activities that
promote not only increased rates of use but also better balances between

81
the nutrients and higher efficiency. Attention also needs to focus on the
availability of credit, an essential factor in ensuring the availability of
fertilizers to farmers. The fertilizer product pattern is unlikely to change
in the near future, and Urea and DAP will continue to dominate over
fertilizer production. Attention will need to focus on ensuring the
availability of good-quality micronutrient fertilizers. Fertilizer use will
remain a sure key to the future development of agriculture.

82
CHAPTER IV
FARMERS‟ TRIBULATIONS IN FERTILIZER CONSUMPTION
4.1. INTRODUCTION
“Life on a farm is a school of patience; we cannot hurry the crops
or make an ox in two days” - Henri Alain
The efficiency in the marketing of fertilizer can be determined by
two ways. First by assessing the companies‟ sales, market share, ability to
provide the fertilizer in time, in right quantity and at right price, facing the
competition and in rendering field service to the farmers.
Secondly the efficiency of the fertilizer marketing can be effectively
assessed in terms of the opinion of the farmers. Farmers are the ultimate
consumers of the fertilizers. The efficiency of marketing rests in the
availability of fertilizers at right price, at right time and at right quality.
4.2. ANALYSIS ON FARMERS‟ TRIBULATIONS
Whether the fertilizer is available easily and adequately can be
effectively analysed only through the opinion of farmers than the reports of
the companies manufacturing or marketing the fertilizer. Hence an attempt
is made in this chapter to evaluate the efficiency of the fertilizer marketing
in both Semi arid (Perambalur District) and Delta zone (Thanjavur District)
through the opinion of farmers.

83
In this chapter, the information relating to the source of procurement
of fertilizers, transport facilities, credit facilities, their brand preferences
etc. are given to understand the consumer behaviour in fertilizer marketing.
For the purpose of the research, this chapter is divided into three
sections
Section I Descriptive Analysis – Nature of Consumption
Section II Descriptive Analysis – Usage of Fertilizers
Section III Inferential Analysis – Hypotheses Testing
The farmers‟ tribulations have been analyzed with the help of the
statistical tools like Descriptive Analysis and Inferential Analysis.
ANOVA followed by Duncon Multiple Range Test had been made to
analyze the category-wise farmers‟ problems.
SECTION – I
4.3. Descriptive Analysis – Nature of Consumption
In this Section, the demographic features of the farmers, the crops
cultivated by them, the types of manures used, the amount spent on the
chemical fertilizers, the sources of procurement, their knowledge about the
authorized dealers, the type of the transport used to bring fertilizers have
been analyzed. More over the total cost of production, the cost of the
fertilizers, the transportation cost, the prices of the fertilizers, the sources of
credit etc., had also been analyzed in order to make out the nature of the
consumption pattern of farmers.

84

85
4.3.1. Age of the farmers
In this study the farmers are classified according to their age into
four categories namely less than 45 years, 45-50 years, 50-55 years and
greater than 55 years. The frequency distribution given in Table 4.1
presents the age details of farmers surveyed in both zones. (Semi arid zone
and Delta zone).
From the Table 4.1, it can be seen that in the semi-arid zone, 42% of
the farmers belong to the age group of 45 years to 50 years and 31% are in
the age group of 50 to 55 years. It is observed that 15% comprise farmers
in the age group above 55 years and 12 % are in the age group below 45
years. Hence it can be inferred that 73 % of the semi arid zone farmers are
in the age group of 45 years to 55 years. From the Table 4.1, it can be seen
that in Delta zone, 37 % of the farmers belong to 45 years to 50 years. The
age category 50 years to 55 years has 27 % of the farmers. It is found that
19% of the farmers are in the age group above 55 years and 17% are in the
age group below 45 years. So it is found that 64% of the Delta zone
farmers are in the age group of 45 to 55 years.
While making the comparative study in the Table 4.1, it is
understood that out of 1000 farmers, 396 farmers (53 % in Semi-arid and
47% in Delta) are in the age group of 45 years to 50 years and 287 farmers
(53% in Semi arid and 47% in Delta) are in the age category of 50 years to
55 years. Hence, it is concluded that the maximum number of farmers in
both the zones are aged between 45 years and 55 years.

86

87
4.3.2. Education of the Farmers
Education helps to keep the farmers aware of various schemes and
revolutionary methods in agricultural development. The farmers are
grouped into illiterates, those who have primary education, High school
education, H.Sc. education and graduation for the purpose of this study.
From the Table, 4.2., it can be seen that in Semi-arid zone, 30% of
the farmers in the sample have High School Education. 25% of the farmers
are graduates. 22% of the farmer respondents have passed their Higher
Secondary Course and 19% of the farmers have Primary Education. Only
4 % of the farmers are illiterates. Hence it is understood that most of the
farmers are educated in Semi-arid zone. The frequency distribution Table
4.2 depicts that in Delta zone, 39% of the farmers have High School
Education. 21% of the farmers have passed their Higher Secondary Course
and 20% of the farmers are Graduates. 17% of the farmers have Primary
Education. Only 3% of the farmers are Illiterates. Hence it is understood
that all the farmers except 3% are educated in Delta zone.
It can be noticed from the Table 4.2, that out of 1000 farmers, 343
farmers (43% in Semi-arid and 57% in Delta) have High School Education
and 217 farmers (51% in Semi-arid and 49% in Delta) have passed their
H.Sc. 223 farmers (56% in Semi-arid and 44% in Delta) are graduates.
Hence, it is concluded that from the sample units surveyed, the majority of
the farmers are educated.

88

89
4.3.3. Family members engaged in agriculture
The farmers are engaging their family members in agriculture. The
members are giving their contribution in the form of hard work in various
agricultural activities which are really helpful and supportive to the
farmers. The frequency distribution of family members of farmers engaged
in agriculture is shown in Table 4.3.
In Semi-arid zone, 40% of the farmers have engaged up to two
family members and 37% of the farmers have occupied three members and
only 20 % of the respondents have engaged more than three family
members. Hence it can be seen that most of the farmers (77%) have
affianced up to three members. In Delta Zone, 44% of the farmers have
engaged three family members in agriculture. 28% of the farmers have
engaged up to two family members and the same percentage (28%) of the
farmers have occupied more than three members. Hence it is understood
that most of the farmers (72%) have engaged three and more family
members.
Out of 1000 farmers, 404 (46% in Semi-arid zone and 54% in Delta
zone) farmers have been engaging up to three family members and 344
farmers (59% in Semi-arid zone and 41% in Delta zone) farmers have
engaged up to two family members in agriculture. 252 farmers (44% in
Semi-arid zone and 56% in Delta zone) have engaged more than three
members. Hence it is understood that in the Delta zone more farmers have
been engaging up to three and more compared to the Semi-arid zone
thereby the farmers can avoid labour-related issues.

90
Table 4.4
Crops Cultivated By Farmers
Crops
Semi arid zone Delta zone
Total Number of
Farmers
Per-
centage
Number of
Farmers
Per-
centage
Paddy- Yes
No
406
94
81.2
18.8
500
-
100.0
-
906
94
Urid Dhal- Yes
No
322
178
64.4
35.6
404
96
80.8
19.2
726
274 Maize/coconut-Yes
No 322
178
64.4
35.6
280
220
56.0
44.0
492
508
Groundnut- Yes
No
363
137
72.6
27.4
148
352
29.6
70.4
511
489
Chillies/ - Yes
Sugarcane No
318
182
63.6
36.4
240
260
48.0
52.0
558
442
Toordhal and -Yes
Pulses No
333
167
66.6
33.4
206
294
41.2
58.8
539
461
Total 500 100.0 500 100.0 1000
Source : Primary Data
From the Table 4.4, it can be seen that various crops are cultivated
by the farmers in both the zones. The crops which are cultivated by the
farmers differ in each zone because of the soil nature and agricultural
practice.
As Delta zone is made up of wet lands, all the 500 respondents have
been cultivating paddy whereas in Semi-arid zone, 81 % of the farmers
have been cultivating paddy because it is made up of dry lands. In Semi-
arid zone, 322 farmers, (64 %) and in Delta zone, 404 (81%) have been
cultivating urid dhal. It is cultivated more by Delta farmers because before
the harvest of paddy, in Delta zone the farmers will sow the urid dhal in

91
their wet field simultaneously whereas in Semi-arid zone after the harvest
of paddy, the farmers will do the reclamation and cultivate the urid dhal.
65% of the farmer respondents have been cultivating Maize in Semi-arid
zone and 56% of the farmers have been cultivating coconut in Delta zone.
Groundnut is cultivated by 73% of the farmers in Semi-arid zone and
30% of the farmers in Delta zone. It is cultivated more in the Semi-arid
zone because there is no need for regular water supply like paddy. So the
Semi-arid farmers have been concentrating more on this cash crop.
Chillies are cultivated in Semi-arid zone; especially Perambalur
District is famous for chillies. Sugarcane is cultivated in Delta zone which
has been giving raw materials to the sugar factories. Out of 500
respondents 318 farmers (64%) have been cultivating chillies. Especially
small and medium farmers have more interest in producing chillies because
they can get more yields from this cultivation.
In Delta zone 48 % of the farmers have been cultivating sugarcane.
Toordhal and other pulses have been cultivating in both the areas. In the
Semi-arid zone, 67 % of the farmers have been cultivating toordhal and
other pulses. The cultivation in Delta zone is 41%. More number of
farmers have been cultivating in Semi-arid zone because they can produce
both groundnut and other pulses together in the same field.

92

93
4.3.5. Types of Manures used
Farmers are using the chemical fertilizers and indigenous manures
like cow dung; compost etc. to give nourishment to their lands. The Table
4.5 depicts the frequency distribution of various types of manures used by
the farmers.
From the Table 4.5, it can be seen that 70% of the farmers have been
using both chemical and indigenous manures to get more yield from their
land. Only 30% of the farmers have been using only chemical fertilizers.
So in the Semi-arid zone, the majority of the farmers have been using both
chemical and indigenous manures. It is inferred from the Table 4.5 that
81% of the farmers have been using both chemical and indigenous manures
in their fields and 19% have been using only chemical fertilizers. In Delta
zone, one-fourth of the total respondents have been using chemical
fertilizers only and remaining three-fourth of the farmers have been are
using both chemical and indigenous manures.
It can be seen from the table 4.5 that out of 1000 respondents 151
Semi-arid farmers (61%) and 97 Delta farmers (39%) have been using
chemical fertilizers only. This indicates that exclusive chemical fertilizer
usage is more in Semi-arid zone compared to Delta zone. But in both the
zones, most of the farmers have been using chemical and indigenous
manures together. Therefore it can be rightly stated here that the use of the
chemical fertilizers has become imperative and farmers have been using
indigenous manures to get an increase in the yield.

94

95
4.3.6. Amount spent on chemical fertilizers
Fertilizers should be applied once immediately before transplantation
and twice after the transplantation at regular intervals of 15 to 30 days.
Depending upon the size of their landholdings, the farmers are spending for
chemical fertilizers.
Table 4.6 shows the frequency distribution of the amount spent on
the chemical fertilizers. It can be seen that 43% of the farmers studied spent
on the chemical fertilizers from Rs.10,001 to Rs.15,000. The amount spent
ranging from Rs.5001 to Rs.10,000 constitutes 25% of sample units. 18%
of the farmers spent up to Rs.5,000 and 13% of the farmers spent more than
Rs.15,000. In Semi-arid zone, more number of farmers have been spending
ranging from Rs.10,001 to Rs.15,000.
In Delta zone, 25% of farmers have been spending from Rs.5,001 to
Rs.10,000 and the amount spent ranging from Rs.10,001 to Rs.15,000
constitutes the same percentage (27%). 25% of the farmers spent upto
Rs.5,000 and 20% of the respondents spent more than Rs.15,000. In Delta
zone, the farmers have been spending for chemical fertilizers depending
upon the size of their landholdings.
Out of 1000 respondents, 354 farmers (61% in Semi-arid and 39% in
Delta) spent from Rs.10,000 to Rs.15,000 and 260 farmers (48% in Semi-
arid and 52% in Delta) spent from Rs.5001 to Rs.10,000. In Semi-arid
zone, the farmers had been spending more than Delta zone for chemical
fertilizers in order to increase the fertility of land.

96

97
4.3.7. Sources of procurement of fertilizers
The farmers have been purchasing fertilizers from various sources
such as private dealers, co-operative market, Agricultural depots. They are
selling seeds and pesticides and agricultural machinery and implements
also. The frequency distribution of various sources of procurement of
fertilizers is shown in Table 4.7.
In the Semi-arid zone, as many as 67% of the farmer respondents
have been purchasing fertilizers from private dealers which constitutes
medium and big farmers large in number. 26% of the farmers (more no. of
marginal and small farmers) have been procuring from the co-operative
market. Only 6% of the respondents got fertilizers from the agricultural
depots. Thus it is found that in the Semi-arid zone, the majority of the
farmers have been procuring the fertilizers from the private dealers.
In the Delta zone, 60% of the farmers have been procuring fertilizers
from co-operatives. 33% of the farmers have been purchasing fertilizers
from private dealers. 7 % of the respondents have been procuring from the
agricultural depots. The majority of the farmers have been purchasing
fertilizers from co-operative markets. Out of 1000 farmers, 503 farmers
(67% in Semi-arid and 33% in Delta) have been purchasing fertilizers from
the private dealers. 430 farmers (30% in Semi-arid and 70% in Delta)
have been procuring fertilizers from co-operatives. In Delta zone most of
the farmers have been procuring fertilizers from co-operatives and in Semi-
arid zone the majority of the farmers have been purchasing from the private
dealers.

98

99
4.3.8. Total cost of production
The farmers are spending money for the procurement of inputs
(seeds, fertilizers, pesticides) engagement of labour in various stages
(reclamation, weeding, harvest etc.) transportation and other expenses
together calculated as total cost. The frequency distribution of total cost of
production is shown in the table 4.8.
In Semi-arid zone, 30% of the farmers‟ total cost falls under the
category of Rs.15,001 to Rs.30,000 followed by 28% of farmers who have
been spending for cultivation from Rs.31,000 to Rs.45,000. 25% of the
farmers spent up to Rs.15,000 and 17% of the farmers spent above
Rs.45,000. 58% of Semi-arid farmers‟ total cost of production range from
Rs.15001 to Rs.45,000.
In the Delta zone, 31% of the farmers have been spending up to
Rs.15,000 and 25% of the farmers spent ranging from Rs.30,001 to
Rs.45,000. The total cost of production of 24% of the farmers falls in
Rs.15,001 to Rs.30,000 range. 19% of the farmers spent above Rs.45,000.
In the Delta zone, the farmers have been spending depending upon the size
of their landholdings.
Out of 1000 farmers, 282 farmers (44% in Semi-arid and 56% in
Delta) spent up to Rs.15,000.The cost of production in two categories
Rs.15001 to Rs.30000 and Rs.30001 to 45000 have been more in Semi-arid
zone which is above 50% than Delta zone . The farmers have been
spending more in the Semi-arid zone than the Delta zone for cultivation.

100

101
4.3.9. Knowledge about the Authorized Dealers
The knowledge of the farmers about the Authorized Dealers of
fertilizers must be underlined. Whether the farmers have knowledge about
the Authorized Dealers of fertilizers or not is given in table 4.9.
From the Table 4.9, it can be seen that 85% of the farmers are
unaware of the Authorized Dealers of fertilizers of their brand preferences
who have been giving the fertilizers at reasonable price at all times. Only
15% of the farmers knew the Authorized Dealers of their brand
preferences. A maximum number of farmers have no idea about the
authorized dealers in the Semi-arid zone.
It is analyzed from the Table 4.9 that 67% of Delta farmers have no
idea about the authorized dealers of their brand preferences and 33% of
farmer respondents have awareness about the authorized dealers. They
knew them and purchase fertilizers from the authorized dealers. Hence it is
found that in Delta zone majority of the farmer respondents unaware of the
authorized dealers.
Out of 1000 farmers 241 farmers (32% Semi-arid and 68% in the
Delta zone) only knew about the Authorized Dealers of their brand
preferences. More Delta farmers are aware of the Authorized Dealers
compared to Semi-arid zone farmers. Had the farmers been able to
purchase from Authorized Dealers, the price would have been less
compared to the other retailers.

102

103
4.3.10. Transport cost of fertilizers
The farmers have to bring the fertilizers from the purchasing point to
their field. Table 4.10 shows the details of transport expenses met out by
the farmers to bring the fertilizers.
From the Table 4.10, it can be seen that in semi arid zone 43% of the
farmer respondents paid Rs.5 per bag for transport charges for fertilizers.
23% of the farmers paid Rs.6 per bag followed by 22% of the farmers who
were not using any transport as they carried the fertilizers on their head.
The remaining 13% of the farmers paid Rs.4 per bag for the transportation
of fertilizers. More number of Marginal and Small Farmers have been
spending either Rs.5 per bag as transport cost or no cost in Semi-arid zone.
It is referred from the Table 4.10 that in the delta zone, as many as
41% of the farmers spent Rs. 5 per bag for transportation. 24% of the
farmer respondents spent Rs.6 per bag for transport charges. 21% of the
farmers did not use any transport to carry their fertilizers. 14% of the
farmer respondents paid Rs.4 per bag for transportation. In the Delta zone
also like the Semi-arid zone, the Marginal and Small Farmers did in both
the ends paid either Rs.5 per bag or no cost for transportation.
Out of 1000 farmer respondents, 418 farmers (51% in Semi-arid
zone and 49% in the Delta zone) spent Rs.5 per bag for transportation
expenses. In both zones the farmers have been spending more or less the
same amount for transport expenses. Most of the farmers spent Rs. 5 per
bag as the transportation cost.

104

105
4.3.11. Transport used to bring fertilizers
The modes of transport used by the farmers to get the fertilizers are
given in the Table 4.11. The fertilizers purchased by the farmers were
taken by heads where purchases were made from the nearest purchasing
points and by bullock carts and motor vehicles where the purchasing points
were located away from their end.
In Semi-arid zone 42% of the farmer respondents used bullock carts
and 36% of the farmer respondents used motor vehicles to bring fertilizers.
The remaining 22% of the farmers took away fertilizers as head load. In
Semi-arid zone, most of the marginal and small farmers carried fertilizers
by bullock carts and by head loads. Most of the big farmers used motor
vehicles to bring fertilizers. In the Delta zone 41 of the farmer respondents
used bullock carts and 39% of the farmers used motor vehicles to bring
fertilizers. 21% of the farmers carried the fertilizers by head load. In Delta
zone also, most of the Marginal and Small Farmers carried fertilizers in
bullock carts and as head load. Most of the Medium and Big Farmers used
motor vehicles to bring fertilizers.
Comparatively, out of 1000 respondents, 414 farmers (50% each in
both zones) used bullock carts and 375 farmers (49 % in Semi-arid zone
and 51% in Delta) used motor vehicles to bring fertilizers to their end. 214
farmers (51% in Semi-arid and 49% in the Delta) took the fertilizers as
head load. It is seen from the Table that the majority of the BF in both the
zones has been using motor vehicles to bring fertilizers. The MF and SF
mostly used bullock carts to carry the fertilizers.

106

107
4.3.12. Distance covered in transportation
The distance travelled by the farmers to purchase the fertilizers is
shown in table 4.12. The farmers have to travel from their field to the shop
to procure the fertilizers.
From the table 4.12, it is understood that in Semi-arid zone, 37% of
the farmer respondents have to travel 7 to 8 kms and 29% of the farmer
respondents have to travel 5 to 6 kms to purchase the fertilizers. 24% of
the farmers travel less than 4kms and 10% of the farmer respondents have
to travel more than 8 kms to procure the fertilizers. In the Semi-arid zone,
most of the farmers have to travel 5 to 8 kms.
In the Delta zone, 39% of the farmers have to travel 5 to 6 kms and
38% of the farmer respondents have to travel 7 to 8 kms to purchase the
fertilizers. 23% of the farmer respondents have to travel less than 4 kms
and 8% of the farmers have to travel more than 8 kms. In Delta zone, most
of the farmers have to cover the distance from 5 to 8 kms to purchase the
fertilizers.
Out of 1000 farmer respondents, 375 farmers (50% in each zone)
have to travel 7 to 8 kms to purchase the fertilizers. 299 farmers (48% in
Semi-arid and 52% in the Delta) have to travel 5 to 6 kms to get the
fertilizers. In both the zones, most of the farmers have to travel almost
equal distance i.e., 5 kms to 8 kms to purchase the fertilizers irrespective of
the size of their landholdings.

108

109
4.3.13. Prices of the Fertilizers
Whether the fertilizers are sold to the farmers at the same price or at
different prices and the additional amount paid by them are shown in Table
4.13. If the farmers could not get the fertilizers at control price they are
forced to purchase by paying premium to get the fertilizers. It is due to
credit purchases or non availability of specific fertilizers.
Within Semi-arid zone most of the farmers about 68% have paid
more than the control price. Only 32% have been able to get the fertilizers
at the control price. While analyzing the various categories, it has been
found that out of 125 farmers in each category ( MF and SF) 99 Marginal
Farmers and 91 Small Farmers have been getting fertilizers more than the
control price. Within the Delta Zone, 55% were able to get the fertilizers
at the control price and remaining 45% cannot get it. More number of
Small and Marginal farmers has been paying more than the control price.
In the Semi-arid zone, more number of farmers (340 farmers) has been
getting the fertilizers more than the control price compared to the Delta
zone (276).
While analyzing the premium, out of 340 farmers 57% of the Semi-
arid farmers paid Rs.3 followed by 56% paid Rs.2 as a premium per bag.
In the Delta zone out of 276 farmers 49% paid Re.1 per bag, 44% paid
Rs.2 per bag as premium and 42% paid Rs.3 per bag more than the control
price. The Delta zone is better than the Semi-arid zone by selling the
fertilizers at the control price and in zones, more number of MF and SF
have been paying more than the control price to procure the fertilizers.

110

111
4.3.14. Farmers availing credit for the purchase of the fertilizers
The farmers are getting credit for the purchase of the fertilizers.
They have many sources to get finance. They depend others even for
purchasing seeds, fertilizers etc. The number of farmers availing credit for
the purchase of the fertilizers is shown in Table 4.14.
The Table 4.14 shows the nature of the purchases of the fertilizers by
the farmers. Within Semi-arid zone, out of 500 sample farmers surveyed
377 (75%) were getting on credit and 25% of the farmer respondents were
purchasing fertilizers with their own fund. While analyzing the various
categories of farmers, it can be seen that more number of MF and SF (113
MF and 101 SF out of 377) has been getting credit for the purchase of
fertilizers compared to Me.F and B.F.
Within Delta zone 73% of the farmers were getting credit and 27%
were not receiving credit for the purchase of fertilizers. Like Semi-arid
zone, in Delta zone also more number of MF and SF (115 MF and 111 SF
out of 363) were getting credit to purchase the fertilizers.
In both the zones, more than 70% of the farmers were getting credit
for the purchase of the fertilizers. Among them, Marginal and Small
farmers are more in number. The farmers were unable to make cash
purchases. It may lead to the delay in the application of the fertilizers and
force the farmers to forego their brand preference as their bargaining power
gets reduced due to the credit purchases.

112

113
4.3.15. Sources of credit for the purchase of fertilizers
The source from which the farmers were obtained credit to make the
purchases of fertilizers can be seen from the above table 4.15.
Out of 740 farmers, 92 farmers (24%) in Semi-arid zone and 71
farmers (20%) in Delta zone took credit from the money lenders.
Comparatively, in Semi-arid zone more number of farmers got credit from
money lenders. 141 farmers (37%) in Semi-arid zone and 150 farmers
(41%) in the Delta zone obtained credit from their friends and relatives.
Comparatively, in the Delta zone more number of farmers got credit from
their friends and relatives than in the Semi-arid zone.
The co-operatives have been giving credit in the form of seeds,
fertilizers, cash credit etc. in both the zones. 116 farmers (31 %) in the
Semi-arid zone and 121 farmers (33 %) in the Delta zone obtained credit
from the co-operatives. 178 farmers (47%) in the Semi-arid zone and 168
farmers (46%) in the Delta zone obtained credit from commercial banks.
The farmers are getting the credit facilities equally in both the zones by the
commercial banks.
In both the zones, more number of Marginal and Small farmers got
credit from money lenders compared to other sources. The Medium and
the Big farmers taking credit from money lenders are less in number . Co-
operatives are the next major source for getting credit.

114
Table 4.16
Problems Encountered By Farmers in Procurement of Fertilizers
Problems in
procurement of
fertilizers
Semi-arid Zone Delta Zone
Mean Rank Mean Rank
Price 4.17 2 4.06 1
Place 3.27 6 3.19 5
Transport 3.30 5 3.28 4
Credit 3.95 3 3.75 3
Quality 3.31 4 3.09 6
Availability 4.24 1 3.97 2
Source : Computed by the Researcher
Farmers face various types of problems. The opinion of farmers on
the problems faced in obtaining fertilizers was got and the results are given
in the above Table 4.16 and ranked as per their mean values.
In the Semi-arid zone, the first problem is the non-availability of the
fertilizer showing 4.24 as mean value followed by price problems, i.e.,
unable to get the fertilizers at the control price which shows 4.17 mean
value and ranked as the second problem. Credit problems show the mean
value 3.95 and Quality dissatisfaction shows the next lesser mean value of
3.31. Transport and Place problems show the less significant mean values
of 3.30 and 3.27 respectively. In the Delta zone price problems are ranked
as the first problem showing 4.06 mean value followed by the non-
availability (3.97 mean values). The third problem is the Credit problem

115
(3.75) and the next is the transport problem (3.28). Place and Quality show
the better results and they bagged 5th and 6th
positions respectively.
It is an interesting fact to note that all the problems in Semi-arid zone
show more mean values compared to the Delta zone. So it can be
concluded that in Semi-arid zone more number of farmers face the
problems in procuring the fertilizers compared to the Delta zone.
SECTION II
4.4. Descriptive Analysis – Fertilizer Usage
It is generally accepted that any future growth in the agricultural
production which is very necessary to reach the increasing demand of food
grains due to increase in population has to come essentially from a higher
productivity. Fertilizers are taken as a major input for improvement in the
productivity of agriculture. The farmers are rational in purchase and use of
inputs such as fertilizers based on their experience. Fertilizers constitute a
major part of the cost of cultivation along with other inputs such as human
and bullock labor, seeds and pesticides. The main factors which have been
influencing fertilizer usage are soil type, crops grown, amount and pattern
of rainfall and availability of credit.
In this section, the timings of application of fertilizers, the reasons
for delay, the changes in the yield due to delay , usage of nutritious
fertilizers, preference and usage of DAP and Urea Brands have been
discussed. If the fertilizers have not been applied in the right time, there
may be chances to decrease the yield. Hence the farmers must be able to

116
get the fertilizers at right time and at right place in order to avoid the delay
in the application of the fertilizers. The opinion of the farmers about the
popularity among the sources of supply has also been analyzed.
Table 4.17
Timings of Application of Fertilizers
Application of
fertilizers at right
time
Semi-arid Zone Delta Zone
Total
Number of
Farmers
% Number of
Farmers
%
Yes 206 41.20
(41.37)
292 58.40
(58.63)
498
No 294 58.80
(58.57)
208 41.60
(41.43)
502
Source : Primary Data
Figures in the Parentheses indicate row percentage (Semi-arid Zone vs. Delta Zone).
The Fertilizers should be applied once immediately before the
transplantation and two times after the transplantation at regular intervals
of 15 to 30 days. If there is any delay in the application, it would definitely
affect the yield. Whether the farmers had been applying the fertilizers in
time or in delay can be analyzed from the above Table 4.18.
The Researcher invited 1000 respondents and it was observed that
502 farmers (294 in the Semi-arid zone and 208 in the Delta zone) could
not apply fertilizers in time (59 % in Semi-arid and 41 % in the Delta) due
to various reasons. While comparing with the Delta zone, it was found that
as many as 59 % of the Semi-arid zone farmers could not apply the
fertilizers in time and it was 41 % in the Delta zone.

117

118
Reasons for Delay in Application of Fertilizers
The Table 4.18 reveals that out of 1000 respondents, 883 farmers
(51 % in the Semi-arid and 49 % in the delta) have been having the non-
availability problem. As farmers were conscious about their brand loyalty
which renders them delaying the application of fertilizers. 89 % in the
Semi-arid and 87 % in the Delta farmers have non- availability problem.
403 farmers (61% in the Semi-arid and 39 % in the Delta) have the
labour problem. Even though the farmers made everything to be ready,
still they could not get the required number of labourers which is another
problem and the major reason for the delay in application of fertilizers in
both the zones. Within the zone, 49 % in the Semi-arid and 32 % in the
Delta have the shortage of labour problem. 301 farmers (51 % in the
Semi-arid and 49 % in the Delta) are having transport problem. The
Places of difficult access and lack of good road facilities are the main
reasons for the transport problem. The delay was due to the financial
problem for 422 farmers (54 % in Semi-arid and 46 % in the Delta).
Within the zone, 45 % in Semi-arid and 46 % in Delta zone have the credit
problem. If finance is ensured and the delay is avoided, there would have
been a significant increase in the yield.
The farmers have to depend on the favourable climatic conditions
needed for their cultivation. Out of 1000 respondents 599 farmers (51 % in
the Semi-arid and 49 % in the Delta) had climatic condition as the problem.
Within the zone 61 % in the Semi-arid and 59 % in the Delta have to face
the problems due to climatic conditional changes.

119
Table 4.19
Changes in the Yield Due To Delay
Source : Primary Data
If the farmers do not apply the fertilizers in time, it will make
changes in the yield. From the above Table 4.19, it is found that all 1000
farmer respondents (500 in the Semi-arid and 500 in the Delta) are agreeing
that the yield will decrease due to the delay in the application of the
fertilizers. 155 farmers told that due to the delay, the quantity of the
fertilizers usage increased. It is 19 % in the Semi-arid and 12 % in the
delta zone. By denying the “no change” criteria as 100 % in both the zones,
all the farmers in both the zones, ensured that there is a change in the yield
due to the delay in the application of the fertilizers.
Ch
anges
due
to d
elay
Semi-arid Zone Delta Zone
To
tal
Num
ber
Co
lou
mn
%
Row
%
Num
ber
Co
lou
mn
%
Row
%
Yield decreased
Yes
500
100.00
50.00
500
100.00
50.00
1000
Total 500 100.00 50.00 500 100.00 50.00 1000
Quantity of
fertilizers
increased
Yes
No
93
407
18.60
81.40
60.00
48.17
62
438
12.40
87.60
40.00
51.83
155
845
Total 500 100.00 50.00 500 100.00 50.00 1000
No change No 500 100.00 50.00 500 100.00 50.00 1000
Total 500 100.00 50.00 500 100.00 50.00 1000

120
Table 4.20
Usage Of Nutritious Fertilizers By Farmers
Use
d
nutr
itio
us
fert
iliz
ers
Semi-arid Zone Delta Zone
To
tal
Num
ber
Co
lou
mn
%
Row
%
Num
ber
Co
lou
mn
%
Row
%
Yes 80 16.00 31.62 173 34.60 68.38
25
No 420 84.00 56.22 327 65.40 43.78 747
Total 500 100.00 50.00 500 100.00 50.00 1000
Respondents‟ opinion about the usage of nutritious fertilizers
Yield
increased
80 100.00 31.62 173 100.00 68.38
253
Total 80 100 31.62 173 100.00 68.38 253
Source : Primary Data
The nutritious fertilizers are helpful to increase the yield. The
knowledge of the farmers about these nutritious fertilizers is described in
the above table. Moreover, the opinion of the respondents about the usage
of the nutritious fertilizers has also been given.
From the Table 4.20, it is inferred that out of 1000 respondents, 747
farmers (56 % in the Semi-arid zone and 44 % in the Delta zone) never
used nutritious fertilizers in their fields. 253 farmers (32% in the Semi-arid
and 68 % in the Delta zone) have been using the nutritious fertilizers. In
the Delta zone as many as 173 farmers have been willing to accept and
apply the nutritious fertilizers in their field compared with the Semi-arid
zone. From the Table 4.20, it is analysed that all the 253 farmers (80 in

121
the Semi-arid and 173 in the Delta) accept that the yield has been increased
because of the usage of nutritious fertilizers.
It is understood from the Table that the nutritious fertilizers are
capable of increasing the yield as it is shown as 100 % accepted in both the
zones that the yield is being increased and there is no difference of opinion
from any single farmer.
Table 4.21
Preference And Usage Of Dap Brands
Bra
nd
pre
fere
nce
Semi-arid Zone Delta Zone
To
tal
Num
ber
Co
lou
mn
%
Row
%
Num
ber
Co
lou
mn
%
Row
%
SPIC
327 65.40 50.54 320 64.00 49.46 647
IFFCO 150 30.00 48.54 159 31.80 51.46 309
Fact
23 4.60 52.27 21 4.20 47.73 44
Total 500 100 50.00 500 100 50.00 1000
Actual Usage of DAP Brands
IFFCO 500 100 50.00 500 100 50.00 1000
Total 500 100 50.00 500 100 50.00 1000 Source : Primary Data
The farmers use different types of chemical fertilizers. The DAP
brands preferred by the farmers are shown in the above Table. Out of 1000
farmers, 647 farmers (51 % in Semi-arid and 49 % in delta) gave
preference of SPIC DAP. 309 farmers (49 % in the Semi-arid and 51 %
in the Delta) preferred IFFCO, the co-operative undertaking. Fact DAP is

122
preferred by 44 farmers. In both the zones, the farmers have the same
brand preference as more preference is given to SPIC but due to some
reasons, the company had closed its production.
DAP is being issued by IFFCO only and the distribution by other
brands are fully banned in Tamil Nadu by the Government. The farmers
prefer some brands. But some of them have been using some other brands
other than their preference due to various reasons. Whether there is any
difference between the brands of DAP preferred and the brand actually
used by the farmers is explained in the above Table. IFFCO stands as a
monopoly in total marketing of DAP in the State during the study period.
Table 4.22
Preference of Urea Brands
Bra
nd
pre
fere
nce
Semi-arid Zone Delta Zone
To
tal
Num
ber
Co
lou
mn
%
Row
%
Num
ber
Co
lou
mn
%
Row
%
SPIC
63 12.6 34.24 121 24.2 65.76 184
FACT 165 33.0 46.88 187 37.4 53.12 352
Vijay
223 44.6 57.77 163 32.6 42.23 386
Others
49 9.8 62.82 29 5.8 37.18 78
Total 500 100 50 500 100 50 1000
Source : Primary Data

123
The above Table 4.22 stated the preference given by the farmers for
Urea Brands. In the case of Urea the Semi-arid zone farmers preferred
Vijay Urea more in number when compared to the Delta Zone. More
number of farmers in the Delta zone gave preference to buy FACT Urea.
45% of the farmers of Semi-arid zone gave preference to purchase Vijay
Urea which stood at first place. 33% preferred FACT Urea and 12% were
ready to buy SPIC Urea and the remaining 10% was preferred by others.
As far as the Delta zone is concerned, 37% of the farmer respondents have
chosen FACT Urea followed by Vijay Urea that was preferred by 33% of
the farmers. 24% gave preference to purchase SPIC Urea and only 6%
preferred to buy others. Comparatively in the Delta zone more farmers
preferred to purchase FACT Urea and Semi-arid zone preference was given
by more farmers for Vijay .
Table 4.23
Usage of Urea Brands
Bra
nd
pre
fere
nce
Semi-arid Zone Delta Zone
To
tal
Num
ber
Co
lou
mn
%
Row
%
Num
ber
Co
lou
mn
%
Row
%
IFFCO
98
19.6
41.35 139 27.8
58.65
237
FACT 81 16.2 47.09 91 18.2 52.91 172
Vijay
321 64.2 54.31 270 54.0 45.69 591
Total 500 100 50.00 500 100 50.00 1000
Source : Primary Data

124
The actual brand of Urea used by the farmers irrespective of their
preference is stated in the above Table 4.23. It can be seen that Vijay
stood as the first in the Semi-arid and the Delta zone and became the
market brand leader of Urea in the study area. Out of 500 farmers
surveyed in the Semi-arid zone, most of the farmers i.e., 64% consumed
Vijay Urea. IFFCO Urea is used by 20% of the farmer respondents. Only
16% purchased FACT.
In the Delta zone, 54% of the farmers were purchasing Vijay Urea
which is the market leader in Thanjavur District and also in the distribution
of Urea. 29% of the respondents were given IFFCO Urea and 18% of the
farmers bought FACT Urea even though they gave preference to buy it. It
is investigated that the FACT Company has the scope to extend its
marketability. In both the districts, Vijay is the market dealer of Urea and
it has been giving uninterrupted supply of Urea fertilizers.
Table 4.24
Best Source of Supply of Fertilizers
Best Source of Supply
Semi-arid Zone
Delta Zone
Mean Rank Mean Rank
Open - Market 4.05 1 3.50 2
Co-operatives 2.94 3 3.55 1
Agricultural depots 3.07 2 3.31 3
Computed by the Researcher

125
The farmers can get fertilizers from many sources such as Open
Market, Co-operatives and Agricultural Depots. The opinion of the
farmers regarding the best source of supply of fertilizers in their area has
been depicted in the above Table 4.24 by giving their Mean values and
Ranks.
In the Semi-arid zone, the first choice of the farmers are Open-
Market or private traders which shows the highest Mean value (4.05) even
though the prices of fertilizers were high because retailers were the most
accessible source. The second most popular source was the Agricultural
Depots having the Mean value of 3.07. The final choice of the popularity
of sources is co-operatives.
In the Delta zone, the co-operatives bagged the first rank as the most
accessible best source (Mean value 3.55) followed by the Open Market
(Mean value 3.50). Agricultural Depots stood in the third position.
Hence it is found out that the best source as per the farmers‟ opinion
survey in the Semi-arid zone is private dealers and in the Delta zone is co-
operative societies.
SECTION III
4.5. Inferential Analysis on Farmers –Testing of Hypotheses
HYPOTHESIS – 1
Null Hypothesis: There is no significant difference between the types of
manures used with regard to the overall yield per acre.

126
Alternate Hypothesis: There is a significant difference between the types
of manures with regard to the overall yield per acre.
Table 4.25
„t‟ Test for Types of Manures used
Types of
Manures used
Number of
cases
Mean S.D T
value
P
value
Chemical
Fertilizers 248 11818.75 9644.63
2.79
0.005** Chemical and
indigenous
Fertilizers
752 13888.09 10281.86
Computed by the Researcher
Note : ** denotes significant at 1% level
Since the „P‟ value is less than 0.01, the null hypothesis is rejected at
1% level of significance. Hence it is proved that there exists a significant
difference between the types of manures used with regard to the overall
yield per acre. While analyzing the table 4.25, it is shown that the
application of only the chemical fertilizers has the Mean value of 11818.75.
While using both chemical and indigenous manures the Mean value is
13888.09. The usage of only chemical fertilizers shows the less mean
value. It is proved that there is a significant increase in the yield due to the
application of both chemical and bio fertilizers, instead of the chemical
fertilizers alone which has the lesser mean value.
HYPOTHESIS – 2
Null Hypothesis: There is no relationship between the preference and the
usage of Urea.

127
Alternate Hypothesis: There is a relationship between the preference and
the usage of Urea.
Table 4.26
Chi-Square Test for relationship between Preference &Usage of Urea
Preference
of Urea
Usage of Urea
Total
Chi-
square
Value
P
Value IFFCO FACT Vijay
SPIC
50
(27.2)
[21.1]
36
(19.6)
[20.9]
98
(53.3)
[16.6]
184
87.633
0.000 **
FACT
73
(20.7)
[30.8]
46
(13.1)
[26.7]
233
(66.2)
[39.4]
352
Vijay
114
(29.5)
[48.1]
90
(23.3)
[52.3]
182
(47.2)
[30.8]
386
Others
--
--
78
(100.0)
[13.2]
78
Total 237 172 591 1000
Computed by the Researcher
Note: The value within ( ) refers to Row Percentage, [ ] column percentage
** denotes significant at 1% level
Since the „P‟ value is less than 0.01, the null hypothesis is rejected at
1% level of significance. Hence it is proved that there is a relationship
between the preference and the usage of Urea. The above Table 4.26 shows
that the preference given for SPIC is 27.2 % but there is no usage because
the production has been stopped.
About 21% of the farmers have been using IFFCO Urea without
giving preference. Similarly the preference for FACT is 20.7, but the
usage is as high as 30.8%. The preference for Vijay Urea is 29.5 %, but the

128
usage is as high as 48.1%. Therefore it can be concluded that the farmers
are not given their preferred brands of fertilizers.
HYPOTHESIS – 3
Null Hypothesis: There is no significant difference between usages of
nutritious fertilizers with regard to yield.
Alternate Hypothesis: There is significant difference between usages of
nutritious fertilizers with regard to yield.
Table 4.27
„t‟ Test for Nutritious Fertilizers used
Usage of
nutritious
fertilizers
Number
of cases
Mean S.D. t
value
P
value
Using 253 16579.84 8463.62
5.90
0.000 **
Not using 747 12289.42 10461.04
Computed by the Researcher ** denotes significant at 1% level
Since the „P‟ value is less than 0.01, the null hypothesis is rejected at
1% level of significance. Hence it is concluded that there is a significant
difference between the usages of the nutritious fertilizers with regard to the
yield. From the above Table 4.27, it is seen that the Mean value of the
yield while using the nutritious fertilizers is 16579.84 and the mean value
for not using is 12289.42. It is clear that when the farmers use the
nutritious fertilizers, the mean value is more compared to the Mean value
for not using the nutritious fertilizers. The nutritious fertilizers have
significantly increased the yield.

129
HYPOTHESIS – 4
Null Hypothesis: There is no significant difference between the
application of the fertilizers at the right time with regard to the yield.
Alternate Hypothesis: There is a significant difference between the
applications of the fertilizers at the right time with regard to the yield.
Table 4.28
„t‟ Test for application of Fertilizers at Right Time
Application of
fertilizers at
right time
Number
of cases
Mean S.D t
Value
P
value
Yes 498 117809.54 10843.80
15.26
0.000**
No 502 8975 59 7094.60
Computed by the Researcher ** denotes significant at 1% level
Since the „P‟ value is less than 0.01, the null hypothesis is rejected at
1% level of significance. Hence it is concluded that there is a significant
difference between the applications of the fertilizers at the right time with
regard to the yield. Based on the Mean values shown in the Table 4.28, it
is clear that when the farmers were applying the fertilizers at the right
time, the Mean value is as more as 117809.54 compared with the delay in
the application of the fertilizers which has a less Mean value of 8975.59.
Hence it is understood that there is a significant decrease in the yield when
the farmers do not apply the fertilizers at the right time. If the farmers had
applied the fertilizers in time, they could have earned more yields.

130
HYPOTHESIS – 5
Null Hypothesis: There is no relationship between the total cost of
production and the percentage of the fertilizers usage.
Alternate Hypothesis: There is a relationship between the total cost of
production and percentage of the fertilizer usage.
Table 4.29
Chi-Square test for relationship between Total Cost and
Usage of fertilizers
Total cost
of
production
Percentage of fertilizer
usage
Total
Chi-
Square
Value
P
value
Below
30
30-40 Above
40
Below
15000
95
(33.7)
[53.1]
138
(48.9)
[27.4]
49
(17.4)
[15.4]
282
183.264
0.000 **
15000 to
30000
48
(17.8)
[26.8]
169
(62.8)
[33.6]
52
(19.3)
[16.4]
269
30000 to
45000
17
(6.3)
[9.5]
148
(54.8)
[29.4]
105
(38.9)
[33.0]
270
Above
45000
19
(10.6)
[10.6]
48
(26.8)
[9.5)]
112
(62.6)
[35.2]
179
Total 179 503 318 1000
Computed by the Researcher ** denotes significant at 1% level
Note: The value within ( ) refers to Row Percentage, [ ] column percentage
Since the „P‟ value is less than 0.01, the null hypothesis is rejected at
1% level of significance. Hence it is proved that there is a relationship
between total cost of production and the percentage of fertilizers usage.

131
From the Table 4.29, it is seen that out of the total cost of
production in all categories (except above 45000) , more number of
farmers had fertilizer usage under 30-40 percentage category. When the
total cost of production increases, the fertilizer usage also equally increases
category wise.
HYPOTHESIS - 6
Null hypothesis: There is no association between the knowledge about the
authorized dealers and getting the fertilizers at the control price.
Alternate Hypothesis: There exists an association between the knowledge
about the authorized dealers and getting the fertilizers at the control price.
Table 4.30
Chi-Square Test for relationship between Knowledge about
authorized dealers and getting Fertilizers at control price
Knowledge
about
authorized
dealers
Getting
fertilizers at
control price
Total
Chi-
Square
Value
P
Value
Yes No
Yes
85
(35.3)
[22.1]
156
(64.7)
[25.3]
241
1.315
0.25
No
299
(39.4)
[77.9]
460
(60.6)
[74.7]
759
Total 384 616 1000
Computed by the Researcher
Note: The value within ( ) refers to Row Percentage, [ ] column percentage

132
Since the „P‟ value is less than 0.01, the null hypothesis is rejected at
1% level of significance. Hence it is proved that there is an association
between the knowledge about the authorized dealers and getting the
fertilizers at the control price. It can be understood from the Table 4.30,
that when the farmers have no knowledge about authorized dealers (65 %),
they could not get the fertilizers at the control price (61%). Had the
farmers been able to purchase from the authorized dealers, the price would
have been less compared to other retailers. Hence the knowledge about the
authorized dealers will enable the farmers to get the fertilizers at the control
price.
HYPOTHESIS – 7
Null Hypothesis: There is no significant difference between the Semi-arid
zone and the Delta zone with regard to the overall yield.
Alternate Hypothesis: There is a significant difference between the Semi-
arid zone and the Delta zone with regard to the overall yield.
Table 4.31
„t‟ Test for overall yield per acre
Area Number
of cases
Mean S.D t
value
P
value
Semi-arid Zone 500 12618.80 10621.96
2.36
0.019*
Delta Zone
500 14131.00 9632.09
Computed by the Researcher * denotes significant at 5% level
Since the „P‟ value is greater than 0.05, the null hypothesis is
rejected at 5% level of significance. Hence it is proved that there is a

133
significant difference between the Semi-arid zone and the Delta zone with
regard to the overall yield per acre. It can be seen from the Table 4.31 that
the Delta zone has the mean value of 14131.00 which is more than the
Semi-arid zone which has a Mean value of 12618.96 only.
Agriculture is the gamble of monsoon. Favourable climatic
conditions will help the farmers to get better yield. Due to ecological
differences, the yields also differ from one field to another field. The yield
between both the areas have been calculated and analyzed with the help of
„t‟ Test.
While comparing the overall yield, the delta zone is better than the
Semi-arid zone. In delta zone, there are well structured irrigation
facilities, uninterrupted inputs supply, favourable climatic conditions,
planned agriculture etc. that will help the farmers to get more yield.
HYPOTHESIS – 8
Null hypothesis: There is no relationship between the amount spent on the
chemical fertilizers and the area of the Study.
Alternate Hypothesis: There is a relationship between the amount spent
on the chemical fertilizers and the area of the Study.

134
Table 4.32
Chi-Square test for relationship between amounts spent
on chemical fertilizers and area of the study
Amount
spent on
chemical
fertilizers
Area of the study
Total
Chi-
Square
Value
P
value
Semi-arid
zone
Delta
zone
Less than
5000
92
( 42.2 )
[ 18.4 ]
126
( 57.8 )
[ 25.2 ]
218
31.481
.000**
5001-10000
125
( 48.1 )
[ 25.0 ]
135
( 51.9 )
[ 27.0]
260
10001 –
15000
217
( 61.3 )
[ 43.4 ]
137
( 38.7 )
[ 27.4 ]
354
Above
15000
66
( 39.3 )
[ 13.2 ]
102
( 60.7 )
[ 20.4 ]
108
Total 500 500 1000 Computed by the Researcher ** significant at 1% level
Note: The value within ( ) refers to Row Percentage, [ ] column percentage
Since the „P‟ value is less than 0.01, the null hypothesis is rejected at
1% level of significance. Hence it is proved that there is a relationship
between the amount spent on the chemical fertilizers and the area of the
Study. While analyzing the above Table 4.32, it is clear that in the Semi-
arid zone, as many as 62 % of the farmers spent ranging from Rs.10001 to
Rs.15000 irrespective of the size of their land holdings because the grain
cultivation needs a heavy usage of fertilizers. In the Delta zone, the
farmers have been spending for the chemical fertilizers depending upon
their landholdings.

135
HYPOTHESIS – 9
Null hypothesis: There is no association between the total cost of
production and the area of the Study.
Alternate Hypothesis: There is an association between the total costs of
production and the area of the Study
Table 4.33
Chi-Square test for association between total cost of
production and the area of the study
Amount
spent on
Chemical
fertilizers
Area of the study
Total
Chi-
Square
Value
P
Value
Semi-arid
Zone
Delta Zone
Less than
15000
125
( 44.3 )
[ 25.0 ]
157
( 55.7 )
[ 31.4 ]
282
7.743
0 .051*
15001-30000
149
( 55.4 )
[ 29.8 ]
120
( 44.8 )
[ 24.0 ]
269
30001 –
45000
141
( 52.2 )
[ 28.2 ]
129
( 47.8 )
[ 25.8 ]
270
Above
45000
85
( 47.5 )
[ 17.0 ]
94
( 52.5 )
[ 18.8 ]
179
Total 500 500 1000 Computed by the Researcher * significant at 5% level
Note: The value within ( ) refers to Row Percentage, [ ] column percentage

136
Since the „P‟ value is less than 0.05, the null hypothesis is rejected at
5% level of significance. Hence it is proved that there is an association
between the amount spent on the chemical fertilizers and the area of the
Study. It is clear from the above Table 4.33, that in the Semi-arid zone, the
amount spent on the chemical fertilizers by the farmer respondents range
from Rs. 15001 to Rs. 30000 which constitutes 30% of the farmer
respondents. In the Delta zone, 31 % of farmers have been spending less
than Rs. 15,000.
HYPOTHESIS – 10
Null hypothesis: There is no significant difference between the Semi-arid
zone and the Delta zone with regard to their sources of procurement of
fertilizers.
Alternate Hypothesis: There is a significant difference between the Semi-
arid zone and the Delta zone with regard to their sources of procurement.
Table 4.34
„t‟ Test for Sources of procurement of fertilizers
Sources of
Procurement
Area of Study
t
Value
P
Value Semi-arid
Zone
Delta Zone
Mean SD Mean SD
Open
Market
4.05
0.49 3.50 0.90 11.93 0.000**
Co-
operatives
2.94
0.64 3.55 1.10 10.76 0.000**
Agricultural
Depots
3.07
0.58 3.31 0.71 5.95 0.000**
Computed by the Researcher** denotes significant at 1% level

137
Since the „P‟ value for all the sources is less than 0.01, the null
hypothesis is rejected at 1% level of significance. Hence it is concluded
that there is significant difference between the Semi-arid zone and the
Delta zone with regard to the sources of procurement of Fertilizers.
While comparing the Mean values in the above Table 4.34, it can be
seen that the Semi-arid zone has more Mean value (4.05) than the Delta
zone (3.50) with regard to the open market. As far as the co-operatives are
concerned, the Delta zone has more Mean value (3.55) than the Semi-arid
zone (2.94).
The Delta zone has more Mean value than the Semi-arid zone with
regard to the agricultural depots. In the Semi-arid zone, more farmers have
been procuring the fertilizers from the open market and in the Delta zone
from the co-operatives.
HYPOTHESIS – 11
Null hypothesis: There is no significant difference between the Semi-arid
zone and the Delta zone with regard to the problems faced by the farmers
in the procurement of the fertilizers.
Alternate Hypothesis: There is a significant difference between the Semi-
arid zone and the Delta zone with regard to the problems faced by
farmers in the procurement of the fertilizers.
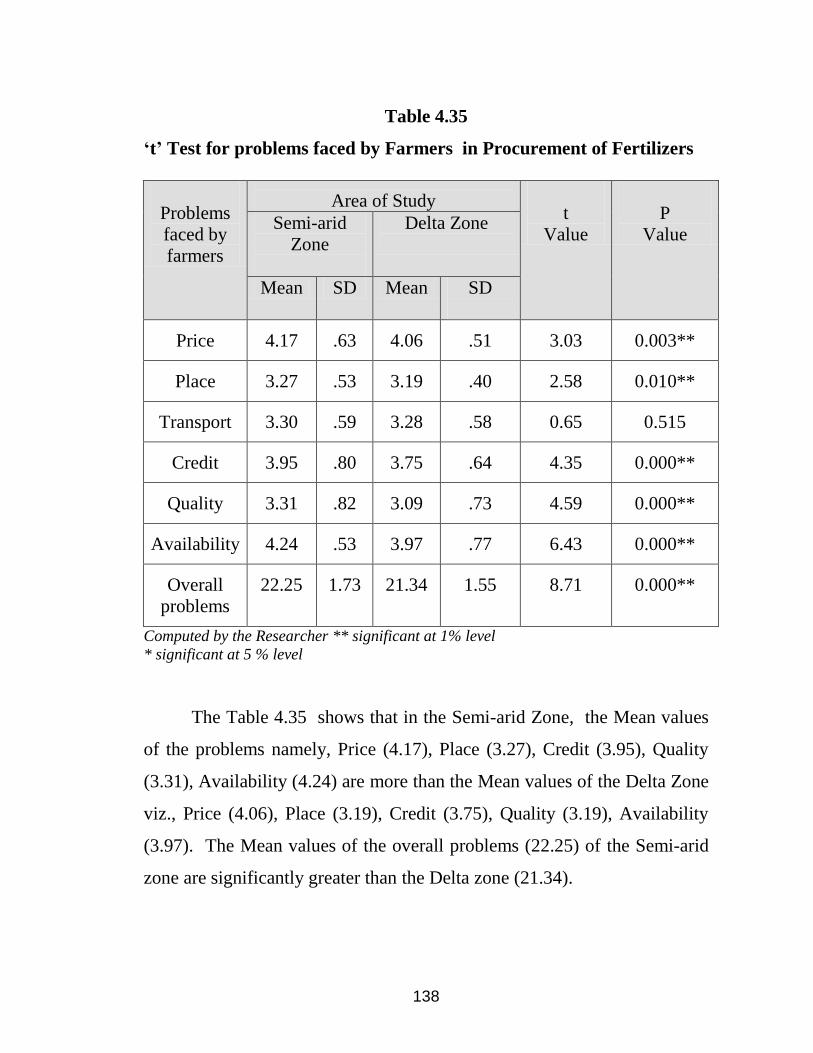
138
Table 4.35
„t‟ Test for problems faced by Farmers in Procurement of Fertilizers
Problems
faced by
farmers
Area of Study
t
Value
P
Value Semi-arid
Zone
Delta Zone
Mean SD Mean SD
Price 4.17 .63 4.06 .51 3.03 0.003**
Place 3.27 .53 3.19 .40 2.58 0.010**
Transport 3.30 .59 3.28 .58 0.65 0.515
Credit 3.95 .80 3.75 .64 4.35 0.000**
Quality 3.31 .82 3.09 .73 4.59 0.000**
Availability 4.24 .53 3.97 .77 6.43 0.000**
Overall
problems
22.25 1.73 21.34 1.55 8.71 0.000**
Computed by the Researcher ** significant at 1% level
* significant at 5 % level
The Table 4.35 shows that in the Semi-arid Zone, the Mean values
of the problems namely, Price (4.17), Place (3.27), Credit (3.95), Quality
(3.31), Availability (4.24) are more than the Mean values of the Delta Zone
viz., Price (4.06), Place (3.19), Credit (3.75), Quality (3.19), Availability
(3.97). The Mean values of the overall problems (22.25) of the Semi-arid
zone are significantly greater than the Delta zone (21.34).

139
Since „P‟ values for all the problems except Transport are less than
0.01, the null hypothesis is rejected at 1% level of significance. Hence it is
proved that there is a significant difference between the Semi-arid zone and
the Delta zone with regard to the problems faced by the farmers except
transport problems in the procurement of the fertilizers.
There is no significant difference between Semi-arid zone and Delta
zone with regard to the problems relating to transport in the procurement of
the fertilizers since „P‟ value is greater than 0.05.
As the Mean values of the problems are more in the Semi-arid zone,
it is clearly understood that the farmers of the Semi-arid zone have been
facing more problems than the farmers of the Delta zone. The farmers have
been facing the problems in the procurement of the fertilizers such as
credit, non-availability, inferior quality, warehousing problems and price.
Sometimes the farmers are compelled to get the fertilizers for which they
have not given any preference to buy.
HYPOTHESIS – 12
Null Hypothesis: There is no significant difference between the transport
costs of the fertilizers with regard to the area of the Study.
Alternate Hypothesis: There is a significant difference between the
transport costs of the fertilizers with regard to the area of the Study.

140
Table 4.21
„t‟ Test for Transport Costs of Fertilizers
Area Number
of cases
Mean S.D t
value
P
Value
Semi-arid Zone
500
4.0060 2.197
0.38
0.707
Delta Zone
500 4.0580 2.180
Computed by the Researcher
Since the „P‟ value is greater than 0.05, the null hypothesis is
accepted at 5 % level of significance. Hence it is proved that there is no
significant difference between the transport costs with regard to the area of
the Study.
From the Table 4.36, it is understood that the transport costs of both
the zones are the same. The Transport cost of the Semi-arid zone farmers
has the Mean value of 4.0060 which is more or less equal to the Delta zone
mean value 4.0580. The Transport cost has not been contributing any
difference in both the zones in the total cost of the production.
HYPOTHESIS – 13
Null Hypothesis: There is no relationship between the area of the Study
and getting the fertilizers at the control price.
Alternate Hypothesis: There is a relationship between the area of Study
and getting the fertilizers at the control price.

141
Table 4.37
Chi-Square test for relationship between getting fertilizers
at the control price with regard to the area of the study
Getting
Fertilizers at
Control Price
Area of the study
Total
Chi-
Square
Value
P
Value Semi-arid
Zone
Delta
Zone
Yes
224
( 58.3 )
[ 44.8 ]
160
( 41.7 )
[ 32.0 ]
384
17.316
0 .000**
No
276
( 44.8 )
[ 55.2 ]
340
( 55.2 )
[ 68.0 ]
616
Total 500 500 1000
Computed by the Researcher ** significant at 1% level
Note: The value within ( ) refers to Row Percentage, [ ] column percentage
Since the „P‟ value is less than 0.01, the null hypothesis is rejected
at 1% level of significance. Hence it is concluded that there is a
relationship between getting the fertilizers at the control price with regard
to the area of the Study.
While analyzing the above Table 4.37, it is understood that in the
Semi-arid zone 58 % of farmers have been getting fertilizers at the control
price whereas in the Delta zone, 42 % of farmers have been getting at the
control price. Within the Semi-arid zone, it can be seen that 55 % of the
farmers have not been getting fertilizers at the control price and within the
Delta Zone 68% of the farmers are not getting the fertilizers at the control
price. Hence it is proved that in the Delta zone more number of farmers
have not been getting fertilizers at the control price.

142
HYPOTHESIS – 14
Null Hypothesis: There is no relationship between the area of the Study
and the sources of obtaining the credit.
Alternate Hypothesis: There is a relationship between the area of the
Study and the sources of obtaining the credit.
Table 4.38
Chi-Square test for relationship between Sources of Credit
with regard to Area of the Study
Sources of Credit Chi-Square value P value
Money Lenders 2.526 0.111
Friends & Relatives 1.192 0.275
Co-Operatives 0.559 0.455
Commercial Banks 0.0648 0.799
Computed by the Researcher
Since the „P‟ value is greater than 0.05, the null hypothesis is
accepted. So there is no relationship between the area of the Study and the
sources of obtaining the credit. Hence it is concluded that the credit
availed by the farmers of both the zones for their agriculture are from the
same sources. From the above Table 4.38, it can be seen that that P value
is greater than 0.05 for all the sources of credit. The farmers have been
getting the credit from various sources such as money lenders, friends and
relatives, co-operatives and commercial banks in both the zones. The
contribution by the sources does not show any difference in both the zones.

143
HYPOTHESIS – 15
Null Hypothesis: There is no relationship between the area of the Study
and the reasons for the delay in the application of the fertilizers.
Alternate Hypothesis: There is a relationship between the area of the
Study and the reasons for the delay in the application of the fertilizers.
Table 4.39
Chi-Square test for relationship between area of Study and
Reasons for Delay in Application of Fertilizers
Reasons for delay Chi-Square value P value
Non-availability 1.171 0.279
Credit Problem 31.460 0.000**
Labour Problem 0.118 0.730
Transport Problem 4.198 0.040*
Climatic condition 0.503 0.477
Computed by the Researcher **Significant at 1% level * at 5%level
From the above Table 4.39, it can be seen that the P value is less
than 0.01 for the Credit problem and less than 0.05 for the Transport
problem. The P value is greater than 0.05 for other problems viz., Non–
availability, Labour problem and Climatic conditions. So the null
hypothesis is rejected for two cases namely, Credit problem and Transport
problem at 1% and 5 % level of significance respectively. Hence it is
proved that there is a relationship between the area of Study and the

144
reasons for the delay for the credit and the transport problems. Whereas,
the P value is greater than 0.05 for other problems and hence the null
hypothesis is accepted for the other problems. Hence there is no
relationship between the area of Study and the above problems. The
farmers have been facing the same problems for the delay in the application
of the fertilizers in both the zones like non-availability, labour problems
and climatic conditions.
HYPOTHESIS – 16
Null hypothesis: There is no significant difference between the Semi-arid
zone and the Delta zone with regard to the overall satisfaction of the usage
of the fertilizers.
Alternate Hypothesis: There is a significant difference between the Semi-
arid zone and the Delta zone with regard to the overall satisfaction of
the usage of the fertilizers.
Table 4.40
„t‟ Test for overall satisfaction of usage of Fertilizers
Overall
satisfaction
Area of Study
t
Value
P
Value Semi-arid zone Delta Zone
Mean
SD Mean SD
Increase in
yield
4.432 0.535 4.472 0.500 1.22 0.222
Soil quality 3.462
0.630 3.596 0.722 3.13 0.002**
Growth
4.074
0.526 4.076 0.536 0.06 0.953
Computed by the Researcher ** significant at 1% level

145
The above Table 4.40 reveals that the „P‟ value for satisfaction on
the soil quality is less than 0.01 and the „P‟ values for increase in the yield
and growth are showing the „P‟ value more than 0.05. In both the zones,
the overall satisfaction for the usage of fertilizers differs only with the soil
quality factor. While comparing the mean values, it is understood that the
delta zone has more satisfaction mean value of 3.596 compared with 3.462
of Semi-arid zone. In Semi-arid zone, the farmers are having less
satisfaction of fertilizer usage with regard to soil quality.
Since the P value of satisfaction on the soil quality is less than 0.01,
the null hypothesis is rejected at 1% level of significance. So it is proved
that there is a significant difference between the Semi-arid zone and the
Delta zone with regard to the satisfaction on soil quality.
Since the „P‟ value of satisfaction on the increase in the yield and the
overall growth is greater than 0.05, the null hypothesis is accepted at 5%
level of significance. So it is proved that there is no significant difference
between the Semi-arid zone and the Delta zone with regard to the
satisfaction on overall growth and increase in the yield by the fertilizer
usage. Hence it is concluded that in both the zones, the overall satisfaction
derived from fertilizer usage is common with regard to the overall growth
and increase in the yield. The same level of satisfaction is got by the
farmers in using the fertilizers in their fields for the increase in the yield
and the overall growth of the crops

146
HYPOTHESIS – 17
Null Hypothesis:
There is no significant difference among the various categories of
farmers in the over all problems in the procurement of the fertilizers
Alternate Hypothesis
There is a significant difference among the various categories of
farmers in the over all problems in the procurement of the fertilizers.
There are four categories of farmer‟s viz., Marginal Farmers, Small
Farmers, Medium Farmers and Big Farmers. The overall problems for the
various categories of the farmers were tested by ANOVA followed by
Duncan Multiple Range Test.
Table 4.41
ANOVA Test to analyze the overall problems of various categories of
farmers in procurement of fertilizers
Categories of
farmers
Mean Standard
Deviation
F
Value
P
Value
Marginal Farmers 22.11 c 1.16
123.43
0.000**
Small Farmers 23.06 d 1.71
Medium Farmers 21.32 b 1.53
Big Farmers 20.70 a 1.38
Note : The different alphabets between farmers denote significant at 5 %
Level using Duncon Multiple Range Test

147
From the above table 4.41, it is inferred that there is a significant
difference between different categories of farmers with regard to overall
problems faced by them in the procurement of fertilizers ( F = 123.43 , P <
0.01). Based on the Duncon Multiple Range Test, it can be seen that the
problems faced by Big Farmers (a) are comparatively less than the other
categories followed by Medium Farmers (b). The Marginal Farmers (c)
were facing more problems in getting fertilizers than the Medium and Big
Farmers. On the whole, the Small farmers (d) have been facing more
problems than the other categories in the procurement of the fertilizers.
Table 4.42
Co-Efficient Of Correlation Between The
Usages Of Chemical Fertilizers And The Yield
Variables Co-efficient of
Correlation
P
Value
Usage of Chemical
fertilizers
Vs Yield per acre
0.8239
0.000**
Source : Computed by the Researcher
From the table 4.42, it can be seen that the variables such as the
usage of the chemical fertilizers and the yield per acre has been taken for
the calculation of correlation. It is inferred that there is a (82%) positive
relationship that exists between the usage of the chemical fertilizers and the
yield per acre in the last harvest. The P value is also less than 0.01 and
hence it is proved that both usage of chemical fertilizers and the yield per
acre were associated positively.

148
Table 4.43
Comparative Study Of
Purchase Behaviour Of The Farmers
Purchase Behaviour Semi-arid Zone
Mean Value
Delta Zone
Mean Value
No. of family members
engaged in Agriculture
2.76 # 2.71
Usage of both Indigenous
and Chemical Fertilizers
2.37 2.65 #
Amount spent on
Chemical Fertilizers
2.38 # 2.18
Knowledge about
Authorized Dealers
1.88 # 1.64
Transport Cost of
Fertilizer
3.71 # 2.33
Getting of Fertilizers at
the Control Price
1.51 1.82 #
Usage of Nutritious
fertilizers
1.90 # 1.63
Overall Yield per acre
9380.37
12614.74 #
Satisfaction on increase in
the yield.
4.47 4.51 #
Source : computed by the Researcher
Note : # indicates that the factor is better than the other zone.
The above table shows the comparative study of the purchase
behaviour of the farmers in the Study area.

149
4.6. CONCLUSION
India is an agricultural country. Agriculture forms the backbone of
Indian economy. Despite concentration of industrialization for the past two
decades, agriculture still remains in a place of pride. But for a long time
Indian farmers have been facing number of socio-economic problems such
as harassment by money lenders, inability to repay the debts, crops loss,
inability to get the medical treatment for the family, lack of positive and
co-operative support from the banks, weather and market fluctuations etc.
So planners, administrators, farm scientists and personnel related to the
agricultural department must consider the threats faced by farmers to
protect the farming community as well as the nation. By reducing the level
of problems faced by the farmers, the nation as a whole shall march
towards a prosperous future.

150
CHAPTER –V
HINDRANCES IN FERTILIZERS MARKETING
(A COMPARATIVE STUDY)
5.1. INTRODUCTION
“Marketing includes those business activities which are involved in
the flow of goods and services from Production to Consumption”.
The Marketing activities help the goods to start the journey from the
place of Production to the place of Consumption. During the journey there
are so many hindrances viz., Personal Hindrance, Place Hindrance, Time
Hindrance, Knowledge Hindrance and Financial Hindrance. These
problems or hindrances are overcome by the help of various aids of trade
namely, Middlemen (wholesalers, retailers, etc.,) Transport, Warehousing,
Advertisement, Banks and financial sources.
The functional approach to the Study of Marketing splits the whole
process into the above several smaller activities. Hence the major areas of
fertilizer marketing have been identified and analyzed with the help of Chi-
square test. It is used to make the Comparative Study of Fertilizer
Marketing done by the private dealers and co-operatives in both the Semi-
arid and the Delta zones.

151
For the purpose of analyzing the various Hindrances, this chapter is
divided broadly into seven sections and in each section the comparative
study has been carried out.
Section I Describes the socio-demographic features of the
fertilizer Dealers
Section II Identifies the sources of finance
Section III Gives the particulars relating to purchase.
Section IV Gives the particulars relating to sales to the farmers.
Section V Explains the storage of fertilizers.
Section VI Describes the transportation of fertilizers.
Section VII Describes the advertisement and the sales promotional
activities.
SECTION I
5.2. SOCIO-DEMOGRAPHIC DETAILS OF THE FERTILIZER
DEALERS
The socio-demographic details have the impact on the performance
and the development of the fertilizer business. Various dimensions taken
for collecting the personal details are age, education, nature of business,
experience, business organization and dealing of agricultural inputs. The
Profile of the fertilizer dealers are given below in a tabulated form by way
of percentage analysis and Chi-square analysis to know the significant
difference between the Semi-arid zone and the Delta zone.

152
5.2.1. Educational qualification of the fertilizer dealers
The education keeps the fertilizer dealers aware of the combination
of fertilizers and its usage. It helps the dealers to understand the needs of
the farmers. It identifies the selling techniques and the business
development practices. Table 5.1 gives the details of the frequency
distribution of the fertilizer dealers surveyed, based on their education.
Table 5.1
Educational Qualification Of Fertilizer Dealers
Source : Primary Data, Computed by the Researcher
* denotes significant at 5% level
The values within ( ) refer to Row% and within [ ] refer to Column%
Educational
qualification
Semi
Arid
zone
Delta
zone
Total
Chi
square
value
P
Value Private
dealers
Private
Dealers
Higher
Secondary.
8
(61.5)
[16.0]
5
(38.5)
[10.0]
13
7.961
0.018* Under-
Graduation
27
(62.8)
[54.0]
16
(37.2)
[32.0]
43
Post-
Graduation.
15
(34.1)
[30.0]
29
(65.9)
[58.0]
44
Total 50 50 100
153
The above Table 5.1. depicts that within the Semi-arid zone, most
of the fertilizer dealers (54%) are Under-graduates and 30% of the
dealers are Post-graduates and the remaining 26% have H.Sc. education.
Within the Delta zone, most of the fertilizer dealers (58%) are Post-
graduates and 32% of the dealers are Under-graduates.
While making the Comparative Study in Table 5.1, with the help of
Chi-square analysis, the „p‟ value is less than 0.05. Hence it is proved that
there is a relationship between the educational qualification of the dealers
and the Area of the Study. While identifying the relationship through the
Table, it is found that in the Semi-arid zone most of the dealers (63%) are
Under-graduates and in the Delta zone, most of the dealers (66%) are Post-
graduates.
5.2.2. Age of the Fertilizer Dealers
The age of a person plays an important role in business. The
progressive outlook, the innovative spirit, the risk taking ability and so on,
is closely related to the age factor of the Fertilizer Dealers. Table 5.2
presents the age details of the Fertilizer Dealers surveyed.

154
Table 5.2
Age Group Of The Fertilizer Dealers
Age
Group
(in years)
Semi arid
zone
Delta
zone
Total
Chi
square
value
P
Value
Private
dealers
Private
dealers
Below 40 13
(52.0)
[26.0]
12
(48.0)
[24.0]
25
7.310
0.026* 40-45 18
(37.5)
[36.0]
30
(62.5)
[60.0]
48
Above 45 19
(70.4)
[38.0]
8
(29.6)
[16.0]
27
Total 50 50 100
Source: Primary Data, Computed by the Researcher
* denotes significant at 5% level
The values within ( ) refer to Row% and within [ ] refer to Column
From the above Table 5.2, it is seen that within the Semi-arid zone,
38% of the private dealers studied belong to the age group of 45 years and
above and 36% are in the age group of 40 years to 45 years. 26% comprise
the age group of less than 40 years. Within the Delta zone, most of the
dealers i.e., 60% are aged between 40 years and 45 years and 24% are young
dealers in the age group below 40 years and only 16% of the private dealers
fall under 45 years and above age category.
It can be seen from the table 5.2 that the „p‟ value is less than 0.05.
Hence it is proved that there is a relationship between the age of the dealers

155
and the Area of the Study. While identifying the relationship through the
Table, it is found that comparatively, in the Semi-arid zone more number of
dealers (38%) fall under above 45 years age category which is only 16% in
the Delta zone. In the Delta zone most of the farmers (60%) belong to the
age category of 40 years to 45 years.
5.2.3. Nature of business of the Fertilizer Dealers
The farmers are scattered in many places. The gap between the
producer and the farmer is shrunk by the channel of distribution. The
fertilizer marketing distribution is done by the wholesalers who get
fertilizers from the manufacturers, the Retailers who get fertilizers from the
wholesalers and the co-operative societies. The private dealers will do either
wholesale business or retail business or both. The co-operatives do the retail
business by getting the fertilizers from the Co-operative Marketing
Federations. The nature of business done by the fertilizer dealers are shown
in the following Table 5.3.

156
Table 5.3
Nature Of Business Of The Fertilizer Dealers
Nature
of
business
Semi arid zone
Delta zone Total Chi
square
value
93.672
P value
0.000**
Private
Co-op Private Co-
op.
Whole
sale
5
(29.4)
[10.0]
--
12
(70.6)
[24.0]
-- 17
Retail
37
(24.5)
[74.0]
50
(33.1)
[100.0]
14
(9.3)
[28.0]
50
(33.1)
[100.
0]
151
Both
8
(25.0)
[16.0]
-- 24
(75.0)
[48.0]
-- 32
Total 50 50 50 50 200
Source : Primary Data, Computed by the Researcher
** denotes significant at 1% level
The values within ( ) refer to Row% and within [ ] refer to Column%
Table 5.3 shows that a majority of the dealers in the semi arid zone,
consisting of 74% of the population studied have been doing retail
business. 16% have been doing both wholesale and retail business and the
remaining 10% have been doing wholesale business. Within Delta zone,
most of the dealers i.e., 48% have been doing both wholesale and retail
business. 28% of the dealers have been doing retail business and 24% have
been doing wholesale business. In both the zones, the co-operative
societies have been doing retail business.
From the Table 5.3, it can be seen that the „p‟ value is less than 0.01
and it is proved that there is a relationship between the nature of business

157
and the area of the Study. While analyzing the relationship, it can be seen
from the Table that in the Semi-arid zone most of the private dealers
(24.5%) have been doing retail business compared to the Delta zone (9.3%
only) whereas in the Delta zone, most of the dealers (75%) have been
doing both the business compared to the Semi-arid zone ( 25% only).
Figure.5.1. Nature of Business of the Fertilizer Dealers
0
5
10
15
20
25
30
35
40
45
50
Wh
ole
sale
Reta
il
Bo
th
Semi arid zone Private
Semi arid zone Co-op
Delta zone Private
Delta zone Co- op.
5.2.4. Experience of the of the Fertilizer Dealers in Business
The classification of the fertilizer traders on the basis of Experience
in Business is studied by grouping them as below 20 years,20-40 years and
above 40 years and the frequency distribution is given in Table 5.4.

158
Table 5.4
Experience Of Fertilizer Dealers In Business
Experienc
e in
business
Semi-arid zone
Delta zone
Total
Chi
square
value
P
Value Private
Dealers
Co-
op.
Private
dealers
Co-
op.
Below 20
35
(59.3)
[70.0]
--
24
(40.7)
[48.0]
--
59
120.886
0.000**
20-40
15
(19.5)
[30.0]
21
(27.4)
[42.0]
26
(33.8)
[52.0]
15
(19.5)
[30.0]
77
Above
40
--
29
(45.3)
[58.0]
--
35
(54.7)
[70.0]
64
Total
50 50
50
50
200
Source : Primary Data, Computed by the Researcher
** denotes significant at 1% level
The values within ( ) refer to Row% and within [ ] refer to Column%
From the Table 5.4, it can be inferred that within the Semi-arid
zone, most of the sample private dealers constituting 70% have less than
20 years of experience in business and remaining 30% have run the
business for about 20- 40 years. 58% of the Co-operatives have experience
for above 20 years and 42% have 20 to 40 years of experience in the Semi-
arid zone. In the Delta zone, 52% of private dealers have established their
Business for 20-40 years and remaining 48% have less than 20 years of
experience. 70% of the Co-operatives have more than 40 years of
experience and 30% have 20 to 40 years of experience in Business.

159
From the Table 5.4, it is inferred that the „p‟ value is less than 0.01
and it is proved that there is a relationship between the experience of the
Fertilizer Dealers in Business and the Study area. While studying the
relationship, it can be seen that in the Semi-arid zone most of the private
dealers (59.3%) have less than 20 years of experience. But more dealers in
the Delta zone (33.8%) have 20-40 years of experience compared to the
Semi-arid zone. In the Delta zone more number of co-operatives (54.7 %)
have more than 40 years of experience.
5.2.5. Business organization of the Fertilizer Dealers
The Organization of business will help the dealers in raising the
required capital and provides opportunities for the development. The
organization of business conducted by the fertilizer dealers is given.
Table 5.5.
Business Organization Of Fertilizer Dealers
Business
organi
zation
Semi arid zone Delta zone
Total
Chi
square
value
P
value Private
dealers
Co-op. Private
dealers
Co-
op.
Proprie-
torship
17
(43.6)
[34.0]
--
22
(56.4)
[44.0]
--
39
236.33
0.000** Partner-
ship
33
(54.1)
[66.0]
--
28
(45.9)
[56.0]
--
61
Co-ops.
--
50
(50.0)
[100.0]
--
50
(50.0)
[100.0]
100
Total
50
50
50
50
200
Source : Primary Data, Computed by the Researcher ** significant at 1% level ,
The values within ( ) refer to Row% and within [ ] refer to Column%

160
The Table 5.5 shows the business organization of private traders and
co-operatives. Within the Semi-arid zone, it can be seen that majority of
66% of the Business are Partnership form of organization and the
remaining 34% of the traders surveyed are the Sole Proprietors. But in the
case of the Delta zone, 56% have been doing Partnership business and 44%
have been the sole proprietors. The co-operative societies have been
registered under the co-operative form of organization in both the zones.
As the fertilizer distribution cannot be undertaken on a large scale,
owing to the geographical limitations, no corporate entity is involved in
this field. From the Table 5.5, it can be seen that the „p‟ value is less than
0.01 and it is proved at 99% level of significance that there is a relationship
between the Business Organization and the Area of the Study.
While analyzing the relationship, it can be seen from the Table that
in the Semi- arid zone most of the private dealers (54.1%) have been doing
partnership business compared to the Delta zone (45.9%) whereas in the
Delta zone, most of the dealers (56.4%) have been sole proprietors
compared to the Semi-arid zone ( 43.6 %) . The co-operative societies
come under the co-operative form of organization.
5.2.6. Dealing of Agricultural Inputs of the Fertilizer Dealers
It may not be economical for the dealers to distribute only one input
namely the fertilizer. On the other hand, if they combine other inputs like
seeds, pesticides, agricultural implements etc., it would improve their
business. The Frequency distribution based upon dealing of inputs of the
fertilizer dealers is given in Table 5.6.

161
Table 5.6
Dealing Of Agricultural Inputs Of
Fertilizer Dealers
Response
Semi arid zone Delta zone
Total
Chi
square
value
P
value Private
dealers
Co-
op.
Private
dealers
Co-
op.
Fertilizer
alone
23
(69.7)
[46.0]
-
10
(30.3)
[20.0]
- 33
51.787
0.000** Fertilizer
&
Pesticides
24
(21.1)
[48.0]
30
(26.3)
[60.0]
26
(22.8)
[52.0]
34
(29.8)
[68.0]
114
Fertilizer,
pesticides
Agri.-
appliances
3
(5.7)
[6.0]
20
(37.7)
[40.0]
14
(26.4)
[28.0]
16
(30.2)
[32.0]
53
Total 50 50 50 50 200
Source: Primary Data, Computed by the Researcher
** denotes significant at 1% level
The values within ( ) refer to Row% and within [ ] refer to Column%
Table 5.6 clearly shows that within the Semi-arid zone 48 % of the
private dealers dealt with fertilizers and pesticides followed by 46% who
have been dealing with fertilizer alone. Only 6% of the dealers have been
selling fertilizers, pesticides and agricultural appliances. 40% of the Semi-
arid zone co-operatives have been in the dealing of fertilizers, pesticides
and agricultural appliances.

162
Within the Delta zone, about 52% dealt with the second category
that is selling the pesticides along with the fertilizers. 28% of the sample
dealers have been using all the three inputs for sale. 68% of the Co-
operatives have been dealing with the fertilizers and the pesticides.
From the Table 5.6, it can be inferred that the „p‟ value is less than
0.01 and it is proved that there is a relationship between the dealing of the
inputs and the Area of Study. While analyzing the relationship, it can be
seen from the Table that in the Semi-arid zone a majority of the private
dealers (69.7%) have been dealing with the fertilizers alone compared to
the Delta zone. Whereas in the Delta zone, most of the dealers (26.4%)
could deal with all the three inputs compared to the Semi-arid zone which
is 5.7% only. The Co-operatives are far better than the private dealers in
both the zones, since most of them have been dealing with all the inputs
needed for the farmers.
The following figure 5.2 shows the different types of inputs dealt by
the Fertilizer dealers. The traders will sell the needed inputs to the farmers
whenever the farmers approach the fertilizer traders.

163
Figure. 5.2. Dealing of Inputs by the Fertilizer Dealers
70%0%
30%
0% 21%
26%
23%
30%
6%
38%
26%
30%
Semi arid zone Private dealers Semi arid zone Co-op.
Delta zone Private dealers Delta zone Co-op.
SECTION II
5.3. SOURCES OF FINANCE
Finance is the most fundamental aspect for any merchandise
transaction. Hence a sufficient amount is needed for a business firm. The
Fertilizer distribution system requires finance for the purchase of
inventories to meet the farmers‟ demand. The firm needs quite a good
amount of cash for the smooth running of the business. The Amount of
capital invested and the various sources of finance for the fertilizer dealers
are shown in this Section.

164
5.3.1. Amount of capital invested by the fertilizer dealers
Capital is the money invested into the business. This capital is
required to purchase inventories and to meet the day-to-day expenses of the
fertilizer dealers. The primary need of the fertilizer marketer for the fund
arises when they have to invest in stock of goods. The Table 5.7 presents
the amount of capital invested by the fertilizer dealers.
Table 5.7.
Amount Of Capital Invested By The
Fertilizer Dealers
Capital
Invested
(in lakhs)
Semi-arid
Zone
Delta
zone
Total
Chi-
Square
value
P
value
Private
dealers
Private
dealers
Less than
20
23
(69.7)
[46.0]
10
(30.3)
[20.0]
33
8.335
0.015*
20-25
17
(44.7)
[34.0]
21
(55.3)
[42.0]
38
More than
25
10
(34.5)
[20.0]
19
(65.5)
[38.0]
29
Total 50 50 100
Source: Primary Data, Computed by the Researcher
* denotes significant at 5% level
The values within ( ) refer to Row% and within [ ] refer to Column%

165
From the Table 5.7, it can be seen that within the Semi-arid zone
46% of the dealers invested less than Rs.20 Lakhs and 34% of the dealers
invested between Rs.20 Lakhs and Rs.25 Lakhs. 20% of the dealers
invested more than Rs.25 Lakhs into the fertilizer marketing business. In
Delta zone, as many as 42% of the sample dealers invested the capital
between Rs.20 Lakhs and 25 Lakhs followed by 38% who invested above
25 Lakhs.
It can be seen from the Table 5.7 that the „p‟ value is less than 0.05.
So it is proved that there is a relationship between the Amount of Capital
invested and the Area of the Study. In the Semi-arid zone as many as
69.7% of the dealers invested less than Rs.20 Lakhs only whereas in the
Delta zone more number of dealers, about 65.5% invested more than Rs.
25 lakhs.
5.3.2. Sources of finance of fertilizer dealers
The dealers have been obtaining finance from various sources.
Today‟s business world warrants a reasonable capital. It is difficult for the
fertilizer traders to invest the entire capital from their own Source.
Moreover there is a scope for locking of funds in this trade. This also
necessitates the fertilizer traders to go for outside borrowings. The Sources
of the finance of the fertilizer dealers are shown in Table 5.8.

166
Table 5.8.
Sources Of Finance Of Fertilizer Dealers
Source of
finance
Semi-arid zone Delta Zone
Total Private Co-
ops.
Private Co-
ops.
Borrowed
fund
20
(41.7)
[40.0]
-
28
(58.3)
[56.0]
-
48
Own &
Borrowed
fund
30
(19.7)
[60.0]
50
(32.9)
[100.0]
22
(14.5)
[44.0]
50
(32.9)
[100.0]
152
Total 50 50 50 50 200
Chi-square value 66.667
p value 0.000**
Source: Primary Data, Computed by the Researcher
** denotes significant at 1% level
The values within ( ) refer to Row% and within [ ] refer to Column%
From the Table 5.8, it is understood that within the Semi-arid zone,
60% of the fertilizer dealers have been doing their business with the help of
own and borrowed funds. The Remaining 40% of the dealers who were
surveyed have been using their own capital in the business. In the Delta
zone, 56% of the private dealers have been doing their business with their
own capital and 44% have been using both own and borrowed capital. In
both the zones, it can be seen that all the Co-operatives have been doing
their business with their own capital and the capital borrowed from the
Central and the State Co-operatives. It can also be seen from the Table 5.8
that the „p‟ value is less than 0.01.
Hence it is proved that there is a relationship between the Sources of
Finance and the Area of the Study. In the Delta zone most of the private

167
dealers (58.3%) have carried on their business with their own capital
compared to the private dealers of the Semi-arid zone (41.7 %).
5.3.4. Sources of the borrowed funds of the fertilizer dealers
The capital of the fertilizer dealers are made up of the owned and the
borrowed capital. They borrow finance from the commercial banks,
friends and relatives, money-lenders and others. The sources of the
borrowed funds are shown in the following Table 5.9.
Table 5.9.
Sources Of The Borrowed Funds By The Fertilizer Dealers
Source : Primary Data, Computed by the Researcher
The values within ( ) refer to Row% and within [ ] refer to Column%
From the Table 5.9, it can be inferred that in the Semi-arid zone 50%
of the private dealers borrowed capital from other sources. The capital
Source of
Funds
Semi arid zone
Private dealers
Delta zone
Private dealers
Chi
square
value
P
Value
Yes No Yes No
Commercial
Banks
17
(38.6)
[34.0]
33
(58.9)
[66.0]
27
(61.4)
[54.0]
23
(41.1)
[46.0]
2.038
0.163
Friends &
Relatives
23
(59.0)
[46.0]
27
(44.3)
[54.0]
16
(41.0)
[32.0]
34
(55.7)
[68.0]
2.060
0.151
Money
Lenders
23
(45.1)
[46.0]
27
(55.1)
[54.0]
28
(54.9)
[56]
22
(44.9)
[44.0]
1.000
0.317
Others
25
(53.2)
[50.0]
25
(47.2)
[50.0]
22
(46.8)
[44]
28
(52.8)
[56.0]
0.361
0.548

168
borrowed from friends and relatives and money lenders are equal i.e., 46%
each. 34% of the dealers borrowed the capital from the commercial banks.
In the Delta zone, 55. % of the private dealers run their business by
borrowing funds from the money-lenders and 54% obtained funds from the
commercial Banks. 32% of the private dealers borrowed capital from the
friends and relatives. The „p‟ values for all of the sources of finance of
borrowed capital are more than 0.05 and hence it is proved that there is no
relationship between the Sources of Borrowed Capital and the Area of
Study. Hence it is concluded that in both the zones, the capital is borrowed
by the dealers through the same sources.
Figure.5.3. Sources of Borrowed funds by the Private Dealers
PRIVATE DEALERS
17
23
23
25
27
16
28
22
Commercial Banks
Friends & Relatives
Money lenders
Others
SOURCES
Delta zone
Semi-arid zone

169
5.3.5. Getting of Sufficient loans of Fertilizer Dealers
Whether the dealers have been getting the sufficient loans or not
have been analyzed by the researcher in the Table 5.10.
Table 5.10
Getting Of Sufficient Loans Of The Fertilzier Dealers
Getting
suffic
-ient
Loans
Semi-arid zone Delta zone
Total
Chi-
square
value
P
Value
Private
dealers
Co-
Ops
Private
Dealers
Co-
ops.
Yes
13
(12.3)
[26.0]
36
34.0)
[72.0]
19
(17.9)
[38.0]
38
(35.8)
[76.0]
106
37.013
0.000**
No
37
(39.4)
[74.0]
14
(14.9)
[28.0]
31
(33.0)
[62.0]
12
(12.8)
[24.0]
94
Total 50
50 50 50 200
Source : Primary Data, Computed by the Researcher
** denotes significant at 1% level
The values within ( ) refer to Row% and within [ ] refer to Column %
From the above Table 5.10, it can be seen that within the Semi-arid
zone, most of the private dealers about 74% have not been getting
sufficient loans of the fertilizer dealers. Only 26% of the private dealers
have been getting the same. 72% of the Co-operatives have been getting
sufficient loans and the remaining 28% have not been getting sufficient
loans. In the Delta zone, 62% of the private dealers and 24% of the Co-

170
operatives have not been getting the sufficient loans. 38% of private
dealers and 76% of Co-operatives have been getting sufficient loans.
From the Table 5.10, it can be seen that the „p‟ value is less than
0.01 and hence it is proved that there is a relationship between the Getting
of Sufficient Loans and the Area of the Study. While making an analysis,
it can be seen from the Table 5.10 that more number of private dealers are
given sufficient loans in the Delta zone (17.9%) compared to the Semi-arid
zone (12.3%). In both the zones, the Co-operatives are satisfied in getting
sufficient loans from the Central and the State Co-operative Banks.
SECTION III
5.4. PARTICULARS OF PURCHASES (BUYING)
“Buying comprises all those activities involved in finding suitable
sources of supply, selecting the desired quantity, quality, grade style and
size and coming to an agreement with reference to the price, delivery data
and other conditions”.
The fertilizer dealers have been purchasing the fertilizers from
various manufacturing companies as well as wholesalers. After
determining the demand, they plan to purchase the required fertilizers. The
Wholesalers stock or accumulate the fertilizers in one place and sometimes
sell. The retailers buy small quantities and sell those fertilizers to the
sellers. The Companies whose products are purchased, the purchase
channels, the timing of purchases, the difficulties in purchasing of

171
fertilizers, getting of the required stock in time and the reasons for the
delay have been analyzed in this Section.
5.4.1. Companies whose products are purchased
Fertilizers production can be done in all the three major sectors of
the economy, namely Private enterprise, Public enterprise and Co-
operatives. Co-operatives purchased their fertilizers from IFFCO. The
fertilizer dealers get the fertilizers from the various manufacturing
companies. The different types of chemical fertilizers are purchased from
different companies to give the required fertilizer to the farmers which is
shown in Table 5.11.
Table 5.11
Companies Whose Products Are Purchased
Name of the
suppliers
Semi arid zone Delta zone
Yes No Yes No
M.F.L. 39
(43.8)
11
(100.0)
50
(56.2)
-
FACT 44
(55.0)
6
(30.0)
36
(45.0)
14
(70.0)
IPL 32
(69.6)
18
(33.3)
14
(30.4)
36
(66.7)
Kothari Ltd.
28
(53.8)
22
(45.8)
24
(46.2)
26
(54.2)
Parry India
Ltd.
27
(45.8)
23
(56.1)
32
(54.2)
18
(43.9)
Source : Primary Data The values within ( ) refer to Row%

172
From the Table 5.11, it is understood that in the Semi-arid zone, the
first choice of the fertilizer dealers for their purchases is FACT Fertilizers
followed by MFL. The next choice is the purchase from IPL Fertilizers.
Kothari and Parry Fertilizers are almost purchased by equal number of the
fertilizer dealers. In the Delta zone, MFL Fertilizers are purchased by
more number of private dealers. Both FACT and PARRY Fertilizers are
equally purchased by the private dealers. The next choice is Kothari
Fertilizers followed by the least choice of the fertilizers from IPL
Fertilizers.
5.4.2. Sources of the Purchase channels
The fertilizers are purchased through various purchase channels viz.,
the Manufacturing company, the wholesale dealers and the Co-operatives.
The wholesalers directly purchase from the manufacturing company and
sell to the farmers directly because they do both wholesale and retail
business together. The retailers purchase from the wholesalers and
distribute to the farmers. The Co-operatives are purchase from the Co-
operative Market Federations.

173
Table 5.12.
Sources Of The Purchase Channels Of The Fertilizer Dealers
Purchase
channels
Semi-arid zone Delta zone
Total
Chi
square
value
P
Value Private
Dealers
Co-op. Private
dealers
Co-op.
Manufac
-turing
Company
15
(38.5)
[30.0]
-
24
(61.5)
[48.0]
-
39
206.81
0.000** Wholesale
Dealer
35
(57.4)
[70.0]
-
26
(42.6)
[52.0]
-
61
Co-
operatives
- 50
(50.0)
[100.0]
- 50
(50.0)
[100.0]
100
Total
50 50 50 50 200
Source : Primary Data, Computed by the Researcher
** denotes significant at 1% level
The values within ( ) refer to Row% and within [ ] refer to Column%
It can be seen from the above Table 5.12.that within the Semi-arid
zone most of the fertilizer dealers, about 70% have purchased from the
wholesalers and the remaining 30% only have been purchasing from the
manufacturers. Within the Delta zone, 52% of the fertilizer dealers have
purchased from the wholesalers and 48% from the manufacturers. The co-
operatives were purchasing from the Co-operative Marketing Federations.
While analyzing the Table 5.12, it can be seen that the „p‟ value is
less than 0.01 and hence it can be proved that there is a relationship
between the sources of the purchase channels and the Area of the Study.
More number of the private dealers (61.5%) have been purchasing from the

174
manufacturing company compared to the Semi-arid zone (38.5%) and it is
vice versa in the case of the purchase of fertilizers from the wholesalers
more in the Semi-arid zone.
5.4.3. Timing of the Purchase of the Fertilizers by the fertilizer dealers
The Chemical fertilizers are perishable by nature and they cannot be
stored for more than 3-4 months. During rainy season, the products like
Urea get depleted. Hence they have to be kept carefully. This warrants the
fertilizer traders not to go for a single bulk purchase, but at the same time
to meet the peak season needs. So they have to keep a good stock. Only
experience in this business could strike out a balance. The fertilizer dealers
have been purchasing the fertilizers at different times to meet the required
needs of farmers. Table 5.13 shows the timing of the purchase of the
fertilizers by the fertilizer dealers. In the Study Area, the fertilizer dealers
have been purchasing fortnightly or according to the demand.

175
Table 5.13.
Timing Of The Purchase Of The Fertilizers By The Fertilizer Dealers
Source : Primary Data, Computed by the Researcher
** denotes significant at 1% level
The values within ( ) refer to Row% and within [ ] refer to Column%
From the figure 5.13, it can be seen that in the Semi-arid zone, most
of the farmers i.e., 68% of the fertilizer dealers have purchased the
fertilizers according to the demand. 32% of the dealers have purchased
fortnightly. In the Delta zone, the private dealers are equally purchasing in
both timings (50% each). The Semi arid co-operatives purchased mostly
according to the demand where as the Delta zone Co-operatives purchased
fortnightly to satisfy the needs of the farmers. From the Table 5.13, it can
be inferred that the „p‟ value is less than 0.05 and hence it is proved that
there is a relationship between the timing of the purchase of the fertilizers
by the fertilizer dealers and the Area of the Study. While making a
comparative study it can be seen that more number of the Delta zone
fertilizer dealers (30.5) have purchased fortnightly than the Semi-arid zone
private dealers (19.5%).
Timing of
purchases
Semi Arid zone Delta zone
Total
Chi
square
value
P
value Private
dealers
Co-
op.
Private
dealers
Co-
op.
Fort
-nightly
16
(19.5)
[32.0]
6
(7.3)
[12.0]
25
(30.5)
[50.0]
35
(42.7)
[75.0]
82
38.115
0.000**
According
to
Demand
34
(28.8)
[68.0]
44
(37.3)
[88.0]
25
(21.2)
[50.0]
15
(12.7)
[30.0]
118
Total 50
50 50 50 200

176
Figure.5.4. Timing of the Purchase of the Fertilizers by the Private
Dealers
5.4.4. Preference of the Particular Company Products
The fertilizer dealer can purchase the fertilizers from any
manufacturer. Sometimes they may give preference for the particular
company‟s products or wholesalers. The preference is shown in the Table
5.14.
16
6
25
35
34
44
25
15
0 10 20 30 40 50 60
S.A. Private
S.A. Co-op.
Delta Private
Delta Co-op
ZONE
Fortnightly According to Demand

177
Table 5.14.
Preference Of The Particular Company Products
Preference
of particular
products
Semi-arid
zone
Delta zone Total Chi
square
value
67.966
P
Value
0.000**
Private
dealers
Private
dealers
Yes
22
(35.5 )
[44.0]
40
(64.5 )
[80.0]
62
No
28
(73.7)
[56.0]
10
(26.3)
[20.0]
38
Total 50 50 100
Source: Primary Data, Computed by the Researcher
** denotes significant at 1% level
The values within ( ) refer to Row% and within [ ] refer to Column%
From the Table 5.14, it can be seen that within the Semi-arid zone
44% of the private dealers have been giving preference to the particular
company products and the remaining 56% of the dealers surveyed have not
given such a preference for their purchases. But in the Delta zone, a
majority of 80% of the fertilizer dealers had given preference for the
purchase of the fertilizers from the particular companies.
The Table 5.14 shows that the „p‟ value is less than 0.01 and hence it
is proved that there is a relationship between the preference of the
particular company products and the Area of the Study at 1% level. While
comparing both the zones, in the Delta zone most of the private dealers

178
(64.5%) have given preference to purchase their products from the
particular companies when compared to the Semi-arid zone (35.5%).
5.4.5. Difficulties in the purchase of the fertilizers
The private dealers have been purchasing their fertilizers either from
their wholesalers or from the manufacturers. While purchasing them, they
have some difficulties. The Co-operative societies have been purchasing
from the Co-operative federations.
Table 5.15.
Difficulties In The Purchase Of The Fertilizers
Difficulti
-es in the
purchase
Semi-arid zone Delta zone Total Chi
square
Value
P
value
Private
dealers
Co-
ops.
Private
Dealers
Co-
ops.
Yes
41
(37.6)
[82.0]
23
(21.1)
[46.0]
35
(32.1)
[70.0]
10
(9.2)
[20.0]
109
45.549
0.000**
No
9
(9.9)
[18.0]
27
(29.7)
[54.0]
15
(16.5)
[30.0]
40
(44.0)
[80.0]
91
Total 50
50
50
50
200
Source : Primary Data, Computed by the Researcher
** denotes significant at 1% level
The values within ( ) refer to Row% and within [ ] refer to Column%
From the Table 5.15, it is understood that within the Semi-arid zone,
a majority of the private dealers, i.e., 82% have been facing difficulties in
179
the purchase of the fertilizers and the remaining 18% do not feel any
difficulty in purchasing fertilizers. As far as the Co-operatives are
concerned, 46% have faced problems in their purchases. In the Delta
zone, most of the private dealers about 70% have problems in the purchase
of the fertilizers. Only 20% of the Co-operative societies have been facing
difficulties in the purchase of the fertilizers.
The Table 5.15 shows that the „p‟ value is less than 0.01 and it is
proved that there is a relationship between the difficulties in the purchases
and the Area of the Study. While analyzing the relationship, it is found
that as far as the private dealers and Co-operatives are concerned, the Delta
zone is better than the Semi-arid zone. The Semi-arid zone fertilizer
dealers have been facing more difficulties in purchases than the Delta zone
dealers.
5.4.6. Getting the required stock in time from the suppliers
The fertilizer dealers, both the private and the Co-operatives have
been getting the fertilizers from the suppliers in order to meet the needs of
the farmers. But sometimes they could not get the required stock in time
owing to various reasons that how many of them have been getting the
required stock in time has been shown in the Table 5.16.

180
Table 5.16.
Getting The Required Stock In Time From Suppliers
Getting
required
stock in
time
Semi arid zone Delta zone
Total
Chi
square
value
55.942
P
value
0.000**
Private Co-
op.
Private Co-
op.
Yes
11
(11.2)
[22.0]
27
(27.6)
54.0]
15
(15.3)
[30.0]
45
45.9)
[90.0]
98
No
39
(38.2)
[78.0]
23
(22.5)
[46.0]
35
(34.3)
[70.0]
5
(4.9)
[10.0]
102
Total 50
50
50
50
200
Source : Primary Data, Computed by the Researcher
** denotes significant at 1% level
The values within ( ) refer to Row% and within [ ] refer to Column%
From the Table 5.16, it is inferred that within the Semi-arid zone
only 22% of the private dealers have been getting the stock at the needed
time and a majority of the dealers i.e., about 78% of the private dealers
have not been in a position to get the needed stock in time. Similarly
46% of the Semi-arid co-operatives have not been getting the stock within
the stipulated time.
In the Delta zone, 70% of the private dealers have not been
receiving the stock at the right time and only 30% of the surveyed private
dealers could receive the stock in time. Only 5% of the Delta Co-
operatives could not receive the required stock and the other 95% of the
Co-operative societies have been receiving the fertilizers at the right time.
When the researcher was analyzing the Table 5.16, it could be inferred that

181
the Delta dealers could get the required stock in time compared to the
Semi-arid zone private dealers (11.2%) and the Co-operatives (27.6%) who
could get the required stock in time. The Delta zone private dealers
(15.3 %) and Co-operatives (45.9%) were better.
5.4.7. Reasons for not getting the stock in time
The Table 5.17 depicts the reasons for not getting the stock in time
by the fertilizer dealers. The fertilizer dealers could not get the needed
stock at the right time from the suppliers because of so many reasons viz.,
insufficient stock, finance problems and transport problems.
Table 5.17.
Reasons For Not Getting The Stock In Time
Reasons Semi arid zone Delta zone
Total Private Co-op. Private Co-op.
Insufficient
Stock
12
[30.8]
9
[39.1]
9
[25.7]
1
[20.0]
31
Finance
problems
17
[43.6]
1
[4.3]
17
[48.6]
-
-
35
Transport
Problems
10
[25.6]
13
[56.5]
9
[25.7]
4
[80.0]
36
Total
39
23
35
5
102
Source : Primary Data , The values within [ ] refer to Column%

182
The Table 5.17 shows the reasons for not getting the required stock
in time by the fertilizer dealers. Within the Semi-arid zone, more number
of private dealers i.e., 43.6% have the reasons that owing the finance
problems they could not get the stock at the right time. The next major
reason is the insufficient stock position of the suppliers which shows
30.8% and 25.6% of the private dealers have the transport problems. In the
Co-operatives, the Table shows the transport problems as 56.5%, the
insufficient stock position as 39.1% and 4.3% for the finance problems.
Within the Delta zone, more number of private dealers i.e., 48.6%
have the reasons that owing to the finance problems they could not get the
stock at the right time. Other major reasons were the insufficient stock
position and the transport problems of the suppliers which show 25.7 %
each. In the Co-operatives, the Table shows the transport problems as 80%
and the insufficient stock position as 20%. Both the Delta and Semi-arid
private dealers have suffered equally because of the finance problems and
the transport problems for not getting the needed stock at the appropriate
time. Moreover the Semi-arid private dealers and Co-operatives have the
problems of the insufficient stock with their suppliers.

183
Figure. 5.5. Reasons for not getting the required stock in time
5.4.8. Getting of credit facilities from the suppliers
The suppliers of the fertilizers have been giving the credit facilities
by granting the fertilizers on credit. This credit will be helpful to the
fertilizer dealers to meet the needs of the customers by getting the required
fertilizers at the right time without immediate cash payment. Such a type
of credit will be helpful to strengthen the business of fertilizer dealers.
0
2 4
6 8
10 12
14 16
18
S.A.
Private
S.A. Co-
op.
Delta
Private
Delta Co-
op
ZONE
Insufficient Stock
Finance Problems
Transport Problem

184
Table 5.18.
Getting Of Credit Facilities From The Suppliers
Getting
of the
credit
facilities
Semi-arid zone Delta zone
Total
Chi
square
value
P
Value
Private
dealers
Co-
op.
Private
dealers
Co-
op.
Yes
35
(22.0)
[70.0]
50
(31.4)
100.0]
24
(15.1)
[48.0]
50
(31.4)
[100.0]
159
58.997
0.000**
No
15
(36.6)
[30.0]
-
-
26
(63.4)
[52.0]
-
-
41
Total 50
50
50
50
200
Source : Primary Data, Computed by the Researcher
** denotes significant at 1% level
The values within ( ) refer to Row% and within [ ] refer to Column%
From the Table 5.18, it can be seen that within the Semi-arid zone,
70% of the private dealers have been getting the credit facilities from their
suppliers and the remaining 30 % had not received the credit. But within
the Delta zone 52% of the private dealers could not receive credit facility
from the suppliers and 48% have got the credit facility from the suppliers.
All the Co-operatives have been getting the fertilizers on consignment
basis from the Co-operative Marketing Federations.
The Table 5.18 shows that the „p‟ value is less than 0.01. So it is
proved that there is a relationship between the getting of the credit facilities
from the suppliers and the Area of the Study. While analyzing the
comparison it can be seen that in the Delta zone more number of private

185
dealers (63.4%) have not been receiving the credit facilities compared to
the Semi-arid zone (36.6%).
SECTION IV
5.5 . SELLING
Selling is the crown of all marketing activities. The object of
selling is to dispose of goods at the satisfactory prices. It is called a
creative function. „Sales‟ is the life blood of business. The successful
selling depends on the intelligent buying and the efficient merchandising.
Selling, in its broad sense, aims not just at making the sales alone but also
finding the buyers, stimulating the demand and the providing of advice and
the services of the buyers. The Sales particulars, the provision of credit
facilities to the customers, the credit period, the commission on sales, the
profit margin and the expectations of the fertilizer dealers with regard to
the commission and the profit margin have been analyzed in this Section.
5.5.1. Providing the Credit Facilities to the Customers
The farmers in India cannot do cultivation without any financial
help. Finance is required for the productive needs. The fertilizer dealers
have been providing the credit facilities to the farmers. The Co-operative
Credit Societies play an important role by giving the fertilizers on credit.

186
Table 5.19
Providing The Credit Facilities To The Customers
Giving
credit
facility
Semi arid Zone Delta Zone
Total
Chi
square
value
P value
Private Co-op Private Co-op.
Yes
23
(16.7)
[46.0]
50
(36.2)
[100.0]
15
(10.9)
[30.0]
50
(36.2)
[100.0]
138
92.847
0.000**
No
27
(43.5)
[54.0]
-
-
35
(56.5)
[70.0]
-
-
62
Total 50
50
50
50
200
Source : Primary Data, Computed by the Researcher ** denotes significant at 1%
level The values within ( ) refer to Row% and within [ ] refer to Column%
From the Table 5.19, it is clear that all the Co-operatives provide
credit to farmers. The private traders‟ response relating to the provision of
credit facility can also be seen from the Table. It shows that within the
Semi-arid zone, 54% of the private dealers have not been giving credit to
the farmers in their purchases. Only 46% of them have been selling
fertilizers on credit. Within the Delta zone most of the private dealers i.e.,
about 70% have not been giving the credit facilities to the farmers and
only 30% of the private dealers have been giving fertilizers on credit.
From the Table 5.19, it can be inferred that the „p‟ value is less than 0.01
and it is proved that there is a relationship between the Semi-arid zone and
the Delta zone. While analyzing, it can be inferred that in the Delta zone
(56.5%) more Private fertilizer dealers have not been selling the fertilizers
on credit compared to the Semi-arid zone which shows 43.5%. Any trader

187
has to provide the credit facility to keep a good group of the loyal
customers. They alone will repeat the purchase every year. In the Semi-
arid zone more private dealers have been giving the credit facilities than
the Delta zone.
5.5.2. Period of the credit facilities given to the farmers
In both the zones, out of the 200 fertilizer dealers surveyed, 138 of
them have been giving credit to the farmers. Among them, all the 100 Co-
operative societies have given credit to the needed farmers. The fertilizer
dealers have given credit for one month or two months or three months and
above depending upon their needs. The period of credit given by the
fertilizer dealers is shown in the Table 5.20.
Table 5.20
Period Of The Credit Given To The Farmers
Period of
credit (in
months)
Semi arid Zone
Delta Zone
Total
Chi
square
value
P
Value Private
dealers
Co-op. Private
Dealers
Co-
op.
One
10
(55.6)
[43.5]
1
(5.6)
[2.0]
5
(27.8)
[33.3]
2
(11.1)
[4.0]
18
59.185
0.000**
Two
12
(20.0)
[52.2]
13
(21.7)
[26.0]
10
(16.7)
[66.7]
25
(41.7)
[50.0]
60
Three
and
above
1
( 1.7)
[4.3]
36
(60.0)
[72.0]
-
-
23
(38.3)
[46.0]
60
Total 23 50 15 50 138 Source : Primary Data, Computed by the Researcher ** denotes significant at 1%
level The values within ( ) refer to Row% and within [ ] refer to Column%

188
It can be seen that within the Semi-arid zone, out of 50 samples
surveyed, 23 private dealers have been given the credit to the farmers.
Among them, 52% of the private dealers have given the credit for two
months and 44% have given the credit for one month and only 4% have
given the credit for three months and more. Within the Delta zone, 15
private dealers have given credit to farmers in the procurement of the
fertilizers. Among them, 50% of the private dealers have given the credit
for two months, 46% have given for three months and more. Only 4%
have given one month credit. Most of the Co-operatives of both the zones
have been giving the credit for more than three months.
From the Table 5.20, it is understood that the „p‟ value is less than
0.01. So, it is proved that there is a relationship between the period of the
credit and the Area of the Study. From the Table 5.20, it is inferred that in
the Semi- arid zone more private dealers have given the credit for one
month only when compared to the Delta zone, where the farmers have
given the credit for two months. Semi-arid Co-operatives have been better
than all the types of the dealers surveyed because as many as 60% have
been giving the credit for more than three months.

189
Figure.5.6.
Period of credit given to the farmers by the fertilizer dealers
5.5.3. Rate of Commission for the Sale of the Fertilizers
The wholesalers have been getting the fertilizers from the
manufacturers. The retailers are an intermediate between the marketer and
the consumers. In the fertilizer business, both the wholesalers and the
retailers have close contact with the ultimate consumers (farmers). While
selling the fertilizers they get a certain percentage of commission which is
described in the table 5.21.
0 5
10 15
20 25
30
35 40
S.A. Private
S.A. Co- op.
Delta Private
Delta Co- op
ZONE
One month Two months
Three months & Above

190
Table 5.21
Rate Of Commission For The Sale Of The Fertilizers
Rate of
commission
(in %)
Semi-arid Zone Delta Zone
Total
Chi
Square
value
P Value Private
Dealers
Private
Dealers
5 to 10
26
(39.4)
[52.0]
40
(60.6)
[80.0]
66
8.734
0.003**
Above 10
24
(70.6)
[48.0]
10
(29.4)
[20.0]
34
Total 50 50 100 Source : Primary Data, Computed by the Researcher ** denotes significant at 1%
level The values within ( ) refer to Row% and within [ ] refer to Column%
From the Table 5.21, it can be understood that within the Semi-arid
zone 52% of the fertilizers private dealers have been getting 5% to 10% of
the commission and 48% have been getting above 10% . Within the Delta
zone most of the private dealers, about 80% have been receiving the
commission from 5% to 10% and only 20% have been getting above 10%.
From the table 5.21, it can be seen that the „p‟ value is less than 0.01
and it is proved that there is a relationship between the rate of commission
on sale and the Area of Study. When the researcher analyzed the
relationship it is inferred that the rate of commission for sale of fertilizer is
more i.e., above 10% in the Semi-arid zone (70.6%) compared to the Delta
zone (29.4%).

191
5.5.4 Expected Rate of Commission for the Fertilizer Dealers
The fertilizer traders are not satisfied with their rate of commission
on sale. They expect more about an increase of Rs.6 or Rs.7 for the sale as
commission. The expectations of the private dealers are given.
Table 5.22
Expected Rate Of Commission For Sale
Expected
Rate of
commission
(in Rs.)
Semi-arid
Zone
Delta Zone
Total
Chi
Square
value
P Value
Private
Dealers
Private
Dealers
6
22
(44.0)
[62.9]
28
(56.0)
[68.3]
50
0.248
0.619
7
13
(50.0)
[37.1]
13
(50.0)
[31.7]
26
Total 35 41 76 Source : Primary Data, Computed by the Researcher The values within ( ) refer to
Row% and within [ ] refer to Column%
Out of 100 private dealers sample surveyed, 76 of them are not
satisfied with their commission received on sale. From the figure 5.22, it
can be understood that within the Semi-arid zone, out of 35 private dealers,
63% of the private dealers have been expecting Rs.6 as the rate of
commission and remaining 37% have been in need of Rs.7 as commission.
Within the Delta zone, out of 41 private dealers, 68% have been
expecting Rs.6 and 32% of the private dealers were expecting Rs.7. From
the Table 5.22, it can be seen that the „p‟ value is more than 0.05 and hence

192
it is proved that there is no association between the expectations of
fertilizer dealers and area of the study.
5.5.5. Sufficiency of the Profit Margin of the Fertilizer Dealers
The researcher analyzed about the sufficiency of the fertilizer
dealers for the rate of returns (profit) they earned. Only when they earn
more profit, they can develop their business and get good yield from their
capital. Their opinion about the satisfaction of the profit margin received
from the private dealers has been surveyed and given in the Table 5.23.
Table 5.23
Sufficiency Of The Profit Margin Of
The Fertilizer Dealers
Profit
margin is
sufficient
Semi-arid
Zone
Delta Zone
Total
Chi
Square
value
P
Value Private
Dealers
Private
Dealers
Yes 28
(59.6)
[56.0]
19
(40.4)
[38.0]
47
3.252
0.071
No 22
(41.5)
[44.0]
31
(58.5)
[62.0]
53
Total 50 50 100 Source : Primary Data, Computed by the Researcher
The values within ( ) refer to Row % and within [ ] refer to Column %
From the Table 5.23, it is understood that within the Semi-arid zone,
56% of the private dealers have accepted the sufficiency of the profit
margin they earned. The remaining 44% have not got the sufficient margin
from their business. Within the Delta zone, 62% of the fertilizer dealers

193
have not got the sufficient profit and only 38% have been satisfied with
their profits. While analyzing the table for a comparative study, it is seen
that the „p‟ value is more than 0.05 and it is proved that there is no
relationship between the profit margin sufficiency and the Area of the
Study.
SECTION VI
5.6 WAREHOUSING
The hindrance of place is removed by the Warehousing. The
Storage can be defined as one of the marketing functions involving the
preservation of goods between the time of production and the time of
consumption. The place where the goods are stored is known as the
warehouse. A warehouse or a godown is a room or building possessing
facilities for the accumulation of goods and to perform other marketing
functions. In this Section an analysis has been done about the warehouses
of the fertilizer dealers, the rent paid for godowns, the distance between the
storing point and the shop. The goods are stored at a particular place and
from there, they are transported easily.
5.6.1. Warehousing of the fertilizers
On the basis of ownership, the warehouses are classified into the
Public warehouses, the Private godowns and the Co-operative warehouses.
The Public warehouses are used by the public and the rates of rent are
regulated by the government. The Private warehouses are owned by the
private and the large business houses such as the manufacturers, the

194
wholesalers and the Retailers etc., The Co-operative warehouses are buffer
godowns of the Co-operative Marketing Federations. Apart from that, the
private dealers have been storing their fertilizers in same rented buildings
also. The frequency distribution of the warehouses of the fertilizers is
depicted in the Table 5.24.
Table 5.24.
Warehouses Of The Fertilzer Dealers
Ware
-houses
Semi-arid Zone
Delta Zone
Total
Chi
Square
Value
P value
Private Co-op. Private Co-op.
Private
Godowns
29
(56.9)
[58.0]
-
22
(43.1)
[44.0]
-
51
212.642
0.000**
Public
Ware
-houses
2
(16.7)
[4.0]
-
10
(83.3)
[20.0]
-
12
Rented
Building
19
( 51.4)
[38.0]
-
18
(48.6)
[36.0]
-
37
Co-op.
Ware
-houses
-
50
(50.0)
[100.0]
-
50
(50.0)
[100.0]
100
Total 50 50 50 50 200 Source : Primary Data, Computed by the Researcher ** denotes significant at 1%
level. The values within ( ) refer to Row% and within [ ] refer to Column%
From the Table 5.24, it can be seen that within the Semi-arid zone,
58% of private dealers have been keeping the fertilizers in the private
godowns owned by manufacturers or wholesalers. 38% of the private
dealers stored these fertilizers in the rented buildings. Only 4% have
chosen the public warehouses for their storage. Within the Delta zone 44%
195
of the private dealers used the private godowns and 36% used the rented
building for the storage purpose. 20% of the private dealers stored the
fertilizers in the public warehouses in both the zones. All the Co-
operatives have been maintaining the Buffer stock with the TCMF
godowns or the TNWH corporation or the Central Warehousing
Corporation. The Co-operative societies have been getting the required
stock from the Marketing Federations concerned before making an indent.
The table 5.24 shows that the „p‟ value is less than 0.01 and so it is
proved that there is a relationship between the warehouse of the fertilizers
and the Area of the Study. In the Delta zone, more private dealers (83.3%)
stored in the public warehouses compared to the Semi-arid zone (16.7%
only). More private dealers (56.9%) have stored in the private godowns in
the Semi-arid zone compared to the Delta zone (43.1%). The rented
buildings chosen by the private dealers in both the zones are more or less
equal.
The following figure 5.7 shows the Warehouses of the fertilizer
dealers.

196
Figure. 5.7. Warehouses of the Fertilizer Dealers
5.6.2. Rent for godowns
The rent paid by the dealers for the godowns are given.
Table 5.25
Rent Paid For The Godowns
Rent for the
Godown
(in Rs.)
Per month
Semi Arid
Zone
Delta Zone
Total
Chi
square
value
P
value
Private
dealers
Private
Dealers
1000 to
3000
27
(67.5)
[57.4]
13
(32.5)
[31.7]
40
4.964
0.026* 3000 &
Above
20
(41.6)
[42.6]
28
(58.3)
[68.3]
48
Total 47
41
88
Source : Primary Data, Computed by the Researcher * denotes significant at 5%
level The values within ( ) refer to Row% and within [ ] refer to Column%
0 5
10 15 20 25 30 35 40 45 50
S.A. Private
S.A. Co- op.
Delta Private
Delta Co- op
ZONE
Private Godowns
Public Warehouses
Rented Building
Co-operative warehouses

197
The private dealers have to pay the rent for the storage of the
fertilizers. The Godown rent is an important establishment expense that
the fertilizer dealers have to meet with. As per the 100 samples surveyed,
only 12 private dealers have their own godowns. The remaining 88 private
dealers have to pay the rent for their storage in the godowns.
From the Table 5.26, it can be seen that within the Semi-arid zone
47 samples out of 50 have to pay the rent for the godowns. Among them
57% of the dealers have been paying the rent from Rs.1,000 to Rs.3,000
per month and 43% have been paying more than Rs.3,000. Within the
Delta zone, most of the fertilizer dealers about 68% paid more than
Rs.3,000 for the storage and 32% of the private dealers paid Rs.1,000 to
Rs.3,000 as the rent for the godowns.
From the Table 5.25, it can be seen that the „p‟ value is less than
0.05 and it has been proved that there is a relationship between the rent for
the godowns and the Area of the Study. When the researcher analyzed the
relationship, it is found that in the Delta zone, more fertilizer dealers
(58.3%) have been paying above Rs.3, 000 as the rent compared to the
Semi- arid zone (41.6%). In the Semi-arid zone, more (67.5%) private
dealers have been paying Rs.1,000 to Rs.3,000 as the rent which is very
less in the Delta zone. (32.5% only).
5.6.3. Distance between the Storing Point and the Shop
The fertilizers dealers have to take fertilizers from the godown to
their shop. The distance traveled by the fertilizer dealers has been shown
in the Table 5.26.

198
Table 5.26
Distance between Storing Point and Shop
Distance
( in
kms.)
Semi arid Zone
Delta Zone
Total
Chi
square
value
P value
Private Co-op. Private Co-op.
Below 3
25
(31.6)
[50.0]
6
(7.60)
[12.0]
25
(31.6)
[50.0]
23
(29.1)
[46.0]
79
36.46
0.000**
3-5 18
(23.7)
[36.0]
19
(25.0)
[38.0]
17
(22.4)
[34.0]
22
(28.9)
[44.0]
76
Above 5
7
(15.6)
[14.0]
25
( 55.6)
[50.0]
8
(17.8)
[16.0]
5
(11.1)
[10.0]
45
Total 50 50 50 50 200
Source : Primary Data, Computed by the Researcher ** denotes significant at 1%
level The values within ( ) refer to Row% and within [ ] refer to Column%
From the Table 5.26, it can be inferred that within the Semi-arid
zone, 50% of the private dealers have to travel within 3 kms. to reach the
shop from their godowns. But the same percentages of the Co-operatives
have been traveling above 5 kms. 36% of the private dealers have been
travelling from 3 to 5 kms, and only 14% of the private dealers have to
travel above 5 kms. 38% of the Co-operatives have been travelling from
3 to 5 kms. and 12% have to go below 3 kms.
Within the Delta zone, 50% have been traveling within 3 kms. 34%
have to travel between 3 and 5 kms. and the remaining 16% have to travel
above 5 kms. from their shop to the storing point. But 46% of the Delta
Co-operatives can easily reach the storing point within 3 kms. 44%

199
travelled between 3 to 5 kms, and only 10% have been traveling above 5
kms. to reach the godowns.
The Table 5.26 shows the „p‟ value and it is less than 0.01 and hence
it is proved that there is a relationship between the distance from the
storing point to the shop and the Area of the Study. As far as the private
dealers are concerned, more or less they have to travel equal distance
between the storing point and the shop in both the zones. But the Co-
operatives differ. The Delta Co-operative Societies which have been
traveling within 3 kms are more compared to the Semi-arid zone. But in
the Semi-arid zone, more Co-operative Societies have to travel above 5
kms. compared to the Delta Co-operatives.
Figure. 5.8. Distance between the storing point and the shop
The above figure 5.8. shows the distance between the storing
point and the shop by the fertilizer dealers.
0
10
20
30
40
50
60
S.A. Private S.A. Co-op. Delta Private Delta Co-op
ZONE
Above 5 km
3km to 5 km
Below 3 km

200
SECTION – VI
5.7. TRANSPORTATION
The hindrance of place is also removed by transport. The physical
supply or the physical distribution of goods is one of the functions of
Marketing. Transportation is the key link and the nervous system of
marketing. It encourages the business by the mobilization of goods. It
helps for the physical movement of the goods from one place to another.
The fertilizers dealers have been taking the fertilizers either from the
manufacturers or the wholesalers.
The types of transport used, the transport freight, the distance
between the authorized godown and the shop have been analyzed in this
Section. Whether the fertilizer dealers have been getting adequate
transport facilities or not has also been analyzed in this Section.
5.7.1. Types of the Transport Used
In the fertilizer distribution business, the transport has to play a
crucial role. The success of this business depends on the efficient transport
service. For Co-operatives, this service is provided by the Co-operative
Marketing Federations. The mode of transport which is used to transport
the fertilizers is shown in the Table 5.27.

201
Table 5.27
Types Of Transport Used
Type of
transport
used
Semi arid Zone Delta Zone
Total
Chi
square
Value
P value Private
Dealers
Co-op. Private
Dealers
Co-op.
Lorry
46
(26.4)
[92.0]
44
(25.4)
[88.0]
39
(22.4)
[78.0]
45
(25.7)
[90.0]
174
3.654
0.301 Tractors 4
(15.4)
[8.0]
6
(23.1)
[12.0]
11
(42.3)
[22.0]
5
(19.2)
[10.0]
26
Total 50
50
50
50
200
Source : Primary Data, Computed by the Researcher
The values within ( ) refer to Row% and within [ ] refer to Column %
The Table 5.27 shows the types of transport used by the fertilizer
dealers. It can be seen that within the Semi-arid zone 96% of the private
dealers use Lorry and only 4% use tractors to carry their fertilizers. But
Within the Delta zone, 78% of the private dealers have taken lorry to
transport their fertilizers and the remaining 22% have used tractors.
Nearly 90% of the Co-operatives of both the zones take the fertilizers
through Lorry and the service is rendered by Co-operative Marketing
Federations. While analyzing the „p‟ value in the Table 5.27, it is more
than 0.05. So it is proved that there is no relationship between the types of
transport used and the Area of the Study.
5.7.2. Availing adequate transport facilities
The role of transport in the sphere of agriculture cannot be over -
emphasized. The Transport has a great bearing on distribution. The
business development would not have taken place if there had been

202
inadequate transport facilities. Hence it is necessary to analyze the
adequacy of the transport facilities availed by the fertilizer dealers.
Whether the fertilizer traders have been availing adequate transport
facilities or not has been analyzed in the Table 5.28.
Table 5.28.
Availing Adequate Transport Facilities
Availing
adequate
transport
facilities
Semi arid zone Delta zone
Total
Chi
square
value
P value
Private
dealers
Co-op. Private
dealers
Co-
op.
Yes
24
(15.6)
[48.0]
50
(32.5)
[100.0]
34
(22.1)
[68.0]
46
(29.9)
[92.0]
154
47.318 0.000** No
26
(56.5)
[52.0]
-
-
16
(34.8)
[32.0]
4
(8.7)
[8.0]
46
Total 50
50
50
50
200
Source : Primary Data, Computed by the Researcher ** denotes significant at 1%
level The values within ( ) refer to Row% and within [ ] refer to Column%
It can be seen from the above Table 5.28 that within the Semi-arid
zone, 52% of the private dealers do not have adequate transport facilities.
48% of the private dealers have been availing necessary transport facilities.
All the Co-operatives of the Semi-arid zone have been getting the required
transport facilities. Within the Delta zone, 68% of the private dealers have
been enjoying the adequate transport facilities for their fertilizer business.

203
The remaining 32% of the private dealers have difficulties in getting the
transport at the needed time. Only 8% of the Delta Co-operatives have not
got the adequate transport facilities.
From the Table 5.28, it can be seen that the „p‟ value is less than
0.01 and it is proved that there is a relationship between the availing
adequate transport facilities and the Area of the Study. When the
researcher analyzed the relationship, it is inferred that, compared to the
Delta zone (22.1%), more Semi-arid zone private dealers (15.6%) do not
have the adequate transport facilities. But all the Co-operatives of the
Semi-arid zone have the adequate transport to do their fertilizer marketing.
Compared to the Delta zone (22.1%), more Semi-arid zone private
dealers (15.6%) do not have the adequate transport facilities. But all the
Co-operatives of the Semi-arid zone have adequate transport to do their
fertilizer marketing.
5.7.3. Transport Freight paid by the Fertilizer Dealers
For availing the transport facilities, the fertilizer dealers have to pay
the transport freight and it is an establishment expense for Marketing. The
frequency distribution of the transport freight paid by the fertilizer dealers
is shown in the Table 5.29.

204
Table 5.29
Transport Freight Paid By The Fertilzier Dealers
Transport
freight
(in Rs.)
Semi Arid
Zone
Delta
Zone
Total Chi
square
value
5.661
P value
0.058
Private
Dealers
Private
Dealers
Upto 150
11
(33.3)
[22.0]
22
(66.7)
[44.0]
33
151 – 200
23
(56.1)
[46.0]
18
(43.9)
[36.0]
41
201 – 250 16
(61.5)
[32.0]
10
(38.5)
[20.0]
26
Total 50 50 100 Source : Primary Data, Computed by the Researcher
The values within ( ) refer to Row% and within [ ] refer to Column%
From the Table 5.29, it can be analyzed that within the Semi-arid
zone, 46% of the .private dealers surveyed have been paying from Rs.151
to Rs.200 as the transport cost followed by 32% of the private dealers who
have to pay Rs.201 to Rs.250. The remaining 22% paid up to Rs.150 as
the transport freight to carry their fertilizers. Within the Delta zone, 44%
of the private dealers paid up to Rs.150 to transport their fertilizers. 36%
of the sample private dealers paid from Rs.151 to Rs.200 and only 20% of
the fertilizer dealers paid above Rs.200. While analyzing the „p‟ value in
the table 5.29, it can be seen that the „p‟ value is more than 0.05. So it can
be concluded that there is no relationship between the transport freight paid
and the Area of the Study.

205
5.7.4. Distance Between the nearest Authorized Godown and the
Shop
The distance between the nearest authorized godown and the shop
has to be measured. If it is located far away, it may involve one more
additional transport cost. The details have been shown in the Table 5.30.
Table 5.30
Distance Between Nearest Authorized Godown And The Shop
Distance
(in Km.)
Semi arid zone Delta zone Total Chi
square
value
18.066
P
Value
0.006**
Private
dealers
Co-
op.
Private
dealers
Co-op.
Less than
25
6
(15.0)
[12.0]
14
(35.0)
[28.0]
5
(12.5)
[10.0]
15
(37.5)
[30.0]
40
25-40 21
(25.6)
[42.0]
18
(22.0)
[36.0]
18
(22.0)
[36.0]
25
(30.5)
[50.0]
82
More
than 40
23
(29.5)
[46.0]
18
(23.1)
[36.0]
27
(34.6)
[54.0]
10
(12.8)
[20.0]
78
Total 50
50
50
50
200
Source : Primary Data, Computed by the Researcher ** denotes significant at 1%
level. The values within ( ) refer to Row% and within [ ] refer to Column%
The Table 5.30 shows the distance between the authorized godown
and the shop. Within the Semi-arid zone, 40% of the private dealers have
to go more than 40 km. to reach the nearest authorized godown from their
shop. The distance of 42% of the private dealers fall under 25km to 40

206
km. 36% in each category viz., 25km to 40 km and more than 40 kms.
have fallen for the Co-operatives.
Within the Delta zone, as many as 54% of the private dealers have
the distance of more than 40 km from their shop to the authorized godown.
36% of the private dealers came under the category 25 km to 40 km.
distance. Among the Delta co-operatives 50% of them have to cover the
distance from 25km to 40 km. followed by 30% who have to cover the
distance of less than 25 km.
While analyzing the „p‟ value in the Table 5.30, it can be seen that it
is less than 0.01 and it is proved that there is relationship between distance
between the authorized godown and the shop. It can be seen that more
private dealers (34.6%) have to cover more than 40 km compared to the
Semi-arid zone (29.5%). But it is vice versa in the case of co-operatives.
More Semi-arid zone Co-operatives has the distance of more than 40 km.
(23.1%) than the Delta zone Co-operatives (12.8%).
The distance between the authorized godown and the shop is given
in the following Fig. 5.9.

207
Figure.5.9.
Distance between the nearest authorized godown and the shop
SECTION VII
5.8. ADVERTISEMENT AND SALES PROMOTION
The hindrance of Knowledge is removed by the advertisement and
the sales promotion. Advertising is the mass communication of the
information intended to persuade the buyers as to maximize the profits.
The Advertisement reaches the masses. The sales promotions are defined
as those marketing activities which stimulate the consumer purchasing and
the dealer effectiveness. Both Advertisements and Sales promotional
activities are very essential in Marketing. The types of sales promotional
activities, the advertisement materials have been analyzed in this Section.
Whether the manufacturers help in the sales promotion or not has also been
analyzed.
0
5
10
15
20
25
30
S.A. Private S.A. Co-op. Delta Private
Delta Co- op
ZONE
Less than 25 km
25km - 40km
More than 40 km

208
5.8.1. Sales promotional activities of fertilize dealers
Advertising and sales promotions are the most challenging part of
the marketing job in the rural areas of India. How many of them were
doing the sales promotional activities was shown in the Table 5.31.
Table 5.31
Sales Promotional Activities Of The
Fertilizer Dealers
Sales
promotional
Activities
Semi arid zone Delta zone Total Chi
square
value
17.011
P
Value
0.000**
Private
dealers
Co-
op.
Private
dealers
Co-
op.
Yes
21
(16.3)
[42.0]
40
(31.0)
[80.0]
35
(27.1)
[70.0]
33
(22.6)
[66.0]
129
No 29
(40.8)
[58.0]
10
(14.1)
[20.0]
15
(21.1)
[30.0]
17
(23.9)
[34.0]
71
Total 50
50
50
50
200
Source : Primary Data, Computed by the Researcher ** denotes significant at 1%
level The values within ( ) refer to Row% and within [ ] refer to Column%
From the Table 5.31, it can be understood that within the Semi-arid
zone, 58% of the private dealers do not carry out any sales promotional
activities and 42% of them have been doing the sales promotional activities
to boost up their fertilizer sales. Most of the Co-operative Societies of the
Semi-arid zone i.e., 80% have been promoting their sales by the sales
promotional measures. Within the Delta zone, as many as 70% of the
private dealers concentrated on the sales promotion. 66% of the Delta zone
Co-operatives has been doing the sales promotional activities.
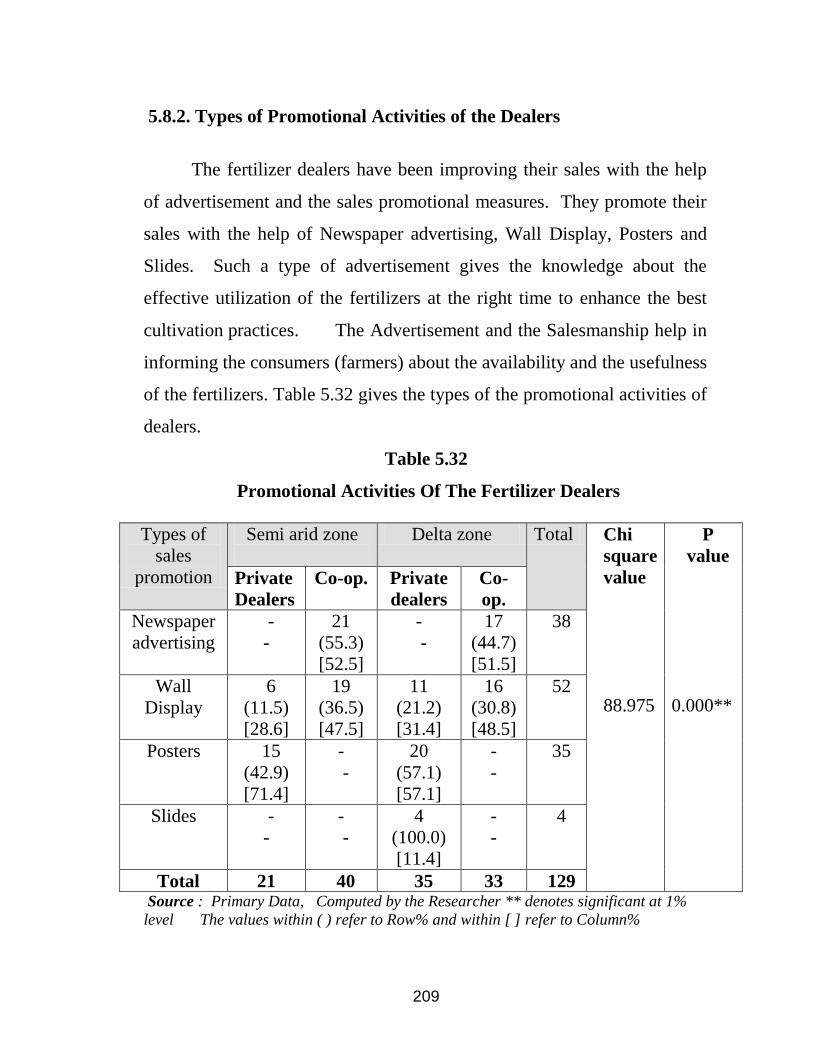
209
5.8.2. Types of Promotional Activities of the Dealers
The fertilizer dealers have been improving their sales with the help
of advertisement and the sales promotional measures. They promote their
sales with the help of Newspaper advertising, Wall Display, Posters and
Slides. Such a type of advertisement gives the knowledge about the
effective utilization of the fertilizers at the right time to enhance the best
cultivation practices. The Advertisement and the Salesmanship help in
informing the consumers (farmers) about the availability and the usefulness
of the fertilizers. Table 5.32 gives the types of the promotional activities of
dealers.
Table 5.32
Promotional Activities Of The Fertilizer Dealers
Types of
sales
promotion
Semi arid zone
Delta zone Total Chi
square
value
88.975
P
value
0.000**
Private
Dealers
Co-op. Private
dealers
Co-
op.
Newspaper
advertising
-
-
21
(55.3)
[52.5]
-
-
17
(44.7)
[51.5]
38
Wall
Display
6
(11.5)
[28.6]
19
(36.5)
[47.5]
11
(21.2)
[31.4]
16
(30.8)
[48.5]
52
Posters
15
(42.9)
[71.4]
-
-
20
(57.1)
[57.1]
-
-
35
Slides
-
-
-
-
4
(100.0)
[11.4]
-
-
4
Total 21 40 35 33 129 Source : Primary Data, Computed by the Researcher ** denotes significant at 1%
level The values within ( ) refer to Row% and within [ ] refer to Column%

210
From the Table 5.32, it can be inferred that out of 200 samples, 129
fertilizer dealers have made the sales promotional activities. Among
them, it can be seen from the table 5.32 that within the Semi-arid zone,
71% were promoting with the help of posters and remaining 29% used
wall display. The Semi-arid Co-operatives, i.e., 53% of them, have been
using Newspaper advertisement and the remaining used wall display for
the sales increase. Within the Delta zone 57% have believed in the posters
and the wall display has been done by 31% of the private dealers. 51% of
the Delta Co-operatives have been targeting the farmers with the help of
Newspaper advertising.
It can be analyzed from the Table 5.34 that the „p‟ value is less than
0.01 and hence it is proved that there is a relationship between the types of
the promotional activities and the Area of the Study. It can be seen that the
in the Semi-arid zone, more Co-operatives (55.3%) were doing their sales
promotion with the help of Newspaper advertising compared to the Delta
zone (44.7%). The advertisements through posters were popular and more
in the Delta zone (57%) compared to the Semi-arid zone (43%) by the
private dealers. Wall display is very popular in the Semi-arid Co-operative
Societies (37%) among the other types of the fertilizer dealers.
The Figure 5.10. clearly shows the different types of sales
promotional activities done by the fertilizer dealers in both the Semi-arid
zone and the Delta zone.

211
Figure. 5.10. Promotional activities of the Fertilizer Dealers
0 0
6
15
0
21
19
0
0
0
11 20
4
17
16
0
0
0
10
20
30
40
50
60
Ne
ws
pa
pe
r
ad
ve
rtisin
g
Wa
ll Dis
pla
y
Po
ste
rs
Slid
es
Semi arid zone Private Semi arid zone Co-op.
Delta zone Private dealers Delta zone Co-op.
5.8.3. Manufacturers‟ support in advertising
The fertilizer manufacturers support the dealers in advertising their
fertilizers. They give the advertisement materials, sign hoardings, leaflets,
and wall display facilities etc. to the fertilizer dealers.
Table 5.33
MANUFACTURERS‟ SUPPORT IN ADVERTISING
Manufa
cturers‟
help
Semi arid zone Delta zone
Total
Chi
square
value
19.736
P
Value
0.000**
Private
dealers
Co-op. Private
dealers
Co-op.
Yes
43
(23.5)
[86.0]
50
(27.3)
100.0]
40
(21.9)
[80.0]
50
(27.3)
[100.0]
183
No 7
(41.2)
[14.0]
-
-
10
(58.8)
[20.0]
-
-
17
Total 50 50 50 50 200 Source : Primary Data, Computed by the Researcher. ** significant at 1% level
The values within ( ) refer to Row% and within [ ] refer to Column%

212
The Table 5.35 shows clearly that all the co-operative societies in
both zones have been getting the support from their manufacturers in
advertising their products. Within the Semi-arid zone, majority of the
private dealers, i.e., 86% have got the help of the manufacturers in
advertising. The remaining 14% of the private dealers have not been
assisted by the manufacturers. In the Delta zone also, 80% of the private
dealers have enjoyed the support of the manufacturers in advertising and
sales promotion.
The table 5.33 shows that the „p‟ value is less than 0.01 and hence it
is proved that there is a relationship between the manufacturers‟ support in
advertising and the Area of the Study. It has been found out that in the
Semi-arid zone more private dealers have been getting the support in
advertising from the manufacturers compared to the Delta zone to some
extent.
Table 5.34
Friedman Test For The Difference Between The Types Of
Competitions Faced By The Fertilizer Traders
Type of Competition Mean
Rank
Chi-Square
Value
P Value
Price Reduction 2.60 (2)
29.301
0.000** Discount 2.98 (1)
More credit facilities 1.86 (4)
Heavy Advertisement 2.56 (3)
Source: Computed by the Researcher
Figures within ( ) denotes the Mean Rank ** Significant at 1 % level

213
From the above Table 5.34, it can be seen that the fertilizer traders
are facing different types of competitions in the fertilizer trading business.
The Friedman Test has been applied to analyze the significant difference
between the various types of competitions. The Mean values of the types
of competitions have been ranked in order to know the order of
significance. The first rank went to „Discount‟ which is the main threat for
the traders followed by price reduction which has got the second rank. The
third rank has been given to heavy advertisement as per the opinion of the
fertilizer traders. More credit facilities have less botheration among the
competitions faced by the fertilizer traders.
Table 5.35
Competitions Faced By Fertilizer Traders
Type of Competition
faced by the Fertilizer
Dealers
AREA OF STUDY
SEMI-ARID ZONE DELTA ZONE
Private
Traders
Mean
Co-
operatives
Mean
Private
Traders
Mean
Co-
operatives
Mean
Price Reduction 3.22 3.50 2.32 2.66
Discount 3.38 3.02 3.82 3.38
More Credit Facilities 2.96 2.72 1.50 1.50
Heavy Advertisement 2.20 2.28 4.32 4.08
Source : Computed by the Researcher

214
From the Table 5.35, it can be seen that the Semi-arid zone Co-
operatives have been facing the competition in marketing of the fertilizers
because of the price reduction strategies but this is positive for the private
traders in the Delta zone. But those private traders of the Delta zone have
to face the challenge of „Discount‟ and is least bothered by Semi-arid Co-
operatives. Similarly the Semi-arid private traders face competitions
regarding the credit facilities. Such a problem is not there in the Delta zone
for both the type of the fertilizer traders. There is another threat for Delta
zone fertilizer traders about the „Heavy Advertisement‟ which shows the
Mean value of 4.32. So in the Semi-arid zone „Price Reduction‟ and „More
Credit Facilities‟ are the main competitions faced by the fertilizer traders.
Whereas in the Delta zone „Discount‟ and „Heavy Advertisement‟ are the
competitions faced by private traders of the fertilizers.
5.9. DISCRIMINANT ANALYSIS – Cluster Justification
In this analysis, the test of equality of group Means, Canonical
correlation Co-efficient and Wilks Lamda co-efficient are displayed to
prove the cluster justification.

215
Table 5.36
Test of Equality of Group Mean for the Functions of Marketing
Features of Marketing Wilks‟
Lambda
F df1 df2 P Value
Educational Qualification 0.939 6.364 1 98 0.013
Age Group 0.988 1.225 1 98 0.271
Nature of Business 0.983 1.728 1 98 0.192
Experience in Business in years 0.950 5.160 1 98 0.025
Dealing of Inputs 0.924 8.111 1 98 0.005
Amount of Capital Investment 0.922 8.321 1 98 0.005
Sources of Finance 0.974 2.579 1 98 0.112
Getting Sufficient Loan 0.983 1.649 1 98 0.202
Purchase of Fertilizers 0.966 3.454 1 98 0.066
Purchase Timings 0.967 3.395 1 98 0.068
Difficulty in purchasing fertilizers 0.980 1.973 1 98 0.163
Getting of required stock in time 0.992 0.822 1 98 0.367
Providing credit to customers 0.973 2.736 1 98 0.101
Rate of commission 0.913 9.379 1 98 0.003
Profit Margin 0.967 3.294 1 98 0.073
Competitions facing 0.976 2.389 1 98 0.125
Transport facilities 0.930 7.361 1 98 0.008
Distance coverage to reach shop 0.903 10.470 1 98 0.002
Enjoying adequate transport facilities 0.959 4.195 1 98 0.043
Transport freight 0.951 5.092 1 98 0.026
Sales promotional activities 0.920 8.469 1 98 0.004
Help from Manufacturing companies 0.994 0.629 1 98 0.430
More effective advertisement material 0.935 6.866 1 98 0.010
Sales promotional activities by
manufacturing companies
0.940 6.255 1 98 0.014
From the above Table 5.36, the Equality of Group Mean for all the
features of marketing can be seen. The classification is mainly done with
the help of various features of marketing with four different group of
fertilizer traders. So it is indispensable to establish a relationship between
the cluster and the factor scores. The exploitation of Canonical Correlation
is highly useful in establishing frequencies of clusters and factor scores in
the form of a Linear Discriminant Function.

216
Table 5.37
Eigen Values of Functions of the Marketing
Function Eigen
values
Percentage
of Variance
Cumulative
Percentage
Canonical
Correlation
1 5.287 100.0 100.0 0.917
Source : Summary of Canonical Discriminant Functions
Table 5.37 gives the Eigen value 5.287 with individual Variance of
100 % for the discriminant function. This function established a profound
relationship between the fertilizer dealers in both the zones (Semi-arid and
Delta ) in the form of Canonical Correlation Co-efficient namely 0.917.
This value is also statistically significant. To verify the effect of the
Discriminant function, the researcher used Wilk‟s Lambda parameter.
Table 5.38
Wilks‟ Lambda values of the Functions of Marketing
Test of
Function
Wilks‟
Lambda
Chi-square df P
value
1 0.159 168.222 13 0.000
Source : Summary of Canonical Discriminant Functions
The Table 5.38 clearly identifies that the test of functions for the
Discriminant Function has the Wilks‟ Lambda value as 0.159 and the Chi
square value is as 168.222. The cumulative effect is statistically
significant. Therefore, it is concluded that the Discriminant Function

217
perfectly match the Functions of Marketing and the two zones. This
function is further explored by the classification of Function co-efficient.
Table 5.39
Classification of Function Co-efficient
Functions Group
Semi Arid
dealer
Delta
Dealer
Sources of finance 53.731 46.770
Purchase of fertilizer 57.622 53.618
Preference of company product 20.739 7.567
Difficulty in purchases 27.662 33.448
Sufficient Profit Margin 49.889 38.125
Adequate Transport facilities 11.749 10.878
Sales promotional activities 14.487
16.969
Fisher’s Linear Discriminant Function
From the Table 5.39, it can be seen that the above seven factors are
taken for the classification of results through Fisher‟s Linear Discriminant
Function. This Table clearly indicates the consistency of various functions
of marketing in both the zones. They differ in all the aspects of Marketing
and hence the clusters are being justified.
Table 5.40
Classification Results
Function
Group
Predicted Group
Membership
Total
Semi Arid
dealer
Delta
dealer
Count Semi-arid Dealer
Delta Dealer
48 2 50
0 50 50
Percentage
Semi-arid Dealer
Delta dealer
96.0 4.0 100.0
0.0 100.0 100.0 98 .0 % of original grouped cases correctly classified

218
From the above Table 5.40, it is clearly proved that 98.0% of the
original grouped cases are correctly classified. The classification of
samples is originally grouped as per the terminology and hence the clusters
are being justified.
5.10. CONCLUSION
Marketing is a very important aspect in business since it contributes
greatly to the success of the organization. Production and distribution
depend largely on Marketing. It is the process of introducing and
promoting the product or service into the market. The major marketing
management decisions can be classified in one of the major categories viz.,
Product, Price, Place and Promotion. The variables are known as the
Marketing Mix. The variables have to be controlled in order to achieve the
goals of the business.
Hence Fertilizer Marketing is helpful to the farmers to get their
fertilizers for their cultivation. Fertilizer Marketing is the process of
planning and executing the conception, promotion and distribution of
fertilizers. The study of Marketing of Fertilizers is important to the basics
of running a fertilizer business. Today most nations, regardless of their
degree of economic development or their political philosophy have been
recognizing the importance of the functions of Marketing.

219
CHAPTER VI
WRAP-UP
6.1. INTRODUCTION
Being the largest component of India‟s economic life, agriculture is of
utmost importance for the vast number of people. India is predominantly a
rural economy where agricultural sector accounts for a remarkable
contribution of the country‟s exports. It supplies bulks of raw materials for a
large section of the industry. Despite tremendous increase in the production
of food grains, Indian agriculture is economically backward.
It is a paradox of the Indian situation that while nature has much to
give in respect of variety of soils, water, manpower etc, little comes out of
these at the present, due to poor irrigation facilities, low productivity of land,
small size of operational holdings, institutional and human drawbacks,
inadequacy and inefficient distribution of agricultural inputs like seeds,
fertilizers, pesticides, machinery and improved implements and lack of infra-
structural facilities.
The Indian agriculturists have limited resources and often say,
“Provide the inputs at our door steps, we shall take care of the rest”. It means
all is not well in this direction and very often the cultivators are not in a
position to get their inputs especially fertilizer in the proper manner. It is
therefore necessary that fertilizers should be made available to them at the
right place, at the right time, in the adequate quantity of the proper quality

220
and at right prices. In this Chapter, the problems in the Marketing of
Fertilizers have been analyzed and the Findings have been given. The
effective suggestive measures have also been specified. A strategic model
has also been developed to strengthen the Fertilizer Marketing.
6.2. SUMMARY
Marketing as a function of Management, has assumed significant
importance in the Modern World. Obviously marketing of the fertilizer must
be understood as a specialized job and has to be attended to accordingly. The
present Study is an attempt in this direction.
The introduction about Fertilizer Marketing and the Research Design
are present in Chapter I.– “Design and Execution of the Study”. The
Significance for the Study, the Background of the Study, Objectives, and
Hypotheses are also mentioned in this chapter.
As per the terminology, the different categories of farmer‟s viz.,
Marginal Farmers (MF), Small Farmers (SF), Medium Farmers (Me.F) and
Big Farmers (BF) were met to collect the data. 125 farmers in each
category and hence 500 farmers were selected through random sampling in
the Study Areas of Perambalur District (25 in each category in each area)
and Thanjavur District (25 in each category in each area) by collecting the
data from 125 farmers and hence from 500 farmers in each district totalling
about 1000 farmers. In both Perambalur and Thanjavur Districts 50 private
dealers and 50 Primary Agricultural Co-operative Societies (10 in each
category in each area) were approached to collect the relevant data and the

221
same methodology was applied to Thanjavur District also viz., 50 Primary
Agricultural Co-operative Societies (10 in each category in each area) and
hence 200 fertilizer distributors were met. Statistical Package for Social
Sciences (SPSS) was used to analyze the data.
Chapter II “Review of Literature” traces out the related reviews of
literature to the study. In this chapter how the problem under investigation
relates to the previous search studies is analyzed. It helped the researcher to
identify the research gap and to proceed further with her objectives and the
formulation of the hypotheses.
Chapter III “Production, Consumption and Distribution Patterns of
the Fertilizers” gives an outlook about the Production, the Consumption and
the Distribution Patterns of the fertilizers.
Chapter IV “Farmers‟ tribulations in the Fertilizer Consumption”
deals with the comparative analysis of problems encountered by the farmers
in procurement of fertilizers in the Study Area (A Semi-arid zone and a Delta
zone). The formulated hypotheses have been analyzed with the relevant
statistical tools.
Chapter V, “Hindrances in Fertilizer Marketing” gives a
comparative analysis of the Hindrances of the Fertilizers Dealers in the Study
Area (A Semi-arid zone and a Delta zone) in marketing of the fertilizers.
Chi-square analysis tool has been used for the comparative study.

222
Thus the problems of farmers in getting the fertilizers and the
hindrances of the fertilizer dealers in distributing the fertilizers has been
analyzed significantly in Chapter IV and V respectively. The Findings are
summed up in the following pages followed by effective suggestions to
strengthen the fertilizer distribution network.
6.3. FINDINGS
The Findings of the research have been presented by the Researcher by
dividing them into two sections.
SECTION I – Findings of the farmers‟ tribulations in fertilizer consumption.
SECTION II – Findings of the Hindrances in the Fertilizer Marketing.
Based upon the analysis made by the Researcher, the following
findings are listed in the above two sections.
SECTION I
THE FINDINGS OF FARMERS‟ TRIBULATIONS IN FERTILIZER
CONSUMPTION
In this Section, the findings have been given from the descriptive
analysis and the inferential analysis made in chapter IV of this thesis. There
are similarities and disparities in the tribulations of farmers in the
procurement of the fertilizers. The findings from the descriptive and the
inferential analysis of farmers have also been given.

223
6.3.1. The Findings from the Descriptive analysis of the farmers‟
tribulations
The farmers face several problems. The uncertainty of rainfall leads to
a lot of difficulties for farmers. So they find it difficult to plan their
cropping and input purchase positions.
Out of 1000 farmers, 396 farmers are in the age group of 45 years to 50
years and 287 farmers are in the age group of 50 to 55 years (53 % in
the Semi-arid zone 47% in the Delta zone in each category). The
Maximum number of farmers in both the zones is aged between 45
years and 55 years.
Out of 1000 farmers, 343 farmers (43% in the Semi-arid and 57% in
the Delta) have High School education and 217 farmers (51% in Semi-
arid and 49% in Delta) have passed their Higher Secondary Course.
223 farmers (56% in Semi-arid and 44% in Delta) are graduates. Only
34 farmers are illiterates. Majority of the farmers are educated.
In the Delta zone more farmers (56%) have been engaging up to three
and more family members in agriculture compared to the Semi-arid
zone (44%). The farmers may utilize the available family members
fully in their own field to avoid labour problem.
As the Delta zone is made up of wet lands, all the 500 respondents
have been cultivating paddy whereas in the Semi-arid zone, 81% of the
farmers have been cultivating paddy because it is made up of dry
lands. More number of farmers have been cultivating the pulses in the

224
Semi-arid zone (67% ) compared to the Delta zone (41%) because the
Semi-arid zone farmers can produce both groundnut and other pulses
together in the same field.
Out of 1000 respondents 151 Semi-arid farmers (61%) and 97 Delta
farmers (39%) have been using only chemical fertilizers. This indicates
that pure chemical fertilizer usage is more in Semi-arid zone compared
to the Delta zone. But in both the zones, most of the farmers have
been using chemical and indigenous manures together. The use of
chemical fertilizers became imperative and farmers are using
indigenous manures like cow dung, compost etc. to get an increase in
the yield.
Out of 1000 respondents, 354 farmers (61% in the Semi-arid and 39%
in the Delta) spent Rs.10,0001 to Rs.15,000 and 260 farmers (48% in
Semi-arid and 52% in the Delta ) spent Rs.5001 to Rs.10,000. In
Semi- arid zone, the farmers have been spending more than the Delta
zone for chemical fertilizers in order to increase the fertility of land.
Out of 1000 respondents, 503 farmers (67% in Semi-arid and 33% in
Delta) have been purchasing fertilizers from the private dealers. 430
farmers (30% in Semi-arid and 70% in Delta) have been procuring
fertilizers from co-operatives. In the Delta zone most of the farmers
have been procuring fertilizers from the Co-operatives and in the
Semi-arid zone majority of the farmers have been purchasing from the
private dealers.

225
Out of 1000 respondents, 282 farmers (44% in Semi-arid and 56% in
Delta) have spent upto Rs.15,000 for cultivation. The cost of
production in two categories Rs.15001 to Rs.30000 and Rs.30001 to
45000 are more in the Semi-arid zone which is above 50% (55% and
52%) than the Delta zone which is below 50% (45% and 48%). The
farmers have been spending more in the Semi-arid zone than the Delta
zone for cultivation.
In both the zones, most of the farmers are unaware of the authorized
dealers of their brand preferences. Out of 1000 farmers 241 farmers
(32% Semi-arid and 68% in the Delta) only are aware of the authorized
dealers. More Delta farmers are aware of the authorized dealers
compared to the Semi-arid zone farmers. If the farmers were able to
purchase from authorized dealers, the prices would be less compared to
the other retailers.
In both the zones, more number of farmers (418 out of 1000) has to
spend Rs.5 per bag as the transport cost to transport the fertilizers from
the shop to their field. 235 farmers have been spending Rs.6 per bag
for transportation. This rate is very high for Small Farmers and
Marginal Farmers since their requirements have been small quantities
compared to Medium and Big farmers.
Out of 1000 sample farmers surveyed, 414 farmers use bullock carts.
Among them most of the farmers are Marginal and Small farmers. 375
farmers use Motor vehicles. The Medium and Big farmers have been
using motor vehicles to carry their fertilizers.

226
Even the Medium and the big farmers used to purchase their
requirements not at a time by purchasing in bulk but in several times in
small quantities. Since the farmers have not been purchasing in bulk
quantities they could not avail any to take trade discount advantage.
As many as 375 farmers out of 1000 surveyed have been travelling
7km to 8 km. to get the fertilizers followed by 299 farmers who have
to travel 5 to 6 km. Most of the farmers in both the zones have to
travel above 5 kilometers to get their fertilizers.
More number of farmers (616 out of 1000) has been paying more than
the control price for the fertilizers. It is due to the credit purchases or
non-availability of specific fertilizers etc. In Semi-arid Zone more
farmers (55%) have paid more than the control price compared to the
Delta Zone (45%). Most of the farmers (260 out of 616) have paid a
premium of Rs.2 per bag than the control price.
Out of 1000 sample farmers 740 (51% in Semi-arid and 49% in the
Delta) have been availing credit facilities for the purchase of the
fertilizers. Most of them fall under the category of Marginal and Small
Farmers.
In both the zones more number of Marginal and Small Farmers got
credit from the money lenders compared to other categories.
In the Semi-arid zone, non-availability of the fertilizer is the prime
problem followed by „price fluctuations‟ and it is vice versa in the

227
Delta zone. Comparatively in Semi-arid zone more number of farmers
was facing problems in getting fertilizers compared to the Delta zone.
Out of 1000 respondents surveyed, 747 farmers never used nutritious
fertilizers. In Semi-arid zone, 80 farmers have used nutritious
fertilizers. In the Delta zone, 173 farmers used nutritious fertilizers
which are comparatively higher than the Semi-arid zone.
It was observed that 502 farmers out of 1000 farmers (59% of the
Semi-arid zone and 41% of the Delta zone) have not been applying the
fertilizers at the right time due to various reasons. Among them, „non-
availability‟ problem stood first. 89% of the Semi-arid farmers and
87% of the Delta farmers have suffered as they are conscious about
their brand loyalty which renders them delaying the application of
fertilizers.
The Delay in application will lead to a poor yield of crops. All the
farmers in both the zones ensured that there is a decrease in the yield
due to the delay in the application of the fertilizers.
IFFCO stands as a monopoly in the total marketing of DAP in the
State.
In the Delta zones more farmers preferred to purchase FACT Urea and
in the Semi-arid zone preference was given by more farmers for
„Vijay‟ Urea. „Vijay‟ is the market leader of urea in both the zones. It
has been giving an uninterrupted supply of urea fertilizer to the needy
farmers.

228
The best source as per the Farmers‟ Opinion Survey in the Semi-arid
zone is the private dealers and in the Delta zone is the Co-operative
Society.
6.3.2. The Findings from the inferential analysis of the farmers‟
Tribulations
There is a significant increase in the yield due to application of both
the chemical and bio-fertilizers, instead of the chemical fertilizers only.
The farmers are not given their preferred brands of fertilizers.
When the farmers use the nutritious fertilizers, the „Mean‟ value of the
yield is more compared to the „Mean‟ value for not using. The
nutritious fertilizers have significantly increased the yield.
When the farmers were applying the fertilizers at the right time, the
„Mean‟ value is more compared with „delay in application‟ of
fertilizers which has a less Mean value. There is a significant decrease
in the yield when the farmers are not applying the fertilizers at the right
time.
When the total cost of the production increases, the fertilizer usage also
increases equally category wise.
The knowledge about the authorized dealers will enable the farmers to
get the fertilizers at the control price.

229
While comparing the overall yield, the Delta zone is better than the
Semi-arid zone. In the Delta zone, there are well structured irrigation
facilities, favourable climatic conditions, planned agriculture etc. that
will help the farmers to get more yields.
In the Semi-arid zone, as many as 62 % of farmers spent ranging from
Rs.10001 to Rs.15000 irrespective of the size of their land holdings
because the grains cultivation needs heavy usage of fertilizers. In the
Delta zone, the farmers have been spending for the chemical fertilizers
depending upon their landholdings.
There is a difference between Semi-arid zone and the Delta zone with
regard to their sources of procurement. The Semi-arid zone has more
Mean value (4.05) than the Delta zone (3.50) with regard to the open
market. As far as the Co-operatives are concerned, the Delta zone has
more Mean value (3.55) than the Semi-arid zone (2.94). In the Semi-
arid zone, more farmers have been procuring fertilizers from the open
market and in the Delta zone from Co-operatives.
There is no significant difference between the Semi-arid zone and the
Delta zone with regard to the problems relating to the transport in the
procurement of the fertilizers.
The Mean values of the problems are more in the Semi-arid zone
compared to the Delta zone. The farmers of the Semi-arid zone have
been facing more problems than the farmers of the Delta zone. The
farmers have been facing the problems in the procurement of the

230
fertilizers such as the credit, the non-availability, the inferior quality
and the warehousing problems and the price. Sometimes the farmers
are compelled to get the fertilizers for which they have not given any
preference to buy.
The transport costs of both the zones are the same. Transport cost does
not contribute any difference in both the zones in the total cost of the
production.
Within the Semi-arid zone, 55 % of the farmers have not been getting
fertilizers at the control price and within the Delta Zone 68% of the
farmers have not been getting the fertilizers at the control price. In the
Delta zone more number of farmers has not been getting fertilizers at
the control price compared to the Semi-arid zone.
The credit availed by the farmers of both the zones for their agriculture
are from the same sources viz. Money lenders, friends and relatives,
Co-operatives and Commercial banks. The contribution from the
sources does not show any difference in both the zones.
The Delta zone has more satisfactory Mean value of the fertilizer usage
compared to the Semi-arid zone with regard to the soil quality. In both
the zones, the overall satisfaction derived from the fertilizer usage is
common with regard to the overall growth and the increase in the
yield.
The overall satisfaction of the fertilizer usage shows the good Mean
value as it indicates that all the samples surveyed were satisfied by

231
their fertilizer usage with regard to the increase in the yield, the soil
quality and the crop growth.
SECTION II
In this section, the findings are given from the comparative study done
in the Chapter V of this Thesis.
6.3.3. The Findings from the analysis of the hindrances of the fertilizer
Marketing
In the Semi-arid zone most of the private dealers (63%) are Under-
graduates and in the Delta zone, most of the dealers (66%) are Post-
graduates.
In the Semi-arid zone more number of dealers (38%) falls under
„above 45 years‟ age category which is only 16% in the Delta zone. In
Delta zone most of the farmers (60%) belong to the age category of 40
years to 45 years.
In the Semi-arid zone most of the private dealers (25%) have been
doing retail business compared to the Delta zone (9 % only) whereas in
Delta zone, most of the dealers (75%) have been doing both the
business compared to the Semi-arid zone (25% only).
All the Co-operatives do the retail business by getting the fertilizers
from the Co-operative Marketing Federations.

232
In the Semi-arid zone most of the private dealers (59.3%) have less
than 20 years of experience. But more dealers in the Delta zone
(33.8%) have 20-40 years of experience compared to Semi-arid zone.
As far as the Co-operatives are concerned, in the Delta zone more
number of Co-operatives (55%) has more than 40 years of experience.
The Co-operative societies are registered under the co-operative form
of organization in both the zones. As the fertilizer distribution cannot
be undertaken on a large scale, due to geographical limitations, no
corporate entity is involved in this field.
In the Semi-arid zone most of the private dealers (54%) have been
doing partnership business compared to the Delta zone (46%) whereas
in the Delta zone, most of the dealers (56%) are the sole proprietors
compared to the Semi-arid zone (44 %).
It is not economical for dealers to distribute only one input namely
„fertilizer‟. On the other hand, if they combine other inputs like seeds,
pesticides, agricultural implements etc., it would augment their
business profit.
In the Semi-arid zone majority of the private dealers (70%) have been
dealing with the fertilizers alone compared to the Delta zone. Whereas
in the Delta zone, most of the dealers (26.%) can deal with all the three
inputs compared to the Semi-arid zone which is 5.7% only. The Co-
operatives are far better than the private dealers in both the zones,
since most of them have been dealing with all the inputs needed.

233
In the Semi-arid zone as many as 69.7% of the dealers invested below
Rs.20 lakhs only whereas in the Delta zone number of dealers about
65.5% invested above Rs. 25 lakhs.
In the Delta zone most of the private dealers (58%) have done their
business with their own capital compared to the private dealers of the
Semi-arid zone (42%).
The fertilizer dealers borrow finance from the commercial banks,
friends and relatives, money lenders and others. In both the zones, the
capital is borrowed by the dealers through the same sources.
More number of private dealers are given sufficient loans in the Delta
zone (17.9%) compared to Semi-arid zone (12.3%). In both the zones,
the Co-operatives are satisfied by getting sufficient loans from Central
and State Co-operative Banks.
In the Semi-arid zone, the first choice of the fertilizers dealers for their
purchases is FACT fertilizers followed by MFL. The next choice is
the purchase from IPL fertilizers. Kothari and Parry fertilizers are
almost purchased by the equal number of fertilizer dealers.
In the Delta zone, MFL fertilizers are purchased by more number of
private dealers. Both FACT and PARRY fertilizers are equally
purchased by the private dealers. The next choice is Kothari fertilizers
followed by the least choice of the fertilizers from IPL fertilizers.

234
More number of Delta private dealers (62%) have been purchasing
from the manufacturing company compared to the Semi-arid zone
(38%) and it is vice-versa in the case of the purchase of the fertilizers
from the wholesalers more in the Semi-arid zone.
More number of Delta zone fertilizer dealers (31%) purchased
fortnightly than the Semi-arid zone private dealers (20%). The Semi-
arid Co-operatives purchased mostly according to the demand where as
the Delta zone co-operatives purchased fortnightly to satisfy the needs
of the farmers.
In the Delta zone most of the private dealers (65%) have given
preference to purchase their products compared to the Semi-arid zone
(35%).
As far as the private dealers and Co-operatives are concerned the Delta
zone is better than the Semi-arid zone. The Semi-arid zone fertilizers
dealers have been facing difficulties in purchases than the Delta zone
dealers.
The Delta dealers have been getting the required stock in time.
Compared to the Semi-arid zone private dealers (11.2%) and Co-
operatives (27.6%) who have been getting the required stock in time,
Delta zone private dealers (15.3 %) and co-operatives (45.9%) were
better.

235
The fertilizer dealers could not get the needed stock at the right time
from the suppliers because of so many reasons viz., insufficient stock,
finance problems and transport problems.
Both the Delta and the Semi-arid private dealers have suffered
equally because of the finance problems and transport problems for not
getting the needed stock at relevant time. Moreover the Semi-arid
private dealers and the co-operatives have the problems of the
insufficient stock of their suppliers.
The type of the credit received by the fertilizer traders from their
suppliers will be helpful to strengthen the business of the fertilizer
dealers. In the Delta zone more number of private dealers (63%) has
not been receiving the credit facilities compared to the Semi-arid zone
(37%).
In the Delta zone (57%) more private dealers of the fertilizers have not
been selling the fertilizers on credit compared to the Semi-arid zone
which shows 44%. Any trader has to provide the credit facility to keep
a good group of loyal customers. They alone will repeat purchase
every year. In the Semi-arid zone more private dealers have been
giving credit facilities than the Delta zone.
In the Semi-arid zone more private dealers gave credit for one month
only compared to the Delta zone, where the farmers have been given
credit for two months. The Semi-arid Co-operatives are better than all

236
the types of dealers surveyed because as many as 60% have been
giving credit for more than 3 months.
The rate of commission for the sale of the fertilizer is more i.e., above
10% in the Semi-arid zone (71%) compared to the Delta zone (29%).
All the Co-operatives have been maintaining the Buffer stock with
TNWH Corporation or Central Warehousing Corporation. The Co-
operative societies have been getting the required stock from the
marketing federations concerned before making an indent.
In the Delta zone, more private dealers (83%) stored in the public
warehouses compared to the Semi-arid zone (16.7% only). More
private dealers (57%) have stored in the private godown in the Semi-
arid zone compared to the Delta zone (43%). The rented buildings
chosen by the private dealers in both the zones are more or less equal.
In the Delta zone, more fertilizers dealers (58%) have been paying
above Rs.3,000 as rent compared to the Semi-arid zone (42%). In the
Semi-arid zone, more (68%) private dealers have been paying Rs.1,000
to Rs.3,000 as rent which is very less in the Delta zone. (33% only).
As far as the private dealers are concerned, more or less have to travel
equal distance between the storing point and the shop in both the
zones. But the Co-operatives differ. The Delta co-operative societies
which have been traveling within 3 kms are more compared to the
Semi-arid zone. But in the Semi-arid zone, more Co-operative

237
Societies have to travel above 5 kms. compared to the Delta co-
operatives.
Nearly 90% of the Co-operatives of both the zones took the fertilizers
through Lorry and the service is rendered by the Co-operative
Marketing Federations.
Within the Semi-arid zone 96% of the private dealers used Lorry and
only 4% used tractors to transport their fertilizers. But Within the
Delta zone, 78% of the private dealers used lorry to transport their
fertilizers and remaining 22% used tractors.
Compared to the Delta zone (22.1%), more Semi-arid zone private
dealers (15.6%) do not have adequate transport facilities. But all the
Co-operatives of Semi-arid zone have adequate transport to do their
Fertilizers Marketing.
More private dealers (34.6%) have to cover above 40 km compared to
Semi-arid zone (29.5%). But it is vice versa in the case of Co-
operatives. More Semi-arid zone Co-operatives has the distance of
above 40 km. (23.1%) than the Delta zone Co-operatives (12.8%).
It can be seen that in the Semi-arid zone, more Co-operatives (55.3%)
have been doing their sales promotion with the help of the newspaper
advertising compared to the Delta zone (44.7%). Advertisements
through posters are popular and more in the Delta zone (57%)
compared to the Semi-arid zone (43%) by the private dealers. Wall

238
Display is very popular in the Semi-arid Co-operative Societies (37%)
among the other types of fertilizer dealers.
More private dealers of the Semi-arid zone have been getting the help
in advertising from the manufacturers compared to the Delta zone to
some extent.
6.4. SUGGESTIONS
The following suggestions are given to improve the Fertilizer Marketing.
The suggestions have been classified into three Sections.
SECTION I – Suggestions to improve the Marketing of the Fertilizers in the
Semi-arid Zone (Perambalur District).
SECTION II – Suggestions to improve the Marketing of Fertilizers in the
Delta Zone (Thanjavur District).
SECTION III – Common Suggestions to improve the overall Fertilizer
Marketing applicable to both the zones.
SECTION I – PERAMBALUR DISTRICT
6.4.1. SUGGESTIONS FOR THE SEMI-ARID ZONE (FARMERS)
The farmers may utilize the available family members fully in their
own field to avoid labour problems.
The farmers may avoid pure chemical fertilizer usage to protect the
soil.

239
The farmers may change their purchase habits. They may purchase
from the co-operatives to get the fertilizer at the controlled price.
The knowledge about the authorized dealers will enable the farmers to
get the fertilizer at the right time and at the right price.
The farmers, especially Marginal and Small Farmers may approach the
Co-operative and the Commercial Banks for credits instead of from
money lenders.
The farmers are advised to apply the fertilizer at the right time. They
may use nutritious fertilizers that are capable of increasing the yield.
6.4.2 SUGGESTIONS FOR SEMI-ARID ZONE (TRADERS)
The fertilizer dealers can do wholesale business instead of retailing
in order to increase the profitability.
They should combine other inputs like seeds, pesticides and
agricultural implements etc. to improve their business.
They should be farmer-friendly by giving the price concessions to
the loyal farmers to improve the market.
Periodical purchase from the manufacturers or the wholesalers must
be made to enhance the uninterrupted supply of fertilizer.

240
The fertilizer dealers may extend the credit facilities to the farmers
which will repeat the purchase every year. The period of credit may
also be extended.
The dealers may construct their own godowns to store the fertilizers.
They must maintain adequate stock level to be maintained to meet
out the needs of the farmers.
Co-operative Societies must come forward to distribute the needed
varieties of fertilizers to the needy farmers.
Efforts must be taken to create co-ordination among the distribution
agencies.
The traders may educate the farmers about the effective use of the
inputs.
SECTION II – THANJAVUR DISTRICT
6.4.3. SUGGESTIONS FOR DELTA ZONE (FARMERS)
The farmers may improve their knowledge about the authorized
dealers of their brand preference. It will help them to get the fertilizers
at the control price.
Marginal and Small Farmers may avoid the delay in the application of
the fertilizers by taking the precautionary measures.

241
Since the Co-operatives are the market leaders in the Delta zone, the
Marginal and Small Farmers may approach the Co-operative Societies.
They can avoid getting the funds from the money lenders.
The farmers are advised to take quality fertilizers to improve their
productivity and soil fertility.
The Big farmers may make bulk purchases to gain trade discounts.
This will help the fertilizer traders to get an idea about the demand of
the fertilizers of other categories of farmers.
6.4.4. SUGGESTIONS FOR THE DELTA ZONE (TRADERS)
The traders may approach bank finance at the reasonable rate of
interest because in this business heavy capital is being locked.
Maintenance of adequate stock level of the fertilizers is necessary.
The Co-operatives should not compulsorily issue unwanted varieties or
brands not preferred by the farmers.
The traders may extend the credit facilities to the farmers to get the
fertilizers at the right time.
The dealers should maintain the price stability and oblige the
government regulations in the fixation of prices.
The fertilizer traders must improve their sales promotion by means of
salesmanship technique.

242
SECTION III – COMMON SUGGESTIONS
Fertilizer business is a seasonal business. The traders and farmers face
several problems. On the side of traders the business being seasonal,
traders cannot depend on a single business. Those who deal only with
the fertilizer trade are unable to get a reasonable profit in the business.
Hence the traders may combine allied businesses like pesticides, farm
machinery etc., such combination can increase the total volume of
business of traders and profit.
One important problem faced by the fertilizer traders is the non-
availability of finance. As heavy capital is locked, traders need bank
finance at the reasonable rate of interest. At present only the
influential traders are able to get such bank credit. Fertilizer Traders
Association may sit with the Lead bank of the District and try to have
informed code of financing for the fertilizer business.
The Scientific way of the stocking of the fertilizers may be planned by
the fertilizer producers and the traders.
During certain seasons, the needed fertilizer is not available. This is
owing to government policies and general conditions of the fertilizer
industry. The Non-availability of petroleum-based products like
Naptha led to such problems. The Government of India may come
forward to rectify such things. One easy way the Government finds is
to resort to import. But by the time the imported fertilizers reach the
places, the agricultural season would have been over. So the

243
Government should predict such unexpected happenings and take
necessary remedial measures.
Several fertilizer traders do not have godown facilities and they suffer
a lot. The warehousing corporations (Central and State) must come
forward to construct godowns at the important centres exclusively for
the fertilizer traders.
„Price control‟ is another major problem of the industry. For the same
type of fertilizer, price variations are found with Government depots,
Co-operatives and private traders. Private traders manipulate prices
during the times of shortage. The licenses of the traders who are not
honest, must be cancelled; Officials of the Department of Agriculture
must visit the traders frequently and check their prices.
From the Regional Distribution or manufacturing centres to local point
several hurdles are there in the transportation of the fertilizers. The
Delay occurs during the rainy seasons. Places of easy access and good
road facilities are given preference to that of difficult centres. The
Manufacturers should change this trend to have uniform transport
policies.
The Officials of the Agricultural Department must be specific in
announcing the needed varieties of fertilizers wherever new hybrid
varieties of paddy are introduced.

244
The subsidy given by the Central Government for fertilizer is to be
continued to enable the farmers to get the required inputs of agriculture
at the affordable price.
There must be the co-ordination among the fertilizer distribution
agencies.
The journey of fertilizers from factory to the farmer faces a number of
constraints, which are termed as infrastructure and managerial
limitations. The fertilizers should be made available at the doorsteps
of the farmers. It is therefore suggested that the dealers should be
located as near to the farmers as possible.
The profession of agriculture should be given the status of an industry.
All the facilities, resources, subsidies etc., may be given to agriculture
on par with the industry.
Soil test as an important farm practice has not been done by the
majority of the farmers. This must be inculcated to them.
Responsive Marketing may be adopted to provide consultancy services
to farmers along with selling of the fertilizers Innovative promotional
activities are to be adopted to educate the farmers about the effective
utilization of inputs.
“Farmers‟ crusade” is called for converting agriculture into a
commercial venture.

245
The farmers must be ready to utilize the available family members
fully in their own field.
Reliable, accurate and timely Marketing information is essential to the
producer in the efficient marketing of his products through Marketing
Plan.
Proper educational training must be given to the farmers to speedy
adjustments to face the changing conditions in getting his inputs.
The farmers must adopt different cultivation practices by using the
capital efficiently.
The Fertilizer companies while releasing the new fertilizer brands
should rely more on the retailer-oriented promotion of brands and
direct farmer contacting methods, which will be more effective in
increasing the sales of company brands.
A Strategic Model is being suggested to make the efficient Marketing Mix
of Fertilizer Marketing. This will enable the traders to gain competitive
advantage in the field of the Marketing of Fertilizers. The Model is shown in
the following figure 6.1.

246

247
6.5. SCOPE FOR FURTHER RESEARCH
There is a scope for further research in the following areas based upon
this research. They are listed below:
A Study on Fertilizer Marketing can be done comparatively by taking
another two different ecological zones
This type of Fertilizer Marketing Study has to be made in other Semi-arid
zone and Delta zone districts also.
A separate study can be made to improve the Fertilizer Marketing with
reference to a particular district or region only.
A Study of Co-operative Agricultural Societies and their role in effective
distribution of fertilizers to strengthen agriculture can also be prepared.
A Study on Distribution channels of fertilizers can be studied.
A detailed study can be carried out to understand the problems of farmers
in getting all agricultural inputs.
A study may be conducted on the consumption and the usage of the
fertilizers by the farmers and their problems.
Farmers Relationship Management in Fertilizer Marketing can be carried
out by making a special study through Farmers‟ Opinion Survey.

248
CONCLUSION
Even after 60 years of independence, very meager efforts are being
exercised on the agriculture sector resulting in a scanty improvement. Most
of the farmers lack interest to improve agriculture and its allied occupations
because even after huge capital investments on fertilizers, pesticides etc.,
they may get a loss due to natural calamities like floods, cyclones, droughts
etc. or even due to poor market. Educated rural youth have also been
migrating to cities for some kind of employment neglecting agriculture.
Hence integrated efforts should be undertaken to provide essential and
desirable facilities to the farmers to increase their productivity. It is
necessary that a chance must be given to the farmers in India to prove their
saying “Provide the inputs at our door steps, we shall take care of the rest”
by providing adequate supply of agricultural inputs, especially fertilizers.
Fertilizers should be ensured to the farmers at the right time, at the right
price in the right quantity and at the right places to show better results in
agriculture.

![Chapter 6 - Putting concepts under stress [I]](https://static.fdokumen.com/doc/165x107/632e95ea4c6a0f43fd046506/chapter-6-putting-concepts-under-stress-i.jpg)