CHAPTER - I - KVK Darrang - Assam Agricultural University
197
1
-
Upload
khangminh22 -
Category
Documents
-
view
3 -
download
0
Transcript of CHAPTER - I - KVK Darrang - Assam Agricultural University

1

2
LIST OF COMPILERS
1. Dr. Tulshi Prasad Saikia
2. Himangshu Talukdar
3. Rinkumoni Phukon
4. Ghana Kanta Sarma
5. Sanjukta Saikia
6. Dr. Debajit Deka
7. Tulika Bora
8. Dhananjoy Mushahary

3
KRISHI VIGYAN KENDRA, DARRANG VISION 2020 Year 2009 Materials contained in this document may not be reproduced, in any form without the permission of the publisher Concept of cover page: Himangshu Talukdar Coverpage designed and DTP: Dhananjoy Mushahary Produced at: Computer Cell, KVK, Darrang Published by: The Programme Coordinator KVK, Darrang

4
LIST OF TABLES
Table No.
Title
Table 1 Weather information of Darrang District
Table 2 Rainfall information of the district during 2006 (in mm.)
Table 3 Key Features of District (As per Census 2001)
Table 4 Demographic pattern of the District
Table 5 Fisheries available in the district (2005-06)
Table 6 Distribution of Workforce
Table 7 Administrative Setup
Table 8 Establishment Setup
Table 9 Agro ecological situation (AES) of the District (Based on soil and topography)
Table 10 Demographic information of the district
Table 11 Land Use pattern (area in ha) of the district
Table 12 Types of Farming Situation under which important Agricultural Crops are cultivated in Darrang District
Table 13 Block wise textural classification of soils (area in ha and in %) for the district
Table 14 Classification of farmers on the basis of operational land holding
Table 15 Block wise details on operational land holding
Table 16 Irrigation potential utilized in Darrang district (2003-04,2004-05)
Table 17 Irrigation Potential Created, upto 31.03.2006 through government Irrigation Scheme (Area in Hectare)
Table 18 Information on Rainfed and Irrigated area of Darrang district
Table 19 Existing farming systems and predominant Enterprises in Darrang district
Table 20 Agricultural Area covered in Darrang District
Table 21 Agricultural Institutions/ infrastructure available in the district
Table 22 Annual Agricultural crop production of Darrang District (2004-05)
Table 23 Annual Agricultural Crop Production Darrang District (2007-08)
Table 24 Fertilizer Consumption Pattern in the district
Table 25 Crop calendar of the District
Table 26 Gap in adoption and proposed Extension Strategy for Improving the Productivity of crops
Table 27 Gap in adoption and proposed Extension Strategy for Improving the Productivity of crops
Table 28 Gap in adoption and proposed Extension Strategy for Improving the Productivity of crops:AES-1
Table 29 Gap in adoption and proposed Extension Strategy for Improving the Productivity of crops: AES -2

5
Table 30 Gap in adoption and proposed Extension Strategy for Improving the Productivity of crops: AES-3
Table 31 Gap in adoption and proposed Extension Strategy for Improving the Productivity of crops: AES-4
Table 32 Technology gap in cereal (paddy & wheat) production
Table 33 Technology gap in pulses production
Table 34 Technology gap in Oil seed production
Table 35 Technology gap in Sugarcane production
Table 36 Technology gap in Jute production
Table 37 Crop wise intervention in Agriculture Sector
Table 38 Existing Machineries
Table 39 Information on existing market infrastructural facilities available in the district
Table 40 Information on location of existing markets and commodities handled
Table 41 Information on Agro-processing facilities available in and outside the district but serving the need of the district
Table 42 Marketing Strategies and Marketing Activities
Table 43 Critical issue and proposed Extension Strategies in Agricultural Sector in Darrang District
Table 44 Proposed Research Strategies in Agricultural sector in Darrang District
Table 45 Proposed Strategies for Promoting Integrated Pest Management in Paddy
Table 46 Proposed Strategies for Promoting Integrated Pest Management in Vegetables
Table 47 SWOT analysis of Crop Production Sector in the district
Table 48 Projected requirement of foods (cereal, pulses & oil seeds) in Darrang District (Based on projected population)
Table 49 Inter linkages of KVK with different Organizations
Table 50 Vision for Darrang District
Table 51 Area, production and productivity of Horticultural crops (2004-05)
Table 52 Area, production and productivity of Horticultural crops ( 2007-08)
Table 53 Production Target of horticultural crops in Darrang district (kg/ha)
Table 54 Crop wise constraints and strategies of cultivation practices
Table 55 A few important pockets of Horticulture are mentioned below
Table 56 Type of farming situations under which important Horticultural crops are cultivated
Table 57 Critical issue and proposed extension strategies in horticultural sector
Table 58 Analysis of Horticultural problems with regard to existing farming system(AES-1)EFS-I
Table 59 Analysis of Horticultural problems with regard to existing farming system(AES-2) EFS-II
Table 60 Analysis of Horticultural problems with regard to existing farming system: (AES-2)EFS-III

6
Table 61 Analysis of Horticultural problems with regard to existing farming system: (AES3) EFS-I
Table 62 Analysis of Horticultural problems with regard to existing farming system: (AES3) EFS-II
Table 63 Analysis of Horticultural problems with regard to existing farming system: (AES4) EFS-I
Table 64 Analysis of Horticultural problems with regard to existing farming system: (AES4) EFS-II
Table 65 (A)
Movement and Flow Pattern of Different Commodities from and to Darrang District
Table 65(B) Movement and Flow Pattern of Different Commodities from and to Darrang District Table 66 Movement and Flow Pattern of Different Commodities from and to Darrang District
Table 67 Table Supply of seeds and planting material (as on December 2008)
Table 68 Technology matrix of Medicinal and Aromatic plants
Table 69 Expression of Livestock and Poultry population of darrang district in respect of the State and country (In ‘000)
Table 70 Population trend of different livestock species in Darrang districts
Table 71 Population trend of different livestock species in Darrang districts in term of 1000 human
Table 72 Infrastructure facilities of A.H. & Veterinary in Darrang District
Table 73 Constraints, Strategies, technological intervention and action plan of different livestock production system
Table 74 Productivity of Livestock component in Darrang District, 2007
Table 75 Present and Projected Milk Production in Darrang District
Table 76 Projected Gap in Milk production in Darrang District
Table 77 Technical Strategies for improvement Milk Production in Darrang District
Table 78 Present and estimated Meat Production of Meat in Darrang District from 2007 to 2025
Table 79 Present and estimated Meat Production of Darrang District from 2007 to 2025
Table 80 Year wise technical strategies for increasing Meat Production in Darrang District
Table 81 Present and Projected Egg Production per year scenario in Darrang District from 2007 to 2025
Table 82 Present and Projected Egg Production per year scenario in Darrang District from 2007 to
2025
Table 83 Present and Projected Egg Production per year scenario in Darrang District from 2007 to 2025
Table 84 Estimated Gap in Egg production in Darrang District from 2007 to 2025
Table 85 Year wise technical strategies for increasing egg Production in Darrang District
Table 86 Fisheries Resource of the district
Table 87 AES (Agro Ecological Situation) and Development Block wise distribution of resource of the district (ha)
Table 88 Area, Production and Productivity of the district in comparison to national and state level
Table 89 Production of fish and fish seed (2008)

7
Table 90 Requirement, Gap & Achievable production of the district in comparison to State level
Table 91 Population increase trend
Table 92 Expected Consumer population trend and annual requirement of fish
Table 93 Information on land use pattern of Darrang district
Table 94 Vision of population wise expected requirement, expected production and gap in the district
Table 95 Existing farming system of the district in 3 AES
Table 96 Priority problem: Low fish production
Table 97 Proiority problem: 1. Decreasing fish production
Table 98 Priority problem: 2. Decreasing income of fishers
Table 99 Gap in adoption of technology of spawn rising in all AES
Table 100 Gap in adoption of technology of culture fish production in all AES
Table 101 Gap in adoption of technology of capture fish production in all AES
Table 102 Extension strategies with regard to prioritized critical issues
Table 103 Interlinkages of KVK with different Organizations with respect to Fisheries
Table 104 Mortality Rate in Assam and in India (per thousand)
Table 105 Immunization Coverage Under Darrang District
Table 106 Family Welfare Programmes in Darrang District
Table 107 Detail of data on ICDS project under the Darrang District at a glance- 2007-2008
Table 108 Handloom and Textiles in Darrang District
Table 109 Statistics of Handloom Demonstration circle and Weaving Activity in Darrang District
Table 110 Sericulture activities in Darrang
Table111 Sericulture Farms and Grain ages in Darrang
Table 112 Reeling Units in Darrang
Table 113 Gap in Adoption and Proposed Extension Strategies for Improving the Productivity/ Income of Eri
Table 114 Different human and non human resources
Table 115 List of Fruits and Vegetable Processing Centre Functioning in the District
Table 116 Present Staff Position

8
Content
CHAPTER - I
AGRICULTURAL SCENERIO OF DARRANG DISTRICT
1.1 Introduction and Background 1 - 3
1.2 Our Vision 4
1.3 Objectives 4
1.4 Approaches and Methodology 5
1.5 Expected Outcome 5
CHAPTER II
DISTRICT PROFILE AT A GLANCE
2.1 Geographical Features of the District 6
2.2 Darrang District at a glance 6 - 9
2.3 Infrastructure for Fishery development 9 -10
2.4 Infrastructure for Animal Husbandry and Veterinary development 10
2.5 Infrastructure for Health 10
2.6 Educational Institutions in the district 10 – 11
2.7 Industrial position of the district (2005-06) 11
2.8 Infrastructure for road communication (2006-07) 11
2.9 Infrastructure for power and telecommunication: 11
2.10 Credit infrastructure 11
2.11 Police Station 11
2.12 Infrastructure for Sericulture development 11
2.13 Land use pattern of the district 12 - 15
2.14 Agro climatic Situation of the Distric 15 - 16
2.15 Major Rivers of the District 16
2.16 Demographic pattern of the district 16 - 17

9
2.17 Land use pattern of Darrang District 17
2.18 Soil Types of Darrang District 18 - 19
2.19 Operational land Holding Pattern of the district 19 - 20
2.20 Irrigation status of the district 20 - 22
CHAPTER III
AGRICULTURAL SCENERIO OF DARRANG DISTRICT
3.1 Introduction 23
3.2 Area under cultivation and existing crop production scenario in the district
23
3.2.1 Cereal production system 23 - 25
3.3 Existing cropping pattern and cropping sequences of the district 25
3.4 Fertilizer Consumption Pattern in the district 25 - 26
3.5 Existing farming practices and technology Gap in adoption 26 - 53
3.6 Farm Mechanization 53
3.7 Marketing of Agricultural produce in Darrang District 53
3.7.1 Existing markets and infrastructure 54 - 55
3.7.2 Major marketing channels prevailing in the district 56
3.7.3 Organizational Setup of Regulated Market Committee in Darrang district
56
3.7.4 Difficulties faced by the farmers in marketing 57 - 58
3.7.5 Existing mechanism for diffusion of marketing information 58 - 59
3.8 Constraints for production of major field crops in Darrang District
59 - 77
3.9 Major factors involving for increasing productivity of field crops 78 - 80
3.10 Extension Strategy Needed 80 - 84
CHAPTER IV
HORTICULTURE SCENERIO OF DARRANG DISTRICT
4.1 Introduction 85
4.2 Area, production and productivity of Horticultural crops 86 - 96
4.3 Approaches for Horticultural Development 96 - 97

10
4.4 Strategies for Development of Horticulture 97
4.5 Post Harvest Technology 97 - 98
4.6 Horticultural Markets in Darrang District 98 - 100
4.7 SWOT of Medicinal and Aromatic plants 101
4.8 Bari system in Darrang district 101 - 102
CHAPTER V
ANIMAL HUSBANDRY
5.1 Introduction 103
5.2 Population trend 103 - 108
5.3 Infrastructure facilities of A.H. & Veterinary in Darrang District 108
5.4 Dairy Production 108 - 109
5.5 Housing System of Cattle in Darrang District 109
5.6 Marketing of Dairy Products 109 - 110
5.7 Sheep and Goat Production 110
5.8 Swine Production 110 - 111
5.9 System of Pig Rearing in Darrang District 111 - 112
5.10 Feeding practices 112
5.11 Health Management 112
5.12 Market Status 113
5.13 Poultry Production System 113
5.14 Chicken production system in Darrang District 114
5.15 Market Status of Poultry 114
5.16 SWOT analysis of Animal Husbandry of Darrang District 114 - 117
5.17 Role of Animal Husbandry in Livelihood in Darrang District 117
5.17.1 Animal products and production potential: 117 - 118
5.17.2 Present production and requirement scenario of Darrang District 118
5.18 Identification of critical issues of prioritized commodities in Animal Husbandry in Darrang District
119 - 132
5.19 Strategies for improvement of Livestock and Poultry 133

11
CHAPTER VI
FISHERIES SECTOR OF DARRANG DISTRICT
6.1 Introduction 134 - 142
6.2 Constrains and intervention needed (Culture fisheries) 142
6.3 Constrains and intervention needed (Capture fisheries) 143 - 146
6.4 SWOT analysis 147 - 154
6.5 Fish Marketing Scenario of the District 155
6.5.1 Fish and fish byproducts marketing channels 155
6.5.2 Normal Price sharing 155
6.5.3 Characteristics 155
6.5.4 Strategies for Fish Marketing Development in the District 156
6.6 Extension Strategies 156 - 158
6.7 Immediate Research Strategies required 159 - 160
6.8 Ongoing fishery development Schemes 160 - 161
CHAPTER VII
HOME SCIENCE
7.1 Introduction 162
7.2 Home Science means… 162
7.3 Constituent Areas of Home Science 162 - 165
7.4 Human Development 165
7.5 Infant Mortality Rate 165 - 166
7.6 Family Welfare Programme 166 - 167
7.7 The Integrated Child Development Services (ICDS) projects of the District
167 - 169
7.8 Textiles and Clothing 169 - 170
7.9 Sericulture Activities 170 - 173
7.10 Handicrafts 173
7.11 Family Resource Management 173 - 175
7.12 Value addition in Food products from Fruits and Vegetables 175
7.13 Role of Women in Agriculture 176
7.14 Types of health hazards faced by farm women 176 - 177
7.15 Extension Education 177

12
CHAPTER VIII
PERSPECTIVE PLAN
7.1 Introduction 178
7.2 Background of the KVK, Darrang 178
7.3 Our Vision 178
7.4 Our Objectives 178 - 179
7.5 Infrastructure Available with KVK, Darrang 179
7.6 Requirement for Future 179 - 180
7.7 Action Plan for Instructional farm of KVK 180
7.8 Major Thrust Areas, Technological and Training needs 181 - 183
7.9 Focus area of the KVK, Darrang 183 - 184
7.10 Road Map of KVK, Darrang 184 - 185
7.11 Linkages of KVK, Darrang with Other Institutions and Organizations
185

13
CHAPTER - I
1.1 Introduction and Background
The District of Darrang (undivided) had been created with effect from July, 1983
converting the erstwhile Sub-Division of Mangaldai.
The name Darrang was derived from the Bodo word Dourang, which means
'Lilabhumi' (Playground) of Gods. According to Scholar Late Dineswar Sarma, the word
Darrang came from Dawrang which means gate, as there was direct entry to Bhutan and from
there to Nepal, China etc. gradually this was known as Darrang.
Darrang consists of a narrow strip of plain lying between Himalayas and Brahmaputra
river in the north-west part of Assam. The land which is now known as Darrang district was
included in the Hindu Kingdom of Kamrupa as mentioned in Mahabharata. Its antiquity dates
back to the beginning of the sixteenth century when the Koch king NarNarayan incorporated
this district in his Kingdom. In 1637, the Ahom Kingdom was established in the land after the
death of the then Koch King BaliNarayana. In 1792, Darrang Raja was defeated by an
expeditionary force under the command of Captain Welsh and in 1826. Darrang with rest of
Assam passed under the British rule. The existing Darrang district was formed on 1st
July,1983.
The district Darrang is situated in the North Bank Plain Zone (NBPZ) of Assam and
has a total geographical area of 1427.49 sq.km which is about 1.82% of the total geographical
area of the state. There elevation of Darrang varies from 50 mtrs to 250 mtrs above sea level
and there is a constant slope from north to south. The Khalingduar Reserved Forest and
Bhairavkunda area is at the peak of 150 - 250 mtrs. height. This is touched by another thin belt
of 100 to 150 mtrs. high, The central belt of the district is at 50 - 100 mtrs. and covers 40% of
the district. To the south, this elevation gets further reduced. The Brahmaputra maintains a
level of 10 to 50 mtrs.

14
Fig: Map of Darrang District (Divided)
Fig 1: Map of Darrang District
The district is located at a 20o9´N to 26o95´N latitude and 91o45´ E to 92o22´ E
longitude. The district is situated 68 km away from the state capital of Assam and in the
central part of Assam and on the Northern side of the river Mighty Brahmaputra. The district
is bounded by the Udalguri district in the North. The river Brahmaputra flows in the South.
The district Sonitpur and Kamrup districts are in the East and West respectively.
Darrang is not connected by rail but has a good network of road transport system. The
NH 52 is passed across the district. The nearest airport is at Barjhar near Guwahati. It
facilitates as traffic corridor to the district of upper and northern Assam. The major
physiographic variation of the district is in general is considered to be plain except a few
dotted by small hillocks. The northern part of the district is generally hilly areas and the

15
southern part of the district is covered with forest and hillocks. The mighty Brahmaputra
flows along the southern periphery of the district. Thus, the district is also well connected
with the water ways. The district can be divided in the low-lying plains, covered plains and
hills. The hills are for the most part formed of gneissic rocks from which excellent building
stone can be obtained. The plain is of alluvial origin and consists of sand and clay in varying
proportions.
The status of soil ranges from old alluvial to new alluvial. The soils are sandy to
sandy loam in texture and acidic in reaction and are characterized by medium to high organic
carbon, low to medium phosphorus and potash content. The northern border is covered by
Alluvium, accompanied by another thin belt of older alluvium; the rest of the District is
covered by sandstone & shale. There is a small resource of coal near Udalguri.
The district has a grossed cropped area 268727 ha (Source: Statistical Hand Book,
Assam, 2007) (estimated of which rice alone covers 184000 ha annually). More than 75% of
the population depends on agriculture. The occurrences of natural calamities like, flood,
draught etc. are the regular phenomena in the district.
The district is consisted of two agricultural subdivisions viz. Dalgaon and Patharighat.
The climate of the district is congenial. In the winter, the northern part of the district is colder
than the rest of the district since it is covered by hills and forests of Udalguri District. The
average temperature ranges from 10o to 30o C. Average annual rainfall is about 2120 mm.
The relative humidity is about 37% in the month of February/ March and about 82% in
other months. The moonson of the district commences from the end of March and intensity
gradually increases up to August and then declines to the minimum during Novermber and
December. The weather information of the district is given in Table 1
Table 1: Weather information of Darrang District:
Temperature (0C) Year Rainfall
(mm) Max. Min.
Relative
Humidity (%)
Wind velocity
(Km/hr)
Sunshine
hour
2001 1105.6 28.5 19.6 69.99 1.04 4.93
2002 1284.2 29.3 19.8 69.80 1.03 5.4
2003 1688.4 29.6 20.0 68.1 0.93 5.39
2004 1709.9 28.7 20.3 70.8 1.18 5.41
2005 2303.4 28.7 20.2 80.7 0.92 5.51
*Source: SREP, 2005

16
Table 2: Rainfall information of the district during 2006 (in mm.) :
Normal 34.4 1. Winter Season January 2006 to February.2006 Actual 9.0 Normal 542.4 2. Summer Season March 2006 to May 2006 Actual 390.1 Normal 1254.0 3. Mansoon Season June 2006 to Sept. 2006 Actual 3104.0 Normal 120.4 4. Post Mansoon Season Oct. 2006 to Dec. 2006 Actual 98.4 Normal 1951.2 5. Total (2006) Actual 1601.5
*Source: Statistical Handbook, Assam 2007
The Brahmaputra is the main river in the border of the south of the District on the east
to west direction. Other important tributaries of the Brahmaputra are Barnadi, Nanoi,
Mangaldai, Noanodi, Saktola, Dhansiri, which are the main River flowing through the District
and the rivers are perennial in nature.
The KVK in the district was started in the year 2007 under Assam Agricultural
University, The operational area was restricted to Darrang district only. The KVK is located
temporarily at Magaldoi town.
1.2 Our Vision:
i. To develop the Darrang district agriculturally self sufficient by popularizing
modern Agricultural/allied sector technologies among the farming communities.
ii. To develop KVK, Darrang by action as a nodal centre of excellence growing
with continuous extension and farmers centric services for socio-economic
upliftment.
1.3 Objectives:
• To document the existing farming system of the district and develop strategies for improvement.
• To identify the production constraints, gap in technology and in adoption of
technology. • To document the existing marketing pattern in the district
● To formulate strategies and action plan for enhancing production, productivity and sustainability in the production system.

17
1.4 Approaches and Methodology:
Following approaches and methodology were undertaken to prepare the vision document.
i. Structured survey to conduct situational analysis of the existing farming
practices
ii. Consultation with the key stakeholders from public and private sector
iii. Comprehensive review of the secondary data.
iv. Visit to different market for its study and one to one discussion with traders and experienced farmers.
1.5 Expected Outcome
i. The document will provide a better understanding of current agricultural
situation, constraints and existing technological gap in Darrang district.
ii. The publication puts forward an insight to identify the development
opportunities and potentialities of employment generation in agriculture and
allied sector
iii. The document will support the state government in its effort to develop
agriculture and allied sector reform policies and action plans.

18
CHAPTER II
DISTRICT PROFILE AT A GLANCE
2.1 Geographical Features of the District:
The district Darrang occupies a geographical area of 1427.49 sq. km. It is located at
20o9´N to 26o95´N latitude and 91o45´ E to 92o22´ E longitude. This district is situated at the center
of the state, which comes under North Bank Plain Zone (NBPZ) of Assam and surrounded by
the district is bounded by the Udalguri district in the North. The river Brahmaputra flows in
the South. The district Sonitpur and Kamrup districts are in the East and West respectively.
The major physiographic variation of the district is in general is considered to be plain
except a few piedmont and high land areas, flood plain, char lands and swampy areas. The
mighty Brahmaputra flows along the southern periphery of the district. Thus, the district is also
well connected with the water ways.
2.2 Darrang District at a glance:
Name of the district : Darrang
Bordering District : Udalguri, Sonitpur, Kamrup
HQ of the district : Mangaldai
No. of Agril. Sub-division : 2 (Dalgaon and Patharighat)
No of ADO circle : 14
Major rivers : Brahmaputra, Barnadi, Nanoi, Mangaldai, Noanodi,
Saktola, Dhansiri
Nearest Airport : Lokapriya Gopinath Bordoloi International Airport,
Borjhar.
Nearest Railway Station : Guwahati.
Table 3: Key Features of District (As per Census 2001):
Location The district is situated in the central part of Assam and on the northern side of the river mighty Brahmaputra. The district is bounded by Arunachal Pradesh (State) and Bhutan Country) in the North. The river Brahmaputra flows in the South. The district Sonitpur and Kamrup districts are in the East and West respectively.
Latitude-Longitude 20o9´N to 26o95´N and 91o45´ E to 92o22´ E
Distance from State
Capital
68 kms.

19
Climate The Climate of the district is humid and congenial.
Relative Humidity Around 82 %
Annual Rainfall 1500 mm. to 2600 mm
Population Total- 8, 34,078, Rural - 7,18,927 and Urban – 41,703. (as per 2001 Census)
Population Density 533 per sq. km. Sex ratio ( Nos. of female per 1000 male)
937
Literacy 47.51% Sub-division One (1) Sub-division i.e., Mangaldai Sadar Revenue Circle 4 Nos. Total no. of households 1421555
Blocks 5 Nos. HPC 1 No LACs 4 Nos. Police Out post 3 Nos. Mouza 18 Nos. Number of Anchalik Panchayat 6Nos
Number of Zila Parishad 1 No
Gaon Panchayats 76 Nos. Revenue Villages 533 Nos. Tea Gardens 4 Nos. Municipal Boards 1 No (Mangaldai Municipal Board) Town Committees 1 No. (Kharupetia Town Committee) Total Area The total area of the district is 1427.49 sq. km Cultivated Area (gross) 268727 ha
Reserved Forest 18016.900 Proposed Reserved Forest 2698 Protected Area Network -- Total Forest (Excluding Unclassed State Forest) 20714.900
Area Under Forest as on 31.03.2006 (Area in Hectare)
Sources: Economic Survey Assam, 2007-08 Commercial Bank Nationalised Bank Banks Rural Bank

20
LACs
1 65 Kalaigaon LAC 2 66 Sipajhar LAC 3 67 Mangaldai(SC) LAC 4 68 Dalgaon LAC HPC
1 8 Mangaldai H.P.C CIRCLE
1 Mangaldai 2 Sipajhar 3 Patharighat 4 Dalgaon BLOCK
1 Pachim-Mangaldai 2 Sipajhar 3 Bechimari 4 Pub-Mangaldoi 5 Dalgaon-Sealmari MOUZA
SL NO CIRCLE MOUZA 1 Mangaldoi Chapai 2 Rangamati 3 Dahi 4 Sipajhar Sipajhar 5 Lokrai 6 Hindughopa 7 Patharighat Bonmaza 8 Dipila 9 Rainakuchi 10 Sarabari 11 Dalgaon Shyamabari 12 Kharupetia 13 Pub-Dalgaon 14 Pachim-Dalgaon 15 Pub-Sealmari 16 Pachim-Sealmari

21
Table 4: Demographic pattern of the District:
Urban Rural Childdren(<6 yrs) Total Scheduled
Caste Scheduled
Tribe Male 21961 370670 37324 429955 18740 5010
Female 19742 348259 36124 394125 17621 4815
Total Population (divided Darrang district):
Total 41703 718927 73448 834078 36361 9825
Hindu Muslim Christian Shikh Buddhist Jain 1991 60.54 31.98 6.3 0.017 0.098 0.05
Religion-wise Population* 2001 57.74 35.54 1.75 0.19 0.07 0.35
* Undivided Darrang District
Darrang 533 Population Density
Assam 340
Year Population Increase in
Population % of Increase
1951 4,02,501 1961 5,82,624 1,80,123 44.75
1971 8,34,574 2,51,905 43.22 *1991(20 Yrs) 12,98,860 4,64,294 55.63
Population Growth
*1981 Census was not conducted in Assam**
2001 15,04,320 2,05,460 15.82 ** Undivided Darrang District
Year Male Female Average % Literacy rate
2001 58.68% 41.32% 47.51%
% Darrang 937
Sex Ratio Assam on average 935
2.3 Infrastructure for Fishery development:
Production of fish in the district is relatively low. But in recent years some
entrepreneurs (in the rural areas and in some urban areas) have taken pisciculture as a major
occupation. Besides river and private tanks, some beels lying in the southern part of the district
cater to the major requirement of fish of the district.

22
Table 5: Fisheries Resource/infrastructure available in the district:
Sl Resource Area (ha)
1 Ponds and tanks 2978.20 2 Paddy cum fish culture 160.00 3 Derilict water bodies 802.45 4 Beel fisheries 942.20 5 River fisheries 6040.00 6 Others 20.00 7 Eco hatchery 5 nos 8 Magur hatchery 1 no
2.4 Infrastructure for Animal Husbandry and Veterinary development:
Veterinary Hospital : 1
Veterinary Dispensaries : 14
First Aid Centre : 12
A.I. Centre : 27
Block Veterinary Dispensaries : 6
Mobile dispensaries : 1
2.5 Infrastructure for Health:
Govt. Hospital (Civil hospital) : 1
30 beded rural hospitals : 4
Primary Health Centres : 35
Community health centre : 7
State Dispensaries : 11
Sub-Centres : 322
*Source: Statistical Hand Book, Assam, 2007
2.6 Educational Institutions in the district:
Community Information Centres : 8
(CIC)
Colleges : 4
Intermediate/ Junior college : 10
Higher Secondary Schools : 31
High Schools : 232
Middle Schools (State Govt.) : 450
Primary Schools (State Govt.) : 1523

23
No. of pre-primary schools : 11
*Source: Statistical Hand Book, Assam, 2007
2.7 Industrial position of the district (2005-06):
a. Agro based industries : 17
b. Forest based industries : 1
c. Engineering based industries : 19
d. Textile based industries : 21
e. Miscellaneous based industries : 34
*Source: Darrang District at a glance, 2006 published by Directorate of Economics and Statistics, Govt. of Assam
2.8 Infrastructure for road communication (2006-07):
Total length of PWD Road : 2437 Km
(black topped length-601 km, earthen length-1836
km)
(State Highway- 234 km, major district road –
330 km, rural road – 1858 km, urban road – 16
km )
*Source: Statistical Hand Book, Assam, 2007
2.9 Infrastructure for power and telecommunication:
Nos. of Electrified village : 1211 (92% of the total villages) as on 31st
March,
2006 (Source: Statistical Hand Book,
Assam,2007)
2.10 Credit infrastructure:
Bank Branches : 49
2.11 Police Station:
No. of police station : 4
No. of out post police station : 3
No. of Fire Service Station : 4
2.12 Infrastructure for Sericulture development:
No. of sericulture villages : 120
No. of spinning charkas : 9
*Source: Darrang District at a glance, 2006 published by Directorate of Economics and
Statistics, Govt. of Assam

24
2.13 Land use pattern of the district:
Total geographical area : 1, 42, 051 ha
Net sown area : 73,619 ha (51.82 % of total geographical area)
Area sown more than once : 59,116 ha (80.30% of net area sown)
Gross cropped area : 132735 ha
Cropping intensity : 180.30%
*Source: Darrang District at a glance, 2006 published by Directorate of Economics and Statistics, Govt. of Assam
Table 6: Distribution of Workforce:
85% of the population is engaged in agriculture and allied activities. Out of the total population of 12,98,860 in the district only 4,05,743 (i.e. 31.23 %.) constitute the workforce, the distribution of which is as follows. Workers under various sectors
Male Female Total
Cultivator 20,6711 36,402 2,43,113 Agricultural labour 46,335 10,536 56,871 Livestock, Forest etc. 21,718 18,936 40,604 Mining & Quarrying 52 0 52 Manufacturing & Production in Household & Industry.
1,131 1,609 2,740
Manufacture & production other than Household Industry
Construction worker 5,834 499 6,333
Trade & Commerce Transport storage & Communication
3,564 64 3,628
Based on
1991 census
Worker in other services 18,2,41 476 18,7,17

25
Fig 2: Office of the Deputy Commissioner, Darrang
Table 7: Administrative Setup:
The Setup
Name of HPC Name of the MP House of Parliamentary
Constituency 8 Mangaldai H.P.C Ramen Deka
Total = 1
Name of LACs Name of MLAs 65 Kalaigaon LAC Maheswar Boro Lagislative Assembly
Constituency 66 Sipajhar LAC Binanda Kr Saikia
67 Mangaldai(SC) LAC Hiren Kr. Das
68 Dalgaon LAC Ilius Ali
Total = 4
Sub-divisions The district has only one (1) Sub-division, namely - Mangaldai (Sadar) sub-division
Revenue Circle Mouza Chapai Rangamati
Revenue Circle & Mouza Mangaldai
Dahi Sipajhar Lokrai
Sipajhar
Hindughopa Dipila Bonmajha Rainakuchi
Patharighat
Sarabari

26
Pub-Dalgaon Shyamabari Pachim-Dalgaon Kharupetia Pub-Sialmari
Dalgaon
Pachim-Sialmari Total = 4 Total = 16 Development Blocks Names Sipajhar Pachim-Mangaldai Dalgaon-Sialmari Pub-Mangaldai Bechimari Sipajhar Total = 5 Mahkuma Parishad
The district has only one (1) Mahkuma Parishad, namely - Mangaldai Mahkuma Parishad
Anchalik Panchayat
Each Dev Block constitute one Anchalik Panchayat. Thus Darrang District contains Total 5 Anchalik Panchayats
Gaon Panchayat Darrang District has Total 76 Gaon Panchayats
Revenue Villages There are Total 533 Revenue villages in Darrang.
Table 8: Establishment Setup:
Addl. Deputy Commissioner (3 Nos.) Sub-Divisional Officer(Sadar) (2 Nos.) Extra Asstt, Commissioner (1 Nos.) C.O.(A) to D.C. (1 No.) Circle Officer (4 Nos.)
Administrative machinery (Mangaldai Sub-division)
Election Officer (1 No.) Total = 12
Names
Mangaldai Sipajhar Dalgaon
Police Stations
Dhula Total = 4
Burha Kharupetia
Out Posts (Sanctioned) Daipam

27
Total = 3
Patharighat Silbori
Out Posts (Non-sanctioned) Panbari
Total = 3
Dhalpur (Under Mangaldai P/S) Bhakatpara (Under Dhula P/S)
Watch Posts
Kharupetia (Attached to Kharupetia O/P)
Total = 3
2.14 Agro climatic Situation of the District:
The district has a sub-tropical climate with semi-dry hat summer and clod winter.
Dust storms are common in the southern part of the district during February to April of the
year because of the proximity of the area to sand loads of the Brahmaputra. Generally,
December and January are the coldest months of the year. The maximum rainfall generally
occurs during a period of 4 months starting from May/June. The drainage system is
inadequate in the monsoon. Recurrence of flood during monsoon due to heavy rainfalls in the
district and neighboring Arunachal Pradesh (state) and Bhutan (country) causes loss of crops
and other properties almost every year. In recent years the district the experienced the heavy
floods, to be precise, flash floods, due to heavy deforestation towards northern part. The
people of the district, who mainly depend on rain water for their cultivation, are often badly
affected on one hand by floods and on the other hand by occasional dry spell.
The annual rainfall varies from 1500 mm. to 2600 mm. Annual rainfall of the district
in 1995 was 2449 mm. The Khalingduar R.F. comes under the lowest rainfall zone. The
highest rainfall occurs at a small western part including Kalaigaon. The district received
maximum rainfall during the month May to September.
With respect of temperature, again the district is divided into belts in East-West
direction. The middle belts are the hottest, where temperature goes up to 36o and the northern
belts is the coolest, the temperature goes below 10o here. . Other parts experience temperature
ranges around 22o. The mean relative humidity here is around 82 %.

28
Table 9: Agro ecological situation (AES) of the District (Based on soil and topography):
Sl. No. Agro-ecological
situation
Blocks covered Characteristics
01. AES-1 Sipajhar, Pub Mangaldai, Kalaigaon(Part), Khairabari (Part), Bechimari
Low land with lower elevation
02. AES-2 Sipajhar, Pub Mangaldai, Dalgaon-Sialmari, Kalaigaon(Part), Bechimari, Pachim Mangaldai,
Upland with medium rainfall
03. AES-3 Sipajhar, Pub Mangaldai, Dalgaon-Sialmari,
Medium land with medium rainfall
04. AES-4 Kalaigaon(part), Khairabari (Part)
Deep water with lower elevation
2.15 Major Rivers of the District:
The mighty river Brahmaputra is the main river in the border of the south of the
district on the east to west direction. Other important tributaries of the Brahmaputra are
Barnadi, Nanoi, Mangaldai, Noanodi, Saktola, Dhansiri, which are the main River flowing
through the district and the rivers are perennial in nature.
2.16 Demographic pattern of the district:
As per 2001 census, the population of the district is 8,34,078, out of that 95% live in
rural areas and 5% in urban areas. The population density of the district is 533 persons/ sq. km
as against the 340 / sq. km of the state and sex ratio of 937 females/ 1000 male (935 of
Assam). The literacy rate in the district is 47.51%. The male literacy rate was calculated as
58.68% and that of female is 41.32%. Out of the total workforce of the district, 85% are of
designated as the agricultural workers and rests 15% are as non agricultural labours who are
basically engaged in Mining & Quarrying, Manufacturing & Production in Household &
Industry, Manufacture & production other than Household Industry, Construction worker,
Trade & Commerce, Transport storage & Communication, Worker in other services etc.
Migration of agricultural workers from rural to urban areas for better livelihood is hampering
the agricultural operations and other related works. The SC and ST population of the district
are 36,361 (4.78%) and 2,49,861 (1.29%) respectively. The demographic information (block
wise) presented in the table 10.

29
Table 10: Demographic information of the district:
Workers in No. Caste in No. Name of Block
Population (As per
2001 Census )
% of Literacy
Male No.
Female No. Agril. Non
Agril. Total SC ST General
(others)
Sipajhar 201532 103446 98086 7246 2086 9332 7284 1741 192507 Pub
Mangaldoi 138310 70947 67361 4346 1251 5597 9291 1819 128200
Dalgaon-Sialmari
148991 76726 72265 4284 1215 5499 2331 1468 145192
Pachim Mangaldai
192318 72944 69374 2715 1081 3796 10551 1697 180070
Bechimari 152927
48
68569 60913 1998 1872 3870 7227 3100 141923 Total 834078 48 392632 367999 26147 7505 33652 36361 9825 787892
*Source: SREP, 2005
2.17 Land use pattern of Darrang District: The total geographical area of the district is 1, 42, 051 hectares and out of that 73.40% is
cultivable area. At present, 83.7% of cultivable area is under cultivation. The gross cropped
area in the district is 87, 277 ha (61.40 % of total geographical area) and the net sown area is
calculated as 73,619 ha (84.4% of gross cropped area). The area sown more than once is 59,
116 ha (67.70% of gross cropped area). The cropping intensity is 180.30 %. Out of the total
cultivable area, 3.70% is still cultivable waste. Out of the total geographical areas, 1.70% areas
covered as current fallow land. Permanent pastures and grazing land covered 3, 105 ha
(2.20% of the total geographical area), Land under misc. trees groves not included in net area
sown covered 4, 760 ha (3.40 % of gross cropped area). Block wise land use pattern of the
district is presented in table 11.
Table 11: Land Use pattern (area in ha) of the district:
Forest Name of Block
Geogra phical area
Cultivable area
Cultivated area
Cultivab-le waste
Current fallow Res
erve
Open Pas ture
Non -Agril Use
Misc. Pla ntation
Sipajhar 43279 36500 30632 1550 750 - 1600 1520 3343 1500 Pub Mangaldoi
32162 21300 18438 350 400 - 0 321 2278 800
Dalgaon-Sialmari
33061 22500 18203 550 350 - 550 530 2558 750
Pachim Mangaldai
18582 14525 11532 400 430 - 0 385 1360 860
Bechimari 14967 9420 8472 400 432 - 0 349 2895 850 Total 1,42,051 1,04,245 87,277 3,250 2,362 2,150 3,105 12,434 4,760
*Source: SREP, 2005

30
2.18 Soil Types of Darrang District
The northern part of the district consists of the vast tracts of marshy Tarai-land of
Bhutan hills filled up by alluvial and colluvial deposits forming light textured soils with a
loose stratum. Major part of the district, mainly southern part, is younger alluvial entisols.
The central portion is covered by older alluvial alfisols. The northern part is brown red &
yellow ulfisols, tarai mollisols and small amount of bhabar.
The District can be divided in the low-lying plains, covered plains and hills. The hills
are for the most part formed of gneissic rocks from which excellent building stone can be
obtained. The plain is of alluvial origin and consists of sand and clay in varying proportions.
The northern border is covered by Alluvium, accompanied by another thin belt of
older alluvium. The rest of the district is covered by sandstone & shale.
The type of Farming situation under which Agricultural crops are grown in Darrang
District are given in the Table 12
Table 12: Types of Farming Situation under which important Agricultural Crops are cultivated in Darrang District:
Name of Agro-ecological situation
Name of the crop
Area in ha
Farming situation
Low land situation Paddy
Mustard
115.7
18.4
Sandy loam+ Irrigated Clay loam +Irrigated Sandy loam +Rainfed Clay loam+ Rainfed Sandy loam +Rainfed
Upland situation with medium rainfall
Paddy 180 Sandy loam +Rainfed Clay loam + Rainfed Clay + Rainfed Sandy loam +Irrigated Clay +Irrigated
Medium land with medium rainfall
Paddy 216 Sandy loam +Rainfed Sandy loam +Irrigated Clay loam +Rainfed
Deep water with lower elevation.
Paddy 120 Sandy loam +Irrigated Sandy +Irrigated
Foot Hill with High Elevation
Paddy 125.2 Sandy loam +Rainfed
*Source- SREP, 2005.

31
Table 13: Block wise textural classification of soils (area in ha and in %) for the district:
Sandy Loams Clay loam Silty clay loam Sl. No
Name of Block Geogra phical area
Cultivated area Area % Area % Area %
1. Sipajhar 43279 30632 19376.9
42.70 14314.65 33.04 9587.45 24.26
2. Pub Mangaldoi 32162 18438 21053.3
65.46 11108.70 34.54 0 0
3. Dalgaon-Sialmari
33061 18203 23142.7
70.00 9918.30 30.00 11007.00 41.20
4. Pachim Mangaldai
18582 11532 0 0 11532.00 100.0 0 0
5. Bechimari 14967 8472 3842.80
45.36 3019.42 35.64 1609.50 19.0
Total 1,42,051 87,277 67415.7
49893.07 22203.95
*Source: SREP, 2005 2.19 Operational land Holding Pattern of the district:
The total operational land holding in the district are 87, 277 ha and total cultivable area
is 1, 04, 245 ha. The average size of the land holding is 0.95 ha. The resource rich farmers on
the basis of size of land holding viz. big farmer (operational holding > 10.0ha) are 11.31 %.
37.06% farmers are found under small farm family (operational holding 1.0-2.0 ha). The
marginal farm family (operational holding 0.3 – 1.0 ha) accounted as 29.14%. 22.49% farmers
were calculate as marginal farm families (operational holding <0.3 ha). No farmers are founder
the category of medium farm family ( operational holding >2.0 ha -10.0 ha).The details of
classification of farmers on the basis of size of land holding and the block wise details on
operational land holding have been presented in table 14 and 15 respectively.
Table 14: Classification of farmers on the basis of operational land holding:
Size of holding Nos. of farmers % total farmers Big farm family 11522 11.31 Small farm family 37755 37.06 Marginal farm family 29686 29.14 Landless farm family 22912 22.49 Total farm family 101875 100.00

32
Table 15: Block wise details on operational land holding:
Operational holdings( in Number and Area in ha) Large Medium Small Marginal Landless Nos Area Nos Area Nos Area Nos Area Nos Area
Name of block
(3-4) (2-3) (1-2) (0.5-1) (< 0.4)Sipajhar 3623 8207 11855 14750 9335 6100 7246 1575 Pub Mangaldoi 2180 4946 7134 8876 5615 3671 4346 945 Dalgaon-Sialmari 2153 4883 7044 8765 5545 3624 4284 931 Pachim Mangaldai
1364 3092 4464 5554 3512 2296 2715 590
Bechimari 1002 2271 3279 4080 2580 1687 1998 434 Total 10322 23399 33776 42025 26587 17378 20589 4475
*Source: SREP, 2005
2.20 Irrigation status of the district:
78.4% of the total cultivated area is under rain fed and rest 21.6% is irrigated. Darrang
district receives total rainfall about 1500 mm. to 2600 mm per year and more than 70% distributed
in 7 months i.e. from April to October. Irrigated area is increased with the installation of STW,
mainly in Boro rice and also in vegetable area. Out of the total irrigated area about 71.4% is
covered by STW. In winter season, rainfall is less and crops suffer from water stress and need
irrigation. Even in areas with higher rainfall there is need of irrigation in critical periods. There
is a big gap between the potential irrigated areas than actual irrigated areas.
Table 16: Irrigation potential utilized in Darrang district (2003-04, 2004-05):
Kharif (ha) Rabi and pre-kharif (ha) Total (ha)
2003-04 2004-05 2003-04 2004-05 2003-04 2004-05 10543.00 10673.00 569.00 669.00 11112.00 11342.00
*Source: Statistical Hand Book, Assam 2006
Table 17: Irrigation Potential Created, upto 31.03.2006 through government Irrigation Scheme (Area in Hectare) :
Minor Major and Medium Total
33159 24599 57758
*Source: Statistical Handbook, Assam 2007

33
Table 18: Information on Rainfed and Irrigated area of Darrang district:
Irrigated area (Source wise)
Major Medium Minor
STW deptt. scheme
Total irrigated area
Sl. No.
Name of block
Rain fed area (ha)
% of cultiva-
ble area P A P A P A Nos. A % of
cultivable area
A
1. Sipajhar 19690 70.0 5778 2582 5164 30.0 109422. Pub
Mangaldoi 10057 65.0 2520.3 2520.3 1737 3474 35.0 8331
3. Dalgaon-Sialmari
9713 78.1 1113 2226 21.9 8490
4. Pachim Mangaldai
7865 79.0 1163 2326 21.0 3667
5. Bechimari 7123 83.7 884 1768 16.3 1345 Total 67138 78.4 2520.3 2520.3 5778 9602 19206 21.6 32775
*Source: SREP, 2005
P = Potential area in ha, A = Actual area irrigated in ha, % = % share of total irrigated area Table 19: Existing farming systems and predominant Enterprises in Darrang district:
AES-1 AES-2 AES-3 AES-4 Existing farming systems
Predominant Enterprises
Existing farming systems
Predominant Enterprises
Existing farming systems
Predominant Enterprises
Existing farming systems
Predominant Enterprises
Agriculture + A.H.
Agriculture
Agri + Horti + + A.H.
Agriculture
Agri + Horti + Fishery+ A.H.
Agriculture
Agriculture .
Agriculture
Agriculture +Fishery + A.H.
Agriculture
Agri + Horti + Fishery
Agriculture
Agri + Horti + A.H.
Agriculture
Agriculture + Horti
Agriculture
Agri + Seri + Horti
Agriculture
Agriculture + Horti +A.H.
Agriculture
*Source: SREP, 2005
Table 20: Agricultural Area covered in Darrang District:
Sl.No. Items Year Unit Particulars
(a)
Land Utilization- Net area sown
2007-08 ha 73619
(b) Area sown more than once -do- ha 59116 (c) Total cropped area -do- ha 132735 (d) P.C. of net area sown to total
geographical area -do- % 51.82
(e) P. C. area sown more than once to net area sown
-do- % 80.30
*Source: Dist. Agricultural Office, 2007-08

34
Table 21: Agricultural Institutions/ infrastructure available in the district: Infrastructure Utility Location No/Area Agriculture Department
Office of DAO Mangaldoi 1 Office building Office of SDAO Patharighat, Dalgaon 2
Community Canning and Training Center
Preservation of fruits and vegetables
Mangaldai 1
Office Building Office of Executive Engineer(Agril)
Mangaldai 1

35
CHAPTER III
AGRICULTURAL SCENERIO OF DARRANG DISTRICT
3.1 Introduction:
Agriculture is the back bone of economy in the district of Darrang. 85% of the
population is engaged in agriculture and allied activities and they take it as their main
occupation. Out of the total population of 8, 34, 078 in the district only 4, 05, 743 (i.e. 48.65
%.) constitute the workforce. The diverse topography and unique agro-climatic condition of the
region has made it very conducive for growing various types of agricultural and horticultural
crops.
Darrang is one of the most important district of Assam in respect of agriculture and
situated at an altitude of It is located at an altitude of 50 mtrs to 250 mtrs above MSL and at
20o9´N to 26o95´N latitude and 91o45´ E to 92o22´ E longitude 3, 48, 100 ha. This district is blessed
with plenty of natural resources which can be harnessed for the upliftment of the rural
community. The most important crops growing in the district are paddy, jute, mustard,
sesamum, groundnut, toria, green gram, black gram, sugarcane, potato, banana, vegetables etc.
Paddy is the staple food crop of the district.
3.2 Area under cultivation and existing crop production scenario in the district.
The major field crops grown in Darrang district are cereal, pulses, oilseeds, jute and
sugarcane. The area, production and productivity of major field crops in the district is
presented in table 22 and the trend of total area, production and productivity of cereals, pulses
and oilseeds for the last 35 years is depicted in table 23.
3.2.1. Cereal production system
Among the cereals paddy stands as most important crop of the district followed very
remotely by wheat and maize. Out of net cropped areas (198615 hectares) of the district the
paddy alone occupies 105965 hectares and covers about 53.35 % of the net cultivated area of
the district. On the other hand wheat and pulses occupy 2.36% and 4.55% net cultivated area of
the district. The productivity of paddy in the district is 1390 kg/ha which is less than the state
average (1475 kg/ha) and the national average (3040 kg/ha). The productivity of wheat in the
district is 1275 kg/ha which is far below both the state and national average.

36
Paddy is grown in three distinct
seasons viz. Autumn paddy or Ahu rice
(March/April to June/July), Winter
paddy or Sali rice (June/July to
November/December) and Summer
paddy or Boro rice
(November/December to May/June).
Out of 105965 hectares of total paddy
area winter paddy is occupying an area
of 54950 hectares followed by autumn
paddy (31915 hectares) and summer paddy (19100 hectares). On the other hand with the
introduction of Shallow Tube Wells (STWs) with the assistance of World Bank and NABARD
during nineties an abrupt increase in area under summer paddy and Autumn paddy has taken
place through out the district. Since autumn paddy grown traditionally as direct seeded crop
under rain fed condition, therefore productivity is very low. After installation of STWs, the
farmers also have shifted towards cultivation of summer paddy and hence the area under
autumn paddy also gradually increased.
Table 22: Annual Agricultural crop production of Darrang District (2004-05):
Sl.No Crops Area(ha) Production (tones)
Productivity ( kg/ha)
1. Winter rice 54950 82699 2400 2 Summer Rice 19100 35526 3770 3 Autumn Rice 31915 29138 2400 4 Wheat 4710 6005 982 5 Pulses 8955 5301 660 6 Jute 5278 45449* 2060 7 Sugarcane 595 42262 35793 *unit is in bale *Source: Darrang at a glance, 2006 and Deptt. of Agriculture, Darrang
Table 23: Annual Agricultural Crop Production Darrang District (2007-08):
Sl. No.
Item Area (ha) Production (MT) Productivity (Kg/ha)
Yield rate (MT)
1. Autumn rice. 19383 17696 912.96 913 2. Winter rice. 48310 72706 1504 1505 3. Summer rice. 18000 33480 1860 1860 4. Total rice 85693 123882 1425 1426 5. Wheat 2200 2805 1274 1275

37
6. Pulse 6292 3353 532 - 7. Total food
grain 94185 106381 1129 1129
8. Sugarcane 492 10099 20526 20527 9. Jute 3700 1550 1550 10. Oilseed 11473 6883 - -
*Source: Dist. Agricultural Office, 2008-09.
3.3 Existing cropping pattern and cropping sequences of the district:
The cropping intensity of the district is 180.30 % which is more than state average
(152%). Rice, jute, wheat, toria, green gram, black gram and vegetables are the important crops
and it is due to the double and triple cropping has to be initiated by the farmers in the district.
3.4 Fertilizer Consumption Pattern in the district:
At present fertilizer consumption level in the district is 56 kg/ha which is higher than
state average (40.70 kg/ha). With the increase in irrigated area and replacement of local variety
by high yielding variety especially in paddy and vegetables crops it is expected that the
fertilizer consumption may further increase in coming years. There is a need to mobilize the
farming community to avoid indiscriminate use of fertilizers and therefore practices like
integrated nutrient management shall have to be popularized. For rational use of chemical
fertilizers, the knowledge about the use of fertilizers must be gathered among the farmers. To
increase the productivity of different crops fertilizer consumption shall have to be increased.
Table 24: Fertilizer Consumption Pattern in the district:
Name of Fertilizer
2005 – 06 (in tones) 2006 – 07 (in tones)
Urea
3503 4294
SSP
3375 4694
MOP
1965 2720
DAP
1703 1954
*Source: Deptt. of Agriculture, Darrang

38
Table 25: Crop calendar of the District: Sl.No.
Crop Sowing / Planting Time Harvesting Time
1 Normal Ahu Rice (transplanted)
March – April (sowing in nursery bed) June – July
2 Sali Rice June – July (sowing in nursery bed) November – December
3 Boro Rice November – December (sowing in nursery bed)
April – May
4 Wheat 5th November – 15th December February – March 5 Black Gram Mid February – Mid March (summer)
Mid August – Mid September (Kharif) May – June (summer) November– December (Kharif)
6 Green Gram Mid February– Mid March (summer) Mid August – Mid September (Kharif)
May – June (summer) November– December (Kharif)
7 Pea Mid October January 8 Lentil Mid October – Mid November January – February 9 Jute Capsularis : March – April
Olitorious : Mid March – May June-July
10 Toria Mid October – Mid November January – February 11 Sesamum 1st Week of March – 1st Week of
April(summer) July – Mid August (Kharif)
June –July October - November
12 Niger October January – February 13 Linseed Mid October – Mid November February – March 14 Sugarcane March December - January
3.5 Existing farming practices and technology Gap in adoption. Table 26: Gap in adoption and proposed Extension Strategy for Improving the Productivity of crops: AES-1
Farming situation
Sandy loam +Rainfed Sl. No. Items of
Package Recommended
practice Existing practice
Gap in Adoptio
n (F/P/N)
Specific reasons for
the Gap
Farmers proposed extension strategy
1. Sowing- -Time -Method
June-July Line transplanting
June-July Haphazard practice
N P
1. Cost effective 2. Shortage of labour. 3. Time consuming.
1. Mechanization. 2. Training on farm Machinery.

39
2. Varieties Pankaj Ranjit.
Local variety/ Recommended Variety.
P Un availability of certified seed as per reqd.
1.Establishment of seed village.
3. Seed rate (per ha)
37.5 kg 45 kg P Low germination of seed
1. Training on seed production technology and storage at farmers level.
4. Seed treatment
Wet/dry Nil F Lack of knowledge
1. Awareness Camp. 2. Training.
5. Organic manure (t/ha)
10 t 4 t P Not-availability
Intensification of varmi-compost, FYM, Compost pit etc.
6 Fertilizer/ Nutrient (kg/ha) -Basal (N+P+K) -Top dress
20:20:20 20:00:00
Below dose
P
Financial problem
Financial support.
7. Method of fertilizer use: - Basal - Top dress
Soil application
Soil application
N
8. Micronutrient - Dose (kg/ha) - Method of application.
- - - - -
9. Pest management
Need base Not properly.
P Lack of awareness
1. Creation of awareness on concept of IPM. 2. Training on IPM. 3. Demonstration. 4. Field day.
10. Disease management
Need base. Not properly.
P Lack of awareness
1. Creation of awareness on concept of IDM. 2. Training on IDM. 3. Demonstration. 4. Field day.
11. Post harvest management
Scientific Method.
Traditional Method
P Lack of awareness
1. Creation of awareness on concept of post

40
harvest technology. 2. Training on Post harvest technology.
12. Weed management -Mechanical -Herbicide
Need base Butachlor.
N F
Interested on Manual weeding.
1. Training on Integrated weed management.
14. Land management: -Salinity/ acidity
- - F Lack of awareness
1. Social mobilization for micro watershed.
Table 27: Gap in adoption and proposed Extension Strategy for Improving the Productivity of crops: AES-1
Farming situation
Clay loam +Rainfed Sl. No.
Items of Package
Recommended
practice
Existing practice
Gap in Adoption (F/P/N)
Specific reasons
for the Gap
Farmers proposed extension strategy
1. Sowing: - Time. - Method
June-July Line transplanting
June-July Haphazard transplanting
N P
1. Cost effective. 2.Shotage 3. Time consuming
1. Mechanisation. 2. Training on farm Machinery.
2. Variety Pankaj Ranjit.
Local variety/ Recommended Variety.
P Un availability of certified seed as per reqd.
1.Establishment of seed village
3. Seed rate (per ha)
37.5 kg 45 kg P Low germination of seed
1. Training on seed production technology and storage at farmers level.
4. Seed treatment
Wet/dry Nil F Lack of knowledge
1. Awareness Camp. 2. Training.

41
5. Organic manure (t/ha)
10 t 4 t P Not-availability
Intensification of varmi-compost, FYM, Compost pit etc.
6. Fertilizer/Nutrient (kg/ha) -Basal (N+P+K) -Top dress
20:20:20 20:00:00
20:0:0 20:0:0
P
Lack of awareness.
1. Awareness.
7. Method of fertilizer use: - Basal - Top dress
Soil application
Soil application
N
8. Micronutrient - Dose (kg/ha) - Method of application.
- - - - -
9. Pest management
Need base Not properly.
P Lack of awareness
1. Creation of awareness on concept of IPM. 2. Training on IPM. 3. Demonstration. 4. Field day.
10. Disease management
Need base. Not properly.
P Lack of awareness
1. Creation of awareness on concept of IDM. 2. Training on IDM. 3. Demonstration. 4. Field day.
11. Post harvest management
Scientific Method.
Traditional Method
P Lack of awareness
1. Creation of awareness on concept of post harvest technology. 2. Training on Post harvest technology.
12. Weed management -Mechanical -Herbicide
Need base. Butachlor.
Need base . Nil
N
F
Interested on Manual
1. Training on

42
weeding. Integrated weed management.
13. Water management. -No. of irrigation. -Method of irrigation.
4-5 no.s flooding.
Rainfed.
F
Irrigation facility not available.
1. Installation of STW. 2. Lifting of water from natural pond.
14. Land management: -Salinity/ acidity. -Water logging.
Drainage.
Nil.
F Lack of awareness
1. Social mobilization for micro watershed.
15. Method of harvesting
- Manually N
16. Any other - - - - - Average
Yield (Q/Ha) - Grain. - Fodder.
4.00
2.50
P
Cultivation was not done as per package of practices.
1. Training on ICM. 2. Demonstration. 3.Exposure visit.
Table 28: Gap in adoption and proposed Extension Strategy for Improving the Productivity of crops: AES-1
Farming situation
Clay loam +irrigated Sl.No.
Items of Package
Recommended practice
Existing practice
Gap in Adoption(F/P/N)
Specific reasons for the Gap
Farmers proposed extension strategy
1. Sowing: - Time. - Method
Nov-Dec. Line transplanting
Nov-Dec. Line transplanting
N N
2. Variety Pankaj Ranjit.
Pankaj Ranjit.
N
3. Seed rate (per ha)
37.5 kg 45 kg P Low germination of seed
1. Seed Replacement.
4. Seed treatment
Wet/dry Nil F Lack of knowledge
1. Awareness Camp. 2. Training.

43
5. Organic manure (t/ha)
10 t 4 t P Not-availability
Intensification of varmi-compost, FYM, Compost pit etc.
6. Fertilizer/ Nutrient (kg/ha) -Basal (N+P+K) -Top dress
20:30:30 40:00:00
20:0:0 20:0:0
P
Lack of awareness.
1. Awareness camp. 2. Training on INM. 3. Method Demonstration.
7. Method of fertilizer use: - Basal - Top dress
Soil application
Soil application
N
8. Micronutrient- Dose (kg/ha) - Method of application.
- - - - -
9. Pest management
Need base Not properly.
P Lack of awareness
1. Creation of awareness on concept of IPM. 2. Training on IPM. 3. Demonstration.4. Field day.
10. Disease management
Need base. Not properly.
P Lack of awareness
1. Creation of awareness on concept of IDM. 2. Training on IDM. 3. Demonstration.4. Field day.
11. Post harvest management
Scientific Method.
Traditional Method
P Lack of awareness
1. Creation of awareness on concept of post harvest technology. 2. Training on Post harvest technology.

44
12. Weed
management -Mechanical -Herbicide
Need base. Butachlor.
Need base . Nil
N
F
Interested on Manual weeding.
1. Training on Integrated weed management.
13. Water management. -No. of irrigation. -Method of irrigation.
5+-2 standing water.
Not maintain.
F
Cost factor.
1. Adoption of SRI/Resource conservation Technology.
14. Land management: -Salinity/ acidity. -Water logging.
Drainage.
Nil.
F Lack of awareness
1. social mobilization for micro watershed.
15. Method of harvesting
- Manually N
16. Any other - - - - - Average
Yield (Q/Ha) - Grain. - Fodder.
4.00
2.50
P
Cultivation was not done as per package of practices.
1. Training on ICM. 2. Demonstration.3.Exposure visit.
Table 29: Gap in adoption and proposed Extension Strategy for Improving the Productivity of crops: AES-2
Farming situation
Sandy loam+ Rainfed Sl. No.
Items of Package
Recommended practice
Existing practice
Gap in Adoption(F/P/N)
Specific reasons for the Gap
Farmers proposed extension strategy
1. Sowing: - Time. - Method
Nov-Dec. Line transplanting
Nov-Dec. Line transplanting
N N
- -
- -
2. Variety Pankaj Ranjit.
Pankaj Ranjit.
N - -

45
3. Seed rate (per ha)
37.5 kg 45 kg P Low germination of seed
1. Seed Replacement.
4. Seed treatment Wet/dry Nil F Lack of knowledge
1. Awareness Camp. 2. Training.
5. Organic manure t/ha)
10 t 4 t P Not-availability
Intensification of varmi-compost, FYM, Compost pit etc.
6. Fertilizer Nutrient (kg/ha) -Basal (N+P+K) -Top dress
20:20:20 20:00:00
20:00:00 20:00:00
P
Lack of awareness.
1. Awareness camp. 2. Training on INM. 3. Method Demonstration.
7. Method of fertilizer use: - Basal - Top dress
Soil application
Soil application
N
8. Micronutrient - Dose (kg/ha) - Method of application.
- - - - -
9. Pest management
Need base Not properly.
P Lack of awareness
1. Creation of awareness on concept of IPM. 2. Training on IPM. 3. Demonstration.4. Field day.
10. Disease management
Need base. Not properly.
P Lack of awareness
1. Creation of awareness on concept of IDM. 2. Training on IDM. 3. Demonstration.4. Field day.
11. Post harvest management
Scientific Method.
Traditional Method
P Lack of awareness
1. Creation of awareness on concept of post

46
harvest technology. 2. Training on Post harvest technology.
12. Weed management -Mechanical -Herbicide
Need base. Butachlor.
Need base . Nil
N
F
Interested on Manual weeding.
1. Training on Integrated weed management.
13. Water management. -No. of irrigation. -Method of irrigation.
4-5 no.s flooding.
Rainfed.
F
Irrigation facility not available.
1. Installation of STW. 2. Lifting of water from natural pond.
14. Land management: -Salinity/acidity.-Water logging.
Drainage.
Nil.
F Lack of awareness
1. Social mobilization for micro watershed.
15. Method of harvesting
- Manually N
16. Any other - - - - - Average Yield
(Q/Ha) - Grain. - Fodder.
4.00
2.50
P
Cultivation was not done as per package of practices.
1. Training on ICM. 2. Demonstration.3. Exposure visit.
Table 30: Gap in adoption and proposed Extension Strategy for Improving the
Productivity of crops: AES-3
Farming situation
Clay loam+ Rainfed Sl.No.
Items of Package
Recommended practice
Existing practice
Gap in Adoption(F/P/N)
Specific reasons for the Gap
Farmers proposed extension strategy
1. Sowing: - Time. - Method
June-July. Line
June-July. Haphazard
N G
Not a
Awareness for

47
transplanting transplanting critical factor in Rainfed condition.
maintaining plant population.
2. Variety Pankaj Ranjit.
Pankaj Ranjit.
N
3. Seed rate (per ha)
37.5 kg 45 kg P Low germination of seed
1. Seed Replacement.
4. Seed treatment Wet/dry Nil F Lack of knowledge
1. Awareness Camp. 2. Training.
5. Organic manure (t/ha)
10 t 4 t P Not-availability
Intensification of varmi-compost, FYM, Compost pit etc.
6. Fertilizer/ Nutrient (kg/ha) -Basal (N+P+K) -Top dress
20:20:20 20:00:00
20:00:00 20:00:00
P
Lack of awareness.
1. Awareness camp. 2. Training on INM. 3. Method Demonstration.
7. Method of fertilizer use: - Basal - Top dress
Soil application
Soil application
N
8. Micronutrient - Dose (kg/ha) - Method of application.
- - - - -
9. Pest management
Need base Not properly.
P Lack of awareness
1. Creation of awareness on concept of IPM. 2. Training on IPM. 3. Demonstration.4. Field day.
10. Disease management
Need base. Not properly.
P Lack of awareness
1. Creation of awareness on concept of IDM. 2. Training on IDM.

48
3. Demonstration.4. Field day.
11. Post harvest management
Scientific Method.
Traditional Method
P Lack of awareness
1. Creation of awareness on concept of post harvest technology. 2. Training on Post harvest technology.
12. Weed management -Mechanical -Herbicide
Need base. Butachlor.
Need base . Nil
N
F
Interested on Manual weeding.
1. Training on Integrated weed management.
13. Water management. -No. of irrigation. -Method of irrigation.
4-5 no.s flooding.
Rainfed.
F
Irrigation facility not available.
1. Installation of STW. 2. Lifting of water from natural pond. 3. Harvesting of rainwater.
14. Land management: -Salinity/acidity. -Water logging.
Drainage.
Nil.
F Lack of awareness
1. Social mobilization for micro watershed drainage development.
15. Method of harvesting
- Manually N
16. Any other - - - - - Average Yield
(Q/Ha) - Grain. - Fodder.
4.00
2.50
P
Cultivation was not done as per package of practices.
1. Training on ICM. 2. Demonstration.3. Exposure visit.

49
Table 31: Gap in adoption and proposed Extension Strategy for Improving the Productivity of crops: AES-4
Farming situation Sandy loam+ Irrigated Sl.No. Items of Package Recommended
practice Existing practice
Gap in Adoption(F/P/N)
Specific reasons for the Gap
Farmers proposed extension strategy
1. Sowing: - Time. - Method
Nov-Dec. Line transplanting
Nov-Dec. Line transplanting
N N
2. Variety Mahsuri Bishnu Prasad.Jyoti Prasad.
Biplav N Biplav is generally accepted variety by the farmers because of its high yield.
Research: Require further study of Biplav variety.
3. Seed rate (per ha) 37.5 kg 50 kg P Continuous use of seeds from own source for years.
Seed Replacement.
4. Seed treatment Wet/dry Nil F Lack of knowledge
1. Awareness Camp. 2. Training.
5. Organic manure (t/ha)
10 t 6 t P Not-availability
Intensification of vermi-compost, FYM, Compost pit etc.
6. Fertilizer/Nutrient (kg/ha) -Basal (N+P+K) -Top dress
30:30:30 30:00:00
Below dose.
P
Financial problem.
Financial support.
7. Method of fertilizer use: - Basal - Top dress
Soil application
Soil application
N
-
-
8. Micronutrient - Dose (kg/ha) - Method of application.
- - - - -
9. Pest management Need base Not properly.
P Lack of awareness
-
10. Disease Need base. Not P Lack of -

50
management properly. awareness 11. Post harvest
management Scientific Method.
Traditional Method
P Lack of awareness
-
12. Weed management -Mechanical -Herbicide
Need base. Butachlor.
Need base . Nil
N
F
Interested on Manual weeding.
13. Water management. -No. of irrigation. -Method of irrigation.
4-5 no.s Flooding.
3-4 no.s Flooding.
P
1. Expensive.
14. Land management: -Salinity/ acidity. -Water logging.
Lime application.
Nil.
F
Not easily available.
1. Linkage with input dealers. 2. Dealers training.
15. Method of harvesting
- Manually N - -
16. Any other - - - - - Average Yield
(Q/ha) - Grain - Fodder.
4.00
3.00
P
Improve cultivation practice.
1. Training on ICM. 2. Demonstration.3. Exposure visit.
Table 32: Technology gap in cereal (paddy & wheat) production:
Sl
No. Packages of
practices Varieties in
practice Recommended
varieties Technology gap and reasons for
gap
Proposed strategy
1. Variety a) Ahu rice Local and high
yielding varieties Pusa 2-21, Gobinda, Jaya, Saket 4, Ratna, IR- 50, IR-36, Luit, Chilarai, Gopinath, Dikhow, Kapilee, Dishang,
b) Sali rice Local and high yielding varieties
Rasi, Pusa 2-21, Ranjit, Pankaj, Bahadur, Kushal, Piolee, Saket 4,
Partial gap in adoption 1.Lack of technical know how of farmers about HYV and improved method of rice cultivation 2.Non-availability of good quality
1. Creating a model farm at KVK 2. Creating mass awareness through training, OFT & FLD at farmer’s

51
Ratna, Jaya, Moniram, Lakhimi, IET 6666, IET 6987, Mahsuri, Stryranjan, Basundhara, Manoharsali
c) Boro rice Local and high yielding varieties
Boro 1, Boro 2, Culture – 1, Mahsuri, Joymati, Jyotiprasad, Bishnuprasad, NBR-2, NBR-3
d) Wheat Use local Variety K7410, WH 291, K8962, K9107, DBW-14, HUW468, UP 262, HDR-77, Sonalika
recommended varieties seeds in time
field. 3.Make availability of seeds of recommended varieties in time 4. Farm advisory services
2. Sowing time & method Sl
No. Packages of
practices Existing practices Recommended
practices Technology gap
and reasons for gap
Proposed strategy
2.
a) Ahu rice b) Sali rice c)Boro rice d) Wheat
Local and improved Local and improved Local and improved Local and improved
February-March June –July November-December 5th November to 20th November
1.Lack of
technical know how of farmers about proper sowing time and spacing
1. Creating mass awareness through training to farmers, OFT & FLD at farmers’ field.
3. Nursery bed Sl
No. Packages of
practices Existing practices Recommended
practices Technology gap
and reasons for gap
Proposed strategy
a) Size Not strictly followed the actual size as per recommendations by all farmers
10.0 mt. x 1.25 mt per bed
Full gap in adoption of tech. Ignorance about the benefit of maintaining specific seed size.
1. Creating mass awareness through training to farmers, OFT & FLD at Farmers’ field.
b) Fertilizer -do- 80g N2, 80g SSP & 40g MOP per bed
Full gap in adoption of tech. Lack of
1. Creating mass awareness

52
knowledge about the benefit of the use of fertilizers
through training to farmers, OFT & FLD at Farmers’ field.
c) Seed rate More than recommendation
i) Paddy:40-45kg/ha ii) Wheat: 100-120kg/ha
Partial gap in adoption of tech To avoid short fall of seedling
1. Creating mass awareness through training to farmers, OFT & FLD at Farmers’ field.
d) Seed treatment
i)Paddy Not followed a. Wet seed treatment: Seed soaking in solution of Indofil M-45 @ 2.5g or Bavistin @ 1g/lit of water for 24 hrs. b. Dry seed treatment: Mancozeb @ 2.5 g/kg or Captaf @ 2.5g/kg
Full gap in adoption of tech Lack of Knowledge on seed treatment
Creating mass awareness through training & demonstration at farmer’s field.
ii) Wheat Not followed a. Wet seed treatment: Seed soaking in solution of Captaf or Vitavox or Bavistin @ 3g/kg of seed. b. Dry seed treatment: Mancozeb @ 2.5 g/kg or Captaf @ 2.5g/kg
Full gap in adoption of tech Lack of Knowledge on seed treatment
1. Creating mass awareness through training to farmers, OFT & FLD at Farmers’ field.
f)Precautionary measure before transplanting in the main field
Not followed Furadon 3G @ 3g/sq meter 1 (one) week before uprooting of seedling or seedling root dip treatment with 0.02% solution of chloropyriphos @ 1ml/lit along with 1% solution of urea.
Full gap in adoption of tech Lack of awareness
1. Creating mass awareness through training to farmers, OFT & FLD at Farmers’ field.

53
4. Main field a) Organic manure
Inadequate 10 t/ha Partial gap in adoption of tech Not available
Training on preparation of vermicompost, compos & manure
b)Fertilizer (N:P:K kg/ha)
Inadequate & irrationaluse
Ahu & Sali rice: 40:20:20 Boro rice : 60.30.30 Wheat : 60:45:42
Partial gap in adoption of tech Farmers are content with basal dose
Training on economic and rational use of N application & INM
c) Bio-fertilizer Not applied Azolla @ 500kg/ha in rice
Full gap in adoption of tech Ignorance & unavailability of the input
Training & demonstration on use of bio-fertilizer.
d)Spacing Not followed line sowing
Ahu & Sali : 20x20 and 20cm x 15 cm Wheat : 20-22 cm row to row
Partial gap in adoption of tech Line transplanting /sowing is expensive & labour intensive
1. Creating mass awareness through training to farmers, OFT & FLD at Farmers’ field.
d) Pest management : Stem borer, hispa, gundhi bug, aphid (wheat)
ITK followed Chloropyriphos 20 EC @ 1lit/ha or Monocrotophos 40EC @1.2 lit/ha or Malathion 50EC @ 1.2 lit/ha
Non adoption of IPM. Ignorance & not availability of recommended insecticide.
1.Creating awareness through training & demonstration 2. Supply of kits & inputs at subsidized rate.
e) Disease management : BLB& blast in paddy; leaf blight & spot in wheat
Improper management
Avoid top dressing of N, top dressing 17 kg MOP/ha or foliar spray of 3% MOP solution @ 8.5kg/ha in paddy. Sppraying of Zineb or Mancozeb @ 1.2-1.5 kg/ha at an interval of 10 days in case of wheat desease.
Partial gap in adoption of IDM tech. Lack of knowledge about symptoms, disease incidence & use of fungicide
1. Creating awareness training & demonstration 2. Supply of kits & inputs at subsidized rate.
f) Weed management (Mechanical, herbicides)
Follow manual weeding
Manual weeding twice at 20 & 40 DA planting need based) & post emergence application of 2,4-D @ 0.5-0.75 kg a.i./ha at 2-3 leaf stage of weed (broad leaf &
Partial gap in adoption of IWM tech. Lack of awareness on proper & IWM tech.
Creating awareness through training & demonstration

54
sedge). g) Water management (irrigation no. & method)
Not proper Ahu: 5-7 nos. & Boro: 10-12 nos. Maintain 5-7 cm water depth after 2-3 days transplanting upto 7-10 days before harvest in paddy. Tow irrigation at CRI (20-25 DAS) & flowering stage in wheat.
Partial gap in adoption of technology Lack of knowledge about efficient water management tech.
Creating awareness on irrigation management through training & demonstration
5. Grain yield (q/ha)
Low than recommended practices
Ahu & Sali: 40-50q/ha, Boro: 60-65q/ha. wheat: 20-25q/ha (Rainfed), 30-35q/ha(irrigated)
Partial gap in adoption of technologies Full recommendation not followed due to higher management cost, resulting low yield.
Conducting training, & demonstration on improved production technologies of cereal crops.
Table 33: Technology gap in pulses production:
Sl No.
Packages of practices
Existing practices
Recommended practices Technology gap Reason for gap
Proposed strategy
1. Variety a) Black gram Use local
Variety T 9, T 27, T 122, Pant U 19, Saoniamah (SB 121)
b) Green gram -do- T 44, PIMS 1, ML131, Pratap(SG-1), AAU-34, AAU-39, GS-21-5, T-44,K-851, Kopergaon, ML 56
c) Lentil -do- B-77, L-9-12, PL-81-4, PL-406
d) Pea
-do- T-163, Rachna, HUP-2, Boneville, KFPD 1
Full gap in adoption of tech 1. Lack of technical knowledge about cultivation of pulses 2. Non-availability of recommended and improved varieties in time
1. Make timely availability of seeds of recommended variety. 2. Creating mass awareness through training, OFT & FLD.
2. Sowing time & method a) Summer b) Kharif c) Rabi
Late sowing
Mid February-March Mid August –mid Sept. Mid Oct.-mid November
Partial gap in adoption 1. Kharif sowing delayed due to continuous
1. To grow late HYV seeds 2. Growing of suitable medium duration Sali

55
rain. 2. Rabi sowing delayed due to late harvest of Sali rice
rice variety which can be harvested by mid October. 3. To make aware the farmers about timely cultivation of Sali rice. 4. If possible, grow pulses in separate field
3. Seed rate Use higher seed rate
a. Black gram:25-27kg/ha (Broadcasting) 20-25kg/ha (Line sowing) b. Green gram: 20-25kg/ha(Broadcasting) 18-25 kg/ha (Line sowing) Pea: 60-75kg/ha Lentil: 30kg/ha
Partial gap in adoption. Seeds procure from local market often have low germination.
1. Make availability of good quality seeds having good germination. 2. Training and demonstration
4. Spacing (Line sowing)
Not maintained
30 cm X 10 cm (Black gram, Green gram, Pea) Lentil: 25cm X 5-7 cm
Full gap in adoption Expensive and labour intensive
1. Provide suitable seed drill. 2. proper training and demonstration.
5. Fertilizer (NPK- kg/ha)
Inadequate and improper application
For Black gram, Green gram and Lentil 15-35-0 (without rhizobium) 10-35-0 (with rhizobium) Pea: 20-46-0 (without rhizobium) 10-46-0 (with rhizobium
Partial gap in adoption. Lack of idea about fertilizer requirement and INM.
Training on INM.
6. Bio-fertilizer application
Not applied Seed inoculation with Rhizobium culture: Moisten seeds with clean water avoiding excess wetting and mix Rhizobium culture thoroughly with seeds @150 gm of culture in 3-4kg seeds. Dry the treated seeds under shade.
Full gap in adoption of technology. Lack of awareness about inoculation of rhizobium with seeds.
Training on rhizobium & PSB inoculation.
7. Application of lime
Not followed Calcium carbonate in the form of Dolomitic lime @ 492 kg/ha applied 15 days after sowing
Full gap in adoption of technology. Lack of awareness about lime application.
To impart training on importance of lime application
8. Pest Follow Application of Malathion Partial gap. Proper training

56
management (Aphid. Jassids, Flee beetle, hairy caterpillar, white fly, Pod borer , leaf minor etc.)
indigenous technology, irrational use of plant protection chemical
50 EC @ 1-1.5 lit/ha or Endosulfan @ 1-1.5 lit/ha), Nuvan 100 EC @ .5ml/lit of water.
Lack of technical know how about initial symptom of pest incident and IPM.
and demonstration.
9. Disease management (Leaf spot, blight, powdery mildew, rust, wilt etc.)
Follow indigenous technology, irrational use of plant protection chemical
Seed treatment with Bavistin or Thiram @ 2 gm/ kg. Spraying with 0.05 % Bavistin or Indofil M45 @ 0.2% solution or Monocrotophos @ 2ml/ lit of water at 10 to 15 days interval.
Partial gap. Lack of technical know how about initial symptom of pest incident and IPM.
Proper training and demonstration.
10 Weed management
Traditional Application of pre emergence herbicides along with two hand weddings at 30-450days intervals.
Full gap in adoption. Lack of knowledge.
Training and demonstration on Integrated weed management.
11 Irrigation Grown as rain fed crop
Irrigate at 40-50 days after sowing if required an available.
Full gap in adoption of scientific methods of irrigation. 1.Lack of awareness 1. Lack of irrigation facility.
1. To create awareness among farmers about the benefit of application of irrigation 2. Demonstration showing cost benefit ratio.
12 Method of Harvesting
Pulling of whole plants.
Picking of pod and cut the plants at ground level
Full gap 1.Easy to Harvest 2. Lack of knowledge about the benefit of nodules present in the root
Training and demonstration.
13 Yield (Q/ha) Low yield than recommended practices
10-12 Partial gap. Non adoption of full recommended cultivation practices
Awareness on improved method of pulses cultivation through training and demonstration.

57
Table 34: Technology gap in Oil seed production:
Sl No.
Packages of practices
Existing practices
Recommended practices
Technology gap Reason for gap
Proposed strategy
Crops: Toria, Mustard, Sesamum 1. Variety Use local
variety Toria: M- 27, TS-38, TS- 36, TS-29, TS-46 Mustard: Varuna, TM-2, TM-4 Sesamum: SP 1181 (Madhabi), ST 1683, Gouri, Vinayak, RT 1, Punjab Til No. 1
Non adoption of HY & improved variety. 1. Lack of technical know how about varietal difference 2.Non-availability of recommended variety.
1. Make availability of seeds of recommended variety. 2. Creating mass awareness through training,
2. Sowing time
Late sowing
Mustard and Toria: Mid October to Mid November Sesamum: July to first forthnight of August
Partial gap. Delayed harvest of previous rice crop in mid land.
1. Suitable short/medium duration early Sali rice variety is to be introduced. 2. For sesamum, upland is to be selected.
3. Sowing method
Follow broadc-asting
Line sowing Broadcasting
Partial gap. Lack of knowledge for maintaining proper spacing.
1. Provide suitable seed drill 2. Proper training /demonstration is to be provided.
4. Seed rate Use of higher seed rate
Toria: 10Kg/ha Mustard: 8 Kg/ha Sesamum: 4 kg/ha
Partial gap in adoption. Seeds procure from local market often have low germination.
1. Make availability of good quality seeds having good germination. 2. Training and demonstration.
5. Application of organic manure
Use of low dose of organic manure.
2-3 t/ha Partial gap in adoption 1. Ignorance about the application of organic manure. 2. not available
1. Creating awareness. 2. Training and demonstration on preparation of super digest compost and vermicompost
6. Fertilizer ( NPK kg/ha)
Improper application
Toria & Mustard: 60:30:30 kg/ha Sesamum: 30:20:20 kg/ha
Partial gap in adoption. 1. Lack of awareness. 2. Financial constraint.
1. Creating awareness about INM. 2. Credit Linkage and facilities.
7. .
Pest (Aphid & saw fly)
Follow indigenous technology and improper dose
1. Rogor 2ml/lit of water or Chloropyrephos 2.5 ml/lit of water or Endosulfan 2
Partial gap. Ignorance about the pest and IPM approach.
Creating awareness among farmers on IPM through training and demonstration.

58
ml/lit of water. 2. Timely sawing of crop.
8. Disease
(Downy mildew, white rust etc)
Follow indigenous technology and improper dose
Seed treatment with Apron 35WS (Metalaxyl) @ 6 gm/ kg seed.
Full gap. Ignorance about the pest and IDM approach.
Creating awareness among farmers on IDM through training and demonstration.
9. Weed management
Traditional Toria and mustard: No weeding is required Sesamum: One weeding at 20 DAS
- Partial gap. Ignorance about the proper time of weeding
Weed management approach through training and demonstration
10. Irrigation Grown as Rainfed crop
One irrigation up to a depth of 6cm at 50% flowering/ early pod formation stage.
Full gap in adoption of scientific methods of irrigation. 1.Lack of awareness 2. Lack of irrigation facility.
1. Creation of irrigation facilities 2.Demonstration showing cost benefit ratio.
11. Method of Harvesting
Traditional Pulling of whole plants when 70-80% pods turned yellow.
No gap in adoption. -
_
12. Yield (q/ha) Low yield than recommended practices
Toria: 10-12qt/ha Mustard: 12-16 qt/ha Sesamum: 8-9 qt/ha
Partial gap. Full recommendation not followed due to higher management cost, resulting low yield.
Awareness on improved method of oil seed cultivation through training and demonstration.
Table 35: Technology gap in Sugarcane production:
Sl No.
Packages of practices
Existing practices
Recommended practices
Technology gap Reason for gap
Proposed strategy
1. Variety Use unknown/ local variety
For general cultivation: Co 740, Co 997, Co 1008, S 155/72 (Co Jor 1), S 101/72 (Co Jor 2), Co 6315, Co 961, Co-1132, CO JOR 1, Doria, Kolong, Barak, Lohit, Dhansiri, C 1132, For chewing purpose: Co-7401, Co. 1148, Co. 7107
Full gap in adoption Bulky and sets of recommended variety are locally not available.
1. Make availability of seeds of recommended variety. 2. Creating mass awareness through training, demonstration & OFT.

59
2. Sowing time
Followed
March
Partial gap. Sometimes delayed due to delayed pre monsoon rain.
Make sure of irrigation facilities.
3. Sowing method
Followed
3-4 budded planting sets in trench/ furrow
No gap in adoption -
-
4. Seed rate followed specific seed rate
45000-52000 (6.5-7.5 t) per ha
No gap in adoption. -
-
5. Seed treatment
Not adopted Dipping in 0.2% solution of Captaf or Indofil M-45 or 0.1% solution of Bavistin.
Full gap. Lack of knowledge
Training & demonstration
6. Application of organic manure
Applied inadequate amount
10 t/ha Partial gap. Not available.
Training on preparation of super digest compost/manure and vermicompost
7. Fertilizer ( NPK kg/ha)
Inadequate & improper application
NPK @ 135:70:60 kg/ha
Partial gap in adoption. 1. Lack of awareness. 2. Economic hardship
1.Trainign & demonstration 2. Credit Linkage and facilities.
i)Basal -do- 45-70-30 (1/3rd of Nitrogen and ½ of potassium fertilizer in trenches before planting)
Partial gap. Lack of knowledge on proper use of fertilizer
Training & demonstration on use of fretilizers
ii) Topdress-ing
-do- 90-0-30 (2/3rd N and ½ of K fertilizer top dressed at first earthing up or within 90-100 days of planting)
Full gap. Lack of knowledge on proper use of fertilizer
Training & demonstration on use of fretilizers
6 .
Pest management (Termite, red ant, stem borer etc)
Follow indigenous technology and application of imbalanced chemicals.
1. Malathion 5% dust@ 20-25 Kg/ha in trenches before planting. 2. Endosulfan @ 1-1.5 Lit/ ha at 15 days interval starting from rush of egg laying (Stem borer).
Full gap. Ignorance about the pest and IPM approach.
Creating awareness on IPM by training and demonstration.
7 Disease(Red rot , wilt)
Not followed 1. Diseases free sets be selected. 2. Water stagnation in field should be avoided. 3. Affected plants should be rouged. 4. Ratooning should be discourage.
Full gap. Lack of knowledge
Training & demonstration

60
8 Weed management
Improper 1. First weeding at 30-35 days and 2nd at 60-90 days.
2.Pre emergence application of 2,4- [email protected] Kg a.i/ha.
Partial gap 1. Lack of knowledge on use of herbicide. 2. Not available input in time
Training & demonstration showing cost benefit ratio
9 Earthing up One earthling up
First at 45-60 days after planting and 2nd at 90-100 days after planting.
Partial gap To reduce cost of two earthing up
Training & demonstration showing cost benefit ratio
10 Stripping and Propping
Not followed Removal of old and dry leaves to be mechanical support to prevent logging.
Partial gap Lack of knowledge
Training
11 Method of Harvesting
Partially followed.
Harvesting to be done at the ground level and as per maturity time. Late suckers are removed at harvesting.
Partial gap Lack of knowledge
Training
12 Yield (t/ha) Low than recommended practices
80-100 t/ha. Partial gap Low yield as full inputs are not applied
Training & credit linkages.
Table 36: Technology gap in Jute production:
Sl No.
Packages of practices
Existing practices
Recommended practices
Technology gap Reason for gap
Proposed strategy
1. Variety Use local Variety
Capsularis: JRC-212 (Saubujsona), JRC-321 (Sonali), JRC- 7447 (Shyamali), JRC -1108, UPC-94 (Reshma) Oilotorious: JRO-524 (Novin), JRO- 7835 (Basudev), JRO-632 (Baisakh tossa), Tarun (AAU-OJ-1)
Non adoption of technology Recommended varieties are not available.
1. Make availability of seeds of recommended variety. 2. Creating mass awareness through training, demonstration & OFT.
2. Sowing time
Followed
Capsularised: Mid Feb – April. Oilotorious: Mid March to May.
Partial gap. Sometimes delayed due to delayed pre monsoon rain.
Creation of irrigation facilities.
3. Sowing method
Followed Broadcast sowing.
Broadcast sowing. Line sowing.
Partial gap in adoption Line sowing expensive & labour intensive
1.Provide suitable seed drill 2. Training & demonstration
3. Seed rate Followed specific seed rate
Capsularised: Line sowing: 6-7 kg/ha.
No gap in adoption. -
-

61
Broadcast: 10-11 kg/ ha Oilotorious: Line sowing: 5-6 kg/ha. Broadcast: 6-7 kg/ ha
4. Seed treatment
Not adopted Indofil M-45 or Bavistin @ 2g/kg of seed for control of stem rot, root rot and other diseases.
Full gap. Lack of knowledge
Training & demonstration
4. Application of organic manure
Inadequate application
5t/ha Partial gap. Not available.
Training and demonstration on preparation of super digest compost
5. Fertilizer ( NPK kg/ha)
Inadequate & improper application
Capsularised: 40-25-30 Basal application: 0-25-30. Top dressing: 40-0-0. Olitorious: 30-25-25 Basal application: 0-25-25. Top dressing: 30-0-0.
Partial gap 1. Lack of awareness. 2. Economic hardship
1. Trainign & demonstration on INM. 2. Credit Linkage and facilities.
6 Method of fertilizer application
-do- Basal: Full P& K fertilizer is applied during final land preparation for both capsularis and olitorious. Top dressing: 50% N at 4-6 weeks and at 6-8 weeks after sowing when there is no water. Under water logged condition 3% urea foliar application at 4-6 weeks and 6-8 weeks after sowing.
Full gap. Lack of knowledge on proper use of fertilizer
Training & demonstration
6 .
Pest management (Hairy caterpillar, Semi lupper etc)
Follow indigenous technology.
1. Handpicking and destroying 2. Fixing bird preach for predatory birds.to control semi lupper. 3. Endosulfan 35 EC or Dimethoate @ 2 ml /lit of water 3 times from mid june at 15 days interval or first appearance of pest.
Full gap. Ignorance about the pest and IPM approach.
1.Training and demonstration. 2.Make availability recomnded insecticide in time.
7 Disease(Root rot, stem rot and seedling
Follow indigenous technology
1. If diseases appear in plants apply 1 gm Bevestion /lit of water
Full gap. Lack of knowledge
Training & demonstration

62
blite) or Endofil M45 @ 3 gm/lit of water (Root and stem rot). 2. Jute rice rotation to be followed (Seedling blite).
8 Weed management
Follow mechanical weeding
1.First weeding along with thinning is to be done 3-4 weeks after emergence maintaining 50-60plants/sq m 2. Wheel hoeing between rows within 4-5 weeks after sowing. 3. Basalin @3 lit/ha in 1000 lit of water at 3 days before sowing.
Partial gap 1.Expensive and labour intensive 2. Non availability of implements and chemicals in time.
1. Training & demonstration. 2. Provision of seed drill /wheel hoe at subsidized rate.
9 Time of harvest
Followed 1. At small pod stage. 2.10-120 days when Jute is followed by Sali rice.
No gap -
-
9 Method of Harvesting
Followed. Cutting at ground level with a sharp hook type “Dao”.
No gap -
-
10 Retting i. Bundling
and shading of leaves.
Follow indigenous technique
Harvested plants are to be bundled in 15-20 cm in diameter adding 2-3 dhaincha plants and kept in standing position for 2-3 days to shade leaves.
Partial gap 1. Lack of knowledge
Training & demonstration
ii. Jak Follow indigenous technique
Bundles are to be arranged side by side in water and tied together to form a platform and covered with materials like water hyacinth, Keturi leaves paddy straw thatch.
Partial gap 1. Lack of knowledge
Training & demonstration
iii. Submergence of Jak
Follow indigenous technique
Putting weight of concrete slabes, bricks, stones or dry log on jaks.
Partial gap 1. Lack of knowledge
Training & demonstration
iv. Extraction of fibre
Followed After completion of retting (10-30 days) fibers should be extracted from each jute stock separately by manually. Then it should be washed in clean water thoroughly and dried in mild
No gap -
-

63
sunlight.
11 Up gradation of fibre quality
Not followed Extracted fibres be treated with fungal cultures
Full gap 1. Lack of knowledge
Training & demonstration
12 Av fibre
Yield (q/ha) Low than recommended practices
Capsularised: 22-26(q/ha) Oilotorious: 25-30 (q/ha)
Partial gap Full recommendation not followed due to higher management cost, resulting low yield.
Ascertain procurement of fibre at reasonable price.
13 Grading of Fibre
Not followed 3-4 grades. Full gap Lack of knowledge
Training
Table 37: Crop wise intervention in Agriculture Sector:
Crops Problems Interventions 1. Paddy 1. Use of low yielding local
varieties. 2. Low replacement rate of HYV 3. Inadequate quantity of quality seeds at proper time. 3. Low and irrational use of fertilizers and improper method of application 4. High incidence of pest and diseases (Rice hispa, stem borer, rice Gandhi bug, leaf blight disease etc.)
1. Use of improved and high yielding / hybrid varieties of paddy and conduct OFT on varietal trial.
2. Popularization of INM, IPM, IWM, IRM technology etc. through training and demonstration.
3. Convert most of the rain fed paddy cultivation into wet rice cultivation by providing assured irrigation facility.
.4. Introduction of double and triple cropping system
and improvement of SRI in the rice growing
areas. 5. FLD and training at farmers field by the KVK Officials. 6. To make farmers aware about the organic farming system
2. Wheat 1. Use of low yielding local varieties. 2. Non availability of quality seeds in time. 3. Problem of tillage management of wheat after harvest of Sali rice. 4. Pre-harvest sprouting of wheat seed due to pre-monsoon rains.
1. Training & field demonstration on use of short duration high yielding improved variety and conduct OFT on varietal trial. 2. Popularization of short duration HYV 3. Identification of pre-harvest sprouting resistant entries through OFT. 4. Identification of late sown short duration high yielding wheat varieties by OFT and also provides suitable seed drill.

64
5. Delayed sowing due to late harvest of Sali rice causing low yield.
5. Awareness campaign and exposure visit to the farmers. 6. Use of zero tillage seed drill 7. Seed priming for early quick seedling establishment specially in the rainfed situation
3. Pulses 1. Use of low yielding local varieties. 2. High infestation of pest (pod borer, aphid, jassid, flea beetle, leaf minor etc.) and diseases (YMV, Cerpospores leaf spot, wed blight, powdery mildew etc.) 3. Non adoption of improved production technology 4. Pre harvest sprouting of both summer and kharif pulses.
1. Field demonstration on use of improved high yielding pulse varieties suitable for different seasons 2. Seed treatment is to be popularized to get rid of pests and diseases. 3. Educating the farmers about adoption of improved cultivation practices of different pulses through field demonstration and training. 4. Popularize use of bio-fertilizers through training and demonstration. 5. Educating the farmers about fixation of atmospheric N by the pulses crop and the inter- cropping with other crops which enhance the nutrient content of the soil by OFT and training.
4. Oilseeds (Toria & Mustard)
1. Use of locally available seed. 2. Low replacement of local variety by HYV. 3. Formation of false siliqua 4. Non adoption of improved cultivation practices for maximum production. 5. Marketing problem of harvested seeds due to unorganized marketing infrastructure.
1. Replacement of low yielding traditional variety with improved varieties through OFT and demonstration. 2. Introducing improved package of practices by training and OFT. 3. Proper nutrient managemant 4. Transport facilities to be provided for marketing of oil seeds. 5. Mobilized oil seed grower to follow scientific control of false siliqua and aphids. 6. Introduction of HYV of different oil seed through OFT and training conducted by KVK.
5. Sugarcane
1. Non- availability of sets of recommended variety. 2. Lack of knowledge about improved cultivation practices of sugarcane. 3. Marketing problem.
1. Quality planting materials are to be made available to farmers by KVK, Agricultural Universities and registered nurseries. 2. Credit linkages with financial institutions for large scale cultivation. 3. Introducing improved packages of

65
practices by training and OFT. 4. Transport facilities to be provided for marketing of sugarcane. 5. Installation of sugar mill for production of by products of crop.
6. Jute 1. Use of low yielding local varieties. 2. Non adaptation of recommended package of practices of jute cultivation. 3. High incidence of paste and diseases. 4. Marketing problem of jute fiber.
1. Introduction of HYV of jute through demonstration and training. 2. Field demonstration and training on improved cultivation practices (INM, IPM, IDM etc.). 3. Visit of KVK scientist to farmers field’s 4. Proper marketing facility
3.6 Farm Mechanization:
Agriculture is the backbone of economy in the Darrang district. It provides livelihood
to about 85% of the population. In most of the villages, farm machineries such as power tillers
and tractors are in great demand to the farmers as they are now interested for double/ triple
cropping system. The Govt. of India and the state Govt. are attaching due importance for
promotion of such activities in its pursuit to boost up productivity and agricultural production.
In view of high operation cost, the climatic condition under which the field works are
undertaken, the use of farm machinery is necessary to achieve better level of production.
The status of farm mechanization in the district may be viewed from the population of
tractors, power tillers and sprayers as given below.
Table 38: Existing Machineries:
Type of machineries Nos.
i) Tractors 49
ii) Power Tillers 265
iii) STW 14824
iv) LLP 246
*Source: Deptt. of Agril. Engineering, Darrang

66
3.7 Marketing of Agricultural produce in Darrang District: 3.7.1 Existing markets and infrastructure:
There is only one regulated market in the district which is situated at Kharupetia about
15 km from the district Head Quarter Mangaldai. The market is lying on the NH 52 towards
Tezpur in the eastern side of Mangaldai. Besides this regulated market other prominant non-
regulated market in the district are Dhula, Balugaon, Ghagra, Bhergaon, Bechimari,
Patharighat, Dumunichowki, Bonglagarh, Bhakatpara, Namkhola, Kopati, Dimakuchi,
Kalaigaon Haats are one of the oldest system through which marketing is carried out not only
in the district but also in whole of the state. These are mostly located at places where regular
markets do not exist. Marketing at haat normally conducted on a certain day of a week or
month which is mutually decided by the stockholders viz haat traders, village producers cum
traders, service provider (Tea, Pan, Cigarette, Sweets, juice etc). These are generally managed
by the Lesser (Zilla Parishad or Block) through the local institution like Gaon Panchayats,
Town Committees, Municipal Board and tea estate etc.
The Lesser (Owner of the haat) gives the haat on annual rent basis to the lessee for an
amount, which is sanctioned or to the bidder. Lessee who has taken the haat on lease collects
the rent from the traders who are trading in the haat. Usually, haat traders (wholesalers) are
dealing at large scale and village traders (retailers) at small scale, as normally they do not have
any access to any funds. Most of the haats are having few permanenent retails outlets may be
pucca, semi pucca or kuccha. The details of existing infrastructure regulated or managed by
them presented in the following table
Table 39: Information on existing market infrastructural facilities available in the district:
Capacity Sl. No.
Name of the location
Name of the structure*
Type of services offered
Location of facility
Commodities handled Installed used
Tariff if any
01. Balugaon market
Auction platform
Used by traders free of cost
Surrounding village nearby market
Vegetables 500 mt Fully No
02. H/Q of marketing board, Kharupetia
Godown Store purpose
Surrounding village nearby godown
Rice/Jute 500 mt Fully Rented
03. Patharighat Auction platform
Used by traders free of cost
Surrounding village nearby market
Rice 500 mt Fully No.
04. Dumunichowki
Auction platform
Used by traders free of cost
Surrounding village nearby market
Rice/Arecanut
500mt Fully No

67
05. Namkhola market
Auction platform
Used by traders free of cost
Surrounding village nearby market
Paddy 250 mt Fully No
Table 40: Information on location of existing markets and commodities handled: Block Market
Centre Periodicity (weekly/ daily)
Important Commodities Handled
Commodity wise quantity handled (annual) in tonne
Area covered
No. of Farm families Covered
Jute 5000 Arecanut 3000 Pulses 3000
Kharupetia town eleka
Kharupetia Daily
Oilseeds 2000
8 sq. km 1000
Jute 1500 Arecanut 800 Pulses and oil seeds
1000
Pachim Mangaladai block
Banglagarh Weekly
Paddy 2000
6 sq. km 700
Jute 1000 Paddy 2000 Pulses ad oil seeds
1000
Pub Mangaladai block
Bhakatpara Weekly
Arecanut 600
5 sq. km 600
Jute 500 Arecanut 200 Pulses and oil seeds
300
Sipajhar Dev. Block
Dumunichwoki
Weekly
Paddy 1000
4 sq. km 400
Jute 3000 Arecanut 300 Pulses and oil seeds
700
Paddy 3000 Paddy 200
Dalgaon Sialmari Dev. block
Kopati Weekly
Arecanut 300
5 sq.km 500
Pulses and oilseeds
200
1500
Sipajhar Patharighat Weekly
Paddy Arecanut 300
3 sq. km 250
Paddy 3000 Pulses and oilseeds
1500
Arecanut 500 Jute 4000
Dalgaon-sialmari
Balugaon Weekly
Vegetables 13000
54 sq km 600
Paddy 2000 3 sq.km Pulses and oilseeds
700
Arecanut 300
Mangaldai municipal board
Mangaldai Bi-weekly
Jute 500
250
*Source: SREP, Darrang

68
3.7.2 Major marketing channels prevailing in the district:
A. For Food grains i. Farmers/producer → Consumer ii. Farmer/producer → Retailer/Village traders → Consumer iii. Farmer/producer → Wholesaler → Retailer/village traders → Consumer iv. Farmer/producer → Village traders →Wholesaler → Retailer→ Consumer v. Farmer/producer → Co-operative marketing society → Retailer→ Consumer vi. Farmer/producer → Govt. Agency (FCI etc.) → Fair Price shop→ Consumer vii. Farmer/producer → Wholesaler→ Flour miller → Retailer→ Consumer B. For Oilseeds: i. Farmers/producer → Consumer ii. Farmer/producer → Village traders →Retailer→ Consumer iii. Farmer/producer → Oilseed wholesaler →Processor → Oil wholesaler
→Retailer→ Oil consumer iv. Farmer/producer → Village traders → Processor → Oil consumer C. For Fruits and Vegetables: i. Farmers/producer → Consumer ii. Farmers/producer → Primary wholesaler →Retailers →Consumer iii. Farmers/producer → Processor →Retailers →Consumer v. Farmers/producer → Primary wholesaler → Processor →Retailers → Consumer vi. Farmers/producer →Local Assembler →Primary wholesaler →Retailers →
Consumer D. For live Poultry: i. Producer → Consumer ii. Producer → Retailer → Consumer E. For Fish: i. Producer → Consumer ii. Producer → Retailer → Consumer iii. Producer → Wholesaller → Retailer → Consumer iv. Producer → Fish Co-operative Society → Retailer → Consumer
3.7.3 Organizational Setup of Regulated Market Committee in Darrang district:
Secretary*/Chairman**
↓ Assistant Secretary☻
↓ Marketing Inspector☻
↓ Assistant Marketing Inspector☻
* Drawing and disbursing officer ** Elected member ☻ Duty is to collect chess and license to motivate growers/traders

69
3.7.4 Difficulties faced by the farmers in marketing:
The major problems faced by the farmers in marketing of their produces are as under:
1. Interference of Middleman: The middle man determine the term of trade and prices.
Actually farmers are not permitted to sell their produces as a retailer in markets reason
being that market sheds and apartments are allotted on lease money to a particular
wholesaler for a specific period who further allocates the space to other wholesalers
and retailers against collection fees. Therefore, farmers are bound to sell their produces
to them at low price as they do not have any other option and reason being farmers are
not getting genuine price of their produces.
2. Non-implementation of Auction facility: In the month of June, 1977, the Govt. of
Assam notified to district regulated market committee to implement the auction system
for selling of agricultural produce so that the producer can get the minimum support
price for their produce. But, to get the higher profit, the traders are not supporting the
system and even, the do not compromise with the district regulated market committee.
3. Transportation: Farmers are facing problems in transportation of their produces from
distant / remote area to markets reason being that rural roads are either not in good
condition particularly during rainy season or not exist at all therefore; farmers have no
option except to invest more toward incidental cost of transportation, which ultimate
decrease net return.
4. Inconvenience of Storage: Storage facility neither existed with the most of markets
nor in near by of market where farmers can keep their produces for some days /period
hence they are bound to sell their produces what so ever price is offered to them by
someone generally at a genuine price.
5. Lower category Farmers group: 89% farmers belong to small , marginal or landless
categories hence as an individual farmer is not producing bulk quantity which can be
transported to distant market due to high cost of transportation and other recurring
expenditure to and fro etc. charges therefore , middleman as well as traders are
harvesting their this weakness by offering the low price.
6. Uneven economic condition: Persistence of mistrust amongst the farming community
is a biggest social endurance in a way of joint / collective marketing and thereby they
are selling their produces individually at low or non remunerated prices.
7. Poor financial condition: Due to poor financial capability and non accessibility to
credit institutions, farmers are taking the advance money from traders normally on the
condition that they will sell their produces to them and by this way they lost their
bargaining power.

70
8. Packaging facility: Non availability of good packing material particularly for bulky
material and marketing information.
3.7.5 Existing mechanism for diffusion of marketing information:
In fact marketing information system exists in the district, which is not widely known
to the farmers. The exporters are mostly using telephonic communication for acquiring market
information. Some farmers are also collecting the information from the fellow farmers and by
visiting the local markets. Recently, Community Information Centre has been established in all
blocks by the govt. to provide the market information to the farming community. State
marketing Board has also set up a market information website at different regulated marketing
committees.
Table 41: Information on Agro-processing facilities available in and outside the district
but serving the need of the district: capacity Sl.
No. Name of the block
Location of the processing unit
Name Commodities processed
Method of processing Installed In use
01. Pachim Mangaldai
Gaonburhapara Fresh Squash, Jam, Jelly, pickles
10 MT 5 MT
Godhiapara Sheetal Squash, Jam, Jelly, pickles
10 MT 4 MT 02. Pub-Mangaldai
Bezpar Jilimili Squash, Jam, Jelly, pickles
10 MT 2 MT
Sipjhar Madharima food products
Squash, Jam, Jelly, pickles
10 MT 5 MT
Dakhin Subari Ghorabandha
SHG Squash, Jam, Jelly, pickles
10 MT 1-2 MT
03. Sipajhar
Burah Jnyan-Bigyan NGO
Squash, Jam, Jelly, pickles
10 MT 2MT
04. Dalgaon-Sialmari
Dalgaon Nilons India
Squash pickles
C
hem
ical
pro
cess
250 MT 15 MT
Table 42: Marketing Strategies and Marketing Activities:
Marketing Strategies Marketing Activities 1. Elimination of distress price of marketed products
1. Mobilization of farmer for market oriented production 2. Collection of market information 3. Preparation of production planning 4. Encourage small and marginal farmers to grow quality product through contact farming with the private sectors
1.Increase bargaining power of the producers
1. Villages/commodity wise formation farmers group and established commodity

71
collection centres 2. Motivated farmers for action sell 3. Organised Kissan Mela
3. Creation of market infrastructure facilities
1. Linkage with Gramin Bhandar Yojana 2. Providing facility for transportation of commodities to and from the producing site to the main market 3. Modernization of market with facilities like banking, IT network, terminal etc.
4. Value addition in marketed commodities
1. Imparting knowledge on cleaning, pre- cooling, grading and packaging of marketed commodities to get better price of their commodities.
3.8 Constraints for production of major field crops in Darrang District:
Paddy:
1. Low production and productivity:
Cultivation of local/ traditional varieties in case of Ahu and Sali paddy.
Imbalance use of fertilizes with inappropriate methods.
Low replacement rate of high yielding varieties seeds.
Non availability of flood water submerged tolerant varieties.
High infestation of rice hispa, stem borer, leaf blight.
Excess and uneconomic use of irrigation water during summer.
2. Non availability of adequate and qualitative inputs in time.
3. No or very low use of organic manure.
4. Small and scattered land holdings.
5. Iron toxicity in some pockets.
6. Inadequate credit facility and negligible accessibility of farmers to the financial
institutions.
7. No direct accessibility of farmers to markets and are bound to sale their produce to the
retailers at low price.
8. Inadequate availability of market information.
Wheat:
1. No HYV seeds in the district except Sonalika which is susceptible to insect-pests and
diseases
2. Late sowing of seeds due to preparation of land after harvesting of Sali paddy
3. Occurrence of pre-monsoon rain during harvesting of the crop

72
Pulses:
1. Uncertain weather condition viz. high rainfall during Kharif hampers timely land
preparation and sowing of Kharif pulses and the rabi pulses suffers from moisture
deficit stress particularly during reproductive phase. Summer pulses (green gram and
black gram) receive rainfall during maturity state causes pre-harvest sprouting and lack
of adequate moisture leads to delayed sowing of summer pulses.
2. Non availability of quality seed at time viz. non availability of delayed sown black
gram varieties and uniform maturing green gram varieties.
3. Non adoption of improved production technology
4. Soil acidity.
5. Cultivated as rain fed crop in marginal and submerginal lands with less effort and
inputs.
6. Infestation of insect pests and diseases. Pod borers, aphids etc are the major pest of all
the pulses. Wilt in lentil, rust in pea, YMV, CLS and WB in black gram and green gram
are serious diseases.
7. Lack of irrigation facility.
8. Stray animals.
9. Problem in seed storage due to infestation of stored grain pest.
10. Non availability of processing unit.
11. Unorganized marketing infrastructure.
Oil seeds:
1. Uncertain weather condition viz. excess rainfall in Kharif causes water stagnation in
crop fields and delays the sowing of kharif oilseeds like sesamam and groundnut and
intermittent moisture stress in rabi due to absence of rainfall at the critical stages of
crop growth.
2. Non availability of quality seeds at proper time and in required amount. Farmers are
compelled to grow locally available seeds of low yielding varieties which eventually
reduce productivity and total production.
3. Non or low replacement of old seeds at periodical interval.
4. Poor nutrient and crop management practices.
5. Infestation of insect pest and diseases. Major pest like aphid, saw fly, jassids, thrips,
leaf minor etc attack oilseeds drastically reduce their yields. Several fungal and viral
diseases like blight, leaf spot, wilt, steam rot, root rot, yellow mosaic etc ruin these
crops when conditions are favourable for them.

73
6. Cultivation of oil seeds mostly in less fertile and marginal land which account for the
increased in area and total production but not productivity.
7. Cultivation of oil seed without irrigation.
8. Unorganized marketing infrastructure.
Jute:
1. Jute is generally grown under rain fed condition; delay of pre-monsoon rain often
results in reduction jute area.
2. Non availability of quality seeds at
proper time and this causes delay in
sowing resulting in low yield.
3. Weed infestation in initial growth
period of jute and there by high cost of
weeding.
4. High infestation of insect pest viz.
hairy caterpillars and semilooper and
diseases like root rot, steam rot.
5. Non availability of sufficicient and
good water for retting results in poor
quality of fibre.
6. High labour intensive crop and hence high production cost.
9. Uncertain market price and lack of proper marketing facility for surplus produces.
Table 43: Critical issue and proposed Extension Strategies in Agricultural Sector in
Darrang District:
Critical gap Extension Strategies Proposed activities Identification and analysis of success stories where farmers have successfully grown the summer paddy. Exposure visit to farmers’ field by other interested farmers. Organized training programme for improve cultivation of rice.
Assured rice production in flood affected area instead of winter paddy.
Expansion of summer area under flood affected area.
Training on dry technologies of summer rice for better quality.

74
Conducting field demonstration on Organic farming of Rice. Training on production technology on Organic farming of rice. Exposure visit to farmers’ field by other interested farmers.
Market oriented rice production
Organic farming of Rice.
Training on production of organic inputs. Organization of seed village. Training on seed production technology. Linkage with research center for foundation seed.
Low production of Rice. Replacement of low productivity variety area by Hybrid/HYV.
Organization of seed village. Conducting field demonstration on Pulse and oilseed. Training on seed production technology.
Low production of pulse and oilseed.
Expansion of Pulse and oilseed area under char &char like area.
Facilitate for supply of inputs. Motivation of farmers for high value crops.
Fluctuation price of law jute. Diversification of jute area.
Farmers incentives for adopting crop diversification. Farmers awareness. Training on Jatropha cultivation.
Huge waste land areas. Introduction of Jatropha in waste land.
Demonstration of Jatropha. Low productivity and income existing enterprise/farming system.
1. Creation of assured irrigation facility.
1. Mobolisation of farmers group. 2. Demonstration of modern irrigation system. 3. Linkage with other ongoing programme.
2. Establishment of seed village.
1. Awareness of farmers. 2. Training on seed production technology. 3. Linkage with Research Station &Certified agency. 4. Incentive to the farmers.
3. Use of bio-fertilizer and bio-pesticide.
1. Awareness camp. 2. Mobilization of farmers. 3. Training on bio-fertilizer and bio-pesticides use.
4. Soil amelioration. 1. Collection of soil sample & analysis. 2. Preparation of crop plan.
5. Use of modern farm implements.
1. Training on farm machinery. 2. Linkage with ongoing schemes.
6. Water harvesting for rain fed agriculture.
1. Awareness to farmers. 2. Training on judicious use of water.
7. Use of balance dose of chemical fertilizer.
1. Awareness to farmers. 2. Training on judicious use of

75
fertilizers. 8. Strengthening post
harvest along with value addition of rice.
1. Training on PHT. 2. Training on modern milling technique.
Table 44: Proposed Research Strategies in Agricultural sector in Darrang District:
Research Strategies Research Activities 1.Identication of nutrients stress in crop production
1. Analysis of AES wise micronutrient status soil. 2. Preparation AES wise soil status map and preparation package of practice thereof. 3. Leaf analysis. 4. Organizing issue base workshop for different AES involving scientist, Extension worker and innovative farmers.
2. Cost effective production of different commodities.
1. Research on low cost technology for production of different commodities especially for resource poor farmrs. 2. Adoptive trials in farmers field. 3. Preparation of Documentation of success stories.
3. Improvement of technology for high quality value added product.
1. Research on Hi-tech for production of different commodities for resource rich farmers. 2. Adoptive trials in farmers field. 3. Replication of success stories.
4. Development of short duration varieties for Arhar.
1. Frontline demonstration Arhar. 2. Farmers-Scientist interaction.
5. Research on knowledge and input delivery system to increase the risk taking capacity of farmers to derive economic benefit from new technology.
1. Information collection and analysis. 2. Farmers-Scientist interaction. 3. Issue base workshop involving expert panel, innovative farmer, NGO & private sector.
6. Refinement of existing traditional farmers technologies.
1. Scientist study & validation of traditional technology in research activities. 2. Issue base workshop involving expert panel,innovative farmer, NGO & private sector. 3. Documentation of traditional technology evolving by innovative farmers. 4. On firm on refine technology.
7. Participatory variety selection of important crops.
1. Identification and analysis of problems and farmers need. 2. Search for suitable seed material. 3. On-firm testing of seed material in farmers field. 4. Selection of preferred variety by the farmers. 5. Wider dissemination of farmers preferred cultivars.
8. Gene sequencing of excellent breeds.
1. Establishment of gene bank for the District so as to collect special breeds.

76
2. Gene study on wild and traditional breeds to evolve new high productive, high quality breed. 3. Replication of success stories.
9. Conducting research on identification issue.
1. Priorities of Researchable on the basis of Socio-Eco factors. 2. Organizing issue based workshop for finalizing research findings. 3. On firm trials of successful adaptive trial in farmers field. 4. Researching prudent technology for concern AES.
Table 45: Proposed Strategies for Promoting Integrated Pest Management in Paddy:
Sl. No.
Particulars Existing Practice
Recommended Practice
Gap in Adoptive(F/P/N)
Reasons for Gap in Adoption (*)
Proposed Strategies (**)
1. Cultural practice (Y/-) - Summer ploughing - Timely sowing
Nil Yes
Ploughing after harvest. Yes
F N
Lack of knowledge
Awareness.
2. Resistant variety (specify)
- - N - -
3. Bio-pesticide (No. of application ) - Neem product. - NPV
- -
Yes Yes
F F
Lack of knowledge
Training. Training.
4. Bio agent (Y/-) - Egg parasite
-
Yes
F
Not available
Training/ Demonstration.
5. Other practices (Y/-) - Pheromone trap - Light trap
- -
Yes Yes
F
Lack of knowledge.
Training/ Demonstration.
6. Pesticide (No. of application) - Spraying - Dusting - Seed treatment. -Soil application.
- - - -
Yes Yes. Yes. Yes
F F F
Lack of knowledge.
Training/ Demonstration.Training/ Demonstration.Training/ Demonstration.
*Source: SREP, 2005.

77
Table 46: Proposed Strategies for Promoting Integrated Pest Management in Vegetables:
Sl. No.
Particulars Existing Practice
Recommended Practice
Gap in Adoptive(F/P/N)
Reasons for Gap in Adoption (*)
Proposed Strategies (**)
1. Cultural practice (Y/-) - Summer ploughing - Timely sowing
Nil Yes
Ploughing after harvest. Yes
F N
Lack of knowledge
Awareness.
2. Resistant variety (specify)
- - N - -
3. Bio-pesticide (No. of application ) - Neem product. - NPV
- -
Yes Yes
F F
Lack of knowledge
Training. Training.
4. Bio agent (Y/-) - Egg parasite
-
Yes
F
Not available
Training/ Demonstration.
5. Other practices (Y/-) - Pheromone trap - Light trap
- -
Yes Yes
F
Lack of knowledge.
Training/ Demonstration.
6. Pesticide (No. of application) - Spraying - Dusting - Seed treatment. -Soil application.
- - - -
Yes Yes. Yes. Yes
F F F
Lack of knowledge.
Training/ Demonstration.Training/ Demonstration.Training/ Demonstration.

78
Table 47: SWOT analysis of Crop Production Sector in the district:
AES STRENGTH
I II III IV
* Suitable land situation for agricultural crops Y Y Y Y
* Favourable climate for agricultural crops/Livestock and
Fodder cultivation
Y Y Y Y
* Potentiality for assured irrigation facility Y Y Y Y
* Adequate waste land for Jatropha production and grass
cultivation
Y Y Y Y
* Adequate rainfall for cultivation under rainfed condition Y Y Y Y
* Available Human Resource Y Y Y Y
* Available organized women group Y Y Y Y
* Rich in Bio diversity Y Y Y Y
* Good road communication to major market Y Y Y Y
* Scope for establishment of agro-processing industry Y Y Y Y
* Financial Institution available Y Y Y Y
* Available weekly, bi-weekly and daily market Y Y Y Y
* Availability of Community Information Centre for market
information
Y Y Y Y
* Sufficient Technical Service Provider for technology
development and dissemination
Y Y Y Y
* Traditionally skilled breeders Y Y Y Y
* Vast char areas for rearing of Buffaloes and pulses and oilseed
production
Y Y
* Old and ancient tanks for community fishery adopting modern
fish culture technology
Y Y Y Y
* Low laying soil favourable for community fisheries Y Y
* Adoption of modern fish technology on private fish pond Y Y Y Y
WEAKNESS
• Erratic rainfall Y Y Y Y
• Occurance of flood during kharif season Y Y Y Y
• Soil erosion due to natural degradation Y Y Y Y
• Occurrence of pests and diseases Y Y Y Y

79
• Water logging Y Y Y Y
• Siltation problem Y Y Y Y
• Majority of the population are landless, small and marginal Y Y Y Y
• Fragmented land Y Y Y Y
• Unorganised farmers community Y Y Y Y
• Lack of modern community facility Y Y Y Y
• Lack of storage facility Y Y Y Y
• Lack of storage facility Y Y Y Y
• Lack of knowledge on agro processing industry Y Y Y Y
• Lack of knowledge on water management Y Y Y Y
• Non adoption of production and post harvest technology Y Y Y Y
• Market oriented production not prevailing Y Y Y Y
• Generated technologies are not to specific field situation Y Y Y Y
• Irregular supply of Liquid nitrogen and frozen semen Y Y Y Y
• CD Ratio is very poor for agriculture and allied sector Y Y Y Y
• Superstition to do A1 in some parts of the district Y Y Y Y
• Poor scientific knowledge on dairy management Y Y Y Y
• Non-availability of low cost feed Y Y Y Y
• Non-availability of improved variety fodders Y Y Y Y
• Non-availability of required input dealers Y Y Y Y
• High cost medicine and vaccines Y Y Y Y
• Quality fish seed production for cultivable species Y Y Y Y
OPPORTUNITY
• Vast potentiality for agricultural and horticultural crops Y Y Y Y
• Scope for production of non-conventional and high value
crops
Y Y Y Y
• Optimum use of natural resources Y Y Y Y
• Proper utilization of Human resources Y Y Y Y
• Encourages Self Help Group/Women Group for micro
enterprenership
Y Y Y Y
• Utilization of ground water through STW Y Y Y Y
• Cultivation of off season vegetables Y Y Y Y

80
• Formation of farmers interest group/ grower society/FMC/
Commodity Interest Group and linkage with CIC for
domestic and international market
Y Y Y Y
• Improvement of market infrastructure Y Y Y Y
• Scope of establishment of cold storage/processing industry Y Y Y Y
• Potentiality for establishment of seed village Y Y Y Y
• Scope for organic cultivation Y Y Y Y
• Scope for value addition in agricultural product Y Y Y Y
• Involvement of Women faemers for bio-mass recycling for
soil health management
Y Y Y Y
• Women empowerment for agriculture management Y Y Y Y
• Scope for upgradation of local breeds by cross breeding Y Y Y Y
• Scope for establishment of agro-clinic centre Y Y Y Y
AGRICULTURE
COMMODITY AES
Winter rice STRENGTH I II III IV
* Land is fertile and suitable Y Y Y Y
* Use of HYV and improved variety seeds Y Y Y Y
* Natural water available from seasonal rain Y Y Y Y
* Least infestation of pests and diseases Y Y Y Y
* Use as the staple food of the people Y Y Y Y
* Easy marketability Y Y Y Y
* Availability of labour Y Y Y Y
* Farming system dominated by winter paddy Y Y
WEAKNESS
* Non-adoption of improved technology Y Y Y Y
* Lack of mechanization Y Y Y Y
* Improper and poor management Y Y Y Y
* Non-availability of foundation/certified
seeds in time
Y Y Y Y
* Production is far less than potentiality Y Y Y Y
* Improper and adequate use of chemical Y Y Y Y

81
fertilizer
* Poor health bullocks Y Y Y Y
* Fragmented land Y Y Y Y
OPPORTUNITY
• High yield potential Y Y Y Y
• Use IPM practices Y Y Y Y
• Mechanized cultivation Y Y Y -
• Proper water management and weed
management
Y Y Y -
• Timely and balance application of fertilizer Y Y Y Y
THREAT
* Occurrence of flood Y Y
* Elephant damage Y Y Y Y
Summer Rice STRENGTH
* Suitable and fertile land Y Y Y
* Irrigation facility available Y Y Y
* Improved seeds available Y Y Y
* Seasonal climate favourable Y Y Y
* High yield Y Y Y
* Availability of agricultural labour Y Y Y
* ITKs used Y Y
WEAKNESS
* Cost Of production is high due to fuel cost for the pump set
Y
* Poor management Y Y
* Pest and disease problem Y Y Y
* Improper use of fertilizers Y Y
* Lack of water management Y
OPPORTUNITY
* High yield potentiality Y Y
* Use of quality HYV seeds Y Y Y
* Proper management practices Y Y Y
* Subsidized fuel for pumpsets Y Y Y
* Adoption of IPM practices Y Y Y

82
* Scope for extension areas with irrigated facility (STW)
Y
THREAT
* Problem of stray cattle Y Y Y
Autumn Rice STRENGTH
* Suitable and fertile land Y Y Y
* Available of Agricultural labour Y Y Y
* Easy marketability Y Y
* Use improved varieties Y Y Y
WEAKNESS
* Very low use of compost Y
* Improper management practices Y Y Y
* Lack of mechanization Y Y
* Fragmented land Y Y Y
* Least quantity (improper dose) of fertilizer use
Y Y Y
* Pest problem Y Y Y
* Low yield Y
OPPORTUNITY
* Scope for mechanized cultivation Y Y Y Y
* Use of HYV Y Y Y Y
* Proper management practices Y Y Y Y
* Scope for use of compost Y Y Y Y
THREAT
* Natural calamities like flood/draught/ cyclone
Y Y Y Y
* Problem of stray cattle Y Y Y Y
Wheat STRENGTH
* Suitable and fertile land Y Y Y Y
* Available of Agricultural labour Y Y Y Y
* Easy marketability Y Y Y Y
WEAKNESS
* Very low use of compost Y Y Y Y
* Non availability if improved HYV except Sonalika which is also susceptible to insect-pests and diseases
Y Y Y Y

83
* Late harvest of Sali rice results late sowing of the crop
Y Y Y Y
OPPORTUNITY
* Food habit of human being has been shifted from rice to roti
Y Y Y Y
THREAT
* Pre-monsoon rain occurs during harvesting Y Y Y Y
Mustard STRENGTH
* Suitable deep fertile soil Y Y Y Y
* Mustard oil covers the oil component of daily diet
Y Y Y Y
* Availability of local process unit for oil Y Y Y Y
* Use of mustard oil cake as • Anti repellant against pest • To improve soil status • Fuel by mixing with cowdung
Y Y Y Y
* Locally available seeds Y Y Y Y
* seeds are nonperishable and easy for storage Y Y Y Y
* Extensive cultivation of mustard Y Y Y Y
* easy marketability Y Y Y Y
* Oil is used as health message for babies and for others
Y Y Y Y
WEAKNESS
* Improved quality seeds not used Y Y Y Y
* Essential micro nutrients like boron not used
Y Y Y Y
* Least fertilizer – imbalance dose application Y Y Y Y
* Pest attack Y Y Y Y
* Unavailability of irrigation Y Y Y Y
* Defect soaring causes heavy pest attack Y Y Y Y
* Improper management practices Y Y Y Y
OPPORTUNITY
* Predictable overgrowing demand Y Y Y Y
* Scope for establishment of medium scale processing unit
Y Y Y Y
* Scope for higher production potentiality Y Y Y Y
* Scope for using improved seeds and production technology
Y Y Y Y
THREAT

84
* Heavy pest attack for late sown crop Y Y Y Y
Sugarcane STRENGTH
* Suitable land available Y Y Y Y
* High demand for molasses Y Y Y Y
* Better monetary return Y Y Y Y
* Sugarcane juice is a common drink in summer season
Y Y Y Y
* Sugarcane juice use as health drink against jaundice disease
Y Y Y Y
* Juice extraction is easy Y Y Y Y
* Dabi (remains of sugarcane after juice extraction) used as poor mans fuel
Y Y Y Y
* Molasses locally produced as at production site
Y Y Y Y
* Easy marketability Y Y Y Y
* More return from ratoon crop Y Y Y Y
WEAKNESS
* Use of poor quality setts Y Y Y Y
* Improper management practices Y Y Y Y
* Pest problem reduces yield Y Y Y Y
* Low yield Y Y Y Y
* Lack of irrigation Y Y Y Y
* Lack of setts and soil treatment Y Y Y Y
OPPORTUNITY
* Scope for easy availability of improved variety
Y Y Y Y
* Scope for research on variety Y Y Y Y
* Scope for soil and setts treatment Y Y Y Y
* Scope for higher yield Y Y Y Y
* Scope to meet demand from out side the district
Y Y Y Y
* Scope for proper management Y Y Y Y
THREAT
Elephant damage Y Y Y Y
Potato STREANGTH
* Very suitable land Y Y Y Y
* Daily consumable tuber Y Y Y Y

85
* Ever going consistent demand Y Y Y Y
* Good production /yield Y Y Y Y
* Irrigation available Y Y Y Y
* Use of improved seeds Y Y Y Y
* Fertilizers applied Y Y Y Y
* Tuber Treatment done Y Y Y Y
WEAKNESS
* Soil treatment not done Y Y Y Y
* Improper management practices Y Y Y Y
* Prophylactic measures against disease not taken
Y Y Y Y
* Timely irrigation not done Y Y Y Y
* Fuel cost for pump high Y Y Y Y
* Lack of cold storage facility Y Y Y Y
* Farmers not getting remunerative price Y Y Y Y
* Non availability of TPS Y Y Y Y
* High cost of cultivation Y Y Y Y
* Harvesting not done at proper time Y Y Y Y
OPPORTUNITY
* Scope for extension of area Y Y Y Y
* Scope for easy availability of finance Y Y Y Y
*Scope for installation of cold storage facilities
Y Y Y Y
* Scope for TPS cultivation Y Y Y Y
* Scope for proper management practices Y Y Y Y
*Scope for creating awareness through training and exposure visit
Y Y Y Y
* Scope for subsidized fuel Y Y Y Y
THREAT
* Late blight disease due to seasonal high humid condition
Y Y Y Y
Rabi Vegetables
STRENGTH
* Area and production in increasing trend Y Y Y Y
* Very high market demand Y Y Y Y
* Early variety and hybrid seeds preferred Y Y Y Y
* Suitable land available Y Y Y Y

86
* Proper management practices followed Y Y Y Y
* Fertilizers used Y Y Y Y
* Commercial cultivation done Y Y Y Y
* Easy marketability Y Y Y Y
* Profitable return Y Y Y Y
* ITKs used Y Y Y Y
* Wastage on harvest used as cattle feed and making compost
Y Y Y Y
* Irrigation facility available Y Y Y Y
WEAKNESS
* In judicious use of chemical pesticides Y Y Y Y
* Medium and late variety crop fetches poor price
Y Y Y Y
* Growers not getting remunerative prices Y Y Y Y
* IPM not followed Y Y Y Y
* Produce is easily perishable Y Y Y Y
* High pests and disease problem Y Y Y Y
* Involvement of middleman in the marketing system
Y Y Y Y
OPPORTUNITY
* Scope for growing early variety Y Y Y Y
* Scope for adoption of IPM technology profitably
Y Y Y Y
* Scope of training and exposure visit to create awareness
Y Y Y Y
* Scope for vermicompost unit at cultivation site
Y Y Y Y
* Scope for self employment through SHG by involving the P.H. handling and marketing of produce
Y Y Y Y
* Scope for using balanced dose of fertilizers Y Y Y Y
* Scope for growing squash Y Y Y Y
* Scope for Green House cultivation Y Y Y Y
THREATS
* Human and livestock health hazards as a result of indiscriminate use of chemical pesticides
Y Y Y Y
Kharif Vegetables
STREANGTH
* Seasonal rain water available Y Y Y Y

87
* Commercial cultivation is done Y Y Y Y
* Hybrid seeds preferred Y Y Y Y
* Suitable land available Y Y Y Y
* Growing market demand Y Y Y Y
* ITKs used Y Y Y Y
* Local varieties also grown (Thupi Jika) Y Y Y Y
WEAKNESS
* In judicious use of chemical pesticides Y Y Y Y
* Proper management practices nor followed Y Y Y Y
* Growers not getting remunerative prices Y Y Y Y
* IPM not followed Y Y Y Y
* Early season cultivation not always done Y Y Y Y
* High pests and disease problem Y Y Y Y
* Consistent heavy rainfall Y Y Y Y
OPPORTUNITY
* Scope for proper management practices Y Y Y Y
* Scope for regeneration on improvement of local variety of Thupi Jika, Bhol and other crops
Y Y Y Y
* Scope for Training and exposure visit Y Y Y Y
* Scope for IPM practice Y Y Y Y
* Scope for self employment through involvement of SHG in P.H. handling
Y Y Y Y
* Scope for self employment through involvement of SHG in P.H. handling and marketing produce
Y Y Y Y
Fruit Crop – Citrus Fruit
STREANGTH
* Suitable climate and suitable land Y Y Y Y
* Very good market demand Y Y Y Y
* Improved local variety available Y Y Y Y
* Produce used in homestead processing Y Y Y Y
* Easy marketability Y Y Y Y
* Planting material locally available Y Y Y Y
* Demand throughout the year Y Y Y Y
* Medicinally valued crop Y Y Y Y
WEAKNESS

88
* Lack of proper management Y Y Y Y
* Lack of irrigation Y Y Y Y
* Pest and disease problem Y Y Y Y
* Lack of fertilization Y Y Y Y
OPPORTUNITY
* Scope for extension area expansion Y Y Y Y
* Scope for growing Assam Lemon as fencing crop
Y Y Y Y
* Scope for extra earning through sale of quality planting materials
Y Y Y Y
* Scope for varieties reach throughout the year production
Y Y Y Y
* Scope for establishment of agro-processing unit
Y Y Y Y
* Turmeric, ginger can be grown as mix crop Y Y Y Y
THREAT
* Susceptibility to citrus canker and diabetic daises
Y Y Y Y
Pineapple STREANGTH
* Suitable land and climate Y Y Y Y
* Very good market demand Y Y Y Y
* Growers get remunerative price Y Y Y Y
* Easy marketability Y Y Y Y
* Less pest and disease problem Y Y Y Y
* Produce used in homestead fruit processing Y Y Y Y
* Improve variety grown Y Y Y Y
* Grown also as mixed crop with arecanut Y Y Y Y
* Easy availability of planting materials Y Y Y Y
* No fear of cattle damage Y Y Y Y
* Less management cost of labour Y Y Y Y
WEAKNESS
* Lack of proper management Y Y Y Y
* Fertilizers not used Y Y Y Y
* Yield/productivity not good Y Y Y Y
* No irrigation facility Y Y Y Y
OPPORTUNITY
* Scope for extension of areas with great Y Y Y Y

89
potentiality * Scope for growing as mix crop Y Y Y Y
* Scope for research in improving qualitative/quantitative production
Y Y Y Y
* Scope for adoption of improved technology Y Y Y Y
THREAT
* Squirrel damage Y Y Y Y
Table 48: Projected requirement of foods (cereal, pulses & oil seeds) in Darrang District (Based on projected population):
Projected population (in Lakhs)
Cereal (‘ooo ton) Pulses(‘ooo ton) Oilseeds(‘ooo kilo ltr) Year
Adult (> 6 yrs)
Minor (<6 yrs)
Adult @520g /day
Minor @343g /day
Total Adult @30g /day
Minor @40g /day
Total Adult Adult @45ml /day
Minor @33ml /day
Total
2001* 1153262 80772 600 27.7 627.7 34.6 3.2 37.8 51.9 2.7 54.6 2010 1406979 98541 732 33.8 765.8 42.2 3.9 46.1 63.3 3.3 66.6 2015 1575861 110365 818 37.9 855.9 47.3 4.4 51.7 70.9 3.6 74.5 2020 1764964 123698 917 42.4 959.4 52.9 4.9 57.8 79.4 4.1 83.5 2025 1976759 163947 1028 56.2 1084.2 59.3 6.6 65.9 89.0 5.4 94.4 *Source: Deptt. of Economics and Statistics, Darrang
Statistics of divided Darrang district
With the rise of population, the requirement of food grains is increasing day by day. To
meet the requirement, the production and productivity of cereals, pulses & oilseeds must be
increased. It is possible only through increasing cropping intensity, crop diversification, area
expansion under these crops by utilizing fallow lands, waste land, char land, reverine areas,
mono cropped areas, adopting improved package of practices, development of farm
mechanization & assured irrigation system, strengthening linkage between research, extension
and farmers etc.

90
3.9. Major factors involving for increasing productivity of field crops:
1. Quality seeds: The productivity of a crop depends on the quality of seeds. To maintain
productivity, same seed should not be grown for more than 3 years because its quality
is gradually deteriorated. Thus the previous seeds are to be substituted by new certified
quality seeds. Specially, the certified paddy seed is not available in commercial
establishments though the quality vegetable seeds can be obtained from Govt. agencies
and registered seed dealers. At present paddy seed requirement for the district is 3,856
MT, 25% of which shall have to be substituted by certified good quality seeds every
year to maintained desired change of seeds to maintain sustainable production.
2. Application of fertilizers: To increased productivity, fertilizer consumption shall have
to be rationalized. The fertilizer consumption levels in the district are found uneven.
The average fertilizer consumption rate is accounted as 56 kg/ha (State av. 40.70
kg/ha). With increase in irrigation area and substitution of local variety by HYV
especially in paddy and vegetables, consumption of fertilizer is likely to increase but
care shall have to taken to avoid indiscriminate use of fertilizers and therefore practices
like Integrated Nutrient Management (INM) shall have to be popularized.
3. Increased in irrigation efficiency: Productivity is primarily determined by the extent
to which the water supply can be made as per requirement which varies through the
seasons. This food requires highest water utilization efficiency to be obtained from the
available water supply. Providing required irrigation water in a controlled manner
especially in critical stages will increase irrigation efficiency and productivity.
4. Proper plant protection measures: Due to high price of pesticides and reluctance of
farmers to use them for fear of poisoning of crops, presently less than 50% of the gross
cropped area, proper plant protection measures are seen to have been adopted which
results in considerable reduction in productivity. Moreover, the farmers are not aware
about the use the chemical plant protection chemicals. Even they have less knowledge
about the concentration of chemicals to be used, hardly differentiate the insecticides
and pesticides. It is proposed that this problem shall be solved through proper training,
involving Field Management Committees (FMC) and by popularization of low-cost but
sophisticated Integrated Pest Management (IPM) techniques.
5. Improvement of soil health: Due to use of only straight fertilizers, especially Urea,
Single Super Phosphate (SSP), Murate of Potash (MOP) and Di-ammonium Phosphate
(DAP) and insufficient use of compost and other organic manures, the soil environment
is getting degraded in almost all the cropped areas of the district. Thus, the physico-

91
chemical properties, required for optimal adjustment of soil fertility and plant nutrient
supply to sustain the desired crop productivity, have become imbalanced and as a result
the productivity levels have stagnated and in some cases even decreased. So adoption
of scientific approach of Integrated Nutrient Management (INM) is thus felt essential to
increase productivity levels.
Table 49: Inter linkages of KVK with different Organizations: Sl.No Name of organization Nature of linkage needed for1. Assam Agricultural University * Sources of technology
* Technology transfer 2. State Department of Agriculture, Darrang * Collaborative training
programmes * On Farm Trial (OFT) * Demonstration * Resource person * Beneficiary selection * District agricultural data * Implementation of central/ state schemes * Exhibition
3. Various Line Departments like Veterinary and Animal Husbandry, Fishery, Sericulture, Forestry, Irrigation, Agril. Engineering, Handloom and Textiles, District Rural Development Agency (DRDA), District industries and Commerce (DIC), Neharu Yuva Kendra (NYK) etc.
* Collaborative training programmes * On Farm Trial (OFT) * Demonstration * Resource person * Beneficiary selection * District agricultural data * Implementation of central/ state schemes * Exhibition
4. Panchayat and Rural Development (Block, Panchayat, Zilla Parishad)
* Training programme * Demonstration * Beneficiary selection * Primary/ secondary data * Implementation of central/ state schemes
5. Financial Institute (Public/ Private)
* Loan to the farmers * Collaborative training for farmers, farm women, SHGs, Rural youth etc.
6. NGOs, SHGs, Cooperative Societies, Professional Association etc
* Collaborative training for farmers, farm Women, SHGs, Rural youth etc. * Technical support and guidance to SHG

92
7. Govt.Sponsored Scheme * Implementation 8. Doordarshan Kendra, All India Radio (AIR), Press,
Magazine * Wide publicity of recent technology * News coverage * Field Progarmme coverage * Documentation
9. Input dealers/ Manufactures IFFCO
*Supply of quality seeds, fertilizers, chemicals, farm machinery etc * Collaborative training
10. State Institute of Rural Development (SIRD), National Institute of Rural development (NIRD), Indian Institute of Entrepreneurship (IIE), Extension Education Institute (EEI) etc.
* Human Resource Development * Entrepreneurship development * Training for farmers, farm women, SHGs, Rural youth etc.
11. Assam State Agricultural Marketing Board (ASAMB), NEDFI, NERAMAC, APEDA, TRIFED, ASCA, NSC, Spices Board etc
* Market information * Marketing of produce * Value addition * Export promotion and funding
12. Entrepreneurs/traders * Supply Services * Marketing of farmers produce
3.10 Extension Strategy Needed
1. Emphasis on entrepreneurship development in production of quality seed and planting materials.
2. Development of expertise on processing and value addition in KVK.
3. Emphasis on establishment of model integrated farming system demonstration unit and
small agro processing unit in the KVK.
4. Need to organize regular training for capacity building of KVK scientist in their respective discipline.
5. Involving Panchayati Raj Institutions in the KVK programme
6. Imparting training to rural youth on agribusiness management by the KVK
7. Developing and strengthening linkages with the Agricultural Universities, ICAR
Institutions and other Institutions, which are directly, or indirectly generating technology.

93
8. Setting up a small processing unit in the KVK to demonstrate on how to minimize post
harvest losses, value addition resulting in increased employment and livelihood security in the rural areas.
9. Promoting farmer to farmer learning by establishing farm school, which can speed up
the process of technology transfer in agriculture, animal husbandry, fisheries and agro-forestry
10. Extending necessary support and organize training to facilitate capacity building of
various extension functionaries under Govt. and non-govt sectors, including farmers organizations, cooperatives, agri-preneurs, NGOs, private sectors etc.
11. Prioritizing training of women in entrepreneurship development programme with
appropriate govt support and guidance.
12. Assist in establishing of agro based micro and small-scale women run enterprise to
make rural women financially and socially strong. 13. Involving all the line departments, Depart of Agriculture, NGOs, and private sectors
etc. for large scale adoption and dissemination.
14. Establishment of Community Radio Station by KVK
15. Development of farming situation and system based package of practices
16. Encouraging high density planting of Banana and Pineapple.
17. Empowerment of farmers with new knowledge of improved technology
18. Imparting location specific and need based knowledge and skill on product rather than organizing routine training on package of practices of a particular crop.
19. Strengthening linkages between research- extensions –farmers.
20. Organizing District level Conference on Self Help Group(SHG) to encourage their
activity Table 50: Vision for Darrang District: SL. No.
Sector Base line 2005-06
Intervention Projection in the year
2020 01. Agriculture:
Paddy- a. productivity
1390kg/ha
Introduction of hybrid
seeds Intensification of HYV Increase of seed
replacement gradually
2500 kg/ha

94
b. production of
CODEX standard rice
__
upto 50% To bring 50% area under
assured irrigation system Optimum use of water
resources Balance use of fertilizers Integrated pest
management
Use of organic fertilizers/ bio pesticides
Soil and water management for organic cultivation
Value addition in rice products
200 MT
02. Pulses and oilseeds a. Area extension b. Productivity
37000ha 592 kg/ha
Mind set of the farmers to
be changed to adopt the pulses and oilseeds as primary crops instead of secondary crop
Fertile lands are to be used by the farmers instead of poor lands
Introduction of short duration varieties to fit in the multiple cropping
Seed multiplication programmes are to be taken
Adoption of
HYV/improved variety in place of local and low productive variety
Use of modern irrigation system like sprinkler irrigation, drip irrigation etc.
Seed treatment with biofertilizers
Balaned and efficient use of fertilizers
80000 ha 1200kg/ha

95
Introduction of resource conservation technology
03. Wheat Area extension and improvement of productivity
7500 ha
To make available situation specific good quality seed to bring more area under cultivation
Application of fertilizers Assured irrigation facility Improved package of
practices
14000 kg/ha
04. Horticulture: Vegetables: a. Organic b. Contact farming
nil
More emphasis is to be given on organic cultivation
Encourage public-private-partnership to establish food processing unit
Establish food park
1500 MT 2000 nos.
05. Potato: Productivity 6100 kg/ha * Use of True Potato Seed (TPS) for higher production and to minimize the cost of production * Cost ruction of low cost storage of tuberlets * To follow plant protection measures * Adoption of Post harvest technology for better marketing.
06. Chilly: Area expansion and improve productivity.
1000 ha Cultivation of improved variety.
Tailoring of improved agronomic practices.
Adoption of IPM practice.
2000 ha.
07. Fruits: Area expansion and improved productivity.
4500ha 9840 kg/ ha
Use good quality planting materials.
Adoption of improved package of practices.
Adoption of IPM practices.
6000ha 11000 kg/ha
08. Marketing Nil Formation of FIG/CIG/FO for easy access to market.
Value addition of the agril. Products.

96
Emphasis on market led extension services.
Access knowledge through IT net works.
09. A.H. & vety: Increase productivity of meat, milk and eggs.
Milch-110000 Pig-55000 Goat-159545 Poultry-991830
Vaccination programme against disease.
Door step delivery of A.I. service.
Low cost & Quality feed production.
Promote low cost and Zero input Backyard farming.
Empowerment of women/farmers.
Introduction of germ free high yield duck germplasm.
10 Fishery-Fish production 7012 ton Quality fish seed production and distribution.
Development of beel/farmers’ pond for fish production.
Emphasis on Integrated Fish Farming.
Optimum utilization of water resources.
15000 ton
11. Sericulture: Area Expansion
Mulbery-175 ha Eri-246 ha Muga-127 ha
Use of improved variety. Introduction of Drip
Irrigation. Production of good
quality cocoons. Introduction of Improved
equipment for reeling.
200 ha 300 ha 150 ha

97
CHAPTER IV
HORTICULTURE SCENERIO OF DARRANG DISTRICT
4.1 Introduction: Assam is a traditionally horticultural State and the socio – economic fabric of its people
is largely constituted by horticultural components. The horticultural beauty lies in its history,
culture, traditions and in the mindset of the people – which has imbibed a lot from this colorful
science of fruits, flowers, vegetables, spices, plantation crops, root & tuber crops, nut crops,
medicinal, aromatics, mushroom, bee keeping and lately bamboo. With a mere acreage of 5.46
lakh hectors under horticulture, out of gross cropped area of 36.37 lakh ha, it is only 15% of
this area. Horticulture has a commitment that no other sector may perhaps can come up as
parallel i.e. in terms of its importance to achieve nutritional security and as a most viable
component of environment friendly industrial base. This is a sector gaining importance day by
day and the reason behind for calling it as sunrise area are – diverse nature of its products to
suit different agro climatic situation, higher bio mass production per unit area and thereby
more income per unit area, scope for improvement in rural diet with least investment or any
extra effort, scope for massive employment generation, unveiling new horizons of value
addition and the science itself being intellectually satisfying with aesthetic outlook has an
universal appeal for both developed and developing nations. The situation can be looked under
Assam’s perspective as here under:
1. Horticultural sector which includes fruits, vegetables, tuber crops, floriculture, mushroom,
medicinal & aromatic plants, spices and plantation crops have proved beyond doubt to be the
best diversification of agriculture for
better land use.
2. The soil and climate is so ideal for a wide range of horticultural crops that experts comment
Assam as a ‘Sleeping Giant’.
5. Sustainable approach to raise productivity is best suited when horticulture is taken into
account due our existing production system approach.
6. The natural flora of Assam have huge number of hitherto unexploited medicinal and
aromatic plants including minor fruits and orchids. Any strategy to boost up this sector will
particularly help local and more particularly tribal farmers. This has a bearing on preserving
genetic variability that exists in case of many horticultural crops also.

98
4.2 Area, production and productivity of Horticultural crops:
Development of horticulture provides the key to commercialization of agriculture. It paves
the way for additional employment opportunities by gearing up the food processing sector. The
district offers good scope for plantation and horticulture, as the agro-climatic conditions are
conducive for growth and development of some of the important horticultural crops. There are
approximately 2000 ha Khas land, 4890 ha cultivable wasteland, 5149 ha of cultivable fallow and
about 250 ha needing replacement of old
plantation areas totaling 12289 ha still
available for horticultural development. At
present, the district has about 70 small
orchards (0.5 to 4 bighas) and 30 medium to
big orchards (above 4 bighas) growing fruits
and plantation crops. The area,
production and productivity of different
horticultural and plantation crops are
increasing. Irrigation potential credited in
the district is 35.41%. Commonly grown horticultural crops are banana, orange, pineapple, papaya,
jackfruit, guava; mango etc. major plantation crops include areca nut & coconut besides tea and
rubber, which are grown commercially. Major species include ginger,
turmeric, green chilly and others including black pepper and coriander. The area, production and
productivity of some horticulture crops grown in the district (for undivided Darrang district) during
2004-05 are as follows:
Table 51: Area, production and productivity of Horticultural crops (2004-05):
Crop Area (in ha ) Production (in ton) Average Yield (kg/ per ha)
Banana 2,550 28,575 11,206
Papaya 385 9,125 23,701
Orange 495 8,525 17,222
Pineapple 526 7,898 15,015
Lemon 375 3,750 10,000
Guava 215 1,075 5,000
Litchi 185 872 4,714
Jack fruit 1,318 12,773 9,691
Mango 150 696 4,640
Other fruits 550 2,750 5,000

99
Cashew nut 35 (New Plantation)
Total fruit crops 6,784 76,039 1,947
Tea 41,667 81,112 627**
Areca nut 4,750 11,360 529**
Coconut 981 519.20*
Total plantation crops
47,398 519.20*
Potato 10,335 63,043 6,100
Sweet potato 371 928 2,501
Tapioca 13 45 3,461
Total tuber crops
10,719 64,016 319
Chili 1,380 6,900 5,000
Turmeric 945 5,670 6,000
Ginger 975 4,875 5,000
Coriander 625 1,950 2,000
Garlic 575 1,875 3,000
Onion 85 2,875 5,000
Black pepper 5,560 21 247 Total spices 8,211 24,166 Kharif vegetable
16,975 83,834 10,210
Rabi vegetables 25,186 198,275 11,680 Total vegetables 94,358 282,09 11,201 Total of all crops
515,367
* Coconut production in ‘000’ nos. ** Average yield (no. of nuts) per tree
Table 52: Area, production and productivity of Horticultural crops ( 2007-08):
Crop Area (in ha ) Production (in ton) Average Yield (kg/ per ha)
Banana 1650 23285 14112
Papaya 265 3388 12485
Orange 95 998 10511

100
Pineapple 325 4872 14990
Lemon 275 2125 7728
Guava 175 3065 17519
Litchi 172 1121 6520
Jack fruit - - -
Mango 85 867 10201
Other fruits 252 1682 6675
Cashew nut 10 20 2000
Medicinal plant 12 18 1500
Aromatic plant 5 1.25 250
Areca nut 2785 92044 33050
Coconut 575 6468 nos 11250 nos
Potato 4600 86250 18750
Sweet potato 183 3202 17500
Tapioca 005 110 22000
Total tuber crops
Chili 1170 8424 7200
Turmeric 480 14160 29500
Ginger 375 5494 14650
Coriander
675 2835 4200
Garlic 325 1771 5450
Onion 275 3987 14500
Black pepper 88 132 1500 Total spices 75 187 2500 Kharif vegetable 6525 117398 17992 Rabi vegetables 10250 163980 15998 For Arecanut*/ Coconut*: Production ( nut in lakhs) and Productivity( Nut/palm)

101
Table 53: Production Target of horticultural crops in Darrang district (kg/ha): Crops 2005 2010 2015 2025 Productivity
(Kg/ha) Productivity (Kg/ha)
Productivity (Kg/ha)
Productivity (Kg/ha)
Fruits 9840 11000 12500 13505 Vegetables 13150 15210 18162 20120 Tuber crops 6130 7650 9950 12000 Other vegetables 6850 8729 10668 12569 Table 54: Crop wise constraints and strategies of cultivation practices: Crops Practices Reason of gap Technology suggested
Variety Lack of awareness Recommended varieties Planting time Lack of knowledge March-May Planting Material Lack of knowledge Suitability or availability Planting System Lack of awareness High density planting Fertilizer application Lack of chemical know
how INM with application of micronutrients
Pest management Lack of awareness IPM , Mechanical methods and weed control
Fruits
Disease management Lack of awareness IDM, chemical control Variety Lack of awareness Recommended varieties Planting time Lack of knowledge Early, Mid, Late Planting Material Lack of knowledge Reliability Planting System Lack of awareness Row method Fertilizer application Lack of chemical know
how INM
Vegetables
Pest management Lack of awareness IPM , Mechanical methods and weed control
Disease management Lack of awareness IDM, chemical control Variety Lack of awareness Local (fibreless) Planting time Lack of knowledge March-April Planting Material Lack of knowledge Chemical treatment with
Indofil-M-45 or Captan @ 3gm/litre
Planting System Lack of awareness Row planting in ridges Fertilizer application Lack of chemical know
how INM
Pest management Lack of awareness IPM , Mechanical methods and weed control
Spices
Disease management Lack of awareness IDM

102
Variety Lack of awareness Recommended varieties, Local
Planting time Lack of knowledge March-May Planting Material Lack of knowledge Reliability Planting method Lack of knowledge Pit Method Planting System Lack of awareness Square method of planting Fertilizer application Lack of chemical
know-how INM with application of micronutrients
Pest management Lack of awareness IPM , Mechanical methods and weed control
Plantation crops
Disease management Lack of awareness IDM, chemical control Variety Lack of awareness Recommended varieties Planting time Lack of knowledge March-May Planting Material Lack of knowledge Suitability Planting System Lack of awareness Square method Fertilizer application Lack of chemical know
how INM
Pest management Lack of awareness IPM
Medicinal and aromatic plants
Disease management Lack of awareness IDM Table 55 : A few important pockets of Horticulture are mentioned below: Sl.No Name of the crops Name of the pockets
1. Winter Vegetables
Fakirpara,Bechimari, Kharupetia,Dolgoan, Pathorighat
2. Rabi vegetable Pub-Mangaldoi, Pachim Mangaldoi , Siphajhar, Khoirabari, Bhergoan, Mazbat, Dalgoan, Bechimari
3. Banana
4. Pineapple
Dalgoan
5. Arecanut Kharupetia,Pachim Mangaldoi, Pub-Mangaldoi, Siphajhar, Dolgoan, Khoirabari,

103
Table 56: Type of farming situations under which important Horticultural crops are cultivated: Name of agro-ecological situation
Village Area(ha) Name of hort.crops
Soil type No. of families (%) under different farming situations
Total
Irrigated Rainfed Area (%) Upland with Medium Rainfall
Daifang 133’33 Ridge gourd Cle crops Tomato Brinjal
Sandy loam Do Do Do
- 100 60 100
100 - - 40 -
26 - 74 20.50 12.83
19.5 55.5 15.37 9.63
Medium with Medium Rainfall
Naharbari 20 Arecanut Clay loam
100 24 100
Deep water with lower elevation
Bandia 67 Tomato Brinjal
Sandy loam Do
100 100
35 32
52.2 47.8
Foot Hill with High elevation
Baranga juli Khuti
135.0 Arecanut Pineapple Zinger Bettle vine
Sandy loam Do Do Do
100 100 100 100
40 5 13 21
26.6 - 9.6 15.5

104
Table 57: Critical issue and proposed extension strategies in horticultural sector: Critical gap Extension Strategy Proposed activities Residual content of pesticides in vegetable is very high
Organic farming of vegetable
1.Awarenessprogramme 2.Training on organic vegetable production 3.skill Development for Organic input production & delivery
Less area under spices Intensification of spices 1.Exposure visit of farmers to spice growing area 2.Demonstration of high quality spices 3.Training on production technology of spices
Non utilization of potentiality for Horticultural crops
Aera expansion under different fruit crops
Training on production technology of spices Farmers training on production technology of fruits Exposure visit outside the state
Export oriented flower production High quality flower cultivation
Demonstration of flowers having market value in compact area Exposure visit Replication of success stories
Loss of bio diversity Conservation of non-conventional crops
Training of unemployed educated youth Exposure visit outside & inside the state
Deforestation Area expansion under agro forestry
Orientation training on agro forstry
Non-existence of fruit processing unit Establishment of fruit processing unit Establishment of food park
Training of unemployed educated youth Exposure visit outside & inside the state Enhancement of credit facility

105
Table 58: Analysis of Horticultural problems with regard to existing farming system (AES-1)EFS-I: Types of commodities (P/S/T) Specific problems No. of affected
persons Proposed solution Proposed strategy
Areca nut Cashew nut Vegetables
P T S
Marketing Non availability of planting material Lack of knowledge of post harvest technology Pest and Diseases
94% 2.6% 90.3%
Market led information Training on post harvest technology Training on IPM
Training Exposure visit IT networks R-E-F linkage Training Exposure visit Training on IPM
Table 59: Analysis of Horticultural problems with regard to existing farming system(AES-2) EFS-II: Types of commodities
(P/S/T) Specific problems No. of affected persons
Proposed solution Proposed strategy
Areca nut Cashew nut Vegetables
P T S
Marketing Non availability of planting material Lack of knowledge of post harvest technology Pest and Diseases
94% 2.6% 90.3%
Market led information Training on post harvest technology Training on IPM
Training Exposure visit IT networks R-E-F linkage Training Exposure visit Training on IPM

106
Table 60: Analysis of Horticultural problems with regard to existing farming system: (AES-2)EFS-III: Types of commodities
(P/S/T) Specific problems No. of affected persons
Proposed solution Proposed strategy
Areca nut Cashew nut Vegetables
P T S
Marketing Non availability of planting material Lack of knowledge of post harvest technology Pest and Diseases
94% 2.6% 90.3%
Market led information Training on post harvest technology Training on IPM
Training Exposure visit IT networks R-E-F linkage Training Exposure visit Training on IPM
Table 61: Analysis of Horticultural problems with regard to existing farming system: (AES3) EFS-I: Types of commodities
(P/S/T) Specific problems No. of affected persons
Proposed solution Proposed strategy
Areca nut Vegetables
P S
Marketing Pest and Diseases Marketing
84% 75%
Organic farmers group for better market linkage Training on IPM Storage facility Processing unit
Promotion of commodity based farmer organization Training on IPM $ INM Establishment of cold storage/Processing unit

107
Table 62: Analysis of Horticultural problems with regard to existing farming system: (AES3) EFS-II: Types of commodities
(P/S/T) Specific problems No. of affected persons
Proposed solution Proposed strategy
Areca nut Vegetables
P S
Marketing Pest and Diseases Marketing
84% 75%
Organic farmers group for better market linkage Training on IPM Storage facility Processing unit
Promotion of commodity based farmer organization Training on IPM $ INM Establishment of cold storage/Processing unit
Table 63: Analysis of Horticultural problems with regard to existing farming system: (AES4) EFS-I: Types of commodities
(P/S/T) Specific problems No. of affected persons
Proposed solution Proposed strategy
Vegetables (Tomato, Brinjal etc.)
P
Pest and Diseases Marketing Lack of knowledge of post harvest technolog
100%
Market led information Training on IPM Storage facility Processing unit
Training on IPM $ INM Training Exposure visit IT networks

108
Table 64: Analysis of Horticultural problems with regard to existing farming system: (AES4) EFS-II: Types of commodities
(P/S/T) Specific problems No. of affected persons
Proposed solution Proposed strategy
Vegetables (Tomato, Brinjal etc.)
P
Pest and Diseases Marketing Lack of knowledge of post harvest technolog
100%
Market led information Training on IPM Storage facility Processing unit
Training on IPM $ INM Training Exposure visit IT networks
4.3 Approaches for Horticultural Development:
There is a vast scope for development of horticulture in the district which can contribute substantially in the economy of the farmers. The approach of horticultural development should be different from other crops.
a) Technology for low cost hybrid vegetable seed production.
b) Growers should be supplied with credit by bank finance/ Kishan Credit Cards, planting materials, other inputs through KVK or farm/ Nurseries and Technology Mission by state govt. department.
c) Facilities to be supported by proper marketing, cold storage and proper
processing of perishable crops.
d) Involvement of organizations like Assam Seed Corporation, Assam Agro-industries Development, Govt. and AAU farms, State Farm Corporation of India ,Private dealers in extending input services in Horticulture in the State.

109
e) Encourage to grow fruits and spices as alternative feasible crops in most suitable areas.
f) Formulation of value added products like fruits and vegetables processed products. In addition to that use of improved cultural techniques including improved varieties with good quality and nutritional value should be the aim in the developmental programme.
4.4 Strategies for Development of Horticulture:
1) Establishment of nurseries in each district /blocks under state of horticulture for
certified growers or progressive farmers
2) Arrangement of training/ workshop to propagate orchard management packages
to support production and maximize yield.
3) Establishment of production site for organic compost in each identifies pockets to
support organic nutrient management
4) Adoptions of advanced techniques of agriculture like crop diversification, contract
farming, precision farming, fruits based farming system and reach the unsearched
in real time.
5) Development of wholesale market, rural areas market at district level near to t he
city.
4.5 Post Harvest Technology:
Being living organism, the condition and marketable life of fruits and vegetables
are affected by temperature, humidity, the composition of surrounding atmosphere, level
of damage before, during and after harvest and degree of infection with microorganism,
insect etc. They will deteriorate during storage through loss of moisture, loss of stored
energy (carbohydrate), physical losses through pest and disease attack, losses from
physiological disorder, fibre development, greening in potato, seed germination etc.
Therefore proper harvest management plays a pivotal role in rural economy.
Vegetables and fruits after harvest are either used for home consumption or sale
in the local market. There is no concept of packaging. All horticultural produce is either
transported loose in bamboo basket or in gunny bags which results in heavy losses

110
during transportation. Fruits processing need more emphasis in the district as it is the
integral part of horticultural development. The poor communication and transport
problem necessitate immediate intervention.
Table 65 (A): Different Processing unit in the District of Darrang Sl. No.
Name of the Block
Location of processing unit
Name Commodity Processed
Method of processing
1 Pub-Mangaldoi,
Godhiapara, Bezpar
SHEETAL JILMILI
Suash,Jam, Jelly, Pickle
Chemical
2 Pachim Mangaldoi
Goanburapara FRESH Do
3 Siphajhar Siphajhar, Dakhin Subari Ghorabandha BURAH
Madharima ATMA SAHAK GOTJyan-Bigyan NGO
Do
4 Khoirabar Namkhola ADITI Do 5 Dolgoan-
Sialmari Dalgoan NILONS
India Do
4.6 Horticultural Markets in Darrang District:
It is observed an organized vegetable market in Darrang district. The farmers
either arrange their own marketing system or they sell to local or outside middle men at
lower prices. Fruits and vegetables prices go down in nominal rates in rural areas and in
urban market of the district the prices leads to the higher consumer price. Two of
regulated market is running in Kharupetia and Bechimeri area of the district. In marketing
the garden owners sell the whole orchard like fruit and vegetables to private party at
nominal price. The private parties or middlemen sell the whole orchard with profit. Prices
of the horticultural commodities are highly fluctuating which varies from season to
season. During the crop season the prices are lower but during off season price of the
commodities rises to the double the original price.

111
Table 65(B): Movement and Flow Pattern of Different Commodities from and to Darrang District: Sl. No.
Name of Commodity
Location of Trade Markets Quantity(Volume) of Trade (MT)
District Level
BlockLevel
Village Level
Inflow Outflow
District Level
BlockLevel
Village Level
District Level
BlockLevel
Village Level
1 Beetle nut - 4 16 - 415 36 - 185 - 2 Supari 2 3 90 63 13 3 Potato 1 2 2000 1000 4 coconut 10 7 1000 5000 2000 8000

112
Table 66: Supply of seeds and planting material (as on December 2008):
Name of the Crop Nos /kg
Banana 56630 Pineapple 23984 Orange 965 Assam Lemon 389
Fruits
Coconut 25639 Arecanut 36219
Cabbage 256 Cauliflower 963 Tomato 1203 Brinjal 5699 Chilli 789
Vegetable
Ladies Finger 978
The marketing channels prevailing in the district are as follows: (i) Producer--------Consumer (ii) Producer---------Retailer-----------Consumer (iii) Producer----------Wholesaler----------Consumer (iv) Producer-----------Wholesaler----------Retailer-------------Consumer (v) Producer-----------Post Harvest Contractor--------------Retailer-----------consumer
Flow of Money:
Producer Assembler Wholesaler Retailer Consumer
Intermediaries
Consumer Retailer Wholesaler Assembler Producer
Intermediaries

113
4.7 SWOT of Medicinal and Aromatic plants: Strengths: 1. The district is rich in Medicinal and Aromatic plants. 2. Favorable agro-climatic condition for cultivation of many Medicinal and Aromatic
plants. 3. Traditional system of treatment for many problems is being practiced.
Weaknesses 4. Identification and documentation of indigeneous medicinal plants. 5. Awareness campaigns for conservation of biodiversity in the district.
Threats 1. Risk to loose the information about indigeneous medicinal knowledge with age old
people.
Table 67: Technology matrix of Medicinal and Aromatic plants:
Crop Problem Interventions
1 Citronella and Patchouli
Lack of processing units Introduction of processing units of Citronella and Patchouli
2 Medicinal Plants Lack of awareness about Medicinal Plants
Identification and documentation of Indigeneous Medicinal Plants
4.8 Bari system in Darrang district: Baris contribute nearly 80 per cent of total fruit production of the state. It is seen in the district that due to urbanization and fragmentation of holding, the size of these baris is decreasing day by day and old baris are becoming less productive. • Based on size, baris are classified into –
• Small bari (up to 0.26 bigha), • Medium bari (0.26-0.53 bigha) • Large bari (more than 0.53 bigha)
• Another classification is – • Complete bari • Fruit bari • Pam bari • Meroni • Bamboo and Timber wood bari
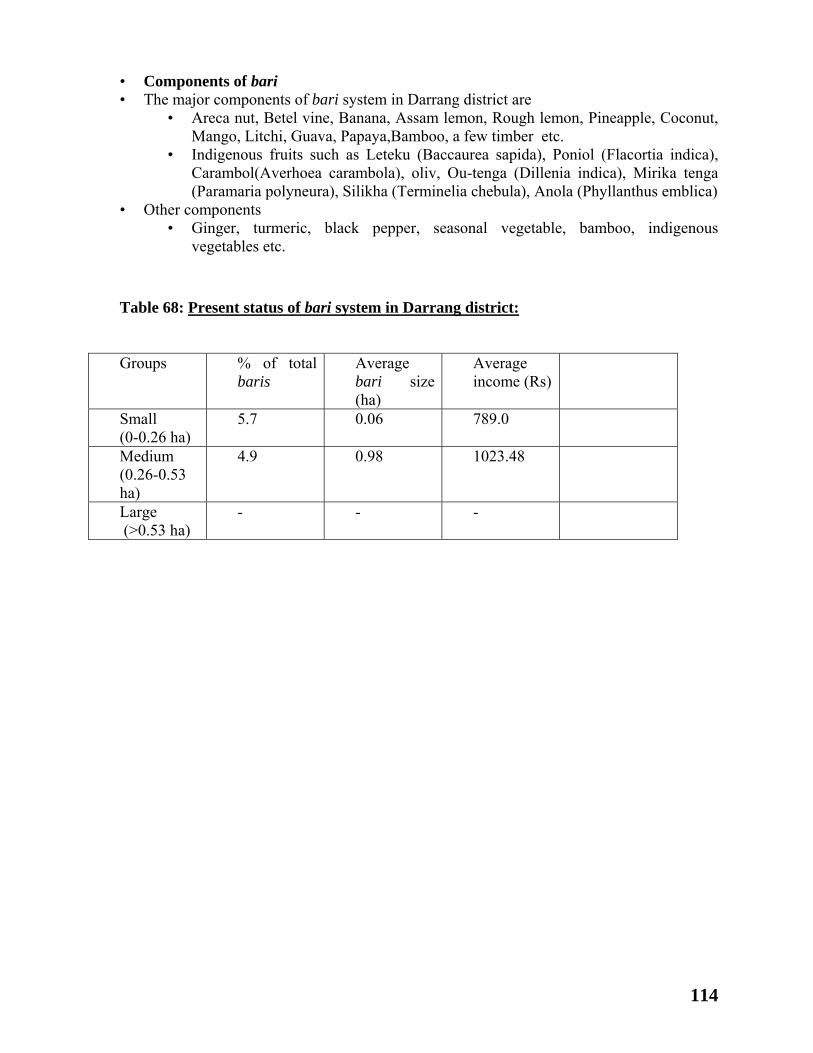
114
• Components of bari • The major components of bari system in Darrang district are
• Areca nut, Betel vine, Banana, Assam lemon, Rough lemon, Pineapple, Coconut, Mango, Litchi, Guava, Papaya,Bamboo, a few timber etc.
• Indigenous fruits such as Leteku (Baccaurea sapida), Poniol (Flacortia indica), Carambol(Averhoea carambola), oliv, Ou-tenga (Dillenia indica), Mirika tenga (Paramaria polyneura), Silikha (Terminelia chebula), Anola (Phyllanthus emblica)
• Other components • Ginger, turmeric, black pepper, seasonal vegetable, bamboo, indigenous
vegetables etc.
Table 68: Present status of bari system in Darrang district: Groups % of total
baris Average bari size (ha)
Average income (Rs)
Small (0-0.26 ha)
5.7 0.06 789.0
Medium (0.26-0.53 ha)
4.9 0.98 1023.48
Large (>0.53 ha)
- - -

115
CHAPTER V
ANIMAL HUSBANDRY IN DARRANG DISTRICT 5.1 Introduction:
Darrang district is basically an agricultural district and it plays a pivotal role in the
agrarian economy of district as it create of thousand of employment opportunities through out the
year by adopting animal husbandry industry on large scale of rural people in supporting the
family income particularly for landless, small and marginal farmers. The production and use of
animal products in the human diet is receiving tremendous attention. Assam is endowed with
rich genetic resources of different livestock and poultry species. The indigenous livestock and
poultry constitute the major shank of the states populations which are non-descript. The
productivity and reproductively of the indigenous live stocks are poor in comparison to the
exotic breeds but they are well adapted to local hot and humid climatic condition.
5.2 Population trend Table 69: Expression of Livestock and Poultry population of Darrang district in respect of
the State and country (In ‘000):
Cattle Buffalo Locality Indigenous
CB Local CB Sheep Goat Pig Fowl Duck
Darrang 436.789 18.840 15.713 12.528 9.753 159.546 55.626 620.740 382.012
Assam 7979 440 667 60 169 2905 1533 14757 6888 India 160495 24686 97922 61469 124358 13519 457399 31613 Darrang Shares to Assam (Percentage)
5.47 4.28 2.36 20.88 5.77 5.49 3.63 4.21 5.55
*Source: Livestock Census, 2003

116
Table 70: Population trend of different livestock species in Darrang districts: Species 15th Livestock Census (1997) 17th Livestock
Census (2003) 18th Livestock Census (2007)
Indigenous Cattle NA 436789 423782
Crossbred Cattle NA 18840 14426
Total cattle 429686 455629 438208
Local Buffalo NA 15713 15307
Crossbred Buffalo NA 12528 12219
Total buffalo 38766 28241 27526
Sheep 7032 9753 39006
Goat 160851 159546 156893
Pig 45453 55626 54618
Fowl 619419 620740 585423
Duck 259760 382012 369238
Total 1560967 1711547 1670912
NA : Not available
From the above population of livestock, we can not represent a trend because the
population of different species in year 1997 and 2003 consist of undivided Darrang. But in the
census report 2007 consists of divided Darrang. Therefore, to draw a population trend, the
population of different livestock species must be presented in terms of human population.

117
Table 71: Population trend of different livestock species in Darrang districts in term of 1000 human:
Species 15th Livestock Census
(1997) 17th
Livestock Census (2003)
Livestock Census (2007)
Growth rate (1997-2007)
Indigenous
Cattle
NA 290.36 504.96
Crossbred Cattle NA 12.52 19.19
Total cattle 286.71 302.88 522.15 82.12 % increase
Local Buffalo NA 10.45 18.24
Crossbred
Buffalo
NA 8.33 14.56
Total buffalo 25.78 18.77 32.80 27.23 % increase
Sheep 4.68 6.48 46.48 893.16% increase
Goat 106.95 106.06 186.94 74.79 % increase
Pig 30.22 36.98 65.08 115.35 % increase
Fowl 411.86 412.64 697.57 69.73 % increase
Duck 172.72 253.94 439.97 155.23 % increase
Total 1037.92 1137.75 2039.42 966.25 % increase
NA: Not available
*Source
Strategic Research and Extension Plan, 2005 by ATMA, Darrang, MANAGE, Hyderabad &AAU, Jorhat Statistical Hand Book, Assam , 2002, 2006 and 2007 Mangala, Souvenir of general conference of Assam Animal Husbandry and Veterinary Service Association, 2007.
The increased growth of livestock and poultry population in Darrang was observed at a
time when there has been tremendous pressure from human population. The increase in growth
of human population has undoubtedly exerted pressure on livestock. Even then the growth rate
of livestock and poultry continued to sustain mainly because of economic compulsion and

118
increased realization on the part of the farmers about the value of the animals and also due to the
fact that various diseases of animals and poultry could be effectively controlled by the efforts of
the veterinarians. There is an increase in the total population of cattle, buffalo, sheep, goat, pig
fowl and duck from 1997 to 2007 by 82.12, 27.23, 893.16, 74.79, 115.35, 69.73 and 155.23%
respectively with over all livestock and poultry population increase by 966.25 %.
Fig 3: Population trend of cattle in Darrang district from 1997 to 2007
R 2 = 0.8013
1997 2003 2007
Popu
latio
n
Fig 4: Population trend of Buffalo in Darrang district from 1997 to 2007
R2 = 0.2504
1997 2003 2007
Popu
latio
n
Fig 5: Population trend of Sheep in Darrang District from 1997 to 2007
R2 = 0.7822
1997 2003 2007
Popu
latio
n

119
Fig 6: Population trend of Goat in Darrang District from 1997 to 2007
R 2 = 0.7417
1997 2003 2007
popu
latio
n
Fig 7: Population trend of Pig in Darrang district from 1997 to 2007
R2 = 0.889
1997 2003 2007
popu
latio
n
Fig 8: population trend of fowl in darrang district from 1997 to 2007
R2 = 0.752
1997 2003 2007
popu
latio
n

120
5.3 Infrastructure facilities of A.H. & Veterinary in Darrang District:
The District Animal Husbandry & Veterinary Office, Darrang with one Veterinary
Subdivision at Mangaldai have the responsibilities to promote Animal Husbandry activities
through better health care, breeding support, supply of inputs and marketing of farm products
etc.
Table 72: Infrastructure facilities of A.H. & Veterinary in Darrang District:
S.No. Institution/ facilities Number Locations A Health Care facilities 1 Veterinary Hospitals 1 Darrang 2 Veterinary Dispensaries 13 - 3 Block Veterinary Dispensaries 6 4 Mobile Dispensaries 1 6 A.I. Centre 21 - B FARM 1 Duck cum Fishery Farm 1 Sipajhar
Fig 9: population trend of duck in darrang district from 1997 to 2007
R2 = 0.9512
1997 2003 2007
popu
latio
n
Fig 10: population trend of total livestock and poultry in darrang district from 1997 to 2007
R2 = 0.8239
1997 2003 2007
popu
latio
n

121
5.4 Dairy Production:
Darrang district possesses a heterogeneous cattle population of 438208 and buffalo
15307. Majority of the cattle in Darrang district are local nondescript type. The female animals
are usually kept to produce offspring. The non-descript indigenous cows are never thought to
rear for commercial purposes and they always left as such and blamed for their poor
productivity. The indigenous bullocks are short, sturdy and diseases resistant and have good
draught power. The cows are also small, sturdy and have very low milk production capacity
(0.5- 1.5 lit/day) with high fat percentage. However, their small body size (about 150 Kg), high
adaptability and heat tolerance make them convenient for rearing under poor manage mental
conditions by the rural households.
The buffaloes of Darrang district are considered to be of swamp type and are extremely
good as draft animals for carrying out agricultural activities in wet lands, reasonably good
producers of high quality milk.
5.5 Housing System of Cattle in Darrang District:
There are three housing system that practices in the district viz. Free range/ open grazing, Restricted grazing and Intensive stall feeding.
(i). Free Range/open grazing system: Local cattle are not provided with proper housing. The
top of the house is covered with thatch or asbestos and the floor is kuccha. In this system cattle
are let loose in the morning and whatever dung and urine is excreted is cleaned in the morning so
that in the evening it becomes dry. No concentrate feed is fed to the cattle, although some of the
farmers provide rice polish, MOC, vegetable and kitchen waste along with salt.
(ii). Restricted grazing system: In this system the animals are tethered in the road site, forest
area or open uncultivated fields for grazing, so as to avoid destroying the paddy crops by cattle.
The animals during the season are totally under fed with poor general health. Production and
reproduction is seized during the season.
(iii). Intensive stall fed system: A few farmers are reared cross bred cattle generally followed
this system. Majority of the cattle shed is traditionally built with concrete flooring,
wooden/bamboo/concrete post with thresh or asbestos sheet roofing. The manger and the water
supply system are not well constructed. Concentrate feed, Bason, Rice polish, MOC, green

122
fodder, vegetable and kitchen waste along with salt are provided to their cattle. Proper
vaccinations schedule are maintained by the farmer.
5.6 Marketing of Dairy Products:
There is not organized marketing system in Darrang district.
a. Direct Selling: Farmers are selling their raw milk directly to the consumers. There is not
any system of checking adulteration of milk and the prices ranges from Rs. 24.00 to Rs.
25.00 per liter. The price of dahi ranges from Rs 50.00 to Rs 80.00 per Kg.
b. By middleman: Milk is sold by the middlemen and the prices of milk ranges from Rs. 24.00 to Rs. 25.00 per liter and dahi ranges from Rs 50.00 to Rs 80.00 per Kg.
c. Sale of milk through co-operative society: The price of milk selling through milk co-
operative has been fixed @ Rs. 24.00/lit. 5.7 Sheep and Goat Production:
Sheep and Goat production is still in its primitive stage in the district. Every household’s
rear goat in the district and very few farmers rear sheep for meat purpose only. Only Assam Hill
Goat and Black Bengal are found in the district. Genetic group of sheep is not recognized.
Small ruminant production is a source of income to about 40% of rural population below poverty
line, large scale small ruminant organized production is not practiced in the district. Small
ruminant sector in general and goat husbandry in particular has got good prospects for growth in
the region since the people are predominantly non-vegetarian and there is no such taboo and
issue for goat meat.
Most of the farmers feed their goats through tethering process where animals are tied
with a rope to a tree on the field and allowed to browse upon the small trees, shrubs and grasses
available within the radius of the rope. Animals are given very less attention in terms of feeding,
housing, disease control, vaccination and other management aspects. They are housed in
backyard system for night time to protect from predators and other adverse environmental
conditions. Local goats are small in size, sturdy and give at least 2 kidding/1.5 years. She gives
two to four kids.

123
5.8 Swine Production:
Pig farming has a special significance as it can play an important role in improving the
socio-economic status of a sizeable of the weaker rural commodity. Among the meat producing
animals, pig occupies unique place, as rearing of pig is considered to be one of the most
encouraging and appropriate livestock enterprise to narrow down the gap between the
availability and requirement of animal protein in this district. Pig is one of the most efficient
feed converting animals, having shortest generation intervals, high prolificacy and faster growth
rate, all there economic traits are directly and positively correlated with the overall economy in
production. Pig farming fits in very well mix farming and can also be a complementary in
intensive crop production operation. Pig rearing is taken as a subsidiary occupation by the small
and marginal farmers and the agricultural labourer of the tribal community. Almost every tribal
household rear at least one or two pigs in backyard, but still a wide gap exist between the need /
demand and availability of pork. The major reason for insufficiency in pork production is that,
pigs are reared by the farmers is mostly of non-descript type, whose growth rate is relatively
poor and hence production is hardly adequate for the population of the district. The indigenous
pigs of Darrang district are small and their
reproductive performances is also poor with
a adult body weight around 30 -40 kg and
litter size is around 5 at birth. These animals
can hardly be economical for large scale
organized farming. The animals are let loose
for scavenging and only a small amount of
feed provided for when necessary as
supplement. The district posses 11294 nos of pig (Livestock Census, 2007) and most of them are
indigenous non-descript type. In order to augment the pork production of the district, exotic
breeds of pigs namely Hampshire, Large Black, Large White Yorkshire, Saddle back have been
introduced in the district , both by Government and private entrepreneurs, Crossing of
indigenous pigs with exotic breeds with 50-75 % exotic inheritance have also been undertaken.
The cross breeding practices are less popular and still people are unaware with the beneficial
aspects of crossbred pig.

124
5.9 System of Pig Rearing in Darrang District:
In general two housing system of pig rearing are practiced by the farmers of the district
viz. Scavenging system and Backyard System.
A. Scavenging system: In this system, poor farmers of backward class rear local pigs by the
system. The pigs are let loose to feed on roots and tubers in open fields, garbage’s, kitchen waste
or hotel waste during day time and in night time they return back home. Some farmers are
keeping the animals by tethering. Proper housing is not provided to the animals. Proper housing
is not provided to the animal. No concentrate feed is provided, although some farmers provided
boiled rice/ kitchen waste or boiled colocasia, tapioca, water hyacinth, rice polish along with
little amount of salt. In some areas of upper bank Brahmaputra river of Darrang district, farmers
rear large number of pigs in scavenging system of rearing. They allow their animals for
searching feed in the marginal area of Brahmaputra river at day time and keep the animal on
embankment of same river.
B. Backyard System: In this system of pig
rearing, pigs are housed in temporary sheds are
constructed by using locally available materials
like wood, bamboo etc. The feeding and water
trough are also made up of wooden and
bamboo. There is fencing around the shed
which is also made up of bamboo. The animals
are provided roots and tubers in open fields,
garbage’s, kitchen waste or hotel waste and merra/ Juguli (Rice liquor residue) and salt. The
location of the pig house is usually in the backyard of the house for easy operation.
5.10 Feeding practices:
The farmers provide concentrate feed to the pig once and/or twice daily. In addition to
concentrate feed some locally available unconventional feed stuffs are also provided to the pigs
such as Tomato, cabbage, orange peets, citrus, pineapple waste, banana tree, sweet potato,

125
tapioca, Arum (Kachu), water hyacinth and Kitchen waste e.g. Garbage, hotel waste, hostel
waste, residue of rice beer (Jugule or mera)
5.11 Health Management:
There is no any standard preventive health measure. But some of the farmers vaccinate
their pigs against Swine Fever and deworming is done occasionally. Educated unemployed youth
are generally follows the all the preventive measures against swine fever, H.S., and FMD. They
immediate consulted with local veterinarians if any abnormalities shown by the animals.
5.12 Market Status:
There is no any organized pig market in Darrang district. Due to lack of organized
marketing facilities, pig breeders sometimes find it difficult to sell pigs timely and at a
remunerative price. Generally farmers used to sell their adult pigs when it attain 1 year of age on
live weight basis to the traders @ Rs. 6000.00 to 6500.00 and the piglet are sell at the age of 2-3
months @ Rs. 1000 to 1200. The market price of pork in the local market varies from Rs 120 to
140 / Kg. In order to protect the interest of the pig breeders of Darrang, public slaughter houses
(Bacon factories) need to be established in district head quarter.
5.13 Poultry Production System:
The poultry production in Darrang district is mainly in the hands of the rural people who
rears mostly the desi or nondescript type of poultry. The desi birds are hardy, and have been
acclimatized in diverse conditions of the rural areas of the district. Almost every household use
to keep a few birds to met their pecuniary need. The birds are kept in traditional method which is
nearly similar to the free range system. Birds are let loose in the morning and sheltered only
during night and in inclement weather conditions. For feeding, breeding, disease control and
other management cares, these birds can not accept much from their owners. Whatever eggs and
poultry meat produced by theses birds are almost free of cost to their owners. The production
system is based on scavenging or semi-scavenging and investment is normally limited to
housing. But the systems are poorly described in terms of management strategies, practices

126
productivity, diseases and losses. But recently commercial poultry farming has percolated to the
rural areas in a large way mainly due to two basic characteristics i.e. the cheaper capital
investment followed by early income to the farmers and simple management practices.
As people in the Darrang district are predominantly non vegetarian and prefer both eggs
and meat of birds’ local variety/ improved variety layer as well as broiler. The production of egg
is less than the demand in the district. Therefore to meet the demand, eggs are procured from far
off places like Delhi and Hyderabad.
5.14 Chicken production system in Darrang District: Backyard farming or semi intensive scavenging system:
In this traditional system of rearing, indigenous non- descript chicken especially in rural
& semi urban areas of Darrang district the birds are housed as backyard with simply designed
house attached with the residence of the owner. The shed are constructed generally with the
locally available material like bamboo, wooden base and roof with tin or kher.
In the day time birds are allowed for grazing in nearby localities and in the night they are
kept in the shed. The farmers generally provide few feds like rice, rice polish and water. No other
feed additives are provided. Coccidiosis, colibacillosis, CRD, RD, IBD, Gout etc are some of the
common diseases. Diseases against which vaccines are currently used include IBD and RD (F &
Lasota).
5.15 Market Status of Poultry: The market price of chicken and duck fluctuates heavily in the region. The price of
chicken and duck rang between Rs. 70-120/Kg and Rs. 100-150/No. High consumer price can be
attributed to high production cost and unorganized nature of marketing dominated by
middlemen.
The average production cost of per kg live chicken Rs 140.00 and broiler is Rs 100.00.
5.16 SWOT analysis of Animal Husbandry of Darrang District Strength:

127
1. Darrang district has favourable climatic condition for livestock and poultry production
and all the species or crossbred are well suited.
2. Framers are traditional tendency to keep some cow, buffalo, goat, duck, pigeon and bird
in their household. Even female member of some family are rearing some animals and
birds for their own income.
3. financial institution available
4. Availability of weekly, by-weekly and daily market
5. Availability of community information centre for market information.
6. Technically skilled breeders
7. AI facilities are available
8. The district has higher cropping intensity in terms of paddy, whose waste by products i.e
straw, rice polish, broken rice etc. can effectively be used as livestock feed.
9. Almost 95% of the people of Darrang district are non-vegetarian. So there is a high
market demand for livestock commodities.
10. As Guwahati is not far from Darrang district, so transportation cost for feed, medicine etc
will be low.
Weakness:
1. Inadequate availability of superior germplasm of livestock and poultry. The majority of
livestock and poultry are indigenous type with poor productivity.
2. Unscientific breeding practices
3. There are few well-trained personals in this area. Lack of scientific knowledge for
operating a livestock and poultry farm.
4. Inadequate availability of quality feed and feed stuffs.
5. No availability of improved variety fodder
6. These sectors are always considered as a subsidiary income. They are always reared on
zero input system.
7. Lack in sound breeding, feeding, health care policies and their implementation.
8. Inadequate facilities for vaccine production and storage due to which health cover
measures are suffer.
9. No scientific slaughter house in the district so all byproducts are wasted.
10. No any weather or season based disease forecast

128
11. High cost of medicine and vaccine
12. Lack of any organized market facility is constrained for producers and buyers.
13. Inadequate credit support to the farmers.
14. Poor involvement of corporate sectors in the livestock industries.
Opportunities: 1. Scope for establishment of mega seed production farms in respect all species.
2. Scope for establishment dairy processing unit
3. Scope for establishment of meat processing unit
4. As Darrang district have breeding pocket for duck, there is a very good opportunity exists
to promote and propagate duck industry in the district.
5. As there is a very good genetic variation among the indigenous all species so there is
scope for genetic improvement of indigenous live stock and poultry.
6. Utilization of high land for fodder cultivation.
7. Scope for establishment of hatchery for broiler and duck.
8. Scope for establishment of feed meal
9. Scope for making a unit to make various milk products such as dahi, paneer and various
sweets etc.
10. To develop livestock and poultry feed formula in cooperating indigenous feeds and
fodder resources including medicinal herbs, shrubs and tree leaves.
11. Opportunities of organic animal husbandry.
12. Scope exists to establish slaughter house byproduct utilization industries.
13. Biotechnological application for superior germplasm conservation and propagation.
14. Promotion of farmers consortium and SHG for livestock product processing, value
addition and marketing.
15. Export potentialities of organically produced livestock.
Threats:
1. Global warming is one threat to the livestock sector as vast population of ruminants have
role in global warming
2. Easy money culture among the young is also one of threat to the livestock sector.

129
3. Zoonotic diseases are threat to the livestock sector
4. Non availability of concentrated feed resources is a threat to the livestock and poultry
industry.
5. Non availability of carcass utilization facilities is a threat from public health point of
view.
6. Decline natural resources based with disturbed eco- system.
7. Import threat from neighbouring state and country.
8. Rapid urbanization and shrinkage of agricultural land mass.
9. Natural calamities like flood, earth quake etc.
10. Social constraint to rear pig in some minor areas of the district
11. Dreaded viral disease like Bird flu in Poultry, FMD in Cattle, Swine fever in pig etc.
5.17 Role of Animal Husbandry in Livelihood in Darrang District:
The role of Animal Husbandry in the society is enormous for building heath and wealth
of the human society. The huge livestock industry of today which provides nutritive foods to
lakhs of people, and give livelihood to farmers, butchers, traders and others. This provides direct
and indirect employment potential to the rural people.
5.17.1 Animal products and production potential: Milk: Total milk production of Darrang district is 772829 litres. Darrang district having 4, 38,
782 nos. of cattle population out of which 4, 23, 782 are indigenous and 14,426 are crossbred,
where as in case of buffalo out of total 27, 526 nos, 15307 are indigenous type and 12219 are
improved variety. The productive and reproductive efficiency of indigenous cattle and buffaloes
are very poor. The average milk yield of indigenous cattle is 0.5 litre/ day against all India
average 2.210 lit/ day. The lactation milk yields of this animal however, low ranging from
around 300 to 600 kg in a lactation length around 205 to 290 days. Thus with long age at first
calving and inter calving period and low yield, these animals can hardly be economical for
commercial farming. But at present most of the farmers have realized the potential benefits of
rearing high yielding crossbred animal. As a result there is a form of drastic increased in the
percentage of Crossbred cattle population (96.58) and today CB cattle population increased to

130
56,771. The average milk yield of crossbred cattle 6lit/day, while all India average 10 lit/day.
The average milk yield of indigenous buffalo varies from 2-4 litre / day.
Meat: Meat is the main source for protein supplement. Total meat production of Darrang district
is 1430356 kg. Majority of the population in the Darrang district are non vegetarian (95%) in
food habit and prefer the chicken, chevon, pork, duck and pigeon meat.
Beef: There is 35.54% muslim population in Darrang district, therefore beef consumption is also
play an important role for the district. The annual utilization of beef per year comes around 1556
Kg/year.
Pork: There is high demand for pork and pork products in district. Popularity of pork is gaining
day by day as the price of pork is some lower as compared to other meat. This district is having
about 3.6 % of state total pig population (Livestock Census 2003). The total pork production in
the district in 2007 was around 912.21 ton.
Egg: The egg production in the district in 2007 is around 102.23 lakhs. The average annual
production of indigenous bird reported to be 80 eggs per year which is far less in comparison to
either improved strain of bird or layer (150-175 eggs/year). Improved variety of duck such as
Chara Chambelli is introduced to enhance the egg production in the district by SIRD. The
average annual production of Chara Chambelli duck varies from 150 to 200 eggs per year. This
suggests the enormous scope for increasing egg production by using improved germplasm.
However the products from local birds fetch a higher price in market than the products from
exotic birds.
5.17.2 Present production and requirement scenario of Darrang District.
Milk: Milk consumption is not sufficient to cater the milk requirement. The district produces around 772829 litres of milk annually. The requirement of milk for human consumption comes around 857.70 million lit/year. The partial portion of deficit milk has been compensated from powder milk.

131
Meat: In spite of having a good numbers of food animals, the Darrang district is deficient in
meat production. The district produces around 1430. 356 ton of meat against the requirement of
91895.90 ton.
Egg: In the absence of commercial poultry production system, the district produces around 102.23 lakhs of egg against the requirement of 551.38 million. This huge deficit is partly compensated by transport of egg from Andhra Pradesh and Delhi. 5.18 Identification of critical issues of prioritized commodities in Animal Husbandry in Darrang District Cow and buffalo: 1. Poor production and productive efficiency
No improved variety of
breed
No proper breeding plan
No intensive system of
management.
No availability of green
fodder except rainy
season.
All most all farmer rear
indigenous breeds with
low production performances.
Improper health care and sanitation in rural areas.
Low availability of quality concentrate feed and at high cost.
2. Insufficient AI service facility and irregular supply of liquid nitrogen and frozen semen .
3. Reluctant of financial institution to finance as per requirement.
4. Lack of regulated market and market price.
5. Repeat breeding, inbreeding and infertility.
6. Superstition to do AI in some part of district
7. High cost and non availability of medicine and vaccine in rural areas.
7. Nonavailability of require nos of input dealer.
8. Poor insurance facility.

132
Goat:
1. Poor production and productive efficiency as majority of the goat are indigenous type.
2. No improved variety of goat
3. Lack of scientific knowledge of interested breeders.
4. Poor financial conditions of breeders and low accessibility to financial institution.
5. Lack of regulated market
6. High cost of medicine and vaccine.
7. No scientific slaughter house
8. Poor insurance facility.
Pig : 1. Poor production and productive efficiency
2. Improved breed/ variety are not easily available for upgrading
3. Lack of availability of low cost effective feeds due to non availability of feeds meals.
4. Non availability of required nos of input dealer.
5. Lack of regulated market and market price.
6. Reluctant of financial institution to finance as per requirement.
7. Social constraint to rear pig in some minor areas of the district
8. Poor insurance facility.

133
Table 73: Constraints, Strategies, technological intervention and action plan of different livestock production system: Production system
Constraints Strategies Technological intervention and action plan
Low productive and reproductive performance
Introduction of superior breeds for upgradation
Upgrading of local cattle with Jersey by Artificial Insemination or natural service in cattle. In buffalo selective breeding
Poor performance due to imbalance feeding.
Production of feed ingredients and cultivation of fodder
Use of Concentrate feed, Hay and silage production, Formulation of ration incorporating locally available feed ingredient and fodder
High mortality of young one.
Proper management, deworming and vaccination
Feeding colostrums, preweaning management, proper deworming and vaccination against FMD, BQ, HS etc.
Inadequate Breeding Male
Maintenance of bull mother farm
Cattle and buffalo
Incidence of infectious diseases
Immunization Treatment and vaccination against FMD, BQ, HS etc
Pig Low productive and reproductive performance
Infusion of exotic germplasm
Upgrading with Exotic breeds like Hampshire, Large Black, Saddle back, Large White Yorkshire etc.
Poor performance due to imbalance feeding.
Production of feed ingredients and unconventional feeds
Use of Concentrate feed, unconventional feeds such as banan tree, cabbage, roots and tubers in open fields, garbage’s, kitchen waste or hotel waste and merra/ Juguli (Rice liquor residue)
High mortality of piglet
Proper management, deworming and vaccination
Construction of creep area, Iron supplementation, Proper management of piglet and taking strict hygienic measure. vaccination against FMD, Swine fever, HS etc
Goat Low productive and Upgradation by Selective Breeding with Black Bengal.

134
reproductive performance
Poor performance due to imbalance feeding.
Use of concentrated feed. Use of tree fodders and incorporation of locally available feed ingredients.
High mortality of kid Flushing. Supplementation of kid starter.
Poultry Low productive and reproductive performance
Introduction of dual purpose improved varieties like Vanaraja, Giriraja, Gramapriya etc
High mortality of chick
Proper brooding, Supplementation of starter ration.
Table 74: Productivity of Livestock component in Darrang District, 2007: Year Milch
Cow(L/day) Milch Buffalo (L/day)
Goat Meat (Kg/year)
Pig Meat (Kg/year)
Sheep Meat (Kg/year)
Chicken Egg (Nos. /yr.)
Duck Egg (Nos. /yr.)
Chicken and Duck Meat
(Kg/yr.)
CB Local Desi Improved Desi Improved 2007 6.00 1.00 6.50 10.0 70.0 9.5 80 175 80 150 1.6

135
Table 75: Present and Projected Milk Production in Darrang District: Year Milch Cattle Milch Buffalo GrandTotal
Production of Milk ( Lt.) (C+D)=E
Crossbred Indigenous Population Productivity
(L/day) Production (A) ( Lt.)
Population Productivity (L/day)
Production ( Lt.) (B)
(A+B)= C Population Productivity (L/day)
Production (D) (Lt.)
2007
2885 6.00 17311 84756 1.00 84756 102067 5505 6.50 35783 137850
2015
4732 6.25 29573 139000 1.00 139000 168573 6606 6.75 44592 213165
2020
6624 6.50 43057 194600 1.00 194600 237657 7432 7.00 52024 289681
2025
9274 6.75 62600 272441 1.00 272441 335041 8361 7.00 58527 393568
N.B.: Population of milch animal is considered as 20 % of total population. As per the regression equation of population from 1997 to 2007, the cattle population increased by 8.0% and buffalo population increased by 2.5 % per year.

136
Table 76: Projected Gap in Milk production in Darrang District : Year Total Milk Production ( lt.) Consumer population Requirement @ 280 ml /day
( lit) Gap ( lit)
2007
137850 941342 263575
125725
2015
213165 1129186 316172 103007
2020
289681 1298564 363598 73917
2025
393568 1493348 418137 24569
Table 77: Technical Strategies for improvement Milk Production in Darrang District: Year Milch Crossbred Cow Milch Local Milch Buffalo 2007-2015
1. Infusion of exotic Jersey,
Holstein Friesian . 2. Upgraded of local cattle with 50
% exotic inheritance along with a small herd of local cattle for conservation
3. Increased productivity from 6
1. Upgraded of local cattle with 50 % exotic
inheritance along with a small herd of local cattle for conservation and population should not increased as impact on global warming
2. Increased productivity from 0.5 lit/ per day to 2.00 lit/day.
1. Selective breeding of swamp
buffalo and Infusion of revirine buffalo and population should not increased as impact on global warming
2. Increased productivity from 6.5 lit/ per day to 7.5 lit/day.

137
lit/ per day to 8 lit/day. 4. Increased lactation period
from150 to 280 days. 5. Reduce the intercalving period
and early sexual maturity 6. Production of Feed and fodder
cultivation. 7. Proper treatment and
vaccination programme 8. HRD with sophisticated
instruments to handle with high yielding variety.
3. Production of Feed and fodder cultivation 4. Marketing facility of whole milk and milk
products 5. Increased lactation period from150 to 280
days. 6. Reduce the intercalving period and early
sexual maturity 7. Proper treatment and vaccination
programme
3. Production of Feed and fodder cultivation
4. Marketing facility of whole milk and milk products
5. Dairy Village and cluster approach for dairy development.
2015-2020
1. Infusion of exotic Jersey,
Holstein Friesian . 2. Upgraded of local cattle with
62.5 % exotic inheritance along with a small herd of local cattle for conservation
3. Increased productivity from 8 lit/ per day to 10 lit/day.
4. Reduce the intercalving period and early sexual maturity
5. Production of Feed and fodder cultivation.
6. Proper treatment and vaccination programme
7. HRD with sophisticated instruments to handle with high yielding variety.
1. Upgraded of local cattle with 50 % exotic inheritance along with a small herd of local cattle for conservation and population should not increased as impact on global warming
2. Increased productivity from 2.0 lit/ per day to 3.00 lit/day.
3. Production of Feed and fodder cultivation 4. Marketing facility of whole milk and milk
products 5. Increased lactation period from150 to 280
days. 6. Reduce the intercalving period and early
sexual maturity 7. Proper treatment and vaccination
programme
1. Selective breeding of swamp buffalo and Infusion of revirine buffalo and population should not increased as impact on global warming
2. Increased productivity from 7.5 lit/ per day to 8.5 lit/day.
3. Production of Feed and fodder cultivation
4. Marketing facility of whole milk and milk products
5. Dairy Village and cluster approach for dairy development

138
2020-2025
1. Infusion of exotic Jersey, Holstein Friesian .
2. Upgraded of local cattle with 75 % exotic inheritance along with a small herd of local cattle for conservation
3. Increased productivity from 10 lit/ per day to 12 lit/day.
4. Reduce the intercalving period and early sexual maturity
5. Production of Feed and fodder cultivation.
6. Proper treatment and vaccination programme
7. HRD with sophisticated instruments to handle with high yielding variety.
1. Upgraded of local cattle with 50 % exotic inheritance along with a small herd of local cattle for conservation and population should not increased as impact on global warming
2. Increased productivity from 2.0 lit/ per day to 3.00 lit/day.
3. Production of Feed and fodder cultivation 4. Marketing facility of whole milk and milk
products 5. Increased lactation period from150 to 280
days. 6. Reduce the intercalving period and early
sexual maturity 7. Proper treatment and vaccination
programme
1) Selective breeding of swamp buffalo and Infusion of revirine buffalo and population should not increased as impact on global warming
2) Increased productivity from 8.5 lit/ per day to 10.0 lit/day.
3) Production of Feed and fodder cultivation
4) Marketing facility of whole milk and milk products
5) Dairy Village and cluster approach for dairy development
Table 78: Present and estimated Meat Production of Meat in Darrang District from 2007 to 2025: Year Pig Goat Sheep Poultry Beef Popul
ation (Nos.)
Produ ctivity (Kg/yr)
Produ ction (Ton)
Popul ation (Nos.)
Produ ctivity (Kg/yr)
Produ ction (Ton)
Popul ation (Nos.)
Produ ctivity (Kg/yr)
Produ Ction (Ton)
Popu lation (Nos.)
Produ ctivity (Kg/yr)
Produ ction (Ton)
Popu lation (Nos.)
Produ ctivity (Kg/yr)
Produ ction (Ton)
Total (Ton)
2007 6800 70.00 476 78446 10.0 784 1950 9.5 18.5 477330 1.6 763 8000 75 600 2640 2015 11152 70.00 780 124887 10.0 1248 3167 10.00 31.6 640101 1.8 1152 8500 75 637 3850 2020 15610 70.00
1090 171095 10.0 1710 4402 10.00 44.0 1239150 1.8 2230 9000 75 675 5750
2025 21858 70.00
1530 234400 10.00 2344 6119 10.00 61.1 1827746 1.8 3290 10000 75 750 7975

139
Table 79: Present and estimated Meat Production of Darrang District from 2007 to 2025:
Requirement of Meat (@.015Kg/day)
Year Consumer population
Total(In Ton)
Total Production Deficit
2007 941342 5153 2640 2513 2015 1129186 6182 3850 2332 2020 1298564 7110 5750 1360 2025 1493348 8176 7975 201 Table 80: Year wise technical strategies for increasing Meat Production in Darrang District: Year Pig Goat Sheep Poultry Beef 2007-2010
1. Upgrading of local pig with 50 % exotic inheritance and increased pig population by 25%. 2.Increased productivity to 80 kg/year. 3.Production of Feed and use of locally avialble feed ingredients. 4.Proper treatment and
1.Selective breeding of Assam Hill Goat and Black Bengal and Increased Goat population by 25%. 2. Increased productivity to 11.00 kg/year. 3. Production of Feed and fodder cultivation . 4.Proper treatment and vaccination programme 5.Establishment of slaughter house and
1. Upgrading of indigenous sheep with 50 % pure breed inheritance and increased pig population by 25%. 2. Increased productivity to 10.50 kg/year. 3. Production of Feed and fodder cultivation . 4.Proper treatment and vaccination programme 5.Establishment of slaughter house and
1. Selective breeding of local breed and Increased poultry population by 55%. 2. Increased productivity to 1.85 kg. 3. Production of Feed ingredients 4.Proper treatment and vaccination programme 5.Establishment of
1. Upgraded of local cattle with 50 % exotic inheritance along with a small herd of local cattle for conservation and population should not increased as impact on global warming 2. Increased productivity to 80 kg/year.
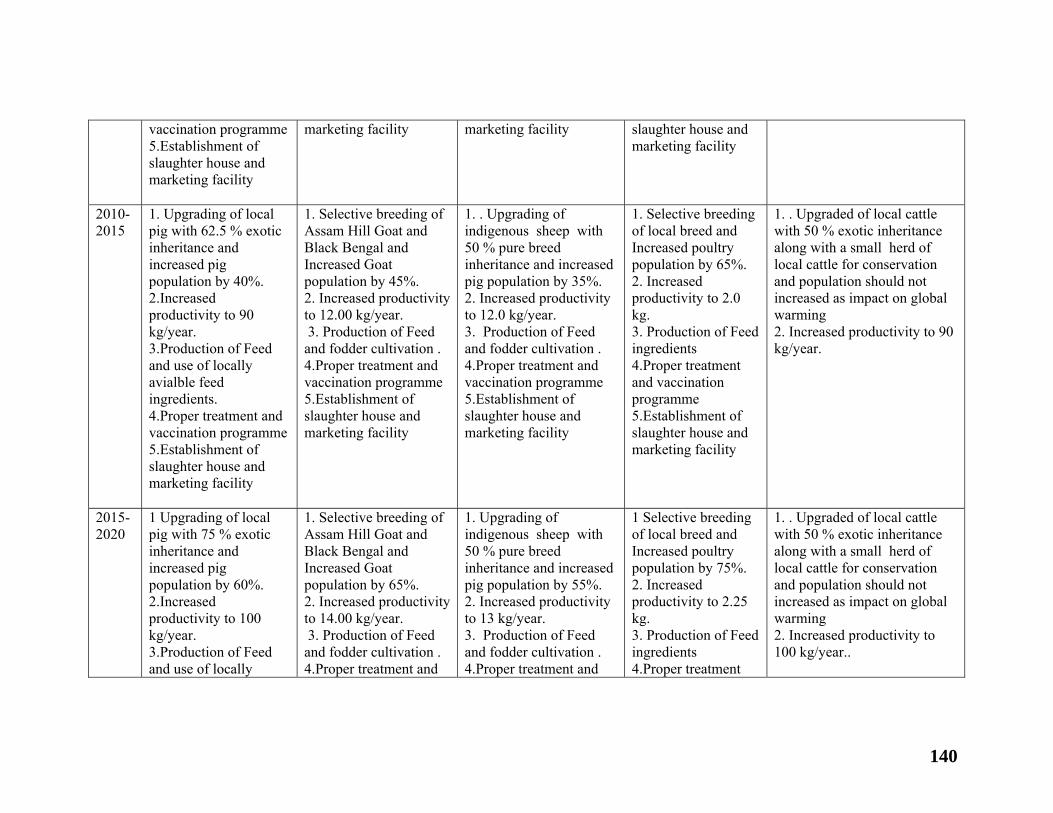
140
vaccination programme 5.Establishment of slaughter house and marketing facility
marketing facility
marketing facility
slaughter house and marketing facility
2010-2015
1. Upgrading of local pig with 62.5 % exotic inheritance and increased pig population by 40%. 2.Increased productivity to 90 kg/year. 3.Production of Feed and use of locally avialble feed ingredients. 4.Proper treatment and vaccination programme 5.Establishment of slaughter house and marketing facility
1. Selective breeding of Assam Hill Goat and Black Bengal and Increased Goat population by 45%. 2. Increased productivity to 12.00 kg/year. 3. Production of Feed and fodder cultivation . 4.Proper treatment and vaccination programme 5.Establishment of slaughter house and marketing facility
1. . Upgrading of indigenous sheep with 50 % pure breed inheritance and increased pig population by 35%. 2. Increased productivity to 12.0 kg/year. 3. Production of Feed and fodder cultivation . 4.Proper treatment and vaccination programme 5.Establishment of slaughter house and marketing facility
1. Selective breeding of local breed and Increased poultry population by 65%. 2. Increased productivity to 2.0 kg. 3. Production of Feed ingredients 4.Proper treatment and vaccination programme 5.Establishment of slaughter house and marketing facility
1. . Upgraded of local cattle with 50 % exotic inheritance along with a small herd of local cattle for conservation and population should not increased as impact on global warming 2. Increased productivity to 90 kg/year.
2015-2020
1 Upgrading of local pig with 75 % exotic inheritance and increased pig population by 60%. 2.Increased productivity to 100 kg/year. 3.Production of Feed and use of locally
1. Selective breeding of Assam Hill Goat and Black Bengal and Increased Goat population by 65%. 2. Increased productivity to 14.00 kg/year. 3. Production of Feed and fodder cultivation . 4.Proper treatment and
1. Upgrading of indigenous sheep with 50 % pure breed inheritance and increased pig population by 55%. 2. Increased productivity to 13 kg/year. 3. Production of Feed and fodder cultivation . 4.Proper treatment and
1 Selective breeding of local breed and Increased poultry population by 75%. 2. Increased productivity to 2.25 kg. 3. Production of Feed ingredients 4.Proper treatment
1. . Upgraded of local cattle with 50 % exotic inheritance along with a small herd of local cattle for conservation and population should not increased as impact on global warming 2. Increased productivity to 100 kg/year..

141
avialble feed ingredients. 4.Proper treatment and vaccination programme 5.Establishment of slaughter house and marketing facility
vaccination programme 5.Establishment of slaughter house and marketing facility
vaccination programme 5.Establishment of slaughter house and marketing facility
and vaccination programme 5.Establishment of slaughter house and marketing facility
2020-2025
1 Upgrading of local pig with 75 % exotic inheritance and increased pig population by 80%. 2.Increased productivity to 120 kg/year. 3.Production of Feed and use of locally avialble feed ingredients. 4.Proper treatment and vaccination programme 5.Establishment of slaughter house and marketing facility
1. Selective breeding of Assam Hill Goat and Black Bengal and Increased Goat population by 85%. 2. Increased productivity to 15.00 kg/year. 3. Production of Feed and fodder cultivation . 4.Proper treatment and vaccination programme 5.Establishment of slaughter house and marketing facility
1. . Upgrading of indigenous sheep with 50 % pure breed inheritance and increased pig population by 65%. 2. Increased productivity to 14 kg/year. 3. Production of Feed and fodder cultivation . 4.Proper treatment and vaccination programme 5.Establishment of slaughter house and marketing facility
1. Selective breeding of local breed and Increased poultry population by 75%. 2. Increased productivity to 2.5 kg. 3. Production of Feed ingredients 4.Proper treatment and vaccination programme 5.Establishment of slaughter house and marketing facility
1. . Upgraded of local cattle with 50 % exotic inheritance along with a small herd of local cattle for conservation and population should not increased as impact on global warming 2. Increased productivity to 120 kg/year.

142
Table 81: Present and Projected Egg Production per year scenario in Darrang District from 2007 to 2025:
Duck Fowl Year Population
(Nos.) Productivity
Production
Population
(Nos.) Productivity
Production
Total
2007
73847 80 5907760 117085 80 9366800 15274560
2010
80493 80 6439458 125281 80 10022480 16461938
2015
87737 80 7018989 134050 80 10724000 17742989
2020
95633 80 7650640 143433 80 11474640 19125280
2025
104240 80 8339200 153473 80 12277864 20617064

143
Table 82: Present and Projected Egg Production per year scenario in Darrang District from 2007 to 2025:
Duck Fowl Year Population
(Nos.) Productivity
Production
Population
(Nos.) Productivity
Production
Total
2007
73847 80 5907760 117085 80 9366800 15274560
2010
80493 80 6439458 125281 80 10022480 16461938
2015
87737 80 7018989 134050 80 10724000 17742989
2020
95633 80 7650640 143433 80 11474640 19125280
2025
104240 80 8339200 153473 80 12277864 20617064
Table 83: Present and Projected Egg Production per year scenario in Darrang District from 2007 to 2025:
Duck Fowl Year Population
(Nos.) Productivity
Production
Population
(Nos.) Productivity
Production
Total
2007
73847 80 5907760 117085 80 9366800 15274560
2010
80493 80 6439458 125281 80 10022480 16461938
2015
87737 80 7018989 134050 80 10724000 17742989
2020
95633 80 7650640 143433 80 11474640 19125280
2025
104240 80 8339200 153473 80 12277864 20617064
Table 84: Estimated Gap in Egg production in Darrang District from 2007 to 2025: Year Total Population
(In Million) Total Requirement (@180 Nos./year)
Total Production
Gap
2007
941342 169441560 15274560 -154167000
2015
1129186 203253480 17742989 -185510491
2020
1298564 233741520 19125280 -214616240
2025
1493348 268802640 20617064 -248185576

144
Table 85: Year wise technical strategies for increasing egg Production in Darrang District: Year Poultry Duck
2007-2010
1. Selective breeding of local breed and Increased poultry population by 55%. 2. Increased productivity to 125 no. 3. Production of Feed ingredients 4.Proper treatment and vaccination programme 5.Proper marketing facility 6. Establishment of Mini hatchery in each block
1. Upgrading of local duck with Khaki Campbell duck and Increased duck population by 55%. 2. Increased productivity to 100 no. 3. Production of Feed ingredients 4.Proper treatment and vaccination programme 5.Proper marketing facility 6. Establishment of Mini hatchery in each block
2010-2015
1. Selective breeding of local breed and Increased poultry population by 65%. 2. Increased productivity to135 nos. 3. Production of Feed ingredients 4.Proper treatment and vaccination programme 5. Proper marketing facility 6. Establishment of Mini hatchery in each block
1. Upgrading of local duck with Khaki Campbell duck and Increased duck population by 65%. 2. Increased productivity to 110 no. 3. Production of Feed ingredients 4.Proper treatment and vaccination programme 5.Proper marketing facility 6. Establishment of Mini hatchery in each block
2015-2020
1 Selective breeding of local breed and Increased poultry population by 75%. 2. Increased productivity to 145 nos. 3. Production of Feed ingredients 4.Proper treatment and vaccination programme 5. Proper marketing facility 6. Establishment of Mini hatchery in each block
1. Upgrading of local duck with Khaki Campbell duck and Increased duck population by 75%. 2. Increased productivity to 120 no. 3. Production of Feed ingredients 4.Proper treatment and vaccination programme 5.Proper marketing facility 6. Establishment of Mini hatchery in each block
2020-2025
1. Selective breeding of local breed and Increased poultry population by 75%. 2. Increased productivity to 165 nos. 3. Production of Feed ingredients 4.Proper treatment and vaccination programme 5. Proper marketing facility 6. Establishment of Mini hatchery in each block
1. Upgrading of local duck with Khaki Campbell duck and Increased duck population by 85%. 2. Increased productivity to 130 no. 3. Production of Feed ingredients 4.Proper treatment and vaccination programme 5.Proper marketing facility 6. Establishment of Mini hatchery in each block

145
5.19 Strategies for improvement of Livestock and Poultry
1. Establishment of Mega Seed Farm
2. Establishment of frozen semen/ embryo bank
3. Establishment of feed mill
4. Establishment of poultry breeding farm and hatchery
5. Establishment of scientific slaughter house
6. Establishment of milk processing unit
7. Establishment of diagnostic laboratory and institute of biological products
8. Marketing facility
9. Credit facilities

146
CHAPTER VI
FISHERIES SECTOR OF DARRANG DISTRICT
Vision Statement “To become a leading fish and fish seed producing district in Assam” 6.1 Introduction
Fisheries play a vital role in the rural economy of Assam. The state has been
having bountiful water resources which contribute about one twelfth of the inland
water resources. As per the estimate the gross value of the fisheries production in the
state is more than 620 crores. Fisheries also provide part/full time employment
opportunity to about 475000 fisherman population. More than 90% of the total
population of the state is fish eaters. Though district of Darrang has vast water
resources bearing immense potentiality for utilization/improvisation in the form of
capture and culture fisheries, till today, the resources are not being optimally utilized
for which there is a noticeable demand supply gap.
However, it has been observed that the fisheries productivity of the district can
be improved to many folds with a systemic approach and systemic effort in the
coming years to mitigate the gap between short supply and increasing demand. The
main objective of this study is to generate a development perspective of the district
that reflects the thinking
of diverse stakeholders,
to work out an inspiring
goal for aquaculture and
fisheries development, to
pasteurize optimal
utilization of available
resources for achieving
higher levels of livelihood, especially, for the underprivileged, to foresee needs and
level of human and infrastructure development as it emerges from collective wisdom

147
for achieving goals, to motivate people of the area and gear up all segments of
population for facing challenges, difficulties and bottlenecks to realize their cherished
goals, to act as a goal post towards which the entire planning should be oriented and
to help people of the area in developing more realistic, objective oriented, and
executable in plan periods.
Table 86: Fisheries Resource of the district:
Sl Resource Area (ha)
1 Ponds and tanks 2978.20 2 Paddy cum fish culture 160.00 3 Derilict water bodies 802.45 4 Beel fisheries 942.20 5 River fisheries 6040.00 6 Others 20.00 Total 10942.85
Table 87: AES (Agro Ecological Situation) and Development Block wise distribution of resource of the district (ha): Sl Name of the
block Covered under AES
Ponds and tanks
Beel River Paddy field
Swamps and derelict water body
Others
1 Sipajhar I, II, III 1378.42 343.40 2370.00 160.00 200.79 20.00 2 Pub
Mangaldai I, II, III 266.17 45.00 1550.00 - 114.18 -
Fig 11. Fisheries Resource of Darrang District
27%
1%7%
9%56%
0%
Ponds and tanks
Paddy cum fish culture Derilict water bodies Beel fisheries
River fisheries
Others

148
3 Dalgaon Sialmari
II 188.36 342.00 - - 115.29 -
4 Pacchim Mangaldai
II 571.67 142.50 2038.00 - 190.50 -
5 Kalaigaon I, II, IV 427.01 - - - 81.38 - 6 Bechimary I, II 146.57 69.3 82.00 - 100.31 - 2978.20 942.20 6040.00 160.00 802.45 20.00 *Source: Strategic Research and Extension Plan, 2005 by ATMA, Darrang, MANAGE, Hyderabad &AAU, Jorhat Table 88: Area, Production and Productivity of the district in comparison to national and state level:
National
State District (Darrang)
Area (ha) Producti-on (MT)
Produc-tivity
(Kg/ha)
Area (ha)
Producti-on (MT)
Produc -tivity Kg/ha)
Area (ha)
Producti-on (MT)
Produc-tivity
(Kg/ha)
78800000
4500000
57.10
364841
186314
51.06
10942
6704
61.26 Table 89: Production of fish and fish seed (2008):
Fish Seed
Fish (MT)
Spawn (lakh)
Fry and fingerling (lakh)
6704 788.9 113.32
Table 90: Requirement, Gap & Achievable production of the district in comparison to State level:
State (Assam) District (Darrang)
Production
MT
Requirement
MT
Gap
MT
Achievable production
MT
(by 2010)
Production
MT
Requirement
MT
Gap
MT
Achievable production
MT
(by 2025)
1,86,314 2,83,000 96,686 2,55,389 6,704 10308 -3604
21451

149
Table 91: Population increase trend: Sl Year Population Increase in
population % increase
1 1951 402501 2 1961 582624 180123 44.75 3 1971 834574 251905 43.22 4 1991 (20
years) 1298860 464294 55.63
5 2001 1504320 205460 15.82 50 years 159.42 N.B. Average annual increase in population is approximately 3.19%
Table 92: Expected Consumer population trend and annual requirement of fish: Sl Year Total population
expected @ 3% annual increase
Consumer Population expected i.e. 90% of total population
Annual requirement (MT) @ 30 gm fish/person/day
1 2008 1045935 941342 10308 2 2010 1091001 981901 10752 3 2015 1254651 1129186 12365 4 2020 1442849 1298564 14219 5 2025 1659276 1493348 16352
1961 1971
1991
2001
0
10
20
30
40
50
60
% IN
CR
EASE
Fig 12: Population increase trend of Darrang District

150
0 2000 4000 6000 8000
10000 12000 14000 16000 18000
Req
uire
men
t (M
T)
2008 2010 2015 2020 2025 Year
Fig 13: Yearwise fish requirement of Darrang District
Fig 14: Vision of fish requirement in Darrang District
2008 20102015
20202025
0
5000
10000
15000
20000
YEAR
REQ
UIR
EMEN
T (M
T)

151
Table 93: Information on land use pattern of Darrang district:
Forest (ha)
Sl Name of Block
Geographical area (ha)
Cultivable area (ha)
Cultivated area (ha)
Cultivable waste (ha)
Current fallow (ha) Reserved Open
Pasture Land put to non agri. use (ha)
Land under misc. plantation (ha)
1 Sipajhar
52405 36500 30632 1550 750 - 1600 1520 3343 1500
2 Pub Mangaldai
32162 21300 18438 350 400 - 0 321 2278 800
3 Dalgaon Sialmari
33061 22500 18203 550 350 - 550 530 2558 750
4 Pachim Mangaldai
18582 14525 11532 400 430 - 0 385 1360 860
5 Kalaigaon
31207 19235 17049 850 800 - 987 812 3214 2000
6 Bechimary
14967 9420 8472 400 432 - 0 349 2895 850
Total
182348 123480 104326 4100 3162 - 3137 3917 15648 6760
*Source: .Strategic Research and Extension Plan (SREP), 2005 by ATMA, Darrang, MANAGE, Hyderabad &AAU, Jorhat
.Total cultivable area under fish culture in the district is 3138.20 ha.

152
Table 94: Vision of population wise expected requirement, expected production and gap in the district: Sl Year Consumer
population Requirement per annum (MT)
Water Resource Total area under production (ha)
Production per ha. (MT)
Total production (MT)
Net Gap (MT)
Ponds and tanks 2978 1.873 5578 Beel 942 0.300 283 Paddy cum fish culture
160 0.150 24
Swamps and DWB
802 0.185 148
Rivers 6040 0.110 664 Others 20 0.350 7
2008
941342
10308
Total 10942 0.610 6704
-3604
Ponds and tanks 3097* 2.200 6813 Beel 942 0.350 330 Paddy cum fish culture
166* 0.300 50
Swamps and DWB
802 0.300 240
Rivers 6040 0.150 906 Others 20 0.400 8
2010
981901
10752
Total 11067 0.750 ** 8347
-2405
• Horizontal area increased by 4% ** Vertical production increased by 22.95%
Contd.

153
Sl Year Consumer population
Requirement per annum (MT)
Water Resource Total area under production (ha)
Production per ha.
Total production (MT)
Net Gap (MT)
Ponds and tanks 3408* 3.300 11246 Beel 942 0.600 565 Paddy cum fish culture 183* 0.800 146 Swamps and DWB 802 0.450 361 Rivers 6040 0.150 906 Others 20 0.500 10
2015
1129186
12365 Total 11395 1.160** 13234
+ 869
* Horizontal area increased by 10% ** Vertical production increased by 54.57% Ponds and tanks 3794* 4.000 14996 Beel 942 1.000 942 Paddy cum fish culture 201* 1.200 241 Swamps and DWB 802 0.500 401 Rivers 6040 0.200 1208 Others 20 0.500 10
2020
1298564
14219 Total 11799 1.510** 17798
+ 3579
* Horizontal area increased by 10% ** Vertical production increased by 30.00% Ponds and tanks 4142* 4.500 18558 Beel 942 1.000 942 Paddy cum fish culture 221* 1.500 332 Swamps and DWB 802 0.500 401 Rivers 6040 0.200 1208 Others 20 0.500 10
2025
1493348
16352 Total 12167 1.760** 21451
+ 5099
* Horizontal area increased by 10% ** Vertical production increased by 17.00%

154
Table 95: Existing farming system of the district in 3 AES:
AES I AES II AES III
Existing farming system
Dominant enterprise
Existing farming system
Dominant enterprise
Existing farming system
Dominant enterprise
Agri. +
Fishery + A.H.
Agriculture
Agri. + Horti. + Fishery
Agriculture
Agri. + Horti. +
Fishery + A.H.
Agriculture
*Source: Strategic Research and Extension Plan, 2005 by ATMA, Darrang, MANAGE, Hyderabad &AAU, Jorhat As per SREP data no fishery practice has been incorporated as existing farming system
in AES IV. Fishery, as existing farming system could not be included in the above table
though it has relevance in AES V which is presently under Udalguri district.
6.2 Constrains and intervention needed (Culture fisheries) Table 96: Priority problem: Low fish production: Sl Constrains Strategies Action plan
1 Non availability of
quality fish seed in time Timely increase of fish seed production
Exposure visit to eco hatchery owners for success stories and motivation
2 Stocking of small size fish seed in high densities
Assured availability of quality fish seed
Mobilize eco hatchery owners to produce fish seed. Technical skill up gradation through demonstration and training
3 No application or inadequate application of lime
Promote scientific fish culture
Training and demonstration to all concerned
4 No or imbalance use of organic and inorganic fertilizer
Promote use of vermicompost made from aquatic weeds
Training and technical skill up gradation for preparing vermicompost
5 No or inadequate application of supplementary feed
Promote scientific fish culture Initiate low cost diet formulation with locally available ingredients
Training and technical skill up gradation for preparing low cost diet with locally available ingredients
6 Lack of soil and water quality examination
Establishment of soil and water testing laboratory
Institutional arrangement, Appointment of “Matsya mitra”

155
6.3 Constrains and intervention needed (Capture fisheries) Table 97: Priority problem: 1. Decreasing fish production: Sl
Constrains Strategies Action plan
1 Lack of awareness
On farm/off farm training and demonstration for all concerned
Impart knowledge, motivation through demonstration, village level teaching and training programme,distribution of booklets,pamphlets,exhibition,audiovisuals made in local language
2 Lack of enforcement and legal support
Encourage watch and ward in beel, demarcation of beel boundaries, enforcement of fisheries legislation and fishing regulation
Establishment of watchman huts, survey for making beel boundary, initiating quick legal action against offenders
3 No or low stocking
Training and demonstration, stocking based on production potential of beel, selection of right species and following stocking methods
Research support for appropriate stock management, selection of species, work out production potential of beel, initiate stocking
4 Diseases Initiate prophylactic measure, treat disease and prevention measure
Initiation of research work and prophylactic measure
5 Low auto stocking
Clearing of connecting channels with the river, protection of brooders, awareness generation among fishers and planned land modification around the beel
Impart awareness through extension, legal measures, banning capture of brood fish, regulation and monitoring of beel
6 Financial constrains
Bank, Department of Fisheries and other financial institution assure financial help
NABARD, other Banks and Govt. departments to extend financial help and insurance cover for crop loss
Table 98: Priority problem: 2. Decreasing income of fishers: Sl Constrains Strategies Action plan
1 Destruction of
breeding ground
Creating awareness among fishers and related person Steps to reduce siltation
Mass awareness campaign, training to fishers, increasing contact with NGOs and Govt. agencies to initiate social forestry and steps to check soil erosion
2 Fishing of juveniles
Regulation of mesh size of fishing nets
Insisting Govt. to impose laws/code of conduct
3 Lack of extension
Establishing linkage with extension agencies (ICAR institute/alleviated SAUs/NGOs/State agencies
Organisation of meetings, issue of circulars, letters and workshops

156
Table 99: Gap in adoption of technology of spawn rising in all AES:
Sl Item of package Recommended practice
Gap in adoption
Reason for gap in adoption
Farmer proposed extension strategy
1A (i) Carp (ii) Cat fish
(iii) Prawn
Single species fish seed production in one time Specific age size brood fish for specific species
Full
Lack of awareness and knowledge
Mass awareness campaign, training to fish seed producer
B Breeding of Common Carp
Controlled breeding
Full Lack of knowledge
Impart training and in situ demonstration
2 (i) Dewatering Annually Full Lack of
knowledge Impart training
(ii) Liming Regularly before every stocking
Full Lack of knowledge
Impart training
(iii) Manuring Instant manuring
Full Lack of knowledge
Impart training and in situ demonstration
(iv) Insect control
Soap oil emulsion
Full Lack of knowledge
Impart training and in situ demonstration
(v) Spawn stocking
Single species Full Lack of knowledge
Impart training and in situ demonstration
(vi) Feeding Rice polish and Mustard oil cake
Partial Lack of knowledge
Impart training
(v) Recovery of fry
Minimum 30% Full Lack of knowledge
Impart training and in situ demonstration

157
Table 100: Gap in adoption of technology of culture fish production in all AES:
Sl Item of package
Recommended practice
Gap in adoption
Reason for gap in adoption
Farmer proposed extension strategy
Polyculture Composite fish culture
Partial Lack of commercial outlook, high cost
Motivation, Credit
Pre-stocking management practice 1
Control of aquatic weed
If less,eradicte manually
Nil
If more, use chemicals
Full Lack of knowledge
Impart training
2 Dewatering and removal of bottom mud
Once after every 3 years
Partial Lack of motivation
Awareness
3 Repeated netting
Before stocking for non drainable pond
Nil
4 Liming Application of CaO
Partial Lack of knowledge and skill
Impart training, skill upgradation through demonstration
5 Manuring Application of Raw Cowdung
Partial Lack of knowledge, non availability of input
Impart training, promote use of vermicompost made from aquatic weeds
6 Fertilization Application of urea and SSP
Partial Lack of knowledge and skill
Impart training, skill upgradation through demonstration
Stocking management 1 Size of fish
seed 4-6 inch length Full Lack of
availability, high cost
Assured availability, Credit
2 Stocking density
5000-6000 no/ha Partial Lack of knowledge, fear of loss
Impart training, assure crop insurance
3 Time of stocking
March-April Partial Timely fish seed unavailability
Assure timely fish seed availability
4 Species mix IMC and Exotic carp
Partial Lack of knowledge, quantity wise seed unavailability
Impart training, assure quantity wise seed availability
Post stocking management practice 1 Feeding Rice polish and
Mustard oil cake, green leaf/grass
Partial Lack of knowledge, high cost,
Impart training, credit, supply of seed/seedlings of

158
unavailability hybrid grass 2 Periodic
liming Monthly with CaO
Partial Lack of knowledge, lack of conviction
Impart training and on farm demonstration
3 Periodic manuring
Monthly with Raw cowdung
Partial Lack of knowledge, non availability of input
Impart training, promote use of vermicompost made from aquatic weeds
4 Periodic fertilization
Monthly with Urea and SSP
Partial Lack of knowledge, skill and conviction
Impart training and on farm demonstration
5 Prophylactic measure
During winter season with sanitizer like Sukrena WS/CIFAX etc
Full Lack of knowledge, application skill unavailability and high cost
Impart training and on farm demonstration, assure availability, credit
6 Sample netting
Monthly Partial Lack of knowledge, high cost
Impart training, credit
7 Harvesting Multiple Partial Lack of knowledge
Impart training
8 Record keeping
For all item Full Lack of knowledge, carelessness
Impart training
9 Average yield 3-3.5 MT/ha/year Below 2 MT/ha/year
Due to partial and full gap in adoption
All above
Table 101: Gap in adoption of technology of capture fish production in all AES:
Sl Item of package
Recommended practice
Gap in adoption
Reason for gap in adoption
Farmer proposed extension strategy
1 Polyculture Cage and pen
culture Full Lack of
knowledge and skill
Impart training, skill upgradation
through demonstration

159
6.4 SWOT analysis Strength General
• Rich and diversified aquaculture resources: The aquaculture resources of the district
are huge in terms of 2978 hectares of ponds and tanks and 942 hectares of beels, 802
hacters swamps and derelict water bodies, in addition to 6042 hectares of rivers, that
could be put to different fish culture practices or even culture-based capture in case of
large water sheets.
• Large number of cultivable candidate species of finfish: Being basically a carp
dominated the indigenous and exotic carps, viz., catla (Catla catla), rohu (Labeo
rohita), mrigal (Cirrhinus mrigala), silver carp (Hypophthalmichthys molitrix), grass
carp (Ctenopharyngodon idella) and common carp (Cyprinus carpio) account for bulk
of the production. Several other candidate species include L. calbasu, L. gonius, L.
bata, P. sarana, Cirrhinus cirrhosa and even the minor carps fetch high price. With
technologies available for breeding and culture of air-breathing (Clarias batrachus,
Heteropneustes fossilis) and non-air breathing catfishes (Wallago attu, Mystus
seenghala, M. aor, Pangasius pangasius), organised catfish culture could be
undertaken. The freshwater prawns, Macrobrachium rosenbergii and M. malcolmsonii
are already receiving keen attention with regard to establishment of hatchery or grow-
out systems.
• Availability of hosts of standardized technologies with different production levels and
input use: With carp culture being the main fish culture activity, different culture
systems that have been standardized with minimum achievable production rates are
composite carp culture
(4-6 t/ha/yr), weed-
based carp polyculture
(3-4 t/hayr), biogas
slurry-fed fish culture
(3-5 t/ha/yr), integrated
fish farming with
poultry, pigs, ducks,
horticulture, etc. (3-5
t/ha/yr), intensive pond
culture with
supplementary feeding and aeration (10-15 t/ha/yr), pen culture (3-5 t/ha/yr), cage

160
culture (10-15 kg/m2/yr) and running-water fish culture (50-100 t/ha/yr). Integrated fish
farming is a diversified and coordinated system of producing fish and
agricultural/livestock produce in fish farms with fish as the main component for
maximal utilization of land/water through recycling of wastes and byproducts, reduced
application of fertilizers and feeds and maintenance of a balanced ecosystem. Paddy-
cum-fish culture is a well known practice with production possibilities of about 1 tone
fish with 5-6 t paddy/ha/yr. Culture of freshwater prawns, M. rosenbergii and M.
malcolmsonii, may be adopted by farmers, as monoculture or polyculture along with
carps. With development of technology of breeding and grow-out production of catfish
like magur and singhi, there has been increasing thrust for culture of these species due
to their high market price.
• Utilization of organic wastes as primary input for freshwater aquaculture:
Aquaculture systems not only utilize the wastes as nutrient inputs, but also process and
treat a large number of wastes. It is assuming great importance in the context of total
environment management. Apart from the excreta of cattle, buffalos, pigs, poultry and
other agro-residues, domestic sewage have also been proved to be potential organic
input for freshwater aquaculture.
• Large demand-supply gap of fish and growing domestic market: The district at
present produces 6074 tones of fish as against the requirement of about 10075 tones,
thereby creating a large demand supply gap.
• Aquaculture possesses potential to form an important component in farming system:
With the marginalization of land and shrinkage of profit margins from different
agricultural avenues, necessity of integration of agriculture, animal husbandry and
aquaculture are being emphasized for optimal sharing the resources.
• Freshwater aquaculture is accepted as an important farming practice for nutritional
security, livelihood development and entrepreneurship: Freshwater aquaculture has
not only shown to be a potential farming practice for rural development but also
livelihood security. The potentiality of the farming as an industrial enterprise may be
grown in the district like Godavari-Krishna delta regions of Andhra Pradesh and Punjab
where production levels of 8-12 t/ha/yr have become a common practice.

161
Institutional
• KVK for dissemination of technologies: The KVK of the district under Assam
Agricultural University is able to disseminate the first-hand information generated by
the Research Institute to the farmers through on-campus and off-campus training.
Weaknesses
General
• Non-availability of proper database in freshwater aquaculture resources and systems:
Lack of proper database has often been main constraint in formulation of management
plans in aquaculture sector. It is necessary that a census is made for compiling primary
data on water resources, fish production levels, practicing aquaculturists and
populations dependent on the sector, marketing channels, etc. This would greatly
facilitate establishment of a proper information system on freshwater aquaculture in the
district.
• Domination of freshwater aquaculture by few fish species: Freshwater aquaculture in
the district is mainly dominated by a single group, i.e., carps. With catla, rohu and
mrigal are the three principal species; carp contributes over 90% of the freshwater
aquaculture production. Considering rich biodiversity with regard to fish species
available in the district, it is necessary to bring more species of promise into
aquaculture practices, duly considering their production potentials, consumer
preference and prices they command in the market.
• Weak linkages between research and development machineries in the freshwater
aquaculture sector: Strong linkages between research and development agencies are
prerequisites for technology development and implementation, as it is basically a
multidisciplinary activity. Considering the varied agro-ecological situation of the
district, it is necessary that suitable provisions be made for multi locational testing and
dissemination of technologies. Absence of All India Coordinated Research Projects and
Operational Research Projects in freshwater aquaculture, important mechanisms for
achieving the necessary interactions between research and development agencies, is
important missing-links in the research and development process.
• Weak extension network for transfer of technology and provision of feedback
mechanism: Weak extension has been the major huddle for aquaculture development in

162
the district. Considering the adoption gap of aquaculture technologies in different parts
of the district, it is greatly emphasized that the extension machineries of the State
Fisheries Departments are strengthened. Krishi Vigyan Kendras (Farmers’ Training
Centre) located in the districts could play a major role in not only disseminating the
technologies to the farmers, but also providing feedbacks to the researchers with regard
to field problems and indigenous technological knowledge. The other machineries like
FFDAs, NGOs, etc. could be networked to achieve desired technology dissemination
without much transmission losses.
• Non-availability leasing policy for community water bodies: It has been observed that
no uniform leasing policy exists in the district for the community beels. While some of
the water bodies for a long duration of 5-10 years, the leasing period in most cases are
only for one year. While ownership of the water bodies may rest with any of
department, fishery and aquaculture rights must rest with the State Fisheries
Departments, who need to evolve long-term leasing policies congenial for investments
in aquaculture sector.
• Social issues hindering the aquaculture development: In the district, till today,
aquaculture has been considered as a profession of socially backward community.
Integration with certain farm animals like poultry and pigs are prohibited in several
communities, hindering development process. Poaching and poisoning of fishponds
have been the persistent problems in the district.
• Inadequate infrastructure facilities and input availability: Increased governmental
investments with regard to fish and prawn hatcheries, feed mills and ancillary industries
for manufacturing aerators, feed dispensers and formulations against fish diseases have
been suggested. Strengthening marketing structure including storage facilities, ice
plants, cold chains, road and transportation in identified aquaculture areas would ensure
higher profit margins to the producers, enabling faster aquaculture development. Post-
harvest technology measures like processing and value addition would make the sector
more attractive to the investor. Establishment of Aqua-shops with facilities for soil and
water testing, disease diagnosis as also availability of material inputs like fertilizers,
feeds, medicines, literature, etc. at district levels initially and further at block levels
would greatly accelerate the freshwater aquaculture activities.
• Non-availability of adequate credit facilities: Owing to the small and marginal nature
of freshwater aquaculture resources in the form of ponds and tanks, and non-
availability of ownership rights in case community resource farmers are often deprived

163
of availing any credit facilities for procurement of critical inputs. Recent technological
advancements have transformed aquaculture to the status of industry. The investment
requirements for different projects like composite carp culture, prawn culture, and
magur culture vary greatly. It is recommended that NABARD may revise the level of
finance and the unit costs for existing fisheries projects and may include projects with
regard to recently developed technologies in the sector with due consultation with the
ICAR Fisheries Research Institutes.
• Non-Availability of aquaculture insurance schemes: Aquaculture has become a
commercial activity, resembling an industry. Considering huge investment made in the
sector, it is necessary to provide safeguards for unforeseen mishaps like floods, disease
incidence, crop failure, etc. and introduction of insurance risk coverage for a sustained
growth of the sector is desirable.
Institutional
• Lack of adequate manpower: The KVK at present has one SMS in fishery sector.
Thus, it is becoming difficult for the Institute to meet the growing demand of different
states for technological support, besides carrying out envisaged research programmes.
• Non availability of fish farm: To carry out field-based research programmes the KVK
presently has no fish farms.
Opportunities General
• Enhancement of aquaculture productivity from present district average of 1.8 t/ha/yr
to 4.5 t/ha/yr including horizontal expansion: Presently, 2978 ha of available ponds
and tanks are under utilization. Thus, it is necessary that more area be brought under
scientific farming. While production levels of over 15 t/ha/yr have been demonstrated
by Research Institutes (CIFA) and also 8-12 t/ha/yr has been common practice in
several regions of the country, the district average remains only at 1.8 t/ha/yr. It has
been envisaged that mean production of 4.5 t/ha/yr can be easily achievable with
adoption of appropriate technologies.

164
• Diversification of aquaculture practices for optimal utilization of resources: The
available derelict water bodies can be utilized for catfish farming with certain
renovation. Further, there has been a great opportunity for expansion of area for culture
of high valued
species like
freshwater prawn,
Chital and murrels
etc.
• Genetics and
Biotechnological
interventions for
stock improvement
for quality and
quantity: While intensification of farming practice has been the approach for increasing
productivity over the years, increasing input cost coupled with environmental concern
at present is prohibiting large-scale adoption of such practice. Considering the
demonstrated potential of enhancing production, intervention through genetics and
biotechnology must play great role in coming years.
• Integration of freshwater aquaculture with other farming systems: As aquaculture
utilizes wastes of different farm animals as the major input, integration with different
animal components has proved to be economically remunerative. Further,
marginalization of farm holding over the years has led to increasing adoption of such
approach of integrated farming system for effective utilization of available resources.
• Livelihood enhancement for marginally small and poor farmers and providing
nutritional security: Fish culture has been an economic enterprise having edge over
several other agricultural practices. The small and marginal ponds in the villages
dedicated mainly for the domestic and household activities, are utilized even for seed
production followed by grow-out fish culture. Besides providing livelihood option,
adoption of aquaculture practice can also meet the protein requirement of the rural
villagers.

165
Institutional
• KVK to be recognized as a lead institute for training, need based research and and
demonstration for the district: The Institute has been organizing several farmers
training programmes for the practicing farmer of the district. With the proposed
infrastructure, facilities and expertise in near future, the Institute can be a Lead Centre
for research, demonstration training and extension in different aspects of fisheries and
aquaculture in the district.
Threats General
• Unauthorized introduction of exotic fish species into culture systems: Introduced into
the district during several years back, tilapia has made its presence in almost all water
bodies of the district. In spite of all regulation, the species could not be eradicated from
the culture systems. African catfish, Clarias gariepinus, that has made its way into the
district waters through porous boundary in spite of restrictions imposed by the
Government of India, grows to over 10 kg and is known to be highly predatory and also
cannibalistic. Its possible entry into the open waters like rivers and beels can lead to
disastrous consequences on natural biodiversity. Similar is the story with regard to
unauthorized entry of bighead, Aristichthys nobilis. Though the species is not
carnivorous in nature as that of the former, it may result in threatening the fishery of
important major carp species.
• Inbreeding depression of cultivable fish species: Repeated use of same stock of major
cultivable species by our hatcheries for induced breeding has already created concern of
inbreeding depression. Unless corrective measures on intermittent stock replacement
from natural source are taken, the problem is expected to intensify further.
• Incidence of emerging diseases in freshwater culture systems: It has been shown that
many of the fish pathogens that cause sporadic mortalities or serious epizootics were
previously unknown to the region and were introduced along with exotic fish species.
With the unprecedented development of aquaculture during recent years and increased
emphasis on adoption of diversified aquaculture, there has been clandestine import of
different species from neighboring countries without any quarantine. The country is
also importing a large number of ornamental fishes, which too do not undergo through

166
strict quarantine procedure. Thus possible risks of introduction of new pathogens into
our water body cannot be ruled out.
• Several cultivable species getting endangered in open water: In the past several years
the natural ecosystem have undergone high anthropogenic interference with regards to
indiscriminate fishing, habitat destruction, degradation of water quality through
pollution, and deforestation resulting in siltation which cumulatively threatening the
fish biodiversity.
• Excessive use of chemicals and antibiotics: Use of a wide spectrum of organic and
inorganic chemicals to prevent or control the diseases is a common practice among the
fish farmers. At present, an array of wide spectrum antibiotics is used in aquaculture to
prevent or control several diseases. As most of these drugs are bacteriostatic, the
bacterial multiplications are inhibited. However, prolonged, repeated and widespread
use of these antibiotics leads to development of resistance. Use of such antibiotics,
applied either in the medium or through feed, unlike direct administration to infected
ones as in case of terrestrial animals, subjects the antibiotics administration both to
infect and healthy ones. It has been reported that the antibiotics not only affect the
physiological state and further the immune system of the animals but also result in
bioconcentration and later biomagnification in the higher trophic levels.
• Natural disasters and poaching: Natural calamities like cyclone, flood, drought etc.
and poaching has been the persistent problems in several parts of the district causing
severe loss to the aquaculture sector. Thus, contingency measures are needed taken for
effective management of the resource in case of emergency.
Institutional
• Difficulty for catering the research and extension need due to inadequate human
resource: Though the district is having a KVK for research and extension works but it
has not developed as a full flagged institution yet. Moreover, the present strength of
Subject Matter Specialist in the discipline of fishery is only one. The District Fishery
Development Office is also suffering from dearth of adequate technical manpower in
almost all six blocks for effective extension works.

167
6.5 Fish Marketing Scenario of the District The success of fish trade depends upon how efficient is the fish marketing system.
Marketing ensures direct link between the trader and the consumer. Its utility and efficacy lies
in safeguarding the interest not only the trader but of the consumer as well. It must satisfy both
of them. Also, the trader must not be allowed to feel satisfied with marginal returns, average
production and medium quality. Fish marketing here has an important role to play. It must
induce the trader to endeavour for maximum production, best quality of commodity and its
timely supply at reasonable cost. It can be achieved only when fish marketing is able to offer a
systematic encouraging market.
6.5.1 Fish and fish byproducts marketing channels:
* 1. Fishers → Consumers
** 2. Fishers→ Retailers → Consumers
** 3. Fishers→ Wholesalers → Consumers
*** 4. Fishers→ Wholesalers → Retailers → Consumers
*** 5. Fishers→Assemblers →Wholesalers → Consumers
*** 6. Fishers→Assemblers →Wholesalers → Auctioneers → Retailers → Consumers
* Less frequent channel ** Medium frequent channel *** High frequent channel
The main wholesale markets in the district are located at Mangaldai, Kharupetia and
Khandajan.
6.5.2 Normal Price sharing
Fishers: Wholesaler: Retailer = 45%: 23%: 32% 6.5.3 Characteristics 1. Fish is a perishable commodity
2. Seasonal concentration of landing
3. Small quantity produced by each fisherman
4. Non uniformity of landing
5. Involvement of large nos of intermediaries/middleman
6. Lack of infrastructure for preservation and quality control

168
6.5.4 Strategies for Fish Marketing Development in the District 1. To know when, where and what of the demand position of the consumer market
through extensive survey work.
2. To assess the demand of any one place as to its amount, kind and time with a view
to make provision of required supply
3. To regulate supply in such a way as to enable stabilization of prices in periods of
bumper landings or extremely poor landing of fish. The distribution system at all
levels has to be supervised efficiently to prevent occurrence of local artificial
scarcity and consequent price hike, as also any flooding of commodity and
consequent dangerous price fall.
4. Establishment of cold storage and ice making units and introduction of refrigerated
vans for transportation of fish in order to ensure keeping quality of fish and to
prevent losses due to wastage.
5. To keep a strict vigil on unscrupulous elements and their activities in the trade.
Middleman, cooperative societies, money lenders, hoarders and retailers engaged in
the trade to be controlled for their harmful activities or functioning.
6. Value addition in fish in general and specifically in bumper landings
7. To explore possibilities of export and import specially for ornamental fish species,
thereby to help the district earn foreign exchange and cooperate in international
trade.
6.6 Extension Strategies
The following Extension issues have been chalked out for development of fishery
sector in the district
1. Intensification and diversification of Existing Farming System
The existing farming system of the district mainly comprises
Agri/Horti/A.H/fishery. Although fish culture and capture covers a sizable area
of the district, productivity is very low as compared to research findings. Thrust
has to be given to increase the area under culture and augment productivity
considering the requirement of the district. However, no emphasis has been
given for diversification of culture practice. Air breathing fish culture, Prawn

169
culture, Pearl culture, Magur culture etc. are some of the immediate diversified
culture practices.
2. Improvement in productivity and income of existing fishery in existing farming system
The present yield gap existed between research findings and farmer’s field is
mainly due to the partial adoption of technologies developed by the researchers.
Hence, various extension ISSUES have to be taken into account to improve the
fishery productivity.
3. Sustainability of the production system
Sustainability of the production system especially in capture fisheries has been
threatened due to indiscriminate fishing, destruction of breeding ground,
siltation and encroachment of
beel etc. Hence, necessary
steps have to be chalked out
to overcome the threatened
sustainability.
4. Human Resource Development
Human resource is a prime
factor for production system.
Skill and knowledge up gradation of human chain involved in the production
system is of utmost necessary factor to increase the managerial efficiency so
that the production and quality can be increased up to a level of competition
with world aquaculture. In this regard the resource rich farmers are to be
acquainted with advanced aquaculture practice and export oriented production
while the small and marginal farmers/ woman group are to be skilled for other
activities like processing and marketing beside production to utilize their
efficiency to increase labour productivity.
5. Dovetailing and redesigning of various ongoing scheme of line department and
research institutions in the public, private and NGO
Necessary steps will have to be taken for dovetailing and redesigning of various
ongoing schemes of line department, AFDC, FISHFED etc. to improve their
utility and impact.
6. Post harvest technology and value addition
Post harvest management is an important aspect of farming system. The
necessary strategic step has to be taken to reduce post harvest loss right from
harvesting to storage and storage to marketing.

170
7. Public – Private – Partnership
To increase the efficiency of service delivery, to reduce fiscal burden and for
empowerment of farming community, necessary steps have to be taken to
encourage the public sector to come together with private sector to deliver
services that have been traditionally delivered by Govt.
8. Mechanization
Population of the district is gradually increasing day by day while the resources
are shrinking. To meet the challenge, mechanization particularly in capture
fisheries are essential to increase the production from per unit area.
9. E- fishery
Modernization of aquaculture need a standardized/comprehensive database at
district level with disaggregated data sets at district block and villages to
support building up databases and decision support system and communication
system to facilitated sustainability of resources, poverty alleviation and
empowerment women full employment, production system planning,
environmental planning, marketing planning etc.
Table 102: Extension strategies with regard to prioritized critical issues: Critical gap Extension Strategy Proposed activities
Introduction of composite fish culture in water bodies
1. Awareness camp 2. Training 3. Demonstration
Introduction of polyculture in village tanks
1. Awareness camp 2. Training 3. Demonstration
Introduction of paddy cum fish culture
1. Awareness camp 2. Training 3. Demonstration 4. Reward/incentive
Centralize production of quality fish seed
1. Formation of farmers group
2. Training 3. Reward/ incentive
Low fish production (Culture fishery)
Adoption of technology for higher fish production
1. Awareness camp 2. Training 3. Demonstration
Integrated natural resource management
1. Awareness camp Training on environment protection
Inconsistent productivity/income (Capture fishery)
Conservation of biodiversity and sustainability
1. Awareness camp 2. Training

171
6.7 Immediate Research Strategies
required
• Refinement of existing traditional
farmers technology
• Generation of package for
identification, breeding and culture
of exportable indigenous
ornamental fishes
• Improvement of technology for high quality value added product production
• Stock enhancement in capture fisheries
• Mass breeding, seed production and development of package of practices of large
catfishes like P. pangasius and Mystus spp., minor catfishes O. bimaculatus, O. pabda,
etc.
• Technology development for breeding and culture of medium and minor carps viz.,
Puntius sarana, L. fimbriatus, L. gonius, L. bata and P. pulchellus
• Organic aqua-farming and aquaculture-agriculture-livestock system development
• Use of various non-conventional feed sources and development of cost-effective diets,
feed additives, stimulants, chemo-attractants,
Table 103: Interlinkages of KVK with different Organizations with respect to Fisheries development:
Sl. No
Name of organization Nature of linkage needed for
1. Assam Agricultural University, College of Fisheries *Sources of technology *Technology transfer
2. State Department of Fisheries, Assam Fisheries Development Corporation
* Collaborative training programme * On Farm Trial (OFT) * Demonstration * Beneficiary selection * State fishery data * Implementation of central/ state scheme
3. District Fishery Development Office, District Rural Development Agency (DRDA)
* Collaborative training programme

172
* Demonstration * Beneficiary selection * District data * Resource person * Implementation of central/ state scheme
4. Panchayat and Rural Development (Block, Panchayat, Zilla Parishad)
* Training programme * Demonstration * Beneficiary selection * Primary/ secondary data * Implementation of central/ state scheme
5. Financial Institute (Public/ Private)
* Credit to the farmers * Collaborative training for
farmers, SHGs, Rural youth etc
6. NGOs, SHGs, Cooperative Societies, Professional Association etc.
* Collaborative training * Technical support and guidance to SHG
7. Doordarshan Kendra, All India Radio (AIR), Press *Wide publicity of recent technology * News coverage * Field Programme coverage * Documentation
8. State Institute of Rural Development (SIRD), National Institute of Rural development (NIRD), Indian Institute of Entrepreneurship (IIE), Extension Education Institute (EEI) etc.
* Human Resource Development * Entrepreneurship development
9. Assam State Agricultural Marketing Board (ASAMB), NEDFI, FISHFED, ATMA
* Market information * Marketing of produce * Value addition * Export promotion and funding
6.8 Ongoing fishery development Schemes Various fishery development schemes in the district are supervised and implemented by
the District Fishery Development Office, District Rural Development Agency (DRDA), Fish
Farmers Development Agency (FFDA), Assam Fishery Development Corporation (AFDC),
Agricultural Technology Management agency (ATMA) and National Bank for Agriculture and
Rural Development (NABARD). Majority of development schemes are implemented by the
District Fishery Development Office. Some of them are highlighted below.

173
1. Linked and Delinked schemes under centrally sponsored schemes of Fish Farmers
Development Agency
2. Assam Agricultural Competitiveness Project (AACP)
3. Rastriya Krishi Vikash Yojana (RKVY)
4. Assam Vikash Yojana
5. Women beneficiary oriented schemes
6. District Development Plan schemes (untied fund)
7. Derilict and water log development schemes under State Plan
8. Fisherman Welfare Scheme
The schemes stated above covers activities like training, demonstration, reclamation of
existing ponds, construction of new ponds, integrated fish farming, development of low lying
area into community tank, establishment of mini hatchery, involvement of women in fish
culture, development of beel fisheries, development of derelict water body and water log,
Supply of fishing nets, cycles and hundies to fishers etc. The beneficiaries of the schemes
contribute a minimal percentage of share of the total scheme cost while the lion share has been
contributed by the funding agency concerned with a view to develop human resource, better
productivity, better income generation and better livelihood, poverty alleviation and nutritional
security, self employment and to support a better socio economic condition of the farming
community.

174
CHAPTER VII
HOME SCIENCE
7.1 Introduction:
As the very name suggests, Home Science is concerned with the home. The perception
of a lay person is that it is a subject about home making and household chores. They are only
partly correct because the area covered by the subject of Home Science is vast and varied. It’s
scope extends far beyond the ‘home’ and is not limited to cooking, laundry, needlework and
home decoration. In fact it is the only subject which prepares young learners for the two most
important goals in their lives - looking after their home and family and preparing for a career
or vocation in life.
Today, men and women share the responsibility of a home and family equally and need
an equal amount of preparation in making the best use of the resources available to make their
lives comfortable.
7.2 Home Science means the art of managing your resources efficiently and the science of achieving a healthier, happier home and, if need be, a successful career.
The words “art” and “science” being used together in the definition given above is
because Home Science teaches the art of using things, so that a beautiful, harmonious whole is
achieved and an overall pleasant effect is created. At the same time, it gives you all the
knowledge of the scientific procedures involved in making a home beautiful. The combination
of science and art holds true in every sphere of our life like any of the following –
• the house that you live in;
• the food that you eat;
• the family that you care for;
• the resources that you use;
• the environment around you;
• the skills that can lead to a successful career.
7.3 Constituent Areas of Home Science There are five major components which are as follows-
HOME SCIENCE
Food and Resource Textiles and Human Extension and Nutrition Management Clothing Development Education

175
1. Food and Nutrition:
Good health is both an end in itself and also contributes to economic growth. Meeting
the health needs of the population requires a comprehensive and sustained approach. Our
health services should be affordable and of reasonable quality. Sub – Branches of Food and Nutrition are -
Food science Nutrition- clinical nutrition
and community nutrition Institutional food service
Food Habits:
Food habits of a region depends
on availability of food items , climatic
conditions and economic condition of the people. The Assamese food habits includes Main
course of food and Snakes.
Main course: Main course of food is Rice . With the cooked rice both vegetarian and non-vegetarian
items are consumed.Non vegetarian food includes goat, pork, chicken, duck , pigeon meat ,
fish and egg that are traditionally prepared. Fish are mainly prepared as Fish Tanga (sour
curry) which is prepared with leafy vegetables and other vegetables. Other recipes of fish like
Bhapot Diya( steamed fish), Patot Diya, Khulot Diya, Pura Mas etc. are prefered . In the
vegetarian food lots of vegetables found locally are used. The vegetables include (in Assamese
names):- "dhekia", "ponougewa", "bob-jaluk", "kosu", "bhedailata", "khutura", "kolmou",
"matikadori", "manimuni", "mohaneem", "narasingha", "mosundori", "jilmil",
"maandhaniya", "tengesi", "lai-bhabori", "morisa", "puroi", "dherua", "paleng" etc.
Moreover, from the interior part of the banana stem of a particular variety of banana plant
called Bhim Kol “Posola”, “koldil”(banana flower) are prepared . Before, due to the scarcity
of salt in Assam a strong preparation known as “Khaar” is used in every food items.
Snacks (Jalpan): Generally it can be seen that the snacks items are taken during the morning and evening
time. "Muri", "hurum", "akhoi", "chira", "sandoh", "korai guri" are the different local snack

176
items prepared from rice. It can be noted that every item has its own identity regarding its taste
and quality. The powder of rice has been used in preparation of different types of phithas or
cakes – like the "til pitha", "gheela pitha", "tel pitha", "tekeli mukhot dia pitha", "pani pitha",
"haneki pitha, "paat pitha", "bhaja pitha", "sunga pitha", "anguli diya pitha", "chitow pitha"
etc.
Strategies 1. Nutritional loss during processing of food has to be reduced .
2. Awareness is needed regarding Balanced diet .
3. Snacks items are prepared mainly of rice which can be blended with pulses and oil seeds to
enhance nutritional value .
4. National marketing avenues can be increased in snacks items by developing proper
technologies for production of items and also packaging units.
5. There is a possibility of Geographical indication in Assamese snacks items.
Adequacy of diets:
Diets of the rural people will continue to be grossly inadequate for a long time to come
unless there is phenomenal improvement in their economic status to afford an adequate diet.
The current production of milk, animal foods, vegetables, fruits, fats and oil are grossly
inadequate to meet the needs of all the population in the district according to the currently
recommended nutritional status.
As a consequence of the dietary deficiency, several nutritional deficiencies with clinical
manifestations and disabilities are encountered in the district, namely:-
1. Protein energy malnutrition among the preschool children
2. Vitamin A deficiency among children
3. Iron deficiency anemia in all groups, particularly among women, children and
pregnant women
4. Iodine deficiency – endemic goiter
5. B complex deficiency
6. Other nutritional diseases – Pellagra, fluorosis etc.
Strategies 1. Rigidity in food habits to be broken by relevant trainings and demonstrations.
2. Popularization of high energy giving products from low cost food items such as Assam
Mix
3. Low cost high energy diet planning for the different age groups in the farm family.

177
4. Making the rural women conversant in the proper storage of the different food items and
their protection from pest and insects.
5. To make the rural women aware on the various food adulterants found in the food products.
6. Home gardening or nutritional gardening to be encouraged amongst the farm families.
7.4 Human Development:
Human development refers to the biological and psychological changes that occur in
human beings between birth and the end of life, as the individual progresses from dependency
to increasing autonomy. Because these developmental changes may be strongly influenced by
genetic factors and events during prenatal life, genetics and prenatal development are usually
included as part of the study of child development. Developmental change may occur as a
result of genetically-controlled processes known as maturation, or as a result of environmental
factors and learning, but most commonly involves an interaction between the two.
Human Development consists of-
� Child welfare
� Adolescence, marriage and family guidance
� Care of the elderly
7.5 Infant Mortality Rate The Infant Mortality Rate is one of the indices to check the mortality rate amongst the
children of any particular area. The table given shows a comparison between the prevalent rate
in India as a whole and in Assam.
Table 104: Mortality Rate in Assam and in India (per thousand):
Year Rural Urban Combined Assam India Assam India Assam India
2003 70 66 35 38 67 60 2004 69 64 38 40 66 58 2005 71 64 39 40 68 58
Immunization: Table 105: Immunization Coverage under Darrang District: Year Target
Infant B.C.G. DPT-3 OPV-3 Measles TT-2 +B
2005 40031 30220 31782 32091 28883 31850 2006 37955 37269 30489 30327 29890 35176

178
Strategies to be adopted: At Birth
• Essential new born care;
• Weigh ment at birth and referral for preterm babies and neonates weighing less than 2.2
kg to institutions where paediatrician is available.
• Universal immunisation against the 6 vaccine preventable diseases.
Nutrition Interventions
• Promote exclusive breast-feeding upto 6 months;
• Introduce semi-solid supplements at 6th month;
• Screen all children to identify those with severe grades of under-nutrition and treat
them;
• Administer massive dose of vitamin A supplements as per schedule;
• Administer iron-folate supplements if needed.
7.6 Family Welfare Programme
Human development and improvement in quality of life are the ultimate objectives of
all Planning. This is to be achieved through policies and programmes aimed at promotion of
both equity and excellence. Planning takes into account the resources required for human
development and human resources available for carrying out the Plan. India, the second most
populous country in the world having a meagre 2.4% of the world's surface area sustains
16.7% of the world’s population. Realising the inevitable high population growth during the
initial phases of demographic transition and the need to accelerate the pace of the transition,
India became the first country in the world to formulate a National Family Planning
Programme in 1952, with the objective of "reducing birth rate to the extent necessary to
stabilise the population at a level consistent with requirement of national economy".
Table 106: Family Welfare Programmes in Darrang District: Year Sterilisation I.U.D.Insertion CC. Users O.P. Users
2004- 05 1998 1931 942 1287
2005- 06 499 1564 748 846

179
Strategies to be adopted: 1. Family limitation or spacing of children is necessary and desirable in order to secure better
health for the mother and better care and upbringing of children. 2. Method specific contraceptive targets to meet all the unmet needs for contraception to
reduce unwanted pregnancies. 3. Numerous vertical programmes for family planning and maternal and child health to
integrated health care for women and children. 4. Implementation of health care for women and children to reduce infant mortality 5. Predominantly women centred programmes to meet the health care needs of the family with
emphasis on involvement of men in Planned Parenthood. 6. Counselling and balanced presentation of advantages and disadvantages of all available
methods of contraception to enable the family to make the right choice. 7. Good follow up care. 7.7 The Integrated Child Development Services (ICDS) projects of the District
The Integrated Child Development Services (ICDS) Scheme today is the World’s
largest programme aimed at enhancing the health, nutrition and learning opportunities of
infants, young children (0-6 years) and their mothers. It is the foremost symbol of India’s
commitment to its children – India’s response to the challenge of providing pre-school
education on one hand and breaking the vicious cycle of malnutrition, mortality, and
morbidity, on the other.
The Scheme provides an integrated approach for converging basic services through
community-based honorary workers, viz. Anganwadi Workers and Helpers. The services are
provided at a centre called the ‘Anganwadi’ which literally means a courtyard play centre, a
childcare centre located within the village itself. The packages of services provided are:
• Supplementary nutrition,
• Immunization,
• Health check-up,
• Referral services,
• Pre-school non-formal education and
• Nutrition & health education

180
It is a centrally sponsored scheme implemented throughout the State with 100 per cent
financial assistance from the Central Government for all inputs. The table below shows detail
data on ICDS project under Darrang District.
Table 107: Detail of data on ICDS project under the Darrang District at a glance- 2007-
2008: Sl. No.
Name ICDS projects
No.s of AWC Beneficieries under SNP Status of officers & employee
Gen. BTC Total Gen. BTC Total CDPO ACDPO Sup UDA SA Aww 1. 1996-97
Kalaigaon 183 117 300 25,620 16,380 42,000 1 - 13 1 1 300
2. 1995-96 Sipajhar
189 1 190 26,460 140 26,600 1 - 8 1 1 190
3. 1981-82 Khirabari
58 192 250 8120 26800 35000 1 - 10 1 1 250
4. 1995-96 Dolgaon-Sialmari
299 31 330 41860 4340 46200 1 - 13 1 1 314
5. 2005-06 Bechimari
50 18 68 7000 5202 9520 1 - 3 - 1 68
6. 1997-98 Pub- Mangaldoi
141 22 163 19740 3080 22820 1 - 6 - 1 163
7. 2005-06 Pachim-Mangaldoi
73 - 73 10,220 - 10,220 1 - 3 - 1 73
Total 993 381 1374 13,9020 53,340 192,360 7 - 52 4 7 1358 Projects running under ICDS in the year 2008:
a) Supplementary Nutrition Programme – (0 – 6 years, children )
b) Classification of nutritional status by weight – (0 – 5 years, children)
c) Preschool education (3 – 6 years , children )
d) Health Checkup ( 0 – 6 years , children ) & (Pregnant and Lactating Women)
e) Referral Service 0 – 6 years , children ) & (Pregnant and Lactating Women)
f) Immunization (0 – 6 years , children ) & Pregnant mothers
g) Kishori Sakti Yojana (11 - 18 years ) girls
Strategies to be adopted in this sector:
1. Education on the general health status of the parents at the time of conception.
2. Health and care of mother during pregnancy, especially during the first trimester.
3. Training on the nutrition and care of the baby.

181
4. Awareness on the immunization of the mother and the child.
5. Care and management of the common childhood diseases.
6. Formation of crèches.
7. Proper training on Nutritional Grading on the basis of weight.
7.8 Textiles and Clothing: Textiles and Clothing consists of -
• Clothing construction
• Textile science
• Textile designing
• Garment designing
• Care and maintenance of clothes
Handloom and Textile Industry in the District:
The handloom industry is the most important industry in Assam with a glorious past. It
is closely associated with art and culture of the society. It is the largest cottage industry next to
agriculture in the district and plays a key role in the socio- economic life of the people.
Handloom weaving is the household activity in rural areas mostly practiced by women. Looms
are part and parcel of rural households and weaving is an integral part of rural livelihood.
However this industry has yet to be exploited commercially. Weaving is practiced as a part
time activity in the houses and is not considered as a bread winning income generation activity.
There is good demand for handloom products produced in the area especially that of woolen
shawl, Endi Chaddar (made of Eri silk), Bodo & Garo traditional garments.
Table 108: Handloom and Textiles in Darrang District:
Year Handloom Training Center
No. of trainees in Handloom
Training center
Weavers Extension service unit
Handloom Production Center
2006 6 100 5 2
2007 6 100 5 2

182
Table 109: Statistics of Handloom Demonstration circle and Weaving Activity in Darrang
District:
No. of Weavers engaged
Year No. of circle No. of Village covered
Part Time Full Time
2006 12 280 84317 5444
2007 14 280 84367 5494
7.9 Sericulture Activities:
Darrang district is traditionally associated with sericulture. Eri and Mulberry are grown
in more areas than Muga. Sipajhar area has been known for weaving as well as for sericulture.
Rearing of Eri and Mulberry worms are traditional activities of the area. Integrated system of
rearing to weaving can be seen in Balipota area of the district. Rearing of worms has taken up
by people of all community living in the district. Sericulture provides self-employment to
many men and women in the district. The product has good demand and has the potential to
take on even ‘Sualkuchi’ with proper support.

183
Table 110: Sericulture activities in Darrang: Year No. of
Seri. Vill.
No. of Farmers Engaged Total area under Silk worm Food plant(in hect.)
Yield of Cocoons Production of Silk yarn No. of spinning Charkha in no.s
Eri Muga Mulbery Eri Muga Mulbery Eri cocoons (in mts)
Muga cocoons (‘000 nos.)
Mulbery Reeling cocoon (in mts)
Eri Raw silk (in mts)
Muga cocoons (‘000nos.)
Mulbery Reeling cocoon (in mts)
2006 466 6554 115 1796 427 244 202 27 198 5.77 20.09 0.03 0.58 354
2007 475 6602 285 1792 435 252 202 21 1594 8.25 15,47 0.31 0.82 307
Table111: Sericulture Farms and Grain ages in Darrang: Year Eri Seed Grainages Mulbery Farms Basic Muga silk Farm Eri concentration centre
Total
area Area under plantation
Total area
Area under plantation
Total area
Area under plantation
Production of Muga cocoon (in nos.)
Total area
Area under plantation
Production of Eri cocoon (in kg)
2006 18.40 16.00 15.00 10.25 Nil Nil Nil 35.73 24.07 2875.00
2007 18.4 15.2 15.00 10.25 12.4 4.4 - 30.51 21.14 198.5

184
Table 112: Reeling Units in Darrang:
No. of Reeling units
No. of improved basins established
Quantity of cocoons reeled
Quantity of Raw silk
Year
Mulberry Muga Mulberry Muga Mulberry Muga Mulberry Muga2006 1 - 6 - - - - - 2007 1 - - - - - - - Table 113: Gap in Adoption and Proposed Extension Strategies for Improving
the Productivity/ Income of Eri: Sl. No.
Items of the package
Recommended practice
Existing practice
Gap in adoption (F/P/N)
Reasons for gap in adoption
Farmer proposed extension strategy
1. Name of plant used as feeding materials
Systematic Kesseru Plantation
Castor leaves
F Lack of technical knowledge
Training on package and practices
2. Rearing practices of Eri
Practices of rearingof less quantity worm for better results.
Old practices use for rearing
F Lack of technical knowledge
Training on package and practices
3. Post Cocoon technology
Spin the cocoon in motorized cum paddle Eri spinning wheel.
Cocoon are sold in the market and use pupa as food.
F Lack of technical knowledge
Training on package and practices
4. Intercultural operation
Practice of systemic plantation with ginger or brinjal as intercrop
Collect castor leave from other village as costor plantation not done
F Lack of technical knowledge
Training on package and practices
Strategies to adopted in the field of Sericulture:
1. Encouraging farmers to rear more Muga as it has already achieved
Geographical indication (GI).
2. More income can be generated by Export of Muga silk.
3. There exists vast scope to develop a special brand of cloths as
‘Chandery/ Maheswari’ of Madhya Pradesh.

185
4. Use of improved variety.
5. Introduction of Drip irrigation.
6. Production of good quality Cocoon.
7. Introduction of improved equipment for reeling.
7.10 Handicrafts:
Handicraft is an important cottage and household industry providing self
employment opportunities to supplement the earnings of the rural people. The district
has a vast scope for setting up of SSI units in the categories of agro-based, forest –
based and demand based.Forest based industries of wooden furniture and cane and
bamboo products are feasible in the district. Bomboo products like - japi and pati
making etc. are some of the handicraft activities taken up in the district.
Strategies to be adopted under Home Science in this sector: 1. Training on the basics of the family garment making.
2. Training on the basic embroidery skills and products for income generation.
3. Demonstrations on the care and maintenance of the different fabrics.
4. Selection and purchase on garments on need base of the family.
5. Formation of SHG’s with women efficient in weaving and other hand skills.
6. Training on identifying the need of the current market demand and production of
diversified products as table mats, shawls, cushion covers, bags etc. apart from
the traditional dresses.
7. Involvement of the women in the handicraft sector.
7.11 Family Resource Management: Home management is the administrative side of family living. It is the vital
factor in every family contributing to the overall health, happiness and well being of
the family. It is a valuable means for accomplishing growth and development of the
family members. Management in the family occurs at different levels. In each of these
levels, there is a demand, certain inputs of resources and varying environmental
situations affecting the use of resources.
Home Management = (Planning + Organization) + (Implementation + Controlling) + Evaluation

186
Resource Management consists of -
• Resource management • Housing and Equipment • Interior decoration • Consumer education
Resources are limited but most of the time the rural woman is unaware of all
the resources that are available at her command. As a result they often face drudgery
at different levels. There are various classifications of resources and the most of
common classifications in home management refers to human and non human
resources.
Table 114: Different human and non human resources: Family Resources
Human Resources Non Human Resources Types Examples Types Examples
Knowledge Information needed to purchase a pressure cooker
Money Income, savings , shares
Abilities Intellectual ability Material goods
Equipment, consumer goods, food, furnishing
Skills Sewing , weaving Community Self help group , women’s club
Interest Interest in interior designing
Energy Fuels , smokeless chulha
Attitude Willing to do the job Space House Energy Energy to do household
activities
Time One hour a day Common problems observed in the district:
1. Lack of decision making capability.
2. No economic security amongst the rural women.
3. Lack of awareness about the various saving schemes.
4. Lack of knowledge in budget making for running the home efficiently.
5. No scientific knowledge on work simplification techniques.
6. Lack of knowledge on organizing the different areas of the home.
Strategies to overcome the problems:
1) Motivating the rural women on the importance of decision making and encouraging them to take active part in family decision making.
2) Building awareness on the importance of family budget making with the income available.

187
3) Management of the available and alternative form of resources within the house.
4) Information dissemination on the various methods of investing in saving schemes those women can opt for.
5) Demonstrations on the various work simplification technique to be adopted at home.
6) Demonstration on organizing the different areas of the home i.e. the kitchen layout, dining room, drawing room etc.
7) Trainings on the proper cleaning and maintenance of the household equipments.
7.12 Value addition in Food products from Fruits and Vegetables:
Various products can be prepared from fruits and vegetables. Their processing
centers are shown in table.
Table 115: List of Fruits and Vegetable Processing Centre functioning in the District:
Sl. No.
Name of fruit and vegetable
Processing Centre
Year of establishment
Name of product Installation capacity
Whether F.P.O.
obtained 1 Fresh Fruit
Patharighat 2004 Squash, Jam,
Jelly, Pickles 2 mts. No
2 Sanskriti, Bordoulguri
2006 Squash, Jam, Jelly, Pickles
2mts. Yes
3 Youth Club Mahila Sakha,
Mangaldai
2008 Squash, Pickles 1mt. No
4 Neelon’s Pickle (Private company)
2007 Squash, Pickles - Yes
Strategies for increasing the value addition: 1. Training on the various methods of food preservations.
2. Dissemination of training and demonstration of the processing of fruits and
vegetables preservation.
3. Training on the packeting of the products.
4. Formation of SHGs.

188
7.13 Role of Women in Agriculture:
The women are the backbone of agricultural workforce but worldwide her
hard work has mostly been unpaid. She does the most tedious and back-breaking tasks
in agriculture, animal husbandry and homes. The research efforts have tried to relieve
her of the drudgery by providing time and labour saving tools. Vocational trainings
are also being conducted, to impart skills to undertake different avocations.
7.14 Types of health hazards faced by farm women Activities Health hazards reported • Farm activities Transplanting 50% Harvesting 26.5% • Post harvest activities Threshing 50% Drying 33% Parboiling 67% • Livestock management Shed cleaning 47% Fodder collection 23% Mulching 27.5 Improved and women friendly farm tools and equipments that need to be
popularized amongst rural farm women in the district are:
1. Seed treatment drum 2. Improved sickle 3. Hand ridger 4. Fertilizer broadcaster 5. Manual seed drill 6. Naveen dibbler 7. Rotary dibbler 8. Two row rice transplanter 9. Four row rice transplanter 10. Wheel hoe 11. Cono weeder 12. Pedal operated paddy thresher 13. Tubular maize sheller 14. Rotary maize sheller 15. Hanging type grain cleaner

189
16. Fruit harvester 17. Improved method of paddy parboiling procedures.
7.15 Extension Education Education and Extension deals with -
• Preparing home science educators
• Community services and welfare
• Non-formal Education
Activities under Extension Education (Home Science)
1. Popularization of the smokeless chulha.
2. To bring awareness amongst the rural women on safe drinking water practices.
3. To impart education in schools about health, hygiene and sanitation. 4. To promote low cost water filtration techniques using locally available
materials. 5. To educate the rural families on the harmful effects of consuming fluoride
contaminated water. 6. Popularizing the low cost latrines among the farm families.
Strategies used for empowerment
1. Development of technology kits and media mixes for promoting knowledge and
skill empowerment on various topics related to farming and household practices.
2. Development of ‘Nutriguide’ based on regional foods for food and therapeutic
purposes.
3. Establishment of nutrition garden in rural households as cost- effective solution
for micronutrient malnutrition and nutritional upliftment of rural population.
4. Development of natural dye sources for use by weavers and women entrepreneurs.
5. Organizing stimulation programme in farm creche for enhancing psycho-motar,
mental, social and emotional development of rural children and educational
interventions to rural mothers for providing conducive home environment to
children.
6. Providing supplementary feeding to infants and toddlers in farm creche for healthy
security.
7. Conducting field trials on drudgery reducing technologies for assessing ergonomic
based physiological cost and work efficiency of rural women.
8. Conducting out-reach programmes through radio and television talks; publication
of scientific articles in newspapers, magazines.

190
CHAPTER VII
PERSPECTIVE PLAN
7.1 Introduction
The KVK is the down-to-earth institutions committed to vocational
training, transfer of latest technologies, on farm research and thus, serving as the light
house for overall rural development in the district. The activities of the KVK include
technology assessment, refinement and transfer, aiming to bridge the gap between the
technology developed at the research institutions and its adoption at the field level by
the farmers through demonstration of technology/ products etc. and training of
farmers, rural youths and extension personnel. The activities of the KVK includes on
farm testing to assess and refine the technologies to develop location specific
agricultural technologies, frontline demonstration to exhibit production potential of
the technologies on the farmers field, training of farmers to update their knowledge
and skills in improved agricultural technology and training of extension personal to
orient them in the frontier areas of technology development.
7.2 Background of the KVK, Darrang:
The KVK was started during 2007 covering Darrang and Udalguri
district of North Bank Plain Zone as operational area.
7.3 Our Vision:
iii. To develop the Darrang district agriculturally self sufficient by
popularizing modern Agricultural/allied sector technologies among the
farming communities.
ii. To develop KVK, Darrang by action as a nodal centre of excellence
growing with continuous extension and farmers centric services for
socio-economic upliftment
7.4 Our Objectives: • To document the existing farming system of the district and develop
strategies for improvement. • To identify the production constraints, gap in technology and in
adoption of technology.
• To document the existing marketing pattern in the district

191
● To formulate strategies and action plan for enhancing production,
productivity and sustainability in the production system.
Table 116: Present Staff Position:
Sl. No
Sanctioned posts
Name of the Incumbent
Designation Discipline Date of joining
1
Progarmme Coordinator
Dr. T. P. Saikia
Progarmme Coordinator
Agronomy 12.11.2008
2 Subject Matter Specialist
Ms Rinku Moni Phukon
Subject Matter Specialist
Horticulture 06.11.2008
3 Subject Matter Specialist
Ms Tulika Borah
Subject Matter Specialist
Home Science 07.11.2008
4 Subject Matter Specialist
Ms Sanjukta Saikia
Subject Matter Specialist
Plant Protection 08.11.2008
5 Subject Matter Specialist
Mr Himangshu Talukdar
Subject Matter Specialist
Fishery 28.11.2008
6 Programme Assistant
Dr. Debajit Deka
Programme Assistant
Animal Science 28.02.2009
7 Programme Assistant (Computer)
Mr. Dhananjoy Mushahary
Programme Assistant (Computer)
B.Sc.(Agri) & PGDCA, PGDHR
28.11.2008
8 Farm Manager Mr. Ghana Kanta Sarma
Farm Manager Ag. Economics 16.01.2009
7.5 Infrastructure Available with KVK, Darrang:
As Darrang KVK has no permanent site so there is a huge requirement for future.
7.6 Requirement for Future:
A. Infrastructure development:
• Exhibition Hall (ATIC Type)
• Development of small scale preservation and processing unit
• Bio-fertilizer and bio-pesticide production unit
• Library
• Farmers Call Centre
• Mobile Clinical Van
• Community Radio Station
• Vehicle.
• Audio-Visual and Lap top facility

192
• More nos. of Computer
• Mist house, Shade house and Nursery unit
• Provision for Polyhouse
• Provision of staff quarter
• Water supply and irrigation system
• Electricity provision
• Godown and threshing floor
• Farm Lab
• Farm Machinery and implement shed
• Sale Counter
• Display and Demonstration unit
B. Human Resource Development
• Training of KVK personnel
• Exposure visit of KVK personnel to developed KVK
• Exposure visit to advanced country
C. Manpower Requirement:
• Appointment in vacant post of SMS, LDA cum Stenographer and Driver
• Appointment of regular field workers
D. Proposed Demonstration unit under KVK:
• For Technology Demonstration
7.7 Action Plan for Instructional farm of KVK:
Seed Production
Planting Material Production.
Crop Cafeteria.
Farm Beautification with ornamental and avenue trees.
Cattle, Buffalo, Goat, Pig , Poultry and Duck and Fish seed production
7.8 Major Thrust Areas, Technological and Training needs:
A. Thrust Areas:
1. Increasing cropping intensity
2. Increasing area under HYV/improved variety
3. Introduction of high value crop
4. Application of INM and IPM

193
5. Easy marketing facility
6. Identification of indigenous ornamental fishes
7. Integrated fish culture
8. Quality fish seed production
9. Pen & Cage culture in Beels
10. Post harvest technology & value addition
11. Increase the production of milk, meat & egg
12. Infusion of exotic germplasm for upgrading
13. Formulation of low cost ration
14. Protection of society from zoonotic diseases
15. Awareness on health, hygiene & sanitation
16. Improvement of Home/Nutritional garden
17. Reduction of nutritional deficiency
18. Diet planning for the different age groups
B. Technological Needs:
Agriculture:
• Technology for Bio control of Potato tuber moth, Rice weevil.
• Standardization of cultivation of wild edible mushroom.
• Short duration wheat varieties.
• Technology for Organic vegetable cultivation.
• Medium duration Boro Rice varieties.
• Reclamation of silt deposited soil.
• Cold tolerant Boro Rice variety.
• Acid tolerant pulse crop variety.
• Low cost efficient weed management practices in Jute.
• Scientific retting technique
• Efficient IPM for different vegetable crops.
• Establishment of medium scale processing unit.
• Establishment of seed village
Animal Husbandry:
• Genetic improvement of indigenous livestock and poultry
• Production of feed ingredients and cultivation of fodder

194
• Production of frozen semen and embryo
• Development of diagnostic kit and vaccine against infectious diseases
Fishery Science:
• Breeding and propagation of indigenous ornamental fish
• Diversification of culture practice
• Freshwater prawn culture
• Low cost feed formulation
Home Science
• Establishment of Farm Cretch in villages
• Introduction of drudgery reducing household and agricultural science
• Introduction of “Nutriguides” for nutritional gardening
• Natural dye for fabrics
C. Training needs Agriculture:
1. Nutrient Management
2. Cropping System
3. Integrated Farming system
4. Water Management
5. Fodder production.
6. Integrated crop management
7. Production of Organic inputs
8. Integrated Pest management.
9. Disease Management
10. Bio-control of pests and diseases.
11. Post harvest technology
12. Grading, Packaging and storing of field crops and horticultural crops.
Horticulture:
1. Off-season vegetables.
2. Protective cultivation (Green house, Shade house etc.)
3. Plant propagation techniques.
4. Production and Management technology in potato.
5. Processing and value addition.

195
Fishery:
1. Scientific composite fish culture
2. Integrated fish culture like paddy cum fish culture, pig cum fish culture,
poultry cum fish culture, duck cum fish culture
3. Pen and cage culture in beels
4. Breeding and hatchery management
5. Concept of quality fish seed and scientific fish seed raising
6. Community based fishery management
7. Fish processing and value addition
Animal Husbandry:
1. Scientific breeding, housing, feeding and health management of Cattle.
2. Scientific breeding, housing, feeding and health management of Buffalo.
3. Scientific breeding, housing, feeding and health management of Pig.
4. Scientific breeding, housing, feeding and health management of Sheep and
Goat
5. Scientific management of commercial Poultry farming
6. Production of quality animal products.
7. Fodder production and preservation
7.9 Focus area of the KVK, Darrang:
1. Development of district database and preparation of action plan accordingly.
2. Identification of farmer’s need and areas for training through Participatory Rural
Appraisal (PRA) and focus Group Discussion.
3. Planning and conduct production oriented need based long and short duration on
and off campus training.
4. Developing and maintaining farm and demonstration unit on scientific lines to
facilitate work experience to the trainees and also to put a showcase of latest
technological know how.
5. Developing and organizing non-formal education programme by way of field
days, farm visits, farmers fair, radio talk, film show etc.
6. Gap analysis of different farming system and developing methods for improving
existing farming system.
7. Collecting feedback from the farmers and extension personnel
8. Planning and conducting on farm testing to assess the technologies in farmers’
situation in the district and refine it, if required.

196
9. Demonstrating new and improved technologies to the farmers as well as to the
extension workers directly in the farmers’ field with their active participation for
promotion and large-scale adoption.
10. Development and publication of need based literatures, newsletter, leaflets,
pamphlets etc in local languages.
11. Organizing Farm Science Club in Rural Schools and Villages to introduce liking
and interest for agriculture and allied sciences in younger generation.
12. Infrastructure development like library, training hall, demonstration units,
Internet, water harvesting structure, soil testing laboratory, green and polyhouse,
seed and planting material production.
13. Developing and promoting small village organizations like SHG, Farmers Interest
Groups (FIGs), Kissan Club etc.
7.10 Road Map of KVK, Darrang:
• Benchmark survey of the district and documentation of existing traditional
farming system practices, production technologies and cropping system.
• Natural and Human Resource Mapping.
• Identification and validation of the potential farming system of the district and
finding the technological gap, reasons for the gap in adoption and
technological intervention that can be initiated
• Identification of production system, cropping pattern and crops suitable for
various micro climatic conditions.
• Survey to be undertaken for analysis of the training needs of the farmers.
• Documentation of the traditional tools and implements of the district and
identifying the scope for farm mechanization
• Trials and demonstration of high yielding and disease resistant crop varieties
for increasing the agricultural productivity in the district.
• Establishment of nurseries for production of quality seeds and planting
materials.
• Development of Integrated Farming System Model for the district.
• Post harvest processing and value addition in important commodities.
• Promotion of local entrepreneurs for agriculture and allied sector enterprise
and creating marketing channels and credit linkages.

197
• Dissemination of Improved production technology of fish to the farmers.
• Development & Introduction of Improved Breed/ variety of milch cow, pig,
goat & poultry suitable for agro climatic condition of Assam.
• Tapping of Indigenous know how technology for developing sustainable
agriculture.
• Documentation of success stories and creating role models amongst the
farming community.
• Knowledge and skill up gradation of farmers through training.
• Credit linkage of farmers to financial institutes.
7.11 Linkages of KVK, Darrang with Other Institutions and Organizations:
• Research centers of AAU and ICAR Institutions:
• State Development Departments: State Department of Agriculture,
Horticulture, Animal Husbandry and Vety, Fishery, Sericulture, Soil and
Water Conservation, Forestry, Handloom and Textiles, Agril Engineering,
Panchayat and Rural Development etc.
• Financial Institutions: Public/Private
• Agencies: ATMA, NSC, SIRD, DRDA, CDPO, EEI, etc
• Organizations: NGOs, SHGs, Cooperative Societies, Growers Societies,
Professional Association etc
• Input Dealer/ Manufacturers/ Entrepreneurs
• Media: AIR, Doordarshan Kendra, Newspaper, Magazine etc
• District Administration
*************************************************************