
CHAPTER 9 Testing a Claim
15
The Practice of Statistics, 5th Edition Starnes, Tabor, Yates, Moore Bedford Freeman Worth Publishers CHAPTER 9 Testing a Claim 9.1 Significance Tests: The Basics
-
Upload
khangminh22 -
Category
Documents
-
view
3 -
download
0
Transcript of CHAPTER 9 Testing a Claim
The Practice of Statistics, 5th Edition
Starnes, Tabor, Yates, Moore
Bedford Freeman Worth Publishers
CHAPTER 9Testing a Claim
9.1
Significance Tests:
The Basics
Learning Objectives
After this section, you should be able to:
The Practice of Statistics, 5th Edition 2
STATE the null and alternative hypotheses for a significance test
about a population parameter.
INTERPRET a P-value in context.
DETERMINE whether the results of a study are statistically
significant and MAKE an appropriate conclusion using a
significance level.
INTERPRET a Type I and a Type II error in context and GIVE a
consequence of each.
Significance Tests: The Basics
The Practice of Statistics, 5th Edition 3
Introduction
Confidence intervals are one of the two most common types of
statistical inference. Use a confidence interval when your goal is to
estimate a population parameter.
The second common type of inference, called significance tests, has a
different goal: to assess the evidence provided by data about some
claim concerning a population.
A significance test is a formal procedure for comparing observed data
with a claim (also called a hypothesis) whose truth we want to assess.
The claim is a statement about a parameter, like the population
proportion p or the population mean µ. We express the results of a
significance test in terms of a probability that measures how well the
data and the claim agree.

The Practice of Statistics, 5th Edition 4
Activity: I’m a Great Free-Throw Shooter!
A basketball player claims to
make 80% of the free throws
that he attempts. We think he
might be exaggerating. To test
this claim, we’ll ask him to shoot
some free throws—virtually—
using The Reasoning of a
Statistical Test applet at the
book’s Web site.
1. Launch the applet.
2. Set the applet to take 25 shots. Click “Shoot.” Record how many
of the 25 shots the player makes.
3. Click “Shoot” again for 25 more shots. Repeat until you are
convinced either that the player makes less than 80% of his
shots or that the player’s claim is true.
4. Click “Show true probability.” Were you correct?
The Practice of Statistics, 5th Edition 5
Stating Hypotheses
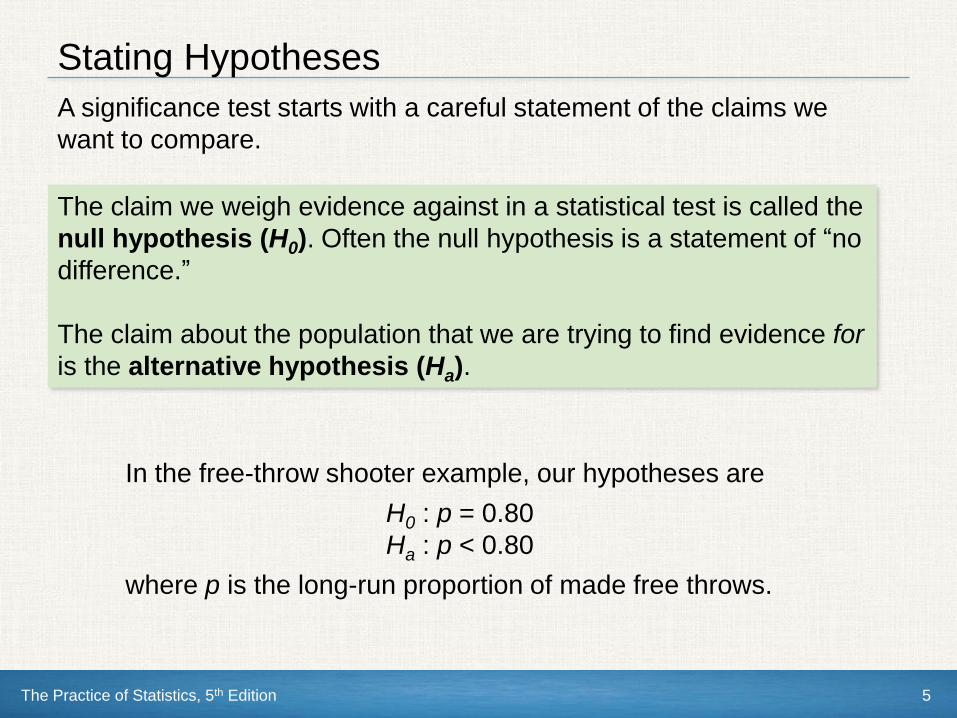
A significance test starts with a careful statement of the claims we
want to compare.
The claim we weigh evidence against in a statistical test is called the
null hypothesis (H0). Often the null hypothesis is a statement of “no
difference.”
The claim about the population that we are trying to find evidence for
is the alternative hypothesis (Ha).
In the free-throw shooter example, our hypotheses are
H0 : p = 0.80
Ha : p < 0.80
where p is the long-run proportion of made free throws.
The Practice of Statistics, 5th Edition 6
Stating Hypotheses
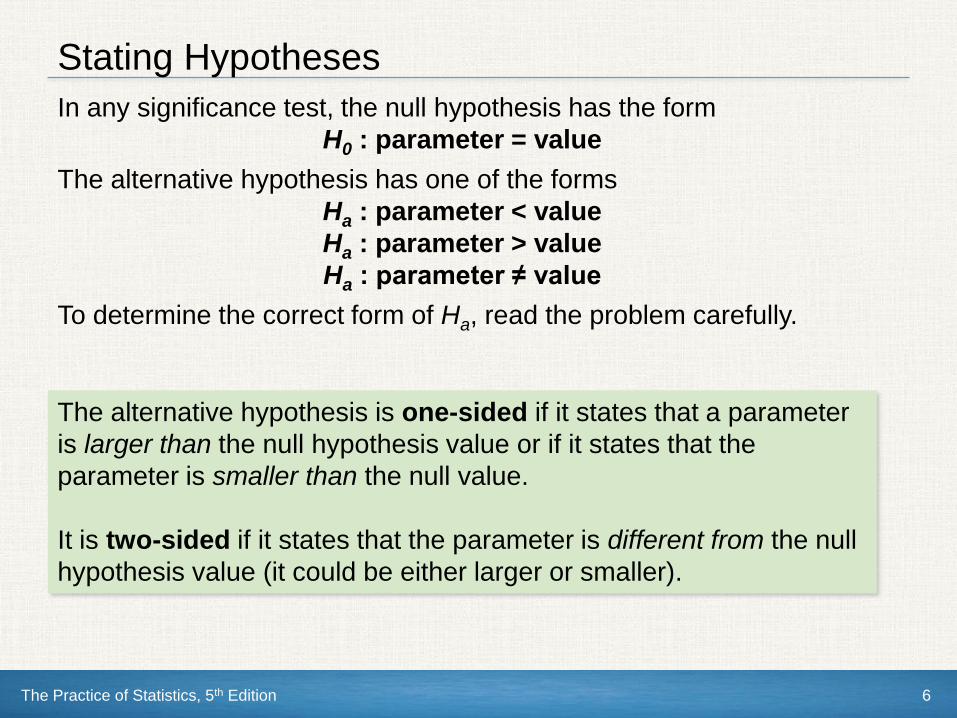
In any significance test, the null hypothesis has the form
H0 : parameter = value
The alternative hypothesis has one of the forms
Ha : parameter < value
Ha : parameter > value
Ha : parameter ≠ value
To determine the correct form of Ha, read the problem carefully.
The alternative hypothesis is one-sided if it states that a parameter
is larger than the null hypothesis value or if it states that the
parameter is smaller than the null value.
It is two-sided if it states that the parameter is different from the null
hypothesis value (it could be either larger or smaller).
The Practice of Statistics, 5th Edition 7
Stating Hypotheses
The hypotheses should express the hopes or suspicions we have
before we see the data. It is cheating to look at the data first and
then frame hypotheses to fit what the data show.
Hypotheses always refer to a population, not to a sample. Be
sure to state H0 and Ha in terms of population parameters.
It is never correct to write a hypothesis about a sample statistic,
such as
ˆ p = 0.64 or x = 85.
The Practice of Statistics, 5th Edition 8
The Reasoning of Significance Tests
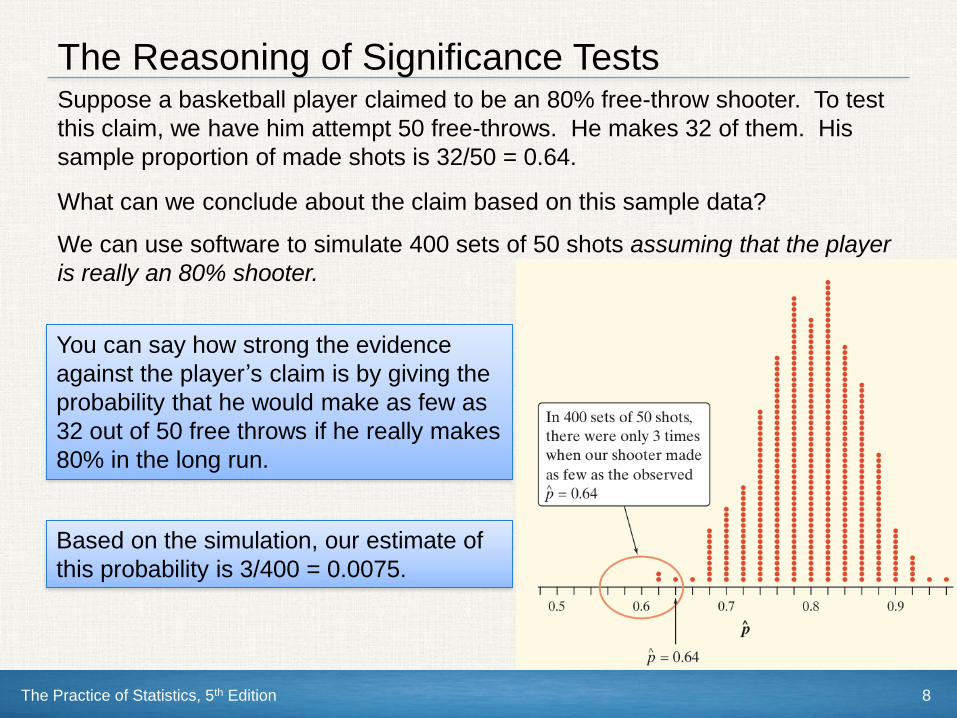
We can use software to simulate 400 sets of 50 shots assuming that the player
is really an 80% shooter.
You can say how strong the evidence
against the player’s claim is by giving the
probability that he would make as few as
32 out of 50 free throws if he really makes
80% in the long run.
Suppose a basketball player claimed to be an 80% free-throw shooter. To test
this claim, we have him attempt 50 free-throws. He makes 32 of them. His
sample proportion of made shots is 32/50 = 0.64.
What can we conclude about the claim based on this sample data?
Based on the simulation, our estimate of
this probability is 3/400 = 0.0075.
The Practice of Statistics, 5th Edition 9
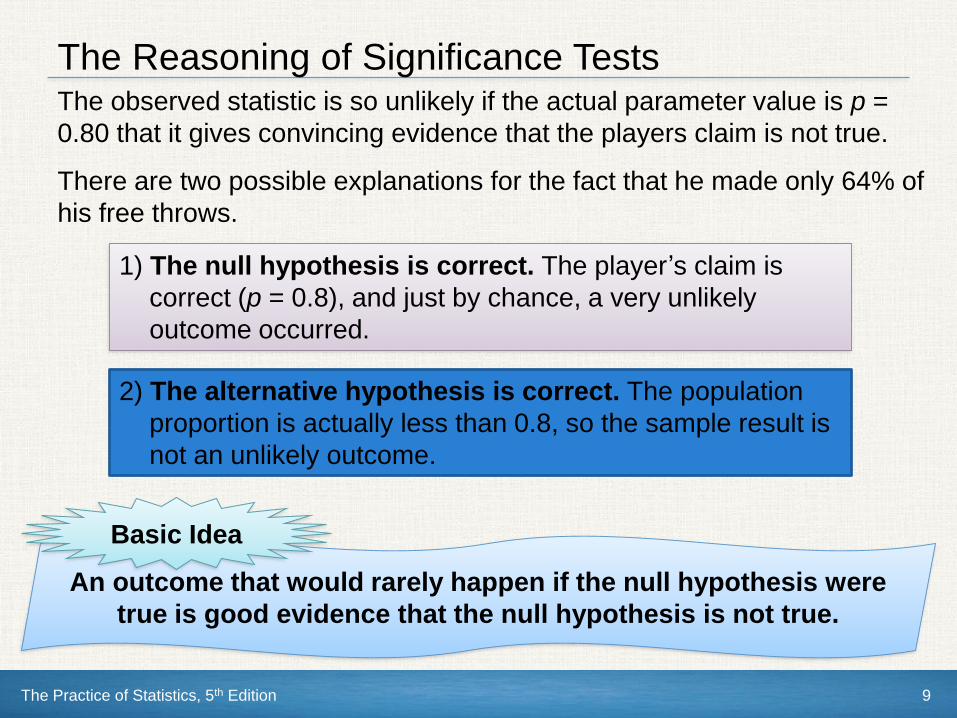
The Reasoning of Significance TestsThe observed statistic is so unlikely if the actual parameter value is p =
0.80 that it gives convincing evidence that the players claim is not true.
There are two possible explanations for the fact that he made only 64% of
his free throws.
1) The null hypothesis is correct. The player’s claim is
correct (p = 0.8), and just by chance, a very unlikely
outcome occurred.
2) The alternative hypothesis is correct. The population
proportion is actually less than 0.8, so the sample result is
not an unlikely outcome.
An outcome that would rarely happen if the null hypothesis were
true is good evidence that the null hypothesis is not true.
Basic Idea
The Practice of Statistics, 5th Edition 10
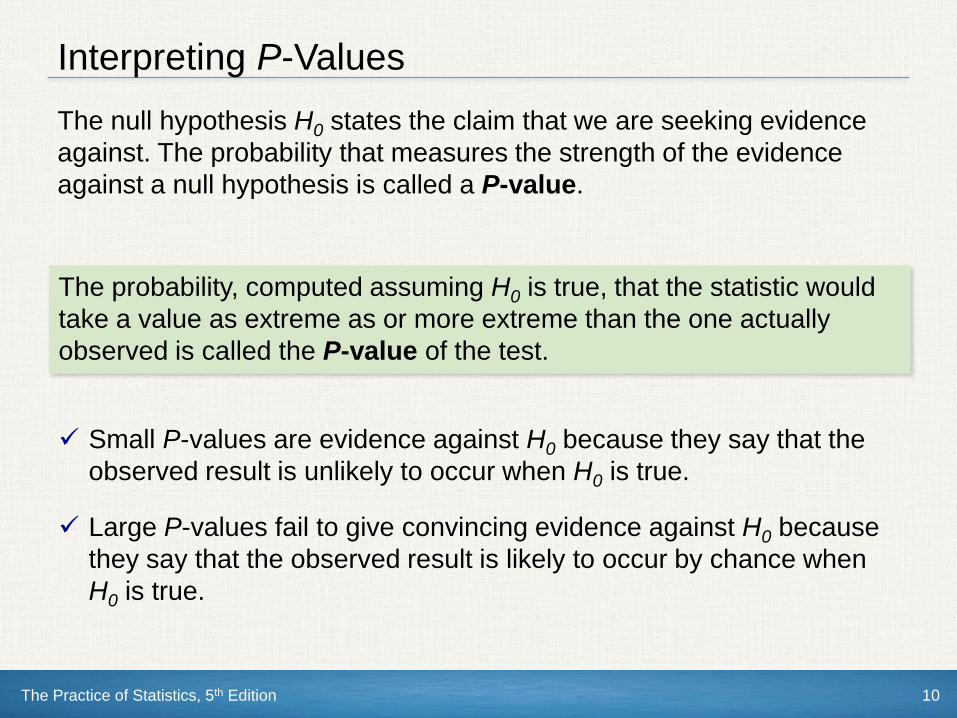
Interpreting P-Values
The null hypothesis H0 states the claim that we are seeking evidence
against. The probability that measures the strength of the evidence
against a null hypothesis is called a P-value.
The probability, computed assuming H0 is true, that the statistic would
take a value as extreme as or more extreme than the one actually
observed is called the P-value of the test.
Small P-values are evidence against H0 because they say that the
observed result is unlikely to occur when H0 is true.
Large P-values fail to give convincing evidence against H0 because
they say that the observed result is likely to occur by chance when
H0 is true.
The Practice of Statistics, 5th Edition 11
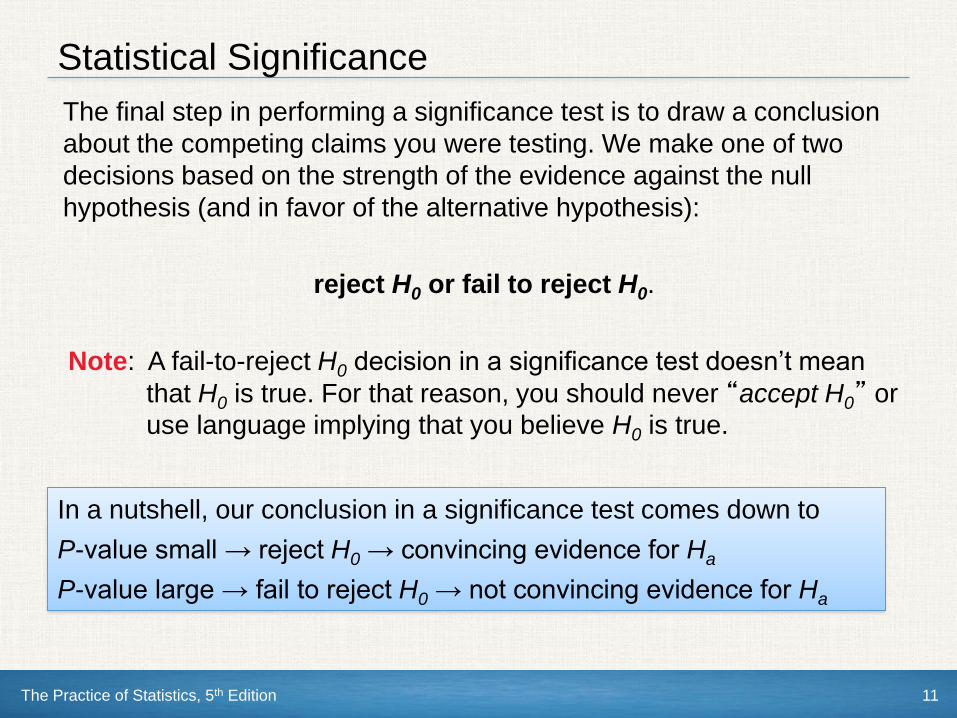
Statistical Significance
The final step in performing a significance test is to draw a conclusion
about the competing claims you were testing. We make one of two
decisions based on the strength of the evidence against the null
hypothesis (and in favor of the alternative hypothesis):
reject H0 or fail to reject H0.
Note: A fail-to-reject H0 decision in a significance test doesn’t mean
that H0 is true. For that reason, you should never “accept H0” or
use language implying that you believe H0 is true.
In a nutshell, our conclusion in a significance test comes down to
P-value small → reject H0 → convincing evidence for Ha
P-value large → fail to reject H0 → not convincing evidence for Ha

The Practice of Statistics, 5th Edition 12
Statistical Significance
There is no rule for how small a P-value we should require in order to
reject H0. But we can compare the P-value with a fixed value that we
regard as decisive, called the significance level. We write it as , the
Greek letter alpha.
When we use a fixed level of significance to draw a conclusion in a
significance test,
P-value < α → reject H0 → convincing evidence for Ha
P-value ≥ α → fail to reject H0 → not convincing evidence for Ha
If the P-value is smaller than alpha, we say that the data are statistically significant at level α. In that case, we reject the null
hypothesis H0 and conclude that there is convincing evidence in favor
of the alternative hypothesis Ha.
The Practice of Statistics, 5th Edition 13
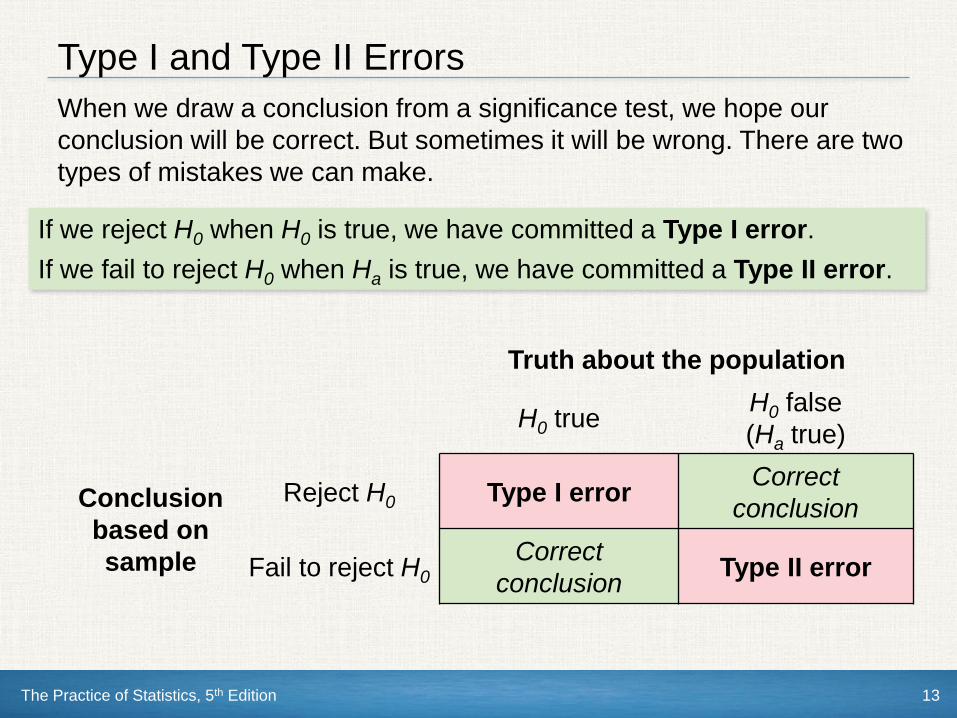
Type I and Type II Errors
When we draw a conclusion from a significance test, we hope our
conclusion will be correct. But sometimes it will be wrong. There are two
types of mistakes we can make.
If we reject H0 when H0 is true, we have committed a Type I error.
If we fail to reject H0 when Ha is true, we have committed a Type II error.
Truth about the population
H0 trueH0 false
(Ha true)
Conclusion
based on
sample
Reject H0 Type I errorCorrect
conclusion
Fail to reject H0
Correct
conclusionType II error
The Practice of Statistics, 5th Edition 14
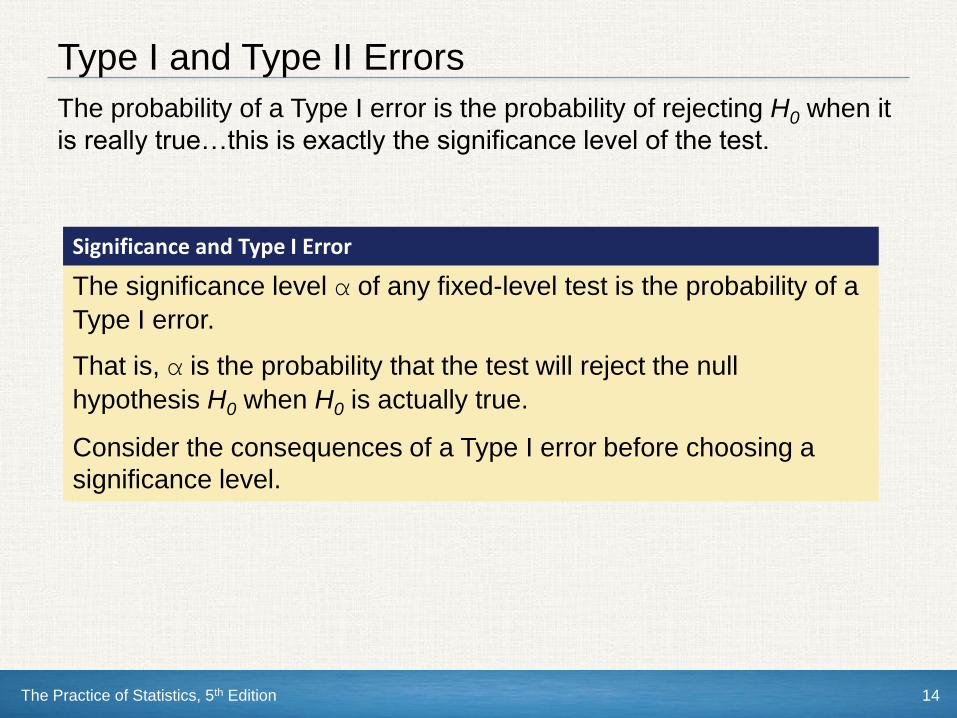
Type I and Type II Errors
The probability of a Type I error is the probability of rejecting H0 when it
is really true…this is exactly the significance level of the test.
Significance and Type I Error
The significance level α of any fixed-level test is the probability of a
Type I error.
That is, α is the probability that the test will reject the null
hypothesis H0 when H0 is actually true.
Consider the consequences of a Type I error before choosing a
significance level.
Section Summary
In this section, we learned how to…
The Practice of Statistics, 5th Edition 15
STATE the null and alternative hypotheses for a significance test
about a population parameter.
INTERPRET a P-value in context.
DETERMINE whether the results of a study are statistically significant
and MAKE an appropriate conclusion using a significance level.
INTERPRET a Type I and a Type II error in context and GIVE a
consequence of each.
Significance Tests: The Basics