
AV toQ3g$9 9 - CiteSeerX
167
ARL 647-109 AV toQ3g$9 9 AN EXPERIMENTAL STUDY OF INFRA-RED SCATTERING BY CLOUDS OF PARTICLES T. J. LOVE R. A. WHEASLER ' ' SCHOOL OF AEROSPACE AND MECHANICAL ENGINEERING UNIVERSITY OF OKLAHOMA NORMAN, OKLAHOMA JUNE 1964 Reproduced From Best Available Copy Contract AF 33(657)-8859 Project 7063 Task 7063-03 AEROSPACE RESEARCH LABORATORIES OFFICE OF AEROSPACE RESEARCH UNITED STATES AIR FORCE WRIGHT-PATTERSON AIR FORCE BASE, OHIO
-
Upload
khangminh22 -
Category
Documents
-
view
0 -
download
0
Transcript of AV toQ3g$9 9 - CiteSeerX

ARL 647-109 AV toQ3g$9 9
AN EXPERIMENTAL STUDY OF INFRA-REDSCATTERING BY CLOUDS OF PARTICLES
T. J. LOVER. A. WHEASLER ' '
SCHOOL OF AEROSPACE AND MECHANICAL ENGINEERINGUNIVERSITY OF OKLAHOMA
NORMAN, OKLAHOMA
JUNE 1964
Reproduced FromBest Available Copy
Contract AF 33(657)-8859Project 7063
Task 7063-03
AEROSPACE RESEARCH LABORATORIESOFFICE OF AEROSPACE RESEARCH
UNITED STATES AIR FORCEWRIGHT-PATTERSON AIR FORCE BASE, OHIO

Ma t .,-Alt 6
NOTICES
When Government draiinsgs, specifications, or other (Lata are used for any iirpose other than inconnection with a definitely related Government procurement operation, the United States Governmentihereby incurs no responsibi!ity nor any obligation whatsrwver; and the fact that the G(overnment mayhave formulated, furnished, or in any way supplied the said drawings. sl*ecifications, or other data, Isnot to be regarded by implication or otherwise as in any manner licensing the holder or any otherperson or corporation, or conveyimig any rights or permission to manufacture, use. or sell any patentedinventicn that may in any way he related thereto.
Quali~ed requesters may obtain copies of this report from the Defense Documentation Center, (DDC),Cameron Station, Alexandria, Virginia.
This report has been released to the Office of Technical Services, U. S. Department of Commerce,Washington 25, D. C. for sale to the general public.
Stock available at OTS $ 3.. 0 ..............
Copies of ARL Technical Documentary Reports should not be returned to Aerospace ResearchLaboratories unless return is required by security considerations, contiactual ohligations or notices ona specific document.
S00 - July 1964 - 1•2-47-95S

FOREWORD
The work reported herein was performed by the University ofOklahoma, School of Aerospace and Mechanical Engineering and the Uni-versity of Oklahoma Research Institute, Norman, Oklahoma under AirForce Contract AF 33(657)-8859, Project 7063, Task 7063-03, spo'soredby the Thermo-Mechanics Branch, Aerospace Research Laboratories, Office,f Aerospace Research,,-United States Air Force.
In addition to the authors listed a special notc should be madeof the efforts of Mr. J. H. Ingram and Mr. Han-Min Hsia. Mr. Ingramwas responsible for the early work on the development of the particlegenerator and Mr. Hsia assisted in the experimental phases and thereduction of the data.
Mr. Paul Schreiber, Aeronautical Research Laboratories served asthe monitoring scientist. His interest, critical reviews and helpfulsuggestions are greatly appreciated.
This is an interim technical report for work performed beginningJanuary 1963 and ending January 1964. ARL 63-3 was a previous interimreport on this project covering work accomplished prior to January1963.
The experimental equipment utilized for this study was purchasedunder the National Science Foundation Grant No. GP36O.
li

ABSTRACT
This report describes a study of the extinction and scatteringof infra-red radiation from an aerosol of fine particles. A descrip-tion is given of the method developed for generation of a uniformoptically thin cloud of particles. Reynolds aluminum 40XD powder wasused for this test. The optical equipment including glo-bar source,focusing optics, traversing mechanism and Perkin Elmer model 98moncchromator is described. The extinction coefficient and normalizedscattering function is reported for 21 wave lengths of incident radia-tion.
iii

TABLE OF CONTENTS
PAGE
SECTION P
I INTRODUCTION
II DESCRIPTION OF EQUIPMENT 6
III RESULTS AND CONCLUSIONS 73
IV REFERENCES 77
V APPENDICES 9o
iv

LIST OF ILLUSTRATIONS
FIGURE PAGE
1 Plan view szema-tic of e..iipment 8
2 Radiation scattering equipment. View 1 9
3 Radiation scattering equipment. View 2 10
4 Schematic--scanning disc speed reduction mechanismand clutch 11
5 Radiation scattering equipment. View 3 12
6 Optical layout 14
7 Monochromator optical layout 16
8 Monochromator calibration curve 18
9 Schematic of air system 22
10 Schematic--particle generator and feed-mechanism 23
11 Particle generator. Exploded view 24
12 Particle generator and feed mechanism 25
13 Microscopic view of particles--4OOX 30
14 Particle analysis equipment 31
15 Percent attentuation variation with media density 48
16-36 Angular distribution of scattering function--experimental data 49-69
37 Variation of. with wave length 70
38 Mass scattering coefficient with wave length 71
39 Variation of mass extinction with wave length 72
40-46 Angular distrtbuti-on of scattering function--theoretical data 128-134
47 Experimental data. Angular distribution ofintensity--2.0.M 135
48 Experimental data. Angular distribution ofintensity--2.5Y 136
V
LIST OF ILLUSTRATIONS--Continued
FIGURE PAGE
49 Experimental data. Angular distribution of
intensity--3 O J 137
50 Experimental data. Angular distribution ofintensity--3 •5 138
51 Experimental data. Angular distribution of
i-ntensity--41 .0) 139
52 Experimental data. Angular distribution ofIntensity--4.• 5j140
53 Experimental data. Angular distribution of
intensity--5.0 M 141
54 Experimental data. Extinction--3.0O. 142
55 Experimental data. Extinction--3.5)l 1+3
56 Experimental data. Extinction--12.03A 144
vi

LIST OF TABLES
TABLE PAGE
I Angular distribution of scattering function,Scons (0') based on experimental data 90-115
II Integrated axially-symmetric scattering functionsfor discrete positions and wave lengths (A) basedon experimeanJt-data 116-1 19
4-III i IJJ~ (~J~ for discrete positions of
incident ray and wave lengths (X)--based onexperimental data 120
IV Oil (Based on AO = 100) for discrete positionsof incident ray and wave length 122,123
V Numerically integrated axially-symmetric scatter-ing function for discrete positions and sizeparameter (•)--based on theoretical data sphericalparticles, refractive index 1.6 124912541
VI I ,jjc for' discrete positions of
incident ray and particle size parameter (oc)--based on theoretical data spherical particles,refractive index = 1.6 126
vii

SECTION I
INTRODUCTION
The study of radiation heat transfer in absorbing, emitting andscattering media was initiated by an analytical study of systems ofparticles bounded by infinite plane diffuse walls. The results ofthis study are reported in Aeroaautical Research Laboratories reportnumber ARL63-3. The analysis assumed plane parallel systems of uni-fort spherical particles. The refractive index of the particles wasassumed known and constant for all wave lengths. Cases of isothermalclouds of particles rnd radiative equilibrium were considered.
In many situations of engineering interest, the particles willbe neither spherical, uniform nor isothermal. In addition, informa-tLon on the complex refractive index of mo.t materials is ratherscarce. The purpose--a--the present investigation is to develop amethod of determining the necessary scattering functions and ex-tinction coefficients of clouds of particles. Such determinationswould thus allow the previous analysis to be applied to systems com-posed of these particles.
Analytical prediction of the scattering parameters of typicaldusts would be impractical. Not only would the mathematical ex-tension of Mie theory to irregular particles of mixed sizes be dif-ficult, but, it is often impossible to accurately usscribe the par-ticle size and shape as well as the refractive index for all wavelengths of radiation. The study described in this report is there-fore concerned primarily with the development of a method of ex-perimental determination of these parameters.
There is no unique design for a light scattering device, and nosuch devices are offered on the market. It is the responsibility ofeach investigator to use his ingenuity and experience to custom-build or fashion a device that will perform to meet the criteriawhich have been established. The intended use of the data will dic-tate, for the most part, the design of the instrument. It is forthis reasor. that a literature survey, per se, is not presented. In-stead, only a few comments from some of the literature that has beensurveyed will be presented, while additional notes will be attachedas an appendage for those interested in the vast number of applica-tions for light scattering experiments or the uses of light scatter-ing for experimental work.
Although a search of the literature did not produce a design oflight scattering equipment which could be used in this investigationto determine the scattering function for an aerosol of irregularshaped particles, much information can be gained from previous work inlight scattering measurements.
Manuscript released January 31, '964 by the authors for publica-tion as an ARL Technical Documentary Report.
- - -~

Through the efforts of Gustav Mie the electromagnetic wavetheories had been fairly well developed by 1908; however, very littleexperimental work in light scattering was done prior to World War II.Interest in colloids, with a great need to develop techniques whichwould accurately determine particle size and particle concentrations,provided the stimulus needed to recognize the versatile tool avail-able in light scattering measurements. Work on aerosols for the Of-fice of Scientific Research and Development by LaMer and Sinclair inthe years 1940-42 undoubtedly helped to provide this stimulus. Theirwork was published as an OSRD report which appeared in part in vari-ous scientific journals during the postwar years.
LaMer and Barnes (89) were among the first, if not the first, toconfirm experimentally the general theories of Rayleigh and Mie, par-ticularly Mie. For this reason some detail of their work will bepresented here, whereas other contributions will not be noted at thistime. This should not be construed to mean that this was the mostsignificant contribution to the field, however. The first problemthey encountered, prior to their experiments to confirm the electro-magnetic wave theory of the scattering of light of transparentspheres, was the development of a method for comparison of sols witha 1i.gh degree of uniformity of particle size as a base for funda-mental measurements for checking theory and calibrating methods.They were successful in preparing a mono-dispersed sol of differentparticle sizes. Prior to their success it was difficult to obtaincolloidal and macromolecular systems of a well-defined and fairlyuniform particle size. It is believed by some (150) that this wasthe reason for the lag in experimental work, togethe~r with the factthat dimensions on colloidal systems and their molecular weights wasnot considered important until the early 19 40's. Along with thiscontribution they developed a device (2) which enabled them to makelight scattering measurements on hydrophobic colloidal dispersions ofa sulfur sol using light in the visible range; i.e., wave lengths0.37 to 0.85 microns. A Coleman double monochromator Model 10-S wasused for monochromatic light transmittance measurements. Theirmeasurements were alternated between distilled water and a dispersiontube containing the sulfur sol. Their data were corrected for varia-tions in readings (explained as bein& due to settling and redissolvingof particles), by taking readings in rapid succession at specifiedpoints and using these specified points to adjust the cu-ves. Thecurves which they plotted were total scattering versus wave length(in water). Reproducibility was reported to be good. The sols con-tained spheres or at least seemed to under the ultra-microscope. Itwas in this early work that the experimenters noticed scatteringminimum which shifted to longer wave lengths with larger particlesizes. This.is ontrfthe earliest reports where researchers, orexperimenters, reported the influence of superposition. Considerablevariation or irregularity of curves was noted, including secondarymaxima not before reported, which became increasingly apparent andmore pronounced with more homogeneous particle sizes, although prac-tically absent in heterogeneous sols. Smooth total scattering curvesresulted when heterogeneous sols were used. These sols were preparedby adding a solution of sulfur in acetone to water and were observed
2

by ultra-microscopic examination. The presence of a few secondarymaxima in total scattering had been considered previously, at leasttheoretically, by Lowen. Their method of determining particle radiusand refractive index as a result of plotting their data was ratherunique.
It is interesting to note that early experimenters (90) usinglight scattering measurements as a tool recognized the need for astandardization of symbolism, yet some twenty years later no progressseems to have been made toward this end.
DeVore and Pfund (29) made use of the Mie minimum observed intotal scattering measurements for their work on dielectric powdersof zinc sulfide and ti*anium dioxide. Using the changing of positionof the Mie minimum with variation of refractive index, they were ableto develop methods for measuring the refractive indices of somepowders of uniform particle size. Henry (66) found in his investi-gation that the transmission of powder films in the infra-red regionhad spectral transmission curves considerably different from thoseof the same material in bulk form.
The majority of investigations seeking to confirm the Mie andRayleigh theories have been successful; however, great care must beexercised in developing equipment necessary to make such measure-ments. The theories, in general, have been accepted as fact and con-firmed experimentally. Little work, however, has been done to con-firm the Mie theory for regions of large size parameters (alpha) (22),probably due to the difficulty involved in producing suitable dis-tributions of uniform scattering particles of large sizes. LaMer wasvery successful in confirming the region for alpha from 2 to 13.Cleveland and Raymond (22) were evidently the first to make measure-ments of integrated scattering by metallic spheres; however, theirresults were obtained from layers of particles rather than from anaerosol. A Perkin-Elmer Model 12A Spectrometer was used for theirmeasurements and the slit width was varied to maintain full deflec-tion on the chart; consequently, the angle of reception also variedfor measurements of different wave lengths, which is contrary to theconstant angle of reception used in the present investigation. Usinga sodium chloride prism, their investigation covered a wave lengthrange of 0.45 to 15 microns, which would extend the low side of theuseful range of the sodium chloride prism to such an extent that oneshould be skeptical of the results. Curves of scattering area coef-ficient as a function of size parameter (alpha) were presented. Sincea hetero-disperse system was being investigated, the particle sizeparameter was necessarily based on an average particle size. Conse-quently, Cleveland and Raymond were faced with the same dilemma asthe authors of this investigation in that any comparison of experi-mental work on poly-disperse systems with the theoretical work of Mierequires that an average or pseudo particle size be used.
Much of the work published on light scattering measurements hasattempted to verify the theories of Mie and Rayleigh or, acceptingthese theories as fact, to determine particle size distributions of
3

colloids, particle concentrations, and/or refractive indices of sub-stances. Since the particle size parameter can be varied by varyingthe size of the particle, it is no wonder that most investirationshave been made using white light and that very little work has beendone in the infra-red region.
Considerable effort is required on the part of the investigatorto obtain exact numerical solutions to the Mie equations, and forthis reason results of electronic computer calculations have beenpublished in tables to minimize the work required to obtain answers.The tables of Chu, Clark, and Churchill (17)(21), and Gumprecht.andSliepcevich (47) are particularly noteworthy and were used to obtainsolutions to the Mie equations for a few cases reported in this in-vestigation.
In order to establish a well-founded background and understand-ing of the electromagnetic wave theory, most experiments and analysesreported in the literature have necessarily been for mono-dispersesystems; consequently, little is reported on poly-disperse systems.Numerous works by Heller and his co-workers have appeared in theliterature over the past fifteen years. Their theoretical analysesand experimental confirmations of the Mie theory are probably themost extensive and complete of any work published to date. Obviously,few systems found in nature are mono-disperse. It is for this reason,as pointed out in the introduction, that the experimental work forpoly-disperse systems is being extended as in this investigation.The experimental approach is obvious since, except for certain specialcases, no suitable solutions exist for non-spherical particles.
Light scattering measurements on poly-disperse systems have beenmade by the astrophysicist and meteorologist. The nephelometer andthe transmissometer are two devices used for measuring light scatter-ing and transmission of the atmosphere (124) which usually utilize aphoto-multiplier detector.
It is of particular interest to this investigation to cite theworks published by Pritchard et al (124), and Gibbon et al (41), ontheir investigations of light scattering and transmissions throughatmospheres. These papers further support the conclusionis of thisinvestigation that angular distribution of intensity curves for sys-tems containing particles of non-uniform size and distributions willbe smooth functions.
This investigation succeeded in obtaining the scattering func-tion for an aluminum oxide powder dispersed in air for 21 values ofwave length. In addition, the investigation produced the mass scat-tering coefficient and the mass extinction coefficient for the samemedia.
Considerablreattention was given to the design of the apparatusfor measuring the mass scattering coefficient, the mass extinctioncoefficient, and the scattering function for the real substance, sothat the values obtained would be valid for optically thin media.
4~

Single scattering phenomena was considered since radiant heat trans-
fer in scattering and absorbing media that is optically thin is of
primary interest for the present-day heat transfer analysis.

SECTION II
DESCRIPTION OF EQUIPMENT
The physical arrangement of the apparatus used to measure theangular distribution of intensity was a result of several compromisesinvolved in cost, versatility and utility. Several configurationswere studied before a proposed final design was considered acceptable.
Prior to the initiation of the design the literature was sur-veyed to ascertain whether or not there was a configuration that wastypical for this purpose. It was soon concluded that there was nostandard design available for measurements of this kind and that a de-vice would have to be custom-made to meet the criteria establishedfor this investigation. The problem was approached by first consid-ering the objectives for which the apparatus was being designed; i.e.,establishing a criteria for the design. In f(ilowing this approachthe end result may. appear to be somewhat unorthodox for this type ofapparatus. The objective was to develop a device which would measurethe angular distribution of intensity or "scattered" radiation from a"cloud" of particles which had been irradiated by a ray of energy.It was desirable to measure the angular distribution of intensitythrough a range of 180 degrees, that is from = 00 (forward scatter-ing) toe3 =1800 (backward scattering), with the angle 9 being de-fined as that angle between the direction of the scattered energy andthe direction of the incident ray. Continuous angular scanning wasconsidered more desirable than the less acceptable method of obtain-ing intensity readings at discrete angles. The "cloud" of particleswas to. be irradiated with monochromatic energy, or a device would bedesigndd to measure the monochromatic intensity of the scatteredradiation from the "cloud." The "cloud" of particles was not to besuspended in a cell, tube, or container that would introduce ex-traneous cell reflections or require the scattered light to traversemedia with different refractive indices, since it was desirable tomeasure the scattered intensity of particles nf irregular shape andsize dispersed in air. Also, since "single scattering" phenomena wasbeing investigated, it would be necessary to construct a particlegenerator that would provide a "cloud," or what might be called anaerosol, of f'inely dispersed particles. It was vitally importantthat the design provide for the following: Uniform distribution ofparticles supplied continuously for the period of time required totake measurements, controlled density, and the ability to reproduceconditions consistently. It was also recognized that it would benecessary to collect the particles through the use of some suitabledevice, if a continuously moving cloud were considered, and either todiscard the particles or reclaim them. To extend the versatility ofthe apparatus to include extinction measurements, it would be neces-sary to find some method of determining the density of the "cloud."
With the criteria established, a configuration was visualized,and after many compromises the design was formalized. In presentinga description of the apparatus, a general description will be givenfirst, which will be followed by more intricate design details of thecomponent parts.
6

GENERAL DESCRIPTION OF APPARATUS
Aluminum oxide particles of irregular shape and size were dis-persed in an air stream by a suitably-designed generator to form apoly-dispersed system of fluidized particles (See Schematic of Parti-cle Generator Design). These particles were injected vertically,under air pressure, through a highly-polished tube 0.375 inch indiameter, forming a column of fluidized particles bounded by the am-bient air (free stream). The relatively low differential pressurebetween the mainstream and the bounding surfaces, plus the kineticenergy of stream, were zufficient to permit the column of fluidizedparticles to remain essentially cylindrical for approximately 0.6-inch beyond the exit of the tube before diverging or "fanning out."It was this cylindrical region near the exit of the tube that con-stituted the specimen area. The stream tube was positioned concen-trically through a 1-1/2-inch hole located in the center of a 36-inch rotating platform-,,- on which was located a glo-bar source andsource optics. The source optics consisted of a spherical mirrorpositioned with one of its foci on the glo-bar and the other on thespecimen (See Figures 1, 2 and 3). The circular platform served asa pulley in the speed reduction mechanism which allowed the glo-barsource to be rotated at a constant speed in a horizontal plane whilemaintatning the focus of the incident ray on the specimen area. Thescattered intensity was received by the optics located adjacent tothe rotating platform and focused on the slits of a double-passmonochromator which permitted selective wave lngth detection of thescattered radiation. The monochromatic scattered intensity was de-tected by a thermocouple, amplified, and recorded on a strip chart.The fluidized particles being ejected from the tube were collectedby a "bell-mouth" attached to a vacuum hose, and the waste particleswere discarded. The bell-mouth device also housed the filters,screens and retaine#rs used to collect the particles for weighing,which was necessary in particle-density determination.
ROTATING PLATFORM
A 36-inch diameter, 3/8-inch thick aluminum disc was mounted ona central hub which rotated freely on a close-tolerance ball-bearingmount. The disc and mount were designed with a 1-1/2-inch hole inthe center to permit centering of the fluidized particle tube in thedisc and to allow the mounting of the particle generator in a verticalposition in a convenient location beneath the test bench. The discwas provided with a 150 off-axis slot, 10-inches long and 3/ 4 -inchwide, which allowed flexibility in focusing the glo-bar source on thespecimen for several arrangements of optics. A 1/2-inch V-type beltwas attached in an inverted position to the circumference of the discwith machine screws (See Figure 4). The disc served as one wheel ofthe speed-reduction mechanism which controlled the specimen scanningrate. The driving motor was a Master gear-head motor, Model 104530,1/8 HP, Type RA, manufactured by the Master Electric Company, Dayton,Ohio. The output shaft RPM was L.9. The disc was belt-driventhrough a pulley reduction system, the arrangement and details ofwhich can be seen in Figures 3 and 4. With this reduction system the
7

J 4
Z 0
0 94
0
0
ble
-U,

I0.
0Cz1
'4S
fGU
U2
0
0N
S
4-
9

N
S
4S
ad
0�
S
U2
0
S34
10

41
mu:41
I~ I!ZesS
~~-4-
am
ILI

dii
rt 14
ol4
disc (source platform) rotated at a constant speed of 0.0595 RPM;consequently, 8.4 minutes were required to scan the specimen through180 degrees. For this experiment only one scanning speed was used;however, the scanning speed could have been varied without difficultyby changing pulley sizes. Since a reversible gear head motor was notavailable, the speed reduction mechanism was provided ."th a clutch-ing arrangement which allowed manual movement of the disc to any de-sired position. The manual control was realized through a simplespring load clutch (See Figure 4).
OPTICAL SYSTEM
Two optical systems were considered for this investigation. Thefirst system made use of two 267-mm. focal length, 180 off-axis para-bolic mirrors. One off-axis mirror was focused on the glo-bar sourceprovided for the irradiation of the fluidized column of particleswith a collimated beam of energy. The second off-axis mirror, whichwas used to collect the intensity scattered from the column of par-ticles, was then focused onto the slits of the monochromator. Thisoptical arrangement did not prove satisfactory since the collimatedbeam of energy directed onto the specimen area was not of sufficientintensity to detect adequately the intensity scattered by the parti-cles. This difficulty could be alleviated with a source of higherintensity than that provided by the glo-bar; however, this was notfeasible in this investigation. Therefore, an alternate system wasused which proved to be quite satisfactory.
The physical arrangement of optics for the alternate system canbest be understood by referring to Figure 6. In this system a 13.9-cm. focal length, 7.9-cm. diameter spherical mirror was used to focusthe glo-bar source onto the specimen area. An image of the glo-barsource 0.977-cm. (0.385 in.) in width and 3.01-cm. (1.875 in.) inheight was projected onto the specimen region. Thus, the column offluidized particles-was irradiated by a rather intense beam of energyof width approximately equal to the width (0.952 cm.) of the particlecolumn. The source optics were mounted on the rotating platform asdescribed in the previous section. A second spherical mirror with a27.94-cm. focal length was positioned with one of its foci located atthe center of the specimen region and the other reflected by a planemirror onto the slits of the monochromator. The section of thecolumn of fluidized particles (specimen region) which was "seen" bythe monochromator slits was an area O.264-cm. wide and 0.91-cm. high.It can, therefore, be visualized that the region of the specimen as"seen" by the detection device can be considered as being constantfor all directions of angular measurement; i.e., for all measurementsof the angular distribution of intensity scattered by the particlesan equal region ofkthespecimen section was considered.
In order that the monochromator slits would not "see" the speci-men region except through the reflections dictated-by the arrangementof the mirrors, an opaque non-reflecting surface was placed in thedirect line of sight.
13

- V4zo
14.
All mirrors used in the optical system were front surface alumi-nized, of high quality, to minimize optical imperfections. Allmirror mounts were designed to give wide latitude in adjustment.
MONOCHROMATOR
The monochromator used for this experiment was a Perkin-ElmerModel 99, single-beam, double-pass, instrument. The path followed bythe radiant energy through the monochromator may be best understoodby referring to the optical schematic, Figure 7. The infra-red-radiation beam focused on the slit S-I was collimated by the off-axisparaboloid M-3, and a parallel beam traversed the NaCi prism P for afirst refraction, Path 1, after which it was reflected by theLittrow mirror M-4 through the prism for a second refraction andfocused by the paraboloid at the corner mirror M-6 through the mirrorM-5, Path 2. The radiation, after being chopped, was reflected againby mirror M-5 to the paraboloid along Path 3 and again traversed theprism and was reflected back along Path 4 for reflection by M-7 andbrought to a focus in a spectrum falling across the exit slit S-2.The exit slit passed only chopped radiation of a narrow wave lengthrange whose band width depended on the slit width S-2 and whose mid-band wave length depended on the Littrow angle setting. The bandwidth which passed through slit S-2 was focused by plane mirror M-8onto spherical mirror M-9 and then onto the thermocouple T-C. Sincethe energy focused by the ellipsoid mirror M-9 onto the thermocouplewas chopped, a pulsating signal was produced. The purpose in choppingthe energy was to produce an AC voltage at the thermocouple which wasproportional to the radiant power, or intensity, of the beam. It wasthis signal that was amplified and recorded by the electronic po-tentiometer. Since the wave length band falling across slit S-2 de-pended on the Littrow angle setting, the wave length reaching thedetector could be controlled by rotation of the Littrow mirror. Con-sequently, a wave length con trol could be manually operated whichcould detect monochromatic radiant energy of a known wave length.One of the advantages of the double-pass monochromator was that thescattered light which is normally present after a single pass (due todust and optical imperfections) was dispersed out of the path by thesecond pass in the same manner as it would be with a double mono-chromator. The NaCl prism instrument was used in this instance be-cause of its greater range and simplicity, even though the dispersioncould have been obtained by a diffraction grating, which in generalwould give higher dispersions than a prism instrument but which hadthe disadvantage of being usable only over a short spectral range.The usable range for a sodium chloride prism was between 0.2 to 17microns; however, the manufacturer recommended a range between 2 and15 microns. The long wave length limit was set by prism absorption,whereas the shorter wave length was limited by experimental circum-stances such, as lght-s-esdttering or limited dispersion. One of thechief disadvantages of the sodium chloride prism was its poor resist-ance to water vapor, which required that particular attention begiven to the instrument to protect it from a humid atmosphere.
15

NI
4
Figure 7
Moriochromator Optical Layout

Consequently, a heater was provided to aid in drying the atmospheresurrounding the prism at all times. In addition silica gel crystals(a mild dessicant) were kept in a container within the monochromatoras a further aid in protecting the sodium chloride prism.
To supplement the wave length calibration curve supplied by themanufacturer, a calibration curve (Figure 6) was made for the instru-ment used in this experiment. The calibration was made using a sam-ple of polystyrene in the atmosphere, with additional points of cali-bration being obtained by "running the spectra" for an atmospherethat included the 15-micron water vapor region, the 6-micron watervapor region, and the CO2 absorption band. A total of 8 polystyrenepoints, 5 CO2 wave lengths including the CO2 doublet, and 8 wavelengths in the 6-micron region were located, giving a total of 21wave lengths which were defiritely identified and from which a cali-bration curve could be drawn. The calibration curve for the mono-chromator used in this experiment is included in the appendix, to-gether with a tabulation of the specific wave length identified inthe calibration. This calibration was repeated on three differentoccasions on three different days, and the three calibration curveswere identical. Therefore, the calibration curve obtained was con-sidered acceptable. The spectra obtained for this calibration arenot included in this report but are on file at the EngineeringCollege, University of Oklahoma, Norman, Oklanoma.
THE INFRA-RED SOURCE
The ideal infra-red source is a black body radiator. Thenearest approximation to the ideal source is a heated cavity. How-ever, these are very difficult to build, and the energy requirementsPre usually quite high. The most common source is the so-calledglo-bar, which is a silicon carbide rod. Sometimes a Nernst Glower,which is a bonded mixture of rare earth oxides in a rod form, isused. The rods are usually electrically heated to temperatures inthe range 1200 to 2000 degrees Kelvin. These are pi-actical approxi-mations to the black body. The glo-bar was the source used for thisexperiment. The glo-bar rod was silver-coated on the tips for bettercontact, and the temperature of .the glo-bar was approximately 1100degrees Centigradej- wheii 200 watts of energy were supplied. Theenergy distribution was similar to the black body radiation for thetemperature corresponding to the temperature of the glo-bar. There-fore, the peak energy occurred at about 2.5 microns. The glo-barwas surrounded by a water-cooled jacket.
INFRA-RED DETECTORS
Several types of infra-red detectors have been devised; however,the most commonly used are of the servo or the thermo type, such asthe thermocoupl.e, the bolometer, or the pneumatic cell. With thethermo detector it is necessary to distinguish signal changes causedby ambient temperature from those caused by radiation. In the instru-ment used for this experiment the detection of the different signalswas aecomplished by chopping the radiation beam at a frequency of
17

BLANK PAGE
).
/

13 cycles per second and measuring the AC signal at this frequency;however, this method required that the detector have a very short re-sponse. The thermocouple type of detector was used in this experi-ment. It was a high-speed type thermocouple, which consisted of ablackened, gold-leafed target welded to pillars made of one of theactive elementskwhile the other active el ement, of fine wire, con-nected the target to one of the silver leaves, with the other leafsoldered to the pillars at one end. Both leaves were run through aceramic rod and were soldered to an output plug at the base of thehousing. The average thermocouple characteristics are: sensitivity,4 micro-volts per micro-watt; response time, 75 percent of D-C re-sponse at 13-cycle modulation; target size, 0.2 x 2 mm.; resistance,12 ohms. The signal from the thermocouple was fed through a low im-pedance preamplifier before entering a 13-cycle amplifier where itwas rectified. The rectified signal passed through a network offilters before entering a Leeds and Northrup Speedox Strip ChartRecorder.
PARTICLE GENERATOR AIR SUPPLY SYSTEM
The particle generator was supplied with filtered dry air. Uponleaving the compressor the air entpred a storage tank (approximately21 ft.5 capacity) which dampened any pulsations induced by the re-ciprocating action of the compressor; consequently, a steady flow ofair was provided. Air passed from the reservoir at 100 psig througha condenser fabricated from 15 feet of 3/8-inch copper tubing formedinto 5-inch diameter coils. A water trap was located at the bottomof the condenser, which was immersed in a 55-gallon drum filled withcold water (and/or ice as required). This served to condense partof the water from the air. The air supply was then diverted througha Norgren 12-002 centrifugal-type oil-and-water filter before passingthrough two chambers containing a dessicant (approximately 100 cubicinches of silica gel) at room temperature. By means of a manuallycontrolled pressure regulator, the air was regulated to approximately30 psia before it was passed through an 8-foot heater capable ofcontrolled heating of a 2 cfm air supply to a temperature of over2500 F. The temperature of the resistance-type heater was controlledby a variable auto transformer Powerstat type 236, 2.5 kva, manu-factured by the Superior Electric Company, Bristol, Connecticut. Theair temperature was sensed by an iron-constantin thermocouple po-sitioned in the air line and it was measured by a Leeds and Northruppotentiometer, Model 8657C. The temperature-controlled air waspassed through a 0-100 psig pressure gauge before entering theprecision-bore, variable-area flowrater. A Stabil-Vis Flowrater,0-2.55 cfm, manufactured by Fischer and Porter, Hatboro, Pennsylvania,was used to measure the air-flow rate. From the diagram (Schematicof Air Supply System), it can be seen that the air passed from theflow regulator through- a Norgren Type 11-018 pressure regulator andthrough a 0-30 psig pressure gauge, manufactured by the AshcroftInstrument Company, before it entered the particle generator. Thisarrangement supplied well-regulated, steady-flow, dry. air to theparticle generator at a continuous rate (up to 1.5 cfm) for an in-definite time period. For the measurements made and reported herein
19

the- air was not pre-heated since the experiment did not require it;however, the heating device was included to enhance the versatilityof the equipment.
AEROSOL COLLECTOR AND VACUUM SYSTEM
Studies were made on the feasibility of reclaiming the particlesfor re-use in the experiment; however, the nature of the aluminumoxide particles used for this particular investigation precludedtheir reclamation and re-use.
In the actual investigation two vacuum systems were necessary:One system to collect all waste particles when particle density mea-surements were not being taken; the other system for particle densitymeasurements, exclusively. The purpose of the latter system will berelated more fully under the section describing particleý densitymeasurements; however, the two systems were essentially the same andthe details of both will be given here.
In both cases the steady stream of fluidized particles (aerosol)flowing from the specimen region was collected by a 2-inch flexiblehose to which was -attached an industrial-type vacuum cleaner (seeFigure 5). Some-of the particles were trapped by the commercialfilter provided with the vacuum cleaner; however, the commercialfilter was not suitable for complete filtering. Consequently, someparticles contaminated the driving motor, necessitating frequentcleaning and periodic maintenance of the vacuum system. Attached tothe flexible hose was a bell-mouth entrance which was followed by asection in the line for housing screens, filters, andtheir respec-tive retainers.
The two bell-mouth entrances for the separate systems were lo-cated adjacent to one another and were fastened securely to a movablecantilever arm. Either of the two systems could be put into opera-tion by rotating (or swinging) the proper bell-mouth inlet into po-sition.
The.two type's f vacuum cleaners used for this experiment werean industrial vacuum cleaner (Black and Decker, Type A) and an ordi-nary household-type vacuum cleaner. Vacuum cleaners of differenttypes were used because of availability, not performance.
It should be pointed out that a vacuum cleaner selected for thispurpose should be "oversized" to assure sufficient vacuum for com-plete collection of the particles, for the following reason: Thealuminum oxide particles used in this investigation were of a flakynature and were in the 1-40 micron range. The handling problems as-sociated with an aerosol of such material can cause a great deal ofdifficulty, even at low concentrations. If great care is not takento collect and discard all waste particles, the equipment and sur-rounding working area will quickly accumulate a "dust" coverage ofaluminum oxide particles. Usually a paint thinner, or an equivalentsolvent, is necessary for removal of the aluminum dust. The finely
20

atomized aerosol, after becoming suspended in the atmosphere, has asettling rate approximately equal to that of ordinary house dust andcan easily be inhaled Into the respiratory system, causing a healthhazard. The possibility of this hazard is only presumed by the writerand is not founded on medical evidence. Experience has shown thatthe vacuum system used In this experiment was barely adequate andleft much to be desired.
PARTICLE GENERATOR
The particle generator design was based on an investigation ofaerosol generators-mondtucted at the University of Oklahoma, to bereported in a master's thesis. Basically, the idea was to feed thepowder mechanically into a region in which air jets could be used todisperse the particle into an aerosol. The particle generator de-sign developed for this study was perfected after several modifica-tions of the original conception of the idea. Early experimentsindicated a need for a device that would eject and continue to dis-perse the particles from the region in which the powder in compactform was separated into small aggregates. The early experiments alsopointed up the importance of air-jet velocity and feed-rate regula-tion. All future developments bore out this observation--the parti-cle feed rate and the air flow rate were critical adjustments for awell dispersed uniform flow of fluidized particles.
A general description and principle of operation of the gen-erator follows.
The aluminum powder in packed form was fed from the 6-inchparticle cartridge, by a 3/8-inch diameter piston, into the dis-persion and ejector tube. Refer to Figures 10 and 11. The disper-sion and ejector tube consisted of a tube with a 3/8-inch bore withsmall holes drilled through its walls through which air, under pres-sure, for'med jets which broke up the packed powder into small aggre-gates and dispersed and ejected them as a fluidized stream ofparticles. The first set of jets was four equi-spaced holes drilledwith a #70 drill tangentially to the bore.
The purpose of the first set of tangentially drilled holes wasto provide a vortex or "swirling" motion which would disperse thepowder from its compact form more readily. Downstream 3/16-inchfrom the 'irst set of holes was another set of four equally-spacedholes, drilled with a #70 drill, with their centerlines directed ata 45-degree angle upstream and 3/32-inch off-center, i.e., spaced3/32 of an inich off of, but parallel to, the diametric axis of thebore. The purpose of this second set of holes was to propel theparticles in aggregate form in a spiralling motion along the streamtube and to continue the dispersion of the aggregates into individualparticles.
The third set of holes was located approximately 2-5/16-inchesdownstream from the second set, and the holes were drilled at a +5-degree angle in a downstream direction, their centerlines forming a
21

4 4 L
0441i
W; d
v g
iffME aU M UMn 4j
bOo-1.
22z

j 2
w I
'II
-~ a,
- a,-~ a. b
23U

'1109
J4,4
41W*
i A~w -'
3(4A
L0
4r14
24

2U
U
US
134
LW
540
4.£654S
S0S
p4U
5446
Q4
0Np4
S54
134
25

cone whose apex was located at the center of the bore. The intent ofthe third set of jets was to further accelerate and disperse any ag-gregates that remained in the powaer, so that a finely-dispersed,uniform stream of fluidized single particles was ejected from thegenerator. Surrounding the ejector tube is an air-tight cylindricalchamber which provides a plenum chamber of high pressure (normally6-9 psig) air which is exhausted as small air jets through the wallsof the ejector tube. The cylindrical chamber is supplied withpressure-controlled air through two l/4-inch copper tubes coupled tothe head of the chamber.
The entire particle generator design was based on the ejection-pump principle, which is essentially the principle by which a primarystream of high-pressure fluid is ejected into a region of low pres-sure fluid (called secondary fluid). The kinetic energy of theprimary stream establishes a pumping action which will pump a second-ary fluid into a mixing zone where the primary fluid and the second-ary fluid are mixed prior to being ejected downstream.
Summarizing, the first set of jets was used primarily to breakup the packed particles into smaller aggregates; the second set ofjets continued to break up the particles into a finer dispersion andto create a turbulence and a secondary fluid composed of small ag-gregates of particles; whereas the third set introduced a primaryfluid, located upstream, with which kinetic energy was associatedwhich established a-region of low pressure in the neighborhood of theso-called secondary fluid. The action of this third set of jets ac-celerated the movement of the secondary fluid downstream to be mixedwith the air of the so-called primary zone.
The particle feed mechanism can best be understood by referringto the system schematic (Figure 10). The particles were forced fromthe packed particle cartridge by an 0.374-inch diameter piston,1 inch in length. A gear-head motor driving a 45-degree bevel geararrangement translated a 1/4-inch-20 threaded brass rod to which thepiston was attached. The piston rate of travel was 0.309 inch perminute with the gearz atios and motor shaft speed indicated in theschematic (Figure 10). For this arrangement 19.45 minutes was re-quired to discharge a fully-packed particle cartridge 6 inches inlength. Obviously the particle feed rate could be varied throughjudicious selection of the bevel gear ratio and/or the number o:threads per inch on the feed rod. Another method by which the feedrate might have been varied was through a gear reduction mechanism orgear train placed between the motor output shaft and the bevel gears.To increase the versatility of the equipment a small gear train wasdesigned (not shown in photographs) which permitted the motor outputshaft speed to be increased or decreased by a factor of two.
Four brass particle cartridges were fabricated so that a greaterlength of time for taking data could be provided before it was neces-sary to repack the cartridges. The design of the cartridges, particu-larly the design ofthe coupling between the ejector tube and the par-ticle cartridge, was-i Sachieved after attempted use of other designs.
26

As can be seen from the drawings, the advantage of the design usedlay in the fact that bore alignment could be maintained between theejector tube and several cartridges.
PARTICLE CARTRIDGE PACKING PROCEDURE
It was soon realized that the technique for packing the particlecartridge had an important effect on the dispersion of the particlesinto an aerosol. The procedure, determined through trial and error,and found to be the best method for conditions of this investigation,is outlined below. Experience had shown that success in obtaininga uniformly-dispersed aerosol depended upon several factors; namely,the type of particle or powder used; the particle feed rate; the airpressure used in the particle generator, i.e., the velocity of theair jets used to disperse the particles; and the compactness of theparticles within the cartridge. Of the influencing factors men-tioned, the proper technique of packing the particles was the mostdifficult to acquire.
One of the important thi ngs to remember in packing the cartridgewas that a procedure must be defined and consistently used. The pro-cedure used in packing aluminum powder of the consistency of the 'OXDpowder may differ from that used in carbon powders or, for that mat-ter, aluminum powder of different size and different shaped particles.However, a procedure based on experience and needs of the user mustbe set up. The procedure that follows was one that was felt to besatisfactory for this experiment, and it proved to be quite success-ful. It was foWlO ailso from experience, that a non-uniform distri-bution.of the particles resulted from any deviation from a set pro-cedure which greatly influenced the results.
The first step of the procedure was to fill the cartridge withthe aluminum powder. No attempt was made to pack the powder withinthe cartridge since experience showed that a rather loose pack wasdesirable for, if the cartridge was packed too tightly, binding ofthe piston within the cartridge would result, causing a stoppage ofthe flow.
The second step of the procedure involved shaking the cartridgefor a period of two minutes on a sieve shaker. This shaking processwas not, in essence, a vibration of the cartridge, but was a tappingof the cartridge to jar the particles into a more compact form. Theparticle cartridge was allowed to tap against a vibrating piece ofwood placed on the shaker platform in a motion with a frequency ofapproximately the order of 300 cycles per minute. It was this tappingmotion that caused the particles to settle within the cartridge.
After the two-minute "Jarring" procedure, the cartridge was againfilled with aluminum powder in a loose-packed condition. Once againthe two-minute "Jarring" procedure followed. The second two-minutetapping procedure was followed with six one-minute tapping periods,and between each of these periods the cartridge was refilled withaluminum particles. Consequently, the cartridge was tapped for a
27

total of ten mintrs-for each packing of a cartridge. It was foundfrom experience that the length of time used in shaking influencedthe compactness of the aluminum powder within the cartridge; i.e.,longer periods of vibration resulted in a more tightly-packed car-tridge.
It should be emphasized once again that the tapping procedurewas found to be a rather important part of the packing procedure,since a steady shaking or vibration of the cartridge did not give re-sults as satisfactory as those obtained with this tapping procedure,and the procedure specified here was found to give particularly con-sistent results. A procedure different from the one specified couldgive equally good results; however, it should be obtained by a trialand error process.
PARTICLES UTILIZED FOR THIS STUDY
Since mono-disperse media are not found in nature, the appa-ratus was designed to measure the angular distribution of intensity(radiation scattering) from a poly-disperse system. The particleswere selected, however, with certain criteria in mind. They were tobe very irregular in shape, relatively non-conductive, non-uniformin size, but they were to fall within a size range of 1 to 20 micronswith 90 percent in the 5 micron range.
Reynolds Aluminum Company donated their 40XD aluminum powder foruse in this study, and they supplied the following specifications:average particle size, 6 microns (determined by the Fisher Sub-sieveSizer); particle range, 0.1-44 microns; thickness, 1.7 microns; den-sity, 2.58 g/cc (the difference between this and massive aluminum isdue to the presence of stearic acid.); apparent density, 0.23 g/cc;coverage (water), 3500 sq. in./gram.
The 40XD powder was further analyzed for this investigation toconfirm and/or complement the information supplied by the manufacturer.The average particle size was determined by microscopic analyses, us-ing a 400-power Bausch and Lamb microscope and a hemacytometer.
The hemacytometer is an instrument that is used under ordinarycircumstances for making red- and white-blood-cell count; however, ithas other uses, including the determination of dust counts and countsin spinal salivary 9-rother body fluids. The instrument is essen-tially a glass p ate with ruled lines which form a grid work orcounting area. The counting area is a 1-millimeter squared section,which is divided into 25 equal squares, each of which is separatedby 3 ruled lines with a spacing of 2.5 microns between each of thelines. Eac4 of the 25 squares is sub-divided into 16 squares, giv-ing 25(10)" square millimeters for each area. In addition, the gridwork is engraved 1/10 millimeter below the surface, thus giving aregion of known volume. For ecample, for each of the 16 squares theknown volume would be 2.5(10)" cubic milliieters or for a group of16 squares the known volume would br 4(10)'3 cubic millimeters.Therefore, it would be possible to ascertain the number of particles
28

in a given volume, if this information were required. The method usedin counting followed the procedures outlined by George E. Cartwrightin the book Diagnostic Laboratory Hematology, published by Grune andStratton, New York and London, 1954..
To prepare a sample for counting, a known quantity of aluminumpowder was diluted with ethanol.- Usually the quantity of powder wasapproximately 1/10 gram, whereas the suspending agent used for dilu-tion varied from 25 milliliters to 150 milliliters. The mixture ofpowder and suspending agent was thoroughly agitated for one or twominutes before a sample was withdrawn by means of a thin glass rod,which had been drawn to a point by heating, and a droplet was in-serted on the lined area of the hemacytometer. A thorough agitationof the solution was necessary, of course, in order to get a uniformdistribution or an average sample. In order to insure that an aver-age sample was being taken the volume of the suspending agent wasvaried, and a check was made to see if the number of particlescounted was directly-proportional to the increase in suspendingagent. For each-sample, the number of particles contained in 16squares was counted. A total of 25 squared sections containing 16squares each was counted. From these 25 counts the average number ofparticles per group of 16 squares was determined. This procedure wasrepeated for 25, 75, and 150 milliliter ethanol solutions, containingapproximately 1/10 gram powder in each solution. Consequently, thetotal number of counts covered 100 16-squared sections, or a total of1600 squares. The particle density calculation f~r the average ofthe 100 counts indicated that there were 6.05(1%"J particles pergram, or a mass of each particle was 1.655(I0)- gram. The averageparticle size determination indicated that the average particle sizewas 7.9 microns across the largest diameter. The largest diameterwas selected for a reference point, since the particles were very ir-regular in shape. An attempt was made to determine the approximatesurface area. Several assumptions were made. If it is assumed thatthe particles ari 6Ctangular in shape, having the dimensions 2 mi-crons in thickness, 7.9 microns in the longest length, and 1+ micronsin width, the total surface area is 110.8(10)-8 square centimeters.An equivalent diameter can be determined if it is assumed that thetotal surface area of the particle is equivalent to the surface areaof a sphere from which the equivalent diameter is obtained, i.e., thediameter of a sphere whose surface area is equal to the surface areaof the particle. A calculation using the dimensions of the particlesdescribed above will be 5.94 microns, or roughly 6 microns. It isinteresting to note that the v9lume of the particle based on theabove assumptions is 6.32(10)-'' centimeters cubed, which gives adensity for the particles of 2.62 grams per cc, compared to the manu-facturer's figure of 2.58 grams per cc.
The particles, when observed under a microscope (see Figure 13),can be seen to be very irregular in shape, having void spaces andpossibly having fissures; consequently, the apparent density shouldbe used. The actual volume of the particles was determined by dis-placement by the particles in a liquid of known volume, and an appar-ent density of 0.23 grams per cc was obtained. A check of the
29

1 ±4
CC1'IIU*-U
r� 0
0 4
*
I,.9.0.0UU0'4U
0
30

jili

particle size has been made using the extinction equation, i.e., theextinction coefficient. A relationship exists between the mass ex-tinction coefficient 09) and the extinction cross-section Ke as usedby some authors. This relationship is,
where r is equal to the particle radius and /01m is equal to the massdensity of the particle. From geometrical optics at large values ofparticle size parameter alpha, a plot of extinction cross-section asa function of alpha will generally be a constant value of 2.
Using a value for Ke of 2 and the calculated value determined byexperiment of 11,350 for high values of alpha (low wave lengths), to-gether with the xer-imentally determined particle density, the di-ameter of the particle was obtained. The calculatci value for theparticle diameter was 5.62 microns. This value compares favorablywith the equivalent diameter of 5.94 microns which was calculated onthe basis of an assumed dimension of the particle. Utilizing thelatter method of comparing the extinction coefficient with the knownvalue of the extinction cross section theoretical calculations, thecalculated value of particle diameter of 5.62 microns forms a realis-tic comparison with the experimental values, and the values could bemade to. compare identically by adjusting the particle dimensions,since the particle dimensions were assumed on the basis of micro-scopic observations. The only calculated dimension was the averageparticle size which was the largest dimension and was based on astatistical average. However, the comparison just made is obviouslya good indication of the accuracy of the results.
PARTICLE TUBE VELOCITY
The velocity in the tube from which the fluidized particles werebeing ejected was calculated in order to determine whether laminaror turbulent flow existed within the tube. The velocity in the tubewas 29.5 feet per second, with a Reynolds number of 5,894, which in-dicates that the fluid in the tube was in a turbulent condition.
AEROSOL DENSITY MEASUREMENTS
Calculations of the mass extinction and mass scattering coef-ficients required that the density of the aerosol be known. Firstconsideration conceived the idea that an aerosol density measurementbe established for the period in which data was being taken. Theoriginal idea was to collect the particles thnt had passed throughthe specimen area for the entire period in which scattering and/orextinction data were taken on millipore filters and weigh them.Measurements of the air-flow rate, the time required to collect theparticles on a filter, and the weight of the accumulated particleswould provide information for the determination of the media densityfor a particular set of data. However, skepticism of this method wasfelt from the very beginning, because of the anticipated vacuum re-quirements necessary to collect all of the particles on the milliporefilters. Other methods, such as drawing off or collecting all the
32

particles in an evacuated chamber, were analyzed. The scattering andextinction apparatus was being designed for the continuous collectionof data to extend for periods of over ten minutes; consequently, themethod of collecting the particles on a suitable filter or filterswas considered the best compromise. This compromise revealed itsinadequacies soon after the vacuum cleaners were purchased and thesystem was constructed. It soon became apparent that the vacuum sys-tem was'inadequate for the filter would accumulate sufficient parti-cles in one or two minutes to cover the filter, and an overloading ofthe vacuum cleaner motor followed.
A solution to this dilemma was a sampling technique, which ne-cessitated the use of two separate vacuum systems. Instead of mil-lipore filters, a readily available fibre-glass material that wouldfilter particles down to 0.5 micron was purchased from The FramCorporatiun, Tulsa, Oklahoma. This material proved very satisfactoryand was used in all particle density measurements included in thisreport.
With the exception of the vacuum cleaner used, the two systemswere identical in design. The collecting devices, including bell-mouth inlets, housing screens, and filters (See Figure 3), could beused alternately, and sampling could thus be conducted continuously.However, it was found later that the number of samples necessary fora given run could be reduced to one or two since the particle flowrate was comparatively steady for the period in which data was taken.
The air-flow rate--was measured with a precision flowrater (in-cluded in description of air system) with 0-2.5 cfm range, calibratedin inctements of 0.1 cfm. A flow rate corrected for inlet pressureand temperature was used in all measurements. The filters wereweighed before and after collection of the particles on a beam balancecapable of reading to 1/10,000 gram.
Calculations were made to determine the optical depth nf theaerosol to see if single scattering phenomena could be consideredprevalent throughout the test. The optical depth (T) is defined as
w or (1
assuming density and mass coefficient constants, and with 1 repre-senting the length of path traversed by the ray of energy through theaerosol. The plot of the mass extinction coefficient as a function ofwave length (Figure 39), indicates that A can be considered constantfor a large range of wave lengths. Using a value of A equal to.11,350 fte/lbm and the maximum and minimum density values obtainedduring the investigation, a range of optical depths between 0.077 and0.01102 will result. These values fall within the range specified byVan de Hulst (156) who stated that single scattering phenomena can beconsidered if the optical depth is less than 1/10. Boll and
33

Sliepcevich (7) published a paper in which they indicated, as a re-sult of experimental evidence, that the condition for single scatter-ing will be fulfilled if log Io/I is less than approximately 2.5 to3, and the half-angle of reception,4G , for the light received isless than about I degree to 1.1+ degree. Thus, the first of the con-ditions specified by Boll and Sliepcevich was satisfied in this ex-periment.
In addition, from the definition of single scattering, theamount of scattering will change in direct proportion to the number ofparticles involved. From the extinction data a curve was plottdwhich indicated the decrease in incident intensity per a unit inci-dent intensity and was plotted as a function of the density of themedium. The curve plotted from this data was essentially a straightline (Figure 15). It is then obvious from this curve that the de-crease in incident intensity or the extinction is, or can be consid-ered to be, directly-Troportional to the density. As an example, anincrease in the density by 49.5 percent will result in a decrease inthe intensity by 50 percent. The above information was considered assufficient evidence to accept the phenomena of single scattering forthis experiment.
Although the information obtained and reported in this workcovers the results for one substance, the versatility of the designof the equipment makes it possible to investigate other substances ormedia containing other types of particles. As a consequence, researchis presently being continued with this equipment to obtain additionalinformation, such as the emission function of the substance used inthis investigation, as well as information on media containing othertypes of particles.
REDUCTION OF DATA
As pointed out in the discussion of the equipment, all data wererecorded on a Leeds and Northrup Speedox strip chart recorder. Meas-urement of the angular distribution of intensity was recorded for allangles ofre between 7 and 173 degrees; i.e., the aerosol specimen wasscanned continuously over this range. Scattering measurements weretaken for 21 wave lengths; i.e., at 0.5-micron intervals for wavelengths between 1 and 7 microns, and at 1-micron intervals between 7and 15 microns. Extinction measurements were recorded for the sameintervals of wave lengths as the scattering, with the additional wavelength of 15.5 microns being recorded.
Due to the large amount of date taken, it was not feasible toinclude all the data in this report; therefore, representative sam-ples have been included (photographic reduction method) as an append-age to illustrate the type of data recorded. The "raw data" for boththe extinction and scattering measurements are on file at the Depart-ment of Aerospace and Mechanical Engineering, University of Oklahoma.
34

NORMALIZATION OF THE EXPERIMENTAL DATA
In presniting the data it is convenient to isolate the influenceof radiative scattering by neglecting other effects. For the experi-mcntal work reported herein the variation of monochromatic intensity
,(IC') with the direction G' was measured. Emission from the par-ticles was neglected. The validity of this approach is to be in-vestigated in future wor'k; however, for this work the approach isprobably adequate since the particles were at relatively low tempera-tures (approximately 750 F.).
Radiative scattering for the axial-symmetric case was expefi-mentally determined (scattering in a horizontal plane).
The energy balance per unit solid angle can be written:
our SCAT* 51...= l (2)
where: AISA,= decrease in the incident intensity due to scattering
/A I = decrease in the incident Intensity due to absorption
&It, decrease in the incident intensity due to extinction
-( s, c'd ci' (3)0
For the axial-7ymmetric case, we write
0
Approximating. Beer slaiw.-as,
3r (5)
35

(6)
If p .,and W( are identical. in Eq ( a) and Eq (6) we then have
A .... •'-- (7)
Rewriting Eq (2) in the following manner,
A l s c ,-r * .a - 1( 8 )
or
(9)
also, from Eq (4)
SC04T
- -(10)
Since the scattering function S(is') is defined as the fractionof scattered radiation directed into a unit. solid angle du3' in thedirection 0', 4' it is evident that for the case of non-conservativescattering we can write
Sj (e, ) suneg'de'c° --- (11)
The scattering function is referred to by Van de Hulst (156) as theamplitude function, whereas Chandresekhar (14) refers to it, as thephase function.
36

For the axiay-synmetric case we have
0Troe OS ( 0) SIN 5 C)(12)
Upon comparing Eq (10) with Eq (12) and assviming that 'alis not a function of (D)' we then have
Sce') £5 1 ') (13)
For a particular case of conservative scattering (Cr-=3)Eq (10) is identical to Eq (4) and we can, therefore, define a con-servative scattering function as
Scos('e) 0 (14)
Examining Eq (7), Eq (3), and Eq (4), one can readily see that
0' e) =,2 SCONS ) (15)
The conservative scattering function, ScoNs(i), hat been plot-ted as a function of 3' for the wave length interval 1 micron to 15microns (21 values). In additionSeo,..(0') has been tabulated betweenO'4 a' 4 '180 for 21 values of wave length, Table 1.
The mass extinction coefficient 13 has been calculated fromEq (5), using the-easured values of density a , the path length
, and the percent decrease in incident energy * The
mass scattering coefficient Q" has been calculated from Eq (10) bynumerically integrating Is(e')over finite (1 #_hgree) intervals. Onecan, therefore, determine the corresponding $(r')for the interval0q< eG' 180"
Beginning with Eq (4) and considering dGas WD and taking&0m-Ui radian we write
tL "-L nJ SiN ISO AIX..T (16)
37

hnerefore, from Eq (3)
360 l, (0n)S•C OeS (,On) ="- (17)
The numerical values of Sram. (On) were calculated using theIBM1410 digital computer for 21 values of wave lengths (from micronto 7 microns in one-half-micron intervals and from 7 microns to 15microns in one-micron intervals). The values are presented in Fig-ures 16 to 36 and--in-tabular form in Table 1.
CALCULATION OF MASS SCATTERING COEFFICIENT
The mass scattering and mass extinction coefficients are neces-sary to obtain an accurate solution of the radiant transfer equation.Just as the determination of the scattering function and the massextinction coefficient were desirable for actual media, so is thedetermination of the mass scattering coefficient desirable for theactual media.
With a few minor assumptions it was possible to obtain the massscattering coefficlent for the aerosol of aluminum powder used inthis experiment. From Eq (7) developed earlier,
In the development of Eq (7) it was assumed that t,', and %were identical for both extinction and scattering data. Since theextinction data and the scattering data were obtained independently,it is obvious that it was impossible to obtain identical conditionsfor both sets of data. Consequently, to apply Eq (7) the data mustbe corrected.
bblswhas been determined by integration of Eq (4), assumingthe finite difference technique to be justified; i.e.
e)eA
38

Where Is(d) has been measured at a particular set of conditions.These conditions include th,2 wave length of the radiation, the massdensity of the cloud, and the path length of the radiation.
The mass ScaTtCring coefficient has been determined in the fol-lowing marner.
1. ubtain the value of, 13 , the monochromatic mass extinct-oncoefficient from the graph in Figure 39, for the wave length cor-responding to the experimental data for IS(GD)
2. Compute .... by multiplying A by the value of /oOY
corresponding to the experimental data for TS(G°)
3. Lt 4 is determined by assuming lwN Is). This approxima-tion is valid because the optical thickness of the samples was small.
A.IgyTis then computed as follows:
4. Obtain &I SCAT from integration of
5. Calculate
G~ 1.SAT
The above procedure has been followed in the calculation of themass scattering coefficients for 15 wave lengths, the results ofwhich are plotted in Figures 37 and 38. However, the average densitywas used in the calculations. As can be seen from Figure 37, con-siderable dispersion of the calculated points occurred. Possiblythis dispersion could-be improved if additional points were used inthe calculations. Aerosol density measurements were not recorded forall measurements of scattered intensity recorded for purposes of cal-culating the scattering function since the scattering function per seis independent of density. Unfortunately it was not planned thatthe mass scattering coefficient would be calculated by the aboveprocedvre prior to the accumulation of the scattering and extinctiondata. Consequently, calculation of the mass scattering coefficientand the resulting plot are based on a minimum of data.
It can be seen from the figure that the media upon which
39

measurementS bere made should not be considered as a non-absorbiia"
media, i.e. a-
RELATIONSHIP BETWEEN &ND SCd= "(0')
in solving the heat transfer equation by approximation methods,it has been found convenient to express the equations in a particularform. SimJlarly, in order to expand the utility of the experimentaldata, it is desirable to express the data in a form which Is conver-ient for use in these types of problems. The problem is one of as-certaining the relationship between r](kMtL4k and L:,(a). Sa-,Q0A•j)can be obtained directly if its relationship with is known.
If we consider scattering into discrete directions (j) from aparticular incident direction (1), we can write
_ o(18)
where (e•is the angle between the directions of the incident andleaving rays, and frrom solid geometry,
Equation (18) has been evaluated using the finite differenceIntegration. Azimuthal increments of 10 degrees were selected, i.e.,&0 = 100. In addition, discrete values of A%,!..U; as dictated bythe fourth order approximation were uzod to calc,.0ate values of Eb3.Sixteen values of--M.-1 M) and sixteen values of 5(-AW; aretabulated in Table 2. The calculated va.ues of 1t are tabulated inAppendix B.
Since " is the probability that a photon will be deflected fromits original direction or scattered as it encounters an elementalmass, we can write
5~ s: (20)4'n
4•1
or (4o

In the absence of absorption, the total flux scattered in all
directionsCequals the incident flux, i.e., for the case of conserva-
tive scattering,
fA(21)--I
Rewriting Eq (21)
1i o (22)
Equation (22)'is now :ewritten in a form suitable for integration by
an approximat 4 on method, i.e..
aslj)-' !S iT. (23)hatI
For the case of fourth approximation Eq (23) becomes
4 4
.0 (24)
Due to the fact that intervals of A %0 and a fourth order
approximation were used in the calculation of the functions
&(kp lpJ) , it seemed advisable to check the accuracy of the compu-
tations. Equation ( 2 4) was used to make this check.
It should be noted that only the positive directions of).LL need
be considered in Eq (24) since the Hemholtz reciprocity law is valid;
i.e.,,uýPp = S(-,Uz -,,u).S(-.u,u3 ,)= ,-•,
To provide a comparison of the experimental results with a the-
oretical result, 32 values of S(AL;,L•,.J were calculated using the
work of Chu, Clark, Churchill (17, 21) and Love (96). These
41

alculations for the Mie theory considered a real refractive index of1.6 and O(= 2 and O( = 3. Calculations for values of o( larger than3 were not attempted, due to the tremendous amount of work invclved.These values are tabulated in rable 5. Checking the computations us-ing Eq (24) indicat6d that the accuracy was sufficiently close formost engineering work. However, the experimental lesults did notagree too closely with Eq (24) as indicated in Table 6. The followingis offered as an explanation of this disagreement.
The scattering function calculated from the Mie thecry does notchange as rapidly in the region- for small values of 0 as that calcu-lated from the experimental data. The scattering in the nel.ghbor-hood of'OO (forward scattering) was much higher for the experimentaldata when compared to that calculated from the Mie theory. Since afourth approximation quadrature formula was used to express thisfunction and discrete values of-i, P) were dictated by this rela-tion, it seems L-easonable to assume that the approximation methodused did not express this function adequately in the neighborhood of00. Another possible explanation is that an insufficient number ofazimuthal increments were used and possibly A( of 50 or even 10should be used.
In order to improve the accuracy in the calculation offrom the experimental data, two alternatives are suggested:
1. Increase the number of intervals of AO used in Eq (18), thatis, use values of A of 50 or 20. This may improve the ac-curacy for an individual point.
2. Increase the degree of approximation so that more points canbe considered in regions having steep gradients. In thisrespect the accuracy could be improved by considering theapproach suggested earlier; i.e., to extend the applicationof the quadrature formula in normalizing the scatteringdata. However, there is one serio-'s dVfficulty with thisapproach. Increasing the degree of' approximation will pre-sent many difficulties in solving the heat transfer equation,utilizing the approximation techniques.
Since the f-T±i•uggestion has not been attempted due to the ob-vious amount of work involved, the influence on the accuracy of thecalculation can only be assumed. Therefore, for the present it issuggested that the calculated values of S(AiAL) be accepted asbeing sufficiently accurate for engineering applications.
It should be kept in mind that a direct comparison between theexperimental work reported here and the theoretical calculations men-tioned above cannot be made. The particles used in the experimentalwork were neither spherical nor of uniform size and they had a com-plex refractivo index (an estimated, not a known value), while thecalculations for the theoretical particles considered only the realrefractive index.
42

DISCUSSION OF EXTINCTION DATA
A total of 87 calculated values of beta for 22 different wavelengths was used to plot the extinction curve. At each of the 22wave lengths plotted the calculated values of beta were averagedarithmetically to obtain the average extinction coefficient for thewave length. Consequently, a curve was plotted for the average massextinction coefficient as a function of wave length for the 22 wavelengths. (Refer to Figure 39).
The extinction curve was plotted as a function of wave length,since it is ratber difficult to determine a value of particle sizeparameter ('K) for irregular-shaped particles. However, one couldpossibly use an equivasent diameter to establish pseudo particle sizeparameters.
As can be seen from Figure 39, the extinction curve is relativelyflat for the average line drawn through the plotted points. Possiblydue to inaccuracies in measurement or to the fact that an insuffi-cient number of points was recorded, the plotted points failed toindicate the maxima and minima observed for the Mie curves; conse-quently, there was no justification for not representing the extinc-tion coefficient as a smooth function. From the extinction plot, thecurve does "drop off" at a wave length larger than 10 microns. Ifthe effective particle diameter were accepted as a correct value, andan equivalent alpha value were determined on this basis, the "drop-off" of the extinction curve would occur at values of alpha smallerthan 2. Since an insufficient number of points was evaluated forequivalent values of alpha between 0 and 3, this experiment did notpredict the maxima and minima as predicted by the Mie theory for thisrange of alpha values. As has been explained earlier, however, thereis no justification for comparing the results of this experiment withthi Mie theory, primarily due to the fact that the Mie theory con-siders scattering from single spherical particles. Also, the calcu-lated values showing these distinct maxima and minima are, essential-ly, for non-absorbing spheres.
For extinction measurements the angle of reception must besmall. This requisite was pointed out by the experiments of Sinclairand LaMer (134) and by the investigations of Boll and Sliepcevich(7). Due to the large value of forward scattering intensity obtainedin this'experimental work, especially at the low wave lengths, it wasnecessary to reduce the monochromator slit width in order to keep thesolid angle very small. As experience pointed out, a large angle ofreception would include so much forward scattering, primarily fromrefraction and reflection, that the amount of extinction (AT) wouldbe so small that accuracy would be poor; consequently, by decreasingthe cone of reception the percentage of extinction was kept between8 and 20 percent, with a consequential improvement in the accuracy.The large amount of variation in the data can be attributed primarilyto the density measurement. It is believed that the particle flowdensity, or particle distribution, was quite uniform, since this wasconfirmed by the scattering data and the investigations of the
43

particle generator itself. The error in the density measurement canbe attributed to two factors:
1. A stopwatch was used to determine the time for sampling theflow. Any error in the measurement of the time would createa large error in the density calculation. The number ofparticles counted per unit of time, of course, varies withthe accuracy for the period of sampling; for example, a5-second variation in time for the one-minute samplingperiod could result in approximately 8 percent error in thedensity measurement. Consequently, improvement of thedensity measurement would require longer periods of sam-pling, which were impossible with the equipment designedfor this experiment.
2. A variable area flowrater was used to measure the airflowwhich could be determined to within 1/10 cfm. Consequently,the accuracy of such a device was insufficient for thedensity measurements necessary for this type of experiment.It is suggested that a calibrated orifice plate and a mano-meter be used to obtain a more accurate determination of theairflow.
These two factors contributed greatly to the accuracylof thedensity measurements taken. Since the extinction data varied with,or was influenced directly by, the density measurement, the extinc-tion measurements were obviously in error and it was difficult toobtain reproducible values. This error was minimized by taking aminimum of three extinction measurements at each wave length, and insome instances by-taking-s many as 7.
DISCUSSION OF ANGULAR DISTRIBUTION OF INTENSITY DATA
In order to have a complete set of scattering data at a partic-ular wave length, it was necessary to have the measured scatteredintensity for all angles between 0 and 180 degrees. The informationat the endpoints was the most difficult to obtain, particularly inthe neighborhood of 0 degrees. The backward scattering, or the scat-tering in the region of 180 degrees, can be extrapolated with a cer-tain degree of accuracy. A device to measure backward scattering ismore easily constructed or designed than one that would be capable ofmeasuring the scattered intensity in the neighborhood of 0 degrees;i.e., forward scattering. The results of the data in this experimentindicated that therg.exd.sits a very strong forward scattering atnearly all wave lengths, and that the ratio of the scattered inten-sity of 0 degrees to that at 90 degrees was at least a hundred forthe high wave lengths and more than a thous&nd for the low wavelengths. Since there is a steep gradient in the region between 20 de-grees and 0 degrees, it is quite obvious that difficulty would arisein trying to extrapolate the scattered intensity in this region.Some authors have indicated that data can satisfactorlly be extra-polated to the zero point and have reported experimental data withthe last measured value as high as 40 degrees being extrapolated to
44

the zer,' point. However, they offer no basis for this extrapolation.Others, for example W.E.K. Middleton (106), have recognized that er-rors exist in extrapolating the information to the zero position, butthey did not suggest a more suitable procedure for the extrapolationof the data. Light-s6attering devices have been devised which willmeasure the scattered intensity in the neighborhood close to zero, infact, for a value of less than 1 degree (1). Such desirable char-acteristics have not been incorporated in the particular design de-scribed herein, due to the fact that compromises were necessary indesigning and constructing a versatile piece of equipment that couldbe used for scattering measurements on other powders.
Due to the physical limitations of the design reported herein,the smallest angle, theta, in which the scattered intensity can bemeasured is 7 degrees. Consequently, it was necessary to locate apoint in the neighborhood of 0 degrees, in order to extrapolate thedata in this region. The data reported herein for the scattered in-tensity in the neighborhood of 0 degrees was obtained from the ex-tinction data.
It was recognized early in the experiment that the intensity inthe 0-degree position was at least a hundred times more intense thanthe scattered intensity at the 90-degree position. Consequently, aprocedure for taking data had to be considered by which the record-ing of data could be kept on the chart paper. It was found that re-cording of the angular distribution of the scattered intensity couldbe retained within the limits of the chart paper if the amplificationof the thermocouple signals could be controlled or kept within cer-tain magnitudes. A control of the amplification can be obtained withthe equipment used through the control of the gain.
The procedure used in this experiment was to record the angulardistribution of the scattered intensity beginning with the largestpossible anglee, which was approximately 1730 and scanning thespecimen to an angle in the neighborhood of 20 degrees. In this re-gion, the scattered intensity was usually of such magnitude as torun off the chart paper, especially for data recorded for the lowerwave lengths. For the higher wave lengths it was possible to recordthe scattered intensity over a larger angular range before exceedingthe limits of the chart paper, i.e., from 173 to 7 degrees. There-fore, for each wave length the scattered intensity was recorded foran angular range which could be retained on the chart with one gainsetting, and the remaining angular range to 00 was recorded on an-other portion of the chart. In this way, the ratio of the scatteredintensity at 0 degrees to the scattered intensity at another angle,somewhere in the region between 20 and 30 degrees, could be estab-lished. For example, ratios could be found between the intensitiesat 0 and 7 degrees, between 0 and 20 degrees, or betweer 0 and 30 de-grees. Since several ratios of the angular intensities could beestablished, there was sufficient information to locate the scatteredintensity at the 0-degree position. There is obviously some error inthis procedure, especially for the wave lengths of 1, 1.5, and 2microns, due to the large ratios of the scattered intensity at

0 degrees to the scattered intensity at 10 degrees. Any error inreading the intensity at 10 degrees could result in a large errorat the O-degree point. For example, if the intensity measured atthe 0 point was 100, and the intensity at the 10-degree point was re-corded at 4, the ratio of the intensity at 0 degrees to the intensityat 10 degrees would be 25. However, if an error had been ma,.e in re-cording the intensity at 10 degrees, say at a value of 3.5 ratherthan 4, an error of approximately 14 percent would result. Eventhough these errors are possible, the procedure will establish theintensity at 0 degrees within 20 percent, which is a much better ap-proach to obtaining accurate data than any attempt to extrapolate thecurve beyond the last measured intensity. If such a procedure wereused, errors greater than 500 percent would result, particularly forscattering measurements at the low wave lengths, for it is at thesewave lengths that the scattered intensity in the forward direction isthe greatest.
It is also recognized that an error exists in the scatteringintensity in the backward direction, or the 180-degree direction. Toobtain the 180-degree point the curve was extended beyond the 173-degree point. Consequently, it is obvious that errors could resultin this region, due to the arbitrariness that would result in extend-ing the curve. However, it was felt that this procedure was adequatefor this experiment since the intensity in a backward direction was.small as compared to the scattering intensity at values smaller than20 degrees; i.e., the curve was relatively flat for angles between70 and 180 degrees. It is estimated that the accuracy of the scat-tering data for the region between 0 and 10 degrees is within 10 per-cent, which is considered a conservative value, based on the factthat the measurements were taken on several different occasions andan average of the results was used in presenting the data. For agiven wave length data were taken a minimum of 3 times and in someinstances 11 times, and none were taksen consecutively, but were takenin a random fashion. Comparison of the scattering data taken for agiven wave length on different occasions indicated that reproduci-bility was very good. It was, of course, impossible to generate thesame density of the aerosol consistently; therefore, the scatteredintensities moasured on different occasions would obviously not haveidentical values. However, since conditions for single scatteringphenomena were prevalent, the ratio of the intensities for any twofixed angles would be the same, independent of the density of the testspecimen. For example, for a given wave length the ratio of the in-tensity at 20 degrees to the intensity at 90 degrees, or any othercombination, should be identical for two sets of data regardless oftheir aerosol densities. These ratios for the various scatteringmeasurements were found to be identical for all intents and purposes.
It was also found that on comparing the normalized curve for twosets of data at a given wave length the results were identical. Theresults presented -trVIi-malized form were a result of the averagevalues of all the data taken, except in those instances where thedata recorded had no obvious error, for example, an error that re-sulted from improper operation of the particle generator, such as
46

clogging in the particle flow or aggregates that formed. In all
cases for which these influences were disregarded the influences were
noted through continuous monitoring of the equipment during the pe-
riods in which data were being recorded.
147

0.24
0.22
0.20
W 0
Z 0~0
00.20
-. 0
(1 0 0
S o ! o ;0 oiiJ 0-<I). o0 0
• I I I . 0. I.0I I
00
~t0.14 00
oz 0
tAIZ 0!q 0.12 0
10.10
0.06
0.06
0 2 1.6 2.0 2.4 2 &Z
p DENSITY OF MEDIUM x 104 Ib,/fts
Figure 1 5 Percent Attentuation Variation with Media Density

Iwo0
100
zQL.)
zwa
10
%-bo
44

I000
XuI1.5pa
100
0I,-
z2
L.
z
w 10I,<
'm
U)
U)
0.10 II I I I I0 20 40 60 60 100 120 140 10 10
W," DEGREESFigure 17. Angular Distribution of Scattering
Function--Experimental Data

1000
" X. " 2.01L
100
z0
zI.
zC" lo -wI-JI-
U)
1.0
0 20 40 60 SO 100 120 140 16o 1SO
8', DEGREESFigure 18. Angular Distribution of Scattering
Function--Experimental Data

1000
, 2.5/L
I00
z0
U_zLr.
I
0.10 20 40 60 so 100 120 140 ISO 1S0
- DEGREESFigure- 1-9--Angular Distribution of Scattering
Function--Experimental Data
52

1000
-= 3.0,
100
z0C.
zLL..C,.
zw 0
I-.
C)
Coon
oz0
1.0
0.1 - I I
0 20 40 GO-- 00 100 ItO 140 1SO I10
Vow, DEGREESFigure 20. Angular Distribution of Scattering
Function--Experimental Data
53

1000-
""k 3.5,IL
I00
z0
za..
zrý 10wI-
UC,)
1.0 --W
0.!00 20 40 60 so 100 120 140 160 ISO
8'- DEGREESFigure 21. Angular Distribution of Scattering
Function--Experimental Data
.34

1000
X, 4.0j.
00
z0
Z.
W - 0
ULz
Co,
U
V,)0
1.0
0.10I I I I I I ,0 20 40 60 S0 100 120 140 10 ISO
8'" DEGREES
Figure 22. Angular Distribution of ScatteringFunction--Experimental Data

1000
100
0
zmL
U.f
0 -
I--
z Il
0
(flU
ml.
0 0 20 40 Go so loo 120 140 1, 0
8'" DEGREESFigure 23. Angular Distribution of Scattering
runction--xperimental Data
56

100 "
2 ). = 5.Op0
Z IDU.tL.
I-
0
0.1
0 20 40 60 so 1oO 120 140 160 1o
0',- DEGREES
Figure 24. Angular Distribution of Scattering
Function--Experimental Data
57

I00
I-
.5.5)z
0
so
1.0
U
0.1
0 20 40 60 60 loo 120 140 160 190
8'" DEGREES
Figure 25. Angular Distribution of Scattering
Function-Experimental Data
58

I00
z fi,,6.0,01-
zw
U(1.0
0I--
o to 40 60 So 100 120 140 960 1So
Wo' DEGREESFigure 26. Angular Distribution of Scattering
Function--Lcxperimental Data
59

I00
z 6.5p
0o ,o~10
z
w
"MI-
(0
0 20 40 60 so I00 120 1,40 ISo Ie0
Wo' DEGREES
Figure 27. Angular Distribution of Scattering
punction--xperimen tal Data
60

100
I
71.0
Z,0CDz.
b1J
40.C)U)
(I)
0 to 40 60 so 100 120 140 10 IO
W'- DEGREESFigure 28. Angular Distribution of Scattering
. � -Function--Experimental Data
61

,oo
z\
Z Ion CLIA.
r-
z
wI- "
U)
2 1.0
o.w
0 20 40 60 6o 100 I20 140 160 ISO
8"'w DEGREESFigure 29. Angular Distribution of Scattering
Function--Experimental Data
62

100
0I-.UZ 10
z
I--
1.o-
2 10
0.1- -
0 20 40 60 so 100 120 140 160 ISO
8'-, DEGREESFigure 30. Angular Distribution of Scattering
Function--Zxperimental Data
63

100
z lO.O/.0
Z 10
qD
U-.
I-Lz
U)
0
0.I I I I I I0 20 40 60 so 100 120 140 16o ISO
8'p- DEGREESFigure 31. Angular Distribution of Scattering
Function--Experimental Data
61*
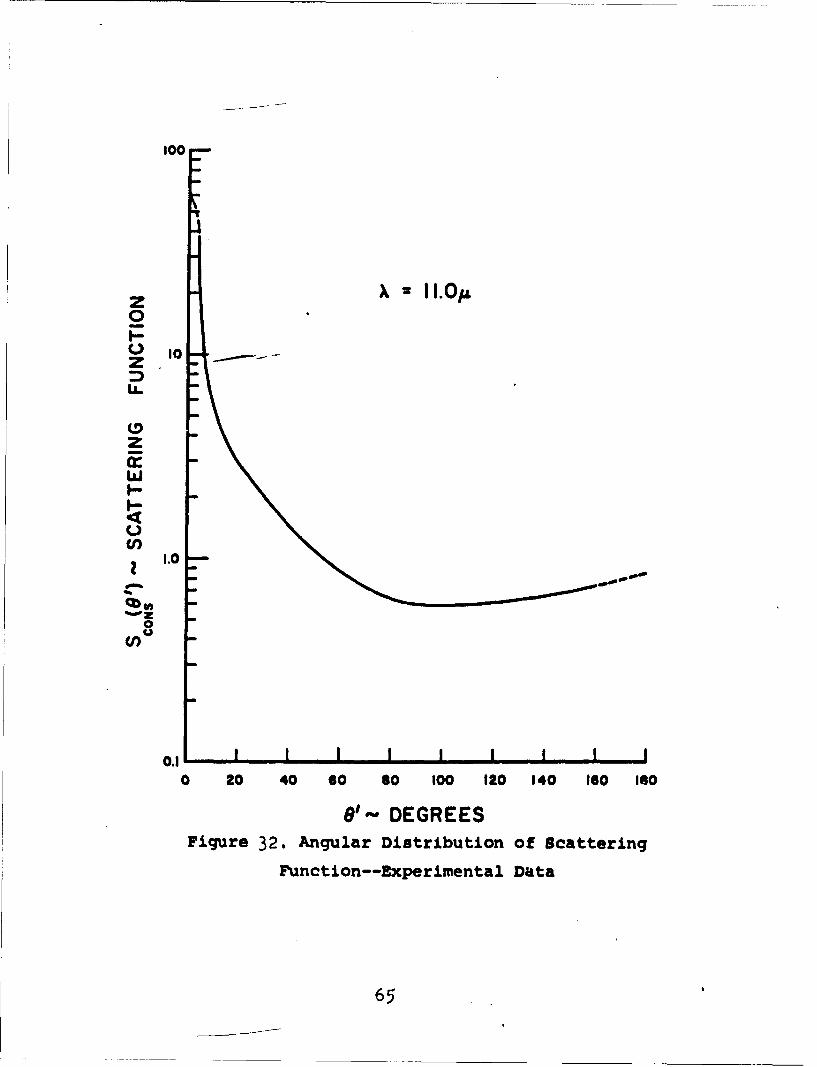
100
z I I.O0.0i.-
U.
'3z
I-
U
1.0 ---
0€,U .
0.1 I I
0 20 40 0o so 1OO 120 140 160 16o
80- DEGREESFigure 32. Angular Distribution of Scattering
Function--Experimental Data
65

100
z A6• 12. 0/
I-
Z
LL.
w
U)
dI-0
.0 --
0
o tI I I I I I
0 20 40 tO so 100 120 140 160 190
8'- DEGREES
Figure 33, Angular Distribution of ScatteringFunction--Experimental Data
66

100
1 13.O00
U)t&,.
w
L&J-
CI)
I.- -
o,
0.1
0 20 40 60 SO 100 120 140 IO ISO
8"'- DEGREESFigure 34. Angular Distribution of Scattering
Function--Experimental Data
67

too .
100IU-J
a.0
(0.
fu•
0 20 40 so so o o o o o0'0 4 0 6 00 120 140 160 too' DEGREESFigure 35, Angular Die5trtbutlon
Of ScatteringFunction'-EMperimental
Data
68

100
D1.0
0
U)
0 20 40 60 60 100 12 14 *890% DEGREES 10 10 IO g
Figure 36. Angular DiStribution Of Scattering
FIlnction--B.eimeta Data
69

0.?
I-J0 0 0
05 6 0Wi 0.5 0
oJC-)0
0.4F0
ýzoI-- 0
S0.3
X€U)
cr)iC 02
0 2 4 6 a to 12 14 I
X WAVE LENGTH MICRONSFigure 37. Variation of alp with Wave Length

W(6) 000-
0
U
6000-
'0
zz
- 4000
(n 2000
C/)
b 0 2 4 6 6I 10 I1 14 1
,-,WAVE LENGTH ,-MICRONSFigur-3 38
Mass Scattering Coefficient with Wave Length
0t

14000
12000zW
00
zP 600
04 6 1 0 12 14 Is
.'WAVE LENGTH - MICRONSFigure 39
Variation of Mass Extinction with Wave Length
- 7e)- *

SECTION III
RESULTS AND CONCLUSIONS
COMPARISON OF EXPERIMENTAL RESULTS WITH THEORY
In any experimental work it is possible to gain a great deal ofconfidence and perhaps to obtain personal satisfaction if it can bestated simply that the experimental results compared quite favorablywith the theoretical investigations. However, this is not possiblefor the experimental work reported herein, since the only existingtheory with which a comparison could possibly be made is the classicaltheory of Mie, and Mie's theory is limited to spherical particles ofknown refractive index. As stated earlier, no theory has been estab-lished for the case of scattering from non-homogeneous systems con-taining irregular-shaped particles.
If the scattering function obtained through computations of theMie theory for spherical particles of a known refractive index andparticle-size parameter (m ) were plotted as a function of scatteredangle (a), the resulting curve would not be a smooth function. Sucha curve would include several maxima and minima plus, in some in-stances, secondary maxima and minima, with an increase in the numberof maxima and a corresponding increase in the particle-size parameter,i.e., with a decreasing value of wave length. It is also known thatthe maxima and ml-iima do not occur at the same angle (0 ) with varia-tion in the particle-size parameter, and there is a variation in thelocation of these maxima for particles of different refractive in-dicies.
Therefore, the only comparison that can be made between the Mietheory and the results of this investigation are the "general trends"of the regular distribution curves. A comparison of this type hasbeen made assuming the refractive index of the aerosol to be 1.6,which is approximately the refractive index of aluminum oxide. Theangular distribution of the scattering function was calculated usingthe IBM11+1O Computer for a refractive index of 1.6 and particle sizeparameters (o•) of 2, 3, 1+, 5, 6, 8, and 15, with the aid of tablesof the Legendre polynomials (21) and the angular distribution coef-ficient (17). - -
The Mie scattering functions were calculated and plotted forangles of 0 between I and 180 degrees at 5-degree intervals and areincluded as an Appendix E. A cursory comparison between the angulardistribution curves plotted from this investigation and the Miecurves will show that the trends are the same. As an example, fordecreasing values of wave length (largeCK ) the ratio of the scat-tered intensity at 0 degrees compared to that at 90 degrees increasesfor both the experimental and the theoretical curves. Similarly,variations of the forward and backward scattering with variations inwave length will display the same trend. An examination of both thetheoretical and experimental curves will also emphasize the in-fluence of irregular shaped particles on the angular distribution
73

curves. The experimental curves will not depict the maxima and minimaas illustrated by the theoretical curves based on media containingnon-absorbing spherical particles.
It might be expected that a solution to the problem of scatter-ing from irregular-shaped particles could be obtained by super-imposing the results of the computations for scattering from parti-cles of a variety of sizes. This approach to the solution of theproblem would undoubtedly provide some interesting answers and mightprovide answers that would be sufficiently accurate for most engi-neering work. However, this approach would be extremely difficultand would obviously require a great expenditure of time. If this ap-proach were taken, one would intuitively feel that the results wouldindicate that for--lFrular shaped particles of various sizes andorientations the scattering function, when plotted as a function ofscattering angle (0) would approach a smooth curve; i.e., the maximaand minima for the case of spherical particles would tend to dampenout, resulting in a smooth function.
As has been shown by Van de Hulst (156), the imaginary componentof the refractive index, which must be included when considering ab-sorbing particles, can be considered a dampening component whichwould also tend to reduce the large amplitudes that occur in Miecurves for non-absorbing particles.
The results of the experimental data indicate that this is true;however, there is little information through which the experimentalresults of this investigation can be compared with experimental re-sults of other investigations, as very little information has beenreported in the literature. However, there has been an agreementwith measurements recorded as a result of experiments on light scat-tering in the atmosphere (41). Light scattering measurements on fogsand dust particles in the atmosphere result in .smooth functions whendata are plotted. Hodkinson of Great Britain reported in a paper(79) based on his Ph.D. thesis results of his angular distributionof intensity experiments on dusts of quartz, diamond, bituminous andanthracite coal. These results indicated that a smooth function wasobtained for the scattering from irregular-shaped particles. Hisdata, however, considered only the angular range between 0 and 90 de-grees and was limited to wave lengths 0.51+6 and 0.526 microns.
No method or equation has been developed which permits thecalculation of the scattering function, the mass scattering coef-ficient, and mass extinction coefficient for media containing par-ticles having irregular shapes, sizes and orientations. To obtain arealistic solution to the radiative heat transfer equation for prob-lems considering scattering and absorbing media, laboratory equip-ment must be designed to evaluate these functions experimentally.The experimental rproach to the determination of these functions isnot only feasible, but it appears to be the mo3t promising. Once theequipment is designed and developed, accurate scattering data can beobtained with relative ease.
74

The angular distribution of intensity and the mass scatteringand mass extinction coefficients were obtained for a media contain-ing particles of aluminum oxide of irregular size and shape sus-pended in air. The data was obtained for 21 wave lengths over arange of 1 to 15 microns at 0.5-micron intervals between wave lengthsof 1 and 7 microns and at 1-micron intervals between wave lengths of7 and 15 microns.
The results of this investigation indicate that the scatteringfrom irregular shaped particles will produce angular distribution ofintensity curves which are smooth functions. This further supportsthe experiments of those few who have attempted to measure the scat-tered intensity for poly-disperse media.
No exact theory exists with which to compare the experimentalresults: however, a cursory comparison with the Mie theory as wellas a study of the literature covering scattering measurements indi-cate that no irregularities have occurred during the investigationwhich would raise any doubt as to the reliability of the data.
The mass scattering coefficient calculated from the experi-mental data indicates that the scattering media contained absorbingparticles; i.e., the ratio of the mass scattering coefficient to themass extinction coefficient (•) was approximately 0.52 for all wavelengths.
The refractive index of the media has a marked influence on anytheoretical calculation of the scattering function even when spheri-cal particles are assumed. To the knowledge of the author, nosatisfactory method-exists for determining the refractive index ofpowders composed of particles having irregular size, shape and orien-tation; however, knowledge of the refractive index is not necessaryfor an experimental determination of the scattering function.
This investigaticn also revealed a stronger forward scatteringfor all wave lengths than that indicated by the Mie theory for scat-tering from spherical particles.
The design of the equipment was sufficiently versatile that datasimilar to that obtained during this investigation can be obtainedfor other types of media. It is anticipated that only a modificationin technique and procedure would be required to investigate mediacontaining other types of particles. The following improvements aresuggested before f-ut!I4investigations are attempted:
1. *The present method of measuring airflow rate should bemodified through use of a more sensitive device, such asa manometer and calibrated orifice plate.
2. An improved vacuum system would allow longer periods of timefor the collection of particles to be weighed for the den-sity calculations, unless an alternate method of obtainingmedia density could be developed.
75

3. An auxiliary optical system should be provided to investi-gate the angular distribution of intensity for the angularrange 0 to 10 degrees.
This lattersugg-estion would require a major modification in thepresent equipment, which was, of course, the primary reason that itwas not incorporated in the present design. As stated earlier, itwas the angular region 0 to 10 degrees that required alternate tech-niques in obtaining data, and skepticism toward the accuracy of thedato occurred.
It can be concluded that equipment of a design such as describedherein will provide scattering data for actual media and will aid inobtaining a more realistic solution to the radiative heat transferequation when applied to problems considering scattering and absorb-ing media.
76

SECTION IV
REFERENCES
1. Aughey, W. Henry anr F. J. Baum, "Angular-Dependence Light Scat-tering--A Hinh-Resolution Recording Instrument for the AngularRange 0.O5-1 00," J. Opt. Soc. Am., XLIV (1954), pp. 833-837.
2. Barnes, Marion D., and Victor K. LaMer, "Monodispersed Hydro-phobic Colloidal Dispersions and Light Scattering Properties.II. Total Scattering from Transmittance as a Basis for theCalculation of Particle Size and Concentration," J. Colloid Sci.,I (1946), pp. 79-91.
3. Barnes, Marion D., A. S. Kenyon, E. M. Zaiser, "MonodispersedSulfur Sols. IV. Comparison of the Particle Radius Determinedby Transmittance and by the Angular Positions of Higher OrderTyndall Spectra from the Mie Theory," J. Colloid Sci., II(1947), pp. 349-359.
4. Bateman, J. B., E. J. Weneck, and D. C. Eshler, "Determinationof' Particle Size and Concentration from SpectrophotometricTransmission," J. Colloid Sci., XIV (1959), pp. 308-329.
5. Blevin, W. R. and W. J. Brown, "Light Scattering Properties ofPigment Suspensions," J. Opt. Soc. Am., LI (1961), p. 975.
6. Boll, R. H., R. 0. Gumprecht, and C. M. Sliepcevich, "TheoreticalLight-Scattering Coefficients for Relative Refractive IndicesLess than Unity and for Totally Reflecting Spheres," J. Opt. Soc.Am., XLIV (1954), p. 18.
7. Boll, R. H. and C. M. Sliepcevich, "Evaluation of Errors of Opti-cal Origin Arising-in the Size Analysis of a Dispersion by LightTransmission," J. Opt. Soc. Am., XLVI (1956), pp. 200-208.
8. Bonnelycke, Byrg E. and W. B. Dandliker, "Light Scattering ofColloidal Silica," J. Colloid Sci., XIV (1959), pp. 567-571.
9. Born, Max and E. Wolf. Principles of Optics, London: PergamonPress, 1959.
10. Brackett, Frederick S. and Elliot Charney, "Apparatus for Measur-ing the Spectral Dependence of Light Scattering from Large Par-ticles," J. Opt. Soc. Am., L (1960), pp. 811-812.
11. Bugnolo, D. S., "Transport Equation for the Spectral Density ofa Multiple-Scattered Electromagnetic Field," J. Appl. Phys.,XXXI (19 6 0),-pp-.-1176-11 8 2.
12. Butler, Warren L., "Absorption of Light by Turbid Materials,"J. Opt. Soc. Am., LII (1962), pp. 292-299.
77

13. Carr, C. I., Jr., and B. H. Zimm, "Absolute Intensity of LightScatteeing from Pure Liquids and Solutions," J. Chem. Phys.,XVIII (1950), pp. 1616-1626.
14. Chandrasekhar, S. Radiative Transfer, Oxford University Press(1950), Dnver Publications (1960).
15. Chromey, F. C., "Evaluation of Mie Equations for ColoredSpheres," J. Opt. Soc. Am., L (1960).
16. Chu, C. M. and S. W. Churchill, "Numerical Solution of Problemsin Multiple Scattering of Electromagnetic Radiation," J. Phys.Chem., LIX (1955), pp. 855-863.
17. Chu, C. M., C. C. Clark, and S. W. Churchill. Tables of Angu-lar Distribution Coefficients for Light-Scattering by Spheres.University of Michigan Press, Engineering Research Institute(1957).
18. Churchill, S. W., C. M. Chu, L. B. Evans, L. C. Tien, and S. C.Pang. Exact Solutions for Anisotropic, Multiple Scattering byParallel Plane Dispersions, DASA - 1257 (1961).
19. Churchill, S.J. __G. C. Clark, and C. M. Sliepcevich, "Light-Scattering by Very Dense Monodispersions of Latex Particles,"Faraday Society Discussions, XXX (1960), pp. 192-199.
20. Clark, Geo. C., Chiao-Min Chu and Stuart W. Churchill, "AngularDistribution Coefficients for Radiation Scattered by a Spheri-cal Particle," J. Opt.. Soc. Am., XLVII (1957), pp. 81-84.
21. Clark, G. C. and S. W. Churchill. Legendre Polynomials, Uni-versity of Michigan Press, Engineering Research Institute(1957).
22. Cleveland, E. Lynn, and Richard C. Raymond, "Scattering ofVisible and Near Infra-red Radiation by Layered Distributionsof Small Metal Spheres," J. Opt. Soc. Am., XLII (1952), pp. 183-186.
23. Corn, M., "Orientation of Dust Particles During and After Set-tling in Water," J. Colloid Sci. (to be published).
24. Coumou, D. J., "Apparatus for the Measurement of Light Scatter-ing in Liquids. Measurement of the Rayleigh Factor of Benzeneand of Some Other Pure Liquids," J. Colloid Sci., XV (1960),pp. 408-417.
25. Dandliker, Walter B., "Light Scattering Studies of a PolystyreneLatex," J. Am. Chem. Soc., LXXII (1950), pp. 5110-5116.
26. Debye, P. "Light Scattering in Soap Solutions," J. Colloid Sci.,III (19483, pp. 407-409.
78

27. DeirmendJian, D., R. Clasen, and W. Viezee, "Mie Scattering withComplex Index of Refraction," J. Opt. Soc. Am., LI (1961),pp. 620-633.
28. Denman, H., W. Heller, and W. J. Pangonis. Angular ScatteringFunctions for Spherical Particles II, Detroit: Wayne StateUniversity Press, 1963.
29. DeVore, J. R. and A. H. Pfund, "Optical Scattering by DielectricPowders of Uniform Particle Size," J. Opt. Soc. Am., XXXVII(1 9 47), pp. 826-832.
30. Dezelic, GJuro, and Josip P. Kratohvil, "Determination of Par-ticle Size of Polystyrene Latexes by Light Scattering," J. Col-loid Sci., XVI (1961), pp. 561-580.
31. Doty, Paul and Robert F. Steiner, "Light Scattering and Spectro-photometry of Colloidal Solutions," J. Chem. Phys., XVIII(1950), pp. 1211-1220.
32. Drude, Paul. The Theory of Optics, (Translated from the Germanby C. Riborg Mann and Robert A. Millikan) New York: Dover Pub-lications, Inc., 1959.
33. Duntley, Seibert Q., "The Optical Properties of Diffusing Ma-terials," J. Opt. Soc. Am., XXXII (19&2), pp. 61-69.
34. Ellison, J. McK., "Extinction of Light by Suspensions of SilicaDust," Proc. Phys. Soc. Brit., LXX (1957), pp. 102-111.
35. Erlander, Stig R., and Dexter French, "Dispersion of StarchGranules and tho Validity of Light Scattering Results onAmylopectin," J. Am. Chem. Soc., LXXX (1958), pp. 4413-4420.
36. Filler, A. S. and L. Indyk, "Calibration of Infra-Red PrismSpectrometers," J. Opt. Soc. Am., LI (1961).
37. Fishma.n, M. M.t. Light Scattering by Colloidal Systems - An An-notated Billiography, River Edge, New Jersey: Technical ServiceLaboratories, 1957.
38. Forsythe, W. E. Measurement of Radiant Energy, New York:McGraw-Hill Book Company, Inc., 1932.
39. Frei, K. and Hs. H. Gunthard, "Distortion of Spectral LineShapes by Recording Instruments," J. Opt. Soc. Am., LI (1961),pp. 83-86.
40. Gibbons, Mathew G., .Frank I. Laughridge, John R. Nichols, andNicholas A. Krause, "Transmission and Scattering Properties ofa Nevada Desert Atmosphere under Cloudy Conditions," J. Opt.Soc. Am., LII (1962), pp. 38-43.
79

41. Gibbons, Mathew G., John R. Nichols, Frank I. Laughridge, andRalph L. Rudkin, "Transmission and Scattering Properties of aNevada Desert Atmosphere," J. Opt. Soc. Am., Li (1961),pp. 633-640.
42. Goldstein, M., "Depolarized Components of Light Scattered byGlasses," J. Appl. Phys., XXX (1959), pp. 493-506.
43. Greenberg, J. Mayo, "Scattering by Nonspherical Particles,"J. Appl. Phys., XXXI (1960), pp. 82-84.
44. Greenberg, J. Mayo, Norman E. Pedersen, and Jeanne C. Pedersen,"Microwave Analog to the Scattering of Light by NonsphericalParticles," J. Appl. Phys., XXXII (1961), pp. 233-242.
45. Gucker, Frank T. and James J. Egan, "Measurement of the AngularVariation of Light Scattered from Single Aerosol Droplets,"J. Colloid Sci., XVI (1961), pp. 68-84.
46. Gucker, F. T. and R. L. Rowell, "Tle Angular Variation of LightScattered by Single Dioctyl Phthalate Aerosol Droplets," FaradaySodiety Discussions, XXX (1960), pp. 185-191.
47. Gumprecht, R. 0. and C. M. Sliepeevich. Tables of Light Scat-tering Functions for Spherical Particles, University of MichiganPress, Engineering Research Institute (1951).
48. Gumprecht, R. 0. and C. M. Sliepcevich, "Scattering of Light byLarge Spherical Particles," J. Phys. Chem., LVII (1953),pp. 90-95. --
49. Gumprecht, R. 0., and C. M. Sliepcevich, "Measurement of Par-ticle Sizes in Polydispersed Systems by Means of Light Transmis-sion Measurements Combined with Differential Settling," J. Phys.Chem., LVII (1953), pp. 95-97.
50. Gumprecht, R. 0., N. L. Sung, J. H. Chin, and C. M. Sliepcevich,"Angular Distribution of Intensity of Light Scatte,'ed by LargeDroplets of Water," J. Opt. Soc. Am., XLII (1952), pp. 226-231.
51. Hardy, A. C., and F. M. Young, "In Defense of Beer's Law,"J. Opt. Soc. Am., XXXVIII (1948), pp. 854-858.
52. Harrison, J. A. and C. D. Reid, "Infra-Red Absorptiometer, UsingInterference Filters, for Analysis of Hydrogen Fluoride inGqseous Mixtures," J. Sci. Instr., XXXVI (1959), p. 240.
53. Hart, Robert W. and Elliott W. Montroll, "On the Scattering ofPlane Waves by Soft Obstacles. I. Spherical Obstacles,"J. Appl. Phys., XXII (1951), pp. 376-386.
54. Hart, R. W., and E. W. Montroll, "Sound Scattering of a PlaneWave from a Nonabsorbing Sphere," J. Acoust. Soc. Am., XXIII(1951), pp. 323-329.
80
55. Heller, W., "Tyndall Spectra Their Significance and Applica-tions," J. Chem. Phys., XIV b1946), p. 565.
56. Heller, Wilfried, "Theoretical Investigations on the LightScattering of Colloidal Spheres. II. Accurate Interpolationsof Theoreticaljjxn.bidity-Data," J. Chem. Phys., XXVI (1957),pp. 920-922.
57. Heller, Wilfried, "Theoretical Investigations on the LightScattering of Colloidal Spheres. III. Analytical Expressionsfor Turbidity Approximating the Performance of the Mie Egua-tions Prior to the First Maximum," J. Chem. Phys., XXVI (1957),pp. 1258-1264.
58. Heller, Wilfried, Hari L. Bhatnagar, and Masayaki Nakagaki,"Theoretical Investigat 4 ons on the Light Scattering of Spheres.XIII. The 'Wavelength Exponent' of Differential TurbiditySpectra," J. Chem. Phys., XXXVI (1962), pp. 1163-1170.
59. Heller, W. and H. James McCarty, "Theoretical Investigations onthe Light Scattering of Colloidal Spheres. IV. Specific Turbid-ities in the Lower Microscopic Range and Fine Structure Phe-nomena," J. Chem. Phys., XXIX (1958), pp. 78-80.
60. Heller, Wilfried and Masayuki Nakagaki, "Theoretical Investiga-tions on the Light Scattering of Colloidal Spheres. VII. Dis-symmetry in Unpolarized and Polarized Light," J. Chem. Phys.,XXXI (1959), pp. 1188-1195.
61. Heller, Wilfried, Masayuki Nakagaki, and Morton L. Wallach,"Theoretical Investigations on the Light Scattering of ColloidalSpheres. V. Forward Scattering," J. Chem. Phys., XXX (1959),pp. 444-450.
62. Heller, Wilfried and William J. Pangonis, "Theoretical Investi-gations on the Light Scattering of Colloidal Spheres. I. TheSpecific Turbidity," J. Chem. Phys., XXVI (1957), pp. 498-506.
63. Heller, Wilfried and Thomas L. Pugh, "Experimental Investiga-tions on the Effect of Light Scattering Upon the RefractiveIndex of Colloidal Particles," J. Colloid Sci., XII (1957),pp. 294-307.
64. Heller, Wilfried, and Richard M. Tabibian, "Experimental Investi-gations on the Light Scattering of Colloidal Spheres. II.Sources of Err-or--lnrTurbidity Measurements," J. Colloid Sci.,XII (1957), pp. 25-39.
65. Heller, W., and Richard Tabibian, "Experimental Investigationson the Light Scattering of Colloidal Spheres. IV. ScatteringRatio," J. Phys. Chem., LXVI (1962), pp. 2059-2065.
66. Henry, R. L., "The Transmission of Powder Films in the Infra-Red,"'J. Opt. Soc. Am., XXXVIII (1948), pp. 775-789.
81

67. Hill, F. B. and R. H. Wilhelm, "Radiative and Conductive HeatTransfer in a Quiescent Gas-Solid Bed of Particles," J. Am. Inst.Chem. Engr., V (1957).
68. Hughes, W. J., and P. Johnsen, "The Construction and Testing ofa 'Universal' Light Scattering Apparatus," J. Sci. Instr., XXXV(1958), pp. 57-59.
69. Hutchinson, Eric, Physical. Chemistry, Philadelphia (London):W. B. Saunders Co., 1962.
70. Jakob, M. Heat Transfer, I. J. Wiley and Sons (1949).
71. Jakob, M. Heat Transfer, II. J. Wiley and Sons (1957).
72. Jenkins, Francis A., and Harvey E. White. "hundamentals ofOptics, 2nd ed., New York: McGraw-Hill Book Company, Inc.,1950.
73. Johnson, Irving, and Victor K. LaMer, "The Determination of theParticle Size of-Monodispersed Systems by the Scattering ofLight," J. Am. Chem. Soc., LXIX (1957), pp. 1184-1192.
7 4 . Jones, J. F., "Method of Double Beam Spectrophotometry in theVacuum Ultra-Violet," J. Sci. Instr., XXXVI.
75. Kahn, A. H., "Phase-Shift Method for One Dimensional Scatter-ing," Am. J. Phys., XXIX (1961), pp. 77-80.
76. Kauzman, Walter. Quantum Chemistry, New York: Academic Press,Inc., 1957.
77. Keith, C. H., and J. C. Derrick, "Measurement of the ParticleSize Distribution and Concentration of Cigarette Smoke by the'Conifuge,'" J. Colloid Sci., XV (1960), pp. 340-356.
78. Keller, Joseph B., "Geometrical Theory of Diffraction," J. Opt.Soc. Am., LII (1962), pp. 116-130.
79. Kerker, Milton, Electromagnetic Scattering, Proceedings of theInter-disciplinary Conference held at Clarkson College ofTechnology, Potsdam, New York. New York: Pergamon Press, 1963.
80. Kerker, M., "The Use of White Light in Determining ParticleRadius by the Polarization Ratio of the Scattered Light,"J. Colloid Sci., V (1950), pp. 165-167.
81. Kerker, Milton, and Merle I. Hampton, "The Use of UnfilteredLight in Determining Particle Radius by the Polarization Ratioof the Scattered Light," J. Opt. Soc. Am., XLIII (1953),pp. 370-372.
82. Kerker, Milton, and Victor K. LaMer, "Particle Size Distribu-tion in Sulfur Hydrosols by Polarimetric Analysis of ScatteredLight," J. Am. Chem. Soc., LXXII (1950), pp. 3516-3525.
82

83. Kerker, M., D. Lee, and A. Chou, "The Molecular Weight of Phos-photungstic Acids by Light Scattering," J-. Am. Chem. Soc., LXXX(1958), pp. 1539-1545.
84. Kerker, Milton and Egon Matijevio, "Light Scattering of Mono-dispersed Polystyrene Latexes," J. Opt. Soc. Am., L (1960),pp. 722-729.
85. Kourganoff, V. Basic Methods in Heat Transfer Problems, OxfordUniversity Przs( 1952).
86. Kratohvil, J. P., Gj. Dezelic, M. Kerker, and E. Matijevic,"Calibration of Light-Scattering Instruments: A Critical Sur-vey," J. Polymer Sci., LVII (1962), pp. 59-78.
87. Kubelka, Paul, "New Contributions to the Optics of IntenselyLight-Scattering Materials. Part I." J. Opt. Soc. Am.,XXXVIII (1948), pp. 448-457 .
88. Kunz, K. S. Numerical Analysis, New York: McGraw-Hill BookCompany, 1957.
89. LaMer, Victor K., and Marion D. Barnes, "Monodispersed Hydro-phobic Colloidal Dispersions and Light Scattering Properties.I. Preparation and Light Scattering Properties of MonodispersedColloidal Sulfur," J. Colloid Sci., I (1946), pp. 71-76.
90. LaMer, Victor K., and Marion D. Barnes, "A Note on the Symbolsand Definitions Involved in Light Scattering Equations,"J. Colloid Sci., II (1947), pp. 361-363.
91. LaMer, V. K., and I. W. Plesner, "Letters to the Editor,"J. Polymer Sci., XXIV (1957), pp. 147-150.
92. Langer, G., and A. Lieberman, "Anomalous Behavior of AerosolProduced by Atomization of Monodisperse Polystyrene Latex,"J. Colloid Sci., XV (1960), pp. 357-360.
93. Larkin, B. K., and S. W. Churchill, "Scattering and Absorptionof Electromagnetic Radiation by Infinite Cylinders," J. Opt.
.Soc. Am., XLIX (1959), pp. 188-190.
94. Larkin, B. K. and S. W. Churchill, "Heat Transfer by Radiationthrough Porous Insulations," J. Am. Inst. Chem. Engr., V(1959), pp. 467-474.
95. Lindsey, R. B. Mechanical Radiation, New York: McGraw-HillBook Company, Inc., 1960.
96. Love, Tom J.--Jr3.rAn Investigation of Radiant Heat Transferin Absorbing. Emitting and Scattering Media, Norman, Oklahoma:University of Oklahoma Research Institute, i 63. (ContractAF 33 (657)-8859) (ARL63-3).
83

97. Lowan, A. Tables of Scattering Functions for SDher!qaj_ t-cles, National Bureau of Standards (U.S.), Applied MathematicsSeries 1+ (1949).
98. McCartney, J. T. and S. Ergun, "Refractive Index and Thicknessof Ultrathin Sections of Coals and Graphite by Interferometry,"JT Opt. Soc. Am., LII (1962).
99. McIntyre, D., and G. C. Doderer, "Absolute Light-ScatteringPhotometer: Design and Operation," J. Res. Natl. Bur. Std.,LXII (1959), pp. 153-159. (Research Paper 2946)
100. Mallette, F. S. Air Pollution, New York: Reinhold PublishingCorporation, 1955.
101. Maron, Samuel H., and Richard L. H. Lou, "Calibration of LightScattering Photometers with Ludox," J. Polymer Sci., XIV(1954), pp. 29-36.
102. Matijevic, E., M. Kerker, and K. F. Schulz, "Light Scatteringof Coated Aerosols. Part I - Scattering by the AgCl Cores,"Faraday Soc. Discussions, XXX (1960), pp. 178-184.
103. MatiJevic, E., R. H. Ottewill, and M. Kerker, "Light Scatteringby Infinite Cylinders. Spider Fibers.,", J. Opt. Soc. Am., LI(1961), pp. 115-116.
104. Matijevic, E., K. F. Schulz, and M. Kerker, "Light Scatteringof Coated Aerosols. II. Scattering by Linolenic Acid Aero-solas," J. Colloid Sci., XVII (1962), pp. 26-38.
105. Meehar, E. 3., and Z. Z. Hugas, "Light Scattering Functions forSpherical Particles with m = 1.65 (0.05) 185," J. Opt. Soc. Am.,LI (1961), p. 260.
106. Middleton, W. E. Knowles. Vision Through the Atmosphere,Toronto: University of Toronto Press, 1952.
107. Middleton, W. E. Knowles, "Diffusion of Ultraviolet and VisibleLight by Ground Surfaces of Fused Quartz," J. Opt. Soc. Am., L( 1960)9 pp. 747--19.
108. Millikan, R. C., "Measurement of Particle and Gas Temperaturesin a Slightly Luminous Premixed Flame," J. Opt. Soc. Am., LI(1961), p. 535.
109. Montroll, E. W., and J. M. Greenberg, "Scattering of PlaneWaves by Soft Obstacles. III. Scattering by Obstacles withSpherical and Circular Cylindrical Symmetry," Phys. Rev.,LXXXVI (1952), pp. 889-898.
110. Nakagaki, Masayuki, and Wilfried Heller, "Theoretical Investi-gations on the Light Scattering of Colloidal Spheres. VI.Backward Scattering," J. Chem. Phys., XXX (1959), pp. 783-786.
84+

111. Nakagaki, Masayuki, and Wilfried Heller, "Theoretical Investi-gations on the Light Scattering of Colloidal Spheres. VIII.Angular Locati7on of Intensity Maxima and Minima in the Radia-tion Diagram of Colloidal Spheres," J. Chem. Phys., XXXII(1960), pp. 835-842.
112. Olson, Donald R., "Research Proposal on Self-Ignition of FuelDroplets," submitted to National Science Foundation by Depart-ment of Mechanical Engineering, Pennsylvania State University.
113. Osborne, A. B. "7 KW Plasma Jet for Laboratory Use," J. Sci.Instr., XXXVI 11959), p. 317.
114. Pangonis, William J., Wilfried Heller, and Nicolaos A.Economou, "Theoretical Investigations on the Light Scatteringof Colloidal Spheres. IX. Lateral Scattering at 900 fromIncident Natura~-and Linearly Polarized Light," J. Chem. Phys.,XXXIV (1961), pp. 960-970.
115. Pangonis, W. M., W. Heller, and A. Jacobson. Tables of LightScattering Functions of Spherical Particles, Dotroit: WayneState University Press, 1957.
116. Penndorf, R. New Tables of Mie Scattering Functions, Geo-physics Research Directorate, Air- Force Cambridge ResearchCenter, (Parts 1, 2, 3, 4t 5, 6; m = 1.33, 1.40, 1.9+, 1.486,and 1.50).
117. Penndorf, R., "Scattering Coefficients for Absorbing and Non-absorbing Aerosols," Research on Aerosol Scattering in theInfrared, Scientific Report No. 3, Bedford, Massachusetts:Air Research and Development Command, United States Air Force,1960. (Avco Corp., Tech. Rept. RAD-TR-60-27).
118. Penndorf, Rudolf B., "Atlas of Scattering Diagrams for n =1.33," Research on Aerosol Scattering in the Infrared, Scien-tific Report No. 5, Bedford, Massachusetts, Office of Aero-space Research, United States Air Force, 1961 (AFCRL-1O044;Avco RAD-TR-61-32) 69 pages.
119. Penndorf, Rudolf B., "An Approximation Method to the MieTheory for Colloidal Spheres," J. Phys. Chem., LXII (1958),pp. 1537-154.2.
120. Penndorf, Rudolf B., "Angular Mie Scattering," J. Opt. Soc.Am., LII (1962), pp. 402-408.
121. Planck, M. Theory of Heat, London: MacMillan and Company,Limited, 1932.
122. Planck, M. Theory of Light, London: MacMillan and Cbmpany,Limited, 1932.
123. Planck, Max. The Theory of Heat Radiation, New York: DoverPublications, Inc.
85

124. Pritchard, B. S. and W. G. Elliott, 'Two Instruments for At-mospheric Optics Measurements," J. Opt. Soc. Am., L (1960),pp. 191-202.
125. Roof, R. B., Jr., "Experimental Determination of Atomic Scat-tering Factors," J. Appl. Phys., XXX (1959), pp. 1599-1603.
126. Sato, T., and R. Matsumoto, "Radiant Heat Transfer fromLuminous Flame," Intern. Heat. Transfer Conference Proc. (1961).
127. Saunderson, J. L., 'Calculation on the Color of PigmentedPlastics," J. Opt. Soc. Am., XXXII (1942), pp. 727-736.
128. Schiff, L. I., "Approximation Method for Short Wave-length orHigh-Energy Scattering," Phys. Rev., CIV (1956), pp. 1481-1485.
129. Schiff, L. I., "Scattering of Waves and Particles by In-homogeneous Regions," J. Opt. Soc. Am., LII (1962), pp. 140-144.
130. Schuster, A., "Radiation Through a Foggy Atmosphere,"Astrophys. J., XXI (1905), pp. 1-22.
131. Sekera, Z., "Light Scattering in the Atmosphere and thePolarization of Sky Light," J. Opt. Soc. Am., XLVII (1957),pp. 484-490.
132. Sinclair, David, "Light Scattering by Spherical Particles,"J. Opt. Soc. Am., XXXVII (1947), pp.-475-480.
133. Sinclair, D. Physical Properties of Aerosols, New York:McGraw-Hill Book Company, Inc., 1952.
134. Sinclair D., and V. K. LaMer, "Light Scattering as a Measureof Particle Size in Aerosols," Chem. Rev., 2Q.IV (1949),pp. 245-267.
135. Slavin, Walter, R. W. Mooney, and D. T. Palumbo, "Energy-Recording Spectrofluorimeter," J. Opt. Soc. Am., LI (1961), 93.
136. Sleator, F. B., "A Variational Solution to the Problem ofScalar Scattering by a Prolate Spheroid," J. Math Phys., XXXIX(1960), pp. 105-120.
137. Sliepcevich, C. M., and Gumprecht, R. 0., "Scattering of Lightby Large Spherlcal Particles," J. Phys. Chem., LVII (1953),p. 90.
138. Slutsker, A. I., and V. A. Marikin, "Certain Problems in theTheory of the Scattering of Electromagnetic Radiation by Sub-microscopic Nonspherical Particles," Opt. and Spectroscopy, X(1961), p. 116.
86
139. Slutsker, A. I., and V. A. Marikin, "Measurement of the Trans-mittance of a Light-Scattering Medium as a Method of StudyingInhomogeneities in it," Opt. and Spectroscopy, X (1961),pp. 263-266.
140. Stacey, K. A. Light Scattering in Physical Chemistry, NewYork: Academl6 Press, 1956.
141. Stavropoulos, Napoleon, "Deposition of Particles from Turbu-lent Gas Streams," a thesis submitted in partial fulfillmentof the requirements for the degree of Master of Science to theFaculty of Engineering, Columbia University (1954).
142. Stegun, Irene A., and Milton Abramowitz, "Generation of CoulombWave Functions by Means of Recurrence Relations," Phys. Rev.,XCVIII (1955), pp. 1851-;852.
143. Stein, R. S., P. R. Wilson, and S. N. Stidham, "Scattering ofLight by Heterogeneous Spheres," J. Appl. Phys., XXXIV (1963),pp. 46-50.
144. Stevenson, A. F., "Electromagnetic Scattering by an Ellipsoidin the Third Approximation," J. Appl. Phys., XXIV (1953),pp. 1143-1151.
145. Stevenson, A. F.. "Note on Krishman's ReciprocIty Relation inLight Scattering," J. App. Phys., XXVIII (1957), pp. 1015-1016.
146. Stevenson, Arthur F., Wilfried Heller, and Morton L. Wallach,"Theoretical Investigations on the Light Scattering of Col-loidal Spheres. XI. Determination of Size DistributionCurves from Spectra of the Scattering Ratio or from De polar-ization Spectra," J. Chem. Phys., XXXIV (1961), pp. 1789-1795.
147. Stratton, J. A. Electromagnetic Theory, 1st ed., New York:McGraw-Hill Book Company, Inc., 1941.
148. Sykes, J. B., "Approximate Integration of the Equation ofTransfer," Monthly Notes of Royal Astronomical Society, III(1951).
149. Tabibian, Richard M., and Wilfried Heller, "Experimental In-vestigations on the Light Scattering of Colloidal Spheres.III. The Specific Scattering @ 900," J. Colloid Sci.. XIII(1958), pp. 6-23.
150. Tabibian, Richard M., Wilfried Heller, and Joseph N. Epel,"Experimental Investigations on the Light Scattering of Col-loidal Spheres. I. The Specific Turbidity," J. Colloid Sci.,XI (1956), pp. 195-213.
151. Theimer, 0., and J. Canfield, "Theoretical Analysis of LightScattering Irregular Dislocation Networks," J. Appl. Phys.,XXXIII (1962), pp. 570-574.
87

152. Thring, M. W., R. J. Foster, I. A. McGrath, and J. S. Ashton,"Prediction of the Emissivity of Hydrocarbon Flames," Intern.Heat Transfer Conference Proc. (1961).
153. Tobias, R. Stuart and S. Young Tyree, Jr., "Application ofLight Scattering to the Study of the Hydrolytic Aggregationof Ions," J. Am. Chem. Soc., LXXXI (1959), PP. 6385-6389.
154. Tobias, R. S., and S. Y. Tyree, Jr., "Studies on HyarolyzedBismuth (III) Solutions, II. Light Scattering," J. Am. Chem.Soc., LXXXII (1960), pp. 3244-3249.
155. Twersky, V., "Multiple Scattering of Waves and Optical Phe-nomena," J. Opt. Soc. Am., LII (1962), p. 145.
156. Van de Hulst, H. C., Light Scattering by Small Particles,New York: J. Wiley and Sons, 1957.
157. Verba, J. and R. Hawrylak, "Continuous Rotation ScatteringChamber of New Design," Rev. Sci. Instr., XXXII (1961),pp,. 1037-1039.
158. Verschoor, J. D. and P. Greebler, "Heat Transfer by Gas Con-duction and Radiation in Fibrous Insulation," Transactions,Am. Soc. Mech. Engr., LXXIV (1952), pp. 961-962.
159. Viskanta, Raymond. Heat Transfer in Thermal Radiation Ab-sorbing and Scattering Media Argonne, Illinois: ArgonneNational Laboratory, 1960. ?Based on a thesis submitted tothe faculty of Purdue University in partial fulfillment ofthe requirements for the degree of Doctor of Philosophy.)ANL-6170.
160. Wallach, Mnrton L., Wilfried Heller, and Arthur F. Stevenson,"Theoretical Investigations in the Light Scattering of Col-loidal Spheres.-- XII. The Determination of Size DistributionCurves from Turbidity Spectra," J. Chem. Phys., XXXIV (1961),pp. 1796-1802.
161. Walton, W. A., "Supplement on Particle-Size Analysis," Trans-actions, Inst. Chem. Engr., XXV (1947), pp. 141-142.
162. Williams, C. S., "Discussion of the Theories of Cavity-TypeSources of Radiant Energy," J. Opt. Soc. Am., LI (1961),p. 564.
163. Wyatt, Philip J., "Scattering of Electromagnetic Plane Wavesfrom Inhomogeneous Spherically Symmetric Objects," Phys. Rev.,CXXVII (1962), pp. 1837-1843.
164. Yokobori, S., Study on the Emissivity of a Gas Which ContainsParticles," Intern. Heat Transfer Conference Proc. (1961).
88

165. -Zabrodsky, S. S., "Heat Transfer by a Fluidized Bed," Intern.Heat Transfer Conference Proc. (1961), p. 737.
166. Zimm, Bruno H., "The Scattering of Light and the Radial Dis-tribution Function of High Polymer Solutions," J. Chem. Phys.,XVI (1948), pp. 1093-1099.
167. Zimm, Bruno H., "Apparatus and Methods for Measurement andInterpretation of the Angular Variation of Light Scattering;Preliminary Results on Polystyrene Solutions," J. Chem. Phys.,XVI (1948), pp. 1099-1116.
89

APPENDIX A
ANGULAR DISTRIBUTION OF SCATTERING FUNCTION
M #i f ~y O M odMM M% -o f-00aMa% 0ý 0" %c aI rMfC% %aM% fwo RdW0~~ Nq4g
* P: .05 A o .. . 000j000000000I I 1,0006.0 .0 d
CUt % tmrMt 40oqswa
0 Uef#1 o f" C%-#0WM uCf ~pW f,
S4 - ly 40 0-P 0 a %0 # M N M %0 y 0e M W %0 # 0n in 0 -# 6 04 0 0 0 l%0
low 9 It MfyNNN
ad
M ' 0, y0r ' 00'raI n'a 4rW 'ts 44P,, 0i .- .- oA- 0Av %m0m' 0P0tHI#ffItW04%f --MVN" o#r,"0efV% " MT 0N a afqV% 4 0 4 0%M 4 % W%0%rypaN w04 "
N w ftni 0%Naefpo ppctp roo " ommOt
0 I
on0 M %#Pofb~i~ l-nQt0W w#14 ~fM -A f
W O 4V4%?- * 0WMC4 NMMOWM4 VP4 *t- P MNodm040 N 04WNWt %V0"4I "m0 CAlm o
* 00 0060 0000 0000 0 o&0000 ge WaU) dN 4t o4m4a V df q0
Hv, z ; ; ;A 4 zr4 .0Po g*04 0
"Moo Pm" #MN p
& M 0 04 0a 0 0 0 0 N 0 M M 0 . .0 0
NNUW9 i N0
90

o 0 0 ý0~ ocON -40 r0% Mm0wPC4 C r0 0U 2 0Na -W "mNq l -0L
od t-*@ O* 6 e% .a.. to@ %qwi i ,Ntnow wr% w
N W O* a 0 (P em V 0 f" %t 0% 60 0 0l #t 0 1- In 0 v 0 0c No go * 0 %0
-" NW 000 w. WP P- P--40%
O0)w% f"9400 06000 N *060"*@" 000 6060 06060 60y% #q
44J0"m yp d000 I ' ct o F l -f a%%%% 0% 0 6U
N 0400M4O:0:0Nosost
Q, 0 4( M0mm% yP no f 0% )i 4p "4 ya0r"
0. 0 4 a
V.d
0C%44 CO Y#S C d MtA-PP-CC ý% 0o O 4f
N O WA ygo*0 N % " c 0rN 4 0paN t t N91-ds

.44wo 0 cccC c#o #"a nitAp ni %c 4Ai
0 &0N0Nf *o1 i i4 4N0I 0I-ffo - -i -M %a00FSp
U b oo # 0 0 0~010 MP0400W00 1- 00 o LM g***~oOpor05
pwi nMi #4#f nrif yNNtvNNNNNN#
o% o*i
PNtoMnI e44i M N......V
Ne o4rw k" vi F00 00 0 6 04005006000000ft 00% a *
ONMIa %"Po0 O O MMd o o v
0 44 bp b -P oMI 4 M** * * * 06 06 14P 00 06*0*600
N 41 w M 0I n0 N 0C s40I fC 0M O 0lota 0t-pa - - - - - p 44 44 4o 4Q 4
WON NNWNNNF NNcyNmNmm awe amemo w w com
92

caa ccc ooP- at0 %W wP 400 F %W A0 opatmNwwmm44w4m"0 004a kMt4NMW %WWW%00% n4 0w0 w"NNmm r% nq -?-V "N%
fn e g * * . * *61 In I In m 0 t In i V% n &A in * o ee tog e %0 0
Vlkg -0 - kp ' ' ot %m n0i t44wC r 7 -NNNN4
in PaC oNww"i m0Ni kN oa , -0wP -wa %GC4 o "- 04,- "% c0( %p -O v0 7 o 00f %p
rym 0 0 %m m0%6 @ g **I fv %k n% 4t 0 w -?-s DC 4O %
tr% eq tW% % ri #% rr4 rwl eq
w 0O f y0f 4p A4 )f 0t tF "t P do 04Rfw4wN DDpO oDdDN O f"Ct 4i ,q %vwNC
o f"W wi dwAm0f a0R -00t 4I o1 4 4m% -4 0O*mpl-0 0 qp fq r k "0 rm d"d"a o"NNNmmmmmmm #wo %0I %Q%
In W% $A o Mg In0&00060RA000n00 sNe IAAAU gM nW AI % nI nW
In2 A&m"i pftm0m"u f nAi -0f rN0fod"O 0- NaI "0W PN1 0- eQMg v0Pt- k- .%0I 00R bw uv "aem00 V?*0C -0N0 o4
qrq e% f wm% g0P tlDc A0q cf n4 "p rPitw e # N nin t W a 4q % o aao P a a40lpOk0 0PdOdo" f"MM MMmmf "f "I "f "1 "mf "f "o r% Vq* 0
Ok0a 4MW# 6O q p dF n0r t o4 dt w4 %0r40 CONNNNC COCO01 04 O 04 M 0 0 Omd40'IMME0f~to O Wggg #N 490040 M0 i 40 6o02pb % eg s*opgoc4pet
93

o% $A 1*IF nO koa o
gee......I ON W 0N ga... pbl *Oeowe gOONa
II 04 * 0 m M 0 0q WN * " 0 % in 4 m N 0 a N M m
0 N 0 V V1 060100"00Nat t "e.. . 0 0 60066eag0%Fim
cmo O* Nnp 0o4-m m ON mMop-I -"a0aao0 ta0"" #0M44q -aw0
0%MW %MU NW a4t 0044t 0444P
II0 0 * W% o0 In 0 In M 0 % we 0 0 N 0 0 o M 0 " 0
4 N W %t 04PP.aa0 w. N NN m AM 4M& WM
914

MON lOOMN
w, Now. 4e ON ~ e '. 0, 00 0,00t O 040"4 0 10M000
itP V %0 o . %%0m'
O. VP~ In 64 UNW %i n O n % 01 aQ4 a1 -%0 0 00 00 0 0a 60 0 00 00
%a aIN&0 -0t d 2cm40 %I0 f 4N% dW %0 "PtFO 0voC bq # 0kPe fi N odIn q Id0 A
LM f %a n0 P a#NCPi wo
.94 tomr 4o 0q df r tI "0P df n f n
0 4P o0 r0P "Wv oP -0%0g d# "00 9 e4 %9poo% a4 *IRp -P -P w -PWp -a4 0aa4 0s r0
inodq N040 64% 4 .N 0 " b w 4N ftoN % N 0 O44N f a k - %I"
41 ~ ?-de @0WIP4 NI~ #140e 4twd i 0 46%wId#f o~%
r. a 4 N 4o n wo 4 9f 0 oi o w4 % oo EDS@ PO.4NWVI4itV 4.PmSI# 0@O % NWa
0 Witi *F f rada4 N PNI~ e 4 %9P- % kN toat to a of - 'ofod~pf Oemv Pe Wee 0k*~"% f f*O~d OlpM
pa44 popeO N4OtePweN4 oko 0 o 4 k ,~~4~~m~~~tiol o QPd~~~E~ 4
0%A040 -W to0 04 kV "P Pta t0q "tiad %awd inN N 00 CPe
Pf oi oppopi&Mlo.4o~d~%
40 %G4 dV dt G4 ANV "P Af 40 nC ýP Pi0 d1 "i ebb4 et 00 dNMo

PO %w oM O &a
NOOSM.4.. Meg.0. Mp...4 Mo SO cONe 000000~
$^m W4N aM4 4Ow 0474MN a A 0 04 & N too4M
F* 044N0at W
* ~ ~ 0 g e . . .M* ..N. ..". . . . S .
a" to a& tom a ad4psO O NAO I f MAa
In M
A I4ue 24NM ep.U40Aok A# mmM aa Nin N44.ivb
CD wdvi~ 00 A* 00 ~ 0O wd N"N N NN N~ N NM.
96

4 04 0 mi P .4 f 0 in - N 4 ft0 0 A A N d- Ia ' 't N .4 N 0,wP
a i NO * P P 0A4 In ,-0 NU4 %N 0 U'% -4 M 'a. IA 0P%0C Ck4 IPN d _0N mtotk m0%%0-dw I " NP- w c im 1 N0 2 eg ... %04nmN0406 Ch0600eFl QW I 4mg
0 4o o %4 nm0P N4m04 0L %.
o4 mP4 0.4 Poo 06 "d od "d ad 0.4 "dd
*yU 4 mq mV 0 a ka0t#00 %tP l~n ony0 any - 4%r 04w mp_%U rf
*n .L ** e0 Ne e g e gee.0.0 o0 ow a0q 4P-1 7 ,-t 0a%?fj WI
04CP NlmIy00 0 O P ot 4 f %U nq r% #% "('atyUNow1 P in MN r mC a t o0 "aVEIwe0% Ft 0 *ow4odoo wpm
o VnNf 4V %0 F 0CoC -P ~f eP .% 0 %
CY P4U*00 0a 00404 a% 4D fP.P .0 40 %a 0 % % % % 4 W I
F-0e If4N O0 P- A y04 C)474 o p"%0 n %A wok Mgeg e geeo Pe ee Pae %g0 r 4 ggg4#A% 4ty% 0 rd 4 g&g
%t% 0l o I nGoa 0( #pW a 00 N1"oo97 p _t

IA0 Ný0a*L N#AP aaPo4M-*M oPIn p44 a n-dM tfo M0O O
NM- 404 of,,NMVO 44pN 0 a W"9%A 4prMPNgpow
q64%04b4% IntAIAVII4 U U U A %1%U
kN I tM N goW o' ow 440 0 0 ( 000 I% 0%~ (4 4 a, 'C40 N4 Ot at '0450 04 0
et p~~f, 06%n401 y"PN oMD o44 00104
M N0W'Q~'C N Mcdors #000000000We..*%0*%DID %a 40 %DID*%0%0.%a.%a
IA 6Ni n% %6%W t r% r% tI t I 4 vi tI 'I *o
N 0 N 'I 40 WCCGOf-f" P % % 4p0UW) F- JA1#N % a4~0W*-MW P %% 44 4 4444 0i ae l% aNc " % 0MC 4q
In Na %aWM4 t % oa t t.-(%P-% NcC7 oIt d %V 98 e %

ON* %000.FN M0PbP'"-0"Ml'd" 4.Nw4Fl0UN O N4A~pa0 0 . 0 N 4 UN P- (11 04 P-4 N * l %A %a N 4S 0% Mb r-'. Nto 4 0
W% W% 4n in in Ml Mn vf 4 40 v 4 4 4 1 P. 0 U) a m tv 0 0 0 -
00 00 o #.N N-lM4.0 4.4. aFe m 400ON4. .4% N-e* 04444 " N m *Nr MW% 4 to0 a N4#.O.I 0PadM v r-0
0 N %a0 * 0 M flbP In 4. N 4o m 0PM 0 40 0 a N 4 N M% M% *. W% 9 4IA m0%0%44*It AN %Or- owemc a "NMI# ona 44pbw mON M *
N* .W 0 N 40 a 4 I 0N0 a0 M 0 M M wM w 40.p4PIA444444444 44 444v~ PacoION
M 4 Inn b a.M 4 NIA q6tA0UN# 40 fV0% 0% Pf O o a g b 00
o ~ % ItN* P.4I *i 0 I IU .A 64%,0 0 4 4 4 %0d
I* %0WdW S O 4. A 0I N W. P 00 4 A. S .0 0
C14 e O (1 Ao0%A44NN u Coco"" lp4 p4NNNNMMM*.
A*i u %9 ez0 fW op 00
Fl 0%lF0%ll~0 Fll~0 Fl.444...44.44..99~i4

V N' m %0 A 0 pl- M 0 4 N # pb f0r. t4 N (Y4 p N to40 0 0 JA 40 P- JA
Me MQPNfftN 44tdPm m IAP.0'.Gotmin 4N00InIt ocmnN4 00"" N M~ 0 4 W 4 kop 04 0 ..d N M 4t, P- a 0' ON N M W% P.
I~~~ *.*.* ..... egogeg 00 0 00 a
m raw m' - 4 viJ ON 00 Vi Oh 0 IA F. N 4 0 N of 0 m. f- W% o 0
00 4 mo4m m4NIA NIUN a fpe or.MO toON Ina"*4Pooin Ift a mohOd *N M weInop.Q0'0m~emw 10ONMO44
&fl4nflnIA1044 o4 404 too44por.pop.p. -P.Pft No memo
IA S OIn of om
a NM WM 0 F-a V 0 am# MP-0mw ~m InoamWhNM#too MMoftFUpaPW pa p-pa Pb 0a0 0 a 606a00m0m 0'OhO0 0 0 a0
As"M9A.~.M oIApmo %MNW q4MNM~Nsm
pea *iMSiMAWM 0sba0VMN *i Mfir41% Nmin oo"m0in O444P.PSU4h4
* b*P mow 00 0 00 O~p dvNNMI4m 01n 44N-mp aIA "Mf4-*4*4I4VAmwIAAIIImwIIA4t O
100

04 "qv %0 0" *t gp.. .. **g* *** W0 0U O lo S~-O 4Md i
N % 'CP00 1 7 OPINowm qtC"yI"Mqrq0UaC 0 0 0 * 0 0 * 0 0 0 a 0 0 0 PoloWo d0 dP dP da 40 dw 4a da
IY~V P"O OWvi, e 0 4Nkd00M4 PP%a In000 aNP a "aNpo00 -40.uIn N aN t - 44f" q0 n # ftC%0a0p *NNf %6NaP ** * . . ccCO *0% 0 S oN tqvIr-WO0df
f"Pt0Mt 41 Ng "t 4i oI 0W %I f 0V V0P 0opf~oW~VO. 4 VV 0M4O~fqeP0 N %rIQ ~. in OWN()%
wek&70 p14m c cddd N If ff4 tWnW
swa 4P *P dP d0 qa dP Io 4s n we
qDI poto vf dq k %o 4% tNa0af -ION# aak S 01 %S.0 4004ONSSO NoopmoOSOSC 0%I
0AOPW~f&~ 0VP 0WN0 okPo eg~f
M A FW kk d ~ r k0f% CpvfRvW~V% s.N... F-* **~ Se gg O N006n0f 0 " 40 k "0 "04 01 n
004 NN A * iik 000PP. 00, 0"d mr&
ad0 :wdo .4 d o0 "Mp oP d" ds 4o ONNNNNNt 41
%aN'4 0o ~ ~yký
II'Skd o Va oC444 c IDM- 4s0% a fwP #0f" 0Pb f" toQ N 01 %V n4 4W *I "P 00MN% n0

A c~ ",b ff i.ON- " NM - 6. 4 "N M 0 0 "a in 0 40 ON 4 iSP CA*~ n
C) PSoo 04 #wNIAO6iA 40"NfO~N**m a -wN Ow o M4c W " 00N "#N
ý m e m lvC- 0 0 0 6 4e e c e e N a p* @ 5.0 0 " Mg eM a0 O M W 0N0ow %M O. nm oC0aa
o ~ ~ ~ ~ ~ W It0AOCIAOSN APSOpd.Nf;M MIAIIAcvW"
*ft 1;-o
~PSPS~iWP IAIA O M~O 'M~P..in%0 gg.geem 4 0004 000N0 0 cke44d~ - 4oo a gee-4 0 4A#W tW % %00NI oP 40w
40 mV P ko o 4 % %% 0% % 0
od" NNN#0W0" M""0 P A0 Nc ,-Vch a " " 0 0 0e0 WN Nm a % UN N 00% W 4 n iVý4r ; c :A1 #
* ~ ~ .e e ee N e ... esge egN o...m*PIA NO in %* # - t NN04 n ofMN0u.mP. w %brwd M
N 0 10 0 woNPS N* N N M0N t "N a0 N m 4 0 4VN 04M4t %p %mt 0 000- -000I NUo M ,". 4. .. ."440 - n-C S a4 40 % n N F-4 0 t aP-4 0 A0 4 m m
N f
102

PI Os...... ing WoOs.....a.ooMf 050636in0to 0060W0 0a t -- -e40 Q444q
o4 aC o ol 4 M4MMlolfo o mIOPf 4f r n* 411,W olaN0M0I N000MlwMW 0lwt nP '
owNm0#I0o% 4MMMi tV N 0N f -a0a4404 r0IInai i0t olo0P "O O 0Naw tMN0 40I ooP-4- 4tom UWvIc m mCPAr-~o nAO
%a%0%W#I o9 d0000a % 44 04 -PoPo o,1
0 00 00 *0 0e 00 0...$0
Po 0 Pd Wod d d 4 4ad Uaa ~ 'O 0 W e S
##4uP ovP10 O N O~ N1 0 FI,0win - -- &-f4~~, 1101'0 --- o l0 y w4 111M
41011103

o MNOe "b ON4"O*-OkON ui n ON a 0 P..*
4 N* ** * 04000 e f-e .. e e inm0 Ne aF-egegt00 4N
4 q0 to to %0 0 0 a c 4 %0 4 %a %0 60 0 to to a 0o a q0 40 t 0 0 40
f" a Pbt %,0 n0aV 4 "a %at #P 4f A1
OpOom#1inFtQ WM WM~l 0 *? fm 4olnOd$.4InI 0O *o 41 1 o ýevNP.N9 mNW -r "NI
loU0O NP ~W h In 0 4on o in0 *Pd04 Nt- a aW% oo4 f d ao; Wqi iit- .F 00i n0AAr . 4. -0 ,q ,0
%04 0 44 16.* to . e%.. .. gW.. .. @06 %I i I % %I NinI nI
IAP P0P WNM4k 0P 00C k44C %0 %04tO
410a000 4a ds dW wa F ws ai "f dc sW *09 90n "w eI "0 kP nmo k#A %o ~ ow 0q di %0W
0 ~e ee ~ g to.. .. toee ee W%0i oog "t " 0f *Np Pa0 "p o% DW *%
%0i "f yo %O C 0P *.01 %i o ti '4i to
WW p A0 %W t0o t0Wi e0 I t0i tI VI
I" 9 0 f"4"C a i WadtoIAOL*% p o% o 00 ta o

N N N N im A .4N#40a We "%0#O
N~~~ QU N N A t 4 inA 4n -0 W% P. Vt p- a 064 PIS " N0 mt mf 4 Vin
4604 04N~ 6 44Pmf4U'apepols, oplS
4' 0
0 opip v *******.**** 00v0a0000000 M00000
VNPsP nvdod9 dp 4ala mlw i a da 0
zU'S otsMte "ll e" l "U'MOVIIII &I~rD& A n
N4 in MA M 4 0 4 0F . 0P.U'U0N AA0# 0 4 4www O W% I k i I $ U
0 FID t .4 # 3 U'4 0 0 aU% go 't4 '0I a0Na40 '0
0 N4tSNOOOOO U'.45NOCOP.0NfV~4I0tN
N M 444444p444 44 a oI p 4 444 m4444P n 4 044%
am in gO OIn 0 0Noc#.amO0Occ0PN0000000##0 QNO
to 110 Is 1 4 4 Vt4 o 4 45U'0 Wo 4 4 14 4P 45 ' CS to~ V 4 o 40 o' 0
105

okvN ~ %CN b~-%WM# p
*4P. rp. a0 a o ON A A 4 w M. O' t-00 04 NM 00 4 P- tO 0po* -~fv-a4m a m a a wt a i40%0poo0& 0% &
M M w.. . . . e . 0 4 0 o 44 4pOI% ISpSpe a aa
N0pook &tom emo p0ar p i0s 4 4 i4 mmUin *4M
A 4i P- ff a at a d " N 0 n4 P- ap. N M in ff a atN M 0 N M 0 M
'0444 44440 4'c' 4401 4 44of ""I0 'ppa" memo mockp~
N a000Io0000600060 0 %N*0 S 6 0 060pb " ,0 00-%a
as N" rAo " oAMa O "kf rNC
4 ,00 qDof P00 m mo106a 0

o m MOO~SN* IOMO 40 Aode mNO ad 4004M&N*4W
0
* 000 0 00 0 00000 mo0l00 p ~b0mo o000400M0000
am'
0
r* OM N P N ** O000e000o Ina0 00 "10 " 4"P- m re
0OCOomNI o c
.4~~~~ -4 I- -4- -
- ~ ~ W A~ a"- P - a"- -o 0 4m4M M- -- too
A NA N0 0 N04 o 4i107q k t" r

&M d 10411,e eI.. .. MNO b4101" WIa* ew g..... a egon.kIta
0 gg g g a 00*6 egO's 0 g . 0 e g g ee
to f"C w dw
COO 010 *" Wf ff 6ddfd 6I' i %0 04 #M ~~CCSC IM f 0 C 0 0 0
twgo. e4 m Se ge megee V mmN N .. ... .Og. adan
N4 a U 0 0MNwd lNaW O I,0Io O dfm
oeb f ~~pp4~opVP 4p *aa P b00i n O #4,aOdPPNImie som rcn6 01 iifN tMdWfw"P
-a-o o 4a4 nPPa wNv wi kao oi n4 "o *4 ,P4 Sg0 SSgfS SO 0 or- Packer- in4ito
b4 in b4% in q# f" g
ome oatm~oioltn ~ f108 o nI "&i di "a #N4 nJ

o pf 6. Ic4CMon*
'00N4qaaMV -0 MMW -0a n*PA 4C -i 0000000M000600a0pa0000006In00
ap a.4-0ý 4I nU nWM* *# tM M M
r- p P P fa - b - a - "M1 0 pt k ptpepwO p ftP pt v p wo
Ob 0000m mm600600000 ww *Okp--#mp-P Ph00 F0000 00000
N 0 00 a0 00ek00 SO ukeoO O O 00000404 0s F W" P -p N f -p
adO 4 da 0 dO
"MI oae "% 4 s0 nNw y 0t oN04 4 %O oP
o ~ wwf4 or 0O0%N Ok oeI ~%4i "wdC %~*e ai qan k~ w oio" o oI f N -4 4 0w I
o- OkO %oow 44 &p -U -f 0f 0w %"MP 04 dfN GN1 4i 0N0i d4 "0 I "0 %e 01 pWr N%
N 0.000000 0000000WW0COC0O000 0
.4 4 l, .4 d 4 w*.0d. o
ad e-4-0 4 N k % * 09 ni d0 o4 nf pc k 1 %I

a AO P.440A p aN4 %0b va 4aamI a N# 4&vi
-AM" NNNNNNNNNNNN N SO 04""
VIC
ob AC p- itI N400Ita v 4 * eG.. ,. W% ~e 04M4 MP IN d4 41 19"O-0ý so G9 %qtM4 -Nf 40W NO 64 4P tN0
MWM Mf fMM Sf f m00 - n*C0 ~o f
c mWnfcqOn #0*OONIt~ oN 11n N VISOC*cw 4 m moO VIDNIMMP0WSIDOqoCM MVn~nW.i-OO% %titum10k ot 3q 0% 0% %DeO O 10e a %%aaokatlo o %a %Q o % 0% Gq
""%k9,1MO4oukqc Dnmo bqo A4 0' mN R t0 O W0t 0C 6%- 0I - MMMMMf
In4- FNN " 0 t 0 W0%11 040N yN W it t qv # 0 0 0 00m eaW "4 49 e% "a 4a a0 vo %f vo ai ,i %Aicaw l"4cIU @or ~C ~ N OOk46ca 0 w a040
a 94rvId 04 ItI 4a0f %I o0 f 4I 1 f -0 MAIP4 q 0af 0 o00M4,I ok0Mo 4Pl t0P d04 k *4
400tof *OCCCC OOOCS.*OC4, M~foC do..O ak weme W
FIDISPl e10t N O, oq ot k o4 01a a% D1 nW nW nI
#AAfNddCkkOaW 4PbfapjO0 0
0 0 Into 3 N e % 0 o1140 01N 49f-IMOkqOl0at0WPN,%

fm C me f-4OOO Oneeo M~oca a o -4 In OM -4 a I- 6M0%•e e••
P-mo ooo 4 ON e I 0" 0 e e e e Pa e -e •ee e" %t Ue U- 40 coo
4 4 eWON 4OOOO•ONNNNNNN•
I NO a " m W% P- W 0 N It 4 pS 0p m 0 %a W 0 N N N N 0 N N N N 0.S
i Op it w a N ot o o ov v 0 ot 6e %p %o Po ps w ck u% P- t" •
N e ege ge e e e 09#% eao g..e e , .. .e •e • *S qo % eDf P o 0
94 oF o In o d o to to 4 N • to •%•a o oad of f o 0 • a N do 4 0 •f • N 4aa
oI 40% 1# N 040. Co o% % N WbFJOW
* S. 5 00 060 .. 0 .S**60* 0005 S
a*do0 4pP0 *06 66 5v 0 g . . .06dN mOPe % %
to* 40 a 006 it60 itI"N0o0 4 0 o10 o %.. W 47 * 0P-40 J M0 P W
0. 0
md0 a d O 0% LW%ý Ft0400 0 0 C4 f1oI11 C0C

NOw vM0 ~ 0 Q ON$O ui kN440vN NVI-PP agec e ae* a t000 00006 eec ego..N
oamIa" a ot a0 NPN00i~ %OO 0iflom hi¶om *a w
Cc 4"O FN M 4a4 44r a44% W 404 N%0 m* 0%0 ao 0 0w 0"% 44 4 d1 0e g g N ge#ees ce"cee
m #4n% f~ " #%4 kd lo 4 40c 4 1 p~ 4
44 4 4 v 4Pmpf w5 comewe
*4 o*4aaM4nO P WM *OSMP0C N"0U~~m *. ** * eeoc~ln 40e eeoc"M Peowe
"0P b"4 a0 km 1 omt" n400N0w0A tNI ef 4 nC d4 o0M"
14 0 do 0MNNNAMMM#*0W ýM% sf fo %044% 4% o% % 0444404%0 *
a. Ck ~ 0%p nP~ N oP "itaww ~ 0 N N f~ My%" % 04 NA04 4 "I t- "nw4444 4 0*a % i 40k m4 444#4"444N44
0 0 esee ec cc c eWNc . see.%..Nm W "Nft k %9
P4 a - 400 ft0W %0NMW I nf %o
offow w mo (%0000 44 V 0 0 04 " "A 0 o40 d"Pdo da
odNf %0 NM- %4 edo0a Nf &u 0p o0
112

00 4M 0P IC0 'O4 Oft00M4Oqpp4n00 ~4 Mtw M4
P4 A m N M* M, 4 IV% M Mi M~ 044aP P- the Vs 0 0 0a 040 0
I~~ ****.* MSee. N...O a 4t0M0%W%
4 %1 l -aO MR NW -P 0a9rk0NtPNr Po w"*M o MWf OWN% "a d4 o0 4q t pp 0&w #% kO it %0 01 wo qf qA 04 -4U~m
ad0 *0 yNNNNM0 t rfrWUI %b%% 0t SS0e2e eF- gee Se .. .. S S 000p"pnp f at&t f -t Ot'P -POP*P WotN a" I -p -P -I
Ma do-m fo rC~a- aod i tV OI O ý GIo0 P-O 0OI1 yP tI n4 -4 "% n% -G c0 04
M* kf A 0V pI -V pP M 4 C Di 0Na- d0a ~0" ra 9% f 0 pw qv04 f ow a"%a WCUN 0qrN h fPh4rw
~~~~~~~1ý ~ l Roma,00 ~ i i U u.N h %. N M
*0 POOO SC 0455 glee od PQ W4 w
%a - oI ho-- haO No of nwa a %% 04M*@uN 0 W M a0,40 4Noe 49% e-*re
we 401 of k dO aA Wt ýq srbW cN% rP,0 n0 "0sN a n0 qI 6" n4 "c n0146 4s h 4q rO "r d(4P *0 l0 a O d MM itin %NOVO 0P- k*4D04tk0 0Odadad04N e w#q4p h -F -tD P - P f wt op f wg @5 W0 doe~ toe toee ee 0 eOD W
0 4AI k bNWpaaI %W4n~4 %ac~q o 0"
rq4 4MFtO RI tR ~ %ft nw4 4a %a aaa0 40aPOo 40i 4% p4 O rV o? 400 0p &i dw Pt 04on a 6V t*p k0w ##64 op cO ef f-cW0itI ~~UI- O adMq 60 dMP %p nP-0f o4 daO 0NP
M-"o q rI NN N 4 4 i i in in 0 1* 0 %0po 0Of W o0 % Q040
O* ad ee ee "0e ee e~ 04ee e SdO 4O ds o0 40 d0 d da 40 ow d" da 4N
O'0 "i nI N 0O 00 v4 op ,a Cw #I 4 "4 l
In inW nW %V lV 0% o1 0* *% a1 -fbp -P a wPDFOpa*a*dv tp4 dd Wa 4p de *w v4 a4 aOi wO iO440'0 04 adodwlPO s w P w

0 % %00%O %NN'-n ()%\Or MOUN '*-% 0 If\O - U~C C--00 0\ f04 4-rM 0 ~L0 'C)%a0 00 C*-C' r'I r\r0a '- \
N N N tn-t V D'--EX )N0()r-tt
q1~ 0 0 S 0o 0 0 0 0 0 0 0 0 0 0 0 0 0 0 0 0 a 0 0 0 0 0
CM -n ~-t ~tr\\bO Noo Y0 C\ r4-t UN*"0 No ONO 9- N rM-t Uv0\ Na-C 0% 0
4-1 Q'co (A N %- N S- \ No *t)r0 )mX )- -t -t4 4- 4-t ulr\ r'0u-\9:\o.. NJO' ~NcCw Oa,0 a\ooq- v- , q- N ('m cm (m -4 v-9- o oa,%cy\coo oo
0 ~ ~ ' 11'\_ f~-f C\1 _0 V- O~O N N ', lt\_t fn_ o~O C\1 C' j(\ jjN N q-.- _.v. V~- q~.O -
0 * N t-4NN-4E- t% - r4r-t-4N-t- N " -
o ntU.\ Ic 1 O0N00O ~ t UO4 -ýr'NCO 3N 0N M x\ N '00N 0
0t rn-cPl C\. 0'C 0 r\ 0 Ou~N CM ff-O lru"\%04 "o Nrý-Na cr)o-t 0%0r (MOO-
UNrxn-lt O 0\04-(Y 0C\N \O N4- 0'~~ a'"-t 0\~' M\ 00 0000 CV) 'O'O'tO'%ICM 0 0N en 0A 0- -tC0 0% 0y "I 0 NOD 0\ 0N 0N 0 0N 0 0 \0 0 0 0\ 0 0
S0 a, 0 lt'rn %N cm
o m en- 'u-N' V-,oNc7% O '0v- rnt~t u \ ooa o~C ,~ c- (4 u~-, "D Vcc q% o
114+

0 N 0 N-t N C~-oocoou" a'aON'a'o 00-t Nt N frON 4-4~ UnON0
0 a. E'- \ 0 0'- 0l 0~ - * a\ 0 CS- UN fn S~ T- 0\ 5 \0 St S - 0 00 t UN ON
o "- t %vy -eu% -a% rnv c n4--.c lfvOi c ao c~- uNo r' 6- -.r\ C~-)\ *' 0r*,.. ~ ~ q t%.r.t-.N ww0 Y 0% 0% 0 ' 0- j- m- YnMt-,-
4. t 00~ 04-oN0 - oCj\O -tco \0 0 C- NMat-f a- ."0 _0 V 00. CI i'O ElC-c-o\ 'ON "I~-c tv~'4 O~l \ 0 '0- aNo 41r--\ ) tNt nC\-c a
'- l 0'- N N\ lr'o-~COa\ O N - \"ONO N\ C00CY0 N4lrf-t UNI C,00 0% 0
~ q y 1 * 0i-. v- q- q-0-0-0 -q - q-- 0- q0- T-q q- q~- q- v~- q
aaaa\ \0, %0%aSa\ o0oooOOO'-oq-_,-'i-NNNNNN
0m M5 X5 0 L%5 43 0 cmc5 '\)Noa C )tINDNOO
cyaccaaNNs o"4 o o- o' o o N o t\0>-o q'0~ i~- iq-~. 9-coa

TABLE 2
INTEGRATED AXIALLY-SYMMETRIC SCATTERING FUNCTIONSFOR DISCRETE POSITIONS AND WAVE LENGTHS (k)
BASED ON EXPERIMENTAL DATA
Wave Integrated Functions
Length
8 1 oi ! 8 1)s( ,i 8
4.0 5.2976 0.9960 0.6402 0.48894.5 4.1760 1.2153 0.7529 0.61755.0 3.9193 1.1737 0.9637 0.86555.5 4.0026 1.1320 0.7118 0.57386.0 4.1034 0.9705 0.7622 0.67706.5 3.6815 1.0622 0.7012 0.54737.0 4.1637 1.2499 0.6500 0.46318.0 3.8309 1.1137 0.7183 0.53479.0 4.1665 1.0168 0.7323 0.6333
10.0 3.9144 1.0319 0.7607 0.620211.0 4.2027 1.1402 0.8027 0.630112.0 3.9778 1.0236 0.7270 0.518113.0 4.6582 0.8594 0.6912 0.646714.0 4.1096 0.7808 0.7509 0.728915.0 3.5009 0.8225 0.6040 0.7930
4.0 1.5991 0.9253 0.6102 0.49114.5 1.45609 0.8783 0.7394 0.62245.0 1.5861 0.9331 0.6338 0.50195.5 1.4401 0.9535 0.6780 0.56966.0 1.1445 0.8792 0.7350 0.65186.5 1.2817 0.9322 0.6707 0.54767.0 1.6296 0.9740 0.6114 0.47346.0 1.4981 0.9887 0.6739 0.51929.0 1,2306 0.6748 0.7216 0.647410.0 1.2121 0.9737 0.7587 0.635611.0 1.2113 1.0017 0.7344 0.603212.0 1.2441 0.8910 0.7086 0.611413.0 1.3,185- 0.7654 0.6788 0.642614.0 0-.6442 0.7764 0.7531 0.733815.0 0.8640 0.8197 0.8073 0.7969
116

TABLE 2--Continued -
Wave Integrated FunctionsLength --
1 8 (122 .10.8(2 ) a(42. l'8424)( )
4.0 0.9960 5.2567 0.8392 0.53734.5 1.2153 4.0966 0.9099 0.65125.0 1.1737 3.8962 0.8705 0.58125.5 1.1320 3.9727 0.8997 0.63586.0 0.9705 4.0924 0.8670 0.75646.5 1.0622 3.6415 0.8507 0.60257.0 1.2499 4.1155 0.8860 0.54348.0 1.1137 3.7775 0.9121 0.63659.0 1.0168 4.1325 0.8465 0.6336
10.0 1.0319 3.8474 0.8219 0.631611.0 1.142`- 4.2182 1.0317 0.746012.0 1.0236 3.9592 0.8386, 0.667313.0 0.8594 4.6640 0.7617 0.669014.0 0.7808 4.1003 0.7526 0.728315.0 0.8225 3.4925 0.8000 0.7866
4.0 0.9253 0.7818 0.6392 0.53624.5 0.8783 0.9751 0.7861 0.67545.0 0.9331 0.7933 0.6296 0.53345.5 0.9535 0.8248 0.6765 0.59076.0 0.8792 0.8071 0.7127 0.63226.5 0.9322 0.8338 0.6820 0.59037.0 0.9740 0.8372 0.6265 0.51378.0 0.9887 0.8873 0.6672 0.53639.0 0.8748 0.8327 0.7490 0.703410.0 0.9737 0.9388 0.7496 0.716411.0 1.0017 0.8182 0.6493 0.594712.0 0.8910 0.8068 0.7131 0.637813.0 0.7654 0.7067 0.6716 0.645614.0 0.7764 0.7751 0.7614 0.746515.0 0.8197 0.8237 0.8175 0.8142
117

TABLE 2--'Contlnued
Wave Integrated FunctionsLength
x" s (P1P3 ,8(4.)0P 13,U ) "(314 ,:)s UA3 ,4)
4.0 0.6402 0.8392 5.9187 0.90784.5 0.7529 0.9099 4.3549 0.96245.0 0.9637 0.8705 4.5400 0.98035.5 0.7118 0.8997 4.4935 1.00276.0 0.7622 0.86?0 5.3565 0.94466.5 0.7012 0.8507 5.0757 0.94267.0 0.6500 0.8860 4.6728 0.98838.0 0.7183 0.9121 4.2906 1.07249.0 0.7323 0.8465 4.6410 0.8483
10.0 0.7607 0.8219 4.43182 0.850411.0 0.8027 1.0317 4.5525 1.231812.0 0.7270 0.8386 3.8558 0.911613.0 0.6912 0.7617 6.1097 0.750514.0 0.7509 0.7526 6.2781 0.753415.0 0.8040 0.8000 3.4428 0.7866
4.0 0.6102 0.6392 0.7389 0.69844.5 0.7394 0.7861 0.9637 0.86555.0 0.6338 0.6296 0.7098 0.67045.5 0.6780 0.6765 0.7552 0.70706.0 0.7350 0.7127 0.7120 0.67326.5 067-07- 0.6820 0.7770 0.73897.0 0.6114 0.6265 0.7704 0.67878.0 0.6739 0.6672 0.7778 0.68299.0 0.7216 0.7490 0.8369 0.8357
10.0 0.7587 0.7496 0.9511 0.936011.0 0.7344 0.6493 0.6443 0.632712.0 0.7086 0.7131 0.7545 0.744913.0 0.6788 0.6716 0.6764 0.676414.0 0.7531 0.7614 0.7780 0.784615.0 0.8073 0.8175 0.8378 0.8405
118

TABLE 2-I I nu- n-h
Wave Integratod FunctionsLength . ..
4.0 0.4889 0.5373 0.9078 10.03694.5 0.6175 0.6512 0.9624 6.33365.0 0.8655 0.5812 0.9803 7.95275.5 0.5738 0.6358 1.0027 7.83466.0 0.6770 0.7564 0.9446 8.71456.5 0.5473 0.6025 0.9426 8.09557.0 0.4631 0.5434 0.9883 8.11498.0 0.5347 0.6365 1.0724 7.49649.0 0.6333 0.6336 0.8483 8.0003
10.0 0.6202 0.6316 0.8504 7.272911.0 0.6301 0.7460 1.2318 8.095012.0 0.61.81 0.6673 0.9116 8.005613.0 0.6467 0.6690 0.7505 9.689214.0 0.7289 0.7283 0.7534 9.540315.0 0.7930 0.7866 0.7886 7.9642
4.0 0.4911 0.5362 0.6984 1.03314.5 0.6224 0.6754 0.8655 1.34555.0 0.5019 0.5334 0.6704 0.9s185.5 0.5696 0.5907 0.7070 0.97226.0 0.6518 0.6322 0.6732 0.80296.5 0.5476 0.5903 0~.7389 1.04847.0 0.4734 0.5137 0.6787 1.10358.0 (,.5192 0.5363 0.6929 1.08219.0 0.6474 0.7034 0.8357 1.0582
10.0 0.6356 0.7164 0.9360 1.222311.0 0.6032 0.5947 0.6327 0.714512.0 0.6114 b.6378 0.7449 0.935813.0 0.6426 '0.6496 0.6764 0.721814.0 0.7338 0.7456 0.7846 0.83691540 0,7989 0.8142 0.8405 0.8795
119

TABLE 3
S aj S(Ui
FOR DISCRETE POSITIONS OF INCIDENT RAY AND WAVELENGTHS ( X)--BASED ON EXPERIMENTAL DATA
Wave Direction of Incident RayLength
A, •i W2 P3 V4
4.0 1.2021 1.4859 1.5749 1.48484.5 1.1822 1.4008 1.4324 1.28995.0 1.1229 1.2893 1.3575 1.31395.5 1.1306 1.3272 1.3823 1.34406.0 1.1117 1.3380 1.5178 1.43346.5 1.0757 1.2567 1.4696 1.35907.0 1.1546 1.3394 1.3887 1.32848.0 1.1248 1,3028 1.3575 1.31519.0 1.1335 1.3543 1.4261 1.3917
10.0 1.1297 1.3282 1.4213 1.367711.0 1.1779 1.3980 1.4171 1.395912.0 1.1073 1.3100 1.2735 1.267413.0 1.12017 1.3653 1.5833 1.465114.0 1.05712 1.3053 1.6618 1.520715.0 1.0485 1.2494 1.2432 1.43.38
120

APPENDIX B
ei (BASED ON AC - 10) FOR DISCRETE POSITIONS
OF INCIDENT RAY AND WAVE LENGTH
121

I ~ ~ atO 0 P440
M rq44 f in o f- 0% 0P4
o - F4 r40-4 1-4 P4 P4 PH 0
o~P F4 P44~4 F4 m F
Nator nmt 4WL 40L nac Dv4c
qw0 n0U or Sc 4C rOONn "
M 4% 40-nf nNI P4"4"4"44m
040 0
"49-
*1.4~P 0-4 "44" 4 4 04 P4"
0-4 0 - - 4P4F 4P
"a"4"mvInwrI4 P4 P-4 v-4 r4OO4OO4 O
"(D
1 22

1' P4m in r 0m o m mrOII;~~ u"4"in"4m44in"44-4"4 -"4m
mmm0 4P
0r m t n- -
P-1-' - -4r mvvvvmt
0 m 0 0 v 0"4-- %
"0"eINM'M o Dko-o mm m
0r
"4t'U
#4m MMM - w r-4 NufO-r
123

APPENDIX C
NUMERICALLY INTEGRATED AXIALLY-SYMMETRIC SCATTERING
FUNCTION FOR DISCRETE POSITIONS
AND SIZE PARAMETER (L)
124

APPENDIX C
TABLE 5
NUMERICALLY INTEGRATED AXIALLY-SYMMETRIC SCATTERINGFUNCTION FOR DISCRETE POSITIONS AND SIZEPARAMETER (L)--BASED ON THEORETICAL DATASPHERICAL PARTICLES, REFRACTIVE INDEX 1.6
Size Integrated FunctionsParameter
C vllp0(1fp s•)'~j s(pl.Uq
2 1.43671 1.34821 0.77463 0.581223 1.99736 1.69822 0.76401 0.25075
C • (v 1,-U]) 8(v •Ul, a (I 1,0 -,p a W.I., -U4)
2 1.22867 1.20665 0.77973 0.426963 1.54406 1.33614 0.50062 0.21109
2 1.34821, 1.49750 1.25648 1.047343 1.69822 2.07478 1.51562 0.49900
M s(142,-Mi.) a ('A 2 ,'-0 ) a (V•2, "# v ) s( (!2, -Ui•)
2 1.20665 0.89952 0.50756 0.242083 1.33614 0.70709 0.28506 0.16147
C 8 (IA3 ,1i 4 (43 40• sp (3#4 ,a) (W•3 ,IIA)
2 0.97463 1.25648 1.94134 2.17055
3 0.76401 1.51562 2.54656 2.10988
124 a

TABLE 5--Continued
Size .. Integrated FunctionsParameter
M 1 (W3, "U V a (V'3' 8• (UA3, I• )~ 8(;3' "U4•)
2 0.77973 0.50756 0.25442 0.150833 0.50062 0.28506 0.20591 0.18599
S•. imLi , if s ii ii
I (1 I6 V 8 ii A .V 8 m 4 6i; a (141 4
2 0.58122 1.04734 2.17'35 3.646343 0-.2,5075, 0.49900 2.10988 5.35301
8 (14, 1A j) a (144 -UP• ) (44, -ý) S, (4, -0ý)
2 0.42696 0.24208 0.15083 0.162103 0.21109 0.16147 0.18599 0.24173
125

APPENDIX D
TABLE 6
FOR DISCRETE POSITIONS OF INCIDENT RAY AND PARTICLESIZE PARAMETER (&)--BASED ON THEORETICAL DATA
SPHERICAL PARTICLES, REFRACTIVE INDEX - 1 .6
Size Direction of Incident RayParameter
4i1 42 93 IA4
2 1.022 1.013 1.000 1.008
3 1.049 1.077 1.052 1.008
126

APPENDIX E
ANGULAR DISTRIBUTION OF SCATTERING FUNCTION CURVES
BASED ON THEORETICAL DATA - MIE CURVES
REFRACTIVE INDEX 1.6
127

100
50-
I- a-2.0
77 1.6
z
zLu.
zFE 1.0-
0.-
0U
0.1
0.058
0.o , I I I I0 20 40 so wo 00 120 140 1S0 ISO
"W-, DEGREESFigure 40. AncTular Distribution of Scattering
Function--Theoretical Data
128
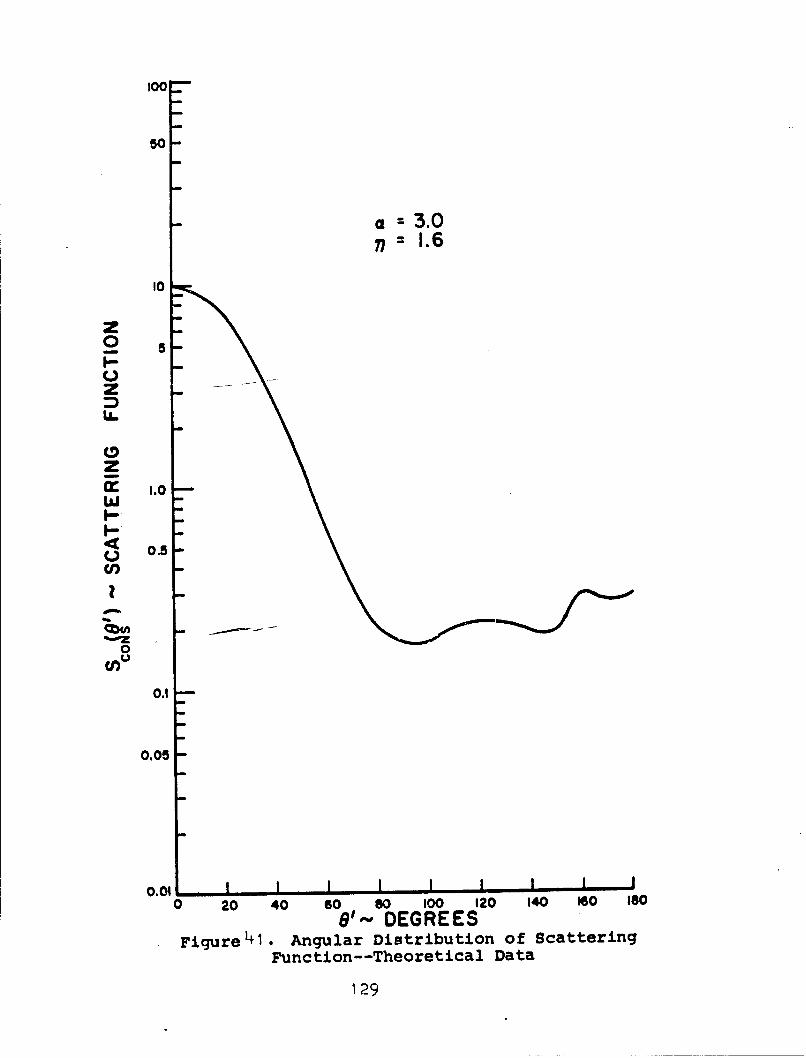
100
50-
a 3.0
77 1.6
I0
20 5
U.
%_Z
2, i~--
L0.
I-.I--
0.05
o0 20 4 6 o 100 120 140 10 IGOo zo 40 8'-0. DEGREES
Figure •1. Angular Distribution of ScatteringFunc tion--Theoretical Data
129

100
50
- a z 4 .0SF• •----• • : 1.6
10-
I.-
zU.
zFE 1.0-
w
0.-Cf o.s
0
0.1
0.05
0.010 20 .. 40 60 so 100 120 140 16o ISO
8'~ DEGREESFigure 42. Angular Distribution of Scattering
Functicn--Theoretical Data
130

100
50-
'•_ =5.0
•o 77= 1.6
z
o
L.-
zCC .0 -
w- -
.0-
0.0.5
Um
0 20 40 so so 1030 120 140 I10 190
8'"- DEGREESFigure 43. Angular Distribution of Scattering
Function--Theoretical Data
131

100
50
a =6.0"" /= 1.6
00
z0
2
Im-
-.zW .0
0.1
0.05
0.010 20 40 60 so 100 120 140 160 ISO
8'' DEGREESFigure 44. Angular Distribution of Scattering
Function--Theoretical Data
132

I00"-
soo50
a 8.02 1.6
I0
z0I- S
z
U.
zw 1.0-
C--
m 0.5
•Z0
0.1
0.05-
0.010 20 40 60 soD 10 120 140 160 ISO20 G"" DEGREEt
Figure 45. Angular Distribution of Scattering
Function--Theoretical Data
133

100
- a z 15. 017 = 1.6
10-
Z0 5Z o -
z
z
n- t.0wI-I--
05
U,•
20i
U
0.1
0.05 "
0.0 1 A0 II
0 20 40 60 s0 100 120 140 160 ISO
8"' DEGREESFigure 46. Angular Distribution of Scattering
Function--Theoretical Data

APPENDIX F
SAMPLE DATA
FLie117. Experi norita1 Da ta . Ari~ular DistrIbutionof Interiotty--?.O

P~gure 4t8. Experimental Data. Angular Distributionof Intensity--2.5
K7
136

l ut-e 4t9. 1Rxper'I mr'al Datan. Angular DIs~tri but Ion
(if' I ritoeu I by-- 3 .0

. tgur. 50. .xeineti . ~ta .n~~i .ltibi.ij.~o .I.t.. . l.y.-.3.
. . . .
. ~ ~~ ~ ~ . .. . .

7:--7~
Figure 5~1. Experimental Datai. An .gular Distribution- ~of Intensity-41 .O
139
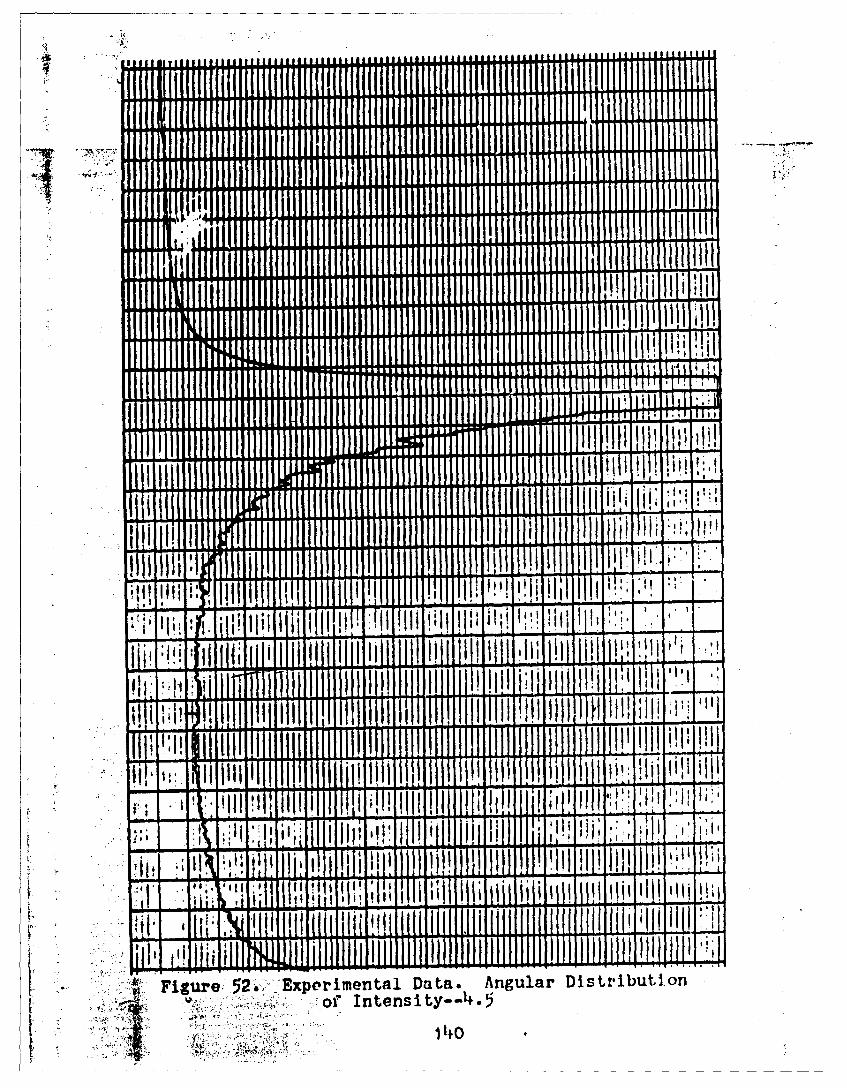
. . . . . . I I . I I
. .. .. .. .. ..
. ... .. .. .. .. ..
...........M .1111 NINON IM .. I ..m I I .......410.10 POP1.1mo ... ......... ...
.mmimNowl . I I . I . I . . I . . I . .
. . . I . . I . . I .
- UI . . . . . . I . I I . . 0 . . . . . . . . .
I I . . . . . . . . . . I . . . . I I I . . . . . . . . . . . . . . .
t 11 n il I T I I I
. ..... . I I .......................... . . ............
S O ....... ........
milli 111111 HH111 T: h1i
S t.. Li
11111M 111illid
01.
if
I I I i I 1 0 i i I I
t I
X Dat Angular DistributIonFigure. 52,0 1 porimental_0f Intensity-4.5
140Jý

HIM.... ......
..... . . . . ...
. . .... . . . .
. . ..... . . . .
. . . . Is . . . . . . .
. . . . . . . I . . .. . . . . .
IN F I . . . . . . . .
I pill .7
. . . . . . . . . . . ....
. I I I I No P
hhh1.7
... .................
. . . . . . . . . .. . . . . . .
HILL fill ..... .. H
ISM
Angular DlýtrtbutionFirurp. 53- Experimental Data.
of tntcristtY--ý*O

Fiur 54. Exelmna Daa Extnct- -3.
114

Figure 5.Experimental Data. Extinction~-3.5%
11+3

i4IP
a .
Figure 56# -Experimental Data. Extinction--12.O
*14
rý!Y

APPENDIX G
NOTES ON lITERATURE ON LIGHT SCATTERING
As menticned in the body of this dissertation, the survey of theliterature is by no means complete, and it has not been assumed tobe. The literature reported in the bibliography represents some ofthe papers that were considered important in relation to this inves-tigation. Most of them were studied to enlighten the investigator onthe.techniques of light scattering weasurements. This appendix,covering additional notes on available literature, has been added forthe benefit of thosi readers who might be interested in further studyof the theoretical applications of this technique or Lhe practicaladaptations of its methods for use in particular fields of research.
Johnson and LaMer (73)1 presented a very good discussion of theMie theory. Particle radius can be determined by measaring the an-gular position of the "red orders" of the higher-order Tyndall spectrafor mono-dispersed sols. The experimental apparatus consisted es-sentially of four elements: (1) an intense collimated beam of light;(2) a transparent cell to hold the sol; (3) a telescope in which toobserve *the scattered light; and (4) a protractor in which to measurethe angle between the incident beam and the telescope. Angular po-sitions were considered accurate to within one degree. In addition,previous work of LaMer and co-workers was discussed, including thedescription of the.method in which alpha minimum was used to analyzeand verify the Mie theory.
A LaMer and Barnes paper (90) included a note on symbols inwhich the authors suggested the standardization of symbols since theyfelt that the literature contained widely varying symbolism which wasconfvusing. They suggested that clearer, unambiguous descriptions ofscattering be standardized, and they offered definitions to be con-sidered for adoption.
DeVore and Pfund (29) experimented with dielectric powders ofzinc sulfide And titanium-dioxide. Using the changing position ofthe Mie minimum with-variation of refractive index and an extrapola-tion procedure, they were able to measure the refractive index ofvarious powders. In addition, they reported on an interesting way topredict the Mie minimum for substances of known refractive indices."The wave length of the 'Mie minimum' changes as the refractive indexof the medium surrounding the particle is changed." And "Thespectral-transmission curve of a film of dielectric powder havinguniform particle size shows a very pronounced minimum correspondingto the Mie scattering maximum." The metlod is restricted, however,to the following: (a) the sample must have very uniform particlesize; and (b) the particle size must be such that the Mie minimum willfall in a measurable region of the spectrum.
iNumbers in parthdses refer to items in the bibliography.
14+5

Sinclair (132) discassed the factor of 2 foi extinction c;o~ssections of large particles, originating with the work of Rayleigh.He briefly related the historical progress of Mie and Rayleigh, andnoted previous experimental work. The Mie equations are theoreticallyvalid for any value of size parameter (alpha), but they are difficultto calculate for larger values and become impractical to nalculatefor alpha greAter than 10 cr 12, due to the slow convergence of theseries in the equations. He discussed briefly the workin which Debyepresented an approximate formula for calculations for large values ofalpha. Eor large values of alpha tne extinction cross section isK = 2;fr . From geometrical opticz it can be seen that for largespheres the scattering cross section is equal to two times the geo-metric cross sections. He then concluded thet (1) either the Mietheory was wrong-for--arge alpha (although correct for smalleralphaT, or (2) the theory is correct but Is difficult to verify ex-perimentally for large spheres. It now appears that the Mie theoryis c 2rrect and the theoretical cross section for large spheres is21Vr when both diffracted and intercepted light is considered. Inmost practical measurementsi only the intercepted light can be de-tected since the diffracted light is indistinguishable from the in-nident beam.
Henry (66) considered the transmission of powder films in theinfra-red region. A globar source was used and the powder was pre-pared on a disc for transmission measurements. In general, he foundthat the dry powder films consisting of small particles adhering totransparent plates have spectral transmission curves considerablydifferent from th9,e af the same materials in bulk form. The infra-red spectra from1 to 14 microns were !nvestigated.
Hardy and YLung (51) discussed the use of Beer's law for mix-tures. "The dependence of light absorptionr on length of path in ahomogeneous medium was correctly stated by Bouguer in 1729." In'1852 Beer discovered that varying the concentration of an absorbingsubstance has the same effect as varying the length of path. BothBouguer and Beer's lsw have been observed to fail if the light is notsufficiently monochromatic. The authors attempt to explain thatBeer's law does not fAil when a substance fails to obey the law, butit is the improper use of the law that is the cause of the failure.For a mixture of substances Beer's law must be applied to each com-ponent of the mixture. The paper discusses multi-componont systems.
Zimm (166) presented theoretical expressions for the intensityof light scattering as a function of angle in concentration. In-cluded is a discussion uf apparatus used to measure light scatteringfrom polystyrene solutions. White light has been used in conjunctionwith a filter to obtain a particulsr wave length.
Sinclair and LaMer (134) made one of the very important contri-butions to the field of light scattering as 4 measure o. particlesizes in aerosols. The paper contains a very good bac1mround of theMie and Rayleigh equations and discusses tke "factor of 2 error"which has appeared in some equations found in the literature. (Thisdiscussion appeared in earlier papers.) For the experimental
146

measurements monochromatic light was used whose wave length of .524plus or minus .OLe-Al€c-n was obtained through the use of a filter.Measurements of angular distributions of 3 to 175 degrees were madeat frequent intervals. The resulting measurements were integratedcver the entire sphere and compared with the Mie theory. The varia-tion in particle size was used to establish the particle sizeparameter, alpha, variation. The scattering cross section was ob-te.ined by comparison with the brightness of a diffuse reflector ofknown reflectivity. Use was made of the fact that for single scat-tering the intensity is a fimection of concentration. This is true,of course, only if the concentration is sufficiently low that second-ary scattering is negligible. If single scattering exists, the in-tensity scattered in a particular direction and from a given volumewill vary with the particle number concentration, as well as with theparticle radius raised to some power, as given in the equation
= nkrP. Variation of the exponent p with r has becn evaluated.The authors dlscussed a method to obtain size distribution in a fogof non-uniform droplet size by allowing it to settle in a convection-free fog clamber and observing the decrease in scattering intensitywith time. The paper also discussed Gucker's measurements, usingwhat is .elleved to he the post sensitive aerosol detector reported,1u0(10)¶• micrograms or 104 grams per liter. A method is discussedfol producing fogs of uniform droplet sizes which do not vary morethan 10 percent from the average found by microscopic meaburement.The droplets are below 0.2 micron. Plots calculated with the aid ofmathematical tables are included for the angular distribution func-tions iI and i 2 which are complicated functions of particle sizeparameter, refractive index, and scattering angle theta. Polar dia-grams for m = 1.55 and alpha = 1.5 and 3.6 are presented to show atypical diagram. Unfortunately, no curves or scattered diagrams arepresented for the fogs of non-uniform droplet size, which would en-able a comparison of their work with that of other investigators.Included in the appendix is a discussion of absorption and complexrefractive index,
"Absorption may arise from two causes: (1) in conductingmedia for which the conductivity, sigma, is finite, and (2) indielectrics when the incident wave length is not far from thatof an emission line. The first type of absorption is the onlyone considered in the derivation of the Mie theory. The secondtype of absorption results from the interaction of bound elec-trons and the incident electro-magnetic wave."
Kerker and LaMer (82) used the polarization ratio method toanalyze scattering light for equal size dictribution of sulfur hydro-soj.s. Filtered white light of 4360 angstroms and 5460 angstroms wasused. The polarization ratio method can be nonsidered, using meas-urements of the ratio of the intensities of the horizontal to verti-cal components of the scattered light, provided that alpha is lessthan 2. For values of alpha larger than 2 the ratio is no longermonotonic but undergoes a highly irregular fluctuation as a functionof alpha. If the ratio is plotted as a function of angle of observa-tion for a specific value of alpha, the resulting curve exhibits the
11+7
maxima and minima. The angular position and number of these maximaand minima vary in a regular manner with increasing alpha. When alphais greater than 1.5, these maxima and minima move toward the forwarddirection as alpha increases.
Dandliker (25) obtained the particle size of polystyrene latexfrom angular positions of minimunm intensity. The method is quitesimilar to that of LaMer and Sinclair in their study of aerosols andto the investigations of Johnson and LaMer in the determination ofparticle sizes of sulfur hydrosols. The apparatus used was the modi-fied Debye apparatus. Angular distribution of intensities was meas-ured at angles between 20 and 14+ degrees. A mercury arc source wasused with monochromatic light of uave length 4358 angstroms. Thepositions of minimum intensity in an angular dependence curve arefunctions of both refractive index and particle size parameter; hence,the location of these positions, that is, theta minimum, can be usedto determine the-size-of a sphere. This is a method similar to thatused by LdMer and Sinclair and by Johnson and LaMer when they studiedthe particle size of sulfur hydrosols. Dandliker has extended thesestudies and the measurements are carried out in the presence of trueabsorpti'n. Results of his investigation were compared with thesphere-diameter measurement using an electron microscope, and resultswere considered within experimental error.
A paper by Carr and Zimm (13) considers light scattering fromliquids, using three methods: (1) transmission, (2) integrated scat-tering, and (3) scattering at 90 degrees. The errors of their de-sign have been discussed: (a) refractive index of cell, correctionis required, (b) volume of cell as "seen" by photometer, correctionis required, and (c) the sensitivity of the photo cell variation.The electronic system was nearly the same as that used by Zimm (167),although it was moTrt•d slightly. Corning filters were used to ob-tain wave lengths 4358 and 5461 angstroms. Scattering of liquidssuch as benzene, carbon tetrachloride, dibenzyl, and sucrose octa-acetate wav measured. Turbidity measurements were included.
Hart and Montroll (53) presented a theoretical evaluation of thesolutions of the electro-magnetic theory (closed-form approximationof Rayleigh and Mie theories). The approximate theory yields totalscattering cross sections in good agreement with exact methods forrefractive indices 1 to 1.5. The Rayleigh-Gans theory is summarizedfor spheres of uniform density and of Gaussian density. No absorp-tion is considered.
In a paper by Cleveland and Raymond (22) the introduction offersa particularly good review of the theoretical and experimentai workin light scattering. The authors were the first to make m,.asurementsof integrated scattering by metallic spheres; however, results wereobtained on layers of particles rather than on an aerosol. A Perkin-Elmer spectrometer, Model 12A, was used. The extinction, rather thanangular scattering, was measured. The slit width was varied to main-tain fhll deflection on chart; consequently, angle reception alsovaried. Carbonyl iron was used in their experiment with a particle
148.

size of 2.7 microns on the average and with a range of 0.5 to 5 mi-crons. The specimen consisted of a layer of particles or a film ofparticles of rather close proximity (3.4-micron diameter maximum).The investigation covered a wave length range of 0.45 to 15 microns,utilizing a sodium chloride prism. The measured size of spheres wasnot considered to be accurate. The curves plotted were scatteringarea coefficienrrl versus particle size parameter, alpha; however,alpha was based on multi-dispersed systems. Since the size of theparticles was not accurately determined, the particle size parameterwas -based on an average Lize of particle. It was reported that theerror in k was probably due to the uncertainty in the obtainedtransmission values and the measured area coverage factors. The areacoverage factor was used in the determination of the particle sizeparameter, alpha. It was suggested that the error in alpha, esti-mated to be within 3 to 5 percent, was due to the uncertainty insphere size.
Gumprecht and Sliepcevich (48) define and discuss the terms:apparent and actual scattering coefficients. The actual scatteringcoefficient is based on the total amount of light scattered by a par-ticle in all directions, whereas the apparent scattering coefficientk is based on the amount of light scattered by a particle in alldirections except within a cone of half-angle theta in the fcrTarddirection. Scattering coefficient k is defined as the ratio betweenthe scattering cross-section and the geometric cross-section of thespherical particle. For large values of alpha kt approaches thevalue of 2 rather than 1. This D;ienomena, which might appear impos-sible for a large spherical particle, is explained on the basis ofBabinet's principle of diffraction by opaque circular discs. Sincethe apparent scattering coefficient has a value of 1 and approaches avalue of 2, depending upon the value of the half angle theta of thecone of reception, a distinction is made between ka and kt, with theratio ka to kt being defined as R. The defined term R is computedfrom diffraction theory and compared with the Mie theory. The ad-vantages of the lens-pinhole detector are discussed. Also discussedis experimental work on the transmission of light through dispersionsof glass spheres suspended in water to test the validity of computedvalues of R. According to this report, the lens-pinhole opticalsystem excludes practically all stray light from the photo tube. Theexact value for the half-angle theta can be calculated readily from adirect measurement of the diameter of the pinhole and the\ focallength of the lens. The value of theta is a constant and is inde-pendent of the location of the illuminated particle in the path ofthe beam or in the fringes of the beam. For the above three reasons,the lens-pinhole optical system is preferred.-
In another-paper-Gumprecht and Sliepcevich (49) discussed theirparticle size measurements on poly-dispersed systems. Their previousanalytical and experimental investigations of light transmissionequations were combined with Stoke's law of settling. The ratio ofactual to total scattering coefficients, R, defined in earlier work,was used in the transmission equation. Light transmission measure-ments were made on a dispersion containing particles above the
149

colloidal size range. The intensity of the transmitted light will,of course, gradually increase as the particles settle out under theinfluence of gravity. The size range of particles settling duringany interval of time can be computed from Stoke's law. Consequently,a combination of Stoke's law and the transmission equations permitted14ght transmission measurements on a dispersion undergoing tranquilsettling with time, making possible direct measurement of the rela-tionship between intensity and time and calculation of the number ofparticles as a function of diameter of the largest particle to obtainthe so-called size-frequency distribution curve.
Kerker and Hampton (81) used unfiltered light in an attempt toimprove results obtained in the measurement of particle sizes bymonochromatic light and measuring polarization ratio. Results fromthe unfiltered light method are comparable to those from monochro-matic light, and the authors conclude that it is unnecessary tofilter light when using polarization methods.
Maron and Lou (101) utilized light scattering measurements forthe determination of molecular weights. In this work Ludox (afinely-dispersed colloid of silica in water) was used with resultsbeing reported as very good.
Aughey and Baum (1) designed a device to measure the angulardistribution of intensity very near the zero direction (forward scat-tering). Their angular dependence light scattering device, using amercury arc as aj.zurc-e, was constructed by Dupont de Nemours. Theintensity was varied with filters and through use of.a slit control.Angular variation was from 140 degrees to .05 degrees. This was theonly device described in the literature that could measure the angu-lar distribution of intensity to such a small angle or so close tothe forward direction. The author's experiment, using white lightand filters, was restricted in wave length. This was the firstpaper encountered which mentioned continuous scanning. The incidentbeam used was not parallel, and this varied from most experimentsreported in the literature. A photo-multiplier was used. The opti-cal system is exceptionally good.
Tabibian, Peller, rpel (150) offer an introduction and reviewwhich is particularly good for background material.
Sekera (13) has presented a theoretical paper on light scatter-ing which discusses the experimental techniques of light scatteringas applied to atmospheric studies. The integro-differential equationof radiative transfer is discussed for atmospheric radiation. Thenormalized scattering function is expressed in the equation.Rayleigh type of scattering is assumed and the expression for thescattering function is that expressed by Chandrasekhar. A photo-electric polarimeter was constructed for mnasurements.
Heller and Pangonis (62) considered turbidity measurements on atheoretical basis. Mie, Rayleigh-Gans, Debye, and Einstein equationsare compared briefly in the introduction.
150

Heller and Tabibian (64) summarize errors in colloidal cellsused in turbidity measurements.
Heller-and Pugh (63) report on an experiment on particles of.67 micron in diameter and a refractive inder of 1.2. This was anexperimental investigation on the effect of light scattering uponthe refractive index of a colloid or of colloidal particles. An un-certainty of .003 in the refractive index will give 5 percent errorin particle size measurements, calculated from turbidity measure-ments. Therefore, the refractive index should be kniown to four dec-imal places.
Tabibian and Heller (149) made scattering measurements at 90 de-grees on very small spheres, that is .046 to .824 micron in diameter.Plots were included which show the concentration dependence of lightscattering at 90 degrees for several substances. Variation of lightscattering at 90 degrees with particle diameter is also included.Curve shows maxima and minima comparable to the theoretical Mie equa-tions for turbidity measurements (that is, extincticn measurements).Considerable discussion has been devoted to those curves which ex-hibit a decrease in the 90 degree intensity ratio with increasingconcentration and to a point of inflection which occurs in some ofthe curves of 90 degree intensity versus concentration. Some ofthis is explained by the lateral radiation of multiple scattering.The point has been made that measurements of angular distributionshould be taken with various solid angles and that the solid anglefor the 90 degree measurement should be sufficiently small to con-sider scattering from a single particle. This procedure for thevariation in solid angle should be followed unless the solid anglethat is used is small enough that the ratio of the intensity of90 degrees to the incident intensity is independgnt of solid angle.The solid angle used was reported to be 4.1(i0)" steradian.
Penndorf (116) discussos an approximation method for solutionof Mie equations for refractive indices less than 2, but for anyvalue of particle size parameter, alpha. The paper is based on thescattering theory for spheres of refractive indices near 1. 1haseand amplitude of scattering coefficient at the extrema are computed.rte results are plotted in three-dimensional form, which permitsgraphical interpretation. The investigation was a theoretical pres-entation as opposed to experimental. The author concludes that hismethod is much less time-consuming than using -an exact solution tothe Mie equations and that a complete description of the functionalrelationship between the-scattering coefficient k and the size of thesphere exists.
Heller, Naka~waki and Wallach (61) present a theoretical analysisor a comparison of the Rayleigh-Gans and the Mie theories. Investi-gation is for non-absorbing spheres.
Bateman, Wenack, and Eshler (4) determined the particle size andconcentration from spectral photometric transmission. Experimentalmeasurements for characterization of biological hydrosols in the

micron range with respect to size, concentration and refractive indexare reported. Measurements were made in the visible and long ultra-violet range. The spectro-photometer design made careful note of thespecifications set by Heller and Tabibian in their "error study".
Bonnelycke and Dandliker (8) used a colloidal of silica, Ludox,for their scattering measurements, since it supposedly does not ab-sorb at wave lengths of interest, that is, using a mercury arc andwave lengths of 4358 and 5461 angstroms. The transmission versus90-degree readings were compareg for particles 10 to 15 micro-micronsin diameter with a weight of 100.
A paper by Heller and Nakagaki, No. VII in a serie , (61) refersto dissymmetry, wrtich relates to the fact that the scattered light inthe forward direction is greater than the scattered light in thebackward direction. The theoretical calculation of dissymmetry is90 + delta gamma and 90 - delta gamma. Delta gamma is the angle be-tween the scattered--intensity and incident ray and is equal to 1+5 de-grees, giving dissymmetry at 45 and 135 degrees. The delta gammaequal to 90 degrees was presented in papers V and V1. The spheresconsidered had a refractive index of 1.2. The Mie theory was con-sidered, using the particle size parameter 0.2(0.2)15.2. The diameteris equal to 0.2 microns for the green mercury line, that is, at the15.2 value of the particle size parameter. This paper, as all ofHellei's work, is a very detailed theoretical examination of the re-sults of the Mie equation, and it can be considered one of the mostextensive works in the area.
Greenberg ('+3) used the scalar wave equation which is applicableto quantum-mechanics and acoustical problems as a basis for calcula-tions. Non-spherical scatterers are compared with sperical scat-terers.
Pritchard and Elliott (124) discuss the polar nephelometer andthe transmissometer. These two instruments were used to measurelight scattering and transmission of the atmospheres. The scatteringfunction was referred to as the scattering index. They found that ifwhite light and a broad band receiver were used large errors in scat-tering and attenuation measurements resulted. The article containsa description of the nephelometer, which can be called a device formeasuring the scattering of atmosphere. It utilizes a photo-multiplier detector. Scattering in the atmosphere was considered,and irregular shaped particles were encountered. The resulting curveswere smooth functions. The only irregularity appearing in theircurves was attributed to unstable conditions on a particular experi-ment in fog.
Kerker and Matijevic (84) experimentally analyzed light scat-tering of mono-dispersed polystyrene latexes at 45, 90, and 135 de-grees, in another investigation to verify the Mie theory. The ex-perimentally determined polarization ratio was compared with the Mietheory. Discrepancies noted between theory and experiment were at-tributed to secondary scattering. Measurements were made on systems
152

containing latex particles of sizes 1380, 2640, 5110, and 5570
angstroms. A photometer was used for measuring the scattered inten-sity.
Brackett and Charney designed an apparatus for measuring thespectral dependence of light scattering from large particles. How-ever, a very narrow angular range, 26.5 to 86 degrees, was used.
Keith and Derrick (77) studied the measurement of par!.1cle sizedistributions and concentrations of cigarette smoke. The signifi-cance of this paper to the current investigation is contained in thecentrifugal aerosol collector designed to collect parUi~'.es in therange .05 to 10 microns in diameter. The investigation sought tofind the distribution of particle sizes in cigarette smokes.
Langer and Lieberman (92) discuss the difficultirs in obtainingmono-dispersed aerosols. The atomization of mono-dispersed latexlattice does not necessarily produce mono-dispersed aerosol.
Coumou (24) developed an apparatus with which he measured theRayleigh factor for benzene and some other pure liquids. Light scat-tering by liquids or solutions is determined by compartson with astandard liquid, for which the scattering power has been previouslydetermined. In general, the standard is benzene. The absolutescattering of light by liquid can be characterized by the Rayleighfactor and the equation for this is presented.
Frei and Gunthard (39) consider the distortion of signals froma photometer due to slit widths, scanning speeds, and type of filterused. Influence parameters are defined and discussed.
Quoting from a paper by Greenberg, Pedersen, and Pedersen (44),in general it can be said that
"Particles with spherical symmetry present no difficulties.Similarly, several types of axially symmetric scatterers canbe treated by analytical and numerical methods for the situa-tion in which the radiation is directed along the axis of sym-metry, except for certain special cases there exists no suit-able solutions for non-spherical particles. It is for thisreason that we have developed an experimental method, whichuses micro-wave techniques for obtaining both photo crosssections and angular scattering distributions from arbitrarily-shaped particles."
"By proper scaling, the results are applicable to thescattering of light or of any wave length of electro-magneticradiation. so long as the mechanism of scattering can be con-sidered a clasvi7faI application of electro-magnetic theory."
Angular distribution measurements were made for angles-between 10 de-grees and 170 degrees, at 5-degree increments rather than continuousscanning. The total cross section was investigated. Single spheres
1 53

with refractive index 1.603 (luicite) were used and results were plot-ted on the theoretical Mie curve. In addition, spheroids and cylin-ders.were used to make measurements, some of which were made with 3centimeters wave length (1.25 inches). The size of particle was 3centimeters, that is, the same order of magnitude as the wave length.The angular scattering distributions of spheres are fairly well inagreement with theory. The Mie and Van de Hulst solutions are ap-plicable. They were interested in solutions to inter-stellar dustproblems. Particles with real refractive indices were used.
Pangonis; He.ler, and Economou (114), in another of a series ofpapers published by Heller and co-workers on light scattering, con-
*,, -didered various refractive indices 1.05 (.05)(1.3), and particle sizeparameter, alpha, .2(.2)25.6. The ratio of intensity at 90 degreesto the incident intensity was plotted versus alpha for the variousrefractive indices. Secondary fluctuations were noted for the largervalues of refractive index. The ratio of intensity wns higher atsmaller values of particle size parameter and was also highir forlarger values of refractive index. The data included in this report,together with that in previous reports, supplies the data requiredfor emulsion studies for particles between 0 and 3.3 microns in di-ameter and for mercury-vacuum wave length (5460.73 angstroms).
Gibbon, Nichol-sgLaughridge, and Rudkin (40) used a nephelometerto measure transmission and scattering properties at night on theNevada desert atmosphere. Particles were assumed to be in a range0.1 to 0.6 micron in diameter, and source receivers were located at adistance of 0.51 to 13.17 miles. The scattered intensity at a par-ticular angle, as compared to tho scattered intensity at 10 degrees,was plotted as a function of the scattering angle. The data was thenextrapolated to 0 from 10 degrees. White light was used with wavelengths 0.4, 0.45, 0.5, and 0.55 micron. No mention was made of themethod used in extrapolation. The ratio of the scattered intensityat 0 degrees as compared to that at 90 degrees was 50 or more. Theangular distribution was measured in 10-degree intervals o':ar arange from 10 to 170 degrees. It is of particular interest to theinvestigation presented here that the curves are smooth functions, aswould be expected dwlthparticles of irregular sizae.
Deirmendjian, Clasen, and Viezee (27) made detailed computationsof Mie scattering at Rand Corporation, considering complex indices ofrefraction. Most of the results were presented in graphic form forspheres of various optical properties. Scattering and absorptioncharacteristics were calculated. The summary and comments in thispaper are particularly noteworthy. It is pointed out that smallchanges in the absorption index have large influences on the inten-sity and polarization of scattered flux. "Both theory and experi-mental measurements show that the scattering properties of a poly-dispersed media tend to be smooth functions of the scattering angle."Theoretical invebtigations have shown that flux scattered at anglesbetween 0 and 40 degrees exceed the back-scattered flux at angles be-tween140 to 180 degrees by 2 to 40 orders of magnitude. The authorsnotedcthat the ratio mentioned above does not depend on the
15+
absorption properties in a simple manner. In addition, they pointedout that secondary maxima and minima are absent in the case of ab-sorbing particles.
Gucker and Egan (45) measured angular variation by developing anelaborate system and exercising great care in suspending single par-ticles of dioctyl phthlate 0.7 to 1.5 microns in radius betweenelectro-static plates 19 millimeters apart and 75 millimeters in di-ameter. A very ingenious method was used to suspend a single par-ticle for measurement, the size of which was calculated from Stoke'slaw. After measuring the rate 9f fall while viewing the particlethrough a microscope, the results were compared to the Mie theorybased on calculations-wtith 10-degree intervals. Curves were normaliz-ed to obtain'a fit between the experimental and theoretical results.The first maxima, with theta approximately equal to 42 degrees,served as a standard. The distribution of angular intensity over arange of 40 to 140 degrees was considered, and white light with afilter was used to obtain a wave length of 436 milli-microns with aband widtb of 7 milli-microns. The following explanation was of-fered for the deviation of the experimental results from the theo-retical results: In theory the light was collected by infinitesimalaperture, while the experimental results were obtained through theuse of a lens system which integrated the radially varying intensityover a 5.3 degree range. Also, in theory, monochromatic light isconsidered, whereas in the experimental work a wave length band of7 milli-microns was necessary. This seems to be the only paperavailable in the literature covering an investigation in which meas-urements on a single particle were made to validate the Mie theory.
Dezelic and Kratohvil (30) reevaluated previous work on latexes.The particle size measured was lower than that obtained from theelectron microscopy, but no reason was given for this.
Gibbons, Laughridge, Nichols, and Krause (40), in a test similarto one completed in 1959 but using measurements made under cloudyskies, used both white and near infra-red sources. In a comparisonof the results with those of the previous investigations, the resultswith partial cloud coverage were similar to clear sky, but the fullcloud coverage had more influence. All the curves presented weresmooth functions.
Keller (78) presents an excellent discussion on the geometricaltheory of diffraction, with an exceptionally good introduction. Itis a paper that should be read in conjunction with books on electro-magnetic wave theory; for example, the work of Stratton.
Butler (12) examined the effects of light scattering on absorp-tion spectra and presents analytical expressions which predict spec-tral characteristics of light scattering media. In general, littlework has been done to describe the transmission and absorptionproperties of materials; however, Butler has investigated the ab-sorption of light on such materials as calcium carbonate and aluminumoxide powders as well.as~poly.*yrene lat, xes.
155

Heller, Bhatnegar, and Nakagaki (58), in another of the seriesof papers by Heller and co-workers, note that one of the character-istic features of light scattering by non-absorbing spheres whose
j diameter is small compared to wave length (Rayleigh scattering) isthat the specific turbidity at infinite dilution can be expressed asthe Rayleigh factor, which is k ".A method of "wave length ex-ponent" which is comparable to Debye's dissymmetry method for de-termining size of particles which are negligibly small compared towave length is discussed. These have in common the important ad-vantage that the concentration of the scattering material does notneed to be known, although single scattering must be prevalent.. Atheory of wave length exponent is given and theoretical calculationsare presented.
Penndorf (117) presents a very good discussion of the Mie theorywith explanations of various definitions of scattering coefficients,intensity and scattering functions, etc. It points out the fact thatgeneralizations and conclusions of the Mie theory require quite ex-tensive computations.
A publication by Kratohvil, Dezelic, and Kerker (86) is a surveyof papers, both experimental and theoretical, which have used theRayleigh ratio of benzene as a standard for calibration.ý It pointsout the discrepancies between authors which are not attributable toexperimental error.
For those interested in light Ecattering publications of a the-oretical niture, the following papers should be consulted in additionto those already-menitionedt: Heller (55, 56, 58), Nakagaki (110, 111),Schiff (128, 129), and Wyatt (163).
156

APPENDIX H
NOMENCLATURE
English Symbols
a - Quadrature weight factorjc - Velocity of light, (f':)(hr)'l
d - Particle diameter, (ft)
h - Planck's constant, (Btu)(hr)-I
I - Monochromatic intensity of radiation, (Btu)(ft) 2
(stearadian) -l
Ke n Extinctiolg-ncoss section
k n Boltzman's constant, (Btu)(R)"l
a a Scattering function
a - Distance along a ray, (ft)
x = Normal coordinate distance, (ft)
Greek-Syvmbols8
* a Particle size parameter
- Monochromatic mass extinction coefficient, (ft) 2 (lb )-m
9- Polar angle, radians
e - Angle between incident and leaving ray, radians
x a Monochromatic mass absorption coefficient, (ft)2 (lb M)l
a Radiation wave length, (ft)
* Cosine S
- Frequency of Radiation, (hr)}'
W a 3.1416
P a Mass density, (lb )(ft)' 3
a Monochromatic mass scattering coefficient, (ft)2 (lb )-lm
I57

- Optical depth
* w Azimuthal angle, radians
w = Solid angle, stearadian
Subscripts
i j Iteration index
j Iteration index
158