Chapter 6: Effective control of the common myna - Dr Kate ...
23
Chapter 6: Effective control of the common myna Chapter 6 Effective control of the common myna Published as: Grarock, K, Tidemann CR, Wood JT, Lindenmayer DB (2013) Understanding basic species population dynamics for effective control: a case study on community-led culling of the common myna (Acridotheres tristis). Biological Invasions, Online First: 5 November, doi:10.1007/s10530-013-0580-2 Manuscript: Appendix 5
-
Upload
khangminh22 -
Category
Documents
-
view
3 -
download
0
Transcript of Chapter 6: Effective control of the common myna - Dr Kate ...

Chapter 6: Effective control of the common myna
Chapter 6
Effective control of the common myna
Published as:
Grarock, K, Tidemann CR, Wood JT, Lindenmayer DB (2013)
Understanding basic species population dynamics for effective control: a case study on
community-led culling of the common myna (Acridotheres tristis).
Biological Invasions, Online First: 5 November, doi:10.1007/s10530-013-0580-2
Manuscript: Appendix 5

Chapter 6: Effective control of the common myna
Grarock K., Introduction, spread, impact and control of the common myna 107
6.1 Abstract
Population manipulation of introduced species can be difficult and many widespread
eradication or reduction attempts have failed. Understanding the population dynamics of a
species is essential for undertaking a successful control program. Despite this, control attempts
are frequently undertaken with limited knowledge of the species population dynamics. For
example, in Australia, concern over the impact of the introduced common myna (Acridotheres
tristis) has led to community members culling the species. In this paper, we assessed the impact
of a community-led common myna culling program over broad and fine-scales in Canberra,
Australia. We utilised a basic population model to enhance understanding of common myna
population dynamics and the potential influence of various culling regimes. We found a
significant negative relationship between common myna abundance and culling at fine-scales (1
km2). However, over broad-scales the relationship between common myna abundance and
culling was not significant. Our population model indicated culling at a rate of 25 birds per km2
per year would reduce common myna abundance, regardless of initial density. Our results
suggest that currently too few individuals are being removed from the Canberra population, and
natural reproduction, survival and/or immigration is able to replace the culled individuals. This
highlights the value of undertaking basic population modelling to assess if potential control
measures are capable of achieving desired outcomes. Our work provides information for
researchers, government and community groups interested in controlling not only the common
myna, but also other introduced species.
6.2 Introduction
Increased trade and transport has led to the introduction of numerous species worldwide
and the number of these introductions is increasing (Lockwood et al. 2005; Hulme 2006;
Ascunce et al. 2011; Ricciardi 2012) The impact of introduced species can be varied with some
species having devastating impacts while others are relatively benign (Davis 2003; Gurevitch
and Padilla 2004; Gurevitch et al. 2011; Ricciardi 2012; Ruhren 2012). Due to the negative
impacts of some introduced species, often significant effort is made to manage them.
Introduced species management has traditionally focused on eradication (Newton 1998;
Davis et al. 2011). However, many widespread eradication or reduction measures have failed,
leading to a waste of resources (Caughley 1977; Ward et al. 1979; Feare 1991; Newton 1998;
Shine and Doody 2010; Davis et al. 2011). Examples include the failure of 26 of 30 attempted
plant eradications in the Galapagos Islands since 1996 (Davis et al. 2011) and the expenditure
of more than $AUD20 M that has largely failed to eradicate cane toads (Rhinella marina) from
Australia (Shine and Doody 2010).
Eradicating an introduced species can be difficult and often only isolated populations or
newly established species can be effectively eradicated (Hulme 2006; Zabala et al. 2010). The
Chapter 6: Effective control of the common myna
Grarock K., Introduction, spread, impact and control of the common myna 108
traits that make a species abundant are often the same traits that make a species difficult to
control (for example, a high reproductive rate) (Newton 1998; King and Powell 2011). A
population can compensate for culling losses through density dependent changes in
reproduction, survival or immigration (Nichols et al. 1984; Conroy and Krementz 1990; Feare
1991; Nichols 1991; Shine and Doody 2010; Lebreton 2005; King and Powell 2011). Therefore,
some species can be culled heavily year after year without achieving long-term reductions in
their abundance or the damage they cause (Newton 1998; Shine and Doody 2010; King and
Powell 2011).
Due to the difficulties associated with introduced species eradication, many programs
have now shifted toward impact reduction measures, as they tend to be a more economical and
effective way of impact mitigation (Newton 1998; Shine and Doody 2010; Melero et al. 2010).
Numerous methods are available to reduce the impact of introduced species, such as the use of
physical protection (fencing, netting, exclusion device), repellents (chemical, scaring device),
resistance measures (development of resistant crops), and management (changing cropping
time, location or planting ‘lure crops’) (Feare 1991; Newton 1998; Tracey et al. 2007).
However, the impact of an introduced species is often related to their abundance and therefore,
population control may still be necessary (Braysher 1993). Strategies should aim to reduce
species abundance to below a threshold where their ‘damage’ is minimised (Braysher 1993;
Shea and NCEAS 1998; Beggs and Rees 1999; Eiswerth and Johnson 2002). However, defining
such thresholds can be extremely difficult (Hone 1995; Choquenot and Parkes 2001; Eiswerth
and Johnson 2002; Buckley et al. 2004; Edwards et al. 2004). For detailed assessments of
setting thresholds for pest control see Choquenot and Parkes (2001) and Bonesi et al. (2007).
To reduce the size of a population, the number of individuals culled annually needs to
be higher than the maximum rate of population growth (Caughley 1977; Sutherland et al. 2004;
Zuberogoitia et al. 2010; King and Powell 2011). This rate of culling also needs to be sustained
year after year or numbers may recover (Shine and Doody 2010; Zuberogoitia et al. 2010; King
and Powell 2011). Therefore, to successfully manipulate the population size of a species, its
biology and population dynamics need to be understood (Newton 1998; Zuberogoitia et al.
2010; Zabala et al. 2010; King and Powell 2011; Louette et al. 2013). An effective method for
population reduction also needs to be available (Newton 1998; Melero et al. 2010; Zabala et al.
2010; Louette et al. 2013; Tobin et al. 2014).
A key example of a control program, where little is known about species biology and
population dynamics, is the culling of the common myna (Acridotheres tristis) in Australia.
Using this case study, we demonstrated how knowledge of a species population dynamics and
biology can be employed to enhance culling outcomes.
Globally, concern over the impact of the common myna is growing rapidly due to it
competing with native species for territory and nest cavities (Feare and Craig 1998; Lowe et al.
2000; Dhami and Nagle 2009). In 2005, the Australian community voted the common myna as

Chapter 6: Effective control of the common myna
Grarock K., Introduction, spread, impact and control of the common myna 109
the ‘most significant pest’, ‘the pest problem seen to be increasing most’, and the top ‘pest
problem that needs more control’ (ABC 2011). Concern about the common myna was greater
than species that have devastating impacts in Australia such as the cane toad, red fox (Vulpes
vulpes), feral cat (Felis catus) and European rabbit (Oryctolagus cuniculus) (Reddiex and
Forsyth 2006). As a result, community-led trapping programs for the common myna have been
initiated (CIMAG 2013). These trapping programs often focus on culling as many individuals
possible, but are not guided by an understanding of the number of individuals that need to be
culled to reduce species abundance. Therefore, it is timely that the effectiveness of community-
led culling is assessed.
In this paper, we used culling data and bird survey data to investigate whether
community-led culling is reducing common myna abundance in the city of Canberra, Australia.
We analysed changes in common myna abundance over fine-scale (1 km2) and broad- scale
(approximately 70 km2) regions, in relation to culling by a community group. We hypothesised
that community-led culling in Canberra is responsible for apparent reductions in common myna
abundance. We then utilised a basic population model to enhance understanding of common
myna population dynamics and the potential impact of various culling rates on the abundance of
this introduced species.
6.3 Method
6.3.1 Background on the common myna and community-led culling
The common myna is listed in the world’s worst invasive species (Lowe et al. 2000) and
the species has been observed dominating natural nesting cavities, evicting native birds, killing
the chicks and destroying eggs (Byrd 1979; Jones 1996; Pell and Tidemann 1997a, b; Feare and
Craig 1998; Harper et al. 2005).
In April 2006, the Canberra Indian Myna Action Group (CIMAG) was formed (CIMAG
2013). CIMAG is a community group that aims to reduce the impact of the introduced common
myna, through public education (to reducing feeding and breeding opportunities) and a humane
culling program. The group uses pet food as bait to lure individuals into valve traps, before
humanely euthanising them (CIMAG 2013). Traps are designed to permit entry to the common
myna by means of a valve through which individuals can enter freely but are unable to locate
the exit (Tidemann 2010). CIMAG has approximately 1,400 members that have euthanised over
45,000 individuals from the Canberra area over 7 years (CIMAG 2013). The common myna
was once the third most common bird species in Canberra but since culling began it has dropped
to the thirteenth most common bird species (Canberra Ornithologists Group 2011). The culling
program is considered to be ‘successful’ by CIMAG. Other community groups around Australia
and overseas have sought advice and support from CIMAG to implement their own control
programs (B Handke 2013 pers. comm. 20 Jan.).
Chapter 6: Effective control of the common myna
Grarock K., Introduction, spread, impact and control of the common myna 110
6.3.2 Study site
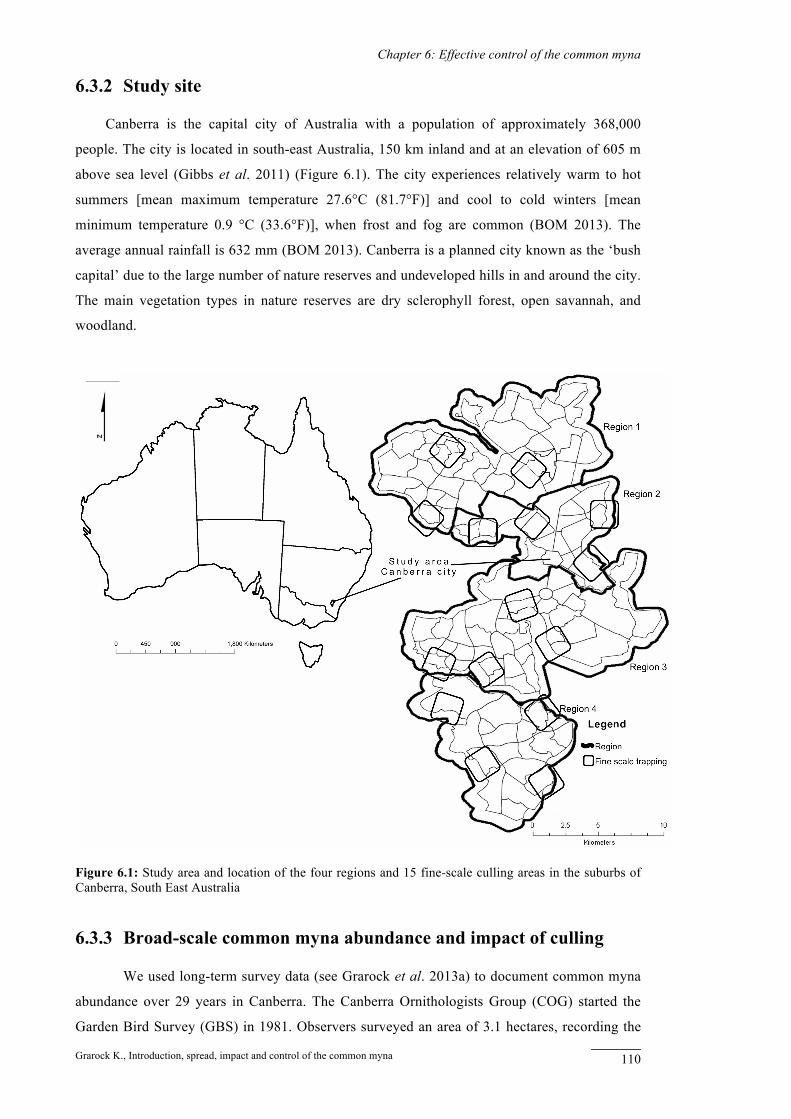
Canberra is the capital city of Australia with a population of approximately 368,000
people. The city is located in south-east Australia, 150 km inland and at an elevation of 605 m
above sea level (Gibbs et al. 2011) (Figure 6.1). The city experiences relatively warm to hot
summers [mean maximum temperature 27.6°C (81.7°F)] and cool to cold winters [mean
minimum temperature 0.9 °C (33.6°F)], when frost and fog are common (BOM 2013). The
average annual rainfall is 632 mm (BOM 2013). Canberra is a planned city known as the ‘bush
capital’ due to the large number of nature reserves and undeveloped hills in and around the city.
The main vegetation types in nature reserves are dry sclerophyll forest, open savannah, and
woodland.
Figure 6.1: Study area and location of the four regions and 15 fine-scale culling areas in the suburbs of Canberra, South East Australia
6.3.3 Broad-scale common myna abundance and impact of culling
We used long-term survey data (see Grarock et al. 2013a) to document common myna
abundance over 29 years in Canberra. The Canberra Ornithologists Group (COG) started the
Garden Bird Survey (GBS) in 1981. Observers surveyed an area of 3.1 hectares, recording the
Chapter 6: Effective control of the common myna
Grarock K., Introduction, spread, impact and control of the common myna 111
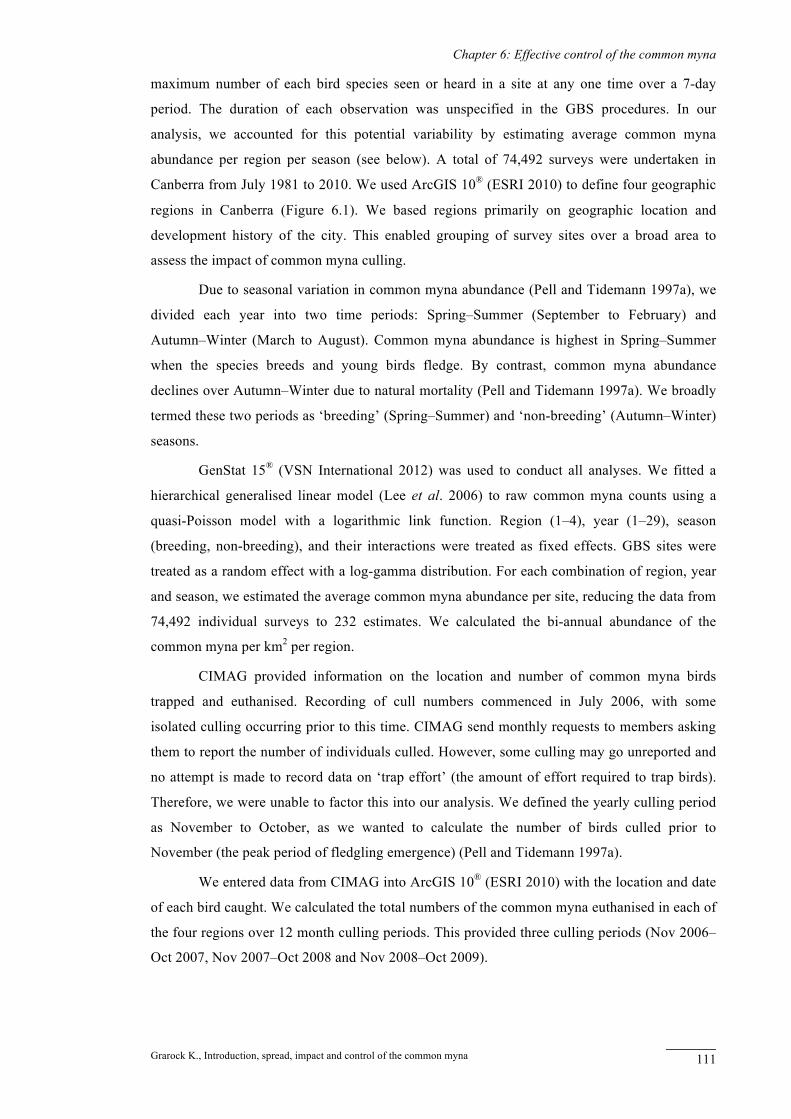
maximum number of each bird species seen or heard in a site at any one time over a 7-day
period. The duration of each observation was unspecified in the GBS procedures. In our
analysis, we accounted for this potential variability by estimating average common myna
abundance per region per season (see below). A total of 74,492 surveys were undertaken in
Canberra from July 1981 to 2010. We used ArcGIS 10® (ESRI 2010) to define four geographic
regions in Canberra (Figure 6.1). We based regions primarily on geographic location and
development history of the city. This enabled grouping of survey sites over a broad area to
assess the impact of common myna culling.
Due to seasonal variation in common myna abundance (Pell and Tidemann 1997a), we
divided each year into two time periods: Spring–Summer (September to February) and
Autumn–Winter (March to August). Common myna abundance is highest in Spring–Summer
when the species breeds and young birds fledge. By contrast, common myna abundance
declines over Autumn–Winter due to natural mortality (Pell and Tidemann 1997a). We broadly
termed these two periods as ‘breeding’ (Spring–Summer) and ‘non-breeding’ (Autumn–Winter)
seasons.
GenStat 15® (VSN International 2012) was used to conduct all analyses. We fitted a
hierarchical generalised linear model (Lee et al. 2006) to raw common myna counts using a
quasi-Poisson model with a logarithmic link function. Region (1–4), year (1–29), season
(breeding, non-breeding), and their interactions were treated as fixed effects. GBS sites were
treated as a random effect with a log-gamma distribution. For each combination of region, year
and season, we estimated the average common myna abundance per site, reducing the data from
74,492 individual surveys to 232 estimates. We calculated the bi-annual abundance of the
common myna per km2 per region.
CIMAG provided information on the location and number of common myna birds
trapped and euthanised. Recording of cull numbers commenced in July 2006, with some
isolated culling occurring prior to this time. CIMAG send monthly requests to members asking
them to report the number of individuals culled. However, some culling may go unreported and
no attempt is made to record data on ‘trap effort’ (the amount of effort required to trap birds).
Therefore, we were unable to factor this into our analysis. We defined the yearly culling period
as November to October, as we wanted to calculate the number of birds culled prior to
November (the peak period of fledgling emergence) (Pell and Tidemann 1997a).
We entered data from CIMAG into ArcGIS 10® (ESRI 2010) with the location and date
of each bird caught. We calculated the total numbers of the common myna euthanised in each of
the four regions over 12 month culling periods. This provided three culling periods (Nov 2006–
Oct 2007, Nov 2007–Oct 2008 and Nov 2008–Oct 2009).
Chapter 6: Effective control of the common myna
Grarock K., Introduction, spread, impact and control of the common myna 112
We used estimates of common myna abundance per km2 per region in the breeding
season to investigate the impact of common myna culling. We focused on the breeding season
(Spring–Summer) due to greater abundance and visibility of the species at this time.
We observed that there were some reductions in common myna abundance prior to April
2006, when culling commenced (Figure 6.2). Therefore, we wanted to avoid mistakenly
identifying culling as reducing common myna abundance when it could potentially be due to
other influences (for example, natural population limitation). Therefore, we extended our
analysis to include common myna abundance in the 3 years prior to common myna culling
(when common myna culling was approximately equal to zero). We used linear regression, to
investigate the relationship between changes in common myna abundance per km2 and birds
culled per km2.
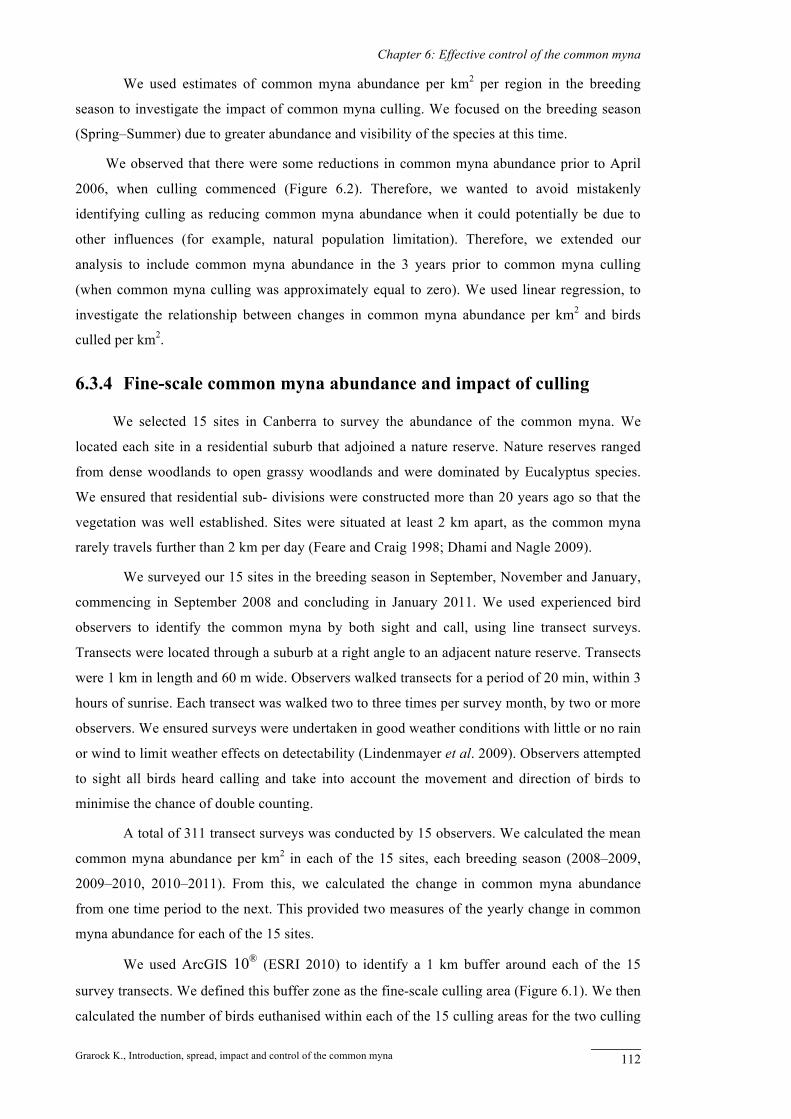
6.3.4 Fine-scale common myna abundance and impact of culling
We selected 15 sites in Canberra to survey the abundance of the common myna. We
located each site in a residential suburb that adjoined a nature reserve. Nature reserves ranged
from dense woodlands to open grassy woodlands and were dominated by Eucalyptus species.
We ensured that residential sub- divisions were constructed more than 20 years ago so that the
vegetation was well established. Sites were situated at least 2 km apart, as the common myna
rarely travels further than 2 km per day (Feare and Craig 1998; Dhami and Nagle 2009).
We surveyed our 15 sites in the breeding season in September, November and January,
commencing in September 2008 and concluding in January 2011. We used experienced bird
observers to identify the common myna by both sight and call, using line transect surveys.
Transects were located through a suburb at a right angle to an adjacent nature reserve. Transects
were 1 km in length and 60 m wide. Observers walked transects for a period of 20 min, within 3
hours of sunrise. Each transect was walked two to three times per survey month, by two or more
observers. We ensured surveys were undertaken in good weather conditions with little or no rain
or wind to limit weather effects on detectability (Lindenmayer et al. 2009). Observers attempted
to sight all birds heard calling and take into account the movement and direction of birds to
minimise the chance of double counting.
A total of 311 transect surveys was conducted by 15 observers. We calculated the mean
common myna abundance per km2 in each of the 15 sites, each breeding season (2008–2009,
2009–2010, 2010–2011). From this, we calculated the change in common myna abundance
from one time period to the next. This provided two measures of the yearly change in common
myna abundance for each of the 15 sites.
We used ArcGIS 10® (ESRI 2010) to identify a 1 km buffer around each of the 15
survey transects. We defined this buffer zone as the fine-scale culling area (Figure 6.1). We then
calculated the number of birds euthanised within each of the 15 culling areas for the two culling

Chapter 6: Effective control of the common myna
Grarock K., Introduction, spread, impact and control of the common myna 113
periods (Nov 2008–Oct 2009 and Nov 2009–Oct 2010). To assess the impact of culling, we
performed linear regression analysis using the change in common myna abundance per km2
against birds culled per km2.
6.3.5 Common myna population model
We used a logistic growth model to investigate how a common myna population would
react to various levels of culling at different population densities. For simplicity, we utilised a
model with no stochastic dynamics (environmental change). We used the generalised logistic
model outlined by Sutherland et al. (2004) and derived from Caughley (1977). The change in
population from one time period to the next was governed by the following equation
(Sutherland et al. 2004):
Nt+1 = Nt + rmaxNt(1 – Nt/K) - ctNt
where Nt is population size at timet, rmax is the maximum growth rate, K is the carrying
capacity, and, ct is the culling rate for the same time period.
We used the average estimates from Grarock et al. (2013a) for the maximum growth
rate and carrying capacity for the common myna over four regions in Canberra. Grarock et al.
(2013a) used a composite 41-year data set to reconstruct the invasion sequence of the common
myna in Canberra since 1968. The average maximum rate of population growth was 24.1 (±6.4)
birds per km2 per year and the average maximum population size was 205.9 (±34.6) birds per
km2.
We used the logistic growth model to establish an understanding of the number of
individuals that need to be culled to reduce the population size. From this model, we identified
the level of cull required (per km2 per year) at various population sizes to produce a significant
(>10%) reduction in common myna abundance. Ultimately culling strategies should aim to
reduce common myna abundance below a predefined threshold, where their ‘damage’ is
minimised (Braysher 1993; Shea and NCEAS 1998; Eiswerth and Johnson 2002). However, in
the absence of such research on the common myna, we used a 10% reduction as a guide to assist
with understanding the number of individuals that need to be culled to reduce species
abundance.
We then estimated the total annual rate of common myna culling per km2 in Canberra
required to reduce species abundance. Using ArcGIS 10® (ESRI 2010) we calculated the total
area of Canberra suburbs as 326.92 km2. This area includes only the suburban area of Canberra
and excludes nature reserves as well as surrounding urban areas of Queanbeyan, Hall and
Hume. We then multiplied the required culling rate per km2 per year, by the total area of
Canberra suburbs.
. Figure 6.2: L

Chapter 6: Effective control of the common myna
Grarock K., Introduction, spread, impact and control of the common myna 114
Chapter 6: Effective control of the common myna
Grarock K., Introduction, spread, impact and control of the common myna 115
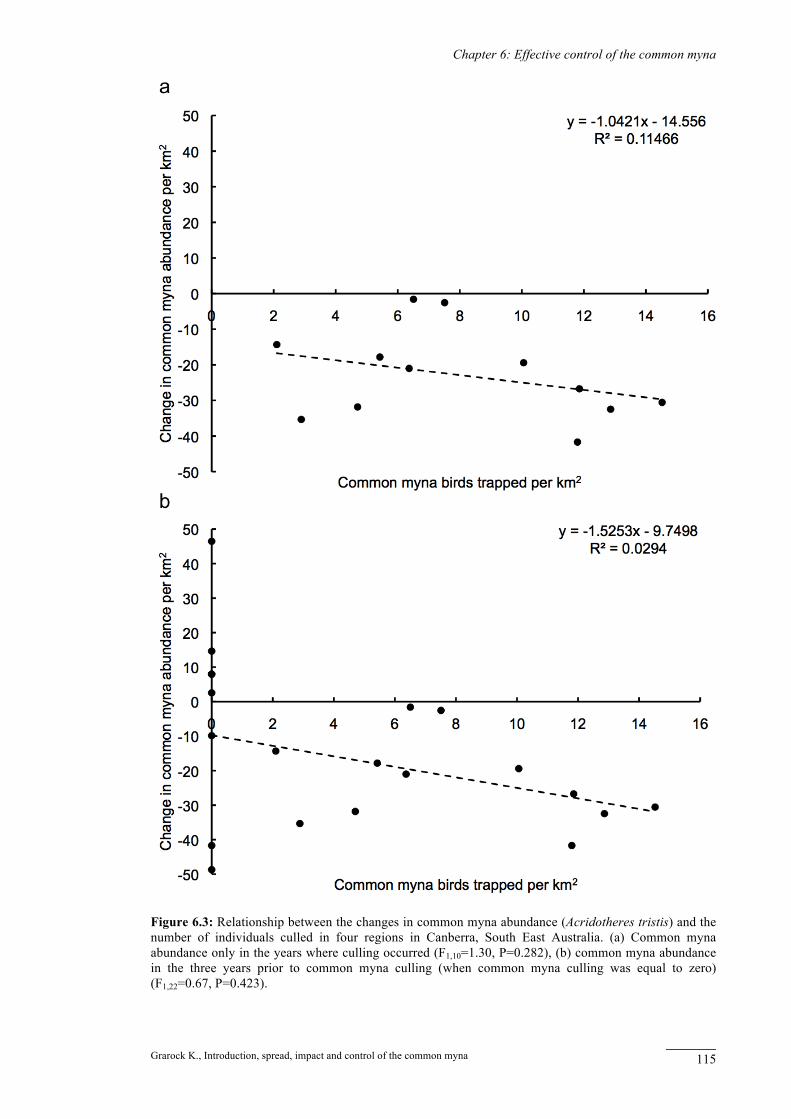
Figure 6.3: Relationship between the changes in common myna abundance (Acridotheres tristis) and the number of individuals culled in four regions in Canberra, South East Australia. (a) Common myna abundance only in the years where culling occurred (F1,10=1.30, P=0.282), (b) common myna abundance in the three years prior to common myna culling (when common myna culling was equal to zero) (F1,22=0.67, P=0.423).

Chapter 6: Effective control of the common myna
Grarock K., Introduction, spread, impact and control of the common myna 116
6.4 Results
6.4.1 Broad-scale common myna abundance and impact of culling
In all four regions in our study, common myna abundance fluctuated over the 29 year
period (Figure 6.2). In some regions there appeared to be a decline in common myna abundance
prior to the commencement of community-led culling (Figure 6.2).
We found no significant relationship between the yearly change in common myna
abundance per km2 and yearly culling per km2 (F1,10=1.30, P=0.28) (Figure 6.3a). When we
included the 3 years of data prior to common myna culling, the relationship further weakened
(F1,22=0.67, P=0.42) (Figure 6.3b). Two of the largest observed reductions in common myna
abundance (41 and 49 birds per km2) occurred prior to culling (Figure 6.3b). This finding
indicates that community-led culling in Canberra is not responsible for reductions in broad-
scale common myna abundance.
Figure 6.4: Relationship between the change in common myna abundance (Acridotheres tristis) and the number of individuals culled in 15 fine-scale sites (1 km2) in Canberra, South East Australia (F1,28=20.67, P<0.001).
Chapter 6: Effective control of the common myna
Grarock K., Introduction, spread, impact and control of the common myna 117
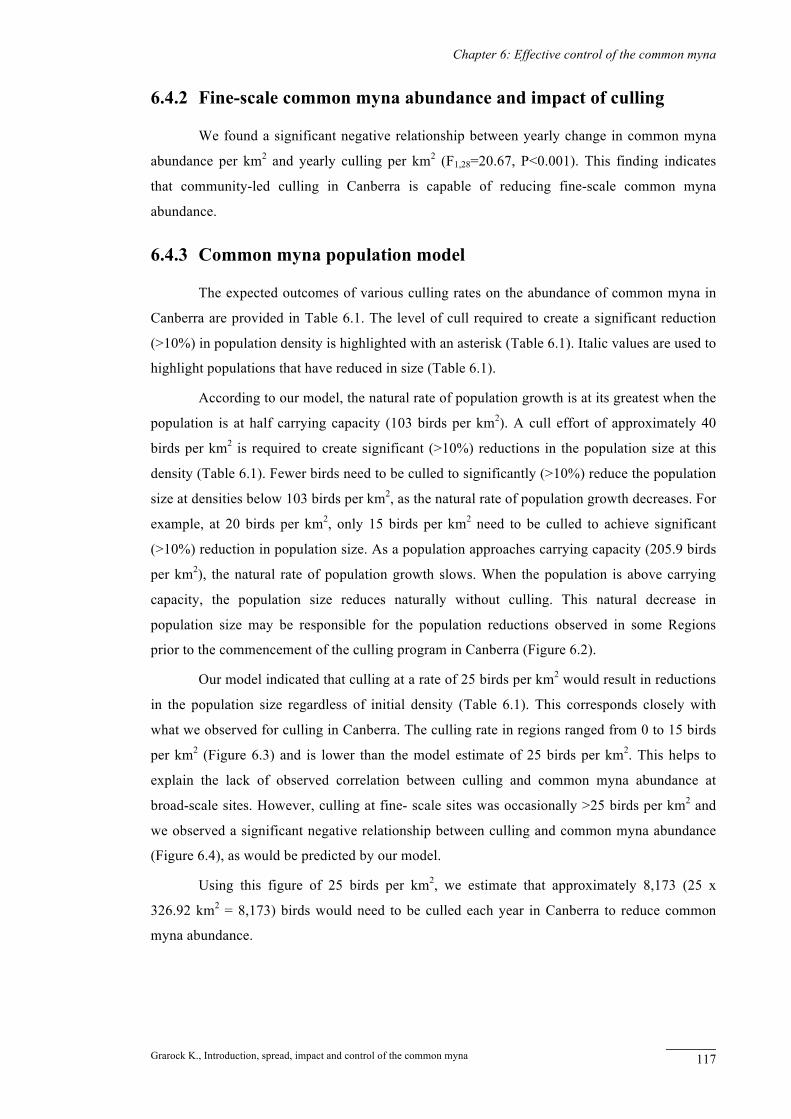
6.4.2 Fine-scale common myna abundance and impact of culling
We found a significant negative relationship between yearly change in common myna
abundance per km2 and yearly culling per km2 (F1,28=20.67, P<0.001). This finding indicates
that community-led culling in Canberra is capable of reducing fine-scale common myna
abundance.
6.4.3 Common myna population model
The expected outcomes of various culling rates on the abundance of common myna in
Canberra are provided in Table 6.1. The level of cull required to create a significant reduction
(>10%) in population density is highlighted with an asterisk (Table 6.1). Italic values are used to
highlight populations that have reduced in size (Table 6.1).
According to our model, the natural rate of population growth is at its greatest when the
population is at half carrying capacity (103 birds per km2). A cull effort of approximately 40
birds per km2 is required to create significant (>10%) reductions in the population size at this
density (Table 6.1). Fewer birds need to be culled to significantly (>10%) reduce the population
size at densities below 103 birds per km2, as the natural rate of population growth decreases. For
example, at 20 birds per km2, only 15 birds per km2 need to be culled to achieve significant
(>10%) reduction in population size. As a population approaches carrying capacity (205.9 birds
per km2), the natural rate of population growth slows. When the population is above carrying
capacity, the population size reduces naturally without culling. This natural decrease in
population size may be responsible for the population reductions observed in some Regions
prior to the commencement of the culling program in Canberra (Figure 6.2).
Our model indicated that culling at a rate of 25 birds per km2 would result in reductions
in the population size regardless of initial density (Table 6.1). This corresponds closely with
what we observed for culling in Canberra. The culling rate in regions ranged from 0 to 15 birds
per km2 (Figure 6.3) and is lower than the model estimate of 25 birds per km2. This helps to
explain the lack of observed correlation between culling and common myna abundance at
broad-scale sites. However, culling at fine- scale sites was occasionally >25 birds per km2 and
we observed a significant negative relationship between culling and common myna abundance
(Figure 6.4), as would be predicted by our model.
Using this figure of 25 birds per km2, we estimate that approximately 8,173 (25 x
326.92 km2 = 8,173) birds would need to be culled each year in Canberra to reduce common
myna abundance.

Chapter 6: Effective control of the common myna
Grarock K., Introduction, spread, impact and control of the common myna 118
Table 6.1: Expected common myna (Acridotheres tristis) abundance after various culling regimes and initial population densities, using a logistic growth model#
#Italic values indicate populations would be expected to reduce in size and an asterisk indicates populations that would be expected to reduce significantly (>10%).
6.5 Discussion
6.5.1 Study Overview
We assessed the impact of community-led culling on common myna abundance, using
bird survey data and culling at different spatial scales in Canberra, Australia. To the best of our
knowledge, it is the first investigation to demonstrate that community-led culling is capable of
reducing the local abundance of the common myna. We also utilised a basic population model
to enhance the understanding of population dynamics and the potential influence of various
culling regimes. Our study provided a unique opportunity to demonstrate how knowledge of
species population dynamics and biology can be employed to enhance culling outcomes. This
knowledge will enable culling targets to be set and guide planning of methods to achieve these
targets. However, thresholds for common myna abundance still need to be determined and
should be a priority. This paper provides valuable approaches and information for researchers,
government and community groups interested in controlling not only the common myna but
also other introduced species.
We observed that high-intensity culling appears to reduce common myna abundance at
a fine-scale (1 km2). This indicates that community-led culling is capable of reducing the local
abundance of the common myna. However, this high-intensity community-led culling may not
be achievable over larger scales. Our results indicate that broad-scale culling of the common
myna falls short of the levels required to reduce population numbers. The graphs of broad-scale
common myna abundance (Figure 6.2) and culling (Figure 6.3) and the common myna culling
model (Table 6.1) suggest that too few individuals are currently being removed from the
population to achieve a significant (>10%) reduction in the population size. Therefore, we reject
our hypothesis that community-led culling in Canberra is responsible for reductions in common
Our model indicated that culling at a rate of 25 birds
per square kilometer would result in reductions in the
population size regardless of initial density (Table 1).This corresponds closely with what we observed for
culling in Canberra. The culling rate in regions ranged
from 0 to 15 birds per square kilometer (Fig. 3) and islower than the model estimate of 25 birds per square
kilometer. This helps to explain the lack of observedcorrelation between culling and common myna abun-
dance at broad-scale sites. However, culling at fine-
scale sites was occasionally [25 birds per squarekilometer and we observed a significant negative
relationship between culling and common myna
abundance (Fig. 4), as would be predicted by our
model.Using this figure of 25 birds per square kilometer,
we estimate that approximately 8,173 (25 9
326.92 km2 = 8,173) birds would need to be culledeach year in Canberra to reduce common myna
abundance.
Discussion
Study overview
We assessed the impact of community-led cullingon common myna abundance, using bird survey data
and culling at different spatial scales in Canberra,
Australia. To the best of our knowledge, it is the firstinvestigation to demonstrate that community-led cull-
ing is capable of reducing the local abundance of thecommon myna. We also utilized a basic population
model to enhance the understanding of population
dynamics and the potential influence of various cullingregimes. Our study provided a unique opportunity to
demonstrate how knowledge of species population
dynamics and biology can be employed to enhanceculling outcomes. This knowledge will enable culling
targets to be set and guide planning of methods
to achieve these targets. However, thresholds for
Table 1 Expected common myna (Acridotheres tristis) abundance after various culling regimes and initial population densities,using a basic logistic growth model
Culling rate (birds per km2 per year) 0 2 5 10 15 20 24 25 30 40
Initial population size (birds per km2)
10 14.5 12.5 9.5 4.5* 0.0 0.0 0.0 0.0 0.0 0.0
20 28.5 26.5 23.5 18.5 13.5* 8.5 4.5 3.5 0.0 0.0
30 42.0 40.0 37.0 32.0 27.0* 22.0 18.0 17.0 12.0 2.0
40 55.1 53.1 50.1 45.1 40.1 35.1* 31.1 30.1 25.1 15.1
50 67.7 65.7 62.7 57.7 52.7 47.7 43.7* 42.7* 37.7 27.7
60 79.9 77.9 74.9 69.9 64.9 59.9 55.9 54.9 49.9* 39.9
80 102.9 100.9 97.9 92.9 87.9 82.9 78.9 77.9 72.9 62.9*
100 124.1 122.1 119.1 114.1 109.1 104.1 100.1 99.1 94.1 84.1*
150 169.1 167.1 164.1 159.1 154.1 149.1 145.1 144.1 139.1 129.1*
200 202.7 200.7 197.7 192.7 187.7 182.7 178.7* 177.7* 172.7 162.7
250 224.9* 222.9 219.9 214.9 209.9 204.9 200.9 199.9 194.9 184.9
Italic values indicate populations would be expected to reduce in size and an asterisk indicates populations that would be expected toreduce significantly ([10 %)
Fig. 4 Relationship between the change in common mynaabundance (A. tristis) and the number of individuals culled in15 fine-scale sites (1 km2) in Canberra, South East Australia(F1,28 = 20.67, P \ 0.001)
K. Grarock et al.
123
Chapter 6: Effective control of the common myna
Grarock K., Introduction, spread, impact and control of the common myna 119
myna abundance. However, the apparent success of fine-scale culling indicates that broad-scale
culling could become more effective if a greater number of individuals could be trapped. Our
findings indicate that both the level of culling and the spatial extent of control operations
influence the success of introduced species management.
According to our model, culling at a rate of 25 birds per km2 per year should reduce the
population size regardless of initial density (although not significantly for population densities
between 60 and 150 birds per km2). Culling at 25 birds per km2 per year is greater than the
maximum rate of increase of 24.1 birds per km2 and may be a suitable target rate for culling in
Canberra.
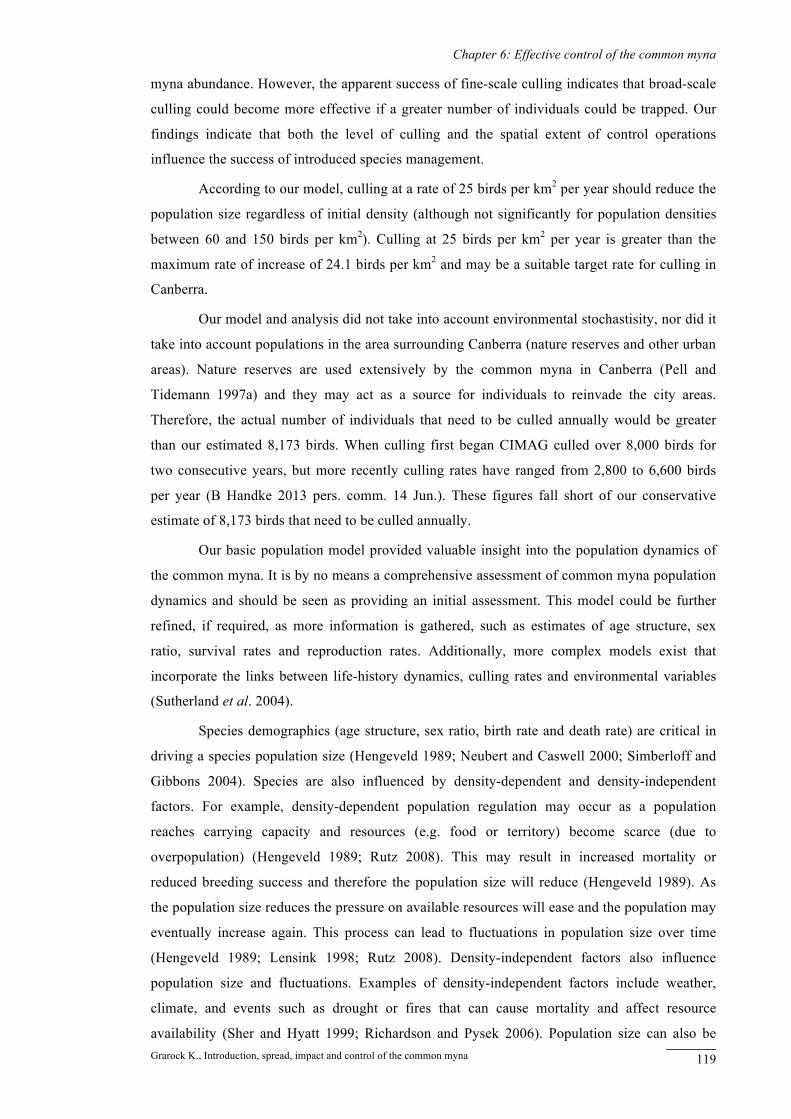
Our model and analysis did not take into account environmental stochastisity, nor did it
take into account populations in the area surrounding Canberra (nature reserves and other urban
areas). Nature reserves are used extensively by the common myna in Canberra (Pell and
Tidemann 1997a) and they may act as a source for individuals to reinvade the city areas.
Therefore, the actual number of individuals that need to be culled annually would be greater
than our estimated 8,173 birds. When culling first began CIMAG culled over 8,000 birds for
two consecutive years, but more recently culling rates have ranged from 2,800 to 6,600 birds
per year (B Handke 2013 pers. comm. 14 Jun.). These figures fall short of our conservative
estimate of 8,173 birds that need to be culled annually.
Our basic population model provided valuable insight into the population dynamics of
the common myna. It is by no means a comprehensive assessment of common myna population
dynamics and should be seen as providing an initial assessment. This model could be further
refined, if required, as more information is gathered, such as estimates of age structure, sex
ratio, survival rates and reproduction rates. Additionally, more complex models exist that
incorporate the links between life-history dynamics, culling rates and environmental variables
(Sutherland et al. 2004).
Species demographics (age structure, sex ratio, birth rate and death rate) are critical in
driving a species population size (Hengeveld 1989; Neubert and Caswell 2000; Simberloff and
Gibbons 2004). Species are also influenced by density-dependent and density-independent
factors. For example, density-dependent population regulation may occur as a population
reaches carrying capacity and resources (e.g. food or territory) become scarce (due to
overpopulation) (Hengeveld 1989; Rutz 2008). This may result in increased mortality or
reduced breeding success and therefore the population size will reduce (Hengeveld 1989). As
the population size reduces the pressure on available resources will ease and the population may
eventually increase again. This process can lead to fluctuations in population size over time
(Hengeveld 1989; Lensink 1998; Rutz 2008). Density-independent factors also influence
population size and fluctuations. Examples of density-independent factors include weather,
climate, and events such as drought or fires that can cause mortality and affect resource
availability (Sher and Hyatt 1999; Richardson and Pysek 2006). Population size can also be
Chapter 6: Effective control of the common myna
Grarock K., Introduction, spread, impact and control of the common myna 120
influenced by the existence of natural enemies (predators, parasites or disease) that increase
mortality (Keane and Crawley 2002; Shea and Chesson 2002).
Due to these natural population fluctuations it can be difficult to clearly identify the
influence of culling on a population. Unfortunately we were unable to obtain data on natural
population fluctuations from sites without common myna culling. Therefore, without this
knowledge we cannot say with certainty that observed changes are due to community-led
culling. However the relationship for both broad and fine scale trapping is consistent with data
from our population model, indicating that it is an accurate representation of this system and
that high intensity culling is capable of reducing common myna abundance.
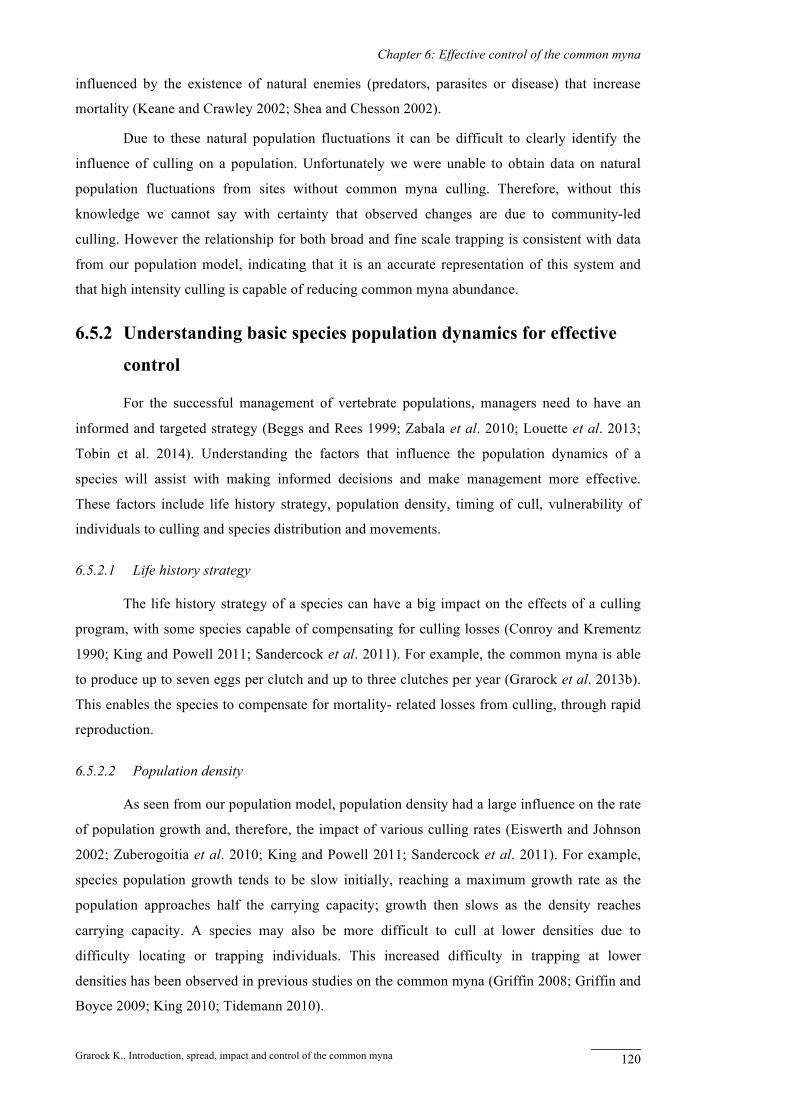
6.5.2 Understanding basic species population dynamics for effective
control
For the successful management of vertebrate populations, managers need to have an
informed and targeted strategy (Beggs and Rees 1999; Zabala et al. 2010; Louette et al. 2013;
Tobin et al. 2014). Understanding the factors that influence the population dynamics of a
species will assist with making informed decisions and make management more effective.
These factors include life history strategy, population density, timing of cull, vulnerability of
individuals to culling and species distribution and movements.
6.5.2.1 Life history strategy
The life history strategy of a species can have a big impact on the effects of a culling
program, with some species capable of compensating for culling losses (Conroy and Krementz
1990; King and Powell 2011; Sandercock et al. 2011). For example, the common myna is able
to produce up to seven eggs per clutch and up to three clutches per year (Grarock et al. 2013b).
This enables the species to compensate for mortality- related losses from culling, through rapid
reproduction.
6.5.2.2 Population density
As seen from our population model, population density had a large influence on the rate
of population growth and, therefore, the impact of various culling rates (Eiswerth and Johnson
2002; Zuberogoitia et al. 2010; King and Powell 2011; Sandercock et al. 2011). For example,
species population growth tends to be slow initially, reaching a maximum growth rate as the
population approaches half the carrying capacity; growth then slows as the density reaches
carrying capacity. A species may also be more difficult to cull at lower densities due to
difficulty locating or trapping individuals. This increased difficulty in trapping at lower
densities has been observed in previous studies on the common myna (Griffin 2008; Griffin and
Boyce 2009; King 2010; Tidemann 2010).
Chapter 6: Effective control of the common myna
Grarock K., Introduction, spread, impact and control of the common myna 121
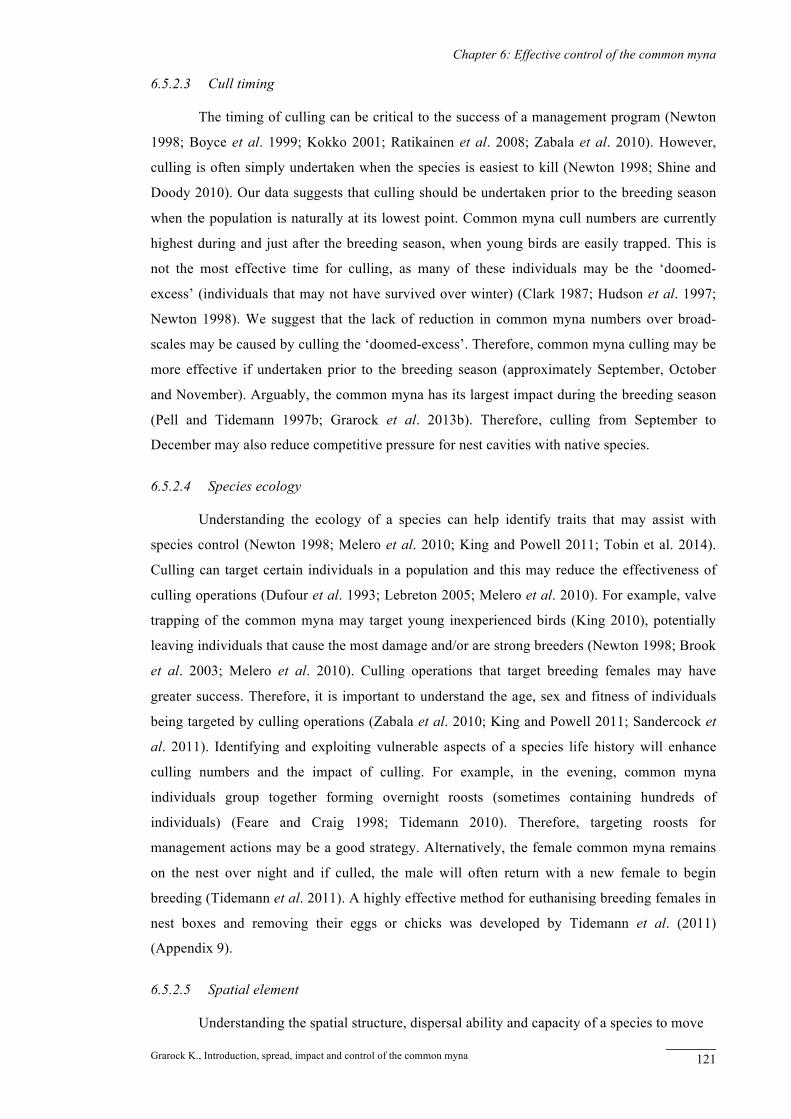
6.5.2.3 Cull timing
The timing of culling can be critical to the success of a management program (Newton
1998; Boyce et al. 1999; Kokko 2001; Ratikainen et al. 2008; Zabala et al. 2010). However,
culling is often simply undertaken when the species is easiest to kill (Newton 1998; Shine and
Doody 2010). Our data suggests that culling should be undertaken prior to the breeding season
when the population is naturally at its lowest point. Common myna cull numbers are currently
highest during and just after the breeding season, when young birds are easily trapped. This is
not the most effective time for culling, as many of these individuals may be the ‘doomed-
excess’ (individuals that may not have survived over winter) (Clark 1987; Hudson et al. 1997;
Newton 1998). We suggest that the lack of reduction in common myna numbers over broad-
scales may be caused by culling the ‘doomed-excess’. Therefore, common myna culling may be
more effective if undertaken prior to the breeding season (approximately September, October
and November). Arguably, the common myna has its largest impact during the breeding season
(Pell and Tidemann 1997b; Grarock et al. 2013b). Therefore, culling from September to
December may also reduce competitive pressure for nest cavities with native species.
6.5.2.4 Species ecology
Understanding the ecology of a species can help identify traits that may assist with
species control (Newton 1998; Melero et al. 2010; King and Powell 2011; Tobin et al. 2014).
Culling can target certain individuals in a population and this may reduce the effectiveness of
culling operations (Dufour et al. 1993; Lebreton 2005; Melero et al. 2010). For example, valve
trapping of the common myna may target young inexperienced birds (King 2010), potentially
leaving individuals that cause the most damage and/or are strong breeders (Newton 1998; Brook
et al. 2003; Melero et al. 2010). Culling operations that target breeding females may have
greater success. Therefore, it is important to understand the age, sex and fitness of individuals
being targeted by culling operations (Zabala et al. 2010; King and Powell 2011; Sandercock et
al. 2011). Identifying and exploiting vulnerable aspects of a species life history will enhance
culling numbers and the impact of culling. For example, in the evening, common myna
individuals group together forming overnight roosts (sometimes containing hundreds of
individuals) (Feare and Craig 1998; Tidemann 2010). Therefore, targeting roosts for
management actions may be a good strategy. Alternatively, the female common myna remains
on the nest over night and if culled, the male will often return with a new female to begin
breeding (Tidemann et al. 2011). A highly effective method for euthanising breeding females in
nest boxes and removing their eggs or chicks was developed by Tidemann et al. (2011)
(Appendix 9).
6.5.2.5 Spatial element
Understanding the spatial structure, dispersal ability and capacity of a species to move
Chapter 6: Effective control of the common myna
Grarock K., Introduction, spread, impact and control of the common myna 122
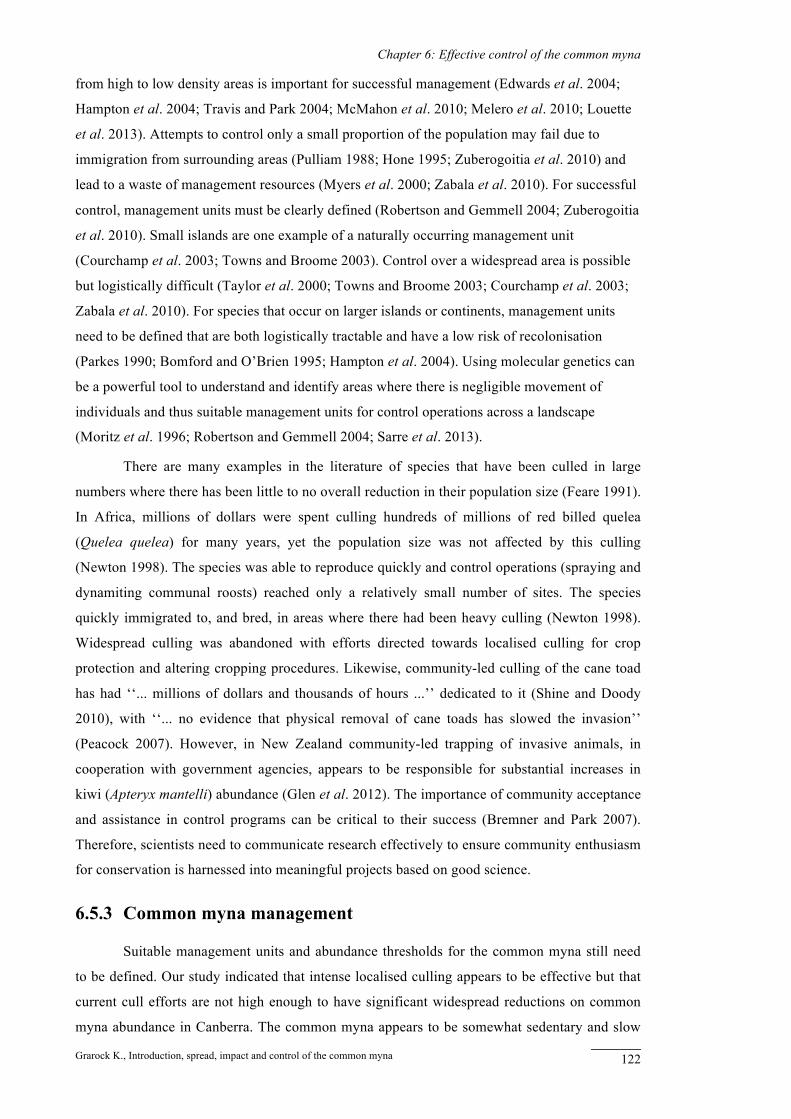
from high to low density areas is important for successful management (Edwards et al. 2004;
Hampton et al. 2004; Travis and Park 2004; McMahon et al. 2010; Melero et al. 2010; Louette
et al. 2013). Attempts to control only a small proportion of the population may fail due to
immigration from surrounding areas (Pulliam 1988; Hone 1995; Zuberogoitia et al. 2010) and
lead to a waste of management resources (Myers et al. 2000; Zabala et al. 2010). For successful
control, management units must be clearly defined (Robertson and Gemmell 2004; Zuberogoitia
et al. 2010). Small islands are one example of a naturally occurring management unit
(Courchamp et al. 2003; Towns and Broome 2003). Control over a widespread area is possible
but logistically difficult (Taylor et al. 2000; Towns and Broome 2003; Courchamp et al. 2003;
Zabala et al. 2010). For species that occur on larger islands or continents, management units
need to be defined that are both logistically tractable and have a low risk of recolonisation
(Parkes 1990; Bomford and O’Brien 1995; Hampton et al. 2004). Using molecular genetics can
be a powerful tool to understand and identify areas where there is negligible movement of
individuals and thus suitable management units for control operations across a landscape
(Moritz et al. 1996; Robertson and Gemmell 2004; Sarre et al. 2013).
There are many examples in the literature of species that have been culled in large
numbers where there has been little to no overall reduction in their population size (Feare 1991).
In Africa, millions of dollars were spent culling hundreds of millions of red billed quelea
(Quelea quelea) for many years, yet the population size was not affected by this culling
(Newton 1998). The species was able to reproduce quickly and control operations (spraying and
dynamiting communal roosts) reached only a relatively small number of sites. The species
quickly immigrated to, and bred, in areas where there had been heavy culling (Newton 1998).
Widespread culling was abandoned with efforts directed towards localised culling for crop
protection and altering cropping procedures. Likewise, community-led culling of the cane toad
has had ‘‘... millions of dollars and thousands of hours ...’’ dedicated to it (Shine and Doody
2010), with ‘‘... no evidence that physical removal of cane toads has slowed the invasion’’
(Peacock 2007). However, in New Zealand community-led trapping of invasive animals, in
cooperation with government agencies, appears to be responsible for substantial increases in
kiwi (Apteryx mantelli) abundance (Glen et al. 2012). The importance of community acceptance
and assistance in control programs can be critical to their success (Bremner and Park 2007).
Therefore, scientists need to communicate research effectively to ensure community enthusiasm
for conservation is harnessed into meaningful projects based on good science.
6.5.3 Common myna management
Suitable management units and abundance thresholds for the common myna still need
to be defined. Our study indicated that intense localised culling appears to be effective but that
current cull efforts are not high enough to have significant widespread reductions on common
myna abundance in Canberra. The common myna appears to be somewhat sedentary and slow
Chapter 6: Effective control of the common myna
Grarock K., Introduction, spread, impact and control of the common myna 123
at spreading to new areas (Grarock et al. 2013a), potentially enhancing cull effectiveness in the
medium term (Sandercock et al. 2011). Due to the species’ broad distribution across Australia
and other continents, perhaps management actions should be undertaken in localised areas
where the species is deemed to have the greatest impact. For example, management of the
common myna near threatened species breeding areas, such as the superb parrot (Polytelis
swainsonii), may be a good strategy. The adaptable nature of the common myna indicates that
complimentary methods for controlling the species (such as roost and nest box culling) will
likely be required to successfully reduce the abundance of this species (Tidemann 2010;
Tidemann et al. 2011) (Appendix 9).
6.6 Conclusion
Our case study shows the value of undertaking basic population modelling before
carrying out control programs. A significant amount of effort is currently being directed towards
a program that is not fully achieving the desired results. Understanding the population dynamics
of a species is essential to undertaking a successful control program. Basic population models
can be used to assess whether potential control measures are capable of achieving desired
outcomes. These models can help avoid the wasteful allocation of resources to projects that are
unlikely to be successful and/or drive innovation into alternative control measures. An effective
control program needs to have an informed and targeted strategy with information on the
number of individuals that need to be culled and the duration and timing of culling. Central to
this understanding is defining the spatial distribution of management units and a target
population size where the species impact is minimised.
6.7 Acknowledgements
We thank the Canberra Indian Myna Action Group and Canberra Ornithologist Group
for providing data for analysis. We thank volunteer bird observers, including: Barbara Allen,
Heather Allsopp, Judith Bourne, John Brannan, Malcolm Fyfe, Bill Handke, Owen Holton,
Anne I’Ons, Daryl King, Sue Lashko, Barbara Levings, Bruce Lindenmayer, Chris Marsh and
Peter Ormay. We also thank Hamish Dalley, Sara Hanley and Simon Roz for their comments on
earlier drafts of this manuscript. Bird transect surveys were undertaken in accordance with
animal ethics approval Protocol No. C.RE.51.08.
6.8 References
ABC (2011) WildWatch2: Quest for Pests. Available at: www.abc.net.au/tv/ wildwatch/credits.htm [Accessed: 30 Jan 2013]
Ascunce MS, Yang C, Oakey J, Calcaterra L, Wu W, Shih C, Goudet J, Ross KG, Shoemaker D (2011) Global invasion history of the fire ant Solenopsis invicta. Science 331: 1066–1068
Beggs JR, Rees JS (1999) Restructuring of Lepidoptera communities by introduced Vespula wasps in a New Zealand beech forest. Oecologia 119:565–571
Chapter 6: Effective control of the common myna
Grarock K., Introduction, spread, impact and control of the common myna 124
BOM (2013) Climate statistics for Australian locations: Summary statistics Canberra city. Available at: www.bom.gov.au/climate/averages/tables/cw_070282.shtml [Accessed: 13 May 2013]
Bomford M, O'Brien P (1995) Eradication or control of vertebrate pests? Wildl Soc Bull 23:249–255 Bonesi L, Rushton S, Macdonald D (2007) Trapping for mink control and water vole survival: identifying
key criteria using a spatially explicit individual based model. Biol Conserv 136:636–650 Boyce MS, Sinclair ARE, White GC (1999) Seasonal compensation of predation and harvesting. Oikos
87:419–426 Braysher ML (1993) Managing vertebrate pests: Principles and strategies. Australian Bureau of Rural
Sciences, Canberra Bremner A, Park K (2007) Public attitudes to the management of invasive non-native species in Scotland.
Biol Conserv 139:306–314 Brook BW, Sodhi NS, Soh MC, Lim HC (2003) Abundance and projected control of invasive house
crows in Singapore. J Wildl Manage 67:808–817 Buckley YM, Rees M, Paynter Q, Lonsdale M (2004) Modelling integrated weed management of an
invasive shrub in tropical Australia. J Appl Ecol 41:547–560 Byrd GV (1979) Common myna predation on wedge-tailed shearwater eggs. Elepaio 39:69–70 Canberra Ornithologists Group (2011) Annual bird report: 1 July 2009 to 30 June 2010. Canberra Bird
Notes 36:1–82 Caughley G (1977) Analysis of vertebrate populations. John Wiley and Sons, New York Choquenot D, Parkes J (2001) Setting thresholds for pest control: how does pest density affect resource
viability? Biol Conserv 99:29–46 CIMAG (2013) Canberra Indian Myna Action Group Inc. Available at: www.indianmynaaction.org.au
[Accessed: 26 April 2013] Clark WM (1987) Effects of harvest on annual survival of muskrats. J Wildl Manage 51:265–272 Conroy MJ, Krementz DG (1990) A review of the evidence for the effects of hunting on American black
duck populations. Trans NAm Wildl Nat Resour Conf 55: 501–517 Courchamp F, Chapuis J-L, Pascal M (2003) Mammal invaders on islands: impact, control and control
impact. Biol Rev 78:347–383 Davis MA (2003) Biotic globalization: does competition from introduced species threaten biodiversity?
Bioscience 53:481–489 Davis MA, Chew MK, Hobbs RJ, et al (2011) Don't judge species on their origins. Nat 474:153–154 Dhami MK, Nagle B (2009) Review of the biology and ecology of the common myna (Acridotheres
tristis) and some implications for management of this invasive species. Pacific Invasives Initiative, The University of Auckland, Auckland.
Dufour KW, Ankney CD,d Weatherhead P J (1993) Condition and vulnerability to hunting among mallards staging at lake St. Clair, Ontario. J Wildl Manage 57:209–215
Edwards GP, Pople AR, Saalfeld K, Caley P (2004) Introduced mammals in Australian rangelands: Future threats and the role of monitoring programmes in management strategies. Austral Ecol 29:40–50
Eiswerth ME, Johnson WS (2002) Managing nonindigenous invasive species: insights from dynamic analysis. Environ Resour Econ 23:319–342
ESRI (2010) ArcGIS. Environmental Systems Resource Institute, Redlands Feare C (1991) Control of bird pest populations. In: Perrins C, Lebreton J-D, Hirons G (eds) Bird
population studies: relevance to conservation and management. Oxford University Press, Oxford, pp 463–478
Feare C, Craig A (1998) Starlings and Mynas. Helm, London Gibbs HM, Chambers LE, Bennett AF (2011) Temporal and spatial variability of breeding in Australian
birds and the potential implications of climate change. Emu 111:283–291 Glen AS, Hamilton T, McKenzie D, Ruscoe WA, Byrom AE (2012) Kiwi Apteryx mantelli population
recovery through community-led trapping of invasive non-native mammals in Northland, New Zealand. Conserv Evid 9:22–27
Grarock K, Lindenmayer DB, Wood JT, Tidemann CR (2013a) Using invasion process theory to enhance the understanding and management of introduced species. A case study reconstructing the invasion sequence of the common myna (Acridotheres tristis). J Environ Manage 126:398–409
Grarock K, Lindenmayer DB, Wood JT, Tidemann CR (2013b) Does human-induced habitat modification influence the impact of introduced species? A case study on cavity- nesting by the
Chapter 6: Effective control of the common myna
Grarock K., Introduction, spread, impact and control of the common myna 125
introduced common myna (Acridotheres tristis) and two Australian native parrots. Environ Manag. 52:958–970
Griffin AS (2008) Social learning in Indian mynahs, Acridotheres tristis: the role of distress calls. Anim Behav 75:79–89
Griffin AS, Boyce HM (2009) Indian mynahs, Acridotheres tristis, learn about dangerous places by observing the fate of others. Anim Behav 78:79–84
Gurevitch J, Padilla DK (2004) Are invasive species a major cause of extinctions? Trends Ecol Evol 19:470–474
Gurevitch J, Fox GA, Wardle GM, Inderjit Taub D (2011) Emergent insights from the synthesis of conceptual frameworks for biological invasions. Ecol Lett 14:407–418
Hampton JO, Spencer PBS, Alpers DL, et al (2004) Molecular techniques, wildlife management and the importance of genetic population structure and dispersal: a case study with feral pigs. J Appl Ecol 41:735–743
Harper MJ, McCarthy MA, van der Ree R (2005) The use of nest boxes in urban natural vegetation remnants by vertebrate fauna. Wildl Res 32:509–516
Hengeveld R (1989) Dynamics of biological invasions. Chapman and Hall, London Hone J (1995) Spatial and temporal aspects of vertebrate pest damage with emphasis on feral pigs. J Appl
Ecol 32:311–319 Hudson PJ, Newborn D, Robertson PA (1997) Geographical and seasonal patterns of mortality in red
grouse Lagopus lagopus scoticus populations. Wildl Biol 3:79–87 Hulme PE (2006) Beyond control: wider implications for the management of biological invasions. J Appl
Ecol 43:835–847 Jones CG (1996) Bird introductions to Mauritius: status and relationships with native birds. In: Holmes JS
and Simons JR (eds) The introduction and naturalisation of birds. Stationery Office Publishing Centre, London, pp 113–123
Keane RM, Crawley MJ (2002) Exotic plant invasions and the enemy release hypothesis. Trends Ecol Evol 17:164–170
King DH (2010) The effect of trapping pressure on trap avoidance, and the role of foraging strategies in anti-predator behaviour of common mynas (Sturnus tristis). Canberra Bird Notes 35:85–108
King CM, Powell RA (2011) Managing an invasive predator pre-adapted to a pulsed resource: a model of stoat (Mustela erminea) irruptions in New Zealand beech forests. Biol Invasions 13:3039–3055
Kokko H (2001) Optimal and suboptimal use of compensatory responses to harvesting: timing of hunting as an example. Wildl Biol 7:141–150
Lebreton J-D (2005) Dynamical and statistical models for exploited populations. Aust NZ J Stat 47:49–63 Lee Y, Nelder JA, Pawitan Y (2006) Generalized linear models with random effects. Unified analysis via
H-likelihood. Chapman and Hall, London Lensink R (1998) Temporal and spatial expansion of the Egyptian goose Alopochen aegyptiacus in the
Netherlands. J Biogeogr 25:251–263 Lindenmayer D, Wood J, MacGregor C (2009) Do observer differences in bird detection affect inferences
from large-scale ecological studies? Emu 109:100–106 Lockwood JL, Cassey P, Blackburn T (2005) The role of propagule pressure in explaining species
invasions. Trends Ecol Evol 20:223–228 Louette G, Devisscher S, Adriaens T (2013) Control of invasive American bullfrog Lithobates
catesbeianus in small shallow water bodies. Eur J Wildl Res 59:105–114 Lowe S, Browne M, Boudjelas S, Poorter MD (2000) ‘100 of the world’s worst invasive alien species: A
selection from the Global Invasive Species Database’. First published as special lift-out in Aliens 12, December 2000. Updated and reprinted version: November 2004, p.7. (Species Survival Commission of the World Conservation Union) Available at: www.issg.org/database/species/reference_files/100English.pdf [Accessed: 22 May 2012]
McMahon CR, Brook BW, Collier N, Bradshaw CJA (2010) Spatially explicit spreadsheet modelling for optimising the efficiency of reducing invasive animal density. Methods Ecol Evol 1:53–68
Melero Y, Palazón S, Bonesi L, Gosálbez J (2010) Relative abundance of culled and not culled American mink populations in northeast Spain and their potential distribution: are culling campaigns effective? Biol Invasions 12: 3877–3885
Moritz C, Worthington Wilmer J, Pope L, Sherwin WB, Taylor AC, Limpus CJ (1996) Applications of genetics to the conservation and management of Australian fauna: four case studies from

Chapter 6: Effective control of the common myna
Grarock K., Introduction, spread, impact and control of the common myna 126
Queensland. In: Smith TB,Wayne RK (eds) Molecular genetics approaches to conservation. Oxford University Press, New York, pp 442–456
Myers JH, Simberloff D, Kuris AM, Carey JR (2000) Eradication revisited: dealing with exotic species. Trends Ecol Evol 15:316–320
Neubert MG, Caswell H (2000) Demography and dispersal: calculation and sensitivity analysis of invasion speed for structured populations. Ecology 81:1613–1628
Newton I (1998) Population limitation in birds. Academic Press, London Nichols JD (1991) Extensive monitoring programmes viewed as long-term population studies: the case of
North American waterfowl. Ibis 133:89–98 Nichols JD, Conroy MJ, Anderson DR, Burnham KP (1984) Compensatory mortality in waterfowl
populations: A review of the evidence and implications for research and management. Trans N Am Wildl Nat Resour Conf 49: 535–554
Parkes JP (1990) Eradication of feral goats on islands and habitat islands. J R Soc NZ 20:297–304 Peacock T (2007) Community on-ground cane toad control in the Kimberley. Review for Western
Australia Department of Environment and Conservation. Invasive Animals Cooperative Research Centre, Canberra
Pell AS, Tidemann CR (1997a) The ecology of the common myna in urban nature reserves in the Australian Capital Territory. Emu 97:141–149
Pell AS, Tidemann CR (1997b) The impact of two exotic hollow-nesting birds on two native parrots in savannah and woodland in eastern Australia. Biol Conserv 79:145–153
Pulliam RH (1988) Sources, sinks, and population regulation. Am Nat 132:652–661 Ratikainen II, Gill JA, Gunnarsson TG, Sutherland WJ, Kokko H (2008) When density dependence is not
instantaneous: theoretical developments and management implications. Ecol Lett 11:184–198 Reddiex B, Forsyth DM (2006) Control of pest mammals for biodiversity protection in Australia. II.
Reliability of knowledge. Wildl Res 33:711–717 Ricciardi A (2012) Invasive species. In: Meyers RA (ed) Encyclopaedia of sustainability science and
technology. Springer, Berlin, pp 5547–5560 Richardson DM, Pysek P (2006) Plant invasions: merging the concepts of species invasiveness and
community invasibility. Prog Phys Geogr 30:409–431 Robertson BC, Gemmell NJ (2004) Defining eradication units to control invasive pests. J Appl Ecol
41:1042–1048 Ruhren S (2012) Invasive species reconsidered. Bioscience 62:305–306 Rutz C (2008) The establishment of an urban bird population. J Anim Ecol 77:1008–1019 Sandercock BK, Nilsen EB, Brøseth H, Pedersen HC (2011) Is hunting mortality additive or
compensatory to natural mortality? Effects of experimental harvest on the survival and cause-specific mortality of willow ptarmigan. J Anim Ecol 80:244–258
Sarre SD, MacDonald AJ, Barclay C, Saunders GR, Ramsey DSL (2013) Foxes are now widespread in Tasmania: DNA detection defines the distribution of this rare but invasive carnivore. J Appl Ecol 50:459–468
Shea K, Chesson P (2002) Community ecology theory as a framework for biological invasions. Trends Ecol Evol 17:170–176
Shea K, NCEAS (1998) Management of populations in conservation, harvesting and control. Trends Ecol Evol 13:371–375
Sher AA, Hyatt LA (1999) The disturbed resource-flux invasion matrix: a new framework for patterns of plant invasion.Biol Invasions 1:107–114
Shine R, Doody JS (2010) Invasive species control: understanding conflicts between researchers and the general community. Front Ecol Environ 9:400–406
Simberloff D, Gibbons L (2004) Now you see them, now you don’t!—population crashes of established introduced species. Biol Invasions 6:161–172
Sutherland WJ, Newton I, Green R (2004) Bird ecology and conservation: a handbook of techniques. Oxford University Press, Oxford
Taylor RH, Kaiser GW, Drever MC (2000) Eradication of Norway rats for recovery of seabird habitat on Langara island, British Columbia. Restor Ecol 8:151–160
Tidemann CR (2010) Investigation into the potential for broad-scale control of mynas by trapping at communal roosts. Final Report to the Hermon Slade Foundation, the Australian Rainforest

Chapter 6: Effective control of the common myna
Grarock K., Introduction, spread, impact and control of the common myna 127
Foundation and the NSW Department of Environment, Climate Change and Water. The Australian National University, Canberra
Tidemann CR, Grarock K, King DH (2011) Euthanasia of pest sturnids in nestboxes. Corella 35:49–51 Tobin PC, Kean JM, Suckling DM, McCullough DG, Herms DA, Stringer LD (2014) Determinants of
successful arthropod eradication programs. Biological Invasions 16(2), 401-414. Towns DR, Broome KG (2003) From small Maria to massive Campbell: Forty years of rat eradications
from New Zealand islands. NZ J Zool 30:377–398 Tracey J, Bomford M, Hart Q, Saunders G, Sinclair R (2007) Managing bird damage to fruit and other
horticultural crops. Bureau of Rural Sciences, Canberra Travis JMJ, Park KJ (2004) Spatial structure and the control of invasive alien species. Anim Conserv
7:321–330 VSN International (2011) GenStat 14. VSN International, Hemel Hempstead Ward P, Pant NC, Roy J, Dorow E, Betts E, Whellan JA (1979) Rational strategies for the control of
Queleas and other migrant bird pests in Africa. Phil Trans R Soc Lond B 287:289–300 Zabala J, Zuberogoitia I, González-Oreja JA (2010) Estimating cost and outcomes of invasive American
mink (Neovison vison) management in continental areas: a framework for evidence based control and eradication. Biol Invasions 12:2999–3012
Zuberogoitia I, González-Oreja JA, Zabala J, Rodríıguez-Refojos C (2010) Assessing the control/eradication of an invasive species, the American mink, based on field data; how much would it cost? Biodivers Conserv 19:1455–1469