Chapter 2 - Gross fixed capital formation - European ...
37
Building a smart and green Europe in the COVID-19 era INVESTMENT REPORT 2020/2021 Chapter 2 Gross fixed capital formation
-
Upload
khangminh22 -
Category
Documents
-
view
1 -
download
0
Transcript of Chapter 2 - Gross fixed capital formation - European ...
Building a smart and green Europ
e in the COVID
-19 era
Building a smart and green Europe
in the COVID-19 era
INVESTMENT REPORT 2 0 2 0 / 2 0 2 1
Chapter 2Gross fixed capital formation
Chapter 2Gross fixed
capital formation
EUROPEAN INVESTMENT BANK INVESTMENT REPORT 2 02 0/ 2 021
Building a smart and green Europe
in the COVID-19 era
Part I Investment and investment finance
Investment report 2020/2021: Building a smart and green Europe in the COVID-19 era© Economics Department (EIB), 2021. All rights reserved. Short sections of text, not to exceed two paragraphs, may be quoted in the original language without explicit permission provided that the source is acknowledged.
About the ReportThe EIB annual report on Investment and Investment Finance is a product of the EIB Economics Department, providing a comprehensive overview of the developments and drivers of investment and its finance in the European Union. It combines an analysis and understanding of key market trends and developments with a more in-depth thematic focus, which this year is devoted to European progress towards a smart and green future in a post-COVID-19 world. The report draws extensively on the results of the annual EIB Investment Survey (EIBIS) and the EIB Municipality Survey. It complements internal EIB analysis with contributions from leading experts in the field.
About the Economics Department of the EIBThe mission of the EIB Economics Department is to provide economic analyses and studies to support the Bank in its operations and in the definition of its positioning, strategy and policy. The Department, a team of 40 economists, is headed by Debora Revoltella, Director of Economics.
Main contributors to this year’s reportReport Director: Debora RevoltellaReport Coordinators and Reviewers: Pedro de Lima and Atanas Kolev
Introduction: Atanas Kolev.Chapter 1: Atanas Kolev (lead author), Laurent Maurin (lead author), Koray Alper, Luca Gattini, Jochen Schanz and
Patricia Wruuck.Chapter 2: Atanas Kolev (lead author), Andrea Brasili, Peter McGoldrick and Jochen Schanz.Chapter 3: Laurent Maurin (lead author), Joel Auber, Frank Betz, Rozalia Pal and Patricia Wruuck, together with Antonia
Botsario, Salome Gvetadze, Helmut Kraemer-Eis, Frank Lang and Wouter Torfs (all European Investment Fund, Research and Market Analysis).
Chapter 4: Fotios Kalantzis (lead author), Andrea Brasili and Annamaria Tueske.Chapter 5: Fotios Kalantzis (lead author) and Hanna Niczyporuk (New York University).Chapter 6: Laurent Maurin (lead author), Giovanni Barci, Emmanouil Davradakis, Aron Gereben, Annamaria Tueske
and Marcin Wolski.Chapter 7: Christoph Weiss (lead author), Julie Delanote, Peter Harasztosi, Désirée Rückert, Antilia Virginie, Sara
Amoroso (European Commission, Joint Research Centre, Box A), Petros Gkotsis (European Commission, Joint Research Centre, Box A) and Nicola Grassano (European Commission, Joint Research Centre, Box A).
Chapter 8: Julie Delanote (lead author), Désirée Rückert (lead author), Peter Harasztosi and Julie Callaert (ECOOM, KU Leuven, collaboration for PATSTAT data preparation, Box A).
Chapter 9: Peter McGoldrick (lead author), Maïa Debs, Julie Delanote, Atanas Kolev and Désirée Rückert.Chapter 10: Patricia Wruuck (lead author), Aron Gereben, Peter McGoldrick, Désirée Rückert, Annamaria Tueske,
Daniel Wetzel (International Energy Agency, Box B) and Marcin Wolski.
Scientific advisory committee: Giorgio Barba Navaretti (Università degli Studi di Milano), Eric Bartelsman (Tinbergen Institute), Catherine L. Mann (Citi), Steven Ongena (University of Zurich), Pier Carlo Padoan, Peter Praet, Jan Svejnar (Columbia University) and Reinhilde Veugelers (KU Leuven).
Published by the European Investment Bank.Editors: Christopher Shaw, Kevin Barron and Janel Siemplenski Lefort Layout: Marlène Hignoul and EIB GraphicTeam Printed on FSC Paper: Munken Polar, bouffant 1.13, FSC® Mix blanc.
The EIB uses paper certified by the Forest Stewardship Council (FSC). Because it’s made by people who like trees.FSC promotes environmentally sound, socially beneficial, and economically viable management of the world’s forests.We all know reading is good for you. It’s good for the planet, too – as long as you read on the right paper.
DisclaimerThe views expressed in this publication are those of the authors and do not necessarily reflect the position of the EIB.
AcknowledgementsAdriano Amati, Blanca Garrido Rivera, Nicola Heusel and Zsolt Nagy provided research assistance. Comments and suggestions from Cristina Niculescu and Diego Tonelli are gratefully acknowledged.
Chapter 2Gross fixed
capital formation
Building a smart and green Europ
e in the COVID
-19 era
Building a smart and green Europe
in the COVID-19 era
INVESTMENT REPORT 2 0 2 0 / 2 0 2 1
Download the complete report:www.eib.org/investment-report-2020www.doi.org/10.2867/904099
Available as:
print: ISBN 978-92-861-4813-2 ISSN: 2599-8269eBook: ISBN 978-92-861-4812-5 ISSN: 2599-8277pdf: ISBN 978-92-861-4811-8 ISSN: 2599-8277
Part IInvestment and investment finance 53
Gross fixed capital formation Chapter 2
Chapter 2
Gross fixed capital formation Investment in the European Union fell precipitously at the onset of the coronavirus outbreak. this decline followed a slowdown in investment that had gradually set in during 2019 and was exacerbated by government restrictions on movement and business activity, especially in the second quarter of 2020.
Uncertainty and a sharply deteriorating economy, however, are the main reasons for the extraordinary decline in investment. While activity partially recovered in the third quarter, uncertainty is likely to continue to dampen investment in the near term, especially as new restrictions are introduced to contain the second coronavirus wave in the fourth quarter of 2020.
Elevated uncertainty, along with deteriorating firm finances, are likely to further impede corporate investment. the cash flows of non-financial corporates have retreated well into negative territory, causing these firms to draw down their cash balances, which might eventually eat into their net worth. this weakened position damages firms’ ability to finance investment, internally and externally. Investment weakness is likely to persist even as economic conditions gradually improve.
The coronavirus outbreak is likely to prompt increased digitalisation and, in the medium term, to cause shifts in supply chains and product portfolios. Many of the companies bearing the brunt of the ongoing crisis see a permanent reduction in employment as another longer-term consequence. policymakers should take action to ease the reallocation of labour to avoid large increases in structural unemployment.
Government investment in 2020 may be another victim of the pandemic. even though policy support has been strong, there are signs that government investment levels might decrease across eU Member States. the decline in government investment must be halted and reversed from 2021 onwards. redirecting investment from current to capital expenditure seems to be the sustainable option. It can be further supported by debt issuance for countries with sound fiscal positions.

Part IInvestment and investment finance 54
INVESTMENT REPORT 2020/2021: BUILDING A SMART AND GREEN EUROPE IN THE COVID-19 ERA
Introduction the initial impact of the coronavirus pandemic on investment in the european Union has surpassed the effects of the global financial crisis. In just two quarters, investment declined to the same extent as in the first year of the recession in 2008-2009. While there is no financial crisis to worry about yet, there are signs that investment may take a long time to recover. the purpose of this chapter is to trace the impact of the pandemic on investment and provide an analysis of the main drivers. the first section outlines the general investment trends in the european Union. Using the latest wave of the eIB Investment Survey (eIBIS), the second section explores the developments in corporate investment in 2019-2020 and expectations for 2021. the third section provides an overview of infrastructure investment through 2019 and information about infrastructure projects in the first half of 2020. the fourth section takes a closer look at government investment in the european Union in 2019, as well as the plans for 2020-2021. the last section draws conclusions about the implications for policy.
Aggregate investment dynamics
Investment growth continued until the end of 2019, but the pace slowed
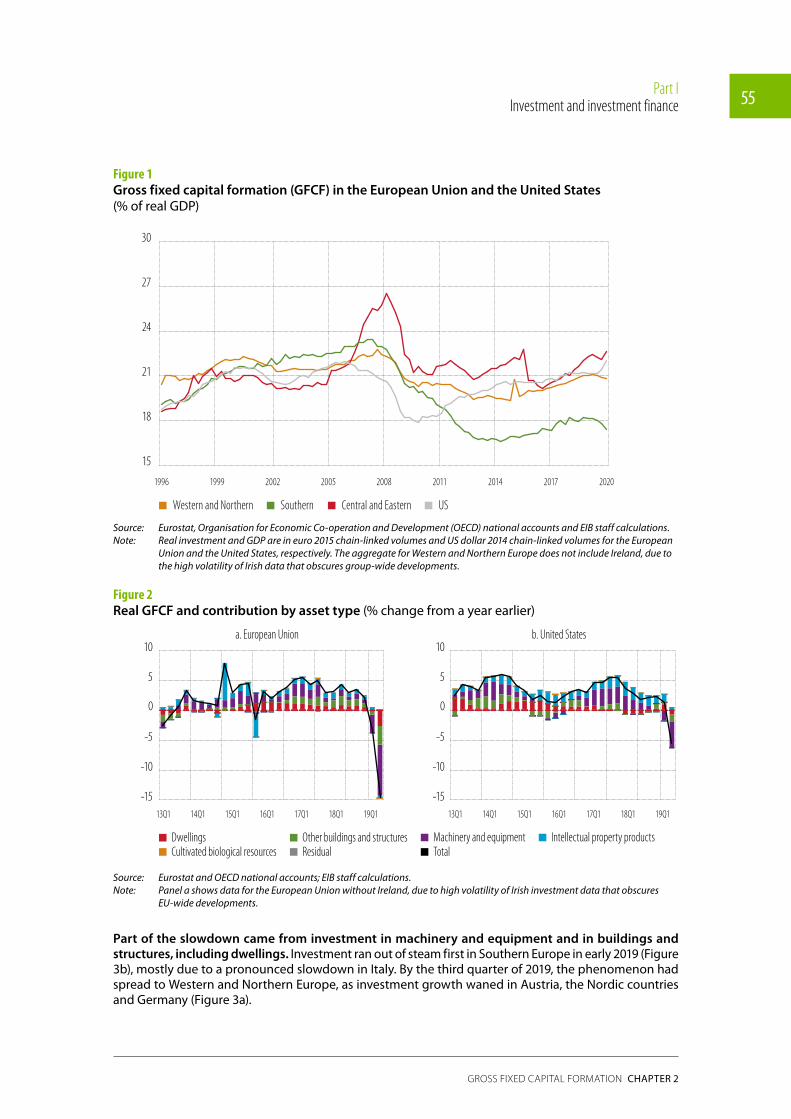
Aggregate investment rates continued to rise throughout 2019 in most EU members as investment growth outpaced growth in real gross domestic product (GDP) (Figure 1).1,2 the investment rate in the european Union rose above its long-term average at the end of 2019. this rise was also seen in Western and Northern europe and in Central and eastern europe. the aggregate investment rate in Southern europe, however, was 1.5 percentage points below the average of the past 25 years.
In 2019, aggregate investment in the European Union grew about 3% relative to 2018. half of this pace of growth resulted from higher investment in buildings and structures, including dwellings (Figure 2a). Investment in other buildings and structures, which includes infrastructure investment (discussed separately in this chapter), expanded at faster rates in Central and eastern europe. the investment in buildings and structures was supported by higher government capital expenditure and investment grants from the european Structural and Investment Funds (Figure 3c). austria, France, Germany and portugal also saw significant investment increases in buildings and structures.
These positive developments notwithstanding, aggregate investment growth slowed down in the European Union in the second half of 2019 (Figure 2a). the slowdown was due to weakening international trade amid intensifying disputes between the United States and its main trading partners (eIB, 2019). In 2019 and early 2020, before the coronavirus pandemic drew all the attention of analysts and commentators, european economic discourse focused mostly on the weakening of the German economy as a result of falling exports.
1 Investment rate in this chapter stands for the share of investment to GDP in percent. Unless stated otherwise, both investment and GDP are measured in real, 2015 chain-linked volumes. In this chapter, investment and gross fixed capital formation have the same meaning and are used interchangeably.
2 Belgium, Estonia, Finland, Hungary, Lithuania, Slovenia and Sweden saw a slight decline in 2019.
Part IInvestment and investment finance 55
Gross fixed capital formation Chapter 2
Figure 1Gross fixed capital formation (GFCF) in the European Union and the United States (% of real GDp)
Western and Northern Southern Central and Eastern US
15
18
21
24
27
30
1996 1999 2002 2005 2008 2011 2014 2017 2020
Poland
Cyprus
Hungary
Croatia
Slovakia
Greece
Bulgaria
Romania
Source: Eurostat, Organisation for Economic Co-operation and Development (OECD) national accounts and EIB staff calculations.Note: Real investment and GDP are in euro 2015 chain-linked volumes and US dollar 2014 chain-linked volumes for the European
Union and the United States, respectively. The aggregate for Western and Northern Europe does not include Ireland, due to the high volatility of Irish data that obscures group-wide developments.
Figure 2Real GFCF and contribution by asset type (% change from a year earlier)
-15
-10
-5
0
5
10
-15
-10
-5
0
5
10
13Q1 14Q1 15Q1 16Q1 17Q1 18Q1 19Q1
Dwellings Other buildings and structures Machinery and equipment Intellectual property productsCultivated biological resources TotalResidual
13Q1 14Q1 15Q1 16Q1 17Q1 18Q1 19Q1
a. European Union b. United States
Source: Eurostat and OECD national accounts; EIB staff calculations.Note: Panel a shows data for the European Union without Ireland, due to high volatility of Irish investment data that obscures
EU-wide developments.
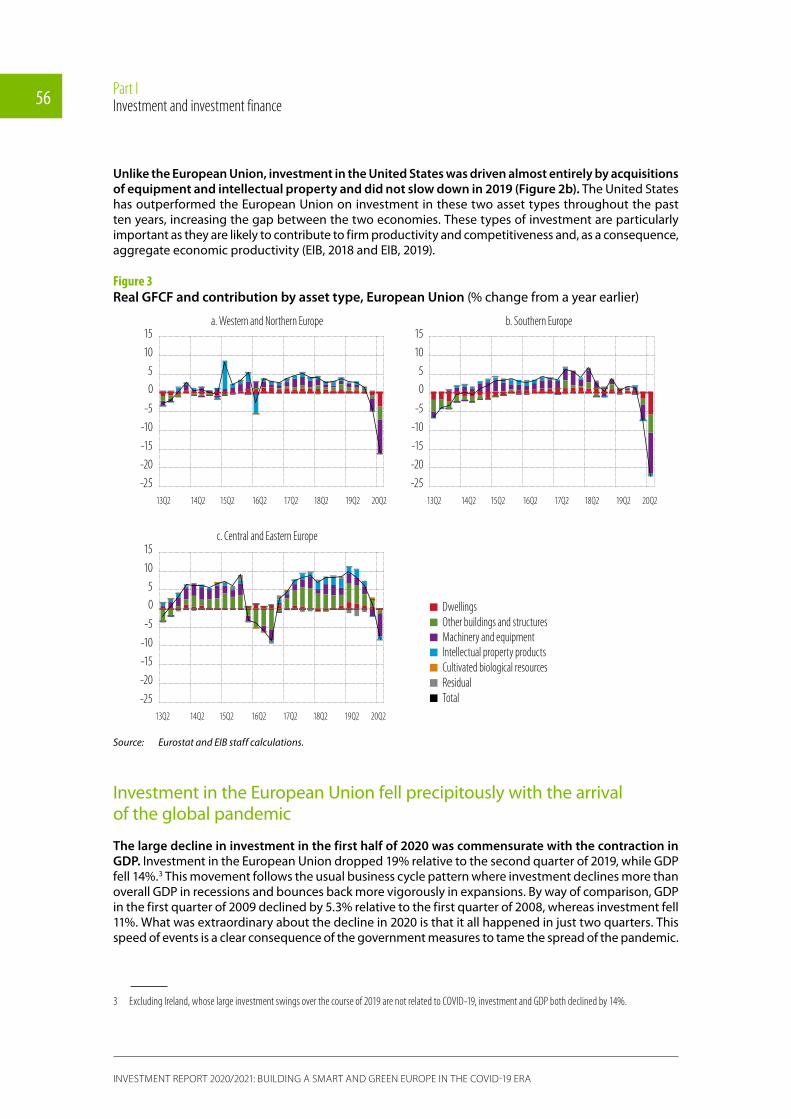
Part of the slowdown came from investment in machinery and equipment and in buildings and structures, including dwellings. Investment ran out of steam first in Southern europe in early 2019 (Figure 3b), mostly due to a pronounced slowdown in Italy. By the third quarter of 2019, the phenomenon had spread to Western and Northern europe, as investment growth waned in austria, the Nordic countries and Germany (Figure 3a).
Part IInvestment and investment finance 56
INVESTMENT REPORT 2020/2021: BUILDING A SMART AND GREEN EUROPE IN THE COVID-19 ERA
Unlike the European Union, investment in the United States was driven almost entirely by acquisitions of equipment and intellectual property and did not slow down in 2019 (Figure 2b). the United States has outperformed the european Union on investment in these two asset types throughout the past ten years, increasing the gap between the two economies. these types of investment are particularly important as they are likely to contribute to firm productivity and competitiveness and, as a consequence, aggregate economic productivity (eIB, 2018 and eIB, 2019).
Figure 3Real GFCF and contribution by asset type, European Union (% change from a year earlier)
-25
-20
-15
-10
-5
0 5
10
15
-25
-20
-15
-10
-5
0 5
10
15
-25
-20
-15
-10
-5
0 5
10
15
13Q2 14Q2 15Q2 16Q2 17Q2 18Q2 19Q2 20Q2
DwellingsOther buildings and structuresMachinery and equipmentIntellectual property productsCultivated biological resources
TotalResidual
13Q2 14Q2 15Q2 16Q2 17Q2 18Q2 19Q2 20Q2
13Q2 14Q2 15Q2 16Q2 17Q2 18Q2 19Q2 20Q2
a. Western and Northern Europe
c. Central and Eastern Europe
b. Southern Europe
-25
-20
-15
-10
-5
0 5
10
15
-25
-20
-15
-10
-5
0 5
10
15
-25
-20
-15
-10
-5
0 5
10
15
13Q2 14Q2 15Q2 16Q2 17Q2 18Q2 19Q2 20Q2
DwellingsOther buildings and structuresMachinery and equipmentIntellectual property productsCultivated biological resources
TotalResidual
13Q2 14Q2 15Q2 16Q2 17Q2 18Q2 19Q2 20Q2
13Q2 14Q2 15Q2 16Q2 17Q2 18Q2 19Q2 20Q2
a. Western and Northern Europe
c. Central and Eastern Europe
b. Southern Europe
Source: Eurostat and EIB staff calculations.
Investment in the european Union fell precipitously with the arrival of the global pandemic
The large decline in investment in the first half of 2020 was commensurate with the contraction in GDP. Investment in the european Union dropped 19% relative to the second quarter of 2019, while GDp fell 14%.3 this movement follows the usual business cycle pattern where investment declines more than overall GDp in recessions and bounces back more vigorously in expansions. By way of comparison, GDp in the first quarter of 2009 declined by 5.3% relative to the first quarter of 2008, whereas investment fell 11%. What was extraordinary about the decline in 2020 is that it all happened in just two quarters. this speed of events is a clear consequence of the government measures to tame the spread of the pandemic.
3 Excluding Ireland, whose large investment swings over the course of 2019 are not related to COVID-19, investment and GDP both declined by 14%.

Part IInvestment and investment finance 57
Gross fixed capital formation Chapter 2
Economic activity collapsed around mid-March, as most European governments began implementing drastic measures to curtail the pandemic. Investment might have already started to decline three weeks earlier, at the end of February when financial-market volatility jumped sharply in europe. the decline in confidence indicators in February, reversing the gains of the previous three months, also supports this hypothesis. as a result, gross fixed capital formation (GFCF) in the european Union slid nearly 4% compared with the first quarter of 2019, with countries in Western and Northern europe showing the same trend. as previously stated, the contraction was mostly due to falling investment in machinery and equipment (Figure 2a and Figure 3a). In Southern europe, the downtrend in machinery and equipment investment was reinforced by a similar decline in investment in buildings and structures, including dwellings (Figure 3b). In Central and eastern europe, an increase in investment in other buildings and structures offset the decrease in equipment investment (Figure 3c).
Investment declined far less in the United States than in the European Union. this was despite a much smaller difference in the decline in GDp between the two economies. the US deterioration was consistently much smaller across asset types, but followed a very similar pattern to europe. On both sides of the atlantic, investment in machinery and equipment declined the most, followed by investment in other buildings and structures and investment in dwellings. Investment in intellectual property increased in the United States in the second quarter of 2020 compared with the same period a year earlier, while in the european Union it declined and helped push down total investment by an additional 0.5 percentage points.
Restrictions imposed across EU Member States acted as a major barrier to investment in the second quarter of 2020. a significant part of the precipitous decline is most likely due to these severe restrictions. the drop in investment in eU countries in the second quarter is clearly associated with the governmental or self-imposed curbs on movement (Figure 4). this kind of restriction explains, in particular, the varying declines in investment in buildings and structures across the different countries, as shown in Figure 3.4,5 the restrictions on movement were lifted at the end of the second quarter and the beginning of third quarter. GDp showed a partial rebound in third quarter, so we can expect some of the decline in investment to be reversed in that quarter. that said, the recovery might prove to be unimpressive as two very important factors determining investment decisions gain prominence – uncertainty and the impact of corporate liquidity and net worth.
Elevated uncertainty has a powerful negative effect on investment that is widely documented in the academic literature (Leahy and Whited, 1996; Guiso and parisi, 1999; Butzen, Fuss, and Vermeulen, 2003; Bloom, Bond, and van reenen, 2007). as fixed assets are generally more difficult to liquidate, firms are reluctant to invest in this area during periods of elevated uncertainty because their sensitivity to demand shocks would increase as a result. the tendency to postpone this type of spending when uncertainty is high reduces the effectiveness of policies aimed at stimulating investment, and more aggressive policy actions are required. (Bloom, Bond, and van reenen, 2007; Bloom, 2014).
While uncertainty seems to have partially subsided after the initial shock in March 2020, it is still elevated and is likely to remain so for some time (Figure 5). early evidence suggests that higher uncertainty is taking a toll on business investment (Figure 6). the share of respondents in the eIBIS 2020 that say uncertainty is a major obstacle to investment explains about one-sixth of the decline in total investment in the first half of 2020. Similarly, differences in respondents’ views about their business prospects, which is arguably another measure of uncertainty, explains around 13% of the variation in aggregate investment across countries.
4 For instance, not all countries interrupted construction works fully during the second quarter of 2020, which resulted in different investment outcomes in buildings and structures across EU countries. In addition, buying a new property requires a great deal of social interaction and the barriers to this varied in the different countries.
5 The Google mobility trends index explains around 60% of the variation of investment in buildings and structures across countries.

Part IInvestment and investment finance 58
INVESTMENT REPORT 2020/2021: BUILDING A SMART AND GREEN EUROPE IN THE COVID-19 ERA
Figure 4Real GFCF and COVID-19 containment measures
BE
FR
DK
HR
BG
ES
CZ
EL
DESE AT
NLPT
IT
40 50 60 70 80 90
-30
-20
-10
0
10
UK
HU
FI
BEFR
DK
ROBG
SK
ES
CZ
PL
DE
SE
ATNL
HR
PTLV
IT
-60 -40 -20 0
-30
-20
-10
0
10
UK
LT
HU
FIEL
EE
LV
SI
PLLT
SK
RO
EE
SI
LU
OxCRGT stringency index
GFCF
in Q2
2020
, % qu
raterl
y cha
nge
Google mobility indexGF
CF in
Q2 20
20, %
qurat
erly c
hang
e
US
a. GFCF growth in Q2 2020 relative to previous quarter and OxCRGT stringency index
b. GFCF growth in Q2 2020 relative to the previous quarterand the Google workplace mobility index
Source: EIB staff calculations based on data from Eurostat, OECD national accounts, Oxford COVID-19 Government Response Tracker, Blavatnik School of Government and Google community mobility reports.
Note: The OxCRGT stringency index records the strictness of “lockdown style” policies that primarily restrict people’s behaviour. Higher values indicate more restrictions. The Google index tracks visits to the workplace and shows the deviation in mobility on a given day from the median value, for the corresponding day of the week, during the five-week period 3 January to 6 February 2020. A higher, less negative number indicates mobility that is closer to usual. Both indices are daily and averaged over April, May and June.
Figure 5Euro STOXX 50 volatility index provides a forward-looking measure of uncertainty
0
20
40
60
80
100
19M10 19M11 19M12 20M01 20M02 20M03 20M04 20M05 20M06 20M07 20M08 20M09
Source: Refinitiv Datastream and EIB staff calculations.
Part IInvestment and investment finance 59
Gross fixed capital formation Chapter 2
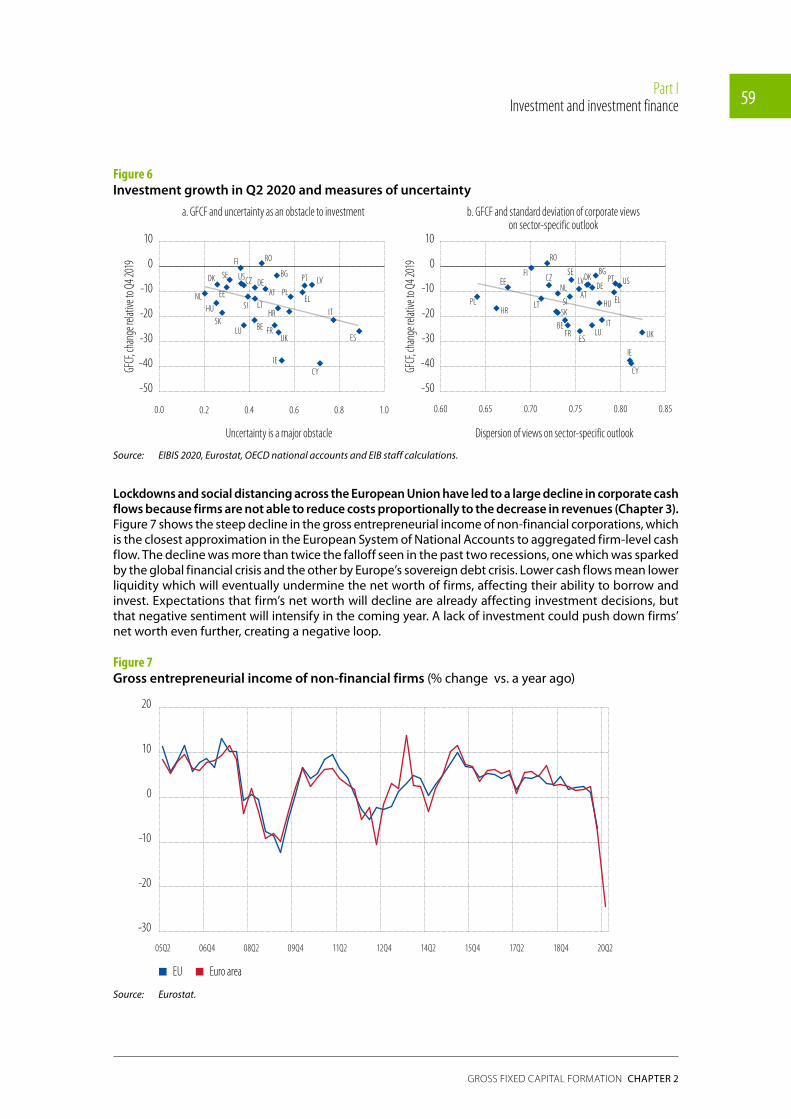
Figure 6Investment growth in Q2 2020 and measures of uncertainty
BE FR
DK
HR
BG
ES
CZ
EL
DESE
ATNL
PT
IT
0.0 0.2 0.4 0.6 0.8 1.0
-50
-40
-30
-20
-10
0
10
UK
HU
FI
BEFR
DK
RO
BG
SK
ES
CZ
PL
DE
SE
ATNL
HR
PTLV
IT
0.60 0.65 0.70 0.75 0.80 0.85
-50
-40
-30
-20
-10
0
10
UK
LT HU
FI
ELEE
LV
SI
PLLT
SK
RO
EE
SI
LU
IE
Uncertainty is a major obstacle
GFCF
, cha
nge r
elativ
e to Q
4 201
9
Dispersion of views on sector-specific outlook
GFCF
, cha
nge r
elativ
e to Q
4 201
9
US
LU
IECY
US
CY
a. GFCF and uncertainty as an obstacle to investment b. GFCF and standard deviation of corporate viewson sector-specific outlook
Source: EIBIS 2020, Eurostat, OECD national accounts and EIB staff calculations.
Lockdowns and social distancing across the European Union have led to a large decline in corporate cash flows because firms are not able to reduce costs proportionally to the decrease in revenues (Chapter 3). Figure 7 shows the steep decline in the gross entrepreneurial income of non-financial corporations, which is the closest approximation in the european System of National accounts to aggregated firm-level cash flow. the decline was more than twice the falloff seen in the past two recessions, one which was sparked by the global financial crisis and the other by europe’s sovereign debt crisis. Lower cash flows mean lower liquidity which will eventually undermine the net worth of firms, affecting their ability to borrow and invest. expectations that firm’s net worth will decline are already affecting investment decisions, but that negative sentiment will intensify in the coming year. a lack of investment could push down firms’ net worth even further, creating a negative loop.
Figure 7Gross entrepreneurial income of non-financial firms (% change vs. a year ago)
EU Euro area
-30
-20
-10
0
10
20
05Q2 06Q4 08Q2 09Q4 11Q2 12Q4 14Q2 18Q4 20Q215Q4 17Q2
Source: Eurostat.

Part IInvestment and investment finance 60
INVESTMENT REPORT 2020/2021: BUILDING A SMART AND GREEN EUROPE IN THE COVID-19 ERA
Corporate investment
Investment cycle and outlook
The near-term outlook for firms deteriorated significantly with the onset of the coronavirus pandemic. expectations of non-financial corporations about the overall economic climate, as well as the business prospects in their own sectors and the availability of finance, had already deteriorated in 2019, as documented in last year’s edition of the investment report (eIB, 2019). Still, the situation had worsened considerably by this summer with the eIBIS 2020 survey (Figure 8). a net balance of 6 57% of firms in the european Union expect the economic climate to deteriorate in the next 12 months. about 25% (in net terms) expect business prospects to deteriorate in their sector or industry. the ability of firms to fund their own investments is expected to deteriorate. the percentage of firms that said they expected a net improvement in their ability internally finance their investments over the following 12 months was 18% in 2019. By 2020, however, 23% (in net terms) of firms said they expected the situation to deteriorate in the next 12 months. expectations about the availability of external finance are broadly neutral following the massive interventions from the european Central Bank, national governments and the european Union (see Chapters 1 and 3).
Figure 8Investment drivers in the European Union, firms expecting an improvement/deterioration (net balance)
-60
-50
-40
-30
-20
-10
0
10
20
30
40
50
60
16 17 18 19 20 16 17 18 19 20 16 17 18 19 20 16 17 18 19 2016 17 18 19 20
Political/regulatoryclimate Economic climate
Business prospects in the sector
Availability of external finance
Availability of internal finance
Source: EIBIS 2016, EIBIS 2017, EIBIS 2018, EIBIS 2019 and EIBIS 2020.Base: All firms (excluding don’t knows/refusals to respond).Question: Do you think that each of the following will improve, stay the same, or get worse over the next 12 months?
Expected investment for the current year also plummeted, in line with the extraordinary deterioration in economic sentiment (Figure 9). planned investment changed from an eU average of 13% (in net terms) of firms expecting an increase in 2019 compared to the prior year, to an eU average of 28% (in net terms) of firms expecting a decrease in investment in 2020 compared to the prior year. Country variations are significant (Figure 9a) – from a 60 percentage point deterioration in Latvia to a 9.6 percentage point
6 The net balance here means the difference between the firms that expect improvement and those that expect a deterioration as a share of total respondents.

Part IInvestment and investment finance 61
Gross fixed capital formation Chapter 2
contraction in romania. as discussed above, some of this decline can be explained by the pandemic. While it is still too early to assess the direct impact of government lockdowns and other restrictions on investment, those restrictions are expected to account for only part of the decline, given their relatively short duration. Deteriorating expectations about the economy and substantial uncertainty about the “new normal” will most likely explain a significant portion of the decline in investment in 2020.
Figure 9Corporate investment dynamics
-50
-40
-30
-20
-10
0
10
20
30
40
50
AT BE BG HR CY CZ DK EE FI FR DE EL HU IE IT LV LT LU MT NL PL PT RO SK SI ES SE UK US
20202019
60 65 70 75 80 85 90 95 100
-60
-50
-40
-30
-20
-10
0
10
20
Firms
expe
cting
to in
creas
e/dec
rease
inve
stmen
t in cu
rrent
finan
cialye
ar(ne
t bala
nce,
%)
Share of firms investing
IE LUDK
FRCYLV
DEAT
HR
RO
BG
FI
ES
EL
UKBE SI
NL
EEHU
IT
PT
LT
PL
MT
SE
SKCZ
EU
US
High investment expanding
High investment contracting
Low investment expanding
Low investment contracting
a. Share of firms expecting to increase/decrease activities in the current financial year (net balance, %)
b. Investment cycle
Source: EIBIS 2019 and EIBIS 2020.Base: All firms (excluding don’t knows/refusals to respond). Share of firms investing shows the percentage of firms whose
investment per employee is greater than EUR 500. The y-axis crosses the x-axis at the EU average in the previous four waves.Note: Net balances show the differences between firms expecting to increase investment activities in the current financial year
and firms expecting to decrease them.
Part IInvestment and investment finance 62
INVESTMENT REPORT 2020/2021: BUILDING A SMART AND GREEN EUROPE IN THE COVID-19 ERA
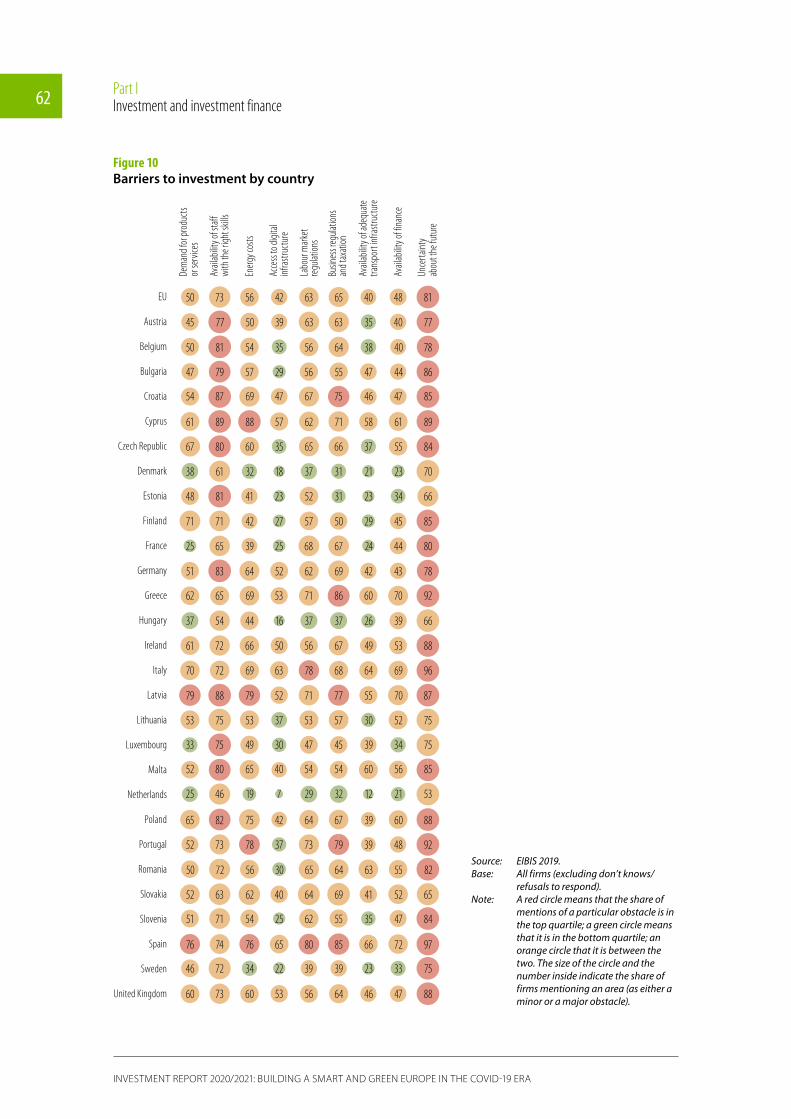
Figure 10Barriers to investment by country
Dem
and f
or pr
oduc
ts or
serv
ices
Avail
abilit
y of s
taff
with
the r
ight s
kills
Energ
y cos
ts
Acce
ss to
digit
alinf
rastr
uctu
re
Labo
ur m
arke
tre
gulat
ions
Busin
ess r
egula
tions
and t
axat
ion
Avail
abilit
y of a
dequ
atetra
nspo
rt inf
rastr
uctu
re
Avail
abilit
y of f
inanc
e
Unce
rtaint
yab
out t
he fu
ture
EU
Austria
Belgium
Bulgaria
Croatia
Cyprus
Czech Republic
Denmark
Estonia
Finland
France
Germany
Greece
Hungary
Ireland
Italy
Latvia
Lithuania
Luxembourg
Malta
Netherlands
Poland
Portugal
Romania
Slovakia
Slovenia
Spain
Sweden
United Kingdom
50 81 54 35 56 64 38 40 78
47 79 57 29 56 55 47 44 86
54 87 69 47 67 75 46 47 85
61 89 88 57 62 71 58 61 89
67 80 60 35 65 66 37 55 84
38 61 32 18 37 31 21 23 70
48 81 41 23 52 31 23 34 66
71 71 42 27 57 50 29 45 85
25 65 39 25 68 67 24 44 80
51 83 64 52 62 69 42 43 78
62 65 69 53 71 86 60 70 92
37 54 44 16 37 37 26 39 66
61 72 66 50 56 67 49 53 88
70 72 69 63 78 68 64 69 96
79 88 79 52 71 77 55 70 87
53 75 53 37 53 57 30 52 75
33 75 49 30 47 45 39 34 75
52 80 65 40 54 54 60 56 85
25 46 19 7 29 32 12 21 53
65 82 75 42 64 67 39 60 88
52 73 78 37 73 79 39 48 92
50 72 56 30 65 64 63 55 82
52 63 62 40 64 69 41 52 65
51 71 54 25 62 55 35 47 84
76 74 76 65 80 85 66 72 97
46 72 34 22 39 39 23 33 75
60 73 60 53 56 64 46 47 88
50 73 56 42 63 65 40 48 81
45 77 50 39 63 63 35 40 77
Source: EIBIS 2019.Base: All firms (excluding don’t knows/
refusals to respond).Note: A red circle means that the share of
mentions of a particular obstacle is in the top quartile; a green circle means that it is in the bottom quartile; an orange circle that it is between the two. The size of the circle and the number inside indicate the share of firms mentioning an area (as either a minor or a major obstacle).

Part IInvestment and investment finance 63
Gross fixed capital formation Chapter 2
Firms in almost all countries in the EIBIS see uncertainty about the future as the most significant impediment to investment in 2020 (Figure 10). Uncertainty has overtaken the availability of workers with the right skills as firms’ major concern. Firm perceptions vary substantially depending on the country. In Spain, 97% of non-financial firms say uncertainty is an impediment to investing, whereas in the Netherlands, only 53% do. the second largest impediment in almost all countries is the availability of staff with the right skills. In austria, Cyprus and Lithuania, lack of skills ties with uncertainty as the most reported impediment to investment. In Belgium, Croatia, estonia, Germany, Latvia and Luxembourg, the availability of staff with the right skills is the top impediment to investment for non-financial firms, unchanged from the past two years.
Short-term impact of the pandemic
In the European Union, 45% of firms have decided to reduce their investments in 2020 because of the COVID-19 crisis. Nearly half of these firms say they will postpone their investments. another 40% of these firms will change or rescale their pre-pandemic plans and only slightly less than 5% intend to abandon their investment plans altogether.7 Six percent (net) of firms that did not change their investment because of the pandemic say they will increase investment in 2020, while more than 40% in this group have not changed their investments relative to 2019. Slightly more than half of the firms that have not changed their plans are large, profitable firms for which the availability of finance is not a great concern.
Plans to adjust investment in 2020 vary little across firm size or other characteristics. the share of firms reducing their investments in 2020 is remarkably similar across size classes (Figure 11a). In previous eIBIS waves, the share of medium and large firms increasing investment was, on average, 10 percentage points higher than for micro and small firms. In the United States and in Western and Northern europe, a bigger share of medium and large firms are reducing their investments in 2020 compared to smaller firms. Differences in investment plans are likewise small or non-existent across firms with different growth dynamics over the past three years, or different average and median productivity profiles (Figure 11b and Figure 11c).
Firms cut employment radically following the coronavirus outbreak. In eIBIS 2020, the pandemic caused about 55% of firms to reduce to some extent their staff through layoffs, redundancies, unpaid temporary leave and cuts to working hours. the share varies significantly across regions – from 45% in Central and eastern europe to slightly more than 60% in Southern europe. Medium and large firms tend to make smaller adjustments that affect up to a quarter of their employees, whereas smaller firms tend to make larger adjustments that involve half or more of their employees.
Regions where firms are more likely to reduce employment because of the pandemic are likely to see cuts in investment as well. Firms that reduced employment due to the COVID-19 crisis are twice as likely to have also revised downwards their investment plans due to the pandemic (Figure 12a). this is the case for all three regions within the european Union as well as for the United States.
7 The remaining firms answered yes to all available options, probably referring to a portfolio of investment projects.

Part IInvestment and investment finance 64
INVESTMENT REPORT 2020/2021: BUILDING A SMART AND GREEN EUROPE IN THE COVID-19 ERA
Figure 11Change in investment in 2020 (% of all firms)
0
20
40
60
80
100
Micro
(5-9
)Sm
all (1
0-49
)Me
dium
(50-
249)
Larg
e (25
0+)
Micro
(5-9
)Sm
all (1
0-49
)Me
dium
(50-
249)
Larg
e (25
0+)
Micro
(5-9
)Sm
all (1
0-49
)Me
dium
(50-
249)
Larg
e (25
0+)
Micro
(5-9
)Sm
all (1
0-49
)Me
dium
(50-
249)
Larg
e (25
0+)
Shrin
king
Grow
ing
Shrin
king
Grow
ing
Shrin
king
Grow
ing
Shrin
king
Grow
ing
USWestern and
Northern SouthernCentral and
Eastern USWestern and
Northern SouthernCentral and
Eastern
0
20
40
60
80
100
Decrease Unchanged Increase Decrease Unchanged Increase
Western andNorthern
SouthernCentral andEastern
2
4
6
8
Investing less About the same Investing more
a. By firm size
c. By total factor productivity
b. By growth of number of employees over the past three years
The impact of COVID-19 on firms’ investment plans varied by sector (Figure 12b). the bars on Figure 12b plot the share of firms in each sector that reduced employment due to the pandemic. each bar is further split according to the pandemic’s impact on investment plans. For the hospitality sector (accommodation), for instance, 89.6% of firms took measures to reduce their labour input, and 53% of these firms also reduced investment plans as a result of the coronavirus. In contrast, slightly more than 40% of firms in the water sector took steps to reduce their labour force, while only 14% of these firms reduced their investment plans because of the pandemic. the ranking in Figure 12b is not surprising, given that the operations of these businesses, especially in the first four sectors, were the most affected by government restrictions and social distancing measures. at the opposite end of the spectrum, utility companies were the least affected by the measures to contain the pandemic and, accordingly, their investment plans were less affected.
Source: EIBIS 2020.Base: All firms (excluding don’t knows/refusals to
respond).Note: The figure shows the 10th, 25th, 50th, 75th and
90th percentiles and the average (diamonds) of firm-level total factor productivity.
Question: For the current financial year, do you expect your investment to be more than last year, around the same or less than last year (panels a, b and c); How many people did your company employ three years ago (panel b).

Part IInvestment and investment finance 65
Gross fixed capital formation Chapter 2
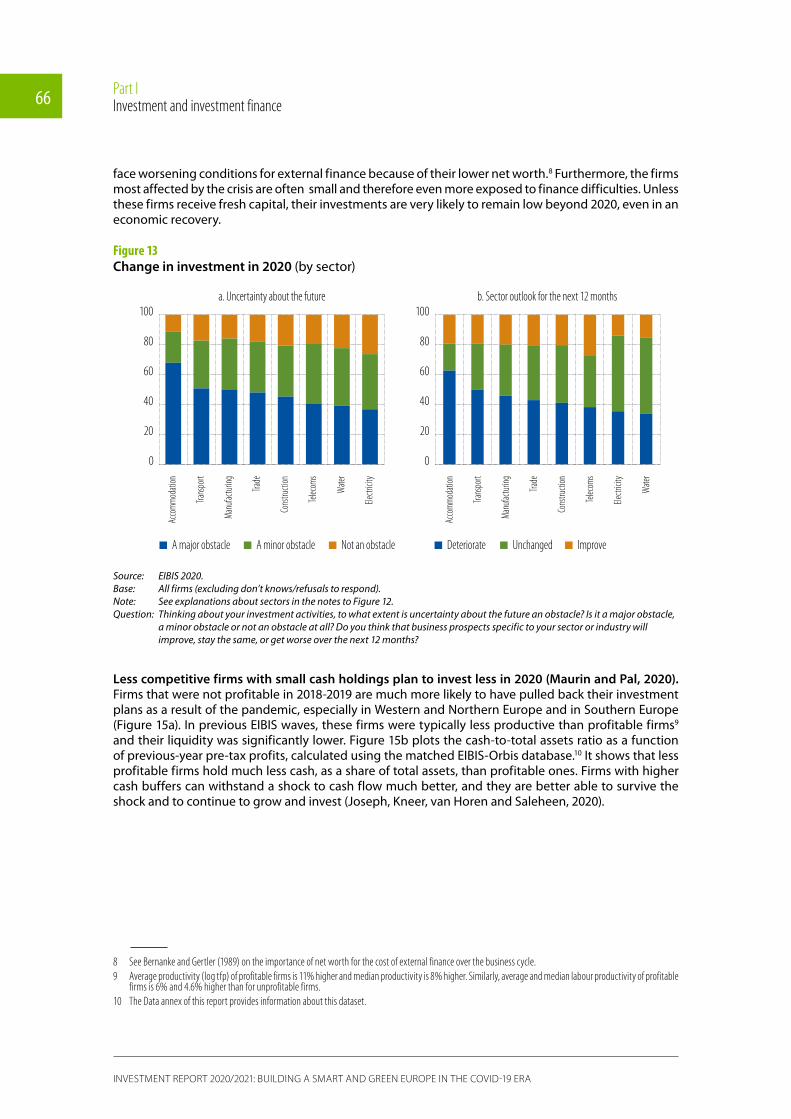
Uncertainty, deteriorating economic sentiment, and the uneven impact of social distancing measures are behind the sector divergence. Many businesses in the hospitality, transport, retail and manufacturing sectors were not able to carry out their investment activities, especially at the beginning of the second quarter of 2020, as they were constrained by social distancing measures. Despite easier conditions in the third quarter, however, it seems that most firms are unwilling to make up the lost ground. Firms are postponing their investment plans amid uncertainty and expectations of a further deterioration in business prospects and the general economic outlook (Figure 13a and Figure 13b).
Figure 12COVID-19 impact on use of labour services and on investment plans
0
20
40
60
80
100
No re
ducti
on
Redu
ce em
ploym
ent
No re
ducti
on
Redu
ce em
ploym
ent
No re
ducti
on
Redu
ce em
ploym
ent
No re
ducti
on
Redu
ce em
ploym
ent
Acco
mmod
ation
Trans
port
Manu
factu
ring
Trade
Cons
tructi
on
Telec
om
Electr
icity
Wate
r sup
ply
USWestern and
Northern SouthernCentral and
Eastern
0
20
40
60
80
100
Invest less Unchanged Invest more
a. By region b. By sector in the European Union
Source: EIBIS 2020.Base: All firms (excluding don’t knows/refusals to respond).Note: Sectors correspond to the NACE Rev. 2 classification of economic activities in the European Union as follows: manufacturing
is section C; electricity is section D (electricity, gas, steam and air conditioning supply); water supply is section E (water supply; sewerage, waste management and remediation activities); construction is section F; trade is section G (wholesale and retail trade; repair of motor vehicles and motorcycles); transport is section H (transportation and storage); accommodation is section I (accommodation and food service activities); and telecoms is section J (information and communication).
Question: Thinking about the impact of coronavirus, have you had to put staff temporarily on leave, make staff redundant or unemployed or reduced the number of hours they work compared to before the coronavirus pandemic? Has your company’s overall investment expectations for 2020 changed due to coronavirus? Will your company invest more, invest less or keep investment broadly the same?
Optimism about a rebound in investment in 2021 may be premature, however. While increased uncertainty and the deterioration in the economy in the first half of 2020 had the strongest impact on investment, firms also said they expected difficulties with finance, especially internal finance. this should come as no surprise as cash flows have retreated well into negative territory, especially in some sectors (see also the analysis in Chapter 3).
Firms that are more affected by the pandemic are significantly more pessimistic about their ability to finance investment internally over the next 12 months (Figure 14). the decline in sales caused by the lockdown resulted in low or negative cash flows for many firms. Some of those firms were obliged to draw down their liquidity as a result, which will affect their overall capital and, ultimately, their net worth (Chapter 3). these firms have lower internal funds to finance investment and are more likely to
Part IInvestment and investment finance 66
INVESTMENT REPORT 2020/2021: BUILDING A SMART AND GREEN EUROPE IN THE COVID-19 ERA
face worsening conditions for external finance because of their lower net worth.8 Furthermore, the firms most affected by the crisis are often small and therefore even more exposed to finance difficulties. Unless these firms receive fresh capital, their investments are very likely to remain low beyond 2020, even in an economic recovery.
Figure 13Change in investment in 2020 (by sector)
0
20
40
60
80
100
Acco
mmod
ation
Trans
port
Manu
factu
ring
Trade
Cons
tructi
on
Telec
oms
Electr
icity
Wate
r
Acco
mmod
ation
Trans
port
Manu
factu
ring
Trade
Cons
tructi
on
Telec
oms
Electr
icity
Wate
r
0
20
40
60
80
100
A major obstacle A minor obstacle Not an obstacle Deteriorate Unchanged Improve
a. Uncertainty about the future b. Sector outlook for the next 12 months
Source: EIBIS 2020.Base: All firms (excluding don’t knows/refusals to respond).Note: See explanations about sectors in the notes to Figure 12.Question: Thinking about your investment activities, to what extent is uncertainty about the future an obstacle? Is it a major obstacle,
a minor obstacle or not an obstacle at all? Do you think that business prospects specific to your sector or industry will improve, stay the same, or get worse over the next 12 months?
Less competitive firms with small cash holdings plan to invest less in 2020 (Maurin and Pal, 2020). Firms that were not profitable in 2018-2019 are much more likely to have pulled back their investment plans as a result of the pandemic, especially in Western and Northern europe and in Southern europe (Figure 15a). In previous eIBIS waves, these firms were typically less productive than profitable firms9 and their liquidity was significantly lower. Figure 15b plots the cash-to-total assets ratio as a function of previous-year pre-tax profits, calculated using the matched eIBIS-Orbis database.10 It shows that less profitable firms hold much less cash, as a share of total assets, than profitable ones. Firms with higher cash buffers can withstand a shock to cash flow much better, and they are better able to survive the shock and to continue to grow and invest (Joseph, Kneer, van horen and Saleheen, 2020).
8 See Bernanke and Gertler (1989) on the importance of net worth for the cost of external finance over the business cycle.9 Average productivity (log tfp) of profitable firms is 11% higher and median productivity is 8% higher. Similarly, average and median labour productivity of profitable
firms is 6% and 4.6% higher than for unprofitable firms.10 The Data annex of this report provides information about this dataset.

Part IInvestment and investment finance 67
Gross fixed capital formation Chapter 2
Figure 14Impact of the COVID-19 crisis on internal finance
No re
ducti
on
Redu
ce em
ploym
ent
No re
ducti
on
Redu
ce em
ploym
ent
No re
ducti
on
Redu
ce em
ploym
ent
No re
ducti
on
Redu
ce em
ploym
ent
0
20
40
60
80
100
Deteriorate Unchanged Improve
USWestern and
Northern SouthernCentral and
Eastern
Deter
iorate
No ch
ange
Impr
ove
Deter
iorate
No ch
ange
Impr
ove
Deter
iorate
No ch
ange
Impr
ove
Deter
iorate
No ch
ange
Impr
ove
0
20
40
60
80
100
Invest less Unchanged Invest more
USWestern and
Northern SouthernCentral and
Eastern
a. Change in investment plans due to the crisis and the near-term outlook for internal finance
b. Reduced employment as a result of the crisis andthe near-term outlook for internal finance
Source: EIBIS 2020.Base: All firms (excluding don’t knows/refusals to respond).Question: Do you think that availability of internal finance will improve, stay the same, or get worse over the next 12 months?
Thinking about the impact of the coronavirus, have you had to put staff temporarily on leave, make staff redundant or unemployed or reduce the number of hours they work compared to before the coronavirus pandemic? Has your company’s overall investment expectations for 2020 changed due to coronavirus? Will your company invest more, invest less or keep investment broadly the same?
Figure 15Profitability and cash holdings’ effect on investment
0
20
40
60
80
Non-
profi
table
Profit
able
Non-
profi
table
Profit
able
Non-
profi
table
Profit
able
Non-
profi
table
Profit
able
USWestern and
Northern SouthernCentral and
Eastern
0
20
40
60
80
100
Invest less Unchanged Invest more
Under 2% 2% to 4% 5% to 9% 10% to 14% 15% or more
a. Profitability and change of investment plans due to COVID-19 b. Cash holdings and pre-tax profits(% revenue for profits and % total assets for cash)
Source: EIBIS 2020 and EIBIS-Orbis matched database.Note: The figure shows the 10th, 25th, 50th, 75th and 90th percentiles of firm-level cash to total assets.

Part IInvestment and investment finance 68
INVESTMENT REPORT 2020/2021: BUILDING A SMART AND GREEN EUROPE IN THE COVID-19 ERA
Longer-term impact of the pandemic
While the pandemic may be brought under control sometime in the near future, it may have a permanent effect on the economy. the size and nature of the shock caused by the pandemic are such that it will likely trigger sweeping, structural changes in the economy, altering how we work, commute, travel and spend our holidays for many years to come. the evolution will likely modify investment priorities and employment patterns. Firms that do not invest in adapting to these changes might be left unprepared for future challenges.
The share of firms that do not have any investment plans in the next three years has increased compared to the average from 2016 to 2019 (Figure 16a). the share of small firms that do not plan to invest in the next three years has risen even faster. Smaller firms face greater difficulties in coping with the economic shock caused by the pandemic. the evidence is corroborated in Figure 15. Smaller firms that do not plan to invest over the next three years have significantly lower median productivity than smaller firms that plan to invest. the difference in productivity is largely absent for medium and large firms. It is therefore very likely that the consequences of the coronavirus on investment and productivity will be felt acutely in the medium term.
Digital technology is likely to become more widely used. half of the firms in the european Union expect the use of digital technologies to increase because of the COVID-19 crisis. the share of firms that expect digital technology to increase is higher in Western and Northern europe (53%) and on par with firms in the United States (Figure 16b). In Southern and Central and eastern europe, the share is somewhat lower, but still above 40%. these high percentages underline the importance of investing in digital technologies if firms are to remain competitive (see Chapter 7).
Supply chains will change, along with product and service portfolios. More than a third of firms in the european Union expect long-term effects on their supply chains and product portfolios. these views were expressed in the wake of significant supply-chain disruptions in the first and second quarters of 2020. the results support expectations about structural changes in supply chains and in industries whose products and services are built around social interaction and face-to-face contact.
Figure 16Firms’ assessment of the longer-term consequences of the pandemic
0
20
40
60
EIBIS
16-19
EIBIS
20
EIBIS
16-19
EIBIS
20
EIBIS
16-19
EIBIS
20
EIBIS
16-19
EIBIS
20
Increa
sed u
se of
digita
l tech
nolog
ies
Supp
ly ch
ain
Produ
ct po
rtfoli
o
Fewe
r emp
loyee
s
None
of th
ese
Large(250+)Micro (5-9)
Small(10-49)
Medium(50-249)
0
20
40
60
80
100
Replacing capacity Capacity expansionProduct development No investment
Western and Northern SouthernCentral and Eastern US
a. Investment plans in the next three years b. Long-term impact of COVID-19
Source: EIBIS 2020.
Part IInvestment and investment finance 69
Gross fixed capital formation Chapter 2
About 20% of all firms estimate that the job cuts they made during the pandemic will be permanent. this share is constant across the european Union and in the United States. the aggregate effect of such a shock will be felt differently across the various countries, depending on their labour market institutions (Nickell, 1997). economies whose labour markets are highly regulated may see a significant increase in structural unemployment, which could last for several years. While structural unemployment may not increase much in countries with more flexible regimes, a significant reduction of employment remains a challenge.
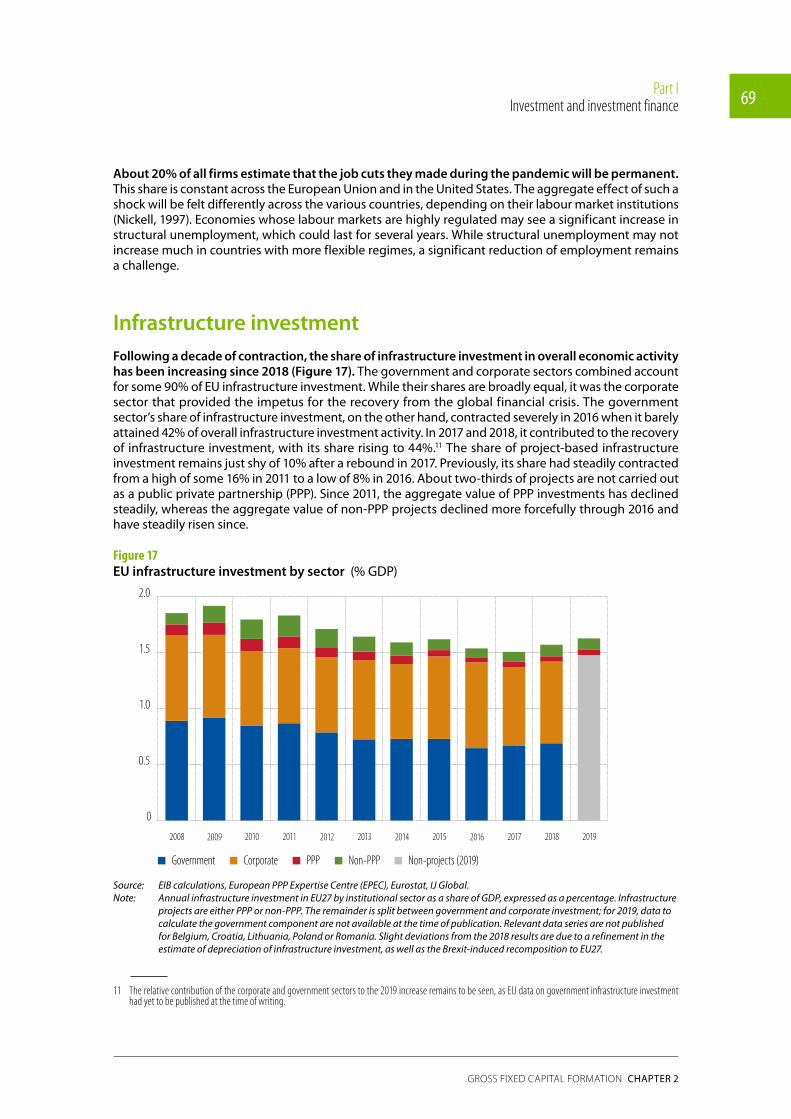
Infrastructure investmentFollowing a decade of contraction, the share of infrastructure investment in overall economic activity has been increasing since 2018 (Figure 17). the government and corporate sectors combined account for some 90% of eU infrastructure investment. While their shares are broadly equal, it was the corporate sector that provided the impetus for the recovery from the global financial crisis. the government sector’s share of infrastructure investment, on the other hand, contracted severely in 2016 when it barely attained 42% of overall infrastructure investment activity. In 2017 and 2018, it contributed to the recovery of infrastructure investment, with its share rising to 44%.11 the share of project-based infrastructure investment remains just shy of 10% after a rebound in 2017. previously, its share had steadily contracted from a high of some 16% in 2011 to a low of 8% in 2016. about two-thirds of projects are not carried out as a public private partnership (ppp). Since 2011, the aggregate value of ppp investments has declined steadily, whereas the aggregate value of non-ppp projects declined more forcefully through 2016 and have steadily risen since.
Figure 17EU infrastructure investment by sector (% GDp)
Government Corporate PPP Non-PPP Non-projects (2019)
0
0.5
1.0
1.5
2.0
2008 2009 2010 2011 2012 2013 2014 2015 2016 2018 20192017
Source: EIB calculations, European PPP Expertise Centre (EPEC), Eurostat, IJ Global.Note: Annual infrastructure investment in EU27 by institutional sector as a share of GDP, expressed as a percentage. Infrastructure
projects are either PPP or non-PPP. The remainder is split between government and corporate investment; for 2019, data to calculate the government component are not available at the time of publication. Relevant data series are not published for Belgium, Croatia, Lithuania, Poland or Romania. Slight deviations from the 2018 results are due to a refinement in the estimate of depreciation of infrastructure investment, as well as the Brexit-induced recomposition to EU27.
11 The relative contribution of the corporate and government sectors to the 2019 increase remains to be seen, as EU data on government infrastructure investment had yet to be published at the time of writing.

Part IInvestment and investment finance 70
INVESTMENT REPORT 2020/2021: BUILDING A SMART AND GREEN EUROPE IN THE COVID-19 ERA
In terms of asset type, investment in communications infrastructure has been the most dynamic component of the rebound. education and transport infrastructure investment provided further support (Figure 18). transportation and utilities constitute some 60% of infrastructure investment assets. though broadly equal in parts, the share of utilities has been declining steadily since a high of 33% in 2013, reaching a low of 27% in 2019. the share of social infrastructure assets in health and education is fairly stable, constituting about one-third of investment; typically, health accounts for about 60% of this though education steadily increased its share from 39% in 2016 to 43% in 2019. the smallest and most volatile share of infrastructure investment is attributable to communications. In 2019, it accounted for just over 7% of infrastructure investments.
Figure 18EU infrastructure investment by asset class (% GDp)
Transport Communications Utilities Education Health
0
0.5
1.0
1.5
2.0
2008 2009 2010 2011 2012 2013 2014 2015 2016 2018 20192017
Source: EIB calculations, EPEC, Eurostat, IJ Global.Note: Annual infrastructure investment in EU27 by infrastructure asset as a share of GDP, expressed as a percentage. Data
missing for Belgium, Croatia, Lithuania, Poland and Romania. Where data are not yet available, the sector share is assumed constant – this is generally the case for 2019 with Spain, Italy, Cyprus and Portugal, the areas of education, health and transport in the Netherlands, as well as with Denmark generally for 2018 and 2019. Slight deviations from the 2018 results are due to a refinement in the estimate of depreciation of infrastructure investment as well as the Brexit-induced recomposition to EU27.
Following a decade of a highly uneven contraction, the recent EU rebound has seen Southern Europe falling further behind. Central and eastern europe as well as Southern europe led a decade-long contraction in eU infrastructure investment’s share of GDp, which bottomed out in 2017. Driving the revival is a rebound in Western and Northern european Member States, where the share of investment in GDp reached 1.8% in 2019, exceeding pre-crisis peak levels. throughout 2018, the bulk of the increase was carried by the corporate sector, with support from government investment, while private sector projects provided some marginal dynamism. In 2019, Central and eastern europe provided further impetus to the revival, with the share of infrastructure investment in GDp reaching 1.9% in 2019, more than half of the pre-crisis highs. here, government activities have become the mainstay of infrastructure investment, accounting for nearly two-thirds of 2018 volumes, whereas the corporate sector continues to wane, accounting for merely one-third. projects have dwindled to barely 3% of infrastructure activity. It remains to be seen how the closing of the eU budget cycle will affect investment in the coming years and whether the predominant position of government investment will continue. In Southern europe, government investment provided some tentative stabilisation in 2018 and the overall share in GDp increased to 1.12% in 2019, here again just over half of the pre-crisis level. Non-ppp projects have more than doubled since 2016 to 0.12% of 2019 GDp.

Part IInvestment and investment finance 71
Gross fixed capital formation Chapter 2
Figure 19Regional shares of infrastructure investment by asset class
Western and Northern Southern Central and Eastern
0
20
40
60
80
100
Transport Communications Utilities Education Health
Source: EIB calculations, EPEC, Eurostat, IJ GlobalNote: Shares of infrastructure investment by infrastructure asset and by EU27 region in 2019 expressed as a percentage. Regions
are Western and Northern, Southern, and Central and Eastern. Data missing for Belgium, Croatia, Lithuania, Poland and Romania. Where data are not yet available, the sector share is assumed constant – this is generally the case for 2019 with Spain, Italy, Cyprus and Portugal, the areas of education, health and transport in the Netherlands as well as with Denmark generally for 2018 and 2019. Slight deviations from the 2018 results are due to a refinement in the estimate of depreciation of infrastructure investment as well as Brexit-induced recomposition to EU27.
Communications’ share of infrastructure investment has remained elevated since 2015 (Figure 19). In Western and Northern europe, three-quarters of infrastructure investment is accounted for in broadly equal measures by utilities, transport and health; the remaining quarter is dominated by education, with communications representing 7%. transport and utilities constitute around three-quarters of investment for both Central and eastern and Southern europe. In Central and eastern europe, the bulk of the remainder is dedicated to education. In Southern europe, communications remains the third-largest sector, with a share in excess of 10% of overall infrastructure investment, well ahead of the corresponding shares elsewhere, whereas the shares of education, health and utilities have dipped below their average in recent years. Considering their relatively small size, health and education represented a disproportionate share of the decade-long contraction in infrastructure investment in Southern europe.
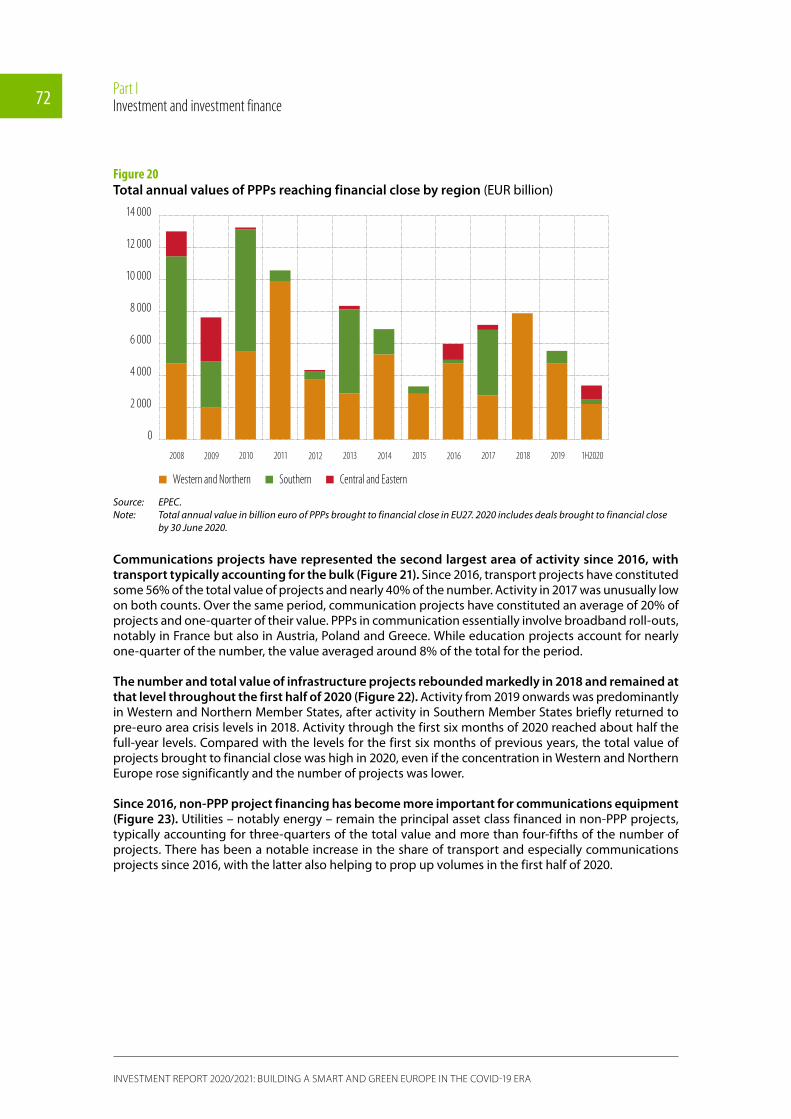
PPPs in the European Union remain concentrated in Western and Northern European Member States, with a continued decline in the number of projects reaching financial close12 accompanied by an increase in average value (Figure 20). Compared to the period preceding the global financial crisis, annual volumes had declined to less than half in 2018. In the wake of the sovereign and banking crisis in the euro area, a saddle (high) point emerged in 2013 and 2014, following which volumes declined until 2019, when they constituted a mere third of the 2010 high. activity in 2019 remained thin in Southern europe and at best sporadic in Central and eastern Member States. Over the first half of 2020, the number and total value of projects reaching financial close was broadly in line with the very low levels of 2019.
12 Volumes of euros associated with the financial close indicate the contracted value of the project and are therefore distinct from the actual levels of investment during any one year of the project’s cycle.
Part IInvestment and investment finance 72
INVESTMENT REPORT 2020/2021: BUILDING A SMART AND GREEN EUROPE IN THE COVID-19 ERA
Figure 20Total annual values of PPPs reaching financial close by region (eUr billion)
Western and Northern Southern Central and Eastern
0
2 000
4 000
6 000
8 000
10 000
12 000
14 000
2008 2009 2010 2011 2012 2013 2014 2015 2016 2018 1H202020192017
Source: EPEC.Note: Total annual value in billion euro of PPPs brought to financial close in EU27. 2020 includes deals brought to financial close
by 30 June 2020.
Communications projects have represented the second largest area of activity since 2016, with transport typically accounting for the bulk (Figure 21). Since 2016, transport projects have constituted some 56% of the total value of projects and nearly 40% of the number. activity in 2017 was unusually low on both counts. Over the same period, communication projects have constituted an average of 20% of projects and one-quarter of their value. ppps in communication essentially involve broadband roll-outs, notably in France but also in austria, poland and Greece. While education projects account for nearly one-quarter of the number, the value averaged around 8% of the total for the period.
The number and total value of infrastructure projects rebounded markedly in 2018 and remained at that level throughout the first half of 2020 (Figure 22). activity from 2019 onwards was predominantly in Western and Northern Member States, after activity in Southern Member States briefly returned to pre-euro area crisis levels in 2018. activity through the first six months of 2020 reached about half the full-year levels. Compared with the levels for the first six months of previous years, the total value of projects brought to financial close was high in 2020, even if the concentration in Western and Northern europe rose significantly and the number of projects was lower.
Since 2016, non-PPP project financing has become more important for communications equipment (Figure 23). Utilities – notably energy – remain the principal asset class financed in non-ppp projects, typically accounting for three-quarters of the total value and more than four-fifths of the number of projects. there has been a notable increase in the share of transport and especially communications projects since 2016, with the latter also helping to prop up volumes in the first half of 2020.

Part IInvestment and investment finance 73
Gross fixed capital formation Chapter 2
Figure 21Annual distribution of PPP projects reaching financial close by asset class (in %)
Transport Communications Utilities Education Health
0
20
40
60
80
100
2008 2009 2010 2011 2012 2013 2014 2015 2016 2018 2018 20182017
Source: EPEC.Note: Distribution across asset class of the total annual value in euros of PPPs brought to financial close in EU27. 2020 includes
deals brought to financial close by 30 June 2020.
Figure 22Annual value of non-PPP project by country group (eUr billion)
Western and Northern Southern Central and Eastern
0
5 000
10 000
15 000
20 000
25 000
30 000
2008 2009 2010 2011 2012 2013 2014 2015 2016 2018 1H202020192017
Source: IJ Global.Note: Total annual value in billion euros of non-PPP projects brought to financial close in EU27. 2020 includes deals brought to
financial close by 30 June 2020.

Part IInvestment and investment finance 74
INVESTMENT REPORT 2020/2021: BUILDING A SMART AND GREEN EUROPE IN THE COVID-19 ERA
Figure 23Annual non-PPP project activity by asset share
Transport Communications Utilities Education Health
0
20
40
60
80
100
2008 2009 2010 2011 2012 2013 2014 2015 2016 2018 2018 20182017
Source: IJ Global.Note: Distribution across asset class of the total annual value in euros of non-PPP projects brought to financial close in EU27. 2020
includes deals brought to financial close by 30 June 2020.
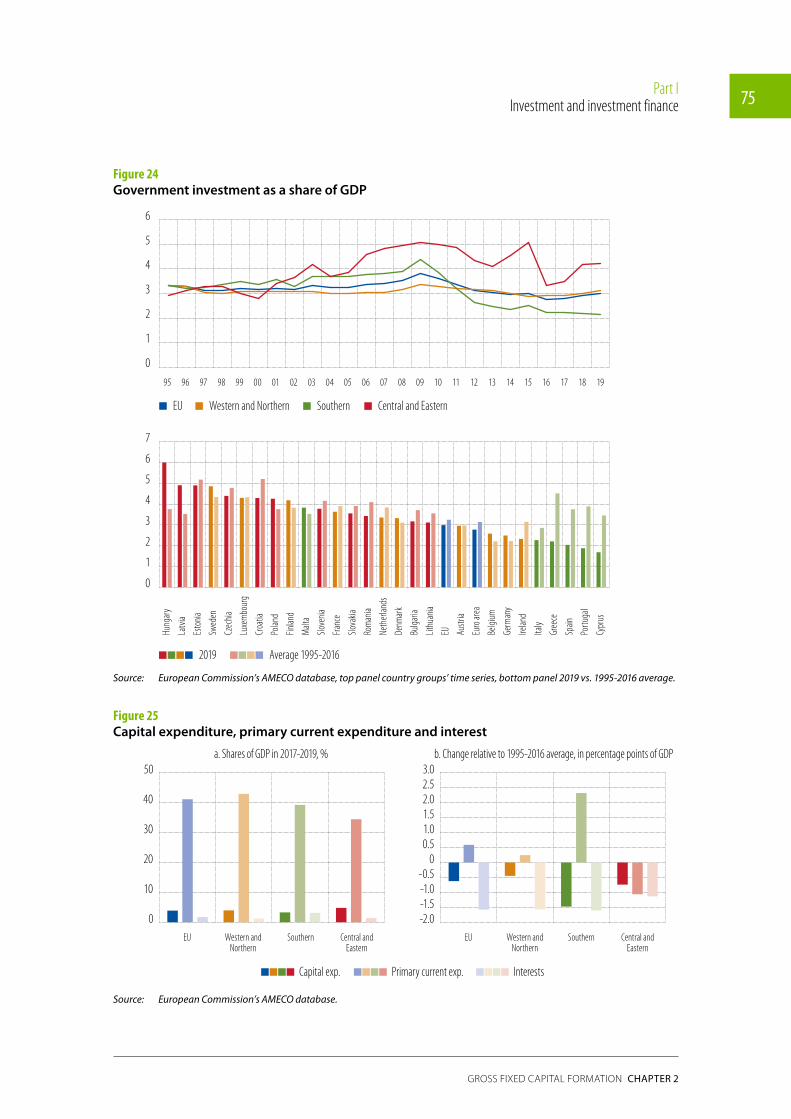
Government investmentGovernment investment showed a mild upward trend in the European Union before the coronavirus outbreak. as a share of GDp, government investment reached 3% in 2019 (from 2.8% in 2016, the lowest level in 25 years) compared with an average of 3.2% for 1995 to 2016. It increased in Western and Northern europe and in Central and eastern europe, but continued to decline slightly in Southern europe. In 2019, investment spending came to 4.2% of GDp in Central and eastern europe, 3.1% in Western and Northern europe and 2.2% in Southern europe. the low level of investment was fairly consistent across Southern europe, without major differences between countries, except Malta, which had a much higher share at 3.8%.13 the differences among countries in the other regions is much greater, ranging from 3.1% in Lithuania to 6% in hungary in Central and eastern europe, and from 2.3% in Ireland to 4.9% in Sweden for Western and Northern europe.
In the last three years, capital transfers and investment have fallen below the average witnessed in 1995-2016. Interest spending registered a larger drop, while primary current expenditure is higher than its historical average. this suggests that the wide reduction in the debt service burden has not translated into support for capital spending. the balance between current and capital expenditure, particularly in Southern europe, has tilted in favour of current spending.
13 The level was 1.7% in Cyprus, 1.9% in Portugal, 2.0% in Spain, 2.2% in Greece and 2.3% in Italy.
Part IInvestment and investment finance 75
Gross fixed capital formation Chapter 2
Figure 24Government investment as a share of GDP
EU
95 96 97 98 99 00 01 02 03 04 05 06 07 08 09 10 11 12 13 14 15 16 17 18 19
0
1
2
3
4
5
6
Hung
ary
Latv
ia
Esto
nia
Swed
en
Czec
hia
Luxe
mbo
urg
Croa
tia
Polan
d
Finlan
d
Malt
a
Slove
nia
Fran
ce
Slova
kia
Rom
ania
Neth
erlan
ds
Denm
ark
Bulga
ria
Lithu
ania
EU Austr
ia
Euro
area
Belgi
um
Germ
any
Irelan
d
Italy
Gree
ce
Spain
Portu
gal
Cypr
us
0
1
2
3
4
5
6
7
Western and Northern
2019 Average 1995-2016
Southern Central and Eastern
EU
95 96 97 98 99 00 01 02 03 04 05 06 07 08 09 10 11 12 13 14 15 16 17 18 19
0
1
2
3
4
5
6 Hu
ngar
y
Latv
ia
Esto
nia
Swed
en
Czec
hia
Luxe
mbo
urg
Croa
tia
Polan
d
Finlan
d
Malt
a
Slove
nia
Fran
ce
Slova
kia
Rom
ania
Neth
erlan
ds
Denm
ark
Bulga
ria
Lithu
ania
EU Austr
ia
Euro
area
Belgi
um
Germ
any
Irelan
d
Italy
Gree
ce
Spain
Portu
gal
Cypr
us0
1
2
3
4
5
6
7
Western and Northern
2019 Average 1995-2016
Southern Central and Eastern
Source: European Commission’s AMECO database, top panel country groups’ time series, bottom panel 2019 vs. 1995-2016 average.
Figure 25Capital expenditure, primary current expenditure and interest
0
10
20
30
40
50
EU Western andNorthern
Southern Central andEastern
EU Western andNorthern
Southern Central andEastern
Primary current exp.Capital exp. Interests
-2.0 -1.5 -1.0 -0.5
0 0.5 1.0 1.5 2.0 2.5 3.0
a. Shares of GDP in 2017-2019, % b. Change relative to 1995-2016 average, in percentage points of GDP
Source: European Commission’s AMECO database.
Part IInvestment and investment finance 76
INVESTMENT REPORT 2020/2021: BUILDING A SMART AND GREEN EUROPE IN THE COVID-19 ERA
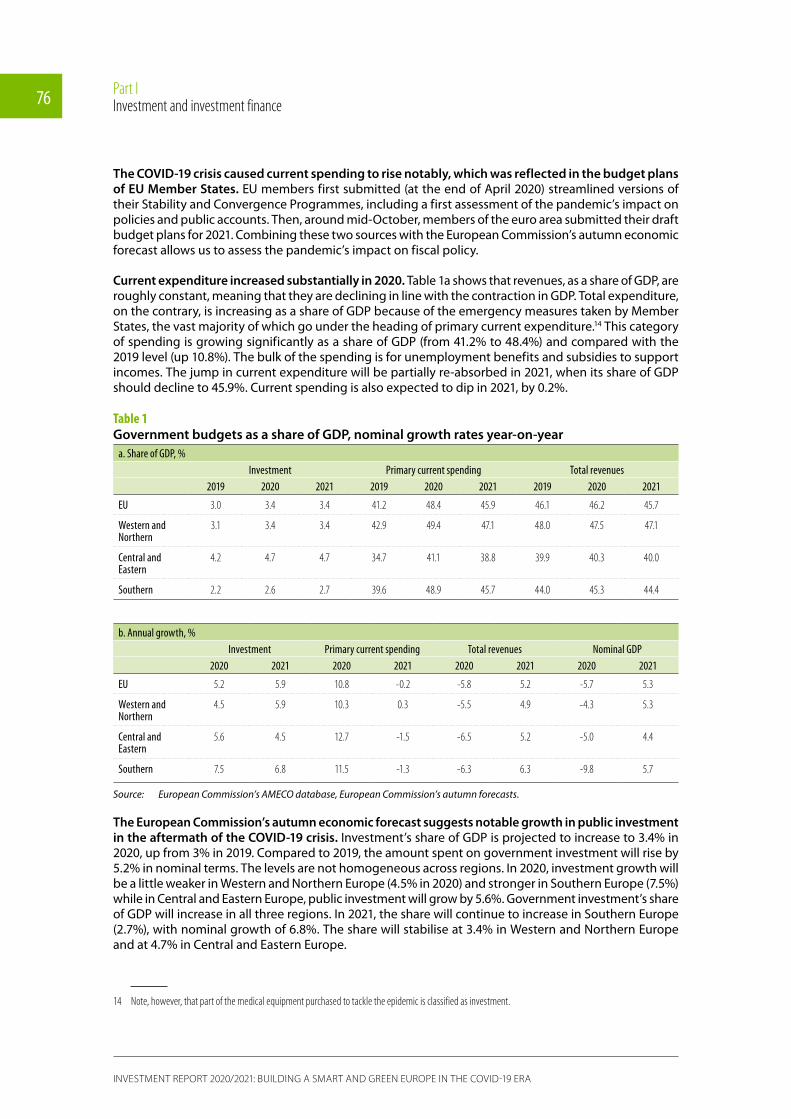
The COVID-19 crisis caused current spending to rise notably, which was reflected in the budget plans of EU Member States. eU members first submitted (at the end of april 2020) streamlined versions of their Stability and Convergence programmes, including a first assessment of the pandemic’s impact on policies and public accounts. then, around mid-October, members of the euro area submitted their draft budget plans for 2021. Combining these two sources with the european Commission’s autumn economic forecast allows us to assess the pandemic’s impact on fiscal policy.
Current expenditure increased substantially in 2020. table 1a shows that revenues, as a share of GDp, are roughly constant, meaning that they are declining in line with the contraction in GDp. total expenditure, on the contrary, is increasing as a share of GDp because of the emergency measures taken by Member States, the vast majority of which go under the heading of primary current expenditure.14 this category of spending is growing significantly as a share of GDp (from 41.2% to 48.4%) and compared with the 2019 level (up 10.8%). the bulk of the spending is for unemployment benefits and subsidies to support incomes. the jump in current expenditure will be partially re-absorbed in 2021, when its share of GDp should decline to 45.9%. Current spending is also expected to dip in 2021, by 0.2%.
Table 1Government budgets as a share of GDP, nominal growth rates year-on-year
a. Share of GDP, %Investment Primary current spending Total revenues
2019 2020 2021 2019 2020 2021 2019 2020 2021
EU 3.0 3.4 3.4 41.2 48.4 45.9 46.1 46.2 45.7
Western and Northern
3.1 3.4 3.4 42.9 49.4 47.1 48.0 47.5 47.1
Central and Eastern
4.2 4.7 4.7 34.7 41.1 38.8 39.9 40.3 40.0
Southern 2.2 2.6 2.7 39.6 48.9 45.7 44.0 45.3 44.4
b. Annual growth, %Investment Primary current spending Total revenues Nominal GDP
2020 2021 2020 2021 2020 2021 2020 2021
EU 5.2 5.9 10.8 -0.2 -5.8 5.2 -5.7 5.3
Western and Northern
4.5 5.9 10.3 0.3 -5.5 4.9 -4.3 5.3
Central and Eastern
5.6 4.5 12.7 -1.5 -6.5 5.2 -5.0 4.4
Southern 7.5 6.8 11.5 -1.3 -6.3 6.3 -9.8 5.7
Source: European Commission’s AMECO database, European Commission’s autumn forecasts.
The European Commission’s autumn economic forecast suggests notable growth in public investment in the aftermath of the COVID-19 crisis. Investment’s share of GDp is projected to increase to 3.4% in 2020, up from 3% in 2019. Compared to 2019, the amount spent on government investment will rise by 5.2% in nominal terms. the levels are not homogeneous across regions. In 2020, investment growth will be a little weaker in Western and Northern europe (4.5% in 2020) and stronger in Southern europe (7.5%) while in Central and eastern europe, public investment will grow by 5.6%. Government investment’s share of GDp will increase in all three regions. In 2021, the share will continue to increase in Southern europe (2.7%), with nominal growth of 6.8%. the share will stabilise at 3.4% in Western and Northern europe and at 4.7% in Central and eastern europe.
14 Note, however, that part of the medical equipment purchased to tackle the epidemic is classified as investment.

Part IInvestment and investment finance 77
Gross fixed capital formation Chapter 2
Governments are planning more investment to support the recovery, particularly in 2021. the expenditure targets included in the draft budget plans for 2021 submitted by euro area members suggest a more expansionary path, with a more prominent role for government investment. the largest differences between these plans and the european Commission’s forecasts of the target share of GDp for government investment are for Greece (6.6% vs. 4.1%), estonia (6.7% vs. 5.9%), Italy (3.4% vs. 2.7%), Slovenia (6.24% vs. 5.8%), Spain (2.8% vs. 2.4%) and France (4.2% vs. 3.9%). If achieved, these targets will imply notably stronger investment growth, particularly in Southern europe. For example, the Greek draft budget plan foresees an increase in the share of investment in GDp from 2.2% in 2019 to 3.6% in 2020 and 6.6% in 2021. those increases will bring the share of investment in GDp in Southern europe almost in line with the eU average (3.3% vs. 3.6%) in 2021.
Table 2Government investment: Draft budget plans and European Commission’s autumn economic forecast
Draft budget plans European Commission autumn economic forecastShare of GDP, % Change YoY, % Share of GDP, % Change YoY, %
2019 2020 2021 2020 2021 2019 2020 2021 2020 2021
EU 3.0 3.4 3.6 5.2 12.9 3.0 3.4 3.4 5.2 5.9
Western and Northern
3.1 3.4 3.5 4.5 8.9 3.1 3.4 3.4 4.5 5.9
Southern 2.2 2.6 3.3 7.5 32.8 2.2 2.6 2.7 7.5 6.8
Central and Eastern
4.2 4.7 4.8 5.6 5.4 4.2 4.7 4.7 5.6 4.5
Source: European Commission’s autumn economic forecast and euro area members’ draft budget plans.
The prospect of activating the Recovery and Resilience Facility and the Multiannual Financial Framework (MFF) for the 2021-2027 budget period is enabling Member States to focus on capital expenditure in their 2021 budgets. the european Union’s recovery programme allows for a longer-term perspective. Without it, the marked increase in public deficits may have reduced governments’ ability to support the recovery by spending on investment. this is particularly evident when comparing the draft budget plan submitted in October with the european Commission’s spring forecasts. aggregating the numbers shows that the planned increase in investment in 2021 is eUr 40 billion higher, with a share of GDp that is around 0.3% higher than in the forecast.15 Many draft budget plans include references to the rrF, a central pillar of the NextGenerationeU recovery programme, as a key factor in the medium term.
Some Member States have discussed or already approved plans that aim to support the economy amid the COVID-19 crisis. early June, Germany approved a large package worth eUr 52.8 billion for 2020-2021 that mainly consists of government investment. part of the package includes eUr 15 billion supporting e-mobility, eUr 11 billion for artificial intelligence, communication technologies and networks, and eUr 15.3 billion for the digitalisation of public administration and local authorities. Investment in hydrogen technology (eUr 9 billion) and r&D (eUr 2.3 billion) is also planned. France has designed a support package that includes eUr 4.6 billion for the aerospace industry, including military and civil security purchases, along with eUr 8 billion for the automotive sector and its supply chain. the Spanish government set eUr 1 billion aside for strengthening science, technology and innovation and established a regional fund for investments in education (eUr 2 billion) in addition to eUr 9 billion for healthcare spending. as part of their extraordinary measures, many countries allocated funds to shoring up the automotive industry, which remains the easiest way to stimulate demand and activate a large and mainly local production chain. this effort involves incentives for renewing vehicle fleets, favouring low-emission vehicles. the automotive initiative includes the european Union’s largest Member States, namely France, Spain, Germany and Italy.
15 Draft budget plans also suggest higher investment spending for 2020 but to a smaller extent (around 0.1% of GDP).

Part IInvestment and investment finance 78
INVESTMENT REPORT 2020/2021: BUILDING A SMART AND GREEN EUROPE IN THE COVID-19 ERA
In 2020-2021, a substantial increase in capital transfers will appear on many public sector balance sheets. Capital spending, which includes investment and capital transfers, is projected to show a massive increase in 2020. Many governments have allocated considerable resources to shore up firms. examples include the hardest-hit sectors, such as air transport, along with innovative firms or start-ups, firms in the utilities sector or, in general, “strategic” companies as shown in table 3. Not all of these funds will necessarily be used and, even if they are, the equity injections by governments will likely be only temporary as the shareholdings will be sold to private investors at a later date.
Table 3Programmes providing equity support for large, strategic firms or small businesses/startups
Large or strategic firms Small businesses
Germany 100 2
France 20 3.9
Spain 10
Denmark 1.3
Ireland 2
Italy 45 2
Source: Bruegel, Bank of Spain, IMF Policy Tracker16.
Figure 26Capital expenditure as a share of primary current expenditure, 2020-2021 change relative to 2017-2019 (percentage points)
-13 -12 -11 -10 -9 -8 -7 -6 -5 -4 -3 -2 -1 0 1 2 3
CY LV EL EE SK BE DK PL LT AT ES NL HU SE EU CZ
Euro
area RO FRDE FI LUIT SI PT HR BG IE MT
Western and Northern Southern Central and EasternSource: European Commission’s AMECO database and EIB staff calculations.
Policymakers should keep in mind that historically, government investment has tended to decline substantially following a surprise contraction in GDP (Box A). We argue that this time, the outcome should be different. as a share of GDp, government investment has approached a 25-year low following several years of fiscal consolidation in the wake of the global financial crisis. Infrastructure needs in many
16 Bruegel, The fiscal response to the economic fallout from the Coronavirus (Aug.2020); Bank of Spain DO 2019 Fiscal policy measures in response to the health crisis in the main euro area economies, the United States and the United Kingdom. IMF https://www.imf.org/en/Topics/imf-and-covid19/Policy-Responses-to-COVID-19.

Part IInvestment and investment finance 79
Gross fixed capital formation Chapter 2
european regions have been increasing after years of underinvestment (eIB, 2017; eIB, 2018). Furthermore, the biggest challenges for the future of the european Union – climate change and digitalisation – require even more government investment. at the same time, current ultra-low interest rates are allowing many governments to borrow very cheaply, easing fiscal constraints. recent high estimates of the impact of government investment on GDp lend further support for an increase (International Monetary Fund (IMF), 2020).
Fiscal sustainability issues, however, require a careful balance between taking on new debt and re-orienting government spending from current to capital expenditure. Low borrowing costs could quickly increase and force fiscal consolidation (Lian, presbitero and Wiriadinata, 2020). that said, sovereign borrowing costs are historically very low as a result of central-bank purchases of sovereign debt in most eU countries. theoretically, governments could lock in low interest rates for their bonds if they extended the maturity of their borrowing. however, investor demand for very long-term securities may be low.17 In addition, debt management offices tend to caution against varying long-established issuance patterns.18
17 For this reason, the United States shelved plans in February to issue 50-year Treasury bonds in February.18 “Modern monetary theory” questions whether concerns about fiscal sustainability are overdone. The idea is that governments would not have to repay their debt at
all as long as central banks monetise it. Inflation could be kept in check with countercyclical fiscal policy. Historical experience, however, shows that debt monetisation is accompanied by large fiscal deficits and high inflation.
Box AGovernment investment following recessions and fiscal consolidation
Contingent liabilities and fiscal deficits have climbed rapidly in most eU countries as economic activity collapsed and government support programmes were rolled out. In its 2020 spring forecast, the european Commission estimated that government debt to GDp in the european Union will likely increase by 15 percentage points to 94%. the increase varies substantially across Member States, from 3.4 percentage points in Luxembourg, the country with the third-lowest government debt, to 26.6 percentage points in Greece, the country with the highest (Figure a.1).
Figure A.1Increase in government debt, European Union in 2020
0 20 40 60 80 100 120 140 160 180 2000
5
10
15
20
25
30
Chan
ge in
gove
rnmen
t deb
t 201
9-20
20, p
ercen
tage p
oints
of GD
P
Government debt 2019, % GDP
IE
LU
DK
FR
CY
LV
DE AT HRRO
BG
FI
ES EL
BE
SI
NLEE
HU
IT
PT
LT
PL
MT
SE
SK
CZ
Source: AMECO database.

Part IInvestment and investment finance 80
INVESTMENT REPORT 2020/2021: BUILDING A SMART AND GREEN EUROPE IN THE COVID-19 ERA
Once the health and economic crises subside, countries will need to rebuild fiscal reserves to deal with future challenges, in particular ageing, structural change, and, in the longer term, climate change (see for instance european Commission, 2020).
Cuts to government investment played an outsized role in previous rounds of fiscal consolidation. Fiscal efforts often entailed a mix in spending cuts and increases in revenues, with increases in revenues playing a bigger part in large-scale consolidations (OeCD, 2011). In many countries, belt-tightening involved significant cuts to the largest expenditure items, such as public sector wages and social security spending. however, some expenditures suffered disproportionately. Government investment was sometimes cut vigorously, even though it generally comprises only about 5% of spending. For example, Blöchliger, Song and Sutherland (2012) find that government investment spending as a share of GDp was cut in half, on average, during 13 major rounds of consolidation over 1981-2000. the pressure on investment could be because those cuts encountered less political resistance than reductions in entitlements (for instance, Blöchliger et al., 2012).
In recent work, we find that the decline in investment following fiscal consolidation was not only large, but also long-lasting. We identify fiscal consolidation, following alesina and ardagna (2013), by sustained improvements of the cyclically adjusted primary balance. the estimation strategy is similar to rioja, rios-avila and Valev (2014): the deviation from the trend in the government investment rate is regressed on indicator variables, one for each year since the start of the fiscal consolidation, and a number of relevant controls. the cumulative sum of the coefficients on these indicator variables form the impulse response of government investment to the fiscal consolidation (Figure a.2). results illustrate the substantial and persistent effects of fiscal consolidation on government investment. after ten years, the cumulative decline in government investment is about 2 percentage points of GDp. put differently, ten years after the start of a round of fiscal consolidation, government investment remains, on average, 0.2 percentage points of GDp below the historic trend.
Figure A.2Deviation of government investment from trend (cumulative percentage points of GDp)
-3.5
-3.0
-2.5
-2.0
-1.5
-1.0
-0.5
0
1 2 3 4 5 6 7 8 9 10
95% confidence interval Cumulative decline 95% confidence interval
Source: EIB staff calculations.
Government investment also fluctuates significantly more than current expenditure over the business cycle, independently of fiscal consolidation. this suggests that governments find it easier to adjust
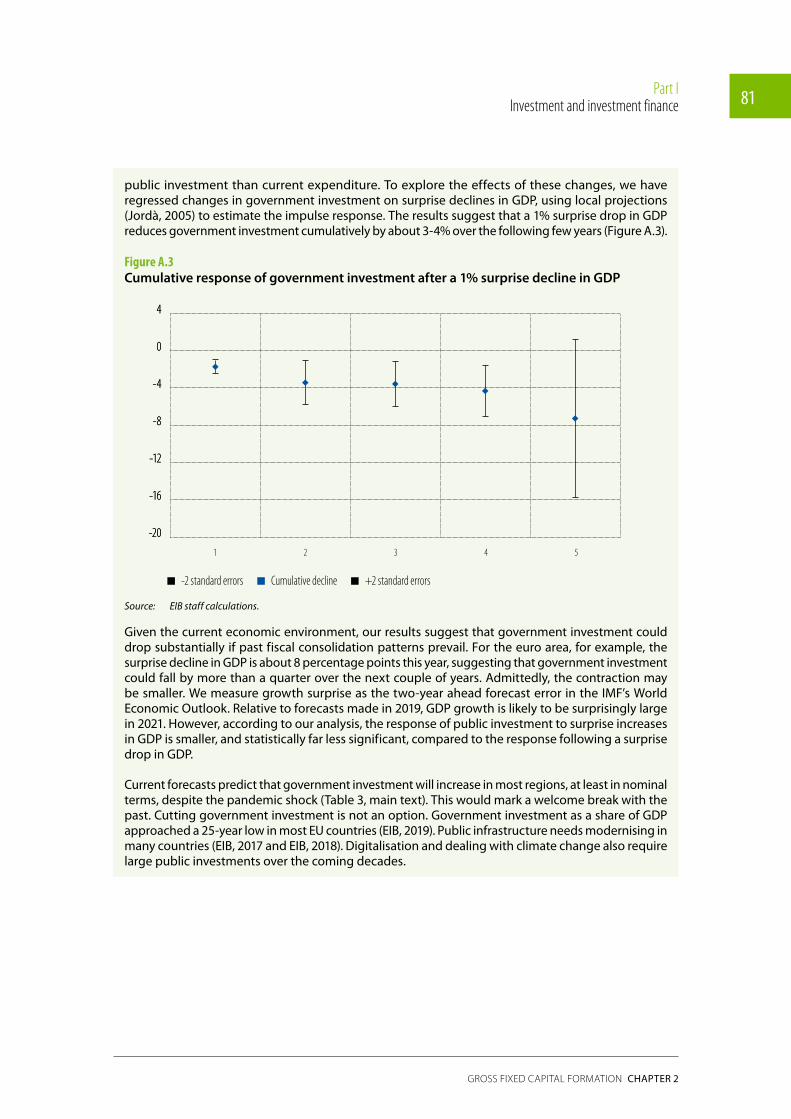
Part IInvestment and investment finance 81
Gross fixed capital formation Chapter 2
public investment than current expenditure. to explore the effects of these changes, we have regressed changes in government investment on surprise declines in GDp, using local projections (Jordà, 2005) to estimate the impulse response. the results suggest that a 1% surprise drop in GDp reduces government investment cumulatively by about 3-4% over the following few years (Figure a.3).
Figure A.3Cumulative response of government investment after a 1% surprise decline in GDP
-20
-16
-12
-8
-4
0
4
1 2 3 4 5
-20
-16
-12
-8
-4
0
4
-2 standard errors Cumulative decline +2 standard errors
Source: EIB staff calculations.
Given the current economic environment, our results suggest that government investment could drop substantially if past fiscal consolidation patterns prevail. For the euro area, for example, the surprise decline in GDp is about 8 percentage points this year, suggesting that government investment could fall by more than a quarter over the next couple of years. admittedly, the contraction may be smaller. We measure growth surprise as the two-year ahead forecast error in the IMF’s World economic Outlook. relative to forecasts made in 2019, GDp growth is likely to be surprisingly large in 2021. however, according to our analysis, the response of public investment to surprise increases in GDp is smaller, and statistically far less significant, compared to the response following a surprise drop in GDp.
Current forecasts predict that government investment will increase in most regions, at least in nominal terms, despite the pandemic shock (table 3, main text). this would mark a welcome break with the past. Cutting government investment is not an option. Government investment as a share of GDp approached a 25-year low in most eU countries (eIB, 2019). public infrastructure needs modernising in many countries (eIB, 2017 and eIB, 2018). Digitalisation and dealing with climate change also require large public investments over the coming decades.
Part IInvestment and investment finance 82
INVESTMENT REPORT 2020/2021: BUILDING A SMART AND GREEN EUROPE IN THE COVID-19 ERA
Conclusion and policy implicationsThe pandemic may continue to weigh on investment well after governments lift restrictive measures. With the partial economic rally of the third quarter of 2020 curtailed by a second wave of infections across the european Union, uncertainty about the pandemic and the economic recovery is running high. even if governments refrain from imposing too many restrictions, investment is unlikely to pick up.
The corporate sector needs creative measures. Whole industries are affected by the declining cash flows resulting from collapsed demand. Lower sales are depleting firms’ cash reserves and, ultimately, their capital and net worth. Some companies can endure a long period of subdued cash flows, because they have large cash buffers and good business prospects that allow them to borrow. the majority, however, will struggle to keep afloat and to invest to maintain competitiveness (see Chapter 3). Standard guarantee programmes and subsidised loans are only part of the solution for these companies, as they cannot take on more debt. Firms need fresh capital, but it will take time to be generated from retained earnings, if at all. Capital may also not be readily available from private investors either, given the size of the european private equity market. Government intervention, which includes providing equity or quasi-equity investments along with debt restructuring, would help significantly. a multitude of proposals are circulating about the right course to take, while maintaining appropriate incentives and reducing moral hazard (Blanchard, philippon and pisani-Ferry, 2020; Boot, et al., 2020).
The lift-off of infrastructure investment is at stake. It took five years of economic expansion for the growth rate in infrastructure investment to turn positive. Investment in 2019 was still well below the level seen in many countries before the global financial crisis.19 the resurgence was due to increased investment from both the private sector and the government. Sustained high levels of uncertainty, along with mounting government deficits, could derail infrastructure investment, however. policymakers need to focus on reassuring the private sector so that it will continue investing and implementing the current pipeline of planned infrastructure investment.
While government investment plans remain ambitious, past experience sounds a note of caution. the aggregate eU government deficit in the second quarter of 2020 was -11.4% of GDp. at the same time, government debt increased by 8.4 percentage points of GDp to 87.8% of GDp. the european Commission expects the ratio of government debt to GDp in the european Union to increase by a further 7.3 percentage points in 2020, before shedding 2 percentage points in 2021. While current market conditions, along with large-scale support from the european Central Bank, are conducive to increasing debt, history shows that markets can swing suddenly and may force through a round of fiscal consolidation. In the past, episodes of fiscal consolidation have been very detrimental to government investment. that said, the latest budgetary plans submitted by Member States to the european Commission provide some reassurance that governments are trying to avoid reducing their investments, at least for the time being.
19 Infrastructure investment rate here is the share of infrastructure investment in GDP.

Part IInvestment and investment finance 83
Gross fixed capital formation Chapter 2
Referencesalesina, a. and ardagna, S. (2013). “the Design of Fiscal adjustments.” In: J. r. Brown, Tax Policy and the Economy. University of Chicago press, pp. 19-67.
Bernanke, B. and Gertler, M. (1989). “agency Costs, Net Worth, and Business Fluctuations.” American Economic Review, Vol. 79(1), pp. 14-31.
Blanchard, O., philippon, t. and pisani-Ferry, J. (2020). “a New policy toolkit Is Needed as Countries exit COVID-19 Lockdowns.” policy Brief 20-8, peterson Institute for International economics.
Blöchliger, h., Song, D.-h. and Sutherland, D. (2012). “Fiscal consolidation: part 4. Case studies of large fiscal consolidation episodes.” OECD Economics Department Working Papers, eCO/WKp(2012)12.
Bloom, N. (2014). “Fluctuations in Uncertainty.” Journal of Economic Perspectives, Vol. 28(2), pp. 153–176.
Bloom, N., Bond, S. and van reenen, J. (2007). “Uncertainty and Investment Dynamics.” Review of Economic Studies, Vol. 74, pp. 391-415.
Boot, a., Carletti, e., Kotz, h.-h., Krahnen, J. p., pelizzon, L. and Subrahmanyam, M. (2020). “Corona and Financial Stability 3.0: try equity-risk Sharing for Companies, Large and Small.” SaFe policy letter No 81.
Butzen, p., Fuss, C. and Vermeulen, p. (2003). “the Impact of Uncertainty on Investment plans.” National Bank of Belgium: Working paper research 24.
european Commission (2020). “report on public Finances in eMU.” Brussels: european Commission.
european Investment Bank (2015). “Investment and Investment Finance in europe: Investing in Competitiveness.” Luxembourg: european Investment Bank.
european Investment Bank (2016). “Investment and Investment Finance in europe: Financing productivity Growth.” Luxembourg: european Investment Bank.
european Investment Bank (2017). Investment Report 2017/2018: from recovery to sustainable growth. Luxembourg: european Investment Bank.
european Investment Bank (2018). Investment Report 2018/2019: retooling Europe’s economy. Luxembourg: european Investment Bank.
european Investment Bank (2019). Investment Report 2019/2020: accelerating Europe’s transformation. Luxembourg: european Investment Bank.
Guiso, L. and parisi, G. (1999). “Investment and Demand Uncertainty.” Quarterly Journal of Economics, Vol. 114(1), pp. 185-227.
IMF (2020). “Fiscal Monitor: policies for the recovery.” Washington: International Monetary Fund.
Jordà, Ò. (2005). “estimation and Inference of Impulse responses by Local projections.” American Economic Review, Vol. 95(1), pp. 168-182.
Joseph, a., Kneer, C., van horen, N. and Saleheen, J. (2020). “all you need is cash: corporate cash holdings and investment after the financial crisis.” Bank of england Staff Working paper No. 843.

Part IInvestment and investment finance 84
INVESTMENT REPORT 2020/2021: BUILDING A SMART AND GREEN EUROPE IN THE COVID-19 ERA
Leahy, J. and Whited, t. (1996). “the effect of Uncertainty on Investment: Some Stylized Facts.” Journal of Money, Credit and Banking, Vol. 28(1), pp. 64-83.
Lian, W., presbitero, a. F. and Wiriadinata, U. (2020). “public Debt and r - g at risk.” IMF Working paper, No 20/137.
Maurin, L. and pal, r. (2020). “Investment vs Debt trade-off in the post-Covid-19 european economic Landscape.” Luxembourg: eIB Working paper.
Nickell, S. (1997). “Unemployment and Labor Market rigidities: europe versus North america.” Journal of Economic Perspectives, Vol. 11(3), 55-74.
OeCD (2011). “Fiscal Consolidation: targets, plans and Measures.” OECD Journal on Budgeting, Vol. 11(2).
rioja, F., rios-avila, F. and Valev, N. (2014). “the persistent effect of Banking Crises on Investment and the role of Financial Markets.” Journal of Financial Economic Policy, Vol. 6(1), pp. 64-77.
Table of contents
Executive summary
Introduction
Part I Investment and investment finance
1. The macroeconomic environment
2. Gross fixed capital formation
3. Financing corporate investment
Part II Investing in the transition to a green and smart economy
4. Tackling climate change: Investment trends and policy challenges
5. Climate change risks: Firms’ perceptions and responses
6. Leveraging the financial system to green the European economy
7. Intangible investment, innovation and digitalisation
8. Innovating for climate change: The green and digital twin transition
9. Infrastructure investment in the face of digital, climate and cohesion challenges
10. The impact of digitalisation and climate change policies on social cohesion
Data annex
Glossary of terms and acronyms