Channel Characteristics of Visible Light Communications within the Dynamic Indoor Environment
12
> REPLACE THIS LINE WITH YOUR PAPER IDENTIFICATION NUMBER (DOUBLE-CLICK HERE TO EDIT) < Abstract—Visible light communications (VLC) is a new emerging technology, which provides both data transmission and illumination by utilizing the visible range (370 – 780 nm) of the electromagnetic spectrum. In order to maximize the available data rate and enhance the user’s mobility within an indoor environment, it is essential to characterize the communication channel. In this paper we present both analytical and experimental results for a VLC system affected by movement of people for different indoor conditions (i.e. furnished office room, empty hall and corridor). VLC systems utilize multiple light- emitting diodes mounted in the ceiling and the configuration is based on the non-directed line of sight. We consider random movement of people within the room, focusing on the impacts of shadowing and blocking on mobility and link system performance by investigating changes in the channel characteristics using the cumulative distribution function of the Manuscript received August 14, 2014; revised XX; accepted YY. Date of publication ZZ; date of current version ZZ2. This joint research is supported by the EU COST ICT Action IC1101 Optical Wireless Communications: An Emerging Technology (OPTICWISE) and by the Grant Agency of the Czech Technical University in Prague, grant no. SGS14/190/OHK3/3T/13. P. Chvojka and S. Zvanovec are with the Department of Electromagnetic Field, Faculty of Electrical Engineering, Czech Technical University in Prague, Technicka 2, Prague 16627, Czech Republic (e-mail: [email protected]; [email protected]). P. A. Haigh and Z. Ghassemlooy are with the Faculty of Engineering and Environment, Northumbria University, Newcastle upon Tyne, NE1 8ST, U.K. (e-mail: [email protected]; [email protected]). received power distribution and the delay profile. We demonstrate the behaviour of communication channels for different scenarios from corridor, the most robust against people movement induced fading, to the office rooms and halls, the most vulnerable to the received power fluctuation. Index Terms — channel characterization, mobile indoor optics, visible light communications I. INTRODUCTION HE energy consumption at a global level in recent years has led to a new way of thinking in how we should use technologies (including the telecommunications and lighting) and come up with more ecologically and economically friendly solutions. Replacing incandescent light bulbs with more compact light- emitting diode (LED) based light sources is a simple and cost-effective way to reduce carbon emissions and increase the energy utilization efficiency on a global scale. LEDs have several advantages over incandescent and fluorescent lamps including multitude of colours, compactness, longer life expectancy, lower power consumption and higher energy conversion efficiency Error: Reference source not found. Moreover, they can be modulated at high-speed to provide data communications and illumination simultaneously - thus the name visible light communications (VLC) - a unique trait that will have a major impact in the T Channel Characteristics of Visible Light Communications within the Dynamic Indoor Environment Petr Chvojka, Stanislav Zvanovec, Senior Member, Paul Anthony Haigh, Member, Zabih Ghassemlooy, Senior Member 1
-
Upload
northumbria -
Category
Documents
-
view
1 -
download
0
Transcript of Channel Characteristics of Visible Light Communications within the Dynamic Indoor Environment

> REPLACE THIS LINE WITH YOUR PAPER IDENTIFICATION NUMBER (DOUBLE-CLICK HERE TO EDIT) <
Abstract—Visible light communications (VLC) isa new emerging technology, which provides bothdata transmission and illumination byutilizing the visible range (370 – 780 nm) ofthe electromagnetic spectrum. In order tomaximize the available data rate and enhancethe user’s mobility within an indoorenvironment, it is essential to characterizethe communication channel. In this paper wepresent both analytical and experimentalresults for a VLC system affected by movementof people for different indoor conditions(i.e. furnished office room, empty hall andcorridor). VLC systems utilize multiple light-emitting diodes mounted in the ceiling and theconfiguration is based on the non-directedline of sight. We consider random movement ofpeople within the room, focusing on theimpacts of shadowing and blocking on mobilityand link system performance by investigatingchanges in the channel characteristics usingthe cumulative distribution function of the
Manuscript received August 14, 2014; revised XX;accepted YY. Date of publication ZZ; date of currentversion ZZ2. This joint research is supported by theEU COST ICT Action IC1101 Optical WirelessCommunications: An Emerging Technology (OPTICWISE)and by the Grant Agency of the Czech TechnicalUniversity in Prague, grant no.SGS14/190/OHK3/3T/13.
P. Chvojka and S. Zvanovec are with the Departmentof Electromagnetic Field, Faculty of ElectricalEngineering, Czech Technical University in Prague,Technicka 2, Prague 16627, Czech Republic (e-mail:[email protected]; [email protected]).
P. A. Haigh and Z. Ghassemlooy are with theFaculty of Engineering and
Environment, Northumbria University, Newcastleupon Tyne, NE1 8ST, U.K. (e-mail:[email protected];[email protected]).
received power distribution and the delayprofile. We demonstrate the behaviour ofcommunication channels for different scenariosfrom corridor, the most robust against peoplemovement induced fading, to the office roomsand halls, the most vulnerable to the receivedpower fluctuation.
Index Terms — channel characterization, mobileindoor optics, visible light communications
I. INTRODUCTIONHE energy consumption at a globallevel in recent years has led to a new
way of thinking in how we should usetechnologies (including thetelecommunications and lighting) and comeup with more ecologically and economicallyfriendly solutions. Replacing incandescentlight bulbs with more compact light-emitting diode (LED) based light sourcesis a simple and cost-effective way toreduce carbon emissions and increase theenergy utilization efficiency on a globalscale. LEDs have several advantages overincandescent and fluorescent lampsincluding multitude of colours,compactness, longer life expectancy, lowerpower consumption and higher energyconversion efficiency Error: Referencesource not found. Moreover, they can bemodulated at high-speed to provide datacommunications and illuminationsimultaneously - thus the name visiblelight communications (VLC) - a uniquetrait that will have a major impact in the
T
Channel Characteristics ofVisible Light Communicationswithin the Dynamic Indoor
EnvironmentPetr Chvojka, Stanislav Zvanovec, Senior Member, Paul Anthony Haigh,
Member, Zabih Ghassemlooy, Senior Member
1

(c)(d)
Z
X
Y
> REPLACE THIS LINE WITH YOUR PAPER IDENTIFICATION NUMBER (DOUBLE-CLICK HERE TO EDIT) <
way we will use light in future Error:Reference source not found. In recentyears we have seen a growing interest inresearch and development in VLC at aglobal level [2, 3, 4]. Achieving higherdata rate transmission is one of the keyresearch challenges in VLC [5, 6].Concurrently, new technologies has emergedfor indoor VLC applications like organicLEDs (OLEDs) representing an alternativelight source to Ce:YAG/GaN LEDs, offeringlower cost, a range of flat panel shapesand sizes with much smoother lightingeffects due to the solution basedprocessing technology [7, 8]. VLC systems are expected to mainly be
utilized for the indoor environment.However they can also be used in outdoorenvironment to provide internet hot spotsusing street lighting and mobile access aspart of the 5G technology in highlycongested areas. In indoor applicationswith a static environment, which are themost common cases, VLC does offer highquality services. The analysis of thestatic optical wireless channel ispresented in [9], which investigates theeffects of multiple order reflections in arectangular room using Lambertianreflectors. The simulation was carried outfor several scenarios (different roomdimensions, source and receiver positionsand receiver parameters) and it was shownthat higher order reflections can be asignificant source of intersymbolinterference, thus resulting in adecreased bandwidth of the channel from 35MHz to 9 MHz. However, in dynamicenvironments (e.g., movement of people orobstacles) the communications link mayexperience temporarily blockage orshadowing, which must be addressed. Thetypical example of shadowing and blockingof the signal path for an office room usedin the simulation is depicted in Fig.1(a), while Fig. 1(b) illustrates all thenecessary dimensions for the obstacles.
Such situation results in reduced totalreceived power and temporal degradation ofthe channel parameters.
(a)
(b)
Fig. 1. (a) Example ofblocking/shadowing of the signal path, (b)dimensions of all obstacles within the officeroom and possible directions of the movement:(c) the office room and the empty hall room,and (d) the corridor
In Error: Reference source not found thevulnerability of a cellular and multi-spotdiffusing (MSD) multiple-input multiple-output architecture to shadowing wasinvestigated. The influence on thereceived signal by people either sittingor standing was analysed and it was found
LEDs
Y
XX
receive
2
> REPLACE THIS LINE WITH YOUR PAPER IDENTIFICATION NUMBER (DOUBLE-CLICK HERE TO EDIT) <
that the probability of shadowing was lessthan 2% in a typical office environment (3m height). The power penalty due toshadowing was insignificant in 99% of thesimulated cases. In Error: Referencesource not found the effect of shadowingon a VLC link utilizing several LEDs fordownlink transmission based on the timedivision multiple access was studied. Incontrast to the static behaviour as inError: Reference source not found, it wasfound that the performance of the link didimprove using 3 LEDs, which wereidentified as the optimal number of LEDfittings, when considering movement ofpeople inside the room. Such a system wasfound to be quite robust against theshadowing. The channel characteristics are changed
due to movement of people and thus whenthe link is temporarily blocked orshadowed the link experiences a muchreduced signal to noise (SNR) ratio at thereceiver. To address the shadowing problemand to enhance the user’s mobility, theconcept of a smart receiver was presentedin Error: Reference source not found andError: Reference source not found, basedon the introduction of additionalphotodetectors all with different viewingangles. Each detector receives a versionof the transmitted signal and the one withthe maximum strength is selected, whilethe others are discarded. The performanceof the receiver in Error: Reference sourcenot found was analysed for a small roomwith dimensions 2 m × 1.5 m × 1.2 m. Usingsuch a receiver, the theoretical maximumchannel capacity up to 666 Mbps with noequalization was reported. Anotherapproach adopted in Error: Referencesource not found used an adaptive receiverto improve the data rate (up to 140 Mbps)for both LOS and NLOS configurations at abit error rate (BER) of 10-9.In order to enhance the user’s mobility
one must investigate the illumination
level or the received power uniformity.For instance, in Error: Reference sourcenot found the focus was on LEDs beinglocated in the ceiling with a varyingreceiver field of view (FOV). It was shownthat uniform illumination can be achievedat the cost of illuminance power. The FOVwas the key parameter, since increasing itbeyond the limit would not result in anyfurther gain in mobility. A secondapproach proposed in Error: Referencesource not found used the evolutionaryalgorithm to drive the LEDs in order tooptimize the power coverage within theroom. In this scheme the dynamic signalpower range was reduced by up to 26.5%while keeping the BER < 10-6. A physicalmodel for a wireless indoor infraredsystem was analysed in Error: Referencesource not found based on simulation andmeasurement to predict the path loss andthe channel bandwidth. It was shown thatemploying moderate directivity (i.e. areduced FOV at the receiver and a narrowbeam at the transmitter) is sufficienteven for data rates beyond 100 Mbit/s.In this paper we extend parameterization
of the VLC channel parameters byconsidering the influence of the movementof people in three indoor scenarios; (i) afurniture equipped office room; (ii) anempty hall and (iii) a corridor. Inaddition we perform several laboratorymeasurements to support the analysiscarried out. For all scenarios we haveadopted the non-directed LOS linkconfiguration with multiple LEDs. Weanalyse changes in the power distributionand the delay profiles to address theparticularly shadowing due to people andmobility issues. The rest of the paper is organized as
follow: Section II describes theanalytical system model, model formovement of people and the results fromthe simulation, in Section III themeasurement campaign is given and finally
3
> REPLACE THIS LINE WITH YOUR PAPER IDENTIFICATION NUMBER (DOUBLE-CLICK HERE TO EDIT) <
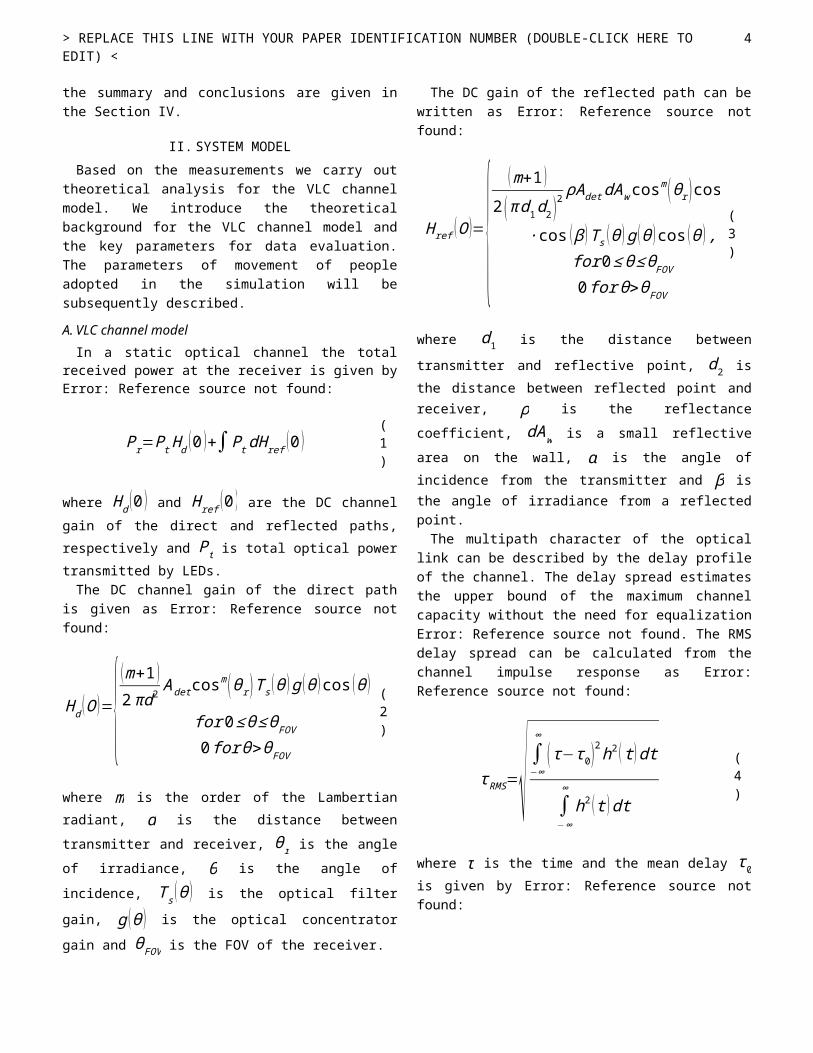
the summary and conclusions are given inthe Section IV.
II. SYSTEM MODELBased on the measurements we carry out
theoretical analysis for the VLC channelmodel. We introduce the theoreticalbackground for the VLC channel model andthe key parameters for data evaluation.The parameters of movement of peopleadopted in the simulation will besubsequently described.
A. VLC channel modelIn a static optical channel the total
received power at the receiver is given byError: Reference source not found:
Pr=PtHd (0 )+∫PtdHref (0 )(1)
where Hd (0 ) and Href (0 ) are the DC channelgain of the direct and reflected paths,respectively and Pt is total optical powertransmitted by LEDs.The DC channel gain of the direct path
is given as Error: Reference source notfound:
Hd (O )={(m+1 )2πd2
Adetcosm (θr )Ts (ϑ )g (ϑ )cos (ϑ )
for0≤ϑ≤ϑFOV0forϑ>ϑFOV
(2)
where m is the order of the Lambertianradiant, d is the distance betweentransmitter and receiver, θr is the angleof irradiance, ϑ is the angle ofincidence, Ts (ϑ ) is the optical filtergain, g (ϑ ) is the optical concentratorgain and ϑFOV is the FOV of the receiver.
The DC gain of the reflected path can bewritten as Error: Reference source notfound:
Href (O )={(m+1 )
2 (πd1d2 )2ρAdetdAwcosm (θr )cos (α )∙
∙cos (β )Ts (ϑ )g (ϑ )cos (ϑ ),for0≤ϑ≤ϑFOV0forϑ>ϑFOV
(3)
where d1 is the distance betweentransmitter and reflective point, d2 isthe distance between reflected point andreceiver, ρ is the reflectancecoefficient, dAw is a small reflectivearea on the wall, α is the angle ofincidence from the transmitter and β isthe angle of irradiance from a reflectedpoint.The multipath character of the optical
link can be described by the delay profileof the channel. The delay spread estimatesthe upper bound of the maximum channelcapacity without the need for equalizationError: Reference source not found. The RMSdelay spread can be calculated from thechannel impulse response as Error:Reference source not found:
τRMS=√∫−∞∞
(τ−τ0)2h2 (t)dt
∫−∞
∞h2 (t )dt
(4)
where τ is the time and the mean delay τ0is given by Error: Reference source notfound:
4

> REPLACE THIS LINE WITH YOUR PAPER IDENTIFICATION NUMBER (DOUBLE-CLICK HERE TO EDIT) <
τ0=∫−∞
∞
th2 (t)dt
∫−∞
∞h2 (t )dt
(5)
B. Mobility of people Since the VLC technology is mostly used
for indoor application, the movement ofpeople within a room will certainly affectthe channel characteristics and hence thelink performance. In our simulation wehave modelled the human body in the formof a rectangular shape object with theheight, width and depth of 1.8 m, 0.4 mand 0.2 m, respectively. The mobility interms of speed is chosen for each personrandomly within the range of 2 and 5 km/h(0.56 – 1.39 m/s). The body rotation isalso considered to be either 90° (back tothe source, worst case) or 0° (sideways tothe source, best case). We assume that people are randomly
distributed within the room at the startof our simulation. The number of people ischosen to follow approximately the samepeople density for different cases, i.e.0.16 people/m2 and 0.17 people/m2. Thelimitation was set by the maximum numberof people in a given office (in this case7). The position of each person is chosento be different and people are randomlymoved for 30 seconds. The movementduration is split into one secondintervals, where each person is moved bythe distance according to its speed (i.e.0.56 m for the shortest movement). Once aperson is moved, all the parameters suchas the received optical power and the RMSdelay spread are calculated and thepositions of all people are saved. Next werandomly selected the direction of nextmovement (see Fig. 1) and then movedaround the people. The whole process wasrepeated until the movement duration iscompleted. The direction probabilities are
1/8 for the office and the hall and 1/6for the corridor, respectively. Note thatfor the case of the corridor only 6directions (in contrast to the case of anempty hall and an office room) wereassumed in order to represent a morerealistic scenario. The simulation wascarried out for 3 different cases ofcorridor, furnished office room and emptyhall room, and assumed the same process ofpeople’s movement as described. The onlydifferent is in the office roomenvironment where the movement is limitedby the location of furniture (see Fig.1(a) and (b)). The NLOS link configurationis adopted for all VLC channels withmultiple LED sources, and the importantparameters used are listed in Table I. Theparameters are chosen to be consistentwith the data given in [1, 11, 12, 14,19]. Note that all the reflections areassumed to have a Lambertian pattern [20].In the simulation we only consider a
single reflection, beyond which thecomputation time is rather long. Thereason for this is that the contributionfrom second order reflection is ~0.7 dB.This is ~2% decrease in the receivedpower, which is not significant for thepractical systems point of view, and is ina good agreement with result outlined in[2].The power distribution and the RMS delay
spread are expressed in the form of CDF toprovide a statistical data. All the CDFfunctions and numerical results areobtained assuming the worst case, i.e.during the movement of people. All theparameters were determined as outlinedabove, and following the simulation theworst possible case was chosen torepresent a given scenario.
5

(b) (c)
(a)
> REPLACE THIS LINE WITH YOUR PAPER IDENTIFICATION NUMBER (DOUBLE-CLICK HERE TO EDIT) <
TABLE IPARAMETERS FOR THE SIMULATION
Parameter Symbol Value
Transmit power per LED - 10 mW
Size of LED array - 100 x 100 LEDsSemiangle at half
power φ1/2 80°
Receiver FOV ϑFOV90°
Optical filter gain Ts 1Optical concentrator
gaing 1
Photodetector area Adet 1 cm2
Reflectivity of walls ρ 0.8Receiver plane height
(hall, office /corridor)
- 0.8 / 1.3 m
Corridor 20 m × 3 m × 3 m
Room size Office 6 m × 7 m × 3 m
Hall 12 m × 8 m × 3 m
Corridor
[2.5, 1.5],[7.5, 1.5] [12.5, 1.5][17.5, 1.5]
Position of LEDs Office [2, 2], [4, 2] [2, 5], [4, 5]
Hall [4, 2], [8, 2] [4, 6], [8, 6]
Fig. 2. Movement map of people (percentageof the time when at least one person issituated inside the small area of size 1 m × 1m): (a) corridor, (b) furnished office room, and(c) empty hall
To illustrate the movement of the peoplewithin the room we have used the movementmap for all three scenarios (see Fig. 2).The room is divided into small areas ofsize 1 m × 1 m and every half a second theposition of each person is recorded. Thegenerated map shows the percentage ofmovement time when at least one person issituated within the small area. Equations(1) – (3) and (4) – (5) were used in thesimulations for the calculation of thereceived power and RMS delay spread,respectively.
C. Corridor The movement map for 10 people within
the corridor is depicted in Fig. 2(a). TheCDFs of the received power and the RMSdelay spread are illustrated in Figs. 3(a)and 3(b), respectively comparing cases
without and with people. The two cases arealmost equivalent with a minor differenceat lower received power levels and the RMSdelay spread.
(a) (b)
Fig. 3. Resulting CDF for the case of corridorwith and without people against: (a) thereceived power, and (b) the RMS delay spread
The differences are caused by thespecific orientation of the corridor (longand narrow) and the distribution of LEDlightings where there is a LOS path fromat least one source for most of the timeduring the movement. With the so-calledpeople density the CDF of the RMS delayspread is marginally shifted to the left(i.e. smaller delays). The reason is thatnot all signal components reflected from
6

(a)
> REPLACE THIS LINE WITH YOUR PAPER IDENTIFICATION NUMBER (DOUBLE-CLICK HERE TO EDIT) <
walls are received by the receiver sincesome are blocked by the people. Of courseas people move around within the corridorthe delay spread will vary.
D.Furnished office roomThe movement map considering 7 people in
an office room with furniture (Fig. 1) isdepicted in Fig. 2(b). The CDFs of thereceived power and the RMS delay spreadare illustrated in Figs. 4(a) and 4(b),respectively. In comparison to theprevious case, a larger difference isobserved with no people and with sevenpeople (i.e., people density > 0.17people/m2). The cumulative probability ofthe received power differs by up to 7%,whereas the cumulative probability of thedelay spread differs by up to 10%. Bothvalues are higher in comparison to thecorridor case. The insets in both figuresillustrates the arrangement of people.
E. The empty hallFig. 2(c) illustrates the movement map
when considering 15 people inside an emptyhall. The cumulative distributionfunctions of the analysed received powerand the RMS delay spread are depicted inFigs. 5(a) and 5(b), respectively. It canbe seen that the cumulative probabilitiesof the received power and the RMS delayspread differ by up to 5% for both cases,which is lower when compared to thefurnished office room.
(a)
(b)
Fig. 4. Resulting CDF for the case of officeroom with and without people against: (a) the
received power, and (b) the RMS delay spread
Fig. 5. Resulting CDF for the case of emptyhall with and without people against: (a) thereceived power; (b) RMS delay spread
As people move within a room, the RMSdelay spread changes becoming highcompared to an empty room with no people.To illustrate this, we have selected theworst case after the movement of peopleand the area of the room, where the RMSdelay spread is high, is determined andcompared to the empty room. Fig. 6illustrates the measured maximumpercentage of area with increased valuesof RMS delay for three cases of corridor,office and hall with and without people’smovement. For all three cases the plotsdisplay a positive linear trend, with thepeople density in the hall environmentdisplaying the highest profile with amaximum of 6.51% at the people density~0.16 people/m2 compared to 2% and 3.4%for the corridor and office environments,
7

a) (a) (b)
> REPLACE THIS LINE WITH YOUR PAPER IDENTIFICATION NUMBER (DOUBLE-CLICK HERE TO EDIT) <
respectively. The inset in Fig. 6illustrates example of the impulseresponse for the office room as denoted.The channel bandwidth is also affected bythe movement of people. Considering thehighest people density in our simulation,the bandwidth reduced from 31 MHz to 27MHz, 25 MHz to 19 MHz and 17 MHz to 11 MHzfor the corridor, office room and hall,respectively, which corresponds to thosein [9].
Fig. 6. Comparison of the maximum percentageof the room area with the increased RMS delayagainst the people density for corridor,office and hall environments
III. MEASUREMENTAn experimental system in the form of an
optical room was devised to demonstrateand evaluate the VLC with shadowing andmobility issues. The optical room hasdimensions of 1.75 m × 1.55 m × 1.95 m andwas fitted with 16 LEDs (Philips LuxeonRebel white phosphor LEDs) arranged intofour independent clusters consisting of a2 × 2 LED array acting as a single source(see Fig. 7(a)). The optical transmitpower of each individual LED was 175 mW ata bias current of 350 mA. The receivedpower was measured using the Thorlabsdigital power meter PM100D with thephotodiode power sensor S120VC. Thereceiving plane was divided into a 0.10 m× 0.10 m grid, 1.95 m below thetransmitters. The centre point of the grid
was aligned directly over the centre ofthe four transmitters (with Cartesiancoordinates of [0, 0]). The optical powerwas measured in each square of the grid.We randomly placed obstacles representingpeople (with the width and height of~0.2 m and 0.8 m, respectively, see Fig.7(b)) into several schemes within the roomand used different walls coverings(reflective or absorptive) and measuredthe optical power distributions. Theentire experiment was carried out based ona series of static measurements. Thepositions of obstacles were changedaccordingly to the people’s movementprocess. The sizes of objects were chosento maintain the same ratio of the roomheight to the human height to the receiverplane height as in the simulation.
(a)
(b) Fig. 7. The optical room: (a) an array of LEDtransmitters, and (b) the floor plan andobstacles
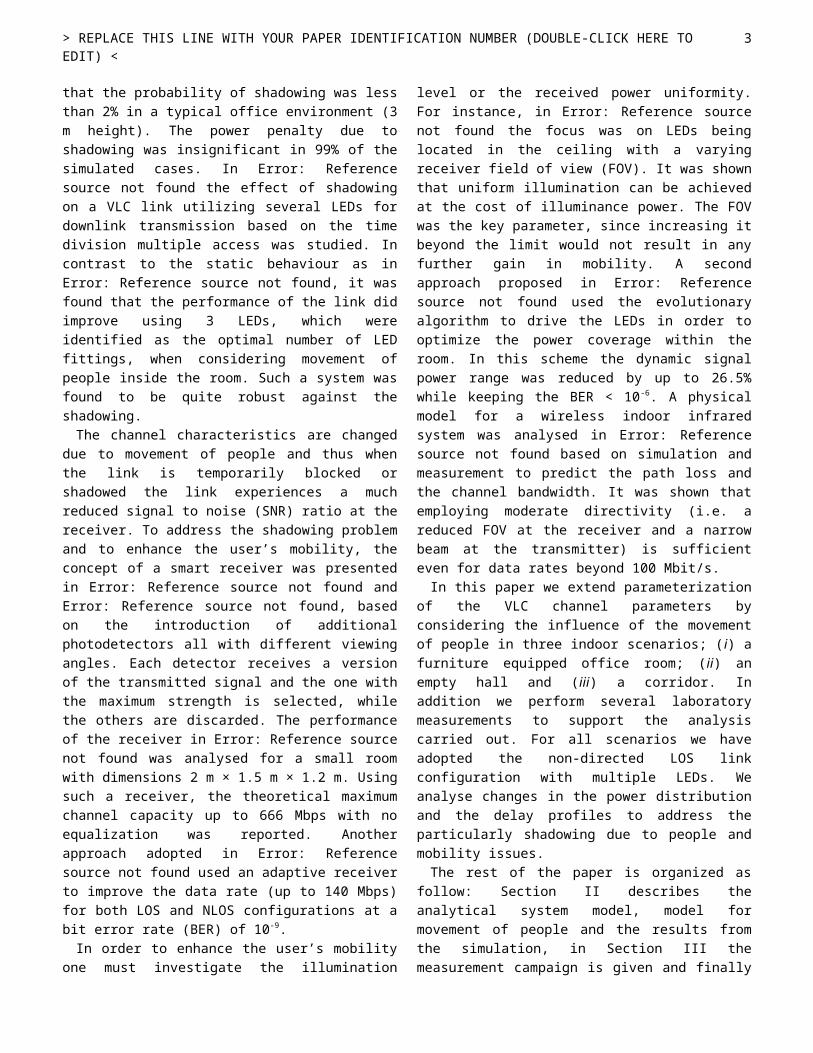
Fig. 8 shows the normalized receivedoptical power distribution along thereceiver plan with no shadowing orblocking and with one, two and threeobstacles. The results demonstrate andconfirm a lighting footprint spanning over1 m2 for satisfying the ISO standardrequirement of 400 lux for illuminationwithin an office environment when there isno shadowing [19]. With shadowing asexpected the luminance level drops by ~10
Fig. 9: Resulting CDF against: (a) thenormalized received power for a range ofpeople’s density. Note, that all walls werecovered with a black material, and (b) the
8

> REPLACE THIS LINE WITH YOUR PAPER IDENTIFICATION NUMBER (DOUBLE-CLICK HERE TO EDIT) <
dB. The measured power distributions wereused to clarify the simulation modeladopted the results achieved. Forscenarios shown in Fig. 8 the deviationsbetween measured and simulated data are(a) 0.08 – 0.4 dB, (b) 0.3 – 1.1 dB, (c)0.33 – 1.15 dB, (d) 0.5 – 1.25 dB. Thedeviations are due to irregular shape ofthe obstacles and the limited number ofreflections considered in the simulation.Such differences are acceptable and in agood agreement with the model used in thesimulation.
Fig. 8. Normalized received optical powerdistribution measured in the optical room: (a)no shadowing, (b) one obstacle, (c) twoobstacles, and (d) three obstacles. Note thez-axis in the top left figure is not constantwith the remaining figures to give the maximumpossible resolution.
Fig. 10. PDF as a function of the normalizedreceived power with and without people andwith Rayleigh distribution fitting. All wallswithin the room were covered by blankets
The cumulative probability as a functionof the normalized received power isillustrated in Fig. 9(a) with and withoutobstacles. In order to maintain areference case, all walls were coveredwith an absorptive black material. Thecumulative probability shows anexponential profile for all cases. At thenormalized received power level of -2 dBmthe cumulative probability increases by~35 % for the people density of1.11 people/m2 when compared to the casewithout people.Fig. 9(b) illustrates the cumulative
probability versus the normalized receivedpower for the people density of0.74 people/m2 and with walls beingcovered and then uncovered. The cumulativeprobability increases by ~23% at thenormalized received power level of -2 dBmfor the case of 3 walls uncovered whencompared to the covered walls. In the casewhere all walls are covered, the receivedpower in the optical room varies over 16dB, which is approximately 10 dB higherthan the case with all walls uncovered.The measured results are in a goodagreement with the simulation (standarddeviation up to approximately 1.3 dB). Allthe curves follow same trend as expected.
(c) (d)
(a) (b)
9

> REPLACE THIS LINE WITH YOUR PAPER IDENTIFICATION NUMBER (DOUBLE-CLICK HERE TO EDIT) <
Note, that people density was higher thanin the simulation model.The measured probability density
function of the normalized received poweris depicted in Fig. 10 with and withoutpeople, which follows Rayleighdistribution given by [22]:
p (x)= xσ2 exp(−x2
2σ2 ) (6)
where represents the scale parameter.With higher people density of 1.11people/m2 the probability density hassignificantly decreased showing a Rayleighdistribution profile with the scaleparameter of 1.77. Note that for thecase of an empty room the distributioncorrespond to the Rayleigh distributionwith of 0.98. Table II summarisedevolution of the scale parameter withincreasing people density in the room.
TABLE IISCALE PARAMETER FOR DIFFERENT DENSITY OF PEOPLE
People density [people/m2] Scale parameter σ
Empty room 0.980.37 1.330.74 1.571.11 1.77
IV. CONCLUSIONIn this paper, for the first time we
have investigated the VLC systemperformance considering peoples movementand have provided experimental results forthe CDF of the received power and the RMSdelay spread for three different indoorscenarios (i.e., corridor, the furnitureoffice room and the empty hall). We showedthat in the furniture office environment(people density > 0.16 people/m2 ) the CDFof the received power differs in the worstcase by up to 7%. On the other hand thehighest RMS delay spread of 6.5% incomparison to the case with no people was
observed for the empty hall. The resultsshowed that the corridor with the maximumRMS delay of 2% at the people density >0.16 people/m2 is the most robust againstthe people’s movement compared to othertwo where the problem of shadowing orblockage could be readily avoided. Themeasurement results presented correspondwell with the simulated data, thedifferences in the received power can bereduced significantly by using morereflective wall surfaces. Based on themeasurement we plotted the PDF as afunction of the normalized received powershowing similar profile to Rayleighdistribution with the scale parametervarying from 0.98 to 1.79 from an empty toa crowded room. Our paper therefore hasshown that the VLC system is robust as anindoor communications technology, offeringexcellent mobility even under highpeople’s density.The measurement results correspond well
with the simulated results and thedifferences in the received power can bereduced significantly by using morereflective wall surfaces.Our paper shows that VLC technology is
robust as an indoor communicationstechnology, offering excellent mobilityeven when considering a room with highpeople density.
REFERENCES REFERENCES[1] Z. Ghassemlooy, W. Popoola, and S. Rajbhandari,Optical Wireless Communications. Boca Raton, FL, USA:Taylor & Francis, 2012.[2] T. Komine and M. Nakagawa, “Fundamental analysisfor visible-light communication system using LEDlights,” IEEE Trans. Consum. Electron., vol. 50, no. 1, pp.100–107, Feb. 2004.[3] J. Boyd, “Let there be (a new kind of) light[NEWS],” IEEE Spectr., vol. 44, no. 7, pp. 12–14, Jul.2007.[4] J. Armstrong, Y. Sekercioglu, and A. Neild,“Visible light positioning: Aroadmap for international standardization,” IEEECommun. Mag., vol. 51, no. 12, pp. 68–73, Dec. 2013.
10

> REPLACE THIS LINE WITH YOUR PAPER IDENTIFICATION NUMBER (DOUBLE-CLICK HERE TO EDIT) <
[5] D. Tsonev, S. Hyunchae Chun, J. J. D.Rajbhandari, S. McKendry, E. Videv, M. Gu, S. Haji,A. E. Watson, G. Kelly, M. D. Faulkner, H. Dawson,D. Haas, and O’Brien, “A 3-Gb/s single-LED OFDM-based wireless VLC link using a Gallium nitrideLED,” IEEE Photon. Technol. Lett., vol. 26, no. 7, pp. 637–640, Apr. 1, 2014.[6] G. Cossu, A. Khalid, P. Choudhury, R. Corsini,and E. Ciaramella, “3.4 Gbit/s visible opticalwireless transmission based on RGB LED,” Opt. Exp.,vol. 20, pp. B501–B506, 2012.[7] P. A. Haigh, F. Bausi, Z. Ghassemlooy, I.Papakonstantinou, and H. L. Minh, “Visible lightcommunications: Real time 10 Mb/s link with a lowbandwidth polymer light-emitting diode,” Opt. Exp.,vol. 22 no. 3, pp. 2830–2838, 2014.[8] P. A. Haigh, F. Bausi, T. Kanesan, S. T. Le, S.Rajbhandari, Z. Ghassemlooy, I. Papakonstantinou,W.Popoola, A. Burton, H. Le Minh, W. P. Ng, A. D.Ellis, and F. Cacialli, “A 20 Mb/s VLC Link with apolymer LED and a multi-layer perceptron equalizer,”IEEE Photon. Technol. Lett., vol. 26, no. 19, pp. 1975–1978,Oct. 2014.[9] J. R. Barry, J. M. Kahn, W. J. Krause, E. A.Lee, and D. G. Messerschmitt, “Simulation ofmultipath impulse response for indoor wirelessoptical channels,” IEEE Sel. Areas Commun., vol. 11, no.3, pp. 367–379, Apr. 1993.[10] S. Jivkova, Kavehrad,Mohsen, “Shadowing andblockage in indoor optical wireless communications,”in Proc. IEEE Global Telecommun. Conf.,Dec. 1–5, 2003, vol.6, pp. 3269–3273.[11] T. Komine and M. Nakagawa, “A study ofshadowing on indoor visiblelight wirelesscommunication utilizing plural white LED lightings,”in Proc. 1st Int. Symp. Wireless Commun. Syst., Sep. 20–22,2004, pp. 36–40.[12] A. Burton, H. Le-Minh, Z. Ghassemlooy, S.Rajbhandari, and P. A. Haigh, “Smart receiver forvisible light communications: Design and analysis,”in Proc. 8th Int. Symp. Commun. Syst., Netw. Digit. Signal Process.,Jul. 18–20, 2012, pp. 1–5.[13] A. Burton, H. Le-Minh, Z. Ghassemlooy, S.Rajbhandari, and P. A. Haigh, “Performance analysisfor 180 receiver in visible light communications,”in Proc. 4th Int. Conf. Commun. Electron., Aug. 1–3, 2012, pp.48–53.[14] M. Biagi, T. Borogovac, and T. D. C. Little,“Adaptive receiver for indoor visible lightcommunications,” J. Lightw. Technol., vol. 31, no. 23, pp.3676–3686, Dec. 1, 2013.[15] A. Burton, H. Le Minh, Z. Ghasemlooy, and S.Rajbhandari, “A study ofLED lumination uniformity with mobility for visiblelight communications,”in Proc. Int. Workshop Opt. Wireless Commun., Oct. 22–22,2012, pp. 1–3.[16] J. Ding, Z. Huang, and Y. Ji, “Evolutionaryalgorithm based power coverageoptimization for visible light communications,” IEEECommun. Lett., vol. 16, no. 4, pp. 439–441, Apr. 2012.
[17] V. Jungnickel, V. Pohl, S. Nonnig, and C. VonHelmolt, “A physical model of the wireless infraredcommunication channel,” IEEE Sel. Areas Commun.., vol.20, no. 3, pp. 631–640, Apr. 2002.[18] J. M. Kahn and J. R. Barry, “Wireless infraredcommunications,” Proc. IEEE, vol. 85, no. 2, pp. 265–298, Feb. 1997.[19] C. R. Lomba, R.T. Valadas, and A. M. Duarte,“Efficient simulation of the impulse response of theindoor wireless optical channel,” Int. J. Commun.Syst., vol. 13, pp. 537–549, 2000.[20] N. Hayasaka and T. Ito, “Channel modeling ofnondirected wireless infrared indoor diffuse link,”Electron. Commun. Jpn., vol. 90, pp. 9–19, 2007.[21] D. Dilaura, K. Houser, R. Mistrick, and G.Steffy, IES lighting handbook:Illumination engineering, 2011.[22] C. Forbes, M. Evans, N. Hastings, and B.Peacock, Statistical Distributions, 4th ed. Hoboken, NJ,USA: Wiley, pp. 173–175.Petr Chvojka was born in 1987. He received the M.Sc.degree from the Czech Technical University, Prague,Czech Republic, in 2013, where he is currentlyworking toward the Postgraduation degree. He iscurrently a Researcher at the Department ofElectromagnetic Fields, Czech Technical University,where he is a Member of a Free-Space and FiberOptics Team. His research interests include visiblelight communications, OLED technologies, andwireless optical communications.
Stanislav Zvanovec received the M.Sc. and Ph.D.degrees from the CzechTechnical University, Prague, Czech Republic, in2002 and 2006, respectively. He is currently a FullProfessor and a Vice-Head at the Department ofElectromagnetic Field, Faculty of ElectricalEngineering, Czech Technical University, where heleads a Free-Space and Fiber Optics Team, Faculty ofElectrical Engineering, and several researchprojects. His current research interests includewireless optical communications, visible lightcommunications, remote sensing, and optical fibersensors.
Paul Anthony Haigh (M’10–S’11-14–M’15) received thePh.D. degree inthe area of optical wireless communications fromNorthumbria University,Newcastle upon Tyne, U.K., in 2014. He is currentlya Research Associate with the High PerformanceNetworks Group, University of Bristol, Bristol,U.K., working on the EPSRC TOUCAN Project. Hisresearch interests include adaptive and programmablereal-time seamless interfaces between wireless andwired multitechnology networks. He has publishedmore than 20 scholarly articles including 13articles in high ranking journals. In 2010, hereceived the prestigious Marie Curie Fellowship atthe European Organization for Nuclear Research(CERN), where he worked on the optoelectronic linksin large hadron collider experiments.
11

> REPLACE THIS LINE WITH YOUR PAPER IDENTIFICATION NUMBER (DOUBLE-CLICK HERE TO EDIT) <
Zabih Ghassemlooy CEng. received the B.Sc.(Hons)degree in electrical and electronics engineeringfrom the Manchester Metropolitan University,Manchester, U.K., in 1981, and the M.Sc. and Ph.D.degrees in optical communications from theUniversity of Manchester Institute of Science andTechnology (UMIST), Manchester, in 1984 and 1987,respectively. From 1986 to 1987, he was with UMIST,and from 1987 to 1988, he was a PostdoctoralResearch Fellow at the City University, London, U.K.In 1988, he joined Sheffield Hallam University as aLecturer, become a Professor in opticalcommunications in 1997. From 2004 to 2012, he was anAssociate Dean for Research (ADR) in the School ofComputing, Engineering, and from 2012 to 2014, ADRfor Research and Innovation with the Faculty ofEngineering and Environment, Northumbria University,Newcastle, U.K. He has been a Visiting Professor ata number of institutions and he is currently at theUniversity Tun Hussein OnnMalaysia. He is currentlythe Head of the Northumbria Communications ResearchLaboratories within the Faculty. His researchinterests include optical wireless communications,visible light communications, and radio overfibre/free-space optics, supported by researchgrants from various funding bodies. He hassupervised a large number of Ph.D. students, lessthan 49, and published more than 560 papers, 195 injournals and four books, and presented more than 60keynote and invited talks. He is a Coauthor of“Optical Wireless Communications Systems and Channel ModellingWith Matlab (Boca Raton, FL, USA: CRC Press, 2012); aCoeditor the “Analogue Optical Fibre Communications”(London, U.K.: IET, 1995). He is the Editor-in-Chief of the International Journal of Optics and Applications,and British Journal of Applied Science and Technology. From 2004-06, he was the IEEE U.K./IR Communications ChapterSecretary, the Vice-Chairman from 2004 to 2008, theChairman from 2008 to 2011, and Chairman
12