Changes in the spatial structure of strong and moderate El Niño events under global warming
7
INTERNATIONAL JOURNAL OF CLIMATOLOGY Int. J. Climatol. 34: 2834–2840 (2014) Published online 30 November 2013 in Wiley Online Library (wileyonlinelibrary.com) DOI: 10.1002/joc.3876 Short Communication Changes in the spatial structure of strong and moderate El Ni ˜ no events under global warming Sang-Wook Yeh, a * Hera Kim, a MinHo Kwon b and Boris Dewitte c a Department of Marine Sciences and Convergent Technology, Hanyang University, Ansan, Korea b Korea Institute of Ocean Science and Technology, Ansan, Korea c LEGOS, Toulouse, France ABSTRACT: In this study, we examine how the spatial structures of strong and moderate El Ni˜ no events have changed due to global warming using the Coupled Model Intercomparison Project Phase 5 (CMIP5) coupled general circulation models (CGCMs) based on a historical run and a Representative Concentration Pathways (RCP)4.5 run. The centre of the maximum anomalous sea surface temperature (SST) in the moderate El Ni˜ no has shifted significantly westward from the historical run to the RCP4.5 run; however, this is not seen with the strong El Ni˜ no events. Further analysis indicates that the centre of the maximum anomalous SST in the moderate El Ni˜ no with a negative Pacific Decadal Oscillation (PDO) phase shifted westward around the international dateline from the historical run to the RCP4.5 run. This is in contrast to the moderate El Ni˜ no, which shows a positive PDO phase. We also briefly discuss a possible mechanism on the change in the spatial structure of moderate El Ni˜ no with a negative phase of PDO from the historical run to the RCP4.5 run. KEY WORDS ElNi˜ no; Pacific Decadal Oscillation; global warming; spatial structure Received 19 April 2013; Revised 16 September 2013; Accepted 22 October 2013 1. Introduction One of the most critical issues concerning climate change is that of El Ni˜ no-Southern Oscillation (ENSO) diversity, specifically, the ENSO properties, which include the amplitude, frequency and spatial pattern, and diversity changes on decadal-to-multidecadal timescales (Gu and Philander, 1995; Wang and Wang, 1996; Stahle et al., 1998; Cobb et al., 2003; D’Arrigo et al., 2005; Li et al., 2011). Among these, most recent studies have focused on the changes of the ENSO spatial structures in the tropical Pacific basin. It has been suggested that there exist two different types of El Ni˜ no events in the tropical Pacific (e.g. Trenberth and Stepaniak 2001; Larkin and Harrison 2005; Yu and Kao 2007; Ashok et al., 2007a, 2007b; Kao and Yu 2009; Kug et al., 2009). We refer here to the conventional El Ni˜ no, in which the centre of the maximum anomalous sea surface temperature (SST) is located in the eastern Pacific, as an Eastern Pacific (EP) El Ni˜ no and the non-conventional El Ni˜ no, in which the centre of the maximum anomalous SST is located in the central Pacific, as a Central Pacific (CP) El Ni ˜ no. In addition, several studies have showed that CP El Ni˜ no events occur more frequently with intensified *Correspondence to: S.-W. Yeh, Department of Marine Sciences and Convergent Technology, Hanyang University, Ansan, Korea. E-mail: [email protected] amplitudes during recent decades (Yeh et al., 2009; Lee and McPhaden 2010). There exist several reasons why changes in the spatial structure of El Ni˜ no events matter. The climate impacts due to the shift of the centre of the maximum anomalous SST (e.g. EP El Ni˜ no vs CP ElNi˜ no) can be distinctly different across the globe because of atmospheric tele- connections (Yeh et al., 2009; Song et al., 2011; Graf and Zanchettin 2012; Yoon et al., 2012; Yu et al., 2012; Yuan and Yang, 2012). Therefore, a detailed investiga- tion of ENSO diversity in warmer climates is useful for documenting and interpreting its distinct remote effects. Using the Coupled Model Intercomparison Project Phase 3 (CMIP3) coupled general circulation models (CGCMs) datasets, former studies showed that the fre- quency of CP El Ni˜ no events increase under global warming, perhaps due to changes in the tropical Pacific mean state, including changes in the thermocline depth (Yeh et al., 2009). Using preindustrial and historical simulations with Representative Concentration Pathways (RCP)4.5 simulations based on the ensemble means of the CMIP5 CGCMs, Kim and Yu (2012) also determined that the ratio of CP and EP ENSO intensity has increased in recent years. Both studies concluded that the inten- sity and frequency of CP El Ni˜ no events have increased because of global warming. However, they note that both CMIP3 and CMIP5 are unable to correctly reproduce the EP and CP El Ni˜ no intensities as compared with actual 2013 Royal Meteorological Society
Transcript of Changes in the spatial structure of strong and moderate El Niño events under global warming

INTERNATIONAL JOURNAL OF CLIMATOLOGYInt. J. Climatol. 34: 2834–2840 (2014)Published online 30 November 2013 in Wiley Online Library(wileyonlinelibrary.com) DOI: 10.1002/joc.3876
Short Communication
Changes in the spatial structure of strong and moderateEl Nino events under global warming
Sang-Wook Yeh,a* Hera Kim,a MinHo Kwonb and Boris Dewittec
a Department of Marine Sciences and Convergent Technology, Hanyang University, Ansan, Koreab Korea Institute of Ocean Science and Technology, Ansan, Korea
c LEGOS, Toulouse, France
ABSTRACT: In this study, we examine how the spatial structures of strong and moderate El Nino events have changeddue to global warming using the Coupled Model Intercomparison Project Phase 5 (CMIP5) coupled general circulationmodels (CGCMs) based on a historical run and a Representative Concentration Pathways (RCP)4.5 run. The centre of themaximum anomalous sea surface temperature (SST) in the moderate El Nino has shifted significantly westward from thehistorical run to the RCP4.5 run; however, this is not seen with the strong El Nino events. Further analysis indicates thatthe centre of the maximum anomalous SST in the moderate El Nino with a negative Pacific Decadal Oscillation (PDO)phase shifted westward around the international dateline from the historical run to the RCP4.5 run. This is in contrast tothe moderate El Nino, which shows a positive PDO phase. We also briefly discuss a possible mechanism on the change inthe spatial structure of moderate El Nino with a negative phase of PDO from the historical run to the RCP4.5 run.
KEY WORDS El Nino; Pacific Decadal Oscillation; global warming; spatial structure
Received 19 April 2013; Revised 16 September 2013; Accepted 22 October 2013
1. Introduction
One of the most critical issues concerning climate changeis that of El Nino-Southern Oscillation (ENSO) diversity,specifically, the ENSO properties, which include theamplitude, frequency and spatial pattern, and diversitychanges on decadal-to-multidecadal timescales (Gu andPhilander, 1995; Wang and Wang, 1996; Stahle et al.,1998; Cobb et al., 2003; D’Arrigo et al., 2005; Li et al.,2011). Among these, most recent studies have focusedon the changes of the ENSO spatial structures in thetropical Pacific basin. It has been suggested that thereexist two different types of El Nino events in the tropicalPacific (e.g. Trenberth and Stepaniak 2001; Larkin andHarrison 2005; Yu and Kao 2007; Ashok et al., 2007a,2007b; Kao and Yu 2009; Kug et al., 2009). We referhere to the conventional El Nino, in which the centreof the maximum anomalous sea surface temperature(SST) is located in the eastern Pacific, as an EasternPacific (EP) El Nino and the non-conventional El Nino,in which the centre of the maximum anomalous SST islocated in the central Pacific, as a Central Pacific (CP)El Nino. In addition, several studies have showed thatCP El Nino events occur more frequently with intensified
* Correspondence to: S.-W. Yeh, Department of Marine Sciences andConvergent Technology, Hanyang University, Ansan, Korea. E-mail:[email protected]
amplitudes during recent decades (Yeh et al., 2009; Leeand McPhaden 2010).
There exist several reasons why changes in the spatialstructure of El Nino events matter. The climate impactsdue to the shift of the centre of the maximum anomalousSST (e.g. EP El Nino vs CP El Nino) can be distinctlydifferent across the globe because of atmospheric tele-connections (Yeh et al., 2009; Song et al., 2011; Grafand Zanchettin 2012; Yoon et al., 2012; Yu et al., 2012;Yuan and Yang, 2012). Therefore, a detailed investiga-tion of ENSO diversity in warmer climates is useful fordocumenting and interpreting its distinct remote effects.
Using the Coupled Model Intercomparison ProjectPhase 3 (CMIP3) coupled general circulation models(CGCMs) datasets, former studies showed that the fre-quency of CP El Nino events increase under globalwarming, perhaps due to changes in the tropical Pacificmean state, including changes in the thermocline depth(Yeh et al., 2009). Using preindustrial and historicalsimulations with Representative Concentration Pathways(RCP)4.5 simulations based on the ensemble means ofthe CMIP5 CGCMs, Kim and Yu (2012) also determinedthat the ratio of CP and EP ENSO intensity has increasedin recent years. Both studies concluded that the inten-sity and frequency of CP El Nino events have increasedbecause of global warming. However, they note that bothCMIP3 and CMIP5 are unable to correctly reproduce theEP and CP El Nino intensities as compared with actual
2013 Royal Meteorological Society

CHANGES IN EL NINO’S SPATIAL STRUCTURE 2835
observations, despite technical improvements (Ham andKug, 2012). Conversely, CGCMs tend to accurately sim-ulate the periods of weak and strong El Nino events onlow-frequency timescales (Lin, 2007). Furthermore, thespatial patterns of strong and moderate El Nino eventsare similar to those of EP and CP El Nino events, respec-tively, in the observations (Sun et al., 2009).
As there has been a lack of research on the issueof changes in El Nino properties under global warming,focusing on strong and moderate El Nino events, weanalyse how the spatial structures of strong and moderateEl Nino events have changed due to global warming,using the CMIP5 CGCMs.
In Section 2, we describe the CMIP5 datasets analysedin this study and the methodology we used to definethe weak and strong El Nino events. In Section 3, weexamine how the spatial structures of weak and strongEl Nino events change due to global warming, and presenta potential mechanism for these changes. In Section 4,we present a summary of our research and concludingremarks.
2. Data and methodology
2.1. Data
We used nine CGCM simulations selected from a his-torical run and an RCP4.5 run. The historical run is asimulation of the year 1905 with anthropogenic and nat-ural forcing. Hereafter, the term ‘historical run’ refersto data from the last 100-year simulation period (i.e.1905–2005). The climate change run corresponds to thefuture climate change simulation with the RCP4.5 runin which the atmospheric CO2 concentration increasedto 550 ppm by the end of 21st century and since thenhas remained fixed. The term ‘RCP4.5 run’ refers to themodel results from the 100-year period between 2100 and2200, during which the concentration of CO2 is fixed atapproximately 550 ppm.
2.2. Classification of strong and moderate El Ninoevents
To classify strong and weak El Nino events, we usedthe NINO3.4 SST index during the boreal winter(December–January–February). The NINO3.4 SSTindex is defined as the anomalous SST averaged in thecentral to eastern tropical Pacific (i.e. NINO3.4 region170◦W–120◦W, 5◦N–5◦S). A strong El Nino event isdefined as occurring when the NINO3.4 SST indexduring the winter is larger than 1.0 ◦C in each run. Con-versely, a moderate El Nino event is defined as occurringwhen the NINO3.4 SST index is larger than 0.5 ◦C andsmaller than 1.0 ◦C in each run. We focused on the winterseason in this study. Unless stated otherwise, our resultsare for the winter season only. The seasonal means arecalculated from the monthly data during the winter andthe seasonal anomalies are obtained by subtracting theseasonal means from the total winter mean.
3. Results
Figure 1(a) and (b) displays the ensemble mean for themoderate and strong El Nino events simulated by thehistorical run of the nine CMIP5 CGCMs, respectively.The maximum of both the moderate and strong El Ninoevents amplitudes is located in the eastern Pacific, whichis an improvement in terms of a comparison with theCMIP3 CGCMs (Yeh et al., 2012). However, the CMIP5CGCMs are still unable to accurately simulate the spatialstructure of moderate and strong El Nino events, as theyoverextend the amplitude in the western-to-central Pacificcompared with the observations (not shown here).
Figure 1(c) and (d) shows the ensemble mean for themoderate and strong El Nino events for the RCP4.5 runof the nine CMIP5 CGCMs, respectively. Figure 1(e)and (f) displays the differences in the ensemble meanfor the moderate and strong El Nino events for thehistorical run and RCP4.5 run (i.e. RCP4.5 run minushistorical run), respectively. It is interesting to notethat the centre of the maximum anomalous SST in themoderate El Nino shifted westward from the historicalrun to the RCP4.5 run (Figure 1(a) and (c)). In thehistorical run, the centre of the maximum anomalousSST in the moderate El Nino is located in the easternPacific (Figure 1(a)), which may reflect the EP El Nino.However, it shifted to the west and is located in thewestern Pacific around the international dateline in theRCP4.5 run (Figure 1(c)). That is, the spatial patternof the moderate El Nino simulated in the RCP4.5 runis similar to the characteristics of a CP El Nino to somedegree. Consequently, the differences in the SST map ofthe moderate El Nino between the historical run and theRCP4.5 run (Figure 1(e)) are characterized by a dipole-like structure in the zonal direction in the western andcentral Pacific. In particular, the anomalous warm SSTaround the dateline clearly reflects a shifted centre of themoderate El Nino when comparing the historical run tothe RCP4.5 run. Conversely, the spatial structure of thestrong El Nino simulated in the RCP4.5 run (Figure 1(d))extended a bit westward compared with the El Nino eventsimulated in the historical run (Figure 1(b)). However,compared with the moderate El Nino events, there isnot much difference between the historical run and theRCP4.5 run (Figure 1(f)). Overall, these results indicatethat the spatial structure of the El Nino events in thehistorical run changed for the RCP4.5 run, with awestward shift in the centre of the maximum anomalousSST, which is consistent with previous results (Kim andYu, 2012). Furthermore, such a westward shift is largelyassociated to moderate El Nino events, rather than tostrong El Nino events. Therefore, we decided to focus onexamining the temporal changes in the spatial structureof moderate El Nino events, from the historical run to theRCP4.5 run.
To examine this issue, we applied a conditional com-posite of moderate El Nino events based on a phase ofPacific Decadal Oscillation (PDO) to both the historicalrun and the RCP4.5 run. We examine the PDO phase
2013 Royal Meteorological Society Int. J. Climatol. 34: 2834–2840 (2014)
2836 S.-W. YEH et al.
(a) (b)
(c) (d)
(e) (f)
Figure 1. The ensemble mean composite of moderate El Nino (a) and strong El Nino (b) simulated by the historical run of nine CMIP5 CGCMs.Panels (c) and (d) are the same as in (a) and (b), except for the ensemble mean composite of the moderate El Nino in the RCP4.5 run. Panels(e) and (f) show the SST difference maps between the historical run and the RCP4.5 run (RCP4.5 run minus historical run) in the moderate
El Nino and strong El Nino, respectively. Dot denotes the region where the statistical significance is above 90% confidence level.
because its change reflects changes in the mean state ofthe tropical Pacific on low-frequency timescales. Accord-ing to recent studies (Xiang et al., 2013; Chung and Li,2013), recent and frequent occurrences of CP El Ninoevents may be associated with a shift to a La Nina-likeinterdecadal mean state. This implies that a westwardshift of the centre of maximum anomalous SST is associ-ated with a mean SST state change for the tropical Pacific.Therefore, it is useful to examine how the spatial changesof moderate El Nino events from the historical run to theRCP4.5 run are associated with PDO phases.
Figure 2(a) and (b) displays the ensemble meanmoderate El Nino simulated by the historical run of nineCMIP5 CGCMs with negative and positive PDO phases,respectively. Figure 2(c) and (d) shows the ensemblemean moderate El Nino simulated by the RCP4.5 runof nine CMIP5 CGCMs. The PDO is defined as thefirst empirical orthogonal function mode of SST in theNorth Pacific (20◦N–60◦N, 120◦E–120◦W) in all ofthe CMIP5 CGCMs, including the historical run andthe RCP4.5 run, and its principal component is definedas the PDO index. A positive (negative) PDO phase isdefined as when the PC index is above (below) zeroand its spatial structure is characterized by cool (warm)temperatures in the western and central North Pacificwith an elliptical shape and warm (cool) temperatures inthe tropical Pacific basin (not shown here).
Surprisingly, a westward shift of the maximum anoma-lous SST occurs when a moderate El Nino accompaniesa negative PDO phase (Figure 2(a) and (c)). That is, thecentre of the maximum anomalous SST in the moderateEl Nino with a negative PDO phase is located in the east-ern Pacific in the historical run (Figure 2(a)); however,it shifted significantly westward around the internationaldateline in the RCP4.5 run (Figure 2(c)). Because of this
shift, the difference map of the moderate El Nino eventswith a negative PDO phase shows a significant warmingin the central Pacific between the historical run and theRCP4.5 run (i.e. RCP4.5 run minus historical run) with amaximum temperature approximately 0.5 ◦C. This mag-nitude is 2 times the SST difference between a moderateEl Nino with no consideration of the PDO phase betweenthe historical run and the RCP4.5 run (Figure 1(e)). Incontrast, there is no significant difference in the spatialstructure of a moderate El Nino with a positive PDOphase when comparing the historical run with the RCP4.5run (Figures 2(b) and (d) and 3(b)). Therefore, the spatialstructure changes of the moderate El Nino events fromthe historical run to the RCP4.5 run (Figure 1(a) and (c))are largely due to occurrences of moderate El Ninos withnegative PDO phases.
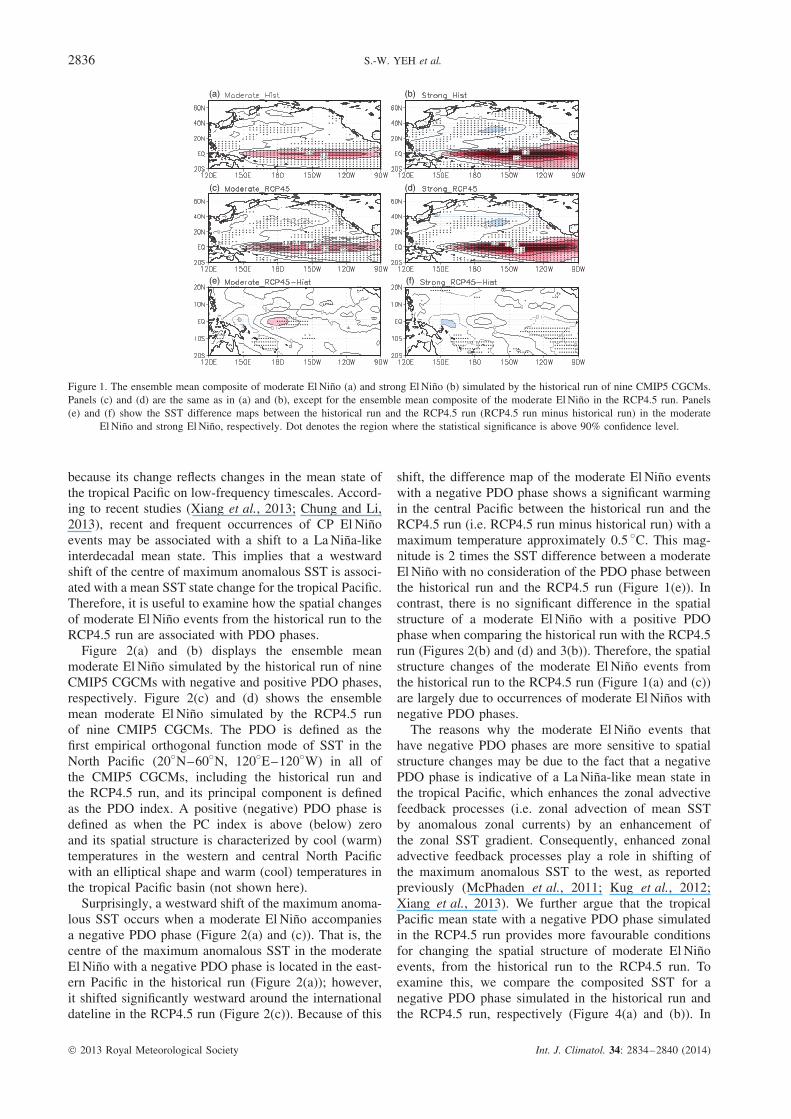
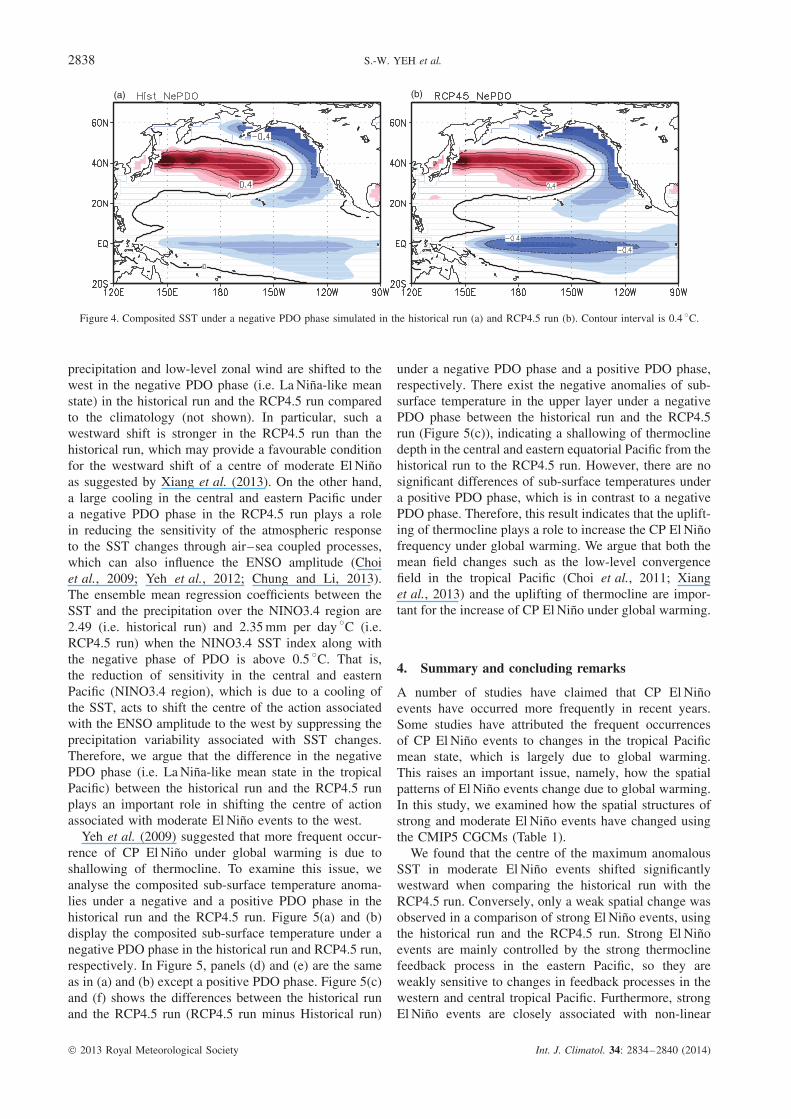
The reasons why the moderate El Nino events thathave negative PDO phases are more sensitive to spatialstructure changes may be due to the fact that a negativePDO phase is indicative of a La Nina-like mean state inthe tropical Pacific, which enhances the zonal advectivefeedback processes (i.e. zonal advection of mean SSTby anomalous zonal currents) by an enhancement ofthe zonal SST gradient. Consequently, enhanced zonaladvective feedback processes play a role in shifting ofthe maximum anomalous SST to the west, as reportedpreviously (McPhaden et al., 2011; Kug et al., 2012;Xiang et al., 2013). We further argue that the tropicalPacific mean state with a negative PDO phase simulatedin the RCP4.5 run provides more favourable conditionsfor changing the spatial structure of moderate El Ninoevents, from the historical run to the RCP4.5 run. Toexamine this, we compare the composited SST for anegative PDO phase simulated in the historical run andthe RCP4.5 run, respectively (Figure 4(a) and (b)). In
2013 Royal Meteorological Society Int. J. Climatol. 34: 2834–2840 (2014)

CHANGES IN EL NINO’S SPATIAL STRUCTURE 2837
(a) (b)
(c) (d)
Figure 2. The ensemble mean moderate El Nino simulated by the historical run of nine CMIP5 CGCMs with a negative PDO phase (a) and apositive PDO phase (b). Panels (c) and (d) are the same as in (a) and (b), respectively, except for the ensemble mean moderate El Nino simulated
by the RCP4.5 run of nine CMIP5 CGCMs.
(a) (b)
Figure 3. The SST difference maps of the moderate El Nino with a negative PDO phase (a) and a positive PDO phase (b) simulated in thehistorical run and the RCP4.5 run (RCP4.5 run minus historical run). Contour interval is 0.1 ◦C. Dot denotes the region where the statistical
significance is above 90% confidence level.
both the historical run and the RCP4.5 run, the spatialpatterns of the negative PDO phases are characterizedby warm temperatures in the western and central NorthPacific that are elliptical in shape. In addition, thereis also an anomalously cool temperature around thewestern coast of the USA and the tropical Pacific basin,representing a La Nina-like mean state.
The most striking difference between the two runs isin the strength of the negative PDO phase in the tropicalPacific. A cool SST under a negative PDO phase inthe RCP4.5 run is stronger than that in the historical
run, indicating that the east–west gradient of the meanSST becomes stronger under a negative PDO phase inthe western and central Pacific. We argue that such astrengthening under a negative PDO phase may haveprovided favourable conditions for changing the spatialstructure of moderate El Nino events in the RCP4.5 run,as discussed above. Recently, Xiang et al. (2013) arguedthat the La Nina-like mean state anchors the convectionand surface wind anomaly further westward in the west-ern Pacific, which holds the key for more occurrence ofCP El Nino. Similarly, it is found that both the anomalous
2013 Royal Meteorological Society Int. J. Climatol. 34: 2834–2840 (2014)
2838 S.-W. YEH et al.
(a) (b)
Figure 4. Composited SST under a negative PDO phase simulated in the historical run (a) and RCP4.5 run (b). Contour interval is 0.4 ◦C.
precipitation and low-level zonal wind are shifted to thewest in the negative PDO phase (i.e. La Nina-like meanstate) in the historical run and the RCP4.5 run comparedto the climatology (not shown). In particular, such awestward shift is stronger in the RCP4.5 run than thehistorical run, which may provide a favourable conditionfor the westward shift of a centre of moderate El Ninoas suggested by Xiang et al. (2013). On the other hand,a large cooling in the central and eastern Pacific undera negative PDO phase in the RCP4.5 run plays a rolein reducing the sensitivity of the atmospheric responseto the SST changes through air–sea coupled processes,which can also influence the ENSO amplitude (Choiet al., 2009; Yeh et al., 2012; Chung and Li, 2013).The ensemble mean regression coefficients between theSST and the precipitation over the NINO3.4 region are2.49 (i.e. historical run) and 2.35 mm per day ◦C (i.e.RCP4.5 run) when the NINO3.4 SST index along withthe negative phase of PDO is above 0.5 ◦C. That is,the reduction of sensitivity in the central and easternPacific (NINO3.4 region), which is due to a cooling ofthe SST, acts to shift the centre of the action associatedwith the ENSO amplitude to the west by suppressing theprecipitation variability associated with SST changes.Therefore, we argue that the difference in the negativePDO phase (i.e. La Nina-like mean state in the tropicalPacific) between the historical run and the RCP4.5 runplays an important role in shifting the centre of actionassociated with moderate El Nino events to the west.
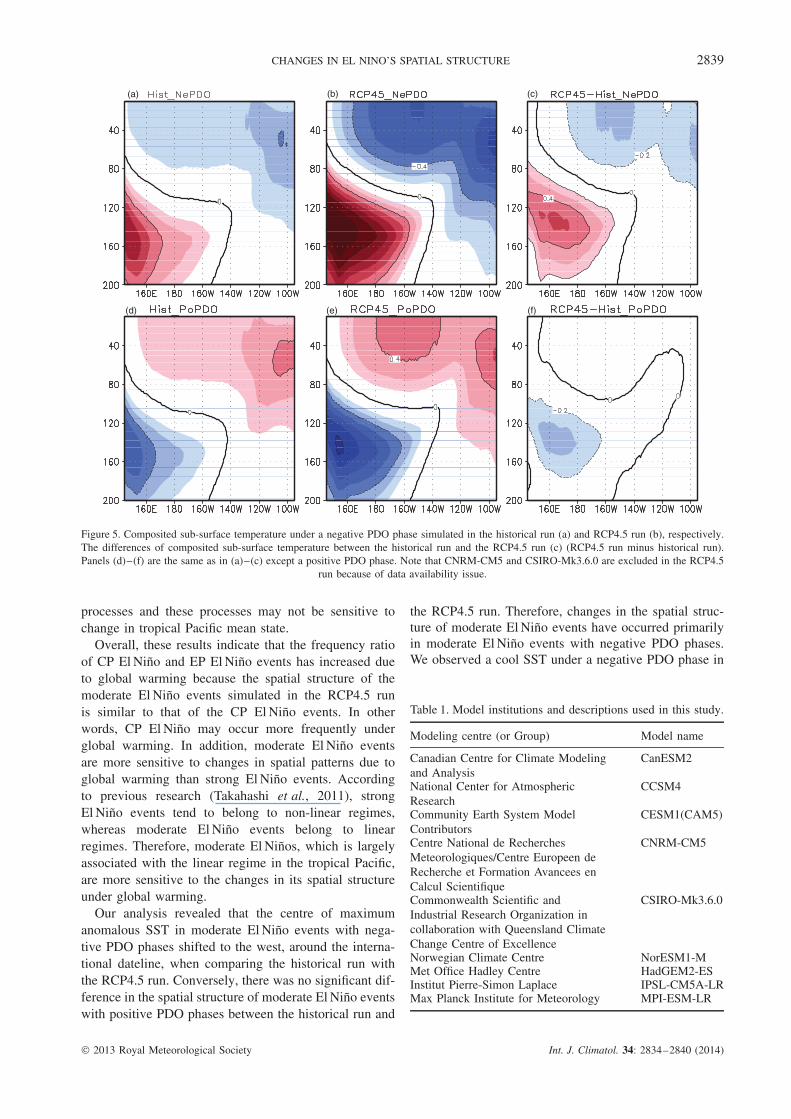
Yeh et al. (2009) suggested that more frequent occur-rence of CP El Nino under global warming is due toshallowing of thermocline. To examine this issue, weanalyse the composited sub-surface temperature anoma-lies under a negative and a positive PDO phase in thehistorical run and the RCP4.5 run. Figure 5(a) and (b)display the composited sub-surface temperature under anegative PDO phase in the historical run and RCP4.5 run,respectively. In Figure 5, panels (d) and (e) are the sameas in (a) and (b) except a positive PDO phase. Figure 5(c)and (f) shows the differences between the historical runand the RCP4.5 run (RCP4.5 run minus Historical run)
under a negative PDO phase and a positive PDO phase,respectively. There exist the negative anomalies of sub-surface temperature in the upper layer under a negativePDO phase between the historical run and the RCP4.5run (Figure 5(c)), indicating a shallowing of thermoclinedepth in the central and eastern equatorial Pacific from thehistorical run to the RCP4.5 run. However, there are nosignificant differences of sub-surface temperatures undera positive PDO phase, which is in contrast to a negativePDO phase. Therefore, this result indicates that the uplift-ing of thermocline plays a role to increase the CP El Ninofrequency under global warming. We argue that both themean field changes such as the low-level convergencefield in the tropical Pacific (Choi et al., 2011; Xianget al., 2013) and the uplifting of thermocline are impor-tant for the increase of CP El Nino under global warming.
4. Summary and concluding remarks
A number of studies have claimed that CP El Ninoevents have occurred more frequently in recent years.Some studies have attributed the frequent occurrencesof CP El Nino events to changes in the tropical Pacificmean state, which is largely due to global warming.This raises an important issue, namely, how the spatialpatterns of El Nino events change due to global warming.In this study, we examined how the spatial structures ofstrong and moderate El Nino events have changed usingthe CMIP5 CGCMs (Table 1).
We found that the centre of the maximum anomalousSST in moderate El Nino events shifted significantlywestward when comparing the historical run with theRCP4.5 run. Conversely, only a weak spatial change wasobserved in a comparison of strong El Nino events, usingthe historical run and the RCP4.5 run. Strong El Ninoevents are mainly controlled by the strong thermoclinefeedback process in the eastern Pacific, so they areweakly sensitive to changes in feedback processes in thewestern and central tropical Pacific. Furthermore, strongEl Nino events are closely associated with non-linear
2013 Royal Meteorological Society Int. J. Climatol. 34: 2834–2840 (2014)
CHANGES IN EL NINO’S SPATIAL STRUCTURE 2839
(a)
(d) (e) (f)
(b) (c)
Figure 5. Composited sub-surface temperature under a negative PDO phase simulated in the historical run (a) and RCP4.5 run (b), respectively.The differences of composited sub-surface temperature between the historical run and the RCP4.5 run (c) (RCP4.5 run minus historical run).Panels (d)–(f) are the same as in (a)–(c) except a positive PDO phase. Note that CNRM-CM5 and CSIRO-Mk3.6.0 are excluded in the RCP4.5
run because of data availability issue.
processes and these processes may not be sensitive tochange in tropical Pacific mean state.
Overall, these results indicate that the frequency ratioof CP El Nino and EP El Nino events has increased dueto global warming because the spatial structure of themoderate El Nino events simulated in the RCP4.5 runis similar to that of the CP El Nino events. In otherwords, CP El Nino may occur more frequently underglobal warming. In addition, moderate El Nino eventsare more sensitive to changes in spatial patterns due toglobal warming than strong El Nino events. Accordingto previous research (Takahashi et al., 2011), strongEl Nino events tend to belong to non-linear regimes,whereas moderate El Nino events belong to linearregimes. Therefore, moderate El Ninos, which is largelyassociated with the linear regime in the tropical Pacific,are more sensitive to the changes in its spatial structureunder global warming.
Our analysis revealed that the centre of maximumanomalous SST in moderate El Nino events with nega-tive PDO phases shifted to the west, around the interna-tional dateline, when comparing the historical run withthe RCP4.5 run. Conversely, there was no significant dif-ference in the spatial structure of moderate El Nino eventswith positive PDO phases between the historical run and
the RCP4.5 run. Therefore, changes in the spatial struc-ture of moderate El Nino events have occurred primarilyin moderate El Nino events with negative PDO phases.We observed a cool SST under a negative PDO phase in
Table 1. Model institutions and descriptions used in this study.
Modeling centre (or Group) Model name
Canadian Centre for Climate Modelingand Analysis
CanESM2
National Center for AtmosphericResearch
CCSM4
Community Earth System ModelContributors
CESM1(CAM5)
Centre National de RecherchesMeteorologiques/Centre Europeen deRecherche et Formation Avancees enCalcul Scientifique
CNRM-CM5
Commonwealth Scientific andIndustrial Research Organization incollaboration with Queensland ClimateChange Centre of Excellence
CSIRO-Mk3.6.0
Norwegian Climate Centre NorESM1-MMet Office Hadley Centre HadGEM2-ESInstitut Pierre-Simon Laplace IPSL-CM5A-LRMax Planck Institute for Meteorology MPI-ESM-LR
2013 Royal Meteorological Society Int. J. Climatol. 34: 2834–2840 (2014)
2840 S.-W. YEH et al.
the RCP4.5 run that was stronger than that observed inthe historical run. The reason why the SST cooling undera negative PDO phase is stronger in the RCP4.5 run thanthe historical run is not clear. We speculate that a reduc-tion of a residual effect of El Nino events on the tropicalPacific mean state is reduced from the historical run to theRCP4.5 run (not shown here). Consequently, we suggestthat a strengthening of the negative phase PDO from thehistorical run to the RCP4.5 run plays a role in the shiftof the maximum anomalous SST to the west through anenhancement of zonal advective feedback processes anda reduction of SST-precipitation sensitivity in the easternPacific. Yeh et al. (2009) argued that the more CP El Ninounder global warming is associated with the shallowingthermocline in the western and central tropical Pacific,resulting in an intensification of thermocline feedbackand zonal advective feedback in the same region. WhileYeh et al. (2009) examined the role of mean state changesfrom the present climate to the global warming, this studyexamined the role of tropical Pacific decadal variability inthe present climate and the warmer climate, respectively.
Acknowledgements
We acknowledge the WCRP’s Working Group onCoupled Modeling, which is responsible for CMIP, andwe thank the climate modeling groups (listed in Table 1)for producing and making available their model output.For CMIP, the U.S. Department of Energy’s Programfor Climate Model Diagnosis and Intercomparisonprovides coordinating support and led development ofsoftware infrastructure in partnership with the GlobalOrganization for Earth System Science Portals. S.-W.Yeh was funded by the Korea Meteorological Adminis-tration Research and Development Program under GrantCATER 2012–3041. MinHo Kwon is supported by theKorea Institute of Ocean Science and Technology grantPE99123. B. Dewitte acknowledge support from theCentre National d’Etudes Spatiales (CNES) (Modokaltprojet).
References
Ashok K, Nakamura H, Yamagata T. 2007a. Impacts of ENSO andIndian Ocean dipole events on the southern hemisphere storm-trackactivity during austral winter. J. Climate 20: 3147–3163.
Ashok K, Behera SK, Rao SA, Weng HY, Yamagata T. 2007b. El NinoModoki and its possible teleconnection. J. Geophys. Res. Oceans112: C11007, DOI: 10.1029/2006JC003798.
Choi J, An S-I, Dewitte B, Hsieh WW. 2009. Interactive feedbackbetween the tropical Pacific decadal oscillation and ENSO in acoupled general circulation model. J. Climate 22: 6597–6611.
Choi JS-I, An J-SK, Yeh S-W. 2011. The role of mean state on changesin El Nino’s favor. Clim. Dyn. 2011(37): 1205–1215.
Chung P-H, Li T. 2013. Interdecadal relationship between the meanstate and El Nino types. J. Climate 26: 361–379.
Cobb KM, Charles CD, Cheng H, Edwards RL. 2003. El Nino/SouthernOscillation and tropical Pacific climate during the last millennium.Nature 424: 271–276.
D’Arrigo R, Wilson R, Deser C, Wiles G, Cook E, Villalba R, TudhopeA, Cole J, Linsley B. 2005. Tropical-North Pacific climate linkagesover the past four centuries. J. Climate 18: 5253–5265.
Graf HF, Zanchettin D. 2012. Central Pacific El Nino, the “subtropicalbridge,” and Eurasian climate. J. Geophys. Res. Atmos. 117: D01102,DOI: 10.1029/2011JD016493.
Gu DF, Philander SGH. 1995. Secular changes of annual and interan-nual variability in the tropics during the past century. J. Climate 8:864–876.
Ham YG, Kug JS. 2012. How well do current climate models simulatetwo types of El Nino? Clim. Dyn. 39: 383–398.
Kao HY, Yu JY. 2009. Contrasting eastern-Pacific and central-Pacifictypes of ENSO. J. Climate 22: 615–632.
Kim ST, Yu JY. 2012. The two types of ENSO in CMIP5 models.Geophys. Res. Lett. 39: L11704, DOI: 10.1029/2012GL052006.
Kug JS, Sooraj KP, Kim D, Kang IS, Jin FF, Takayabu YN, KimotoM. 2009. Simulation of state-dependent high-frequency atmosphericvariability associated with ENSO. Clim. Dyn. 32: 635–648.
Kug JS, Ham YG, Lee JY, Jin FF. 2012. Improved simulation of twotypes of El Nino in CMIP5 models. Environ. Res. Lett. 7: 034002.
Larkin NK, Harrison DE. 2005. Global seasonal temperature andprecipitation anomalies during El Nino autumn and winter. Geophys.Res. Lett. 32: L16705, DOI: 10.1029/2005GL022860.
Lee T, McPhaden MJ. 2010. Increasing intensity of El Nino in thecentral-equatorial Pacific. Geophys. Res. Lett. 37.
Li JB, Xie SP, Cook ER, Huang G, D’Arrigo R, Liu F, Ma J, ZhengXT. 2011. Interdecadal modulation of El Nino amplitude during thepast millennium. Nat. Climate Change 1: 114–118.
Lin JL, 2007. Interdecadal variability of ENSO in 21 IPCC AR4coupled GCMs. Geophys. Res. lett . 34: L12702, DOI: 10.1029/2006GL028937.
McPhaden MJ, Lee T, McClurg D. 2011. El Nino and its relationshipto changing background conditions in the tropical Pacific Ocean.Geophys. Res. Lett. 38: L15709, DOI: 10.1029/2011GL048275.
Song HJ, Choi E, Lim GH, Kim YH, Kug JS, Yeh SW. 2011.The central Pacific as the export region of the El Nino-SouthernOscillation sea surface temperature anomaly to Antarctic sea ice.J. Geophys. Res. Atmos. 116: D21113, DOI: 10.1029/2011JD015645.
Stahle DW, D’Arrigo RD, Krusic PJ, Cleaveland MK, Cook ER,Allan RJ, Cole JE, Dunbar RB, Therrell MD, Gay DA, MooreMD, Stokes MA, Burns BT, Villanueva-Diaz J, Thompson LG.1998. Experimental dendroclimatic reconstruction of the SouthernOscillation. Bull. Am. Meteorol. Soc. 79: 2137–2152.
Sun DZ, Yu YQ, Zhang T. 2009. Tropical water vapor and cloudfeedbacks in climate models: a further assessment using coupledsimulations. J. Climate 22: 1287–1304.
Takahashi K, Montecinos A, Goubanova K, Dewitte B. 2011. ENSOregimes: Reinterpreting the canonical and Modoki El Nino. Geophys.Res. Lett. 38: L10704.
Trenberth KE, Stepaniak DP. 2001. Indices of El Nino evolution.J. Climate 14: 1697–1701.
Wang B, Wang Y. 1996. Temporal structure of the Southern Oscillationas revealed by waveform and wavelet analysis. J. Climate 9:1586–1598.
Xiang BQ, Wang B, Li T. 2013. A new paradigm for the predominanceof standing central Pacific warming after the late 1990s. Clim. Dyn.41: 327–340.
Yeh SW, Kug JS, Dewitte B, Kwon MH, Kirtman BP, Jin FF. 2009.El Nino in a changing climate. Nature 461: 511–U570.
Yeh SW, Ham YG, Lee JY. 2012. Changes in the Tropical PacificSST Trend from CMIP3 to CMIP5 and Its Implication of ENSO.J. Climate 25: 7764–7771.
Yoon J, Yeh SW, Kim YH, Kug JS, Min HS. 2012. Understandingthe responses of sea surface temperature to the two different typesof El Nino in the western North Pacific. Prog. Oceanogr. 105:81–89.
Yu JY, Kao HY. 2007. Decadal changes of ENSO persistence barrierin SST and ocean heat content indices: 1958–2001. J. Geophys. Res.Atmos. 112: D13106, DOI: 10.1029/2006JD007654.
Yu JY, Zou YH, Kim ST, Lee T. 2012. The changing impact of ElNino on US winter temperatures. Geophys. Res. Lett. 39: L15702,DOI: 10.1029/2012GL052483.
Yuan Y, Yang S. 2012. Impacts of Different Types of El Nino onthe East Asian Climate: Focus on ENSO Cycles. J. Climate 25:7702–7722.
2013 Royal Meteorological Society Int. J. Climatol. 34: 2834–2840 (2014)