Changes in the demand for private medical insurance following a shift in tax incentives
33
DOCUMENT DE TREBALL CREAP2006-12 CHANGES IN THE DEMAND FOR PRIVATE MEDICAL INSURANCE FOLLOWING A SHIFT IN TAX INCENTIVES Marisol Rodríguez; Alexandrina Stoyanova
-
Upload
independent -
Category
Documents
-
view
1 -
download
0
Transcript of Changes in the demand for private medical insurance following a shift in tax incentives

DOCUMENT DE TREBALL
CREAP2006-12
CHANGES IN THE DEMAND FOR PRIVATE MEDICAL INSURANCE FOLLOWING A SHIFT IN TAX INCENTIVES
Marisol Rodríguez; Alexandrina Stoyanova

CREAP2006-12
CHANGES IN THE DEMAND FOR PRIVATE MEDICAL INSURANCE
FOLLOWING A SHIFT IN TAX INCENTIVESa
Marisol Rodríguezb, Alexandrina Stoyanovac
Abstract:
The 1998 Spanish reform of the Personal Income Tax eliminated the 15% deduction for private
medical expenditures including payments on private health insurance (PHI) policies. To avoid
an undesirable increase in the demand for publicly funded health care, tax incentives to buy PHI
were not completely removed but basically shifted from individual to group employer-paid
policies. In a unique fiscal experiment, at the same time that the tax relief for individually
purchased policies was abolished, the government provided for tax allowances on policies taken
out through employment. Using a bivariate probit model on data from National Health Surveys,
we estimate the impact of said reform on the demand for PHI and the changes occurred within
it. Our findings suggest that the total probability of buying PHI was not significantly affected.
Indeed, the fall in the demand for individual policies (by 10% between 1997 and 2001) was
offset by an increase in the demand for group employer-paid ones, so that the overall size of the
market remained virtually unchanged. We also briefly discuss the welfare effects on the state
budget, the industry and society at large.
Keywords: Private health insurance, tax reform, Spain.
JEL Codes: I10, H31
a Acknowledgements: We thank Luis Díaz, and Marisa Ciutat for their advise and useful comments, and Rosa Vidal for research assistance. We also acknowledge financial help from the Fondo de Investigación Sanitaria (FIS), grant numbers 00/1172E and 03/1742, and from the Generalitat de Catalunya, grant 2001/SGR-29. b Centre de Recerca en Economia del Benestar (CREB), Parc Científic de Barcelona, C/ Balriri Reixac, 4-6, 08028 Barcelona, Departament de Política Económica i Estructura Econòmica Mundial, Universitat de Barcelona. E-mail: [email protected] c Centre de Recerca en Economia del Benestar (CREB), Parc Científic de Barcelona, C/ Balriri Reixac, 4-6, 08028 Barcelona, Departament de Ecopnomia i Empresa, Universitat Pompeu Fabra. E-mail: [email protected]
1

CREAP2006-12
1. Introduction
Until 1998 the Spanish Personal Income Tax (PIT) regulations permitted taxpayer units
(individuals or families) to deduct 15% of their annual private medical expenses from their
gross income tax liability, as long as the deduction was no higher than their net tax liability. In
the nineties both the number of taxpayer units claiming this deduction and the total amount
deducted increased rapidly and steadily. According to the annual tax reports1, in 1990 a mere
2.4 million taxpayers (22% of the total) applied for tax relief for medical expenditure while in
1998 this number had gone up to 7.1 million (46% of all taxpayers) (Ministerio de Economía y
Hacienda, 1991 and 1999). In terms of monetary volume the tax expenditure rose from 28,866
million pesetas (173.5 million euro) in 1990 to 109,254 million pesetas (656.6 million euro) in
1998; that is a 278.5% rise, compared to a 52.2% growth in PIT deductions in general over the
same period (IEF, 2003). In other words, the 656.6 million euro of revenue forgone in 1998
represented 1.57% of total Personal Income Tax gross liabilities, or enough to cover that year’s
public health care for one million people.
Naturally, the size and evolution of this fiscal benefit started to be a matter of concern to the
government. Signs that it was the higher income groups that were availing more of the relief
(Martínez García et al., 1999) added still further doubts with respect to its appropriateness.
Finally, such deductions were eliminated by the 1998 Personal Income Tax System reform (Act
40/1998, dated of 9th of December, effective as of 1st of January 1999), along with certain other
specific deductions and allowances. The main argument used to justify the measure was that
medical and other personal expenses were encompassed in the new general allowance -a
minimum amount of family and personal income exempt from taxation- introduced in the same
Act.
The 15% deduction had been applicable both to direct out of pocket medical expenses such as
payments for visits, hospitalisation, medical appliances, medicines, etc. and to indirect medical
expenditure, that is, payment of private health insurance premiums. While the government
clearly wanted to eliminate the tax relief on private medical expenditures in general, it is
apparent from the complementary measures that were taken that it did not want to remove the
incentives to taking out private health insurance (PHI) altogether. The reasons the government
had for not wanting to put a brake on the demand for PHI were, most likely, a wish to avoid a
sudden increase in the flow of patients to the public sector and the desire not to harm the
sizeable Spanish private health insurance market. Due to a substitution effect, eliminating the
1 Figures do not include the Basque Country and Navarre, that collect their own taxes.
2

CREAP2006-12
deduction on direct out of pocket medical expenditure was expected to result in a certain
increase in the demand for publicly funded services. Adding to this the complete removal of
incentives to buy PHI was feared it would lead to a further reduction in the demand for private
medical services, thus, putting additional pressure on public health spending.
Two accompanying policy measures were adopted: firstly, a proviso was made (Act 40/1998,
additional provision 13th) exempting health insurance premiums from the new 6% tax on
insurance transactions enacted in 1997 (Act 13/1996, art. 12). Secondly, the tax consideration of
employer-paid group premiums was modified. Previously, such premiums had been considered
as salary in kind, and thus subject to PIT. The reform changed this explicitly stating (Act
40/1998, art. 43.2.f) that, up to a certain limit, any premiums paid by firms on private health
insurance policies for their employees were not to be considered salary in kind. Shortly
afterwards the measure was extended to include any premiums paid to cover the employee’s
spouse and dependent children (Royal Decree 214/1999, dated 9th of February). The annual
limit established by the Decree was 360 euro if the insurance covered the employee alone and
1,200 euro when other family members were also included.
In order to study the impact of the reform, it is very important to understand the incentives
introduced by these policy changes properly. First of all, contrary to what is sometimes thought,
the tax allowance on employer-paid insurance is mainly a subsidy to employees for insurance
purchased through the firm and not a subsidy to employers. From the point of view of the firm,
to pay the employee in the form of health insurance or cash wage is almost2 the same: both are
booked as outgoings and thus both reduce profits and corporate tax liabilities. There is an
important difference, however, from the point of view of the employee: wages are taxed while
the premium paid by (or through) the employer is now fully, or nearly fully3, subsidised by the
government at the individual’s average tax rate. In other words, the reform reallocated tax
incentives while still keeping them within the PIT: it eliminated the previous subsidy on policies
taken out directly by individuals and replaced it with a tax credit on insurance bought through
an employer. Since, at all events, both types of insurance policy received rebate through an
exemption in the tax on insurance premiums, it meant that employer-paid policies obtained a
double subsidy, while individually bought insurance received only one.
2 “Almost” and not “exactly” the same since social insurance contributions are levied on money wages but not on any form of payment in kind. 3 This depends on whether the premium is lower or higher than the legal limit. In 2001 the average annual premium for employer-paid group policies of the “services in kind” type (the vast majority of policies in Spain) was 289.89 euro (ICEA, 2002), and thus lower than the annual legal limit of €360.
3

CREAP2006-12
In investigating the effects of the reform in this paper above all we are interested in whether or
not a sudden fall in the demand for private health insurance was actually avoided and what
changes occurred within it, namely, how individual and group policies responded to the
incentives just described. Other things being equal, the price of individually purchased PHI
went up, while the price of insurance taken out through an employer went down. One would
thus expect to see a fall in the demand for individual insurance policies and a rise in the demand
for employer-paid group schemes, making the net effect on the total demand for PHI uncertain.
Additionally, we explore whether the probable change to the quantity and composition of the
privately insured population translated into changes to the patterns of use of public and private
health care services which would, in the end, affect public health spending.
The remainder of the paper is organised as follows. First, we provide a background explanation
of the Spanish health care system and the private health insurance market. This is accompanied
by a brief discussion of the main arguments involved in the decision on whether or not to tax
subsidise PHI and by a review of the Spanish literature on this issue. In section three we
describe the econometric model, the data set and the explanatory variables we use to estimate
the effect of the reform on the demand for PHI in general, and on individual and group policies
in particular. This is followed by a section presenting the results. In section five we discuss the
results and give a brief account of their impact on the state budget, the industry and society as a
whole.
4

CREAP2006-12
2. Background and literature review
2.1. The Spanish health care system and the private insurance market
Today Spain’s National Health System is financed exclusively through general taxation
(although affiliation is still done through the Social Security System). Coverage is virtually
universal (98.7% according to the 2001 National Health Survey), the set of benefits is quite
comprehensive (dental care being the main exception) and the services are mostly provided by
publicly-financed hospitals and doctors directly employed by the public sector. There is a low
degree of choice (although some regions have started to offer more options with regard to being
able to choose both family doctors and specialists) and waiting lists feature largely. Altogether
though the system performs reasonably well, or even very well, by some international
standards4.
Alongside the public system, there is a sizeable private sector. Private health services amounted
to 27.8% of total health expenditure in 1998 (OECD Health Data, 2004.) The most important
items within private expenditure were medicines (30%), dental care (19%), insurance premiums
(18.5%5), eyeglasses and other prosthesis (15%), and outpatient visits (13%) (INE, 1999).
Approximately 81% of all private health insurance policies in Spain are of the “benefits in kind”
type6; the rest provide sickness compensations or reimbursement of medical expenses –the latter
requiring a co-payment (ICEA, 2002). Most PHI is supplementary to the public sector, that is, it
essentially provides coverage for the same goods and services offered by the public sector, but it
is presumably purchased because it provides faster access, greater consumer choice and better
amenities7. Employer-paid group policies were the minority in 2001, representing around 23.4%
of all voluntary health insurance (ICEA, 2002). At this point, perhaps it is appropriate to remark
that public servants, who belong to one of the three public mutualities (Muface, Mugeju and
Isfas), are not included in our definition of PHI8 and are left out of the study altogether.
4 Spain ranked 7th in the league of 191 countries analysed in the World Health Report 2000, which took into account the level and distribution of health, the responsiveness of the system, fairness in financial contribution and health expenditures per capita (WHO, 2000). 5 Thus, insurance premiums accounted for 5% of all health expenditures in Spain. 6 Subscribers can obtain medical care from a very wide network of providers who have agreements with the insurance companies, which pay the providers directly. As opposed to the public system, access to specialists does not require a referral from a general practitioner. Co-payments are inexistent or involve very small amounts. Some exclusions or waiting periods apply with respect to certain services (for example, the delivery of babies). 7 Most people with PHI thus have double coverage, public and private. 8 Theirs is a mandatory social insurance scheme and they are, therefore, counted among the publicly insured. It is true, though, that these groups are privileged in being able to choose their healthcare provider from either the public system or any of the private insurance companies that want to enter the scheme in exchange for a premium that is paid by the mutuality. Members of these mutualities that opt to receive services through a private insurance company are not able to use the public sector and cannot be
5
CREAP2006-12
2.2. Arguments and findings from the literature
Our paper draws form the literature on the optimal mix of public and private provision of
private goods and their tax/subsidisation and from the literature on the demand for
supplementary private health insurance. Epple and Romano (1996) and Gouveia (1996) model
how the levels of public and private provision are decided under the political process using the
median voter paradigm. A classical conclusion of these models is that mixed systems of public
and private provision are usually preferred to pure public or pure private systems. Specifically
in the health field, Hansen and Keiding (2002) demonstrate that under certain assumptions a
compulsory scheme supplemented by voluntary competitive health insurance has welfare
advantages over other insurance alternatives, including a purely compulsory system. The main
condition is that supplementary health insurance is taken out by the higher risk groups that
presumably find the compulsory scheme sub-optimal and are willing to pay more. Nevertheless,
Danzon (2002) warns against ignoring the additional administrative costs and moral hazard that
result when individuals hold multiple overlapping insurance policies. And López-Casasnovas
(2003) discusses the implications of such supplementation for the finance, organisation and
management of public health services.
Permitting supplementation is usually not an issue in most countries that have national health
insurance systems. Only Canada prohibits supplementary private coverage9. The actual policy
debate in these countries is whether private medical insurance should be encouraged through tax
subsidies at all. In line with Besley and Coate (1991), one of the best known arguments in
favour of subsidising supplementary insurance runs as follows: if the level of quality chosen for
the public sector is not very high, some people will decide not to use its services and instead buy
private health insurance. By doing so, they unclog the public services that will offer better
service to the people that stay. Since the people that waive the public sector cannot opt-out and
still have to contribute to it, it is fair to subsidise their private health insurance to partially
compensate them for paying twice for their health care -or for saving the public sector money.
Hoel and Saether (2003) argue similarly for the case of limit capacity and waiting time in the
public sector.
Two crucial empirical issues arise. First, how effective is the subsidy in stimulating the demand
for PHI. If the subsidy is small or the elasticity of demand low, it will not encourage enough
counted as being doubly insured. On the other hand, these groups constitute a large proportion of the business for the insurance companies: almost one third of all holders of a “benefits in kind” type of policy are members of one of these public mutualities (ICEA, 2004). 9 However, complementary insurance, that is, insurance for goods and services not covered or not covered in full by the public sector -such as dental care or chiropractors- is allowed.
6

CREAP2006-12
people to buy private insurance and will only act as a government “gift” to those who would
have, anyway, purchased the insurance. By the same token, removing the subsidy would not
deter demand by much and the government would save money. There are few studies that have
examined this issue. One of them is a British study by Emmerson et al. (2001) who, after the
elimination of the income tax relief on private medical insurance for people over 60 in 1998
calculated the elasticity to be just –0.024. A recent New Zealand report estimates the price
elasticity of demand for PHI to be –0.54 (NZIER, 2001). In Australia, a 30% tax rebate on PHI
take-up, introduced at the beginning of 1999, increased demand by 11%, thus implying an
elasticity of –0.37 (Frech et al., 2002) 10.
The second issue involved in the subsidising of PHI is to what extent private care will actually
substitute public care. That is, whether 1 euro of subsidy reduces public health expenditure by 1
euro or less. A common finding in countries like Jamaica, UK and Spain is that most people that
hold private health insurance on top of their public coverage still use the public sector for much
of their health care (Gertler and Sturm, 1997; Propper, 2000; Rodríguez and Stoyanova, 2004).
This could be viewed as “negative”: the pressure on the public sector is not eased as much as
expected (each additional euro spent on the subsidy saves less than one euro in public health
care spending), or as “positive”: such individuals will, overall, still strongly support increases to
public health care financing (Propper, 2000). Since supplementary PHI in Europe is
predominantly bought by the higher social classes (Mossialos and Thomson, 2004), one of the
arguments against subsidisation is, precisely, that it is regressive and it can lead to a separation
of health care systems: private, “high quality” care for the rich and public, “poor quality”
services for the poor. In fact, in most European countries there are no tax incentives on taking
out supplementary PHI or such incentives have been reduced or abolished in recent years
(Mossialos and Thompson, 2004).
In Spain, the reform drew some attention just after its implementation. Freire (1999) argued
against the fiscal subsidy granted to employer-paid group insurance policies on equity grounds
and because, in his opinion, the reform would only serve to bolster the private health insurance
industry. Ibern (1999) also remarked that the reform could prove beneficial to the industry since
group policies reduce adverse selection and the costs of commercialisation. Through a
simulation based on the 1994 Catalan Health Survey, López-Nicolás and Vera-Hernández
(2003) analysed whether or not tax subsidies on private medical insurance were self-financing
10 The evidence from the US is of limited help here given the tremendous difference in health care systems. But Gruber and Lettau (2004) find the elasticity of the corporate demand for health insurance to be –0.25. (Since public insurance is only for people over 65 or the really poor, most health insurance is employer provided in the US). Gruber and Poterba (1994) also find high negative elasticity in the demand for health insurance by the self-employed.
7

CREAP2006-12
in Spain. They estimated that there would be public savings due to the elimination of the tax
deduction, therefore, not supporting the self-financing hypothesis11.
The issue of the progressiveness of tax relief on private medical expenditure (including private
insurance policies) was studied by Martínez García (1993). Using the Suits index, she
concluded that in 1990 the deduction was nearly proportional, with a certain degree of
regressiveness in the lower income brackets. In terms of the type of expenditure, insurance
premiums (at the time, mostly individually bought) appeared to be also nearly proportional.
Given the extraordinary growth of this deduction before it was eliminated, it would be risky to
extrapolate these results to the situation in 1998. On the other hand, the case for group policies
could be different to that of individual ones.
Regarding the main determinants of the demand for supplementary health insurance in countries
with universal public health care systems Propper (1989 and 1993), Propper et al. (2001) and
Besley et al. (1999) for the UK; Harmon and Nolan (2001) for Ireland; Christiansen et al.
(2002) for Denmark and Johannenson et al. (1998) for Sweden, all report a positive effect of
income and education on the demand for PHI. Women are also found to be more likely to take
out a private insurance policy than men. Age variables exhibit a significant concave and
quadratic relationship. The effect of other personal characteristics such as socio-economic
status, self-employment and house-ownership is not conclusive. The effect of waiting lists as a
measure of public health sector quality is found to be significant in those studies where this
variable is present.
In Spain, the first studies analysing the decision to purchase supplementary private health
insurance (González, 1995 and Vera-Hernández, 1999) found that age, income, educational
level, occupation (being professional or self-employed) and living in certain regions (Balearic
Islands, Catalonia and Madrid) are the main determinants of such decision. Later, other authors
included waiting lists for surgery (Jofre-Bonet, 2000) and a gap in perceived quality between
the public and the private sector (Costa and García, 2003) in their studies and found them also
to be important factors affecting the demand for PHI.
11 Nevertheless, two points should be made: firstly, in their simulation they took into account only the elimination of the tax credit on individually bought policies and ignored the new tax incentives on employer-paid policies and secondly, as far as PHI is concerned, Catalonia can hardly be considered representative of the whole Spanish population. It is well known in Spain that the private insurance market is much larger and has a much longer standing in Catalonia than in most of the other Spanish regions.
8

CREAP2006-12
3. Empirical framework
3.1. Econometric specification
Changes in the probability of buying PHI could be estimated using a basic discrete choice (logit
or probit) model. However, the analysis of the demand for specific types of policy -individual or
collective- is not so straightforward since we would be incurring into a problem of sample
selection. One way to address both issues at the same time and avoid the sample selection
problem is to use a bivariate probit model (van de Ven and van Praag, 198112). The econometric
specification consists, then, of two simultaneous equations. The first models the binary decision
to buy private health insurance or not, 1iy ; the second discriminates between holding
individually purchased or employer-paid insurance, conditional on being privately insured, 2iy .
These equations are initially defined as:
*1 1 1 1*2 2 2 2
,i i i
i i i
y X
y X
β ε
β ε
= +
= + [1]
for individual i , 1,....; .i N= The *1iy and *
2iy are unobserved latent variables indicating an
individual’s propensity to purchase private health insurance and an individual’s propensity to
have individually bought PHI, respectively. The jiX , 1, 2j = , denote the vectors of explanatory
variables.
The estimation strategy relies upon finding factors, i.e. instruments, that affect the decision to
buy private health insurance but do not influence the choice of policy. Individual health status is
a likely candidate, since health is one of the most important determinants of private health
insurance purchase, but it should not affect the kind of policy held13. Another instrument with
possible identifying power would be a variable reflecting the extent and quality of public health
care. This again should influence total insurance take up, but not for any particular policy. The
indicator incorporated is the amount (lagged one year) of public health expenditure per capita in
12 Technical details and discussion of the bivariate probit model are also presented in Green (2000). 13 If insurance companies practised a risk selection strategy this assumption would probably not hold and individuals in poor health would have a lower probability of being accepted for individual coverage compared to the chance of being accepted under a group policy where, by definition health risks are evened out. Spanish health insurance companies adamantly claim they do not practice risk selection except for some who say they do so in the case of older new members. However, this effect should already be captured by “age”.
9
CREAP2006-12
the region of residence14. To check the robustness of the instruments we estimated a bivariate
probit model including said instruments as covariates in the second equation. The two variables
turned out not to be statistically significant, which indicates that they do not determine the type
of insurance policy held. We also performed a log-likelihood ratio test. The value of the LR-
statistic (2.62) permits to accept the null hypothesis about the validity of the instruments.
The remaining terms in equation [1] are the two vectors of parameters to be estimated, 1β
and 2β , the random error terms, 1iε and 2iε , where 1 2( , )i iε ε ~ (0,0,1,1, )BVN ρ , and the
correlation coefficient, 1 2( , )i icorrρ ε ε= .
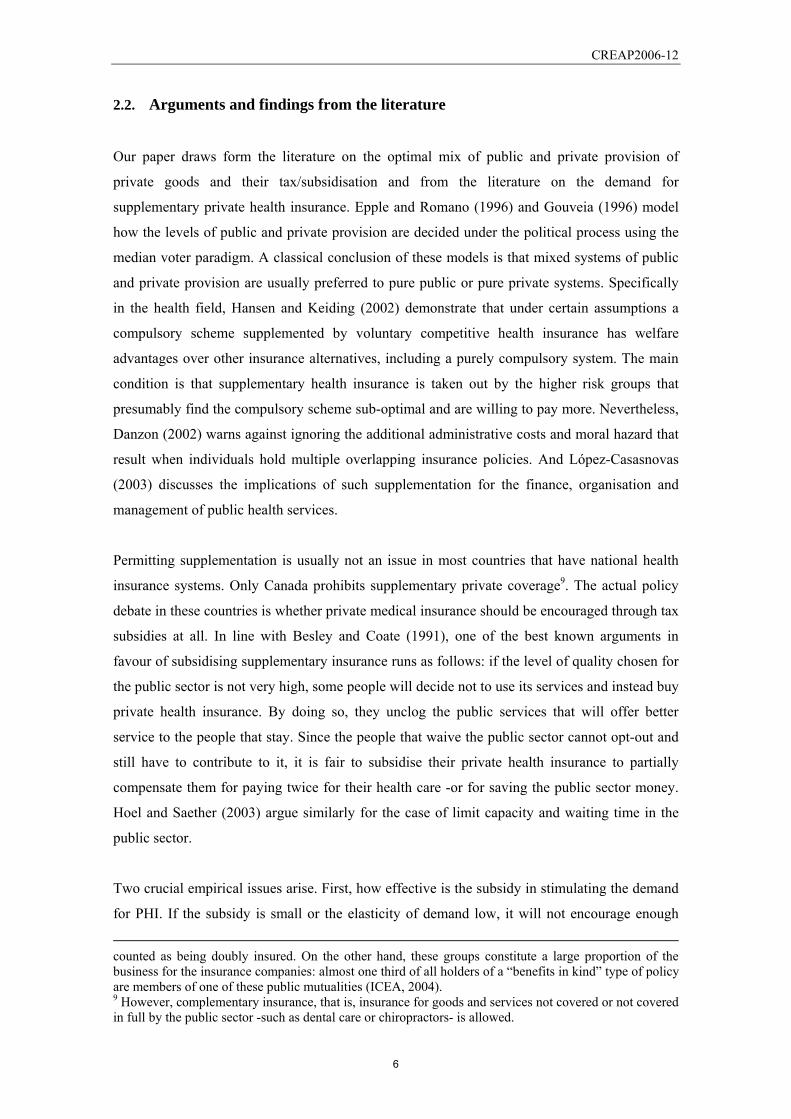
The unobserved propensities 1 2( *, *)i iy y defined in the system of equations [1] can be
measured by means of two binary variables 1iy and 2iy . For 1iy the indicator takes a value of 1
if the individual purchases PHI and 0 otherwise, and for 2iy the indicator takes a value of 1 in
the case of individually purchased PHI and 0 in the case of group employer-paid PHI.
*1
1 *1
1, if 0,0, if 0.⎧ >
= ⎨=⎩
ii
i
yy
y
*2
2 *2
1, if 0,0, if 0.⎧ >
= ⎨=⎩
ii
i
yy
y
This gives rise to three types of observations: insured with an individually contracted policy,
insured holding an employer-paid group policy, and not privately insured. The unconditional
probabilities corresponding to these three types of observations are given by:
1 2 1 2 2 1 1 2 21, 1: Pr( 1, 1) [ , , ]β β ρ= = = = = Φi i i i i i i iy y y y X X
1 2 1 2 2 1 1 2 21, 0 : Pr( 1, 0) [ , , ]i i i i i i i iy y y y X Xβ β ρ= = = = = Φ − −
1 2 1 1 10, 0 : Pr( 0) 1 ( )i i i i iy y y Xβ= = = = −Φ
[2]
where Φ and 2Φ are the univariate and bivariate standard normal cumulative distribution
functions, respectively.
The probabilities defined in [2] yield the following log-likelihood function:
14 Some examples where macro-variables have been used as identifying restrictions are Beenstock and Rahav (2002) and Goldman and Bao (2004). Goldman and Bao (2004) use only macro-variables as instruments, while the instruments defined in Beenstock and Rehav (2002) consist of macro-variables and individual characteristics.
10

CREAP2006-12
( )
12
1 12
2 1 1 2 211
2 1 1 2 2 1 11 00
log ( , , )
log ( , , ) log 1 ( ) .
ii
i ii
i iyy
i i iy yy
LogL X X
X X X
β β ρ
β β ρ β
==
= ==
= Φ +
+ Φ − − + −Φ
∑
∑ ∑ [3]
The above equation is maximized with respect to the two vectors of coefficients and the
correlation coefficient, ρ .
3.2. Data and explanatory variables
The empirical analysis is based on data from the National Health Surveys conducted in 1997
and 2001. After deleting observations from people not responding to one of the relevant
questions and from people insured with a the public mutuality, the final samples contain 5,090
individuals in 1997 and 17,150 in 2001 of 16 years of age and over who belong to different
households that have been randomly selected by means of a stratified random sampling across
Autonomous Communities (regions). For these individuals we have information on their health
insurance take-up and several indicators of their health status and socio-economic
characteristics, the latter referring both to the individual and to the head of the household. Of
special interest to our analysis is the fact that the data provide a distinction between people with
individually purchased PHI and those with PHI bought through the firm. No other national data
set -e.g. the Continuous Family Expenditure Survey or the Spanish section of the European
Community Household Panel (ECHP)- allows for such a distinction to be made. Finally, we
employ the same data sets to revise the patterns of consumption of medical care by type of
insurance, in order to ascertain whether these patterns have changed significantly over the
period.
The choice of years obeys two reasons. First, the availability of the same type of data set before
and after the tax reform. Although there are some differences in the sampling method15 the
questions and wording are practically the same in both surveys. Second, and most importantly,
we reckon that it was probably not until 2001 that the effects of the reform started to take hold.
There are various arguments to support this: i) consumers often take time to acknowledge
15 The main difference is in the distribution of the sample by Autonomous Communities. In the 1997 data set the number of observations by Autonomous Communities follows closely their share in the total Spanish population, while in the 2001 data set smaller regions are given an “extra” weight and more populated ones have relatively less observations.
11

CREAP2006-12
legislative measures and change their behaviour accordingly, ii) employees -already holding an
individually bought policy or not- and their employers would need some time to negotiate
beneficial modifications to their contracts, possibly exchanging part of the monetary wage (or
expected rise in wage) for an employer-paid private health insurance policy16, iii) insurance
companies also needed time to shift their marketing strategy from individuals to enterprises.
The variables appearing in the econometric model are the following. Age and age square, given
previous findings of significant concave and quadratic relationship with PHI demand. Sex has
also been found to influence the decision to buy PHI. Females of prime fertility age are most
particularly known by insurance companies to have a greater likelihood of taking out a private
policy17. Therefore, we include “female” and “female-fertility” (females aged 25-45) as
explanatory variables in our equations. As an indicator of health we incorporate a variable that
combines perceived health status and the presence of chronic conditions. “Good health” is equal
to 1 if the individual reports good or very good health and no chronic conditions; the indicator is
equal to 0 if the individual reports fair, bad or very bad health and/or at least one chronic
condition. As mentioned in the previous section, this variable is only included in the first
equation, but not in the second one, where it does not contribute to explain the dependent
variable.
In almost every study of the demand for supplementary health insurance education appears as a
main determinant in that decision. It also probably influences the type of occupation and the
likelihood of being offered insurance by the firm. Therefore, we have included the individual’s
level of education (four categories) in the two equations. Similarly, occupation (six categories)
is believed to influence both, the decision to purchase PHI and the chance of being offered
group insurance. Earnings are also a favourite in the explanation of the demand for PHI -and
probably also in accounting for the demand for individually bought policies- thus we control for
household disposable income in both equations18. Last among the personal characteristics, we
have included the size of the town of residence since it probably reflects fairly well the
availability of health care supply, both public and private. Presumably, the less available private
16 The decision to offer private health insurance is taken at the firm level through collective bargaining or individual arrangements whose nature is idiosyncratic to each firm and it is not publicly known. On the other hand, employers certaintly use their negotiating power to obtain discounts on policies. In the case of the “benefits in kind” type of insurance, in 2001 the average annual premium of employer-paid group policies was 30% lower than that of individually bought policies: €289.89 versus €415.5 (ICEA, 2002). 17 What they seek is usually private hospital amenities -i.e. private room- when giving birth. 18 Since household disposable income comes as a six interval categorical variable in the survey, and the rate of “no answer” is around 20%, we imputed the household’s monthly income using the interval regression procedure given in Stata (2001). In the regression we controlled for possible differences due to age, sex and level of education of the head of household, labour, social and marital status of the respondent, as well as the autonomous community and size of the town of residence.
12

CREAP2006-12
medical care is, the lower the demand for PHI. Private medical care facilities are usually
concentrated in the bigger cities.
We have also included three macroeconomic variables, collected from official sources. Given
the interrelationship between private and public insurance, the demand for PHI should be
negatively correlated to the extension and quality of services in the public sector, and positively
correlated to the presence and quality of private supply. To capture these effects, and changes in
both sectors during the period, among the covariates in the first equation we have incorporated a
variable measuring lagged public health expenditures per capita (Public Health Expenditures) in
the region of residence and a variable representing the proportion of beds in private hospitals
with high technology equipment19 relative to the total number of beds (public and private) in the
region in each of the previous years (Private High Technology Beds)20. In the second equation
we exclude Public Health Expenditures since it does not help discriminate between the two
types of policy. Instead, we include a proxy for the likelihood of being offered employer-paid
group insurance. Since bigger companies are usually more prone to offer this kind of perk, we
introduce a variable measuring the proportion of firms of over 50 employees with respect to the
total number of enterprises in the region (Medium/Large Firms). This is a factor which we
expect to positively affect the demand for private insurance and, specifically, for employer-paid
health insurance.
Finally, we introduce a dummy variable to capture the effect of the 1998 changes to the tax
treatment of PHI (“Fiscal Reform”). The values it takes are 1 for observations in 2001 and 0 for
observations in 1997. This is somewhat problematic as the coefficient of this dummy may
capture other shocks besides the tax reform. A comparison with a “control” group not affected
by the reform would have been more desirable. However, this was not possible because of the
lack of any population group similar enough (very low income earners and pensioners, in
principle not affected by the reform because the former are exempt from income tax and the
latter are not employed, are not, obviously, random samples of the population. Besides, the
19 A hospital with high technology equipment is defined as a hospital equipped with at least one of the following: Computerised Axial Tomography, Magnetic Resonance, Gamma Camera, Hemodynamics Room, Digital Subtraction Angiography, Extracorporeal Shock Wave Litotripsy, Cobalt Bomb, Particles Accelerator. The information has been extracted from the Catálogo Nacional de Hospitales, 1997 and 2001 which contain data for 1996 and 2000, respectively. 20 The rationale behind the HTbeds variable is twofold: on the one hand, you are less likely to buy a private insurance policy if the supply of beds in private high technology hospitals is relatively small in your region and if hospitalised you are going to end up in a public hospital at all events. (There are no private beds in public hospitals in Spain). On the other hand, the availability of those beds allows the privately insured to avoid the queues in the public sector. We have not used waiting lists directly as a measure of difference in quality between the public and the private sector because, according to our information, waiting lists were, in the years of interest, poorly and heterogeneously recorded in the Spanish regions.
13

CREAP2006-12
pensioners per se are not excluded from the reform since they may hold group insurance as
spouses of employed people). Therefore, the best we could do was to control for the main
relevant changes that may have occurred during the period; essentially, changes to the quantity
and quality of the public and private health care sectors (represented here by Public Health
Expenditures and Private High Technology Beds) and to disposable income21.
The dummy variable appears in the two equations since we want to estimate both, the impact of
the reform on the demand for PHI in general and the differential response by each type of
insurance to the incentives introduced in the 40/1998 Act. As stated in the introduction, the
various tax measures adopted amount to a net increase in the price of individually purchased
PHI and a reduction in the price of corporate policies. We think both types of policies are
normal goods, so we expect a negative effect on the demand for individually bought policies
versus group ones in the second equation. Following the international evidence mentioned in
section two, we expect a low elasticity of demand for individual policies, but we cannot really
speculate with regard to group policies. Therefore, depending on how substantial the level of
substitution of individual for group policies is, one could expect to see no effect, a negative
effect, or a positive effect on the total demand for PHI in the first equation.
Table 1 describes the main characteristics of the individuals in the 1997 and 2001 surveys,
according to the three insurance statuses defined in the econometric model. Firstly, we observe a
slight decline in the proportion of people holding PHI over the period: 11.37% in 1997 versus
9.71% in 2001. The distribution of the privately insured shows a more drastic change. The
percentage of individuals holding group insurance increased by 41% per cent with respect to
1997, jumping from 18% to over 25% of the total.
[Insert Table 1 about here]
In terms of age there are clear differences between the two groups of privately insured.
Subscribers of group policies are noticeably younger than their individually insured
counterparts. Sex is another interesting variable. Although there are no significant differences in
the number of men and women that contract PHI, females constitute only one third of the people
in the employer-paid insurance category. Privately insured individuals report, in general, better
21 Controlling for current household disposable income should pick up any differences in the effect of the reform of the Personal Income Tax in which the shift in the tax treatment of PHI was embedded and, more important, it should also capture the macroeconomic trend of growth of the Spanish economy during those years. In fact, national accounts show a 32% increase in GDP at current prices during the 4 year period between 1997 and 2001; this figure is quite close to the 30% increase in disposable income in our sample of individuals.
14

CREAP2006-12
health than those who do not have PHI. Nonetheless, the increase in the proportion of people
with not good health is more pronounced among those that take out an individual policy
directly. Regarding education, compared to the population who do not purchase PHI, those who
do so have, on average, a higher level of education. In 2001 a quarter of the individuals with
PHI were university graduates (30% among subscribers of individual policies and around 19%
among those with a group policy), while in the non-PHI category only 10.4% held a university
degree.
Average disposable household monthly income is also higher in the two groups of people with
PHI for both years. Regarding the last occupation of the interviewed, the most interesting
feature is the increase in privately insured individuals (holding other type of policy) among the
unqualified workers. In the case of group policies the change could be accounted for by the
increasing number of immigrant workers in sectors such as agriculture and construction, as well
as the navy, for whom employers might take out a group policy. Finally, while in 1997 privately
insured individuals were mainly concentrated in the bigger cities, the figures for 2001 show that
the geographical distribution was then more even. This may indicate the success of the
marketing of their products all around the territory by the insurance companies, and/or the
movement of the better off amongst the population, principal buyers of PHI, away from the
larger cities towards the smaller neighbouring communities.
15

CREAP2006-12
4. Econometric results
Table 2 reports our estimated results. In equation 1, the decision to purchase PHI appears to be
significantly determined by several of the potentially explanatory variables, none of which is the
fiscal reform, which does not seem to have affected total demand for PHI. We tested the
robustness of this result in several ways. First, we estimated a model that excluded Public
Health Expenditures and Private High Technology Beds (the variables meant to capture
differences and changes over the period in the quantity and quality of the public and private
health sectors) from the explanatory variables. In this case the Fiscal Reform dummy comes out
to be significant, which may be interpreted as indicating that this variable now captures the
changes represented by the two excluded ones. Secondly, we estimated the demand for private
insurance using the 1995-2001 waves of the ECHP22, and found no significant differences.
Working with the panel structure of the survey we examined whether or not it was the same
individuals who had private insurance before and after the reform. The percentage of people
saying that they had private insurance is around 10,2% every year; approximately half have
private insurance in all periods while the other half move in and out of private insurance with no
clear pattern emerging, except that 2% entered anew in 2001, possibly into group insurance, but
we cannot be sure since this data set does not distinguish between the two types of policy.
[Insert Table 2 about here]
Good health has a significant negative impact on the demand for private insurance, a result
consistent with common wisdom in health economics. Also as expected, the higher the level of
education the greater the probability of buying PHI. Likewise, income comes forth as having a
highly significant positive effect on this probability. Among the occupational categories,
employers and the self-employed show a positive significant sign, in line with previous findings
in Spain. However, professionals show a significant negative sign, contrary to what we had
expected. We have no adequate explanation to account for this result. As for town size, only the
residents of Madrid and Barcelona (the two cities with of over 1,000,000 inhabitants) show a
significantly higher probability of buying private health insurance. Finally, the level of public
health expenditures per capita in the region shows a significantly negative effect on the demand
for PHI, while the supply of beds in private high technology hospitals exerts a significantly
22 We ignore the 1994 wave because the question on insurance coverage did not distinguish between private and public insurance. The estimation is made using the balanced panel of individuals present in all seven waves. The set of explanatory variables was defined as similarly as possible to that used in the bivariate probit estimation.
16
CREAP2006-12
positive effect, thus confirming our expectations and the ability of these variables to capture the
intertwining of the two sectors.
The most important result from the second equation is the negative and significant sign of the
coefficient of the fiscal reform variable. As expected, the reform lowered the demand for
individually purchased PHI. According to the last column of table 2, which contains the
marginal effects thereof, for the average person the probability of buying an individual policy
declined by 0.08 points. On the other hand, being female has a significantly positive effect on
the demand for this kind of policy compared to employer-paid group policies; the average
partial effect implies an increase in the probability of around 0.05 points. This can quite
probably be explained by the fact that women participate less in the labour market. Being a
female of prime fertile age has an additional distinctly positive effect on the probability of
holding an individually bought insurance policy. Such women have a 6.4% higher probability of
holding an individual policy than women in general.
Income also makes a significant difference in favour of the probability of purchasing PHI
coverage directly. Given its partial effect, a 10% increase in the logarithm of monthly income
increases the probability of buying an individual policy by 15%. Regarding occupation, the
results are quite reasonable: employers and the self-employed have a greater likelihood of
buying an individual policy, while professionals and qualified and non-qualified workers show a
negative probability. Residents in the larger cities (over 400,000 inhabitants) also have, as
expected, a significantly higher probability of purchasing insurance individually. Living in a
region with a larger supply of beds in private hospitals with high technology equipment exhibits
the greatest partial effect: the probability of having individually bought insurance increases by
0,73 percentage points. As for the variable capturing the effect of medium/large sized
enterprises on the type of insurance held, our results confirm its explanatory power. The
negative significant sign indicates that the greater the proportion of companies of over 50
employees in the region of residence, the lower the probability that the insurance held is
individually purchased. The probability falls by around 0.05 points.
17

CREAP2006-12
5. Discussion
5.1. Impact on the demand for private health insurance
The Spanish reform of the tax treatment of PHI contrasts with other cases studied in the
literature in which tax credits were eliminated but no incentives created. In our case, the reform
clearly encouraged the substitution of individual policies for group employer-paid schemes,
which turns it especially interesting.
Given that the shift in incentives increased the price of individually bought policies while at the
same time reducing the price of employer-paid ones, we expected a negative effect on the
demand for individually bought policies versus group schemes in the second equation. Our
results fit with expected behaviour. After controlling for other variables, the marginal effect of
the reform was to cause a decline of 0.08 percentage points in the probability of purchasing
individual PHI (see last column of table 2), a fall of about 10% with respect to the probability
prevailing in 1997. Two price effects are at work here: first, the own-price elasticity due to the
elimination of the deduction and, second, the cross-price elasticity effect due to the fall in the
price of its substitute, group employer policies23. Both price effects act in the same direction:
they reduce the demand for individual policies, although it is impossible to disentangle their
share in that decline. Therefore, we cannot calculate the own-price elasticity, although it seems
to be low, in line with other results found in the literature.
We also said that, depending on how substantial the substitution of individual for group policies
was, we might expect no effect, a negative effect, or a positive effect on the total demand for
PHI in the first equation. The results of the econometric estimation support the hypothesis that
the 1998 changes in the tax treatment of PHI did not significantly alter overall demand. The fall
in the demand for individual policies appears to have been offset by an increase in the demand
for group employer-paid schemes due to the same, but reversed, price effects as those affecting
individual policies24. However, attempts to verify this result with figures from the industry are
somewhat frustrating. It is well known among health economists in Spain that it is very difficult
23 Other things being equal, the price of individual policies went up by 9% (a 15% increase due to the elimination of the deduction minus 6% subsidy from the exemption on the tax on insurance premiums) while the price of employer-paid policies went down, on average, by 22.04% (16.04% average tax rate in 2001 plus 6% exemption on the tax on insurance premiums). 24 Descriptive statistics from the series of National Health Surveys in the nineties show a marked jump in 2001 in the percentage of group insurance policies; the figures for 1993, 1995, 1997 and 2001 are 19.2%, 16,3%, 17,9% and 25.4%, respectively. The total percentage of people holding private health insurance in the same years was 8.2%, 11.4%, 11.3% and 9.7%, respectively.
18

CREAP2006-12
to obtain reliable and homogeneously defined data from the insurance companies25. But internal
reports often talk of “stability” in terms of the number of insured persons during that period
(Guerrero Gilabert, 2001). Also, the number of subscribers under the “services in kind” category
for 1997 reported by Murillo (2000) -citing data from UNESPA, the insurance industry
association- is very similar to the number in 2001 given by ICEA (2002).
Although the results are not shown here26, we also estimated the model for different groups of
the population. Specifically, we tested the results for males and females and for people earning
over and lower than average income, separately. Some interesting findings are the following: in
the first equation, health status is not a significant determinant of the demand for PHI either for
men or for people of over average income. It is, however, significant for women and for people
earning lower than average income. Being a female exerts a positive effect on the total demand
for PHI in the case of people earning over average income, but it makes no difference for people
below that average. In equation two, we note that among people earning over the average
income, being female increases the probability of taking out an individual policy, but among
people below that average it is being a female in prime fertility age that counts. The coefficient
of the income variable is greater for men and persons earning over the average income than for
women and those below that average. Regarding occupation, the professionals that show a
significantly negative sign with respect to the choice of an individual policy are women and
people of below average income. The rest of the coefficients and signs are quite similar to those
of the general sample.
5.2. Impact on state budget
In 1998, before the deduction was eliminated from the PIT, the total amount deducted for
medical expenditure was 656.6 million euro. Since 18.5% of all private medical expenditure
was on insurance premiums (INE, 1999), the estimated revenue forgone by the government on
this item alone was approximately 121.5 million euro. Or, in other words, this is the amount the
government saved with the removal of the deduction on individually purchased policies.
To calculate the fiscal expenditure incurred by subsiding group employer-paid policies, we take
into account the fact that the average premium for group policies was €289.89 in 2001 (ICEA,
2002). Since this is not considered taxable income, the government forgoes the average tax rate
25There are problems with how the different categories of policy (“services in kind”, “reimbursement of medical expenditures” and “sickness compensations”) are aggregated and with members of the public mutualities not being rigorously counted apart -at least, not until 2001. 26 Available on request.
19

CREAP2006-12
times 289.89 euro for each policy held. The average tax rate in 2001 equalled 16.04%27. The
average cost of the subsidy was then 46.5 euro per policy. Given the total number of group
policies in 2001 (1,243,485 according to ICEA, 2002) we calculate the fiscal expenditure on this
specific incentive to be around 55 million euro. To this we have to add 158.8 million euro, the
official amount of tax money foregone with the exemption from the tax on health insurance
premiums granted to both types of policy (Ministerio de Economía y Hacienda, 2002). Thus, the
total revenue lost by the government with the introduction of the two new subsidies is 213.8
million euro, which outweighs the savings made by the elimination of the previous tax credit on
individual policies (121.5 million euros). This is the effect on the revenue side if we focus on
private health insurance alone. If we look, however, at the full effect of the reform, including the
elimination of the deduction on all private medical expenditures, he result is quite different: the
government saved approximately 362 million euro in fiscal benefits.
Now, looking at the impact on the expenditure side of the budget, the effect could potentially
come from either a rise in the consumption of public medical care derived from an increase in
the number of people without private health insurance, or from changes to the pattern of use of
public and private services by the privately insured. We know that the proportion of people with
and without PHI changed very little so, the predicted flow of new users to the public sector did
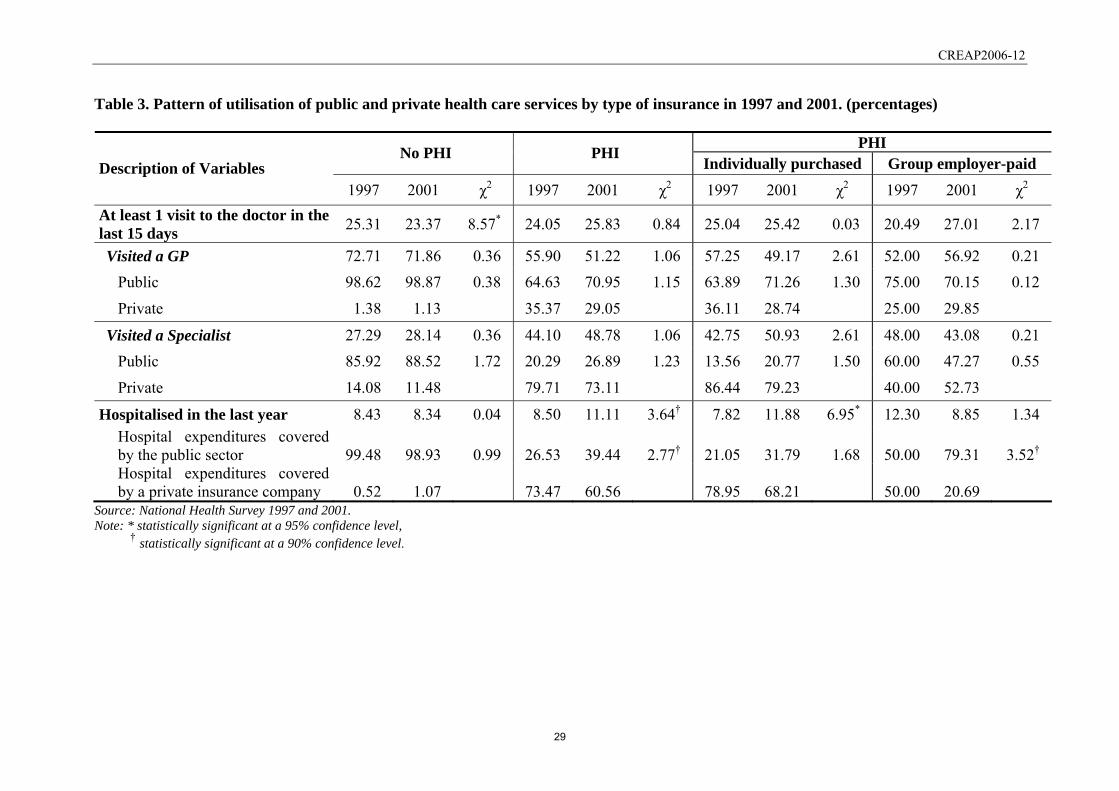
not occur. Regarding possible changes to the patterns of utilisation of health care services, Table
3 describes such patterns and suggests that the proportion and distribution of medical visits and
hospitalisations by insurance categories remained unchanged between 1997 and 200128.
Although one may observe a certain increase in the use of public services by people with and
without PHI, none of these differences are significant at the 95% level29. In short, the aim of
avoiding increased pressure on public health care expenditure would seem to have been
accomplished, and thus the balance of the reform would seem clearly positive for the
government.
27 Since individuals with group PHI have higher average income than those without, their average tax rate is probably higher and our calculation may thus underestimate total fiscal expenditure. 28 Let us note in passing that this also suggests that people that used to pay directly for private medical services was hardly affected by the elimination of the 15% deduction on all private medical expenditures. 29 This is not surprising since absolute figures for some of these cells are really low: e.g. only 15 people with a group policy were hospitalised in 1997; that 50% used a public hospital means 7 did. Larger samples would be needed in order to be able to make a more definite statement.
20

CREAP2006-12
5.3. Impact on society and the industry
An important actor at stake potentially affected by this policy change is the private health
insurance industry. Although a detailed analysis is beyond the scope of this study, we would
like to briefly sketch out some of the issues of possible concern. From the point of view of the
industry, it is positive that the reform would not appear to have had any effect on the overall
size of the market. However, the change in the distribution of individually bought and group
employer-paid policies could affect industry profits in two ways. Firstly, through the “squeeze”
in premiums due to the growth of group policies30. Secondly, through a change in risk rate due
to a modification of the average age-sex-health of subscribers. In principle, group insurance
lowers the chance of adverse selection, but the descriptive statistics provided in Table 1 indicate
a possible increase in risk, above all among those with individually purchased insurance.
From the point of view of society, maintaining the mix of public and private supply can also be
interpreted as a positive outcome. On the one hand, because the mix provides a basis for the
healthy benchmarking of the two sectors; on the other, because the existence of private health
insurance allows for channelling of the heterogeneity of willingness to pay for certain services
(Vera Hernández, 2003).
Nevertheless, the reform was not neutral as far as people potentially affected. There are certain
groups in society that inherently have less opportunity of buying group insurance, or of moving
into group insurance, than others. Such is the case of pensioners (since they are too old or too ill
to work), the unemployed, people who do not form part of the work force and, lastly, the self-
employed31. Since women make up a disproportionately large part of some of the
abovementioned categories, it is not surprising that they are clearly underrepresented in the
number of subscribers to group policies shown in Table 1. For them, the reform had a negative
welfare effect since they have less choice. A final issue is whether the shift in fiscal incentives
has improved or worsened the progressiveness of the tax relief. This is, again, a topic we will
have to leave for future research.
30 This “squeeze” could very well threaten the survival of some companies in the medium/long run if the trend of replacing individual with group policies were to continue at the same rate. 31 The discrimination against the self-employed was corrected by Act 46/2002, art. 14, which came into effect in 2003. It provides for the premiums paid on private health insurance by the self-employed and their families to be considered allowable expenditure when calculating net income. The same act increased the limit exempt from taxable income to €500 per person.
21

CREAP2006-12
References
Beenstock M, Rahav G. Testing Gateway Theory: Do cigarette prices affect illicit drug use? J
Health Econ 2002; 21: 679-698.
Besley T, Coate S. Public provision of private goods and the redistribution of income. Am Econ
Rev 1991; 81: 979-984.
Besley T, Hall J, Preston I. The demand for private health insurance: do waiting lists matter? J
Public Econ 1999; 72: 155-181. DOI: 10.1016/S0047-2727(98)00108-X
Centro de Investigaciones Sociológicas 1997. Encuesta Nacional de Salud 1997.
Christiansen T, Lauridsen J, Kamper-Jørgensen F. Demand for Private Health Insurance and
Demand for Health Care by Privately and Non-privately Insured in Denmark. Health
Economics Paper 2002: 1. Institute of Public Health, University of Southern Denmark.
Costa J, García J. Demand for Private Health Insurance: How important is the quality gap?
Health Econ 2003; 12: 587-599. DOI: 10.1002/hec.756
Danzon P.M. Welfare effects of supplementary insurance: a comment. J Health Econ 2002; 21:
923-926. DOI: 10.1016/S0167-6296(02)00060-7
Emmerson C, Frayne Ch, Goodman A. Should private medical insurance be subsidised? The
King's Fund Review of Health Policy 2001, Health Care UK 2001, 51(4) 49-65.
Epple D, Romano RE. Public provision of private goods. J Political Econ 1996; 104: 57-84.
Frech T, Hopkins S, MacDonald G. The Australian private health insurance boom: was it
subsidies or liberalised? Departmental Working papers 4-2002, Department of
Economics, University of California, Santa Barbara.
http://www.econ.ucsb.edu/cgi-bin/workpapers.cgi#2002 [30 January 2005].
Freire JM. La nueva fiscalidad de los seguros sanitarios privados y el Sistema Nacional de
Salud. Gac Sanit 1999; 13(3): 233-236.
22

CREAP2006-12
Gertler P, Sturm R. Private Health Insurance and Public Expenditures in Jamaica. J Econom
1997; 77: 237-257. DOI:10.1016/S0304-4076(96)01814-3
Goldman D., Bao Y. Effective HIV Treatment and the Employment of HIV+ Adults. Health
Serv Re 2004; 39(6): 1691-1712.
González Y. La demanda de seguros sanitarios. Rev Econ Aplicada 1995; 3(8): 111-142.
Gouveia M. The public sector and health care. Int Tax Publ Finance 1996; 3: 329-349. DOI:
10.1007/BF00418948
Green W. Econometric Analysis (4th Edition). Prentice-Hall: NJ, 2000.
Gruber J, Poterba J. Tax Incentives and the Decision to Purchase Health Insurance: Evidence
from the Self-Employed. Q J Econ 1994; 109(3): 701-733.
Gruber J, Lettau M. How elastic is the firm’s demand for health insurance? J Public Econ 2004;
88: 1273-1293. DOI: 10.1016/S0047-2727(02)00191-3
Guerrero Gilabert JI. Situación actual de los seguros de salud en España. Jornadas de ICEA
(Investigación Cooperativa entre Entidades Aseguradoras y Fondos de Pensiones) 2001.
Mimeo.
Hansen BO, Keiding H. Alternative health insurance schemes: a welfare comparison. J Health
Econ 2002; 21: 739-756. DOI: 10.1016/S0167-6296(02)00062-0
Harmon C, Nolan B. Health Insurance and Health Services Utilization in Ireland. Health Econ
2001; 10: 135-145. DOI: 10.1002/hec.565
Hoel M, Saether EM. Public Health Care with Waiting Time: The Role of Supplementary
Private Health Care. J Health Econ 2003; 22: 599-616. DOI: 10.1016/S0167-
6296(03)00007-9
Ibern P. Seguros sanitarios colectivos y desgravación fiscal. Gac Sanit 1999; 13(3): 236-238.
ICEA. El seguro de salud. Estadística año 2001. Informe nº 872, 2002.
ICEA. Anuario de los seguros de salud; 2004.
23

CREAP2006-12
IEF. BADESPE. Estadística de IRPF. Principales deducciones y ajustes. 2003
www.estadief.minhac.es [21 Diciembre 2004].
Instituto Nacional de Estadística. Encuesta Continua de Presupuestos Familiares 1998 and 1999.
Instituto Nacional de Estadística. Directorio nacional de empresas (DIRCE). Datos de empresas.
Years 1996 and 2000.
Jofre-Bonet M. Public health care and private insurance demand: the waiting time as a link.
Health Care Manag Sci 2000; 3: 51-71. DOI: 10.1023/A:1019024903898
Johannnensson M, Johansson PO, Söderqvist T. Time spent on waiting lists for medical care: an
insurance approach. J Health Econ 1998; 17(5): 627-644. DOI: 10.1016/S0167-
6296(97)00044-1
Ley 13/1996, de 30 de diciembre, de Medidas fiscales, administrativas y del Orden social, BOE
de 31 de Diciembre de 1996, nº 315.
Ley 40/1998, de 9 de diciembre, del Impuesto sobre la Renta de las Personas Físicas y otras
Normas Tributarias, BOE de 10 de Diciembre de 1998, nº 295.
Ley 46/2002, de 18 de diciembre, de reforma parcial del Impuesto sobre la Renta de las
Personas Físicas y por la que se modifican las Leyes de los Impuestos sobre Sociedades y
sobre la Renta de no Residentes, BOE de 19 de Diciembre de 2002, nº 308.
López Casasnovas G. 2003. Nuevos paradigmas de la provisión pública de bienes privados
preferentes: el caso de la sanidad. In El interfaz público-privado en sanidad, López
Casasnovas G. (ed). Masson: Barcelona, 2003.
López-Nicolás A, Vera-Hernández M. Are tax subsidies for private medical insurance self-
financing? Evidence from a microsimulation model for outpatient and inpatient episodes.
Working paper nº 632, Dept. of Economics and Business (UPF): Barcelona, 2003.
Martínez García E. Efectos redistributivos de los gastos fiscales en el IRPF. Estudio particular
del gasto sanitario privado. Universidad de Barcelona: Barcelona, 1993.
24

CREAP2006-12
Martínez García E, Sáez Zafra M, López Casasnovas G. El aseguramiento y otros gastos
sanitarios privados: Financiación mediante impuestos y progresividad. Ministerio de
Sanidad y Consumo: Madrid, 1999.
Ministerio de Economía y Hacienda 1991. Memoria de la Administración Tributaria: 1990.
Madrid.
Ministerio de Economía y Hacienda 1999. Memoria de la Administración Tributaria: 1998.
http://documentacion.minhac.es/doc/Inspgral/Memorias/memoria98.pdf [15 December
2005].
Ministerio de Economía y Hacienda 2001. Memoria de la Administración Tributaria: 2001.
http://documentacion.minhac.es/doc/Inspgral/Memorias/memoria2001.pdf [15 December
2005].
Ministerio de Sanidad y Consumo 2001. Encuesta Nacional de Salud 2001.
Ministerio de Sanidad y Consumo 1998. Catálogo Nacional de Hospitales 1997.
Ministerio de Sanidad y Consumo 2001. Catálogo Nacional de Hospitales 2001.
http://www.msc.es/centros/catalogo/estadistica/camas.asp [10 February 2006].
Mossialos E, Thomson S, et al. Voluntary Health Insurance in the European Union. WHO,
European Observatory on Health Systems and Policies: Brussels, 2004.
Murillo C. (Director) Prospectiva de cambios en el sector asegurador en España y su
interrelación con el sistema de salud. Ministerio de Sanidad y Consumo: Madrid, 2000.
New Zealand Institute of Economic Research. The tax treatment of health insurance premiums.
Report to the Health Funds Association of NZ; 2001.
http://www.nzier.org.nz/SITE_default/SITE_publications/report/2001_Reports.asp [30
January 2005]
OECD Health Data 2004. OECD: Paris; 2005.
Propper C. An econometric analysis of the demand for private health insurance in England and
Wales. Appl Econ 1989; 21: 727-792.
25
CREAP2006-12
Propper C. Constrained choice sets in the U.K. demand for private medical insurance. J Public
Econ 1993; 51: 287-307. DOI: 10.1016/0047-2727(93)90067-4
Propper C. The demand for private health care in the UK. J Health Econ 2000; 19: 855-876.
DOI: 10.1016/S0167-6296(00)00045-X
Propper C, Rees H, Green K. The demand for private medical insurance in the UK: A Cohort
Analysis. Econ J 2001; 111(May): C180-C200.
REAL DECRETO 214/1999, de 5 de febrero, por el que se aprueba el Reglamento del Impuesto
sobre la Renta de las Personas Físicas, BOE de 9 de Febrero de 1999, nº 34.
Rodríguez M, Stoyanova A. The effect of private insurance access on the choice of
GP/specialist and public/private provider in Spain. Health Econ 2004; 13: 689-703. DOI:
10.1002/hec.832
STATA 7. Stata Statistical Software; Stata Corporation; 2001.
Van de Ven W, Van Praag B. The Demand for Deductibles in Private Health Insurance: A
Probit Model with Sample Selection. J Econometrics 1981; 17(2): 229-252.
Vera-Hernández AM. Interacciones entre seguro público y privado en sanidad. In El interfaz
público-privado en sanidad, López Casasnovas G. (ed). Masson: Barcelona, 2003.
Vera-Hernández AM. Duplicate coverage and demand for health care. The case of Catalonia.
Health Econ 1999; 8: 579–598. DOI: 10.1002/(SICI)1099-1050(199911)8:7<579::AID-
HEC478>3.0.CO;2-P
WHO. The World Health Report 2000. Health Systems: Improving Performance. World Health
Organization: Geneva; 2000.
26

CREAP2006-12
Table 1. Characteristics of individuals in the 1997 and 2001 samples, by health insurance status.
PHI No PHI Individually purchased Group employer-paid Variables
1997 2001 χ2/t 1997 2001 χ2/t 1997 2001 χ2/t N 5090 17150 535 1374 118 471 % (of total N) 88.63 90.29 13.02* 9.32 7.23 29.47* 2.05 2.48 29.47*
% (of total PHI) 81.93 74.47 14.89* 18.07 25.53 14.89*
Age (mean) 44.27 45.73 4.82* 41.41 44.17 3.20* 38.94 38.65 0.21Sex (%)
Female 51.45 52.06 0.57 51.21 52.98 0.48 33.90 33.76 0.01Male 48.55 47.94 48.79 47.02 66.10 66.24
Female fertility (%) Female aged 25-45 18.19 19.31 3.15† 24.11 24.09 0.01 13.56 16.99 0.81
Health§ (%) Good health 54.28 52.44 5.33† 60.37 54.08 6.19† 65.25 60.08 1.06Not good health 45.72 48.56 39.63 45.92 34.75 39.92
Education (%) Without studies 16.56 14.00 21.32* 3.74 3.42 5.46 4.24 2.12 6.22Primary 50.61 51.62 29.91 33.55 48.31 39.70 Secondary 23.03 23.97 38.88 33.48 28.81 39.49 University 9.80 10.41 27.48 29.55 18.64 18.68
Occupation (%) Without occupation 32.77 20.43 470.2* 32.15 16.45 88.68* 22.88 6.58 36.24*
Farmer 4.01 4.68 2.24 1.02 0.00 1.49 Employer / Self-employed 7.47 14.69 11.96 18.78 4.24 7.01 Professionals 5.44 6.55 12.15 14.77 6.78 14.44 Qualified worker 31.69 30.16 36.07 34.57 50.85 46.50 Unqualified worker 18.62 23.48 5.42 14.41 15.25 23.99
Household income (mean) 777€ 1025€ 45.15* 1067€ 1269€ 8.61* 989€ 1311€ 9.01*
Size of town of residence Under 2,000 7.80 9.92 99.13* 4.11 5.02 73.23* 11.86 5.31 35.72*
2,001-10,000 18.74 19.60 8.22 13.46 6.78 12.74 10,001-50,000 25.15 24.46 15.70 18.92 19.49 27.39 50,001-100,000 8.41 10.23 6.73 8.73 7.63 11.25 100,001-400,000 24.11 24.24 19.63 25.04 17.80 23.99 400,001-1,000,000 6.66 5.50 3.93 6.33 1.69 4.46 Over 1,000,000 9.14 6.04 42.68 22.49 34.75 14.86
Source: National Health Survey 1997 and 2001. Note: § Good health: individuals that report good or very good health and no chronic condition; No good health: individuals that report
fair, bad or very bad health and/or at least one chronic condition. * statistically significant at a 95% confidence level, † statistically significant at a 90% confidence level.
27

CREAP2006-12
Table 2. Bivariate probit estimation results (standard errors shown in brackets).
Equation 1. 1 1iy = for those who have
PHI
Equation 2. 2 1iy = for those who have individually bought PHI
Coef. (Std. Err.)
Avg. partial effects
Coef. (Std. Err.) Avg.
partial effects
Constant -8.4023* (0.3448) -5.3727* (0.6879) Fiscal Reform 0.0399 (0.0490) 0,0055 -0.2999* (0.0585) -0.0785 Good health -0.0591* (0.0243) -0,0081 Age 0.0211* (0.0041) 0,0029 -0.0112 (0.0089) -0.0029 Age squared -0.0001* (0.0000) 0,0000 0.0003* (0.0001) 0.0001 Female 0.0276 (0.0307) 0,0038 0.1899* (0.0628) 0.0497 Female fertility -0.0535 (0.0379) -0,0073 0.1995* (0.0781) 0.0522 Primary education 0.3608* (0.0734) 0,0494 0.2649* (0.1320) 0.0693 Secondary education 0.6697* (0.0624) 0,0917 0.6249* (0.1382) 0.1635 University education 0.8060* (0.0681) 0,1104 0.9751* (0.1463) 0.2551 Farmer 0.0302 (0.0880) 0,0041 -0.0745 (0.1997) -0.0195 Employer / Self-employed 0.1085* (0.0460) 0,0149 0.2013* (0.1000) 0.0527 Professional -0.1212* (0.0533) -0,0166 -0.5085* (0.1019) -0.1330 Qualified worker 0.0566 (0.0377) 0,0077 -0.3477* (0.0771) -0.0910 Unqualified worker -0.0095 (0.0418) -0,0013 -0.4690* (0.0846) -0.1227 Log Household Income 0.9976* (0.0527) 0,1366 0.5639* (0.1004) 0.1475 2,001-10,000 inhabitants -0.0767 (0.0554) -0,0105 0.0874 (0.1147) 0.0229 10,001-50,000 inhabitants -0.0895† (0.0531) -0,0123 -0.0262 (0.1072) -0.0068 50,001-100,000 inhabitants -0.0644 (0.0624) -0,0088 -0.0268 (0.1225) -0.0070 100,001-400,000 inhabitants -0.0876 (0.0535) -0,0120 0.0793 (0.1075) 0.0208 400,000-1,000,000 inhabitants -0.0205 (0.0688) -0,0028 0.2734* (0.1371) 0.0715 Over 1,000,000 inhabitants 0.4829* (0.0574) 0,0661 0.5694* (0.1180) 0.1490 Public Health Expenditures -0.0018* (0.0002) -0,0003 Private High Technology Beds 1.9779* (0.1477) 0,2709 2.8112* (0.2606) 0.7355 Medium /Large Firms -0.1899* (0.0427) -0.0497 Correlation of error terms ( )ρ -0.7758* (0.1302) N 24,488 Log-likelihood -7995.60
Wald 2χ (22) 1961.46* Note: * statistically significant at a confidence level of 95%,
† statistically significant at a confidence level of 90%..
28
CREAP2006-12
Table 3. Pattern of utilisation of public and private health care services by type of insurance in 1997 and 2001. (percentages)
PHI No PHI PHI Individually purchased Group employer-paid Description of Variables
1997 2001 χ2 1997 2001 χ2 1997 2001 χ2 1997 2001 χ2 At least 1 visit to the doctor in the last 15 days 25.31 23.37 8.57* 24.05 25.83 0.84 25.04 25.42 0.03 20.49 27.01 2.17
Visited a GP 72.71 71.86 0.36 55.90 51.22 1.06 57.25 49.17 2.61 52.00 56.92 0.21 Public 98.62 98.87 0.38 64.63 70.95 1.15 63.89 71.26 1.30 75.00 70.15 0.12
Private 1.38 1.13 35.37 29.05 36.11 28.74 25.00 29.85
Visited a Specialist 27.29 28.14 0.36 44.10 48.78 1.06 42.75 50.93 2.61 48.00 43.08 0.21 Public 85.92 88.52 1.72 20.29 26.89 1.23 13.56 20.77 1.50 60.00 47.27 0.55
Private 14.08 11.48 79.71 73.11 86.44 79.23 40.00 52.73
Hospitalised in the last year 8.43 8.34 0.04 8.50 11.11 3.64† 7.82 11.88 6.95* 12.30 8.85 1.34 Hospital expenditures covered by the public sector 99.48 98.93 0.99 26.53 39.44 2.77† 21.05 31.79 1.68 50.00 79.31 3.52† Hospital expenditures covered by a private insurance company 0.52 1.07 73.47 60.56 78.95 68.21 50.00 20.69
Source: National Health Survey 1997 and 2001. Note: * statistically significant at a 95% confidence level,
† statistically significant at a 90% confidence level.
29

SÈRIE DE DOCUMENTS DE TREBALL DEL CREAP
2006 CREAP2006-01 Matas, A. (GEAP); Raymond, J.Ll. (GEAP) "Economic development and changes in car ownership patterns" (Juny 2006) CREAP2006-02 Trillas, F. (IEB); Montolio, D. (IEB); Duch, N. (IEB) "Productive efficiency and regulatory reform: The case of Vehicle Inspection Services" (Setembre 2006) CREAP2006-03 Bel, G. (GPRE); Fageda, X. (GPRE) "Factors explaining local privatization: A meta-regression analysis" (Octubre 2006) CREAP2006-04 Fernàndez-Villadangos, L. (GPRE) "Are two-part tariffs efficient when consumers plan ahead?: An empirical study" (Octubre 2006) CREAP2006-05 Artís, M. (AQR); Ramos, R. (AQR); Suriñach, J. (AQR) "Job losses, outsourcing and relocation: Empirical evidence using microdata" (Octubre 2006) CREAP2006-06 Alcañiz, M. (RISC); Costa, A.; Guillén, M. (RISC); Luna, C.; Rovira, C. "Calculation of the variance in surveys of the economic climate” (Novembre 2006) CREAP2006-07 Albalate, D. (GPRE) "Lowering blood alcohol content levels to save lives: The European Experience” (Desembre 2006) CREAP2006-08 Garrido, A. (IEB); Arqué, P. (IEB) “The choice of banking firm: Are the interest rate a significant criteria?” (Desembre 2006)
30
SÈRIE DE DOCUMENTS DE TREBALL DEL CREAP
2006 CREAP2006-09 Segarra, A. (GRIT); Teruel-Carrizosa, M. (GRIT) "Productivity growth and competition in spanish manufacturing firms: What has happened in recent years?” (Desembre 2006) CREAP2006-10 Andonova, V.; Díaz-Serrano, Luis. (CREB) "Political institutions and the development of telecommunications” (Desembre 2006) CREAP2006-11 Raymond, J.L.(GEAP); Roig, J.L.. (GEAP) "Capital humano: un análisis comparativo Catalunya-España” (Desembre 2006) CREAP2006-12 Rodríguez, M.(CREB); Stoyanova, A. (CREB) "Changes in the demand for private medical insurance following a shift in tax incentives” (Desembre 2006)
31