CHANGES IN OBESITY-RELATED FOOD BEHAVIOR - CORE
171
CHANGES IN OBESITY-RELATED FOOD BEHAVIOR: A NUTRITION EDUCATION INTERVENTION TO CHANGE ATTITUDES AND OTHER FACTORS ASSOCIATED WITH FOOD-RELATED INTENTIONS IN ADOLESCENTS: AN APPLICATION OF THE THEORY OF PLANNED BEHAVIOR A Dissertation by DIANE ELIZABETH CARSON Submitted to the Office of Graduate Studies of Texas A&M University in partial fulfillment of the requirements for the degree of DOCTOR OF PHILOSOPHY May 2010 Major Subject: Nutrition brought to you by CORE View metadata, citation and similar papers at core.ac.uk provided by Texas A&M University
-
Upload
khangminh22 -
Category
Documents
-
view
2 -
download
0
Transcript of CHANGES IN OBESITY-RELATED FOOD BEHAVIOR - CORE
CHANGES IN OBESITY-RELATED FOOD BEHAVIOR:
A NUTRITION EDUCATION INTERVENTION TO CHANGE ATTITUDES AND
OTHER FACTORS ASSOCIATED WITH FOOD-RELATED INTENTIONS IN
ADOLESCENTS:
AN APPLICATION OF THE THEORY OF PLANNED BEHAVIOR
A Dissertation
by
DIANE ELIZABETH CARSON
Submitted to the Office of Graduate Studies of Texas A&M University
in partial fulfillment of the requirements for the degree of
DOCTOR OF PHILOSOPHY
May 2010
Major Subject: Nutrition
brought to you by COREView metadata, citation and similar papers at core.ac.uk
provided by Texas A&M University
CHANGES IN OBESITY-RELATED FOOD BEHAVIOR:
A NUTRITION EDUCATION INTERVENTION TO CHANGE ATTITUDES AND
OTHER FACTORS ASSOCIATED WITH FOOD-RELATED INTENTIONS IN
ADOLESCENTS:
AN APPLICATION OF THE THEORY OF PLANNED BEHAVIOR
A Dissertation
by
DIANE ELIZABETH CARSON
Submitted to the Office of Graduate Studies of Texas A&M University
in partial fulfillment of the requirements for the degree of
DOCTOR OF PHILOSOPHY
Approved by:
Chair of Committee, William Alex McIntosh Committee Members, Karen S. Kubena Joseph R. Sharkey Patricia Goodson Intercollegiate Faculty Chair, Stephen B. Smith
May 2010
Major Subject: Nutrition
iii
ABSTRACT
Changes in Obesity-Related Food Behavior: A Nutrition Education Intervention to
Change Attitudes and Other Factors Associated with Food-Related Intentions in
Adolescents:
An Application of the Theory of Planned Behavior. (May 2010)
Diane Elizabeth Carson, B.S., California State University, Sacramento; M.S., California
State University, Long Beach
Chair of Advisory Committee: Dr. Wm. Alex McIntosh
This research examines the effect of a nutrition education intervention to change
attitudes and other factors associated with eating breakfast and consuming low-fat dairy
and whole-grains. Adolescents (n = 106) 11 to 15 years old were recruited from after-
school programs in Los Angeles County, California. Participants in the treatment group
(n = 57) met once weekly for 60 minutes during seven weeks. The curriculum focused
on changing attitudes, subjective norms, and perceived behavioral control toward eating
breakfast along with including low-fat dairy and whole grains. The first three lessons
focused on basic nutrition concepts. The later lessons focused on identifying barriers
and overcoming barriers, goal-setting, and identifying methods to stay motivated.
Questionnaires were administered at baseline and post-intervention. Data were analyzed
using SAS statistical analysis program (v. 9.2).
iv
Eighty-eight percent of participants were Hispanic, 55% were girls, and mean
age was 12 years. One-hundred six adolescents completed the questionnaire at baseline
and 75 completed it at post-intervention. Cronbach alpha statistic for subjective norms
and attitudes toward eating breakfast, consuming low-fat dairy and whole-grains were
0.67 and higher for each dependent variable. Intention was significantly predicted by
attitudes, subjective norms, and perceived behavioral control; however, as these models
do not differentiate change, additional models were run with interactions between group
(treatment versus control) and the change variables. Significant changes in perceived
behavioral control were observed among participants in the treatment group regarding
drinking skim milk, 1% milk, and 2% milk respectively (p < .05; p < .001; p < .001) and
attitude (p < .05). No change was observed in breakfast eating or consumption of whole-
grains.
v
DEDICATION
This dissertation, including all of the blood, sweat, and tears that went into it, could not
have happened without Doug Hatton. Doug – from the beginning, you have been the
rock of stability in my life. Without your love that kept me grounded and focused, this
would not be. For every single word I wrote and every single word you read, I am
forever grateful. This is as much yours as it is mine.
vi
ACKNOWLEDGEMENTS
I am blessed to have had the influence and teachings of two extraordinary
mentors – Mary Jacob, PhD, RD (Retired) and CSM Leonard Soldano (US Army
Retired). They pulled back the curtain on countless windows so that I could look out
and see the world in a new and different way along with opening doors of opportunity
which allowed me to grow and bloom. Thank You.
I would like to express my sincere appreciation and gratitude to: (1) my chair,
Dr. Wm. Alex McIntosh for his guidance, support, and time, but also his enormous
patience with me during the past four years. I am indebted to him for agreeing to be my
chair. Alex – it has been a wonderful journey. Thank you. (2) Dr. Karen Kubena,
committee member, for her valuable time, advice, and encouraging words throughout
this arduous process which was valued more than these simple words could ever express.
I have learned much from you and I am lucky you agreed to be on my committee. (3)
Dr. Joseph Sharkey, committee member, who allowed me the opportunity to work with
him, to learn from him, and to experience the world of research from his eyes. I am
grateful he agreed to be on my committee. Dr. Sharkey, we both know that you have
played a supporting role throughout my educational journey for which I am grateful. I
have enjoyed our time together immensely. (4) Dr. Patricia Goodson, committee
member, for the 1-inch rule, health behavior theory (I knew there was a reason and I am
glad I found you!), and writing – all of which have impacted me in a positively fabulous
way and for the remainder of my career and life. (5) Dr. Wendy Reiboldt for continuing
to mentor me through the doctoral education process and being such a great writing
vii
partner – YOU ARE AWESOME and I so appreciate you! I hope we are still writing
together twenty years from now. (6) Intercollegiate Faculty of Nutrition for the
numerous grants, fellowships, and scholarships you so generously awarded me over the
course of my tenure. (7) The American Association of Family & Consumer Sciences for
deeming me worthy of the National Jewel Taylor Graduate Fellowship. (8) The
California Chancellor’s Office for deeming me worthy of selection to the California
Chancellor’s Doctoral Incentive Program. (9) Texas A&M Medical Sciences Library
and “Get it For Me” for the thousands of articles you provided at no cost. (10) Statistical
Consulting Group at California State University for helping me write SAS code. (11)
StatsJane for helping me write SAS code. (12) Glen Seymour for helping me graph
change and interaction variables. (13) Judith Brandlin, President Stone Soup Childcare
Programs and Mountain View School District, for allowing me to conduct my research
with your after-school programs. Also from Stone Soup Childcare Programs, Veronica
Lizarrago, Renee Valencia, Barbara Smith, Marge Hood, and Summer Stoner. All of
you make me look real good and I am thankful for all you have done. (14) My friends
Ruby Saldana, Ponella Booker, and Bonnie Rice. You three know the truth and when I
count my blessings, I count you. (15) And last but not least, my Big Bro. You rock
Brother! Love you!

viii
TABLE OF CONTENTS
Page
ABSTRACT .............................................................................................................. iii
DEDICATION .......................................................................................................... v
ACKNOWLEDGEMENTS ...................................................................................... vi
TABLE OF CONTENTS .......................................................................................... viii
LIST OF FIGURES ................................................................................................... x
LIST OF TABLES .................................................................................................... xi
1. INTRODUCTION: THE IMPORTANCE OF THE RESEARCH ..................... 1
1.1 Definition of Breakfast ......................................................................... 2 1.2 Value of the Breakfast Meal ................................................................. 3 1.3 Low-Fat Dairy, Breakfast and Body Mass Index ................................. 4 1.4 Whole-Grains, Breakfast and Body Mass Index .................................. 4 1.5 Conceptual Framework ........................................................................ 5 1.6 Theory of Planned Behavior ................................................................ 6 1.7 Objectives ............................................................................................. 8
2. REVIEW OF LITERATURE .............................................................................. 10
2.1 Adolescent Diet Quality and Behaviors ............................................... 10 2.2 Breakfast Behavior During Adolescence ............................................. 17 2.3 Research Needs .................................................................................... 20 2.4 Obesity ................................................................................................. 20 2.5 Health Behavior Theories in Nutrition Education ................................ 22
3. PAPER 1: BREAKFAST .................................................................................... 30
3.1 Introduction .......................................................................................... 30 3.2 Conceptual Framework ........................................................................ 32 3.3 Methods ................................................................................................ 33 3.4 Results .................................................................................................. 38 3.5 Discussion ............................................................................................ 41

ix
Page
4. PAPER 2: LOW-FAT DAIRY .......................................................................... 44
4.1 Introduction .......................................................................................... 44 4.2 Conceptual Framework ........................................................................ 46 4.3 Methods ................................................................................................ 46 4.4 Results .................................................................................................. 53 4.5 Discussion ............................................................................................ 59 5. PAPER 3: WHOLE-GRAINS ............................................................................ 63
5.1 Introduction .......................................................................................... 63 5.2 Conceptual Framework ........................................................................ 65 5.3 Methods ................................................................................................ 66 5.4 Results .................................................................................................. 71 5.5 Discussion ............................................................................................ 74
6. SUMMARY AND CONCLUSIONS .................................................................. 77
REFERENCES .......................................................................................................... 80
APPENDIX A: LIST OF FIGURES ......................................................................... 97
APPENDIX B: LIST OF TABLES ........................................................................... 106
APPENDIX C: SURVEY INSTRUMENT ............................................................... 129
APPENDIX D: PRINCIPAL COMPONENT ANALYSES ..................................... 136
APPENDIX E: VARIABLE SCORING KEY .......................................................... 158
VITA ......................................................................................................................... 160
x
LIST OF FIGURES
FIGURE Page
A-1 Conceptual Model ...................................................................................... 98 A-2 Study Design .............................................................................................. 99 A-3 Change in Intention to Drink Skim Milk Regressed on Change in Perceived Behavioral Control .................................................................... 100 A-4 Change in Intention to Drink 1% Milk Regressed on Change in Perceived Behavioral Control .................................................................... 101 A-5 Change in Intention to Drink 2% Milk Regressed on Change in Perceived Behavioral Control .................................................................... 102 A-6 Change in Attitude to Drink Skim Milk Regressed on Change in Perceived Behavioral Control .................................................................... 103 A-7 Change in Intention to Drink 1% Milk Regressed on Change in Perceived Behavioral Control, Attitude and Subjective Norms ................. 104 A-8 Change in Attitude to Drink 2% Milk Regressed on Change in Perceived Behavioral Control, Attitude and Subjective Norms ................. 105
xi
LIST OF TABLES
TABLE Page B-1 Focus Group Interview Questions .............................................................. 107 B-2 Nutrition Education Lessons ...................................................................... 108 B-3 Participant Characteristics .......................................................................... 110
B-4 Chi-Square Test for Equal Proportions ...................................................... 111
B-5 Cronbach-alpha Statistic for Subjective Norms and Attitudes Toward Eating Breakfast at Time 1 and Time 2 ........................................ 113
B-6 Main Treatment Effects on Outcome Measures Breakfast Parameter Estimates with Standard Errors ................................................. 114
B-7 Cronbach-alpha Statistic for Subjective Norms and Attitudes Toward Consuming Low-Fat Dairy at Time 1 and Time 2 ........................ 116
B-8 Main Treatment Effects on Outcome Measures Milk Parameter Estimates with Standard Errors ................................................. 117
B-9 Main Treatment Effects on Change Interactions Milk Parameter Estimates with Standard Errors ................................................. 121
B-10 Main Treatment Effects on Outcome Measures Cheese & Yogurt Parameter Estimates with Standard Errors ................................................. 124
B-11 Cronbach-alpha Statistic for Subjective Norms and Attitudes Toward Consuming Whole-Grains at Time 1 and Time 2 ......................... 126
B-12 Main Treatment Effects on Outcome Measures Whole-Grains Parameter Estimates with Standard Errors ................................................. 127
1
1. INTRODUCTION: THE IMPORTANCE
OF RESEARCH
Overweight and obesity are a result of energy imbalance. Several factors play a
role including change in dietary habits, larger portion sizes, increase in consumption of
fast food, lack of physical activity at school and in the home, and availability of high-
calorie nutrient-poor foods (1). Addressing adolescent overweight is critical because it
is associated with an increased risk of obesity into adulthood (2) but also independently
is related to morbidity and mortality in adulthood (3). Adolescence is the period
between puberty and adulthood.
Between the NHANES surveys of 1976-1980 and 2003-2006, prevalence of
obesity increased from 6.5% to 17% among 6-11 year olds and 5% to 17.6% among
those aged 12- to 19-years (4). Limited attention has been given to behavioral factors
which may increase the risk of obesity. These include skipping breakfast, choosing high-
fat dairy products over their low-fat counterparts, and choosing refined grains over
whole-grain products.
Skipping breakfast has increased over time and may be more common among
certain ethnic or low-socioeconomic groups in the adolescent population. Considering
that skipping breakfast is associated with obesity risk and perhaps the under-
consumption of some essential nutrients, it is more important than ever that adolescents
consume a healthy and nutritious breakfast every day (5-7).
_________________ This dissertation follows the style of the American Journal of Clinical Nutrition.
2
In an analysis of NHANES III and NHANES 1999-2002 data, adolescents who
consumed the least amount of dairy had a higher BMI along with a higher percentage of
body fat (8). Another study showed consumption of flavored milks was not associated
with higher BMI among youth aged 6-11 years and 12- to 18-years while both female
and male non-milk drinkers had higher BMIs (9). Studies examining consumption of
ready-to-eat cereal and its relationship with BMI have seen similar results. One study
looked at whole grain intake among adolescents and found, after adjustment for age,
gender, race, and energy intake, BMI was lower in those consuming more than one and
one-half servings per day compared to those who consumed less (10). Another study in
Greece found that adolescents who chose breakfast cereal had lower average BMIs
compared to children who chose other breakfast foods (11).
DEFINITION OF BREAKFAST
One problem faced by researchers is the lack of a standard definition of
breakfast. Different definitions exist including those defined by the participant (e.g.,
“How often do you eat breakfast?”) (12), defined by the participant within boundaries
(e.g., frequency of eating breakfast before going to school) (13), or defined by the
researchers (e.g., “any eating occurring between 5:00 and 10:00 AM on weekdays or
between 4:00 and 11:00 AM on weekends” or intake of certain foods) (5, 14-15). The
United States Department of Agriculture Child and Adult Care Food Program guidelines
(16) defines breakfast as “a meal which meets the nutritional requirements set out in
§220.8, and which is served to a child in the morning hours. The meal shall be served at
or close to the beginning of the child’s day at school.”
3
VALUE OF THE BREAKFAST MEAL
It is estimated children receive as much as 30% of their total daily caloric intake
from the breakfast meal (17-18). When averaged over a school week, the breakfast meal
provided at schools as part of the School Breakfast Program (SBP) must provide one-
fourth of the Recommended Dietary Allowances (RDA) for protein, calcium, iron,
vitamins A and C, and provide adequate calories (16). Participation in the SBP has
grown since its inception from about 500,000 children participating in 1970 to 8.2
million children participating in 2002-2003 (19).
Consuming breakfast is associated with adequate nutrient intake, healthier food
choices, more regular eating patterns throughout the day, more favorable body weight
status, and improved exercise patterns (5, 20-21). Eating a healthy breakfast is
important in meeting the health and nutrition needs of adolescents. Adolescents who eat
breakfast are more likely to meet the daily recommended intakes for vitamins A, B6, and
B12, and calcium than those who skip breakfast (5, 18, 22-26). More importantly,
research has shown adolescents who skip breakfast do not, on average, make up the
nutrient deficits during the rest of the day (7).
Participation in the school-breakfast program has been shown to be associated
with higher breakfast intakes of food energy, calcium, riboflavin, phosphorus, and
magnesium (27). An experimental study showed making breakfast available in
elementary schools increased the likelihood children would consume a nutritious
breakfast (28). More recently, researchers found children participating in the SBP had
significantly lower BMI especially among non-Hispanic, white children (29).
4
LOW-FAT DAIRY, BREAKFAST AND BODY MASS INDEX
The Dietary Guidelines for Americans (30) recommend adolescents consume
three cups per day of fat-free or low-fat milk or equivalent milk products. Overall, only
30% of the United States population aged 2 and older obtain the recommended levels of
calcium (31). Research shows compared to breakfast skippers, mean daily intakes of
calcium were higher in adolescents who consume breakfast regularly (7, 32). Calcium
intake among adolescents is significantly and positively associated with eating breakfast,
socioeconomic status, social support for healthful eating, and the availability of milk at
meals (33). The question remains however, does intake of low-fat dairy during the
breakfast meal correlate with BMI? As early as 1984, data from the first NHANES
showed calcium intake was correlated with BMI (34). In 2000 it was reported fat acid
synthesis and thus adiposity was regulated at the cellular level by dietary calcium (35).
WHOLE-GRAINS, BREAKFAST AND BODY MASS INDEX
There is limited literature examining the benefit of including whole-grains in the
breakfast meal in terms of meeting the daily recommended intakes of dietary fiber,
vitamins and minerals in the adolescent population. Cross-sectional surveys with
adolescents in the United States have found that inadequate dietary fiber intakes could be
improved by increasing the consumption of whole-grains (30). In a study conducted by
Affentio et al., (5), researchers reported that adolescents who eat breakfast had increased
intakes of calcium and fiber. The Dietary Guidelines for Americans (30) recommend
that children and adolescents should consume whole-grain products often and that at
least half of the grains in the diet should be whole grains. Diets rich in whole-grains
5
provide a host of potential benefits to overall health including reducing the risk of heart
disease, helping with weight maintenance and lowering the risk of other chronic diseases
(30).
CONCEPTUAL FRAMEWORK
The present study examines the impact of an after-school based intervention
designed to improve breakfast behavior and habits among adolescents. The purpose was
to increase breakfast eating and the consumption of whole-grains and low-fat dairy in a
predominantly, Hispanic adolescent population. The intervention is grounded in the
Theory of Planned Behavior (TPB). Conceptual model is at Figure B-1.
There have been few interventions delivered to adolescents which used the TPB
as a conceptual framework. One study tested the effectiveness of an intervention
program to alter adolescents’ healthy eating attitudes and behavior (36). Results showed
the intervention was effective in improving attitudes toward healthy eating. Another
study examined the effect of a condom promotion leaflet and 20-minute intervention on
adolescents intention and attitude toward using a condom (37). Results showed after the
intervention, attitude toward using a condom with new partners increased along with
intention to use condoms. In an examination of the efficacy of an intervention designed
to positively influence physical activity behavior among pediatric cancer survivors,
researchers found that the intervention had a small yet meaningful impact after one year
(38).
6
THEORY OF PLANNED BEHAVIOR (TPB)
The TPB is an expectancy-value model which states an individual’s behavior is
determined proximally by his/her intentions to perform a given behavior (39). A number
of studies suggest the role of the TPB in understanding and predicting health behaviors
(40). The TPB model has been applied to a number of nutrition related behavior
research involving soft drink consumption among female adolescents (41), fruit and
vegetable consumption among young adolescents (42), sugar restriction (43), and
intention to adopt a low-fat diet in men 30- to 60- years old (44).
Central to the model is the individual's intention to perform a given behavior.
Intentions are assumed to capture the motivational factors that influence a behavior and
are indicative of how hard a person is willing to try and how much effort a person is
willing to exert in order to perform the behavior (39). Intention is the immediate
antecedent of behavior and is determined by the attitude toward the behavior, subjective
norm, and perceived behavioral control (39).
Attitude is defined as the overall evaluation of behavior and refers to the degree
to which a person has a favorable or unfavorable assessment of the behavior in question
(behavioral beliefs) and how much value is placed on the behavioral outcome
(evaluation) (45). For example, a person may like bran cereal (behavioral belief), but
may not purchase bran cereal because the benefits of bran in his/her overall diet are not
valued (evaluation) (39). Thus, if a person holds strong beliefs about the positive
outcome of eating bran cereal, a more positive attitude toward the behavior will be held
(45). Whether a person has a favorable or unfavorable assessment of the behavior in
7
question, she/he must have the required skills to perform the behavior. In this example,
a person would have to possess the abilities to grocery shop and make breakfast (46). In
addition, there should be no environmental constraints that make it difficult or
impossible to perform the behavior (46). A positive environment is requisite in order to
produce a given behavior. This means, in order for a person to eat bran cereal, bran
cereal has to be available.
Subjective norm is defined as the perceived belief about whether most people
approve or disapprove of the behavior and refers to the perceived social pressure to
perform or not perform the behavior (39, 45). This concept is centered on how one
“should” act in response to the views and opinions of others (normative belief) and the
desire to do what others think (motivation to comply). Strong influences include family
and friends; weaker influences include doctors, teachers, colleagues, or religious
organizations (39).
Perceived behavioral control refers to the perceived ease or difficulty of
performing the behavior, or stated another way, how much control a person has in
performing the behavior (39). For example, a person may not be able to purchase bran
cereal if it is not available in the store where he/she shops. Perceived behavioral control
is assumed to reflect past experiences about the behavior (habits) and in some cases,
second-hand information provided by others (control beliefs). The perceived ease or
difficulty in performing the behavior is also considered (perceived power) (39, 45).
The TPB model says perceived behavioral control, together with behavioral intention
can be used directly to predict behavioral achievement (39).
8
The more positive a person’s attitude toward a behavior and the greater the
perceived behavioral control, the more likely a person is to perform the behavior (39).
While motivation to carry out the behavior is present, non-motivational factors such as
availability and opportunity must be present in order for the behavior to be performed
(39). Perceived behavioral control can influence behavior directly. An increased sense
of control strengthens a person’s intention to perform a behavior and increases effort as
well as determination (40).
An advantage of the TPB model is that it is a complete theory of behavior.
Variables in the model are assumed to mediate the effects of the other variables
including demographic influences such as ethnicity, gender, age, socioeconomic status,
and personality (39-40). More importantly, the model is open to incorporating new
variables that may explain a significant proportion of variance in intention or behavior
beyond the variables specified in the theory (39).
OBJECTIVES
Most nutrition education efforts have examined the health benefits of eating
breakfast to increase nutrition knowledge and awareness. Few studies have explored the
value and effect of designing interventions to examine the influences of peers and family
on predicting and explaining intention and behavior to eat breakfast. In the long-term
this is important because intention is not only influenced by peers and family but is an
indicator of how hard a person is willing to try and how much effort a person will exert
toward performing a behavior. It is also important to gain an understanding of attitude
toward eating breakfast because changing knowledge and behavior is not enough; the

9
ultimate goal is to effect lifelong knowledge and behavior. Educating and motivating
adolescents about the long-term benefits of consuming breakfast and consuming a
breakfast that is rich in whole-grain and low-fat dairy could have a significant impact on
overall health and well-being among this age group.
The first objective of this study was to assess the needs and test the feasibility of
delivering an after-school based intervention to low-income, ethnically diverse
adolescent boys and girls 12- to 14- years old aimed at changing breakfast behavior and
habits. To accomplish this objective, focus groups will be conducted with after-school
personnel and students to identify perceptions, behaviors and beliefs that contribute to
eating whole-grains and low-fat dairy as part of a healthy breakfast every day. The
second objective was to test the effectiveness of the intervention based on the TPB as a
conceptual framework. The effects of attitude, social and personal factors, personal
characteristics, self-efficacy, parental influence, and individual determinants on intention
to predict breakfast consumption frequency will be examined. To accomplish this, a
seven-week curriculum will be delivered to participants. Questionnaires that address
breakfast behavior and habits of adolescents and their parents will be evaluated. Change
in BMI will not be assessed due to the short length of this intervention.
10
2. REVIEW OF LITERATURE
ADOLESCENT DIET QUALITY AND BEHAVIORS
Diet Quality of Adolescents in the United States
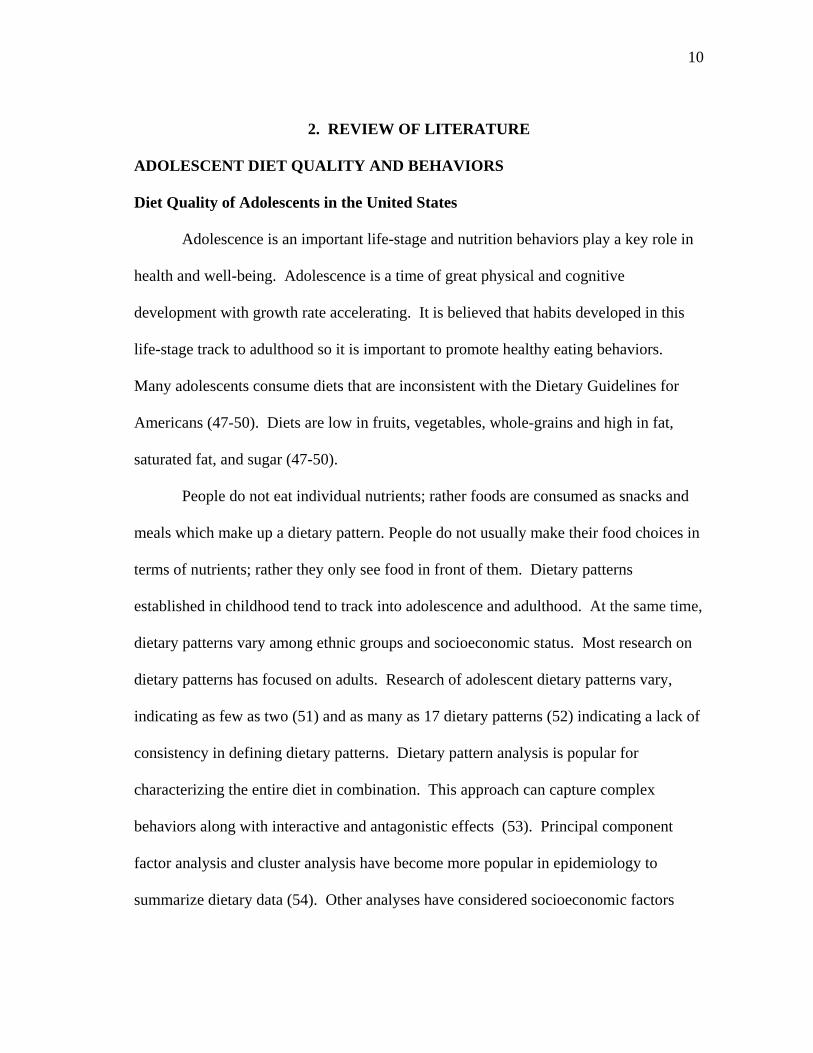
Adolescence is an important life-stage and nutrition behaviors play a key role in
health and well-being. Adolescence is a time of great physical and cognitive
development with growth rate accelerating. It is believed that habits developed in this
life-stage track to adulthood so it is important to promote healthy eating behaviors.
Many adolescents consume diets that are inconsistent with the Dietary Guidelines for
Americans (47-50). Diets are low in fruits, vegetables, whole-grains and high in fat,
saturated fat, and sugar (47-50).
People do not eat individual nutrients; rather foods are consumed as snacks and
meals which make up a dietary pattern. People do not usually make their food choices in
terms of nutrients; rather they only see food in front of them. Dietary patterns
established in childhood tend to track into adolescence and adulthood. At the same time,
dietary patterns vary among ethnic groups and socioeconomic status. Most research on
dietary patterns has focused on adults. Research of adolescent dietary patterns vary,
indicating as few as two (51) and as many as 17 dietary patterns (52) indicating a lack of
consistency in defining dietary patterns. Dietary pattern analysis is popular for
characterizing the entire diet in combination. This approach can capture complex
behaviors along with interactive and antagonistic effects (53). Principal component
factor analysis and cluster analysis have become more popular in epidemiology to
summarize dietary data (54). Other analyses have considered socioeconomic factors
11
(55) or meal frequency such as skipping breakfast (51) while others have examined
health outcomes and risk factors such as BMI, blood pressure or cholesterol (52, 56).
Adolescents tend to consume less fruits, vegetables, dairy, and whole-grains, and more
sugary drinks and foods, and foods higher in total fat, saturated fat, cholesterol, and
sodium compared to the Dietary Guidelines for Americans (6, 25, 32, 52, 56). In a
population-based, cross-sectional study that included middle and high school students
from Minneapolis/St. Paul public schools, researchers found frequency of family meals
was positively associated with higher socioeconomic status, race (Asian American), and
mother’s employment status (not employed). Frequency of family meals was positively
associated with higher intakes of fruits, vegetables, grains, and calcium-rich foods and
negatively associated with soft-drink consumption (55). Additionally, positive
associations were seen between frequency of family meals and protein; calcium; iron;
folate; fiber; vitamins A, C and E; and total energy. Another study found that Hispanic
youth acculturated to the United States tend to consume diets higher in energy and
sodium with a higher percent of energy from fat and saturated fat compared to all
racial/ethnic youth groups in the United States (49). A study in Australia examined the
risk of obesity and high blood pressure among Australian youth 12- to 18-years. After
factor analysis, three dietary patterns emerged: (1) fruit, salad, cereals, and fish; (2) high
fat and sugar; and (3) vegetables. Results showed the fruit, salad, cereals, and fish
pattern was inversely associated with age and diastolic blood pressure; the high fat and
sugar pattern was associated with males; and the vegetable pattern was associated with a
rural region of residence.
12
Another important factor to consider when examining dietary quality in youth is
the consumption of breakfast. As children progress through adolescence, breakfast
skipping increases (6, 25). Breakfast consumption patterns among children and
adolescents are of concern given the association of breakfast consumption with overall
diet quality and nutritional adequacy (32), school performance (57), and the relationship
with overweight and obesity (5, 15, 20, 25, 58). Data from the Nationwide Food
Consumption Surveys for 1965-1966 and 1977-1978 (59) and the 1989, 1990, and 1991
Continuing Surveys of Food Intakes by Individuals (59) document a decline in breakfast
consumption by youth in the United States. Also, these trends are seen among youth in
Canada (60), England (61), Spain (62), Greece (63), Finland (13), Sweden (14),
Australia (64), Iran (65), and Taiwan (66).
Development of Food Behaviors and Preferences
A host of factors including food preferences, genetics and environmental
influences, family demographics, and parenting style contribute to overweight children
in the United States (55, 67-72). Three major learning processes are thought to modify
the food acceptance patterns of the child (73-75). The first, repeated exposure to
unfamiliar foods can reduce neophobia, the tendency to reject unknown or unfamiliar
foods. Second, social influences can change food acceptance. Children who observe
parents and peers consuming a food are more likely to try the food. Finally, children
learn to associate the physiological consequences of food intake with taste cues and this
eventually may result in the development of cognitive structures and processes such as
attitudes and beliefs about food and eating.
13
Recent studies show neophobia may be heritable (67-68). In one study with
twins (8 to 11 years old), variation in neophobia because of heritable genetic differences
was estimated at 78% with 22% of the variance explained by non-shared environmental
factors (68). In another study with same-sex twins (4 to 5 years old), heritability was
found to be modest for dessert foods, moderate for vegetables and fruits, and high for
protein foods (67).
Research indicates that children and youth of low-socioeconomic status and
minority populations are more likely to consume nutrient poor diets, exercise less, and
be overweight or obese (76-77). Gangi and colleagues reported race-, gender-, and age-
specific differences in dietary micronutrient intakes in US children 1 to 10 years old and
found Black males and females had significantly lower dietary intakes for several
micronutrients compared to their white counterparts (76). Delva and colleagues found
minority, low-income male adults and male youth were consistently at or above the 85th
percentile compared to their White counterparts at every socioeconomic status (77).
Early food experiences among Hispanics were found to be different from their non-
Hispanic counterparts in many ways in the Feeding Infants and Toddlers Study (78). In
this study, Hispanic infants under 12 months of age were more likely to be breastfed
along with consuming fresh fruits, fruit-flavored drinks, baby cookies, and foods like
soup, rice, and beans as compared to non-Hispanic infants. Additionally, they were less
likely to consume non-infant cereals and baby food vegetables.
14
Parent Feeding Styles and Expectations
Research suggests parental feeding practices play a role in later eating and
weight outcomes of their children (79-80). Parents play a pivotal role in the
development of their children’s eating habits, especially through their child-feeding
practices (70, 80). It is the parent who determines which foods are offered to his or her
child, which foods the child is forbidden to eat, along with the emotional tone of the
meal (81). Parenting style can have profound effects on the development of food
preferences in children and it is clear that the degree of parental control should be
considered (69, 82), especially since parental control of child eating has been associated
with a greater risk of child overweight (72, 80, 82-83).
One study explored the role of modeling and control among 112 pairs of parents
and their children (9 to 13 years old) when consuming snack foods (69). Snack intake
was significantly correlated between parent and child. Children had higher intakes of
both healthy and unhealthy snacks if their parents reported greater attempts to control
their child’s diets. These parents also had higher dissatisfaction with their own body
images. When parents tried to control the food intake of children (e.g., offering one food
as reward for eating another food), it often resulted in the opposite effect intended with
preference for the distasteful food decreasing and preference for the reward food
increasing (70, 84). Another study found adolescents’ perception of how they were
parented (e.g., nurture versus authoritarian style of nurturing) directly predicted body fat
(82). Associations between authoritative parenting by the mother and heavier adolescent
15
body weight, sub-scapular skinfold, body mass index, and waist circumferences were
significant.
A recent study examined the role of psychological variables (e.g., parental
perceived responsibility for child’s eating, parental perceptions of the child’s weight, and
parents’ own eating patterns) in a French and American sample (85). Researchers found
that among parents in France, monitoring was associated with parental perceived
responsibility for child’s eating, parental restrained eating, and parents’ desire for their
child to be thinner. Restriction of foods for reasons of body weight was more prevalent
in France while use of foods for nonnutritive purposes was more prevalent in the United
States. In the United States, more parents reported controlled or emotional eating. In a
similar study, researchers examined the socio-cultural differences between the United
States and France in levels of feeding practices and the relationships between parent and
child BMI and parental feeding practices in both cultural contexts (86). They found
parental feeding practices such as monitoring, modeling of healthy eating habits, and use
of food as a reward was associated with child BMI in both France and the United States.
Influence of Peers on Food Choices
The role of peers in adolescent food choices is a relatively new concept. Studies
have shown adults eat more and spend more time eating when they are in the presence of
others rather than alone (87). It is important to note however, that in the presence of
certain others, eating behavior may change. One study examined the effects of peer
influence on lean and overweight pre-adolescent girls’ snack intake (88). Participants
included 23 lean (at or below the 85th BMI percentile) and 23 overweight or at risk for
16
becoming overweight (>85th BMI percentile) girls 8 to 10 years old. Each participant
took part in a 45-minute experimental session that involved each child working on a
sorting task in the presence of another participant while having access to snack foods.
Half of the sample was composed of lean-lean or overweight-overweight dyads. The
other half was composed of lean-overweight dyads. Results indicate the amount of
snack consumed by the co-eater predicted their partners’ snack food consumption.
Overweight girls eating with an overweight peer consumed more kilocalories than
overweight participants eating with a normal-weight peer. Lean participants eating with
overweight peers ate similar amounts of snack food as those who ate with lean eating
companions. A similar study examined how the social context (alone versus presence of
peers) influences overweight and normal-weight children’s food intake (89). Thirty-two
children (6 to 10 years old) participated in the study. Seventeen were overweight.
Results showed overweight children ate more when alone than with a group of peers and
normal-weight children ate more when they were with peers than when they were alone.
Another study tested the hypothesis that modeling influences eating in overweight and
non-overweight preadolescent girls (90). In this study, researchers had participants
perform a sorting task while watching a video. Snacks were provided and participants
were informed they could eat as much as they wanted. The video model (10-year-old
girl at the 75th percentile for BMI) performed the same task. The video model was
shown performing her task and choosing either a small or large serving of cookies.
Results indicated that overweight participants consumed significantly more cookies than
17
non-overweight participants suggesting peer-modeling influences overweight and non-
overweight preadolescent girls’ snack consumption.
Influence of Teachers on Food Choices
We could find no research on the influence of teachers on food choices of
adolescents. Social Cognitive Theory says teacher modeling should be one of the most
effective methods to encourage young children to accept foods during preschool lunch
(91). Preschool teachers rated modeling as an effective method to encourage a child’s
food acceptance (92). When preschool teachers modeled with enthusiasm (“Mmm! I
love mangos!”), preschool children maintained the new food acceptance across five
meals (92).
In summary, Benton (70) reported that if parents want to encourage their children
to eat a particular food, they should not try to control the diet because it would likely be
ineffective. Hispanic youth tend to consume diets that are less than optimal for long-
term health and not in line with the Dietary Guidelines for Americans (49). Because
consumption of a healthy diet leads to long-term health and because dietary patterns tend
to track into adulthood from childhood and adolescence, researchers should focus
attention on developing interventions targeting this age and ethnic group.
BREAKFAST BEHAVIOR DURING ADOLESCENCE
Breakfast may be considered the most important meal of the day yet most people
skip it and adolescents are no exception. Breakfast consumption patterns among
children and adolescents are of concern to public health experts given the association of
breakfast consumption with overall diet quality and nutritional adequacy (17, 23, 32,
18
93), school performance (7, 57) and the relationship with overweight and obesity (5, 15,
20, 25, 58). Data from the Nationwide Food Consumption Surveys for 1965-1966,
1977-1978 (18, 59) and the 1989, 1990, and 1991 Continuing Surveys of Food Intakes
by Individuals (18, 59) document a decline in breakfast consumption by youth in the
United States. Also, these trends are seen among youth in Canada (60), England (61),
Spain (62), Greece (63), Finland (13), Sweden (14), Australia (64), Iran (65), and
Taiwan (66).
Although breakfast consumption has favorable implications, frequency of
breakfast consumption decreases from childhood through adolescence (6, 25). Several
reasons why adolescents skip breakfast are apparent. They include more frequent
snacking, lack of time, lack of hunger and/or dieting to maintain or lose weight (7, 26,
32). Research suggests children and adolescents who report skipping breakfast are
found to consume a greater proportion of total energy from fat and snacks that contain
fat during the day (94).
Female adolescents are more likely to skip breakfast than male adolescents of
similar age (7, 18) and African-American and Hispanic adolescents are more likely to
skip breakfast than are white adolescents (5-7). Research indicates that skipping
breakfast increases with age, may be more common among certain ethnic groups or low
socioeconomic groups (6-7), and may be associated with lifestyle factors that may be
detrimental to health, such as cigarette smoking and not participating in regular physical
activity (7, 14).
19
Low-Fat Dairy, Breakfast and Body Mass Index
The Dietary Guidelines for Americans (95) recommend adolescents consume
three cups per day of fat-free or low-fat milk or equivalent milk products. Overall, only
30% of the United States population aged 2 and older obtain the recommended levels of
calcium (31). Research shows mean daily intakes of calcium are higher in adolescents
who consume breakfast regularly, compared to breakfast skippers (5, 7, 31-32). Calcium
intake among adolescents is significantly and positively associated with eating breakfast,
socioeconomic status, social support for healthful eating, body mass index and the
availability of milk at meals (8-9, 33).
Whole-Grains, Breakfast and Body Mass Index
There is limited literature that examines the benefit of including whole-grains in
the breakfast meal in terms of meeting the daily recommended intakes of dietary fiber,
vitamins and minerals in the adolescent population. Nevertheless, cross-sectional
surveys with adolescents in the United States have found that inadequate dietary fiber
intakes could be improved by increasing the consumption of whole-grains (30).
Affentio et al. (5) reported that adolescents who eat breakfast have increased intakes of
calcium and fiber. The Dietary Guidelines for Americans (96) recommend that children
and adolescents consume whole-grain products often and that at least half of the grains
in the diet should be whole grains. Diets rich in whole-grains provide a host of potential
benefits to overall health including reducing the risk of heart disease, helping with
weight maintenance, and lowering the risk of other chronic diseases (96).
20
RESEARCH NEEDS
Research to date has been primarily cross-sectional when examining breakfast
consumption patterns among youth. Breakfast history may impact overall health
indicators. Eating breakfast on a consistent basis, over time, could be important for, as
an example, weight management. Studies have been conducted that examine
consumption of ready-to-eat cereals; however, limitations do exist. Specifically, we
could find none that asked youth about specific cereals consumed. Although
consumption of sugared cereals is better than no breakfast at all, emphasizing whole-
grain breakfast cereals should be the message as consumption of whole-grains could lead
to improved overall nutrient status along with a healthful body mass index among
adolescents. Despite the availability of a growing body of literature examining dairy
consumption and overall calcium intake and/or body mass index, they too have been
primarily cross-sectional in nature. Numerous benefits are observed with daily
consumption of low-fat dairy products. Future research should target low-income,
minority youth as they have a higher incidence of overweight and obesity.
OBESITY
In the last 30 years, the prevalence of overweight and obesity in this country has
seen marked increases in both children and adults. Overweight and obesity are labels for
ranges of weight that are greater than what is typically considered to be healthy for a
given height. Overweight and obesity are shown to increase the risk of developing
certain diseases and other health problems (1). For children, BMI 85th percentile and
21
95th percentile is defined as “at risk for overweight); and, if his/her BMI 95th
percentile, he/she is considered overweight (97).
Data from the National Health and Nutrition Surveys (NHANES) reveals that for
those aged 6 to11 years, prevalence increased from 6.5% (1976-1980 survey) to 17.0%
(2003-2006 survey) (97), and for those aged 12-19 years, prevalence increased from 5%
(1976-1980 survey) to 17.6% (2003-2006 survey) (97). New data show one in seven
low-income, preschool-aged children is obese (98). Moreover, among non-Hispanic
white adolescent boys, the prevalence of obesity increased from 11.6% to 17.3%; among
non-Hispanic black boys, the prevalence of obesity increased from 10.7% to 18.5%; and
among Mexican-American boys, the prevalence of obesity increased from 14.1% to
22.1% (97). Non-Hispanic black adolescent girls showed the highest increase in
prevalence of obesity (14.5%) compared to non-Hispanic white (7.1%) and Mexican-
American adolescent (10.7%) girls.
These sharply increasing rates have serious implications for the overall health of
American children and adolescents. Overweight and obesity are linked with increased
risk and development of chronic disease including hypertension, osteoarthritis,
dyslipidemia, type 2 diabetes, coronary heart disease, stroke, gallbladder disease, sleep
apnea, respiratory problems and certain cancers (97-98). More importantly, children and
adolescents are developing chronic disease as a result of their obesity (97-98). The
Centers for Disease Control (CDC) reports 70% of obese 5- to 17-year olds had a least
one risk factor for heart disease and 39% had at least two (98). The American Diabetes
22
Association reports 22% of individuals 20-years and younger have diabetes and two
million adolescents (1 in 6 overweight adolescents) aged 12-19 have prediabetes (99).
HEALTH BEHAVIOR THEORIES IN NUTRITION EDUCATION
Understanding why people behave the way they do, understanding how what
people do affects their health, and understanding what causes people to change their
health related behavior are important and oftentimes perplexing questions facing public
health professionals today. As the obesity epidemic continues to rise in the United
States, making sense of the numerous causal factors – social, structural, psychological,
and others that predict health behavior has moved to center stage. The use of theory
when designing interventions to elicit behavior change is crucial (100).
Theory acts as a guide describing the nature and strength of relationships of
mediators to the behavior change and is based upon evidence from nutrition research
(100). Constructs are connected together in order to explain food choices and behavior.
There are several models of individual health behavior. Some address increasing
awareness and enhancing motivation (e.g., Health Belief Model and Theory of Planned
Behavior), some facilitate the ability to take action (e.g., Social Cognitive Theory and
the Transtheoretical Model), while others address environmental factors influencing
people’s health actions (100). Theories are better at predicting health behavior when the
behavior is specifically stated therefore, the more effective interventions will have a
specifically stated behavior (100). Also, establishing habit – the repeated practice of a
behavior so it becomes automatic is essential in developing behavior change
interventions (100).
23
With all behavior theories, there are strengths and weaknesses. The Health
Belief Model (HBM) framework has been strong in explaining and predicting
acceptance of health and medical care recommendations however, it is important to be
aware that use of the HBM in multicultural settings requires adaptation of constructs to
make them more relevant to the target culture (101). In the Theory of Planned Behavior
(TPB), the focus is on cognitive factors that predict motivation. The TPB has had
considerable success in explaining behavior but it is important to identify the behavioral,
normative, and control beliefs relevant to the behavior and population in question.
When a researcher understands the control beliefs regarding each factor, only then can
they be measured (45). Weaknesses with this model exist – for example habit and
emotion are not considered. The Transtheoretical Model (TTM) comes from an analysis
of leading theories of psychotherapy and behavior changes and incorporates ten stages of
change (102). An advantage of the TTM is that health-care practitioners are able to treat
individuals as they are – in different phases of readiness to make changes in their health
behaviors. An important guideline when designing interventions around the TTM is to
consider relationships of the TTM variables with constructs from other established
health behavior theories such as perceived risk and subjective norms. Learning if these
constructs relate to the stages of change and if they can predict progress across stages is
one example (102). The most successful studies of TTM have used tailor-made
messages. It is also important to consider how diverse populations respond to tailor-
made messages and if they need to be edited for specific audiences. Social Cognitive
Theory (SCT) explains human behavior by examining personal factors and
24
environmental factors which influence each other at the same time. One of the biggest
pitfalls with SCT is that many practitioners believe it is too complex of a model in its
formulation due to the large number of constructs (103).
A model that has been used in understanding the nutrition choices that people
make is the Theory of Planned Behavior (TPB) described by Ajzen in 1991 (39). The
TPB is an expectancy-value model which states an individual’s behavior is determined
proximally by his/her intentions to perform a given behavior (6). Intentions are assumed
to capture the motivational factors that influence a behavior and are indicative of how
hard a person is willing to try and how much effort a person is willing to exert in order to
perform the behavior (39). Intention is the immediate antecedent of behavior and is
determined by the attitude toward the behavior, subjective norms, and perceived
behavioral control (39).
Attitude is defined as the overall evaluation of behavior and refers to the degree
to which a person has a favorable or unfavorable assessment of the behavior in question
(behavioral beliefs) and how much value is placed on the behavioral outcome
(evaluation) (45). For example, a person may like bran cereal (behavioral belief), but
may not purchase bran cereal because the benefits of bran in his/her overall diet are not
valued (evaluation) (39). Thus, if a person holds strong beliefs about the positive
outcome of eating bran cereal, a more positive attitude toward the behavior will be held
(45). Whether a person has a favorable or unfavorable assessment of the behavior in
question, she/he must have the required skills to perform the behavior. In the example
with bran cereal, a person would have to possess the abilities to grocery shop and make
25
breakfast (46). Finally, there should be no environmental constraints making it difficult
or impossible to perform the behavior (46). A positive environment is requisite in order
to produce a given behavior. This means, in order for a person to eat bran cereal, bran
cereal has to be available.
Subjective norm is defined as the perceived belief about whether most people
approve or disapprove of the behavior and refers to the perceived social pressure to
perform or not perform the behavior (39). This concept is centered on how one
“should” act in response to the views and opinions of others (normative belief) and the
desire to do what others think (motivation to comply). The strongest influences include
family and friends; weaker influences include doctors, colleagues, and/or religious
organizations for example (39).
Perceived behavioral control refers to the perceived ease or difficulty of
performing the behavior, or stated another way, how much control a person has in
performing the behavior (39). For example, a person may not be able to purchase bran
cereal if not is not available in the store where they shop. Perceived behavioral control
is assumed to reflect past experiences about the behavior and in some cases, second-
hand information provided by others (control beliefs). The perceived ease or difficulty
in performing the behavior is also considered (perceived power) (6). The TPB model
says perceived behavioral control, together with behavioral intention can be used
directly to predict behavioral achievement (39).
The more positive a person’s attitude toward a behavior and the greater the
perceived behavioral control, the more likely a person is to perform the behavior (39).
26
While motivation to carry out the behavior is present, non-motivational factors such as
availability and opportunity must be present in order for the behavior to be performed
(39). Perceived behavioral control can influence behavior directly. An increased sense
of control strengthens a person’s intention to perform a behavior and increases effort as
well as determination (39).
An advantage of the TPB model is that it is a complete theory of behavior.
Variables in the model are assumed to mediate the effects of the other variables
including demographic influences such as ethnicity, gender, age, socioeconomic status,
and personality (39-40). More importantly, the model is open to incorporating new
variables that may explain a significant proportion of variance in intention or behavior
beyond the variables specified in the theory (39). There are weaknesses with the TPB.
The inclusion of habit in the TPB is rare as is the inclusion of emotions. Most of the
above theories fall into the general category of rational choice theories; rational choice
suggests that a person 1) considers a behavior before performing it rather than relying on
habit and 2) uses beliefs – themselves considered rational by most researchers using this
model – in order to make a decision about behaving in a particular way. Habit has been
found to a factor in hamburger doneness in adults; habits have been included in the study
of children/adolescents but it should be.
Evidence on Food Choice and Dietary Behaviors – Intention and Behavior
The TPB model has been applied to a number of nutrition-related behavior
research studies with adolescents in the past decade. Most have focused on the
predictive ability of the theory and indicate a range of behaviors and targeted groups
27
(41-42, 104-110). In one study that examined the soft drink consumption among female
adolescents, intention to drink soda predicted its consumption (106). Attitude,
subjective norms, and perceived behavioral control were statistically significant in
predicting intention and together explained 64% of the variance. In another study only
17% of the variance was explained in eating a healthy diet that included fruits,
vegetables, and calories (105) among adolescents. A study with urban Native American
youth that examined healthy eating behaviors found no association between intention
and healthy eating behavior (108).
Researchers administered two identical, self-administered surveys six months
apart to 7th graders in Minneapolis/St. Paul, Minnesota to determine how well the TPB
could predict the frequency of consumption of fruits and vegetables and if gender or
socioeconomic status moderated the effects (42). In this model, 7% of the variation in
the frequency of fruit and vegetable consumption and 31% of the variation in intention
to eat more fruits and vegetables were explained by the model. Gender, but not
socioeconomic status seemed to have moderating effects on attitude and intention and on
intention and behavior. Another study designed to assess the predictors of intention to
eat fruits among 9th-grade students in North Carolina found perceived beliefs were
important to teens (110). In this study, 55% of the variance was explained by attitude,
subjective norms, and perceived behavioral control. Two studies examined the
influences of the TPB constructs on understanding choice of milk among male
adolescents in the US (41) and Swedish schoolchildren in grades 5, 7, and 9 (104). In
the former, attitude, subjective norms, and perceived behavioral control were significant
28
predictors of intention to drink reduced-fat milk. The later study found consumption of
milk was predicted by intention but also by the perceived behavioral control of the
adolescent.
Evidence on Food Choice and Dietary Behaviors – Subjective Norms
A weakness of the TPB is the ability to predict intention or behavior from
subjective norms (39). In an effort to improve this weakness, some researchers have
made a distinction between normative (e.g., subjective, or injunctive) and informational
(descriptive) social influences. Two studies have investigated the role of subjective
norms in explaining attitude and intention in food choices (111-112). The first
longitudinally predicted healthy eating intention and behavior among university students
in Australia (18). Consistent with previous research, attitudes, subjective norms, and
perceived behavioral control predicted intentions for healthy eating and two weeks later,
intention predicted behavior. The other study used cross-sectional data collected from
consumers in Vietnam and found attitude, descriptive norms, and perceived behavioral
control explained intention to consume a fish product (112).
Predicting Maintenance
An underlying issue with the TPB is its inability to predict maintenance and
specific suggestions for processes that people can use to make change. One study with
adults explored the additive and interactive effects of habit strength within the
framework of the TBP (113). Researchers collected cross-sectional data and found that
habit strength was significantly correlated with fat intake. Additionally, they found
intention was significantly correlated with low intake levels of dietary fat. Shankar and
29
colleagues (40) used the TPB to predict maintenance of a frequently repeated behavior –
self-monitoring of blood glucose in patients with Type 1 diabetes over a 2-week period.
In this model, 46% of the variance in behavioral intention and 57% of the variance in
self-monitoring behavior was observed.
The TPB is not often used in nutrition education intervention studies with
adolescents. In all of the above studies, researchers relied on self-report by the
adolescents. In order for an individual to become motivated to take a nutrition related
action, they need specific skills and knowledge. Food and nutrition are complex issues
and require building behavioral skills along with self-efficacy. The studies above
demonstrate the predictability of the constructs in the TPB framework. Differences
observed in variability can be the result of questionnaire construction, administration of
questionnaires (e.g., group versus individually or self-report), the number of
questionnaires administered, age of youth to only name a few. Variability can also be
explained by studies that looked at behavior in a general way (e.g., healthy eating)
versus specific behaviors (e.g., consumption of fruits and vegetables).
30
3. PAPER 1: BREAKFAST
INTRODUCTION
Overweight and obesity are a result of energy imbalance. Several factors play a
role in this imbalance, including dietary habits, larger portion sizes, consumption of fast
food, lack of physical activity at school and in the home, and availability of high-calorie
nutrient-poor foods (1). Addressing adolescent overweight is critical because it is
associated with an increased risk of obesity into adulthood (2) but also independently is
related to morbidity and mortality in adulthood (3). Adolescence is the period between
puberty and adulthood.
Between the NHANES surveys of 1976-1980 and 2003-2006, prevalence of
obesity increased from 6.5% to 17% among 6-11 year olds and 5% to 17.6% among
those aged 12- to 19-years (4). Although attention focused on causes of increasing
obesity rates, limited attention has been given to behavioral factors which may increase
the risk of obesity. These include skipping breakfast, choosing high-fat dairy products
over low-fat counterparts, and choosing refined grains over whole-grain products.
The practice of skipping breakfast has increased over time and may be more
common among certain ethnic or low-socioeconomic groups in the adolescent
population (6). Considering that skipping breakfast is associated with obesity risk and
perhaps the under-consumption of some essential nutrients, it is more important than
ever that adolescents consume a healthy and nutritious breakfast every day (5-7).
It is estimated children receive as much as 30% of their total daily caloric intake
from the breakfast meal (17-18). When averaged over a school week, the breakfast meal
31
provided at schools as part of the School Breakfast Program (SBP) must provide one-
fourth of the Recommended Dietary Allowances (RDA) for protein, calcium, iron,
vitamins A and C, and provide adequate calories (16).
Consuming a breakfast meal is associated with better nutrient intake, healthier
food choices, more regular eating patterns throughout the day, more favorable body
weight status, and improved exercise patterns (5, 20-21). Regularly eating a breakfast
meal is important in meeting the health and nutrition needs of adolescents. Adolescents
who eat breakfast are more likely to meet the daily recommended intakes for vitamins A,
B6, and B12, and calcium than those who skip breakfast (5, 18, 22-26). More importantly,
research has shown adolescents who skip breakfast do not, on average, make up the
nutrient deficits during the rest of the day (7).
The School Breakfast Program serves over 10 million children per day (114).
Participation in the SBP has grown since its inception from about 500,000 children
participating in 1970 to 8.2 million children participating in 2002-2003 (19).
Participation in the school-breakfast program has been shown to be associated with
higher breakfast intakes of food energy, calcium, riboflavin, phosphorus, and
magnesium (27). An experimental study showed making breakfast available in
elementary schools increased the likelihood children would consume a nutritious
breakfast (28). More recently, researchers found children participating in the SBP had
significantly lower BMI especially among non-Hispanic, white children (29).
Most nutrition education efforts have examined the health benefits of eating
breakfast through an increase in nutrition knowledge and awareness. Few studies have
32
explored the value and effect of designing interventions to examine the influences of
peers and family on predicting and explaining intention and behavior to eat breakfast.
An individual’s behavior is thought to be determined proximally by his/her intentions to
perform a given behavior (39). Intentions are assumed to capture the motivational
factors that influence a behavior and are indicative of how hard a person is willing to try
and how much effort a person is willing to exert in order to perform the behavior (39).
In the long-term this is important because intention is not only influenced by peers and
family but is an indicator of how hard a person is willing to try and how much effort a
person will exert toward performing a behavior. It is also important to gain an
understanding of attitude toward eating breakfast because changing knowledge and
behavior is not enough; the ultimate goal is to effect lifelong knowledge and behavior.
Educating and motivating adolescents about the long-term benefits of consuming
breakfast every day could have a significant impact on overall health and well-being
among this age group.
CONCEPTUAL FRAMEWORK
The present study examines the impact of an after-school based intervention
designed to improve breakfast behavior and habits among adolescents. The purpose is to
increase breakfast eating in a predominantly low-income, Hispanic, adolescent
population. The intervention was grounded in the Theory of Planned Behavior (TPB).
The conceptual model guiding the intervention is presented in Figure B-1.
There have been few interventions delivered to adolescents which used the TPB
as a conceptual framework. One tested the effectiveness of an intervention program to
33
alter adolescents’ healthy eating attitudes and behavior (36). Results showed the
intervention was effective in improving attitudes toward healthy eating. Another study
examined the effect of a condom promotion leaflet and a 20-minute intervention on
adolescents intention and attitude toward using a condom (37). Results showed after the
intervention, attitude toward using a condom with new partners improved along with
intention to use condoms. In an examination of the efficacy of an intervention designed
to positively influence physical activity behavior among pediatric cancer survivors,
researchers found that the intervention had a small yet meaningful impact after one year
(38).
METHODS
The objective was to test the effectiveness of an after-school based intervention
designed to improve breakfast behavior and habits among adolescents. Specifically, the
purpose was to increase breakfast eating. The effects of attitude, social and personal
factors, personal characteristics, self-efficacy, parental influence, and individual
determinants on intention to predict change in breakfast consumption frequency was
examined. To accomplish this, a seven-week curriculum was delivered to participants.
Focus group study
The purpose of the focus group study was to collect information and suggestions
from representatives of members in the target community to aid in improving and fine-
tuning the intervention program. Three focus group discussions were conducted. The
first consisted of the administration and staff of the after-school program (n = 4; n = 2
respectively). The second two focus group discussions were conducted with adolescents
34
at two different schools (n = 10; n = 7 participants respectively). Focus group
discussions took less than 60 minutes to complete. Six questions were asked (see Table
A-1). Focus groups were not audio recorded because parents refused consent.
Intervention participants
Adolescents 11 to 15 years old (n = 106) and their parents were recruited from
after-school programs located in Los Angeles County, California. Children were
primarily Hispanic and from low socioeconomic families. Parental consent (passive) was
obtained for all participants. Adolescents provided assent. The research study protocol
was approved by the Texas A&M University Institutional Review Board of Human
Subjects.
Intervention
Participants were assigned by after-school site to either the treatment group or
control group. Within the treatment group (n = 57), participants were assigned to groups
based on grade to facilitate discussion and to allow for easy group interaction (Figure B-
2). Each group met for 60 minutes, once weekly, for seven weeks. Two weeks were set
aside for completion of the survey (pre-intervention and post-intervention). The
curriculum focused on identifying the influences of and changing behaviors of attitude,
subjective norms, and perceived behavioral control. Nutrition education lessons are
identified in Table A-2. The first three lessons focused on basic nutrition concepts to
include the food guide pyramid and the importance of including whole-grains in the
breakfast meal to overall health and well-being. The later lessons focused on identifying
35
barriers and overcoming barriers, goal-setting, and identifying methods to stay
motivated.
During weeks two through seven, to increase self-efficacy (perceived behavioral
control) adolescents were provided the opportunity to taste various whole-grain
breakfast cereals and cereal bars, and low-fat milk and diary products, and different
flavors of soy milk.
Survey Questions
Questionnaires were administered by trained staff to adolescents in the control
and treatment groups and self-administered to both parents of each group (in two-parent
households). Questionnaires were administered at baseline and post-intervention (seven
weeks after the program had started). The principle investigator was present at all times
during survey completion by adolescents to avoid inconsistencies of administration. All
constructs of the Theory of Planned Behavior (TPB) were developed based on the
guidelines described by Ajzen (115). In total, 76 questions addressed salient, behavioral,
normative, and control beliefs relative to the dependant variable (breakfast) in the
adolescent survey. Each belief was paired with a corresponding value statement of that
belief. For example, the statement “I think eating breakfast every day is good for me”
was paired with a corresponding value statement of this belief: “I think eating breakfast
every day will help me to do better in school”.
36
Behavioral intention
Intention was measured by two questions on a 7-point, unipolar scale scored
from +1 to +7. Higher scores indicated a stronger intention (e.g., I intend to eat
breakfast every day… ‘strongly disagree – strongly agree’).
Attitude
Attitude toward eating breakfast (behavioral belief) was measured by twelve
questions using a 7-point, unipolar scale indicating a more positive attitude (e.g., I think
that eating breakfast is good for me… ‘strongly disagree – strongly agree’). Attitude
toward the value of eating breakfast was measured on a bipolar bad-good scale scored
from -3 to +3 (e.g., I think that eating breakfast will provide important nutrients to my
diet … ‘strongly disagree – strongly agree’).
Subjective norm
Subjective norm was measured by six questions using a 7-point unipolar
disagree-agree scale scored +1 to +7 with higher scores indicating more pressure from
others (normative belief). Motivation to do what each referent thinks (motivation to
comply) was measured by using a 7-point unipolar disagree-agree scaled scored +1 to +7
(e.g., I think it is important to do what my parents want me to do ... ‘strongly disagree –
strongly agree’).
Perceived behavioral control
Perceived behavioral control over performing the behavior was measured by two
questions on a semantic differential scale (e.g., I believe it is “up to me” … “not up to
me” to eat breakfast every day). The perceived ease or difficulty of performing the
37
behavior (perceived power) was measured using a bipolar difficult-easy scale scored -3
to +3 (e.g., I think it is ‘easy’ to eat breakfast every day).
Demographic characteristics
Adolescents self-reported race, ethnicity, and age at time of questionnaire
completion.
Statistical analysis
Data were analyzed using the SAS statistical analysis program (v. 9.2). Standard
descriptive statistics were obtained for all variables. The Cronbach alpha test was used
to measure internal consistency, and thus the reliability, of the items that measure the
constructs in the TPB. A given set of items is needed to produce an alpha of 0.70 or
greater to be considered internally consistent (116). Regression analysis was used to
determine the predictors of participants’ intention to eat breakfast. Predictors in these
models included attitudes, subjective norms, perceived behavioral control, and control
variables representing the adolescent’s gender and whether they were in the treatment or
control groups. A p-value of .05 was considered to indicate a statistical significance.
Where multiple measures of a given construct were present, a Cronbach’s alpha was
generated to test for internal consistency, with an alpha of .70 or above considered
acceptable.
Variable creation
The behavioral, normative, and control scores were determined by multiplying
each belief statement by the corresponding value statement. Principal component
analysis was run as a variable reduction procedure (See Appendix D). Factors produced
38
by these analyses were accepted if they met the minimum eigenvalue of 1.0 and if they
explained at least 10% of the variance in the items; a variable was considered to load on
a given factor if the loading was equal to or greater than .600. Finally, interaction
variables were created between group (treatment vs. control) and attitude, group and
subjective norms, group and perceived behavioral control, group and change in attitude,
group and change in subjective norms, and group and change in perceived behavioral
control.
Power
To determine power and effect size, the tables from Clark-Carter (117) were
used. The tables for regression analysis are based on the number of variables. A
regression model with six predictors that explains a modest amount of variance (around
15%) produces statistical power of .88 with a sample size of 100 (treatment plus control
group). A regression model with eight independent variables or predictors that explains
a modest amount of variance (around 15%) would achieve statistical power of .72 with a
sample size of 80.
RESULTS
Baseline characteristics of our study population are shown in Table A-3. Eighty-
eight percent of participants were Hispanic, 55% were girls and mean age was 12 years.
One-hundred six adolescents completed the questionnaire pre-intervention and 75
completed the questionnaire post-intervention (70%). Results of this study were based
only on the 75 cases with the complete data. Missing data were the result of
participation attrition in the after-school program. Attrition in after-school programs
39
occurs frequently in this geographic area and is usually because parents cannot afford to
have their child in after-school care during that particular month. Chi-square analyses
revealed no significant (ns) differences (p > 0.05) between the treatment and intervention
groups (2 = 1, 106) or gender (2 = 1, 106). Significance was seen in race with the
majority of participants comprised of Hispanics (2 = 3, 106) <.0001 (see Table A-4).
Outcome measures: item analysis
Cronbach alpha statistic for subjective norms and attitudes toward eating
breakfast at time 1 and time 2 are presented in Table A-5. Sources of social influence
over breakfast consumption included parents, teachers, and friends. Subjective norms
regarding eating breakfast were 0.68 and 0.67 respectively. Attitudes about the value of
eating breakfast were .89 and .90 respectively.
Attitude
The twelve-item attitude towards eating breakfast scale underwent separate
principal components analysis for responses at time 1 and time 2. For time 1, two factors
were produced, under the minimum eigenvalue of 1.0. The first factor explained 54.9%
of the variance in the twelve items. However, the second factor was largely driven by
one item, “I think that eating breakfast every day will make me healthier”. This factor
explained only 4% of the variance in the nine items. Only the first factor was retained for
further analyses. A Cronbach’s alpha on those items that loaded high (0.600 or greater)
on the first factor produced 0.89. At time 2 a single factor was produced, explaining
57.5% of the variance in the nine items; all items loaded greater than 0.600 on this factor
40
except for one item “I think that skipping breakfast every day will make me gain
weight”. A Cronbach’s alpha on those produced 0.90.
Subjective norms
The three items reflecting subject norms underwent separate principal
components analyses for time 1 and time 2, respectively. Each analysis produced a
single factor, each of which explained more than 61% of the variance in the three items.
Cronbach’s alpha for these items was .56 and .75 respectively.
Intention and perceived behavioral control
Two survey questions reflected intention and perceived behavioral control.
Means were computed for each pair of questions. The means for intention at time 1 and
time 2 were 4.90 (SD=2.013) and 5.34 respectively (SD=1.695). Perceived behavioral
control means were 11.56 (SD=11.469) and 12.81 (SD=9.973) for time 1 and time 2
respectively.
Regression analysis
Intention to eat breakfast every day at time 2 was regressed on intention to do so
at time 1 along with changes in attitude towards eating breakfast, subjective norms, and
perceived behavioral control. Group (treatment and control) and gender were also in the
model. Results are presented in Table A-6. Intention at time 1 was found to be
significant (p < .0001) in predicting intention to eat breakfast at a later time. The
variance explained in intention at time 2 was low (r2 = .35). However, as this model
does not differentiate changes in attitudes, subjective norms, or perceived behavioral
control by group, additional models were run with interactions between group (treatment
41
versus control) and these three change variables. Results showed no significant
interactions.
DISCUSSION
Breakfast may be considered the most important meal of the day yet many people
skip it and adolescents are no exception. Our study examined whether a nutrition
education intervention based on the Theory of Planned Behavior could change the
breakfast behavior of predominately, low-income, Hispanic, adolescents. To our
knowledge, this study is the first of its kind. It is well-known that the use of the Theory
of Planned Behavior is useful in identifying predictors of healthful dietary practices
among adolescents and adults from different ethnic groups (42, 105, 109-112) but these
studies included no interventions.
Breakfast consumption patterns among children and adolescents are of concern
to public health experts, given the association of breakfast consumption with overall diet
quality and nutritional adequacy (17, 23, 32, 93), school performance (7, 57) and the
relationship with overweight and obesity (5, 15, 20, 25, 58). Data from the Nationwide
Food Consumption Surveys for 1965-1966, 1977-1978 (18, 59) and the 1989, 1990, and
1991 Continuing Surveys of Food Intakes by Individuals (18, 59) document a decline in
breakfast consumption by youth in the United States.
There have been a few interventions delivered to adolescents which used the
TPB as a conceptual framework. One tested the effectiveness of an intervention
program to change adolescents’ healthy eating attitudes and behavior (36). Results
showed the intervention was effective in improving attitudes toward healthy eating.
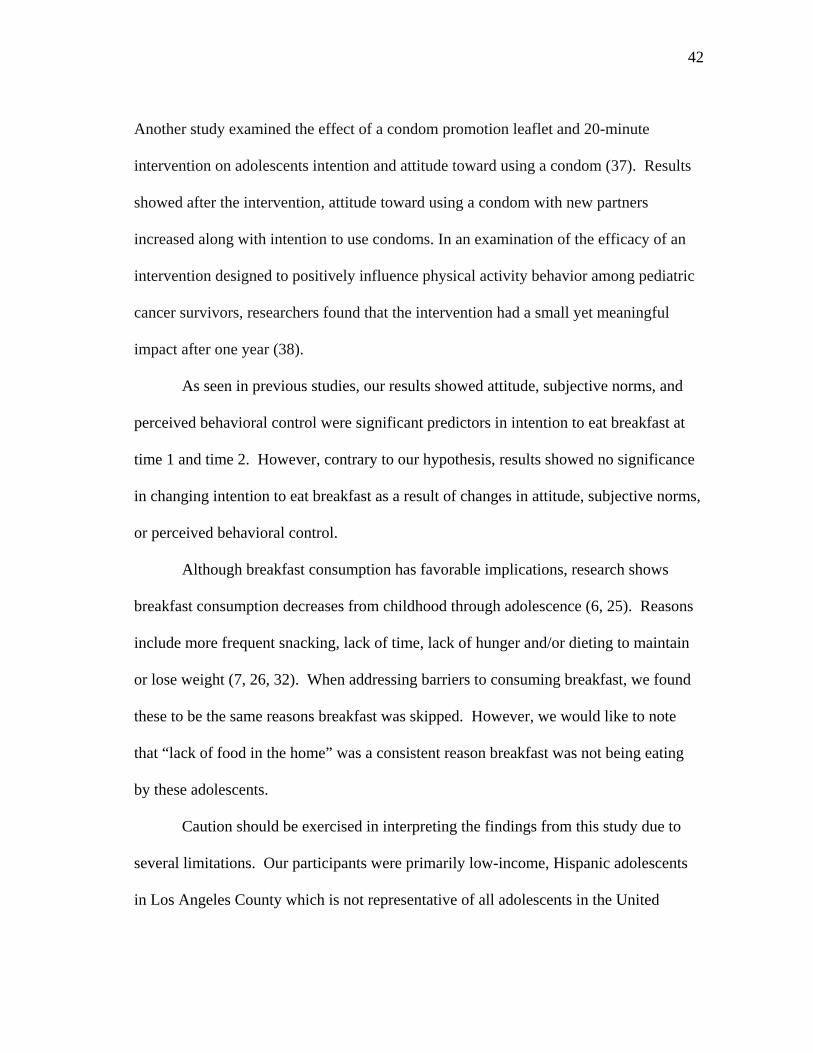
42
Another study examined the effect of a condom promotion leaflet and 20-minute
intervention on adolescents intention and attitude toward using a condom (37). Results
showed after the intervention, attitude toward using a condom with new partners
increased along with intention to use condoms. In an examination of the efficacy of an
intervention designed to positively influence physical activity behavior among pediatric
cancer survivors, researchers found that the intervention had a small yet meaningful
impact after one year (38).
As seen in previous studies, our results showed attitude, subjective norms, and
perceived behavioral control were significant predictors in intention to eat breakfast at
time 1 and time 2. However, contrary to our hypothesis, results showed no significance
in changing intention to eat breakfast as a result of changes in attitude, subjective norms,
or perceived behavioral control.
Although breakfast consumption has favorable implications, research shows
breakfast consumption decreases from childhood through adolescence (6, 25). Reasons
include more frequent snacking, lack of time, lack of hunger and/or dieting to maintain
or lose weight (7, 26, 32). When addressing barriers to consuming breakfast, we found
these to be the same reasons breakfast was skipped. However, we would like to note
that “lack of food in the home” was a consistent reason breakfast was not being eating
by these adolescents.
Caution should be exercised in interpreting the findings from this study due to
several limitations. Our participants were primarily low-income, Hispanic adolescents
in Los Angeles County which is not representative of all adolescents in the United
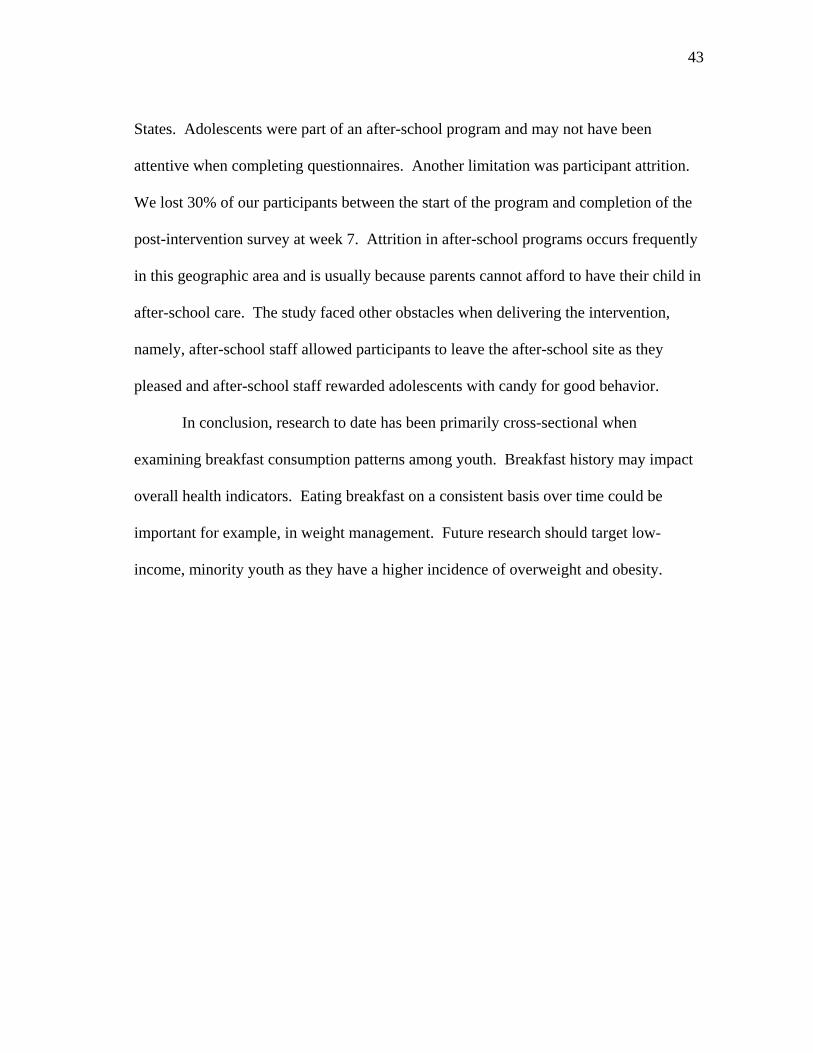
43
States. Adolescents were part of an after-school program and may not have been
attentive when completing questionnaires. Another limitation was participant attrition.
We lost 30% of our participants between the start of the program and completion of the
post-intervention survey at week 7. Attrition in after-school programs occurs frequently
in this geographic area and is usually because parents cannot afford to have their child in
after-school care. The study faced other obstacles when delivering the intervention,
namely, after-school staff allowed participants to leave the after-school site as they
pleased and after-school staff rewarded adolescents with candy for good behavior.
In conclusion, research to date has been primarily cross-sectional when
examining breakfast consumption patterns among youth. Breakfast history may impact
overall health indicators. Eating breakfast on a consistent basis over time could be
important for example, in weight management. Future research should target low-
income, minority youth as they have a higher incidence of overweight and obesity.
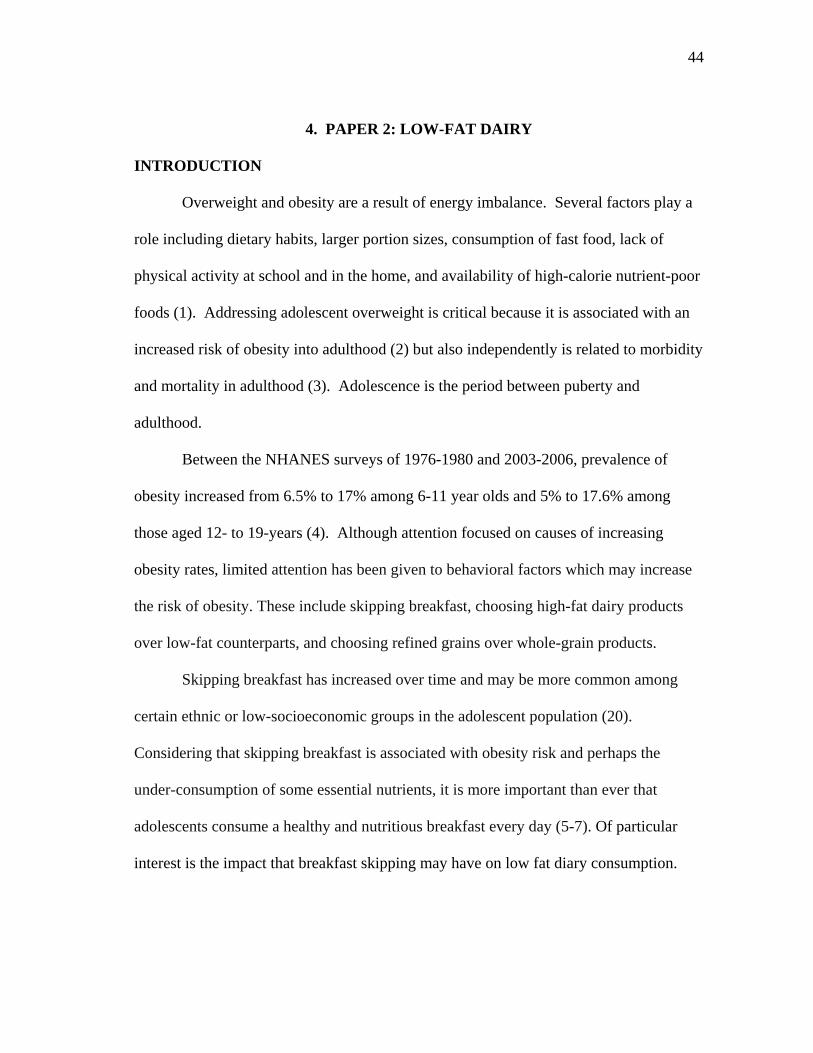
44
4. PAPER 2: LOW-FAT DAIRY
INTRODUCTION
Overweight and obesity are a result of energy imbalance. Several factors play a
role including dietary habits, larger portion sizes, consumption of fast food, lack of
physical activity at school and in the home, and availability of high-calorie nutrient-poor
foods (1). Addressing adolescent overweight is critical because it is associated with an
increased risk of obesity into adulthood (2) but also independently is related to morbidity
and mortality in adulthood (3). Adolescence is the period between puberty and
adulthood.
Between the NHANES surveys of 1976-1980 and 2003-2006, prevalence of
obesity increased from 6.5% to 17% among 6-11 year olds and 5% to 17.6% among
those aged 12- to 19-years (4). Although attention focused on causes of increasing
obesity rates, limited attention has been given to behavioral factors which may increase
the risk of obesity. These include skipping breakfast, choosing high-fat dairy products
over low-fat counterparts, and choosing refined grains over whole-grain products.
Skipping breakfast has increased over time and may be more common among
certain ethnic or low-socioeconomic groups in the adolescent population (20).
Considering that skipping breakfast is associated with obesity risk and perhaps the
under-consumption of some essential nutrients, it is more important than ever that
adolescents consume a healthy and nutritious breakfast every day (5-7). Of particular
interest is the impact that breakfast skipping may have on low fat diary consumption.
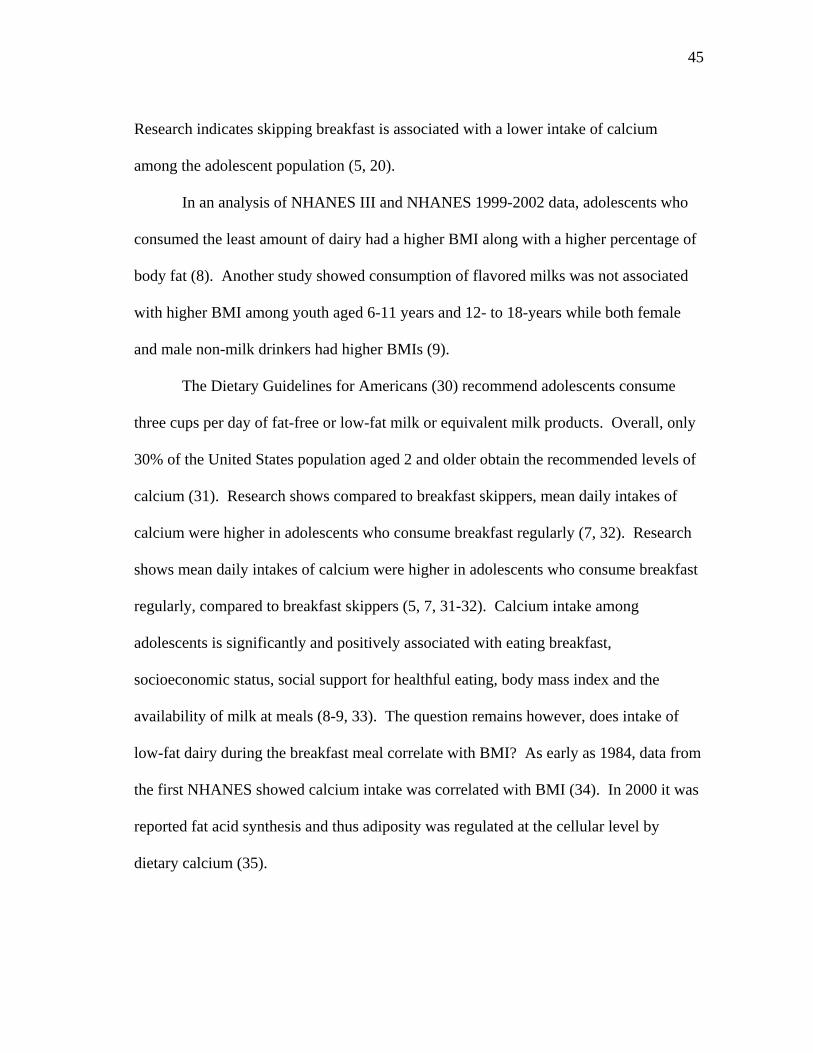
45
Research indicates skipping breakfast is associated with a lower intake of calcium
among the adolescent population (5, 20).
In an analysis of NHANES III and NHANES 1999-2002 data, adolescents who
consumed the least amount of dairy had a higher BMI along with a higher percentage of
body fat (8). Another study showed consumption of flavored milks was not associated
with higher BMI among youth aged 6-11 years and 12- to 18-years while both female
and male non-milk drinkers had higher BMIs (9).
The Dietary Guidelines for Americans (30) recommend adolescents consume
three cups per day of fat-free or low-fat milk or equivalent milk products. Overall, only
30% of the United States population aged 2 and older obtain the recommended levels of
calcium (31). Research shows compared to breakfast skippers, mean daily intakes of
calcium were higher in adolescents who consume breakfast regularly (7, 32). Research
shows mean daily intakes of calcium were higher in adolescents who consume breakfast
regularly, compared to breakfast skippers (5, 7, 31-32). Calcium intake among
adolescents is significantly and positively associated with eating breakfast,
socioeconomic status, social support for healthful eating, body mass index and the
availability of milk at meals (8-9, 33). The question remains however, does intake of
low-fat dairy during the breakfast meal correlate with BMI? As early as 1984, data from
the first NHANES showed calcium intake was correlated with BMI (34). In 2000 it was
reported fat acid synthesis and thus adiposity was regulated at the cellular level by
dietary calcium (35).
46
CONCEPTUAL FRAMEWORK
The present study examines the impact of an after-school based intervention
designed to improve consumption of low-fat dairy at the breakfast meal among
adolescents. The purpose is to increase low-fat dairy consumption in a predominantly
low-income, Hispanic, adolescent population. The intervention was grounded in the
Theory of Planned Behavior (TPB). The conceptual model guiding the intervention is
presented in Figure B-1.
There have been few interventions delivered to adolescents which used the TPB
as a conceptual framework. One tested the effectiveness of an intervention program to
alter adolescents’ healthy eating attitudes and behavior (36). Results showed the
intervention was effective in improving attitudes toward healthy eating. Another study
examined the effect of a condom promotion leaflet and 20-minute intervention on
adolescents intention and attitude toward using a condom (37). Results showed after the
intervention, attitude toward using a condom with new partners increased along with
intention to use condoms. In an examination of the efficacy of an intervention designed
to positively influence physical activity behavior among pediatric cancer survivors,
researchers found that the intervention had a small yet meaningful impact after one year
(38).
METHODS
The objective was to test the effectiveness of an after-school based intervention
designed to improve breakfast behavior and habits among adolescents. The purpose was
to increase consumption of low-fat dairy (milk, cheese, and yogurt). The effects of
47
attitude, social and personal factors, personal characteristics, self-efficacy, parental
influence, and individual determinants on intention to predict change in consumption of
low-fat dairy frequency was examined. To accomplish this, a seven-week curriculum
was delivered to participants.
Focus group study
The purpose of the focus group study was to collect information and suggestions
from representatives of members in the target community to aid in improving and fine-
tuning the intervention program. Three focus group discussions were conducted. The
first consisted of the administration and staff of the after-school program (n = 4; n = 2
respectively). The second two focus group discussions were conducted with adolescents
at two different schools (n = 10; n = 7 participants respectively). Focus group
discussions took less than 60 minutes to complete. Focus group discussions took less
than 60 minutes to complete. Six questions were asked (see Table A-1). Focus groups
were not audio recorded because parents.
Intervention participants
Adolescents 11 to 15 years old (n = 106) and their parents were recruited from
after-school programs located in Los Angeles County, California. Children were
primarily Hispanic and from low socioeconomic families. Parental consent (passive) was
obtained for all participants. Adolescents provided assent. The research study protocol
was approved by the Texas A&M University Institutional Review Board of Human
Subjects.
48
Intervention
Participants were assigned by after-school site to either the treatment group or
control group. Within the treatment group (n = 57), participants were assigned to groups
based on grade to facilitate discussion and to allow for easy group interaction (see
Figure B-2). Each group met for 60 minutes, once weekly, for seven weeks. Two
weeks were set aside for completion of the survey (pre-intervention and post-
intervention). The curriculum focused on identifying the influences of and changing
behaviors of attitude, subjective norms, and perceived behavioral control. Nutrition
education lessons are identified in Table A-2. The first three lessons focused on basic
nutrition concepts to include the food guide pyramid and the importance of consuming
low-fat dairy to overall health and well-being. The later lessons focused on identifying
barriers and overcoming barriers, goal-setting, and identifying methods to stay
motivated.
During weeks two through seven, to increase self-efficacy (perceived behavioral
control) adolescents were provided the opportunity to taste various whole-grain
breakfast cereals and cereal bars, and low-fat milk and dairy products, and a variety of
low-fat/fat-free yogurt and low-fat string cheese.
Survey Questions
Questionnaires were administered by trained staff to adolescents in the control
and treatment groups and self-administered to both parents of each group (in two-parent
households). Questionnaires were administered at baseline and post-intervention (seven
weeks after the program had started). The principle investigator was present at all times
49
during survey completion by adolescents to avoid inconsistencies of administration. All
constructs of the Theory of Planned Behavior (TPB) were developed based on the
guidelines described by Ajzen (115). In total, 76 questions addressed salient, behavioral,
normative, and control beliefs relative to the dependant variable (breakfast) in the
adolescent survey. Each belief was paired with a corresponding value statement of that
belief. For example, the statement “I think drinking 2% milk every day is good for me”
was paired with a corresponding value statement of this belief: “I think drinking 2%
milk every day will help me to do better in school”.
Behavioral intention – milk (skim, 1%, and 2%)
Intention was measured by six questions on a 7-point, unipolar scale scored from
+1 to +7. Higher scores indicated a stronger intention (e.g., I intend to drink skim milk
every day… ‘strongly disagree – strongly agree’).
Behavioral intention – low-fat cheese and yogurt
Intention was measured by four questions on a 7-point, unipolar scale scored
from +1 to +7. Higher scores indicated a stronger intention (e.g., I intend to eat low-fat
yogurt… ‘strongly disagree – strongly agree’).
Attitude – milk (skim, 1%, and 2%)
Attitude toward drinking milk (behavioral belief) was measured by nine
questions using a 7-point, unipolar scale indicating a more positive attitude (e.g., I think
that drinking skim milk is good for me… ‘strongly disagree – strongly agree’). Attitude
toward the value of eating whole-grains was measured on a bipolar bad-good scale
50
scored from -3 to +3 (e.g., I think that drinking skim milk will provide important
nutrients to my diet … ‘strongly disagree – strongly agree’).
Attitude – low-fat cheese and yogurt
Attitude toward eating low-fat dairy products (behavioral belief) was measured
by six questions using a 7-point, unipolar scale indicating a more positive attitude (e.g., I
think that eating low-fat cheese is good for me… ‘strongly disagree – strongly agree’).
Attitude toward the value of eating low-fat dairy was measured on a bipolar bad-good
scale scored from -3 to +3 (e.g., I think that eating low-fat cheese will make me
healthier… ‘strongly disagree – strongly agree’).
Subjective norm – milk (skim, 1%, and 2%)
Subjective norm was measured by three questions using a 7-point unipolar
disagree-agree scale scored +1 to +7 with higher scores indicating more pressure from
others (normative belief). Motivation to do what each referent thinks (motivation to
comply) was measured by using a 7-point unipolar disagree-agree scaled scored +1 to +7
(e.g., I think it is important to do what my parents want me to do ... ‘strongly disagree –
strongly agree’).
Subjective norm – low-fat cheese and yogurt
Subjective norm was measured by three questions using a 7-point unipolar
disagree-agree scale scored +1 to +7 with higher scores indicating more pressure from
others (normative belief). Motivation to do what each referent thinks (motivation to
comply) was measured on using a 7-point unipolar disagree-agree scaled scored +1 to +7
51
(e.g., I think it is important to do what my parents want me to do ... ‘strongly disagree –
strongly agree’).
Perceived behavioral control – milk (skim, 1%, and 2%)
Perceived behavioral control over performing the behavior was measured by four
questions on a semantic differential scale (e.g., I believe it is “up to me” … “not up to
me” to eat low-fat dairy). The perceived ease or difficulty of performing the behavior
(perceived power) was measured using a bipolar difficult-easy scale scored -3 to +3
(e.g., I think it is ‘easy’ to drink a glass of milk with every meal).
Perceived behavioral control – low-fat cheese and yogurt
Perceived behavioral control over performing the behavior was measured by one
question on a semantic differential scale (e.g., I believe it is “up to me” … “not up to
me” to eat low-fat dairy). The perceived ease or difficulty of performing the behavior
(perceived power) was measured using a bipolar difficult-easy scale scored -3 to +3
(e.g., I think it is ‘easy’ to eat low-fat dairy products).
Demographic characteristics
Adolescents self-reported race, ethnicity, age at time of questionnaire
completion.
Statistical analysis
Data were analyzed using the SAS statistical analysis program (v. 9.2). Standard
descriptive statistics were obtained for all variables. The Cronbach alpha test was used
to measure internal consistency, and thus the reliability, of the items that measure the
constructs in the TPB. A given set of items is needed to produce an alpha of 0.70 or
52
greater to be considered internally consistent (116). Regression analysis was used to
determine the predictors of participants’ intention to eat whole-grains. Predictors in
these models included attitudes, subjective norms, perceived behavioral control, and
control variables representing the adolescent’s gender and whether they were in the
treatment or control groups. A p-value of .05 was considered to indicate a statistical
significance. Where multiple measures of a given construct were present, a Cronbach’s
alpha was generated to test for internal consistency, with an alpha of .70 or above
considered acceptable.
Variable creation
The behavioral, normative, and control scores were determined by multiplying
each belief statement by the corresponding value statement (e.g., “My friends think it is
important to drink milk with every meal” multiplied by “I think it is important to do
what my friends want”). Principal component analysis was run as a variable reduction
procedure (See Appendix D). Factors produced by these analyses were accepted if they
met the minimum eigenvalue of 1.0 and if they explained at least 10% of the variance in
the items; a variable was considered to load on a given factor if the loading was equal to
or greater than .600. Finally, interaction variables were created between group (treatment
vs. control) and attitude, group and subjective norms, group and perceived behavioral
control, group and change in attitude, group and change in subjective norms, and group
and change in perceived behavioral control.
53
Power
To determine power and effect size, the tables from Clark-Carter (117) were
used. The tables for regression analysis are based on the number of variables. A
regression model with six predictors that explains a modest amount of variance (around
15%) produces statistical power of .88 with a sample size of 100 (treatment plus control
group). A regression model with eight independent variables or predictors that explains
a modest amount of variance (around 15%) would achieve statistical power of .72 with a
sample size of 80.
RESULTS
Baseline characteristics of our study population are shown in Table A-3. Eighty-
eight percent of participants were Hispanic, 55% were girls and mean age was 12 years.
One-hundred six adolescents completed the questionnaire pre-intervention and 75
completed the questionnaire post-intervention (70%). Results of this study were based
only on the 75 cases with the complete data. Missing data were the result of
participation attrition in the after-school program. Attrition in after-school programs
occurs frequently in this geographic area and is usually because parents cannot afford to
have their child in after-school care during that particular month. Chi-square analyses
revealed no significant (ns) differences (p > 0.05) between the treatment and intervention
groups (2 = 1, 106) or gender (2 = 1, 106). Significance was seen in race with the
majority of participants comprised of Hispanics (2 = 3, 106) p <.0001 (see Table A-4).
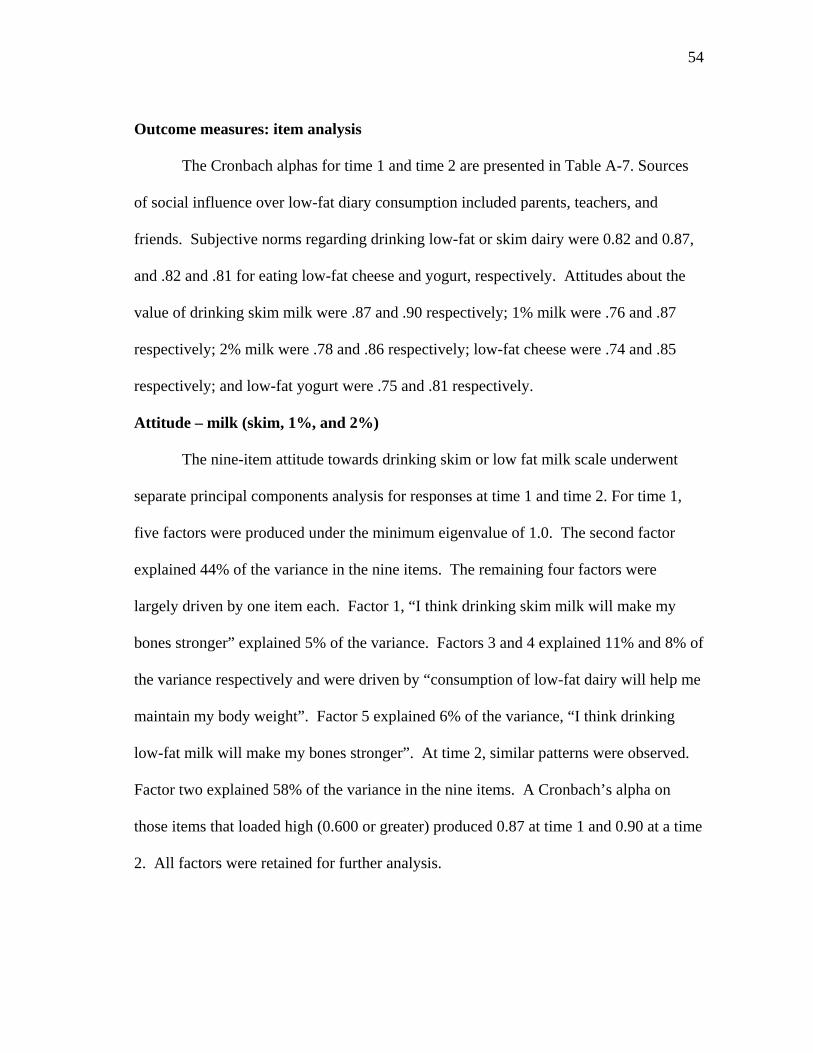
54
Outcome measures: item analysis
The Cronbach alphas for time 1 and time 2 are presented in Table A-7. Sources
of social influence over low-fat diary consumption included parents, teachers, and
friends. Subjective norms regarding drinking low-fat or skim dairy were 0.82 and 0.87,
and .82 and .81 for eating low-fat cheese and yogurt, respectively. Attitudes about the
value of drinking skim milk were .87 and .90 respectively; 1% milk were .76 and .87
respectively; 2% milk were .78 and .86 respectively; low-fat cheese were .74 and .85
respectively; and low-fat yogurt were .75 and .81 respectively.
Attitude – milk (skim, 1%, and 2%)
The nine-item attitude towards drinking skim or low fat milk scale underwent
separate principal components analysis for responses at time 1 and time 2. For time 1,
five factors were produced under the minimum eigenvalue of 1.0. The second factor
explained 44% of the variance in the nine items. The remaining four factors were
largely driven by one item each. Factor 1, “I think drinking skim milk will make my
bones stronger” explained 5% of the variance. Factors 3 and 4 explained 11% and 8% of
the variance respectively and were driven by “consumption of low-fat dairy will help me
maintain my body weight”. Factor 5 explained 6% of the variance, “I think drinking
low-fat milk will make my bones stronger”. At time 2, similar patterns were observed.
Factor two explained 58% of the variance in the nine items. A Cronbach’s alpha on
those items that loaded high (0.600 or greater) produced 0.87 at time 1 and 0.90 at a time
2. All factors were retained for further analysis.
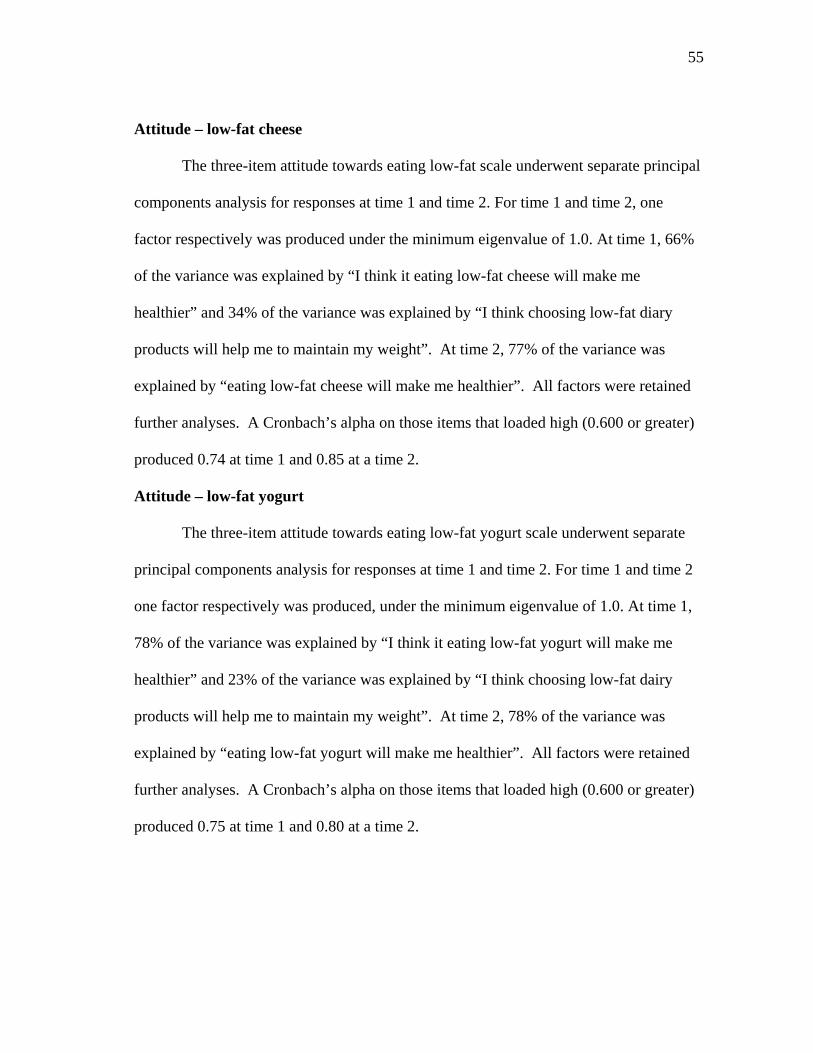
55
Attitude – low-fat cheese
The three-item attitude towards eating low-fat scale underwent separate principal
components analysis for responses at time 1 and time 2. For time 1 and time 2, one
factor respectively was produced under the minimum eigenvalue of 1.0. At time 1, 66%
of the variance was explained by “I think it eating low-fat cheese will make me
healthier” and 34% of the variance was explained by “I think choosing low-fat diary
products will help me to maintain my weight”. At time 2, 77% of the variance was
explained by “eating low-fat cheese will make me healthier”. All factors were retained
further analyses. A Cronbach’s alpha on those items that loaded high (0.600 or greater)
produced 0.74 at time 1 and 0.85 at a time 2.
Attitude – low-fat yogurt
The three-item attitude towards eating low-fat yogurt scale underwent separate
principal components analysis for responses at time 1 and time 2. For time 1 and time 2
one factor respectively was produced, under the minimum eigenvalue of 1.0. At time 1,
78% of the variance was explained by “I think it eating low-fat yogurt will make me
healthier” and 23% of the variance was explained by “I think choosing low-fat dairy
products will help me to maintain my weight”. At time 2, 78% of the variance was
explained by “eating low-fat yogurt will make me healthier”. All factors were retained
further analyses. A Cronbach’s alpha on those items that loaded high (0.600 or greater)
produced 0.75 at time 1 and 0.80 at a time 2.
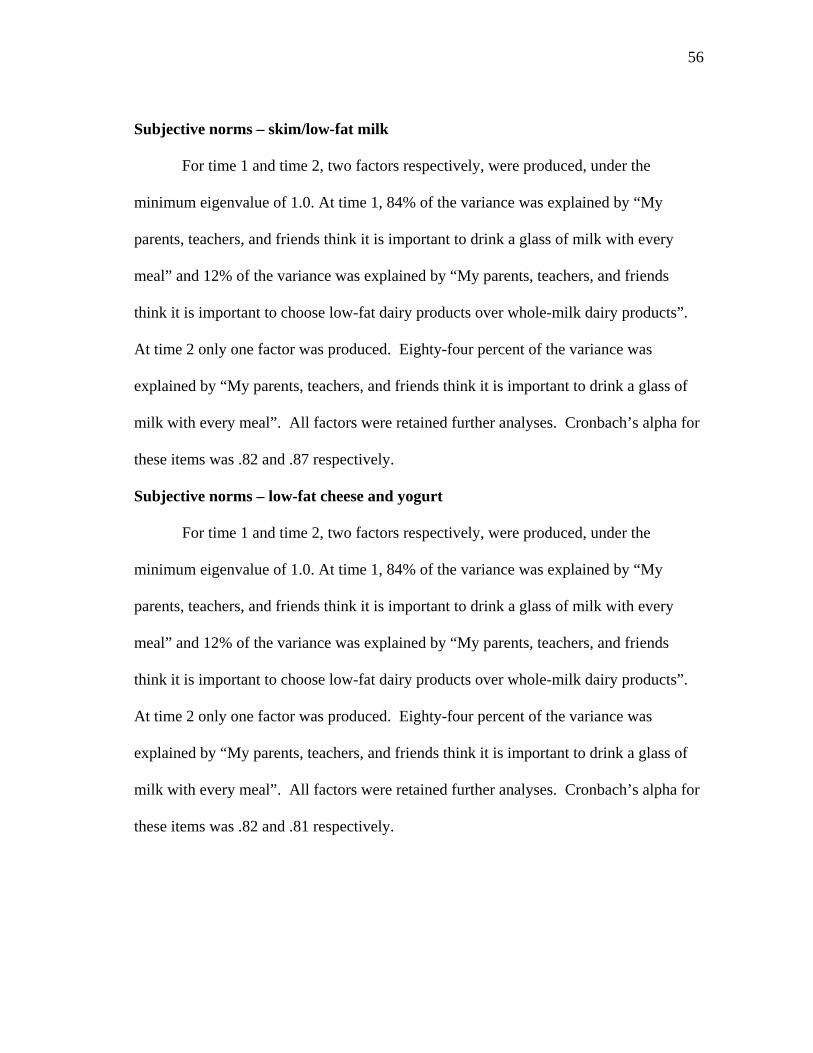
56
Subjective norms – skim/low-fat milk
For time 1 and time 2, two factors respectively, were produced, under the
minimum eigenvalue of 1.0. At time 1, 84% of the variance was explained by “My
parents, teachers, and friends think it is important to drink a glass of milk with every
meal” and 12% of the variance was explained by “My parents, teachers, and friends
think it is important to choose low-fat dairy products over whole-milk dairy products”.
At time 2 only one factor was produced. Eighty-four percent of the variance was
explained by “My parents, teachers, and friends think it is important to drink a glass of
milk with every meal”. All factors were retained further analyses. Cronbach’s alpha for
these items was .82 and .87 respectively.
Subjective norms – low-fat cheese and yogurt
For time 1 and time 2, two factors respectively, were produced, under the
minimum eigenvalue of 1.0. At time 1, 84% of the variance was explained by “My
parents, teachers, and friends think it is important to drink a glass of milk with every
meal” and 12% of the variance was explained by “My parents, teachers, and friends
think it is important to choose low-fat dairy products over whole-milk dairy products”.
At time 2 only one factor was produced. Eighty-four percent of the variance was
explained by “My parents, teachers, and friends think it is important to drink a glass of
milk with every meal”. All factors were retained further analyses. Cronbach’s alpha for
these items was .82 and .81 respectively.
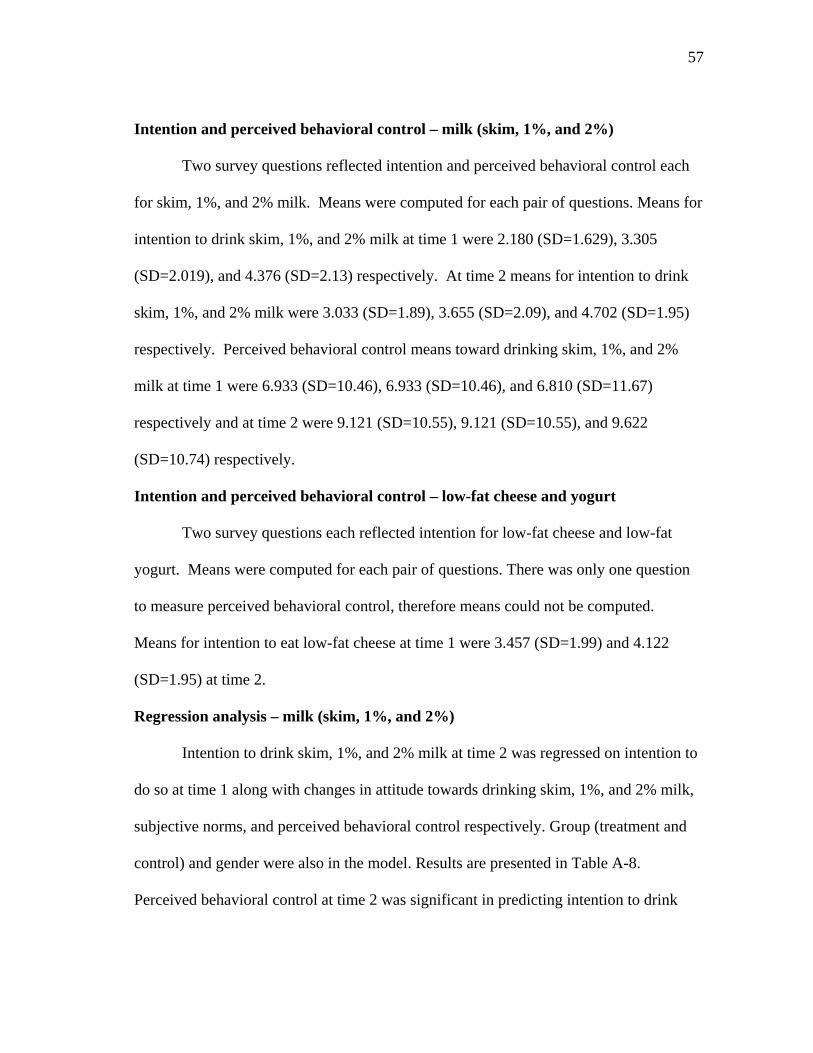
57
Intention and perceived behavioral control – milk (skim, 1%, and 2%)
Two survey questions reflected intention and perceived behavioral control each
for skim, 1%, and 2% milk. Means were computed for each pair of questions. Means for
intention to drink skim, 1%, and 2% milk at time 1 were 2.180 (SD=1.629), 3.305
(SD=2.019), and 4.376 (SD=2.13) respectively. At time 2 means for intention to drink
skim, 1%, and 2% milk were 3.033 (SD=1.89), 3.655 (SD=2.09), and 4.702 (SD=1.95)
respectively. Perceived behavioral control means toward drinking skim, 1%, and 2%
milk at time 1 were 6.933 (SD=10.46), 6.933 (SD=10.46), and 6.810 (SD=11.67)
respectively and at time 2 were 9.121 (SD=10.55), 9.121 (SD=10.55), and 9.622
(SD=10.74) respectively.
Intention and perceived behavioral control – low-fat cheese and yogurt
Two survey questions each reflected intention for low-fat cheese and low-fat
yogurt. Means were computed for each pair of questions. There was only one question
to measure perceived behavioral control, therefore means could not be computed.
Means for intention to eat low-fat cheese at time 1 were 3.457 (SD=1.99) and 4.122
(SD=1.95) at time 2.
Regression analysis – milk (skim, 1%, and 2%)
Intention to drink skim, 1%, and 2% milk at time 2 was regressed on intention to
do so at time 1 along with changes in attitude towards drinking skim, 1%, and 2% milk,
subjective norms, and perceived behavioral control respectively. Group (treatment and
control) and gender were also in the model. Results are presented in Table A-8.
Perceived behavioral control at time 2 was significant in predicting intention to drink
58
skim, 1%, and 2% milk at a later time (p < .05; p < .0001; p < .001 respectively).
Interaction models between group and attitude, subjective norms, and perceived
behavioral control respectively were analyzed. Results are presented in Table A-9.
However, as these models do not differentiate changes in attitudes, subjective norms, or
perceived behavioral control by group, additional models were run with interactions
between group (treatment versus control) and these three change variables. Results of
these analyses are presented in Table A-10. Changes in perceived behavioral control
among participants in the control group (Figures B-3, B-4, B05) to drink skim milk, 1%
milk, and 2% milk produced significant results (p < .05; p < .001; p < .001 respectively).
Changes in attitude among participants in the control group (Figure B-6) to drink skim
milk produced significant results (p < .05). Additional interaction models with attitude
change, subjective norm change, and perceived behavioral control change were run with
significant results (p < .05) seen in perceived behavioral control among participants in
the control group to drink 1% and 2% milk respectively (Figures B-7, B-8).
Regression analysis – low-fat cheese and yogurt
Intention to eat low-fat cheese or yogurt at time 2 was regressed on intention to
do so at time 1 along with changes in attitude towards eating low-fat cheese or yogurt,
subjective norms, and perceived behavioral control respectively. Group (treatment and
control) and gender were also in the model. Results are presented in Table A-8. Attitude
toward eating low-fat cheese and yogurt at a later time was predicted by attitude at time
1 for both (p < .0001). Attitude at time 2 was significant in predicting intention to eat
low-fat cheese at a later time (p < .0001). At time 2, attitude and subjective norms were
59
significant in predicting intention toward eating low-fat yogurt at a later time (p < .001
and p < .05 respectively). However, as these models do not differentiate changes in
attitudes, subjective norms, or perceived behavioral control by group, additional models
were run with interactions between group (treatment versus control) and these three
change variables. No significant results were seen.
DISCUSSION
Our study examined whether a nutrition education intervention based on the
Theory of Planned Behavior could change the behavior toward consuming low-fat dairy
food items by predominately, low-income, Hispanic, adolescents. To our knowledge,
this study is the first of its kind. Previous research shows the use of the Theory of
Planned Behavior is effective in identifying predictors of healthful dietary practices
among adolescents and adults from different ethnic groups (42, 105, 109-112) but these
studies included no interventions. Given that consumption of low-fat dairy is associated
with a lower body mass index and greater intake of calcium among adolescents (5, 20), it
is more important than ever that public health practitioners design interventions that
emphasize consumption of low-fat dairy as part of the breakfast meal.
According to the TPB, attitude is defined as the overall evaluation of behavior
and refers to the degree to which a person has a favorable or unfavorable assessment of
the behavior in question (behavioral beliefs) and how much value is placed on the
behavioral outcome (evaluation) (45). Our results showed a post-intervention
improvement in the attitude toward consuming low-fat milk among participants in the
treatment group suggesting the intervention contributed to this change. This may be
60
explained, in part, to the introduction of low-fat milk, fat-free chocolate milk, and soy
milk (vanilla and chocolate) during the course of the intervention.
Subjective norm is defined as the perceived belief about whether most people
approve or disapprove of the behavior and refers to the perceived social pressure to
perform or not perform the behavior (39). This concept is centered on how one
“should” act in response to the views and opinions of others (normative belief) and the
desire to do what others think (motivation to comply). The strongest influences include
family and friends (39). Our results showed subjective norms significantly affected
attitude toward drinking low-fat milk; however, no change in attitude was seen as a
result of changes in subjective norms. Significant differences in intention to drink 1%
milk, and consume low-fat cheese and low-fat yogurt was observed post-intervention
among participants in the treatment group however, this may be explained in part, by the
introduction of low-fat milk products along with a variety of low-fat and fat-free yogurt
products, and low-fat string cheese.
How much control a person has in performing a behavior (e.g., it is easy for me
to eat low-fat cheese) refers to the third construct of the TPB – perceived behavioral
control (39). Significant change in perceived behavioral control was seen in the
treatment group toward drinking skim, 1% and 2% milk. The lessons on overcoming
barriers to consuming low-fat dairy seemed to contribute to improvement in the
participants’ perception of their ability to control their behavior.
Several limitations warrant mention. First, adolescents were part of an after-
school program and may not have been attentive when completing questionnaires.
61
Second, after-school programs are a place of fun and not work, and completing a 76-
question survey at two time points could lead to some merely checking boxes and not
reading the questions in an effort to escape. Another limitation was participant attrition.
We lost 30% of our participants between the start of the program and completion of the
post-intervention survey at week 7. Attrition in after-school programs occurs frequently
in this geographic area and is usually because parents cannot afford to have their child in
after-school care for that particular month. The study faced other obstacles when
delivering the intervention; namely, after-school staff allowed participants to leave the
after-school site as they pleased and after-school staff rewarded adolescents with candy
for good behavior. Finally, the results may not be generalizable to other adolescents.
While our study has a number of limitations, it is important to point out the
strengths. To our knowledge, this is the first study involving an intervention developed
around the constructs of the TPB aimed at improving low-fat dairy consumption among
a predominately low-socioeconomic, Hispanic adolescent population in Los Angeles
County. Although results may not be generalizable to all youth in the United States, it is
important to note significant improvements in change in attitude and intention to
consume skim, 1%, and 2% milk along with low-fat cheese and yogurt occurred as a
result of the intervention. Including a 7-week intervention targeting behavior and the
introduction of various reduced-fat dairy products are also strengths of this study.
Based on our findings, interventions for change of adolescents’ attitudes should
include strategies that enhance interest in information along with benefits of healthy
eating. The TPB has rarely been applied to intervention studies. In previous studies
62
looking at nutrition behaviors, researchers relied on self-report by the adolescents along
with demonstrating predictability of the constructs in the TPB framework (41-42, 104-
112). Our study included a 7-week intervention that identified the influences of and
changing behaviors of attitude, subjective norms, and perceived behavioral control. The
identification of barriers and overcoming them, along with goal setting and staying
motivated to consume low-fat dairy products were addressed. Overall, the intervention
as applied was somewhat effective in changing attitudes about participants behavior
strength, intention, subjective norms, and perceived behavioral control.
63
5. PAPER 3: WHOLE-GRAINS
INTRODUCTION
Overweight and obesity are a result of energy imbalance. Several factors play a
role including dietary habits, larger portion sizes, consumption of fast food, lack of
physical activity at school and in the home, and availability of high-calorie nutrient-poor
foods (1). Addressing adolescent overweight is critical because it is associated with an
increased risk of obesity into adulthood (2) but also independently is related to morbidity
and mortality in adulthood (3). Adolescence is the period between puberty and
adulthood.
Between the NHANES surveys of 1976-1980 and 2003-2006, prevalence of
obesity increased from 6.5% to 17% among 6-11 year olds and 5% to 17.6% among
those aged 12- to 19-years (4). Limited attention has been given to behavioral factors
which may increase the risk of obesity. These include skipping breakfast, choosing high-
fat dairy products over their low-fat counterparts, and choosing refined grains over
whole-grain products.
Skipping breakfast has increased over time and may be more common among
certain ethnic or low-socioeconomic groups in the adolescent population. Considering
that skipping breakfast is associated with obesity risk and perhaps the under-
consumption of some essential nutrients, it is more important than ever that adolescents
consume a healthy and nutritious breakfast every day (5-7). Of particular interest is the
impact that breakfast skipping may have on whole-grain consumption as whole-grain
64
intake is associated with lower body mass and greater insulin sensitivity among
adolescents (10). Research indicates skipping breakfast is associated with a lower intake
of whole-grains among the adolescent population (5, 20).
There is limited literature that examines the benefit of including whole-grains in
the breakfast meal in terms of meeting the daily recommended intakes of dietary fiber,
vitamins and minerals in the adolescent population. Cross-sectional surveys with
adolescents in the United States have found that inadequate dietary fiber intakes could be
improved by increasing the consumption of whole-grains (30). In a study conducted by
Affentio et al., (5), it was reported that adolescents who eat breakfast had increased
intakes of calcium and fiber. The Dietary Guidelines for Americans (30) recommend
that children and adolescents should consume whole-grain products often and that at
least half of the grains in the diet should be whole grains. Diets rich in whole-grains
provide a host of potential benefits to overall health including reducing the risk of heart
disease, helping with weight maintenance, and lowering the risk of other chronic
diseases (30).
Most nutrition education efforts have examined the health benefits of eating
breakfast to increase nutrition knowledge and awareness. Few studies have explored the
value and effect of designing interventions to examine the influences of peers and family
on predicting and explaining intention and behavior to include whole-grains in the
breakfast meal. In the long-term this is important because intention is not only
influenced by peers and family but is an indicator of how hard a person is willing to try
and how much effort a person will exert toward performing a behavior. It is also
65
important to gain an understanding of attitude toward eating breakfast because changing
knowledge and behavior is not enough; the ultimate goal is to effect lifelong knowledge
and behavior. Educating and motivating adolescents about the long-term benefits of
consuming whole-grains and consuming a breakfast that is rich in whole-grains could
have a significant impact on overall health and well-being among this age group.
CONCEPTUAL FRAMEWORK
The present study examines the impact of an after-school based intervention
designed to improve consumption of whole-grains at the breakfast meal among
adolescents. The purpose is to increase whole-grain eating in a predominantly low-
income, Hispanic, adolescent population. The intervention was grounded in the Theory
of Planned Behavior (TPB). The conceptual model guiding the intervention is presented
in Figure B-1.
There have been few interventions delivered to adolescents which used the TPB
as a conceptual framework. One tested the effectiveness of an intervention program to
alter adolescents’ healthy eating attitudes and behavior (36). Results showed the
intervention was effective in improving attitudes toward healthy eating. Another study
examined the effect of a condom promotion leaflet and 20-minute intervention on
adolescents intention and attitude toward using a condom (37). Results showed after the
intervention, attitude toward using a condom with new partners increased along with
intention to use condoms. In an examination of the efficacy of an intervention designed
to positively influence physical activity behavior among pediatric cancer survivors,
66
researchers found that the intervention had a small yet meaningful impact after one year
(38).
METHODS
The objective was to test the effectiveness of an after-school based intervention
designed to improve breakfast behavior and habits among adolescents. The purpose was
to increase breakfast eating. The effects of attitude, social and personal factors, personal
characteristics, self-efficacy, parental influence, and individual determinants on intention
to predict change in breakfast consumption frequency was examined. To accomplish
this, a seven-week curriculum was delivered to participants.
Focus group study
The purpose of the focus group study was to collect information and suggestions from
representatives of members in the target community to aid in improving and fine-tuning
the intervention program. Three focus group discussions were conducted. The first
consisted of the administration and staff of the after-school program (n = 4; n = 2
respectively). The second two focus group discussions were conducted with adolescents
at two different schools (n = 10; n = 7 participants respectively). Focus group
discussions took less than 60 minutes to complete. Focus group discussions took less
than 60 minutes to complete. Six questions were asked (see Table A-1). Focus groups
were not audio recorded because parents refused consent.
Intervention participants
Adolescents 11 to 15 years old (n = 106) and their parents were recruited from
after-school programs located in Los Angeles County, California. Children were
67
primarily Hispanic and from low socioeconomic families. Parental consent (passive) was
obtained for all participants. Adolescents provided assent. The research study protocol
was approved by the Texas A&M University Institutional Review Board of Human
Subjects.
Intervention
Participants were assigned by after-school site to either the treatment group or
control group. Within the treatment group (n = 57), participants were assigned to groups
based on grade to facilitate discussion and to allow for easy group interaction (see
Figure B-2). Each group met for 60 minutes, once weekly, for seven weeks. Two
weeks were set aside for completion of the survey (pre-intervention and post-
intervention). The curriculum focused on identifying the influences of and changing
behaviors of attitude, subjective norms, and perceived behavioral control. Nutrition
education lessons are identified in Table A-2. The first three lessons focused on basic
nutrition concepts to include the food guide pyramid and the importance of consuming
whole-grains to overall health and well-being. The later lessons focused on identifying
barriers and overcoming barriers, goal-setting, and identifying methods to stay
motivated.
During weeks two through seven, to increase self-efficacy (perceived behavioral
control) adolescents were provided the opportunity to taste various whole-grain
breakfast cereals and cereal bars, and low-fat milk and diary products, and different
flavors of soy milk.
68
Survey questions
Questionnaires were administered by trained staff to adolescents in the control
and treatment groups and self-administered to both parents of each group (in two-parent
households). Questionnaires were administered at baseline and post-intervention (seven
weeks after the program had started). The principle investigator was present at all times
during survey completion by adolescents to avoid inconsistencies of administration. All
constructs of the Theory of Planned Behavior (TPB) were developed based on the
guidelines described by Ajzen (115). In total, 76 questions addressed salient, behavioral,
normative, and control beliefs relative to the dependant variable (breakfast) in the
adolescent survey. Each belief was paired with a corresponding value statement of that
belief. For example, the statement “I think eating whole-grains every day is good for
me” was paired with a corresponding value statement of this belief: “I think eating
whole-grains every day will help me to do better in school”.
Behavioral intention
Intention was measured by one question on a 7-point, unipolar scale scored from
+1 to +7. Higher scores indicated a stronger intention (e.g., I intend to eat whole-grains
in the breakfast meal every day… ‘strongly disagree – strongly agree’).
Attitude
Attitude toward eating whole-grain cereal (behavioral belief) was measured by
three questions using a 7-point, unipolar scale indicating a more positive attitude (e.g., I
think that eating whole-grains is good for me… ‘strongly disagree – strongly agree’).
Attitude toward the value of eating whole-grains was measured on a bipolar bad-good
69
scale scored from -3 to +3 (e.g., I think that eating whole-grains will provide important
nutrients to my diet … ‘strongly disagree – strongly agree’).
Subjective norm
Subjective norm was measured by six questions using a 7-point unipolar
disagree-agree scale scored +1 to +7 with higher scores indicating more pressure from
others (normative belief). Motivation to do what each referent thinks (motivation to
comply) was measured by using a 7-point unipolar disagree-agree scaled scored +1 to +7
(e.g., I think it is important to do what my parents want me to do ... ‘strongly disagree –
strongly agree’).
Perceived behavioral control
Perceived behavioral control over performing the behavior was measured by two
questions on a semantic differential scale (e.g., I believe it is “up to me” … “not up to
me” to eat whole-grains). The perceived ease or difficulty of performing the behavior
(perceived power) was measured using a bipolar difficult-easy scale scored -3 to +3
(e.g., I think it is ‘easy’ to eat whole-grains).
Demographic characteristics
Adolescents self-reported race, ethnicity, age at time of questionnaire
completion.
Statistical analysis
Data were analyzed using the SAS statistical analysis program (v. 9.2). Standard
descriptive statistics were obtained for all variables. The Cronbach alpha test was used
to measure internal consistency, and thus the reliability, of the items that measure the
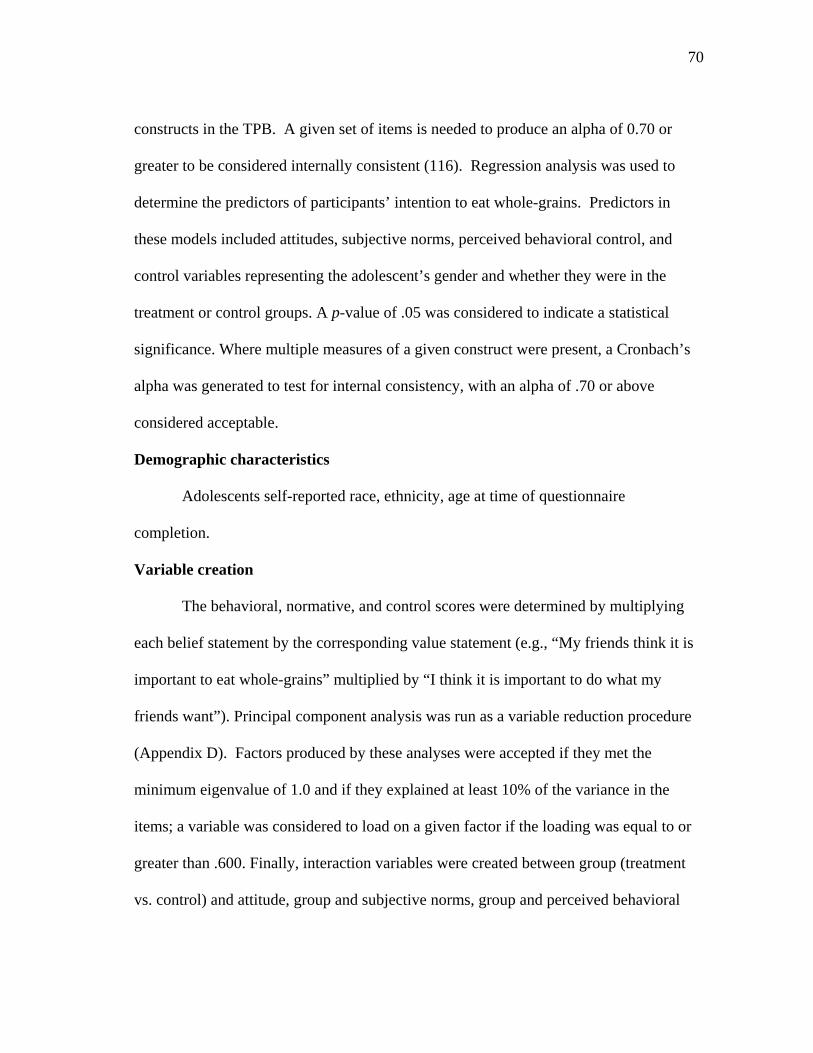
70
constructs in the TPB. A given set of items is needed to produce an alpha of 0.70 or
greater to be considered internally consistent (116). Regression analysis was used to
determine the predictors of participants’ intention to eat whole-grains. Predictors in
these models included attitudes, subjective norms, perceived behavioral control, and
control variables representing the adolescent’s gender and whether they were in the
treatment or control groups. A p-value of .05 was considered to indicate a statistical
significance. Where multiple measures of a given construct were present, a Cronbach’s
alpha was generated to test for internal consistency, with an alpha of .70 or above
considered acceptable.
Demographic characteristics
Adolescents self-reported race, ethnicity, age at time of questionnaire
completion.
Variable creation
The behavioral, normative, and control scores were determined by multiplying
each belief statement by the corresponding value statement (e.g., “My friends think it is
important to eat whole-grains” multiplied by “I think it is important to do what my
friends want”). Principal component analysis was run as a variable reduction procedure
(Appendix D). Factors produced by these analyses were accepted if they met the
minimum eigenvalue of 1.0 and if they explained at least 10% of the variance in the
items; a variable was considered to load on a given factor if the loading was equal to or
greater than .600. Finally, interaction variables were created between group (treatment
vs. control) and attitude, group and subjective norms, group and perceived behavioral
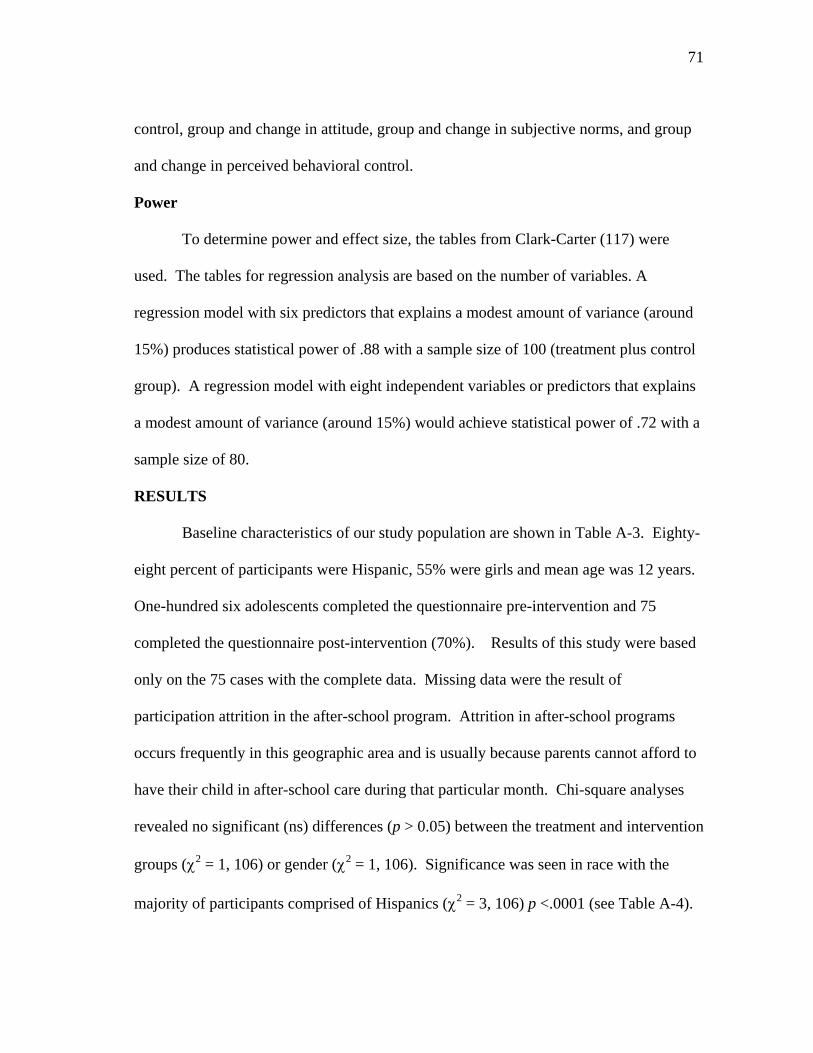
71
control, group and change in attitude, group and change in subjective norms, and group
and change in perceived behavioral control.
Power
To determine power and effect size, the tables from Clark-Carter (117) were
used. The tables for regression analysis are based on the number of variables. A
regression model with six predictors that explains a modest amount of variance (around
15%) produces statistical power of .88 with a sample size of 100 (treatment plus control
group). A regression model with eight independent variables or predictors that explains
a modest amount of variance (around 15%) would achieve statistical power of .72 with a
sample size of 80.
RESULTS
Baseline characteristics of our study population are shown in Table A-3. Eighty-
eight percent of participants were Hispanic, 55% were girls and mean age was 12 years.
One-hundred six adolescents completed the questionnaire pre-intervention and 75
completed the questionnaire post-intervention (70%). Results of this study were based
only on the 75 cases with the complete data. Missing data were the result of
participation attrition in the after-school program. Attrition in after-school programs
occurs frequently in this geographic area and is usually because parents cannot afford to
have their child in after-school care during that particular month. Chi-square analyses
revealed no significant (ns) differences (p > 0.05) between the treatment and intervention
groups (2 = 1, 106) or gender (2 = 1, 106). Significance was seen in race with the
majority of participants comprised of Hispanics (2 = 3, 106) p <.0001 (see Table A-4).
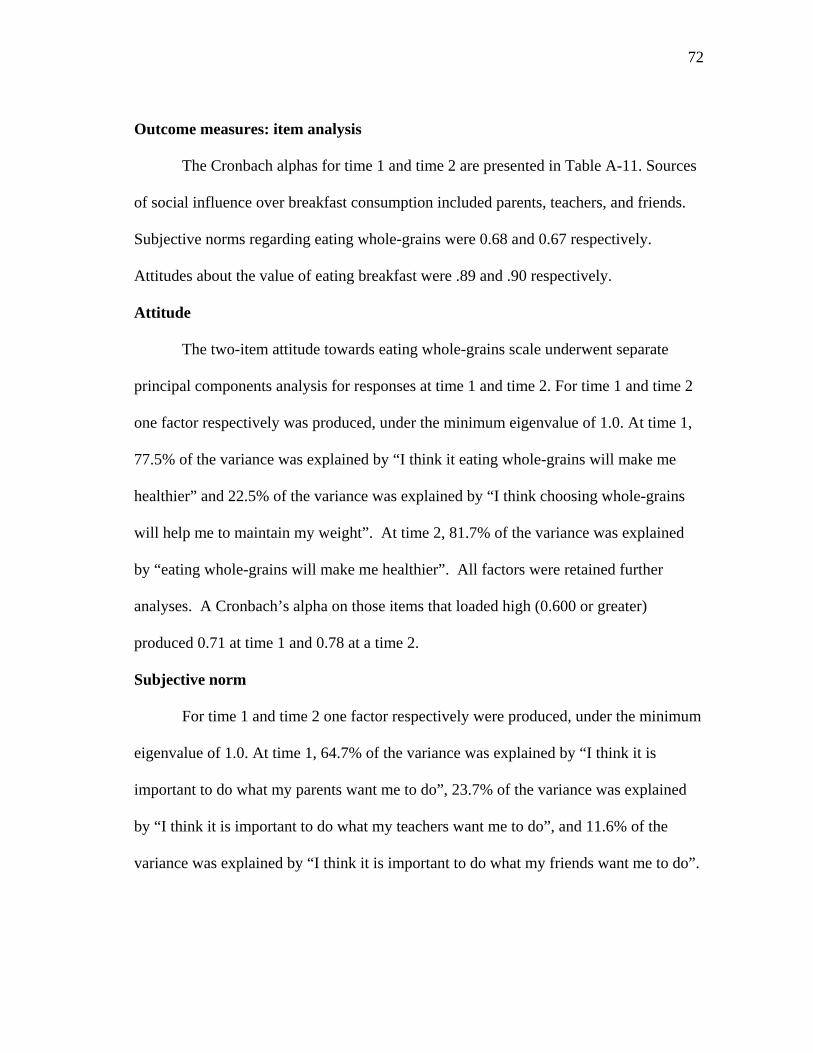
72
Outcome measures: item analysis
The Cronbach alphas for time 1 and time 2 are presented in Table A-11. Sources
of social influence over breakfast consumption included parents, teachers, and friends.
Subjective norms regarding eating whole-grains were 0.68 and 0.67 respectively.
Attitudes about the value of eating breakfast were .89 and .90 respectively.
Attitude
The two-item attitude towards eating whole-grains scale underwent separate
principal components analysis for responses at time 1 and time 2. For time 1 and time 2
one factor respectively was produced, under the minimum eigenvalue of 1.0. At time 1,
77.5% of the variance was explained by “I think it eating whole-grains will make me
healthier” and 22.5% of the variance was explained by “I think choosing whole-grains
will help me to maintain my weight”. At time 2, 81.7% of the variance was explained
by “eating whole-grains will make me healthier”. All factors were retained further
analyses. A Cronbach’s alpha on those items that loaded high (0.600 or greater)
produced 0.71 at time 1 and 0.78 at a time 2.
Subjective norm
For time 1 and time 2 one factor respectively were produced, under the minimum
eigenvalue of 1.0. At time 1, 64.7% of the variance was explained by “I think it is
important to do what my parents want me to do”, 23.7% of the variance was explained
by “I think it is important to do what my teachers want me to do”, and 11.6% of the
variance was explained by “I think it is important to do what my friends want me to do”.
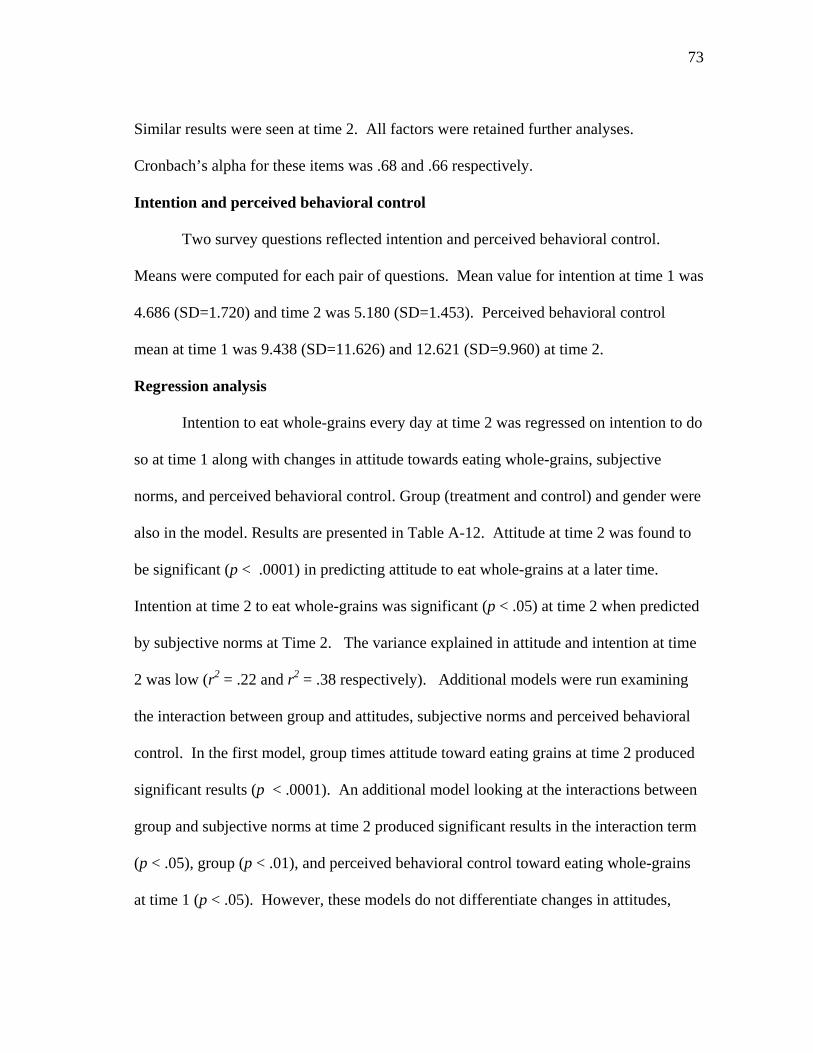
73
Similar results were seen at time 2. All factors were retained further analyses.
Cronbach’s alpha for these items was .68 and .66 respectively.
Intention and perceived behavioral control
Two survey questions reflected intention and perceived behavioral control.
Means were computed for each pair of questions. Mean value for intention at time 1 was
4.686 (SD=1.720) and time 2 was 5.180 (SD=1.453). Perceived behavioral control
mean at time 1 was 9.438 (SD=11.626) and 12.621 (SD=9.960) at time 2.
Regression analysis
Intention to eat whole-grains every day at time 2 was regressed on intention to do
so at time 1 along with changes in attitude towards eating whole-grains, subjective
norms, and perceived behavioral control. Group (treatment and control) and gender were
also in the model. Results are presented in Table A-12. Attitude at time 2 was found to
be significant (p < .0001) in predicting attitude to eat whole-grains at a later time.
Intention at time 2 to eat whole-grains was significant (p < .05) at time 2 when predicted
by subjective norms at Time 2. The variance explained in attitude and intention at time
2 was low (r2 = .22 and r2 = .38 respectively). Additional models were run examining
the interaction between group and attitudes, subjective norms and perceived behavioral
control. In the first model, group times attitude toward eating grains at time 2 produced
significant results (p < .0001). An additional model looking at the interactions between
group and subjective norms at time 2 produced significant results in the interaction term
(p < .05), group (p < .01), and perceived behavioral control toward eating whole-grains
at time 1 (p < .05). However, these models do not differentiate changes in attitudes,
74
subjective norms, or perceived behavioral control by group; therefore additional models
were run with interactions between group (treatment versus control) and these three
change variables. No model produced significant results.
DISCUSSION
Our study, using a randomized controlled trial design, examined whether a
nutrition education intervention based on the Theory of Planned Behavior could change
the behavior toward eating whole-grains by predominately, low-income, Hispanic,
adolescents. To our knowledge, this study is the first of its kind. It is well-known that
the use of the Theory of Planned Behavior is effective in identifying predictors of
healthful dietary practices among adolescents and adults from different ethnic groups
(42, 105, 109-112) but these studies included no interventions. Given that consumption
of whole grain is associated with a lower body mass index and greater insulin sensitivity
among adolescents (10), it is more important than ever that public health practitioners
design interventions that emphasize consumption of whole-grain cereals as part of the
breakfast meal.
As a result of the intervention, significant changes in attitude were seen. At time
1, both groups had a similar attitude toward eating whole-grains; at the conclusion of the
intervention, the treatment group had a significantly more positive attitude toward eating
whole-grains. It should be noted however, while the intervention could have made such
a significant impact, also instrumental in changing attitude was introducing the
adolescents to various whole-grain cereals, cereal bars, and crackers.
75
It is known that parents play a role in adolescent food choices and that their
feeding styles and expectations influence the development of their children’s eating
habits, especially through their child-feeding practices (69-70, 72). The influence of
peers is less studied, but research shows in the presence of certain others peers, food
choices including amount of food consumed changes (87-88, 90, 118). Social Cognitive
Theory has shown teacher modeling can be an effective method to encourage youth to
accept foods (91-92) but no research exists using the TPB. Our study showed that
important others (subjective norms – parents, teachers, and friends) significantly
changed intention to consume whole-grains at time 2.
There are several limitations that warrant mention. First, adolescents were part of
an after-school program and may not have been attentive when completing
questionnaires. Second, after-school programs are a place of fun and not work, and
completing a 76-question survey at two time points could lead to some merely checking
boxes and not reading the questions in an effort to escape. Another limitation was
participant attrition. We lost 30% of our participants between the start of the program
and completion of the post-intervention survey at week 7. Attrition in after-school
programs occurs frequently in this geographic area and is usually because parents cannot
afford to have their child in after-school care for that particular month. Finally, the study
faced other obstacles when delivering the intervention; namely, after-school staff
allowed participants to leave the after-school site as they pleased and after-school staff
rewarded adolescents with candy for good behavior.
76
While our study has a number of limitations, it is important to point out the
strengths. To our knowledge, this is the first study involving an intervention developed
around the constructs of the TPB aimed at improving whole-grain consumption among a
predominately low-socioeconomic, Hispanic adolescent population in Los Angeles
County. While results may not be generalizable to all youth in the United States, it is
important to note significant improvements in change in attitude and intention to
consume whole-grains occurred as a result of the intervention. These results may be due
in part to the introduction of whole-grain cereals, cereal bars, and crackers during the
course of the intervention. Another strength of this study was the inclusion of a 7-week
randomized controlled trial intervention designed to target the constructs of the TPB to
effect change in consumption of whole-grains.
77
6. SUMMARY AND CONCLUSIONS
Breakfast may be considered the most important meal of the day yet many people
skip it and adolescents are no exception. Our study examined whether a nutrition
education intervention based on the Theory of Planned Behavior could change the
breakfast behavior to include consumption of low-fat dairy and whole-grains of a
predominately, low-income, Hispanic adolescent population. To our knowledge, this
study is the first of its kind. Previous research shows the use of the Theory of Planned
Behavior is effective in identifying predictors of healthful dietary practices among
adolescents and adults from different ethnic groups (42, 105, 109-112) but these studies
included no interventions. Given that consumption of breakfast along with low-fat dairy
and whole-grains are associated with a lower body mass index and greater intake of
nutrients among adolescents (5, 20, 31-32, 63, 95), it is more important than ever that
public health practitioners design interventions that emphasize consumption of breakfast
along with consuming low-fat dairy and whole-grains as part of the breakfast meal.
Overall, our results are promising. Like previous research, our results showed
the TPB model significantly predicted intention to consume breakfast along with low-fat
dairy and whole-grains. However, the purpose of our research was to effect change in
attitude, subjective norms, and perceived behavioral control. Change was not
significantly predicted in breakfast , low-fat cheese, low-fat yogurt, and whole-grain
consumption. Significant change results were observed in low-fat dairy (e.g., skim milk,
1% milk, and 2% milk).
78
Several limitations are worth mentioning. First, adolescents were part of an
after-school program and may not have been attentive when completing questionnaires.
Completing a 76-question survey at two time points may have led to some adolescents
merely checking boxes and not reading the questions in an effort to escape. Another
limitation was participant attrition. We lost 30% of our participants between the start of
the program and completion of the post-intervention survey. Attrition in after-school
programs occurs frequently in this geographic area and it usually because parents cannot
afford to have their child in after-school for that particular month. The researcher faced
other obstacles when delivering the intervention; namely, after-school staff allowed
participants to leave the after-school site a they pleased and staff rewarded adolescents
with candy for good behavior.
Although our study has several limitations, it is important to point out the
strengths. To our knowledge, this is the first study using an intervention that centers on
the constructs of the TPB aimed at changing consumption of breakfast, low-fat diary,
and whole-grains among a predominately low-socioeconomic, Hispanic adolescent
population. Results are not generalizable to all youth in the United States. Including a
7-week intervention targeting behavior and the introduction of various whole-grain and
low-fat dairy products are also strengths of this study.
Most nutrition education efforts have examined the health benefits of eating
breakfast to increase nutrition knowledge and awareness. Few studies have explored the
value and effect of designing interventions to examine the influences of peers and family
on predicting and explaining intention and behavior to eat breakfast. In the long-term
79
this is important because intention is not only influenced by peers and family but is an
indicator of how hard a person is willing to try and how much effort a person will exert
toward performing a behavior. It is also important to gain an understanding of attitude
toward eating breakfast because changing knowledge and behavior is not enough; the
ultimate goal is to effect lifelong knowledge and behavior. Educating and motivating
adolescents about the long-term benefits of consuming breakfast and consuming a
breakfast that is rich in whole-grain and low-fat dairy could have a significant impact on
overall health and well-being among this age group.
80
REFERENCES
1. Centers for Disease Control. Overweight and Obesity. Internet:
http://www.cdc.gov/obesity/index.html (accessed August 7, 2009).
2. Zapata LB, Bryant CA, McDermott RJ, Hefelinger JA. Dietary and physical
activity behaviors of middle school youth: the youth physical and activity
nutrition survey. Journal of School Health 2008;78:9-18.
3. Mijailovic V, Micic D, Mijailoui M. Effect of childhood and adolescent obesity
on morbidity in adult life. Internation Journal of Pediatric Endocrinol Metab
2001;17:1339-44.
4. Ogden CL, Carroll MD, Flegal KM. High body mass index for age among US
children and adolescents, 2003-2006. JAMA 2008;299:2401-5.
5. Affenito SG, Thompson DR, Barton BA, et al. Breakfast consumption by
African-American and White adolescent girls correlates positively with calcium
and fiber intake and negatively with body mass index. Journal of the American
Dietetic Association 2005;105:938-45.
6. Affenito SG, Thompson DR, Franko DL, et al. Longitudinal assessment of
micronutrient intake among African-American and White girls: the national
heart, lung, and blood institute growth and health study. Journal of the American
Dietetic Association 2007;107:1113-23.
7. Rampersaud GC, Pereira MA, Girard BL, Adams J, Metzl JD. Breakfast habits,
nutritional status, body weight, and academic performance in children and
adolescents. Journal of the American Dietetic Association. 2005;105:743-62.
81
8. Moore LL, Singer MR, Qureshi MM, Bradlee ML. Dairy intake and
anthropometric measures of body fat among children and adolescents in
NHANES. J Am Coll Nutr 2008;27:702-10.
9. Murphy MM, Douglass JS, Johnson RK, Spence LA. Drinking flavored or plain
milk is positively associated with nutrient intake and is not associated with
adverse effects on weight status in US children and adolescents. Journal of the
American Dietetic Association 2008;108:631-9.
10. Steffen LM, Jacobs DR, Jr., Murtaugh MA, et al. Whole grain intake is
associated with lower body mass and great insulin sensitivity among adolescents.
Am. J. Epidemiol. 2003;158:243-50.
11. Panagiotakos DB, Antonogeorgos G, Papadimitriou A, et al. Breakfast cereal is
assoicated with a lower prevalence of obesity among 10-12-year-old children: the
PANACEA study. Nutrition, Metabolism & Cardiovascular Diseases.
2007;18(9):606-612.
12. O'Dea JA, Caputi P. Association between socioeconomic status, weight, age and
gender, and the body image and weight control practices of 6- to 19-year-old
children and adolescents. Health Educ. Res. 2001;16:521-32.
13. Keski-Rahkonen A, Kaprio J, Rissanen A, Virkkunen M, Rose RJ. Breakfast
skipping and health-compromising behaviors in adolescents and adults. Eur J
Clin Nutr 2003;57:842-53.
82
14. Sjoberg A, Hallberg L, Hoglund D, Hulthen L. Meal pattern, food choice,
nutrient intake and lifestyle factors in The Goteborg Adolescence Study. Eur J
Clin Nutr 2003;57:1569-78.
15. Albertson AM, Franko DL, Thompson DR, et al. Longitudinal patterns of
breakfast eating in black and white adolescent girls. Obesity 2007;15:2282-92.
16. United States Department of Agriculture. Part 220 - School Breakfast Program.
Internet: http://www.fns.usda.gov/cnd/governance/regulations/7cfr220_09.pdf
(accessed August 5, 2009).
17. Ruxton CHS, Kirk TR. Breakfast: a review of associations with measures of
dietary intake, physiology and biochemistry. British Journal of Nutrition
1997;78:199-213.
18. Siega-Riz AM, Popkin BM, Carson T. Trends in breakfast consumption for
children in the United States from 1965 to 1991. American Journal of Clinical
Nutrition 1998;67 (suppl):748S-56S.
19. McDonnell E, Probart C, Weirich E, Hartman T, Birkinshaw P. School breakfast
programs: perceptions and barriers. The Journal of Child Nutrition and
Management 2004;2:1-12.
20. Barton BA, Eldridge AL, Thompson DR, et al. The relationship of breakfast and
cereal consumption to nutrient intake and body mass index: the national heart,
lung, and blood institute growth and health study. Journal of the American
Dietetic Association 2005;105:1483-389.

83
21. Matthys C, DeHenauw S, Bellemans M, DeMaeyer M, DeBacker G. Breakfast
habits affect overall nutrient profiles in adolescents. Public Health Nutrition
2006;10:413-21.
22. Skinner JD, Bounds W, Carruth BR, Ziegler P. Longitudinal calcium intake is
negatively related to children's body fat indexes. Journal of the American
Dietetic Association 2003;103:1626-31.
23. Nicklas TA, Bao W, Webber LS, Berenson GS. Breakfast consumption affects
adequacy of total daily intake in children. Journal of the American Dietetic
Association 1993;93:886-91.
24. Schlundt DG, Hill JO, Sbrocco T, Pope-Cordle J, Sharp T. The role of breakfast
in the treatment of obesity: a randomized clinical trial. American Journal of
Clinical Nutrition 1992.;55:645-51.
25. Berkey CS, Rockett HRH, Gillman MW, Field AE, Colditz GA. Longitudinal
study of skipping breakfast and weight change in adolescents. International
Journal of Obesity 2003;27:1258-66.
26. Zullig K, Ubbes VA, Pyle J, Valois RF. Self-reported weight perceptions, dieting
behavior, and breakfast eating among high school adolescents. Journal of School
Health. 2006;76:87-92.
27. Gordon AR, Devaney BL, Burghart JA. Dietary effects of the national school
lunch program and the school breakfast program. American Journal of Clinical
Nutrition 1995;61:221S-31S.
84
28. Crepinsek MK, Singh A, Bernstein LS, McLaughlin JE. Dietary effects of
universal-free school breakfast: findings from the evaluation of the school
breakfast program pilot project. Journal of the American Dietetic Association
2006;106:1796-803.
29. Gleason PM, Dodd AH. School breakfast program but not school lunch program
participation is associated with lower body mass index. Journal of the American
Dietetic Association 2009;109:S118-S28.
30. United States Department of Agriculture. Dietary Guidelines for Americans,
2005, 6th Edition. Internet:
http://www.health.gov/DietaryGuidelines/dga2005/document/default.htm
(accessed October 8, 2007).
31. Nicklas TA, O'Neil CE, Fulgoni VL, III. The role of dairy in meeting the
recommendations for shortfall nutrients in the American diet. J Am Coll Nutr
2009;28:73S-81.
32. Nicklas TA, C. R, Myers L, O'Neil C. Breakfast consumption with and without
vitamin mineral supplement use favorably impacts daily nutrient intake of ninth-
grade students. Journal of Adolescent Health 2000;27:314-21.
33. Larson NI, Story M, Wall M, Neumark-Sztainer D. Calcium and dairy intakes of
adolescents are associated with their home environment, taste preferences,
personal health beliefs, and meal patterns. Journal of the American Dietetic
Association 2006;106:1816-24.
85
34. McCarron D, Morris C, Henry J, Stanton J. Blood pressure and nutrient intake in
the United States. Science 1984;224.
35. Zemel M, Shi H, Gree B, Dirienzo D, Zemel P. Regulation of adiposity by
dietary calcium. FASEB Journal 2000;14:1132-8.
36. Tsorbatzoudis H. Evaluation of a planned behavior theory-based intervention
programme to promote healthy eating. Perceptual and Motor Skills
2005;101:587-604.
37. Hill C, Abraham C. School-based, randomised controlled trial of an evidence
based condom promotion leaflet. Psychology & Health 2008;23:41-56.
38. Keats M. A theory-driven approach to encourage physical activity in pediatric
cancer survivors: a pilot study. Journal of Sport & Exercise Psychology
2009;31:267-83.
39. Ajzen I. The theory of planned behavior. organizational behavior and human
decision processes 1991;50:179-211.
40. Shankar A, Conner M, Bodansky HJ. Can the theory of planned behaviour
predict maintenance of a frequently repeated behaviour? Psychology, Health
& Medicine 2007;Vol 12:213.
41. Kassem NO, Lee JW. Understanding reduced-fat milk consumption among male
adolescents using the theory of planned behavior. American Journal of Health
Education 2005;36:16-24.
86
42. Lien N, Lytle LA, Komro KA. Applying theory of planned behavior to fruit and
vegetable consumption of young adolescents. American Journal of Health
Promotion 2002;16:189-97.
43. Massalu JR, Astrom AN. The use of the theory of planned behavior to explore
beliefs about sugar restriction. American Journal of Health Behavior 2003;27:15-
24.
44. Nguyen MN, Otis J, Potvin L. Determinants of intention to adopt a low-fat diet in
men 30 to 60 years old: Implications for heart health promotion. American
Journal of Health Promotion 1996;10:201-7.
45. Montano DE, Kasprzyk D. The theory of reasoned action and the theory of
planned behavior. In: Glanz K, Rimer BK, Marcus-Lewis F, eds. Health
Behavior and Health Education: Theory, Research, and Practice. 3rd ed. San
Francisco: John Wiley & Sons, Inc., 2002:67-98.
46. Fishbein M, Triandis H, Kanfer F, Becker M, Middlestadt S, Eichler A. Factors
influencing behavior and behavior changes. In: Baum A, Revenson T, Singer J,
eds. Handbook of Health Psychology. Mahwah, New Jersey: Lawrence Erlbaum
Associates, 1991:3-17.
47. McNaughton SA, Ball K, Mishra GD, Crawford DA. Dietary patterns of
adolescents and risk of obesity and hypertension. J. Nutr. 2008;138:364-70.
48. Cluskey M, Edlefsen M, Olson B, et al. At-home and away-from-home eating
patterns influencing preadolescents' intake of calcium-rich food as perceived by
87
Asian, Hispanic and Non-Hispanic White parents. Journal of Nutrition Education
and Behavior 2008;40:72-9.
49. Wilson TA, Adolph AL, Butte NF. Nutrient adequacy and diet quality in non-
overweight and overweight Hispanic children of low socioeconomic status: the
viva la familia study. Journal of the American Dietetic Association
2009;109:1012-21.
50. American Heart Association, Gidding SS, Dennison BA, et al. Dietary
recommendations for children and adolescents: A guide for practitioners.
Pediatrics 2006;117:544-59.
51. Song Y, Joung H, Englehardt K, Yoo S, Paik H. Traditional v. modified dietary
patterns and their influence on adolescents' nutritional profile. British Journal of
Nutrition 2005;93.
52. McNoughton S, Ball K, Mishra G, Crawford D. Dietary patterns of adolescents
and risk of obesity and hypertension. The Journal of Nutrition 2008;138:364-70.
53. Newby PK. Examining nutrient density: Comments on diet quality, dietary
advice and the cost of healthful eating. Journal of the American Dietetic
Association 2006;106:1166-9.
54. Nettleton J, Seteffen L, Mayer-Davis E, et al. Deitary patterns are assoicated with
biochemical markers of inflammation and endothelial activation in the Multi-
Ethnic Study of Atherosclerosis (MESA). American Journal of Clinical Nutrition
2006;83:1170-6.

88
55. Neumark-Sztainer D, Hannan PJ, Story M, Croll J, Perry C. Family meal
patterns: associations with sociodemographic characteristics and improved
dietary intake among adolescents. Journal of the American Dietetic Association
2003;103:317-22.
56. Alexy U, Sichert-Hellert W, Kersting M, Schultze-Pawlitschko V. Pattern of
long-term fat intake and BMI during childhood and adolescence-results of the
DONALD study. Int J Obes Relat Metab Disord 2004;28:1203-9.
57. Widenhorn-Muller K, Hille K, Klenk J, Weiland U. Influence of having breakfast
on cognitive performance and mood in 13-to 20-year-old high school students:
Results of a crossover trial. Pediatrics 2008;122:279-84.
58. Harding S, Teyhan A, Maynard MJ, Cruickshank JK. Ethnic differences in
overweight and obesity in early adolesence in the MRC DASH study: the role of
adolescent and parental lifestyle. International Journal of Epidemiology
2008;37:162-72.
59. Affenito SG. Breakfast: A missed opportunity. Journal of the American Dietetic
Association 2007;107:565-9.
60. Evers S, Taylor J, Manske S, Midgett C. Eating and smoking behaviours of
school children in southwestern Ontario and Charlottetown. Canadian Journal of
Public Health 2001;92:433-6.
61. Barker M, Robinson S, Wilman C, Barker DJP. Behaviour, body composition
and diet in adolescent girls. Appetite 2000;35:161-70.
89
62. Fernandez San Juan P. Dietary habits and nutritional status of school aged
children in Spain. Nutr Hosp 2006;21:374-8.
63. Kosti R, Panagiotakos DB, Zampelas A. The association between consumption
of breakfast cereals and BMI in school-children aged 12-17 years: the
VYRONAS study. Public Health Nutr 2008;11:1015-21.
64. Shaw ME. Adolescent breakfast skipping: an Australian study. Adolescence
1998;33:851.
65. Rashidi A, Mohammadpour B, Karandish M, et al. Obese and female adolescents
skip breakfst more than their non-obese and male peers. Central European
Journal of Medicine 2007;2:481-7.
66. Yang RJ, Wang EK, Hsieh YS, Chen MY. Irregular breakfast eating and health
status among adolescents in Taiwan. BMC Public Health 2006:295.
67. Breen FM, Plomin R, Wardle J. Heritability of food preferences in young
children. Physiology & Behavior 2006;88:443-7.
68. Cooke LJ, Haworth CM, Wardle J. Genetic and environmental influences on
children's food neophobia. Am J Clin Nutr 2007;86:428-33.
69. Brown R, Ogden J. Children's eating attitudes and behaviour: a study of the
modelling and control theories of parental influence. Health Educ. Res.
2004;19:261-71.
70. Benton D. Role of parents in the determination of the food preferences of
children and the development of obesity. Int J Obes Relat Metab Disord
2004;28:858-69.
90
71. Falciglia G, Pabst S, Couch S, Goody C. Impact of parental food choices on child
food neophobia. Children's Health Care 2004;33:217-25.
72. Gable S, Lutz S. Household, parent, and child contributions to childhood obesity.
Family Relations 2002;49:293-300.
73. Scaglioni S, Salvioni M, Galimberti C. Influence of parental attitudes in the
development of children eating behaviours. British Journal of Nutrition
2008;99:S22-S5.
74. Brug J, Tak NI, te Velde SJ, Bere E, de Bourdeaudhuij I. Taste preferences,
liking and other factors related to fruit and vegetable intakes among
schoolchildren: results from observational studies. British Journal of Nutrition
2008;99:S7-S14.
75. Wardle J, Cooke L. Genetic and environmental determinants of children's food
preferences. British Journal of Nutrition 2008;99:S15-S21.
76. Ganji V, Hampl JS, Betts NM. Race-, gender- and age-specific differences in
dietary micronutrient intakes of US children. International Journal of Food
Sciences & Nutrition 2003;54:485.
77. Delva J, Johnston LD, O'Malley PM. The epidemiology of overweight and
related lifestyle behaviors: racial/ethnic and socioeconomic status differences
among American youth. American Journal of Preventive Medicine
2007;33:S178-S86.
91
78. Mennella JA, Ziegler P, Briefel R, Novak T. Feeding infants and toddlers study:
the types of foods fed to Hispanic infants and toddlers. Journal of the American
Dietetic Association 2006;106:96-106.
79. Johnson S, Birch LL. Parents' and children's adiposity and eating style. Pediatrics
1994;94:653-61.
80. Birch LL, Fisher J. Development of eating behaviors among children and
adolescents. Pediatrics 1998;101:539-49.
81. Story M, Neumark-Sztainer D, French S. Individual and environmental
influences on adolescent eating behaviors. Journal of the American Dietetic
Association 2002;102:S40-S51.
82. Kim M, McIntosh W, J A, Kubena K, Reed D, Moon G. Perceived parenting
behaviours predict young adolescents' nutritional intake and body fatness.
Maternal and Child Nutrition 2008;4:287-303.
83. Sherry B, McDivitt J, Birch L, Cook F. Attitudes, practices, and concerns about
child feeding and child weight status among socioeconomically diverse white,
Hispanic, and African-American mothers. Journal of the American Dietetic
Association 2004;104:215-21.
84. Galloway A, Fiorito L, Francis L, Birch L. 'Finish your soup': counterproductive
effects of pressuring children to eat on intake and effect. Appetite 2006;46:318--
23.
85. de Lauzon-Guillain B, Musher-Eizenman D, Leporc E, Holub S, Charles MA.
Parental feeding practices in the United States and in France: relationships with
92
child's characteristics and parent's eating behavior. Journal of the American
Dietetic Association 2009;109:1064-9.
86. Musher-Eizenman DR, de Lauzon-Guillain B, Holub SC, Leporc E, Charles MA.
Child and parent characteristics related to parental feeding practices. a cross-
cultural examination in the US and France. Appetite 2009;52:89-95.
87. Redd M, de Castro J. Social facilitation of duration and size but not rate of the
spontaneous meal intake of humans. Physiology & Behavior 1992;52:749-54.
88. Salvy S-J, Romero N, Paluch R, Epstein LH. Peer influence on pre-adolescent
girls' snack intake: effects of weight status. Appetite 2007;49:177-82.
89. Salvy S-J, Jarrin D, Paluch R, Irfan N, Pliner P. Effects of social influence on
eating in couples, friends and strangers. Appetite 2007;49:92-9.
90. Romero ND, Epstein LH, Salvy S-J. Peer Modeling influences girls' snack
intake. Journal of the American Dietetic Association 2009;109:133-6.
91. Bandura A. Self-efficacy: the exercise of control. New York: Freeman &
Company, 1997.
92. Hendy HM, Raudenbush B. Effectiveness of teacher modeling to encourage food
acceptance in preschool children. Appetite 2000;34:61-76.
93. Ortega RM, Requejo AM, Lopez-Sobaler AM, et al. Differences in the breakfast
habits of overweight/obese and normal weight schoolchildren. Internat J Vit Nutr
Res 1998;68:125-32.
94. Niemeier HM, Raynor HA, Lloyd-Richardson EE, Rogers ML, Wing RR. Fast
food consumption and breakfast skipping: predictors of weight gain from
93
adolescence to adulthood in a nationally representative sample. Journal of
Adolescent Health. 2006;39:842-9.
95. United States Department of Agriculture. Dietary guidelines for Americans,
2005, 6th Edition. Internet:
http://www.health.gov/DietaryGuidelines/dga2005/document/default.htm
(accessed August 4, 2009).
96. United States Department of Agriculture. Dietary guidelines for Americans,
2005. Internet:
http://www.health.gov/DietaryGuidelines/dga2005/document/default.htm
(accessed October 8, 2007).
97. Centers for Disease Control. Childhood overweight and obesity. Internet:
http://www.cdc.gov/obesity/childhood/prevalence.html (accessed August 4,
2009).
98. Centers for Disease Control. Obesity: Halting the epidemic by making health
easier. Internet:
http://www.cdc.gov/print.do?url=http://www.cdc.gov/NCCDPHP/publications/A
AG/obesity.htm (accessed August 4, 2009).
99. American Diabetes Association. Total prevalence of diabetes & pre-diabetes.
Internet: http://www.diabetes.org/diabetes-statistics/prevalence.jsp (accessed
August 7, 2009).
100. Contento IR. Nutrition Education: Linking Research, Theory, and Practice.
Boston: Jones and Bartlett Publishers, 2007.
94
101. Janz N, Champion V, Strecher V. The health belief model. In: Glanz K, Rimer
BK, Lewis F, eds. Health Behavior and Health Education: Theory, Research, and
Practice. 3rd ed. San Francisco: John Wiley & Sons, Inc, 2002.
102. Prochaska JO, Redding C, Evers K. The transtheoretical model and stages of
change. In: Glanz K, Rimer BK, Lewis F, eds. Health Behavior and Health
Education: Theory, Research, and Practice. 3rd ed. San Francisco: John Wiley &
Sons, Inc, 2002:99-120.
103. Baranowski T, Perry CL, Parcel GS. How individuals, environments, and health
behavior interact: social cognitive theory. In: Glanz K, Rimer BK, Lewis F, eds.
Health Behavior and Health Education: Theory, Research, and Practice. 3rd ed.
San Francisco: John Wiley & Sons, Inc, 2002.
104. Berg C, Jonsson I, Conner M. Understanding choice of milk and bread for
breakfast among Swedish children aged 11-15 years: an application of the
Theory of Planned Behaviour. Appetite 2000;34:5-19.
105. Backman DR, Haddad EH, Lee JW, Johnston PK, Hodgkin GE. Psychosocial
predictors of healthful dietary behavior in adolescents. Journal of Nutrition
Education and Behavior 2002;34:184-93.
106. Kassem NO, Lee JW, Modeste NN, Johnston PK. Understanding soft drink
consumption among female adolescents using the theory of planned behavior.
Health Educ. Res. 2003;18:278-91.
107. Prell HC, Berg MC, Jonsson LM, Lissner L. A school-based intervention to
promote dietary change. Journal of Adolescent Health 2005;36:529-30.
95
108. Fila S, Smith C. Applying the theory of planned bheavior to healthy eating
behaviors in urban Native American youth. International Journal of Behavioral
Nutrition and Physical Activity 2006;3:1-11.
109. Olsen SO, Heide M, Dopico DC, Toften K. Explaining intention to consume a
new fish product: a cross-generational and cross-cultural comparison. Food
quality and preference 2008;19:618-27.
110. Pawlak R, Malinauskas B. The use of the theory of planned behavior to assess
predictors of intention to eat fruits among 9th-grade students attending two
public high schools in eastern North Carolina. Family and Consumer Sciences
Research Journal 2008;37:16-26.
111. Louis W, Davies S, Smith J, Terry D. Pizza and pop and the student identity: the
role of referent group norms in healthy and unhealthy eating. Journal of Social
Psychology 2007;147:57.
112. Tuu HH, Olsen SO, Thao DT, Anh NTK. The role of norms in explaining
attitudes, intention and consumption of a common food (fish) in Vietnam.
Appetite 2008;51:546-51.
113. de Bruijn G-J, Kroeze W, Oenema A, Brug J. Saturated fat consumption and the
theory of planned behaviour: exploring additive and interactive effects of habit
strength. Appetite 2008;51:318-23.
114. Food Research and Action Center. School breakfast scorecard: 2002.
Washington, DC: FRAC, 2007.
96
115. Constructing a TPB questionnaire: Conceptual and methodological
considerations. Internet:
http://www.people.umass.edu/aizen/pdf/tpb.measurement.pdf (accessed June 15,
2008).
116. Cronbach L. Coefficient alpha and the internal structure of tests. Psychometrika
1951;16:297-334.
117. Clark-Carter D. Quantitative Psychological Research. New York: Psychology
Press, 2004.
118. Salvy S-J, Coelho JS, Kieffer E, Epstein LH. Effects of social contexts on
overweight and normal-weight children's food intake. Physiology & Behavior
2007;92:840-6.

97
APPENDIX A
LIST OF FIGURES
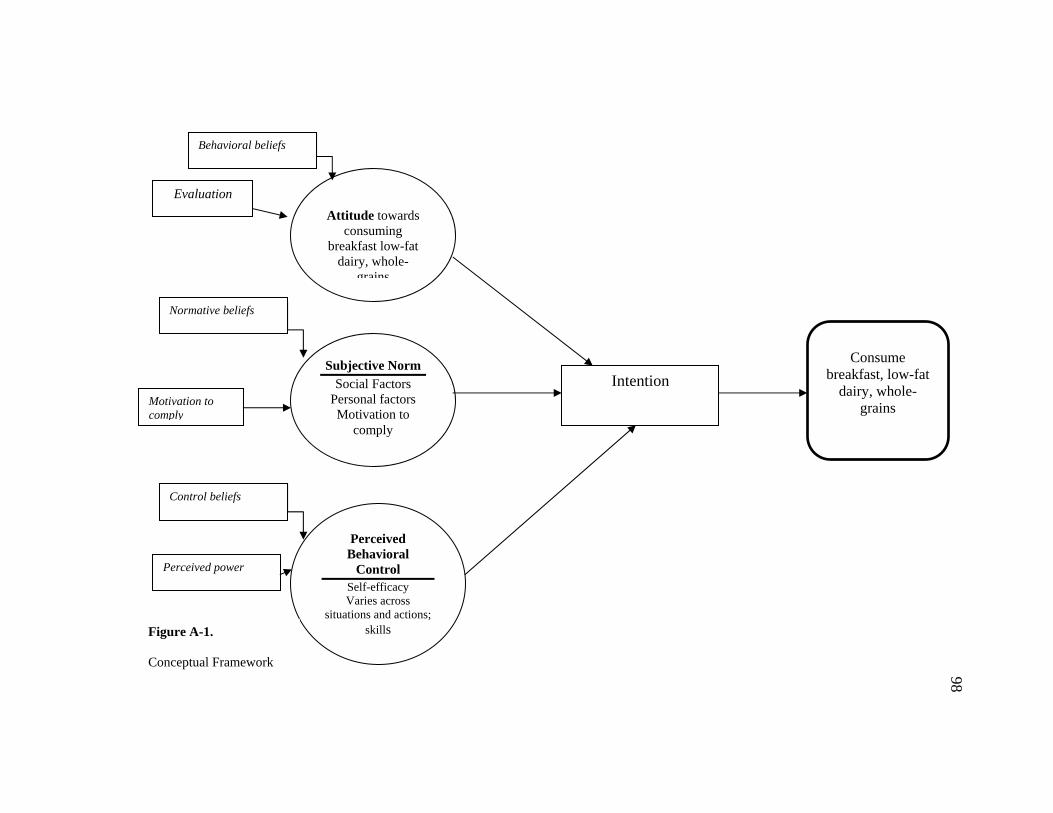
Attitude towards
consuming breakfast low-fat
dairy, whole-grains
Normative beliefs
Control beliefs
Subjective Norm Social Factors
Personal factors Motivation to
comply
Perceived Behavioral
Control Self-efficacy Varies across
situations and actions; skills
Consume
breakfast, low-fat dairy, whole-
grains
Behavioral beliefs
Evaluation
Motivation to comply
Perceived power
Intention
Figure A-1.
Conceptual Framework
98
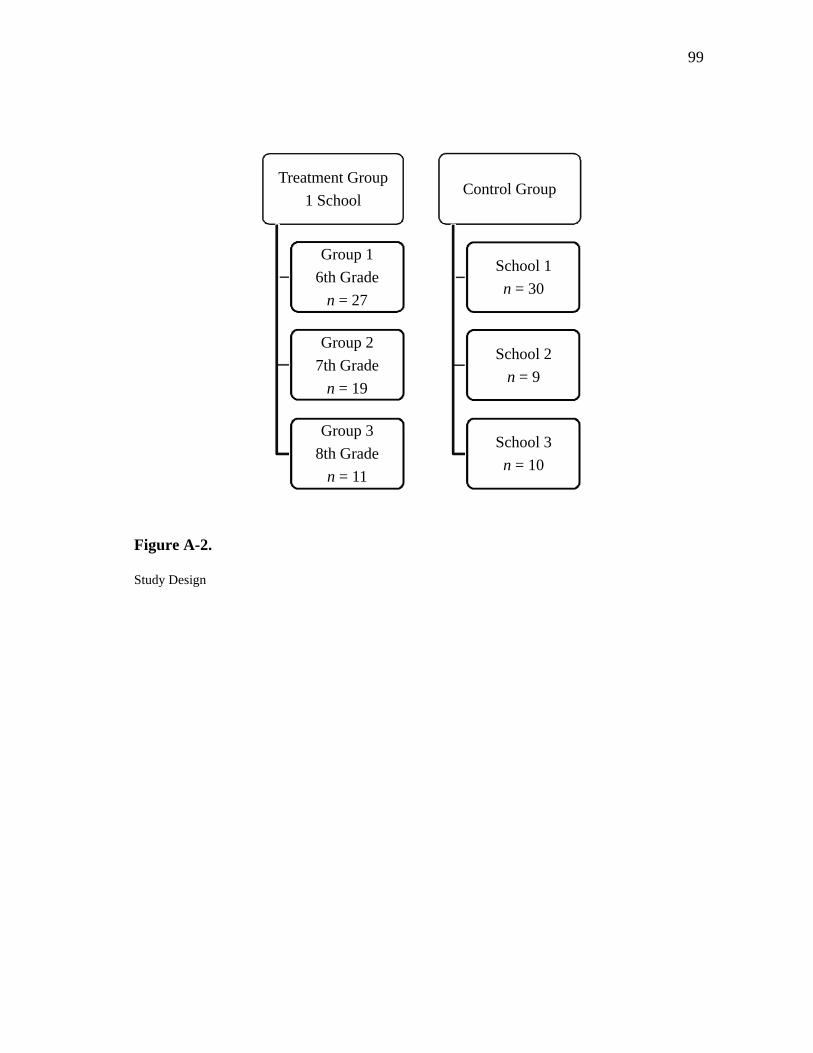
99
Figure A-2.
Study Design
Treatment Group
1 School
Group 1
6th Grade
n = 27
Group 2
7th Grade
n = 19
Group 3
8th Grade
n = 11
Control Group
School 1
n = 30
School 2
n = 9
School 3
n = 10
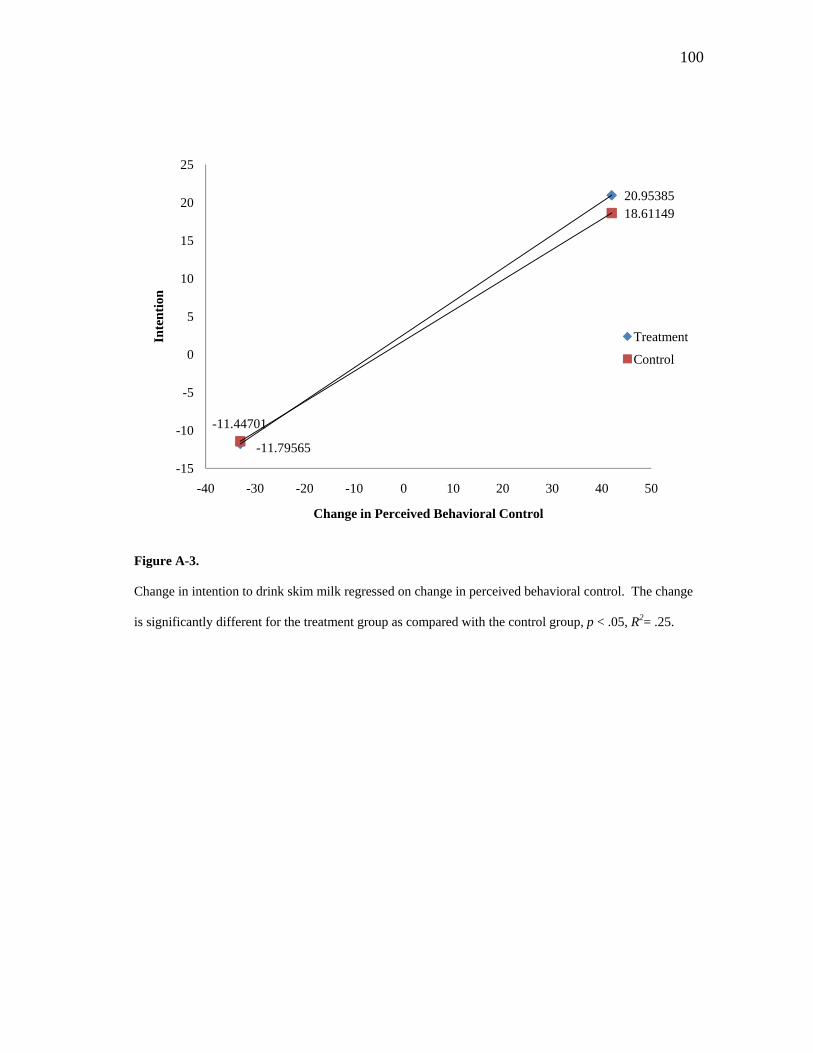
100
Figure A-3.
Change in intention to drink skim milk regressed on change in perceived behavioral control. The change
is significantly different for the treatment group as compared with the control group, p < .05, R2= .25.
-11.79565
20.95385
-11.44701
18.61149
-15
-10
-5
0
5
10
15
20
25
-40 -30 -20 -10 0 10 20 30 40 50
Inte
nti
on
Change in Perceived Behavioral Control
Treatment
Control
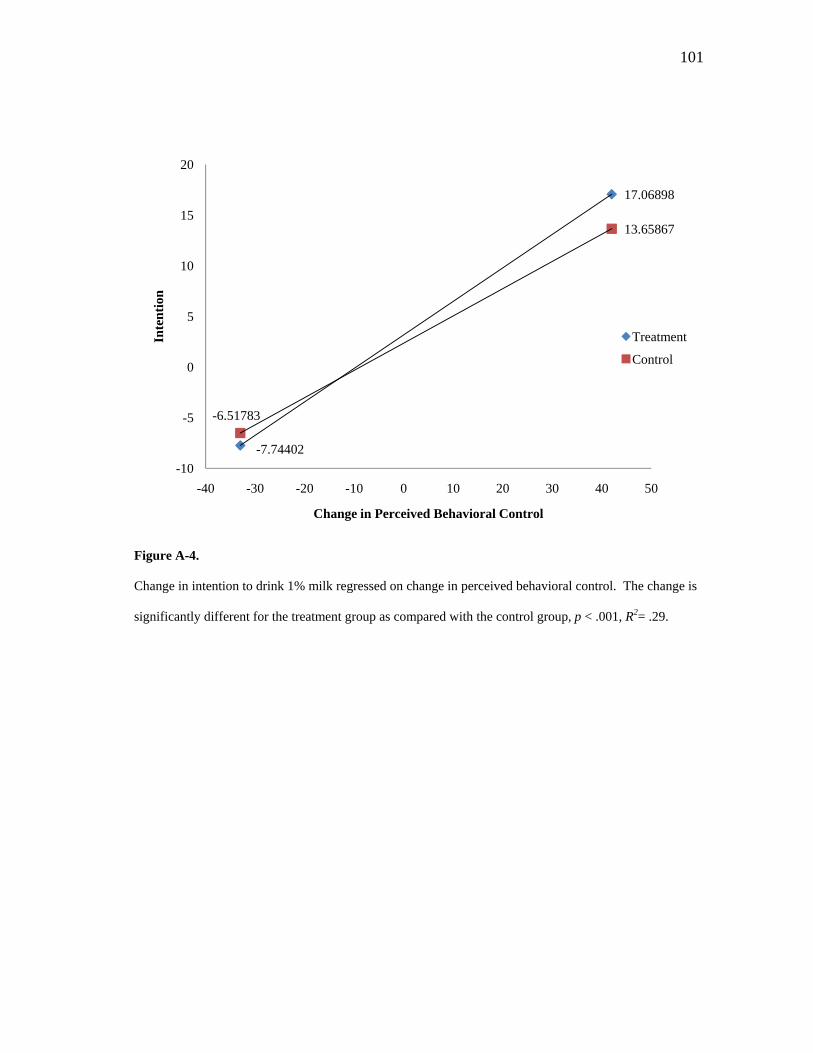
101
Figure A-4.
Change in intention to drink 1% milk regressed on change in perceived behavioral control. The change is
significantly different for the treatment group as compared with the control group, p < .001, R2= .29.
-7.74402
17.06898
-6.51783
13.65867
-10
-5
0
5
10
15
20
-40 -30 -20 -10 0 10 20 30 40 50
Inte
nti
on
Change in Perceived Behavioral Control
Treatment
Control
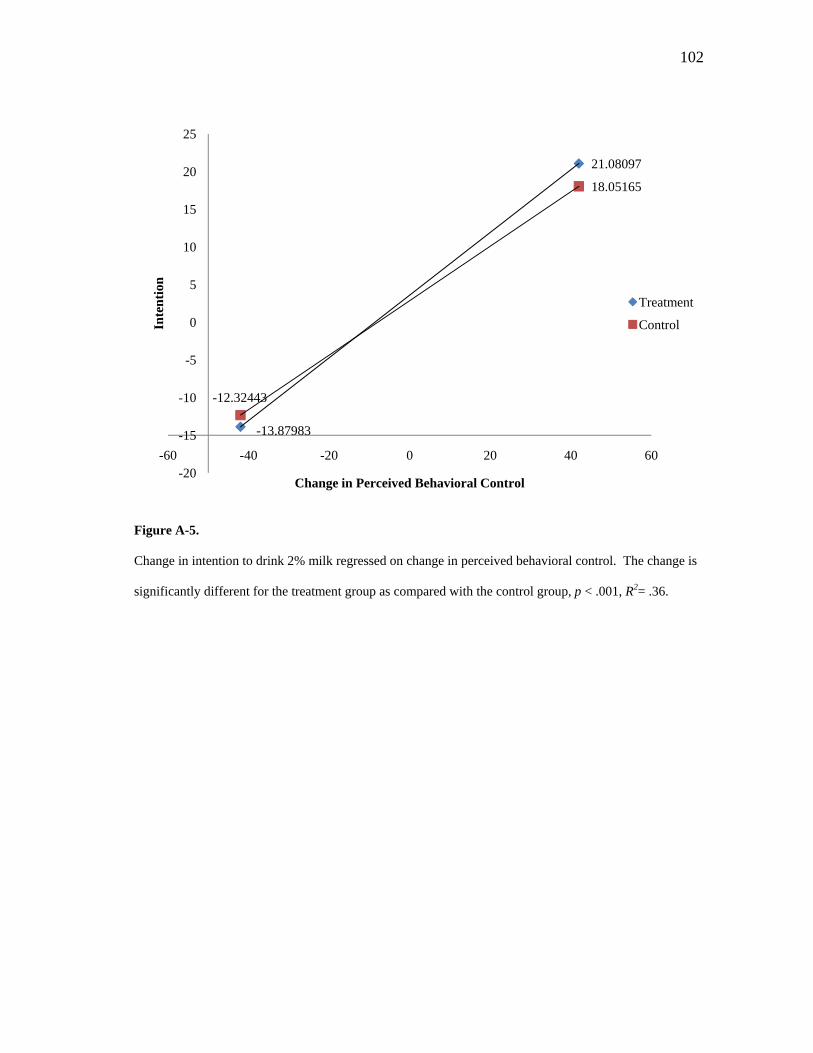
102
Figure A-5.
Change in intention to drink 2% milk regressed on change in perceived behavioral control. The change is
significantly different for the treatment group as compared with the control group, p < .001, R2= .36.
-13.87983
21.08097
-12.32443
18.05165
-20
-15
-10
-5
0
5
10
15
20
25
-60 -40 -20 0 20 40 60
Inte
nti
on
Change in Perceived Behavioral Control
Treatment
Control
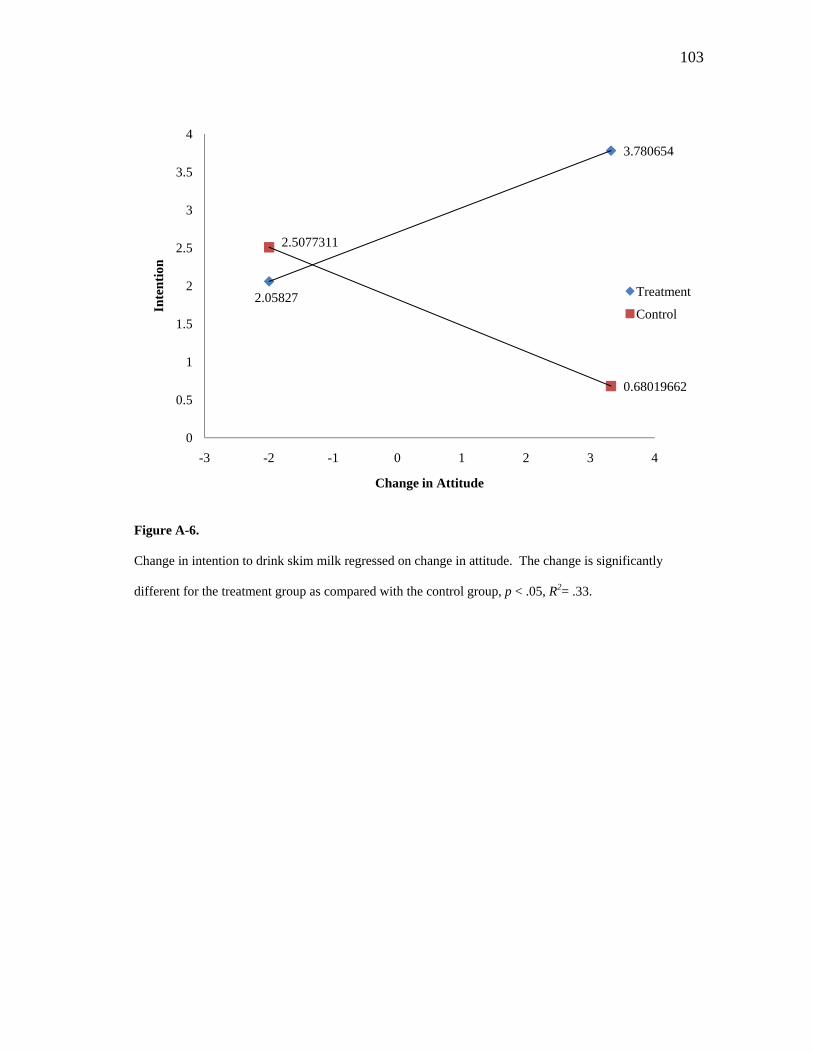
103
Figure A-6.
Change in intention to drink skim milk regressed on change in attitude. The change is significantly
different for the treatment group as compared with the control group, p < .05, R2= .33.
2.05827
3.780654
2.5077311
0.68019662
0
0.5
1
1.5
2
2.5
3
3.5
4
-3 -2 -1 0 1 2 3 4
Inte
nti
on
Change in Attitude
Treatment
Control
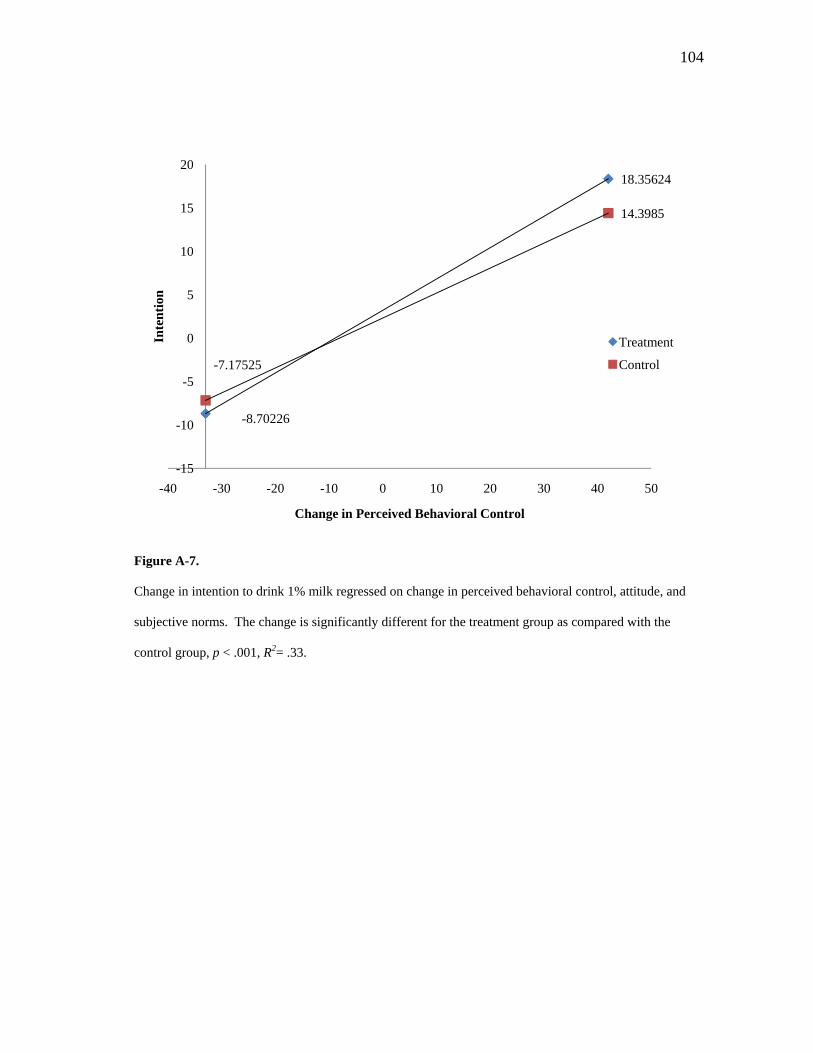
104
Figure A-7.
Change in intention to drink 1% milk regressed on change in perceived behavioral control, attitude, and
subjective norms. The change is significantly different for the treatment group as compared with the
control group, p < .001, R2= .33.
-8.70226
18.35624
-7.17525
14.3985
-15
-10
-5
0
5
10
15
20
-40 -30 -20 -10 0 10 20 30 40 50
Inte
nti
on
Change in Perceived Behavioral Control
Treatment
Control
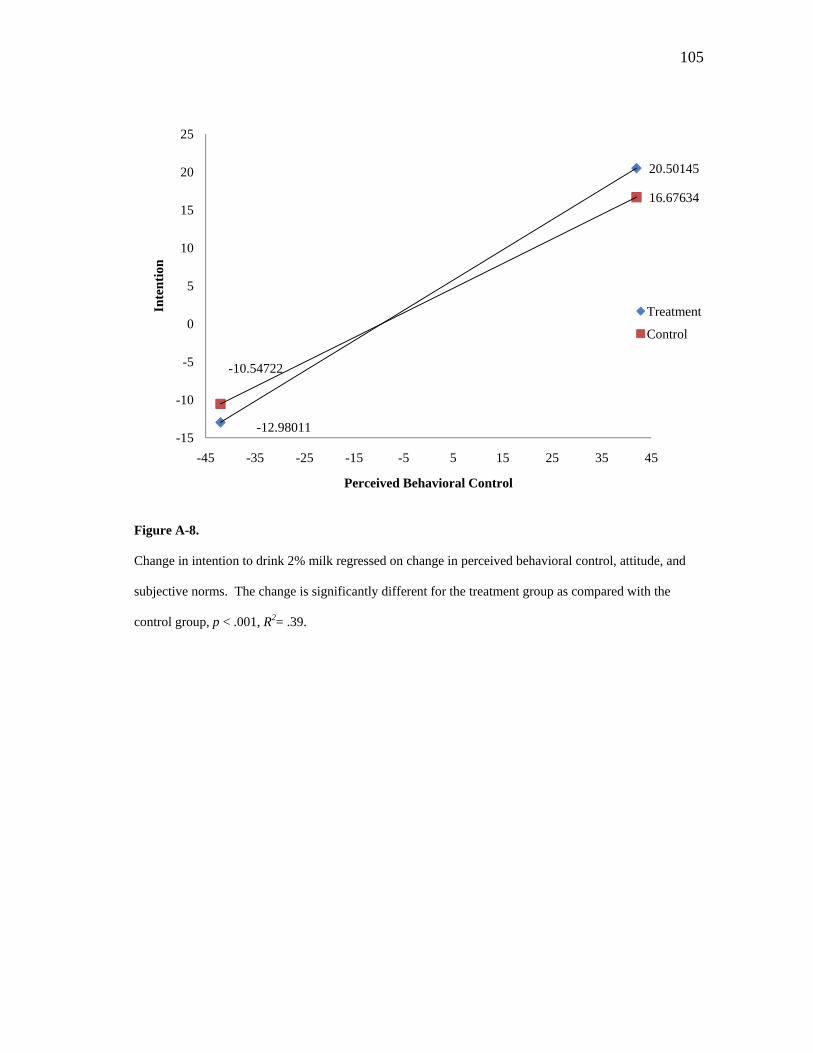
105
Figure A-8.
Change in intention to drink 2% milk regressed on change in perceived behavioral control, attitude, and
subjective norms. The change is significantly different for the treatment group as compared with the
control group, p < .001, R2= .39.
-12.98011
20.50145
-10.54722
16.67634
-15
-10
-5
0
5
10
15
20
25
-45 -35 -25 -15 -5 5 15 25 35 45
Inte
nti
on
Perceived Behavioral Control
Treatment
Control

106
APPENDIX B
LIST OF TABLES
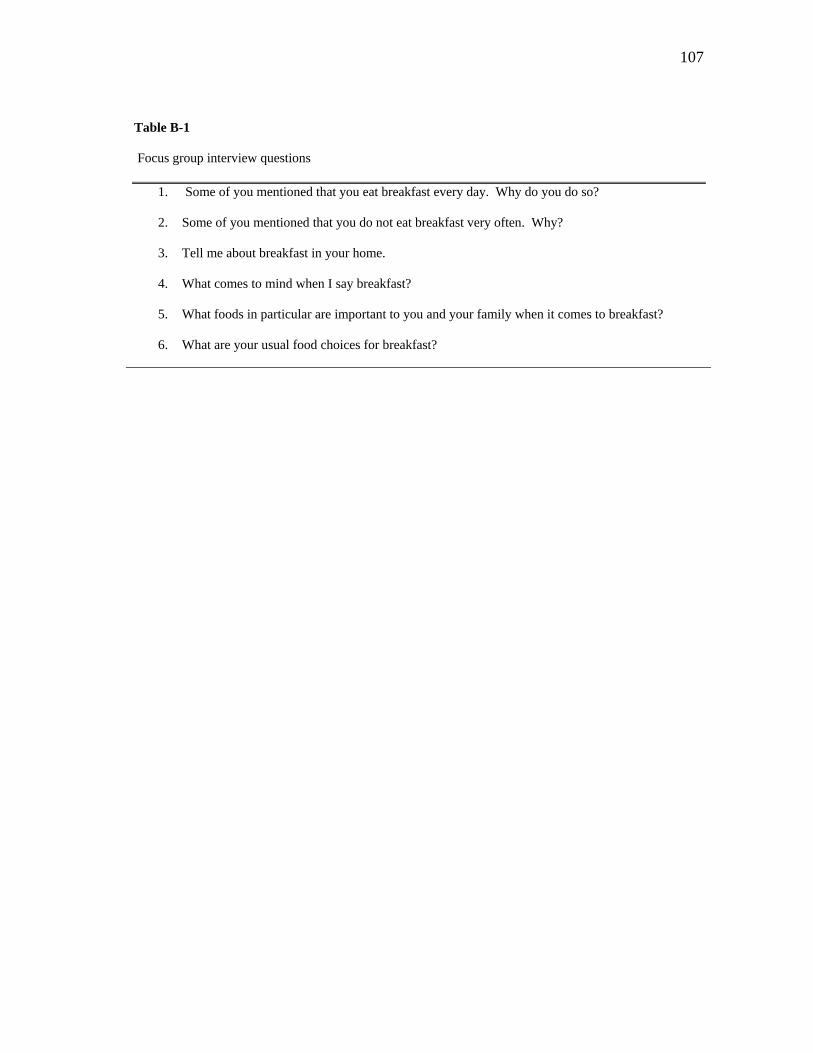
107
Table B-1
Focus group interview questions
1. Some of you mentioned that you eat breakfast every day. Why do you do so?
2. Some of you mentioned that you do not eat breakfast very often. Why?
3. Tell me about breakfast in your home.
4. What comes to mind when I say breakfast?
5. What foods in particular are important to you and your family when it comes to breakfast?
6. What are your usual food choices for breakfast?
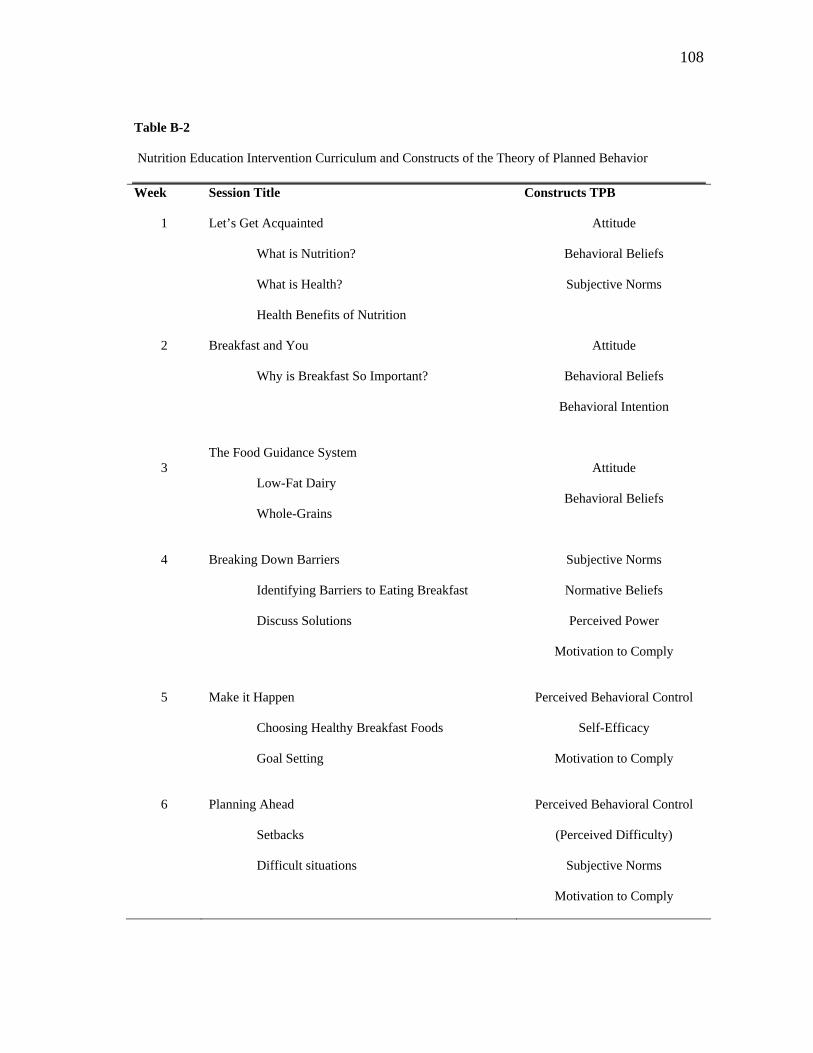
108
Table B-2
Nutrition Education Intervention Curriculum and Constructs of the Theory of Planned Behavior
Week Session Title Constructs TPB
1 Let’s Get Acquainted
What is Nutrition?
What is Health?
Health Benefits of Nutrition
Attitude
Behavioral Beliefs
Subjective Norms
2 Breakfast and You
Why is Breakfast So Important?
Attitude
Behavioral Beliefs
Behavioral Intention
3
The Food Guidance System
Low-Fat Dairy
Whole-Grains
Attitude
Behavioral Beliefs
4
Breaking Down Barriers
Identifying Barriers to Eating Breakfast
Discuss Solutions
Subjective Norms
Normative Beliefs
Perceived Power
Motivation to Comply
5
Make it Happen
Choosing Healthy Breakfast Foods
Goal Setting
Perceived Behavioral Control
Self-Efficacy
Motivation to Comply
6
Planning Ahead
Setbacks
Difficult situations
Perceived Behavioral Control
(Perceived Difficulty)
Subjective Norms
Motivation to Comply
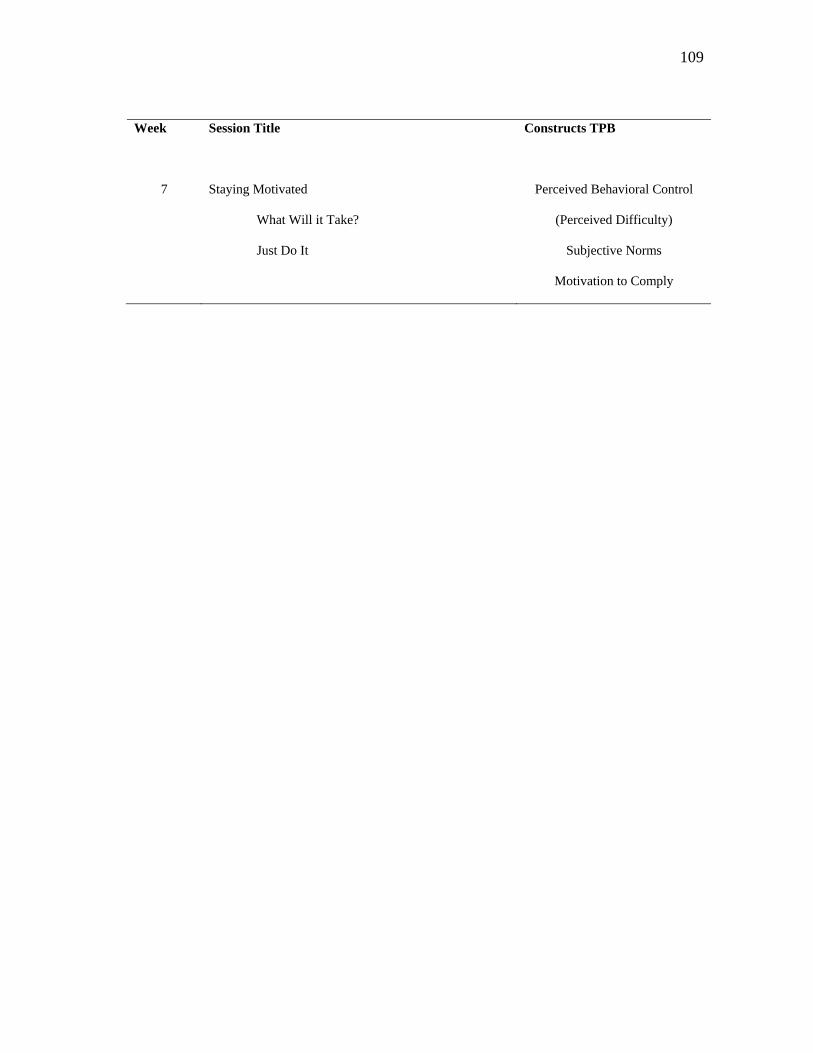
109
Week Session Title Constructs TPB
7
Staying Motivated
What Will it Take?
Just Do It
Perceived Behavioral Control
(Perceived Difficulty)
Subjective Norms
Motivation to Comply
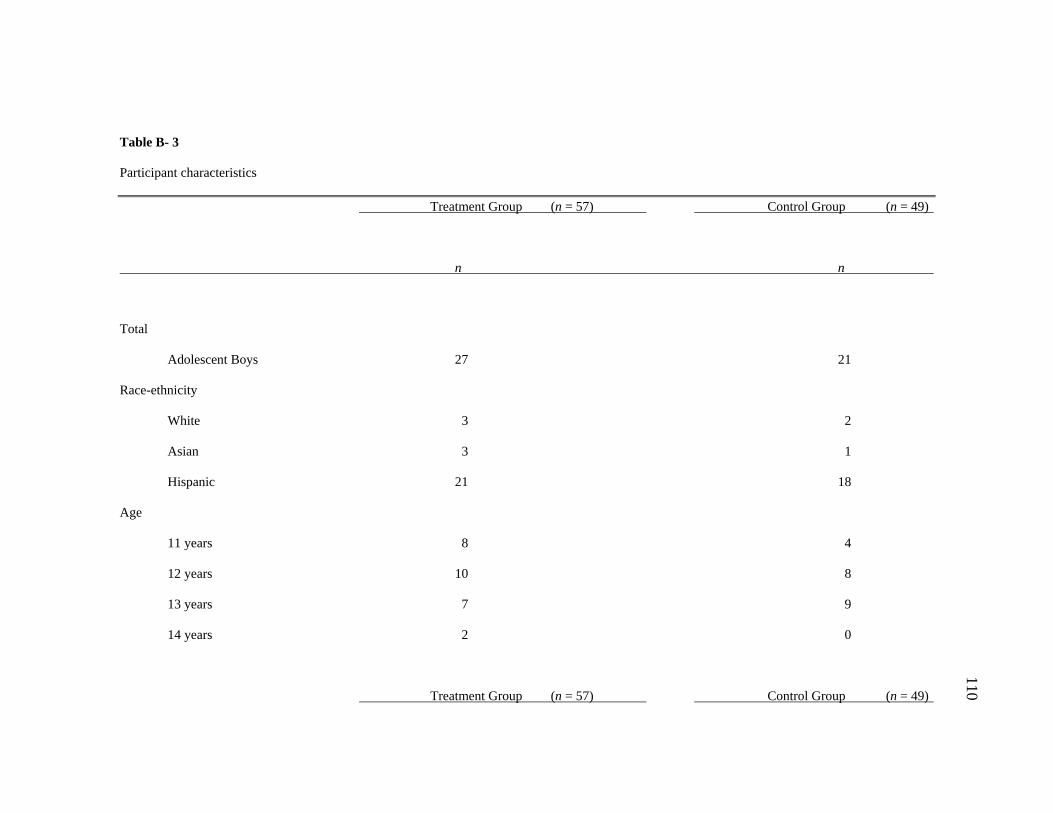
110
Table B- 3
Participant characteristics
Treatment Group (n = 57) Control Group (n = 49)
n n
Total
Adolescent Boys 27 21
Race-ethnicity
White 3 2
Asian 3 1
Hispanic 21 18
Age
11 years 8 4
12 years 10 8
13 years 7 9
14 years 2 0
Treatment Group (n = 57) Control Group (n = 49)
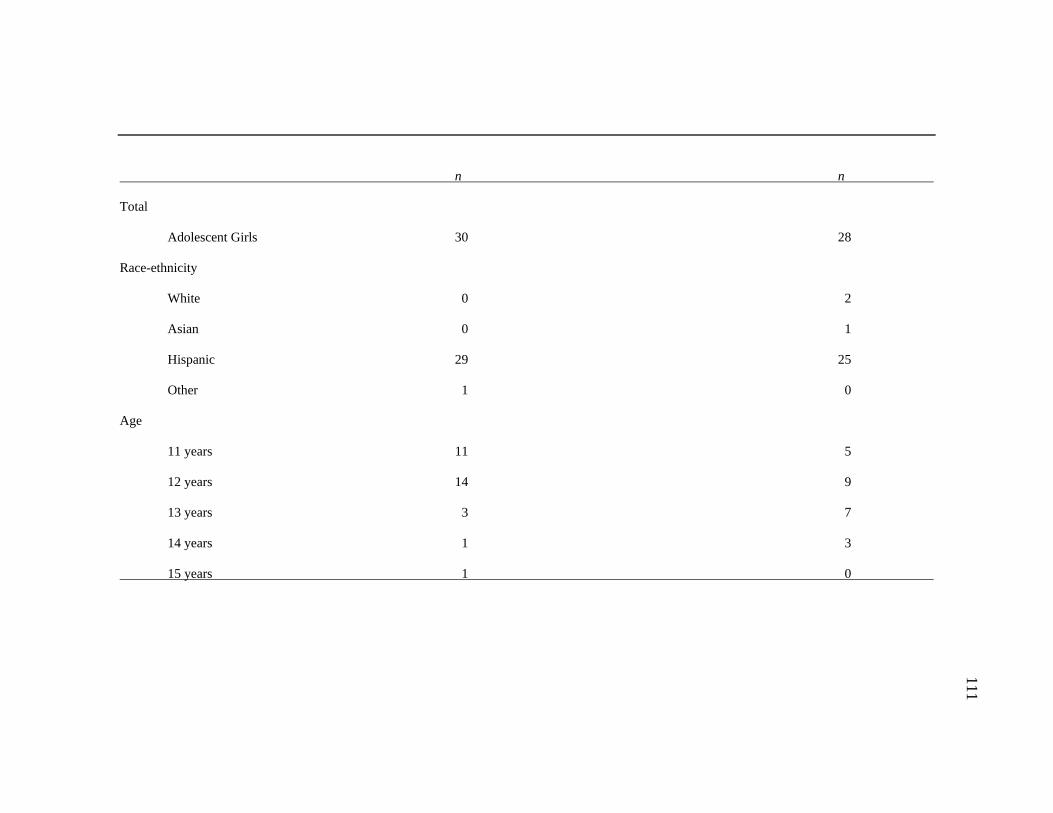
111
n n
Total
Adolescent Girls 30 28
Race-ethnicity
White 0 2
Asian 0 1
Hispanic 29 25
Other 1 0
Age
11 years 11 5
12 years 14 9
13 years 3 7
14 years 1 3
15 years 1 0
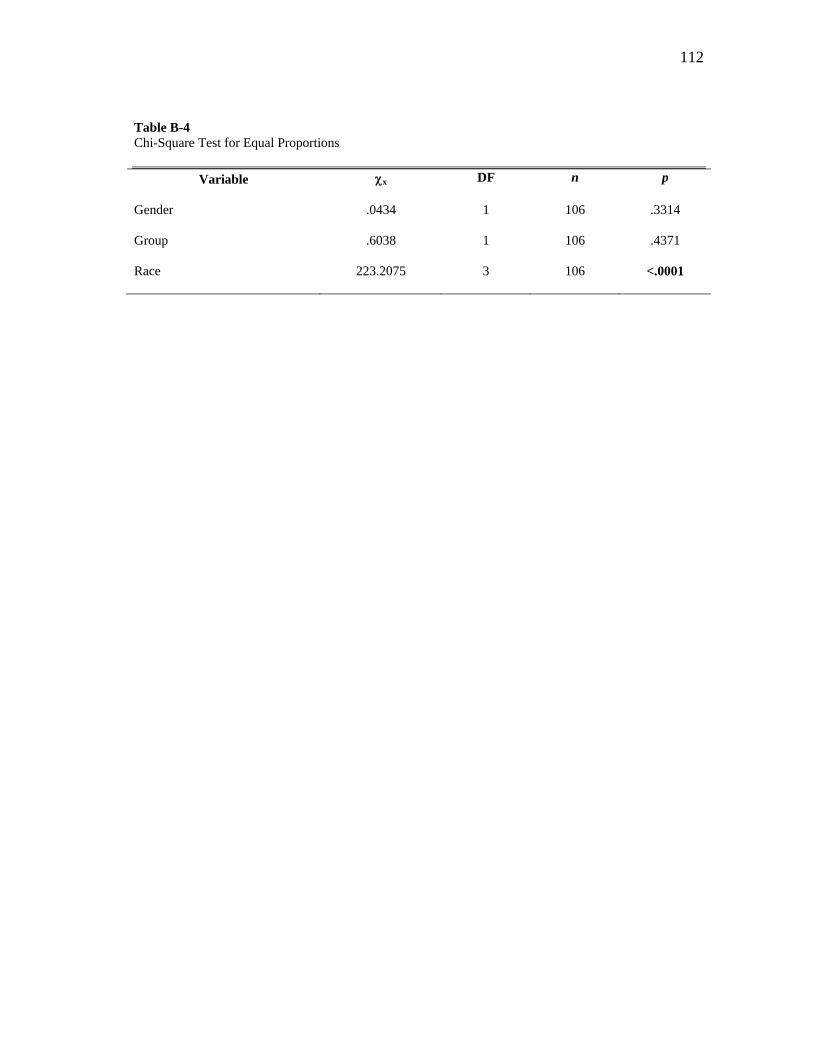
112
Table B-4 Chi-Square Test for Equal Proportions
Variable x DF n p
Gender .0434 1 106 .3314
Group .6038 1 106 .4371
Race 223.2075 3 106 <.0001
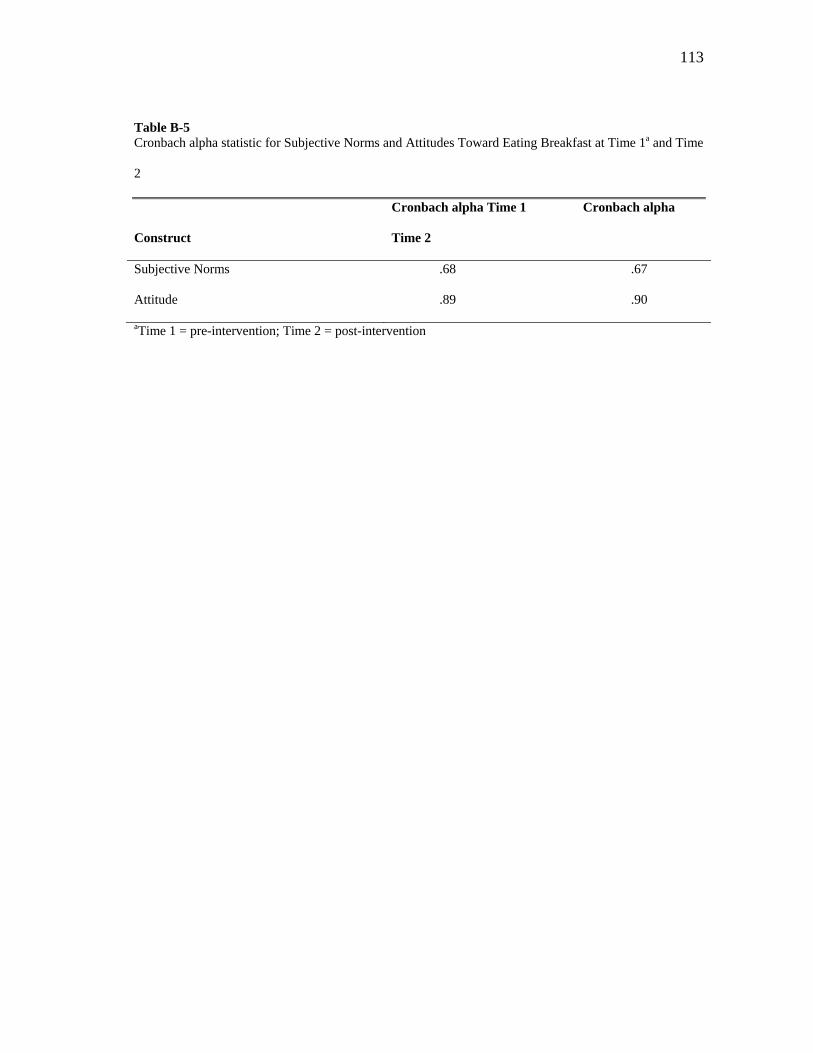
113
Table B-5 Cronbach alpha statistic for Subjective Norms and Attitudes Toward Eating Breakfast at Time 1a and Time
2
Construct
Cronbach alpha Time 1 Cronbach alpha
Time 2
Subjective Norms .68 .67
Attitude .89 .90
aTime 1 = pre-intervention; Time 2 = post-intervention
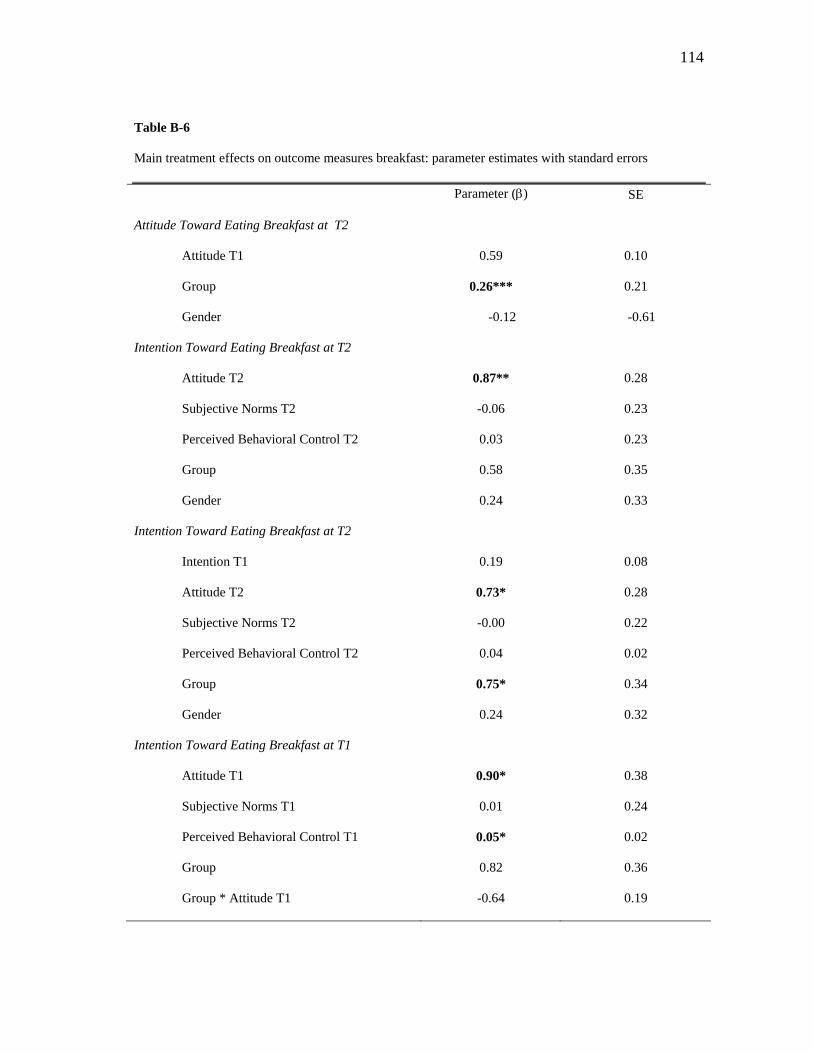
114
Table B-6
Main treatment effects on outcome measures breakfast: parameter estimates with standard errors
Parameter () SE
Attitude Toward Eating Breakfast at T2
Attitude T1
Group
Gender
0.59
0.26***
-0.12
0.10
0.21
-0.61
Intention Toward Eating Breakfast at T2
Attitude T2
Subjective Norms T2
Perceived Behavioral Control T2
Group
Gender
0.87**
-0.06
0.03
0.58
0.24
0.28
0.23
0.23
0.35
0.33
Intention Toward Eating Breakfast at T2
Intention T1
Attitude T2
Subjective Norms T2
Perceived Behavioral Control T2
Group
Gender
0.19
0.73*
-0.00
0.04
0.75*
0.24
0.08
0.28
0.22
0.02
0.34
0.32
Intention Toward Eating Breakfast at T1
Attitude T1
Subjective Norms T1
Perceived Behavioral Control T1
Group
Group * Attitude T1
0.90*
0.01
0.05*
0.82
-0.64
0.38
0.24
0.02
0.36
0.19
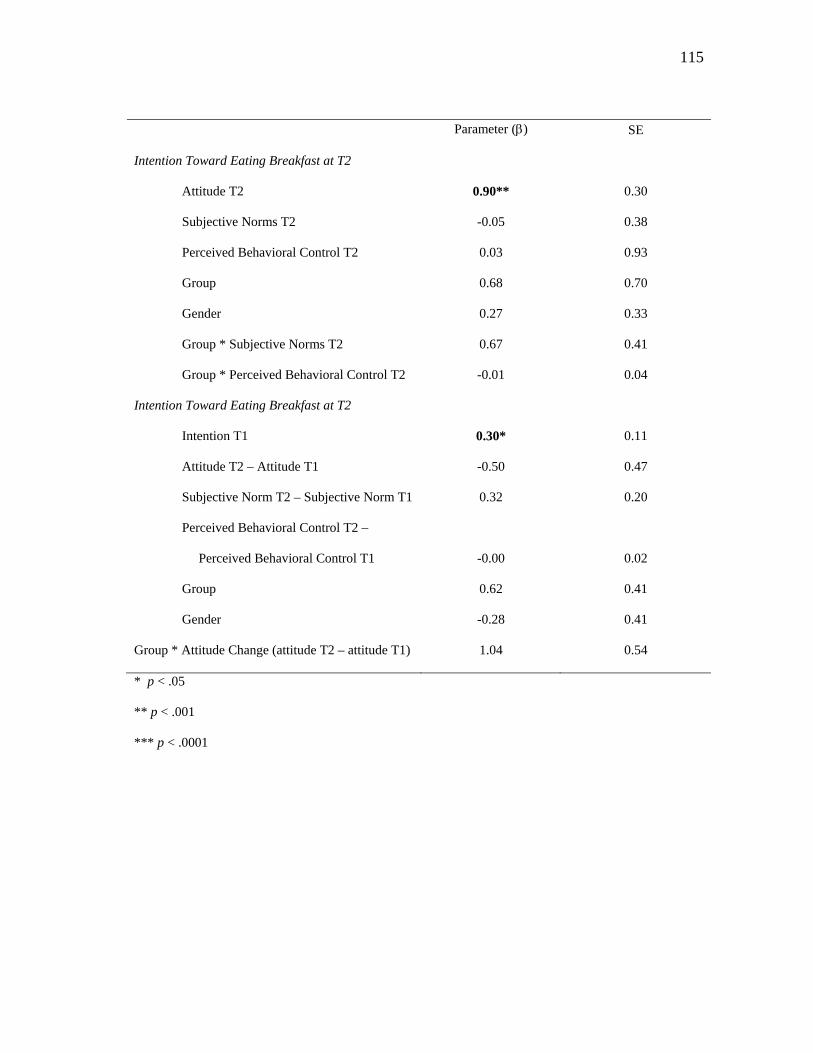
115
Parameter () SE
Intention Toward Eating Breakfast at T2
Attitude T2
Subjective Norms T2
Perceived Behavioral Control T2
Group
Gender
Group * Subjective Norms T2
Group * Perceived Behavioral Control T2
0.90**
-0.05
0.03
0.68
0.27
0.67
-0.01
0.30
0.38
0.93
0.70
0.33
0.41
0.04
Intention Toward Eating Breakfast at T2
Intention T1
Attitude T2 – Attitude T1
Subjective Norm T2 – Subjective Norm T1
Perceived Behavioral Control T2 –
Perceived Behavioral Control T1
Group
Gender
Group * Attitude Change (attitude T2 – attitude T1)
0.30*
-0.50
0.32
-0.00
0.62
-0.28
1.04
0.11
0.47
0.20
0.02
0.41
0.41
0.54
* p < .05
** p < .001
*** p < .0001
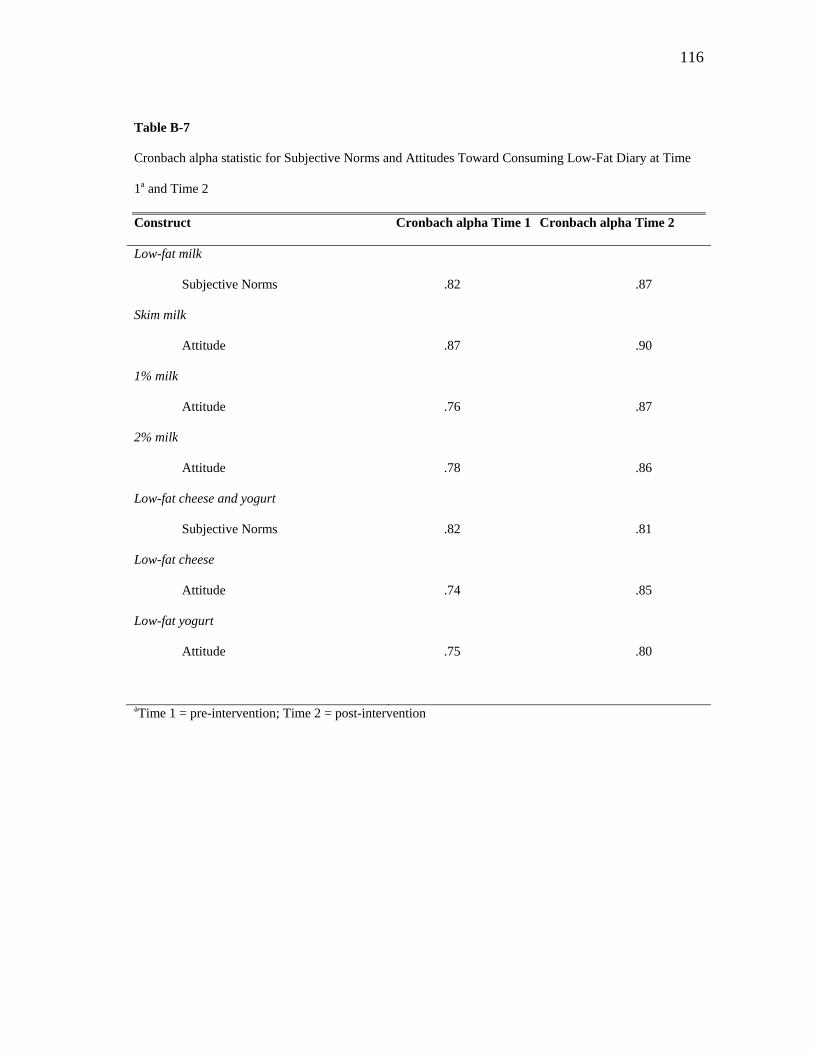
116
Table B-7
Cronbach alpha statistic for Subjective Norms and Attitudes Toward Consuming Low-Fat Diary at Time
1a and Time 2
Construct Cronbach alpha Time 1 Cronbach alpha Time 2
Low-fat milk
Subjective Norms
.82 .87
Skim milk
Attitude
.87 .90
1% milk
Attitude
.76 .87
2% milk
Attitude
.78 .86
Low-fat cheese and yogurt
Subjective Norms
.82 .81
Low-fat cheese
Attitude
.74 .85
Low-fat yogurt
Attitude
.75 .80
aTime 1 = pre-intervention; Time 2 = post-intervention
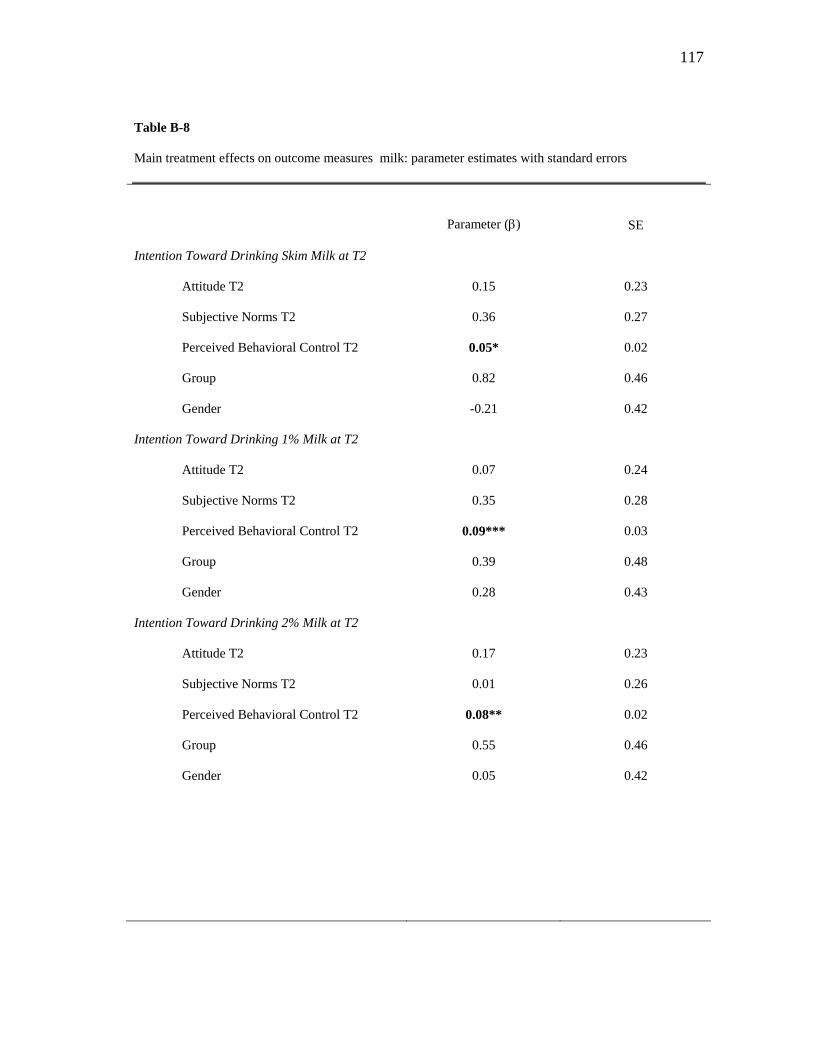
117
Table B-8
Main treatment effects on outcome measures milk: parameter estimates with standard errors
Parameter () SE
Intention Toward Drinking Skim Milk at T2
Attitude T2
Subjective Norms T2
Perceived Behavioral Control T2
Group
Gender
0.15
0.36
0.05*
0.82
-0.21
0.23
0.27
0.02
0.46
0.42
Intention Toward Drinking 1% Milk at T2
Attitude T2
Subjective Norms T2
Perceived Behavioral Control T2
Group
Gender
0.07
0.35
0.09***
0.39
0.28
0.24
0.28
0.03
0.48
0.43
Intention Toward Drinking 2% Milk at T2
Attitude T2
Subjective Norms T2
Perceived Behavioral Control T2
Group
Gender
0.17
0.01
0.08**
0.55
0.05
0.23
0.26
0.02
0.46
0.42
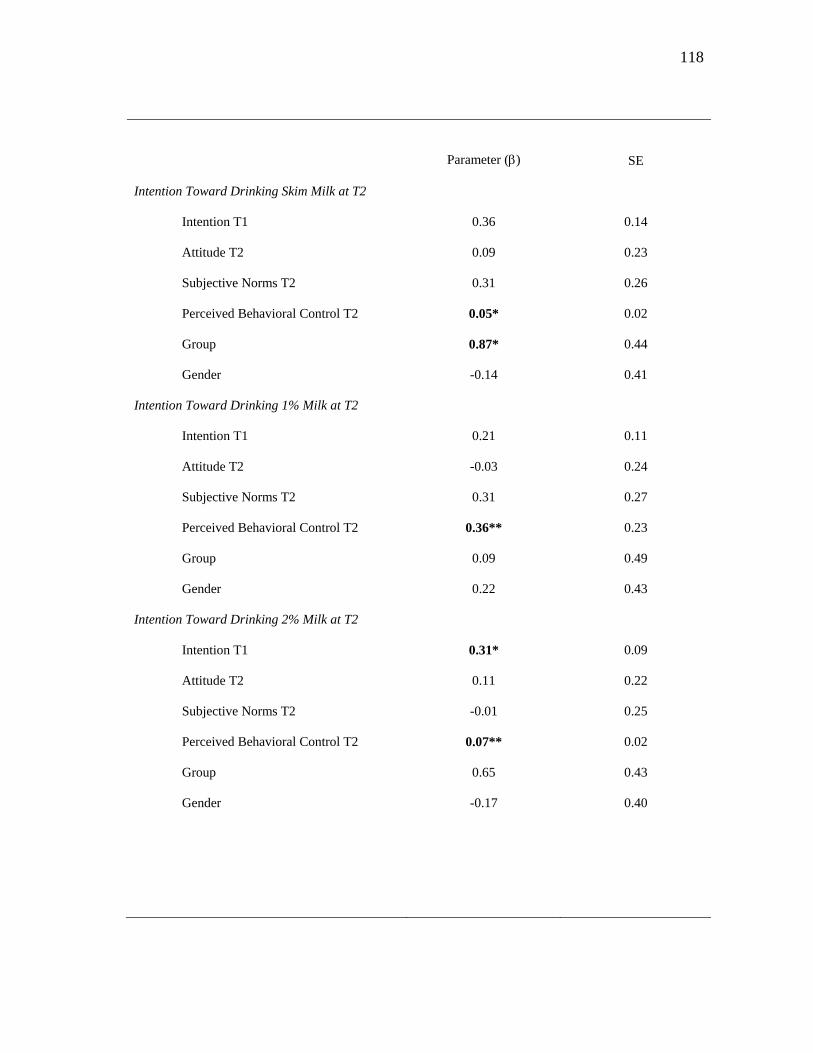
118
Parameter () SE
Intention Toward Drinking Skim Milk at T2
Intention T1
Attitude T2
Subjective Norms T2
Perceived Behavioral Control T2
Group
Gender
0.36
0.09
0.31
0.05*
0.87*
-0.14
0.14
0.23
0.26
0.02
0.44
0.41
Intention Toward Drinking 1% Milk at T2
Intention T1
Attitude T2
Subjective Norms T2
Perceived Behavioral Control T2
Group
Gender
0.21
-0.03
0.31
0.36**
0.09
0.22
0.11
0.24
0.27
0.23
0.49
0.43
Intention Toward Drinking 2% Milk at T2
Intention T1
Attitude T2
Subjective Norms T2
Perceived Behavioral Control T2
Group
Gender
0.31*
0.11
-0.01
0.07**
0.65
-0.17
0.09
0.22
0.25
0.02
0.43
0.40
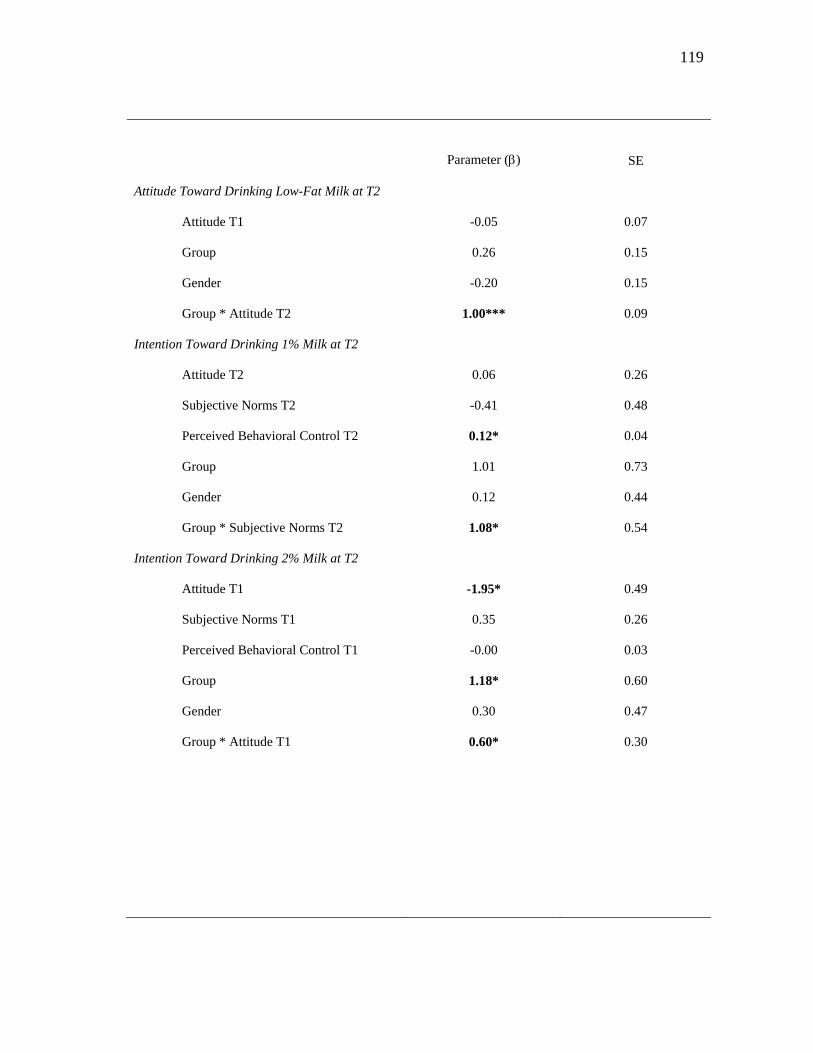
119
Parameter () SE
Attitude Toward Drinking Low-Fat Milk at T2
Attitude T1
Group
Gender
Group * Attitude T2
-0.05
0.26
-0.20
1.00***
0.07
0.15
0.15
0.09
Intention Toward Drinking 1% Milk at T2
Attitude T2
Subjective Norms T2
Perceived Behavioral Control T2
Group
Gender
Group * Subjective Norms T2
0.06
-0.41
0.12*
1.01
0.12
1.08*
0.26
0.48
0.04
0.73
0.44
0.54
Intention Toward Drinking 2% Milk at T2
Attitude T1
Subjective Norms T1
Perceived Behavioral Control T1
Group
Gender
Group * Attitude T1
-1.95*
0.35
-0.00
1.18*
0.30
0.60*
0.49
0.26
0.03
0.60
0.47
0.30
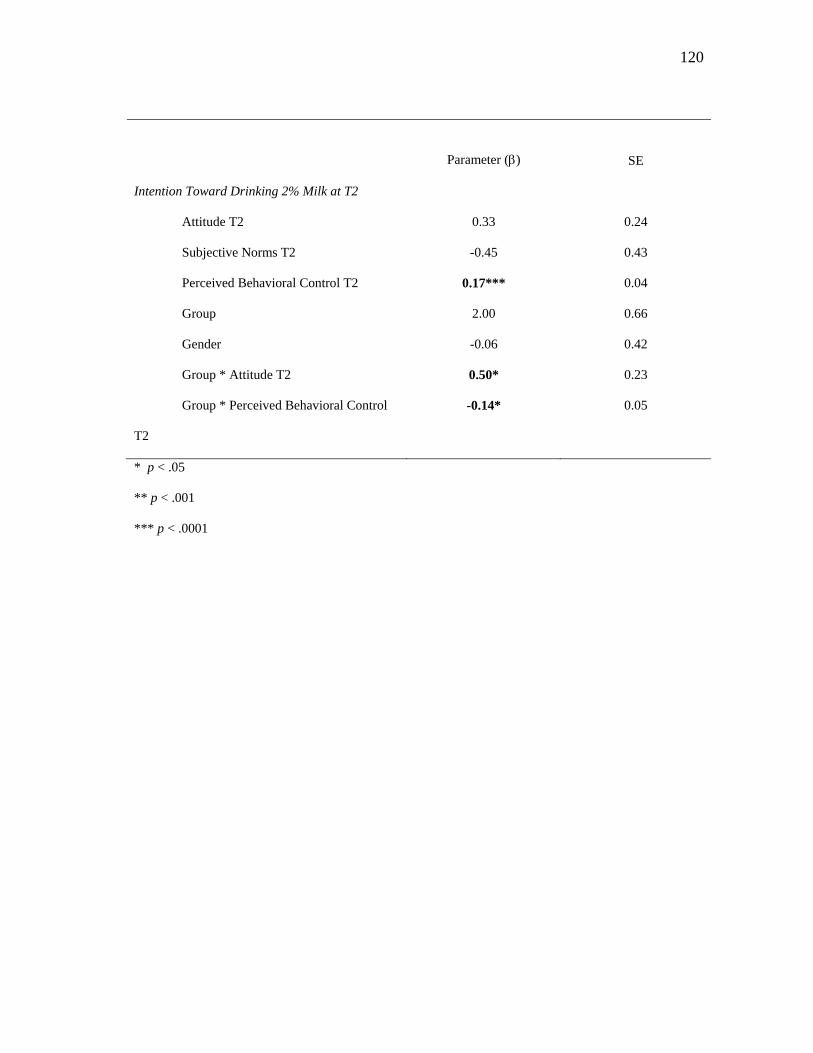
120
Parameter () SE
Intention Toward Drinking 2% Milk at T2
Attitude T2
Subjective Norms T2
Perceived Behavioral Control T2
Group
Gender
Group * Attitude T2
Group * Perceived Behavioral Control
T2
0.33
-0.45
0.17***
2.00
-0.06
0.50*
-0.14*
0.24
0.43
0.04
0.66
0.42
0.23
0.05
* p < .05
** p < .001
*** p < .0001
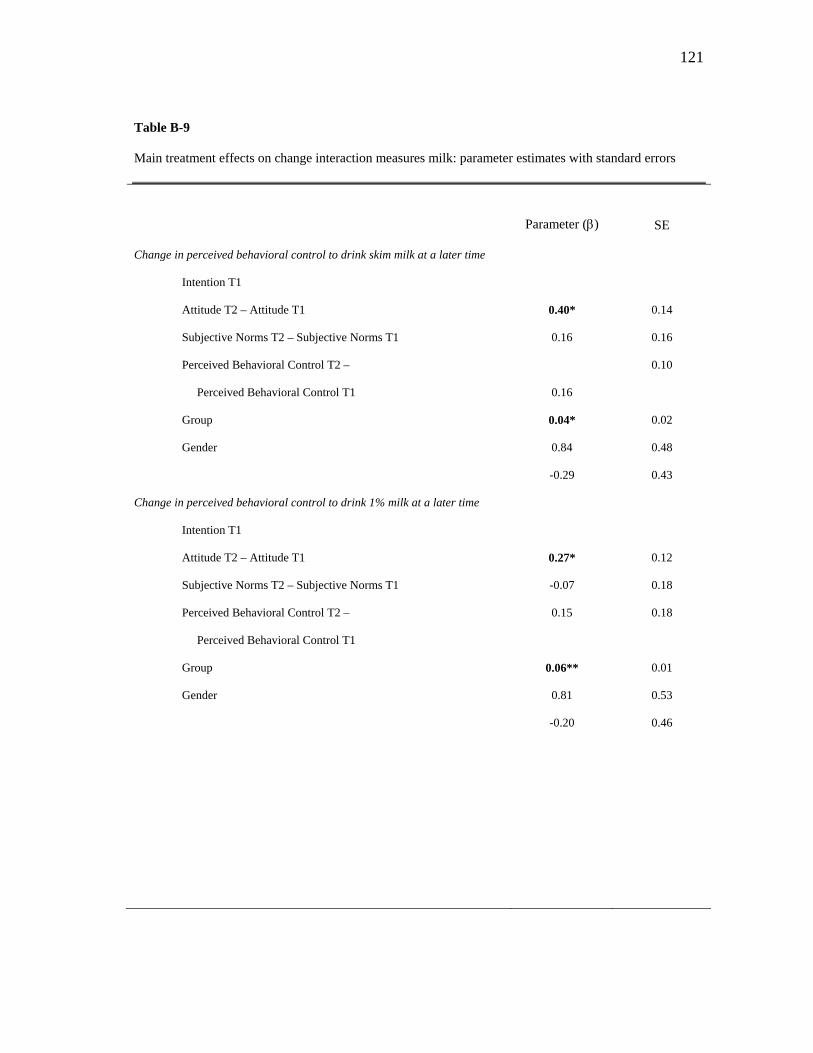
121
Table B-9
Main treatment effects on change interaction measures milk: parameter estimates with standard errors
Parameter () SE
Change in perceived behavioral control to drink skim milk at a later time
Intention T1
Attitude T2 – Attitude T1
Subjective Norms T2 – Subjective Norms T1
Perceived Behavioral Control T2 –
Perceived Behavioral Control T1
Group
Gender
0.40*
0.16
0.16
0.04*
0.84
-0.29
0.14
0.16
0.10
0.02
0.48
0.43
Change in perceived behavioral control to drink 1% milk at a later time
Intention T1
Attitude T2 – Attitude T1
Subjective Norms T2 – Subjective Norms T1
Perceived Behavioral Control T2 –
Perceived Behavioral Control T1
Group
Gender
0.27*
-0.07
0.15
0.06**
0.81
-0.20
0.12
0.18
0.18
0.01
0.53
0.46
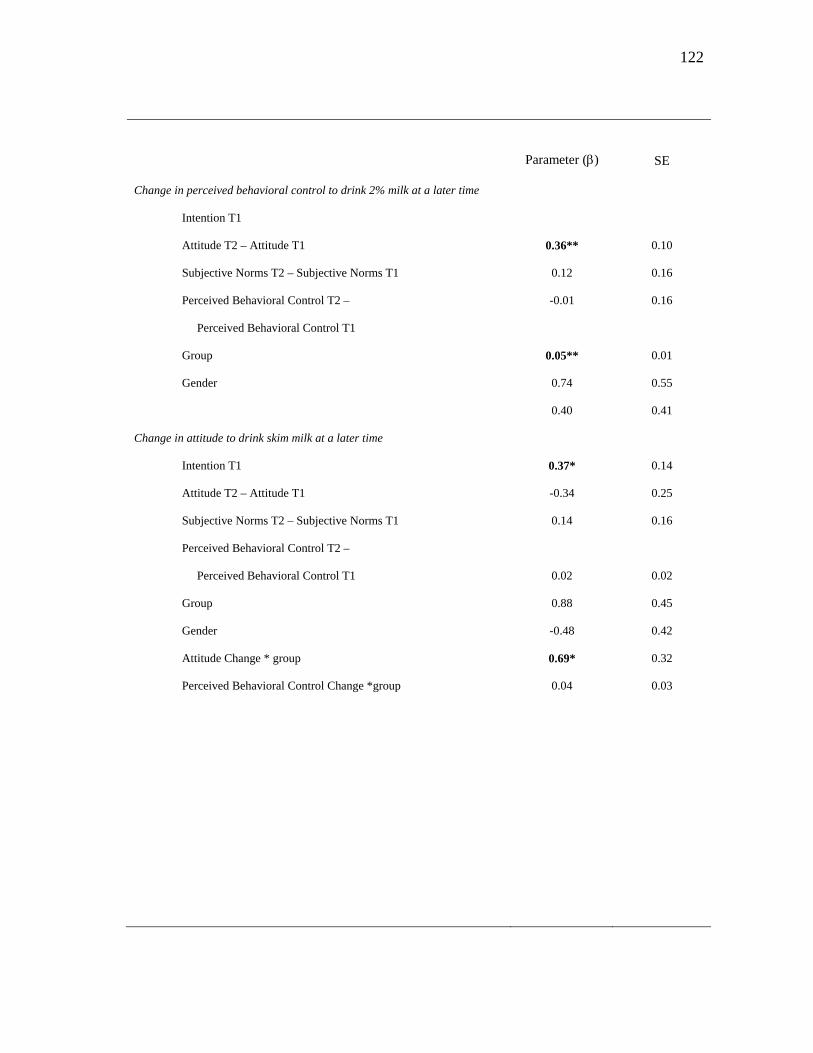
122
Parameter () SE
Change in perceived behavioral control to drink 2% milk at a later time
Intention T1
Attitude T2 – Attitude T1
Subjective Norms T2 – Subjective Norms T1
Perceived Behavioral Control T2 –
Perceived Behavioral Control T1
Group
Gender
0.36**
0.12
-0.01
0.05**
0.74
0.40
0.10
0.16
0.16
0.01
0.55
0.41
Change in attitude to drink skim milk at a later time
Intention T1
Attitude T2 – Attitude T1
Subjective Norms T2 – Subjective Norms T1
Perceived Behavioral Control T2 –
Perceived Behavioral Control T1
Group
Gender
Attitude Change * group
Perceived Behavioral Control Change *group
0.37*
-0.34
0.14
0.02
0.88
-0.48
0.69*
0.04
0.14
0.25
0.16
0.02
0.45
0.42
0.32
0.03
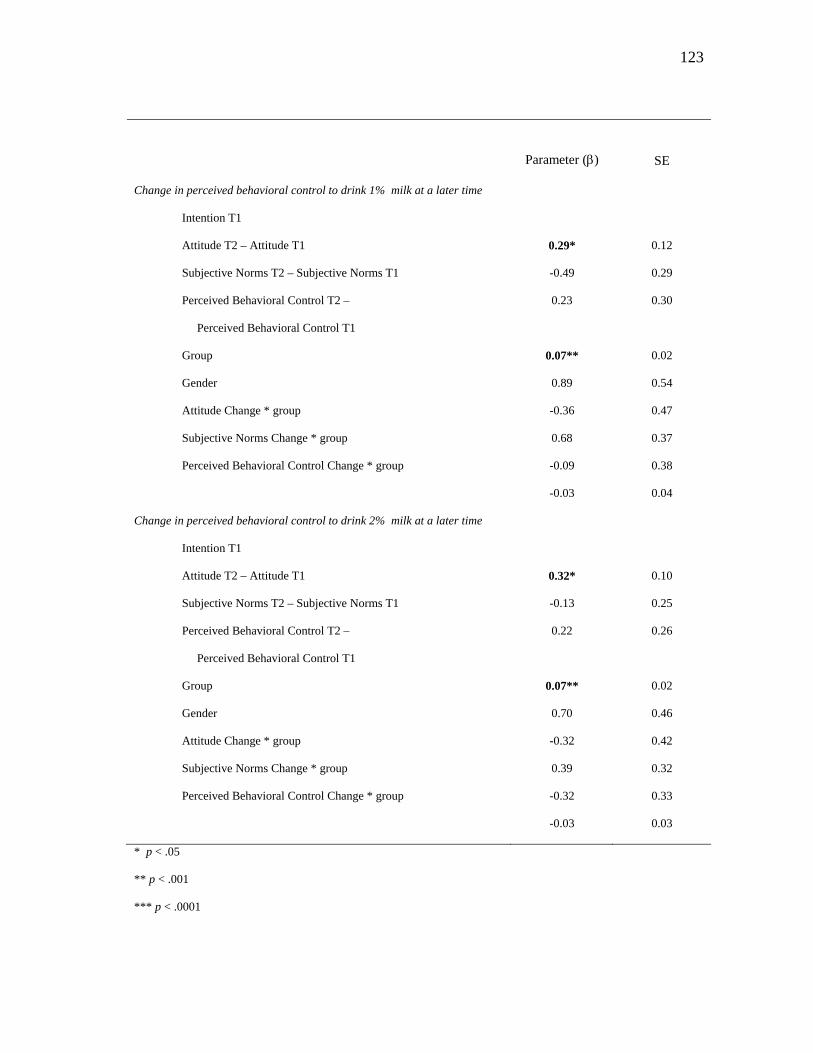
123
Parameter () SE
Change in perceived behavioral control to drink 1% milk at a later time
Intention T1
Attitude T2 – Attitude T1
Subjective Norms T2 – Subjective Norms T1
Perceived Behavioral Control T2 –
Perceived Behavioral Control T1
Group
Gender
Attitude Change * group
Subjective Norms Change * group
Perceived Behavioral Control Change * group
0.29*
-0.49
0.23
0.07**
0.89
-0.36
0.68
-0.09
-0.03
0.12
0.29
0.30
0.02
0.54
0.47
0.37
0.38
0.04
Change in perceived behavioral control to drink 2% milk at a later time
Intention T1
Attitude T2 – Attitude T1
Subjective Norms T2 – Subjective Norms T1
Perceived Behavioral Control T2 –
Perceived Behavioral Control T1
Group
Gender
Attitude Change * group
Subjective Norms Change * group
Perceived Behavioral Control Change * group
0.32*
-0.13
0.22
0.07**
0.70
-0.32
0.39
-0.32
-0.03
0.10
0.25
0.26
0.02
0.46
0.42
0.32
0.33
0.03
* p < .05
** p < .001
*** p < .0001
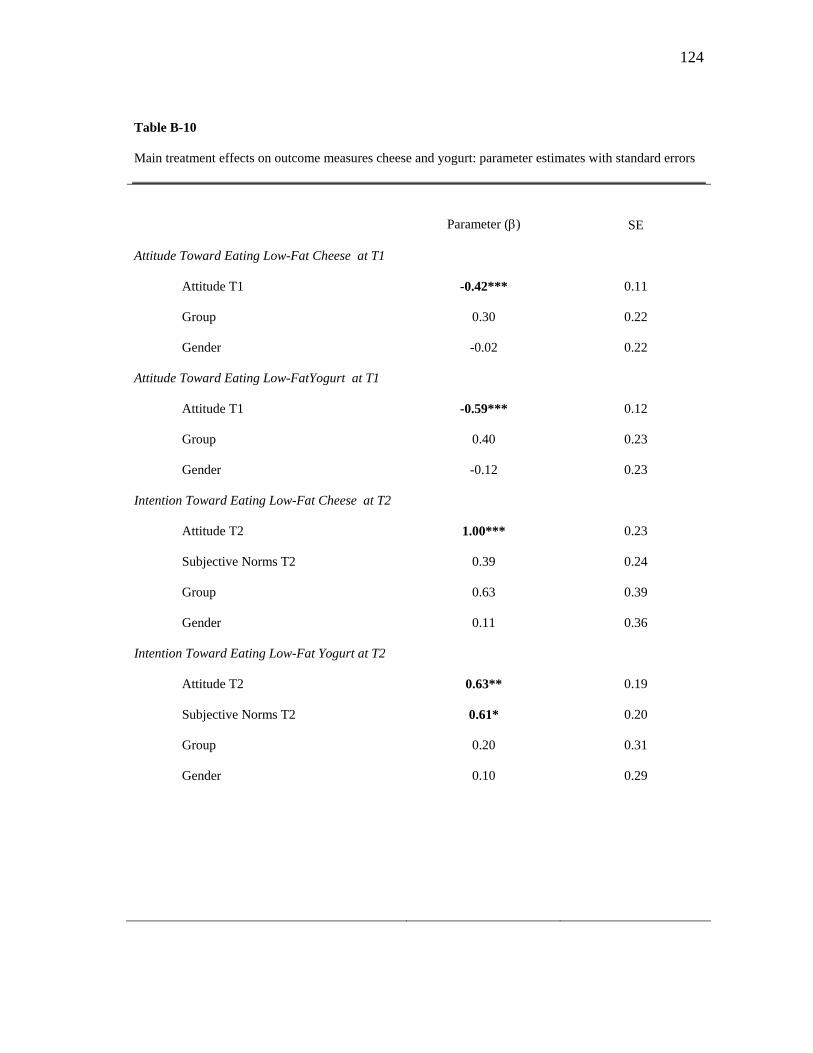
124
Table B-10
Main treatment effects on outcome measures cheese and yogurt: parameter estimates with standard errors
Parameter () SE
Attitude Toward Eating Low-Fat Cheese at T1
Attitude T1
Group
Gender
-0.42***
0.30
-0.02
0.11
0.22
0.22
Attitude Toward Eating Low-FatYogurt at T1
Attitude T1
Group
Gender
-0.59***
0.40
-0.12
0.12
0.23
0.23
Intention Toward Eating Low-Fat Cheese at T2
Attitude T2
Subjective Norms T2
Group
Gender
1.00***
0.39
0.63
0.11
0.23
0.24
0.39
0.36
Intention Toward Eating Low-Fat Yogurt at T2
Attitude T2
Subjective Norms T2
Group
Gender
0.63**
0.61*
0.20
0.10
0.19
0.20
0.31
0.29
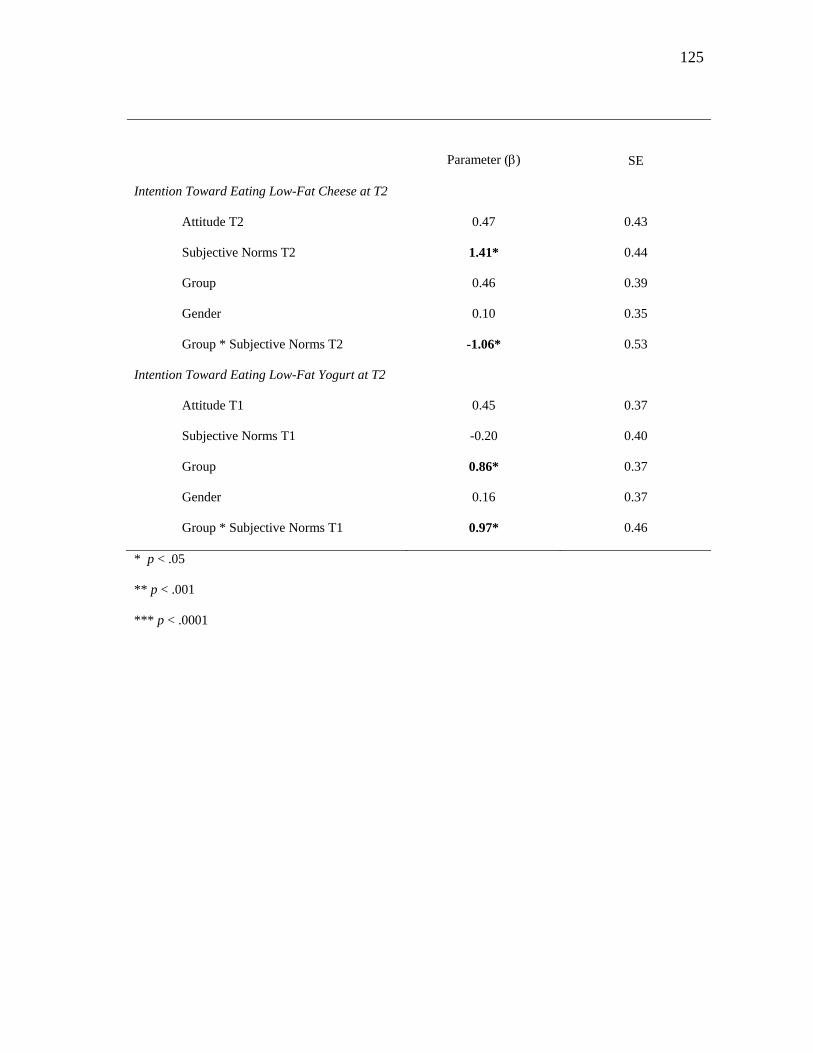
125
Parameter () SE
Intention Toward Eating Low-Fat Cheese at T2
Attitude T2
Subjective Norms T2
Group
Gender
Group * Subjective Norms T2
0.47
1.41*
0.46
0.10
-1.06*
0.43
0.44
0.39
0.35
0.53
Intention Toward Eating Low-Fat Yogurt at T2
Attitude T1
Subjective Norms T1
Group
Gender
Group * Subjective Norms T1
0.45
-0.20
0.86*
0.16
0.97*
0.37
0.40
0.37
0.37
0.46
* p < .05
** p < .001
*** p < .0001
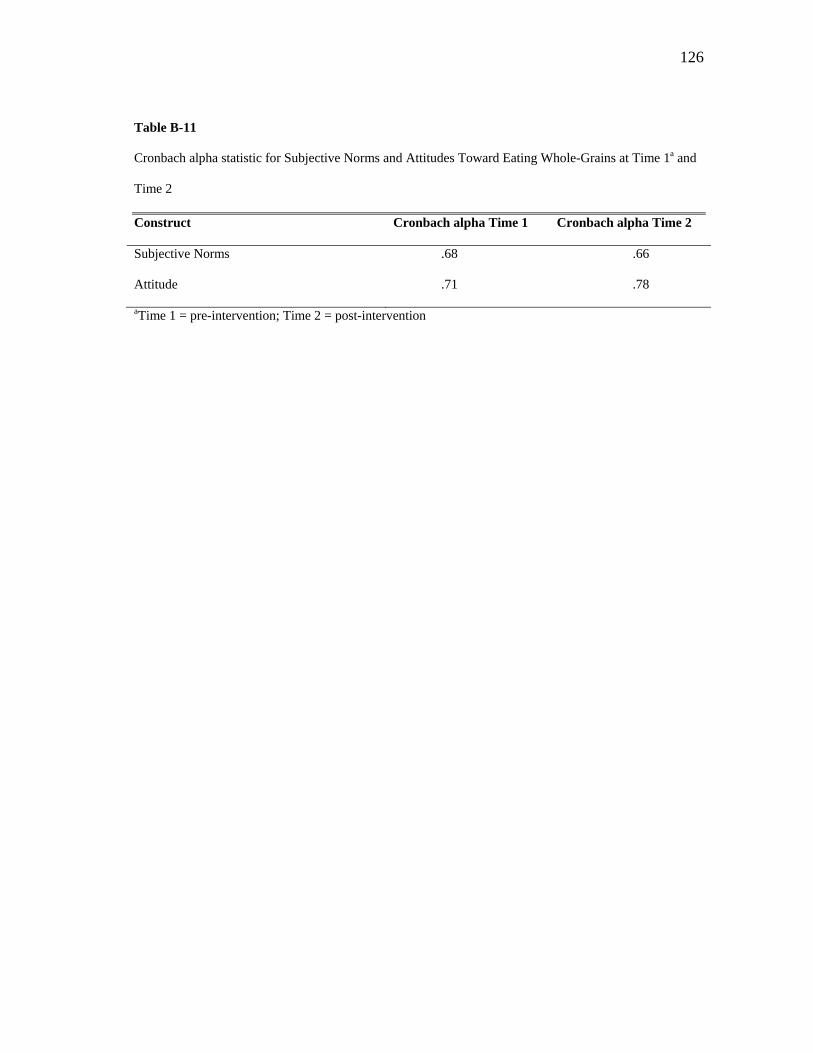
126
Table B-11
Cronbach alpha statistic for Subjective Norms and Attitudes Toward Eating Whole-Grains at Time 1a and
Time 2
Construct Cronbach alpha Time 1 Cronbach alpha Time 2
Subjective Norms .68 .66
Attitude .71 .78
aTime 1 = pre-intervention; Time 2 = post-intervention
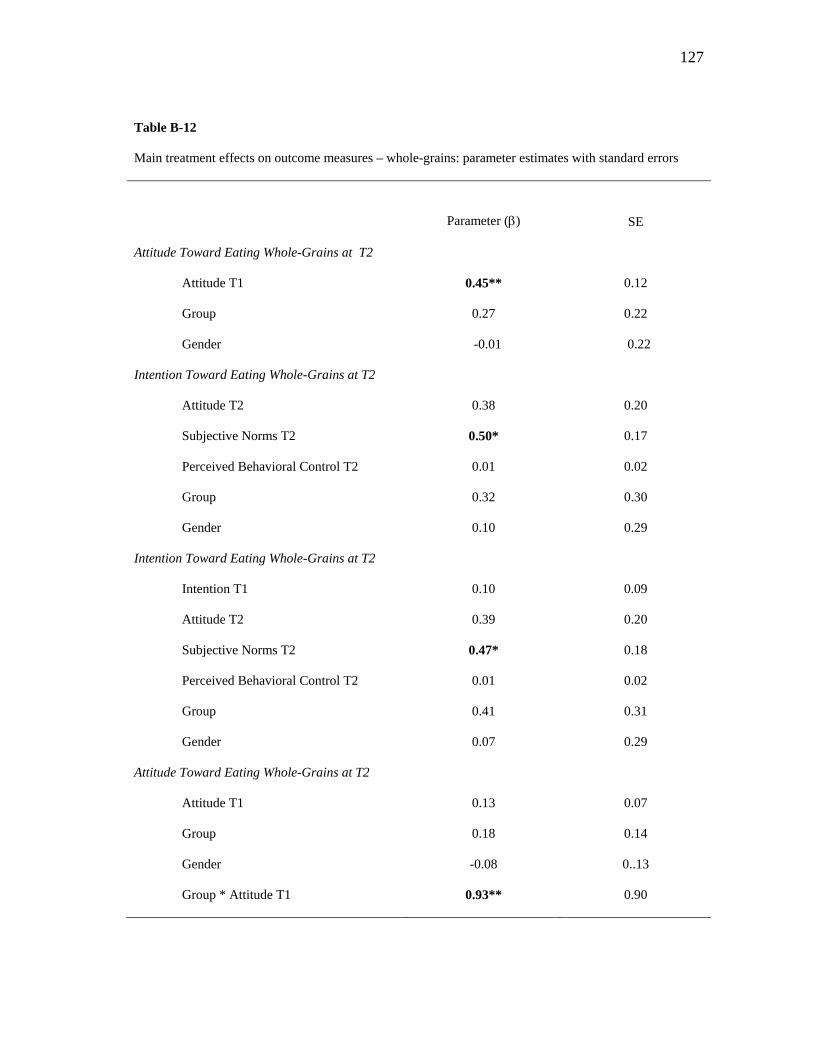
127
Table B-12
Main treatment effects on outcome measures – whole-grains: parameter estimates with standard errors
Parameter () SE
Attitude Toward Eating Whole-Grains at T2
Attitude T1
Group
Gender
0.45**
0.27
-0.01
0.12
0.22
0.22
Intention Toward Eating Whole-Grains at T2
Attitude T2
Subjective Norms T2
Perceived Behavioral Control T2
Group
Gender
0.38
0.50*
0.01
0.32
0.10
0.20
0.17
0.02
0.30
0.29
Intention Toward Eating Whole-Grains at T2
Intention T1
Attitude T2
Subjective Norms T2
Perceived Behavioral Control T2
Group
Gender
0.10
0.39
0.47*
0.01
0.41
0.07
0.09
0.20
0.18
0.02
0.31
0.29
Attitude Toward Eating Whole-Grains at T2
Attitude T1
Group
Gender
Group * Attitude T1
0.13
0.18
-0.08
0.93**
0.07
0.14
0..13
0.90
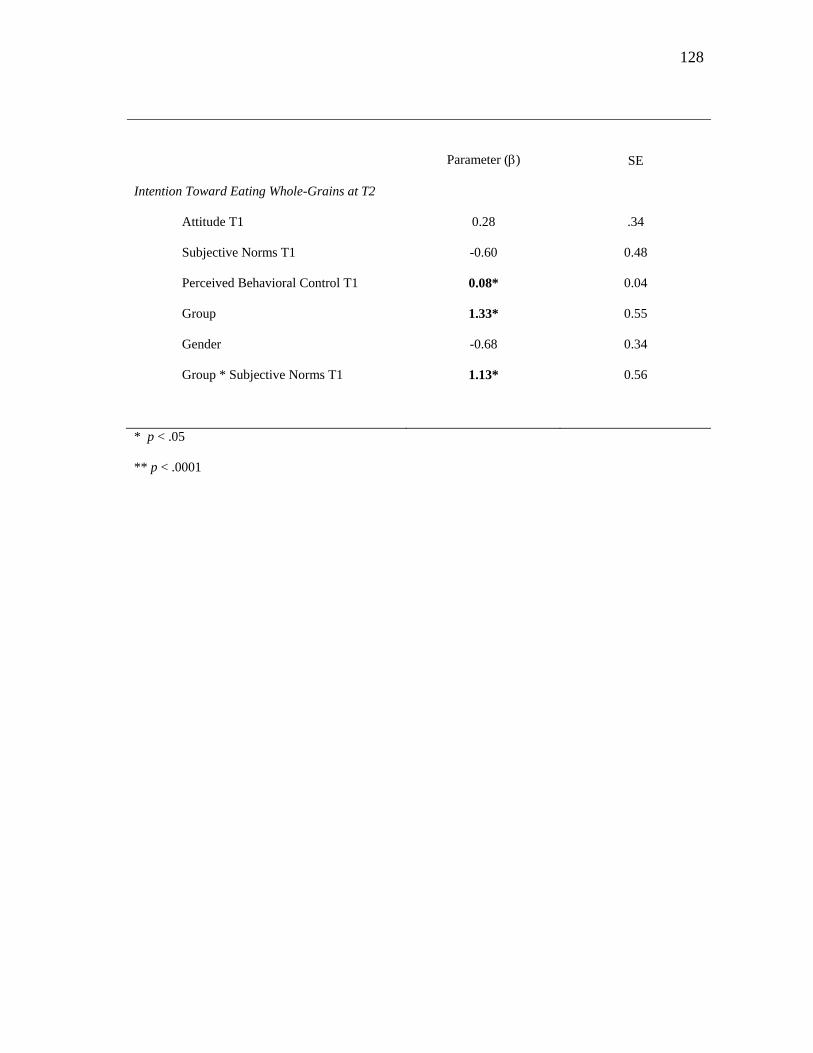
128
Parameter () SE
Intention Toward Eating Whole-Grains at T2
Attitude T1
Subjective Norms T1
Perceived Behavioral Control T1
Group
Gender
Group * Subjective Norms T1
0.28
-0.60
0.08*
1.33*
-0.68
1.13*
.34
0.48
0.04
0.55
0.34
0.56
* p < .05
** p < .0001

129
APPENDIX C
SURVEY INSTRUMENT
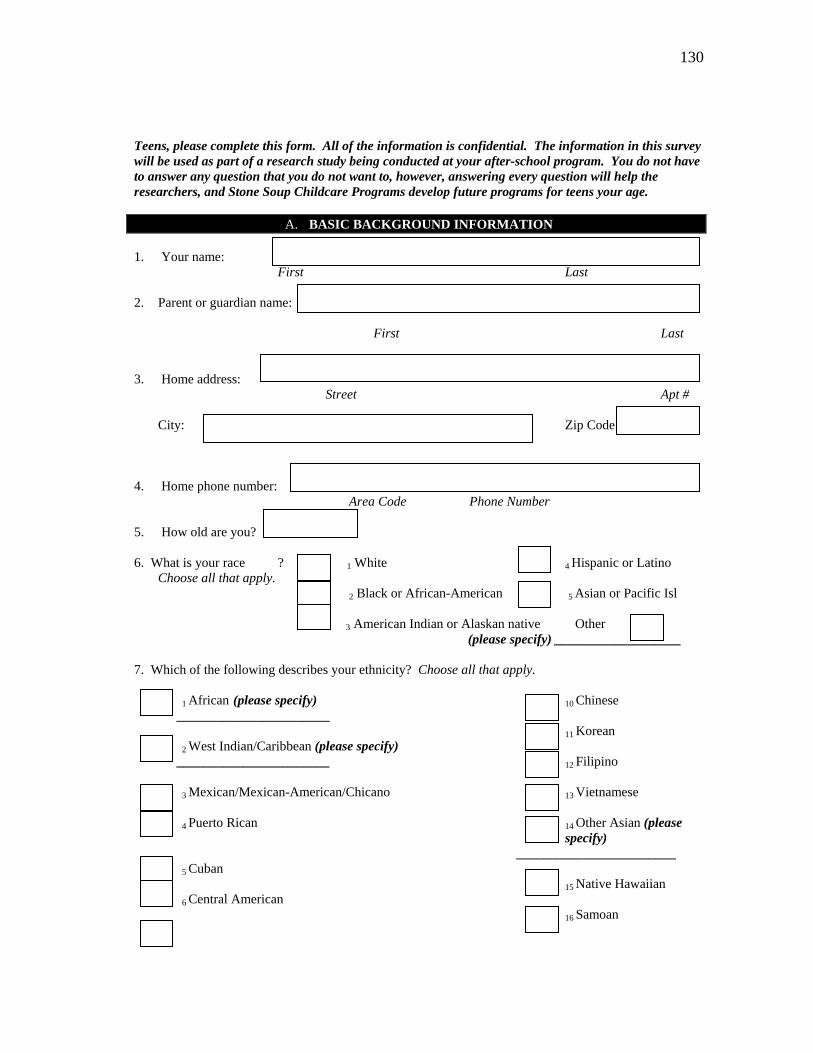
130
Teens, please complete this form. All of the information is confidential. The information in this survey will be used as part of a research study being conducted at your after-school program. You do not have to answer any question that you do not want to, however, answering every question will help the researchers, and Stone Soup Childcare Programs develop future programs for teens your age.
A. BASIC BACKGROUND INFORMATION 1. Your name:
First Last
2. Parent or guardian name: First Last
3. Home address: Street Apt #
City: Zip Code
4. Home phone number: Area Code Phone Number
5. How old are you?
6. What is your race ? 1 White 4 Hispanic or Latino
Choose all that apply. 2 Black or African-American 5 Asian or Pacific Isl
3 American Indian or Alaskan native Other (please specify) ___________________ 7. Which of the following describes your ethnicity? Choose all that apply. 1 African (please specify) 10 Chinese _______________________ 11 Korean 2 West Indian/Caribbean (please specify) _______________________ 12 Filipino 3 Mexican/Mexican-American/Chicano 13 Vietnamese 4 Puerto Rican 14 Other Asian (please
specify) ________________________ 5 Cuban 15 Native Hawaiian 6 Central American 16 Samoan

131
7 Other Latino/Hispanic (please specify) ____________________ 17 Tongan 8 Asian Indian 18Other (please specify): ________________________ 9 Japanese 19 NONE OF THE
ABOVE
B. TPB Survey
Teens, read each question and then circle the answer that best describes how you feel. There are no right or wrong answers.
Behavioral Intentions Extre
mely unlikely
Some‐what Likely
Very likely
1. I plan to eat breakfast every day.
A B C D E F G
2. I plan to drink 2% milk every day. A B C D E F G 3. I plan to drink 1% milk every day. A B C D E F G 4. I plan to drink skim every day. A B C D E F G 5. When I eat yogurt, I plan to choose
low‐fat yogurt every time. A B C D E F G 6. When I eat cheese, I plan to choose
low‐fat cheese every time. A B C D E F G 7. How likely is it that you will eat
breakfast every day? A B C D E F G 8. How likely is it that you will choose
2% milk? A B C D E F G 9. How likely is it that you will choose
1% milk? A B C D E F G 10. How likely is it that you will choose
skim milk? A B C D E F G 11. How likely is it that you will choose
low‐fat yogurt? A B C D E F G 12. How likely is it that you will choose
low‐fat cheese? A B C D E F G 13. How likely is it that you will choose
whole grains? A B C D E F G
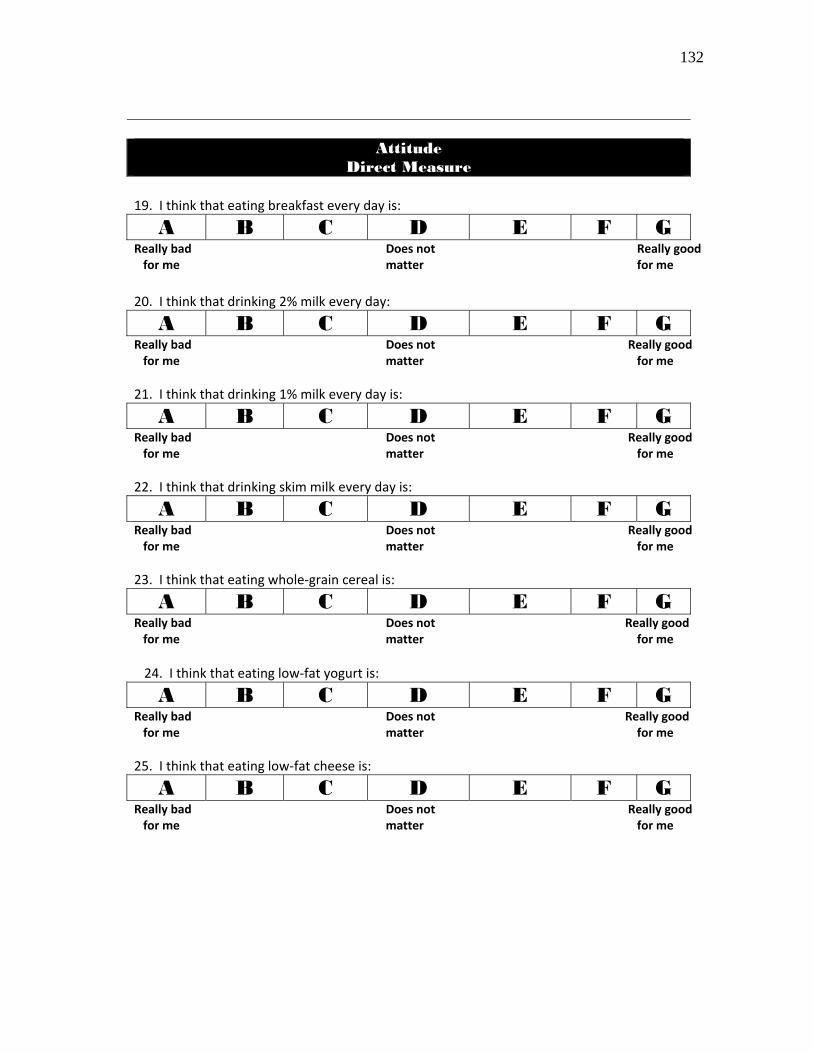
132
Attitude
Direct Measure 19. I think that eating breakfast every day is:
A B C D E F G Really bad Does not Really good for me matter for me
20. I think that drinking 2% milk every day:
A B C D E F G Really bad Does not Really good for me matter for me
21. I think that drinking 1% milk every day is:
A B C D E F G Really bad Does not Really good for me matter for me
22. I think that drinking skim milk every day is:
A B C D E F G Really bad Does not Really good for me matter for me
23. I think that eating whole‐grain cereal is:
A B C D E F G Really bad Does not Really good for me matter for me
\24. I think that eating low‐fat yogurt is:
A B C D E F G Really bad Does not Really good for me matter for me
25. I think that eating low‐fat cheese is:
A B C D E F G Really bad Does not Really good for me matter for me

133
Attitude Evaluation
Strongly
disagree
Do not agree or disagree
Strongly agree
26. I think that eating breakfast every day will provide important nutrients to my diet.
A B C D E F G 27. I think that eating breakfast every day will
help me to do better in school.A B C D E F G
28. I think that eating breakfast every day will help me maintain my body weight.
A B C D E F G 29. I think that eating breakfast every day will
help me perform better in sports (football, soccer, etc).
A B C D E F G
30. I think that eating breakfast every day will help me to get higher scores on tests.
A B C D E F G 31. I think that eating breakfast every day will
give me more energy while I am in school.A B C D E F G
32. I think that eating breakfast every day will help my jeans to fit better. A B C D E F G
33. I think that eating breakfast every day will make me healthier. A B C D E F G
34. I think that drinking 2% milk will make me healthier. A B C D E F G
35. I think that drinking 1% milk will make me healthier. A B C D E F G
36. I think that drinking skim milk will make me healthier. A B C D E F G
37. I think that eating low‐fat yogurt will make me healthier. A B C D E F G
38. I think that eating low‐fat cheese will make me healthier. A B C D E F G
39. I think that eating whole grain cereal will make me healthier. A B C D E F G
40. I think that drinking low fat milk will make my bones stronger. A B C D E F G
41. I think that drinking skim milk will make my bones stronger. A B C D E F G
42. I think that drinking milk every day will make me healthier. A B C D E F G
43. I think that eating and drinking low‐fat milk products will help me maintain my body weight.
A B C D E F G

134
Attitude Evaluation
Strongly
disagree
Do not agree or disagree
Strongly agree
44. I think eating breakfast will make me gain weight. A B C D E F G
45. I think skipping breakfast will make me gain weight. A B C D E F G
46. I think skipping breakfast will make me do worse on tests. A B C D E F G
47. I think choosing low‐fat milk products will help me to lose weight. A B C D E F G
48. I think that choosing whole‐grain cereals will help me to maintain my weight..
A B C D E F G
Subjective Norm Normative Belief
Strongly disagree
Do not agree or disagree
Strongly agree
49. My parents think it is important that I eat breakfast every day. A B C D E F G
50. I think it is important to do what my parents want me to do. A B C D E F G
51. My teachers think it is important that I eat breakfast every day. A B C D E F G
52. I think it is important to do what my teachers want me to do. A B C D E F G
53. My friends think it is important that I eat breakfast every day. A B C D E F G
54. I think it is important to do what my friends want me to do. A B C D E F G
55. My parents think it is important that I drink a glass of milk with every meal.
A B C D E F G 56. My teachers think it is important to
drink a glass of milk with every meal.A B C D E F G
57. My friends think it is important to drink a glass of milk with every meal.
A B C D E F G 58. My parents think it is important to drink
low‐fat or skim milk products instead of whole milk products.
A B C D E F G
59. My teachers think it is important to choose low‐fat/skim milk products instead of whole‐milk products.
A B C D E F G
60. My friends think it is important to choose low‐fat/skim milk products instead of whole‐milk products.
A B C D E F G

135
Subjective Norm Normative Belief
Strongly disagree
Do not agree or disagree
Strongly agree
61. My parents think it is important to choose whole‐grain cereals. A B C D E F G
62. My teachers think it is important to choose whole‐grain cereals. A B C D E F G
63. My friends think it is important to choose whole‐grain cereals. A B C D E F G
Perceived Behavioral Control Direct Measure
Not true at all
Neutral
Very true
64. I think it is up to me to eat breakfast every day. A B C D E F G
65. I think it is up to me to choose 1% milk. A B C D E F G 66. I think it is up to me to choose 2% milk. A B C D E F G 67. I think it is up to me to choose skim milk. A B C D E F G 68. I think it is up to me to choose whole‐
grain cereals. A B C D E F G Perceived Behavioral Control
Perceived Power
Not true at all
Neither true or false
Very
true
69. I think it is easy for me to eat breakfast every day. A B C D E F G
70. I think it is easy for me to drink a glass of milk with every meal. A B C D E F G
71. I think it is easy for me to choose low‐fat/skim milk products over whole‐milk products.
A B C D E F G
72. I think it is easy for me to choose whole‐grain cereals. A B C D E F G
C. FFQ/Availability Survey
1. How many times a day do you drink a glass of milk? Check all that apply.
Breakfast Lunch Dinner Snack
2. Milk is served with meals in my home.
Always Never Sometimes 3. During the past week, how many days did you eat breakfast?
A B C D E
1 2 3 4 5 6 7

136
APPENDIX D
PRINCIPAL COMPONENT ANALYSIS
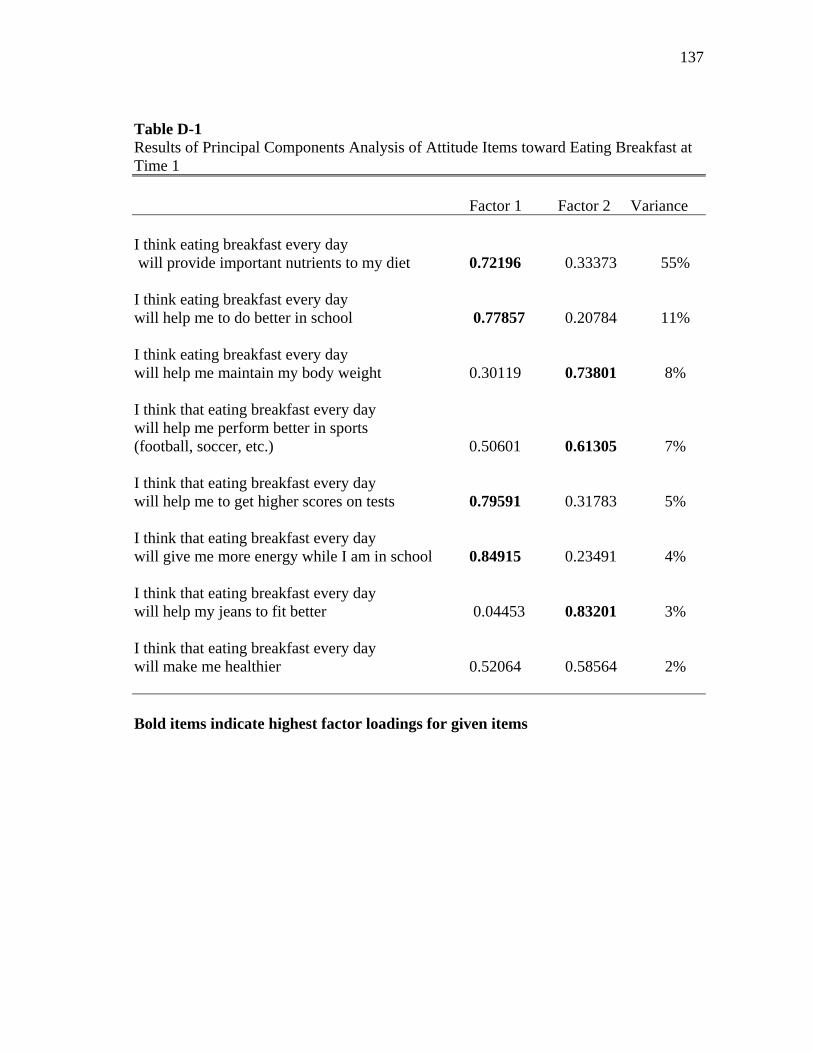
137
Table D-1 Results of Principal Components Analysis of Attitude Items toward Eating Breakfast at Time 1
Factor 1 Factor 2 Variance I think eating breakfast every day will provide important nutrients to my diet 0.72196 0.33373 55% I think eating breakfast every day will help me to do better in school 0.77857 0.20784 11% I think eating breakfast every day will help me maintain my body weight 0.30119 0.73801 8% I think that eating breakfast every day will help me perform better in sports (football, soccer, etc.) 0.50601 0.61305 7% I think that eating breakfast every day will help me to get higher scores on tests 0.79591 0.31783 5% I think that eating breakfast every day will give me more energy while I am in school 0.84915 0.23491 4% I think that eating breakfast every day will help my jeans to fit better 0.04453 0.83201 3% I think that eating breakfast every day will make me healthier 0.52064 0.58564 2% Bold items indicate highest factor loadings for given items
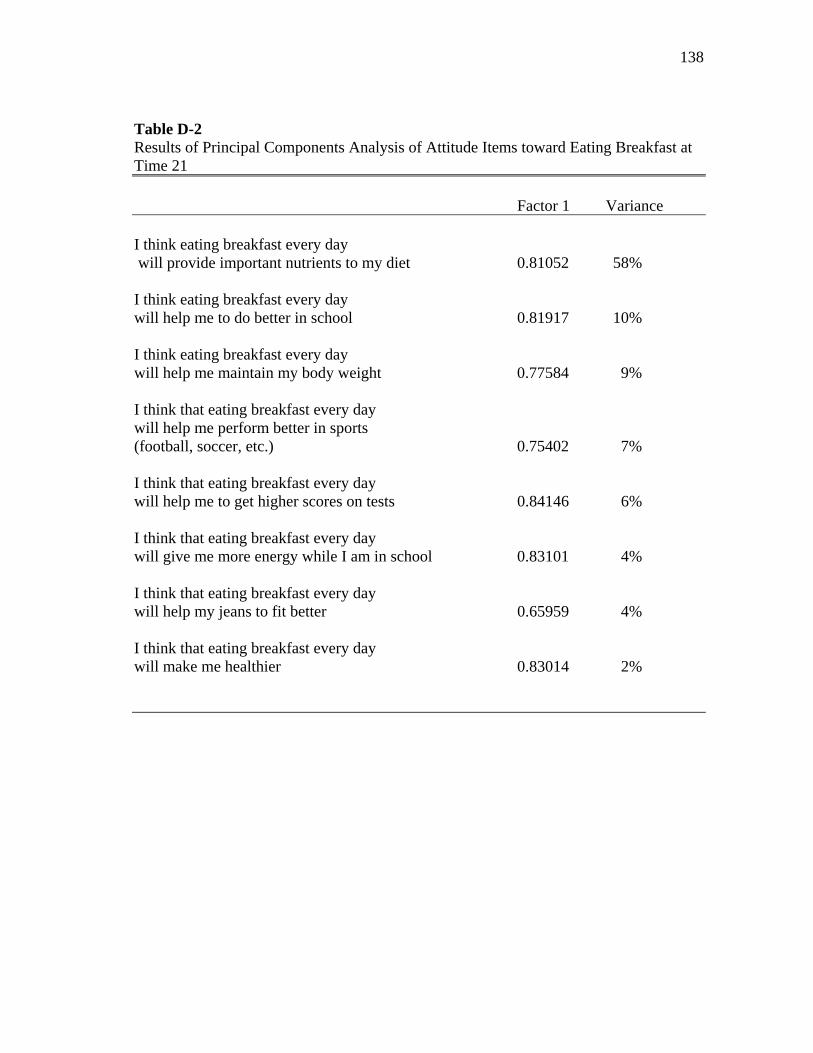
138
Table D-2 Results of Principal Components Analysis of Attitude Items toward Eating Breakfast at Time 21
Factor 1 Variance I think eating breakfast every day will provide important nutrients to my diet 0.81052 58% I think eating breakfast every day will help me to do better in school 0.81917 10% I think eating breakfast every day will help me maintain my body weight 0.77584 9% I think that eating breakfast every day will help me perform better in sports (football, soccer, etc.) 0.75402 7% I think that eating breakfast every day will help me to get higher scores on tests 0.84146 6% I think that eating breakfast every day will give me more energy while I am in school 0.83101 4% I think that eating breakfast every day will help my jeans to fit better 0.65959 4% I think that eating breakfast every day will make me healthier 0.83014 2%
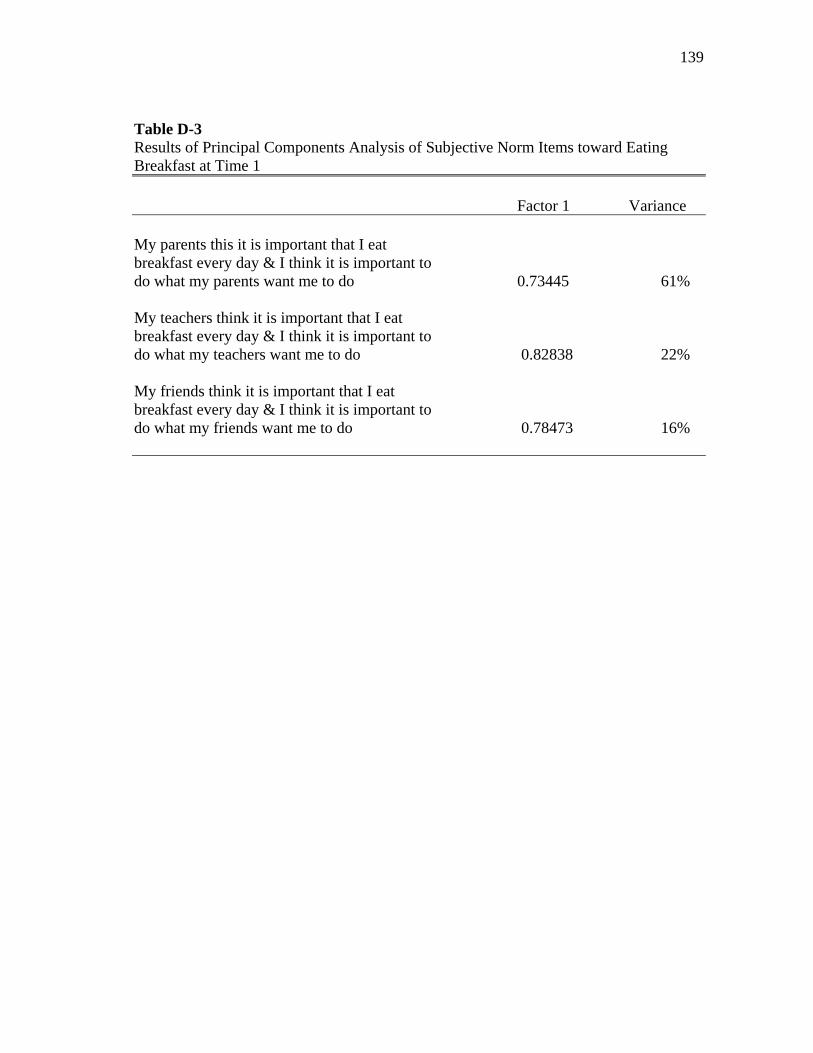
139
Table D-3 Results of Principal Components Analysis of Subjective Norm Items toward Eating Breakfast at Time 1
Factor 1 Variance My parents this it is important that I eat breakfast every day & I think it is important to do what my parents want me to do 0.73445 61% My teachers think it is important that I eat breakfast every day & I think it is important to do what my teachers want me to do 0.82838 22% My friends think it is important that I eat breakfast every day & I think it is important to do what my friends want me to do 0.78473 16%

140
Table D-4 Results of Principal Components Analysis of Subjective Norm Items toward Eating Breakfast at Time
Factor 1 Variance My parents this it is important that I eat breakfast every day & I think it is important to do what my parents want me to do 0.81921 61% My teachers think it is important that I eat breakfast every day & I think it is important to do what my teachers want me to do 0.91453 29% My friends think it is important that I eat breakfast every day & I think it is important to do what my friends want me to do 0.57098 10%
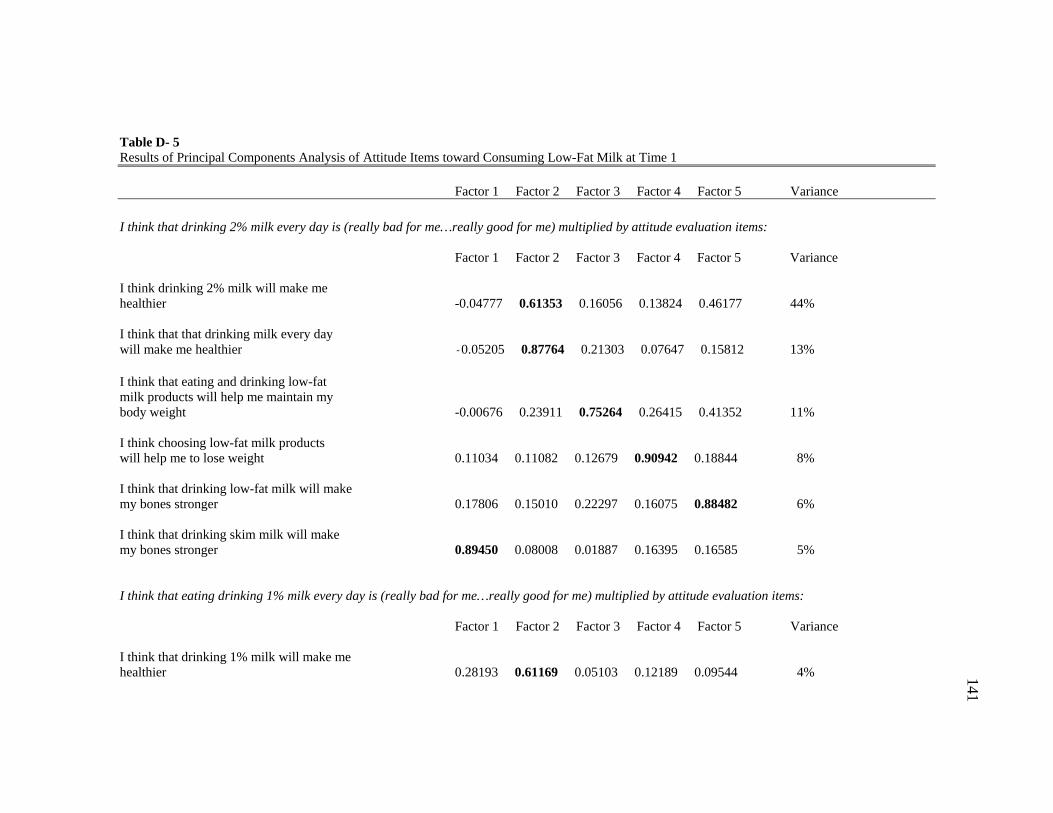
141
Table D- 5 Results of Principal Components Analysis of Attitude Items toward Consuming Low-Fat Milk at Time 1
Factor 1 Factor 2 Factor 3 Factor 4 Factor 5 Variance
I think that drinking 2% milk every day is (really bad for me…really good for me) multiplied by attitude evaluation items:
Factor 1 Factor 2 Factor 3 Factor 4 Factor 5 Variance I think drinking 2% milk will make me healthier -0.04777 0.61353 0.16056 0.13824 0.46177 44% I think that that drinking milk every day will make me healthier -0.05205 0.87764 0.21303 0.07647 0.15812 13% I think that eating and drinking low-fat milk products will help me maintain my body weight -0.00676 0.23911 0.75264 0.26415 0.41352 11% I think choosing low-fat milk products will help me to lose weight 0.11034 0.11082 0.12679 0.90942 0.18844 8% I think that drinking low-fat milk will make my bones stronger 0.17806 0.15010 0.22297 0.16075 0.88482 6% I think that drinking skim milk will make my bones stronger 0.89450 0.08008 0.01887 0.16395 0.16585 5% I think that eating drinking 1% milk every day is (really bad for me…really good for me) multiplied by attitude evaluation items:
Factor 1 Factor 2 Factor 3 Factor 4 Factor 5 Variance
I think that drinking 1% milk will make me healthier 0.28193 0.61169 0.05103 0.12189 0.09544 4%
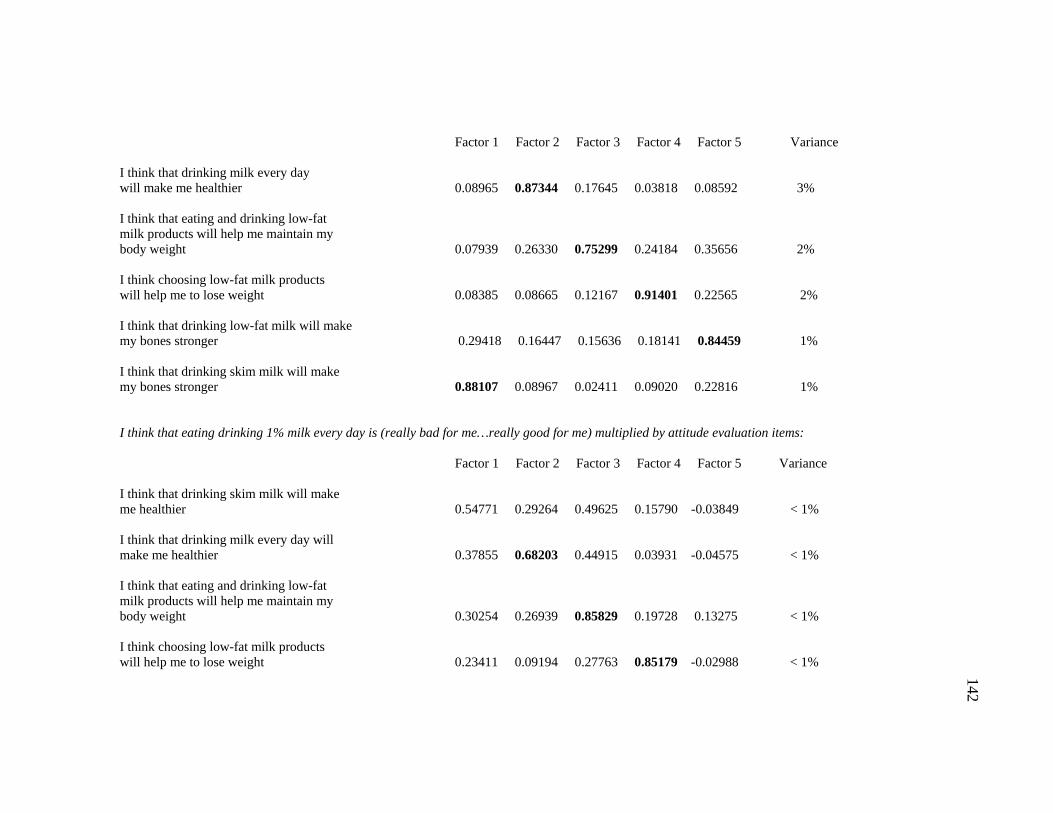
142
Factor 1 Factor 2 Factor 3 Factor 4 Factor 5 Variance I think that drinking milk every day will make me healthier 0.08965 0.87344 0.17645 0.03818 0.08592 3% I think that eating and drinking low-fat milk products will help me maintain my body weight 0.07939 0.26330 0.75299 0.24184 0.35656 2%
I think choosing low-fat milk products will help me to lose weight 0.08385 0.08665 0.12167 0.91401 0.22565 2% I think that drinking low-fat milk will make my bones stronger 0.29418 0.16447 0.15636 0.18141 0.84459 1% I think that drinking skim milk will make my bones stronger 0.88107 0.08967 0.02411 0.09020 0.22816 1% I think that eating drinking 1% milk every day is (really bad for me…really good for me) multiplied by attitude evaluation items:
Factor 1 Factor 2 Factor 3 Factor 4 Factor 5 Variance I think that drinking skim milk will make me healthier 0.54771 0.29264 0.49625 0.15790 -0.03849 < 1% I think that drinking milk every day will make me healthier 0.37855 0.68203 0.44915 0.03931 -0.04575 < 1% I think that eating and drinking low-fat milk products will help me maintain my body weight 0.30254 0.26939 0.85829 0.19728 0.13275 < 1% I think choosing low-fat milk products will help me to lose weight 0.23411 0.09194 0.27763 0.85179 -0.02988 < 1%
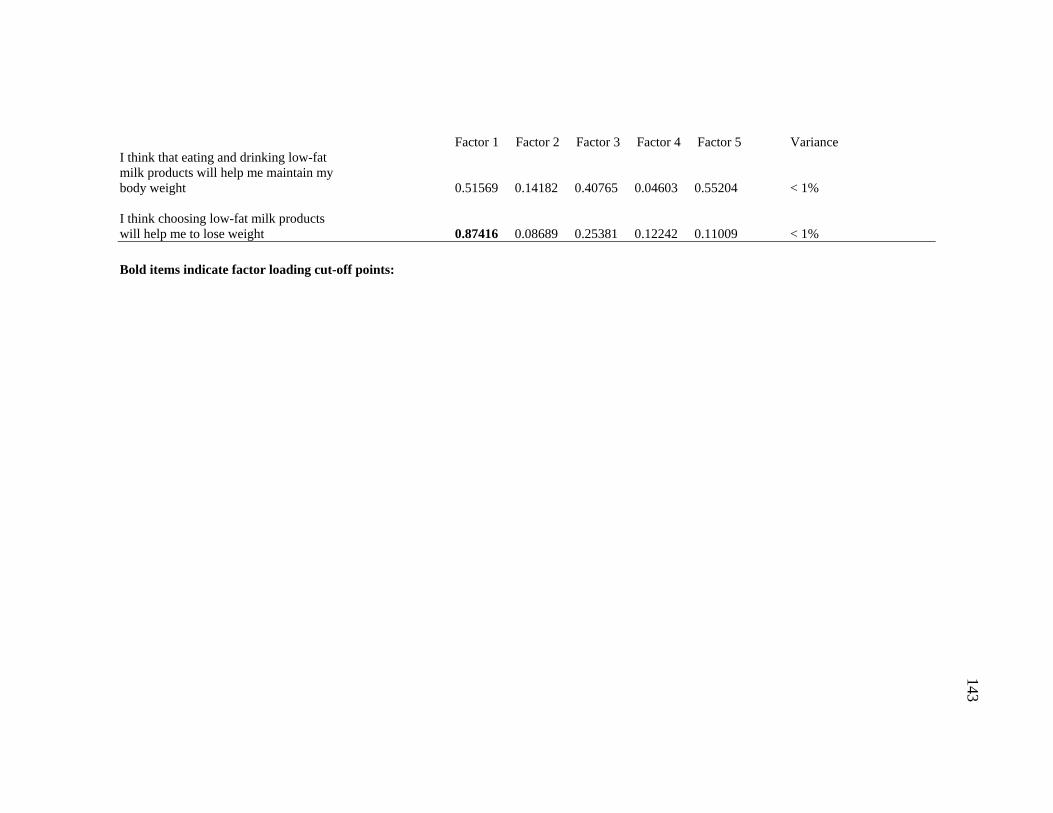
143
Factor 1 Factor 2 Factor 3 Factor 4 Factor 5 Variance I think that eating and drinking low-fat milk products will help me maintain my body weight 0.51569 0.14182 0.40765 0.04603 0.55204 < 1% I think choosing low-fat milk products will help me to lose weight 0.87416 0.08689 0.25381 0.12242 0.11009 < 1%
Bold items indicate factor loading cut-off points:
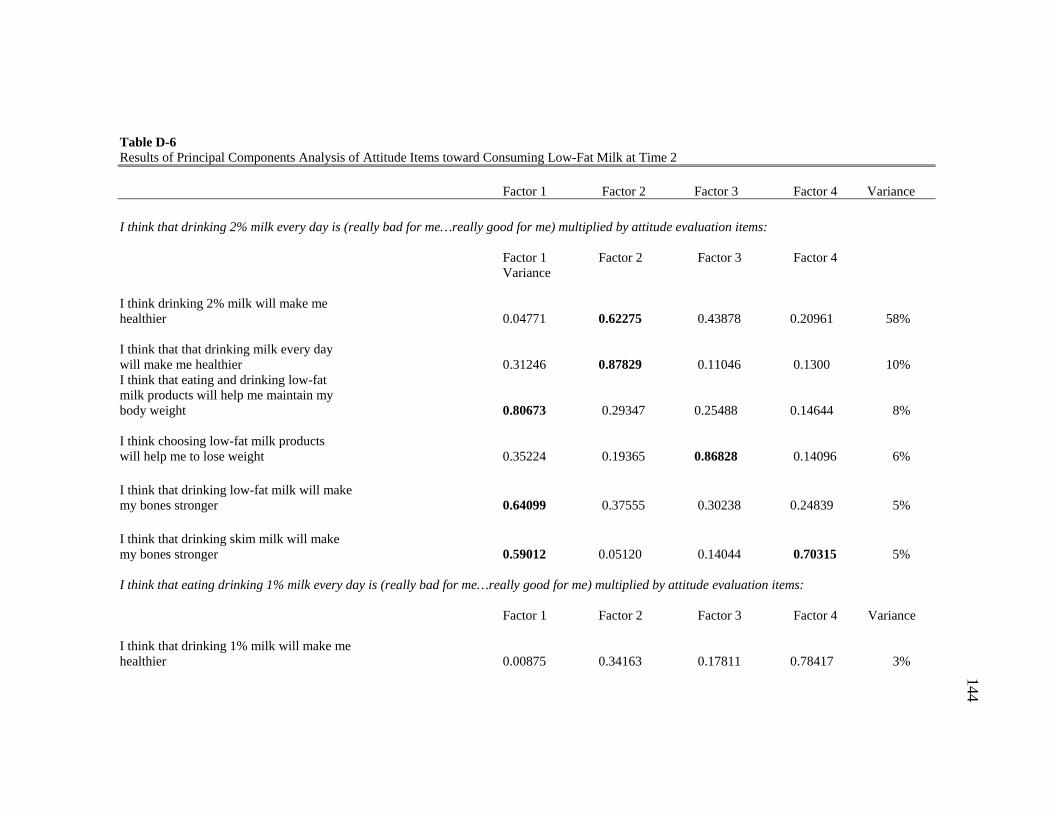
144
Table D-6 Results of Principal Components Analysis of Attitude Items toward Consuming Low-Fat Milk at Time 2
Factor 1 Factor 2 Factor 3 Factor 4 Variance
I think that drinking 2% milk every day is (really bad for me…really good for me) multiplied by attitude evaluation items:
Factor 1 Factor 2 Factor 3 Factor 4 Variance
I think drinking 2% milk will make me healthier 0.04771 0.62275 0.43878 0.20961 58% I think that that drinking milk every day will make me healthier 0.31246 0.87829 0.11046 0.1300 10% I think that eating and drinking low-fat milk products will help me maintain my body weight 0.80673 0.29347 0.25488 0.14644 8% I think choosing low-fat milk products will help me to lose weight 0.35224 0.19365 0.86828 0.14096 6% I think that drinking low-fat milk will make my bones stronger 0.64099 0.37555 0.30238 0.24839 5% I think that drinking skim milk will make my bones stronger 0.59012 0.05120 0.14044 0.70315 5% I think that eating drinking 1% milk every day is (really bad for me…really good for me) multiplied by attitude evaluation items:
Factor 1 Factor 2 Factor 3 Factor 4 Variance
I think that drinking 1% milk will make me healthier 0.00875 0.34163 0.17811 0.78417 3%
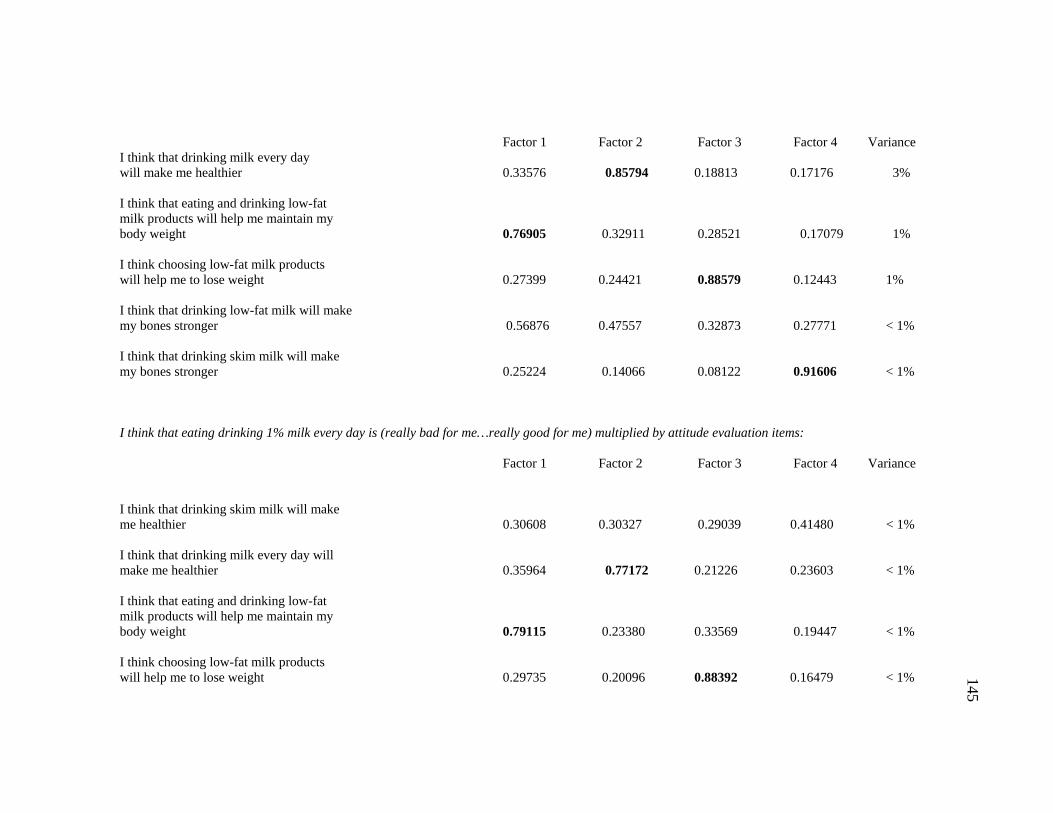
145
Factor 1 Factor 2 Factor 3 Factor 4 Variance I think that drinking milk every day will make me healthier 0.33576 0.85794 0.18813 0.17176 3% I think that eating and drinking low-fat milk products will help me maintain my body weight 0.76905 0.32911 0.28521 0.17079 1% I think choosing low-fat milk products will help me to lose weight 0.27399 0.24421 0.88579 0.12443 1% I think that drinking low-fat milk will make my bones stronger 0.56876 0.47557 0.32873 0.27771 < 1% I think that drinking skim milk will make my bones stronger 0.25224 0.14066 0.08122 0.91606 < 1% I think that eating drinking 1% milk every day is (really bad for me…really good for me) multiplied by attitude evaluation items:
Factor 1 Factor 2 Factor 3 Factor 4 Variance I think that drinking skim milk will make me healthier 0.30608 0.30327 0.29039 0.41480 < 1% I think that drinking milk every day will make me healthier 0.35964 0.77172 0.21226 0.23603 < 1% I think that eating and drinking low-fat milk products will help me maintain my body weight 0.79115 0.23380 0.33569 0.19447 < 1% I think choosing low-fat milk products will help me to lose weight 0.29735 0.20096 0.88392 0.16479 < 1%
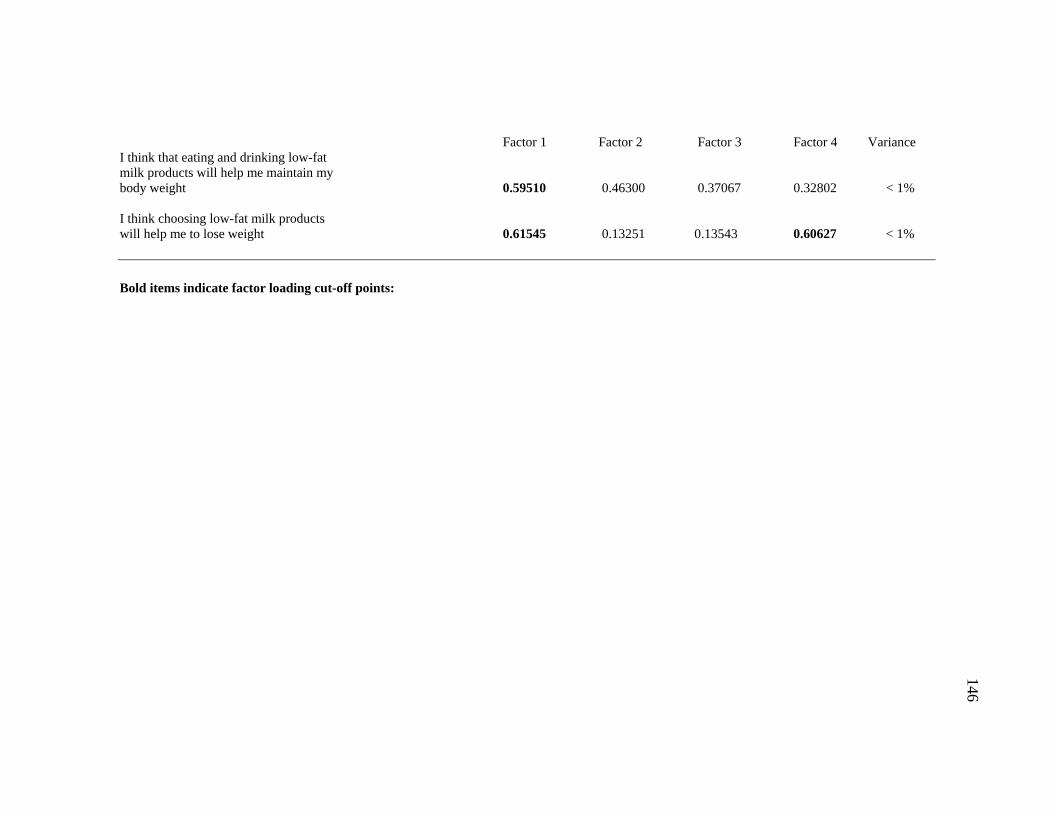
146
Factor 1 Factor 2 Factor 3 Factor 4 Variance I think that eating and drinking low-fat milk products will help me maintain my body weight 0.59510 0.46300 0.37067 0.32802 < 1% I think choosing low-fat milk products will help me to lose weight 0.61545 0.13251 0.13543 0.60627 < 1% Bold items indicate factor loading cut-off points:
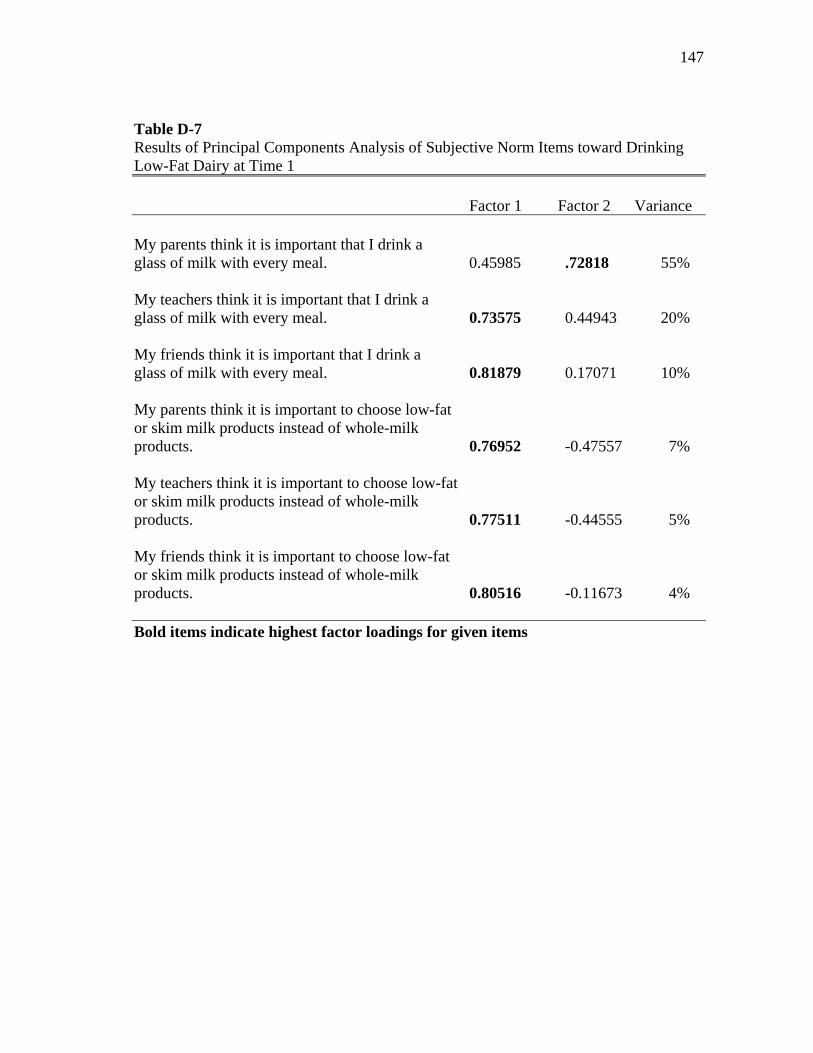
147
Table D-7 Results of Principal Components Analysis of Subjective Norm Items toward Drinking Low-Fat Dairy at Time 1
Factor 1 Factor 2 Variance My parents think it is important that I drink a glass of milk with every meal. 0.45985 .72818 55% My teachers think it is important that I drink a glass of milk with every meal. 0.73575 0.44943 20% My friends think it is important that I drink a glass of milk with every meal. 0.81879 0.17071 10% My parents think it is important to choose low-fat or skim milk products instead of whole-milk products. 0.76952 -0.47557 7% My teachers think it is important to choose low-fat or skim milk products instead of whole-milk products. 0.77511 -0.44555 5% My friends think it is important to choose low-fat or skim milk products instead of whole-milk products. 0.80516 -0.11673 4% Bold items indicate highest factor loadings for given items
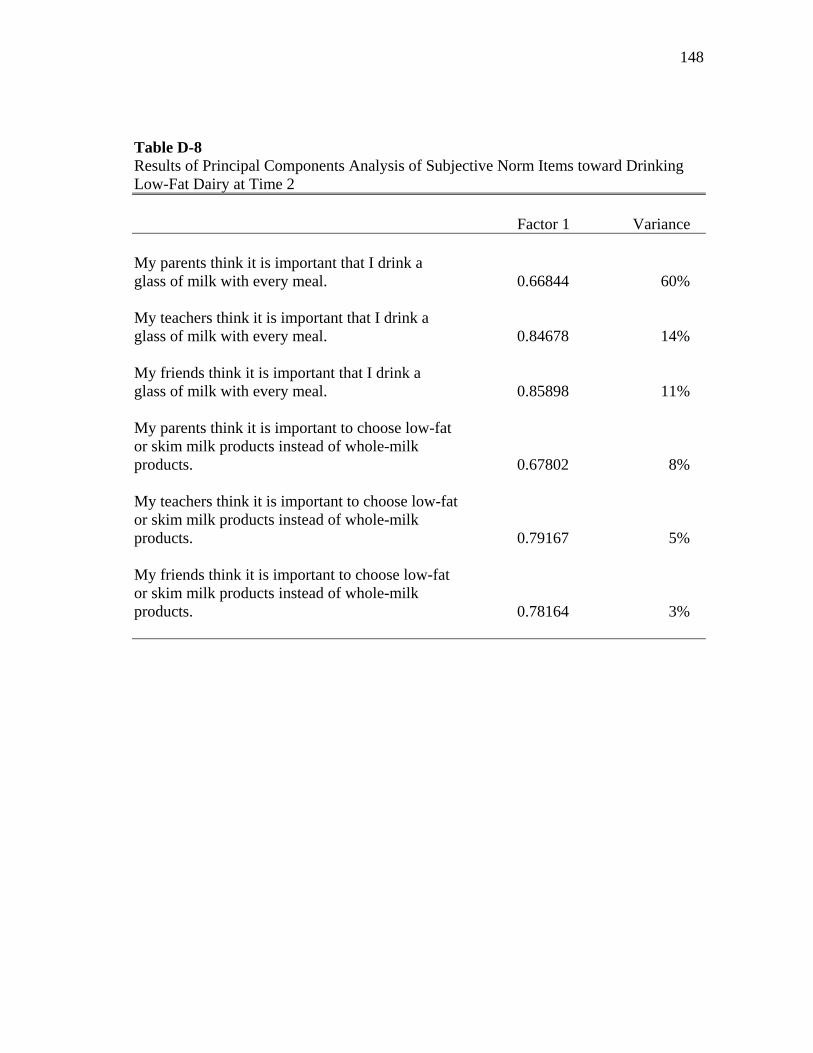
148
Table D-8 Results of Principal Components Analysis of Subjective Norm Items toward Drinking Low-Fat Dairy at Time 2
Factor 1 Variance My parents think it is important that I drink a glass of milk with every meal. 0.66844 60% My teachers think it is important that I drink a glass of milk with every meal. 0.84678 14% My friends think it is important that I drink a glass of milk with every meal. 0.85898 11% My parents think it is important to choose low-fat or skim milk products instead of whole-milk products. 0.67802 8% My teachers think it is important to choose low-fat or skim milk products instead of whole-milk products. 0.79167 5% My friends think it is important to choose low-fat or skim milk products instead of whole-milk products. 0.78164 3%

149
Table D-9 Results of Principal Components Analysis of Attitude Items toward Consuming Low-Fat Cheese at Time 1
Factor 1 Variance I think eating low-fat cheese is “really good… really bad for me” 0.74499 58% I think eating low-fat cheese will make me healthier 0.84198 19% I think eating and drinking low-fat milk products will help me maintain my body weight 0.79447 13% I think choosing low-fat milk products will help me lose weight 0.65758 10%
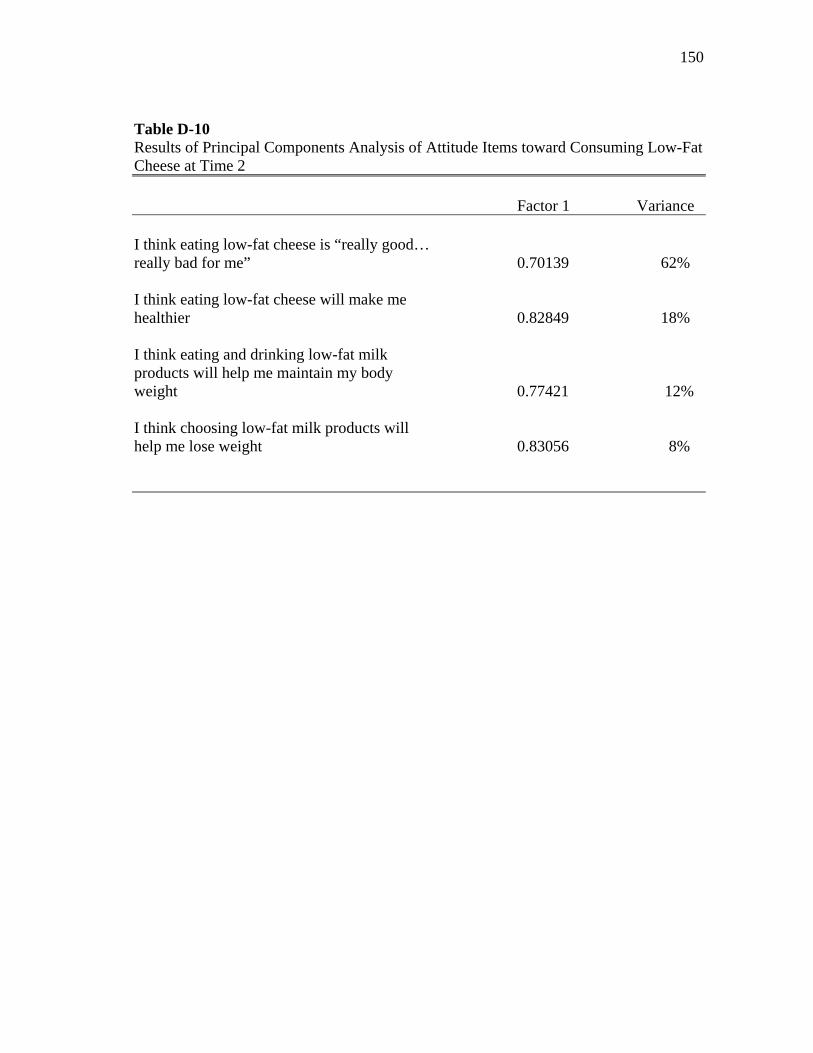
150
Table D-10 Results of Principal Components Analysis of Attitude Items toward Consuming Low-Fat Cheese at Time 2
Factor 1 Variance I think eating low-fat cheese is “really good… really bad for me” 0.70139 62% I think eating low-fat cheese will make me healthier 0.82849 18% I think eating and drinking low-fat milk products will help me maintain my body weight 0.77421 12% I think choosing low-fat milk products will help me lose weight 0.83056 8%

151
Table D-11 Results of Principal Components Analysis of Attitude Items toward Consuming Low-Fat Yogurt at Time 1
Factor 1 Variance I think eating low-fat yogurt is “really good… really bad for me” 0.77082 58% I think eating low-fat yogurt will make me healthier 0.80419 17% I think eating and drinking low-fat milk products will help me maintain my body weight 0.74074 14% I think choosing low-fat milk products will help me lose weight 0.70443 11%
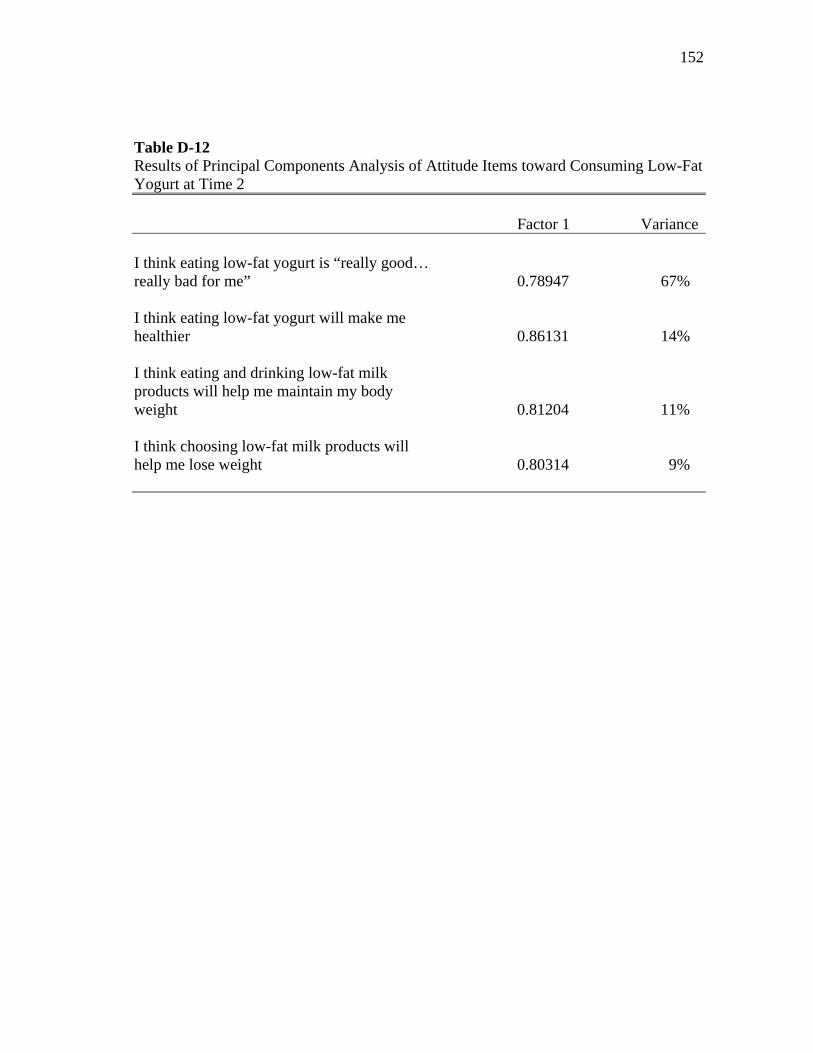
152
Table D-12 Results of Principal Components Analysis of Attitude Items toward Consuming Low-Fat Yogurt at Time 2
Factor 1 Variance I think eating low-fat yogurt is “really good… really bad for me” 0.78947 67% I think eating low-fat yogurt will make me healthier 0.86131 14% I think eating and drinking low-fat milk products will help me maintain my body weight 0.81204 11% I think choosing low-fat milk products will help me lose weight 0.80314 9%

153
Table D-13 Results of Principal Components Analysis of Subjective Norm Items toward Consuming Whole-Grains at Time 1
Factor 1 Variance My parents think it is important to choose whole-grain cereals and it is important to me to do what my parents want 0.83031 65% My teachers think it is important to choose whole-grain cereals and it is important to me to do what my teachers want 0.88057 24% My friends think it is important to choose whole-grain cereals and it is important to me to do what my friends want 0.68896 12%

154
Table D-14 Results of Principal Components Analysis of Subjective Norm Items toward Consuming Whole-Grains at Time 1
Factor 1 Variance My parents think it is important to choose whole-grain cereals and it is important to me to do what my parents want 0.83031 65% My teachers think it is important to choose whole-grain cereals and it is important to me to do what my teachers want 0.88057 24% My friends think it is important to choose whole-grain cereals and it is important to me to do what my friends want 0.68896 12%
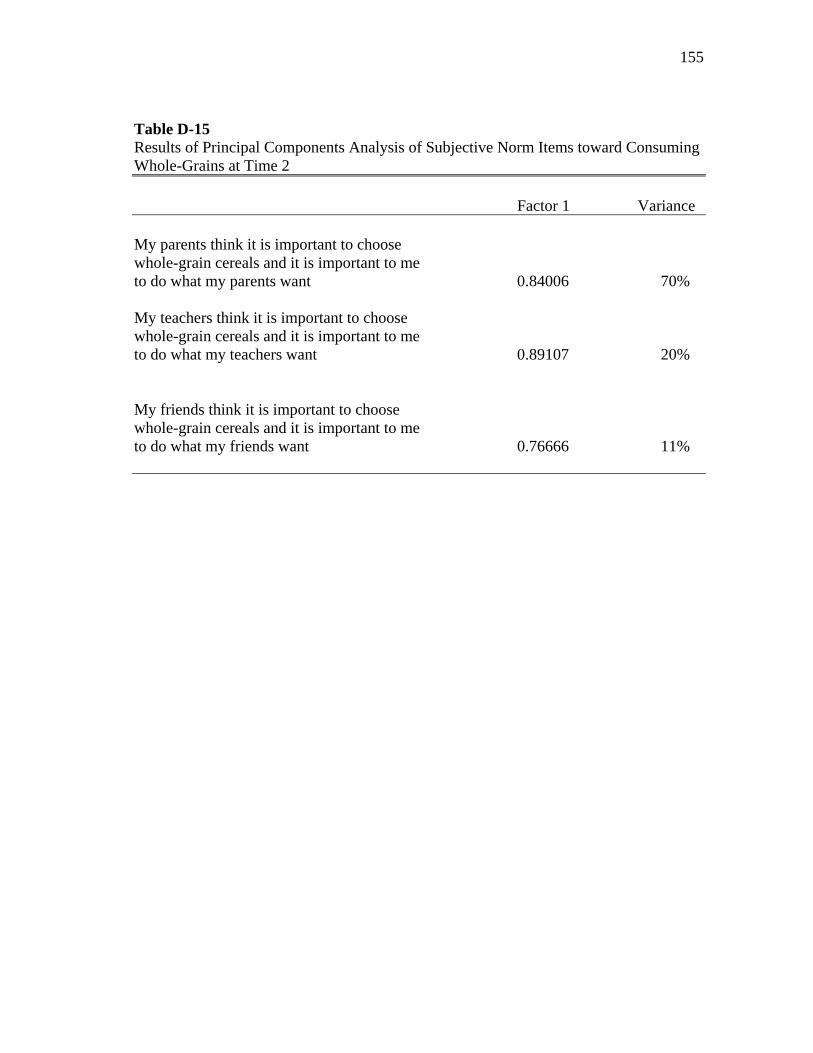
155
Table D-15 Results of Principal Components Analysis of Subjective Norm Items toward Consuming Whole-Grains at Time 2
Factor 1 Variance My parents think it is important to choose whole-grain cereals and it is important to me to do what my parents want 0.84006 70% My teachers think it is important to choose whole-grain cereals and it is important to me to do what my teachers want 0.89107 20% My friends think it is important to choose whole-grain cereals and it is important to me to do what my friends want 0.76666 11%

156
Table D-16 Results of Principal Components Analysis of Attitude Items toward Consuming Whole-Grains at Time 1
Factor 1 Variance I think eating whole-grain cereal will make me healthier 0.88016 77% I think choosing whole-grain cereal will help me to maintain my weight 0.88016 23%
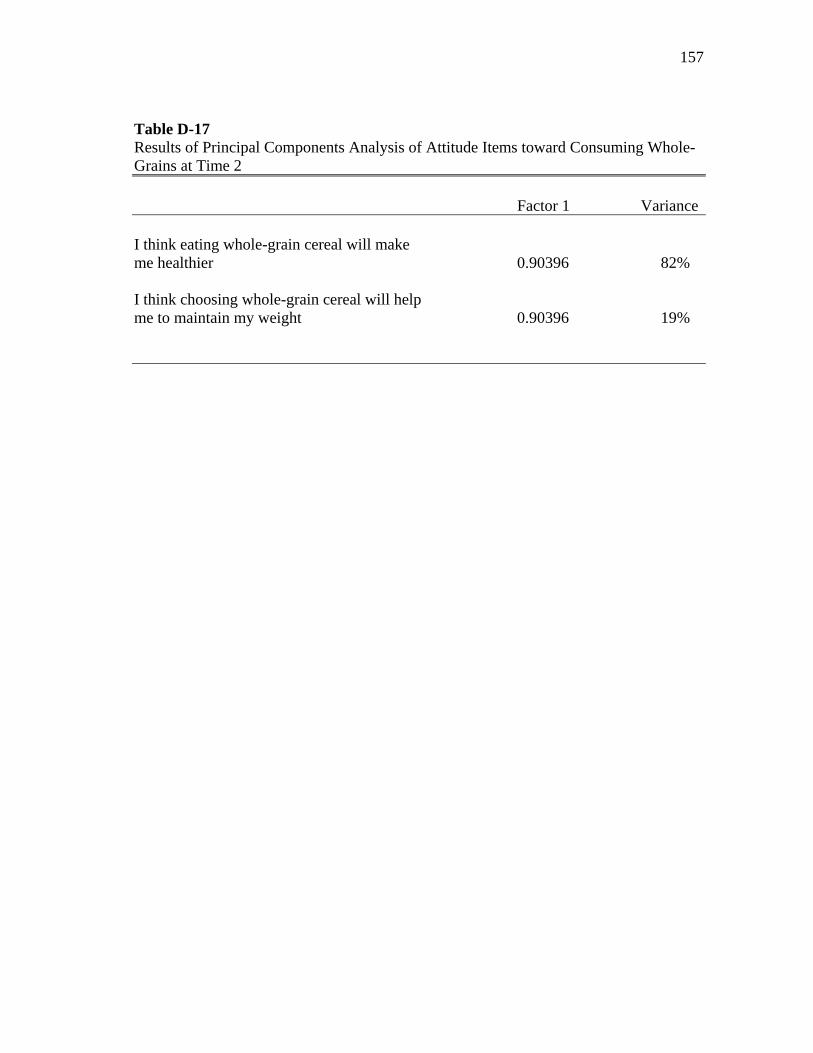
157
Table D-17 Results of Principal Components Analysis of Attitude Items toward Consuming Whole-Grains at Time 2
Factor 1 Variance I think eating whole-grain cereal will make me healthier 0.90396 82% I think choosing whole-grain cereal will help me to maintain my weight 0.90396 19%

158
APPENDIX E
VARIABLE SCORING KEY
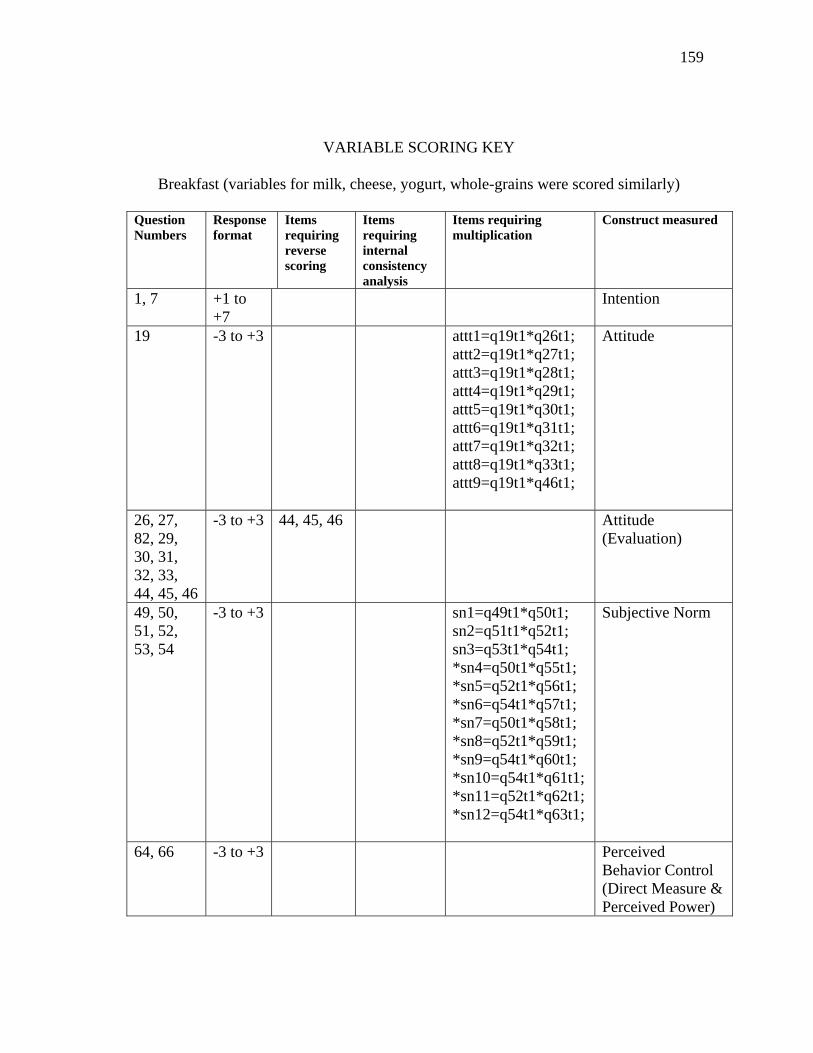
159
VARIABLE SCORING KEY
Breakfast (variables for milk, cheese, yogurt, whole-grains were scored similarly)
Question Numbers
Response format
Items requiring reverse scoring
Items requiring internal consistency analysis
Items requiring multiplication
Construct measured
1, 7 +1 to +7
Intention
19 -3 to +3 attt1=q19t1*q26t1; attt2=q19t1*q27t1; attt3=q19t1*q28t1; attt4=q19t1*q29t1; attt5=q19t1*q30t1; attt6=q19t1*q31t1; attt7=q19t1*q32t1; attt8=q19t1*q33t1; attt9=q19t1*q46t1;
Attitude
26, 27, 82, 29, 30, 31, 32, 33, 44, 45, 46
-3 to +3 44, 45, 46 Attitude (Evaluation)
49, 50, 51, 52, 53, 54
-3 to +3 sn1=q49t1*q50t1; sn2=q51t1*q52t1; sn3=q53t1*q54t1; *sn4=q50t1*q55t1; *sn5=q52t1*q56t1; *sn6=q54t1*q57t1; *sn7=q50t1*q58t1; *sn8=q52t1*q59t1; *sn9=q54t1*q60t1; *sn10=q54t1*q61t1; *sn11=q52t1*q62t1; *sn12=q54t1*q63t1;
Subjective Norm
64, 66 -3 to +3 Perceived Behavior Control (Direct Measure & Perceived Power)
160
VITA
Diane Elizabeth Carson received her Bachelor of Science degree in dietetics and
biology (minor) from California State University, Sacrament in 1997. She entered the
Master of Science program at California State University, Long Beach in August 1997
and received her Master of Science degree in Nutritional Sciences May 2000. She
entered the doctoral program in Nutrition at Texas A&M University in January 2006 and
received her PhD in May 2010. Her research interests include developing nutrition
education interventions using health behavior theory models to improve nutritional
habits among children, adolescents, and adults.
Ms. Carson can be reached at Intercollegiate Faculty of Nutrition, 2253 TAMU,
College Station, TX 77843-2253, 338 Kleberg Center. Her email is [email protected]