In Central Obesity, Weight Loss Restores Platelet Sensitivity to Nitric Oxide and Prostacyclin

David John Hume (Ph.D Candidate) MRC/UCT Research Unit for Exercise Science and Sports Medicine, Department of Human
Biology, Faculty of Health Sciences, University of Cape Town
Mind the Gap: Electroencephalographic record of brain reactivity to visual food cues is different in successful and unsuccessful dieters

WEIGHT RELAPSE
of those who successfully lose weight return to their starting weight at one year follow-up
(Kraschnewski et al., 2010)

Can food be • The global rise in overweight and obesity coincides with the increased availability of highly palatable foods (Popkin, 2001; Swinburn et al., 2011)
• The same neural circuits become activated during substance abuse and during hedonic eating (J. Blundell, Coe, & Hooper, 2014; Hone-Blanchet & Fecteau, 2014)
• The neural substrates of sugar and sweet reward have been shown to foster drug addiction-like dependencies (Ahmed, Guillem, & Vandaele, 2013)
• Does one’s propensity for weight relapse relate to how one’s brain reacts to environmental food cues?
addictive?

Electroencephalography (EEG) • Reflects changes in electrical activity (microvolts/µV) as
sourced via electrodes placed along the scalp’s surface • Neurophysiological activity of the brain’s neural circuitry
(Schomer & Da Silva, 2012)
• Provides high resolution, time-locked changes in cortical activity (milliseconds/ms) (Anderson et al., 2011; Polich, 2007; Sokolov, 1963; Whiting, Shtyrov, & Marslen-Wilson, 2014)
• Two different types data can be extracted from a raw electroencephalograph: – Spectral band power or frequency activity – Event-related potentials (ERPs)

EEG Frequency explained
Incre
ased
cortic
al ac
tivity
Beta (15–30 Hz)
Alpha (7–14 Hz)
Theta (4–7 Hz)
Delta (0.01-4Hz)
Raw EEG signal:
Indicates: cortical arousal or the state of “wakefulness”
EEG Frequency explained
Beta (15–30 Hz)
Alpha (7–14 Hz)
Theta (4–7 Hz)
Delta (0.01-4Hz)
Raw EEG signal:
Indicates: cortical arousal or the state of “wakefulness”
Anticipatory visual alertness
Activation of neural reward circuitry

CONSCIOUS ATTENTIONAL PROCESSING AND MOTIVATED BEHAVIOUR
SUBLIMINAL ATTENTIONAL PROCESSING
Event-related potentials (ERPs) explained
LPP
P300
P200
N100
l
l
MEMORY RECOGNITION AND CORTICAL UPDATING
EARLY SENSORY GATING
Attentional Processing of Visual Food Cues
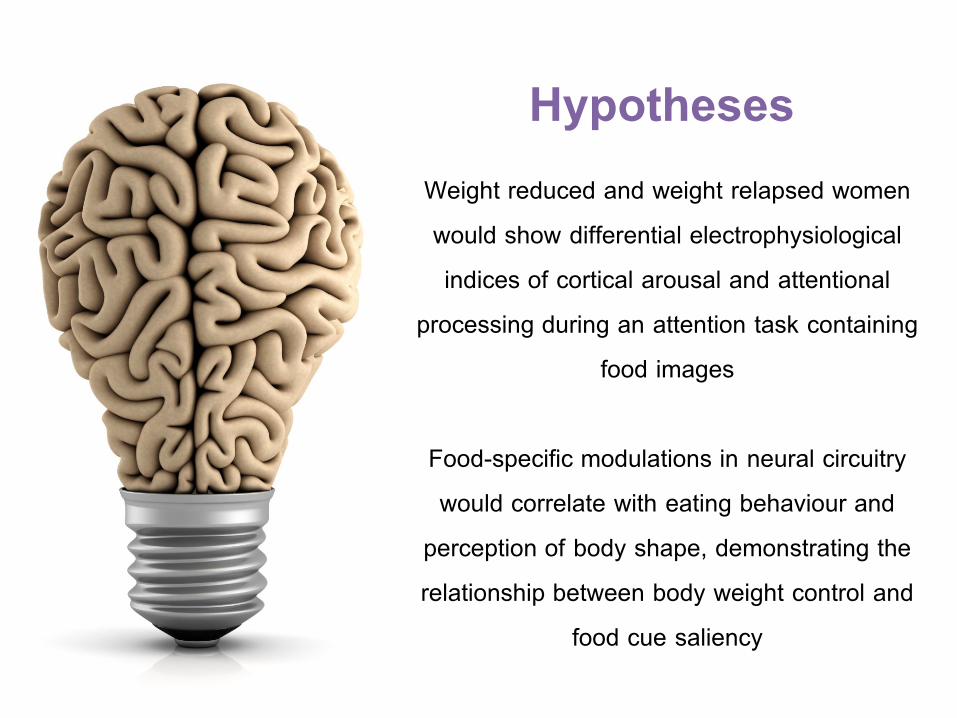
Hypotheses Weight reduced and weight relapsed women would show differential electrophysiological indices of cortical arousal and attentional
processing during an attention task containing food images
Food-specific modulations in neural circuitry would correlate with eating behaviour and
perception of body shape, demonstrating the relationship between body weight control and
food cue saliency

Methodology

Study Population
Reduced-weight group ≥ 10% body weight lost, weight loss
maintenance period ≥ 1 year
Weight relapsed group ≥ 10% body weight lost
and subsequently regained
Low-weight CTLs matched for BMI and Age
High-weight CTLs
matched for BMI and Age
VS
VS
According to definitions coined by Wing & Hill, 2001 (NWCR)
No history of weight loss > 5% body weight during adulthood
2 Exp groups: 2 CTL groups:

Experimental Procedure
2 - 4 h prior
Anthropometry Familiarization VAS Non-food Task with EEG
Food Task with EEG
Demographic Q, Weight & Reproductive History Q, Three Factor Eating Q,
Short Fat Q, Body Shape Q, Body Image Q

BMI WAIST & HIP
CIRCUMFERENCES BIOELECTRICAL IMPEDENCE (%BF)
Experimental Procedure
2 - 4 h prior
Anthropometry Familiarization VAS Non-food Task with EEG
Food Task with EEG

RED BLUE
YELLOW GREEN
RED
Experimental Procedure
2 - 4 h prior
Anthropometry Familiarization VAS Non-food Task with EEG
Food Task with EEG

Experimental Procedure
2 - 4 h prior
Anthropometry Familiarization VAS Non-food Task with EEG
Food Task with EEG

RED BLUE
YELLOW GREEN
RED
Experimental Procedure
2 - 4 h prior
Anthropometry Familiarization VAS Non-food Task with EEG
Food Task with EEG

RED BLUE
YELLOW GREEN
RED
Experimental Procedure
2 - 4 h prior
Anthropometry Familiarization VAS Non-food Task with EEG
Food Task with EEG

ResultsResults

Anthropometry and Surveys

Anthropometry and Surveys
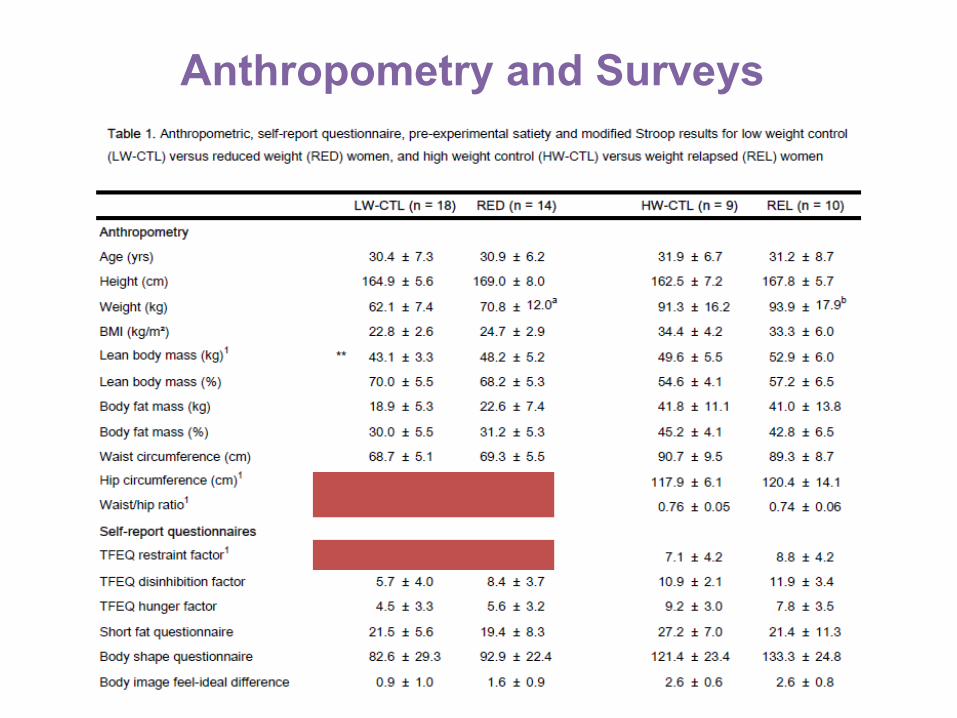
Anthropometry and Surveys

Satiety

Behavioural Data

Frequency Results
Lower delta and higher beta in RED vs LW-CTL during food
task
# #
(p = 0.01)
LOWER SLOW WAVE DELTA ACTIVITY • Reduction of withdrawal symptoms
(Krugel et al., 2003; Wacker at al., 2009)
• ‘Normalization’ of brain DA function • Reduction in reward-driven behavior
(Fisher et al., 2005; Knyazev 2007; Knyazev 2012)
HIGHER FAST WAVE BETA ACTIVITY • Greater anticipatory visual alertness and
visuospatial attentional orienting (Gola, Kami’nski, Brzezicka, & Wróbel, 2012; Kami’nski,
Brzezicka, Gola, & Wróbel, 2012)
• Wilful continuation of top-down control so as to retain high levels of intrinsic neurobehavioural
government over external cues (Engel & Fries, 2010)
RESTRICTED TO THE RIGHT FRONTAL CORTEX • Left frontal cortex: approach behaviour • Right frontal cortex: inhibitory behaviour
(Alonso-Alonso and Pascual-Leone, 2007)

Higher food task delta band activity correlated with higher fat intake and greater body shape dissatisfaction in weight reduced women
Increased delta (marker for reward seeking)
So greater habitual fat intake and greater body shape dissatisfaction offsets food cue control The brain is attuned to seek energy balance (fat = energy dense substrate)
(Blechert, Naumann, Schmitz, Herbert, & Tuschen-Caffier, 2014) individuals who experience greater dissatisfaction with body shape are at greater risk for eating pathology
(E Stice & Shaw, 2002)
Spearman Correlations
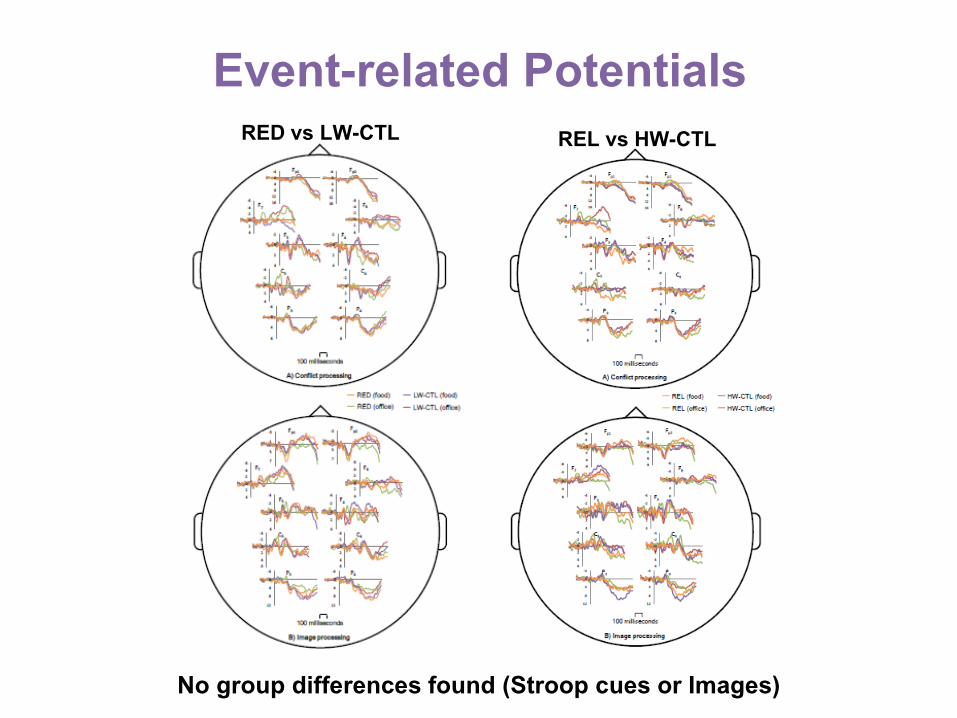
Event-related Potentials
No group differences found (Stroop cues or Images)
RED vs LW-CTL REL vs HW-CTL

ConclusionConclusion

As compared to phenotypically matched women with no history of
weight reduction, reduced-overweight and reduced-obese women show
patterns of cortical arousal associated with increased
neurobehavioral control over external food cues and the
inhibition of reward-driven eating
In contrast, indices of food-related cortical arousal between weight relapsed and weight stable overweight or obese controls are alike
IN A NUTSHELL

Thank you

Electroencephalography (EEG)
• The data were band pass filtered (FIR) with a Hamming window of 0.1 - 30 Hz. The filtered EEG data of the food and office tasks were Fourier transformed extracting delta (δ, 0.1-4 Hz), theta (θ, 4-7 Hz), alpha (α, 7-14 Hz), and beta (β, 15-30 Hz) frequency bands. The extracted absolute power was converted into relative band power (%).
• ERP Epochs were set at 200 msec prior to and 600 msec post cue presentation to capture an 800 msec window. Extraction was set to reject ERPs ± 100 μV, followed by visual inspection. ERPs were baseline corrected by the 200 msec window prior to cue presentation.
• Components extracted around image exposure included an early positive P150 (100-200 ms window, central electrodes (C3, C4)) and an early negative N150 component (100-200 ms window, parietal electrodes (P3, P4)). During image exposure, P200-like (200-300 ms window, central and parietal electrodes (C3, C4, P3, P4)), P300-like (300-400 ms window in central electrodes (C3, C4), 200-550 ms window in parietal electrodes (P3, P4)), and LPP (450-550 ms, central and parietal electrodes (C3, C4, P3, P4)) wave components were extracted.
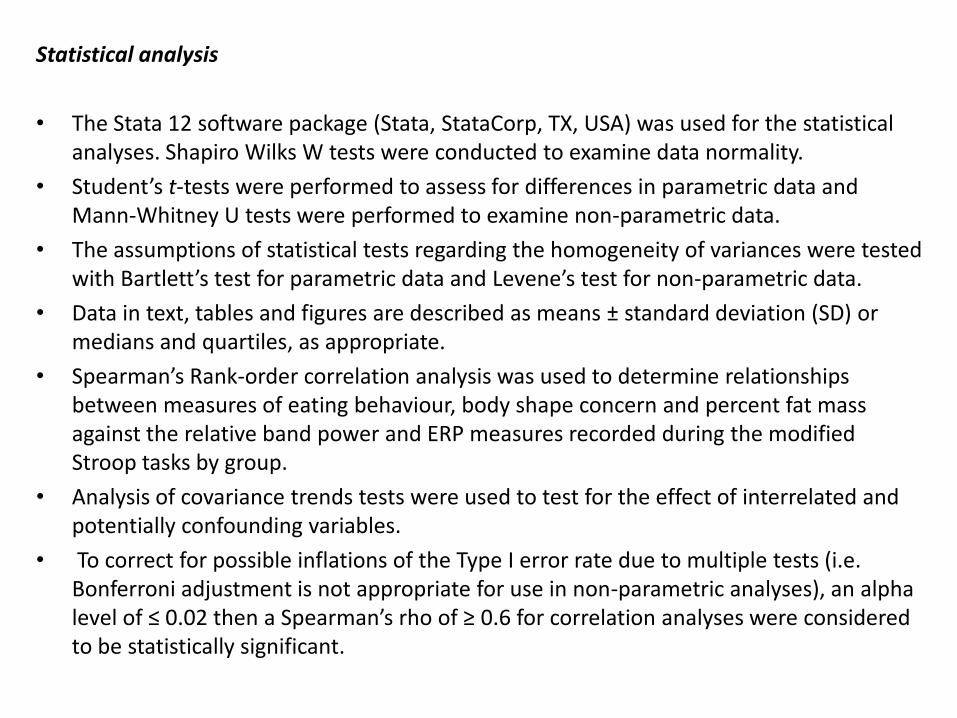
Statistical analysis
• The Stata 12 software package (Stata, StataCorp, TX, USA) was used for the statistical analyses. Shapiro Wilks W tests were conducted to examine data normality.
• Student’s t-tests were performed to assess for differences in parametric data and Mann-Whitney U tests were performed to examine non-parametric data.
• The assumptions of statistical tests regarding the homogeneity of variances were tested with Bartlett’s test for parametric data and Levene’s test for non-parametric data.
• Data in text, tables and figures are described as means ± standard deviation (SD) or medians and quartiles, as appropriate.
• Spearman’s Rank-order correlation analysis was used to determine relationships between measures of eating behaviour, body shape concern and percent fat mass against the relative band power and ERP measures recorded during the modified Stroop tasks by group.
• Analysis of covariance trends tests were used to test for the effect of interrelated and potentially confounding variables.
• To correct for possible inflations of the Type I error rate due to multiple tests (i.e. Bonferroni adjustment is not appropriate for use in non-parametric analyses), an alpha level of ≤ 0.02 then a Spearman’s rho of ≥ 0.6 for correlation analyses were considered to be statistically significant.
Copyright © 2022 FDOKUMEN