Changes in Diversification Patterns and Signatures of Selection during the Evolution of...
23
Viruses 2014, 6, 1112-1134; doi:10.3390/v6031112 viruses ISSN 1999-4915 www.mdpi.com/journal/viruses Article Changes in Diversification Patterns and Signatures of Selection during the Evolution of Murinae-Associated Hantaviruses Guillaume Castel *, Maria Razzauti, Emmanuelle Jousselin, Gael J. Kergoat and Jean-François Cosson INRA, UMR 1062 CBGP (INRA, IRD, Cirad, Montpellier SupAgro), Campus de Baillarguet, 34988 Montferrier-sur-Lez, France; E-Mails: [email protected] (M.R.); [email protected] (E.J.); [email protected] (G.J.K.); [email protected] (J.F.C.) * Author to whom correspondence should be addressed; E-Mail: [email protected]; Tel.: +33-499-623-311; Fax: +33-499-623-345. Received: 29 November 2013; in revised form: 19 February 2014 / Accepted: 24 February 2014 / Published: 10 March 2014 Abstract: In the last 50 years, hantaviruses have significantly affected public health worldwide, but the exact extent of the distribution of hantavirus diseases, species and lineages and the risk of their emergence into new geographic areas are still poorly known. In particular, the determinants of molecular evolution of hantaviruses circulating in different geographical areas or different host species are poorly documented. Yet, this understanding is essential for the establishment of more accurate scenarios of hantavirus emergence under different climatic and environmental constraints. In this study, we focused on Murinae-associated hantaviruses (mainly Seoul Dobrava and Hantaan virus) using sequences available in GenBank and conducted several complementary phylogenetic inferences. We sought for signatures of selection and changes in patterns and rates of diversification in order to characterize hantaviruses’ molecular evolution at different geographical scales (global and local). We then investigated whether these events were localized in particular geographic areas. Our phylogenetic analyses supported the assumption that RNA virus molecular variations were under strong evolutionary constraints and revealed changes in patterns of diversification during the evolutionary history of hantaviruses. These analyses provide new knowledge on the molecular evolution of hantaviruses at different scales of time and space. OPEN ACCESS
-
Upload
nationalagriculturalresearchinra -
Category
Documents
-
view
2 -
download
0
Transcript of Changes in Diversification Patterns and Signatures of Selection during the Evolution of...

Viruses 2014, 6, 1112-1134; doi:10.3390/v6031112
viruses
ISSN 1999-4915
www.mdpi.com/journal/viruses
Article
Changes in Diversification Patterns and Signatures of Selection
during the Evolution of Murinae-Associated Hantaviruses
Guillaume Castel *, Maria Razzauti, Emmanuelle Jousselin, Gael J. Kergoat and
Jean-François Cosson
INRA, UMR 1062 CBGP (INRA, IRD, Cirad, Montpellier SupAgro), Campus de Baillarguet,
34988 Montferrier-sur-Lez, France; E-Mails: [email protected] (M.R.);
[email protected] (E.J.); [email protected] (G.J.K.);
[email protected] (J.F.C.)
* Author to whom correspondence should be addressed; E-Mail: [email protected];
Tel.: +33-499-623-311; Fax: +33-499-623-345.
Received: 29 November 2013; in revised form: 19 February 2014 / Accepted: 24 February 2014 /
Published: 10 March 2014
Abstract: In the last 50 years, hantaviruses have significantly affected public health
worldwide, but the exact extent of the distribution of hantavirus diseases, species and
lineages and the risk of their emergence into new geographic areas are still poorly known.
In particular, the determinants of molecular evolution of hantaviruses circulating in
different geographical areas or different host species are poorly documented. Yet, this
understanding is essential for the establishment of more accurate scenarios of hantavirus
emergence under different climatic and environmental constraints. In this study, we
focused on Murinae-associated hantaviruses (mainly Seoul Dobrava and Hantaan virus)
using sequences available in GenBank and conducted several complementary phylogenetic
inferences. We sought for signatures of selection and changes in patterns and rates of
diversification in order to characterize hantaviruses’ molecular evolution at different
geographical scales (global and local). We then investigated whether these events were
localized in particular geographic areas. Our phylogenetic analyses supported the
assumption that RNA virus molecular variations were under strong evolutionary
constraints and revealed changes in patterns of diversification during the evolutionary
history of hantaviruses. These analyses provide new knowledge on the molecular evolution
of hantaviruses at different scales of time and space.
OPEN ACCESS

Viruses 2014, 6
1113
Keywords: diversification rate; Hantavirus; molecular evolution; Murinae;
phylogenetics; selection
1. Introduction
Pathologies caused by hantaviruses are considered as emerging diseases with important public
health impact worldwide because of the recent detection of new species of hantavirus in Africa, Asia,
America and Europe [1–5], the increase in the amplitude and frequency of outbreaks of human
hantaviruses [6–8] and the expansion of the geographic distribution of Seoul virus in the United
Kingdom, Belgium and France [2,9,10]. The importance of hantaviral diseases is still strongly
underestimated due to the lack of surveillance in many countries, the non-census of a large majority of
benign cases and poor knowledge on wildlife reservoirs. Recently, various studies have shown that
interactions between wild reservoirs and hantaviruses were more complex than previously described.
The identification of reservoir species, their specificity with hantaviruses species and the long
coevolution between hantaviruses and rodents have been particularly challenged by the discovery of
hantaviruses in soricomorphes and bats [11–14], by co-phylogenetic studies [14,15], and by the
occurrence of many host shift and overlapping host ranges [14,16–18]. In humans, hantaviruses are
responsible of the Hantavirus Cardio-Pulmonary Syndrome (HCPS) in the Western hemisphere and the
Haemorrhagic Fever with Renal Syndrome (HFRS) in the Old Word [8]. An outbreak of HCPS
occurred in the summer of 2012 in Yosemite National Park in California with a high rate of fatal cases
(30%) [7] and about 150,000 cases of HFRS are thought to occur annually worldwide [8].
A better understanding of mechanisms that drive and control viral genetic variation may help us to
predict and prevent scenarios that lead to the emergence of viral diseases [19]. Hantavirus molecular
variation has long been overlooked, being mostly restricted to phylogenetic studies and species
descriptions. However, the scientific community currently exhibits a renewed interest in understanding
lineage diversification and molecular factors favouring host switching and pathogenic severity towards
humans. Hantaviruses are ssRNA viruses with a genome organization typical of members of the
Bunyaviridae, consisting of three negative-stranded RNA segments: a large L segment encoding the
viral RNA polymerase, a medium M segment encoding the envelope glycoproteins Gn and Gc, and a
small S segment encoding the viral nucleocapsid protein. Reassortments (i.e., exchange of genome
segments) can occur between different strains or even between different species when they infect the
same host cell [18]. As other RNA viruses, hantaviruses have a high replication rate and a poor
proof-reading ability of their RNA-dependent RNA polymerase but it is now known that evolutionary
rates in these viruses are explained by many different aspects of viral biology and not only by
polymerase fidelity [20]. Host switching and introduction into new environments can also promote
viral evolution [21,22]. Because of their small size, important biological functions are compactly
integrated in viral genomes and a limited number of mutations/genomes can be sufficient to drive a
virus to extinction. Functional conservation of the viral proteins is reflected by purifying selection with
the exception of those involved in evading the host immune system [21,22].

Viruses 2014, 6
1114
Hantaviruses exist within their host as complex and heterogeneous populations [23,24] and genetic
drift, neutral mutation accumulation and small deletion/insertion within the non-coding regions of
RNA segments seem to be the main mechanisms involved in promoting their genetic diversity.
However, the genetic diversity measured at a given time point does not seem to be translated into a
high rate of accumulation of genetic changes on longer time-scales [25]. A recent study on Puumala
virus (PUUV) molecular variation in voles described a high rate of apparition of transient variants,
including reassortants, but also the preservation of a few preferred genotypes over time [26]. Yet it is
not clear whether this pattern better supports a neutral mode of microevolution mostly driven by
genetic drift rather than molecular conservatism due to negative selection. Recent studies actually
provided evidence of the molecular signature of negative selection in wild-type Murinae-associated
hantaviruses, a phenomenon that may be reversed by a treatment using a mutagen-increasing molecule,
such as ribavirin, which induces increased mutational load and positive selection [27–29]. In any case,
this dynamics is corroborated by a slow rate of nucleotides change over time while, as other RNA
viruses, hantaviruses exhibit very high short-term substitution rates.
Different modes of ssRNA virus evolution have recently been described by Holmes [30,31]. The
process of lineage diversification primarily occurs when viruses infect new host species, either through
cross-species transmission or codivergence, (i.e., the process of parallel cladogenesis in which the
diversification of one biological entity results in the diversification of its associated biological entities [32]).
Alternatively, it can be driven by the acquisition of new niches within the same host species; this event
is defined as intrahost duplication. In a recent study, Kitchen et al. have tested these two alternative
evolutionary scenarios in ssRNA viruses from five families of RNA viruses [33]. They concluded that
the colonization of new but related host species might represent the main mode of diversification in
RNA viruses, although strong biases in our knowledge of viral biodiversity may actually blur the
actual pattern. Until recently, hantavirus evolution was still seen as the result of tight coevolution with
their rodent hosts but this assumption was challenged by Ramsden et al. [15] who proposed that there
was no co-divergence between hantaviruses and their hosts. The parallelism between hantaviruses and
hosts phylogenies could have been the result of the recent colonization of rodents by hantaviruses
followed by shifts toward different host species (a phenomenon referred to as phylogenetic tracking) [34].
However, there is still great uncertainty regarding the history and timescale of the evolution of
hantaviruses [14], which impacts our ability to predict the likelihood of future host jumps. Moreover,
the determinants of diversification rate variability among closely related viruses or among lineages of
the same viral species circulating in different geographic region or host species are still poorly
understood [35]. As for other RNA viruses [36], environmental factors could have played an important
role in hantavirus diversification.
In this study, we focused on Murinae-associated hantaviruses and attempted to explore their mode
of diversification at both global and local geographic scales. Eleven hantaviruses species and major
lineages (whose specific statuses are still under debate) are carried by murine rodents: Haantan virus
(HTNV) widely distributed in eastern Asia, together with Dabieshan virus (DBSV) [37], Amur virus
(AMRV) [38] and Soochong virus (SOOV) [39]; Thailand virus (THAIV) [40], Serang virus (SERV) [41]
and Jurong virus [42] in Southeast Asia; GOU virus (GOUV) [37]) in China; Sangassou virus
(SANGV) [43] in Africa; Dobrava-Belgrade virus (DOBV) including four genotypes (Dobrava,
Saarema (SAAV), Sochi and Kurkino) [44,45] in Europe; and Seoul virus (SEOV) worldwide. To this
Viruses 2014, 6
1115
aim, we used sequences available from GenBank to conduct several phylogenetically-based
approaches and investigate selection and shifts in patterns of lineage diversification. We then searched
if these events characterized strains that are associated with specific geographic areas.
2. Results
2.1. Phylogenetic Analyses
Phylogenetic trees retrieved the major lineages currently described for murinae-associated
hantaviruses group in the literature [46]. Each of them (except SAAV/DOBV) formed separate and
well-supported phylogenetic lineages (PP > 0.95) (Figure 1).
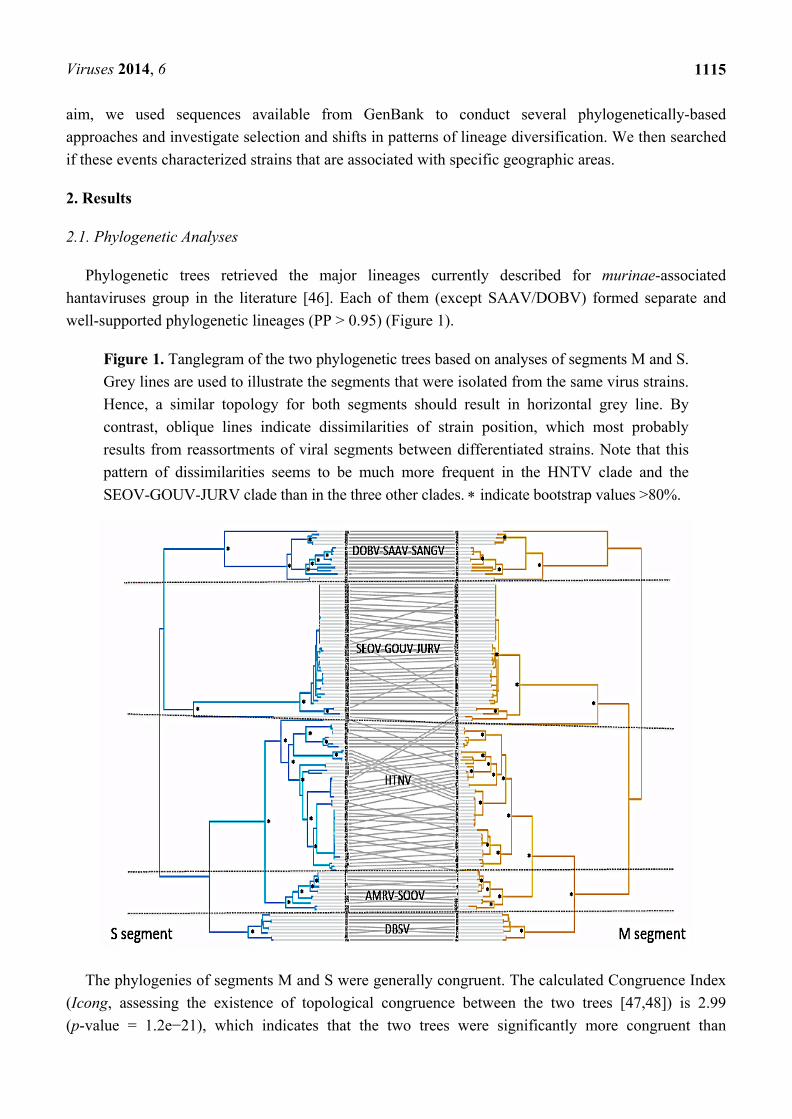
Figure 1. Tanglegram of the two phylogenetic trees based on analyses of segments M and S.
Grey lines are used to illustrate the segments that were isolated from the same virus strains.
Hence, a similar topology for both segments should result in horizontal grey line. By
contrast, oblique lines indicate dissimilarities of strain position, which most probably
results from reassortments of viral segments between differentiated strains. Note that this
pattern of dissimilarities seems to be much more frequent in the HNTV clade and the
SEOV-GOUV-JURV clade than in the three other clades. indicate bootstrap values >80%.
The phylogenies of segments M and S were generally congruent. The calculated Congruence Index
(Icong, assessing the existence of topological congruence between the two trees [47,48]) is 2.99
(p-value = 1.2e−21), which indicates that the two trees were significantly more congruent than
Viruses 2014, 6
1116
expected by chance. However, the Shimodaira-Hasegawa (SH) test [47,48] rejected the alternative
topology (topology obtained with the other segment) for both segments (ln L = 3824, p < 0.001 for S
segment; ln L = 12,444, p < 0.001 for M segment), indicating some incongruence between the trees,
which were symbolized by oblique grey lines in Figure 1. Most incongruencies were observed within
the HTNV and the SEOV-GOUV-JURV lineages.
2.2. Molecular Signatures of Selection
In our study, we used five different models, the Single Likelihood Ancestor Counting (SLAC)
model, the Fixed Effect Likelihood (FEL) model, the internal branches FEL (iFEL), the Mixed Effects
Model of Evolution (MEME) and the Fast Unbiased Bayesian AppRoximation (FUBAR) to detect
selection acting on both segments. Based on the methodology proposed in Wlasiuk and Nachman
(2010) [49] and recommended by other authors [50], we chose to only consider sites that are identified
by at least three of these methods as being under positive selection.
For the S segment, we found strong evidence of positive selection for only one aminoacid (aa) site
in position 43 (Ala for DOBV, SEOV and HTNV) supported by the five methods (Table 1). However,
the results of the MEME method results suggested that a larger number of sites may be subjected to
episodic diversifying selection as it identified 21 others aa sites at 0.05 significance level. Codon
analyses also revealed between 85% (SLAC, Single Likelihood Ancestor Counting model), and 98%
(FUBAR, Fast Unbiased Bayesian AppRoximation model) of negatively selected aa sites, (p = 0.05 or
Bayes Factor > 0.9) (Table 1). Results were consistent for both the small and the large dataset but
10 supplementary aa sites were detected by the MEME method with the large dataset (Table 1, see
Experimental Section for description of the datasets).
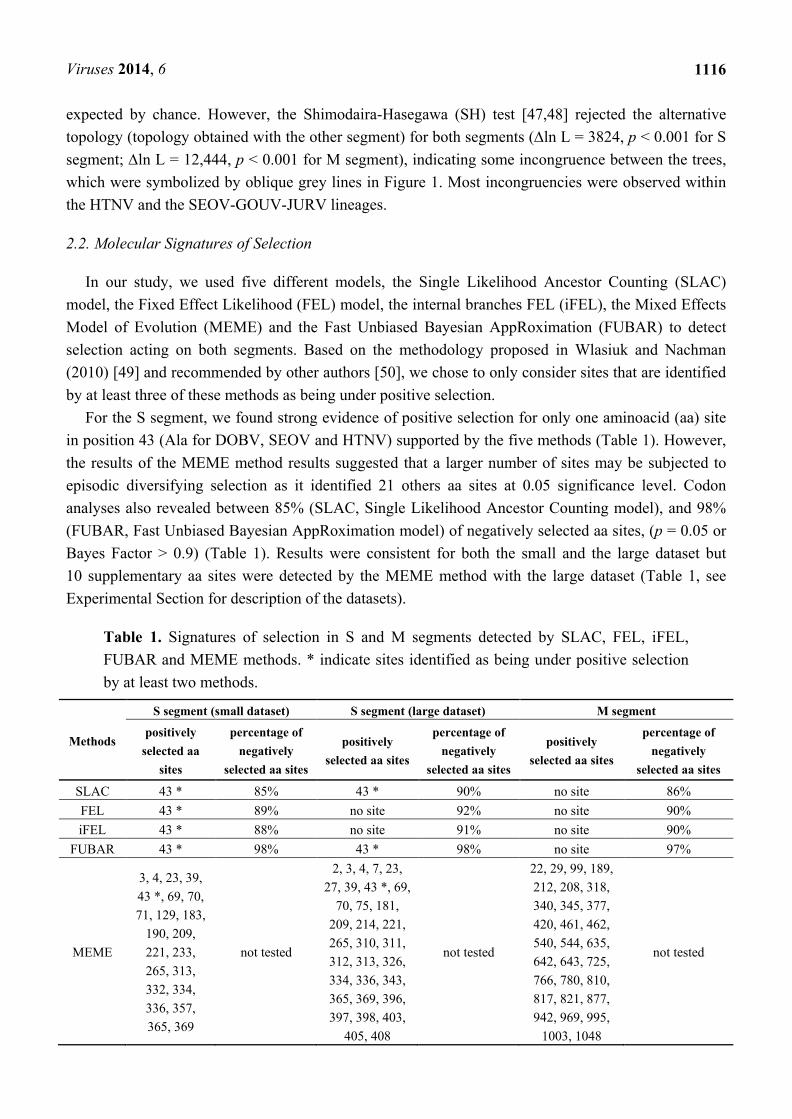
Table 1. Signatures of selection in S and M segments detected by SLAC, FEL, iFEL,
FUBAR and MEME methods. * indicate sites identified as being under positive selection
by at least two methods.
Methods
S segment (small dataset) S segment (large dataset) M segment
positively
selected aa
sites
percentage of
negatively
selected aa sites
positively
selected aa sites
percentage of
negatively
selected aa sites
positively
selected aa sites
percentage of
negatively
selected aa sites
SLAC 43 * 85% 43 * 90% no site 86%
FEL 43 * 89% no site 92% no site 90%
iFEL 43 * 88% no site 91% no site 90%
FUBAR 43 * 98% 43 * 98% no site 97%
MEME
3, 4, 23, 39,
43 *, 69, 70,
71, 129, 183,
190, 209,
221, 233,
265, 313,
332, 334,
336, 357,
365, 369
not tested
2, 3, 4, 7, 23,
27, 39, 43 *, 69,
70, 75, 181,
209, 214, 221,
265, 310, 311,
312, 313, 326,
334, 336, 343,
365, 369, 396,
397, 398, 403,
405, 408
not tested
22, 29, 99, 189,
212, 208, 318,
340, 345, 377,
420, 461, 462,
540, 544, 635,
642, 643, 725,
766, 780, 810,
817, 821, 877,
942, 969, 995,
1003, 1048
not tested

Viruses 2014, 6
1117
For the M segment, we were unable to obtain evidence of positive selection for some sites by at
least three of the five methods. Still, the MEME method identified 30 aa sites as being potentially
subjected to episodic diversifying selection events (Table 1). Except for seven of them (aa 461, 462,
540, 544, 635, 642 and 643) they all corresponded to aa located in the predicted ectodomains of the Gn
and Gc glycoproteins [51–53]. As for the S segment, analyses revealed that the M segment was
subjected to a strong purifying selection with between 86% (SLAC) and 97% (FUBAR) negatively
selected aa sites (Table 1).
2.3. Shifts in Diversification Rates and Patterns
For both M and S segments, our analyses revealed that diversification rates significantly varied
along time.
The general mixed Yule coalescent (GMYC) model was preferred over the null model of uniform
branching rates (2ΔL = 34.28, χ2 test p < 0.0001 and 2ΔL = 31.86, χ2 test p < 0.0001 for S and M
segments respectively with the single-threshold analysis while the multiple-threshold analysis gave a
result of 2ΔL = 37.59, χ2 test p < 0.0001 and 2ΔL = 35.62, χ2 test p < 0.0001 for S and M segments,
respectively. This meant that the best model of branching patterns for both segments corresponded to a
temporal succession of speciation processes followed by coalescent processes. This pattern is well
illustrated by the lineage-through-time (LTT) plots, which evidence a sudden increase in branching
rate towards the present (Figure 2).
The positions of the switches in diversification rates were very close to the tip of the trees. Single-
and multiple-threshold models gave essentially similar results (Supplementary Figure S1). The analyses
lead to the identifications of many lineages affected by an increase in branching rates. The number of
lineages identified by the method was very similar for both S and M segments; 60 putative lineages
(confidence interval 53–67) and 66 putative lineages (confidence interval 54–81) respectively with the
single-threshold analysis and 58 putative lineages (confidence interval 57–58) and 58 putative lineages
(confidence interval 23–60), respectively, with the multiple-threshold analysis. Analyses performed
with the large dataset indicated estimates of 32 lineages (confidence interval 21–113) with the single
threshold method (2ΔL = 11.65, χ2 test p < 0.01) and 102 lineages (confidence interval 98–102) with
the multiple threshold method (2ΔL = 20.86, χ2 test p < 0.0001). Finally, the number and composition
of putative lineages identified by the PTP (Poisson Tree Processes) test were very similar to results
obtained with the GMYC method for both S and M segments (60 and 65 putative lineages, respectively).
This suggests that only minor biases caused by the ultrametrization process with BEAST occurred.
The MEDUSA method allowed identifying where diversification rate shifts occurred on the tree.
The analyses revealed two significant shifts for both M and S segment phylogenies. The location of the
shifts was highly congruent between the two segments (Figure 2). One shift occurred in the clade
including the SEOV strains from the Hubei Chinese province (shift 1 in segment S and 3 in segment
M), and the second one encompassed the HTNV strains from the Guizhou Chinese province (shift 2 in
segment S and 4+5 in segment M). In addition to these two clades, the analyses of the large dataset
detected another shift occurring earlier in the phylogeny and affecting a large clade including SEOV
strains from Asia (China, Vietnam and Singapore) and Europe (France and Belgium). The PRC
method confirmed that the SEOV-Hubei clade and the HTNV-Guizhou clade have diversified more
rapidly than lineages in the rest of the tree.

Viruses 2014, 6
1118
Figure 2. M and S segments of murine-associated hantaviruses BEAST time calibrated
(ultrametric) trees. Root age was arbitrarily assigned to 1. A Generalized mixed Yule
coalescent (GMYC) model was used to determine thresholds such that nodes before the
threshold are considered as species diversification events, whereas branches crossing the
thresholds define clusters following a coalescent process (in red). Shifts in diversification
rates determined using MEDUSA algorithm are represented by numbered blue circles.
Increases in lineage diversification rates among the tree compared to the reminder tree
determined by the PRC Parametric Rate Comparison) test implemented in the iterates
package are represented by orange arrows. Inserts illustrate the Lineage-through-time
(LTT) plots based on the BEAST time calibrated (ultrametric) trees for the M and S
segment of murine-associated hantaviruses in which the occurrence and the position of the
switch between two evolution patterns (red line) was determined by the method of Pons et al.
implemented in the package SPLITS [54].

Viruses 2014, 6
1119
2.4. Geographic Structuration Analyses
Parsimony reconstructions as implemented in PhyloType, yielded nearly identical results for both S
and M segments phylogenies independently of the optimization method used (ACCTRAN or
DELTRAN) (Figure 3, Table S2).
Figure 3. Detection of phylotypes (subsets of taxa with close phylogenetic relationships
and common geographic trait values) among the phylogenies of M (a) and S, for the small
dataset (b) and for the large dataset (c), segments of murine-associated hantaviruses by
Phylotype [55]. Results are presented on the ML phylogenetic trees, in background and in
which the selected phylotypes are represented by coloured regions. Phylotype identifiers
are indicated in circles and refer to Pi in Table S2.
Five phylotypes were identified in the reconstructions. Two phylotypes were recovered among the
SEOV strains lineages, respectively, associated with Hubei (China) [Pi 210 (S) or 212 (M)] and
Zhejiang (China) [Pi 194 (S) or 179 (M)] annotations. Another phylotype including all DBSV virus
strains from Zhejiang was retrieved [Pi 3 (S) or 34 (M)], illustrating the geographical clustering of
DBSV shown in [28]. Among the HTNV strains, a phylotype associated with the Guizhou annotation
in the S phylogeny (Pi 55) was found at a more basal position on the M phylogeny (Pi 51), including a
common ancestor of HTNV and AMRV/SOOV strains. The last phylotype was associated with the
Germany annotation [Pi 146 (S) or 13 (M)] in the DOBV clade.
These phylotypes were also observed when using the larger dataset for the S segment, which
allowed reaching the minimal size selection criteria for the detection of several additional phylotypes
on the whole tree. In particular, a phylotype corresponding to the Korea annotation (Pi 22) including
the common ancestor of AMRV/SOOV and HTNV strains, suggested a Korean ancestor for the

Viruses 2014, 6
1120
considered HTNV strains, which is consistent with the known history of the HTNV discovery in 1976
in Korea [56].
The use of the large dataset also allowed obtaining two additional phylotypes among the SEOV
clade associated with the Beijing annotations (Pi 393 and 423) and inferring the origin of the Zhejiang
phylotype (Pi 318) earlier in the phylogeny, at an ancestral position compared to Hubei (Pi 319) and
Beijing phylotypes.
Analyses also showed strong associations (p < 0.05) between diversification rate shifts and
geographical origins in the S and M segments phylogenies. Guizhou and Hubei phylotypes (Pi 151 and
319, respectively, on Figure 4c and Table S2) correspond respectively to HTNV and SEOV lineages
affected by diversification rate shifts as identified by MEDUSA. Moreover, the PhyloType results
suggested that for the Hubei phylotype, the diversification rate shift event was accompanied by
geographic shift of the ancestral strain (from Zhejiang, China to Hubei, China).
3. Discussion
Our phylogenetic analyses revealed changes in patterns of diversification and selection during the
evolutionary history of RNA viruses. Our analyses suggest that RNA virus molecular variation is
under strong evolutionary constraints, as approximately 90% of aa sites in both M and S segments are
under negative selection. However, we also detected few aa sites belonging to the envelope
glycoproteins and to the nucleoprotein under positive selection, putatively as a result of selection
pressures exerted by hosts’ immunity. Moreover, our findings suggest that Hantavirus lineages mostly
evolve under a birth and death process, as suggested in the literature for RNA viruses [57]. However,
we also detected some acceleration of viral diversification in certain geographic areas. This change in
diversification rates and patterns could be related to environmental and climatic characteristics that
may influence transmission, generation time and/or replication of viruses in their host population [35].
This could locally increase the evolutionary potential of hantaviruses and thus enhance the risk of host
jumping by providing the genetic and phenotypic variation needed for a rapid adaptation to a new host
species [35,57] and, finally, the risk of disease emergence in humans [58,59].
3.1. Molecular Signatures of Selection
Molecular selection is caused by the pressure induced by the environment (including hosts) on the
viral variants [60]. As viral genome is very compact and codes for important biological functions, there
is often remarkable sequence conservation, indicating that purifying selection is a dominant
evolutionary force in viral evolution, preserving aa residues, while allowing neutral variation in
nucleotide sequences to continue [61].
In accordance with previous studies [27–29], we show that murine-associated hantaviruses S and M
segments are mainly subject to purifying selection along their evolutionary history. For both segments,
we detected significant negative selection for 1344 or 1525 aa sites (depending on the method used)
over a total of 1562 (i.e., 88%–97% of the S and M segment aa sites). Only one aa was significantly
detected as evolving under positive selection on the S segment while none was detected on the M
segment. However, the MEME method allowed us to detect several sites that could have been
subjected to episodic diversifying selection (22 on the S segment and 30 on the M segment),

Viruses 2014, 6
1121
i.e., occurring locally during hantavirus evolution and confined to a small subset of branches of the
phylogenetic tree. These sites were not detected in previous works [27,28], but Murrell et al. [62]
suggested that many previous estimates of the proportion of sites under positive selection should be
revised as the new powerful method MEME indicates that selection acting at individual sites is
considerably more widespread than suggested by older constant models. They also suggested that
natural selection is predominantly episodic, with transient periods of adaptive evolution masked by the
prevalence of purifying or neutral selection on other branches [62], which is in agreement with our
findings. Hantavirus evolutionary processes are subject to local dynamics that occur on a short time
scale and also follow very complex patterns, which might differ between the very local scale and the
global scale.
Interestingly, most of the corresponding aa detected on the M segment (23/30) are part of the
predicted ectodomain of the Gn (mapped between aa 17 and 441) and Gc (mapped between aa 650
and 1097) glycoproteins [51–53] of hantaviruses, which forms projections on the virion surface and are
the targets of neutralizing antibodies [63,64], whilst the aa 43 detected on the nucleoprotein is part of a
region identified as an antibody epitope for Sin Nombre (or Four Corners virus) [65], Hantaan [66] and
Puumala [67] virus. This is consistent with an adaptation to host immune recognition in the
N-terminal immunodominant region of the nucleocapsid protein [27]. Diversifying selection at these aa
sites are thus probably the result of adaptation of Hantavirus lineages to their host species and the
evolutionary pressure exerted by their immune systems. However, there is still a lack of information
concerning the exact structure and interaction map of hantaviruses proteins. Structural studies of the
hantaviral N proteins have progressed slowly because of their strong tendency to form aggregates
hampering the efforts to crystallize them [68]. More data, from crystallography studies, are needed in
order to better estimate the selective pressures acting on aa sites and understand the reason why some
sites were found to be under positive selection.
3.2. Co-Divergence between S and M Segments
Co-divergence between viral segments is expected if segments from the same viral strains remain
associated though time. By contrast, reassortment (i.e., exchange of segments) and/or recombination
between segments of different strains may blur the pattern and cause departure from co-divergence.
Both require that cells be infected by different strains at the same time. Reassortment and/or
recombination events have already been reported in the literature for hantaviruses [25] and other RNA
viruses (for a review of these cases, see Han 2001 [69]). Time-series like those of Razzauti [26] on
hantaviruses yet suggest that the reassortants do not persist over time, presumably because they
underwent negative selection.
We found clear signals of departure from co-divergence in some lineages like the HTNV lineage
and the SEOV-GOUV-JURV lineage, while other lineages were less impacted. Most departures from
co-divergence were observed in the shallow nodes of our trees, i.e., within species and within major
lineages. Yet, we also noticed two events between highly differentiated lineages, in particular between
HTNV and SEOV, as already discussed by Zou et al. [18]. Our results thus suggest that cell co-infection
by different lineages and/or negative selection against reassortants and/or recombined strains may vary

Viruses 2014, 6
1122
across lineages and/or geographic regions. This observation deserves further studies because it could
be related to different evolutionary dynamics and to possible risks of emergence in humans.
3.3. Shifts in Diversification Rates
Previous studies suggested that high rates of lineage births and deaths are a dominant feature of
RNA virus evolution [57,70]. Our findings fully support this view, as the BD model is preferred to
other models when considering the murine-associated hantaviruses phylogeny as a whole. However,
we also detected several shifts to the Yule (pure-birth) model in certain tips of the phylogenetic trees.
These shifts were detected in both S and M segments phylogenies and their localisations in the trees
were congruent for both segments.
In particular, two shifts were identified with both S (small and large dataset) and M segments, both
shifts corresponded to a change of the diversification process from a BD model to a Yule model. These
changes were accompanied by a strong increase in diversification rates. One shift concerns the SEOV
strains from the Hubei Chinese province and the second corresponds to a cluster including HTNV
strains from the Guizhou Chinese province. Both clades have diversified more rapidly than the rest of
the tree. Moreover, the two clades are geographically restricted (see also further) illustrating that in
Hantavirus, rates and patterns of diversification may vary locally as already described for rabies
virus [35] or tick-borne encephalitis virus [71]. As for these other RNA viruses, ecological and
environmental conditions (such as climate, host dynamics and host jumping) could trigger the speed of
viral diversification and its evolutionary dynamics.
These findings highlight the complexity of the diversification processes associated with the
evolution of hantaviruses at different spatial and time scales and underline the contrast existing
between micro- and macroevolution in RNA viruses. Generally, microevolution refers to rapid changes
within populations over time, while macroevolution refers to long-term changes driving the evolution
of new species [72]. Our results are in agreement with the findings by several authors that long-term
viral substitution rates (rates in deep nodes of the phylogeny) can be orders of magnitude lower than
short-term substitution rates (rate estimates at the tips of phylogenies) [61]. Strong purifying selection
(as we observed for murine-associated hantaviruses) could be responsible for this discrepancy. As a
result, this could also translate into an underestimation of branch lengths in the deepest branches of the
phylogenies, if we calibrate the tree with substitution rates inferred from the tip of the trees.
3.4. Ecological Drivers of the Diversification Rate Variability
Determinants of evolutionary rate variability among closely related viruses or among lineages of the
same viral species circulating in different geographic regions or host species are still poorly
understood. Changes in host dynamics, geographic dispersal events or jumps between host species may
enhance viral diversification because of genetic bottlenecks and/or changes in selective pressures
exerted by the host immune systems [19,33,73]. As a result, a virus shifting between host species
(or lineages) usually evolves faster than a virus confined to a single host, because viral replication
within a host over time decreases under the pressure of the host immune system [74]. Viral diversity
then decreases as a result of genetic bottleneck or genetic adaptation to the host immune systems. For
the same reasons, viral diversification is expected to be lowered during chronic infection following the

Viruses 2014, 6
1123
acute phase of infection [75], a widely held assumption for hantavirus infection in rodents [76].
New environmental conditions can also shift the equilibrium between viral and host population and
favour rapid viral diversification [77,78]. In the rabies virus, the seasonality of transmission in
different climatic regions strongly influences viral diversification, probably via climate-related changes
in host dynamics [35]. Similarly, variation of local precipitation, humidity and temperatures has been
correlated to HFRS incidence in Shandong Chinese province [79] probably by influencing hantavirus
transmission among their rodent hosts [80].
From this point of view, Hubei and Guizhou provinces, where we observed high diversification
rates for SEOV and HNTV, present interesting geographic and climatic characteristics [81]. Hubei is a
province located in central south China, where the main host of SEOV, the brown rat, Rattus
norvegicus, probably originated (given fossil records, Wu et al. 2008 cited in [82]). Rat communities
there are characterised by the coexistence of many highly divergent genetic lineages [82]. Recent
studies showed that this high genetic diversity in rats is paralleled by a high genetic diversity in
SEOV [82]. Finally, Hubei province is crossed by the Yangtze river, which is an important trade route
for humans, favouring rat dispersal and high mixing of both Hantavirus and rat lineages [83,84]. Based
on above knowledge gained from other RNA viruses, we could thus hypothesise that such mixing of
rodent and Hantavirus lineages could accelerate hantavirus diversification, but this deserves further
studies. One can notice that Hubei province is one of the most severe epidemic areas of SEOV-related
Haemorrhagic Fever with Renal Syndrome (HFRS) for humans in China.
Guizhou province, located in southern part of China, is another major endemic area for HTNV-related
HFRS in humans, and HTNV hantaviruses display there a high degree of genetic diversity [18,81]. In
Guizhou province, as well as in Hubei province, recent works have documented frequent spillover
events of HTNV and SEOV between Apodemus agrarius, Rattus niviventer and Rattus norvegicus [18,82].
Natural reassortments between HTNV and SEOV have also been documented [18]. Cross-species
transmission seems to be an important driver of Murinae-associated hantaviruses evolution [28]. The
geographic localization as well as environmental and/or climatic conditions favouring intense circulation
and contacts between different potential host species and Hantavirus lineages could therefore be at the
origin of the increase of diversification rates we observed there for HTNV and SEOV.
3.5. Sampling Effects
In this work, we chose to use only strains for which relevant genetic data (complete segment
sequences) were available. This probably results in strong geographic and lineage biases, because not
all geographic regions and genetic lineages have been studied equally. For example, strains from some
Chinese provinces or from other Asian or European countries are underrepresented in our dataset
compared to Guizhou and Hubei provinces. Such bias could result in underestimation of the number
and localisation on clades experiencing drastic changes in patterns of diversification [85]. Indeed, we
detected an additional clade experiencing an increase in diversification rate when we used the large S
dataset. Moreover, the number of geographic phylotypes detected is much more important with the
large S dataset, probably because a minimal number of strains is needed to be able to extract
significant information when using the method of Chevenet et al. [55]. Another limitation of our study
is that our analyses are dependent on the metadata linked with each deposited sequence, such as the

Viruses 2014, 6
1124
precise time and place of sampling (latitude and longitude) that are often missing or incomplete in
GenBank [30]. Indeed, more precise geographic data could help to better refine the geographic areas
where changes in evolutionary dynamics occur. Nevertheless, despite these obvious limitations we
provide here a strong indication of the existence of different evolutionary patterns across lineages. For
instance, though a large dataset was available for the DOBV/SAAV clade (29 sequences available in
the large dataset vs. 15 in the small dataset), we were not able to detect any change in diversifying
rates. Such a result contrasts with what was observed for HTNV and SEOV clades in China.
4. Experimental
4.1. Sequences Acquisition
We used a dataset of 124 Hantavirus strains belonging to the hantaviruses carried by the Rodentia
subfamily Murinae. We selected only strains for which complete coding sequences for the two
segments (S, ORF, 1293 bp, and M, ORF, 3408 bp) were available. Segment L was not included in the
analyses due to the paucity of the data available (8 SEOV, 1 SANGV, 9 HTNV and 11 DOBV). For
some analyses we also used a larger dataset of 225 complete S segments for which the M segment was
not available. Sequences were obtained from the NIAID Virus Pathogen Database and Analysis
Resource (ViPR) online through the website in [86]. The list of strains and their geographic origin are
displayed in Table S1 and Figure S1.
4.2. Molecular Signature of Selection
To detect and/or determine selection acting on both segments, sequences were analyzed using HyPhy
software package [87–89] implemented in the Datamonkey web server [90]. Datamonkey includes several
codon-based maximum-likelihood methods described in [87,88], inferring both positively and
negatively selected sites: the Single Likelihood Ancestor Counting (SLAC) model, the Fixed Effect
Likelihood (FEL) model, the internal branches FEL (iFEL). SLAC is the most conservative of the
three methods. We also employed two recently developed models, the Mixed Effects Model of
Evolution (MEME) [62] and the Fast Unbiased Bayesian AppRoximation (FUBAR) [91] methods.
MEME is a branch-site model, which is an extension of FEL that permits a proportion of branches at a
site to evolve neutrally or under negative selection, while the remainder can evolve under diversifying
selection. It can therefore detect signatures of episodic selection even when the majority of lineages are
subject to purifying selection. FUBAR is a very fast approximate hierarchical Bayesian method using a
Markov chain Monte Carlo (MCMC) routine that ensures robustness against model misspecification
by averaging over a large number of predefined site classes.
Significance levels were set fixed to 0.05 or 0.9 (Bayes factor) and the REV substitution model
(also called General Time Reversible model) with a Neighbour Joining tree as default tree.
4.3. Phylogeny and Congruence between M and S Segment Trees
Sequences were aligned with the Clustal Omega alignment program implemented in SEAVIEW
v4.4.2 [92]. The optimal substitution model for both segments was identified as the GTR +G +I
model (General Time Reversible) using a function implemented in Mega v5.1 [93]. Phylogenetic

Viruses 2014, 6
1125
reconstructions were conducted with the ML approach using PhyML v3.0 [94]. We tested the
congruence between the S segment phylogeny and the M segment phylogeny using the on-line
calculation of the congruency index Icong [47] see [95]. This index is based on topological congruence
assessed using MAST (Maximum agreement subtrees) measurement. A large number of random trees
are generated, with a wide range of number of leaves and the topological congruence is then
determined as the minimum number of leaves that have to be removed in each phylogeny to render the
trees identical. A p-value is given for the null hypothesis that two given trees are not more similar than
expected by chance. We also conducted comparative tests of topologies by ML using the Shimodaira-
Hasegawa (SH) test implemented in PAUP* [96] and using 1000 RELL (Resampling estimated log-
likelihoods) bootstraps [48]. Tanglegram in which S and M segment phylogenetic trees are drawn
opposite each other with lines connecting matching taxa, was visualized using TreeMap v.3 [97].
4.4. Phylogenetic Analyses
Diversification analyses require the use of ultrametric trees as input trees. Ultrametric trees for both
segments were obtained using the Metropolis-coupled Markov Chain Monte Carlo (MCMC) method in
BEAST package v1.7.4 [98]. BEAUTi v1.7.4 [98] was used to generate BEAST .xml input files. The
two datasets were analysed under the GTR +G +I model and with a relaxed clock allowing branch
lengths to vary according to an uncorrelated lognormal distribution. Inferring ultrametric trees with
BEAST for species-level phylogenies requires specifying a speciation model prior [99]. Two most
used speciation models are available in BEAST, the pure-birth (Yule) process, which governs
branching times assuming a constant rate of diversification and no extinction [100]; and the birth-death
(BD) process, which is a special case of Yule process allowing lineage extinction. In order to search
for the model that best fits to our data sets, we used the fitdAICrc function (which compares models
AIC scores) implemented in the R package Laser [101] on the S and M ML phylogenetic trees
previously made ultrametric by the chronos function implemented in the R package Ape [102]. As the
birth-death (BD) process was selected for both segments S and M (Table 2), we then used a BD prior
for ultrametric tree inference with BEAST, and all other priors were left to the default settings.
Table 2. Likelihoods, and AIC scores calculated by the fitdAICrc function implemented in
the « Laser » R package for both Yule and Birth-death models. Models are fitted to the M
and S segment phylogenetic trees constructed with PhyML and made ultrametric by the
chronos function implemented in the « Ape » R package.
Model Segment S Segment M
LH AIC LH AIC
Pure birth (Yule) 537.98 −1073.96 674.65 −1347.31
Birth death (BD) 540.18 −1076.36 755.33 −1506.7
A random tree was used as the starting tree. Prior ages to lineages were arbitrarily assigned to 1
(meaning that the time separating the root from the present was arbitrarily assigned to 1). We ran two
analyses of 10 million generations each for both segments with parameters sampled every 1000
generations. Convergence was evaluated using Tracer v1.5 [103] and summary maximum clade

Viruses 2014, 6
1126
credibility trees (MCC) were generated using TREEANNOTATOR v1.7.4 [98], after discarding the
first 10% of the trees in each run as burn-in as determined graphically using Tracer v1.5.
4.5. Shifts in Diversification Rates and Patterns
We ran several analyses to identify shifts in modes of lineage diversification in both S and M
phylogenies. Analyses were performed in R (R-Development-Core-Team 2008) using the MCC trees
and the Ape [102], Geiger [104], Laser [101], SPLITS [54] and iteRates [105] libraries.
The Species’ LImits by Threshold Statistics model of Pons et al., 2006 [54] implemented in the
package SPLITS seeks for transition between two branching patterns in a tree, corresponding to the
Yule process and the coalescent process, respectively. The method tests for the fit of the data to the
null model of general coalescence (in which the entire tree represents a single population) and to the
alternative model, called general mixed Yule coalescent (GMYC) model, which combines models that
separately describe branching within populations (coalescent process) and branching between species
(a Yule model of stochastic lineage growth). A standard likelihood ratio test (LRT) is used to assess
whether the alternative model provides a better fit to the data than the null model. However, as a single
threshold approach may not reflect the variety of divergence levels among lineages, we also applied a
multiple threshold approach that allows the depth of the coalescent transition to vary along individual
branches of the phylogenetic tree [106].
We also used the Poisson Tree Processes (PTP) model for delimiting species on a rooted
phylogenetic tree [107]. In PTP, speciation or branching events are modelled in terms of number of
substitutions (represented by branch lengths), so it only requires a phylogenetic input tree. We used
PTP test to assess whether the ultrametrization process with BEAST could introduce bias in our
analyses, by inferring putative species boundaries on both S and M segment phylogenetic trees.
Analyses were conducted on the web server for PTP [108] using phylogenetic trees obtained with
RAxML v7.0.3 [109] under a GTR +CAT +I substitution model. The latter model is an alternative of
the +G model of rate heterogeneity, which optimizes the evolutionary rate for each individual site
using a fixed number of rate categories.
The Modelling Evolutionary Diversification Using Stepwise AIC (MEDUSA) method implemented
in the package GEIGER aims to detect and locate lineage-specific shifts in diversification rates in a
tree. To this aim, it fits a series of birth-death (BD) and pure-birth Yule models to a phylogenetic tree
(reconstructed by default under a BD process) with an increasing number of breakpoints (rate shifts) [110].
These models are then compared using corrected Akaike information criterion (AICc) to choose the
best-fit model. We tested for significant variation in diversification rates by using the medusaSummary
command and chose the model with the lowest AICc value. The threshold for retaining additional rate
shifts was an improvement in AIC score of 5.26 units or greater as determined as appropriate for a tree
of 124 tips by MEDUSA. We also used the Parametric Rate Comparison (PRC) test implemented in
the ―iterates‖ package [105]. The method is similar to the MEDUSA approach but does not make
assumptions regarding the underlying evolutionary processes of diversification.

Viruses 2014, 6
1127
4.6. Geographic Structuration Analyses
Finally, we aimed to relate the shifts in diversification rates in our phylogenetic trees with the
geographic distribution of the lineages. To this aim we used the PhyloType software [111]. The
method allows detecting genetic clusters, thereafter called phylotypes, which include strains that share
similar extrinsic traits (e.g., geographic location, morphology, host species or the presence of a given
mutation, etc.) [55]. Phylotypes are thus subsets of strains with close phylogenetic relationships and
common trait values. The method combines ancestral trait reconstruction using parsimony, with
combinatorial and numerical criteria measuring tree shape characteristics and the diversity and
separation of the potential phylotypes. A shuffling procedure is used to assess the statistical
significance of phylotypes.
Analyses were performed with phylogenies inferred by maximum likelihood (ML) and with a LRT
SH-like branch support as described in [55]. Annotations in our dataset were the geographic origin of
each strain. For all analyses, criteria chosen for phylotype selection were as follows: size ≥5,
size/different ≥1, persistence ≥1, only nodes which ML bootstrap values were ≥75 were taken into
account in the analyses. Both ACCTRAN and DELTRAN (recommended for geographic annotations)
optimization were tested. Shuffling procedures were performed with 1000 iterations to test for
phylotype significance. Only those phylotypes whose p-value was ≤5% were retained.
5. Conclusions
The diversification of Murinae-associated hantaviruses follows a very complex pattern which might
differ at the very local scale and at the global scale. As RNA viruses’ evolutionary processes are
subject to local ecological dynamics that occur on a short time scale, a credible model of virus
evolution has to take time-dependent ecological processes into account [112]. As already pointed out
by Holmes 10 years ago [70], there is still a great need for more sophisticated models of RNA virus
sequence evolution that allow patterns and rates to differ among lineages [70]. Within some areas, like
Hubei and Guizhou province in China, geographic and climatic characteristics allow intense
cocirculation of hosts and Hantavirus lineages, favouring the occurrence of spillover, and accelerating
hantavirus diversification rates and genetic novelty. These conditions are probably suitable for the
emergence of new genetic variants and increase the risk of transmission to humans. Indeed, those two
provinces of China are important foci of human hantaviruses. One should notice that hantavirus
variation is just about to be described in many other places in the world and most Hantavirus species
are poorly or not documented, preventing similar analyses in other areas and with other species. Such
studies should be strengthened in the future aiming to better predict the geographic or origins of epidemics.
Acknowledgments
This work was partly supported by the French National Agency for Research project
BioDivHealthSEA (Grant Number ANR 11 CPEL 002), and the European program FP7-261504
EDENext. The manuscript is catalogued by the EDENext Steering Committee as EDENext193 [113].
The contents of this publication are the sole responsibility of the authors and don't necessarily reflect
the views of the European Commission.

Viruses 2014, 6
1128
Author Contributions
G.C. performed the analysis, analyzed the data and wrote the manuscript. M.R., E.J. and G.J.K.
provided critical information, participated in the analysis design and edited the manuscript. J.F.C. provided
overall supervision, participated in the analysis design and edited the manuscript. All authors approved the
final version of the manuscript.
Conflicts of Interest
The authors declare no conflict of interest.
References and Notes
1. Reusken, C.; Heyman, P. Factors driving hantavirus emergence in Europe. Curr. Opin. Virol.
2013, 3, 92–99.
2. Jameson, L.J.; Logue, C.H.; Atkinson, B.; Baker, N.; Galbraith, S.E.; Carroll, M.W.; Brooks, T.;
Hewson, R. The continued emergence of hantaviruses: Isolation of a Seoul virus implicated in
human disease, United Kingdom, October 2012. Euro Surveill. 2013, 18, 4–7.
3. Meheretu, Y.; Cizkova, D.; Tesikova, J.; Welegerima, K.; Tomas, Z.; Kidane, D.; Girmay, K.;
Schmidt-Chanasit, J.; Bryja, J.; Gunther, S.; et al. High diversity of RNA viruses in rodents,
Ethiopia. Emerg. Infect. Dis. 2012, 18, 2047–2050.
4. Hjelle, B.; Torres-Perez, F. Hantaviruses in the americas and their role as emerging pathogens.
Viruses 2010, 2, 2559–2586.
5. Henttonen, H.; Buchy, P.; Suputtamongkol, Y.; Jittapalapong, S.; Herbreteau, V.; Laakkonen, J.;
Chaval, Y.; Galan, M.; Dobigny, G.; Charbonnel, N.; et al. Recent discoveries of new
hantaviruses widen their range and question their origins. Ann. N. Y. Acad. Sci. 2008, 1149, 84–89.
6. Watson, D.C.; Sargianou, M.; Papa, A.; Chra, P.; Starakis, I.; Panos, G. Epidemiology of
Hantavirus infections in humans: A comprehensive, global overview. Crit. Rev. Microbiol. 2013,
40, 261–272.
7. Centers for Disease Control and Prevention (CDC). Hantavirus pulmonary syndrome in visitors
to a national park—Yosemite Valley, California, 2012. MMWR Morb. Mortal. Wkly. Rep. 2012,
61, 952.
8. Vaheri, A.; Strandin, T.; Hepojoki, J.; Sironen, T.; Henttonen, H.; Makela, S.; Mustonen, J.
Uncovering the mysteries of hantavirus infections. Nat. Rev. Microbiol. 2013, 11, 539–550.
9. Plyusnina, A.; Heyman, P.; Baert, K.; Stuyck, J.; Cochez, C.; Plyusnin, A. Genetic characterization
of seoul hantavirus originated from norway rats (Rattus norvegicus) captured in Belgium. J. Med.
Virol. 2012, 84, 1298–1303.
10. Mace, G.; Feyeux, C.; Mollard, N.; Chantegret, C.; Audia, S.; Rebibou, J.M.; Spagnolo, G.;
Bour, J.B.; Denoyel, G.A.; Sagot, P.; et al. Severe Seoul hantavirus infection in a pregnant
woman, France, October 2012. Euro Surveill. 2013, 18, e20464.
11. Arai, S.; Nguyen, S.T.; Boldgiv, B.; Fukui, D.; Araki, K.; Dang, C.N.; Ohdachi, S.D.; Nguyen, N.X.;
Pham, T.D.; Boldbaatar, B.; et al. Novel bat-borne hantavirus, Vietnam. Emerg. Infect. Dis.
2013, 19, 1159–1161.
Viruses 2014, 6
1129
12. Sumibcay, L.; Kadjo, B.; Gu, S.H.; Kang, H.J.; Lim, B.K.; Cook, J.A.; Song, J.W.; Yanagihara, R.
Divergent lineage of a novel hantavirus in the banana pipistrelle (Neoromicia nanus) in Cote
d'Ivoire. Virol. J. 2012, 9, e34.
13. Weiss, S.; Witkowski, P.T.; Auste, B.; Nowak, K.; Weber, N.; Fahr, J.; Mombouli, J.V.;
Wolfe, N.D.; Drexler, J.F.; Drosten, C.; et al. Hantavirus in bat, Sierra Leone. Emerg. Infect. Dis.
2012, 18, 159–161.
14. Guo, W.P.; Lin, X.D.; Wang, W.; Tian, J.H.; Cong, M.L.; Zhang, H.L.; Wang, M.R.; Zhou, R.H.;
Wang, J.B.; Li, M.H.; et al. Phylogeny and origins of hantaviruses harbored by bats, insectivores,
and rodents. PLoS Pathog. 2013, 9, e1003159.
15. Ramsden, C.; Holmes, E.C.; Charleston, M.A. Hantavirus evolution in relation to its rodent and
insectivore hosts: No evidence for codivergence. Mol. Biol. Evol. 2009, 26, 143–153.
16. Chu, Y.K.; Owen, R.D.; Jonsson, C.B. Phylogenetic exploration of hantaviruses in Paraguay
reveals reassortment and host switching in South America. Virol. J. 2011, 8, e399.
17. Nemirov, K.; Henttonen, H.; Vaheri, A.; Plyusnin, A. Phylogenetic evidence for host switching
in the evolution of hantaviruses carried by Apodemus mice. Virus Res. 2002, 90, 207–215.
18. Zou, Y.; Hu, J.; Wang, Z.X.; Wang, D.M.; Yu, C.; Zhou, J.Z.; Fu, Z.F.; Zhang, Y.Z. Genetic
characterization of hantaviruses isolated from Guizhou, China: Evidence for spillover and
reassortment in nature. J. Med. Virol. 2008, 80, 1033–1041.
19. Schneider, W.L.; Roossinck, M.J. Genetic diversity in RNA virus quasispecies is controlled by
host-virus interactions. J. Virol. 2001, 75, 6566–6571.
20. Duffy, S.; Shackelton, L.A.; Holmes, E.C. Rates of evolutionary change in viruses: Patterns and
determinants. Nat. Rev. Genet. 2008, 9, 267–276.
21. Ojosnegros, S.; Agudo, R.; Sierra, M.; Briones, C.; Sierra, S.; Gonzalez-Lopez, C.; Domingo, E.;
Cristina, J. Topology of evolving, mutagenized viral populations: Quasispecies expansion,
compression, and operation of negative selection. BMC Evol. Biol. 2008, 8, e207.
22. Eigen, M. Error catastrophe and antiviral strategy. Proc. Natl. Acad. Sci. USA 2002, 99,
13374–13376.
23. Feuer, R.; Boone, J.D.; Netski, D.; Morzunov, S.P.; St Jeor, S.C. Temporal and spatial analysis
of Sin Nombre virus quasispecies in naturally infected rodents. J. Virol. 1999, 73, 9544–9554.
24. Sironen, T.; Kallio, E.R.; Vaheri, A.; Lundkvist, A.; Plyusnin, A. Quasispecies dynamics and
fixation of a synonymous mutation in hantavirus transmission. J. Gen. Virol. 2008, 89, 1309–1313.
25. Razzauti, M.; Plyusnina, A.; Henttonen, H.; Plyusnin, A. Accumulation of point mutations and
reassortment of genomic RNA segments are involved in the microevolution of Puumala
hantavirus in a bank vole (Myodes glareolus) population. J. Gen. Virol. 2008, 89, 1649–1660.
26. Razzauti, M.; Plyusnina, A.; Henttonen, H.; Plyusnin, A. Microevolution of Puumala hantavirus
during a complete population cycle of its host, the bank vole (Myodes glareolus). PLoS One
2013, 8, e64447.
27. Hughes, A.L.; Friedman, R. Evolutionary diversification of protein-coding genes of hantaviruses.
Mol. Biol. Evol. 2000, 17, 1558–1568.
28. Lin, X.D.; Wang, W.; Guo, W.P.; Zhang, X.H.; Xing, J.G.; Chen, S.Z.; Li, M.H.; Chen, Y.;
Xu, J.; Plyusnin, A.; et al. Cross-species transmission in the speciation of the currently known
murinae-associated hantaviruses. J. Virol. 2012, 86, 11171–11182.
Viruses 2014, 6
1130
29. Chung, D.H.; Vastermark, A.; Camp, J.V.; McAllister, R.; Remold, S.K.; Chu, Y.K.; Bruder, C.;
Jonsson, C.B. The murine model for Hantaan virus-induced lethal disease shows two distinct
paths in viral evolutionary trajectory with and without ribavirin treatment. J. Virol. 2013, 87,
10997–11007.
30. Holmes, E.C.; Grenfell, B.T. Discovering the phylodynamics of RNA viruses. PLoS Comput.
Biol. 2009, 5, e1000505.
31. Holmes, E.C. What can we predict about viral evolution and emergence? Curr. Opin. Virol.
2013, 3, 180–184.
32. Charleston, M.A.; Perkins, S.L. Traversing the tangle: Algorithms and applications for
cophylogenetic studies. J. Biomed. Inform. 2006, 39, 62–71.
33. Kitchen, A.; Shackelton, L.A.; Holmes, E.C. Family level phylogenies reveal modes of
macroevolution in RNA viruses. Proc. Natl. Acad. Sci. USA 2011, 108, 238–243.
34. Thompson, J.N. The Coevolutionary Process; University of Chicago Press: Chicago, IL, USA,
1994; p. 387.
35. Streicker, D.G.; Lemey, P.; Velasco-Villa, A.; Rupprecht, C.E. Rates of viral evolution are linked
to host geography in bat rabies. PLoS Pathog. 2012, 8, e1002720.
36. Torres-Perez, F.; Palma, R.E.; Hjelle, B.; Holmes, E.C.; Cook, J.A. Spatial but not temporal
co-divergence of a virus and its mammalian host. Mol. Ecol. 2011, 20, 4109–4122.
37. Wang, H.; Yoshimatsu, K.; Ebihara, H.; Ogino, M.; Araki, K.; Kariwa, H.; Wang, Z.; Luo, Z.;
Li, D.; Hang, C.; et al. Genetic diversity of hantaviruses isolated in china and characterization of
novel hantaviruses isolated from Niviventer confucianus and Rattus rattus. Virology 2000, 278,
332–345.
38. Zhang, Y.; Liu, B.H.; Lin, F.; Zhang, Y.G.; Si, B.Y.; Kang, X.P.; Hu, Y.; Li, J.; Wu, X.Y.;
Li, Y.C.; et al. The first complete genomic characterization of an Amur virus isolate from China.
Arch. Virol. 2013, 158, 2185–2188.
39. Baek, L.J.; Kariwa, H.; Lokugamage, K.; Yoshimatsu, K.; Arikawa, J.; Takashima, I.; Kang, J.I.;
Moon, S.S.; Chung, S.Y.; Kim, E.J.; et al. Soochong virus: An antigenically and genetically distinct
hantavirus isolated from Apodemus peninsulae in Korea. J. Med. Virol. 2006, 78, 290–297.
40. Hugot, J.P.; Plyusnina, A.; Herbreteau, V.; Nemirov, K.; Laakkonen, J.; Lundkvist, A.;
Supputamongkol, Y.; Henttonen, H.; Plyusnin, A. Genetic analysis of Thailand hantavirus in
Bandicota indica trapped in Thailand. Virol. J. 2006, 3, e72.
41. Plyusnina, A.; Ibrahim, I.N.; Plyusnin, A. A newly recognized hantavirus in the Asian house rat
(Rattus tanezumi) in Indonesia. J. Gen. Virol. 2009, 90, 205–209.
42. Johansson, P.; Yap, G.; Low, H.T.; Siew, C.C.; Kek, R.; Ng, L.C.; Bucht, G. Molecular
characterization of two hantavirus strains from different rattus species in Singapore. Virol. J.
2010, 7, e15.
43. Klempa, B.; Fichet-Calvet, E.; Lecompte, E.; Auste, B.; Aniskin, V.; Meisel, H.; Denys, C.;
Koivogui, L.; ter Meulen, J.; Kruger, D.H. Hantavirus in African wood mouse, Guinea.
Emerg. Infect. Dis. 2006, 12, 838–840.
Viruses 2014, 6
1131
44. Nemirov, K.; Vapalahti, O.; Lundkvist, A.; Vasilenko, V.; Golovljova, I.; Plyusnina, A.;
Niemimaa, J.; Laakkonen, J.; Henttonen, H.; Vaheri, A.; et al. Isolation and characterization of
Dobrava hantavirus carried by the striped field mouse (Apodemus agrarius) in Estonia. J. Gen.
Virol. 1999, 80, 371–379.
45. Klempa, B.; Avsic-Zupanc, T.; Clement, J.; Dzagurova, T.K.; Henttonen, H.; Heyman, P.;
Jakab, F.; Kruger, D.H.; Maes, P.; Papa, A.; et al. Complex evolution and epidemiology of
Dobrava-Belgrade hantavirus: Definition of genotypes and their characteristics. Arch. Virol.
2013, 158, 521–529.
46. Plyusnin, A. Genetics of hantaviruses: Implications to taxonomy. Arch. Virol. 2002, 147, 665–682.
47. De Vienne, D.M.; Giraud, T.; Martin, O.C. A congruence index for testing topological similarity
between trees. Bioinformatics 2007, 23, 3119–3124.
48. Shimodaira, H.; Hasegawa, M. Multiple comparisons of log-likelihoods with applications to
phylogenetic inference. Mol. Biol. Evol. 1999, 16, 1114–1116.
49. Wlasiuk, G.; Nachman, M.W. Adaptation and constraint at Toll-like receptors in primates.
Mol. Biol. Evol. 2010, 27, 2172–2186.
50. Lemos de Matos, A.; McFadden, G.; Esteves, P.J. Positive evolutionary selection on the
RIG-I-Like receptor genes in mammals. PLoS One 2013, 8, e81864.
51. Spiropoulou, C. Molecular biology of hantavirus infection. In The Bunyaviridae: Molecular and
Cellular Biology; Plyusnin, A., Elliott, R.M., Eds.; Caister Academic Press: Norfolk, UK, 2011.
52. Lober, C.; Anheier, B.; Lindow, S.; Klenk, H.D.; Feldmann, H. The Hantaan virus glycoprotein
precursor is cleaved at the conserved pentapeptide WAASA. Virology 2001, 289, 224–229.
53. Shi, X.; Elliott, R.M. Golgi localization of Hantaan virus glycoproteins requires coexpression of
G1 and G2. Virology 2002, 300, 31–38.
54. Pons, J.; Barraclough, T.G.; Gomez-Zurita, J.; Cardoso, A.; Duran, D.P.; Hazell, S.; Kamoun, S.;
Sumlin, W.D.; Vogler, A.P. Sequence-based species delimitation for the DNA taxonomy of
undescribed insects. Syst. Biol. 2006, 55, 595–609.
55. Chevenet, F.; Jung, M.; Peeters, M.; de Oliveira, T.; Gascuel, O. Searching for virus phylotypes.
Bioinformatics 2013, 29, 561–570.
56. Lee, H.W.; Lee, P.W.; Johnson, K.M. Isolation of the etiologic agent of Korean Hemorrhagic
fever. J. Infect. Dis. 1978, 137, 298–308.
57. Holmes, E.C. The Evolution and Emergence of RNA Viruses; OUP Oxford: Oxford, UK, 2009.
58. Alexander, H.K.; Day, T. Risk factors for the evolutionary emergence of pathogens. J. R. Soc.
Interface 2010, 7, 1455–1474.
59. Cleaveland, S.; Laurenson, M.K.; Taylor, L.H. Diseases of humans and their domestic mammals:
Pathogen characteristics, host range and the risk of emergence. Philos. Trans. R. Soc. Lond. B
Biol. Sci. 2001, 356, 991–999.
60. Rubio, L.; Guerri, J.; Moreno, P. Genetic variability and evolutionary dynamics of viruses of the
family Closteroviridae. Front. Microbiol. 2013, 4, e151.
61. Wertheim, J.O.; Kosakovsky Pond, S.L. Purifying selection can obscure the ancient age of viral
lineages. Mol. Biol. Evol. 2011, 28, 3355–3365.
62. Murrell, B.; Wertheim, J.O.; Moola, S.; Weighill, T.; Scheffler, K.; Kosakovsky Pond, S.L.
Detecting individual sites subject to episodic diversifying selection. PLoS Genet. 2012, 8, e1002764.

Viruses 2014, 6
1132
63. Arikawa, J.; Schmaljohn, A.L.; Dalrymple, J.M.; Schmaljohn, C.S. Characterization of Hantaan
virus envelope glycoprotein antigenic determinants defined by monoclonal antibodies. J. Gen.
Virol. 1989, 70, 615–624.
64. Hooper, J.W.; Kamrud, K.I.; Elgh, F.; Custer, D.; Schmaljohn, C.S. DNA vaccination with
hantavirus M segment elicits neutralizing antibodies and protects against seoul virus infection.
Virology 1999, 255, 269–278.
65. Jenison, S.; Yamada, T.; Morris, C.; Anderson, B.; Torrez-Martinez, N.; Keller, N.; Hjelle, B.
Characterization of human antibody responses to four corners hantavirus infections among
patients with hantavirus pulmonary syndrome. J. Virol. 1994, 68, 3000–3006.
66. Gott, P.; Zoller, L.; Darai, G.; Bautz, E.K. A major antigenic domain of hantaviruses is located
on the aminoproximal site of the viral nucleocapsid protein. Virus Genes 1997, 14, 31–40.
67. Elgh, F.; Lundkvist, A.; Alexeyev, O.A.; Wadell, G.; Juto, P. A major antigenic domain for the
human humoral response to Puumala virus nucleocapsid protein is located at the amino-terminus.
J. Virol. Methods 1996, 59, 161–172.
68. Kaukinen, P.; Vaheri, A.; Plyusnin, A. Hantavirus nucleocapsid protein: A multifunctional
molecule with both housekeeping and ambassadorial duties. Arch. Virol. 2005, 150, 1693–1713.
69. Han, G.Z.; Worobey, M. Homologous recombination in negative sense RNA viruses. Viruses
2011, 3, 1358–1373.
70. Holmes, E.C. Molecular clocks and the puzzle of RNA virus origins. J. Virol. 2003, 77, 3893–3897.
71. Weidmann, M.; Ruzek, D.; Krivanec, K.; Zoller, G.; Essbauer, S.; Pfeffer, M.; Zanotto, P.M.;
Hufert, F.T.; Dobler, G. Relation of genetic phylogeny and geographical distance of tick-borne
encephalitis virus in central Europe. J. Gen. Virol. 2011, 92, 1906–1916.
72. Reznick, D.N.; Ricklefs, R.E. Darwin’s bridge between microevolution and macroevolution.
Nature 2009, 457, 837–842.
73. Faria, N.R.; Suchard, M.A.; Rambaut, A.; Lemey, P. Toward a quantitative understanding of
viral phylogeography. Curr. Opin. Virol. 2011, 1, 423–429.
74. Orton, R.J.; Wright, C.F.; Morelli, M.J.; Juleff, N.; Thebaud, G.; Knowles, N.J.;
Valdazo-Gonzalez, B.; Paton, D.J.; King, D.P.; Haydon, D.T. Observing micro-evolutionary
processes of viral populations at multiple scales. Philos. Trans. R. Soc. Lond. B Biol. Sci. 2013,
368, e20120203.
75. Holmes, E.C. Evolutionary history and phylogeography of human viruses. Annu. Rev. Microbiol.
2008, 62, 307–328.
76. Meyer, B.J.; Schmaljohn, C.S. Persistent hantavirus infections: Characteristics and mechanisms.
Trends Microbiol. 2000, 8, 61–67.
77. Plyusnin, A.; Morzunov, S.P. Virus evolution and genetic diversity of hantaviruses and their
rodent hosts. Curr. Top. Microbiol. Immunol. 2001, 256, 47–75.
78. Steinhauer, D.A.; Holland, J.J. Rapid evolution of RNA viruses. Annu. Rev. Microbiol. 1987, 41,
409–433.
79. Fang, L.Q.; Wang, X.J.; Liang, S.; Li, Y.L.; Song, S.X.; Zhang, W.Y.; Qian, Q.; Li, Y.P.;
Wei, L.; Wang, Z.Q.; et al. Spatiotemporal trends and climatic factors of hemorrhagic fever with
renal syndrome epidemic in Shandong Province, China. PLoS Negl. Trop. Dis. 2010, 4, e789.
Viruses 2014, 6
1133
80. Wei, L.; Qian, Q.; Wang, Z.Q.; Glass, G.E.; Song, S.X.; Zhang, W.Y.; Li, X.J.; Yang, H.;
Wang, X.J.; Fang, L.Q.; et al. Using geographic information system-based ecologic niche models
to forecast the risk of hantavirus infection in Shandong Province, China. Am. J. Trop Med. Hyg
2011, 84, 497–503.
81. Zou, Y.; Hu, J.; Wang, Z.X.; Wang, D.M.; Li, M.H.; Ren, G.D.; Duan, Z.X.; Fu, Z.F.; Plyusnin, A.;
Zhang, Y.Z. Molecular diversity and phylogeny of Hantaan virus in Guizhou, China: Evidence
for Guizhou as a radiation center of the present Hantaan virus. J. Gen. Virol. 2008, 89, 1987–1997.
82. Liu, J.; Liu, D.Y.; Chen, W.; Li, J.L.; Luo, F.; Li, Q.; Ling, J.X.; Liu, Y.Y.; Xiong, H.R.;
Ding, X.H.; et al. Genetic analysis of hantaviruses and their rodent hosts in central-south China.
Virus Res. 2012, 163, 439–447.
83. Lin, X.D.; Guo, W.P.; Wang, W.; Zou, Y.; Hao, Z.Y.; Zhou, D.J.; Dong, X.; Qu, Y.G.; Li, M.H.;
Tian, H.F.; et al. Migration of Norway rats resulted in the worldwide distribution of Seoul
hantavirus today. J. Virol. 2012, 86, 972–981.
84. Kang, Y.J.; Zhou, D.J.; Tian, J.H.; Yu, B.; Guo, W.P.; Wang, W.; Li, M.H.; Wu, T.P.; Peng, J.S.;
Plyusnin, A.; et al. Dynamics of hantavirus infections in humans and animals in Wuhan city,
Hubei, China. Infect. Genet. Evol. 2012, 12, 1614–1621.
85. Smith, S.A.; Beaulieu, J.M.; Stamatakis, A.; Donoghue, M.J. Understanding angiosperm
diversification using small and large phylogenetic trees. Am. J. Bot. 2011, 98, 404–414.
86. Virus Pathogen Database and Analysis Resource (ViPR)—Genome database with visualization
and analysis tools. Available online: http://www.viprbrc.org/ (accessed on 1 October 2013).
87. Pond, S.L.; Frost, S.D.; Muse, S.V. HyPhy: Hypothesis testing using phylogenies. Bioinformatics
2005, 21, 676–679.
88. Pond, S.L.; Frost, S.D. Datamonkey: Rapid detection of selective pressure on individual sites of
codon alignments. Bioinformatics 2005, 21, 2531–2533.
89. Delport, W.; Poon, A.F.; Frost, S.D.; Kosakovsky Pond, S.L. Datamonkey 2010: A suite of
phylogenetic analysis tools for evolutionary biology. Bioinformatics 2010, 26, 2455–2457.
90. Adaptive Evolution Server @ Datamonkey.org. Available online: http://www.datamonkey.org/
(accessed on 1 January 2014).
91. Murrell, B.; Moola, S.; Mabona, A.; Weighill, T.; Sheward, D.; Kosakovsky Pond, S.L.;
Scheffler, K. FUBAR: A fast, unconstrained bayesian approximation for inferring selection.
Mol. Biol. Evol. 2013, 30, 1196–1205.
92. Gouy, M.; Guindon, S.; Gascuel, O. SeaView version 4: A multiplatform graphical user interface
for sequence alignment and phylogenetic tree building. Mol. Biol. Evol. 2010, 27, 221–224.
93. Tamura, K.; Peterson, D.; Peterson, N.; Stecher, G.; Nei, M.; Kumar, S. MEGA5: Molecular
evolutionary genetics analysis using maximum likelihood, evolutionary distance, and maximum
parsimony methods. Mol. Biol. Evol. 2011, 28, 2731–2739.
94. Guindon, S.; Dufayard, J.F.; Lefort, V.; Anisimova, M.; Hordijk, W.; Gascuel, O. New
algorithms and methods to estimate maximum-likelihood phylogenies: Assessing the
performance of PhyML 3.0. Syst. Biol. 2010, 59, 307–321.
95. De Vienne, D. Icong Congruence Index. Available online: http://max2.ese.u-psud.fr/icong/
(accessed on 1 October 2013).

Viruses 2014, 6
1134
96. Swofford, D.L. PAUP*. Phylogenetic Analysis Using Parsimony (*and Other Methods), Version 4;
Sinauer Associates: Sunderland, MA, USA, 2002.
97. Charleston, M. Cophylogeny. Available online: https://sites.google.com/site/cophylogeny/software
(accessed on 1 October 2013).
98. Drummond, A.J.; Suchard, M.A.; Xie, D.; Rambaut, A. Bayesian phylogenetics with BEAUti
and the BEAST 1.7. Mol. Biol. Evol. 2012, 29, 1969–1973.
99. Drummond, A.J.; Rawlence, N.; Rambaut, A. A rough guide to BEAST 1.4. Available online:
http://beast.bio.ed.ac.uk/Main_Page/ (accessed on 1 February 2013).
100. Nee, S.; May, R.M.; Harvey, P.H. The reconstructed evolutionary process. Philos. Trans. R. Soc.
Lond. B Biol. Sci. 1994, 344, 305–311.
101. Rabosky, D.L. Likelihood methods for detecting temporal shifts in diversification rates.
Evolution 2006, 60, 1152–1164.
102. Paradis, E.; Claude, J.; Strimmer, K. APE: Analyses of phylogenetics and evolution in R
language. Bioinformatics 2004, 20, 289–290.
103. Rambaut, A.; Suchard, M.A.; Xie, D.; Drummond, A.J. Tracer v1.5. Available online:
http://beast.bio.ed.ac.uk/Tracer (accessed on 4 March 2014).
104. Harmon, L.J.; Weir, J.T.; Brock, C.D.; Glor, R.E.; Challenger, W. GEIGER: Investigating
evolutionary radiations. Bioinformatics 2008, 24, 129–131.
105. Shah, P.; Fitzpatrick, B.M.; Fordyce, J.A. A parametric method for assessing diversification-rate
variation in phylogenetic trees. Evolution 2013, 67, 368–377.
106. Monaghan, M.T.; Wild, R.; Elliot, M.; Fujisawa, T.; Balke, M.; Inward, D.J.; Lees, D.C.;
Ranaivosolo, R.; Eggleton, P.; Barraclough, T.G.; et al. Accelerated species inventory on
Madagascar using coalescent-based models of species delineation. Syst. Biol. 2009, 58, 298–311.
107. Zhang, J.; Kapli, P.; Pavlidis, P.; Stamatakis, A. A general species delimitation method with
applications to phylogenetic placements. Bioinformatics 2013, 29, 2869–2876.
108. Zhang, J. Species delimitation server. Available online: http://species.h-its.org/ptp/ (accessed on
1 November 2013).
109. Stamatakis, A. RAxML-VI-HPC: Maximum likelihood-based phylogenetic analyses with
thousands of Taxa and Mixed Models. Bioinformatics 2006, 22, 2688–2690.
110. Alfaro, M.E.; Santini, F.; Brock, C.; Alamillo, H.; Dornburg, A.; Rabosky, D.L.; Carnevale, G.;
Harmon, L.J. Nine exceptional radiations plus high turnover explain species diversity in jawed
vertebrates. Proc. Natl. Acad. Sci. USA 2009, 106, 13410–13414.
111. PhyloType. Available online: http://phylotype.org/ (accessed on 1 June 2013).
112. Kühnert, D.; Stadler, T.; Vaughan, T.G.; Drummond, A.J. Simultaneous reconstruction of
evolutionary history and epidemiological dynamics from viral sequences with the birth-death SIR
model. arXiv 2013, arXiv:1308.5140.
113. EDENext. Available online: http://www.edenext.eu/ (accessed on 25 February 2014).
© 2014 by the authors; licensee MDPI, Basel, Switzerland. This article is an open access article
distributed under the terms and conditions of the Creative Commons Attribution license
(http://creativecommons.org/licenses/by/3.0/).