Change Regularity of Taste and the Performance of ... - MDPI
16
foods Article Change Regularity of Taste and the Performance of Endogenous Proteases in Shrimp (Penaens vannamei) Head during Autolysis Shujian Wu 1,2 , Mouming Zhao 1,3 , Shijue Gao 1,2 , Yue Xu 1 , Xiaoying Zhao 1 , Mingyuan Liu 1 and Xiaoling Liu 1, * Citation: Wu, S.; Zhao, M.; Gao, S.; Xu, Y.; Zhao, X.; Liu, M.; Liu, X. Change Regularity of Taste and the Performance of Endogenous Proteases in Shrimp (Penaens vannamei) Head during Autolysis. Foods 2021, 10, 1020. https://doi.org/10.3390/ foods10051020 Academic Editors: Biniam Kebede and Graham T. Eyres Received: 25 March 2021 Accepted: 5 May 2021 Published: 8 May 2021 Publisher’s Note: MDPI stays neutral with regard to jurisdictional claims in published maps and institutional affil- iations. Copyright: © 2021 by the authors. Licensee MDPI, Basel, Switzerland. This article is an open access article distributed under the terms and conditions of the Creative Commons Attribution (CC BY) license (https:// creativecommons.org/licenses/by/ 4.0/). 1 College of Light Industry and Food Engineering, Guangxi University, Nanning 530004, China; [email protected] (S.W.); [email protected] (M.Z.); [email protected] (S.G.); [email protected] (Y.X.); [email protected] (X.Z.); [email protected] (M.L.) 2 Department of Food Science and Technology, College of Science & Engineering, Jinan University, Guangzhou 510632, China 3 School of Food Science and Engineering, South China University of Technology, Guangzhou 510640, China * Correspondence: [email protected] Abstract: This study evaluated the food safety and proximate composition of shrimp head (SH). Potentially toxic elements in SH were below European Union legislation limits. SH had a high content of tasting amino acids (sweet and umami amino acids was 57%) and a high content of functional amino acids (essential amino acids was 37%). Moreover, the changes of flavor and key umami molecules in SH were studied by sensory evaluation, electronic tongue, electronic nose, automated amino acid analyzer, and high performance liquid chromatography (HPLC). The results showed that the significant difference of flavor in SH happened during autolysis. SH with autolysis had the best umami taste at 6 h, which may result from the synergistic work of free amino acids and nucleotide related compounds. Additionally, the performance of endogenous proteases in SH was investigated to efficiently analyze autolysis. The optimum pH and temperature of endogenous proteases in SH were 7.5 and 50 ◦ C, respectively. The autolysis of SH depends on two endogenous proteases (~50 kDa and ~75 kDa). These results suggest that the formation of flavor in SH during autolysis can be controlled, which could provide guidance for SH recycle. SH could consider as one of the food materials for producing condiments. Keywords: shrimp head; autolysis; taste; umami; endogenous proteases 1. Introduction Shrimp and shrimp products are widely popular all over the world and their demand is increasing yearly owing to the nutritional characteristics and meat taste. In China, it is estimated that shrimp industries produced over 1,000,000 t of shrimp in 2011 [1]. Generally, shrimp head (SH) is removed in shrimp processing industries, and it accounts for about 35–45% of total shrimp weight [2,3]. It results in more than 300,000 t of SH annually [4]. With the ease of spoilage, SH wastes have been a severe environmental disaster, including waste collection, disposal, and pollution problems. Therefore, there is a need to make use of such wastes in the most efficient manner. Economical and efficient use of SH would minimize the pollution problem while maximizing the profitability of the processor. SH is a rich source of protein and nutritive components (minerals, carotenoid, etc.) [5,6]. Moreover, some studies reported that the amino acid (AAs) compositions of SH (Penaeus vannamei) contribute to a good taste and nutritional value [2,3]. Thus, hydrolysates derived from SH could be used as raw materials in food supplements or flavor enhancers. There are many endogenous proteases, such as trypsin and chymotrypsin, in the viscera of SH, which lead to degrading tissue proteins by autolysis [2,7,8]. Autolysis is an efficient method to obtain hydrolysates from SH without expensive exogenous enzymes. Meanwhile, the relationship between the formation of flavor and autolysis is a key factor Foods 2021, 10, 1020. https://doi.org/10.3390/foods10051020 https://www.mdpi.com/journal/foods
-
Upload
khangminh22 -
Category
Documents
-
view
0 -
download
0
Transcript of Change Regularity of Taste and the Performance of ... - MDPI

foods
Article
Change Regularity of Taste and the Performance of EndogenousProteases in Shrimp (Penaens vannamei) Head during Autolysis
Shujian Wu 1,2, Mouming Zhao 1,3, Shijue Gao 1,2, Yue Xu 1, Xiaoying Zhao 1, Mingyuan Liu 1 and Xiaoling Liu 1,*
�����������������
Citation: Wu, S.; Zhao, M.; Gao, S.;
Xu, Y.; Zhao, X.; Liu, M.; Liu, X.
Change Regularity of Taste and the
Performance of Endogenous Proteases
in Shrimp (Penaens vannamei) Head
during Autolysis. Foods 2021, 10, 1020.
https://doi.org/10.3390/
foods10051020
Academic Editors: Biniam Kebede
and Graham T. Eyres
Received: 25 March 2021
Accepted: 5 May 2021
Published: 8 May 2021
Publisher’s Note: MDPI stays neutral
with regard to jurisdictional claims in
published maps and institutional affil-
iations.
Copyright: © 2021 by the authors.
Licensee MDPI, Basel, Switzerland.
This article is an open access article
distributed under the terms and
conditions of the Creative Commons
Attribution (CC BY) license (https://
creativecommons.org/licenses/by/
4.0/).
1 College of Light Industry and Food Engineering, Guangxi University, Nanning 530004, China;[email protected] (S.W.); [email protected] (M.Z.); [email protected] (S.G.);[email protected] (Y.X.); [email protected] (X.Z.); [email protected] (M.L.)
2 Department of Food Science and Technology, College of Science & Engineering, Jinan University,Guangzhou 510632, China
3 School of Food Science and Engineering, South China University of Technology, Guangzhou 510640, China* Correspondence: [email protected]
Abstract: This study evaluated the food safety and proximate composition of shrimp head (SH).Potentially toxic elements in SH were below European Union legislation limits. SH had a high contentof tasting amino acids (sweet and umami amino acids was 57%) and a high content of functionalamino acids (essential amino acids was 37%). Moreover, the changes of flavor and key umamimolecules in SH were studied by sensory evaluation, electronic tongue, electronic nose, automatedamino acid analyzer, and high performance liquid chromatography (HPLC). The results showedthat the significant difference of flavor in SH happened during autolysis. SH with autolysis hadthe best umami taste at 6 h, which may result from the synergistic work of free amino acids andnucleotide related compounds. Additionally, the performance of endogenous proteases in SH wasinvestigated to efficiently analyze autolysis. The optimum pH and temperature of endogenousproteases in SH were 7.5 and 50 ◦C, respectively. The autolysis of SH depends on two endogenousproteases (~50 kDa and ~75 kDa). These results suggest that the formation of flavor in SH duringautolysis can be controlled, which could provide guidance for SH recycle. SH could consider as oneof the food materials for producing condiments.
Keywords: shrimp head; autolysis; taste; umami; endogenous proteases
1. Introduction
Shrimp and shrimp products are widely popular all over the world and their demandis increasing yearly owing to the nutritional characteristics and meat taste. In China, it isestimated that shrimp industries produced over 1,000,000 t of shrimp in 2011 [1]. Generally,shrimp head (SH) is removed in shrimp processing industries, and it accounts for about35–45% of total shrimp weight [2,3]. It results in more than 300,000 t of SH annually [4].With the ease of spoilage, SH wastes have been a severe environmental disaster, includingwaste collection, disposal, and pollution problems. Therefore, there is a need to make useof such wastes in the most efficient manner.
Economical and efficient use of SH would minimize the pollution problem whilemaximizing the profitability of the processor. SH is a rich source of protein and nutritivecomponents (minerals, carotenoid, etc.) [5,6]. Moreover, some studies reported that theamino acid (AAs) compositions of SH (Penaeus vannamei) contribute to a good taste andnutritional value [2,3]. Thus, hydrolysates derived from SH could be used as raw materialsin food supplements or flavor enhancers.
There are many endogenous proteases, such as trypsin and chymotrypsin, in theviscera of SH, which lead to degrading tissue proteins by autolysis [2,7,8]. Autolysis is anefficient method to obtain hydrolysates from SH without expensive exogenous enzymes.Meanwhile, the relationship between the formation of flavor and autolysis is a key factor
Foods 2021, 10, 1020. https://doi.org/10.3390/foods10051020 https://www.mdpi.com/journal/foods

Foods 2021, 10, 1020 2 of 16
for SH recycle in food products. However, there is little information about the autolysis ofSH, especially the influence on flavor. Electronic tongue (E-tongue) and electronic nose(E-nose) are an array of sensors to simulate the tongue and nose of humans, which areefficient analytical tools in food flavor [9]. Therefore, in order to make full use of SH andautolysis, the change regularity of flavor in SH during autolysis was studied by E-tongueand E-nose in this study. Additionally, the free amino acids (FAAs) and nucleotide-relatedcompounds in SH were analyzed during autolysis by an automated amino acid analyzerand HPLC. Moreover, total volatile basic nitrogen (TVB-N) is one of the biomarkers ofprotein and amine degradation [10], which is measured in seafood to reveal microbiologicalspoilage [11]. We determined the level of TVB-N in SH to ensure its food safety. On theother hand, the reaction times and efficiency of autolysis are affected by the kinds ofendogenous proteases and autolysis conditions that included temperature, pH, etc. Theperformance of endogenous proteases was further investigated in the present study. Theaim of this study was to research an effective and low-cost autolysis method for SH recycle,which can provide guidance in the shrimp industry through reasonably control autolysis.
2. Materials and Methods2.1. Materials and Chemicals
SH was obtained by Guangxi Zhengwu Marine Industry Co., Ltd. (Beihai, China).Fresh SH was stored on ice with clean sanitized containers after obtaining them from thewhole shrimp, which was transported to the laboratory and processed immediately.
The standards of the nucleotide flavor compound were purchased from ShanghaiOcean Biotechnology Co., Ltd. (Shanghai, China), which were used to make a standardcurve for the determination of nucleotide flavor compounds in SH. Methanol was of HPLCgrade. Other chemicals were only used for analytical grade reagents.
2.2. Determination of Pb, Cd, Hg, As, and Proximate Composition
Toxic elements (Pb, As, Hg, and Cd) in SH were determined by ICP–AES. The methodwas described in detail by Albuquerque et al. [12]. The SH was dried at 105 ◦C for 24 h todetermine moisture content, the protein was determined by the Kjeldahl method, and theSH was incinerated at 550 ◦C for the determination of ash.
2.3. Autolysis of SH
The autolysis of SH was conducted by the method of Cao et al. [2], with some modifi-cations. The fresh SH was ground by a stirrer (JYL-C022E, Joyoung Co., Ltd., Shandong,China). After that, the SH were placed into a sterilized beaker and put into a water bath at25 ◦C to autolysis (simulated ambient temperature). The reaction was terminated after thereaction up to 10 h.
2.4. Determination of TVB-N
The determination of TVB-N was according to in accordance with the Chinese Stan-dard GB 5009.228-2016 [13]. The analysis includes a perchloric acid extraction, followedby alkalization and steam distillation by Kjeldahl Instrument (SKD.600, Peiou AnalysisInstrument Co., Ltd., Shanghai, China). The boric acid solution was used to absorb thetotal volatile bases. After that, the TVB-N value was titrated with a hydrochloric solution.
2.5. Determination of AAs
The composition of AAs was measured through a fully automated amino acid analyzer(L-8900, Hitachi, Japan) by the method described by Cao et al. [2]. Briefly, samples (2 g)were added into 6 mol/L HCl (10 mL). The mixture was sealed and degraded at 110 ◦Cfor 22 h. After that, the hydrolysate was filtered by a filter paper, and then the solutionwas mixed with ultrapure water to a final volume of 50 mL. A total of 1 mL of the samplesolution was added to a 10 mL volumetric flask in a water bath at 60 ◦C to remove HCl,

Foods 2021, 10, 1020 3 of 16
and then the solution was mixed with ultrapure water to 10 mL. The sample was filteredvia a 0.22 µm filter before determination.
FAAs were analyzed by the method of Dabadé et al. [14]. Sample (5 g) and 15 mLwater were added to the beaker and stored at 4 ◦C for 15 min. Then, 10% trichloroaceticacid (TCA, 15 mL) was added to scale to precipitate the peptide or protein, followed byincubation at 4 ◦C for 15 min, and then centrifuged at 10,000 r/min for 10 min (5418R,Eppendorf, Germany). The supernatant was diluted to 250 mL in a volumetric flask with10% TCA. The sample was filtered via a 0.22 nm filter and stored at 4 ◦C before assay.
2.6. Determination of Nucleotide-Related Compounds
The determination of nucleotide-related compounds was modestly modified accordingto the methods reported by Zhang et al. [15]. The homogenized SH and ultrapure waterwere added into a beaker 1:3 (g:mL) and then stored at 4 ◦C for 30 min with a magneticstirrer. The mixture was centrifuged at 6000 r/min (4 ◦C, 10 min) to obtain a supernatant.After that, the supernatant (5 mL) and 8% perchloric acid (15 mL) were added into abeaker and stored at refrigerator (4 ◦C,10 min), then centrifuged at 6000 r/min (4 ◦C,10 min). The supernatant was collected. The precipitate was repeated again and pooled thesupernatants. Afterward, the pH of supernatants was adjusted to 6.5 by KOH with differentconcentrations. The neutralized supernatant was diluted to 100 mL with neutralizedperchloric acid (pH 6.5). The sample was filtered via a 0.22 nm filter. The resulting solutionwas analyzed by HPLC (Waters e2695, Milford, MA, USA) and UV/Visible Detector (Waters2489, Milford, MA, USA).
The column was an Agilent C18 column (4.6 mm × 250 mm, 5 µm). The Columntemperature was 25 ◦C, and the injection volume was 10 µL. Additionally, mobile phase: A,KH2PO4 / K2HPO4 buffer (pH 6.5); B, methanol. All solvents were filtered and degassedbefore use. Detection at 254 nm. Speed: 0.7 mL/min. Gradient of elution: 0–6 min, 98% Aand 2% B; 6–10 min, B increased to 5%, A reduced to 95%; 10–14 min, B increased to 15%,A reduced to 85%; 14–18 min, B reduced by 10%, A increase to 90%; 18–25 min, B reductionof 5%, B increased to 95%. The column was equilibrated for 5 min before the next sample.
2.7. Sensory Evaluation
The sensory evaluation was the method of Yu et al. [16] and the Chinese Standard(GB/T 12312 and GB/T 12315) [17,18]. All panelists (eight members, half males and half fe-males) were screened by Chinese Standard GB/T 12312 (Sensory analysis—Methodology—Method of investigating the sensitivity of taste, MOD) [17]. These people could recognizethe umami solution and had received training in descriptive sensory analysis. The homog-enized SH and pure water were mixed at the final substrate concentration to 1:3 (g:mL)and stored at 4 ◦C for 20 min with a magnetic stirrer. The mixture was centrifuged at8000 r/min for 10 min and obtain the supernatant. The soluble solids content of the super-natant was adjusted 1% (Sugar Refrectometer, WZS, Jingke, China) with pure water forsensory analysis. Sensory evaluation was a ranking test according to the Chinese StandardGB/T 12315 (Sensory analysis—Methodology—Ranking) [18]. Every sample was randomlynumbered before the experiment to hide its information. Every panelist ranked the samplesaccording to the intensity of umami taste (from 1 to 6, no same rank). The experiment wascarried out in an air-conditioned room (25 ± 2 ◦C), and panelists were separated in eachbooth. The results were analyzed by the Friedman test [18].
F test =12
j.p (p + 1)(R2
1 + . . . + R2x + R2
y)− 3j(p + 1) (1)
Least Significant Difference (LSD) = z
√j.p(p + 1)
6(2)
where F test > F means the significant difference among all samples; Rx – Ry > LSD meansthe significant difference between the sample of x and the sample of y. j = the number of

Foods 2021, 10, 1020 4 of 16
panelists; p = the number of samples; R1 = the rank sum of the sample, which was rankedfirst in all samples, etc. to Rx, Ry; the value of z and F were 1.96 and 10.68, respectively,when j = 6 and p = 8, which were obtained from the table of Friedman test according to theChinese Standard GB/T 12315.
2.8. E-tongue Analysis
E-tongue analysis was performed by TS-5000Z (Insent, Kanagawa, Japan). Samplepreparation was consistent with sensory evaluation. The experiment was determined bythe method of Zhu et al. [19]. A 50 mL sample was put into a cup. The measure progresswas “maintenance measurement.” Four replicates were completed for each group and thenretained three stable sets of data. The detailed information of five chemical sensors inE-tongue is in Table S1.
2.9. E-nose analysis
The experiment was according to the method from Zhu et al. [19] (PEN3, Germany).Briefly, a 15.00 g homogenized sample was placed into a 150 mL sterilized beaker andsealed the top. Then, the sample was equilibrated (10 min, 25 ◦C) to minimize sensor driftdue to environmental changes [19]. The flush time, presampling time, and measurementtime were 60 s, 5 s, and 70 s, respectively. Every sample was determined three times. Fourreplicates were completed for each group and then retained three stable sets of data. thestatistically significant difference (p < 0.05) in the mean of each sensor was obtained by theleast significant difference (LSD) test [19,20]. The detailed information of the 10 chemicalsensors in E-nose is in Table S2.
2.10. Determination of pH Value
The pH of homogenized SH was determined based on the method from Shi et al. [21].
2.11. Determination of Endogenous Enzyme Activity
The determination of endogenous enzyme ratio activity was determined by themethod from Hang et al. [22]. Briefly, 4 mL of Tris-HCl buffer (pH 7, 0.05mol/L) and1.6mL of 1% casein solution were placed into two test tubes, numbered I and II, respectively.Then, 2.4 mL of 10% TCA was added in I (as control, to inhibit the action of enzymes),and the two test tubes were put into a water bath (35 ◦C) for 5 min. After that, a 0.8mL sample was added into I and II and incubated at 35 ◦C for 15 min. Next, 10% TCA(2.4 mL) was added in II. Finally, the resulting solution was centrifuged at 10,000 r/minfor 15 min to obtain the supernatant, of which the absorbance was measured by UV-6100spectrophotometer (Shanghai Meipuda Instrument Co., Ltd. Shanghai, China) at 275 nm.One unit (U/mL) of enzyme activity was defined as the amount of enzyme capable ofhydrolyzing casein to produce a 0.001-unit change in absorbance per minute [23].
a (U/mL) =∆OD
15min × 0.001 × 0.8 mL(3)
Different pH for extraction of SH crude extract (CE) was determined in our preliminaryresearch (Figure S1). the optimal pH to obtain CE was 7.5. The homogenized SH and Tris-HCl buffer was added into a beaker (1:4 (g:mL)) and stored at 4 ◦C with a magnetic stirrer(5 min). The solution was centrifuged at 8000 r/min for 10 min to obtain a supernatant forfuture experiments.
2.12. Separation of Enzyme
The CE was precipitated with saturated ammonium sulfate solution (30%) at 4 ◦Cfor 1 h. The supernatant was obtained from the mixture by centrifuged at 10,000 r/min(4 ◦C, 15 min). Afterward, the supernatant was precipitated with saturated ammoniumsulfate solution (60%) at 4 ◦C for 1 h. The precipitate was obtained by centrifuged at10,000 r/min (4 ◦C, 15 min). The precipitate was redissolved with three times volume

Foods 2021, 10, 1020 5 of 16
of Tris-HCl buffer, which was crude endogenous proteases (CEP). The CEP was furtherseparated by DEAE-Sepharose FF column chromatography. The column temperature was25 ◦C, and injection volume was 5 mL. The detection wavelength was 280 nm. Collection:10 min/tube. Speed: 1 mL/min. Gradient of elution by NaCl with different concentration(first, 80 mL, 0.25 mol/L; then, 80 mL, 0.50 mol/L; final, 80 mL, 1 mol/L).
Enzyme ratio activity (U/mg protein) =Enzyme activity of sampleProtein content of sample
(4)
Recovery rate of enzyme activity (%) =Total enzyme activity of sample
Total enzyme activity of CE× 100 (5)
Purification factor =Enzyme ratio activity of sample
Enzyme ratio activity of CE(6)
2.13. SDS–PAGE
The SDS–PAGE was based on the method described by Beloborodov et al. [24]. A totalof 20 µL sample and 80 µL 5 × SDS–PAGE loading buffer were mixed in a tube and thenput into boiling water bath for 10 min. The separation gel was 12% polyacrylamide gel.
2.14. Statistical Analysis
The experimental data were analyzed by SPSS 19.0 (SPSS Corporation, Chicago, IL,USA) with a one-way analysis of variance (ANOVA) and the Duncan procedure betweenmeans. Ranking data of the sensory evaluation were analyzed using the Friedman test.
3. Results3.1. Food Safety and Proximate Composition of SH
Table 1 shows that that the concentrations of Pb, Cd, and Hg were below the max-imum level of seafood, which was set by the European Commission legislation (ECR)No 1881/2006 and amendments [25]. The concentration of As was not detected. Thesedata indicated that the SH complied with the standard of food safety. Table 2 showsthat the moisture content, ash, and protein were 77.47% ± 0.05%, 4.47% ± 0.01%, and10.32% ± 0.09%, respectively, in SH, which suggested that SH is one of the rich sourcesfor proteins. Additionally, the inedible range of TVB-N for raw shrimps is >30 mg/100 gin the standard of China [26]. As Figure 1 shows, the accepted range of TVB-N for SH isautolysis within 10 h (26.37 mg/100 g). Thus, we studied the change regularity of flavor inSH within 10 h.
Table 1. The concentrations of Pb, As, Cd, and Hg in SH (dry basis, mg/kg).
Toxic Elements Limit of ECR Concentrations in SH
Pb ≤0.5 0.03As Not established Not detectedCd ≤0.5 0.26Hg ≤0.5 0.01
Table 2. The concentrations of proximate composition in SH (wet basis, %).
Moisture Content Crude Ash Protein
77.47 ± 0.05 4.47 ± 0.01 10.32 ± 0.09

Foods 2021, 10, 1020 6 of 16
Foods 2021, 10, x FOR PEER REVIEW 6 of 16
Table 2. The concentrations of proximate composition in SH (wet basis, %).
Moisture Content Crude Ash Protein 77.47 ± 0.05 4.47 ± 0.01 10.32 ± 0.09
Figure 1. Changes of TVB-N in shrimp head during autolysis.
The composition of AAs is a key role in SH when it is used as a raw material for condiments. As shown in Table 3, the SH almost meets the FAO/WHO (1973) require-ments that essential amino acids (EAAs) and the value of the ratio in EAAs to nonessential amino acids (NEAAs) are 40% and 0.6 in foods, respectively [27,28]. The EAAs and EAAs/NEAAs were 37% and 0.57 in SH, respectively. Furthermore, there is an abundance of total sweet and umami amino acids (SUAAs, 57%) in SH. Therefore, SH is one of the good materials to produce condiments.
Table 3. Composition of amino acids in shrimp head (wet basis, mg/g).
Amino Acid Content Glycine 7.62 ± 0.08 Alanine 5.86 ± 0.02 Histidine 2.32 ± 0.19 Tyrosine 4.68 ± 0.55 Serine 3.95 ± 0.05 Cysteine 0.40 ± 0.05 Aspartic acid 8.23 ± 0.08 Glutamic acid 15.46 ± 0.17 Arginine 8.98 ± 0.11 Proline 6.75 ± 0.05 Leucine 6.98 ± 0.08 Isoleucine 3.77 ± 0.03 Valine 4.35 ± 0.04 Threonine 3.77 ± 0.04 Methionine 5.18 ± 0. 34 Phenylalanine 5.28 ± 0.51 Lysine 7.20 ± 0.26 Total amino acids (TAAs) 100.83 ± 1.68 Essential amino acids (EAAs) 36.55 ± 0.54 Nonessential amino acids (NEAAs)
64.27 ± 1.15
Sweet and umami amino acids 56.84 ± 0.43
Figure 1. Changes of TVB-N in shrimp head during autolysis.
The composition of AAs is a key role in SH when it is used as a raw material forcondiments. As shown in Table 3, the SH almost meets the FAO/WHO (1973) requirementsthat essential amino acids (EAAs) and the value of the ratio in EAAs to nonessential aminoacids (NEAAs) are 40% and 0.6 in foods, respectively [27,28]. The EAAs and EAAs/NEAAswere 37% and 0.57 in SH, respectively. Furthermore, there is an abundance of total sweetand umami amino acids (SUAAs, 57%) in SH. Therefore, SH is one of the good materials toproduce condiments.
Table 3. Composition of amino acids in shrimp head (wet basis, mg/g).
Amino Acid Content
Glycine 7.62 ± 0.08Alanine 5.86 ± 0.02Histidine 2.32 ± 0.19Tyrosine 4.68 ± 0.55Serine 3.95 ± 0.05Cysteine 0.40 ± 0.05Aspartic acid 8.23 ± 0.08Glutamic acid 15.46 ± 0.17Arginine 8.98 ± 0.11Proline 6.75 ± 0.05Leucine 6.98 ± 0.08Isoleucine 3.77 ± 0.03Valine 4.35 ± 0.04Threonine 3.77 ± 0.04Methionine 5.18 ± 0. 34Phenylalanine 5.28 ± 0.51Lysine 7.20 ± 0.26Total amino acids (TAAs) 100.83 ± 1.68Essential amino acids (EAAs) 36.55 ± 0.54Nonessential amino acids(NEAAs) 64.27 ± 1.15
Sweet and umami amino acids(SUAAs) 56.84 ± 0.43
SUAAs/TAAs 57%EAAs/TAAs 37%EAAs: NEAAs 0.57
Umami amino acids including aspartic acid, glutamic acid; sweet amino acids including threonine, serine,methionine, glycine, proline, alanine.

Foods 2021, 10, 1020 7 of 16
3.2. Change Regularity of Taste in SH during Autolysis
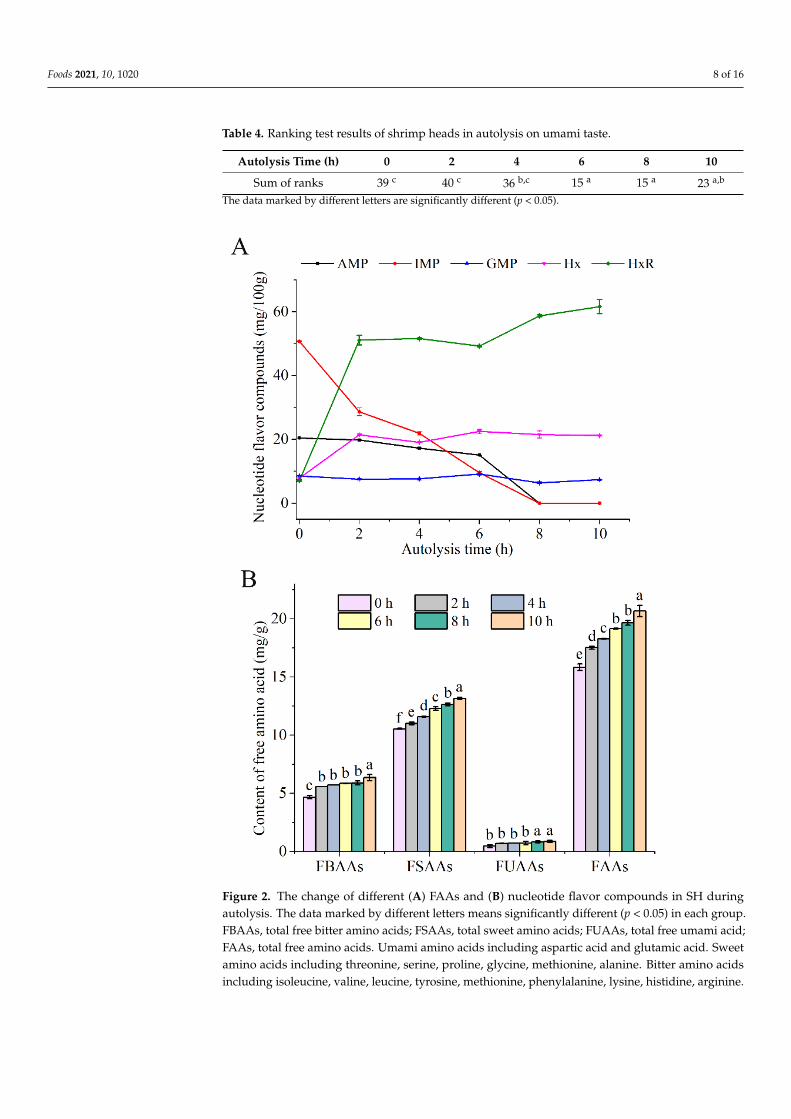
One of the important parts of the taste of shrimp and shrimp products is umamitaste [19,29]; hence, we mainly focused on the umami change of taste in SH during au-tolysis. The SH was evaluated and recognized by panelists during autolysis. The resultsshowed that the flavor of SH had the best umami taste at 6 h and 8 h during autolysis(Table 4), but some panelists taste a fishy smell in SH with autolysis at 8 h during sensoryevaluation. Generally, FAAs and nucleotide-flavor compounds are key umami moleculesin foods, which had the ability to improve the flavor of the sample [30–32]. There areumami, sourness, sweetness, saltiness, and bitterness taste in AAs, which contribute toincreasing the flavor in food [33]. The major flavor enhancer nucleotides, such as inosinemonophosphate (IMP), adenosine monophosphate (AMP), and guanosine monophosphate(GMP), can present umami taste at low levels [34]. Inosine (HxR) and hypoxanthine (Hx)can present bitterness [15]. AMP, IMP, GMP, HxR, and Hx are from the degradation ofATP during autolysis in aquatic products, which plays an important role in the changes offlavor [34,35]. Therefore, we determined the change of these compounds during autolysis.The bitter amino acids (FBAAs), Hx, and HxR were significantly increased in the earlystages of autolysis (Figure 2), which may result in off-flavor. The interaction between Hxand certain AAs can also result in a bitter taste [36]. However, the flavor was influencedby the synergistic work of different flavor components. The decreased trend of AMP andIMP was observed during autolysis, even completely degraded at 8 h, while the sweetamino acids (FSAAs) were increased (Figure 2). The umami taste can be improved by thesynergistic effect of IMP and FSAAs (e.g., alanine, serine, and glycine) [30,37]. Comparedwith a single compound, The synergistic effect of some AAs and GMP, adenosine diphos-phate (ADP), and AMP express greater umami taste [32]. At 6 h, the FBAAs and HxR werenot further increased, but the FSAAs were increased. There are also AMP, GMP, and IMP.After 8 h, a significant increase of FBAAs and HxR and the disappearance of AMP andIMP were observed, which may be one of the reasons for the decrease of umami taste inSH (Figure 2). Thus, SH had good umami taste in autolysis at 6 h, which may explain theumami taste results of sensory evaluation.
3.3. E-Tongue and E-Nose Response Signal of SH during Autolysis
In order to evaluate the changes of taste characterizations during autolysis, SH withautolysis was analyzed by the E-tongue and E-nose. The principal component analysis(PCA) of E- tongue and the linear discriminant analysis (LDA) of E-nose are shown inFigures 3A and 4A, respectively. The total contribution rate of PCA and LDA was 99.36%(PC1, 94.78%; PC2, 4.58%) and 95.43% (LD1, 70.49%; LD2, 24.94%), respectively, whichindicated that PCA and LDA can be used to reflect the changes of flavor with a large amountof information in SH during autolysis [38,39]. The data suggested that the differentiationof the groups was good. Thus, the difference of flavor in SH during autolysis can bedistinguished and sensed by artificial senses (E-tongue and E-nose). On the other hand, thesample of 4 h and 6 h were close to each other and located further from point 8 h (Figure 3A),which suggested that taste compounds may be similar in samples of 4 h and 6 h, whilethey were different in the sample of 8 h. According to the results of enzymatic activity(Figure 5B), the enzymatic activity reached lowest at 4 h and then gradually increased. Ahigher level of enzymatic activity was maintained after 6 h. Thus, the more taste compoundmay be produced due to the enhancement of the autolysis rate after 6 h, which lead to thesignificant difference in taste in SH. These results implied there was a significant differencein flavor in SH during autolysis. The result of E-tongue and E-nose have consistency withthe sensory evaluation results.
Foods 2021, 10, 1020 8 of 16
Table 4. Ranking test results of shrimp heads in autolysis on umami taste.
Autolysis Time (h) 0 2 4 6 8 10
Sum of ranks 39 c 40 c 36 b,c 15 a 15 a 23 a,b
The data marked by different letters are significantly different (p < 0.05).
Foods 2021, 10, x FOR PEER REVIEW 8 of 16
Figure 2. The change of different (A) FAAs and (B) nucleotide flavor compounds in SH during autolysis. The data marked by different letters means significantly different (p < 0.05) in each group. FBAAs, total free bitter amino acids; FSAAs, total sweet amino acids; FUAAs, total free umami acid; FAAs, total free amino acids. Umami amino acids including aspartic acid and glu-tamic acid. Sweet amino acids including threonine, serine, proline, glycine, methionine, alanine. Bitter amino acids including isoleucine, valine, leucine, tyrosine, methionine, phenylalanine, ly-sine, histidine, arginine.
3.3. E-Tongue and E-Nose Response Signal of SH during Autolysis In order to evaluate the changes of taste characterizations during autolysis, SH with
autolysis was analyzed by the E-tongue and E-nose. The principal component analysis (PCA) of E- tongue and the linear discriminant analysis (LDA) of E-nose are shown in Figures 3A and 4A, respectively. The total contribution rate of PCA and LDA was 99.36% (PC1, 94.78%; PC2, 4.58%) and 95.43% (LD1, 70.49%; LD2, 24.94%), respectively, which indicated that PCA and LDA can be used to reflect the changes of flavor with a large amount of information in SH during autolysis [38,39]. The data suggested that the differ-entiation of the groups was good. Thus, the difference of flavor in SH during autolysis can be distinguished and sensed by artificial senses (E-tongue and E-nose). On the other hand, the sample of 4 h and 6 h were close to each other and located further from point 8 h (Figure 3A), which suggested that taste compounds may be similar in samples of 4 h and 6 h, while they were different in the sample of 8 h. According to the results of enzymatic activity (Figure 5B), the enzymatic activity reached lowest at 4 h and then gradually in-creased. A higher level of enzymatic activity was maintained after 6 h. Thus, the more taste compound may be produced due to the enhancement of the autolysis rate after 6 h, which lead to the significant difference in taste in SH. These results implied there was a
Figure 2. The change of different (A) FAAs and (B) nucleotide flavor compounds in SH duringautolysis. The data marked by different letters means significantly different (p < 0.05) in each group.FBAAs, total free bitter amino acids; FSAAs, total sweet amino acids; FUAAs, total free umami acid;FAAs, total free amino acids. Umami amino acids including aspartic acid and glutamic acid. Sweetamino acids including threonine, serine, proline, glycine, methionine, alanine. Bitter amino acidsincluding isoleucine, valine, leucine, tyrosine, methionine, phenylalanine, lysine, histidine, arginine.

Foods 2021, 10, 1020 9 of 16
Foods 2021, 10, x FOR PEER REVIEW 9 of 16
significant difference in flavor in SH during autolysis. The result of E-tongue and E-nose have consistency with the sensory evaluation results.
Figure 3. The analysis of shrimp head by E-tongue. (A) The principal component analysis of E-tongue; (B) The Radar chart analysis of E-tongue.
Figure 3. The analysis of shrimp head by E-tongue. (A) The principal component analysis of E-tongue;(B) The Radar chart analysis of E-tongue.
The response values of E-tongue are shown in Figure 3B. Sensor response output of0 h was calculated as ‘”0” in this study. If the change in concentration of taste substanceexceeds 1.0 scale, the human tongue can recognize the difference of sample [19,40]. With theincrease in time of autolysis, the richness and sourness of SH increased, and the bitternessand umami taste decreased. No marked differences in saltness, astringency, aftertaste A,and aftertaste B were observed. Interestingly, there was inconsistency between the decreaseof umami and bitterness and the increase of FBAAs and FUAAs in SH during autolysis(Figure 2). These data implied that the taste is a comprehensive sense by the synergisticwork of different flavor components. The mechanism among amino acids, E-tongue, andtaste should be studied in future work, which may usefully guide the development offood products. Additionally, according to the results of pH (Figure 5A), the production ofacids may cause the enhance of sourness. Humans accept sour taste when mild but rejectwhen strong [41]. The sourness increased mildly within 6 h, while increased sharply after6 h, which may help to explain the result of sensory evaluation. Richness defines flavorintensity. The enhance of richness in SH suggested that the changes of taste are obviousand can be distinguished during autolysis. The reduction in bitterness may be due to theenhance in free sweet amino acids, which can mask bitter tastes. In summary, the changesof umami in SH may be caused by the combined work of sourness, richness, bitterness.

Foods 2021, 10, 1020 10 of 16
As the radar chart in Figure 4B shows, the odor characteristics were significantlydifferent in SH during autolysis. The response values of sensors W1S (sensitive to methane),W2S (sensitive to ethanol), W1W (sensitive to sulfides), and W6S (mainly selective forhydrogen) differed significantly among all samples, whereas the response values of W1C,W3S, W5S, W2W, W3C, and W5C were similar. The response values of W1S, W2S, andW6S were enhanced during the extension of autolysis, which indicated methyl, aldehydes,ketones, and hydrides were increased in SH. The response value of W1W was decreasedwith the extension of autolysis, which indicated sulfur compounds were decreased in SH.Thus, autolysis time had a significant influence on methyl, aldehydes, ketones, hydrides,and sulfur, which may play an important role in the umami of SH.
Foods 2021, 10, x FOR PEER REVIEW 10 of 16
Figure 4. The analysis of shrimp head by E-nose. (A) the linear discriminant analysis of E-nose; (B) The Radar chart analysis of E-nose.
Figure 4. The analysis of shrimp head by E-nose. (A) the linear discriminant analysis of E-nose;(B) The Radar chart analysis of E-nose.

Foods 2021, 10, 1020 11 of 16Foods 2021, 10, x FOR PEER REVIEW 11 of 16
Figure 5. The changes of (A) pH and (B) enzymatic activity in shrimp during autolysis.
The response values of E-tongue are shown in Figure 3B. Sensor response output of 0 h was calculated as ‘”0” in this study. If the change in concentration of taste substance exceeds 1.0 scale, the human tongue can recognize the difference of sample [19,40]. With the increase in time of autolysis, the richness and sourness of SH increased, and the bit-terness and umami taste decreased. No marked differences in saltness, astringency, after-taste A, and aftertaste B were observed. Interestingly, there was inconsistency between the decrease of umami and bitterness and the increase of FBAAs and FUAAs in SH during autolysis (Figure 2). These data implied that the taste is a comprehensive sense by the synergistic work of different flavor components. The mechanism among amino acids, E-tongue, and taste should be studied in future work, which may usefully guide the devel-opment of food products. Additionally, according to the results of pH (Figure 5A), the production of acids may cause the enhance of sourness. Humans accept sour taste when mild but reject when strong [41]. The sourness increased mildly within 6 h, while in-creased sharply after 6 h, which may help to explain the result of sensory evaluation. Rich-ness defines flavor intensity. The enhance of richness in SH suggested that the changes of taste are obvious and can be distinguished during autolysis. The reduction in bitterness may be due to the enhance in free sweet amino acids, which can mask bitter tastes. In summary, the changes of umami in SH may be caused by the combined work of sourness, richness, bitterness.
As the radar chart in Figure 4B shows, the odor characteristics were significantly dif-ferent in SH during autolysis. The response values of sensors W1S (sensitive to methane),
Figure 5. The changes of (A) pH and (B) enzymatic activity in shrimp during autolysis.
3.4. Change Regularity of pH and Enzymatic Activity in SH during Autolysis
pH is closely related to the umami flavors. Feng et al. [42] found the umami of sixumami additives were significant affected by pH from 5 to 8. The best working pH formost umami substances was 6–7 [42,43]. Meanwhile, endogenous protease plays a keyrole in the degradation of protein and nucleotide-flavor compounds [44]. The changes inpH and enzymatic activity of SH during autolysis were studied (Figure 5). At the earlystage of autolysis, the anaerobic glycolysis and the digestion of ATP were increased. pHdecreased from 6.71 to 6.51 [45]. Afterward, microbial metabolites (such as TVB-N andtrimethylamine-nitrogen) were accumulated rapidly with the activation of endogenousprotease (Figures 1 and 5B), which are the main reason for pH increment to 6.97 [46,47] andbecoming stabilized thereafter. Feng et al. [42] found that the umami of umami flavoringwas increased with the increase of pH within 6.5–7.0, which could help to explain thechange of taste in SH (Table 4). In addition, the trend of change in enzyme activity wassimilar to pH (Figure 5). The native protein of SH could be degraded rapidly by endogenousprotease in digestive organs during autolysis [44]. Therefore, the total free amino acidswere increased in SH (Figure 2). However, there may be more off-flavor compounds withthe further activation of endogenous protease, including FBAAs, Hx, and HxR (Figure 2),which lead to the unpleased flavor in SH (Table 4). The results indicated that the autolysistime needs to be controlled at a suitable time to obtain a good flavor.

Foods 2021, 10, 1020 12 of 16
3.5. Characteristics of Endogenous Protease of SH
The autolysis of SH depends on different physicochemical conditions, includingthe temperature of incubation and pH. The influence of different temperatures and pHon enzyme activity of CEP was evaluated (Figure 6). The maximum activity under theassayed conditions took place at 50 ◦C and pH 7.5, respectively, which may be the optimalconditions to utilize autolysis. this result was similar to the results of Cao et al. [3] (50 ◦Cand pH 7.85). The CEP was further separated and purified by DEAE–Sepharose fastflow column chromatography, providing three fractions (I, II, and III; Figure 7A). Theoutline and the results of the separation and purification of the endogenous proteaseare summarized in Table 5. The results indicate that I and II were the main endogenousprotease of SH, especially II. SDS–PAGE analysis showed endogenous protease containedtwo major enzymes (~50 kDa and ~75 kDa, Figure 7B) which were most likely responsiblefor the changes of flavor during autolysis.
Foods 2021, 10, x FOR PEER REVIEW 13 of 16
Figure 6. The effects of (A) pH and (B) temperature for the endogenous protease.
Table 5. A summary of the purification of endogenous protease on the extract from shrimp heads.
Purification Enzymatic Ratio Activity (U/mg Protein)
Recovery of Enzymatic Activity (%)
Purification Fold
Crude extract 2.93 100 1 Crude endogenous protease 4.16 89.13 1.42
Ⅰ 3.22 15.12 1.10 Ⅱ 6.54 60.88 2.23 Ⅲ Not detected - -
Figure 6. The effects of (A) pH and (B) temperature for the endogenous protease.

Foods 2021, 10, 1020 13 of 16Foods 2021, 10, x FOR PEER REVIEW 14 of 16
Figure 7. The purification of endogenous protease from shrimp head: (A) endogenous proteases were separated and purified by DEAE–Sepharose fast flow and (B) the SDS–PAGE analysis of endogenous protease from shrimp head. CE, SH crude extract; CEP, crude endogenous protease.
4. Conclusions In summary, SH could be one of the sources for condiments with a good composition
of AAs, and it complies with the requirement of food safety. Moreover, there was a sig-nificant difference in flavor in SH during autolysis, which may be caused by the synergis-tic work of FAAs and nucleotide-related compounds. SH with autolysis had the best umami taste at 6 h. Meanwhile, the optimal conditions to utilize autolysis may be at 50 °C and pH 7.5. Two endogenous proteases (~50 kDa and ~75 kDa) play a key role in autolysis. Thus, it is a good economic use of SH to prepare umami hydrolysates from SH by the reasonable control of autolysis, which can be as a raw material in food supplements. The SH recycle with autolysis is an efficient way to solve the problems of SH waste, which complete the low-cost and high-value utilization in by-products of the shrimp industry. The autolysis also can be used for the development of food products and the recycling of chitin, lipid, and astaxanthin in SH. Furthermore, the results of sensory evaluation, E-tongue, and E-nose are consistent, which implied that a combination of these analytical techniques can be applied to study the formation of flavor to obtain more comprehensive and accurate results.
Supplementary Materials: The following are available online at www.mdpi.com/xxx/s1, Figure S1: Changes of enzyme ratio activity of the crude extract were extracted from shrimp head in different
Figure 7. The purification of endogenous protease from shrimp head: (A) endogenous proteases wereseparated and purified by DEAE–Sepharose fast flow and (B) the SDS–PAGE analysis of endogenousprotease from shrimp head. CE, SH crude extract; CEP, crude endogenous protease.
Table 5. A summary of the purification of endogenous protease on the extract from shrimp heads.
Purification Enzymatic RatioActivity (U/mg Protein)
Recovery of EnzymaticActivity (%) Purification Fold
Crude extract 2.93 100 1Crude endogenous protease 4.16 89.13 1.42
I 3.22 15.12 1.10II 6.54 60.88 2.23III Not detected - -
4. Conclusions
In summary, SH could be one of the sources for condiments with a good composition ofAAs, and it complies with the requirement of food safety. Moreover, there was a significantdifference in flavor in SH during autolysis, which may be caused by the synergistic workof FAAs and nucleotide-related compounds. SH with autolysis had the best umami taste

Foods 2021, 10, 1020 14 of 16
at 6 h. Meanwhile, the optimal conditions to utilize autolysis may be at 50 ◦C and pH 7.5.Two endogenous proteases (~50 kDa and ~75 kDa) play a key role in autolysis. Thus, itis a good economic use of SH to prepare umami hydrolysates from SH by the reasonablecontrol of autolysis, which can be as a raw material in food supplements. The SH recyclewith autolysis is an efficient way to solve the problems of SH waste, which complete thelow-cost and high-value utilization in by-products of the shrimp industry. The autolysisalso can be used for the development of food products and the recycling of chitin, lipid, andastaxanthin in SH. Furthermore, the results of sensory evaluation, E-tongue, and E-nose areconsistent, which implied that a combination of these analytical techniques can be appliedto study the formation of flavor to obtain more comprehensive and accurate results.
Supplementary Materials: The following are available online at https://www.mdpi.com/article/10.3390/foods10051020/s1, Figure S1: Changes of enzyme ratio activity of the crude extract wereextracted from shrimp head in different pH buffer, Table S1: The information of chemical sensors inE-tongue, Table S2: The information of chemical sensors in E-nose.
Author Contributions: Conceptualization, X.L. and S.W.; methodology, S.W., S.G. and X.L.; software,Y.X., X.Z. and M.L.; validation, S.W., M.Z. and X.L.; formal analysis, S.W. and X.L.; investigation,S.W., S.G., Y.X., X.Z. and M.L.; resources, X.L.; data curation, M.Z.; writing-original draft preparation,S.W.; writing-review and editing, S.W., M.Z. and X.L.; visualization, S.W.; supervision, M.Z. andX.L.; project administration, X.L.; funding acquisition, X.L. All authors have read and agreed to thepublished version of the manuscript.
Funding: This research was funded by the Scientific Innovation and Industrial DemonstrationProgram of Guangxi (AA20302019-7) and Guangxi Science and Technology Major Special Project(AA17204075); Science and Technology Planning Project of Beihai (202082068).
Conflicts of Interest: The authors declare no conflict of interest.
References1. Cui, H.; Xiao, L. Current situation of China shrimp industry in 2011–2012 and its prospect. China Fish. 2012, 39, 85–87.2. Cao, W.; Zhang, C.; Hong, P.; Ji, H.; Hao, J.; Zhang, J. Autolysis of shrimp head by gradual temperature and nutritional quality of
the resulting hydrolysate. LWT 2009, 42, 244–249. [CrossRef]3. Cao, W.; Zhang, C.; Hong, P.; Ji, H. Response surface methodology for autolysis parameters optimization of shrimp head and
amino acids released during autolysis. Food Chem. 2008, 109, 176–183. [CrossRef]4. Cao, W.; Tan, C.; Zhan, X.; Li, H.; Zhang, C. Ultraviolet irradiation and gradient temperature assisted autolysis for protein
re-covery from shrimp head waste. Food Chem. 2014, 164, 136–141. [CrossRef] [PubMed]5. Sánchez-Camargo, A.P.; Meireles, M.; Ângela, A.; Lopes, B.L.F.; Cabral, F.A. Proximate composition and extraction of carotenoids
and lipids from Brazilian redspotted shrimp waste (Farfantepenaeus paulensis). J. Food Eng. 2011, 102, 87–93. [CrossRef]6. Fanimo, A.; Oduguwa, O.; Onifade, A.; Olutunde, T. Protein quality of shrimp-waste meal. Bioresour. Technol. 2000, 72, 185–188.
[CrossRef]7. Carlos Sainz, J.; García-Carreño, F.L.; Hernández-Cortés, P. Penaeus vannamei isotrypsins: Purification and characterization.
Comp. Biochem. Physiol. Part B Biochem. Mol. Biol. 2004, 138, 155–162. [CrossRef]8. Sriket, C.; Benjakul, S.; Visessanguan, W. Characterisation of proteolytic enzymes from muscle and hepatopancreas of fresh water
prawn (Macrobrachium rosenbergii). J. Sci. Food Agric. 2010, 91, 52–59. [CrossRef] [PubMed]9. Tan, J.; Xu, J. Applications of electronic nose (e-nose) and electronic tongue (e-tongue) in food quality-related properties
de-termination: A review. Artif. Intell. Agric. 2020, 4, 104–115.10. Bekhit, A.E.-D.A.; Holman, B.W.; Giteru, S.G.; Hopkins, D.L. Total volatile basic nitrogen (TVB-N) and its role in meat spoilage: A
review. Trends Food Sci. Technol. 2021, 109, 280–302. [CrossRef]11. Chan, S.T.; Yao, M.W.Y.; Wong, Y.C.; Wong, T.; Mok, C.S.; Sin, D.W.M. Evaluation of chemical indicators for monitoring freshness
of food and determination of volatile amines in fish by headspace solid-phase microextraction and gas chromatography-massspectrometry. Eur. Food Res. Technol. 2006, 224, 67–74. [CrossRef]
12. Albuquerque, F.E.A.; Minervino, A.H.H.; Miranda, M.; Herrero-Latorre, C.; Barrêto Júnior, R.A.; Oliveira, F.L.C.; Dias, S.R.;Ortolani, E.L.; López-Alonso, M. Toxic and es-sential trace element concentrations in the freshwater shrimp Macrobrachiumamazonicum in the Lower Amazon, Brazil. J. Food Compos. Anal. 2020, 86, 103361. [CrossRef]
13. The Hygiene Ministry of China. Determination of volatile base nitrogen in foodstuffs. In National Food Safety Standard; TheHygiene Ministry of China: Beijing, China, 2003.
14. Dabadé, D.S.; Jacxsens, L.; Miclotte, L.; Abatih, E.; Devlieghere, F.; De Meulenaer, B. Survey of multiple biogenic amines andcorre-lation to microbiological quality and free amino acids in foods. Food Control 2021, 120, 107497. [CrossRef]

Foods 2021, 10, 1020 15 of 16
15. Zhang, R.; Qiu, W.; Zhang, M.; Row, K.H.; Cheng, Y.; Jin, Y. Effects of different heating methods on the contents of nucleotidesand related compounds in minced Pacific white shrimp and Antarctic krill. LWT 2018, 87, 142–150. [CrossRef]
16. Yu, Z.; Jiang, H.; Guo, R.; Yang, B.; You, G.; Zhao, M.; Liu, X. Taste, umami-enhance effect and amino acid sequence of peptidessepa-rated from silkworm pupa hydrolysate. Food Res. Int. 2018, 108, 144–150. [CrossRef] [PubMed]
17. The Standardization Administration of China. Sensory Analysis-Methodology-Method of Investigating Sensitivity of Taste, MOD; TheStandardization Administration of China: Beijing, China, 2012.
18. The Standardization Administration of China. Sensory Analysis-Methodology-Ranking; The Standardization Ad-ministration ofChina: Beijing, China, 2008.
19. Zhu, W.; Luan, H.; Bu, Y.; Li, X.; Li, J.; Ji, G. Flavor characteristics of shrimp sauces with different fermentation and storage time.LWT 2019, 110, 142–151. [CrossRef]
20. Liu, Q.; Zhao, N.; Zhou, D.; Sun, Y.; Sun, K.; Pan, L.; Tu, K. Discrimination and growth tracking of fungi contamination in peachesusing electronic nose. Food Chem. 2018, 262, 226–234. [CrossRef]
21. Shi, C.; Cui, J.; Luo, Y.; Zhu, S.; Zhou, Z. Post-Mortem Changes of Silver Carp (Hypophthalmichthys Molitrix) Stored at 0 ◦CAssessed by Electrical Conductivity. Int. J. Food Prop. 2015, 18, 415–425. [CrossRef]
22. Hang, Y.J.; Li, X.Y. Properties of Autolysis Enzymes from Antarctic Krill. Food Sci. 2011, 13, 198–200.23. Cahú, T.B.; Santos, S.D.; Mendes, A.; Córdula, C.R.; Chavante, S.F.; Carvalho, L.B.; Nader, H.B.; Bezerra, R.S. Recovery of
protein, chitin, carotenoids and glycosaminoglycans from Pacific white shrimp (Litopenaeus vannamei) processing waste. Process.Biochem. 2012, 47, 570–577. [CrossRef]
24. Beloborodov, S.S.; Bao, J.; Krylova, S.M.; Shala-Lawrence, A.; Johnson, P.E.; Krylov, S.N. Aptamer facilitated purification offunc-tional proteins. J. Chromatogr. B 2018, 1073, 201–206. [CrossRef]
25. Soultani, G.; Sele, V.; Rasmussen, R.R.; Pasias, I.; Stathopoulou, E.; Thomaidis, N.S.; Sinanoglou, V.J.; Sloth, J.J. Elements oftoxicological concern and the arsenolipids’ profile in the giant-red Mediterranean shrimp, Aristaeomorpha foliacea. J. FoodCompos. Anal. 2021, 97, 103786. [CrossRef]
26. The Hygiene Ministry of China. Hygienic Standard for Fresh and Frozen Marine Products of Animal Origin; The Hygiene Ministry ofChina: Beijing, China, 2015.
27. FAO/WHO 1973. Energy and Protein Requirements: Report of a Joint FAO/WHO Ad Hoc Expert Committee; FAO: Rome, Italy; WHO:Geneva, Switzerland, 1971.
28. Köhler, R.; Kariuki, L.; Lambert, C.; Biesalski, H. Protein, amino acid and mineral composition of some edible insects fromThailand. J. Asia-Pacific Èntomol. 2019, 22, 372–378. [CrossRef]
29. Cheung, I.W.; Li-Chan, E.C. Application of taste sensing system for characterisation of enzymatic hydrolysates from shrimpprocessing by-products. Food Chem. 2014, 145, 1076–1085. [CrossRef]
30. Chen, Z.; Gao, H.; Wu, W.; Chen, H.; Fang, X.; Han, Y.; Mu, H. Effects of fermentation with different microbial species on theumami taste of Shiitake mushroom (Lentinus edodes). LWT 2021, 141, 110889. [CrossRef]
31. Wang, W.; Zhou, X.; Liu, Y. Characterization and evaluation of umami taste: A review. TrAC Trends Anal. Chem. 2020, 127, 115876.[CrossRef]
32. Sabikun, N.; Bakhsh, A.; Rahman, M.S.; Hwang, Y.-H.; Joo, S.-T. Volatile and nonvolatile taste compounds and their correlationwith umami and flavor characteristics of chicken nuggets added with milkfat and potato mash. Food Chem. 2021, 343, 128499.[CrossRef]
33. Yang, Y.; Xia, Y.; Wang, G.; Tao, L.; Yu, J.; Ai, L. Effects of boiling, ultra-high temperature and high hydrostatic pressure on freeamino acids, flavor characteristics and sensory profiles in Chinese rice wine. Food Chem. 2019, 275, 407–416. [CrossRef] [PubMed]
34. Qiu, W.-Q.; Chen, S.-S.; Xie, J.; Qu, Y.-H.; Song, X. Analysis of 10 nucleotides and related compounds in Litopenaeus vannameiduring chilled storage by HPLC-DAD. LWT 2016, 67, 187–193. [CrossRef]
35. Kuda, T.; Fujita, M.; Goto, H.; Yano, T. Effects of retort conditions on ATP-related compounds in pouched fish muscle. LWT 2008,41, 469–473. [CrossRef]
36. Tikk, M.; Tikk, K.; Tørngren, M.A.; Meinert, L.; Aaslyng, M.D.; Karlsson, A.H.; Andersen, H.J. Development of InosineMonophosphate and Its Degradation Products during Aging of Pork of Different Qualities in Relation to Basic Taste andRetronasal Flavor Percep-tion of the Meat. J. Agric. Food Chem. 2006, 54, 7769–7777. [CrossRef] [PubMed]
37. Kawai, M.; Okiyama, A.; Ueda, Y. Taste Enhancements Between Various Amino Acids and IMP. Chem. Senses 2002, 27, 739–745.[CrossRef] [PubMed]
38. Zhang, L.; Hu, Y.; Wang, Y.; Kong, B.; Chen, Q. Evaluation of the flavour properties of cooked chicken drumsticks as affected bysugar smoking times using an electronic nose, electronic tongue, and HS-SPME/GC-MS. LWT 2021, 140, 110764. [CrossRef]
39. Zhu, D.; Ren, X.; Wei, L.; Cao, X.; Ge, Y.; Liu, H.; Li, J. Collaborative analysis on difference of apple fruits flavour using electronicnose and electronic tongue. Sci. Hortic. 2020, 260, 108879. [CrossRef]
40. Jiang, H.; Zhang, M.; Bhandari, B.; Adhikari, B. Application of electronic tongue for fresh foods quality evaluation: A review.Food Rev. Int. 2018, 34, 746–769. [CrossRef]
41. Valentová, H.; Panovská, Z. SENSORY EVALUATION | Taste. In Encyclopedia of Food Sciences and Nutrition, 2nd ed.; Caballero, B.,Ed.; Academic Press: Cambridge, MA, USA, 2003; pp. 5180–5187.
42. Feng, Z.; Li, S.; Hao, W.; Yuan, J.; Liu, M.; Gao, S.; Liu, Y. Effect of pH on the taste of umami flavors. China Food Addit. 2017, 2,144–148.

Foods 2021, 10, 1020 16 of 16
43. Ma, J.; Chen, Y.; Zhu, Y.; Ayed, C.; Fan, Y.; Chen, G.; Liu, Y. Quantitative analyses of the umami characteristics of disodiumsuccinate in aqueous solution. Food Chem. 2020, 316, 126336. [CrossRef]
44. Peng, Y.; Chen, S.; Ji, H.; Liu, S. Localization of trypsin-like protease in postmortem tissue of white shrimp (Litopenaeus van-namei)and its effect in muscle softening. Food Chem. 2019, 290, 277–285. [CrossRef]
45. Zhang, L.; Li, Q.; Lyu, J.; Kong, C.; Song, S.; Luo, Y. The impact of stunning methods on stress conditions and quality of silvercarp (Hypophthalmichthys molitrix) fillets stored at 4 ◦C during 72 h postmortem. Food Chem. 2017, 216, 130–137. [CrossRef]
46. Okpala, C.O.R.; Choo, W.S.; Dykes, G.A. Quality and shelf life assessment of Pacific white shrimp (Litopenaeus vannamei) fresh-lyharvested and stored on ice. LWT 2014, 55, 110–116. [CrossRef]
47. Khaledian, S.; Basiri, S.; Shekarforoush, S.S. Shelf-life extension of pacific white shrimp using tragacanth gum -based coatingscontaining Persian lime peel (Citrus latifolia) extract. LWT 2021, 141, 110937. [CrossRef]