Geometric Correction for Very High Resolution Satellite Images
Proceedings of 2nd International Conference on Innovations in Electronics and Communication Engineering (ICIECE-2013)
9-10th August 2013, Guru Nanak Institutions, Hyderabad P a g e | 252
Change Detection and Estimation of Change Analysis using Satellite
Images Merugu Suresh1, Anuj Tiwari2 and R.P.Naraiah3 1Research Scholar, Department of Civil Engineering 2Research Scholar, Department of Civil Engineering
3Associate Professor, Department of ECE, GURUNANAK ITC,IBP.
Indian Institute of Technology - Roorkee, Roorkee, Uttarakhand, India-247667. Email
ABSTRACT
Urban development and migration of population from
rural to urban areas are global phenomena. Many small and
isolated population centres are rapidly changing into large
metropolitan cities, and hence the conversion of natural land to
urban use is quite obvious. The expansion of urban areas is a
great problem for many countries, especially in the developing
countries, where the rate of urban growth is much higher than
in developed countries. Therefore, it is necessary for the urban
planners to study the growth pattern about various land cover
types. GIS and remote sensing provide a broad range of tools for urban area mapping, monitoring and management.
The results of this work will show the change
detection in land encroachment of built-up land/lakes/ponds
between 1995 and 2011. The business requirements for the
system include land encroachment data propagation, field
database creation, data visualization, feature editing, and
quality assurance/quality control. Subsequently, an attempt to
be made at projecting the observed land use land covers in the next fifteen years.
Key words: Change Detection, Image Processing, Remote Sensing & GIS.
1. BACKGROUND TO THE STUDY
Various studies have shown that there remains only
few landscapes on the Earth that are still in their natural state.
Due to anthropogenic activities, the Earth surface is being
significantly altered in some manner and human being’s
presence on the Earth and their use of land has had a profound
effect upon the natural environment thus resulting into an observable pattern in the land use/land cover over time.
The land use/land cover pattern of a region is an
outcome of natural and socio – economic factors and their
utilization by man in time and space. Land is becoming a
scarce resource due to immense agricultural and demographic
pressure. Hence, information on land use / land cover and
possibilities for their optimal use is essential for the selection,
planning and implementation of land use schemes to meet the
increasing demands for basic human needs and welfare. This
information also assists in monitoring the dynamics of land use resulting out of changing demands of increasing population.
Land use and land cover change has become a central
component in current strategies for managing natural
resources and monitoring environmental changes. The
advancement in the concept of vegetation mapping has greatly
increased research on land use land cover change thus
providing an accurate evaluation of the spread and health of
the world’s forest, grassland, and agricultural resources has become an important priority.
The collection of remotely sensed data facilitates the
synoptic analyses of Earth - system function, patterning, and
change at local, regional and global scales over time; such data
also provide an important link between intensive, localized
ecological research and regional, national and international
conservation and management of biological diversity (Wilkie and Finn, 1996).
Therefore, attempt will be made in this study to map
out the status of land encroachment of Dehradun between 1975
and 2012 with a view to detecting the land consumption rate
and the changes that has taken place in this status particularly
in the built-up land so as to predict possible changes that might
take place in this status in the next 15 years using both Geographic Information System and Remote Sensing data.
2. LITERATURE REVIEW
P. K. Yadav, Mohnish Kapoor, Kiranmay Sarma
(2012) carried out a study on change detection and Conflict
Analysis of Nagzira-Navegaon Corridor, Central India Using
Geospatial Technology, an attempt has been made to find out
the status of ecological corridors between Nagzira Wildlife
Sanctuary and Navegaon National Park using temporal remote
sensing data. It is found that 6.22 percent dense forest is
converted to open forest and 6.66 percent open forest to non
forest between 1990 to 1999. After observation of change
analysis, it is found that maximum deforestation occurred in
the corridors. In the following decade (1999 to 2009), 1.81
percent dense forest is converted to open forest and 2.21
percent of the open forest to non forest. Water bodies have been decreasing continuously in both decades.
Forest loss and degradation occur due to human
interference, urbanization, cattle grazing, noise pollution, air
pollution and so on. As per the details obtained from field
survey regarding the conflict analysis in the corridor, it can be
Proceedings of 2nd International Conference on Innovations in Electronics and Communication Engineering (ICIECE-2013)
9-10th August 2013, Guru Nanak Institutions, Hyderabad P a g e | 253
inferred that most of the sites along the national
highway, state highways and railway tracks show presence of human
1 encroachment in terms of agriculture land and build-up area.
Due to high frequency of traffic on roads/railway, wild animals
often divert from their original dispersal route and enter these hamlets leading to conflict situations.
Yudi Setiawan and Kunihiko Yoshino (2012) carried
out a study on MODIS EVI to detect land use land cover
change due to the change in temporal vegetation patterns. The
wavelet transform was applied to filter out some noises in 161
time series MODIS EVI. Consequently, the MODIS EVI
wavelet-filtered could determine the vegetation phenology in
many vegetated lands. Consistent land use has a typical,
distinct and repeated temporal vegetation dynamics inter-
annually; accordingly, a change in land use type could be
recognized through a change in the pattern of the long-term
vegetation dynamics. Analysed the dynamics pattern of long-
term image data of wavelet-filtered MODIS EVI from 2001 to
2007. The change of temporal vegetation dynamics was
detected by differentiating distance between two successive
annual EVI patterns. Moreover, they were defined the type of
changes using the clustering method, which were then validated by ground check points and secondary data sets.
Arvind C. Pandy and M. S. Nathawat (2006) carried
out a study on land use land cover mapping of Panchkula,
Ambala and Yamunanger districts, Haryana State in India.
They observed that the heterogeneous climate and
physiographic conditions in these districts has resulted in the
development of different land use land cover in these districts,
an evaluation by digital analysis of satellite data indicates that
majority of areas in these districts are used for agricultural
purpose. The hilly regions exhibit fair development of reserved
forests. It is inferred that land use land cover pattern in the area
are generally controlled by agro – climatic conditions, ground water potential and a host of other factors.
It has been noted over time through series of studies
that Landsat Thematic Mapper is adequate for general
extensive synoptic coverage of large areas. As a result, this
reduces the need for expensive and time consuming ground
surveys conducted for validation of data. Generally, satellite
imagery is able to provide more frequent data collection on a
regular basis unlike aerial photographs which although may
provide more geometrically accurate maps, is limited in
respect to its extent of coverage and expensive; which means, it is not often used.
Daniel et al, 2002 in their comparison of land use land
cover change detection methods, made use of 5 methods viz;
traditional post – classification cross tabulation, cross
correlation analysis, neural networks, knowledge – based
expert systems, and image segmentation and object – oriented
classification. A combination of direct T1 and T2 change
detection as well as post classification analysis was employed.
Nine land use land cover classes were selected for analysis. They
observed that there are merits to each of the five methods examined,
and that, at the point of their research, no single approach can solve the land use change detection problem.
Adeniyi and Omojola, (1999) in their land use land cover
change evaluation in Sokoto – Rima Basin of North – Western
Nigeria based on Archival Remote Sensing and GIS techniques, used
aerial photographs, Landsat MSS, SPOT XS/Panchromatic image
Transparency and Topographic map sheets to study changes in the
two dams (Sokoto and Guronyo) between 1962 and 1986. The work
revealed that land use land cover of both areas was unchanged before
the construction while settlement alone covered most part of the area.
However, during the post - dam era, land use /land cover classes changed but with settlement still remaining the largest.
Change detection is the process of identifying differences in
the state of an object or phenomenon by observing it at different times
(Singh, 1989). Change detection is an important process in
monitoring and managing natural resources and urban development
because it provides quantitative analysis of the spatial distribution of the population of interest.
Macleod and Congation (1998) list four aspects of change detection which are important when monitoring natural resources:
i. Detecting the changes that have occurred
ii. Identifying the nature of the change
iii. Measuring the area extent of the change iv. Assessing the
spatial pattern of the change
The basis of using remote sensing data for change detection is that
changes in land cover result in changes in radiance values which can
be remotely sensed. Techniques to perform change detection with
satellite imagery have become numerous as a result of increasing
versatility in manipulating digital data and increasing computer power.
A wide variety of digital change detection techniques have
been developed over the last two decades. Singh (1989) and Coppin
& Bauer (1996) summarize eleven different change detection
algorithms that were found to be documented in the literature by
1995. These include: 1. Mono-temporal change delineation.
2. Delta or post classification comparisons.
3. Multidimensional temporal feature space analysis.
4. Composite analysis.
5. Image differencing.
6. Multitemporal linear data transformation.
7. Change vector analysis.
8. Image regression.
9. Multitemporal biomass index
10. Background subtraction.
11. Image ratioing
In some instances, land use land cover change may result in
environmental, social and economic impacts of greater damage than
benefit to the area (Moshen A, 1999). Therefore data on land use
change are of great importance to planners in monitoring the
consequences of land use change on the area. Such data are of value
to resources management and agencies that plan and assess land use patterns and in modelling and predicting future changes.
Proceedings of 2nd International Conference on Innovations in Electronics and Communication Engineering (ICIECE-2013)
9-10th August 2013, Guru Nanak Institutions, Hyderabad P a g e | 254
Land cover can be altered by forces other than
anthropogenic. Natural events such as weather, flooding, fire,
climate fluctuations, and ecosystem dynamics may also initiate
modifications upon land cover. Globally, land cover today is
altered principally by direct human use: by agriculture and
livestock raising, forest harvesting and management and urban
and suburban construction and development. There are also
incidental impacts on land cover from other human activities
such as forest and lakes damaged by acid rain from fossil fuel
combustion and crops near cities damaged by tropospheric ozone resulting from automobile exhaust (Meyer, 1995).
Hence, in order to use land optimally, it is not only
necessary to have the information on existing land use land
cover but also the capability to monitor the dynamics of land
use resulting out of both changing demands of increasing population and forces of nature acting to shape the landscape.
A remote sensing device records response which is
based on many characteristics of the land surface, including
natural and artificial cover. An interpreter uses the element of
tone, texture, pattern, shape, size, shadow, site and
association to derive information about land cover.
The generation of remotely sensed data/images by
various types of sensor flown aboard different platforms at
varying heights above the terrain and at different times of the
day and the year does not lead to a simple classification system.
It is often believed that no single classification could be used
with all types of imagery and all scales. To date, the most
successful attempt in developing a general purpose
classification scheme compatible with remote sensing data has
been by Anderson et al which is also referred to as USGS
classification scheme. Other classification schemes available
for use with remotely sensed data are basically modification of the above classification scheme.
Land use affects land cover and changes in land cover
affect land use. A change in either however is not necessarily
the product of the other. Changes in land cover by land use do
not necessarily imply degradation of the land. However, many
shifting land use patterns driven by a variety of social causes,
result in land cover changes that affects biodiversity, water and
radiation budgets, trace gas emissions and other processes that
come together to affect climate and biosphere (Riebsame, Meyer, and Turner, 1994).
Also, An analysis of land use and land cover changes
using the combination of MSS Landsat and land use map of
Indonesia (Dimyati, 1995) reveals that land use land cover
change were evaluated by using remote sensing to calculate the
index of changes which was done by the superimposition of
land use land cover images of 1972, 1984 and land use maps
of 1990. This was done to analyze the pattern of change in the
area, which was rather difficult with the traditional method of
surveying as noted by Olorunfemi in 1983 when he was using
aerial photographic approach to monitor urban land use in developing countries with Ilorin in Nigeria as the case study.
4. JUSTIFICATION AND PROPOSED
METHODOLOGY
Various studies have shown that there remain only few
landscapes on the Earth that is still in their natural state. Due to
anthropogenic activities, the Earth surface is being significantly
altered in some manner and human being’s presence on the Earth and
their use of land has had a profound effect upon the natural
environment thus resulting into an observable pattern in the land use/land cover over time.
5. CHANGE DETECTION WITH STEREO
IMAGERY
5.1 RESULTS AND EXPERIMENTS:
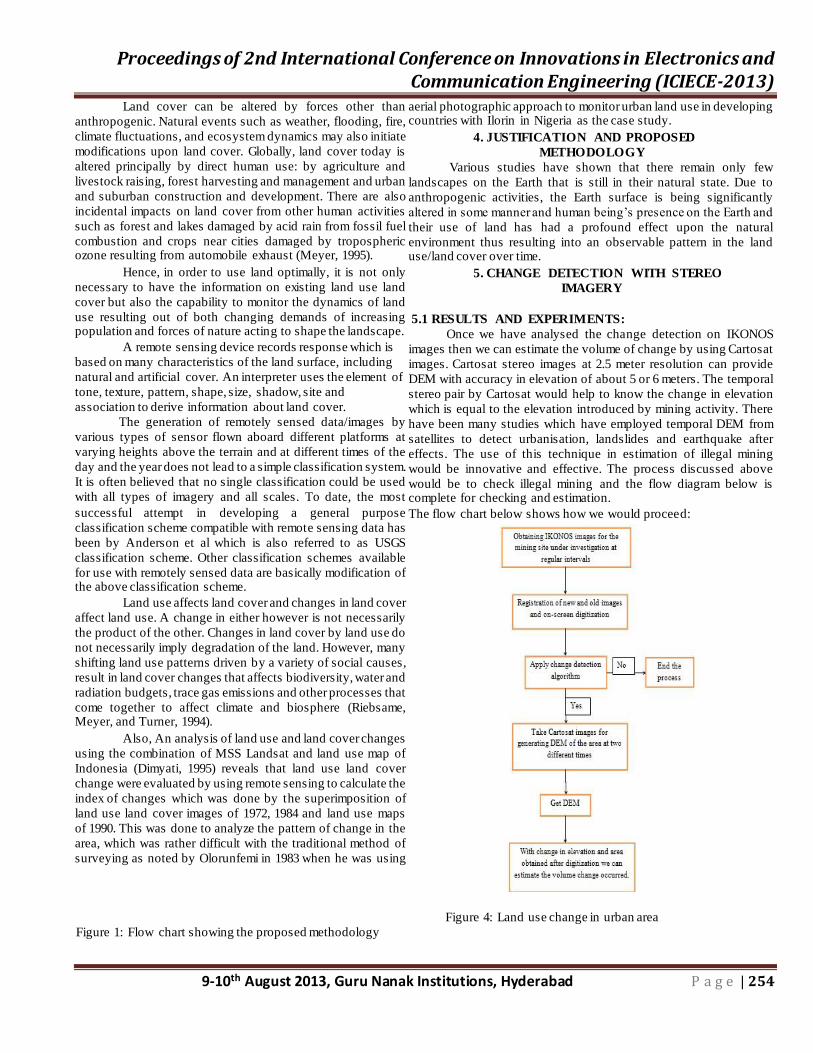
Once we have analysed the change detection on IKONOS
images then we can estimate the volume of change by using Cartosat
images. Cartosat stereo images at 2.5 meter resolution can provide
DEM with accuracy in elevation of about 5 or 6 meters. The temporal
stereo pair by Cartosat would help to know the change in elevation
which is equal to the elevation introduced by mining activity. There
have been many studies which have employed temporal DEM from
satellites to detect urbanisation, landslides and earthquake after
effects. The use of this technique in estimation of illegal mining
would be innovative and effective. The process discussed above
would be to check illegal mining and the flow diagram below is complete for checking and estimation.
The flow chart below shows how we would proceed:
Figure 1: Flow chart showing the proposed methodology
Figure 4: Land use change in urban area
Proceedings of 2nd International Conference on Innovations in Electronics and Communication Engineering (ICIECE-2013)
9-10th August 2013, Guru Nanak Institutions, Hyderabad P a g e | 255
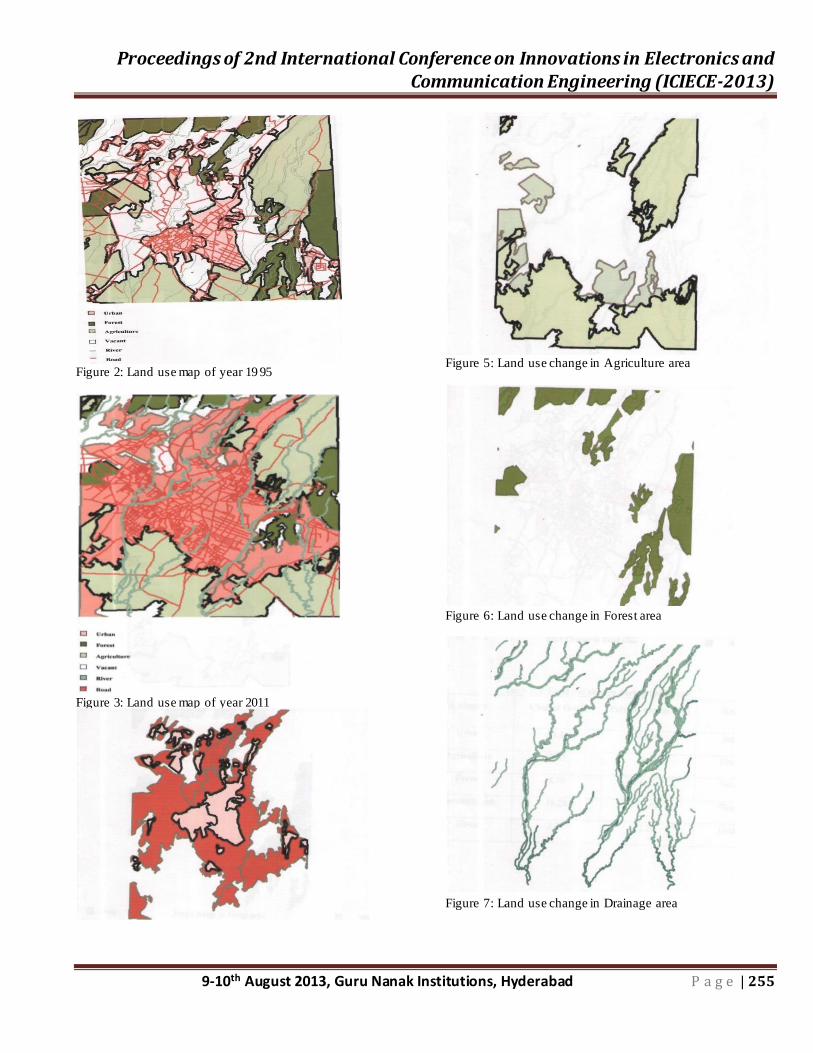
Figure 2 : Land use map of year 19 9 5
Figure 3 : Land use map of year 2011
Figure 5 : Land use change in Agriculture area
Figure 6 : Land use change in Forest area
Figure 7 : Land use change in Drainage area
Proceedings of 2nd International Conference on Innovations in Electronics and Communication Engineering (ICIECE-2013)
9-10th August 2013, Guru Nanak Institutions, Hyderabad P a g e | 256
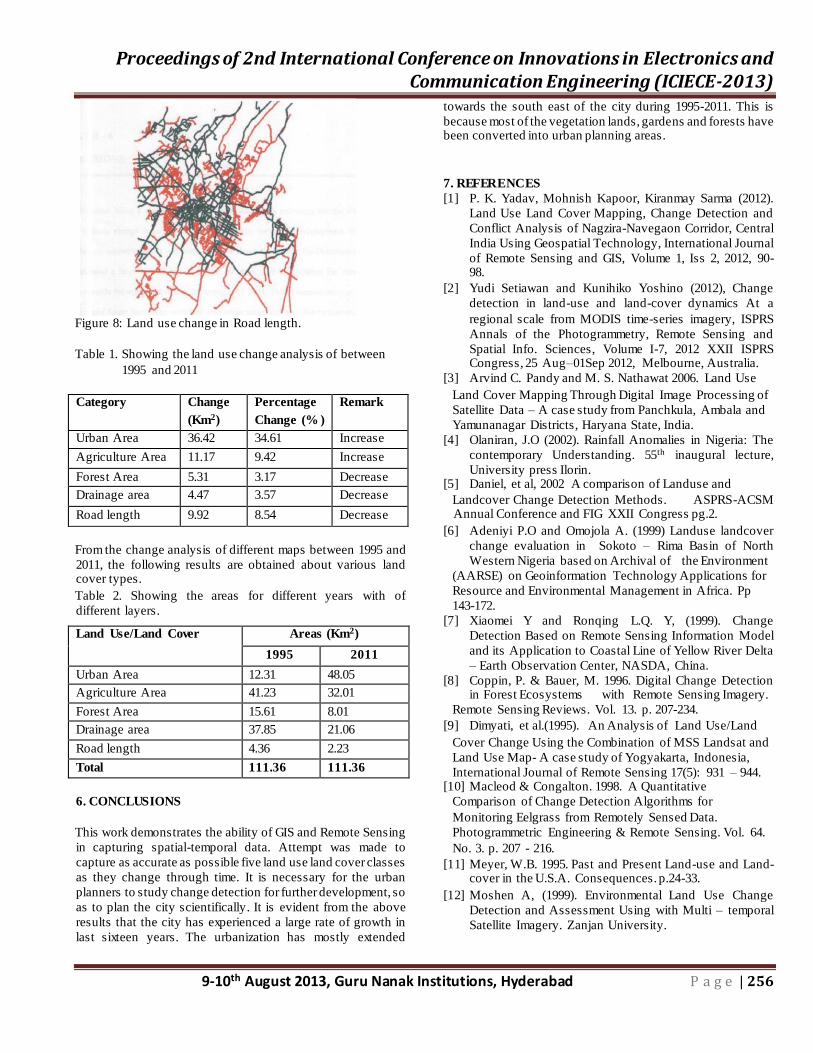
Figure 8: Land use change in Road length.
Table 1. Showing the land use change analysis of between
1995 and 2011
Category Change
(Km2)
Percentage
Change (% )
Remark
Urban Area 36.42 34.61 Increase
Agriculture Area 11.17 9.42 Increase
Forest Area 5.31 3.17 Decrease
Drainage area 4.47 3.57 Decrease
Road length 9.92 8.54 Decrease
From the change analysis of different maps between 1995 and
2011, the following results are obtained about various land cover types.
Table 2. Showing the areas for different years with of
different layers.
Land Use/Land Cover Areas (Km2)
1995 2011
Urban Area 12.31 48.05
Agriculture Area 41.23 32.01
Forest Area 15.61 8.01
Drainage area 37.85 21.06
Road length 4.36 2.23
Total 111.36 111.36
6. CONCLUSIONS
This work demonstrates the ability of GIS and Remote Sensing
in capturing spatial-temporal data. Attempt was made to
capture as accurate as possible five land use land cover classes
as they change through time. It is necessary for the urban
planners to study change detection for further development, so
as to plan the city scientifically. It is evident from the above
results that the city has experienced a large rate of growth in
last sixteen years. The urbanization has mostly extended
towards the south east of the city during 1995-2011. This is
because most of the vegetation lands, gardens and forests have been converted into urban planning areas.
7. REFERENCES
[1] P. K. Yadav, Mohnish Kapoor, Kiranmay Sarma (2012).
Land Use Land Cover Mapping, Change Detection and
Conflict Analysis of Nagzira-Navegaon Corridor, Central
India Using Geospatial Technology, International Journal
of Remote Sensing and GIS, Volume 1, Iss 2, 2012, 90-98.
[2] Yudi Setiawan and Kunihiko Yoshino (2012), Change
detection in land-use and land-cover dynamics At a
regional scale from MODIS time-series imagery, ISPRS
Annals of the Photogrammetry, Remote Sensing and
Spatial Info. Sciences, Volume I-7, 2012 XXII ISPRS Congress, 25 Aug–01Sep 2012, Melbourne, Australia.
[3] Arvind C. Pandy and M. S. Nathawat 2006. Land Use
Land Cover Mapping Through Digital Image Processing of
Satellite Data – A case study from Panchkula, Ambala and
Yamunanagar Districts, Haryana State, India.
[4] Olaniran, J.O (2002). Rainfall Anomalies in Nigeria: The
contemporary Understanding. 55th inaugural lecture,
University press Ilorin. [5] Daniel, et al, 2002 A comparison of Landuse and
Landcover Change Detection Methods. ASPRS-ACSM Annual Conference and FIG XXII Congress pg.2.
[6] Adeniyi P.O and Omojola A. (1999) Landuse landcover
change evaluation in Sokoto – Rima Basin of North
Western Nigeria based on Archival of the Environment
(AARSE) on Geoinformation Technology Applications for
Resource and Environmental Management in Africa. Pp
143-172.
[7] Xiaomei Y and Ronqing L.Q. Y, (1999). Change
Detection Based on Remote Sensing Information Model
and its Application to Coastal Line of Yellow River Delta
– Earth Observation Center, NASDA, China.
[8] Coppin, P. & Bauer, M. 1996. Digital Change Detection in Forest Ecosystems with Remote Sensing Imagery.
Remote Sensing Reviews. Vol. 13. p. 207-234.
[9] Dimyati, et al.(1995). An Analysis of Land Use/Land
Cover Change Using the Combination of MSS Landsat and
Land Use Map- A case study of Yogyakarta, Indonesia,
International Journal of Remote Sensing 17(5): 931 – 944. [10] Macleod & Congalton. 1998. A Quantitative
Comparison of Change Detection Algorithms for
Monitoring Eelgrass from Remotely Sensed Data.
Photogrammetric Engineering & Remote Sensing. Vol. 64.
No. 3. p. 207 - 216.
[11] Meyer, W.B. 1995. Past and Present Land-use and Land-cover in the U.S.A. Consequences. p.24-33.
[12] Moshen A, (1999). Environmental Land Use Change
Detection and Assessment Using with Multi – temporal
Satellite Imagery. Zanjan University.

Proceedings of 2nd International Conference on Innovations in Electronics and Communication Engineering (ICIECE-2013)

Proceedings of 2nd International Conference on Innovations in Electronics and Communication Engineering (ICIECE-2013)
1
Copyright © 2022 FDOKUMEN