Chalmers Formula Sailing
163
Chalmers Formula Sailing High Performance Skiff Marine Design Project 2017 Naval Architecture and Ocean Engineering International Master Programme Department of Mechanics and Maritime Sciences CHALMERS UNIVERSITY OF TECHNOLOGY Gothenburg, Sweden 2017
-
Upload
khangminh22 -
Category
Documents
-
view
3 -
download
0
Transcript of Chalmers Formula Sailing
Chalmers Formula Sailing
High Performance Skiff
Marine Design Project 2017
Naval Architecture and Ocean Engineering International Master Programme
Department of Mechanics and Maritime Sciences
CHALMERS UNIVERSITY OF TECHNOLOGY
Gothenburg, Sweden 2017

Chalmers Formula SailingHigh Performance Skiff
Marine Design Project 2017
Acerbi, Tommaso
Andersson, Rasmus
Eriksson, Eric
Granli, Simon
Jacobs, Eike
Rita, Francisco
Sahlberg, Robert
Werner, Emanuel

Chalmers Formula SailingHigh Performance Skiff
Marine Design Project 2017
Department of Mechanics and Maritime Sciences
Chalmers University of Technology
SE-412 96 Göteborg Sweden
Telephone +46(0)31-772 1000
Printed by Chalmers Reproservice
Gothenburg, Sweden, 2017
ii

Abstract
The 1001VELAcup is a sail race between European universities that takes place annually inItaly. The current report addresses the design and construction of a high performance sailingskiff to allow Chalmers University of Technology to participate in the race. The design isregulated by the Class Rule R3 and the current skiff is mainly inspired by the Olympic class49er©.According to the class rules, the hull shall have a content of natural material of at least 70%.This is achieved by using a sandwich material with a balsa core and a composite from flax (linen)fibres, and an epoxy resin based on the shell of cashew nuts. Since there are no restrictions indraft or height of mast, this skiff has a relatively high mast and deep centreboard. All partsof the design are based on analyses of the race area in Mondello, outside of Palermo, in Sicily.Thus, the team chose to not use hydrofoils on the centreboard and rudder. The sail area ismaximised according to the class rules.The work is carried out by eight students on the master program Naval Architecture and OceanEngineering with supervision from teachers and experts from the industry.
Keywords: skiff, dinghy, sailing, 1001VELAcup, Chalmers University of Technology, CDIO
iii

Preface and Acknowledgement
The Marine Design Project, MMA 151, is a mandatory 15 credits course within the masterprogram Naval Architecture and Ocean Engineering at Chalmers University of Technology. Thecourse is organised by the Department of M2, Mechanics and Maritime Sciences at Chalmers.The objective of this project is to design and build a high performance racing skiff in order tocompete in the upcoming 1001VELAcup 2018. Furthermore the participants have to managethe public relation work in addition to the whole process.
The project members would like thank and acknowledge the help, funding, expertise and sup-port of the following:
To Lars Larsson, Adam Persson, John Mcveagh, Per Wretlind, Henrik Ottoson, PerHogström and Rolf Eliasson, thank you for the guidance, knowledge and expertise through-out the duration of the project.
To Per Hogström and Lars Larsson, thank you for providing us the opportunity to workwith such a unique project and for providing us with Ritsalen. This project would havebeen significantly more difficult without it.
To our sponsors and partners in the project: Seldén Mast, North Sails, SSPA, the ITHproject supported by the EU regional fund, Chalmers Foundation "Fond för högskolansbästa" and Area of Advanced Materials at Chalmers.
To Professor Kai Graf for supplying his VPP.
To SSPA, for general support and SNIC (Swedish National Infrastructure for Computing)for computing resources
To our classmates, working alongside us and providing the good atmosphere and com-panionship.
To Chalmers University of Technology.
Project Members
CAD Simon GranliFrancisco Rita
CFD Tommaso AcerbiRobert Sahlberg
FEM Eric ErikssonEmanuel Werner
VPP Rasmus AnderssonEike Jacobs
v
Executive Summary
The following section is a brief outline of the work accomplished in the project. The missionprofile, main particulars for the skiff and a general overview of its rig and sail set up are presentedin this section.
Mission Profile
The mission of this project is to design and build a high performance racing skiff in order toparticipate in the 1001VELAcup. The regatta will take place in the bay of Mondello, Italy, atthe end of September 2018.
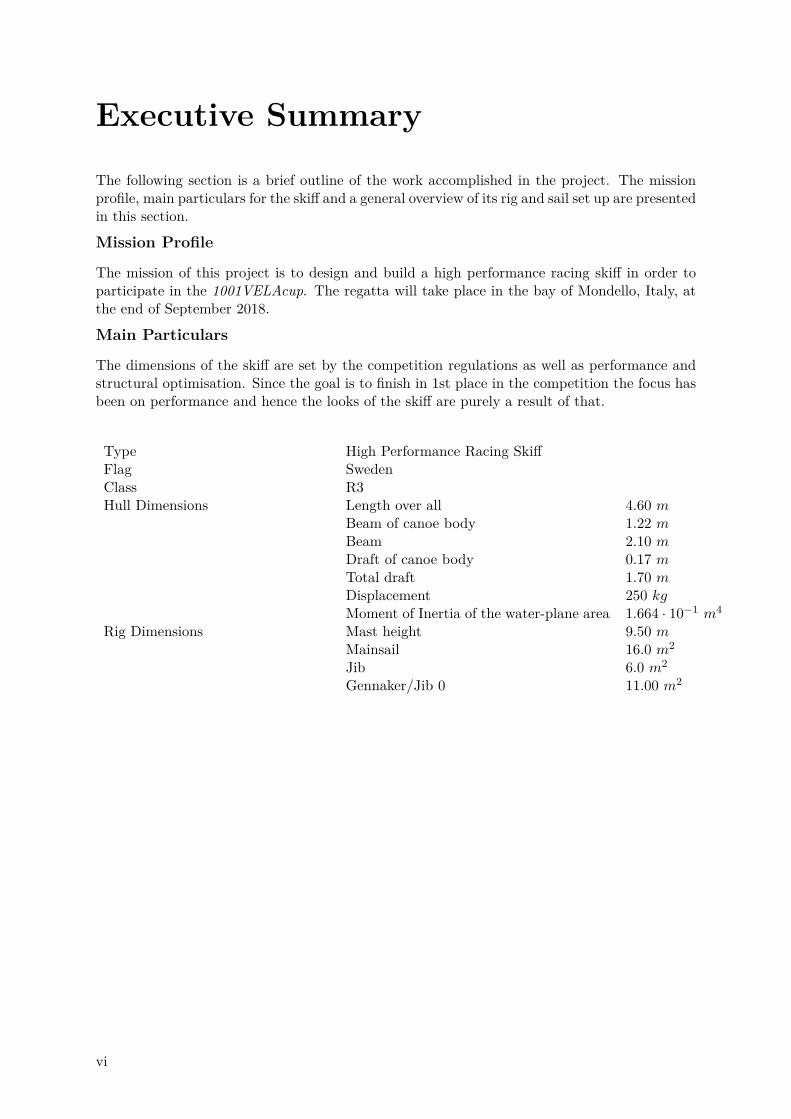
Main Particulars
The dimensions of the skiff are set by the competition regulations as well as performance andstructural optimisation. Since the goal is to finish in 1st place in the competition the focus hasbeen on performance and hence the looks of the skiff are purely a result of that.
Type High Performance Racing SkiffFlag SwedenClass R3Hull Dimensions Length over all 4.60 m
Beam of canoe body 1.22 mBeam 2.10 mDraft of canoe body 0.17 mTotal draft 1.70 mDisplacement 250 kgMoment of Inertia of the water-plane area 1.664 · 10−1 m4
Rig Dimensions Mast height 9.50 mMainsail 16.0 m2
Jib 6.0 m2
Gennaker/Jib 0 11.00 m2
vi
vii

List of Abbreviations
Abbrevation - Description
CDIO - Conceive, Design, Implement and OperateFLAT – The flattening of the main sail to empower itGA - General arrangementISPRA - Istituto Superiore Per la Protezione e la Ricerca Ambientalekn - KnotsMDF - Medium Density FibreboardNACA – National Advisory Committee for AeronauticsORC - Offshore Racing CongressPDF - Probability Density FunctionPLA - Polylactic acidPre-preg - Pre-impregnatedRANS - Reynolds-averaged-Navier-StokesRANS - Reynolds-Avergaed-Navier-StokesRSM - Reynolds Stress MethodRSM - Reynolds Stress ModelSF - Scale factors.f. - Safety factorSST - Shear Stress TransportVMG – Velocity Made GoodVOF - Volume of FluidVOF - Volume of FluidVPP – Velocity Prediction Program
viii

List of Varables
Variable Unit Description
A [m2] Planform areaa [m] Distance between forcesAR [−] Aspect ratioAWA [◦] Apparent wind angleAWS [m/s] Apparent wind speedb [m] Distance between forcesB [m] BeamBmax, canoe body [m] Maximum beam of canoe bodyBS [m/s] Boat speed
C̄ [m] Mean chord lengthC1 [m] Upper chord lengthC2 [m] Lower chord lengthCB [−] Block CoefficientCD [−] Drag coefficientCD,2D [−] Profile drag coefficientCDI [−] Induced drag coefficientCf [−] Skin friction coefficientCL [−] Lift coefficientCL,2D,1◦ [−] 2D lift coefficient at 1◦ angle of attackCL,3D [−] 3D lift coefficientCE [m] Centre of effortCLR [m] Centre of effort of the appendagesCoG [m] Centre of gravityELT [MPa] Elastic modulus in the longitudinal-transverse planeET V [MPa] Elastic modulus in the transverse-vertical planeEV L [MPa] Elastic modulus in the vertical-longitudinal planeEL [MPa] Longitudinal elastic modulusET [MPa] Transverse elastic modulusEV [MPa] Vertical elastic modulusFDI [N ] Induced drag forceFx,aero [N ] Aerodynamic force in x-directionFx,hydro [N ] Hydrodynamic force in x-directionFy,aero [N ] Aerodynamic force in y-directionFy,hydro [N ] Hydrodynamic force in y-directionFz,maststep [N ] Force in z-direction at the mast stepFD [N ] Drag forceFL [N ] Lift forceFx [N ] Force in x-directionFy [N ] Force in y-directionFz [N ] Force in z-directionFn [−] Froude Numberg [m3/(kg · s)] Gravitational constantGM [m] Metacentric heightIx [m4] Moment of inertia of the cross section
ix

IxBS [m4] Moment of inertia of the cross section of the bowspritI49er [m4] Moment of inertia of the water-plane of the 49er©IW P [m4] Moment of inertia of the water-plane areakDY N [−] Dynamic factorL [m] Lengthl [m] Distance on racksLBS [m] Length of the bowsprit that is unsupportedLCF [m] Longitudinal Center FlotationLCG [m] Longitudinal Center of GravityLOA [m] Length over allLWL [m] Length of Water Linemcrew [kg] Mass of the crewmtot [kg] Total massMx [Nm] Moment in x-directionMy [Nm] Moment in y-directionMz [Nm] Moment in z-directionP [N ] Point load applied at the racksPBS [N ] Point load applied at the tip of the bowspritpDY N [N/m2] Dynamic pressurepfw [N/m2] Flat water pressurep0 [N/m2] Uniform pressureρBS [m] Density of the material composing the bowspritR1 [N ] Reaction force on the centrelineR2 [N ] Reaction force at the gunwalerBS [m] radius of the bowsprit’s cross sectionRe [−] Reynolds numberRex [−] Reynolds number at distance x from the stagnation pointRM [Nm] Righting moment
˜RM [Nm] Righting moment approximationRMR [Nm] Righting moment from the crew on the racks
˜RMR [Nm] Righting moment approximation from the crew on the racksRMT [Nm] Righting moment from the crew in the trapeze
˜RMT [Nm] Righting moment approximation from the crew in trapezeσBS [Pa] Stress at a bowsprit sectionσu [Pa] Ultimate stressS12,max [MPa] Maximum shear stress in the XY-/LT-planeS12,min [MPa] Minimum shear stress in the XY-/LT-planeSL,max [MPa] Maximum stress in the longitudinal directionSL,min [MPa] Minimum stress in the longitudinal directionSL [MPa] Stress in the longitudinal directionSLT,max [MPa] Maximum stress in the longitudinal-transverse planeSLT [MPa] Stress in the longitudinal-transverse planeST,max [MPa] Maximum stress in the transverse directionST,min [MPa] Minimum stress in the transverse directionST [MPa] Stress in the transverse directionST V [MPa] Stress in the transverse-vertical planeSV [MPa] Stress in the vertical directionSV L [MPa] Stress in the vertical-longitudinal planeSF [−] Safety factorT [m] Draftt [m] Thickness of the boundary layer
x

tBS [m] Thickness of the bowspritTmax, canoe body [m] Maximum draft of canoe bodyTmax [m] Maximum draftTK [−] Draft of the centreboardTCG [m] Transverse centre of gravityTCGcrew [m] Transverse centre of gravity of crewTR [−] Taper ratioTWA [◦] True wind angleTWS [m/s] True wind speedU∗ [m/s] Friction velocityU∞ [m/s] Freestream velocityU2,max [mm] Maximum deflection in the transverse directionU2,no17 [mm] Deflection in the transverse direction of layup No. 17U2,no18 [mm] Deflection in the transverse direction of layup No. 18U3,i [mm] Deflection of node i in the vertical directionU3,max [mm] Maximum deflection in the vertical directionU3,no17 [mm] Deflection in the vertical direction of layup No. 17U3,no18 [mm] Deflection in the vertical direction of layup No. 18U1 [mm] Maximum deflection of 1st modelU2 [mm] Maximum deflection of 2nd modelU3 [mm] Maximum deflection of 3rd modelV [m/s] SpeedV CG [m] Vertical Centre of GravityxLOA [m] X-position of the maximum beamy [mm] Distance to the nearest wally+ [−] Non-dimensional distance from the wallzB [m] Z-position of centre of buoyancyzG [m] Z-position of centre of gravityzCE [m] Vertical centre of effort of the sailszCLR [m] Vertical centre of effort of the appendagesα [◦] Leeway angle∆ [kg] Displacement∆S [m] Cell spacingµ [kg/(m · s)] Dynamic viscosity of the fluidν [m2/s] Kinematic viscosity of the fluidνLT [MPa] Poisson’s ratio in the longitudinal-transverse planeνT V [MPa] Poisson’s ratio in the transverse-vertical planeνV L [MPa] Poisson’s ratio in the vertical-longitudinal planeρ [kg/m3] Densityτwall [MPa] Wall shear stresses
xi
Contents
Abstract . . . . . . . . . . . . . . . . . . . . . . . . . . . . . . . . . . . . . . . . . . . . iii
Preface and Acknowledgement . . . . . . . . . . . . . . . . . . . . . . . . . . . . . . . v
Executive Summary . . . . . . . . . . . . . . . . . . . . . . . . . . . . . . . . . . . . . vi
Mission Profile . . . . . . . . . . . . . . . . . . . . . . . . . . . . . . . . . . . . . vi
Main Particulars . . . . . . . . . . . . . . . . . . . . . . . . . . . . . . . . . . . . vi
List of Abbreviations . . . . . . . . . . . . . . . . . . . . . . . . . . . . . . . . . . . . . viii
List of Variables . . . . . . . . . . . . . . . . . . . . . . . . . . . . . . . . . . . . . . . ix
List of Figures . . . . . . . . . . . . . . . . . . . . . . . . . . . . . . . . . . . . . . . . xv
List of Tables . . . . . . . . . . . . . . . . . . . . . . . . . . . . . . . . . . . . . . . . . xvii
1 Introduction 1
2 1001VELAcup 3
2.1 Class Rules . . . . . . . . . . . . . . . . . . . . . . . . . . . . . . . . . . . . . . . 3
2.2 The Race . . . . . . . . . . . . . . . . . . . . . . . . . . . . . . . . . . . . . . . . 4
3 Design basis 7
3.1 Wind Statistics . . . . . . . . . . . . . . . . . . . . . . . . . . . . . . . . . . . . . 7
3.2 References for Design . . . . . . . . . . . . . . . . . . . . . . . . . . . . . . . . . . 9
3.2.1 Hull . . . . . . . . . . . . . . . . . . . . . . . . . . . . . . . . . . . . . . . 9
3.2.2 Rig and Sails . . . . . . . . . . . . . . . . . . . . . . . . . . . . . . . . . . 11
3.2.3 Appendages . . . . . . . . . . . . . . . . . . . . . . . . . . . . . . . . . . . 12
3.2.4 Racks . . . . . . . . . . . . . . . . . . . . . . . . . . . . . . . . . . . . . . 14
3.3 Overall Design Features . . . . . . . . . . . . . . . . . . . . . . . . . . . . . . . . 14
4 Theory 17
4.1 Computer-Aided Design (CAD) . . . . . . . . . . . . . . . . . . . . . . . . . . . . 17
4.1.1 Hull Fairing . . . . . . . . . . . . . . . . . . . . . . . . . . . . . . . . . . . 17
4.2 Computional Fluid Dynamics (CFD) . . . . . . . . . . . . . . . . . . . . . . . . . 19
4.2.1 Resistance . . . . . . . . . . . . . . . . . . . . . . . . . . . . . . . . . . . . 19
4.2.2 Governing Equations Solved . . . . . . . . . . . . . . . . . . . . . . . . . . 20
4.2.3 Turbulence Model . . . . . . . . . . . . . . . . . . . . . . . . . . . . . . . 20
4.2.4 Numerical Solution . . . . . . . . . . . . . . . . . . . . . . . . . . . . . . . 21
4.2.5 Grid Description . . . . . . . . . . . . . . . . . . . . . . . . . . . . . . . . 24
4.2.6 Aerodynamic Resistance . . . . . . . . . . . . . . . . . . . . . . . . . . . . 25
4.2.7 CFD Analysis Setup . . . . . . . . . . . . . . . . . . . . . . . . . . . . . . 25
4.3 Finite Element Method (FEM) . . . . . . . . . . . . . . . . . . . . . . . . . . . . 29
4.3.1 Prestudy . . . . . . . . . . . . . . . . . . . . . . . . . . . . . . . . . . . . 29
4.3.2 Hull Components . . . . . . . . . . . . . . . . . . . . . . . . . . . . . . . . 29
4.3.3 Centreboard and Rudder . . . . . . . . . . . . . . . . . . . . . . . . . . . 30
4.3.4 The Sandwich Structure . . . . . . . . . . . . . . . . . . . . . . . . . . . . 30
4.3.5 FEM Analysis Set Up . . . . . . . . . . . . . . . . . . . . . . . . . . . . . 33
4.4 Velocity Prediction Program (VPP) . . . . . . . . . . . . . . . . . . . . . . . . . 38
4.4.1 Input and output . . . . . . . . . . . . . . . . . . . . . . . . . . . . . . . . 39
4.4.2 Solved equations . . . . . . . . . . . . . . . . . . . . . . . . . . . . . . . . 39
4.4.3 Centreboard and Rudder . . . . . . . . . . . . . . . . . . . . . . . . . . . 41
4.4.4 Sail Set Up . . . . . . . . . . . . . . . . . . . . . . . . . . . . . . . . . . . 45
xii

Contents
5 Design process 475.1 Hull . . . . . . . . . . . . . . . . . . . . . . . . . . . . . . . . . . . . . . . . . . . 47
5.1.1 Hull Analysis . . . . . . . . . . . . . . . . . . . . . . . . . . . . . . . . . . 475.1.2 Hull Concepts . . . . . . . . . . . . . . . . . . . . . . . . . . . . . . . . . . 485.1.3 Hull Design Optimisation . . . . . . . . . . . . . . . . . . . . . . . . . . . 515.1.4 Final Hull Geometry and Hydrodynamics . . . . . . . . . . . . . . . . . . 585.1.5 Deck . . . . . . . . . . . . . . . . . . . . . . . . . . . . . . . . . . . . . . . 605.1.6 Structural Hull Design . . . . . . . . . . . . . . . . . . . . . . . . . . . . . 60
5.2 Sail and Rig . . . . . . . . . . . . . . . . . . . . . . . . . . . . . . . . . . . . . . . 755.2.1 Sail Set Up . . . . . . . . . . . . . . . . . . . . . . . . . . . . . . . . . . . 755.2.2 Rig . . . . . . . . . . . . . . . . . . . . . . . . . . . . . . . . . . . . . . . . 83
5.3 Appendages and Racks . . . . . . . . . . . . . . . . . . . . . . . . . . . . . . . . . 895.3.1 Centreboard and rudder . . . . . . . . . . . . . . . . . . . . . . . . . . . . 895.3.2 Racks . . . . . . . . . . . . . . . . . . . . . . . . . . . . . . . . . . . . . . 91
6 Balancing of Final Design 97
7 Building process 997.1 Templates . . . . . . . . . . . . . . . . . . . . . . . . . . . . . . . . . . . . . . . . 997.2 Planking . . . . . . . . . . . . . . . . . . . . . . . . . . . . . . . . . . . . . . . . . 100
7.2.1 Planking the hull and deck . . . . . . . . . . . . . . . . . . . . . . . . . . 1007.2.2 Planking the internal structure . . . . . . . . . . . . . . . . . . . . . . . . 101
7.3 Lamination . . . . . . . . . . . . . . . . . . . . . . . . . . . . . . . . . . . . . . . 1027.3.1 Laminating the hull and deck . . . . . . . . . . . . . . . . . . . . . . . . . 1027.3.2 Laminating the internal structure . . . . . . . . . . . . . . . . . . . . . . . 103
7.4 Further Building . . . . . . . . . . . . . . . . . . . . . . . . . . . . . . . . . . . . 1037.4.1 Rudder and Centreboard . . . . . . . . . . . . . . . . . . . . . . . . . . . 1037.4.2 Racks . . . . . . . . . . . . . . . . . . . . . . . . . . . . . . . . . . . . . . 1047.4.3 Bowsprit . . . . . . . . . . . . . . . . . . . . . . . . . . . . . . . . . . . . . 104
8 Future Work 1058.1 Remaining Work . . . . . . . . . . . . . . . . . . . . . . . . . . . . . . . . . . . . 105
8.1.1 Sails . . . . . . . . . . . . . . . . . . . . . . . . . . . . . . . . . . . . . . . 1058.1.2 Local Reinforcements . . . . . . . . . . . . . . . . . . . . . . . . . . . . . 1058.1.3 Structure of Centreboard and Rudder . . . . . . . . . . . . . . . . . . . . 1068.1.4 FE-Analysis of Racks . . . . . . . . . . . . . . . . . . . . . . . . . . . . . 1068.1.5 Structure of Bowsprit . . . . . . . . . . . . . . . . . . . . . . . . . . . . . 1078.1.6 Deck Layout . . . . . . . . . . . . . . . . . . . . . . . . . . . . . . . . . . 107
8.2 Future Investigations . . . . . . . . . . . . . . . . . . . . . . . . . . . . . . . . . . 1078.2.1 Hull Fluid Dynamics . . . . . . . . . . . . . . . . . . . . . . . . . . . . . . 1078.2.2 Wing Sails . . . . . . . . . . . . . . . . . . . . . . . . . . . . . . . . . . . . 1088.2.3 Foiling . . . . . . . . . . . . . . . . . . . . . . . . . . . . . . . . . . . . . . 1088.2.4 Rotating Racks . . . . . . . . . . . . . . . . . . . . . . . . . . . . . . . . . 1088.2.5 Rotating Bowsprit . . . . . . . . . . . . . . . . . . . . . . . . . . . . . . . 109
References 111
Appendix A - Drawings I
Appendix B - Plots VII
Appendix C - Rules IX
xiii

Contents
xiv

List of Figures
2.1 Map of Mondello, Sicily . . . . . . . . . . . . . . . . . . . . . . . . . . . . . . . . 5
2.2 2017 Regatta track, wind from left side of figure . . . . . . . . . . . . . . . . . . 5
3.1 Weibull probability distributions . . . . . . . . . . . . . . . . . . . . . . . . . . . 8
3.2 Weibull probability density functions . . . . . . . . . . . . . . . . . . . . . . . . . 8
3.3 Weibull probability density functions for different time steps . . . . . . . . . . . . 9
3.4 Model of a 49er©, (Wikipedia, 2010) . . . . . . . . . . . . . . . . . . . . . . . . . 10
3.5 Reference hull concepts . . . . . . . . . . . . . . . . . . . . . . . . . . . . . . . . 11
3.6 Bowsprit reference concepts . . . . . . . . . . . . . . . . . . . . . . . . . . . . . . 12
3.7 Racks reference concepts . . . . . . . . . . . . . . . . . . . . . . . . . . . . . . . . 14
4.1 Keel line curvature graph for final hull model . . . . . . . . . . . . . . . . . . . . 18
4.2 Water line curvature graph for final hull model . . . . . . . . . . . . . . . . . . . 18
4.3 Chine line curvature graph for final hull model . . . . . . . . . . . . . . . . . . . 19
4.4 Computational domain setup . . . . . . . . . . . . . . . . . . . . . . . . . . . . . 22
4.5 Numerical ventilation error . . . . . . . . . . . . . . . . . . . . . . . . . . . . . . 24
4.6 Volume mesh growth . . . . . . . . . . . . . . . . . . . . . . . . . . . . . . . . . . 25
4.7 Mesh detail for the bow in the CFD-simulations . . . . . . . . . . . . . . . . . . . 27
4.8 Mesh detail for the aft in the CFD-simulations . . . . . . . . . . . . . . . . . . . 28
4.9 Sandwich constituents . . . . . . . . . . . . . . . . . . . . . . . . . . . . . . . . . 31
4.10 The meshing of the hull surface . . . . . . . . . . . . . . . . . . . . . . . . . . . . 34
4.11 Shear stresses in core . . . . . . . . . . . . . . . . . . . . . . . . . . . . . . . . . . 35
4.12 Simplification of forces acting on the skiff considered in the VPP . . . . . . . . . 40
4.13 Description of planform . . . . . . . . . . . . . . . . . . . . . . . . . . . . . . . . 42
4.14 Profile drag for different profiles . . . . . . . . . . . . . . . . . . . . . . . . . . . . 43
4.15 Profile drag for different thicknesses . . . . . . . . . . . . . . . . . . . . . . . . . 44
4.16 Lift for different profiles . . . . . . . . . . . . . . . . . . . . . . . . . . . . . . . . 44
4.17 Forces acting on a sail . . . . . . . . . . . . . . . . . . . . . . . . . . . . . . . . . 45
4.18 Lift and Drag coefficients as a function of the angle of attack α . . . . . . . . . . 46
5.1 Transonic hull© . . . . . . . . . . . . . . . . . . . . . . . . . . . . . . . . . . . . . 50
5.2 Scaled 49er© hull . . . . . . . . . . . . . . . . . . . . . . . . . . . . . . . . . . . . 51
5.3 Straight vs flared freeboard sprays differences . . . . . . . . . . . . . . . . . . . . 52
5.4 Max Beam position vs resistance. Red stars mark measured data; Blue line isthe fitted resistance curve . . . . . . . . . . . . . . . . . . . . . . . . . . . . . . . 53
5.5 Max Draft position vs resistance. Red stars mark measured data; Blue line isthe fitted resistance curve. . . . . . . . . . . . . . . . . . . . . . . . . . . . . . . . 57
5.6 Resistance curve for final canoe-body . . . . . . . . . . . . . . . . . . . . . . . . . 58
5.7 Wave pattern generation at 6 kn speed . . . . . . . . . . . . . . . . . . . . . . . . 59
5.8 Location of hull nodes investigated . . . . . . . . . . . . . . . . . . . . . . . . . . 62
5.9 Location of deck nodes investigated . . . . . . . . . . . . . . . . . . . . . . . . . . 64
5.10 Overview of internal stiffening structure . . . . . . . . . . . . . . . . . . . . . . . 68
5.11 Comparison of stiffener design . . . . . . . . . . . . . . . . . . . . . . . . . . . . . 69
5.12 Schematic flange layup design of stiffener . . . . . . . . . . . . . . . . . . . . . . 69
5.13 Comparison of model designs . . . . . . . . . . . . . . . . . . . . . . . . . . . . . 70
5.14 Comparison of model deflection . . . . . . . . . . . . . . . . . . . . . . . . . . . . 70
xv

List of Figures
5.15 Deformations magnified 50:1 for hull-with-trapeze load case . . . . . . . . . . . . 715.16 Deformation of hull magnified 50:1 for hull-with-trapeze load case. Hull plating
and deck are hidden . . . . . . . . . . . . . . . . . . . . . . . . . . . . . . . . . . 725.17 Distortion of elements at forestay magnified 50:1 for hull-with-trapeze load case . 725.18 Bulkhead element for which stress is plotted in Figure (5.19) . . . . . . . . . . . 735.19 State of stress in bulkhead element shown in Figure (5.18) . . . . . . . . . . . . . 735.20 Strain plotted for bulkhead element in Figure 5.18 . . . . . . . . . . . . . . . . . 745.21 Hull element for which stress is plotted in Figure (5.22) . . . . . . . . . . . . . . 745.22 State of stress in hull element shown in Figure (5.21) . . . . . . . . . . . . . . . . 755.23 Final sail area and mast height dimensions . . . . . . . . . . . . . . . . . . . . . . 805.24 Final sail area and mast height dimensions using the Jib 0 . . . . . . . . . . . . . 815.25 Final sail plan . . . . . . . . . . . . . . . . . . . . . . . . . . . . . . . . . . . . . . 825.26 Highlighted are the Jib 0 (red) and Jib (green) . . . . . . . . . . . . . . . . . . . 855.27 Schematics of the attachment of the bowsprit to the hull . . . . . . . . . . . . . . 855.28 Different levels of extension of the bowsprit, with the fixed conical section high-
lighted in red . . . . . . . . . . . . . . . . . . . . . . . . . . . . . . . . . . . . . . 865.29 Rotating bowsprit concept model . . . . . . . . . . . . . . . . . . . . . . . . . . . 885.30 Final rig design, with the diamond rig . . . . . . . . . . . . . . . . . . . . . . . . 895.31 Planforms comparison . . . . . . . . . . . . . . . . . . . . . . . . . . . . . . . . . 905.32 Analysed load case for the aft support of the rack . . . . . . . . . . . . . . . . . . 935.33 Planforms comparison . . . . . . . . . . . . . . . . . . . . . . . . . . . . . . . . . 955.34 Analysed load case for the aft support of the rack . . . . . . . . . . . . . . . . . . 96
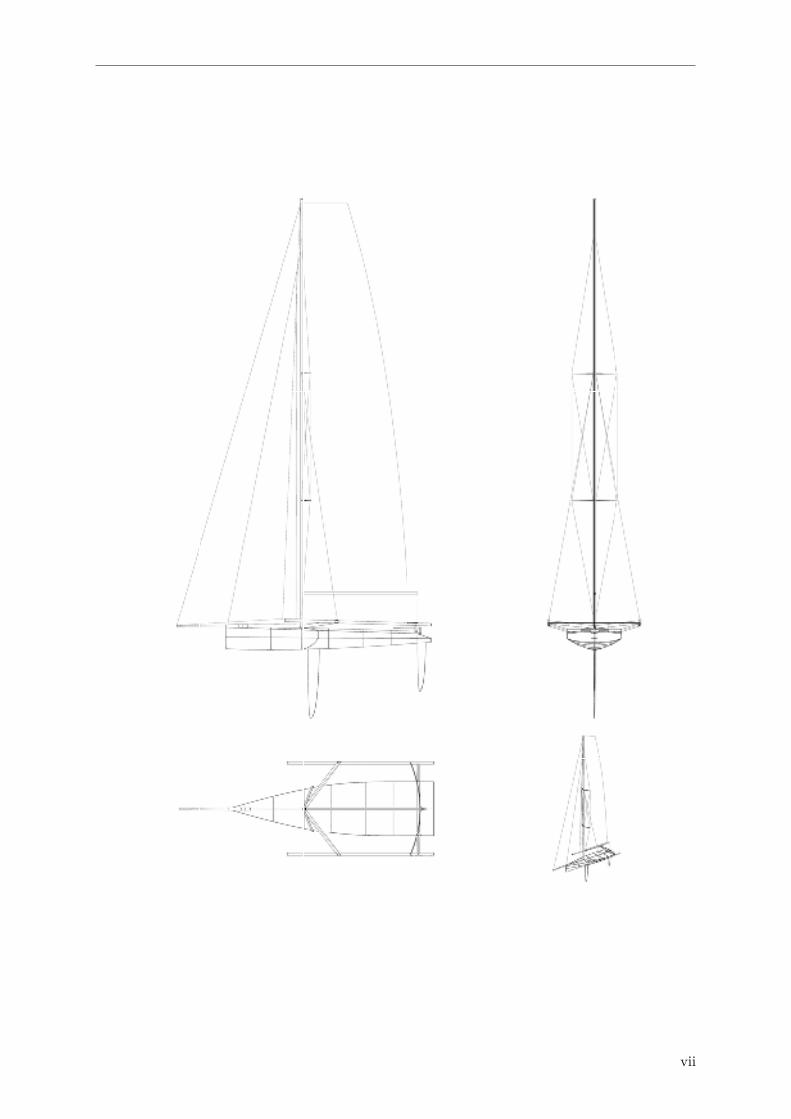
6.1 General arrangement drawings of the skiff . . . . . . . . . . . . . . . . . . . . . . 97
7.1 Dog bones in one of the deck’s template . . . . . . . . . . . . . . . . . . . . . . . 997.2 Templates models in Rhino 3D . . . . . . . . . . . . . . . . . . . . . . . . . . . . 1007.3 Template assemblies used for planking . . . . . . . . . . . . . . . . . . . . . . . . 1007.4 Planking with divinycell blocks . . . . . . . . . . . . . . . . . . . . . . . . . . . . 1017.5 Faired hull . . . . . . . . . . . . . . . . . . . . . . . . . . . . . . . . . . . . . . . . 1017.6 Bulkhead template completely covered with balsa for the core . . . . . . . . . . . 1017.7 Finished half-bulkhead core . . . . . . . . . . . . . . . . . . . . . . . . . . . . . . 1027.8 Layup procedure of stiffener component. . . . . . . . . . . . . . . . . . . . . . . . 103
B.1 Max beam position vs resistance. Red stars mark measured data; Blue line isthe fitted resistance curve . . . . . . . . . . . . . . . . . . . . . . . . . . . . . . . VII
B.2 Max draft position vs resistance. Red stars mark measured data; Blue line is thefitted resistance curve . . . . . . . . . . . . . . . . . . . . . . . . . . . . . . . . . VII
xvi
List of Tables
3.1 Mean values and Weibull distribution fit for inspected wind statistics data . . . . 7
3.2 Mean values and Weibull distribution fit for different time steps . . . . . . . . . . 8
3.3 Important dimensions of the 49er© . . . . . . . . . . . . . . . . . . . . . . . . . . 12
3.4 Important dimensions of Federica (DeSantis, 2016) . . . . . . . . . . . . . . . . . 13
3.5 Comparison of rudder areas and lead for different skiff classes . . . . . . . . . . . 13
4.1 Computational domain boundaries . . . . . . . . . . . . . . . . . . . . . . . . . . 22
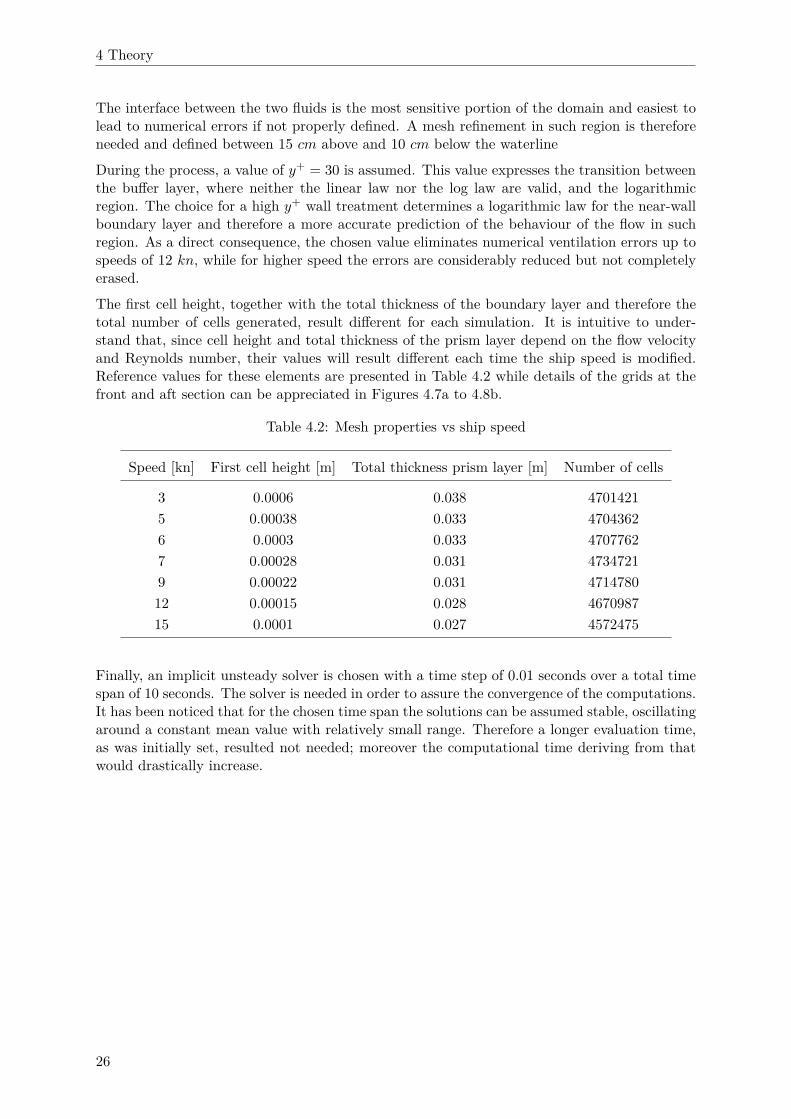
4.2 Mesh properties vs ship speed . . . . . . . . . . . . . . . . . . . . . . . . . . . . . 26
4.3 Balsa wood properties . . . . . . . . . . . . . . . . . . . . . . . . . . . . . . . . . 32
4.4 Flax/epoxy laminate properties . . . . . . . . . . . . . . . . . . . . . . . . . . . . 33
4.5 Load case crew on racks . . . . . . . . . . . . . . . . . . . . . . . . . . . . . . . . 36
4.6 Load case crew in trapeze . . . . . . . . . . . . . . . . . . . . . . . . . . . . . . . 37
5.1 The simulated speeds for each hull in the CFD-simulations converted from knotsto metres per second. . . . . . . . . . . . . . . . . . . . . . . . . . . . . . . . . . . 48
5.2 Location of the centre of gravity (CoG) for each speed scaled from the 49er©. . . 48
5.3 Beam fom moment of inertia . . . . . . . . . . . . . . . . . . . . . . . . . . . . . 50
5.4 Resistance Comparison Between Transonic Hull© and Scaled 49er© Hull . . . . . 51
5.5 Positions for the maximum beam variation . . . . . . . . . . . . . . . . . . . . . . 52
5.6 Resistance vs beam position comparison . . . . . . . . . . . . . . . . . . . . . . . 54
5.7 Scale factors to compare which hull to choose for maximum beam position variation 54
5.8 Ranked and scaled comparison between the beam position to evaluate where toplace the maximum beam . . . . . . . . . . . . . . . . . . . . . . . . . . . . . . . 55
5.9 Positions for the maximum draft position variation . . . . . . . . . . . . . . . . . 55
5.10 Resistance vs draft position comparison . . . . . . . . . . . . . . . . . . . . . . . 56
5.11 Scale factors to compare which hull to choose for draft variation . . . . . . . . . 56
5.12 Ranked and scaled comparison between the beam position to evaluate where toplace the maximum draft . . . . . . . . . . . . . . . . . . . . . . . . . . . . . . . 56
5.13 Final hull dimensions for the skiff . . . . . . . . . . . . . . . . . . . . . . . . . . . 58
5.14 Final drag along x-axis for the canoe body . . . . . . . . . . . . . . . . . . . . . . 58
5.15 Drag along x-axis for hull LED3 . . . . . . . . . . . . . . . . . . . . . . . . . . . 60
5.16 Maximum stress for varying core thickness . . . . . . . . . . . . . . . . . . . . . . 61
5.17 Variation of the sandwich skin laminates . . . . . . . . . . . . . . . . . . . . . . . 63
5.18 Deck layup analysis with 8 mm core thickness . . . . . . . . . . . . . . . . . . . . 65
5.19 Deck layup analysis with 10 mm core thickness . . . . . . . . . . . . . . . . . . . 66
5.20 Deck layup analysis with 12 mm core thickness . . . . . . . . . . . . . . . . . . . 67
5.21 Comparison between models with and without flange. . . . . . . . . . . . . . . . 70
5.22 Different concepts . . . . . . . . . . . . . . . . . . . . . . . . . . . . . . . . . . . . 77
5.23 Systematic variations within different Sail Concepts . . . . . . . . . . . . . . . . 78
5.24 Systematic variations with an centreboard AR = 7.69 . . . . . . . . . . . . . . . 79
5.25 Constants assumed for subsequent computations . . . . . . . . . . . . . . . . . . 86
5.26 Variables used for subsequent computations . . . . . . . . . . . . . . . . . . . . . 86
5.27 Results from the Matlab computations . . . . . . . . . . . . . . . . . . . . . . . . 87
5.28 Leeway angle for different TWS at VMG . . . . . . . . . . . . . . . . . . . . . . . 91
5.29 Forces to dimension against . . . . . . . . . . . . . . . . . . . . . . . . . . . . . . 92
xvii

List of Tables
5.30 Material data for Aluminium EN-AW 6082 T6 taken from Alutrade (2017b) ansAlutrade (2017a) . . . . . . . . . . . . . . . . . . . . . . . . . . . . . . . . . . . . 92
5.31 Dimensions for the aft support. . . . . . . . . . . . . . . . . . . . . . . . . . . . . 935.32 Dimensions for the bow support . . . . . . . . . . . . . . . . . . . . . . . . . . . . 945.33 Dimensions for the beam rack between the support. . . . . . . . . . . . . . . . . 955.34 Dimensions of all the parts of the rack . . . . . . . . . . . . . . . . . . . . . . . . 96
xviii
1 Introduction
This project aims at designing and building a high performance racing skiff, the report startsby explaining the competition context of the project and presenting the class rules that serveas a starting point for the design. The respective design basis follows, being further developedin the design method section. Fundamental theory is also presented in order to explain themain theoretical topics and assumptions that guide all the different sub-groups and their work.Finally the design process can be described without any additional restrictions. In that section,as well as the rest of the report, the process is described in terms of the different componentsof the boat, namely the hull, sail and rig, and appendages. The subsequent sections deal withthe resulting design and its layout, and the last one with the building process.
The project is inserted in three main contexts. Firstly, it is a mandatory 15 credits course forthe Masters Program of Naval Architecture and Ocean Engineering at Chalmers. The course isorganized by the department M2, Mechanics and Maritime Sciences. Secondly, it is inserted inthe context of Chalmers Sports and Technology, which is where advanced sport-related researchtakes place involving engineers, researchers and students with the athletes and coaches, as wellas the enterprise and governing bodies. In this context, one important objective is to improvethe performance alongside safety for the athletes, which are, in this case, sailors. Finally, thelast context this project is included in is the 1001VELAcup 2018, in which the built boat willbe raced against competitors from other universities. This competition is the element linkingall these contexts, being what justifies the building of the boat rather than just its design, aswell as the need for connection with athletes to sail it in the future. These athletes are to whomthe authors turn to for practical advice about several practical usages that are fundamental inthe design process and yet are very difficult to realize if based only on a theoretical analysis.
Naturally with several different contexts come several different goals. First it is intended to gainvaluable knowledge and experience in designing yachts, and all it comprises in all the differentareas of the utmost relevance to Naval Architecture. Furthermore, in the context of ChalmersSports and Technology and the 1001VELAcup, the authors gain additional knowledge in theoperation and practical matters of sailing, its equipment, and in boat building.
1

1 Introduction
2

2 1001VELAcup
Born in 2005 from the minds of the Italian yacht designers Massimo Paperini and Paolo Processi,the 1001VELAcup was brought to the university departments of Naval Architecture, Architec-ture and Engineering of all Europe, the concept of a Conceive, Design, Implement and Operate(CDIO),(CDIO, 2017), project similar to the world famous Formula Student, (Imeche, 2017).It is therefore a project aiming towards the unification and stimulation of academic, as well asresearch and innovation purposes. Further aim of the project is the formation of new profes-sional profiles in the naval architecture world, through the concept design and further buildingprocess of a high performance racing skiff.
The foundation of the project is the Class Rule R3 (A. 1001VELAcup, 2017), kept simple in itsinterpretation and minimalistic in order to leave wide margins to the design process. Such rulesare mainly aimed to limit the dimensions of the hulls and the total sail area. The strength ofthe class rule lays however in the limitations that concern the materials used for the buildingprocess. It is indeed required that a large portion of the materials used for the hull are ofsustainable, either animal or vegetable, derivation, while the mast, or at least its matrix, isexpected to be realized in extruded aluminum.
The mobilisation of students and universities toward the applied research of new compositematerials applicable to nautical purposes has been without a doubt one of the main resultsachieved by the competition. Other relevant factor achieved has been the direct implicationof realities outside the university walls. Collaboration between students, professors and otherexperts from the industry made it possible over the years to carry out focused researches indifferent branches of the yacht design and develop bilateral partnerships that benefit both theacademic and the professional worlds. The most important achievement of the competition ishowever to be identified in the empowerment of students in relation to a real problem, aimingfar beyond obtaining a grade or passing an exam and closing that gap between concept designand final product that defines unfortunately too often academic projects.
The competition has seen over the years the rise of innovative concepts and the constant growinginterest among Italian and other European universities, a signal perhaps that it is ready toexpand.
2.1 Class Rules
As a proper sport competition, the 1001VELAcup is subjected to a regulation class specificallycreated for it, class R3, that allows room for innovation yet limits the differences among theteams taking part to the race. Such rules affect both the crew, which during the race will beexpected to follow the Racing Rules of Sailing, and the skiff. A full rule book can be examinedin Appendix 8.2.5. In the following section only the main limitations are listed.
As far as the crew is regarded, the regulation states it to be composed of two students currentlyregistered at the university they race for. A second rule aims toward a fair level of skills amongthe sailors, so that crew members that hold a Group 3 Classification (WorldSailing, 2017) arenot allowed to participate.
The class R3 is thought of as a box-rule in which limitations are minimal and principally affectthe main dimensions and properties of the skiff in order to allow different design solutions.Beam and Length overall are limited respectively to 2.1 and 4.6 m with a tolerance of 15 mm.
3
2 1001VELAcup
No limits are put on draft, displacement nor the freeboard.
A further geometrical limitation affects the shape of the hull, which has to be of mono-hull type,symmetric along the centreline and is not allowed to present transverse concavities below thewaterline.
As mentioned earlier, the class rules mainly focus their attention on the materials used for thehull, setting a 70% minimum limit in terms of weight for the amount of natural material usedfor the hull construction. Therefore all titanium, aramid, carbon fibres or other high-modulusfibres are banned for this component. The most recent update of the regulations introduced inthe 2018 edition of the 1001VELAcup, put different restrictions to the design of the appendages.In fact, the latest update of the regulations allow the design of the appendages in carbon fibre,spectra, kevlar or other high-modulus fibres. Finally, the bowsprit, whether needed, can berealized in carbon fibre.
Similar limitations in terms of materials are applied to the sail plan, so that aramid, carbonor other high-modulus fibres are prohibited. The total sail area carried onboard is furthermorelimited to not exceed 33 m2.
Finally, unlike most of the box-rules, no geometric limitations are set on the rig plan, it isalthough required for it to be realised out of extruded aluminium.
2.2 The Race
The trophy 1001VELAcup is held every year in Italy during the last week of September. The2018 edition will be held for the second time in the bay of Mondello in Palermo. A map of thebay can be appreciated in Figure 2.1.
Historically, the trophy consisted of an open sea regatta distributed in nine races, each consistingof four legs, over three days of total competition. A sketch of the regatta field, as published inthe Istruzioni di Regata (1001VELAcup, 2017) is shown in Figure 2.2.
Since the 2017 edition, a Midwinter Indoor Race has been introduced with the aim of evaluatingthe hulls only on their technical features. The skiff named LED, realised by the students of theUniversita’ degli Studi di Palermo, graduated as champion of the first edition of the Midwinter
Indoor Race. Hosted by the Universita’ di Napoli Federico II, the indoor competition sees theparticipant hulls towed at the speeds of 2, 4 and 6 kn and judged based on the total resistance,with and without appendages, wave generation pattern in calm water, and the seakeepingproperties in head waves.
4

2 1001VELAcup
Figure 2.1: Map of Mondello, Sicily
Figure 2.2: 2017 Regatta track, wind from left side of figure
5

2 1001VELAcup
6
3 Design basis
In this chapter, a prestudy is presented. In this prestudy, all of the skiff’s parts that are designedare covered, alongside with an investigation of the wind statistics at the race site. Investigationof similar skiffs, both commercial and those participating in the 1001VELAcup in previousyears are also presented. The limitations and the overall design features of the project are alsoidentified and stated in the last part of this chapter.
3.1 Wind Statistics
When designing a hull for a competition, it is good practise to optimise it for the racing con-ditions, therefore, considering where the race will take place, in this case Mondello, Italy. Thedesign can then be optimised for the expected wind speed. The data needed is thus primar-ily the mean wind speed together with its statistical distribution. The data is collected fromtwo different sources, Windguru (Windguru, 2017) and Istituto Superiore per la Protezione ela Ricerca Ambientale (ISPRA) (R.M.N., 2017), focusing on those data corresponding to thesecond half of September. Time period and time frequency of the data extrapolated are differ-ent for the different sources. Windguru provides data since 2004 to present day with 3 hourstime spans, while ISPRA provides acceptable data from 2009 to 2014 with a time frequencyof 10 minutes. Both data sheets are consequently resumed in order to focus only at the hoursduring which the race takes place, therefore only data between 11 am and 5 pm are taken intoconsideration.
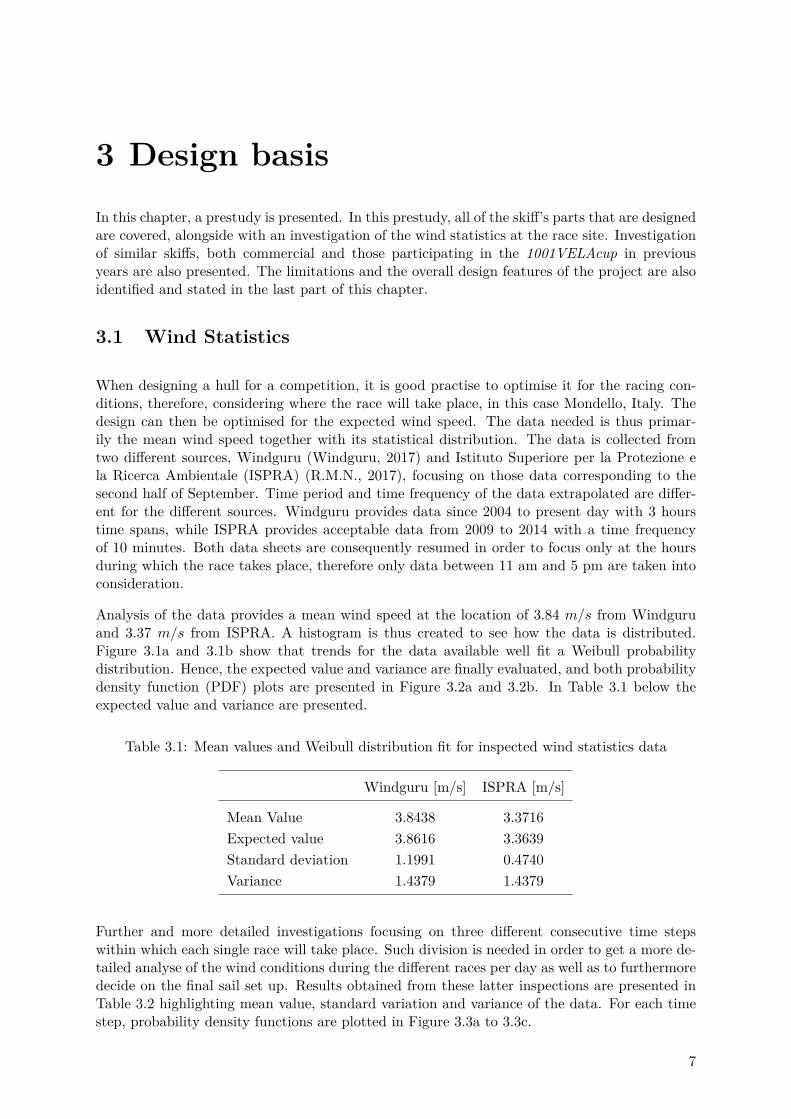
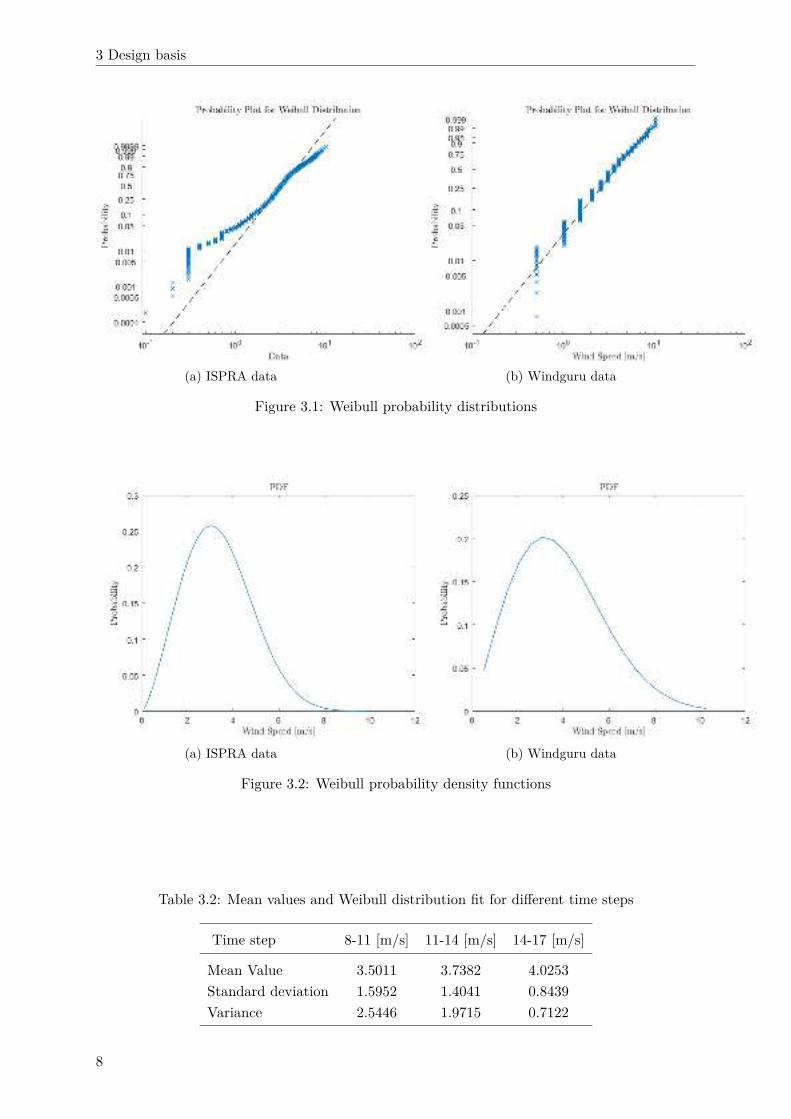
Analysis of the data provides a mean wind speed at the location of 3.84 m/s from Windguruand 3.37 m/s from ISPRA. A histogram is thus created to see how the data is distributed.Figure 3.1a and 3.1b show that trends for the data available well fit a Weibull probabilitydistribution. Hence, the expected value and variance are finally evaluated, and both probabilitydensity function (PDF) plots are presented in Figure 3.2a and 3.2b. In Table 3.1 below theexpected value and variance are presented.
Table 3.1: Mean values and Weibull distribution fit for inspected wind statistics data
Windguru [m/s] ISPRA [m/s]
Mean Value 3.8438 3.3716
Expected value 3.8616 3.3639
Standard deviation 1.1991 0.4740
Variance 1.4379 1.4379
Further and more detailed investigations focusing on three different consecutive time stepswithin which each single race will take place. Such division is needed in order to get a more de-tailed analyse of the wind conditions during the different races per day as well as to furthermoredecide on the final sail set up. Results obtained from these latter inspections are presented inTable 3.2 highlighting mean value, standard variation and variance of the data. For each timestep, probability density functions are plotted in Figure 3.3a to 3.3c.
7
3 Design basis
(a) ISPRA data (b) Windguru data
Figure 3.1: Weibull probability distributions
(a) ISPRA data (b) Windguru data
Figure 3.2: Weibull probability density functions
Table 3.2: Mean values and Weibull distribution fit for different time steps
Time step 8-11 [m/s] 11-14 [m/s] 14-17 [m/s]
Mean Value 3.5011 3.7382 4.0253
Standard deviation 1.5952 1.4041 0.8439
Variance 2.5446 1.9715 0.7122
8

3 Design basis
(a) 8-11 am time step data (b) 11-14 am time step data
(c) 14-17 am time step data
Figure 3.3: Weibull probability density functions for different time steps
3.2 References for Design
To avoid starting from a clean sheet, it is decided to start the design process with some ref-erences. The overall reference skiff used in this project is the 49er©. The 49er© is a highperformance sailing dinghy which was designed in the 1990’s (Bethwaite, 2010). However, someother references are used as well for the hull shape and the appendages.
3.2.1 Hull
When starting the design process for the hull shape, it was decided to start from a coupleof reference hulls. This section presents the two hull shapes that are used as references andexplains why they were chosen.
9
3 Design basis
3.2.1.1 49er© Hull
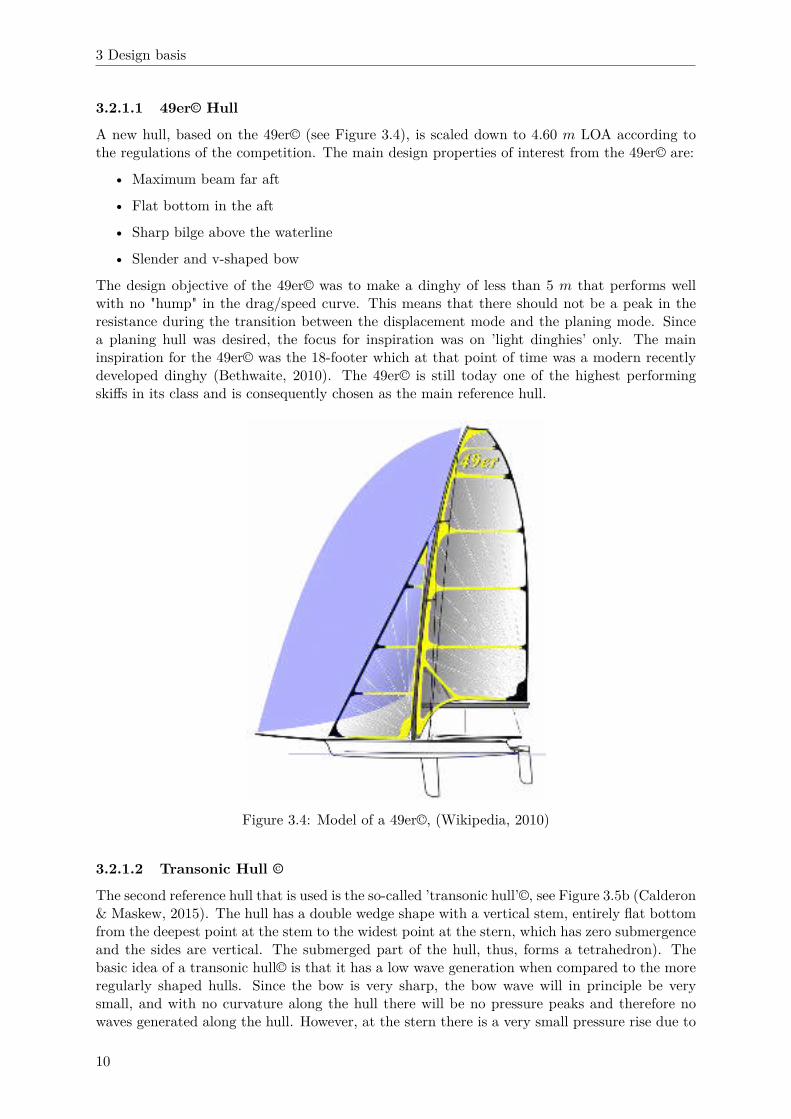
A new hull, based on the 49er© (see Figure 3.4), is scaled down to 4.60 m LOA according tothe regulations of the competition. The main design properties of interest from the 49er© are:
• Maximum beam far aft
• Flat bottom in the aft
• Sharp bilge above the waterline
• Slender and v-shaped bow
The design objective of the 49er© was to make a dinghy of less than 5 m that performs wellwith no "hump" in the drag/speed curve. This means that there should not be a peak in theresistance during the transition between the displacement mode and the planing mode. Sincea planing hull was desired, the focus for inspiration was on ’light dinghies’ only. The maininspiration for the 49er© was the 18-footer which at that point of time was a modern recentlydeveloped dinghy (Bethwaite, 2010). The 49er© is still today one of the highest performingskiffs in its class and is consequently chosen as the main reference hull.
Figure 3.4: Model of a 49er©, (Wikipedia, 2010)
3.2.1.2 Transonic Hull ©
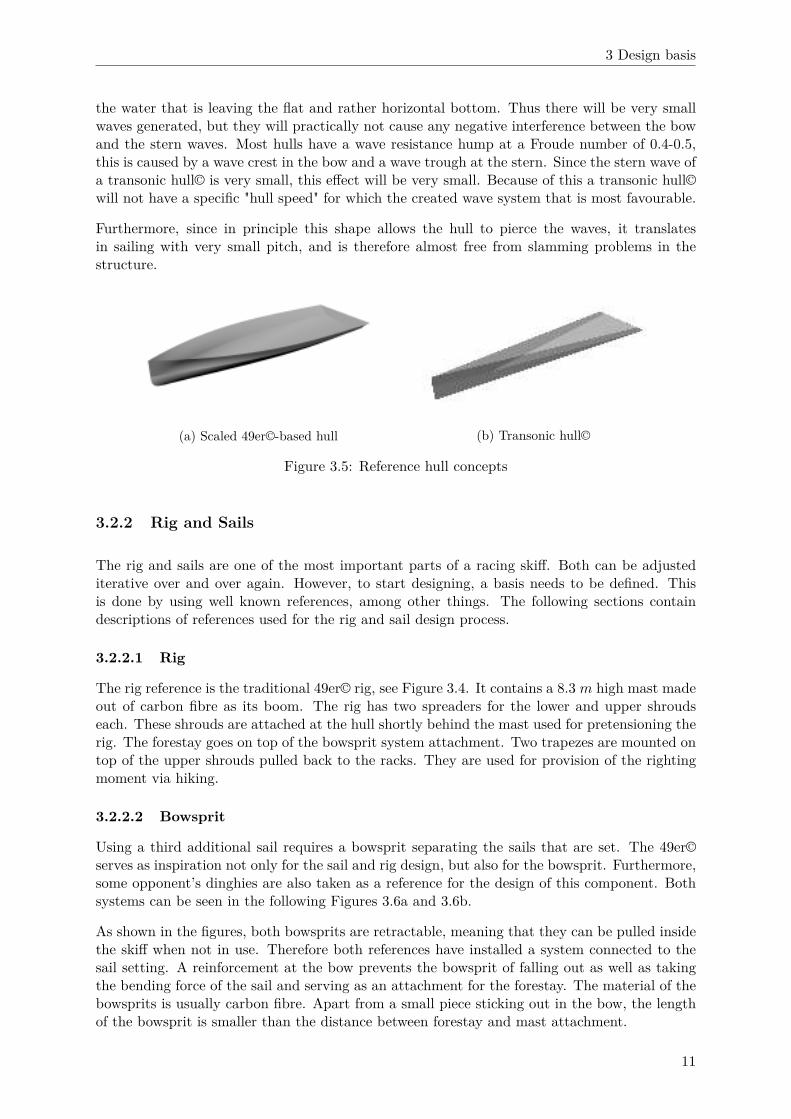
The second reference hull that is used is the so-called ’transonic hull’©, see Figure 3.5b (Calderon& Maskew, 2015). The hull has a double wedge shape with a vertical stem, entirely flat bottomfrom the deepest point at the stem to the widest point at the stern, which has zero submergenceand the sides are vertical. The submerged part of the hull, thus, forms a tetrahedron). Thebasic idea of a transonic hull© is that it has a low wave generation when compared to the moreregularly shaped hulls. Since the bow is very sharp, the bow wave will in principle be verysmall, and with no curvature along the hull there will be no pressure peaks and therefore nowaves generated along the hull. However, at the stern there is a very small pressure rise due to
10
3 Design basis
the water that is leaving the flat and rather horizontal bottom. Thus there will be very smallwaves generated, but they will practically not cause any negative interference between the bowand the stern waves. Most hulls have a wave resistance hump at a Froude number of 0.4-0.5,this is caused by a wave crest in the bow and a wave trough at the stern. Since the stern wave ofa transonic hull© is very small, this effect will be very small. Because of this a transonic hull©will not have a specific "hull speed" for which the created wave system that is most favourable.
Furthermore, since in principle this shape allows the hull to pierce the waves, it translatesin sailing with very small pitch, and is therefore almost free from slamming problems in thestructure.
(a) Scaled 49er©-based hull (b) Transonic hull©
Figure 3.5: Reference hull concepts
3.2.2 Rig and Sails
The rig and sails are one of the most important parts of a racing skiff. Both can be adjustediterative over and over again. However, to start designing, a basis needs to be defined. Thisis done by using well known references, among other things. The following sections containdescriptions of references used for the rig and sail design process.
3.2.2.1 Rig
The rig reference is the traditional 49er© rig, see Figure 3.4. It contains a 8.3 m high mast madeout of carbon fibre as its boom. The rig has two spreaders for the lower and upper shroudseach. These shrouds are attached at the hull shortly behind the mast used for pretensioning therig. The forestay goes on top of the bowsprit system attachment. Two trapezes are mounted ontop of the upper shrouds pulled back to the racks. They are used for provision of the rightingmoment via hiking.
3.2.2.2 Bowsprit
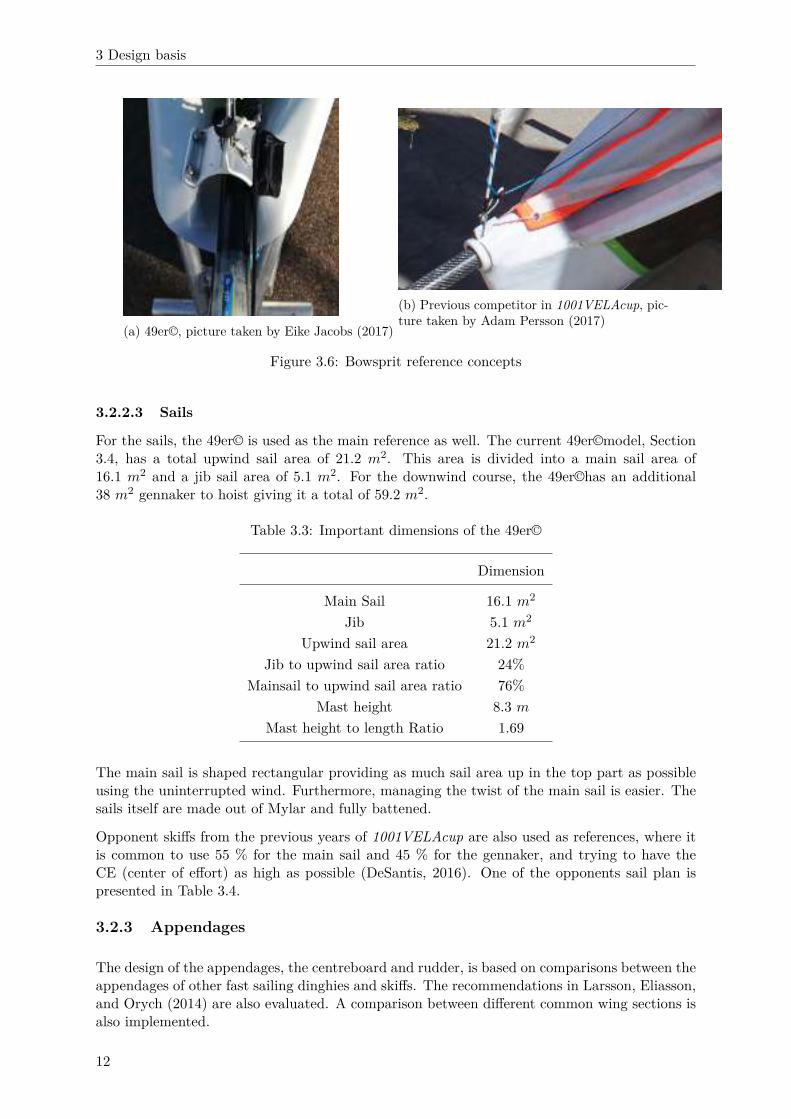
Using a third additional sail requires a bowsprit separating the sails that are set. The 49er©serves as inspiration not only for the sail and rig design, but also for the bowsprit. Furthermore,some opponent’s dinghies are also taken as a reference for the design of this component. Bothsystems can be seen in the following Figures 3.6a and 3.6b.
As shown in the figures, both bowsprits are retractable, meaning that they can be pulled insidethe skiff when not in use. Therefore both references have installed a system connected to thesail setting. A reinforcement at the bow prevents the bowsprit of falling out as well as takingthe bending force of the sail and serving as an attachment for the forestay. The material of thebowsprits is usually carbon fibre. Apart from a small piece sticking out in the bow, the lengthof the bowsprit is smaller than the distance between forestay and mast attachment.
11
3 Design basis
(a) 49er©, picture taken by Eike Jacobs (2017)
(b) Previous competitor in 1001VELAcup, pic-ture taken by Adam Persson (2017)
Figure 3.6: Bowsprit reference concepts
3.2.2.3 Sails
For the sails, the 49er© is used as the main reference as well. The current 49er©model, Section3.4, has a total upwind sail area of 21.2 m2. This area is divided into a main sail area of16.1 m2 and a jib sail area of 5.1 m2. For the downwind course, the 49er©has an additional38 m2 gennaker to hoist giving it a total of 59.2 m2.
Table 3.3: Important dimensions of the 49er©
Dimension
Main Sail 16.1 m2
Jib 5.1 m2
Upwind sail area 21.2 m2
Jib to upwind sail area ratio 24%
Mainsail to upwind sail area ratio 76%
Mast height 8.3 m
Mast height to length Ratio 1.69
The main sail is shaped rectangular providing as much sail area up in the top part as possibleusing the uninterrupted wind. Furthermore, managing the twist of the main sail is easier. Thesails itself are made out of Mylar and fully battened.
Opponent skiffs from the previous years of 1001VELAcup are also used as references, where itis common to use 55 % for the main sail and 45 % for the gennaker, and trying to have theCE (center of effort) as high as possible (DeSantis, 2016). One of the opponents sail plan ispresented in Table 3.4.
3.2.3 Appendages
The design of the appendages, the centreboard and rudder, is based on comparisons between theappendages of other fast sailing dinghies and skiffs. The recommendations in Larsson, Eliasson,and Orych (2014) are also evaluated. A comparison between different common wing sections isalso implemented.
12
3 Design basis
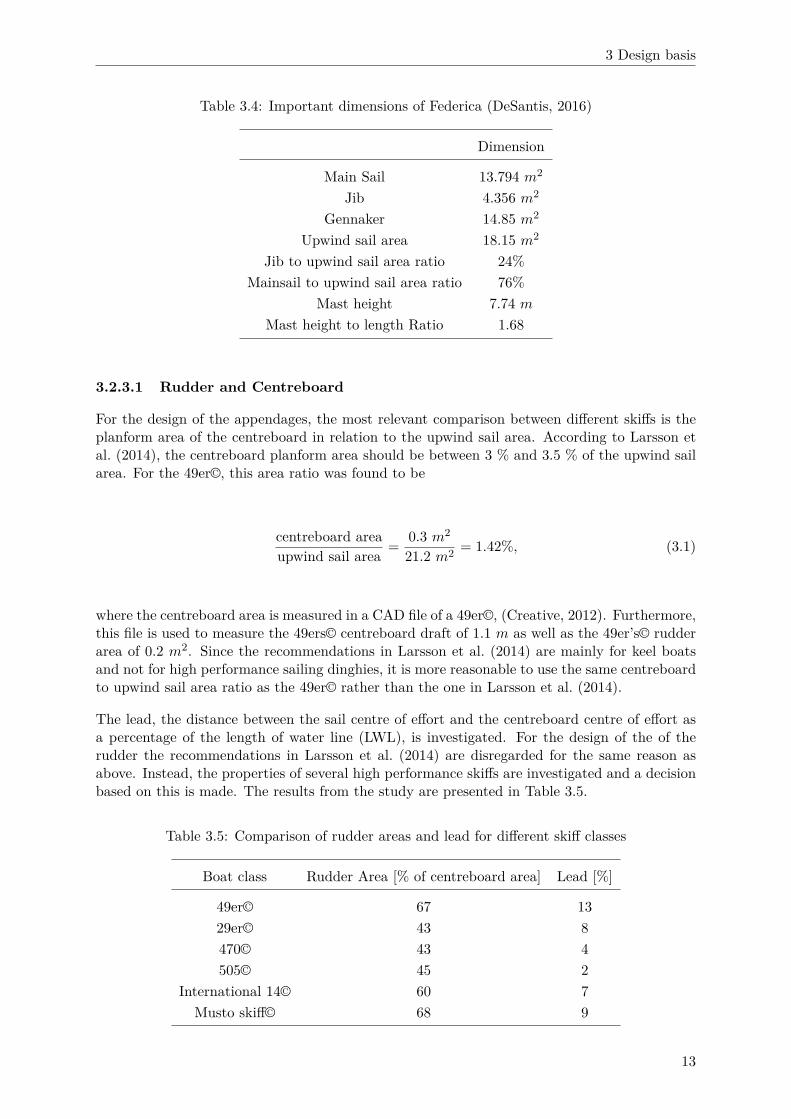
Table 3.4: Important dimensions of Federica (DeSantis, 2016)
Dimension
Main Sail 13.794 m2
Jib 4.356 m2
Gennaker 14.85 m2
Upwind sail area 18.15 m2
Jib to upwind sail area ratio 24%
Mainsail to upwind sail area ratio 76%
Mast height 7.74 m
Mast height to length Ratio 1.68
3.2.3.1 Rudder and Centreboard
For the design of the appendages, the most relevant comparison between different skiffs is theplanform area of the centreboard in relation to the upwind sail area. According to Larsson etal. (2014), the centreboard planform area should be between 3 % and 3.5 % of the upwind sailarea. For the 49er©, this area ratio was found to be
centreboard area
upwind sail area=
0.3 m2
21.2 m2= 1.42%, (3.1)
where the centreboard area is measured in a CAD file of a 49er©, (Creative, 2012). Furthermore,this file is used to measure the 49ers© centreboard draft of 1.1 m as well as the 49er’s© rudderarea of 0.2 m2. Since the recommendations in Larsson et al. (2014) are mainly for keel boatsand not for high performance sailing dinghies, it is more reasonable to use the same centreboardto upwind sail area ratio as the 49er© rather than the one in Larsson et al. (2014).
The lead, the distance between the sail centre of effort and the centreboard centre of effort asa percentage of the length of water line (LWL), is investigated. For the design of the of therudder the recommendations in Larsson et al. (2014) are disregarded for the same reason asabove. Instead, the properties of several high performance skiffs are investigated and a decisionbased on this is made. The results from the study are presented in Table 3.5.
Table 3.5: Comparison of rudder areas and lead for different skiff classes
Boat class Rudder Area [% of centreboard area] Lead [%]
49er© 67 13
29er© 43 8
470© 43 4
505© 45 2
International 14© 60 7
Musto skiff© 68 9
13

3 Design basis
3.2.4 Racks
To maximise the righting moment created by the sailors, in order to carry as much sail aspossible during the races, it is preferred to have the centre of gravity (CoG) as far out from thecentre line as possible. Since it is preferable to have a slender hull, it will most likely not be themaximum allowed width, so the racks will be used to move the sailors centre of gravity as farout as possible.
To have some background of how the racks should look like inspiration is taken from the 49er©,since it is the main reference skiff. The racks on the 49er© are built like wings, which meansthat the space between the hull and the outer part of the racks is covered with material, seeFigure 3.7a. Another dinghy that is used as inspiration is the International 14 footer. It hasracks made out of tubes of carbon fibre which makes them light and moves the centre of gravityfar out from the centre line. Finally inspiration is taken from the already existing boats in the1001VELAcup. These racks are more similar to the International 14 footer, they are made outof aluminium profiles that give the racks, see Figure 3.7b.
(a) 49er©, picture taken by Kaupp (2007) (b) Previous competitor in 1001VELAcup, pic-ture taken by Persson (2017)
Figure 3.7: Racks reference concepts
3.3 Overall Design Features
The authors of the project have decided to not go for hydrofoil nor wing sail. It would havebeen a great advantage to use hydrofoil since the resistance drops to a minimum due to upliftingof the hull out of the water. Had this been the group’s choice, the hull would have been shapedbased on different criteria, such as lifting up as fast as possible. Nevertheless, the hydrofoilingoption was disregarded based on the ruling concerning the sailors, as it is very unusual tohave two sailors on a hydrofoiling skiff. It would have been difficult to find sailors who woulddo it properly and even then it would have required a disproportionate amount of practice.Consequently, this would add too much uncertainty to the results of the race, due to factorsthat are external to the design team.
Similarly, it would have been a great advantage to use a wing sail since the efficiency of such ismuch better compared to a normal sail. Yet this option was also disregarded since the studentswould have had to construct the wing sail by themselves without having the possibility topurchase it from an external company. The handling of a wing sail requires a lot of training.Therefore, more uncertainty would have been introduced due to alien factors to the design team.
14

3 Design basis
Besides the uncertainties added and the eventual absence of backup hulls during the competition,there are also severe time constraints that limit the group’s focus, not allowing for proper designof more complicated concepts. Most of all, since this is the first design for Chalmers University
of Technology, the aim is to achieve a good position in the race as a way to assure the continuityof this project in the future years.
15

3 Design basis
16
4 Theory
In this chapter, the basic theory for the methods that are used is explained in deeper detail.The sections focus on the different softwares used and the assumptions made while using them.The softwares are, Rhinoceros 3D for CAD, STAR-CCM+ for CFD, Abaqus for FEM, and aVPP-program modified specifically for this project, used for velocity prediction.
4.1 Computer-Aided Design (CAD)
The CAD-software used throughout the whole project is Rhinoceros 3D (McNeel, 2017). It isa software based on NURBS mathematical model, which is suitable for designing a boat hullsince it can create complex curves and surfaces. The following sections will explain the theorybehind the designing procedure.
4.1.1 Hull Fairing
Fairing of the hull surfaces is a very important aspect of the modelling process that has tobe regarded throughout the whole process. This is of particular importance at the bottomand freeboard. The fairing process constitutes a good practice of surface modelling, being arequirement for having high quality surfaces (Henry P. Moreton, 1992). It consists in smoothingthe mesh through a proportional grid of control points that do not cross paths between eachother, except if strictly demanded by an irregular or unusual shape. The global trend of thecontrol points’ coordinates should also match the trend of the desired surface, except whendemanded by extreme shapes, that, for example, need trimming. The goal with this is toobtain surfaces that are as smooth as possible in order to improve the results of subsequentcomputations, i.e. to have computational results that are as smooth as possible.
There are no objective criteria to measure smoothness or fairness, and furthermore, it is highlydependent on the application. Yet, a principle that should be followed in this particular ap-plication of yacht design is that the surfaces should result as simple as possible without anyunnecessary details or oscillations. This means they should have the minimum number of con-trol points that are not so restrictive as to inhibit the desired hull shape, but are just enough toachieve it. They should allow for a similarly smooth and relatively easy further manipulation.Adding to all of this, the aesthetics of the hull will also be greatly improved as a result. Duringthe design of the hull, fairness of several key lines and surfaces has always to be made. Theseare explained in the following sections.
4.1.1.1 Keel line
The keel line extends over the length of the hull, and should assume a curvature close to thatdepicted by the blue line in Figure 4.1.
As seen in the Figure 4.1, the curvature decreases to very small values near the stern. Thisis important since a more convex curvature induces a low pressure that sucks the stern down,therefore it increases resistance as the Froude number is increased.
17

4 Theory
Figure 4.1: Keel line curvature graph for final hull model
4.1.1.2 Waterline
The waterline extends for almost the full length of the boat. It should also be smooth all theway along its length, to ensure there are no bumps on the hull surface and in order to minimisethe disturbance of the flow around the boat. The curvature graph of such line shall assume aclear trend as well as absence of sign changes. Furthermore, the curvature will naturally increasevery significantly near the aft due to the geometry of the hull. This is evidenced in Figure 4.2.
Figure 4.2: Water line curvature graph for final hull model
4.1.1.3 Chine line
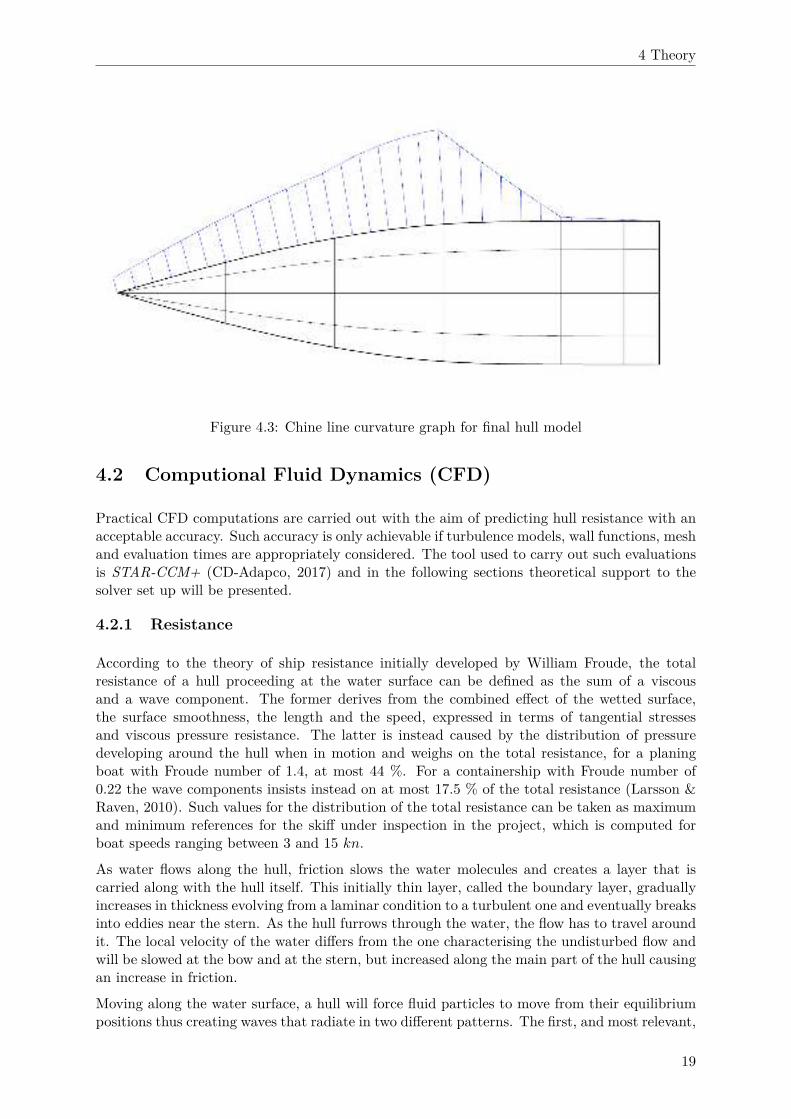
The same reasoning and principles mentioned for the keel and waterline apply for the chine lineas well. In this case, the line shall have no curvature along a certain percentage of the length,this is from where the beam becomes constant. The chine line is presented in Figure 4.3.
18
4 Theory
Figure 4.3: Chine line curvature graph for final hull model
4.2 Computional Fluid Dynamics (CFD)
Practical CFD computations are carried out with the aim of predicting hull resistance with anacceptable accuracy. Such accuracy is only achievable if turbulence models, wall functions, meshand evaluation times are appropriately considered. The tool used to carry out such evaluationsis STAR-CCM+ (CD-Adapco, 2017) and in the following sections theoretical support to thesolver set up will be presented.
4.2.1 Resistance
According to the theory of ship resistance initially developed by William Froude, the totalresistance of a hull proceeding at the water surface can be defined as the sum of a viscousand a wave component. The former derives from the combined effect of the wetted surface,the surface smoothness, the length and the speed, expressed in terms of tangential stressesand viscous pressure resistance. The latter is instead caused by the distribution of pressuredeveloping around the hull when in motion and weighs on the total resistance, for a planingboat with Froude number of 1.4, at most 44 %. For a containership with Froude number of0.22 the wave components insists instead on at most 17.5 % of the total resistance (Larsson &Raven, 2010). Such values for the distribution of the total resistance can be taken as maximumand minimum references for the skiff under inspection in the project, which is computed forboat speeds ranging between 3 and 15 kn.
As water flows along the hull, friction slows the water molecules and creates a layer that iscarried along with the hull itself. This initially thin layer, called the boundary layer, graduallyincreases in thickness evolving from a laminar condition to a turbulent one and eventually breaksinto eddies near the stern. As the hull furrows through the water, the flow has to travel aroundit. The local velocity of the water differs from the one characterising the undisturbed flow andwill be slowed at the bow and at the stern, but increased along the main part of the hull causingan increase in friction.
Moving along the water surface, a hull will force fluid particles to move from their equilibriumpositions thus creating waves that radiate in two different patterns. The first, and most relevant,
19

4 Theory
is the transverse pattern. The second pattern is the divergent waves that fans out from the hull.The resistance component generated by the energy removed from the wave system, which canbe found in the wake, is thus called wave breaking resistance. The remaining portion of waveenergy is instead radiated away from the hull and responsible for the so called wave patternresistance.
4.2.2 Governing Equations Solved
Practical CFD computations can almost always be considered satisfactory when details aboutthe time-averaged properties of the flow are obtained. At the heart of most these CFD ap-proaches is the modelling of informations and effects of the turbulent fluctuations. The treat-ment of such events can be carried out with procedures based on the Reynolds-Averaged-Navier-Stokes (RANS) equations, which represents time-averaged equations of motion for fluid flow.
Assuming that a fluid behaves as a continuum, the Navier-Stokes equations allow to describefluid flows. However, these equations are inherently unsteady and nearly impossible to solveunless multiple average solutions, solved numerically through discretization in space and possiblytime, at a series of time steps are used. As stated in Versteeg and Malalasekera (2007), thedecomposition of the Navier-Stokes equations, bringing to the definition of the RANS, is basedon the assumption that, introducing a set of unknowns called Reynolds Stresses, the time-dependent turbulent velocity fluctuations can be separated from the mean flow velocity. Suchunknowns are then functions of the velocity fluctuations and require the implementation of aturbulence model to solve them.
Unsteady RANS for transient flow is a straightforward variant of the RANS in which, while stillsolving for the mean velocity separately from the turbulent velocity, a transient term is presentin the momentum equation and retained during computation. This means that turbulence timescales are removed from the Navier-Stokes equations through the averaging procedure, whilelarger time scales are resolved. The development of unsteady RANS methods within the shiphydrodynamics evaluations unlocks extensions to applications for seakeeping and manoeuvring,as presented in (Wilson, Carrica, & Stern, 2006) in addition to the already covered resistanceand propulsion evaluations. Nevertheless, the effects of turbulence on the mean flow have to bedescribed, since the time-averaging operation on the momentum equations discard all the detailconnected to the state of the flow in the instantaneous fluctuations.
CFD breaks a fluid domain into discrete cells to then solve in each one of them the conservationlaws. The accuracy of these simulations are strictly bonded to the grid generated.
4.2.3 Turbulence Model
Throughout the project both a normal k − ω turbulence model and the Shear Stress TransportSST-Menter expansion are considered in place of the more commonly used k − ǫ because of thehigh interest in the evaluation of close to wall features.
There are multiple reasons supporting such choice. According to (Versteeg & Malalasekera,2007) the most important however can be found in the improved behaviour of k−ω when dealingwith wall effects, unconfined flows and curved boundary layers. The further implementationof SST-Menter model allows to take into account properly the behaviour of the free-stream,quality of the k − ǫ model, without falling into errors dictated by sensitivity as it would happento a normal k − ω. Therefore, the turbulence model chosen for the calculations is capable ofpredicting, in a numerically stable way, both the near-wall and the far field behaviours of theflow.
Another reason that guides the choice of the model is the under-prediction of separation provided
20
4 Theory
by k − ǫ, leading towards an overly optimistic, and therefore, non-conservative performanceprediction. On the other hand, SST-Menter results should provide higher accuracy when dealingwith onset and amount of flow separation under adverse pressure gradients and thus moreaccurate in such prediction.
It should also be noted the fact that such turbulence model fails to take into account more subtleinteractions between mean flow and turbulent stresses when compared to the Reynolds StressModel (RSM) model. Versteeg and Malalasekera (2007) state in fact that two-equation turbu-lence models are incapable of capturing the more subtle contributions introduced by anisotropyof the normal stresses, as well as correctly predicting the effects on turbulence caused by bodyforces and extra strains. The RSM is able to exactly incorporate such features, but the re-quirement for several unknown turbulence processes to be modelled, together with a significantincrease in computational time and storage need, discourage its implementation.
4.2.4 Numerical Solution
The first step to process a CFD problem is the definition of the region of interest. Evaluation ofencountered resistance of a skiff has to deal with both air and water, therefore the modelling ofan eulerian multiphase computational domain is needed. Furthermore, as there is a change inphysical properties, problems may derive along the interface between the two fluids considered.Subsequent mesh refinements are therefore needed in such region.
4.2.4.1 Computational Domain
The problem requires the definition of a multiphase computational domain where air and waterare considered as the fluids interfacing. Specific dimensions and boundary conditions of thedomain are needed in order to capture with satisfying accuracy the computations results. Onlyhalf of the domain is modelled since symmetry properties of the problem allow to do so and thecomputational time will decrease considerably. It has to be noted that all the results obtainedwill refer to half of the hull, hence half of the total resistance if not otherwise stated. Thecomputational domain, presented in Figure 4.4, can then be defined as a rectangular box andboundary conditions defined according to Table 4.1. The symmetry surface ABCD reflects thesymmetry of the problem, as water and air are considered to flow parallel to this boundary, withno particle crossing through it. The two opposite surfaces ADHE and BCGF are respectivelygiven inlet and outlet boundary conditions; the outflow surface has to be placed sufficientlydownstream such that vortices are not yet present in the stream. The three remaining surfacesare instead given wall boundary conditions.
The hull boundary is modelled by a wall law. To implement such condition, the skiff is positionedin the domain with the centreline on the mirror plane with the bow facing the inflow boundary.At least one ship-length L = 4.6 m has to be left clear between the bow and the inflow boundary.The hull body is then subtracted from the domain itself and wall boundaries are defined at theportion left empty as there is no velocity passing through these sides. The flow encountering awall will then have to travel around it, generating pressure distribution and a boundary layerdevelopment that are the heart of the numerical computations. Finally, no boundary conditionsare applied to the free surface.
21

4 Theory
Figure 4.4: Computational domain setup
Table 4.1: Computational domain boundaries
Surface Corners Boundary
Top CDHG Wall
Bottom ABFE Wall
Side EFGH Wall
Symmetry ABCD Mirror
Inflow ADHE Inlet
Outflow BCGF Outlet
4.2.4.2 Turbulent Boundary Layer
According to Larsson and Raven (2010), a validated assumption is that the velocity profilein the inner part of a boundary layer must be independent of the thickness of the layer anddependent only on the shear stress at the wall, and the fluid density and dynamic viscosity.Reasoning in terms of dimensions, such non-dimensional distance from the wall may be writtenaccording to Equation (4.1).
y+ =U∗y
ν(4.1)
where y represents the distance to the nearest wall, ν the local kinematic viscosity of the fluidand U∗, defined according to Equation (4.2), and being τwall the wall shear stresses and ρ thedensity of the fluid, represents the friction velocity at the nearest wall
U∗ =
√τwall
ρ(4.2)
y+ is thus used to define the proper size of a mesh for a specific flow pattern. The importanceof this element concerns wall functions and the definition of the velocity profile, divided in four
22

4 Theory
different regions according to the value of y+: viscous sublayer, buffer layer, logarithmic regionand wake region.
The first cell spacing, ∆S, on a flat-plate boundary is evaluated via the resolution of the followingalgebraic system:
Rex =ρU∞x
µ(4.3)
Cf =0.026
Re1/7x
(4.4)
τwall =Cf ρU2
∞
2(4.5)
U∗ =
√τwall
ρ(4.6)
∆S =y+µ
U∗ρ(4.7)
where Rex represents the Reynolds number at distance x from the stagnation point, U∞ thefreestream velocity and Cf skin friction coefficient.
Finally, knowing the Reynolds number, it is then possible to evaluate half of the total thicknessof the boundary layer, of the total thickness of the prism layer for the entire length of the hull,according to the Equation (4.8). Such choice can be considered on the safe side an provideresults accurate enough since the velocity gradient in the outer part of the boundary layer isvery small.
t =0.185L
Re1/5(4.8)
4.2.4.3 Volume of Fluid (VOF) Method
The Volume of Fluid (VOF) method belongs to the class of eulerian modelling techniquescharacterised by the mesh, either stationary or moving in a prescribed manner, in order toaccomodate the evolving shape of the small contact area between two fluids. It is a simplesolver that allows for tracking the free surface using a volume fraction function for each fluidto describe the location of the interface. Such fraction function is tracked for each cell of thedomain grid and assumes value 1 when the considered cell is full of water, zero when filledwith air. However, with this method the free surface is not sharply defined and a distributionover the height of several cells is instead generated. Hence, in order to achieve accurate enoughresults, local mesh refinements are needed.
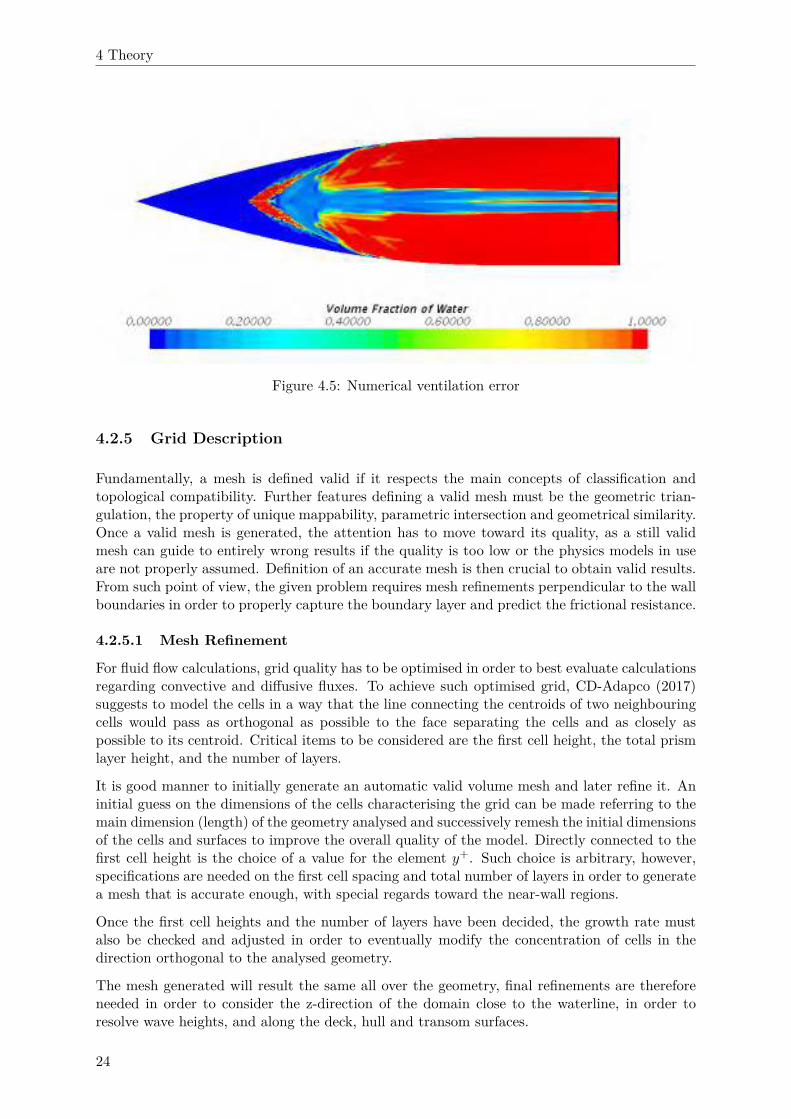
4.2.4.4 Numerical Ventilation
An error that can occur in the cases where the flow is not properly resolved is numericalventilation. Such a computational error is encountered when two fluids are considered interfacingin the domain and particles of one of them are considered trapped into the boundary layer andtransported into the domain of the second fluid. Hence, the net physical transition betweenthe two fluids is erroneously approximated as a gradual diffusion. An example of numericalventilation error can be appreciated in Figure 4.5. The hull presented was tested at a speedof 15 kn and it can be seen how a wide portion of the submerged hull is covered by air (blueportion) instead of water and only after a gradual transition does it reach the wet condition.If not corrected, such error will affect the computations and provide a wrongly estimated lowerresistance.
23
4 Theory
Figure 4.5: Numerical ventilation error
4.2.5 Grid Description
Fundamentally, a mesh is defined valid if it respects the main concepts of classification andtopological compatibility. Further features defining a valid mesh must be the geometric trian-gulation, the property of unique mappability, parametric intersection and geometrical similarity.Once a valid mesh is generated, the attention has to move toward its quality, as a still validmesh can guide to entirely wrong results if the quality is too low or the physics models in useare not properly assumed. Definition of an accurate mesh is then crucial to obtain valid results.From such point of view, the given problem requires mesh refinements perpendicular to the wallboundaries in order to properly capture the boundary layer and predict the frictional resistance.
4.2.5.1 Mesh Refinement
For fluid flow calculations, grid quality has to be optimised in order to best evaluate calculationsregarding convective and diffusive fluxes. To achieve such optimised grid, CD-Adapco (2017)suggests to model the cells in a way that the line connecting the centroids of two neighbouringcells would pass as orthogonal as possible to the face separating the cells and as closely aspossible to its centroid. Critical items to be considered are the first cell height, the total prismlayer height, and the number of layers.
It is good manner to initially generate an automatic valid volume mesh and later refine it. Aninitial guess on the dimensions of the cells characterising the grid can be made referring to themain dimension (length) of the geometry analysed and successively remesh the initial dimensionsof the cells and surfaces to improve the overall quality of the model. Directly connected to thefirst cell height is the choice of a value for the element y+. Such choice is arbitrary, however,specifications are needed on the first cell spacing and total number of layers in order to generatea mesh that is accurate enough, with special regards toward the near-wall regions.
Once the first cell heights and the number of layers have been decided, the growth rate mustalso be checked and adjusted in order to eventually modify the concentration of cells in thedirection orthogonal to the analysed geometry.
The mesh generated will result the same all over the geometry, final refinements are thereforeneeded in order to consider the z-direction of the domain close to the waterline, in order toresolve wave heights, and along the deck, hull and transom surfaces.
24

4 Theory
Unfortunately no universal rule exists when it comes to determining whether the total numberof cells forming a mesh is good enough. As mentioned earlier in this section, rule of thumbs canbe followed considering the characteristic dimension of the geometry analysed and derive fromit the dimensions for the first cell’s height. An other validation can be found when comparingthe generated mesh with one created for similar purposes and geometries
4.2.6 Aerodynamic Resistance
The computational domain in which the skiff is analyzed presents two different phases. It istherefore necessary for completeness of investigation to evaluate the influence of different deckshapes on the total resistance encountered by the skiff when sailing. In these evaluations, theheight of the freeboard and the geometry of the transom play major roles. Due to time limita-tions such properties have not been properly analyzed with iterative investigations. Bethwaite(2008) Higher Performance Sailing is instead taken as reference when shaping the transom.According to Bethwaite,
"when wind flows away from a surface such as a vertical transom, the effect is like a filter
pump; the core of dead air behind the transom is dragged downwind by the viscous drag of
the surrounding moving air, the pressure decreases, and the pressure difference between the
undiminished pressure on the windward face and the reduced pressure on the leeward face shows
up as drag" (Bethwaite, 2008).
An inward sloped transom would therefore allow air to smoothly reach the water level withoutgenerating sudden pressure differences. Additionally, the hull is shaped as a solid brick, hencewith no open top, such that the wind will only hit the windward end and sides of the brick andgently tug the leeward faces backwards.
4.2.7 CFD Analysis Setup
Figure 4.4 shows a representation of the defined computational domain.
The turbulence model is chosen to be a k − ω model with SST implementation in order tobetter capture the flow behaviour both near-wall both in free-stream.
It has been chosen to initially consider an automatically generated mesh and later refine it.In order to accurately capture the viscous boundary layer a Prismatic Cell Mesher has beenchosen together with a Trimmed Mesher, which provides a robust method of producing a high-quality grid, with a Medium Growth Rate, shown in Figure 4.6. All the size types have beenset to the value absolute in order to be able to iteratively modify each one independently of thecharacteristic dimension of the geometry. Starting cell sizes have however been chosen to beequal to 500 times smaller compared to the length of the hull. An initial value of 10 was chosenfor the Number of Layers. The first iterations however, showed that increasing such value to 14provided a better quality of the grid without compromising the computational time.
Figure 4.6: Volume mesh growth
25
4 Theory
The interface between the two fluids is the most sensitive portion of the domain and easiest tolead to numerical errors if not properly defined. A mesh refinement in such region is thereforeneeded and defined between 15 cm above and 10 cm below the waterline
During the process, a value of y+ = 30 is assumed. This value expresses the transition betweenthe buffer layer, where neither the linear law nor the log law are valid, and the logarithmicregion. The choice for a high y+ wall treatment determines a logarithmic law for the near-wallboundary layer and therefore a more accurate prediction of the behaviour of the flow in suchregion. As a direct consequence, the chosen value eliminates numerical ventilation errors up tospeeds of 12 kn, while for higher speed the errors are considerably reduced but not completelyerased.
The first cell height, together with the total thickness of the boundary layer and therefore thetotal number of cells generated, result different for each simulation. It is intuitive to under-stand that, since cell height and total thickness of the prism layer depend on the flow velocityand Reynolds number, their values will result different each time the ship speed is modified.Reference values for these elements are presented in Table 4.2 while details of the grids at thefront and aft section can be appreciated in Figures 4.7a to 4.8b.
Table 4.2: Mesh properties vs ship speed
Speed [kn] First cell height [m] Total thickness prism layer [m] Number of cells
3 0.0006 0.038 4701421
5 0.00038 0.033 4704362
6 0.0003 0.033 4707762
7 0.00028 0.031 4734721
9 0.00022 0.031 4714780
12 0.00015 0.028 4670987
15 0.0001 0.027 4572475
Finally, an implicit unsteady solver is chosen with a time step of 0.01 seconds over a total timespan of 10 seconds. The solver is needed in order to assure the convergence of the computations.It has been noticed that for the chosen time span the solutions can be assumed stable, oscillatingaround a constant mean value with relatively small range. Therefore a longer evaluation time,as was initially set, resulted not needed; moreover the computational time deriving from thatwould drastically increase.
26
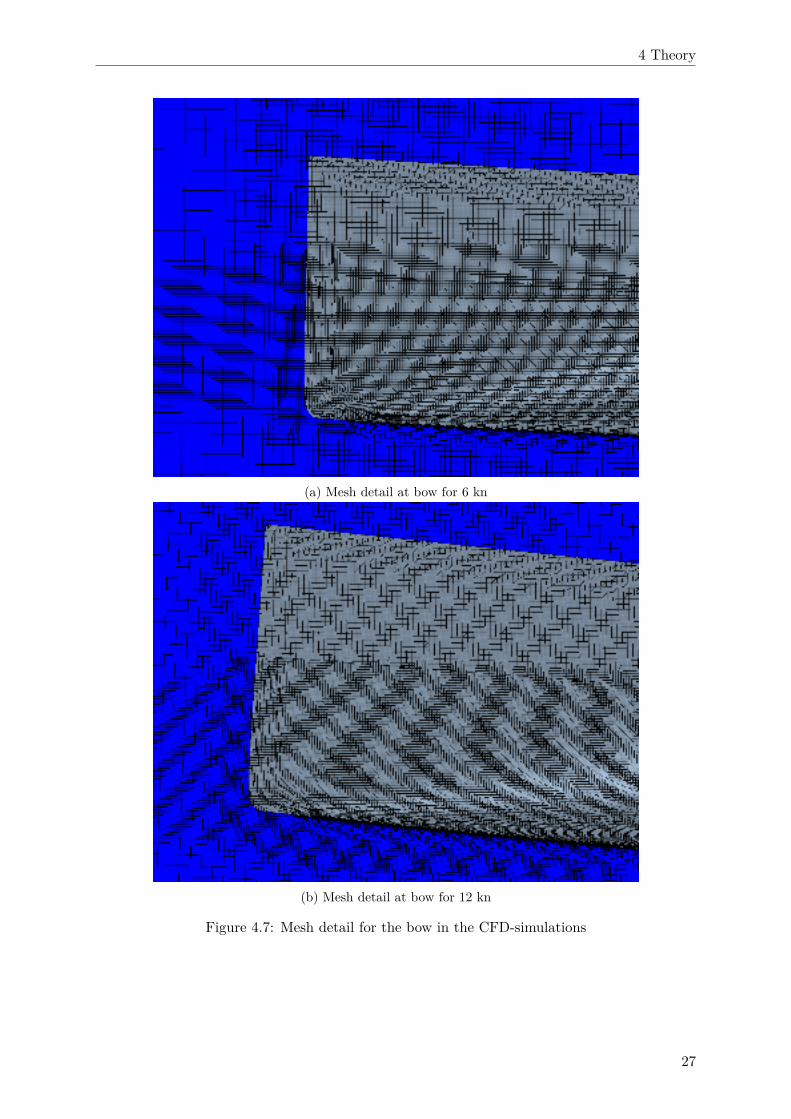
4 Theory
(a) Mesh detail at bow for 6 kn
(b) Mesh detail at bow for 12 kn
Figure 4.7: Mesh detail for the bow in the CFD-simulations
27
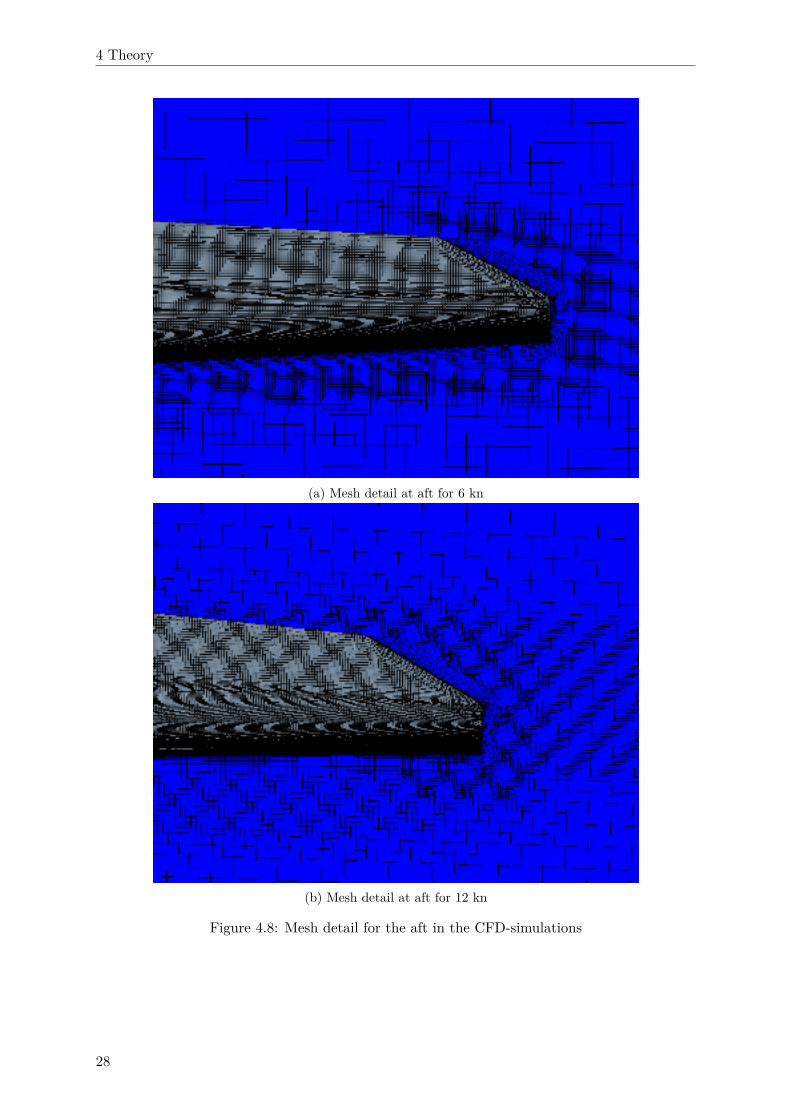
4 Theory
(a) Mesh detail at aft for 6 kn
(b) Mesh detail at aft for 12 kn
Figure 4.8: Mesh detail for the aft in the CFD-simulations
28
4 Theory
4.3 Finite Element Method (FEM)
The structural work within the project has a wide scope. It concerns the choice of constructionmaterials, finite element analysis, structural stiffening, construction method and more. Theprocess of reaching a final result is tedious, and depends on many variables. The followingsections describe the process of the structural work from the beginning to the current state.
4.3.1 Prestudy
Initially, a prestudy was performed. The study was divided into three parts where every partwas needed to produce a final hull. Firstly, material options for the hull structure was studiedwith the aim of finding suitable materials for the hull plating, hull stiffening structure and deck.Secondly, studies were performed with the intent of finding a suitable methodology to assessthe loads acting on the hull structure. These loads include the loads from the rig as well ashydrodynamic loads acting on the hull. Lastly, studies on methodologies to assess the materialand load interaction in the hull structure using FEM-software were conducted.
4.3.2 Hull Components
In the prestudy, the hull structure was divided into three components: hull plating, internalstiffening structure and deck plating. The reason for the division is to identify specific character-istics for each component and thereby be able to adapt the material choice and design for eachcomponent according to their characteristics, while still considering how the components willinteract with each other and how the material will affect this interaction. The material choiceand the design of all hull components is significantly limited in the 1001VELAcup regulationsthat states: "the hull and racks should be made of wood or materials of vegetable and/or animalorigin, expressed in weight, not lower than 70 %". This rule and its effects on the design andconstruction process will be covered in more detail further on in the report.
4.3.2.1 Hull Plating
The hull plating is the main structural component of the skiff. It makes up the closed volumethat provides buoyancy, as well as the main contribution of stiffness to the hull girder. This istrue especially in locations where the curvature of the hull is high such as the bow. The stiffnessof the hull girder is further increased by adding an internal stiffening structure. Commonpractice when designing a lightweight hull structure for small sailing craft is to construct thehull plating using sandwich laminates.
4.3.2.2 Internal Stiffening Structure
The internal structures of the hull, consisting of transverse bulkheads and longitudinal stringers,contributes to the overall hull stiffness. The bulkheads and stringers are also the componentsthat transfer the local loads from rigging and mast through the chain plates and mast foot tothe hull. Using a sandwich structure similar to the one used in the hull plating is possible,though another option to consider is to make use of ordinary marine plywood for the stiffeningstructures. A complete FE-analysis comparing weight and strength of both options must beperformed to make a conclusive decision, although this is not part of the project scope.
4.3.2.3 Deck
The deck serves as the closing surface of the top part of the hull as well as contributing to overallhull stiffness. It is also the part of the boat where components such as deck hardware, mast,forestay, shrouds and mainsheet are attached to the hull. The material in the deck will therefore
29
4 Theory
have to be able to withstand large local point loads at the attachment points of rigging elements,as well as the weight of the sailors during operation and the global bending moment. Makinguse of the sandwich structure in the deck to achieve low weight and high bending stiffness isdesired. However to deal with the local point loads from the rigging, a sandwich structure inthe deck would possibly require reinforcement of the core in these areas, to be able to handlethe out of plane loading. FE-analysis is required to determine the design and location of thesereinforcements.
4.3.3 Centreboard and Rudder
The appendages, centreboard and rudder, are structurally designed with the same design phi-losophy as the hull, which is to create a strong but light structure. The difference is that thereare no restrictions in construction materials for the centreboard and rudder, as opposed to thehull’s limit of 70 % organic origin. This rule opens up new alternatives regarding the choiceof material. Since the structures of the appendages are supposed to be light and strong, asandwich structure may be favourable in this case as well. A material stronger than flax, suchas a composite laminate made from carbon or glass fibre, will most likely be used to achieve alow weight and withstand the relatively high local loads.
The rudder is mainly affected by the hydrodynamic forces when travelling through the water,whereas the centreboard needs to be dimensioned for the worst load case which is when thecrew is standing on the centreboard tip in order to tilt the skiff upright after it has capsized.This load case will naturally cause a large bending moment at the base of the centreboard.
4.3.4 The Sandwich Structure
Early in the project, it was apparent that the final choice of construction material would standbetween marine plywood in a cold moulded configuration, and a sandwich structure usingorganic constituents. Using plywood has the benefit of low cost and relatively easy buildingprocess with a rigid cross-section suitable for attaching hardware relatively easy. It will howevermake the hull heavier than necessary. A sandwich laminate using a lightweight core on the otherhand has the benefit of low total weight together with high flexibility regarding the hull shape.The main reason for using a sandwich laminate is the ability to adapt the laminate layupaccording to the stresses in a specific load case, as opposed to using an isotropic material forexample.
Based on these arguments, as well as the information found in the prestudy, it is concluded thata sandwich structure would be the most beneficial, and also the most interesting to build. Inthis section the procedure of choosing material for the core and the skins of the sandwich willbe described. The sandwich material consists of a weaker core covered by stiffer outer skins onboth sides of the core. The skins act as the load carrying element for global bending and axialloads while the core is supposed to carry the major part of shearing loads as well as keeping thetwo skins separated. The distance between the skins is a key element of a sandwich structuresince the distance increases the moment of inertia and strength of the sandwich section. Theprinciple is similar to that of a common I-beam.
The benefit of the sandwich structure is, as mentioned previously, its low weight to stiffnessratio in the bending load configuration. The main drawback of the sandwich structure is itslimited ability to carry out of plane loads, especially compressive out of plane loads. Since thesandwich structure consists of different materials in the skins and core, alternatives for both ofthese had to be investigated.
30

4 Theory
Figure 4.9: Sandwich constituents
The R3 class rules limits the use of classical sandwich materials such as glass and carbon fibrefor the skins and divinycell foam or (most) honeycombs, as the material for the hull and deck.This made it necessary to look for organic materials that are also readily available for purchase.
4.3.4.1 Sandwich Core
After researching alternatives for an organic material to be used in the core of the sandwichstructure three feasible options were found. The options were the following:
• Balsa wood,
• Cork, and
• Bio-based PLA (Polylactic acid) honeycomb.
The organic honeycomb made from bio-based PLA, could be discarded after researching thepossibility of finding a supplier of this kind of material. Only one company, Econcore, thatproduces the PLA based honeycomb could be found. However upon contacting the company, itwas found that they had temporarily stopped their production but that the material could beproduced on demand. The cost of ordering this material produced on demand was consideredtoo high for this project. There would also be a risk that the sheets of honeycomb would be sostiff that they would affect the design of the hull shape. Still the PLA based honeycomb is amaterial with interesting properties that could be a viable alternative for future projects if thematerial becomes more available.
Comparing the two remaining alternatives, the balsa wood has slightly better mechanical prop-erties than the cork, especially in compression. Another important property of the core materialis its ability to absorb the epoxy used when laminating the skins of the sandwich onto the core.To keep the weight of the material as low as possible, it is desired to keep epoxy absorption inthe core to a minimum. According to (Castegnaro et al., 2017) epoxy absorption is higher forbalsa wood than for cork. However this is only true if the balsa wood is placed with the grainsperpendicular to the laminates, so called end-grain. By placing the balsa grains parallel to thelaminates of the sandwich, it is assumed that epoxy absorption can be reduced drastically, sincethe epoxy will not be applied to the end-grain surface in this configuration. Thus both lowerepoxy absorption and better mechanical performance of the balsa wood in the longitudinaldirection can be utilised.
31

4 Theory
The main drawback of placing the grains parallel to the skins of the sandwich is the loss ofability of the sandwich to carry concentrated out of plane loads, e.g. concentrated rig loads orcrew stepping on the deck. This however mainly concerns the deck structure. It was reasonedthat, if necessary, the grains could be placed perpendicular on the deck or in certain areas of thedeck and keep the grains parallel to the longship direction in the rest of the hull. This idea waslater discarded because no supplier of end grain balsa could be found in Europe. To determinewhether the grains should be placed parallel or perpendicular on the deck, further analysis ofloads and strength would be required through FE-simulations. Through this reasoning it wasdecided that the core material of the sandwich would be balsa wood. The properties of thebalsa wood used in calculations are presented in Table 4.3 (Newaz, Mayeed, & Rasul, 2016)
Table 4.3: Balsa wood properties
Elastic [MPa] EL ET EV GLT GT V GV L νLT νT V νV L
688 32.6 32.6 72.8 12.5 72.8 0.007 0.4797 0.007
Strength [MPa] SL ST SV SLT ST V SV L
Tension 10.12 0.82 0.82 1.35 0.35 1.35Compression 0.71 0.71 0.71 - - -
Density [kg/m3] 150
Where L denotes the property of the material in the fibre direction, T denotes the propertyof the material across the fibres in the transverse direction and V the property of the materialacross the fibres in the vertical direction. Combining these notations (LT, TV and VL) will givethe properties of the material in all three planes. These notations will be applied to describe theproperties of all non-isotropic materials in this project i.e flax epoxy laminate and balsa wood.For compatibility with FE-software used in this project stress is denoted by S in this project.
4.3.4.2 Sandwich Skin
When studying previous boats built with sandwich structures in the 1001VELAcup it wasfound that a common choice of material for the skins was a laminate made of flax fibre weaveand epoxy. This material seemed interesting, and some time was spent finding literature withdata and material characteristics. It was found that three main organic fibres were the flax,jute and hemp fibres, where the flax fibres seemed to have the best mechanical properties forthe current application (Castegnaro et al., 2017). In order to limit the work spent on findingalternative fibres, it was quickly decided that flax would be the fibre component of the sandwichlaminate. One major contribution to this decision was the fact that material testing of the skinlaminate would have to be made, a practical exercise that would be of interest for the wholeproject group. However, shortly after choosing material another paper written in connectionto the 1001VELAcup containing all the material data needed for FEM simulations was found(Pitarresi, Tumino, & Mancuso, 2015). This data was also given for different constructionmethods, one of which was intended to be used for the construction of the boat covered in thisreport. Therefore, the need to do material testing disappeared and the FEM simulations couldcommence immediately. In Table 4.4 the properties of a flax epoxy laminate, manufactured ina vacuum bagging process, are presented. The properties are obtained by contacting BcompLtd., the manufacturer of the flax fibre used in this project.
4.3.4.3 Sandwich Epoxy
The epoxy chosen to be used for the lamination is the FormuLITE 2501A resin, combinedwith FormuLITE 2002B hardener. According to the manufacturer, these are high-performance
32
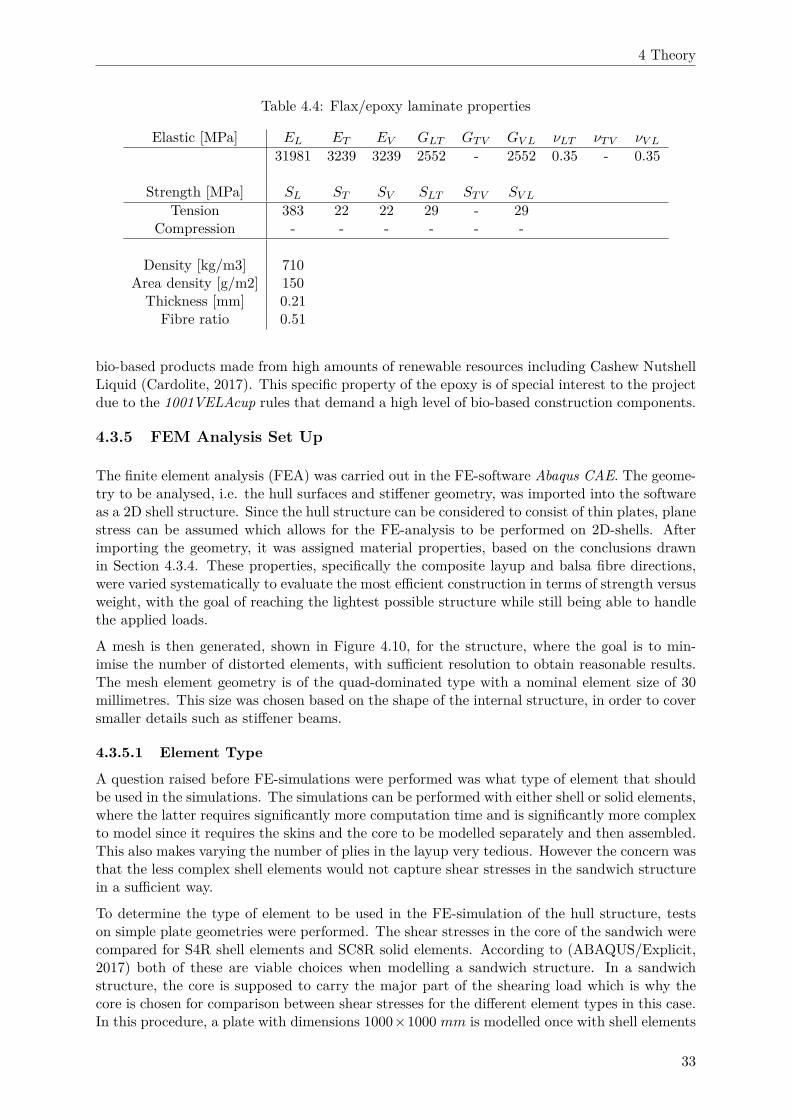
4 Theory
Table 4.4: Flax/epoxy laminate properties
Elastic [MPa] EL ET EV GLT GT V GV L νLT νT V νV L
31981 3239 3239 2552 - 2552 0.35 - 0.35
Strength [MPa] SL ST SV SLT ST V SV L
Tension 383 22 22 29 - 29Compression - - - - - -
Density [kg/m3] 710Area density [g/m2] 150
Thickness [mm] 0.21Fibre ratio 0.51
bio-based products made from high amounts of renewable resources including Cashew NutshellLiquid (Cardolite, 2017). This specific property of the epoxy is of special interest to the projectdue to the 1001VELAcup rules that demand a high level of bio-based construction components.
4.3.5 FEM Analysis Set Up
The finite element analysis (FEA) was carried out in the FE-software Abaqus CAE. The geome-try to be analysed, i.e. the hull surfaces and stiffener geometry, was imported into the softwareas a 2D shell structure. Since the hull structure can be considered to consist of thin plates, planestress can be assumed which allows for the FE-analysis to be performed on 2D-shells. Afterimporting the geometry, it was assigned material properties, based on the conclusions drawnin Section 4.3.4. These properties, specifically the composite layup and balsa fibre directions,were varied systematically to evaluate the most efficient construction in terms of strength versusweight, with the goal of reaching the lightest possible structure while still being able to handlethe applied loads.
A mesh is then generated, shown in Figure 4.10, for the structure, where the goal is to min-imise the number of distorted elements, with sufficient resolution to obtain reasonable results.The mesh element geometry is of the quad-dominated type with a nominal element size of 30millimetres. This size was chosen based on the shape of the internal structure, in order to coversmaller details such as stiffener beams.
4.3.5.1 Element Type
A question raised before FE-simulations were performed was what type of element that shouldbe used in the simulations. The simulations can be performed with either shell or solid elements,where the latter requires significantly more computation time and is significantly more complexto model since it requires the skins and the core to be modelled separately and then assembled.This also makes varying the number of plies in the layup very tedious. However the concern wasthat the less complex shell elements would not capture shear stresses in the sandwich structurein a sufficient way.
To determine the type of element to be used in the FE-simulation of the hull structure, testson simple plate geometries were performed. The shear stresses in the core of the sandwich werecompared for S4R shell elements and SC8R solid elements. According to (ABAQUS/Explicit,2017) both of these are viable choices when modelling a sandwich structure. In a sandwichstructure, the core is supposed to carry the major part of the shearing load which is why thecore is chosen for comparison between shear stresses for the different element types in this case.In this procedure, a plate with dimensions 1000×1000 mm is modelled once with shell elements
33
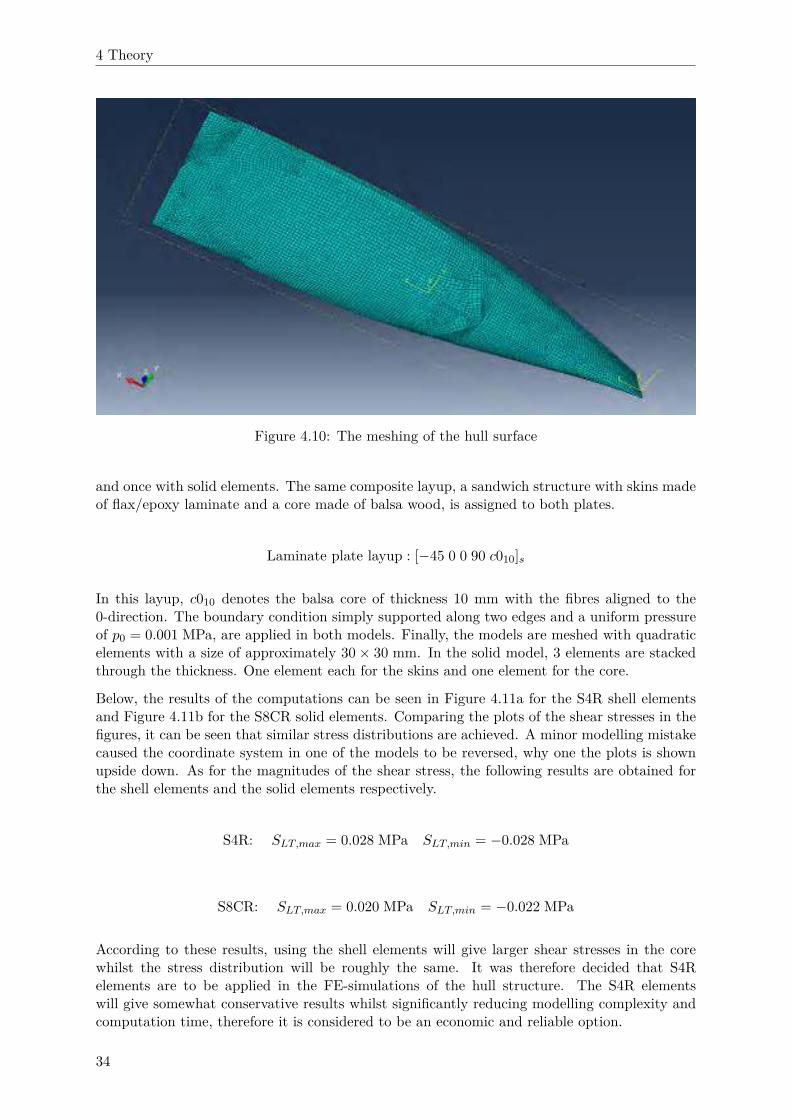
4 Theory
Figure 4.10: The meshing of the hull surface
and once with solid elements. The same composite layup, a sandwich structure with skins madeof flax/epoxy laminate and a core made of balsa wood, is assigned to both plates.
Laminate plate layup : [−45 0 0 90 c010]s
In this layup, c010 denotes the balsa core of thickness 10 mm with the fibres aligned to the0-direction. The boundary condition simply supported along two edges and a uniform pressureof p0 = 0.001 MPa, are applied in both models. Finally, the models are meshed with quadraticelements with a size of approximately 30 × 30 mm. In the solid model, 3 elements are stackedthrough the thickness. One element each for the skins and one element for the core.
Below, the results of the computations can be seen in Figure 4.11a for the S4R shell elementsand Figure 4.11b for the S8CR solid elements. Comparing the plots of the shear stresses in thefigures, it can be seen that similar stress distributions are achieved. A minor modelling mistakecaused the coordinate system in one of the models to be reversed, why one the plots is shownupside down. As for the magnitudes of the shear stress, the following results are obtained forthe shell elements and the solid elements respectively.
S4R: SLT,max = 0.028 MPa SLT,min = −0.028 MPa
S8CR: SLT,max = 0.020 MPa SLT,min = −0.022 MPa
According to these results, using the shell elements will give larger shear stresses in the corewhilst the stress distribution will be roughly the same. It was therefore decided that S4Relements are to be applied in the FE-simulations of the hull structure. The S4R elementswill give somewhat conservative results whilst significantly reducing modelling complexity andcomputation time, therefore it is considered to be an economic and reliable option.
34

4 Theory
(a) Core with S4R (b) Core with SC8R
Figure 4.11: Shear stresses in core
4.3.5.2 Load Cases
To evaluate the strength of the hull structure, one needs to know the loads acting upon it. Inthis project the loads are divided into two main groups: hydrostatic and hydrodynamic pressureacting on the hull, and forces from the rig and its attachments to the deck.
The total hydrostatic and hydrodynamic pressure load acting on the hull below the waterlineis determined from the pressure distribution obtained from the flat water CFD simulation ofthe hull at its maximum speed as predicted by VPP simulations Section 4.4. Since the pressuredistribution from the CFD simulations does not take any dynamic effects such as slamming intoaccount, the pressure calculated in the CFD simulations is multiplied with a dynamic factorcalculated from the ISO-standards for small craft design (ISO, 2015). In this case the dynamicfactor for multihull sailing craft was selected since the multihull is sailed on even keel in a similarmanner as the skiff. The dynamic factor is calculated using Equation (4.9).
kDY N =3.086L2
W L
∆0.66where 1.2 ≤ kDY N ≤ 2.4 (4.9)
With numerical values, length of waterline LW L = 4.6 m and estimated displacement of ∆ =250 kg in Equation (4.9) the dynamic factor is calculated to kDY N = 1.7. The pressure obtainedfrom flat water CFD simulations is pfw = 0.0015 MPa, which is a representative mean value ofthe pressure distribution on the hull. Equation (4.10) is used to calculate the dynamic pressureacting on the hull.
pDY N = kDY N · pfw (4.10)
The final hull pressure, including dynamic factors, is calculated to be pDY N = 0.00255 MPa.This should be interpreted as the sum of the hydrostatic and hydrodynamic pressures givenin the CFD simulations, multiplied with the dynamic coefficient kDY N . This means that thefinal result includes the hydrostatic pressure and the hydrodynamic pressure, with the dynamiccoefficient also taken into account. This pressure is applied to the entire wetted surface of thehull in the FE simulations. This can be considered as a conservative assumption since it canbe reasoned that hydrodynamic pressure from slamming and waves will not be acting on theentire wetted surface at a given instance. On the other hand, from slamming, the craft couldtake air at a wave crest, completely leaving the water surface, and thereafter land flat on thewater surface again. In that case, the hydrodynamic pressure would in fact act on the entirewetted surface. Without further investigations, it is impossible to evaluate if such an event mayor may not occur. It was therefore decided to let the hydrodynamic pressure act on the entirewetted surface and thereby, at least to some extent, design against such an event.
When performing FE-simulations, two load cases were considered. The first being the case
35
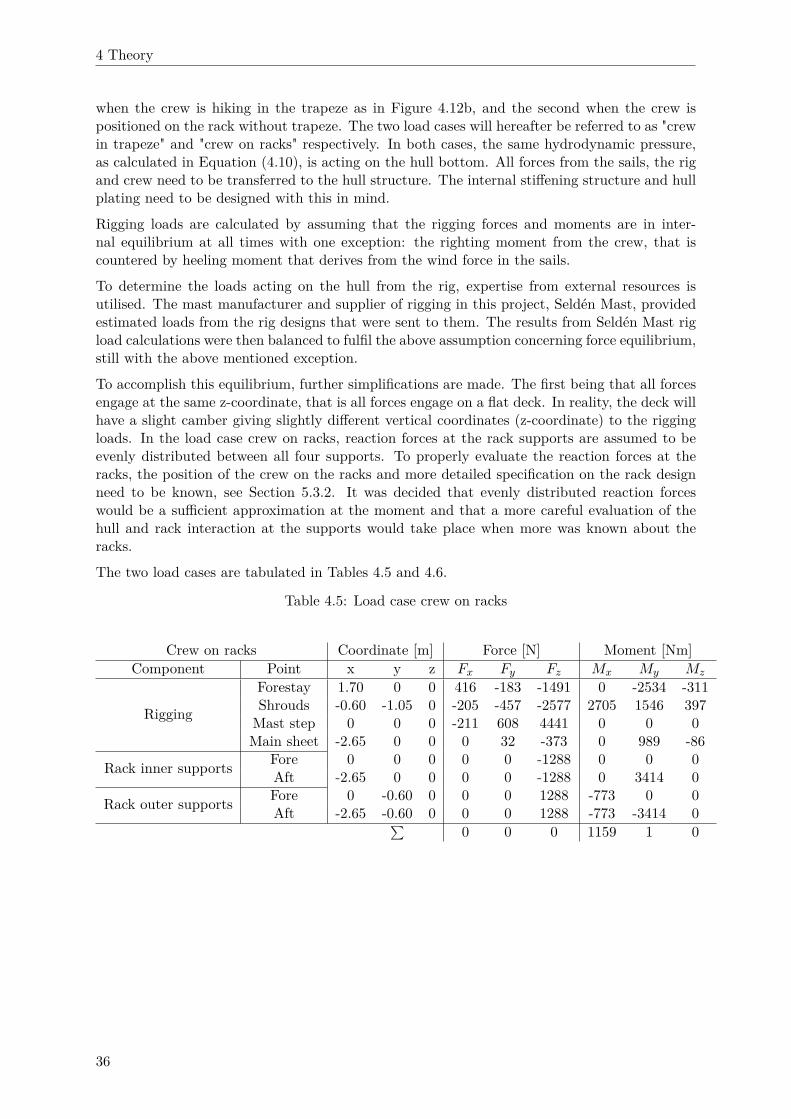
4 Theory
when the crew is hiking in the trapeze as in Figure 4.12b, and the second when the crew ispositioned on the rack without trapeze. The two load cases will hereafter be referred to as "crewin trapeze" and "crew on racks" respectively. In both cases, the same hydrodynamic pressure,as calculated in Equation (4.10), is acting on the hull bottom. All forces from the sails, the rigand crew need to be transferred to the hull structure. The internal stiffening structure and hullplating need to be designed with this in mind.
Rigging loads are calculated by assuming that the rigging forces and moments are in inter-nal equilibrium at all times with one exception: the righting moment from the crew, that iscountered by heeling moment that derives from the wind force in the sails.
To determine the loads acting on the hull from the rig, expertise from external resources isutilised. The mast manufacturer and supplier of rigging in this project, Seldén Mast, providedestimated loads from the rig designs that were sent to them. The results from Seldén Mast rigload calculations were then balanced to fulfil the above assumption concerning force equilibrium,still with the above mentioned exception.
To accomplish this equilibrium, further simplifications are made. The first being that all forcesengage at the same z-coordinate, that is all forces engage on a flat deck. In reality, the deck willhave a slight camber giving slightly different vertical coordinates (z-coordinate) to the riggingloads. In the load case crew on racks, reaction forces at the rack supports are assumed to beevenly distributed between all four supports. To properly evaluate the reaction forces at theracks, the position of the crew on the racks and more detailed specification on the rack designneed to be known, see Section 5.3.2. It was decided that evenly distributed reaction forceswould be a sufficient approximation at the moment and that a more careful evaluation of thehull and rack interaction at the supports would take place when more was known about theracks.
The two load cases are tabulated in Tables 4.5 and 4.6.
Table 4.5: Load case crew on racks
Crew on racks Coordinate [m] Force [N] Moment [Nm]
Component Point x y z Fx Fy Fz Mx My Mz
Rigging
Forestay 1.70 0 0 416 -183 -1491 0 -2534 -311Shrouds -0.60 -1.05 0 -205 -457 -2577 2705 1546 397
Mast step 0 0 0 -211 608 4441 0 0 0Main sheet -2.65 0 0 0 32 -373 0 989 -86
Rack inner supportsFore 0 0 0 0 0 -1288 0 0 0Aft -2.65 0 0 0 0 -1288 0 3414 0
Rack outer supportsFore 0 -0.60 0 0 0 1288 -773 0 0Aft -2.65 -0.60 0 0 0 1288 -773 -3414 0∑
0 0 0 1159 1 0
36

4 Theory
Table 4.6: Load case crew in trapeze
Crew in trapeze Coordinate [m] Force [N] Moment [Nm]
Component Point x y z Fx Fy Fz Mx My Mz
Rigging
Forestay 1.70 0 0 819 -229 -2794 0 -4750 -389Shrouds -0.60 -1.05 0 -10 -19 -91 96 55 22
Mast step 0 0 0 -146 455 5511 0 0 0Main sheet -2.65 0 0 -467 193 -1065 0 2823 -511
Trapeze -1.20 -2.05 0 -197 -400 -1560 3198 1872 883∑-1 0 1 3294 0 5
One should note that in the trapeze load case, see Table 4.6, the weight of the sailors is carriedby the trapeze itself which allows for the racks and the shrouds to be unloaded. This is theideal case. In reality, the racks will carry some of the crew’s weight since the crew needs totransfer some of their body weight to the racks to be able to keep their balance in the trapeze.In these calculations, this is neglected and the racks are assumed to be unloaded in the trapezeload case.
As for the crew on racks load case, see Table 4.5, the opposite is true. The trapeze is unloadedbecause the crew is disengaged from it and the racks and shrouds will have to carry the weightof the crew.
Another point to note is that, in FE-simulations and other calculations, force components of thetrapeze load in Table 4.6 is to be added to the mast step force components, since the trapeze isattached directly to the mast the load from the trapeze has to be countered by the mast step. Asan example the z-component of the mast step should be: Fz,mast step = 5511 + 1560 = 7071 N,in the FE-simulations.
The sum of moments around the x-axis,∑
Mx makes up the total righting moment, RM . FromTable 4.5 and 4.6 this is found as:
For the crew on racks load case: RMR = 1159 Nm
And for the crew in trapeze loadcase : RMT = 3294 Nm
Because the righting moment from the hull is negligible compared to the righting moment fromthe crew due to the low water plane area moment of inertia and the small heeling angles thecraft operates with, it can be approximated with Equation (4.11).
R̃M = mcy cos θ (4.11)
In Equation (4.11), mc is the mass of the crew, y is lever arm from the centre line to the centreof mass of the crew and θ is the angle from the water surface which the crew is hiking with.Setting these to mc = 150 kg, θ = 0◦ and yR = 1.05 m and yT = 2.05 m for the racks andtrapeze loadcase respectively the following is obtained with Equation (4.11).
For the crew in racks load case: R̃MR = 1562 Nm
For the crew in trapeze load case: R̃MT = 3050 Nm
It can be seen that this approximation fairs quite well with the righting moments calculated
37
4 Theory
in Table 4.5 and 4.6. This indicates that the loads in the load cases are a sufficiently accurateestimation of reality. It was decided to proceed with loads the crew in rack and crew in trapezeload cases in the FE-simulations.
4.3.5.3 Boundary Conditions
If a boundary condition is introduced at a point in an FE-model subjected to external loading,a reaction force is also introduced at that same point to fulfil Newtons 3rd law. In the case ofthe skiff in this project, introducing a boundary condition on any point, edge or surface meansthat a reaction force is also introduced at that location. This due to the fact that the loadcases calculated in Table 4.5 and 4.6 are not in equilibrium since the righting moment is notcountered by any heeling moment and the hydrostatic pressure is not countered by any reactionforce. If for example the transom was to be fixed and the trapeze load case to be appliedon the model, a reaction force and reaction moment would engage at the transom surface tocounter the righting moment and hydrostatic pressure. In reality, no reaction force or reactionmoment engages at the transom surface during operation therefore such a model would be apoor approximation. Similarly, if any other geometry in the model is fixed or simply supportedthe same argument can be reasoned. To get around this, inertia relief is introduced. Inertia reliefis used to balance external loading into equilibrium by applying rigid body accelerations to themodel (ABAQUS/Explicit, 2017). This means that righting moment and hydrostatic pressurewill be countered by rigid body accelerations instead of reaction forces and reaction moments.Inertia relief gives a better approximation than introducing ordinary boundary conditions, thusit was decided that inertia relief would be applied in the model.
4.3.5.4 Post Processing
Due to the numerous design options available, a systematic way of evaluating each optionis needed. A well designed hull structure requires sufficient strength to withstand both loadcases, sufficient stiffness to keep deflections low during operation and a low mass. Thereforekey parameters to be evaluated for each design iteration are stress magnitude and direction,deflections and the mass of the model.
In the performed FE-simulations, perfect bonding between skin/core interface and betweenthe interfaces in the skin laminate is assumed. The deflection is thereby constant throughthe thickness of the sandwich structure. In contrast to the stress, that varies with the fibredirections through the thickness of the layers (Agarwal, Broutman, & Chandrashekhara, n.d.).
Because of the previous decision to model with shell elements, out-of-plane stress cannot becaptured by the solution. This means that no method exists to evaluate failure modes suchas delamination. A way of circumventing this problem is to create local solid models in areasof the global model where large out of plane shearing is expected and from these local modelsevaluate the risk of delamination. However, even though the ambition to create such modelsexisted from the beginning of the project, the time required to finalise the global model provedthis ambition to fall short.
4.4 Velocity Prediction Program (VPP)
A Velocity Prediction Program (VPP) is used to determine the performance of sailing boats byusing the properties of hull, rig, sails, and appendages. It calculates the boat speed for differentwind speeds and heading angles by solving force and momentum equations. The VPP used inthis project, originally created by Professor Kai Graf at the University of Applied Sciences inKiel, is modified to model the skiff’s properties.
38
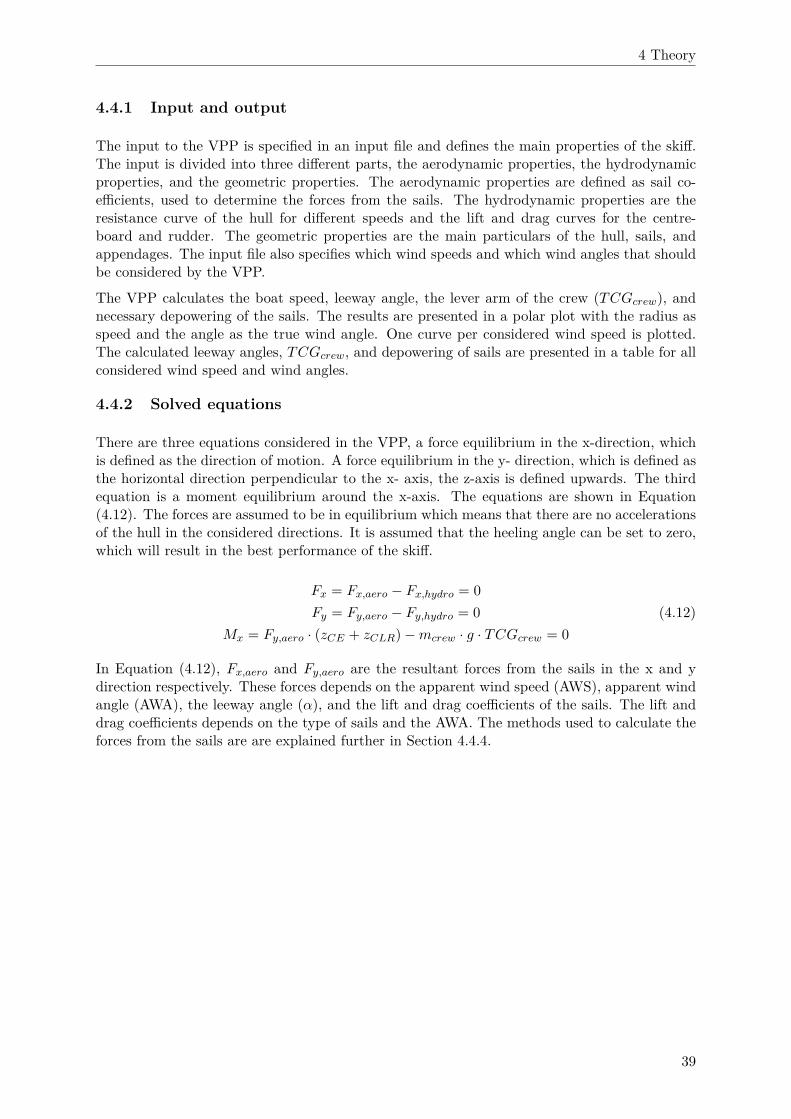
4 Theory
4.4.1 Input and output
The input to the VPP is specified in an input file and defines the main properties of the skiff.The input is divided into three different parts, the aerodynamic properties, the hydrodynamicproperties, and the geometric properties. The aerodynamic properties are defined as sail co-efficients, used to determine the forces from the sails. The hydrodynamic properties are theresistance curve of the hull for different speeds and the lift and drag curves for the centre-board and rudder. The geometric properties are the main particulars of the hull, sails, andappendages. The input file also specifies which wind speeds and which wind angles that shouldbe considered by the VPP.
The VPP calculates the boat speed, leeway angle, the lever arm of the crew (TCGcrew), andnecessary depowering of the sails. The results are presented in a polar plot with the radius asspeed and the angle as the true wind angle. One curve per considered wind speed is plotted.The calculated leeway angles, TCGcrew, and depowering of sails are presented in a table for allconsidered wind speed and wind angles.
4.4.2 Solved equations
There are three equations considered in the VPP, a force equilibrium in the x-direction, whichis defined as the direction of motion. A force equilibrium in the y- direction, which is defined asthe horizontal direction perpendicular to the x- axis, the z-axis is defined upwards. The thirdequation is a moment equilibrium around the x-axis. The equations are shown in Equation(4.12). The forces are assumed to be in equilibrium which means that there are no accelerationsof the hull in the considered directions. It is assumed that the heeling angle can be set to zero,which will result in the best performance of the skiff.
Fx = Fx,aero − Fx,hydro = 0
Fy = Fy,aero − Fy,hydro = 0
Mx = Fy,aero · (zCE + zCLR) − mcrew · g · TCGcrew = 0
(4.12)
In Equation (4.12), Fx,aero and Fy,aero are the resultant forces from the sails in the x and ydirection respectively. These forces depends on the apparent wind speed (AWS), apparent windangle (AWA), the leeway angle (α), and the lift and drag coefficients of the sails. The lift anddrag coefficients depends on the type of sails and the AWA. The methods used to calculate theforces from the sails are are explained further in Section 4.4.4.
39
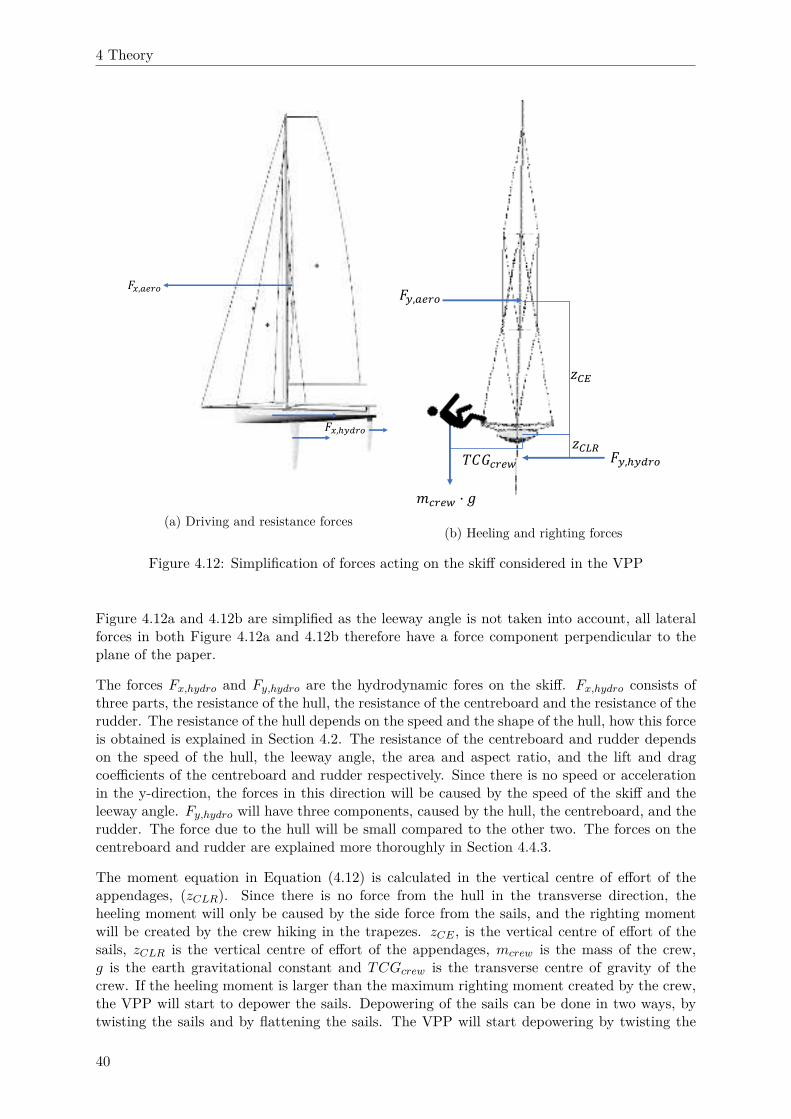
4 Theory
𝐹 ,𝑎 𝑟𝑜
𝐹 ,ℎ 𝑟𝑜
(a) Driving and resistance forces
𝑦,𝑎 𝑟𝑜
𝑦,ℎ𝑦 𝑟𝑜𝑚 𝑟 𝑤 · 𝑔
𝑧𝐶𝐸𝑧𝐶𝐿𝑅𝑇𝐶 𝑟 𝑤
(b) Heeling and righting forces
Figure 4.12: Simplification of forces acting on the skiff considered in the VPP
Figure 4.12a and 4.12b are simplified as the leeway angle is not taken into account, all lateralforces in both Figure 4.12a and 4.12b therefore have a force component perpendicular to theplane of the paper.
The forces Fx,hydro and Fy,hydro are the hydrodynamic fores on the skiff. Fx,hydro consists ofthree parts, the resistance of the hull, the resistance of the centreboard and the resistance of therudder. The resistance of the hull depends on the speed and the shape of the hull, how this forceis obtained is explained in Section 4.2. The resistance of the centreboard and rudder dependson the speed of the hull, the leeway angle, the area and aspect ratio, and the lift and dragcoefficients of the centreboard and rudder respectively. Since there is no speed or accelerationin the y-direction, the forces in this direction will be caused by the speed of the skiff and theleeway angle. Fy,hydro will have three components, caused by the hull, the centreboard, and therudder. The force due to the hull will be small compared to the other two. The forces on thecentreboard and rudder are explained more thoroughly in Section 4.4.3.
The moment equation in Equation (4.12) is calculated in the vertical centre of effort of theappendages, (zCLR). Since there is no force from the hull in the transverse direction, theheeling moment will only be caused by the side force from the sails, and the righting momentwill be created by the crew hiking in the trapezes. zCE , is the vertical centre of effort of thesails, zCLR is the vertical centre of effort of the appendages, mcrew is the mass of the crew,g is the earth gravitational constant and TCGcrew is the transverse centre of gravity of thecrew. If the heeling moment is larger than the maximum righting moment created by the crew,the VPP will start to depower the sails. Depowering of the sails can be done in two ways, bytwisting the sails and by flattening the sails. The VPP will start depowering by twisting the
40
4 Theory
sails. Twisting of the sails is implemented in the VPP as a factor that decreases the lift andlowers the centre of effort. The twisting factor can lower the centre of effort by maximum 25%.If the sails need to be depowered more, the VPP will start flattening the sails. Flattening of thesails is implemented as a factor that effects the lift coefficients of the sails. It can vary between1, where there is no influence on the lift, and 0, where there is no lift at all, This also decreasesthe induced drag according to Equation (4.17).
4.4.3 Centreboard and Rudder
The purpose of the centreboard is to create a counter force to the side force generated by thesails. This side force is created by the speed of the hull, creating an angle of attack for the flowover the centreboard. The rudder’s main purpose is to create a moment that is used to turn theboat when steering. The rudder also supports some of the side force and is thereby unloadingthe centreboard. The forces on a foil, like a rudder or centreboard, are governed by Equations(4.13).
FL =1
2V 2ρACL,3D
FD =1
2V 2ρA(CD,2D + CDI)
(4.13)
The lift, FL and drag, FD, depend on the speed of the foil, V , the planform area, A, density ofthe water, ρ, and the coefficients CL,3D, CD,2D, and CDI . These coefficients depend on severalfactors, such as Reynolds number, wing section, and angle of attack.
4.4.3.1 Planform
When designing the planform for a centreboard and a rudder, the aspect ratio (AR), is one ofthe most important parameters. The lift coefficient, CL,3D, and the induced drag coefficient,CDI , are both affected by the aspect ratio according to Equation (4.16) and (4.17). The aspectratio is the ratio between the draft, TK , and the mean chord, C̄, and can be written as
AR =TK
C̄=
TK2
A(4.14)
Where TK is the draft of the centreboard or rudder and C̄ is the mean chord.
C̄ =C1 + C2
2(4.15)
When AR is increased the lift coefficient, CL,3D, is increased according to Equation (4.16),where CL,2D,1◦ is the two dimensional lift coefficient for the wing section for a angle of attackof one degree, and α is the leeway angle, approximately 2◦ to 3◦ in this case.
CL,3D =CL,2D,1◦
1 +2
AR
· α (4.16)
The drag coefficient, CDI , is decreased with higher AR, as shown in Equation (4.17), but alsoincreased with higher lift coefficient.
CDI =CL,3D
2
π · AR(4.17)
41

4 Theory
Figure 4.13: Description of planform
To maximise the performance, the CL,3D should be as large as possible and the CDI should beas low as possible. In practice, this means that the draft of the centreboard should be as highas possible, but as mentioned in Section 4.3.3, it is restricted due to structural reasons.
The tip shape of the centreboard and the rudder is not as important as the aspect ratio, but itis still something that is investigated. A v-shaped tip is the best shape overall, in comparisonwith a round, square and bulb tip (Larsson et al., 2014). By having a v-shaped tip, the AR willbe lowered by 19 %. Although the v-shaped tip has an AR that is 19% lower, the benefits ofthe shape are bigger than the disadvantages (Larsson et al., 2014).
4.4.3.2 Wing Profiles
It is important to have as low profile drag as possible. One way to accomplish this, is to keepthe flow laminar around the profile for as long as possible. This means that the transition fromlaminar to turbulent flow must be as far back as possible. By having the pressure minimumfar aft, the flow can be accelerated over a longer distance and the transition from laminarto turbulent flow can be delayed. The location of the pressure minimum is governed by thelocation of the maximum thickness, because of this, a wing section with the location of maximumthickness far aft would be beneficial.
The main difference between the NACA four series which have a quite simple geometry, andthe six series which has a more complex geometry is that the six series profiles are designed tohave laminar flow along the wing section. Larsson et al. (2014) states that the NACA six seriesis a good choice as the wing profile for a centreboard.
It is typical for the NACA 6 series to have low profile drag and more or less constant drag forlow angles of attack, but at a certain angle of attack, the drag increases quickly to a higherlevel, from which it increases more moderate with the angle of attack. Such a profile are saidto have a drag bucket. This due to the shape of the graph created when plotting drag as afunction of angle of attack, see Figure 4.14. Comparing the NACA 4 digit series profile with
42

4 Theory
the 6 series profiles, both the 6 series profiles have a bucket shape while the 4 digit series havea does not have that.
Re =V · L
ν(4.18)
The Reynolds number effects the lift and drag coefficients of a foil. The Reynolds number iscalculated according to Equation (4.18) and for a foil like a centreboard or rudder on a skiffdesigned for speeds around 3.5m/s the Reynolds number will be between 5 · 105 and 106. Inthis range, the changes in properties can be considered small. The graphs presented in Figure4.14, 4.15, and 4.16 are calculated for a Reynolds number of 8 · 105 using XFOIL 6.99.
0 0.5 1 1.5 2 2.5 3 3.5 4 4.5 5
Angle of attack [°]
5
5.5
6
6.5
7
7.5
8
8.5
9
9.5
10
Dra
g co
effic
ient
CD
10-3 Profile Drag vs angle of attack
NACA 63012NACA 65012NACA 0012
Figure 4.14: Profile drag for different profiles
In Figure 4.14, all three profiles have a maximum thickness of 12 % of the cord length. Theeffect of location of maximum thickness is important, and is visualised in Figure 4.14. Studyingthe blue and red line, where the the red line has the location of maximum thickness more aft,the resistance at small angles of attack is lower but the drag bucket is slightly more narrow andsteep than for the blue line.
The location of maximum thickness has effect on the shape of the drag bucket, although theeffect of changes in thickness are more significant than the effect of location. A large thicknesswill cause a wider but but more shallow bucket than a thinner profile, which will have a morenarrow but deeper drag bucket, see Figure 4.15. A location of maximum thickness more aftwill cause a slight decrease in resistance for small angles of attack, although the bucket shapewill be more extreme so the drag at large angles of attack will be larger than for a section withmaximum thickness located more forward.
43

4 Theory
0 1 2 3 4 5 6
Angle of attack [°]
5
5.5
6
6.5
7
7.5
8
8.5
9
9.5
10
Dra
g co
effic
ient
CD
10-3 Profile Drag vs angle of attack
NACA 65018NACA 65012NACA 65010
Figure 4.15: Profile drag for different thicknesses
The purpose of the centreboard and rudder is to generate lift. The lift coefficients of symmetricNACA profiles do not differ much from each other and the connection between lift and angleof attack is highly linear for small angles of attack. The proportionality coefficient, CL,2D,1◦ ,can therefore be approximated as the two dimensional lift coefficient for one degree, and canapproximately be stated as 0.1 for symmetric NACA profiles. Figure 4.16 shows that CL,2D,1◦
should be between 0.08 and 0.1 for all five wing sections, and that the relationship between liftcoefficient and angle of attack is linear. This means that for the design of the centreboard andrudder, the lift will be approximately equal independent of the wing section while the drag ofthe appendages to a large extent can be optimised by choosing the right wing section.
0 0.5 1 1.5 2 2.5 3 3.5 4 4.5 5
Angle of attack [°]
0
0.1
0.2
0.3
0.4
0.5
0.6
Lift
coef
ficie
nt C
L
Lift vs angle of attack
NACA 63009NACA 65010NACA 63012NACA 65012NACA 0012
Figure 4.16: Lift for different profiles
44

4 Theory
4.4.4 Sail Set Up
(Larsson et al., 2014), the sails can be considered wings in the same way as as the appendages,but with very low thickness. The presence of a jib in front of the main sail effects the flow overthe main sail and thus also the force on the sails. With the presence of a jib, the main sailwill be unloaded, compared to a case with no jib. The opposite is true for the jib. With thepresence of a mainsail, the jib will be more loaded than without a main sail. Overall, the forcefrom the sails are much larger with the presence of a jib.
4.4.4.1 Sail coefficients
The lift, drag, and induced drag of the sails are governed by Equation (4.13), the same equationsas the centreboard and the rudder. Using the coefficients governed by Equations (4.16) and(4.17). However, the speed term V, should be the wind speed that the sails encounter, theapparent wind speed (AWS). The AWS is calculated according to Equation (4.19).
AWS =√
(TWS · cos (TWA) + V · cos (α))2 + (TWS · sin (TWA) − V · sin (α))2
AWA = arctanTWS · sin TWA − V · sin (α)
TWS · cos (TWA)V · cos (α)
(4.19)
The forces from a sail can, as mentioned earlier, be calculated using classical wing theory,according to Equation (4.13). The obtained forces, FL and FD, are orthogonal where FL isperpendicular and FD is parallel to the wind acting on the sail, this is shown in Figure 4.17where the x axis is the longitudinal direction of the skiff and the y axis is the transverse direction.
𝐹𝐿𝐹𝐷𝐹 ,𝐿
𝐹 ,𝐿
𝐹 ,𝐷𝐹 ,𝐷𝐴𝑊𝐴 + 𝛼
𝐴𝑊𝐴 + 𝛼
𝐴𝑊𝐴 + 𝛼
Figure 4.17: Forces acting on a sail
The resulting forces of FL and FD, in the x and y direction, will give Fx,aero and Fyaero, foreach sail in Equation (4.12), are obtained using the calculated FL, FD, and using the apparentwind angle (AWA), calculated in Equation (4.19), and leeway angle α, according to Equation(4.20).
Fx,aero = Fx,L − Fx,D = FL · sin (AWA + α) − FD · cos (AWA + α)
Fy,aero = Fy,L − Fy,D = FL · cos (AWA + α) − FD · sin (AWA + α)(4.20)
45

4 Theory
The coefficients used for force calculations of the sails in this project are the coefficients used bythe Offshore Racing Congress (2016) (ORC). These sail coefficients are used in the ORC VPPsoftware to calculate handicaps for racing yachts. The ORC uses different sets of coefficientsdepending on the type of sail. The sail coefficients depend only on the angle of attack of thesails. The sail coefficient used in this project are displayed in Figure 4.18a and 4.18b.
0 20 40 60 80 100 120 140 160 180
Angle of attack [°]
-0.2
0
0.2
0.4
0.6
0.8
1
1.2
1.4
1.6
Lift
coef
ficie
nt C
L
CL vs
Main sailJib
(a) Lift coefficients
0 20 40 60 80 100 120 140 160 180
Angle of attack [°]
0
0.2
0.4
0.6
0.8
1
1.2
1.4
Dra
g co
effic
ient
CD
0
CD
vs
Main sailJib
(b) Drag coefficient
Figure 4.18: Lift and Drag coefficients as a function of the angle of attack α
4.4.4.2 Aspect Ratio
To reduce the induced drag in the sail, it is desirable, as for the rudder and centreboard, to haveas high aspect ratio as possible. Larsson et al. (2014), discuss the importance of the height ofthe attachment point of the jib. Having the attachment point at the full mast length increasesthe driving force compared to having it further down, while it does not have any effect on theside force of the sail.
A limitation to an extremely high aspect ratio sail is that it will have very low cord length.This means that the size of the mast section will be large compared to the sail section, whichalso means that the influence from the mast on the flow around the sail will be large. A highmast will also need a thicker profile for structural reasons which means that the influence offthe mast will be even more significant. The mast disturbance is introduced in the VPP as afunction, depending on the ratio between mast diameter and mean cord, effecting both the liftand drag coefficients of the main sail. A higher mast also means that the centre of effort in thesails will be moved upwards, this will cause a larger heeling moment than a shorter mast.
46
5 Design process
In this chapter, the design process of all the components of the skiff are covered. The knowledgeand theory behind this chapter is based on the previous Chapters 3 and 4.
5.1 Hull
In the design process of the hull, modelling of the geometry and CFD simulations are donesimultaneously in order to get updates for improvements and obtain an optimised hull fordesired speeds. When the design of the outer hull shape is decided, the internal structures aredesigned. This process is presented in the following sections.
5.1.1 Hull Analysis
To obtain the best hull design, meaning a hull with a low resistance, all design changes have tobe compared. This is done using CFD-software. To obtain good results, the simulations needto run in the same way. Therefore the same range of speeds for the hulls need to be evaluatedwhile maintaining same displacement. The trim of the hull needs to be set for each iteration.All the simulations are run for just half of the hull, to save computational time. See Section 4.2for further information and how to set up the simulations. Having just half of the hull analysedmakes it needed to correct the results for the total geometry.
5.1.1.1 Simulations Speeds
The speeds of the hull have to be the same in each simulation so they can be compared. To decidewhat speeds will be run, inputs from the VPP are used. Here the resistance for the 49er© is usedwith the same sail area as is allowed in this competition, 33 square metres(A. 1001VELAcup,2017). This gave speeds according to Table 5.1, which will be considered in the simulations.The speeds are chosen in knots but has to be implemented in metres per second.
From the VPP, the maximum speed the boat is most likely to reach is approximately 5-7 knots,in approximately equal values for wind speeds. This wind speed is chosen according to the windstatistics, see Section 3.1 for more information. The reason a wider range of speeds is analysed,instead of considering just the one expected for boat speed is for the estimation of resistance.To implement the resistance values into the VPP calculations for speeds that are not evaluatedthrough CFD simulations, an extrapolation method would be required. Analysis of speeds notdirectly interesting for CFD evaluations make it instead possible for the VPP to obtain resultsthrough interpolation of a known range of values (Wahab, 2017). This interpolation methodresults more accurate than the extrapolation, and will therefore produce more accurate VPPpredictions.
5.1.1.2 Hull Trim
One peculiarity of the 49er© is that it can easily change the waterline just by relocating thecentre of gravity. This makes it possible to have a waterline good both for low speeds, whentrimming the hull forward, and for high speeds, when moving the centre of gravity toward theaft. This feature is transferred to the hull designed since it is based on the 49er© hull. Thereforethe simulations will be run at different trims for different speeds. To have an idea of how to trimthe hull, the longitudinal position of the centre of gravity is scaled from a 49er© for each speed.
47
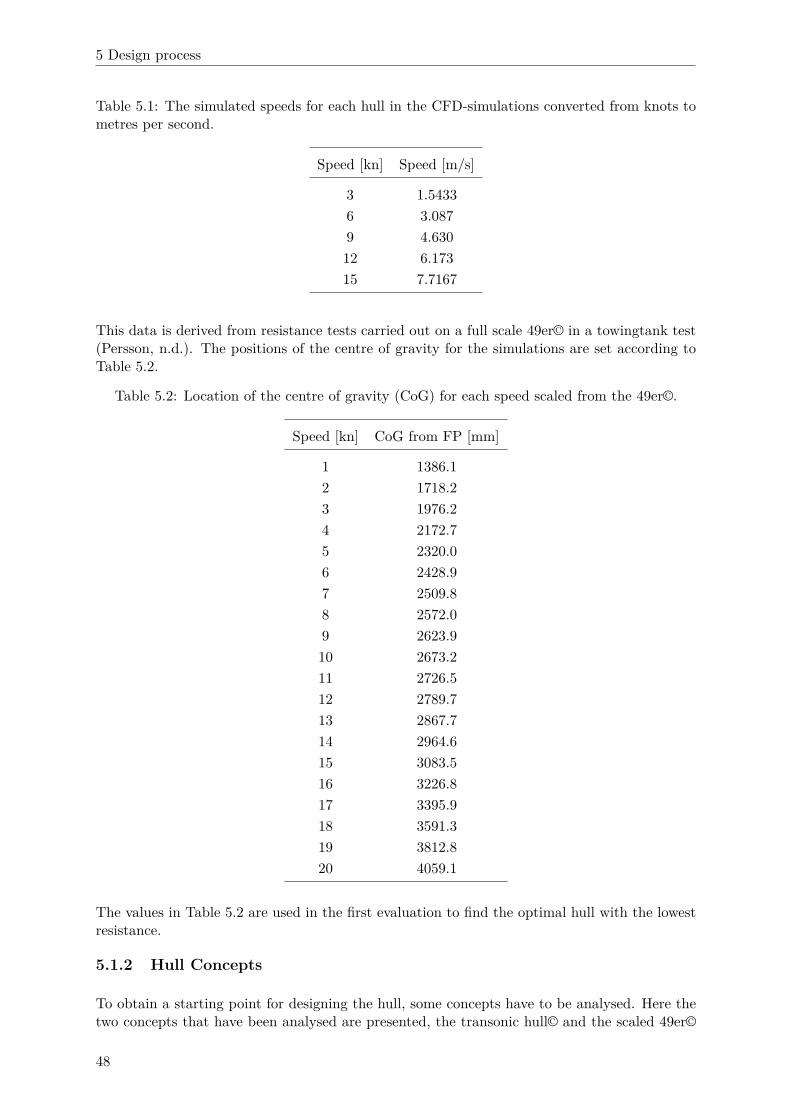
5 Design process
Table 5.1: The simulated speeds for each hull in the CFD-simulations converted from knots tometres per second.
Speed [kn] Speed [m/s]
3 1.5433
6 3.087
9 4.630
12 6.173
15 7.7167
This data is derived from resistance tests carried out on a full scale 49er© in a towingtank test(Persson, n.d.). The positions of the centre of gravity for the simulations are set according toTable 5.2.
Table 5.2: Location of the centre of gravity (CoG) for each speed scaled from the 49er©.
Speed [kn] CoG from FP [mm]
1 1386.1
2 1718.2
3 1976.2
4 2172.7
5 2320.0
6 2428.9
7 2509.8
8 2572.0
9 2623.9
10 2673.2
11 2726.5
12 2789.7
13 2867.7
14 2964.6
15 3083.5
16 3226.8
17 3395.9
18 3591.3
19 3812.8
20 4059.1
The values in Table 5.2 are used in the first evaluation to find the optimal hull with the lowestresistance.
5.1.2 Hull Concepts
To obtain a starting point for designing the hull, some concepts have to be analysed. Here thetwo concepts that have been analysed are presented, the transonic hull© and the scaled 49er©
48
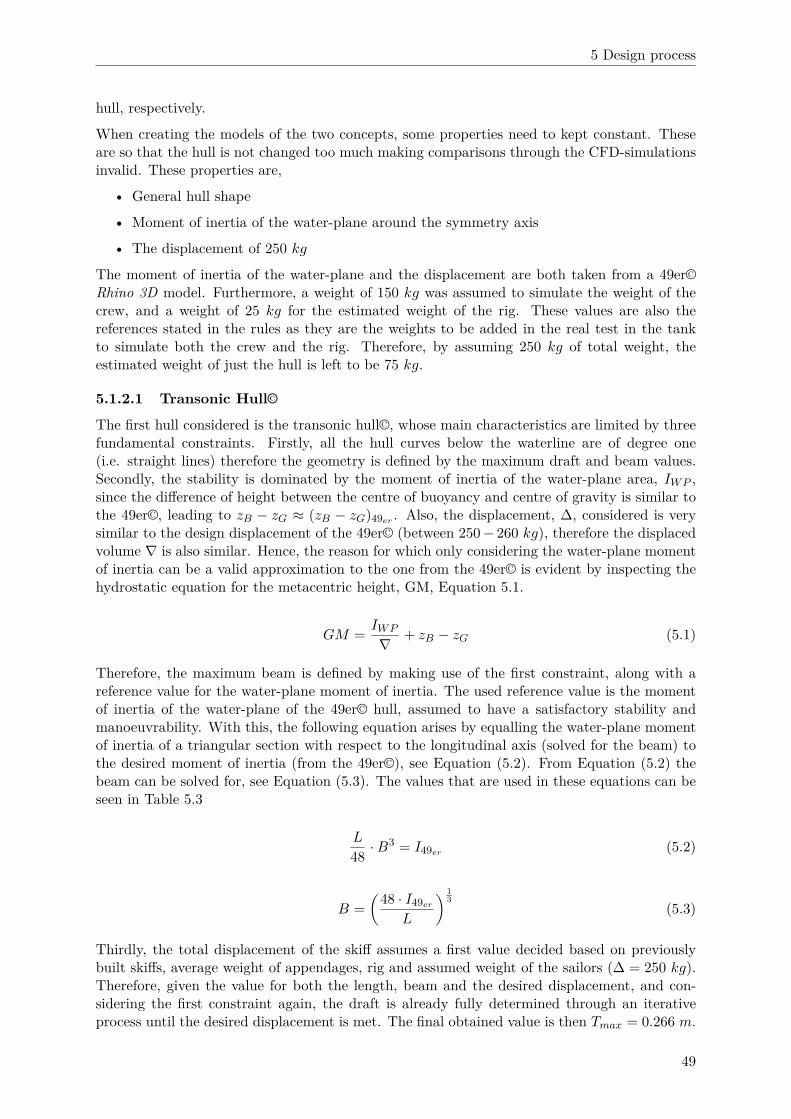
5 Design process
hull, respectively.
When creating the models of the two concepts, some properties need to kept constant. Theseare so that the hull is not changed too much making comparisons through the CFD-simulationsinvalid. These properties are,
• General hull shape
• Moment of inertia of the water-plane around the symmetry axis
• The displacement of 250 kg
The moment of inertia of the water-plane and the displacement are both taken from a 49er©Rhino 3D model. Furthermore, a weight of 150 kg was assumed to simulate the weight of thecrew, and a weight of 25 kg for the estimated weight of the rig. These values are also thereferences stated in the rules as they are the weights to be added in the real test in the tankto simulate both the crew and the rig. Therefore, by assuming 250 kg of total weight, theestimated weight of just the hull is left to be 75 kg.
5.1.2.1 Transonic Hull©
The first hull considered is the transonic hull©, whose main characteristics are limited by threefundamental constraints. Firstly, all the hull curves below the waterline are of degree one(i.e. straight lines) therefore the geometry is defined by the maximum draft and beam values.Secondly, the stability is dominated by the moment of inertia of the water-plane area, IW P ,since the difference of height between the centre of buoyancy and centre of gravity is similar tothe 49er©, leading to zB − zG ≈ (zB − zG)49er
. Also, the displacement, ∆, considered is verysimilar to the design displacement of the 49er© (between 250 − 260 kg), therefore the displacedvolume ∇ is also similar. Hence, the reason for which only considering the water-plane momentof inertia can be a valid approximation to the one from the 49er© is evident by inspecting thehydrostatic equation for the metacentric height, GM, Equation 5.1.
GM =IW P
∇+ zB − zG (5.1)
Therefore, the maximum beam is defined by making use of the first constraint, along with areference value for the water-plane moment of inertia. The used reference value is the momentof inertia of the water-plane of the 49er© hull, assumed to have a satisfactory stability andmanoeuvrability. With this, the following equation arises by equalling the water-plane momentof inertia of a triangular section with respect to the longitudinal axis (solved for the beam) tothe desired moment of inertia (from the 49er©), see Equation (5.2). From Equation (5.2) thebeam can be solved for, see Equation (5.3). The values that are used in these equations can beseen in Table 5.3
L
48· B3 = I49er
(5.2)
B =
(48 · I49er
L
) 1
3
(5.3)
Thirdly, the total displacement of the skiff assumes a first value decided based on previouslybuilt skiffs, average weight of appendages, rig and assumed weight of the sailors (∆ = 250 kg).Therefore, given the value for both the length, beam and the desired displacement, and con-sidering the first constraint again, the draft is already fully determined through an iterativeprocess until the desired displacement is met. The final obtained value is then Tmax = 0.266 m.
49

5 Design process
Table 5.3: Beam fom moment of inertia
L [m] I49er [m4] B [m]
4.6 1.664 · 10−1 1.202
After computing these values, the obtained transonic hull© is depicted in Figure 5.1.
Figure 5.1: Transonic hull©
5.1.2.2 Scaled 49er© Hull
The other evaluated concept is the scaled 49er©, see Figure 5.2. As implied in the name, thecreated model for the scaled 49er© has proportional dimensions to the 49er© skiff and is scaleddown to 4.60 m LOA according to the regulations of the competition. The main design propertiestried to be kept from the 49er© in the new scaled-down version, along with the reasons for doingso are:
• Maximum beam far aft, to reduce resistance
• Flat bottom in the aft, to reduce resistance at higher speeds
• Concavity above the waterline, to reduce spray along the hull sides
• Slender and v-shaped bow, to reduce slamming and pierce waves with less interference
Similarly to the transonic hull©, the design displacement and the moment of inertia of the waterplane are also kept constant.
By having these conditions satisfied, the obtained hull is depicted in Figure 5.2.
50
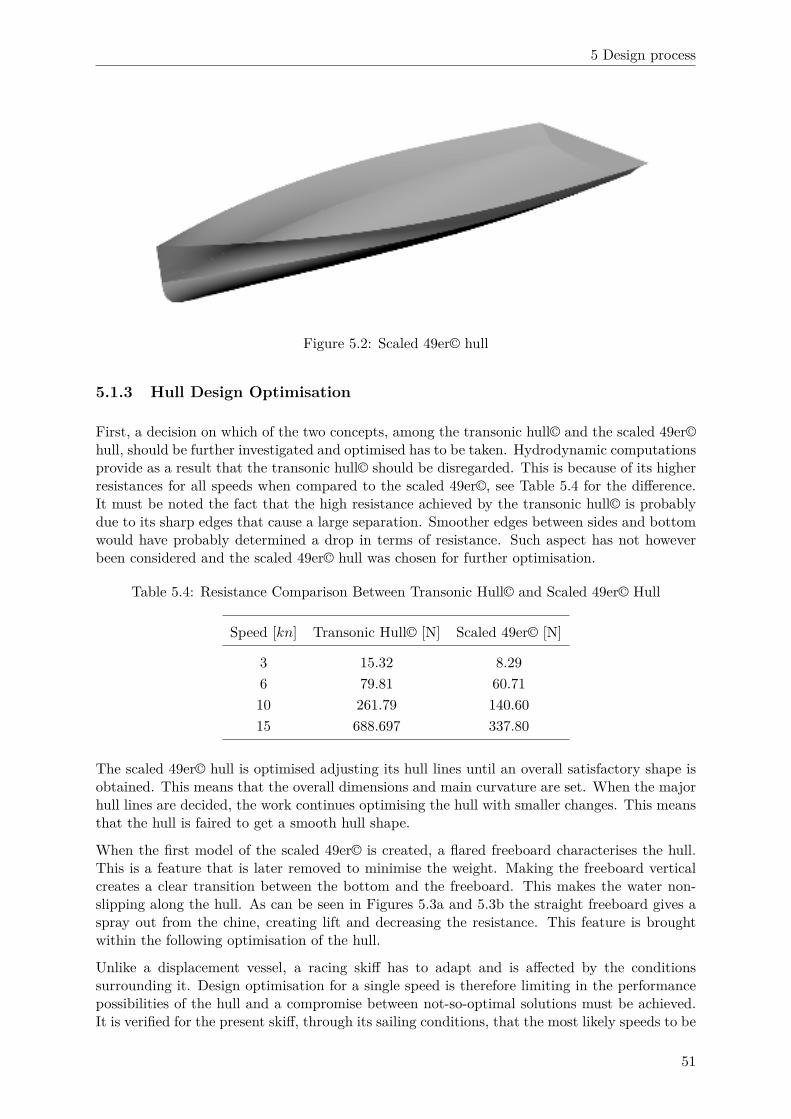
5 Design process
Figure 5.2: Scaled 49er© hull
5.1.3 Hull Design Optimisation
First, a decision on which of the two concepts, among the transonic hull© and the scaled 49er©hull, should be further investigated and optimised has to be taken. Hydrodynamic computationsprovide as a result that the transonic hull© should be disregarded. This is because of its higherresistances for all speeds when compared to the scaled 49er©, see Table 5.4 for the difference.It must be noted the fact that the high resistance achieved by the transonic hull© is probablydue to its sharp edges that cause a large separation. Smoother edges between sides and bottomwould have probably determined a drop in terms of resistance. Such aspect has not howeverbeen considered and the scaled 49er© hull was chosen for further optimisation.
Table 5.4: Resistance Comparison Between Transonic Hull© and Scaled 49er© Hull
Speed [kn] Transonic Hull© [N] Scaled 49er© [N]
3 15.32 8.29
6 79.81 60.71
10 261.79 140.60
15 688.697 337.80
The scaled 49er© hull is optimised adjusting its hull lines until an overall satisfactory shape isobtained. This means that the overall dimensions and main curvature are set. When the majorhull lines are decided, the work continues optimising the hull with smaller changes. This meansthat the hull is faired to get a smooth hull shape.
When the first model of the scaled 49er© is created, a flared freeboard characterises the hull.This is a feature that is later removed to minimise the weight. Making the freeboard verticalcreates a clear transition between the bottom and the freeboard. This makes the water non-slipping along the hull. As can be seen in Figures 5.3a and 5.3b the straight freeboard gives aspray out from the chine, creating lift and decreasing the resistance. This feature is broughtwithin the following optimisation of the hull.
Unlike a displacement vessel, a racing skiff has to adapt and is affected by the conditionssurrounding it. Design optimisation for a single speed is therefore limiting in the performancepossibilities of the hull and a compromise between not-so-optimal solutions must be achieved.It is verified for the present skiff, through its sailing conditions, that the most likely speeds to be
51
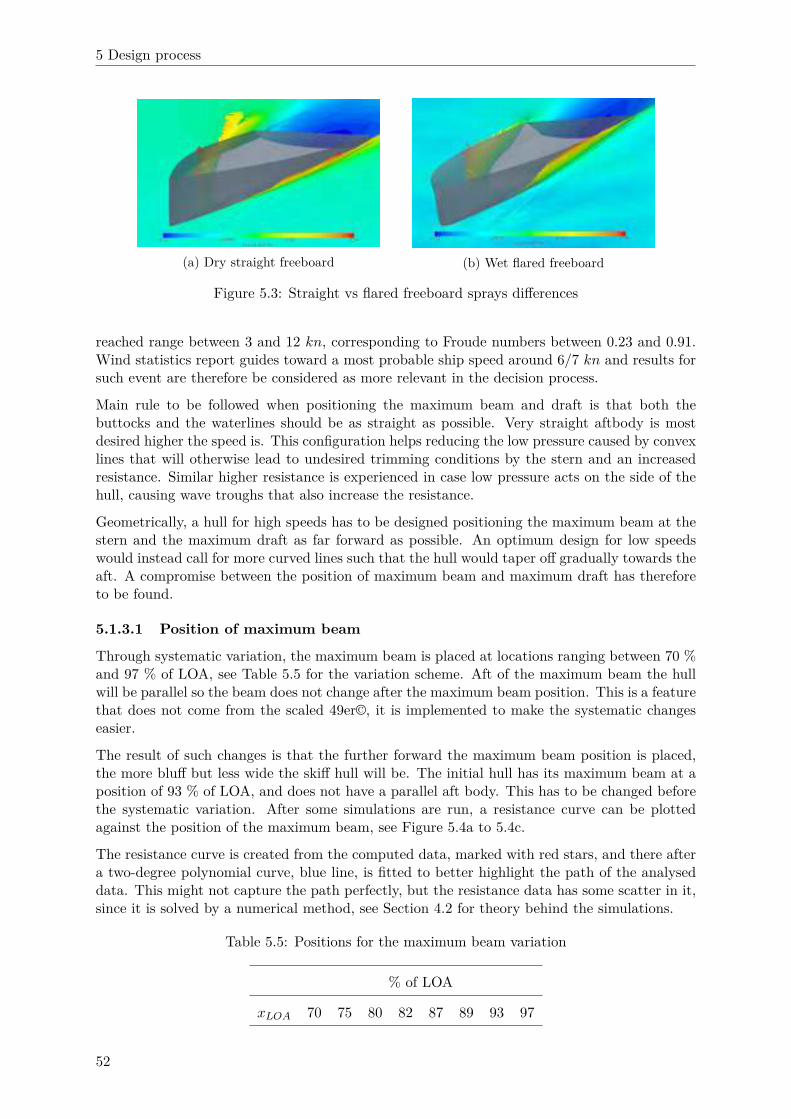
5 Design process
(a) Dry straight freeboard (b) Wet flared freeboard
Figure 5.3: Straight vs flared freeboard sprays differences
reached range between 3 and 12 kn, corresponding to Froude numbers between 0.23 and 0.91.Wind statistics report guides toward a most probable ship speed around 6/7 kn and results forsuch event are therefore be considered as more relevant in the decision process.
Main rule to be followed when positioning the maximum beam and draft is that both thebuttocks and the waterlines should be as straight as possible. Very straight aftbody is mostdesired higher the speed is. This configuration helps reducing the low pressure caused by convexlines that will otherwise lead to undesired trimming conditions by the stern and an increasedresistance. Similar higher resistance is experienced in case low pressure acts on the side of thehull, causing wave troughs that also increase the resistance.
Geometrically, a hull for high speeds has to be designed positioning the maximum beam at thestern and the maximum draft as far forward as possible. An optimum design for low speedswould instead call for more curved lines such that the hull would taper off gradually towards theaft. A compromise between the position of maximum beam and maximum draft has thereforeto be found.
5.1.3.1 Position of maximum beam
Through systematic variation, the maximum beam is placed at locations ranging between 70 %and 97 % of LOA, see Table 5.5 for the variation scheme. Aft of the maximum beam the hullwill be parallel so the beam does not change after the maximum beam position. This is a featurethat does not come from the scaled 49er©, it is implemented to make the systematic changeseasier.
The result of such changes is that the further forward the maximum beam position is placed,the more bluff but less wide the skiff hull will be. The initial hull has its maximum beam at aposition of 93 % of LOA, and does not have a parallel aft body. This has to be changed beforethe systematic variation. After some simulations are run, a resistance curve can be plottedagainst the position of the maximum beam, see Figure 5.4a to 5.4c.
The resistance curve is created from the computed data, marked with red stars, and there aftera two-degree polynomial curve, blue line, is fitted to better highlight the path of the analyseddata. This might not capture the path perfectly, but the resistance data has some scatter in it,since it is solved by a numerical method, see Section 4.2 for theory behind the simulations.
Table 5.5: Positions for the maximum beam variation
% of LOA
xLOA 70 75 80 82 87 89 93 97
52

5 Design process
(a) Results for 3 kn
(b) Results for 6 kn
(c) Results for 9 kn
Figure 5.4: Max Beam position vs resistance. Red stars mark measured data; Blue line is thefitted resistance curve
53

5 Design process
Aim of the computations is to determine a geometry that presents as low resistance as possibleand their results are plotted in Figures 5.4a to 5.4c. Main focus in the post-processing of theresults obtained is put on the range of speeds between 3 and 9 kn, while the higher speeds,12 and 15 kn, are computed almost excusively in order to provide sufficient data to the VPP.At speeds of 3 kn the optimal position of maximum beam is suggested to be placed between80 and 90 % of LOA. Higher speeds suggest instead to move the position of maximum beamtoward the stern, reaching values in the range 85 − 95 % for speeds of 6 kn and even further for9 kn. Furthermore, considering the fact that 6 kn of speed is the one most probably achievedby the skiff, computations for speeds of 5 and 7 kn are also carried out. Choice for these twospeeds also gives the opportunity to carry out a validation comparison with other data. Suchcomparison is presented in Section 5.1.4.1. The results of the computations for the full rangeof speeds are presented in Table 5.6.
Table 5.6: Resistance vs beam position comparison
Speed [kn] 3 5 6 7 9 12 15
Position in %of LOA formax beam
Resistance [N]
80 19.12 67.84 115.04 149.98 231.78 345.98 431.68
87 19.04 67.42 114.76 149.62 237.54 348.38 434.7
93 18.94 68.14 115.68 150.28 236.18 348.1 433.4
From Table 5.6 it is hard to evaluate which beam position to choose. Therefore all the valueshave to be compared in some way. This is done by ranking all of the position based on resistancefor each speeds. There after the rankings are scaled by a factor depending on how probableeach boat speed is. The scale factor is chosen according to Table 5.7.
Table 5.7: Scale factors to compare which hull to choose for maximum beam position variation
Speed [kn] Scale Factor
3 0.16
5 0.23
6 0.23
7 0.23
9 0.15
12 0.00
15 0.00
The scale factors in Table 5.7 are set so they mostly privilege speeds around 7 kn, since this isthe design speed according to the VPP. Then 5 kn and 6 kn are speeds that also need to bedesigned for. Therefore 5, 6 and 7 kn have the main influences on the final decision. Then therest is spread out equally between 3 and 9 kn since these speeds are equally probable for theskiff to reach. For the higher speeds, 12 and 15 kn, it is not seen reasonable to take these intoconsideration since the skiff is designed for speeds around 7 kn. To see the result for the scaledranking, see Table 5.8.
As can be seen in Table 5.8 the maximum beam position should be placed at 87 % of LOA fromthe bow. After this position it should have a parallel aft body. This gives that aft of 4002 mm
54
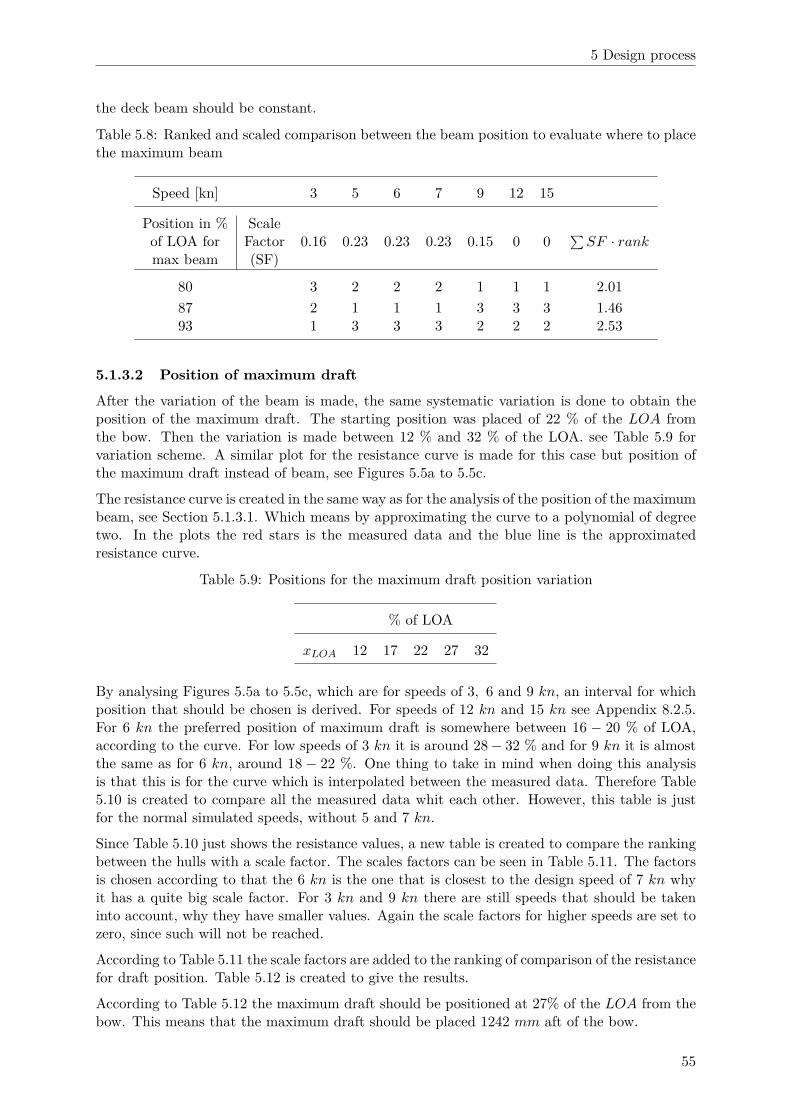
5 Design process
the deck beam should be constant.
Table 5.8: Ranked and scaled comparison between the beam position to evaluate where to placethe maximum beam
Speed [kn] 3 5 6 7 9 12 15
Position in %of LOA formax beam
ScaleFactor(SF)
0.16 0.23 0.23 0.23 0.15 0 0∑
SF · rank
80 3 2 2 2 1 1 1 2.01
87 2 1 1 1 3 3 3 1.4693 1 3 3 3 2 2 2 2.53
5.1.3.2 Position of maximum draft
After the variation of the beam is made, the same systematic variation is done to obtain theposition of the maximum draft. The starting position was placed of 22 % of the LOA fromthe bow. Then the variation is made between 12 % and 32 % of the LOA. see Table 5.9 forvariation scheme. A similar plot for the resistance curve is made for this case but position ofthe maximum draft instead of beam, see Figures 5.5a to 5.5c.
The resistance curve is created in the same way as for the analysis of the position of the maximumbeam, see Section 5.1.3.1. Which means by approximating the curve to a polynomial of degreetwo. In the plots the red stars is the measured data and the blue line is the approximatedresistance curve.
Table 5.9: Positions for the maximum draft position variation
% of LOA
xLOA 12 17 22 27 32
By analysing Figures 5.5a to 5.5c, which are for speeds of 3, 6 and 9 kn, an interval for whichposition that should be chosen is derived. For speeds of 12 kn and 15 kn see Appendix 8.2.5.For 6 kn the preferred position of maximum draft is somewhere between 16 − 20 % of LOA,according to the curve. For low speeds of 3 kn it is around 28 − 32 % and for 9 kn it is almostthe same as for 6 kn, around 18 − 22 %. One thing to take in mind when doing this analysisis that this is for the curve which is interpolated between the measured data. Therefore Table5.10 is created to compare all the measured data whit each other. However, this table is justfor the normal simulated speeds, without 5 and 7 kn.
Since Table 5.10 just shows the resistance values, a new table is created to compare the rankingbetween the hulls with a scale factor. The scales factors can be seen in Table 5.11. The factorsis chosen according to that the 6 kn is the one that is closest to the design speed of 7 kn whyit has a quite big scale factor. For 3 kn and 9 kn there are still speeds that should be takeninto account, why they have smaller values. Again the scale factors for higher speeds are set tozero, since such will not be reached.
According to Table 5.11 the scale factors are added to the ranking of comparison of the resistancefor draft position. Table 5.12 is created to give the results.
According to Table 5.12 the maximum draft should be positioned at 27% of the LOA from thebow. This means that the maximum draft should be placed 1242 mm aft of the bow.
55
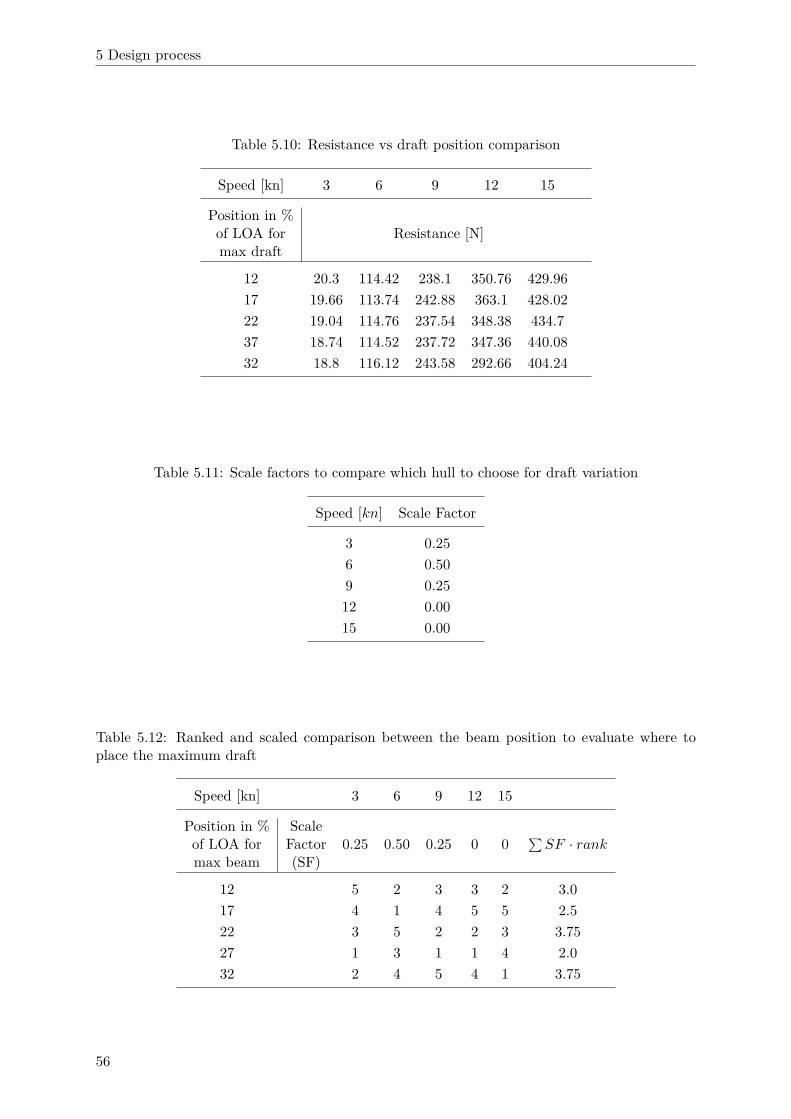
5 Design process
Table 5.10: Resistance vs draft position comparison
Speed [kn] 3 6 9 12 15
Position in %of LOA formax draft
Resistance [N]
12 20.3 114.42 238.1 350.76 429.96
17 19.66 113.74 242.88 363.1 428.02
22 19.04 114.76 237.54 348.38 434.7
37 18.74 114.52 237.72 347.36 440.08
32 18.8 116.12 243.58 292.66 404.24
Table 5.11: Scale factors to compare which hull to choose for draft variation
Speed [kn] Scale Factor
3 0.25
6 0.50
9 0.25
12 0.00
15 0.00
Table 5.12: Ranked and scaled comparison between the beam position to evaluate where toplace the maximum draft
Speed [kn] 3 6 9 12 15
Position in %of LOA formax beam
ScaleFactor(SF)
0.25 0.50 0.25 0 0∑
SF · rank
12 5 2 3 3 2 3.0
17 4 1 4 5 5 2.5
22 3 5 2 2 3 3.75
27 1 3 1 1 4 2.0
32 2 4 5 4 1 3.75
56

5 Design process
(a) Results for 3 kn
(b) Results for 6 kn
(c) Results for 9 kn
Figure 5.5: Max Draft position vs resistance. Red stars mark measured data; Blue line is thefitted resistance curve.
57

5 Design process
5.1.4 Final Hull Geometry and Hydrodynamics
From the optimisation of the hull design, the shape of the canoe body is determined. By this itsmain dimensions are set from an optimal point of view. All the main dimensions are presentedin Table 5.13. Drawings for the final design of the hull shape are detailed in Appendix 8.2.5.
Table 5.13: Final hull dimensions for the skiff
LOA [m]Bmax
canoe-body [m]Position of max beam
[%LOA]Tmax
canoe-body [m]Position of max draft
[%LOA]
4.6 1.202 87 0.17 27
For the final canoe body the resistance is presented in Table 5.14. Also a resistance curve iscreated, see Figure 5.6.
Table 5.14: Final drag along x-axis for the canoe body
Speed [kn] Resistance [N]
3 19.52
5 69.62
6 114.22
7 151.32
9 233.80
12 348.65
15 431.56
Figure 5.6: Resistance curve for final canoe-body
58
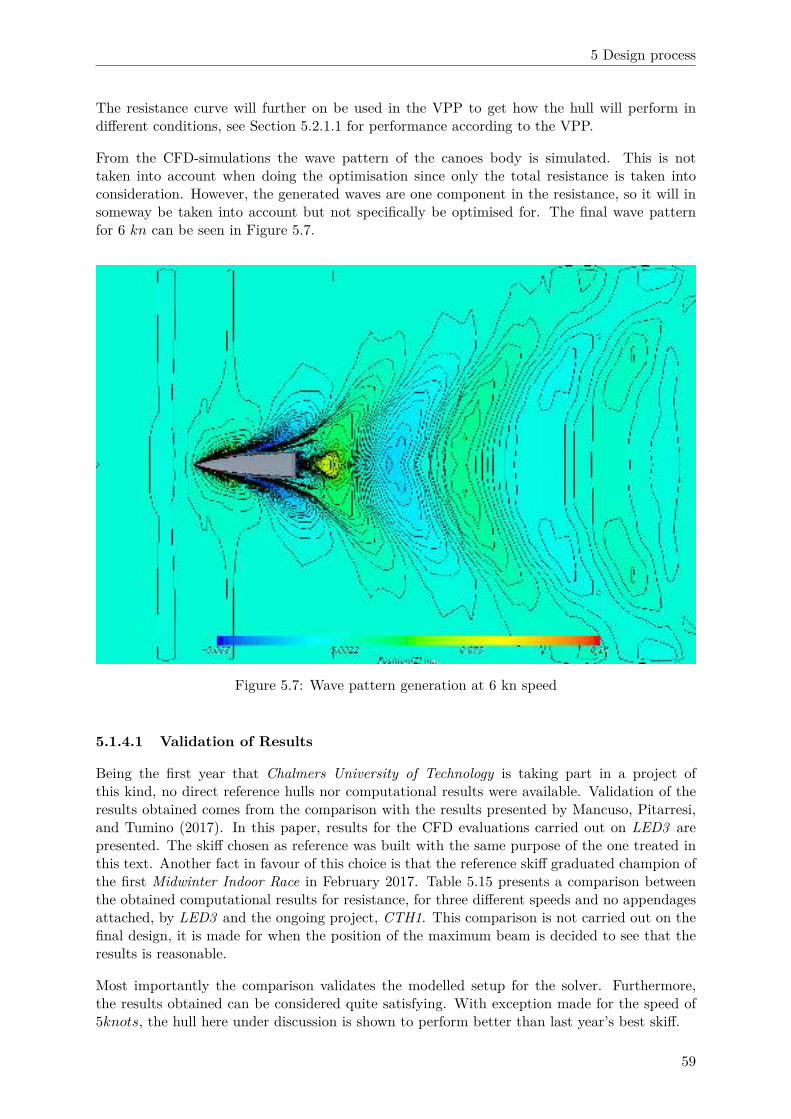
5 Design process
The resistance curve will further on be used in the VPP to get how the hull will perform indifferent conditions, see Section 5.2.1.1 for performance according to the VPP.
From the CFD-simulations the wave pattern of the canoes body is simulated. This is nottaken into account when doing the optimisation since only the total resistance is taken intoconsideration. However, the generated waves are one component in the resistance, so it will insomeway be taken into account but not specifically be optimised for. The final wave patternfor 6 kn can be seen in Figure 5.7.
Figure 5.7: Wave pattern generation at 6 kn speed
5.1.4.1 Validation of Results
Being the first year that Chalmers University of Technology is taking part in a project ofthis kind, no direct reference hulls nor computational results were available. Validation of theresults obtained comes from the comparison with the results presented by Mancuso, Pitarresi,and Tumino (2017). In this paper, results for the CFD evaluations carried out on LED3 arepresented. The skiff chosen as reference was built with the same purpose of the one treated inthis text. Another fact in favour of this choice is that the reference skiff graduated champion ofthe first Midwinter Indoor Race in February 2017. Table 5.15 presents a comparison betweenthe obtained computational results for resistance, for three different speeds and no appendagesattached, by LED3 and the ongoing project, CTH1. This comparison is not carried out on thefinal design, it is made for when the position of the maximum beam is decided to see that theresults is reasonable.
Most importantly the comparison validates the modelled setup for the solver. Furthermore,the results obtained can be considered quite satisfying. With exception made for the speed of5knots, the hull here under discussion is shown to perform better than last year’s best skiff.
59

5 Design process
Table 5.15: Drag along x-axis for hull LED3
Speed [kn] Resistance LED3 [N] Resistance CTH1 [N]
5 67.9 69.62
6 115.1 114.22
7 168.2 151.32
5.1.5 Deck
When designing the deck, several parameters have to be considered. Such parameters are easeof movement for sailors on the deck, aerodynamics, water on deck and stiffness given by deckshape. Three different designs are discussed, one with a v-shaped deck downwards, a straightdeck and one with a slightly upwards cambered deck.
For the v-shaped deck the main feature with this design is that is make the movement for thesailors easily. The angle should follow the racks in this case to make get this easy movement.The disadvantage for this design is that there are risk for collecting water in the middle of theV, as well as the structure will be weaker by this solution. By this reason, it will not be chosen.
Next design concept is the straight deck. This is some mix between the two other options anddoes not give any specific advantage or disadvantage. This is why this is not chosen since bothof the other concept has bigger advantages that can be used.
The last design is the slightly upwards cambered deck. This has it advantages in giving stiffnessto the structural performance, see Section 5.1.6.2 for more information about it. Also the featurethat the water not will be collected on the hull is something that is preferred as well as thereare no big problems with the movement. One problem that can occur further on in the projectwhen designing the deck layout is that there is no place under the freeboard to collect thing in.Like the gennaker sock. This does not seem as a big problem and with all advantages for thisdesign this is chosen.
5.1.6 Structural Hull Design
The structural design of the hull can be divided into three steps. Design of the hull platingsandwich, design of the deck sandwich and design of the internal stiffening structure. In thissection the design of each of these components will be explained. Structural analysis is performedin the FEM-software Abaqus. Details on the set up of the FE-model, elements used, boundaryconditions applied and load cases considered are found in Section 4.3.5.
5.1.6.1 Design of Hull Plating Sandwich
In this section, the process of designing the sandwich for the hull plating is described. Designof the sandwich include determining core thickness and design of the skin laminates.
To begin, the core thickness is determined. This is done by choosing an arbitrary layup sequencefor the skin laminates. It is not of great importance which layup is chosen at this stage, onlythat it is a reasonable layup and that it is held constant while the core thickness is varied.In this case, the following layup sequence for the sandwich was chosen, where x is the corethickness to be varied. See Section 4.3.5.1 for details on layup notation.
[−60 60 c0x]S
60
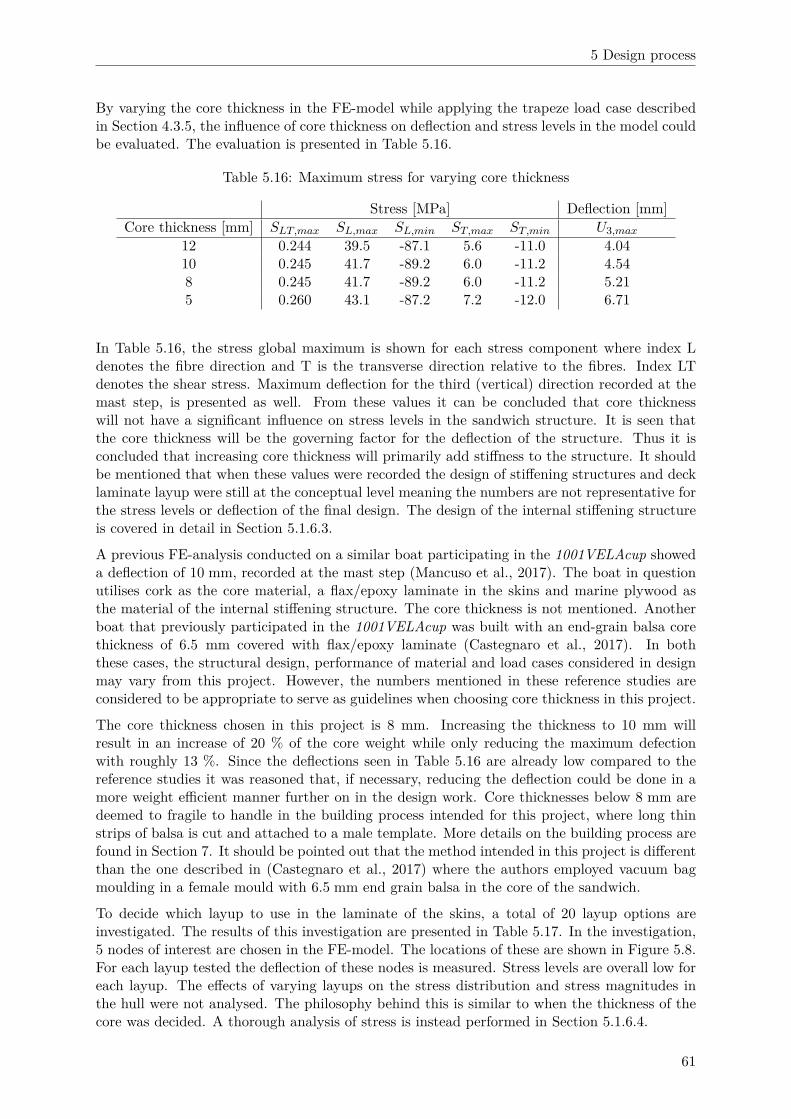
5 Design process
By varying the core thickness in the FE-model while applying the trapeze load case describedin Section 4.3.5, the influence of core thickness on deflection and stress levels in the model couldbe evaluated. The evaluation is presented in Table 5.16.
Table 5.16: Maximum stress for varying core thickness
Stress [MPa] Deflection [mm]
Core thickness [mm] SLT,max SL,max SL,min ST,max ST,min U3,max
12 0.244 39.5 -87.1 5.6 -11.0 4.0410 0.245 41.7 -89.2 6.0 -11.2 4.548 0.245 41.7 -89.2 6.0 -11.2 5.215 0.260 43.1 -87.2 7.2 -12.0 6.71
In Table 5.16, the stress global maximum is shown for each stress component where index Ldenotes the fibre direction and T is the transverse direction relative to the fibres. Index LTdenotes the shear stress. Maximum deflection for the third (vertical) direction recorded at themast step, is presented as well. From these values it can be concluded that core thicknesswill not have a significant influence on stress levels in the sandwich structure. It is seen thatthe core thickness will be the governing factor for the deflection of the structure. Thus it isconcluded that increasing core thickness will primarily add stiffness to the structure. It shouldbe mentioned that when these values were recorded the design of stiffening structures and decklaminate layup were still at the conceptual level meaning the numbers are not representative forthe stress levels or deflection of the final design. The design of the internal stiffening structureis covered in detail in Section 5.1.6.3.
A previous FE-analysis conducted on a similar boat participating in the 1001VELAcup showeda deflection of 10 mm, recorded at the mast step (Mancuso et al., 2017). The boat in questionutilises cork as the core material, a flax/epoxy laminate in the skins and marine plywood asthe material of the internal stiffening structure. The core thickness is not mentioned. Anotherboat that previously participated in the 1001VELAcup was built with an end-grain balsa corethickness of 6.5 mm covered with flax/epoxy laminate (Castegnaro et al., 2017). In boththese cases, the structural design, performance of material and load cases considered in designmay vary from this project. However, the numbers mentioned in these reference studies areconsidered to be appropriate to serve as guidelines when choosing core thickness in this project.
The core thickness chosen in this project is 8 mm. Increasing the thickness to 10 mm willresult in an increase of 20 % of the core weight while only reducing the maximum defectionwith roughly 13 %. Since the deflections seen in Table 5.16 are already low compared to thereference studies it was reasoned that, if necessary, reducing the deflection could be done in amore weight efficient manner further on in the design work. Core thicknesses below 8 mm aredeemed to fragile to handle in the building process intended for this project, where long thinstrips of balsa is cut and attached to a male template. More details on the building process arefound in Section 7. It should be pointed out that the method intended in this project is differentthan the one described in (Castegnaro et al., 2017) where the authors employed vacuum bagmoulding in a female mould with 6.5 mm end grain balsa in the core of the sandwich.
To decide which layup to use in the laminate of the skins, a total of 20 layup options areinvestigated. The results of this investigation are presented in Table 5.17. In the investigation,5 nodes of interest are chosen in the FE-model. The locations of these are shown in Figure 5.8.For each layup tested the deflection of these nodes is measured. Stress levels are overall low foreach layup. The effects of varying layups on the stress distribution and stress magnitudes inthe hull were not analysed. The philosophy behind this is similar to when the thickness of thecore was decided. A thorough analysis of stress is instead performed in Section 5.1.6.4.
61
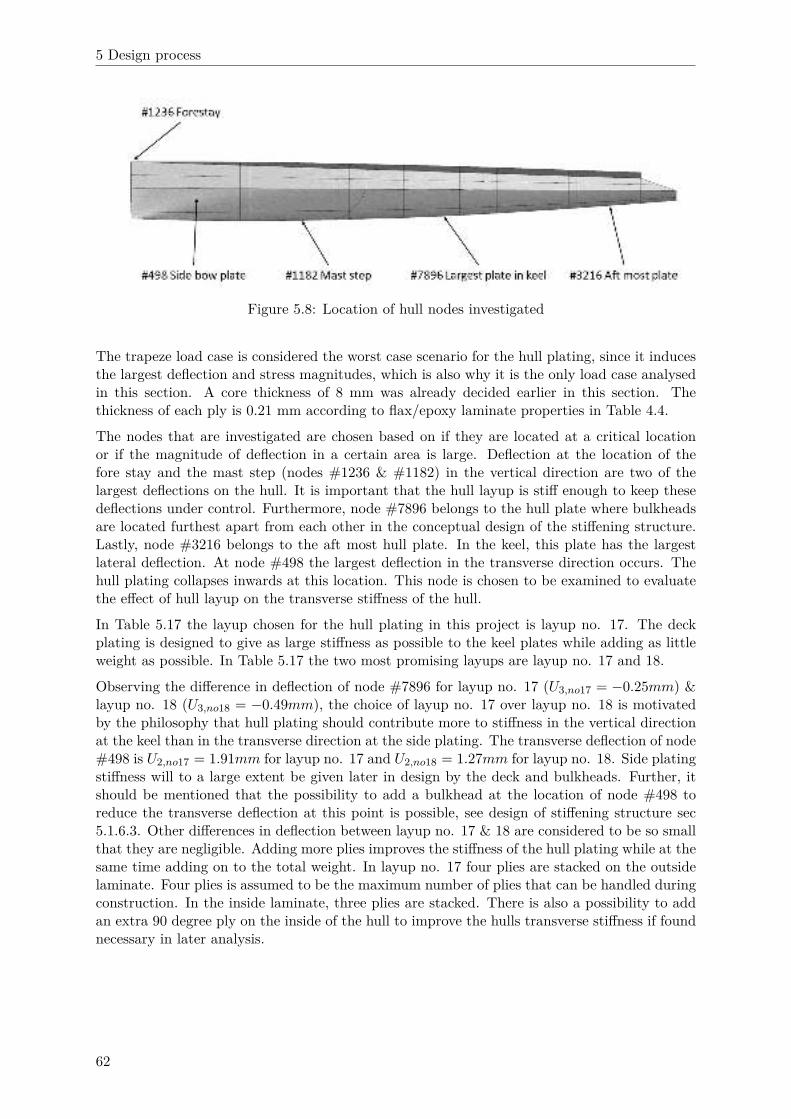
5 Design process
Figure 5.8: Location of hull nodes investigated
The trapeze load case is considered the worst case scenario for the hull plating, since it inducesthe largest deflection and stress magnitudes, which is also why it is the only load case analysedin this section. A core thickness of 8 mm was already decided earlier in this section. Thethickness of each ply is 0.21 mm according to flax/epoxy laminate properties in Table 4.4.
The nodes that are investigated are chosen based on if they are located at a critical locationor if the magnitude of deflection in a certain area is large. Deflection at the location of thefore stay and the mast step (nodes #1236 & #1182) in the vertical direction are two of thelargest deflections on the hull. It is important that the hull layup is stiff enough to keep thesedeflections under control. Furthermore, node #7896 belongs to the hull plate where bulkheadsare located furthest apart from each other in the conceptual design of the stiffening structure.Lastly, node #3216 belongs to the aft most hull plate. In the keel, this plate has the largestlateral deflection. At node #498 the largest deflection in the transverse direction occurs. Thehull plating collapses inwards at this location. This node is chosen to be examined to evaluatethe effect of hull layup on the transverse stiffness of the hull.
In Table 5.17 the layup chosen for the hull plating in this project is layup no. 17. The deckplating is designed to give as large stiffness as possible to the keel plates while adding as littleweight as possible. In Table 5.17 the two most promising layups are layup no. 17 and 18.
Observing the difference in deflection of node #7896 for layup no. 17 (U3,no17 = −0.25mm) &layup no. 18 (U3,no18 = −0.49mm), the choice of layup no. 17 over layup no. 18 is motivatedby the philosophy that hull plating should contribute more to stiffness in the vertical directionat the keel than in the transverse direction at the side plating. The transverse deflection of node#498 is U2,no17 = 1.91mm for layup no. 17 and U2,no18 = 1.27mm for layup no. 18. Side platingstiffness will to a large extent be given later in design by the deck and bulkheads. Further, itshould be mentioned that the possibility to add a bulkhead at the location of node #498 toreduce the transverse deflection at this point is possible, see design of stiffening structure sec5.1.6.3. Other differences in deflection between layup no. 17 & 18 are considered to be so smallthat they are negligible. Adding more plies improves the stiffness of the hull plating while at thesame time adding on to the total weight. In layup no. 17 four plies are stacked on the outsidelaminate. Four plies is assumed to be the maximum number of plies that can be handled duringconstruction. In the inside laminate, three plies are stacked. There is also a possibility to addan extra 90 degree ply on the inside of the hull to improve the hulls transverse stiffness if foundnecessary in later analysis.
62
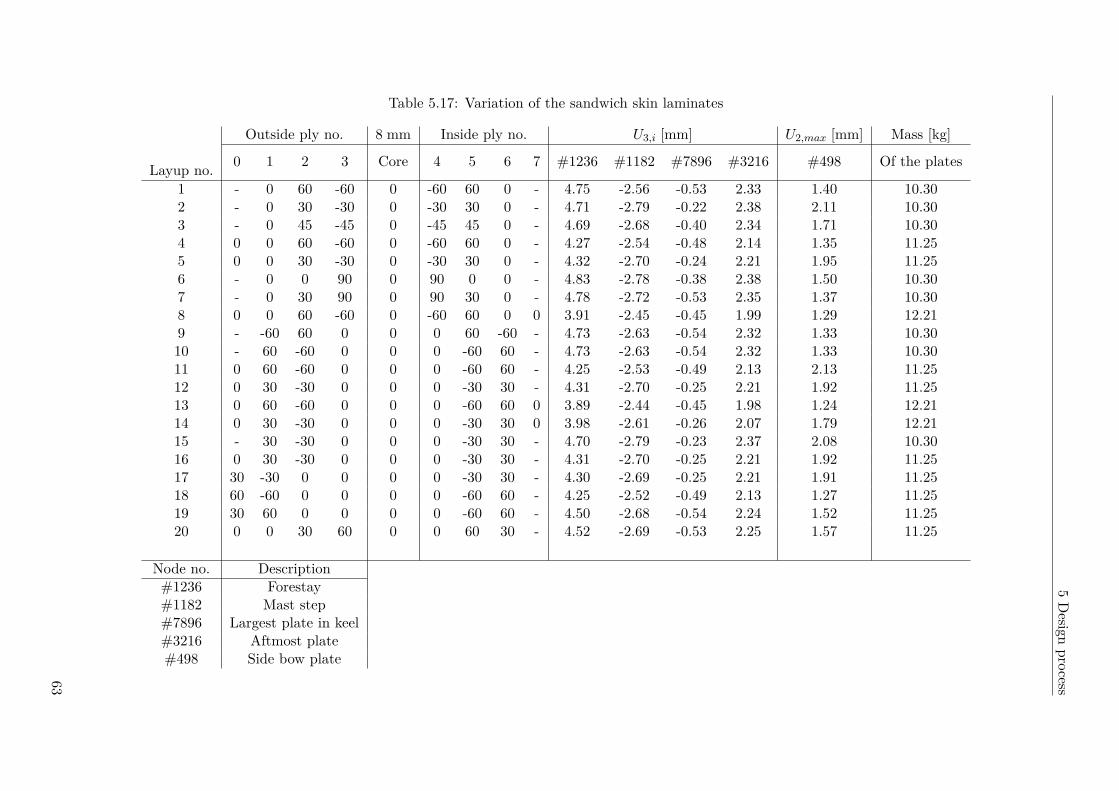
5D
esignpro
cess
Table 5.17: Variation of the sandwich skin laminates
Outside ply no. 8 mm Inside ply no. U3,i [mm] U2,max [mm] Mass [kg]
0 1 2 3 Core 4 5 6 7 #1236 #1182 #7896 #3216 #498 Of the platesLayup no.
1 - 0 60 -60 0 -60 60 0 - 4.75 -2.56 -0.53 2.33 1.40 10.302 - 0 30 -30 0 -30 30 0 - 4.71 -2.79 -0.22 2.38 2.11 10.303 - 0 45 -45 0 -45 45 0 - 4.69 -2.68 -0.40 2.34 1.71 10.304 0 0 60 -60 0 -60 60 0 - 4.27 -2.54 -0.48 2.14 1.35 11.255 0 0 30 -30 0 -30 30 0 - 4.32 -2.70 -0.24 2.21 1.95 11.256 - 0 0 90 0 90 0 0 - 4.83 -2.78 -0.38 2.38 1.50 10.307 - 0 30 90 0 90 30 0 - 4.78 -2.72 -0.53 2.35 1.37 10.308 0 0 60 -60 0 -60 60 0 0 3.91 -2.45 -0.45 1.99 1.29 12.219 - -60 60 0 0 0 60 -60 - 4.73 -2.63 -0.54 2.32 1.33 10.3010 - 60 -60 0 0 0 -60 60 - 4.73 -2.63 -0.54 2.32 1.33 10.3011 0 60 -60 0 0 0 -60 60 - 4.25 -2.53 -0.49 2.13 2.13 11.2512 0 30 -30 0 0 0 -30 30 - 4.31 -2.70 -0.25 2.21 1.92 11.2513 0 60 -60 0 0 0 -60 60 0 3.89 -2.44 -0.45 1.98 1.24 12.2114 0 30 -30 0 0 0 -30 30 0 3.98 -2.61 -0.26 2.07 1.79 12.2115 - 30 -30 0 0 0 -30 30 - 4.70 -2.79 -0.23 2.37 2.08 10.3016 0 30 -30 0 0 0 -30 30 - 4.31 -2.70 -0.25 2.21 1.92 11.2517 30 -30 0 0 0 0 -30 30 - 4.30 -2.69 -0.25 2.21 1.91 11.2518 60 -60 0 0 0 0 -60 60 - 4.25 -2.52 -0.49 2.13 1.27 11.2519 30 60 0 0 0 0 -60 60 - 4.50 -2.68 -0.54 2.24 1.52 11.2520 0 0 30 60 0 0 60 30 - 4.52 -2.69 -0.53 2.25 1.57 11.25
Node no. Description#1236 Forestay#1182 Mast step#7896 Largest plate in keel#3216 Aftmost plate#498 Side bow plate
63

5 Design process
5.1.6.2 Design of Deck Sandwich
Design of the deck sandwich is performed in a similar manner as the design of the hull platingsandwich, only in this process the core thickness is varied together with with skin laminates,why the procedure for the deck is different from the procedure for the hull is explained in Section5.1.6.5. In Tables 5.18 to 5.20, the variation of the core thickness and laminate layups can beseen. In Figure 5.9, the locations of deck nodes investigated are shown. Again, nodes at thelocation of the mast step (#6309) and forestay (#1236) are chosen since these are two criticallocations with large deflections. Node #13108 is located at the midpoint of the largest plate inthe deck, enough stiffness in the vertical direction (3rd direction) is required here to allow forcrew members to operate on the deck without structural failure. The main sheet is predictedin this design stage to be located somewhere around node #15769. The large load from themain sheet will require high stiffness in this area. Node #2341 where the shroud placementis predicted, belongs to the largest deflection in the transverse direction (2nd direction). Thisnode is chosen to evaluate the decks transverse stiffness.
Figure 5.9: Location of deck nodes investigated
In this project layup no. 3 in Table 5.18 is chosen. This means that a core thickness of 8mm in the core of the deck is used. The gain in stiffness with core thicknesses above 8 mm isconsidered too small in relation to the weight added to viable. Decreasing the core thicknessfrom 8 mm is not considered, since 8 mm is the minimum thickness assumed to be manageableduring construction. A maximum of four plies in each laminate is considered, for the samereason.
The deck is subjected to the largest risk for concentrated chock loads, such as tools beingdropped on the deck, during rigging. Four plies are placed in the outside laminate to provideas much protection against concentrated shock loads as possible. On the inside laminate threeplies are stacked (layer 5,6 and 7) and the eighth layer is reserved if it is found in later designwork that additional plies are needed. Also a fifth layer on the outside is reserved for this reason.It should be noted that if a fifth layer on the outside is added it could reduce the possibility tolaminate the deck properly, since as already stated four layers are assumed to be the maximummanageable amount of layers during lamination.
64

5D
esignpro
cess
Table 5.18: Deck layup analysis with 8 mm core thickness
Outside 8 mm Inside U3,i mm U2,max mm Mass [kg]
0 1 2 3 4 Core 5 6 7 8 #1236 #6309 #13108 #15769 #2341 Of deckNo
1 - - 45 -45 0 0 0 -45 45 - 4.55 -2.71 -1.88 2.08 -0.38 6.102 - - 90 0 0 0 0 0 90 - 4.34 -2.68 -1.91 2.00 -0.31 6.103 - 90 0 0 0 0 0 0 90 - 4.17 -2.61 -1.83 1.92 -0.31 6.664 - 90 90 0 0 0 0 0 90 - 4.30 -2.62 -1.87 1.94 -0.31 6.665 - - 90 45 0 0 0 -45 90 - 4.60 -2.70 -1.93 2.05 -0.32 6.106 - - 60 -60 0 0 0 -60 60 - 4.67 -2.71 -1.93 2.08 -0.34 6.107 - - 30 -30 0 0 0 -30 30 - 4.34 -2.73 -1.84 2.05 -0.39 6.108 - - 45 -45 0 90 0 -45 45 - 4.78 -2.75 -1.94 2.15 -0.36 6.109 - - 90 0 0 90 0 0 90 - 4.53 -2.71 -1.97 2.07 -0.31 6.1010 - - 90 45 0 90 0 -45 90 - 4.91 -2.77 -2.02 2.17 -0.31 6.1011 - - 60 -60 0 90 0 -60 60 - 5.00 -2.78 -2.03 2.21 -0.34 6.1012 - - 30 -30 0 90 0 -30 30 - 4.46 -2.72 -1.87 2.06 -0.36 6.10
Node no. Description#1236 Forestay#6309 Mast step#13108 Crew step area#15769 Main sheet#2341 Shroud
65

5D
esignpro
cess
Table 5.19: Deck layup analysis with 10 mm core thickness
Outside 10 mm Inside U3,i mm U2,max mm Mass [kg]
0 1 2 3 4 Core 5 6 7 8 #1236 #6309 #13108 #15769 #2341 Of deckNo
13 - - 45 -45 0 0 0 -45 45 - 4.50 -2.66 -1.84 2.04 -0.37 6.7714 - - 90 0 0 0 0 0 90 - 4.30 -2.63 -1.87 1.97 -0.30 6.7715 - 90 0 0 0 0 0 0 90 - 4.14 -2.56 -1.79 1.89 -0.30 7.3416 - 90 90 0 0 0 0 0 90 - 4.27 -2.57 -1.83 1.91 -0.30 7.3417 - - 90 45 0 0 0 -45 90 - 4.56 -2.65 -1.89 2.01 -0.31 6.7718 - - 60 -60 0 0 0 -60 60 - 4.61 -2.65 -1.89 2.04 -0.33 6.7719 - - 30 -30 0 0 0 -30 30 - 4.30 -2.68 -1.80 2.02 -0.38 6.7720 - - 45 -45 0 90 0 -45 45 - 4.78 -2.70 -1.92 2.12 -0.35 6.7721 - - 90 0 0 90 0 0 90 - 4.54 -2.66 -1.94 2.04 -0.30 6.7722 - - 90 45 0 90 0 -45 90 - 4.92 -2.72 -2.00 2.15 -0.30 6.7723 - - 60 -60 0 90 0 -60 60 - 5.01 -2.72 -2.01 2.18 -0.32 6.7724 - - 30 -30 0 90 0 -30 30 - 4.46 -2.72 -1.84 2.03 -0.35 6.77
Node no. Description#1236 Forestay#6309 Mast step#13108 Crew step area#15769 Main sheet#2341 Shroud
66

5D
esignpro
cess
Table 5.20: Deck layup analysis with 12 mm core thickness
Outside 12 mm Inside U3,i mm U2,max mm Mass [kg]
0 1 2 3 4 Core 5 6 7 8 #1236 #6309 #13108 #15769 #2341 Of deckNo
25 - - 45 -45 0 0 0 -45 45 - 4.45 -2.61 -1.80 2.01 -0.36 7.4526 - - 90 0 0 0 0 0 90 - 4.27 -2.57 -1.82 1.94 -0.30 7.4527 - 90 0 0 0 0 0 0 90 - 4.12 -2.51 -1.75 1.87 -0.29 8.0228 - 90 90 0 0 0 0 0 90 - 4.23 -2.52 -1.78 1.88 -0.29 8.0229 - - 90 45 0 0 0 -45 90 - 4.51 -2.60 -1.85 1.98 -0.30 7.4530 - - 60 -60 0 0 0 -60 60 - 4.56 -2.60 -1.85 2.01 -0.32 7.4531 - - 30 -30 0 0 0 -30 30 - 4.27 -2.63 -1.77 2.00 -0.37 7.4532 - - 45 -45 0 90 0 -45 45 - 4.78 -2.65 -1.90 2.09 -0.34 7.4533 - - 90 0 0 90 0 0 90 - 4.54 -2.61 -1.91 2.02 -0.29 7.4534 - - 90 45 0 90 0 -45 90 - 4.93 -2.67 -1.98 2.13 -0.29 7.4535 - - 60 -60 0 90 0 -60 60 - 5.02 -2.67 -1.99 2.16 -0.31 7.4536 - - 30 -30 0 90 0 -30 30 - 4.46 -2.61 -1.82 2.00 -0.34 7.45
Node no. Description#1236 Forestay#6309 Mast step#13108 Crew step area#15769 Main sheet#2341 Shroud
67
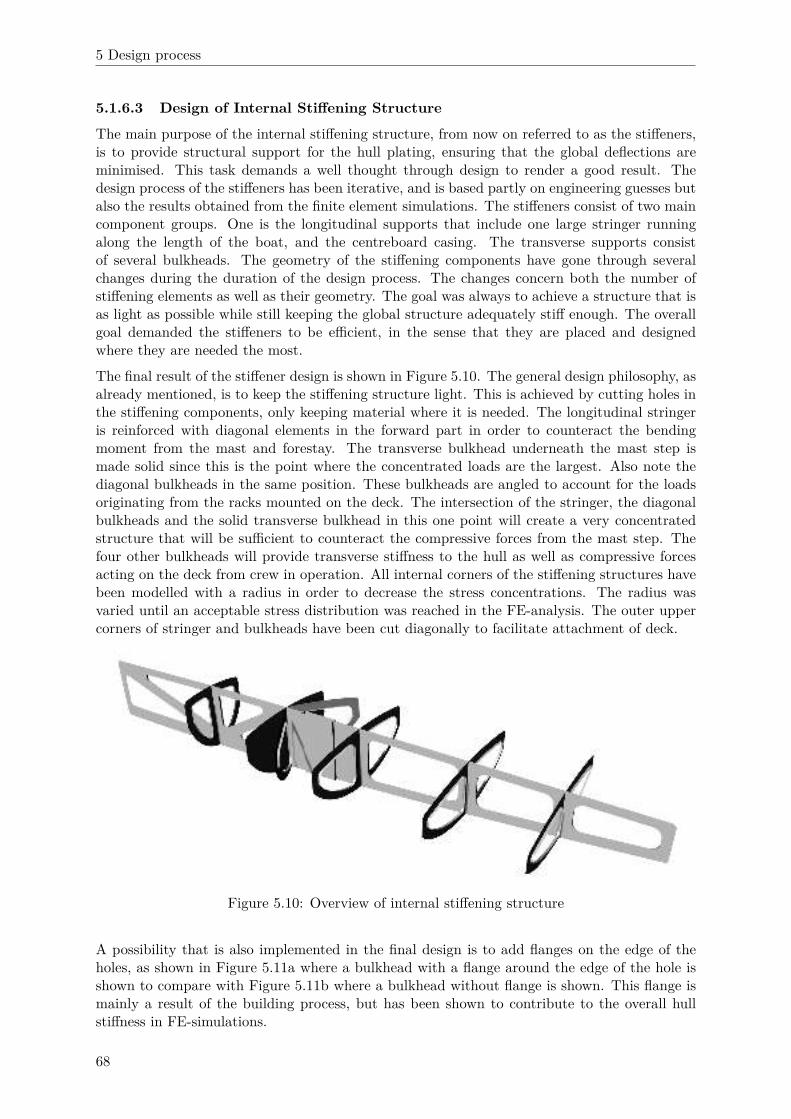
5 Design process
5.1.6.3 Design of Internal Stiffening Structure
The main purpose of the internal stiffening structure, from now on referred to as the stiffeners,is to provide structural support for the hull plating, ensuring that the global deflections areminimised. This task demands a well thought through design to render a good result. Thedesign process of the stiffeners has been iterative, and is based partly on engineering guesses butalso the results obtained from the finite element simulations. The stiffeners consist of two maincomponent groups. One is the longitudinal supports that include one large stringer runningalong the length of the boat, and the centreboard casing. The transverse supports consistof several bulkheads. The geometry of the stiffening components have gone through severalchanges during the duration of the design process. The changes concern both the number ofstiffening elements as well as their geometry. The goal was always to achieve a structure that isas light as possible while still keeping the global structure adequately stiff enough. The overallgoal demanded the stiffeners to be efficient, in the sense that they are placed and designedwhere they are needed the most.
The final result of the stiffener design is shown in Figure 5.10. The general design philosophy, asalready mentioned, is to keep the stiffening structure light. This is achieved by cutting holes inthe stiffening components, only keeping material where it is needed. The longitudinal stringeris reinforced with diagonal elements in the forward part in order to counteract the bendingmoment from the mast and forestay. The transverse bulkhead underneath the mast step ismade solid since this is the point where the concentrated loads are the largest. Also note thediagonal bulkheads in the same position. These bulkheads are angled to account for the loadsoriginating from the racks mounted on the deck. The intersection of the stringer, the diagonalbulkheads and the solid transverse bulkhead in this one point will create a very concentratedstructure that will be sufficient to counteract the compressive forces from the mast step. Thefour other bulkheads will provide transverse stiffness to the hull as well as compressive forcesacting on the deck from crew in operation. All internal corners of the stiffening structures havebeen modelled with a radius in order to decrease the stress concentrations. The radius wasvaried until an acceptable stress distribution was reached in the FE-analysis. The outer uppercorners of stringer and bulkheads have been cut diagonally to facilitate attachment of deck.
Figure 5.10: Overview of internal stiffening structure
A possibility that is also implemented in the final design is to add flanges on the edge of theholes, as shown in Figure 5.11a where a bulkhead with a flange around the edge of the hole isshown to compare with Figure 5.11b where a bulkhead without flange is shown. This flange ismainly a result of the building process, but has been shown to contribute to the overall hullstiffness in FE-simulations.
68
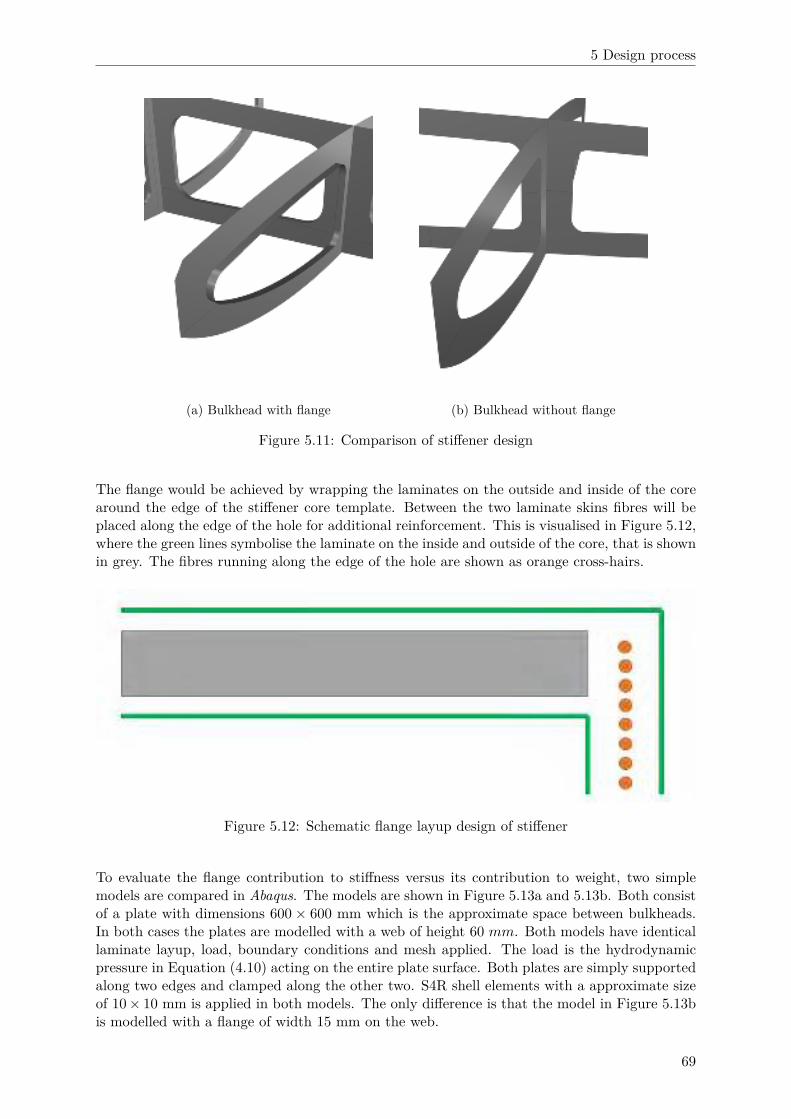
5 Design process
(a) Bulkhead with flange (b) Bulkhead without flange
Figure 5.11: Comparison of stiffener design
The flange would be achieved by wrapping the laminates on the outside and inside of the corearound the edge of the stiffener core template. Between the two laminate skins fibres will beplaced along the edge of the hole for additional reinforcement. This is visualised in Figure 5.12,where the green lines symbolise the laminate on the inside and outside of the core, that is shownin grey. The fibres running along the edge of the hole are shown as orange cross-hairs.
Figure 5.12: Schematic flange layup design of stiffener
To evaluate the flange contribution to stiffness versus its contribution to weight, two simplemodels are compared in Abaqus. The models are shown in Figure 5.13a and 5.13b. Both consistof a plate with dimensions 600 × 600 mm which is the approximate space between bulkheads.In both cases the plates are modelled with a web of height 60 mm. Both models have identicallaminate layup, load, boundary conditions and mesh applied. The load is the hydrodynamicpressure in Equation (4.10) acting on the entire plate surface. Both plates are simply supportedalong two edges and clamped along the other two. S4R shell elements with a approximate sizeof 10 × 10 mm is applied in both models. The only difference is that the model in Figure 5.13bis modelled with a flange of width 15 mm on the web.
69

5 Design process
(a) Without flange (b) With flange
Figure 5.13: Comparison of model designs
The layup of the plates is layup no. 17 in Table 5.17. The web is modelled with the followinglayup, where 0◦ corresponds to the long edge of the web.
[45 − 45 90 c908]S
c908 indicates that the fibres of the core are parallel to the short edge of the web and that ithas the thickness 8 mm. In Figure 5.13b, again with the long edge of the web as a reference.The flange is modelled with the following laminate layup.
[45 − 45 90 0]S
The first three plies are extensions of the web laminates and the fourth is the fibres that aresupposed to give the flange its stiffness. The deflection plots in Figures 5.14a and 5.14b areachieved with FE-simulation.
(a) Without flange (b) With flange
Figure 5.14: Comparison of model deflection
In Table 5.21 below, deflection and mass data are compared between the two models.
Table 5.21: Comparison between models with and without flange.
Maximum deflection [mm] Mass [kg]
U1 U2 U3 mtot
Flange ∼ 0 0.122 0.491 0.71No flange ∼ 0 0.204 0.728 0.70
∆ ∼ 0% 40% 33% -1%
It can be seen that vertical deflection increases with 40 % when the flange is removed and thattransverse deflection is increased with 33 % while the weight only reduces with roughly 1 %. Theflange adds some complexity to the structure and requires extra work in the building process.
70

5 Design process
Still the benefits of adding this laminate flange is considered large enough for the additionalconstruction time to be invested in them. It was decided that the bulkheads and stringers willbe built with a flange along the edges of the holes with a width of around 25 mm. The widthmay vary on some stiffening components since 25 mm of flange width will not fit at all locationsinside the hull.
As for the final layup of the stiffeners, only one was tested at first. The following layup was theone that was analysed.
[45 − 45 0]S
This layup was chosen based on the wish to keep the fibres of at least one ply more or lessperpendicular to the hull surface around the whole circumference of the stiffeners in order tomake use of the fibres’ strength along their length. The layup turned out to give good resultsalready in the first FE-analysis. Since the building process was about to start, no furtherinvestigations were made.
5.1.6.4 Evaluation of Hull Structure Design
When a draft design of hull, deck and internal stiffening structure is established, a final eval-uation of deflection and stress is performed to verify the design. If intolerable levels of stressor deflections are found the design of the internal stiffening structure is changed. This stagemainly concerns increasing radii of corners, slightly modifying the positions of the bulkheadsand other minor geometrical modifications of the internal stiffening structure. The intentionof this process is to systematically improve the design towards lower stress levels and deflec-tion. This stage can be seen as the fine tuning of the design towards its final form. Sincethese changes are many and minor presenting them in a structured way is hard and could causeconfusion. Therefore, this section will focus on how the evaluation of stress and deflection isperformed, rather than the many and minor modifications done to the stiffening structure. InFigure 5.15, the deflection of the hull subjected to the trapeze load case is shown. The largestdeflections occur at the bow due to the force from the forestay, pulling the bow upwards causinga global bending of the hull. The force from the mast compression at the mast step causes largedeflections in this area. This is visualised more clearly in Figure 5.16.
Figure 5.15: Deformations magnified 50:1 for hull-with-trapeze load case
Figure 5.16 shows how the internal stiffening structure deforms under the trapeze load case.The figure clearly shows how the mast step causes the stringer and how (from the bow) 2nd,
71
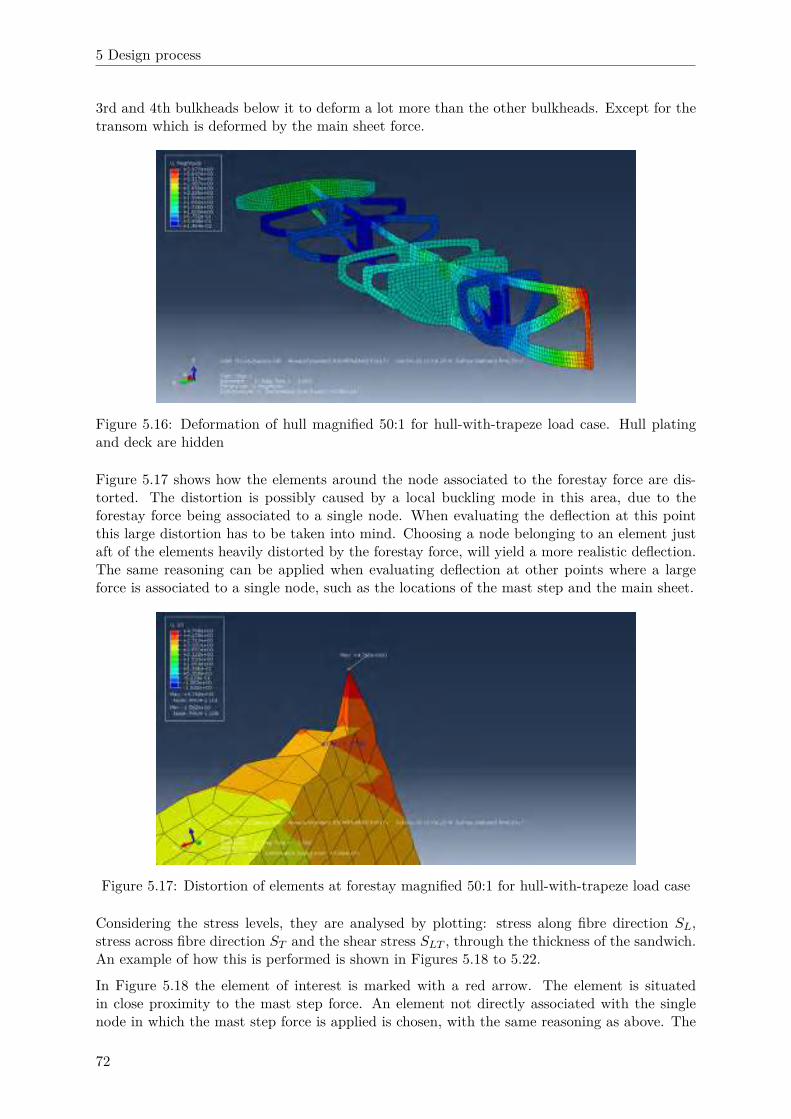
5 Design process
3rd and 4th bulkheads below it to deform a lot more than the other bulkheads. Except for thetransom which is deformed by the main sheet force.
Figure 5.16: Deformation of hull magnified 50:1 for hull-with-trapeze load case. Hull platingand deck are hidden
Figure 5.17 shows how the elements around the node associated to the forestay force are dis-torted. The distortion is possibly caused by a local buckling mode in this area, due to theforestay force being associated to a single node. When evaluating the deflection at this pointthis large distortion has to be taken into mind. Choosing a node belonging to an element justaft of the elements heavily distorted by the forestay force, will yield a more realistic deflection.The same reasoning can be applied when evaluating deflection at other points where a largeforce is associated to a single node, such as the locations of the mast step and the main sheet.
Figure 5.17: Distortion of elements at forestay magnified 50:1 for hull-with-trapeze load case
Considering the stress levels, they are analysed by plotting: stress along fibre direction SL,stress across fibre direction ST and the shear stress SLT , through the thickness of the sandwich.An example of how this is performed is shown in Figures 5.18 to 5.22.
In Figure 5.18 the element of interest is marked with a red arrow. The element is situatedin close proximity to the mast step force. An element not directly associated with the singlenode in which the mast step force is applied is chosen, with the same reasoning as above. The
72
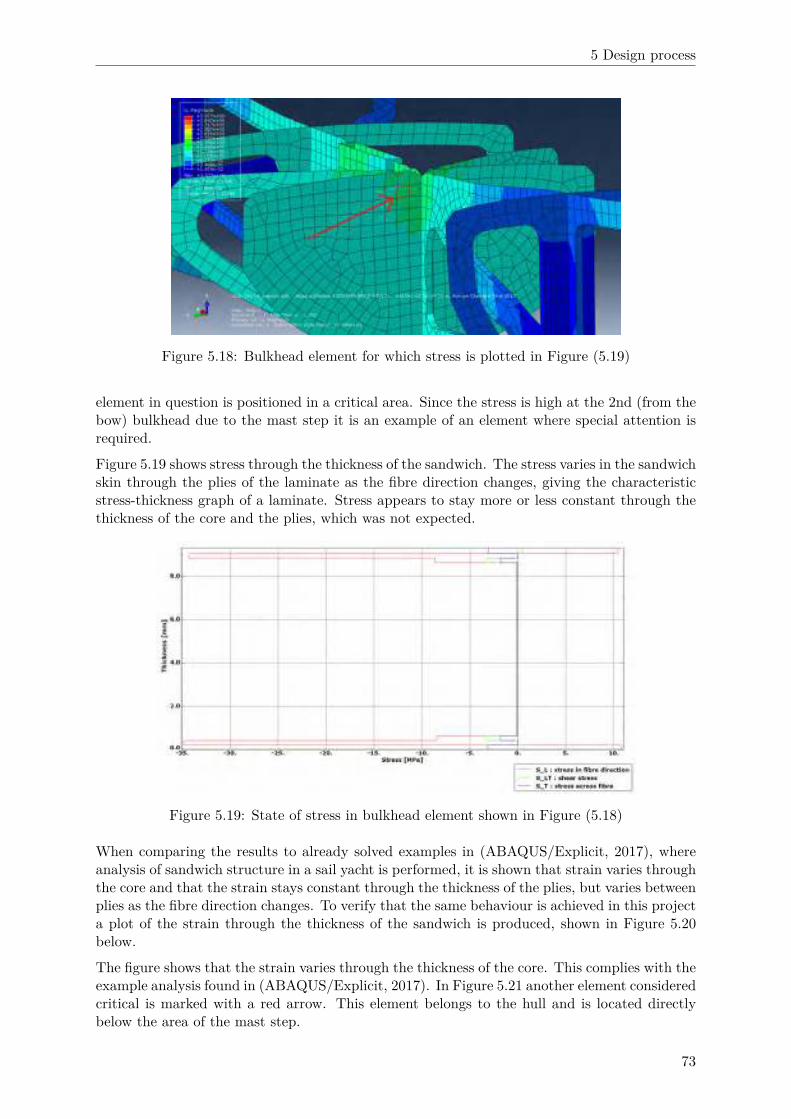
5 Design process
Figure 5.18: Bulkhead element for which stress is plotted in Figure (5.19)
element in question is positioned in a critical area. Since the stress is high at the 2nd (from thebow) bulkhead due to the mast step it is an example of an element where special attention isrequired.
Figure 5.19 shows stress through the thickness of the sandwich. The stress varies in the sandwichskin through the plies of the laminate as the fibre direction changes, giving the characteristicstress-thickness graph of a laminate. Stress appears to stay more or less constant through thethickness of the core and the plies, which was not expected.
Figure 5.19: State of stress in bulkhead element shown in Figure (5.18)
When comparing the results to already solved examples in (ABAQUS/Explicit, 2017), whereanalysis of sandwich structure in a sail yacht is performed, it is shown that strain varies throughthe core and that the strain stays constant through the thickness of the plies, but varies betweenplies as the fibre direction changes. To verify that the same behaviour is achieved in this projecta plot of the strain through the thickness of the sandwich is produced, shown in Figure 5.20below.
The figure shows that the strain varies through the thickness of the core. This complies with theexample analysis found in (ABAQUS/Explicit, 2017). In Figure 5.21 another element consideredcritical is marked with a red arrow. This element belongs to the hull and is located directlybelow the area of the mast step.
73
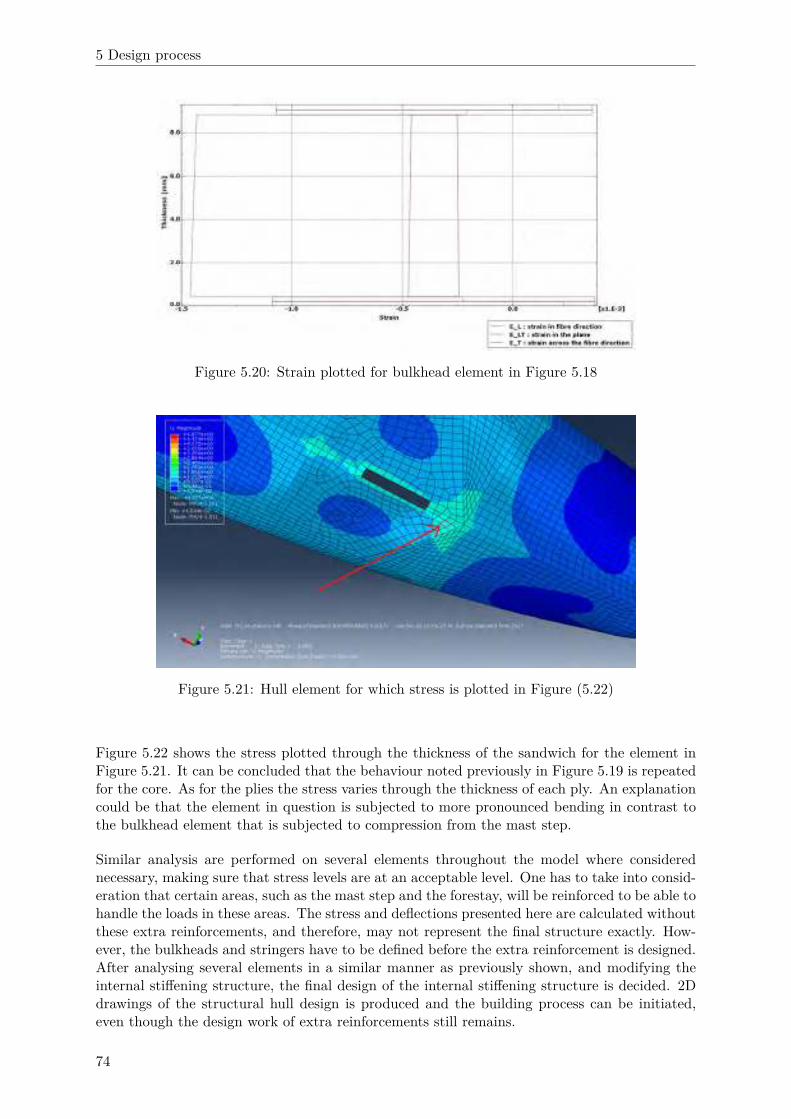
5 Design process
Figure 5.20: Strain plotted for bulkhead element in Figure 5.18
Figure 5.21: Hull element for which stress is plotted in Figure (5.22)
Figure 5.22 shows the stress plotted through the thickness of the sandwich for the element inFigure 5.21. It can be concluded that the behaviour noted previously in Figure 5.19 is repeatedfor the core. As for the plies the stress varies through the thickness of each ply. An explanationcould be that the element in question is subjected to more pronounced bending in contrast tothe bulkhead element that is subjected to compression from the mast step.
Similar analysis are performed on several elements throughout the model where considerednecessary, making sure that stress levels are at an acceptable level. One has to take into consid-eration that certain areas, such as the mast step and the forestay, will be reinforced to be able tohandle the loads in these areas. The stress and deflections presented here are calculated withoutthese extra reinforcements, and therefore, may not represent the final structure exactly. How-ever, the bulkheads and stringers have to be defined before the extra reinforcement is designed.After analysing several elements in a similar manner as previously shown, and modifying theinternal stiffening structure, the final design of the internal stiffening structure is decided. 2Ddrawings of the structural hull design is produced and the building process can be initiated,even though the design work of extra reinforcements still remains.
74
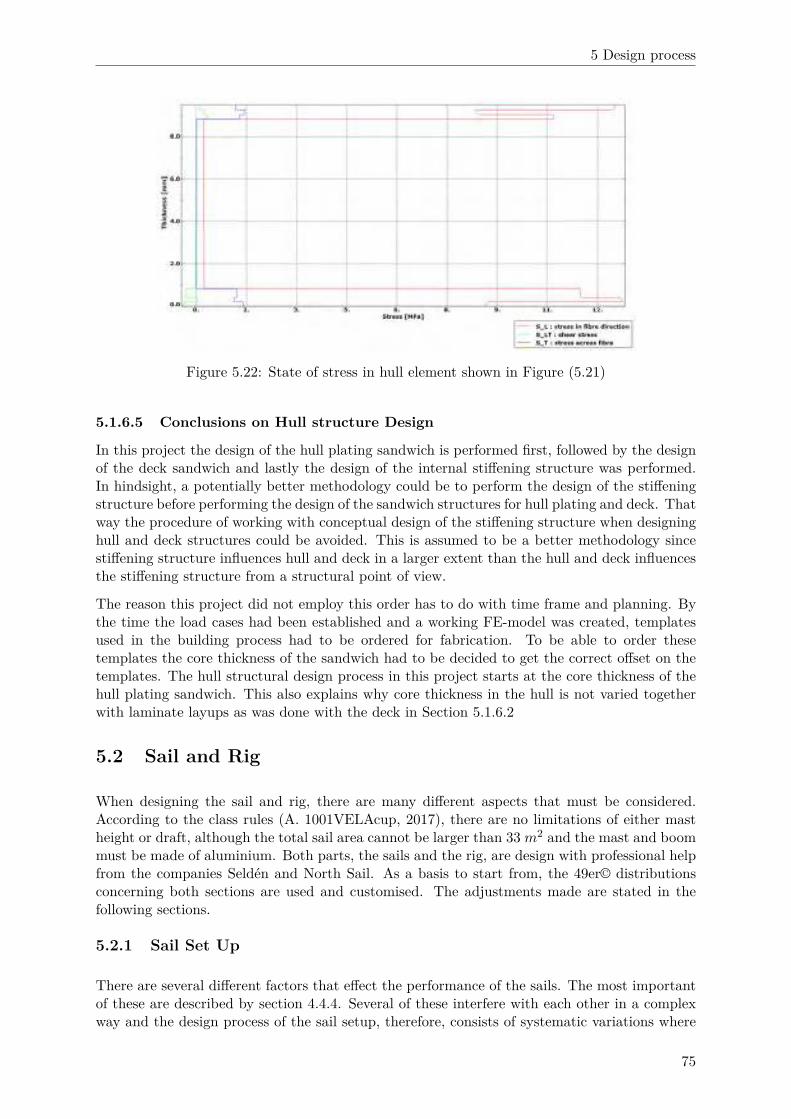
5 Design process
Figure 5.22: State of stress in hull element shown in Figure (5.21)
5.1.6.5 Conclusions on Hull structure Design
In this project the design of the hull plating sandwich is performed first, followed by the designof the deck sandwich and lastly the design of the internal stiffening structure was performed.In hindsight, a potentially better methodology could be to perform the design of the stiffeningstructure before performing the design of the sandwich structures for hull plating and deck. Thatway the procedure of working with conceptual design of the stiffening structure when designinghull and deck structures could be avoided. This is assumed to be a better methodology sincestiffening structure influences hull and deck in a larger extent than the hull and deck influencesthe stiffening structure from a structural point of view.
The reason this project did not employ this order has to do with time frame and planning. Bythe time the load cases had been established and a working FE-model was created, templatesused in the building process had to be ordered for fabrication. To be able to order thesetemplates the core thickness of the sandwich had to be decided to get the correct offset on thetemplates. The hull structural design process in this project starts at the core thickness of thehull plating sandwich. This also explains why core thickness in the hull is not varied togetherwith laminate layups as was done with the deck in Section 5.1.6.2
5.2 Sail and Rig
When designing the sail and rig, there are many different aspects that must be considered.According to the class rules (A. 1001VELAcup, 2017), there are no limitations of either mastheight or draft, although the total sail area cannot be larger than 33 m2 and the mast and boommust be made of aluminium. Both parts, the sails and the rig, are design with professional helpfrom the companies Seldén and North Sail. As a basis to start from, the 49er© distributionsconcerning both sections are used and customised. The adjustments made are stated in thefollowing sections.
5.2.1 Sail Set Up
There are several different factors that effect the performance of the sails. The most importantof these are described by section 4.4.4. Several of these interfere with each other in a complexway and the design process of the sail setup, therefore, consists of systematic variations where
75
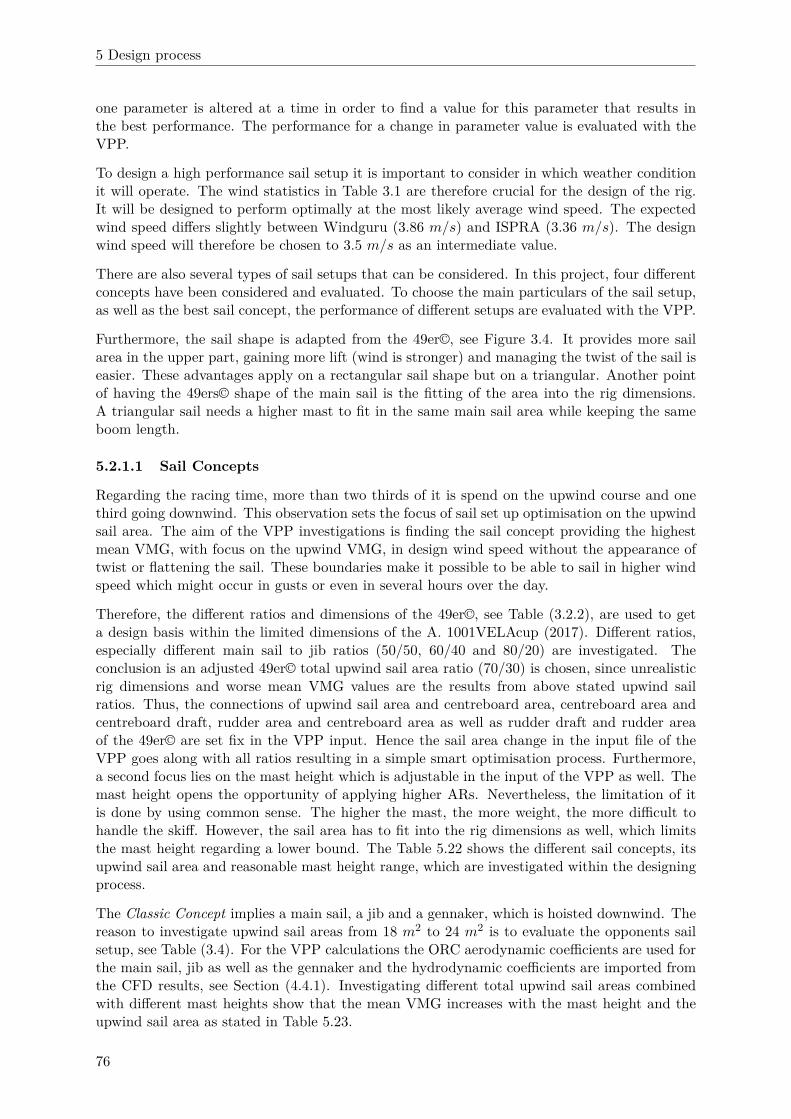
5 Design process
one parameter is altered at a time in order to find a value for this parameter that results inthe best performance. The performance for a change in parameter value is evaluated with theVPP.
To design a high performance sail setup it is important to consider in which weather conditionit will operate. The wind statistics in Table 3.1 are therefore crucial for the design of the rig.It will be designed to perform optimally at the most likely average wind speed. The expectedwind speed differs slightly between Windguru (3.86 m/s) and ISPRA (3.36 m/s). The designwind speed will therefore be chosen to 3.5 m/s as an intermediate value.
There are also several types of sail setups that can be considered. In this project, four differentconcepts have been considered and evaluated. To choose the main particulars of the sail setup,as well as the best sail concept, the performance of different setups are evaluated with the VPP.
Furthermore, the sail shape is adapted from the 49er©, see Figure 3.4. It provides more sailarea in the upper part, gaining more lift (wind is stronger) and managing the twist of the sail iseasier. These advantages apply on a rectangular sail shape but on a triangular. Another pointof having the 49ers© shape of the main sail is the fitting of the area into the rig dimensions.A triangular sail needs a higher mast to fit in the same main sail area while keeping the sameboom length.
5.2.1.1 Sail Concepts
Regarding the racing time, more than two thirds of it is spend on the upwind course and onethird going downwind. This observation sets the focus of sail set up optimisation on the upwindsail area. The aim of the VPP investigations is finding the sail concept providing the highestmean VMG, with focus on the upwind VMG, in design wind speed without the appearance oftwist or flattening the sail. These boundaries make it possible to be able to sail in higher windspeed which might occur in gusts or even in several hours over the day.
Therefore, the different ratios and dimensions of the 49er©, see Table (3.2.2), are used to geta design basis within the limited dimensions of the A. 1001VELAcup (2017). Different ratios,especially different main sail to jib ratios (50/50, 60/40 and 80/20) are investigated. Theconclusion is an adjusted 49er© total upwind sail area ratio (70/30) is chosen, since unrealisticrig dimensions and worse mean VMG values are the results from above stated upwind sailratios. Thus, the connections of upwind sail area and centreboard area, centreboard area andcentreboard draft, rudder area and centreboard area as well as rudder draft and rudder areaof the 49er© are set fix in the VPP input. Hence the sail area change in the input file of theVPP goes along with all ratios resulting in a simple smart optimisation process. Furthermore,a second focus lies on the mast height which is adjustable in the input of the VPP as well. Themast height opens the opportunity of applying higher ARs. Nevertheless, the limitation of itis done by using common sense. The higher the mast, the more weight, the more difficult tohandle the skiff. However, the sail area has to fit into the rig dimensions as well, which limitsthe mast height regarding a lower bound. The Table 5.22 shows the different sail concepts, itsupwind sail area and reasonable mast height range, which are investigated within the designingprocess.
The Classic Concept implies a main sail, a jib and a gennaker, which is hoisted downwind. Thereason to investigate upwind sail areas from 18 m2 to 24 m2 is to evaluate the opponents sailsetup, see Table (3.4). For the VPP calculations the ORC aerodynamic coefficients are used forthe main sail, jib as well as the gennaker and the hydrodynamic coefficients are imported fromthe CFD results, see Section (4.4.1). Investigating different total upwind sail areas combinedwith different mast heights show that the mean VMG increases with the mast height and theupwind sail area as stated in Table 5.23.
76

5 Design process
Table 5.22: Different concepts
Concept Upwind sail area [m2] mast height [m]
Classic 18-24 8-10
Two Sails 33 8-10
Three Sails 33 8-10
Jib 0 18-24 (33) 9,5
The larger the sail area, the higher the lift force resulting in a high driving force which isconnected to a high VMG. Furthermore, the greater the aspect ratio (see Section 4.4.4.2) ofthe sail, the higher the lift force, which ends in an increase of the driving force as well. Theseconnections lead to the investigation of the Two sails Concept with different mast heights. Anupwind sail area of 33 m2 (23 m2 main sail area, 10 m2 jib) is analysed.
The results, described in Table 5.23, in design wind speed show that the produced lift force istoo high to be handled by the righting moment of two sailors. Twist and flattening of the sailsoccur. Also, changing the main sail shape to a triangular by lowering the luff height of the mainsail for 25 % in the input file to reduce the CE or adjusting the mast height for the same reasondoes not result in a competitive VMG without twist or flattening. Reshaping the main sail alsoinvolves an extension of the boom length to still ensure the fitting of the main sail into the rig.
Digging deeper into using the total sail area upwind, investigation of so called ’stay sails’ areperformed. Stay sails are additional small sails between the jib and the main sail. They canenhance the performance of a skiff significantly. The driving force is increased by up to 12, 5 %depending on the AWA (D.J. Le Pelly, 2008). The idea is to use this advantage downwind andtake down the stay sail when going up wind, still keeping a comparably large upwind sail areato handle. For the first VPP analysis of this concept a reasonable small mast height of 8 mis connected to a 14 m2 main sail, 13 m2 jib and 6 m2 stay sail. The calculations of the staysail and the jib use the ORC jib aerodynamic lift and drag coefficient, see Section 4.4.4.1. Theresult, described in the Table 5.23, in design wind speed show a small mean VMG of 2.27 m/sas well as the occurrence of twist and flattening. Besides these facts, taking down the stay sailfor the upwind course turns out to be difficult regarding forestay handling, rig tensions, takingdown system and storage of the sail.
The results, see Table 5.23, show that for the design wind speed the Classic Sail Concept is thebest suitable. In almost all investigated setups neither twist nor flattening occur. The maximumVMG of the Classic Sail Concept is 2.38 m/s at a mast height of 10 m. This value is consideredas competitive compared to the two other concepts. Regarding the twist and flattening of thesail the values are not acceptable. Lowering the mast height to reduce the heeling moment,though results in a non competitive VMG. Analysing the results of the Three Sails Concept
neither the VMG nor the flattening and twist turn out to be competitive values, even with alow mast height of 8 m. Therefore, the Classic Concept is investigated further.
To narrow the sail setup selection down, the mast height of 8 m is crossed out because of thehigh difference in the VMG values. Furthermore, two factors are taken into account: Firstly,the weight of the mast section, and secondly, the highest possible draft of the appendages. Theadjustment of the centreboard draft is done by choosing a higher AR.
AR =(1.4m)2
0.255m2= 7.69.
77
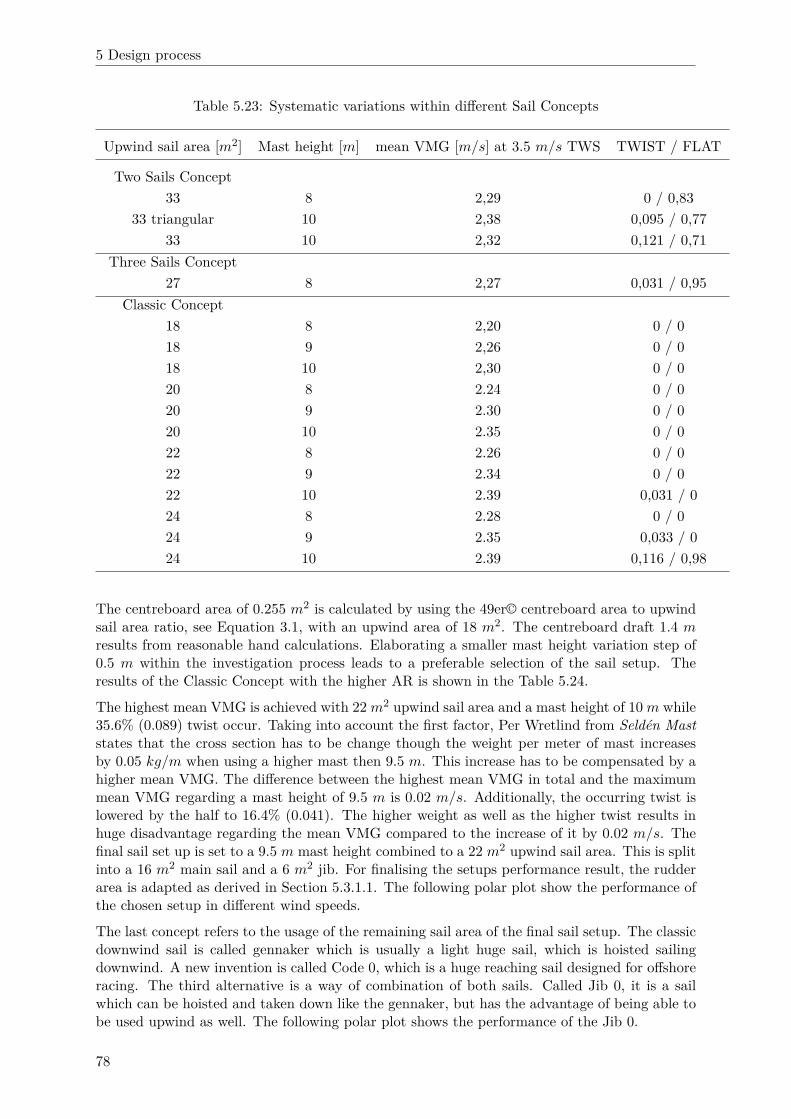
5 Design process
Table 5.23: Systematic variations within different Sail Concepts
Upwind sail area [m2] Mast height [m] mean VMG [m/s] at 3.5 m/s TWS TWIST / FLAT
Two Sails Concept
33 8 2,29 0 / 0,83
33 triangular 10 2,38 0,095 / 0,77
33 10 2,32 0,121 / 0,71
Three Sails Concept
27 8 2,27 0,031 / 0,95
Classic Concept
18 8 2,20 0 / 0
18 9 2,26 0 / 0
18 10 2,30 0 / 0
20 8 2.24 0 / 0
20 9 2.30 0 / 0
20 10 2.35 0 / 0
22 8 2.26 0 / 0
22 9 2.34 0 / 0
22 10 2.39 0,031 / 0
24 8 2.28 0 / 0
24 9 2.35 0,033 / 0
24 10 2.39 0,116 / 0,98
The centreboard area of 0.255 m2 is calculated by using the 49er© centreboard area to upwindsail area ratio, see Equation 3.1, with an upwind area of 18 m2. The centreboard draft 1.4 mresults from reasonable hand calculations. Elaborating a smaller mast height variation step of0.5 m within the investigation process leads to a preferable selection of the sail setup. Theresults of the Classic Concept with the higher AR is shown in the Table 5.24.
The highest mean VMG is achieved with 22 m2 upwind sail area and a mast height of 10 m while35.6% (0.089) twist occur. Taking into account the first factor, Per Wretlind from Seldén Mast
states that the cross section has to be change though the weight per meter of mast increasesby 0.05 kg/m when using a higher mast then 9.5 m. This increase has to be compensated by ahigher mean VMG. The difference between the highest mean VMG in total and the maximummean VMG regarding a mast height of 9.5 m is 0.02 m/s. Additionally, the occurring twist islowered by the half to 16.4% (0.041). The higher weight as well as the higher twist results inhuge disadvantage regarding the mean VMG compared to the increase of it by 0.02 m/s. Thefinal sail set up is set to a 9.5 m mast height combined to a 22 m2 upwind sail area. This is splitinto a 16 m2 main sail and a 6 m2 jib. For finalising the setups performance result, the rudderarea is adapted as derived in Section 5.3.1.1. The following polar plot show the performance ofthe chosen setup in different wind speeds.
The last concept refers to the usage of the remaining sail area of the final sail setup. The classicdownwind sail is called gennaker which is usually a light huge sail, which is hoisted sailingdownwind. A new invention is called Code 0, which is a huge reaching sail designed for offshoreracing. The third alternative is a way of combination of both sails. Called Jib 0, it is a sailwhich can be hoisted and taken down like the gennaker, but has the advantage of being able tobe used upwind as well. The following polar plot shows the performance of the Jib 0.
78

5 Design process
Table 5.24: Systematic variations with an centreboard AR = 7.69
Upwind sail area [m2] Mast height [m] mean VMG at 3.5 m/s TWS TWIST / FLAT
Classic Concept
18 9 2.29 0 / 0
18 9.5 2.31 0 / 0
18 10 2.33 0 / 0
20 9 2.30 0 / 0
20 9.5 2.36 0 / 0
20 10 2.38 0 / 0
22 9 2.36 0 / 0
22 9.5 2.39 0.041 / 0
22 10 2.41 0.089 / 0
24 9 2.36 0.077 / 0.978
24 9.5 2.38 0.103 / 0.956
24 10 2.39 0 / 0
79

5 Design process
0 10
20
30
40
50
60
70
80
90
100
110
120
130
140
150
160
170180
TWA (deg)
0
1
2
3
4
5
6
7B
S (m
/s)
7
1.6442
1.9434
2.2843
2.66652.8558
3.00663.1418
-1.3508-1.5504
-1.8085
-2.1104
-2.5106
-3.0484
-3.5814
22.533.544.55SS1SS2
TWS / Sailset
27-Oct-2017 13:26:39
Figure 5.23: Final sail area and mast height dimensions
80
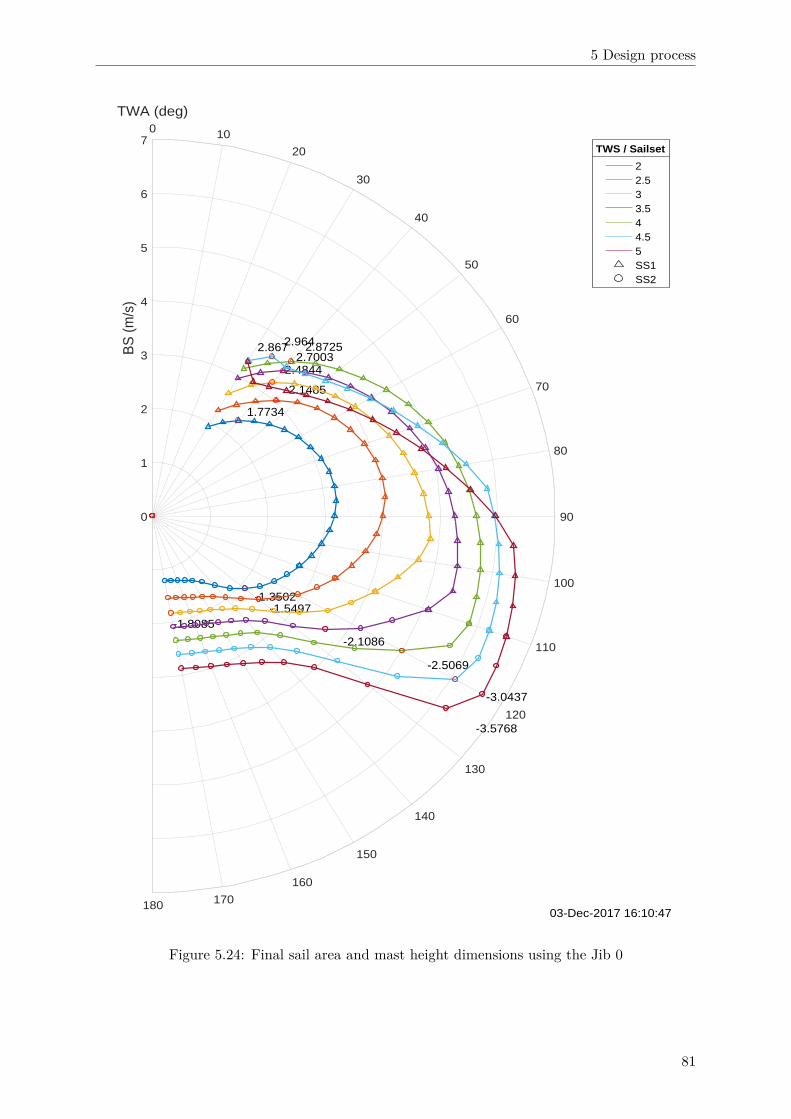
5 Design process
0 10
20
30
40
50
60
70
80
90
100
110
120
130
140
150
160
170180
TWA (deg)
0
1
2
3
4
5
6
7B
S (m
/s)
Formula Sailing VPP V17 22 m2 cb adapted 9,50m AR 7,69 Jib0 Polar Plot
1.7734
2.1485
2.48442.7003
2.87252.9642.867
-1.3502-1.5497
-1.8085
-2.1086
-2.5069
-3.0437
-3.5768
22.533.544.55SS1SS2
TWS / Sailset
03-Dec-2017 16:10:47
Figure 5.24: Final sail area and mast height dimensions using the Jib 0
81
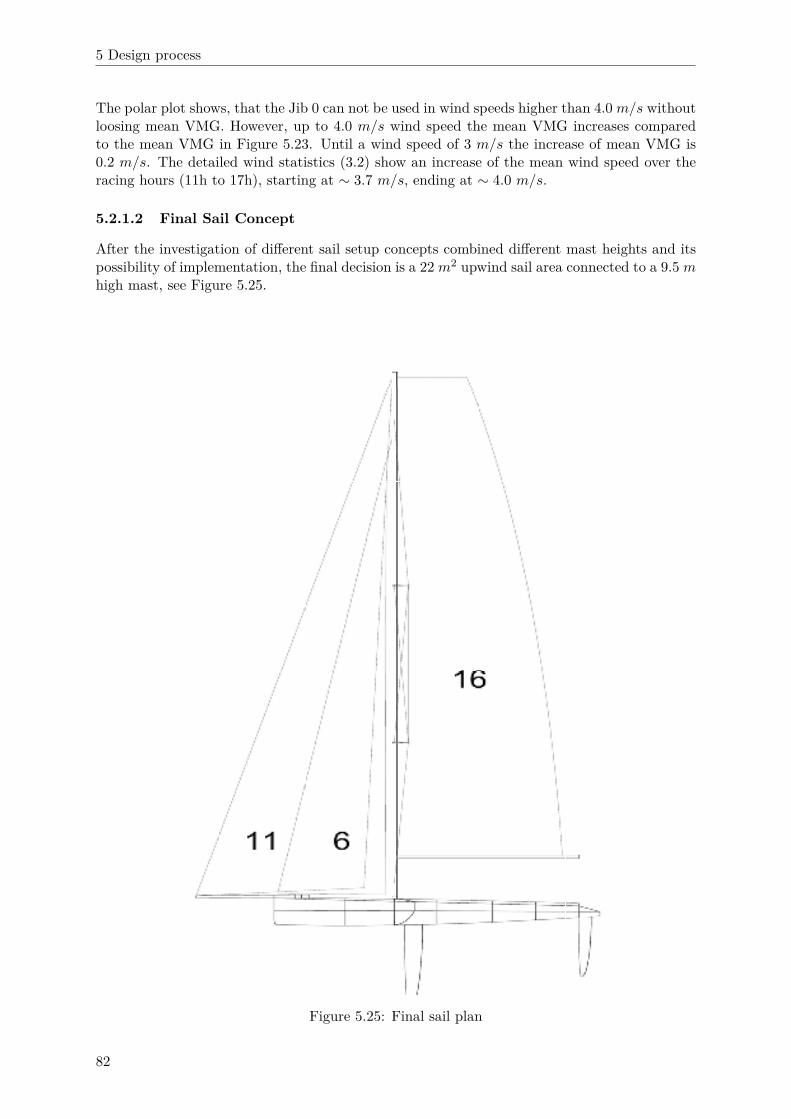
5 Design process
The polar plot shows, that the Jib 0 can not be used in wind speeds higher than 4.0 m/s withoutloosing mean VMG. However, up to 4.0 m/s wind speed the mean VMG increases comparedto the mean VMG in Figure 5.23. Until a wind speed of 3 m/s the increase of mean VMG is0.2 m/s. The detailed wind statistics (3.2) show an increase of the mean wind speed over theracing hours (11h to 17h), starting at ∼ 3.7 m/s, ending at ∼ 4.0 m/s.
5.2.1.2 Final Sail Concept
After the investigation of different sail setup concepts combined different mast heights and itspossibility of implementation, the final decision is a 22 m2 upwind sail area connected to a 9.5 mhigh mast, see Figure 5.25.
Figure 5.25: Final sail plan
82

5 Design process
The sail area is divided into a 16 m2 main sail, a 6 m2 jib and a 11 m2 Jib 0. Regarding thesheeting, the main sail is sheeted on a rail in the aft of the hull, the jib is sheeted on a railshortly in front of the mast and the Jib 0 is sheeted out on the racks extension. The sail shapeis determined by the rig dimensions disregarding the main sail. It is shaped in a rectangularway having as much sail area as possible in the upper part. Furthermore, this shape makes iteasier to twist the main sail.
5.2.2 Rig
The rig of a sailing dinghy is a complex part to design and optimise. This is the reason the R3class rules allow outsourcing the rig design to an external company (A. 1001VELAcup, 2017).For the rig concept of this skiff, the expertise comes from Per Wretlind at Seldén Mast whotakes care of the design.
There are two rig solutions that could be an option for this skiff. One is the traditional rig,similar to the 49er© rig, and the second one is a diamond rig, used mainly on catamarans.These two concepts are based on different ways to handle the loads that the rig will be exposedto. The traditional rig is well used and a lot of the already existing skiffs, which are underlyingthese class rules, have something similar. This also shows that this type of rig works in reality.The diamond rig is not been used for mono hulls as first chose of design. By implementing this,some new ideas are brought into the design of the skiffs for 1001VELAcup.
One feature of the mast, which will be unique, is the mast height. A mast height of 9.5 m ischosen based on the calculations from the VPP, see more information about this decision inSection 5.2.1.1. Since the mast is relatively high and needs to be built in aluminium, there is arisk of a heavy rig construction, as well as a high centre of gravity.
The rig has to take care of the loads that are created from the sails, where mainly the sideforces are important. For this, shrouds and stays are attached between the mast and the hullto make sure that the rig do not break or fall down. Because of this, the shrouds have a forcepulling upwards. This force has its origin in the attachment point of the shrouds, the chainplates. Since the force is pulling upwards and the rig downwards, compression loads will occur.
5.2.2.1 Traditional 49er© rig
The current rig that is used in the 49er© class is a conventional single spreader setup with topmast supporting jumper spreaders, which carries a large main sail on a fixed mast with a boomalong the foot of the main sail. It also carries a smaller head sail, a jib, attached to the forestay.The standing rig is comprised of the mast and boom, which are stabilised in all directions bytwo or four shrouds, a forestay and a backstay. The fore- and backstay serves the purposeof providing the mast with the necessary longitudinal stability, while the shrouds stabilise themast in the transverse direction. The shrouds are usually deflected backwards from the mastusing a set of one or more spreaders in order to provide more longitudinal stability to the mastas well.
By applying this rig design on the skiff the hull needs to be stiffened up due to the compressingloads that is transferred from the rig into the hull. Since these forces will occur and the hullneeds to be stiffened up due to this, some extra weight will be added to the hull.
In the case, where this design is applied on the skiff, the mast will both be heavier and higherthan the 49er’s© mast. The rig will have a weight of about 25 kg, which is approximated fromthe weight of the 49er© rig of carbon fibre, that has a weight of 15 kg. By having both a higherand a heavier mast the skiff will be more unstable. This is something the sailor has to adaptwhen sailing.
83

5 Design process
In this design there is a need to have a kicker that holds the sail down and maintain the correctshape of the sail. With this solution, the mainsheet just needs to change the attacking anglefor the sail. To be able to hold down the boom, a kick is needed. This kicker is placed on topof the boom, why it is called gnav (vang, American word for kick, spelled backwards). Whenhaving this gnav, it needs an extra pair of shrouds that will be placed closed to the height ofthe boom, attached to the mast. This is because the gnav will contribute with bending momentat the mast and there will be a risk of buckling at this point.
The possibility for movement in front of the mast will be limited by having the regular topshrouds to the deck together with the lower shroud. This makes it harder for the sailors tomove in front of the mast, which can be needed in low wind speeds to change the CoG.
This kind of rig is a proven and common solution, being used for the majority of small sailingdinghies. Therefore this is an alternative that is investigated.
5.2.2.2 Diamond Rig
The design of the diamond rig looks as it sounds, the shrouds create a diamond shape aroundthe mast. This rig is also able to carry the main sail as well as a jib and a Jib 0. For themainsail it will have a boom that holds the sail out to get its shape. To stabilise everything,shrouds arranged in a diamond shape around the mast together with at least one pair of shroudout to the deck, will be used. These will make sure that the rig is stable in the transversedirection. For the longitudinal direction it will be stabilised with the help of the forestay, andsome solution to be sure it do not fall forward, like an backstay.
The diamond shaped shrouds around the mast are only attached to the mast and not to thedeck. With this solution, the diamond shrouds will take care of the compression loads thatoccurs from the sail and by that, the hull does not need to be extra stiffened. To achieve thediamond shape, the spreaders will keep the shrouds out. The spreaders will at the same time beswept backwards, which will make the diamond shrouds to contribute to longitudinal stiffnessas well.
The outer shrouds to the deck will partly serve to achieve the longitudinal stiffness, but whenthe sailors are in the trapezes they will instead act as the shrouds that hold the mast straight.In the case the sailors are not in the trapezes the outer shrouds will be the ones that take theload and make sure that the mast will not fall.
To solve the problem with the support in the longitudinal direction, the mainsheet togetherwith the backwards swept shrouds or the trapezes will make sure that the rig does not fallforward. To make sure that the rig will have some kind of longitudinal support, the mainsheetcan not be released too much in the case it needs to change sheeting angle of the sail. To solvethis, the point touching at the hull needs a rail where the sheeting point can be transported on,to be able to change the sheeting angle.
This solution with a rail in the aft makes it possible to sail without having a kick, since thesheet holds the boom down because it is connected to the most outer part of the sail. By this,the mainsheet acts as an backstay, main sheet, and a kicker.
Since the rig is of the type free standing, it allows it to rotate around its own axis. This is afeature that is brought into the design. By doing this the interference between the mast andthe sails is reduced since there is a smoother transition from the mast to the sail. As well asthat the mast section will be in an attack angle against the wind and will contribute with liftforce.
By having the diamond rig, the mast can be seen as an individual truss structure with themast and shrouds. This setup can therefore deliver a mast which can be both lighter and more
84
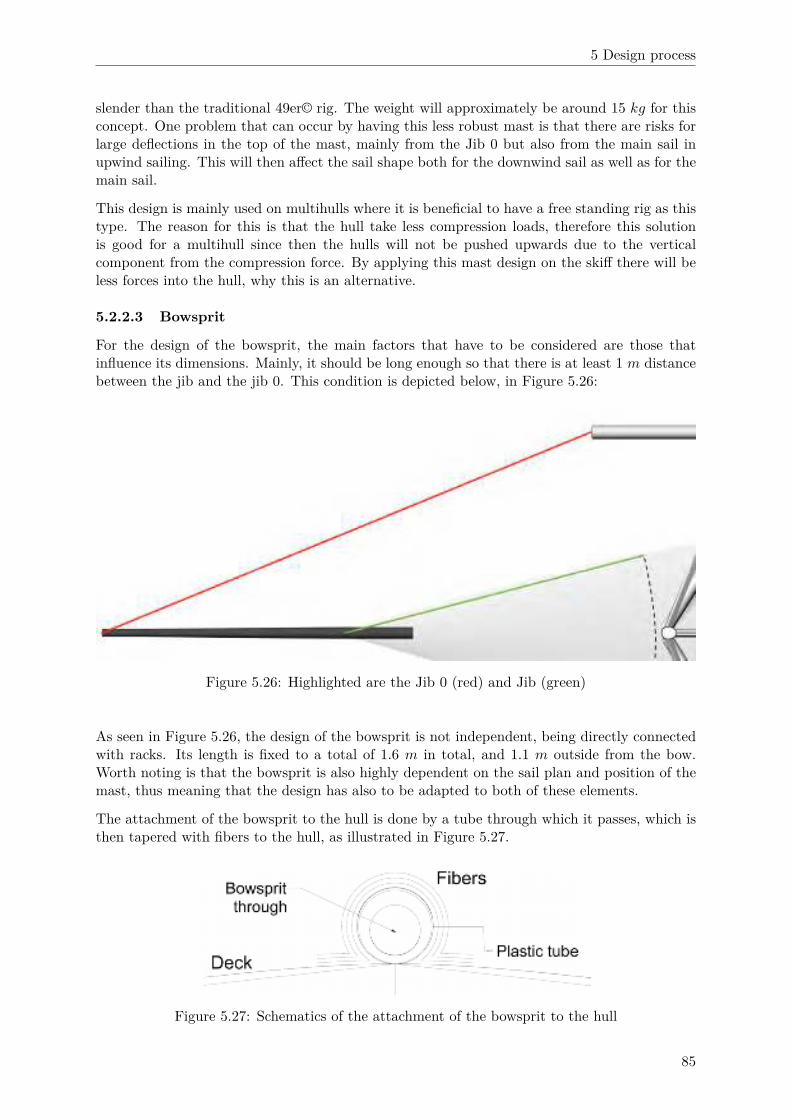
5 Design process
slender than the traditional 49er© rig. The weight will approximately be around 15 kg for thisconcept. One problem that can occur by having this less robust mast is that there are risks forlarge deflections in the top of the mast, mainly from the Jib 0 but also from the main sail inupwind sailing. This will then affect the sail shape both for the downwind sail as well as for themain sail.
This design is mainly used on multihulls where it is beneficial to have a free standing rig as thistype. The reason for this is that the hull take less compression loads, therefore this solutionis good for a multihull since then the hulls will not be pushed upwards due to the verticalcomponent from the compression force. By applying this mast design on the skiff there will beless forces into the hull, why this is an alternative.
5.2.2.3 Bowsprit
For the design of the bowsprit, the main factors that have to be considered are those thatinfluence its dimensions. Mainly, it should be long enough so that there is at least 1 m distancebetween the jib and the jib 0. This condition is depicted below, in Figure 5.26:
Figure 5.26: Highlighted are the Jib 0 (red) and Jib (green)
As seen in Figure 5.26, the design of the bowsprit is not independent, being directly connectedwith racks. Its length is fixed to a total of 1.6 m in total, and 1.1 m outside from the bow.Worth noting is that the bowsprit is also highly dependent on the sail plan and position of themast, thus meaning that the design has also to be adapted to both of these elements.
The attachment of the bowsprit to the hull is done by a tube through which it passes, which isthen tapered with fibers to the hull, as illustrated in Figure 5.27.
Figure 5.27: Schematics of the attachment of the bowsprit to the hull
85
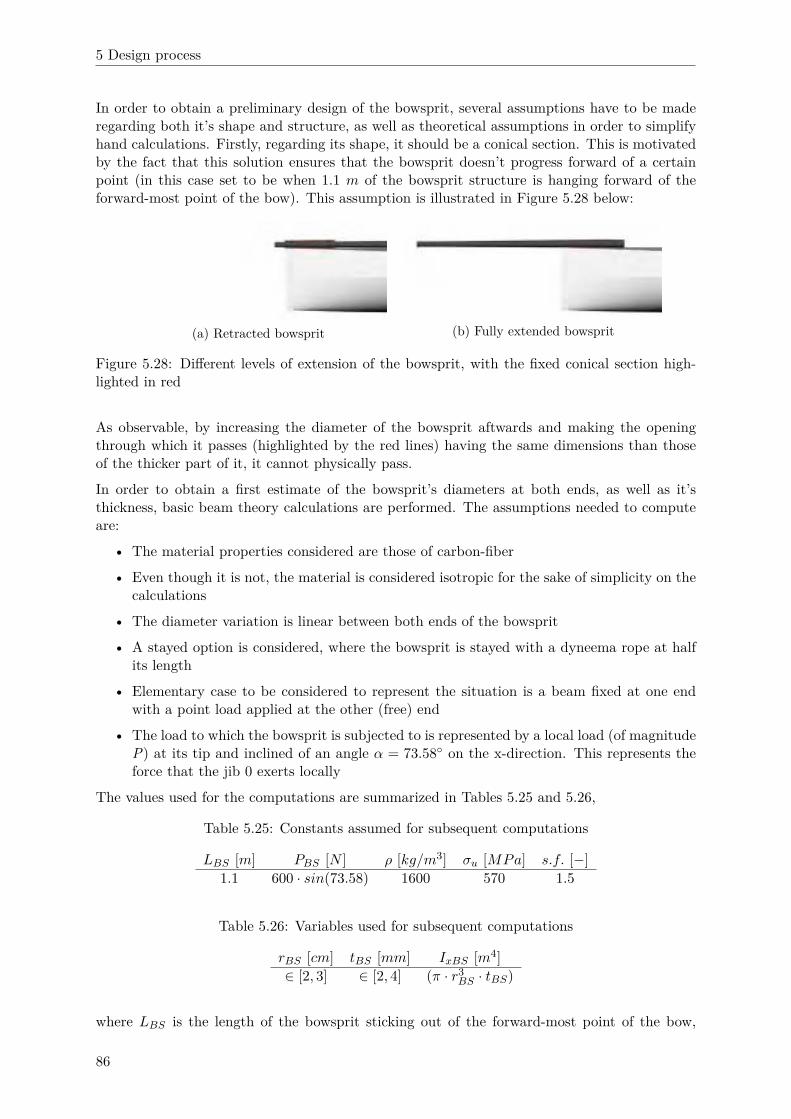
5 Design process
In order to obtain a preliminary design of the bowsprit, several assumptions have to be maderegarding both it’s shape and structure, as well as theoretical assumptions in order to simplifyhand calculations. Firstly, regarding its shape, it should be a conical section. This is motivatedby the fact that this solution ensures that the bowsprit doesn’t progress forward of a certainpoint (in this case set to be when 1.1 m of the bowsprit structure is hanging forward of theforward-most point of the bow). This assumption is illustrated in Figure 5.28 below:
(a) Retracted bowsprit (b) Fully extended bowsprit
Figure 5.28: Different levels of extension of the bowsprit, with the fixed conical section high-lighted in red
As observable, by increasing the diameter of the bowsprit aftwards and making the openingthrough which it passes (highlighted by the red lines) having the same dimensions than thoseof the thicker part of it, it cannot physically pass.
In order to obtain a first estimate of the bowsprit’s diameters at both ends, as well as it’sthickness, basic beam theory calculations are performed. The assumptions needed to computeare:
• The material properties considered are those of carbon-fiber
• Even though it is not, the material is considered isotropic for the sake of simplicity on thecalculations
• The diameter variation is linear between both ends of the bowsprit
• A stayed option is considered, where the bowsprit is stayed with a dyneema rope at halfits length
• Elementary case to be considered to represent the situation is a beam fixed at one endwith a point load applied at the other (free) end
• The load to which the bowsprit is subjected to is represented by a local load (of magnitudeP) at its tip and inclined of an angle α = 73.58◦ on the x-direction. This represents theforce that the jib 0 exerts locally
The values used for the computations are summarized in Tables 5.25 and 5.26,
Table 5.25: Constants assumed for subsequent computations
LBS [m] PBS [N ] ρ [kg/m3] σu [MPa] s.f. [−]
1.1 600 · sin(73.58) 1600 570 1.5
Table 5.26: Variables used for subsequent computations
rBS [cm] tBS [mm] IxBS [m4]
∈ [2, 3] ∈ [2, 4] (π · r3BS · tBS)
where LBS is the length of the bowsprit sticking out of the forward-most point of the bow,
86

5 Design process
PBS is the point load a the tip of the bowsprit, ρ is the density of the material composing thebowsprit and σu is the ultimate stress of the material. The safety factor is represented by s.f..Regarding the variables, rBS represents the radius of the bowsprit, tBS represents the thicknessand IxBS the moment of inertia of the cross section.
These factors are then inserted in Equation (5.4) in order to compute the resulting compressingstress at all points of the bowsprit, in an iterative process.
σBS =PBS · LBS
2rBS · IxBS· s.f. (5.4)
Finally, these values are compared with the ultimate stress considered in Table 5.25. The failurecriterion chosen is a very simplistic one, it being that there’s failure if the computed stress islarger than the ultimate stress for the material (criterion formulated by Equation 5.5).
σBS > σu (5.5)
The results from computations applying this procedure for both the non-stayed and stayed (at0.5 · LBS) cases is summarized in Table 5.27, for a bowsprit with a diameter going from 60 mmat the base to 40 mm at the tip, and with a thickness of 2 mm.
Table 5.27: Results from the Matlab computations
σBS [MPa] σu [MPa] Failure
non-stayed 191 570 Nostayed 96 570 No
So as easily verified by reading Table 5.27, the stress values on the component are well belowthe tolerated ultimate values, therefore meaning that the bowsprit could be in principle thinner.Yet, a thinner bowsprit isn’t considered for three reasons. First, these values for its diameterare already among the smallest manufactured by some companies. Second, it should haveenough inner space for the attachments to slide through. Third, as this is a coarse approach,since in reality a composite is not isotropic, being constituted by several plies of fibers orientedin different directions, the results are not completely trustworthy, requiring further detailedanalysis. This future analysis is further discussed in chapter 8.
Another concept considered for the bowsprit was the rotating bowsprit. This concept consistson a pivoted bowsprit, that enables the Jib 0 to be at the desired shape for different angles ofattack, by rotating the desired amount. The concept is depicted in Figures 5.29a and 5.29b.The bowsprit is pivoted around an axis, and the hull has to have a cut at the bow in orderto allow the rotation. Through it, the attachments of the Jib 0 pass just like in the regularbowsprit. It can be seen that the staying of such a bowsprit can’t just be a dyneema rope due tothe fact that it rotates. Also, two levers can be seen, whose function is to serve as attachmentspoints for the ropes that would pull them. Due to the distance they would have had to bepulled, two horns would have to stick out of the deck, on top of which two wheels would bemounted in order to direct the rope. Such horns were never modelled given the fact that thisconcept was abandoned at a fairly early stage.
This concept ended up being discarded. The main reason driving this decision is the fact thatthe sail plan consists on three sails. Therefore with the rotating bowsprit the distance betweenthe Jib 0 and the jib would become small enough for it to be rendered inefficient.
87

5 Design process
(a) Rotating bowsprit-hull interaction (b) Pivot detail on top of the stiffeners
Figure 5.29: Rotating bowsprit concept model
5.2.2.4 Final rig design
For the final rig design a diamond rig will be used. This is because with this solution the rigwill absorb some of the compression forces by itself. This will make the hull lighter since it notneeds to be stiffened up for these loads. Also by this solution, the rig itself could be lighter.Since the rig is made in aluminium the weight will be higher, saving weight is one importantpart when choosing the rig design.
Since this concept allows the rig to be a rotating rig, this has to be investigated as well. To solvethis, the boom will be locked in rotation around the z-axis, z-direction upwards parallel to themast. By locking this when the boom is released with the sail, it will rotate the mast. This willbe possible since it uses the generated force in the sails to rotate the mast. To stop the rotationof the mast, the rail for the mainsheet will be used. Since the rotation of the mast depends onthe sheeting angle, the sheeting point will be moved onto the rail, and the maximum possiblerotation will thereby be determined by the end of the rail.
The height of the mast will be 9.5 m, this is calculated using the VPP, see Section 5.2.1.2. Theboom will be between the mast and the transom of the deck. Compared to the sail, this meansthat the boom will go more aftwards than the sail. This to be able to have the the sheetingpoint on the the rail without a to big angle between the sheeting point on the deck and theboom.
Trapezes is as well added to the rig to help the sailors to create more righting moment. Theseis also contributing with stability to the rig when they are in use. When they are in use theywill remove the forces in the shroud and the compression forces comes from the sailors.
To achieve more transverse stability to the rig, the shrouds will be attached out at the racks.This puts them further away from the centre line and gives therefore more stability. They willalso be placed 1000 mm aft of the mast to also contribute with longitudinal stability to themast. For the final rig design, see Figure 5.30. For drawings over the rig, see Appendix 8.2.5.
To complement the mast and the boom, a bowsprit is stacked out from the bow. This willpush the Jib 0 forward and extend the gap between the jib and Jib 0. In this way the sailperformance is improved.
The bowsprit will be one long piece made out of carbon fibre and will be retractable to be ableto not have the whole bowsprit out when it is not in use. In the pulled out mode 1.1 m will bestacked out in front of the bow. With a total length of 1.6 m it will leave 0.5 m inside the hullwhen it is pulled out and nothing when it is retracted. The diameter is 40 mm at the tip and60 mm at the base. See Figure 5.28 for the design of the bowsprit.
The dimensions of the bowsprit is just made by simple beam theory and therefore it needs tobe analysed by some FEM-software to make sure it does not break. This will tho be a futurework. Also, the attachment to the hull needs to be decided later on.
88
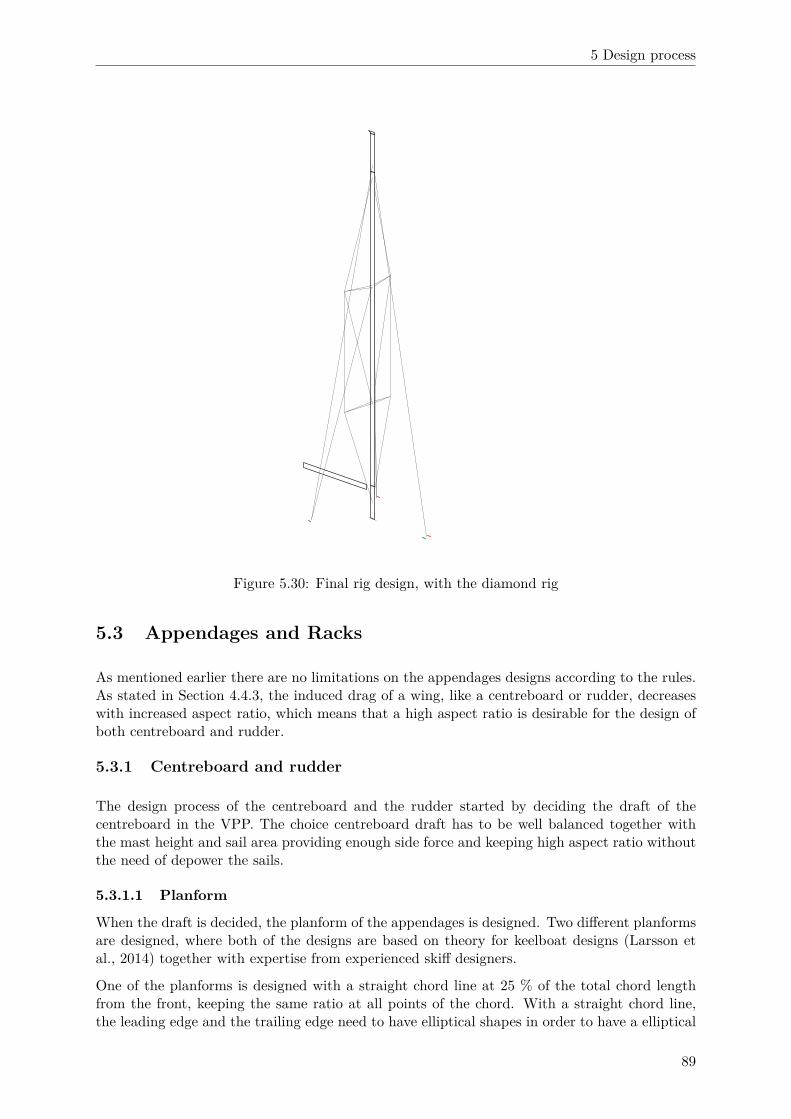
5 Design process
Figure 5.30: Final rig design, with the diamond rig
5.3 Appendages and Racks
As mentioned earlier there are no limitations on the appendages designs according to the rules.As stated in Section 4.4.3, the induced drag of a wing, like a centreboard or rudder, decreaseswith increased aspect ratio, which means that a high aspect ratio is desirable for the design ofboth centreboard and rudder.
5.3.1 Centreboard and rudder
The design process of the centreboard and the rudder started by deciding the draft of thecentreboard in the VPP. The choice centreboard draft has to be well balanced together withthe mast height and sail area providing enough side force and keeping high aspect ratio withoutthe need of depower the sails.
5.3.1.1 Planform
When the draft is decided, the planform of the appendages is designed. Two different planformsare designed, where both of the designs are based on theory for keelboat designs (Larsson etal., 2014) together with expertise from experienced skiff designers.
One of the planforms is designed with a straight chord line at 25 % of the total chord lengthfrom the front, keeping the same ratio at all points of the chord. With a straight chord line,the leading edge and the trailing edge need to have elliptical shapes in order to have a elliptical
89
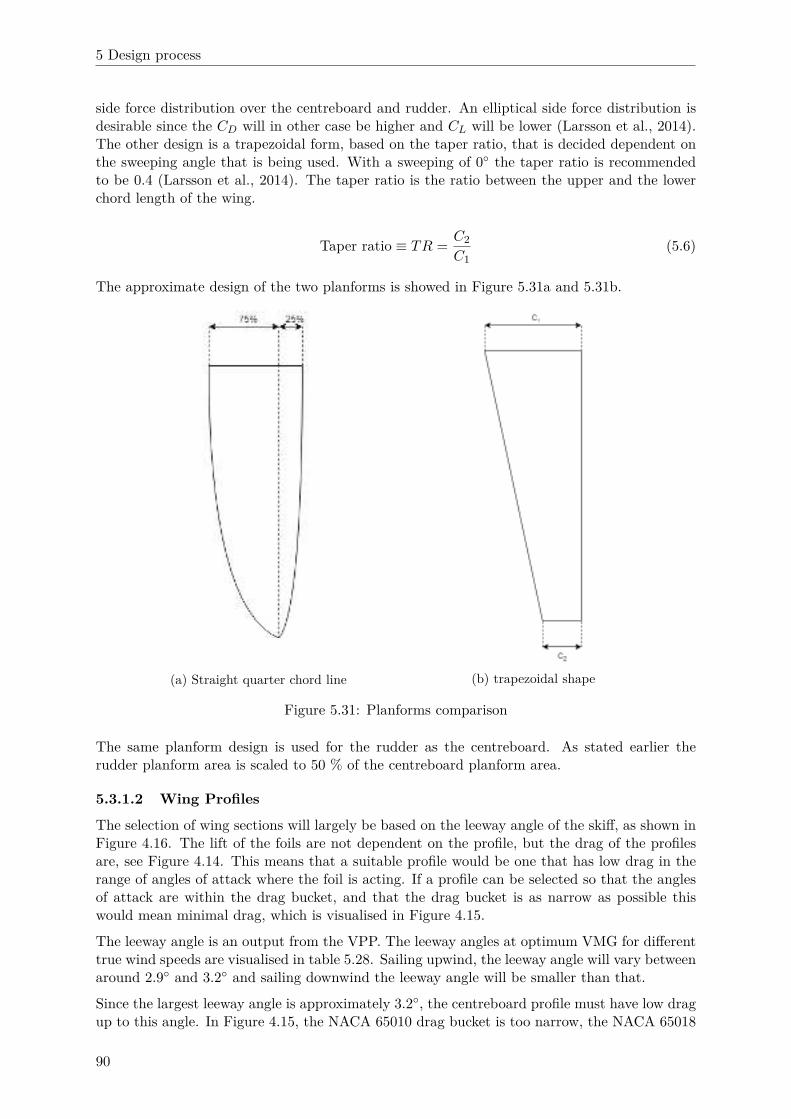
5 Design process
side force distribution over the centreboard and rudder. An elliptical side force distribution isdesirable since the CD will in other case be higher and CL will be lower (Larsson et al., 2014).The other design is a trapezoidal form, based on the taper ratio, that is decided dependent onthe sweeping angle that is being used. With a sweeping of 0◦ the taper ratio is recommendedto be 0.4 (Larsson et al., 2014). The taper ratio is the ratio between the upper and the lowerchord length of the wing.
Taper ratio ≡ TR =C2
C1
(5.6)
The approximate design of the two planforms is showed in Figure 5.31a and 5.31b.
(a) Straight quarter chord line (b) trapezoidal shape
Figure 5.31: Planforms comparison
The same planform design is used for the rudder as the centreboard. As stated earlier therudder planform area is scaled to 50 % of the centreboard planform area.
5.3.1.2 Wing Profiles
The selection of wing sections will largely be based on the leeway angle of the skiff, as shown inFigure 4.16. The lift of the foils are not dependent on the profile, but the drag of the profilesare, see Figure 4.14. This means that a suitable profile would be one that has low drag in therange of angles of attack where the foil is acting. If a profile can be selected so that the anglesof attack are within the drag bucket, and that the drag bucket is as narrow as possible thiswould mean minimal drag, which is visualised in Figure 4.15.
The leeway angle is an output from the VPP. The leeway angles at optimum VMG for differenttrue wind speeds are visualised in table 5.28. Sailing upwind, the leeway angle will vary betweenaround 2.9◦ and 3.2◦ and sailing downwind the leeway angle will be smaller than that.
Since the largest leeway angle is approximately 3.2◦, the centreboard profile must have low dragup to this angle. In Figure 4.15, the NACA 65010 drag bucket is too narrow, the NACA 65018
90
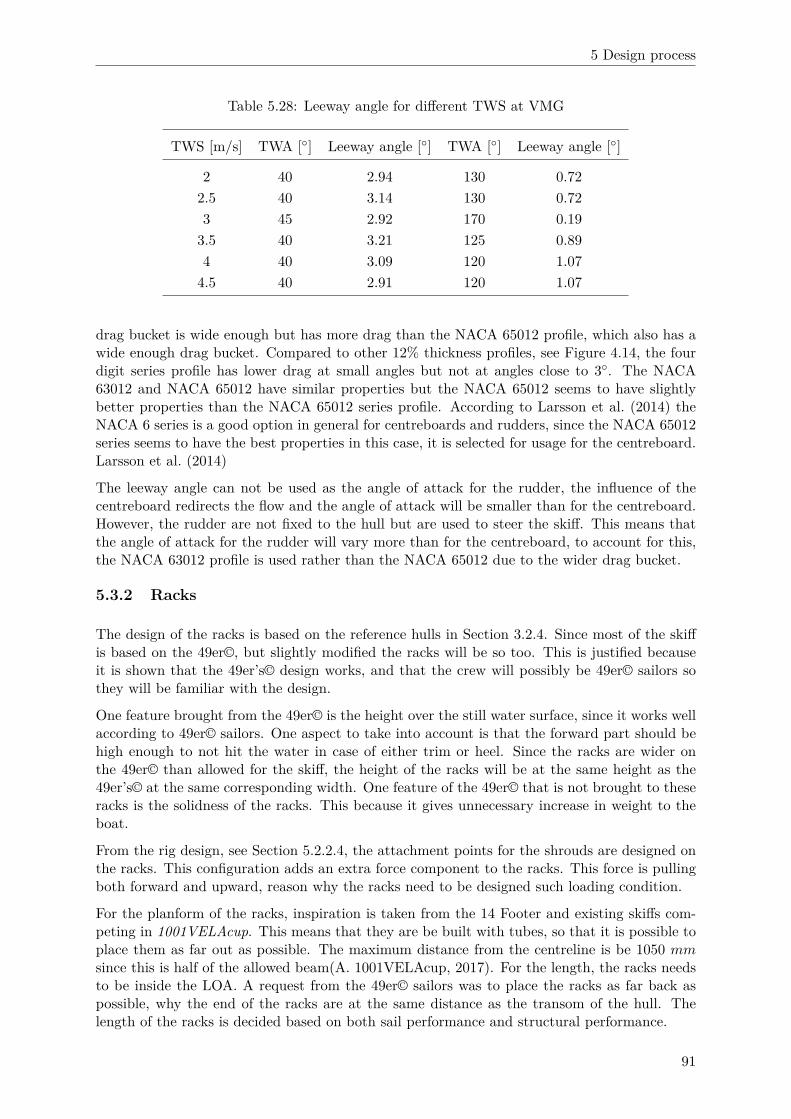
5 Design process
Table 5.28: Leeway angle for different TWS at VMG
TWS [m/s] TWA [◦] Leeway angle [◦] TWA [◦] Leeway angle [◦]
2 40 2.94 130 0.72
2.5 40 3.14 130 0.72
3 45 2.92 170 0.19
3.5 40 3.21 125 0.89
4 40 3.09 120 1.07
4.5 40 2.91 120 1.07
drag bucket is wide enough but has more drag than the NACA 65012 profile, which also has awide enough drag bucket. Compared to other 12% thickness profiles, see Figure 4.14, the fourdigit series profile has lower drag at small angles but not at angles close to 3◦. The NACA63012 and NACA 65012 have similar properties but the NACA 65012 seems to have slightlybetter properties than the NACA 65012 series profile. According to Larsson et al. (2014) theNACA 6 series is a good option in general for centreboards and rudders, since the NACA 65012series seems to have the best properties in this case, it is selected for usage for the centreboard.Larsson et al. (2014)
The leeway angle can not be used as the angle of attack for the rudder, the influence of thecentreboard redirects the flow and the angle of attack will be smaller than for the centreboard.However, the rudder are not fixed to the hull but are used to steer the skiff. This means thatthe angle of attack for the rudder will vary more than for the centreboard, to account for this,the NACA 63012 profile is used rather than the NACA 65012 due to the wider drag bucket.
5.3.2 Racks
The design of the racks is based on the reference hulls in Section 3.2.4. Since most of the skiffis based on the 49er©, but slightly modified the racks will be so too. This is justified becauseit is shown that the 49er’s© design works, and that the crew will possibly be 49er© sailors sothey will be familiar with the design.
One feature brought from the 49er© is the height over the still water surface, since it works wellaccording to 49er© sailors. One aspect to take into account is that the forward part should behigh enough to not hit the water in case of either trim or heel. Since the racks are wider onthe 49er© than allowed for the skiff, the height of the racks will be at the same height as the49er’s© at the same corresponding width. One feature of the 49er© that is not brought to theseracks is the solidness of the racks. This because it gives unnecessary increase in weight to theboat.
From the rig design, see Section 5.2.2.4, the attachment points for the shrouds are designed onthe racks. This configuration adds an extra force component to the racks. This force is pullingboth forward and upward, reason why the racks need to be designed such loading condition.
For the planform of the racks, inspiration is taken from the 14 Footer and existing skiffs com-peting in 1001VELAcup. This means that they are be built with tubes, so that it is possible toplace them as far out as possible. The maximum distance from the centreline is be 1050 mmsince this is half of the allowed beam(A. 1001VELAcup, 2017). For the length, the racks needsto be inside the LOA. A request from the 49er© sailors was to place the racks as far back aspossible, why the end of the racks are at the same distance as the transom of the hull. Thelength of the racks is decided based on both sail performance and structural performance.
91
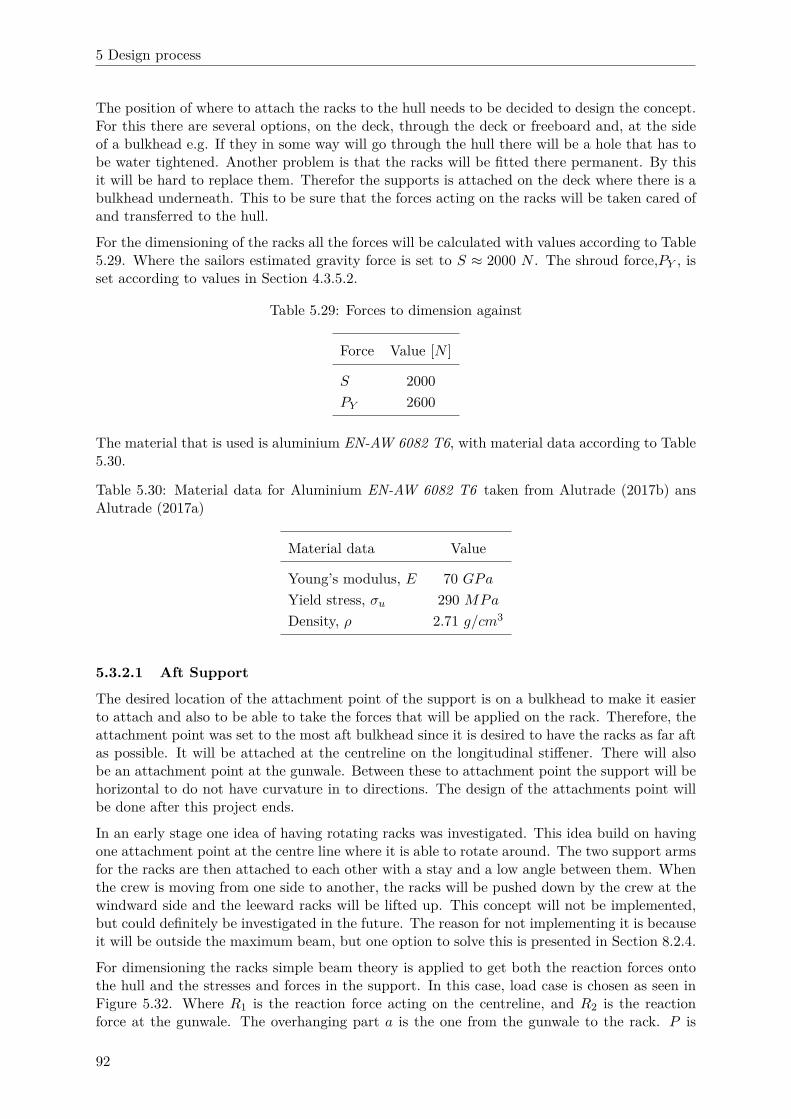
5 Design process
The position of where to attach the racks to the hull needs to be decided to design the concept.For this there are several options, on the deck, through the deck or freeboard and, at the sideof a bulkhead e.g. If they in some way will go through the hull there will be a hole that has tobe water tightened. Another problem is that the racks will be fitted there permanent. By thisit will be hard to replace them. Therefor the supports is attached on the deck where there is abulkhead underneath. This to be sure that the forces acting on the racks will be taken cared ofand transferred to the hull.
For the dimensioning of the racks all the forces will be calculated with values according to Table5.29. Where the sailors estimated gravity force is set to S ≈ 2000 N . The shroud force,PY , isset according to values in Section 4.3.5.2.
Table 5.29: Forces to dimension against
Force Value [N ]
S 2000
PY 2600
The material that is used is aluminium EN-AW 6082 T6, with material data according to Table5.30.
Table 5.30: Material data for Aluminium EN-AW 6082 T6 taken from Alutrade (2017b) ansAlutrade (2017a)
Material data Value
Young’s modulus, E 70 GPa
Yield stress, σu 290 MPa
Density, ρ 2.71 g/cm3
5.3.2.1 Aft Support
The desired location of the attachment point of the support is on a bulkhead to make it easierto attach and also to be able to take the forces that will be applied on the rack. Therefore, theattachment point was set to the most aft bulkhead since it is desired to have the racks as far aftas possible. It will be attached at the centreline on the longitudinal stiffener. There will alsobe an attachment point at the gunwale. Between these to attachment point the support will behorizontal to do not have curvature in to directions. The design of the attachments point willbe done after this project ends.
In an early stage one idea of having rotating racks was investigated. This idea build on havingone attachment point at the centre line where it is able to rotate around. The two support armsfor the racks are then attached to each other with a stay and a low angle between them. Whenthe crew is moving from one side to another, the racks will be pushed down by the crew at thewindward side and the leeward racks will be lifted up. This concept will not be implemented,but could definitely be investigated in the future. The reason for not implementing it is becauseit will be outside the maximum beam, but one option to solve this is presented in Section 8.2.4.
For dimensioning the racks simple beam theory is applied to get both the reaction forces ontothe hull and the stresses and forces in the support. In this case, load case is chosen as seen inFigure 5.32. Where R1 is the reaction force acting on the centreline, and R2 is the reactionforce at the gunwale. The overhanging part a is the one from the gunwale to the rack. P is
92
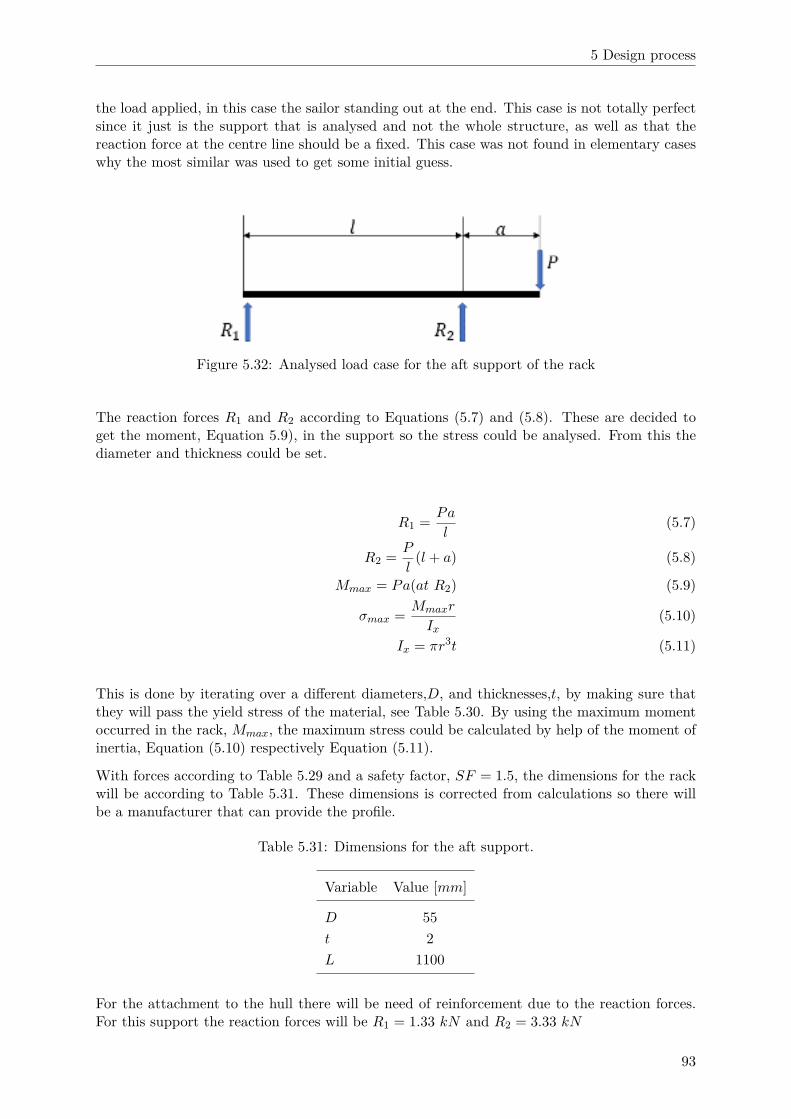
5 Design process
the load applied, in this case the sailor standing out at the end. This case is not totally perfectsince it just is the support that is analysed and not the whole structure, as well as that thereaction force at the centre line should be a fixed. This case was not found in elementary caseswhy the most similar was used to get some initial guess.
Figure 5.32: Analysed load case for the aft support of the rack
The reaction forces R1 and R2 according to Equations (5.7) and (5.8). These are decided toget the moment, Equation 5.9), in the support so the stress could be analysed. From this thediameter and thickness could be set.
R1 =Pa
l(5.7)
R2 =P
l(l + a) (5.8)
Mmax = Pa(at R2) (5.9)
σmax =Mmaxr
Ix(5.10)
Ix = πr3t (5.11)
This is done by iterating over a different diameters,D, and thicknesses,t, by making sure thatthey will pass the yield stress of the material, see Table 5.30. By using the maximum momentoccurred in the rack, Mmax, the maximum stress could be calculated by help of the moment ofinertia, Equation (5.10) respectively Equation (5.11).
With forces according to Table 5.29 and a safety factor, SF = 1.5, the dimensions for the rackwill be according to Table 5.31. These dimensions is corrected from calculations so there willbe a manufacturer that can provide the profile.
Table 5.31: Dimensions for the aft support.
Variable Value [mm]
D 55
t 2
L 1100
For the attachment to the hull there will be need of reinforcement due to the reaction forces.For this support the reaction forces will be R1 = 1.33 kN and R2 = 3.33 kN
93

5 Design process
5.3.2.2 Bow Support
Since the rig design is constructed so the lower shrouds is attached out on the racks this willgive forces pulling the rack upward and inward to the hull. To be able to handle this forces theracks supports has to be designed to be able to take the loads. The forces will contribute withboth bending and compression. For the location of where the loads is acting, see Section 5.2.2.4for the rig design. The load will act 1000 mm aft of the mast out on the racks.
To be able to handle the compressing loads the support will be placed from the mast and800 mm aft of the mast. It would have been preferred to have it to 1000 mm but then materialwould have been needed to be added. Underneath the support there will be a bulkhead to stiffup the hull. This is done to be able the take care of the compressing loads from the racks, formore information see Section 5.1.6.3. This give the bow support an angle backwards from themast.
To get the racks in the correct height they have to have some kind of angle and the optionsis similar to the one for the aft support. This will be taken care of when designing the bowsupport. What also needs to take into consideration is that there will be a lot of ropes thatwill come from the forward part of the hull. This need in some way pass the support. Also thesailors need to be able to move smoothly in front of the support if that is needed in low wind.
To be able tho get the sheets passing the support, the support will be one straight piece withangle increasing height. This is the geometry that will be dimensioned. This will be of a circularcross-section.
For the bow support the dimensioning is using the same load case as for the aft support, seeFigure 5.32. Therefore the equations for solving this will be the same. The force from thesailors is applied at the tip of the support out on the rack. Quite close to this point, 200 mmaft of the point the shrouds will be attached. This is discarded and will act as a safety instead,why the safety factor is set to SF = 1.0 in this case. This will give the dimensions accordingto Table 5.32.
Table 5.32: Dimensions for the bow support
Variable Value [mm]
D 65
t 2
L 1250
For this support the reaction forces that the reinforcement need to handle will be R1 = 2.15 kNand R2 = 4.14 kN .
5.3.2.3 Rack beam
The last part of the racks is the rack beam that runs between the two supports. The lengthof the beam should go as long aftwards as possible, according to 49er© sailor. This gives thatthe racks should go all way back to the aft, behind the aft support and create a overhang of250 mm.
The length in front of the forward support will mainly be decided by where the sheeting pointfor the Jib 0 will be attached onto the rack. This will for sure be in front of the mast, for moreinformation about the reasoning about where to place it see Section 5.2.1.2.
The rack beam will be analysed in two different parts to see which one that is the most critical.The analysed cases are sailors between the supports, see Figure 5.33a, and sailors in front of
94
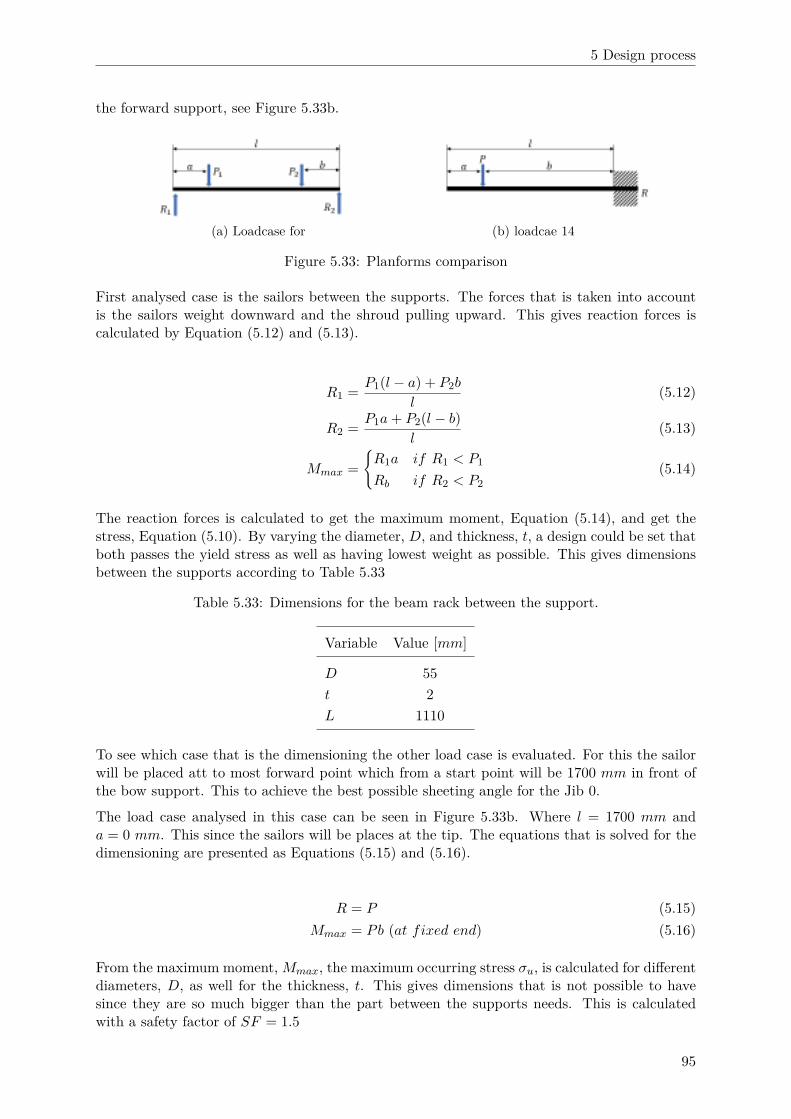
5 Design process
the forward support, see Figure 5.33b.
(a) Loadcase for (b) loadcae 14
Figure 5.33: Planforms comparison
First analysed case is the sailors between the supports. The forces that is taken into accountis the sailors weight downward and the shroud pulling upward. This gives reaction forces iscalculated by Equation (5.12) and (5.13).
R1 =P1(l − a) + P2b
l(5.12)
R2 =P1a + P2(l − b)
l(5.13)
Mmax =
{R1a if R1 < P1
Rb if R2 < P2
(5.14)
The reaction forces is calculated to get the maximum moment, Equation (5.14), and get thestress, Equation (5.10). By varying the diameter, D, and thickness, t, a design could be set thatboth passes the yield stress as well as having lowest weight as possible. This gives dimensionsbetween the supports according to Table 5.33
Table 5.33: Dimensions for the beam rack between the support.
Variable Value [mm]
D 55
t 2
L 1110
To see which case that is the dimensioning the other load case is evaluated. For this the sailorwill be placed att to most forward point which from a start point will be 1700 mm in front ofthe bow support. This to achieve the best possible sheeting angle for the Jib 0.
The load case analysed in this case can be seen in Figure 5.33b. Where l = 1700 mm anda = 0 mm. This since the sailors will be places at the tip. The equations that is solved for thedimensioning are presented as Equations (5.15) and (5.16).
R = P (5.15)
Mmax = Pb (at fixed end) (5.16)
From the maximum moment, Mmax, the maximum occurring stress σu, is calculated for differentdiameters, D, as well for the thickness, t. This gives dimensions that is not possible to havesince they are so much bigger than the part between the supports needs. This is calculatedwith a safety factor of SF = 1.5
95

5 Design process
Therefor the beam dimensions between the supports is used for this section as well. Thereforit had to be decided at wich position both of the sailors could be placed on. For this load caseaccording to Figure 5.32 is used. In this the reaction forces is comes from the supports, whythis not is conservative. By moving the sailors forward the will be allowed to move 500 mmin front of the forward support. But since the racks needs the extra part for achieving goodsheeting angle they will in total be 1200 mm.
5.3.2.4 Final Rack Design
The final rack design is presented in Figure 5.34 with dimensions according to Table 5.34. Therecan though be some problem when the will be built. There can be some problem with mountingdifferent diameters together. One solution is to change the beam to the biggest diameter thatis needed for the supports. Though, the bow support has some safety factor that has not beentaken into account when designing, it is the shroud force that is pulling upwards.
Furthermore, since the racks are up to date designed as a singular piece, a FEM-analysis isneeded to be carried out to analyse the whole structure. More about this is Section 8.1.4.
Table 5.34: Dimensions of all the parts of the rack
Part Dimension Value [mm]
Aft supportL 1100
D 55
t 2
Bow supportL 1250
D 65
t 2
Rack BeamL 2300
D 55
t 2
Figure 5.34: Analysed load case for the aft support of the rack
96
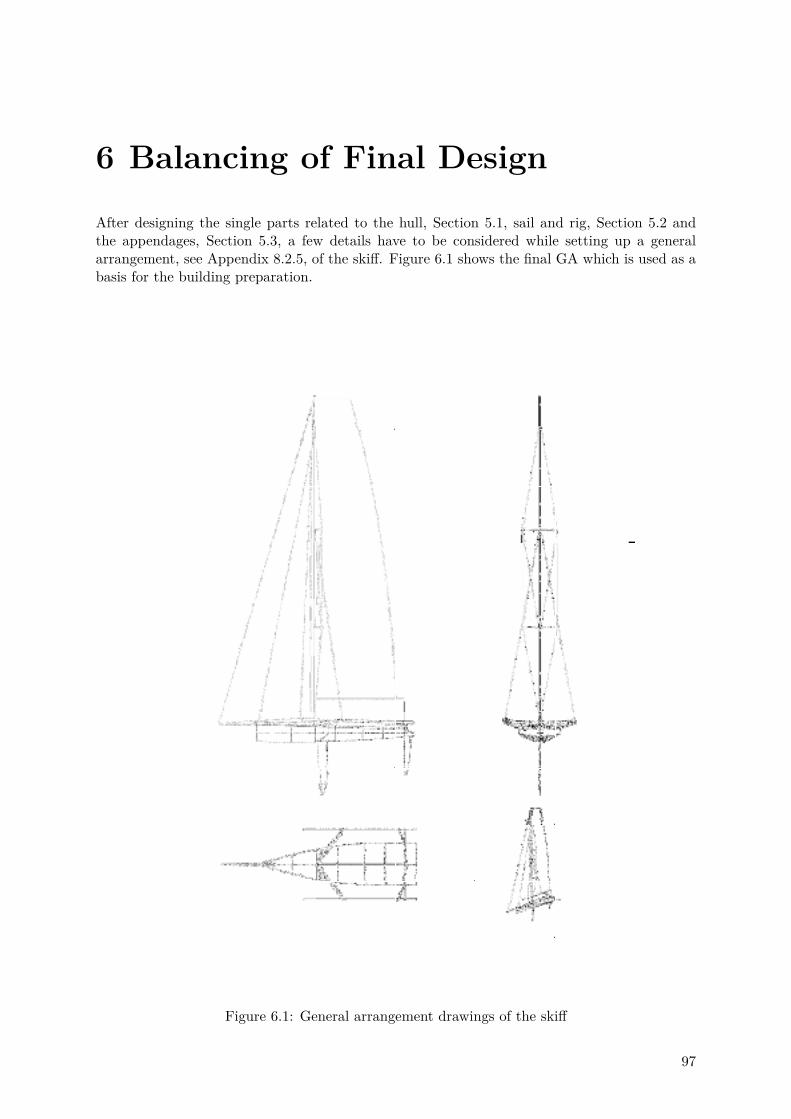
6 Balancing of Final Design
After designing the single parts related to the hull, Section 5.1, sail and rig, Section 5.2 andthe appendages, Section 5.3, a few details have to be considered while setting up a generalarrangement, see Appendix 8.2.5, of the skiff. Figure 6.1 shows the final GA which is used as abasis for the building preparation.
Figure 6.1: General arrangement drawings of the skiff
97
6 Balancing of Final Design
The stiffeners skeleton, as displayed in Section 5.1.6.3, is the result of the balancing of thedifferent elements dimensioned during the project. The second transverse bulkhead from thebow is in fact placed right below the mast foot at a distance of 1.70 m aft from the bow. Suchdistance is scaled, for the current skiff, from considerations made on the mast positioning on a49er©. Therefore, knowing the stability and good handling properties of the 49er©, the currentskiff is expected to present similar properties. Right in front of the mast is placed the rail forthe self-tacking jib. Hence, this second bulkhead is directly asked to provide support to theforces transferred from the rail to the hull.
Moving toward the stern, bulkheads are strategically distributed and designed to not only struc-turally support the hull itself, but also provide additional support to the racks, the appendagesand the sheeting points. In order to provide the best support to the forces transmitted to thehull by the racks, bulkheads are therefore positioned right below their attachment portions.Hence, the diagonal bulkheads spread from the mast foot and follow exactly the direction of thefront attachment of the racks. One innovative feature of this skiff is that the front part of theracks is used to place the shroud attachment. With this solution, the shrouds are placed furtherout and will decrease the compression load of the rig and stabilise it, since the side forces willbe greater. To provide additional stability in longitudinal direction, upper dyneema shrouds,starting at the top area of the mast and reaching the lower shroud attachment on the racks, areadded.
The most aft bulkhead provides instead support to the back attachment of the racks. Thisbulkhead is also given the task of supporting the main sheet, which is positioned in order toprovide the crew with as much clear space as possible. Right beyond the last bulkhead therudder is positioned. Opposed to more common solutions, the rudder is located under the hull.The reason for such solution is given by the consequent elimination of interference with thewater surface. This provides a better inflow on the rudder blade resulting in more lift and lessresistance.
Once the mast and the rudder are set into position, considerations can be made on the place-ment of the centreboard. Such is critical in order to not compromise the capability of steeringmanoeuvres, as the higher the distance between rudder and centreboard the higher the lever.Hence, higher lever produces a higher steering moment. Furthermore, the lever is constrainedby the lead, which describes the distance between the centreboard and the CoE of the sail area.Analysing reference skiffs and dinghies the lead is set to 8 %, see Table 3.5.
Finally, local additional reinforcements are placed in correspondence of all the high load attach-ment points.
98

7 Building process
In this chapter the building process is explained in detail. The parts that are covered are thedesigning and assembling of the templates, followed by the planking of hull and deck, as wellas their lamination and of the stiffening structure.
7.1 Templates
The first step in the building process is to design the templates from the final hull shape. Oneset of templates is designed for the bottom and freeboard while another is designed for thedeck. The templates are designed in Rhino 3D using the final hull design as a reference. Eachof the bulkhead templates is placed within a distance of 230 mm from the the neighbouringtemplate(s). The smaller the distance between them, the more accurate will the shape of thehull be, therefore if a bigger distance would have been used, the precision when it comes toshape of the hull would be lost when planking. To obtain the desired shape of the aft part ofthe hull, one more template is placed in the aft, making the template model 230 mm longerthan the actual hull.
When designing the templates, all joints have a gap of 0.15 mm as a tolerance in order to makethe assembly easier. Furthermore, all the inner corners have to be made with so called ’dogbones’, which have a diameter of 6.2 mm. This is due to the cutting process, where sharp innercorners can not be made due to the milling bit being circular, see Figure 7.1.
Figure 7.1: Dog bones in one of the deck’s template
When the design of the templates is done, they are ordered in Medium Density Fibre boards(MDF) that are 16 mm thick. The MDF boards are later assembled into the full scale templateplug using epoxy to glue them together. A model of the final design of the templates and apicture of the assembly can be seen in Figures 7.2a, 7.2b, 7.3a and 7.3b.
Furthermore, templates for the bulkheads and stringers need to be ordered. These componentsare to be mounted and cut over these templates. This process is described in the followingsection dealing with planking.
99

7 Building process
(a) Model of hull templates (b) Model of deck templates
Figure 7.2: Templates models in Rhino 3D
(a) Templates for the hull (b) Templates for the deck
Figure 7.3: Template assemblies used for planking
7.2 Planking
The entire hull structure of the skiff will be built in a composite sandwich. The core will bebuilt using balsa wood. The following sections will describe the process of building the balsacore for the different parts of the hull.
7.2.1 Planking the hull and deck
The planking process starts once the templates are assembled. Balsa-planks with 8.8 mmthickness to leave a margin for sanding, 45 mm width and 2.5 m in length are used. Theplanks are placed on top of the templates and bent along their curvature in order to achievethe desired shape. At the joints and sides of the planks, fish glue is used to glue the plankstogether. During the curing process of the fish glue, the planks are held in place by screwingthem to the templates. To prevent the screws from damaging the planks and also to distributean even pressure around the screw, small blocks of divinycell are placed between the planks andthe screws. This can be seen in Figure 7.4.
100

7 Building process
Figure 7.4: Planking with divinycell blocks
When the planking is done and the fish glue is cured all the screws and divinycell blocks areremoved and the hull is faired using sandpaper and a planer. This process is important in orderto get the surface as smooth as possible when starting the laminating process. The faired hullcore can be seen in Figure 7.5.
Figure 7.5: Faired hull
7.2.2 Planking the internal structure
In order to build the bulkheads and stringers different pieces of the balsa core are cut andarranged so they cover the entire bulkhead template. See Figure 7.6 for an example where thelargest stringer template is covered with balsa pieces that will constitute its core.
Figure 7.6: Bulkhead template completely covered with balsa for the core
101
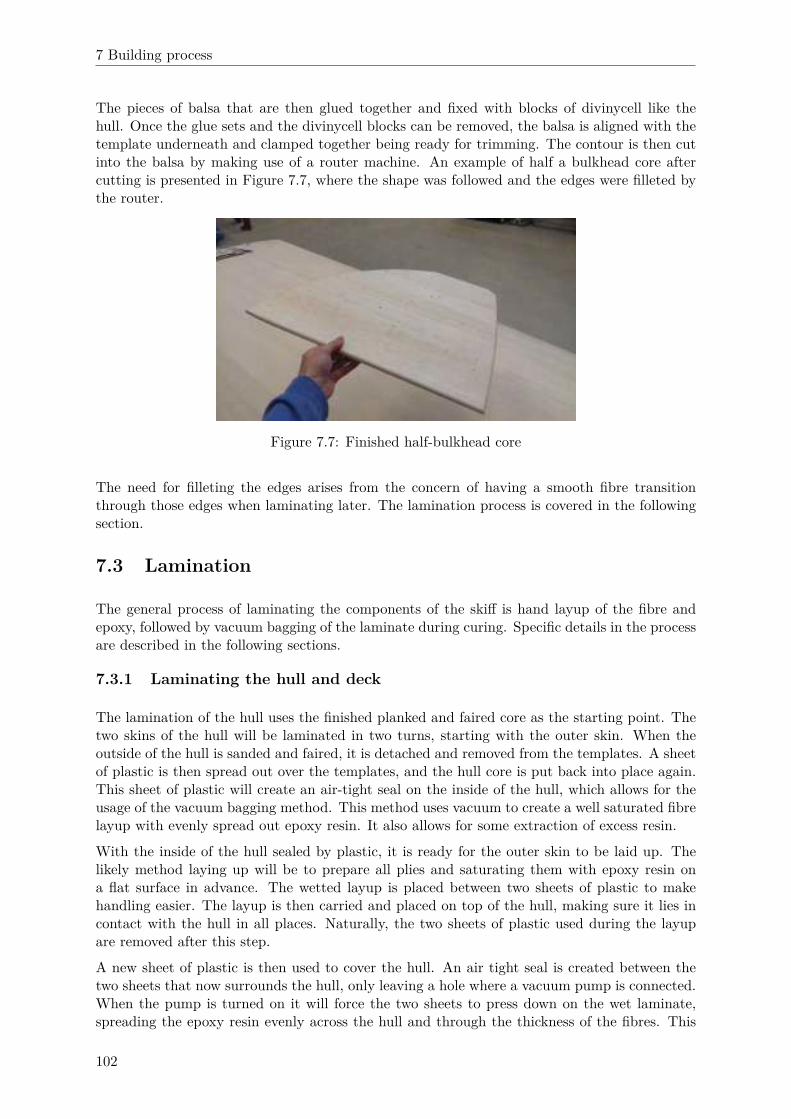
7 Building process
The pieces of balsa that are then glued together and fixed with blocks of divinycell like thehull. Once the glue sets and the divinycell blocks can be removed, the balsa is aligned with thetemplate underneath and clamped together being ready for trimming. The contour is then cutinto the balsa by making use of a router machine. An example of half a bulkhead core aftercutting is presented in Figure 7.7, where the shape was followed and the edges were filleted bythe router.
Figure 7.7: Finished half-bulkhead core
The need for filleting the edges arises from the concern of having a smooth fibre transitionthrough those edges when laminating later. The lamination process is covered in the followingsection.
7.3 Lamination
The general process of laminating the components of the skiff is hand layup of the fibre andepoxy, followed by vacuum bagging of the laminate during curing. Specific details in the processare described in the following sections.
7.3.1 Laminating the hull and deck
The lamination of the hull uses the finished planked and faired core as the starting point. Thetwo skins of the hull will be laminated in two turns, starting with the outer skin. When theoutside of the hull is sanded and faired, it is detached and removed from the templates. A sheetof plastic is then spread out over the templates, and the hull core is put back into place again.This sheet of plastic will create an air-tight seal on the inside of the hull, which allows for theusage of the vacuum bagging method. This method uses vacuum to create a well saturated fibrelayup with evenly spread out epoxy resin. It also allows for some extraction of excess resin.
With the inside of the hull sealed by plastic, it is ready for the outer skin to be laid up. Thelikely method laying up will be to prepare all plies and saturating them with epoxy resin ona flat surface in advance. The wetted layup is placed between two sheets of plastic to makehandling easier. The layup is then carried and placed on top of the hull, making sure it lies incontact with the hull in all places. Naturally, the two sheets of plastic used during the layupare removed after this step.
A new sheet of plastic is then used to cover the hull. An air tight seal is created between thetwo sheets that now surrounds the hull, only leaving a hole where a vacuum pump is connected.When the pump is turned on it will force the two sheets to press down on the wet laminate,spreading the epoxy resin evenly across the hull and through the thickness of the fibres. This
102
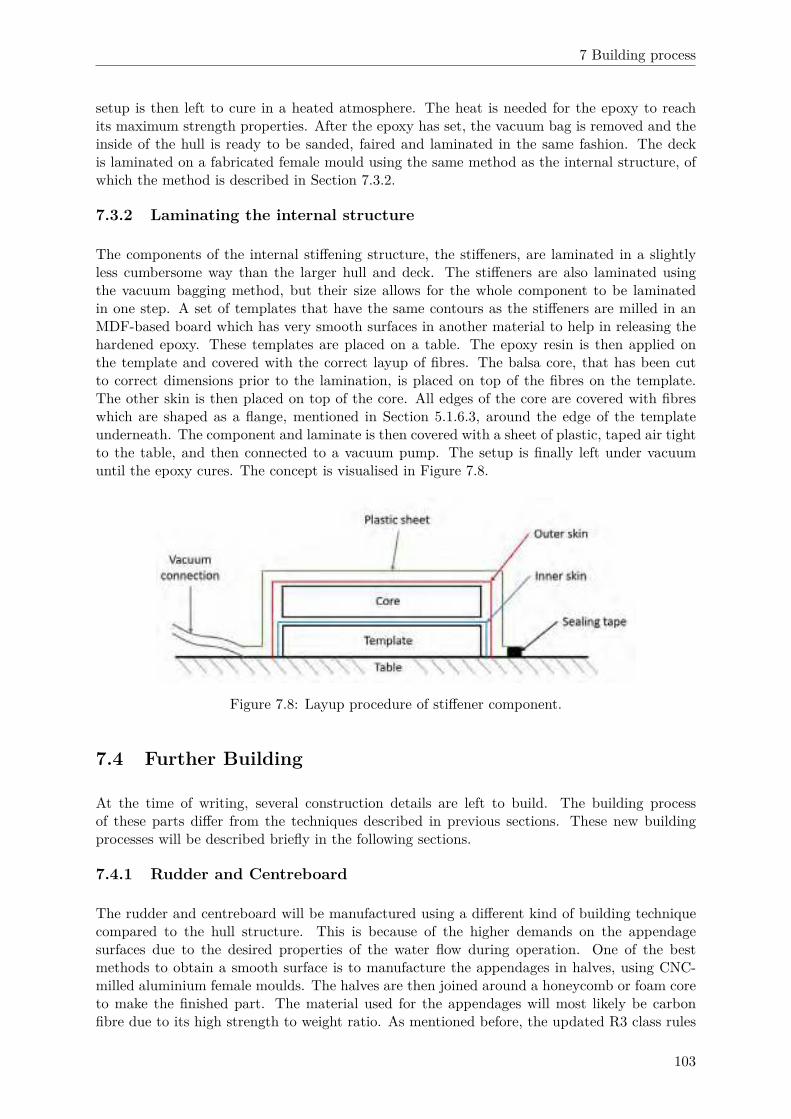
7 Building process
setup is then left to cure in a heated atmosphere. The heat is needed for the epoxy to reachits maximum strength properties. After the epoxy has set, the vacuum bag is removed and theinside of the hull is ready to be sanded, faired and laminated in the same fashion. The deckis laminated on a fabricated female mould using the same method as the internal structure, ofwhich the method is described in Section 7.3.2.
7.3.2 Laminating the internal structure
The components of the internal stiffening structure, the stiffeners, are laminated in a slightlyless cumbersome way than the larger hull and deck. The stiffeners are also laminated usingthe vacuum bagging method, but their size allows for the whole component to be laminatedin one step. A set of templates that have the same contours as the stiffeners are milled in anMDF-based board which has very smooth surfaces in another material to help in releasing thehardened epoxy. These templates are placed on a table. The epoxy resin is then applied onthe template and covered with the correct layup of fibres. The balsa core, that has been cutto correct dimensions prior to the lamination, is placed on top of the fibres on the template.The other skin is then placed on top of the core. All edges of the core are covered with fibreswhich are shaped as a flange, mentioned in Section 5.1.6.3, around the edge of the templateunderneath. The component and laminate is then covered with a sheet of plastic, taped air tightto the table, and then connected to a vacuum pump. The setup is finally left under vacuumuntil the epoxy cures. The concept is visualised in Figure 7.8.
Figure 7.8: Layup procedure of stiffener component.
7.4 Further Building
At the time of writing, several construction details are left to build. The building processof these parts differ from the techniques described in previous sections. These new buildingprocesses will be described briefly in the following sections.
7.4.1 Rudder and Centreboard
The rudder and centreboard will be manufactured using a different kind of building techniquecompared to the hull structure. This is because of the higher demands on the appendagesurfaces due to the desired properties of the water flow during operation. One of the bestmethods to obtain a smooth surface is to manufacture the appendages in halves, using CNC-milled aluminium female moulds. The halves are then joined around a honeycomb or foam coreto make the finished part. The material used for the appendages will most likely be carbonfibre due to its high strength to weight ratio. As mentioned before, the updated R3 class rules
103
7 Building process
allow this choice of material since there are no restrictions regarding material content for theappendages.
7.4.2 Racks
Since the racks can be built in aluminium as long as they comply with the rule of 70 % of naturalmaterial they are designed to be build in aluminium tubes(A. 1001VELAcup, 2017). Since theracks contain three parts of different shape they have to be fitted together. The method ofjoining the aluminium parts is still to be determined. The most likely solution will be a mixof welding and blind riveting. The finished racks will be attached to the hull using epoxy andflax fibres and possibly rope where applicable. To get the shape of the aft support, see Section5.3.2.1, the tube will be bent.
7.4.3 Bowsprit
The bowsprit is allowed to be made out of carbon fibre, and since it assumes a conical shape,as mentioned in Section 5.2.2.3, the method for building shall be roll wrapping. It consistson wrapping sheet of pre-impregnated fibres (pre-preg) onto a mandrel, according to desiredlayers and angles. Then it is pressurised and heat cured to solidify. After solidifying the shapeis extracted from the mandrel. This process is generally used for small to medium diametertubes, that is from around 6 mm to 30 mm diameter, up to 2.5 m length, (west composites,n.d.).
104
8 Future Work
Due to the limited time available for the project, some work and investigations will inevitablyhave to take place further on in time. The following chapter will cover both work that needsto be done within the current project, as well as investigations that lie outside of the projectscope but may be interesting to look at in future projects.
8.1 Remaining Work
Although the main part of the project is finished, there is still some design work left to bedone in order to be able to produce a complete skiff. This work has to be done parallel to theremaining building work, mentioned in Section 7.4. The remaining design work is covered inthe following sections.
8.1.1 Sails
The plan form of the sail is set from the VPP program, see Section 5.2.1.2. Since the design forthe sails are not done yet, some concept for handling of them is not decided. Therefore, someof the future work is presented at this section.
8.1.1.1 Jib 0 and jib handling
The choice of using Jib 0 as a down wind sail that possibly can be used upwind sail as well ispreferred. In the case the wind is too strong, the Jib 0 is just used on the down wind legs. Forthis, the Jib 0 has to be stored on the deck when going upwind. The system for this has to bedecided. One idea for this is to furl it around the stay and then take it down onto the deck.
The same problem will occur if the Jib 0 is used in upwind. In this case the jib and the Jib0 will come to close to each other why the jib has to be taken down. Furling is one option tostore the jib for the upwind leg. For making the handling of the jib easy it will be kept on a selftacking rail. By this the position will be close to the mast, and out to the freeboard. Anotherinvestigation is done on the shape of the jib which might be adjusted to a fat head jib, makingit easier to trim. Both the systems, for the jib and Jib 0, are decided before the skiff will goout on sailing.
To be able to use the Jib 0 both upwind and downwind the sheeting point has to be able to bemoved around. The solution for this is not decided and has to be designed. Two options thatshould be investigated are the extend of the rail for the self-tacking jib so the sheeting point forthe Jib 0 also will be attached on this and a flying sheeting point which will be fixed by sailingupwind
8.1.2 Local Reinforcements
Structural calculations that remain are those regarding local reinforcements of the hull wherethe basic construction may not be sufficient. One such point on the hull is the mast step wherethe mast rests on the deck. This is one of the highest loaded parts of the hull and needs to bereinforced accordingly. As mentioned in Section 5.1.6.4 the internal structure of the hull willmost likely be able to support this load. However, the balsa core of the deck in this point willmost likely be compressed beyond acceptable levels, which is why it will have to be replaced by
105

8 Future Work
a stiffer material. The current options are to either use a stiffer wood core, or simply making asmall area just underneath the mast step out of solid laminate. The decision is still to be made.
Another high load point of the hull is the one where the rudder is attached to the hull. This pointis positioned slightly aft of the transom, which means that some sort of supporting structurehas to be designed in that position.
There are still some uncertainties concerning the attachment of the standing rigging as well asthe attachment of the racks to the hull. These attachment points are also yet to be designedand dimensioned. The design process of these attachment points will take inspiration fromexisting solutions on high-end sail racing boats and adapting these to the material options thatare available, as well as the geometry of the hull.
8.1.3 Structure of Centreboard and Rudder
The centreboard and rudder need to be dimensioned and analysed using the FE-software Abaqus
CAE just like the rest of the structures. A big difference is the separate rules regarding thematerial content. A late change in the R3 class rules now allows appendages to be fully madefrom carbon fibre composites, in addition to the bowsprit which already allowed the usage ofcarbon fibre. This change in the rules will allow for these parts to be designed at a lowerweight than what would have been possible otherwise. Naturally, this will affect the structuralcalculations that have been carried out up to this point, as well as coming calculations.
8.1.4 FE-Analysis of Racks
Regarding the racks, some further structural work needs to be done. This work concerns theattachment of the racks to the hull, as well as FE-analysing the racks themselves. For the FE-analysis the whole rack structure should be investigated since the preliminary design looks ateach member separately, and only using basic beam theory in hand calculations. The analysedload cases should be the following.
1. Sailors not on the racks
• Pulling force from the down wind sail and,
• Shroud force pulling upwards and inwards
2. Sailors as far forward as allowed, in trapeze
• Sailors at a point 500 mm in front of the forward support,
• Pulling force from the down wind sail and,
• Shroud force pulling upwards and inwards
3. Sailors as far backward as allowed, in trapeze
• Sailors at a point 250 mm back of the aft support,
• Pulling force from the down wind sail and,
• Shroud force pulling upwards and inwards
4. Sailor at the mid of the racks,
• Sailors placed at 600 mm aft of the forward support,
• Pulling force from the down wind sail and,
• Shroud force pulling upwards and inwards
106
8 Future Work
8.1.5 Structure of Bowsprit
Given that the bowsprit’s structural characteristics do not affect any of the other differentcomponents of the skiff, only its main dimensions are needed during the design process. Forthis reason, a FEM analysis needs to be conducted as future work, in order to access the desiredcharacteristics, such as the fibres orientation, number of plies and their respective thicknesses.
8.1.6 Deck Layout
Designing and building a skiff implements the point to make it run as well. After designing,building and joining all the individual parts an operating system on the deck is installed. Themain sail is sheeted with a block on a rail at the stem connected to a block on the end of theboom. This sheeting replaces the kicker and can be adjusted via the main sheet. A rope whichgoes out to both sides of the racks is used to move the block on the rail veering the main sail.
The trapezes are fixed with stretching ropes on the racks. Next to the mast and still reachablefrom the racks, the sheet of the selftacking jib is mounted and spread to both sides. The jib issheeted over a block sliding on a rail, which is installed closely in front of the mast. Next tojib sheet, the system to hoist and take down the Jib 0 is installed. This system is connected tothe retractable bowsprit and the Jib 0 storage making sure that the bowsprit is retracted whenthe Jib 0 is stored in the hose and extended when the Jib 0 is set. The Jib 0 is sheeted on thetop part of the racks extension to enable the best wind attacking angle possible. Furthermore,the Jib 0 sheet is connected to a floating sheeting point between racks and hull for being ableto use the Jib 0 upwind with a perfect sheeting angle as well.
To make sure that all these system is working together, all the system has to be implemented inthe GA. This to make sure that the ropes do not cross each other as well as the do not interferewith each other in a bad way. Therefore it has to be more investigated in the future.
8.2 Future Investigations
Many concepts have been mentioned during the project, but not all have been investigated.There are several reasons for this. Some concepts did not seem plausible, and many wouldtake too much time from designing a proper hull. The fact that these concepts have not beeninvestigated does not mean they are not interesting in the project context, which is why theyare mentioned in this section for future reference.
8.2.1 Hull Fluid Dynamics
During the process, a proper CFD analysis has not been carried out as far as it regards theshaping of deck, freeboard height, and transom. Bethwaite (2008) has been used as a referencewhen alteration of the transom have been computed. Moreover, given the satisfying resultsobtained with the first sloped transom, no further analyses has been implemented. The alter-ations that saw a lowered freeboard have been on the same track. Finalised the optimisationof the hull in terms of submerged portion, the freeboard has been cut lower. The interactionbetween the lowered freeboard and the sloped transom determined a further improvement inthe performances of the skiff, however no systematic variation of these two geometries and theirinteraction has been carried out. It might therefore be worthwhile investigate such combinationof solutions in order to achieve an optimal ratio between the two components.
The introduction of the cambered shape for the deck has been considered in terms of ergonomicsadvantages for the sailors, in order to avoid in total the presence of water on board and to
107
8 Future Work
improve structural properties of the complete geometry. The contribution to total dynamicresistance has however not been computed, therefore such shape is probably not optimal and afurther step in terms of CFD computations has definitely to investigate such solution.
Furthermore a study on boat-tailing the skiff should also be conducted, as it might provebeneficial from a resistance point of view.
Moreover a global resistance prediction, considering the hull complete with appendages, shouldbe carried out. Time limitations and set up complexity have however prevent the implementa-tion of such computations and therefore hydrodynamic optimisation under such point of view.
Different CoG, therefore different trim angles, have been assigned to specific speeds. It has notbeen evaluated however a variation of the trimming conditions within a fixed speed. Futureinvestigations can focus on such aspect and optimise the configuration of the skiff while sailing.
8.2.2 Wing Sails
The usage of wing sails on the skiff instead of a traditional rig and sails is allowed in the R3class rules. A wing sail can be made as a hard wing consisting of two or more hinged verticalelements, or as a soft wing where the wing surfaces are made from regular sail cloth. Thecommon trait for the two alternatives is the lack of standing rigging, and the variable camber ofthe wing. A wing sail is more efficient than a traditional rig and sail and is affected by induceddrag to a much lower extent due to the more efficient square or elliptical planform, as opposedto the triangular planform of an ordinary sail (Nielsen, 2014).
The main obstacle when using a wing sail in the design however, is that the R3 class rulesstate that this kind of sail must be designed and built by the project group. Aside from thehigh difficulty of building an advantage bringing wind sail, a considerable amount of workloadis added. Furthermore, a certain amount of water hours are needed to perfect the handling ofthis sail. This may not be a problem if an existing hull is retrofitted with a wing sail.
8.2.3 Foiling
It has been proven and shown in practice that making a boat sail with its hull completelyemerged (to foil), only resting on a set of hydrofoils attached to the lower end of the ap-pendages, is entirely possible. Recently, even an optimist dinghy could be made to foil withsome modification (Andersson et al., 2017). This opens up the future possibility of designing afoiling skiff, since the design of the appendages is completely unregulated in the R3 class rules.If such a design could be made successful, it would give a great advantage to the team.
The idea of designing a foiling skiff in this project was dropped very soon in the initial stagessince it would add a considerable amount of work to an already work intensive project. Itwas decided instead to design a more traditional skiff in order to focus fully on the hull de-sign. Adding foils would most likely need the hull to be altered in order to provide optimalhydrodynamic performance.
The possibility to use foils could however be interesting in future projects where more timecan be spent on evaluating new alternatives to the design. There is already a bachelor thesisavailable at Chalmers University of Technology where the option of adding foils to the currentskiff will be evaluated (Larsson, 2017).
8.2.4 Rotating Racks
As mentioned in Section 5.3.2.1 one opportunity is to implement a rotating system if the racks.This is crossed out due to the fact that it was not possible at that stage in the project to have
108

8 Future Work
rotating forward support as well. Cause in the case it was just the aft section that was rotatedit gave a to wide beam. If it is possible to get the forward support rotating this should be onething to investigate, cause then it is possible to earn some lever arm for the sailors. This willhelp to create a higher righting moment which gives the possibility to have more sail area.
At the same time the system can be built in to rotate the mast to the windward as well. Thiswill give even better sail performance since then the projected sail area will be larger than itwould have been in the case if the rig has some heeling angle.
8.2.5 Rotating Bowsprit
Furthermore, the rotating bowsprit concept mentioned in Section 5.2.2.3 is of great interest,as having the sails at their desired shape increases their efficiency. Therefore a study on thecombination of such a bowsprit with a two sails plan is of potential interest to be carried outin the future.
109

8 Future Work
110
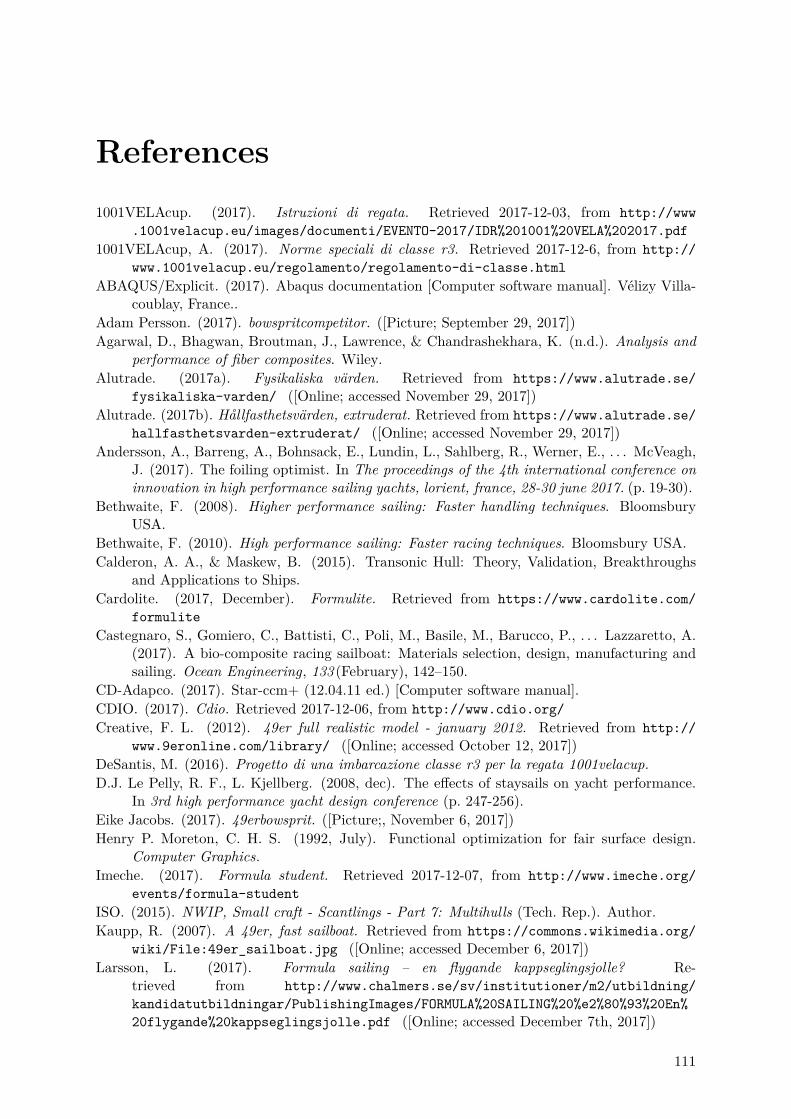
References
1001VELAcup. (2017). Istruzioni di regata. Retrieved 2017-12-03, from http://www
.1001velacup.eu/images/documenti/EVENTO-2017/IDR%201001%20VELA%202017.pdf
1001VELAcup, A. (2017). Norme speciali di classe r3. Retrieved 2017-12-6, from http://
www.1001velacup.eu/regolamento/regolamento-di-classe.html
ABAQUS/Explicit. (2017). Abaqus documentation [Computer software manual]. Vélizy Villa-coublay, France..
Adam Persson. (2017). bowspritcompetitor. ([Picture; September 29, 2017])
Agarwal, D., Bhagwan, Broutman, J., Lawrence, & Chandrashekhara, K. (n.d.). Analysis and
performance of fiber composites. Wiley.
Alutrade. (2017a). Fysikaliska värden. Retrieved from https://www.alutrade.se/
fysikaliska-varden/ ([Online; accessed November 29, 2017])
Alutrade. (2017b). Hållfasthetsvärden, extruderat. Retrieved from https://www.alutrade.se/
hallfasthetsvarden-extruderat/ ([Online; accessed November 29, 2017])
Andersson, A., Barreng, A., Bohnsack, E., Lundin, L., Sahlberg, R., Werner, E., . . . McVeagh,J. (2017). The foiling optimist. In The proceedings of the 4th international conference on
innovation in high performance sailing yachts, lorient, france, 28-30 june 2017. (p. 19-30).
Bethwaite, F. (2008). Higher performance sailing: Faster handling techniques. BloomsburyUSA.
Bethwaite, F. (2010). High performance sailing: Faster racing techniques. Bloomsbury USA.
Calderon, A. A., & Maskew, B. (2015). Transonic Hull: Theory, Validation, Breakthroughsand Applications to Ships.
Cardolite. (2017, December). Formulite. Retrieved from https://www.cardolite.com/
formulite
Castegnaro, S., Gomiero, C., Battisti, C., Poli, M., Basile, M., Barucco, P., . . . Lazzaretto, A.(2017). A bio-composite racing sailboat: Materials selection, design, manufacturing andsailing. Ocean Engineering, 133 (February), 142–150.
CD-Adapco. (2017). Star-ccm+ (12.04.11 ed.) [Computer software manual].
CDIO. (2017). Cdio. Retrieved 2017-12-06, from http://www.cdio.org/
Creative, F. L. (2012). 49er full realistic model - january 2012. Retrieved from http://
www.9eronline.com/library/ ([Online; accessed October 12, 2017])
DeSantis, M. (2016). Progetto di una imbarcazione classe r3 per la regata 1001velacup.
D.J. Le Pelly, R. F., L. Kjellberg. (2008, dec). The effects of staysails on yacht performance.In 3rd high performance yacht design conference (p. 247-256).
Eike Jacobs. (2017). 49erbowsprit. ([Picture;, November 6, 2017])
Henry P. Moreton, C. H. S. (1992, July). Functional optimization for fair surface design.Computer Graphics.
Imeche. (2017). Formula student. Retrieved 2017-12-07, from http://www.imeche.org/
events/formula-student
ISO. (2015). NWIP, Small craft - Scantlings - Part 7: Multihulls (Tech. Rep.). Author.
Kaupp, R. (2007). A 49er, fast sailboat. Retrieved from https://commons.wikimedia.org/
wiki/File:49er_sailboat.jpg ([Online; accessed December 6, 2017])
Larsson, L. (2017). Formula sailing – en flygande kappseglingsjolle? Re-trieved from http://www.chalmers.se/sv/institutioner/m2/utbildning/
kandidatutbildningar/PublishingImages/FORMULA%20SAILING%20%e2%80%93%20En%
20flygande%20kappseglingsjolle.pdf ([Online; accessed December 7th, 2017])
111
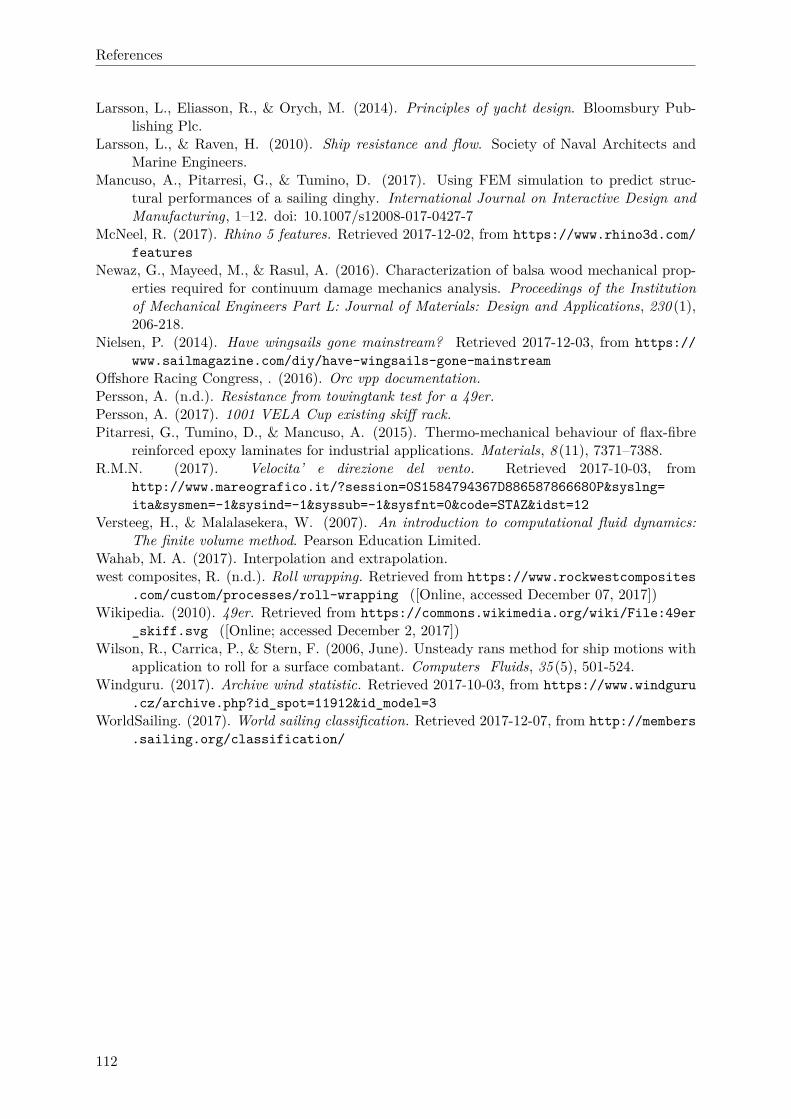
References
Larsson, L., Eliasson, R., & Orych, M. (2014). Principles of yacht design. Bloomsbury Pub-lishing Plc.
Larsson, L., & Raven, H. (2010). Ship resistance and flow. Society of Naval Architects andMarine Engineers.
Mancuso, A., Pitarresi, G., & Tumino, D. (2017). Using FEM simulation to predict struc-tural performances of a sailing dinghy. International Journal on Interactive Design and
Manufacturing, 1–12. doi: 10.1007/s12008-017-0427-7McNeel, R. (2017). Rhino 5 features. Retrieved 2017-12-02, from https://www.rhino3d.com/
features
Newaz, G., Mayeed, M., & Rasul, A. (2016). Characterization of balsa wood mechanical prop-erties required for continuum damage mechanics analysis. Proceedings of the Institution
of Mechanical Engineers Part L: Journal of Materials: Design and Applications, 230 (1),206-218.
Nielsen, P. (2014). Have wingsails gone mainstream? Retrieved 2017-12-03, from https://
www.sailmagazine.com/diy/have-wingsails-gone-mainstream
Offshore Racing Congress, . (2016). Orc vpp documentation.
Persson, A. (n.d.). Resistance from towingtank test for a 49er.
Persson, A. (2017). 1001 VELA Cup existing skiff rack.
Pitarresi, G., Tumino, D., & Mancuso, A. (2015). Thermo-mechanical behaviour of flax-fibrereinforced epoxy laminates for industrial applications. Materials, 8 (11), 7371–7388.
R.M.N. (2017). Velocita’ e direzione del vento. Retrieved 2017-10-03, fromhttp://www.mareografico.it/?session=0S1584794367D886587866680P&syslng=
ita&sysmen=-1&sysind=-1&syssub=-1&sysfnt=0&code=STAZ&idst=12
Versteeg, H., & Malalasekera, W. (2007). An introduction to computational fluid dynamics:
The finite volume method. Pearson Education Limited.Wahab, M. A. (2017). Interpolation and extrapolation.west composites, R. (n.d.). Roll wrapping. Retrieved from https://www.rockwestcomposites
.com/custom/processes/roll-wrapping ([Online, accessed December 07, 2017])Wikipedia. (2010). 49er. Retrieved from https://commons.wikimedia.org/wiki/File:49er
_skiff.svg ([Online; accessed December 2, 2017])Wilson, R., Carrica, P., & Stern, F. (2006, June). Unsteady rans method for ship motions with
application to roll for a surface combatant. Computers Fluids, 35 (5), 501-524.Windguru. (2017). Archive wind statistic. Retrieved 2017-10-03, from https://www.windguru
.cz/archive.php?id_spot=11912&id_model=3
WorldSailing. (2017). World sailing classification. Retrieved 2017-12-07, from http://members
.sailing.org/classification/
112

Appendix A - Drawings
1. CFS 2017/2018 - 0 - General Arrangement
2. CFS 2017/2018 - 001 - Hull Drawing
3. CFS 2017/2018 - 102 - Deck Drawing
4. Seldén Mast - Rig Drawing
I
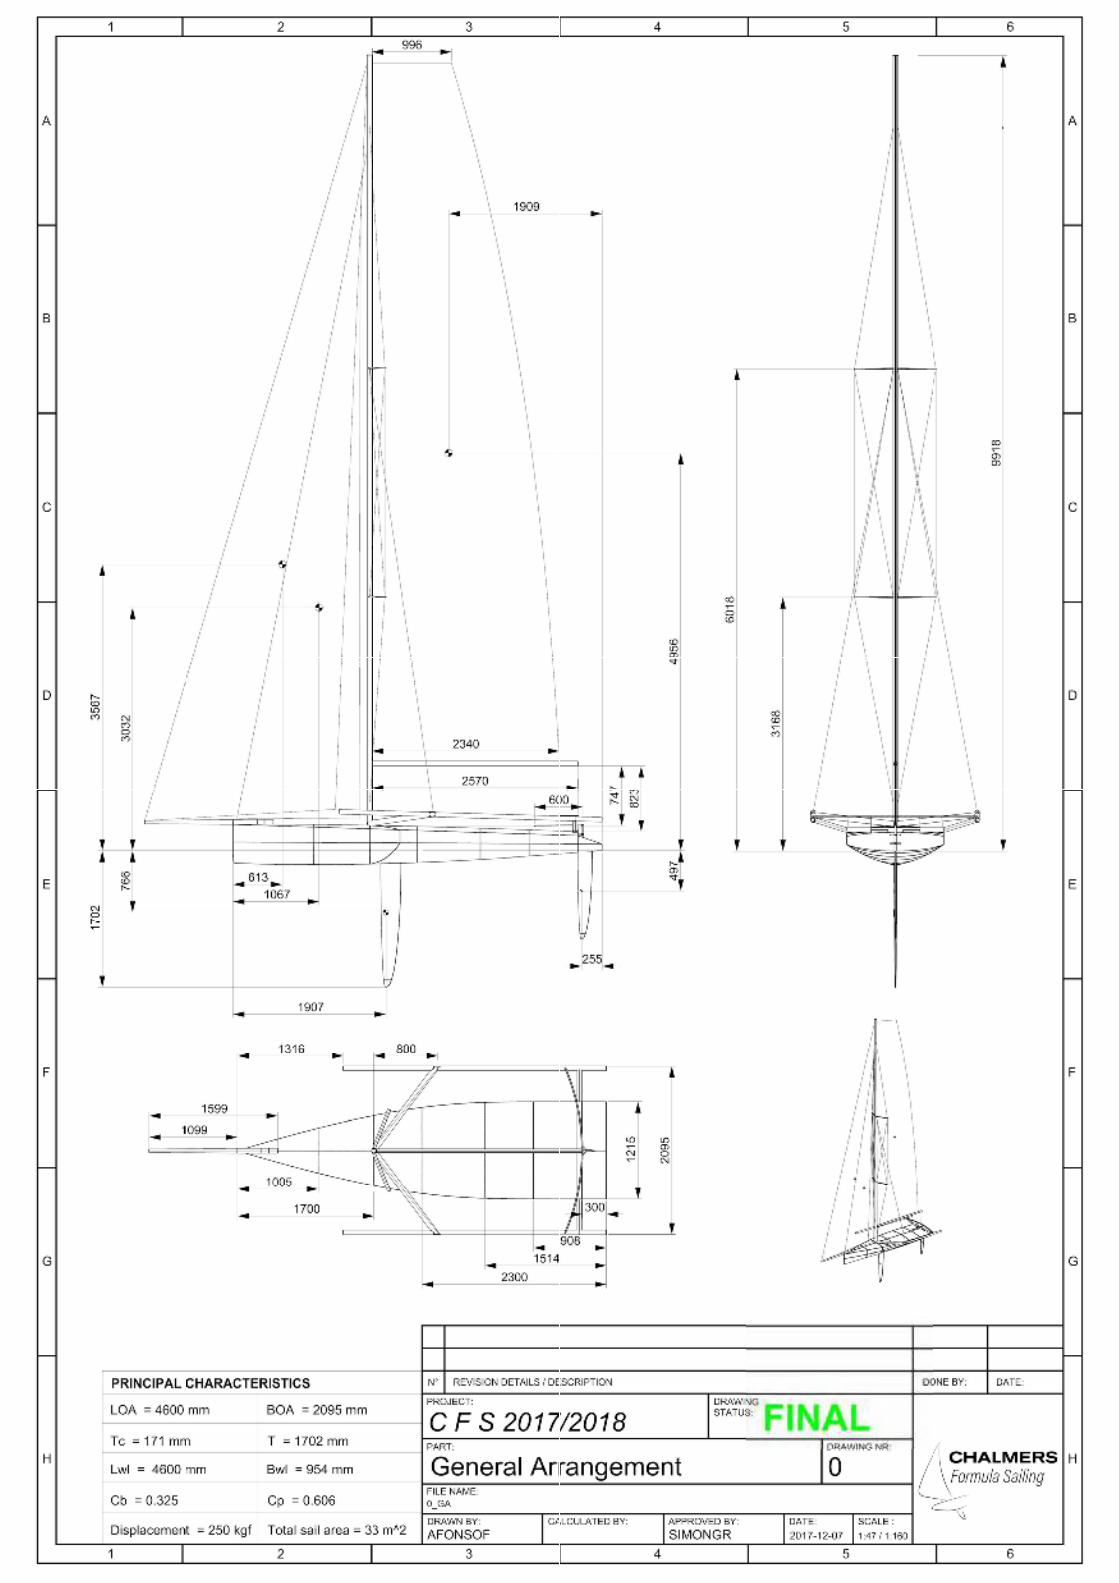

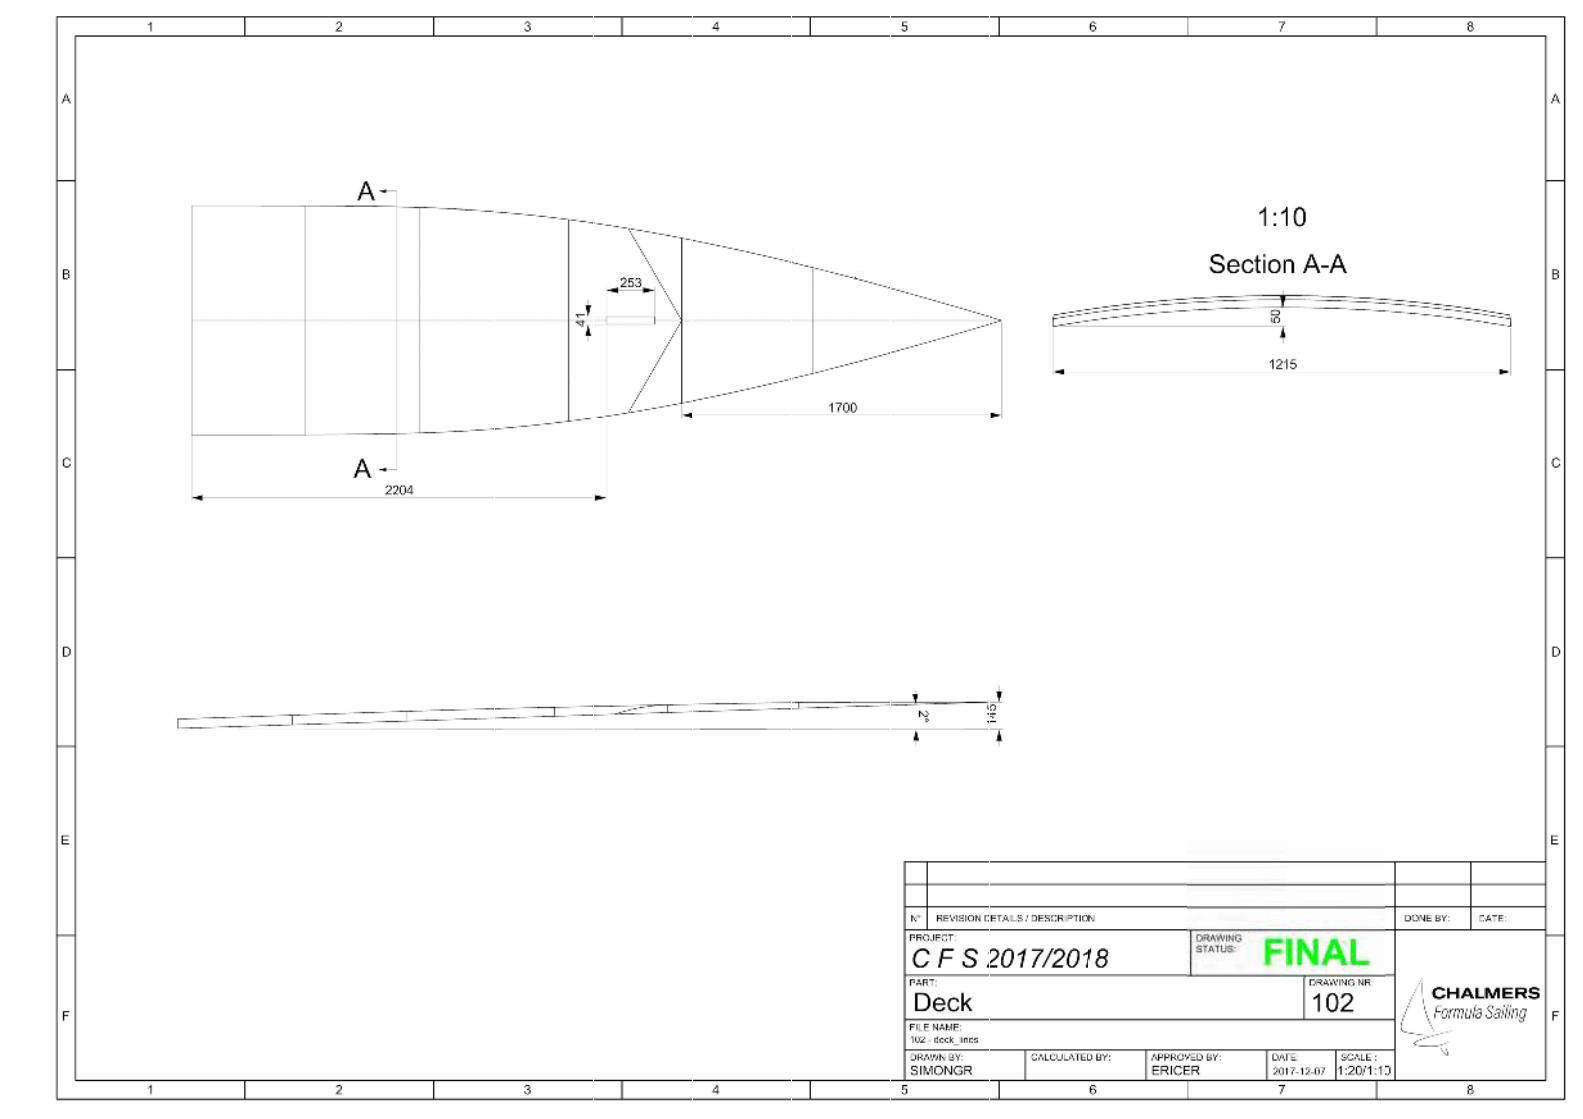

FORMULA SAILING 2018 9.5M IIRig data no. M2211:
Copyright © 1996-2017 Selden Mast AB [email protected] printed 2017-12-06 11:18:07
FSø311,2°1/4"
Diamond angle: 17°
To
tal le
ng
th:
95
50
(8
00
+8
70
0+
50
)
CAP
8720
CAPø36,5°1/4"
LWRø310,0°1/4"
800P35
800 P35 Linked
RD1
400
28
50
28
50
28
50
D3
8410
10
00
RD1/V2ø317,3°1/4"
RD210,7°M24
D3ø315,8°
Customer: CHALMERS UNIVERSITYSales manager: Per WretlindDate created: 17-11-27Latest revision: 17-11-30Not approved
For quotation only.Specifications may be changed in actual production
General rig descriptionDouble diamonds with lower shroudsConventional Untapered
Rig dimensionsForestay height FH: 8 550 mm
Main sail luff length P: 8 700 mm
Boom height above deck BH: 800 mm
Main sail foot length E: 2 340 mm
Main boom sheet pos S: 2 595 mm
Chainplates dist. from cl mastLateral Long
Cap shrouds: 1050 1000 mm (43,6°)
Lower shrouds: 1050 1000 mm (43,6°)
Forestay: 1700 mm
Deck above chainplates: 0 mm
Deck above waterline: 246 mm
Craft data and righting momentCATAMARANLength: 4 600 mm
Beam: 2 100 mm
C-C Hulls: 2 100 mm
Displacement: 310 Kg
Equipped boatDimensioning RM: 3,2 kNm
Spar sectionsMast: C069Boom: B087 No kicker
Square mainsail roach2:1 purchase for main halyard
Masthead gennaker and code zero OK2:1 purchase system for code zero halyard
FurlexForestay: X
Notes (17 lines)Rig setup for Chalmers University Formula sailing competition 2018.
Total sail area with gennaker app. 33m2
Monohull with max length 4600mm, max beam 2100mm
2x75kg crew in trapeze at cap shroud fitting 8720
Rotating mast, main boom to be fixed to the mast in rotating direction.
Main boom Spin poole S038 main sheet fitting on mast S1=2500 Sheet lead block position on boom to be set.(section requirement may be changed)Panel 1 = 3250, Panel 2 = 2900

Appendix A - Drawings
VI
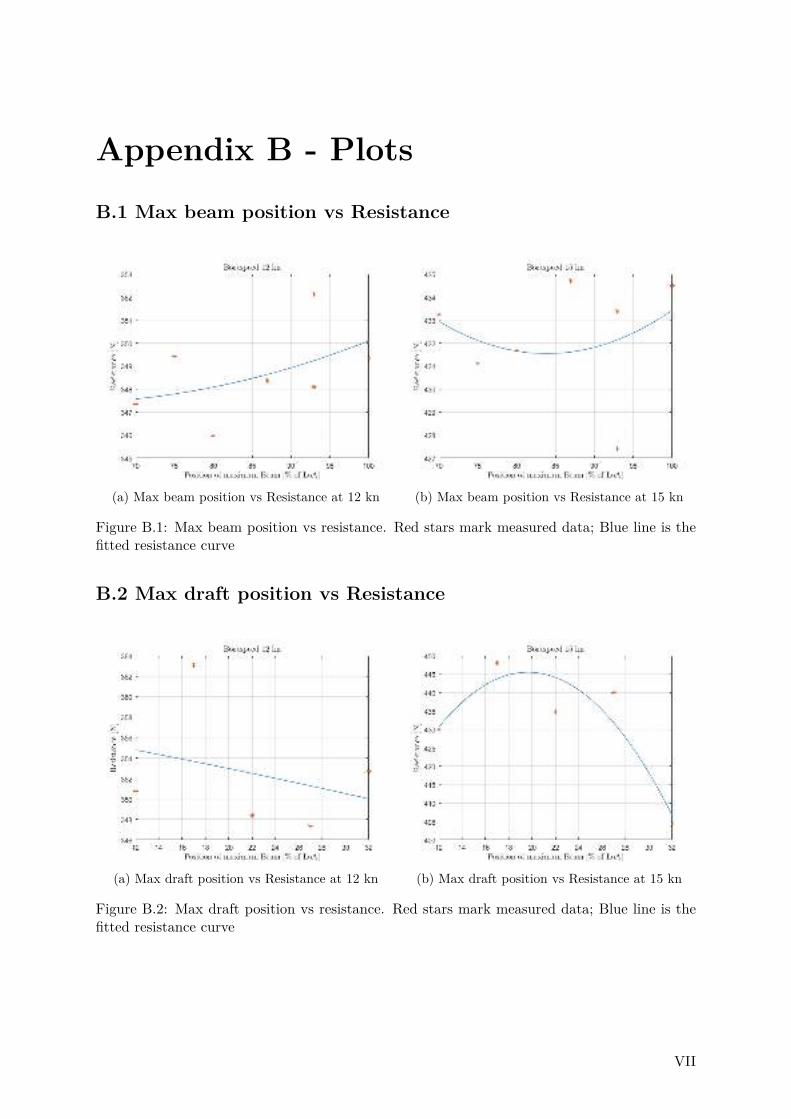
Appendix B - Plots
B.1 Max beam position vs Resistance
(a) Max beam position vs Resistance at 12 kn (b) Max beam position vs Resistance at 15 kn
Figure B.1: Max beam position vs resistance. Red stars mark measured data; Blue line is thefitted resistance curve
B.2 Max draft position vs Resistance
(a) Max draft position vs Resistance at 12 kn (b) Max draft position vs Resistance at 15 kn
Figure B.2: Max draft position vs resistance. Red stars mark measured data; Blue line is thefitted resistance curve
VII

B.2 Max draft position vs Resistance
VIII

Appendix C - Rules
IX
10011ELACUP
CHALLENGE R3
Special Rules Class R3
2017-2020
!!! !his is a translation of the original text : If there is a conflict between languages the Italian text will take
precedence. !!!
Premise
!his Rules aims to promote a regatta’s program for sailboats designed and manifactured inside universities,
under a common teaching program and in accordance with a Class Rule R3 which sets out the features.Premessa
Con il presente regolamento si intende promuovere un programma di regate tra barche a vela progettate e realizzate all’interno
di strutture universitarie, nel quadro di un programma didattico comune e nel rispetto di un Regolamento di classe R3 che ne
stabilisce le caratteristiche.
Aims
Aims of the universities participating in the initiative is to organize within their internal structures (in thesis
courses, workshops, laboratory activities, extracurricular activityes, etc.) annual teaching activity aimed at
the design and implementation of sailboats 15 feet long in accordance with the specifications and
requirements of the Class Rule R3.Obiettivi
Obiettivo degli Atenei che aderiscono all’iniziativa è quello di organizzare all’interno delle loro strutture (nell’ambito di corsi o
tesi di laurea, workshop, attività di laboratorio, extracurriculari ecc.) un’attività didattica annuale finalizzata alla progettazione
e realizzazione di una deriva da 15’ che risponda alle caratteristiche e ai requisiti previsti dal Regolamento di classe R3.
Purpose
!he purpose of the initiative is to promote an annual or bi-annual, meeting between the universityes that
agree the 1001VELAcup aims.
!he calendar and the program of events will be defined by the !echnical Committee provided for in
Regulation R3 class, after hearing the proposals of the University who won the previous edition and the
other participating universities.Finalità
Scopo dell’iniziativa è quello di promuovere, con cadenza annuale o biennale, un incontro tra le Università che aderiscono
all’iniziativa “Mille e una vela cup”.
Il calendario e il programma delle manifestazioni verranno definiti dalla Commissione Tecnica prevista dal Regolamento di
classe R3, sentite le proposte dell’Ateneo che si è aggiudicato la precedente edizione e degli altri Atenei partecipanti.
Generalities
!he boats partecipating to the program 1001VELAcup must comply with these "Special Rules, be designed
and constructed, in accordance with the Rules of Class R3, and be governed by teams composed of
Universities students.Generalità
Le imbarcazioni che partecipano al programma “Mille e una vela cup” devono rispettare le presenti “Norme speciali di Classe
R3”, essere progettate e realizzate, secondo quanto stabilito dal Regolamento di Classe R3, ed essere governate da equipaggi
formati da studenti iscritti presso qualsiasi Ateneo.
1) Elegibility for the “10011ELAcup's Throphy
Crew:
a) !he crews must be composed by students enrolled in participating Universities
b) All crew shall not hold a Group 3 Classification (World Sailing Sailor Code) (Annex “D”).
c) In regattas with multiple consecutive trials, the crew (min. 2 persons) is fixed for the duration of the event
d) Students older than 30 are not admitted.
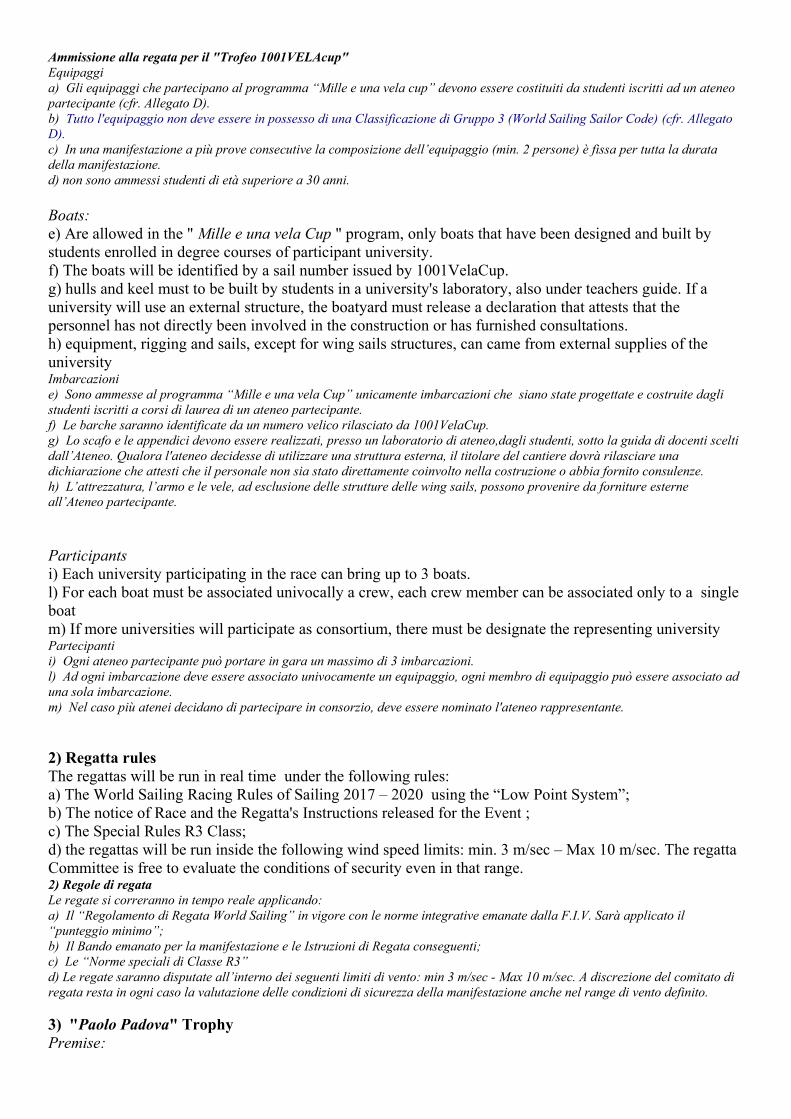
Ammissione alla regata per il "Trofeo 1001VELAcup"
Equipaggi
a) Gli equipaggi che partecipano al programma “Mille e una vela cup” devono essere costituiti da studenti iscritti ad un ateneo
partecipante (cfr. Allegato D).
b) Tutto l'equipaggio non deve essere in possesso di una Classificazione di Gruppo 3 (World Sailing Sailor Code) (cfr. Allegato
D).
c) In una manifestazione a più prove consecutive la composizione dell’equipaggio (min. 2 persone) è fissa per tutta la durata
della manifestazione.
d) non sono ammessi studenti di età superiore a 30 anni.
Boats:
e) Are allowed in the " Mille e una vela Cup " program, only boats that have been designed and built by
students enrolled in degree courses of participant university.
f) !he boats will be identified by a sail number issued by 1001VelaCup.
g) hulls and keel must to be built by students in a university's laboratory, also under teachers guide. If a
university will use an external structure, the boatyard must release a declaration that attests that the
personnel has not directly been involved in the construction or has furnished consultations.
h) equipment, rigging and sails, except for wing sails structures, can came from external supplies of the
universityImbarcazioni
e) Sono ammesse al programma “Mille e una vela Cup” unicamente imbarcazioni che siano state progettate e costruite dagli
studenti iscritti a corsi di laurea di un ateneo partecipante.
f) Le barche saranno identificate da un numero velico rilasciato da 1001VelaCup.
g) Lo scafo e le appendici devono essere realizzati, presso un laboratorio di ateneo,dagli studenti, sotto la guida di docenti scelti
dall’Ateneo. Qualora l'ateneo decidesse di utilizzare una struttura esterna, il titolare del cantiere dovrà rilasciare una
dichiarazione che attesti che il personale non sia stato direttamente coinvolto nella costruzione o abbia fornito consulenze.
h) L’attrezzatura, l’armo e le vele, ad esclusione delle strutture delle wing sails, possono provenire da forniture esterne
all’Ateneo partecipante.
Participants
i) Each university participating in the race can bring up to 3 boats.
l) For each boat must be associated univocally a crew, each crew member can be associated only to a single
boat
m) If more universities will participate as consortium, there must be designate the representing universityPartecipanti
i) Ogni ateneo partecipante può portare in gara un massimo di 3 imbarcazioni.
l) Ad ogni imbarcazione deve essere associato univocamente un equipaggio, ogni membro di equipaggio può essere associato ad
una sola imbarcazione.
m) Nel caso più atenei decidano di partecipare in consorzio, deve essere nominato l'ateneo rappresentante.
2) Regatta rules
!he regattas will be run in real time under the following rules:
a) !he World Sailing Racing Rules of Sailing 2017 – 2020 using the “Low Point System”;
b) !he notice of Race and the Regatta's Instructions released for the Event ;
c) !he Special Rules R3 Class;
d) the regattas will be run inside the following wind speed limits: min. 3 m/sec – Max 10 m/sec. !he regatta
Committee is free to evaluate the conditions of security even in that range.2) Regole di regata
Le regate si correranno in tempo reale applicando:
a) Il “Regolamento di Regata World Sailing” in vigore con le norme integrative emanate dalla F.I.V. Sarà applicato il
“punteggio minimo”;
b) Il Bando emanato per la manifestazione e le Istruzioni di Regata conseguenti;
c) Le “Norme speciali di Classe R3”
d) Le regate saranno disputate all’interno dei seguenti limiti di vento: min 3 m/sec - Max 10 m/sec. A discrezione del comitato di
regata resta in ogni caso la valutazione delle condizioni di sicurezza della manifestazione anche nel range di vento definito.
3) "Paolo Padova" Trophy
Premise:
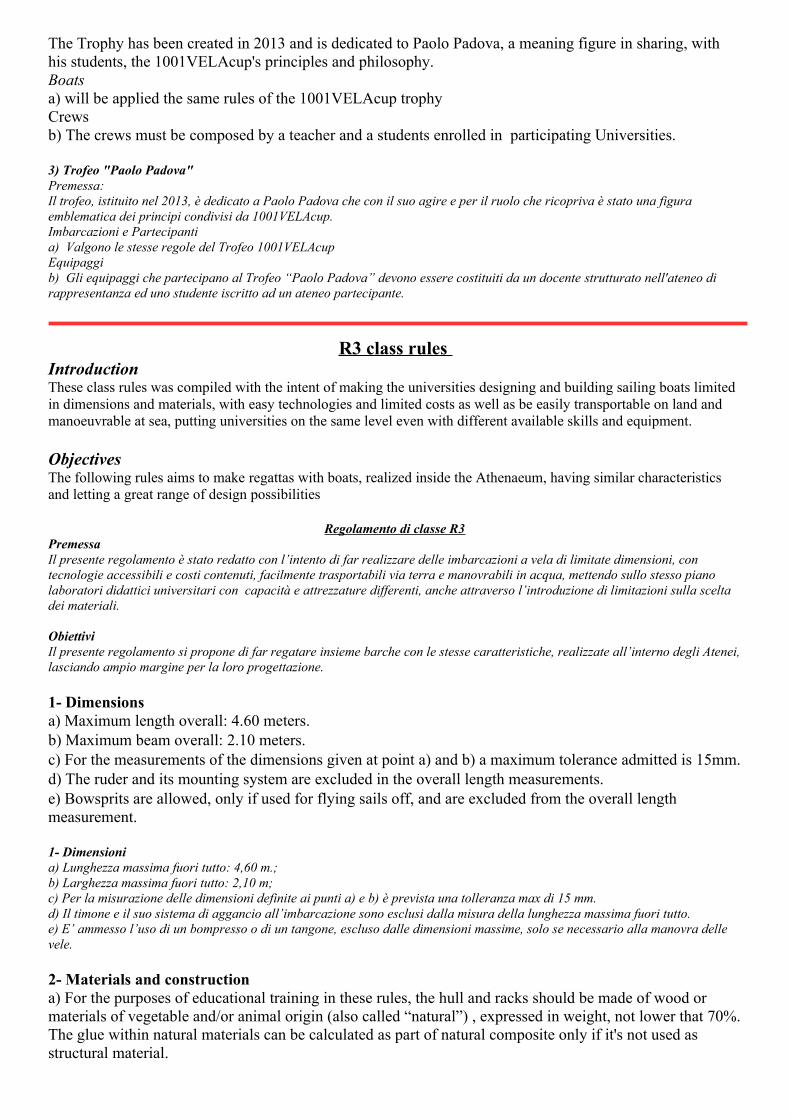
!he !rophy has been created in 2013 and is dedicated to Paolo Padova, a meaning figure in sharing, with
his students, the 1001VELAcup's principles and philosophy.
Boats
a) will be applied the same rules of the 1001VELAcup trophy
Crews
b) !he crews must be composed by a teacher and a students enrolled in participating Universities.
3) Trofeo "Paolo Padova"
Premessa:
Il trofeo, istituito nel 2013, è dedicato a Paolo Padova che con il suo agire e per il ruolo che ricopriva è stato una figura
emblematica dei principi condivisi da 1001VELAcup.
Imbarcazioni e Partecipanti
a) Valgono le stesse regole del Trofeo 1001VELAcup
Equipaggi
b) Gli equipaggi che partecipano al Trofeo “Paolo Padova” devono essere costituiti da un docente strutturato nell'ateneo di
rappresentanza ed uno studente iscritto ad un ateneo partecipante.
R3 class rules Introduction !hese class rules was compiled with the intent of making the universities designing and building sailing boats limited
in dimensions and materials, with easy technologies and limited costs as well as be easily transportable on land and
manoeuvrable at sea, putting universities on the same level even with different available skills and equipment.
Objectives !he following rules aims to make regattas with boats, realized inside the Athenaeum, having similar characteristics
and letting a great range of design possibilities
Regolamento di classe R3
Premessa
Il presente regolamento è stato redatto con l’intento di far realizzare delle imbarcazioni a vela di limitate dimensioni, con
tecnologie accessibili e costi contenuti, facilmente trasportabili via terra e manovrabili in acqua, mettendo sullo stesso piano
laboratori didattici universitari con capacità e attrezzature differenti, anche attraverso l’introduzione di limitazioni sulla scelta
dei materiali.
Obiettivi
Il presente regolamento si propone di far regatare insieme barche con le stesse caratteristiche, realizzate all’interno degli Atenei,
lasciando ampio margine per la loro progettazione.
1- Dimensions
a) Maximum length overall: 4.60 meters.
b) Maximum beam overall: 2.10 meters.
c) For the measurements of the dimensions given at point a) and b) a maximum tolerance admitted is 15mm.
d) !he ruder and its mounting system are excluded in the overall length measurements.
e) Bowsprits are allowed, only if used for flying sails off, and are excluded from the overall length
measurement.
1- Dimensioni
a) Lunghezza massima fuori tutto: 4,60 m.;
b) Larghezza massima fuori tutto: 2,10 m;
c) Per la misurazione delle dimensioni definite ai punti a) e b) è prevista una tolleranza max di 15 mm.
d) Il timone e il suo sistema di aggancio all’imbarcazione sono esclusi dalla misura della lunghezza massima fuori tutto.
e) E’ ammesso l’uso di un bompresso o di un tangone, escluso dalle dimensioni massime, solo se necessario alla manovra delle
vele.
2- Materials and construction
a) For the purposes of educational training in these rules, the hull and racks should be made of wood or
materials of vegetable and/or animal origin (also called “natural”) , expressed in weight, not lower that 70%.
!he glue within natural materials can be calculated as part of natural composite only if it's not used as
structural material.
b) !he use of hiking wings (or racks) is allowed if i's in accordance with the dimensional and material
composition limits.
c) !he following materials are banned: aramid fibres, carbon fibres, titanium.
d) Carbon fibre can only be used for the bowsprit and the appendices.
e) Spectra (polyethylene) can be used for rigging.
f) !he sails cannot be made from Kevlar, spectra, carbon or other high modulus fibres and they must have a
statement from the sail maker.
g) !he mast and boom must be made from extruded aluminium or, in exclusion of the matrix material, in
natural fibers.
2- Materiali e costruzione
a) Per gli scopi didattico formativi che si pone il presente regolamento, l’insieme scafo-coperta-terrazze dovrà prevedere un
contenuto in legno o materiali di origine vegetale e/o animale (in seguito detti anche “naturali”), espresso in peso, non inferiore
al 70%. Il collante può rientrare nel calcolo dei materiali naturali solo se necessario all' incollaggio tra questi e non sia
utilizzato come materiale strutturale.
b ) E’ ammesso l’uso di terrazze nel rispetto dei limiti dimensionali e costruttivi definiti.
c ) Ad eccezione di quanto specificatamente consentito, nella realizzazione di scafo, coperta, terrazze appendici, albero e boma
non sono ammessi i seguenti materiali: fibre aramidiche, fibre di carbonio, titanio.
d) E' ammesso l'utilizzo di fibre ad alto modulo per la realizzazione del solo bompresso e delle appendici.
e) E' ammesso l'uso di polietilene per il sartiame.
f) Le vele non possono essere realizzate in fibre aramidiche, carbonio o altre fibre ad alto modulo e dovranno essere
accompagnate da una dichiarazione del velaio riportante le misure di stazza come descritte negli allegati C e C1.
g) L’albero e il boma devono essere realizzati con estruso in alluminio o, ad esclusione della matrice, in fibre di origine vegetale
e/o animale.
3- Appendices
a) !he number of daggerboards and foils is free, the shapes are not restricted in design.
b) It is allowed the use of Kevlar, spectra, carbon or other high modulus fibres for daggerboards and foils.
3- Appendici
a) Il numero delle appendici è libero, le sagome e superfici sono libere.
b) Per le appendici sono ammessi i seguenti materiali : fibre aramidiche, fibre di carbonio, titanio o altra fibra ad alto modulo.
4- Rig
a) !he height of the mast is not restricted.
b) !rapezes are allowed.
4- Armo
a) L’altezza dell’albero è libera.
b) Sono ammessi trapezi.
5- Sail plan
a) !he sail plan will have a maximum total surface area of thirty-three square meters.!he calculation of the
areas will be carried out in accordance with Annex C for laminate sails and according to what is indicated in
annex C1 for wing sail type; by wingsail is meant any sail which, when used, has a distance between
windward surface and leeward surface is bigger that the thickness of the sheet.
b) No kites are allowed.
c) In a regatta with more manches, only one set of sails are allowed.
d) Each university can present a measured sail set signed by an official measurer of the sail federation from
the university's country, the measures will be taken as description in annex C and C1
5- Piano velico
a) Il piano velico avrà una superficie massima complessiva pari a trentatre mq. Il calcolo delle superfici sarà effettuato secondo
quanto riportato nell’allegato C per le vele in laminato ed in base a quanto riportato nell’allegato C1 per le vele di tipo alare
(wing sail); si intende per wing sail o vela alare qualunque vela che, in esercizio, presenti una distanza tra superficie al vento e
superficie sottovento superiore allo spessore proprio della lamina.
b) Non sono ammessi armi tipo kite o aquilone
c) In una manifestazione a più prove consecutive è ammesso un solo gioco di vele
d) Qualunque ateneo può presentare le vele già stazzate da uno stazzatore, autorizzato della federazione velica dello satato di
appartenenza, seguendo le indicazioni dgli allegati C e C1.
6- Hull
a) !he hull must not have concavities in cross sections below the waterline.
b) It must be a monohull; multihulls are not allowed.
c) !he hull must not have asymmetrical cross-sections.
d) !he hull must be able to provide sufficient buoyancy to the safety of the vessel and its crew, of at least 80
litres; in the form of foam, expanded material, air bags and/or inspectable watertight compartments. !he
caps of the inspection holes will be minimum 2 an have a diameter of 12 cm min. !hey must be located in
the anterior and posterior part of the boat to provide a complete inspection.
e) !he dagger-board and rudder must be securely fixed to the hull; the use of a quick release shackle with
elastic is allowed for each appendix.
6- Scafo
a) Lo scafo non deve presentare concavità nelle sezioni trasversali al di sotto della linea di galleggiamento.
b) Lo scafo deve essere unico; non sono ammessi multiscafi.
c) Lo scafo non deve presentare sezioni trasversali asimmetriche.
d) Lo scafo deve poter garantire una riserva di galleggiamento sufficiente alla sicurezza dell’imbarcazione e del suo equipaggio,
pari ad almeno 80 lt., sotto forma di schiuma, espanso, sacchi d’aria, compartimenti stagni ispezionabili. I tappi di ispezione
dovranno essere minimo 2, avere diametro minimo di 12 cm ed essere posizionati uno nella zona posteriore e uno nella zona
anteriore della coperta e comunque secondo logica in modo da permettere una adeguata ispezione.
e) E’ obbligatorio assicurare la deriva e il timone allo scafo; l’uso di un grillo a sgancio rapido con elastici è permesso per ogni
appendice.
7- Conformity and book of rules
a) !he boats must be in possession of a self-certification of the University represented showing compliance
with this Regulation in accordance with the models in Annexes A and B.
b) !he boats could be subject to compliance testing.
c) If a boat is damaged, repair or replacement of parts is permitted, as long as it complies with the class
rules.
d)If it is not possible to correct any discrepancies, they will be remedied with the installation of an on board
corrector weights from 5 kg, in number established by !.C., placed at a distance less than 50 cm from the
transom.
e) Protests regarding measurement will be accepted until two hour before the start signal of the first race,
except for infraction happened during the race/s
f) 15 days before the start of the regatta/s each entry must present (also in numeric format) the following
documents:
f1) Annex A “Self Certification of Compliance”
f2) Annex B “Weight Calculations”
f3) Draws of the forms, waterlines and construction plan
f4) Detailed technical description about the construction
f5) !echnical sheets of the used materials
f6) photos and/or clips about the construction process to support the points: f1,f2,f3 and f4.
f7)the annex D “Crew Sheet”
7- Conformità al regolamento
a) Le barche dovranno essere in possesso di una autocertificazione dell’Ateneo rappresentato attestante la conformità al
presente regolamento secondo i modelli allegati A e B.
b) Le imbarcazioni potranno essere sottoposte a verifiche di conformità.
c) Qualora una barca venga danneggiata è ammessa la riparazione o la sostituzione delle parti a seguito della quale si
verificherà nuovamente il rispetto delle regole di stazza.
d) Qualora non sia possibile correggere eventuali difformità, queste saranno sanate con l’istallazione a bordo di pesi correttori
da Kg 5, in numero stabilito dalla C.T., posti a distanza inferiore a 50 cm dallo specchio di poppa.
e) Le proteste di stazza saranno ammesse entro le 2 ore dall'inizio delle regate o serie di regate, salvo infrazioni commesse nel
corso dell'evento.
f) Entro 15 giorni dall'inizio delle regate dovranno essere presentati i seguenti documenti:
f 1) Scheda di adesione all’evento “1001VELAcup”
f 2) Allegato A “Dichiarazione di conformità” con allegata dichiarazione del velaio;
f 3) Allegato B “Calcolo dell’esponente del peso”;
f 4) Disegni delle linee d’acqua e del piano di costruzione;
f 5) Descrizione dettagliata della tecnica di costruzione adottata;
f 6) Schede tecniche dei materiali usati;
f 7) Foto e/o filmati di tutte le fasi della costruzione sufficienti a supportare quanto riportato nelle voci 2, 3, 4 ed 5
f 8) Allegato D “Scheda equipaggi” che comprende : categoria di appartenenza degli atleti (sono esclusi gli atleti facenti parte
del gruppo A – World Sailing), certificato di iscrizione all’ateneo per l’anno in corso (allegato alla scheda), tessera della
federazione velica del paese di appartenenza valida per l’anno in corso.
8- Technical committee
a) !he technical committee is composed by four members named by 1001VelaCup and by the
representatives appointed, time to time, from the first three universities classified in the regatta for the
“!rofeo 1001VELAcup”.
8- Commissione Tecnica
a) La Commissione Tecnica è costituita da quattro membri nominati da 1001VelaCup e dai rappresentanti nominati di volta in
volta dai primi tre Atenei classificatisi nella Regata per l’assegnazione del “Trofeo 1001VELAcup”.
Emendments
a) !his Regulation will be valid until October 2016.
b) !his regulation could be supplemented and / or modified by the !echnical Committee as a result of any
proposals by the universities concerned.
c) Proposed amendments must be submitted to the !echnical Committee within 7 days of being awarded the
"!rofeo 1001VELAcup."
d) !he !echnical Committee will review the proposed amendments within 30 days from the date of award
of the "!rophy 1001VELAcup."
Emendamenti
a) Il presente regolamento è valido fino a November 2020.
b) Il presente regolamento potrà essere integrato e/o modificato, dalla Commissione Tecnica a seguito di eventuali proposte da
parte degli Atenei interessati.
c) Le proposte di emendamento dovranno essere sottoposte alla Commissione Tecnica entro 7 giorni dall’assegnazione del
“Trofeo 1001VELAcup”.
d) La Commissione Tecnica provvederà a esaminare le proposte di emendamento entro 30 giorni dal termine della assegnazione
del “Trofeo 1001VELAcup”.
Interpretation
If a university requires clarification on the interpretation of some of these rules only the interpretation
expressed by the !echnical Committee will apply.
!he official language of these class rules is Italian, all interpretations will refer to the Italian language
meanings
Interpretazione
Qualora un Ateneo richiedesse chiarimenti sull’interpretazione di alcune delle presenti regole sarà valida solo l’interpretazione
espressa dalla Commissione Tecnica.
Roma, 16 Novembre 2017
Signed
the president of the !echnical Committee
Massimo Paperini

ANNEXES !O R3 CLASS RULES
ALLEGATI AL REGOLAMENTO DI CLASSE R3

ANNEX A
CLASS RULES R3
SELF CERTIFICATION OF COMPLIANCE (pt. 7A)
Boat's name : ……………………………………………………………………………...
Sail Number: (3 letters for the nationality) ….......... - (sail number)……………………..
Construction year : ……………………….
University: …………………………… Faculty : ……………………………….
Address : ………………………………………………………………………………
Telephone : +…… ………….…………….... Fax: +........ ………………………
E-mail:……………………
HULL: Rule. R3
LH (Leinght overall max) 1a (max mt. 4.60) : mt.…………………………
B (beam overall max) 1b (max mt. 2.10) : mt.…………………………
PIANO 1ELICO Rule. R3
SA (total sail surface) 5a (max mq. 33,00) : mq……………………
In attachment the certification of the sailmaker.
Norme Speciali
Wing Sail 1d) □NO □YES.
I declare to have read the Special Rules of R3 Class, I certificate the exactness of the information released in
this declaration. I accept to make the boat available for verifications.
Date : ………………… stamp of the athenaeum and signature of the person responsible :
………………………………...
____________________________________________________________________________________
Pb (corrector weights) rule 7d □NO □YES → : kg. ………………………..
.
notes:
..................................................................................................................................................................
at .............................. date: ..../..../........
the measurer the president of !.C.
.................................................. ..................................................

Annex B – WEIGHTS CALCULATIONS
Brief technical descrittion about the construction …………………………………………………………………….
……………………………………………………………………………............................................................................................
................................................................................................................................................................................................................
................................................................................................................................................................................................................
....................................................................................................................................................................................................
Note: for “Natural Material” is intended Wood or vegetal/animal materials
HULL
Hull is considered being the the ensemble of surfaces for planking, topside, underside, stern surface.
Natural Materials Stecific Weight (kg/m3) Surface (m2) Weight (kg)
1
2
3
4
5
Total
Others Materials Stecific Weight (kg/m2 o kg/m3) Quantity (m2 o m3) Weight (kg)
1
2
3
4
5
Total
STRUCTURES
Structures are the ensemble of parts such as frames, keelson, stingers, and reinforcements. Thereinforcements for rigging settings must be calculated in the “Rigging” section.
Natural Materials Stecific Weight (kg/m3) Quantity (m2 o m3) Weight (kg)
1
2
3
4
5
Total
Others Materials Stecific Weight (kg/m2 o kg/m3) Quantity (m2 o m3) Weight (kg)
1
2
3
4
5
Total

SOVRASTRUCTURES (only in natural fibres builded)
For sovrastructures is intended l' ensamble of the planking surfaces. Structural elements must becocalculated in the “Structure” section.
Natural Materials Stecific Weight (kg/m3) Surface (m2) Weight (kg)
1
2
3
4
5
Total
Others Materials Stecific Weight (kg/m2 o kg/m3) Quantity (m2 o m3) Weight (kg)
1
2
3
4
5
Total
RACKS (only if maiden in “non-natural” fibers)
This section must be filled only in case the racks (or “wings”) are maiden in materials different than “naturalfibers” . It's necessary to calculate also the local renforcements and fastenings.
Material Stecific Weight (kg/m2 o kg/m3) Quantity (m2 o m3) Weight (kg)
1
2
3
4
5
Total
Others Materials Stecific Weight (kg/m2 o kg/m3) Quantity (m2 o m3) Weight (kg)
1
2
3
4
5
Total
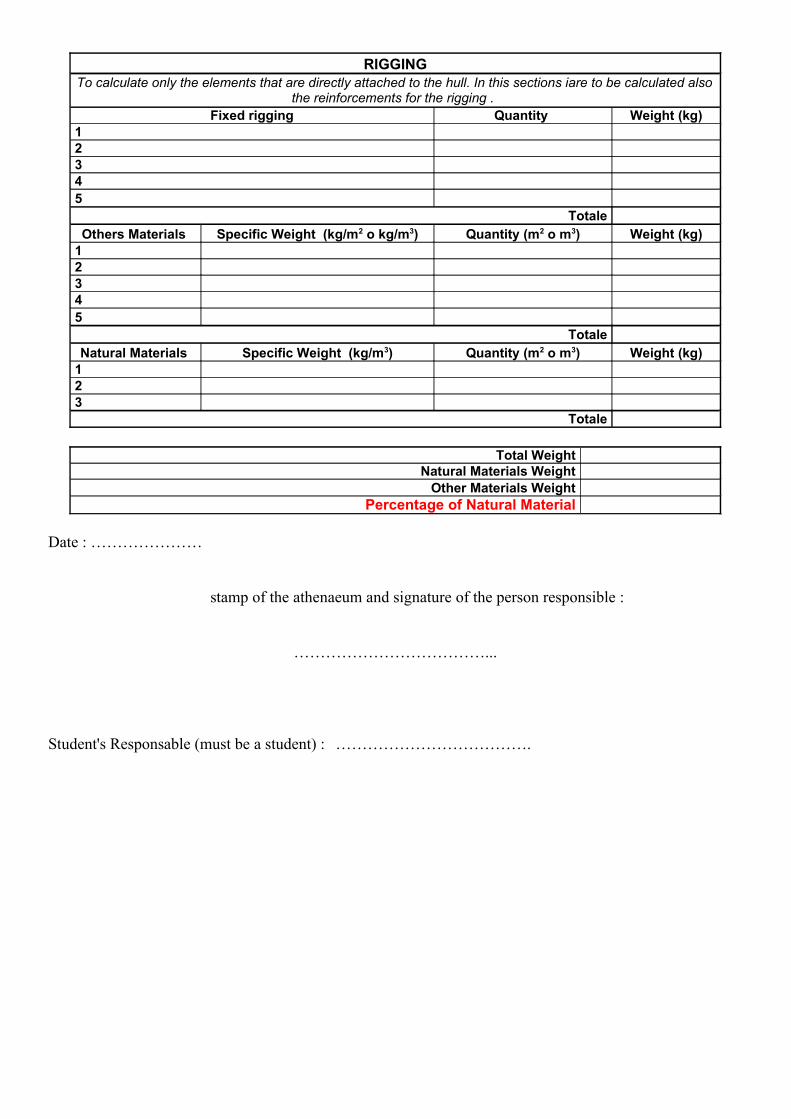
RIGGING
To calculate only the elements that are directly attached to the hull. In this sections iare to be calculated alsothe reinforcements for the rigging .
Fixed rigging Quantity Weight (kg)
1
2
3
4
5
Totale
Others Materials Stecific Weight (kg/m2 o kg/m3) Quantity (m2 o m3) Weight (kg)
1
2
3
4
5
Totale
Natural Materials Stecific Weight (kg/m3) Quantity (m2 o m3) Weight (kg)
1
2
3
Totale
Total Weight
Natural Materials Weight
Other Materials Weight
Percentage of Natural Material
Date : …………………
stamp of the athenaeum and signature of the person responsible :
………………………………...
Student's Responsable (must be a student) : ……………………………….
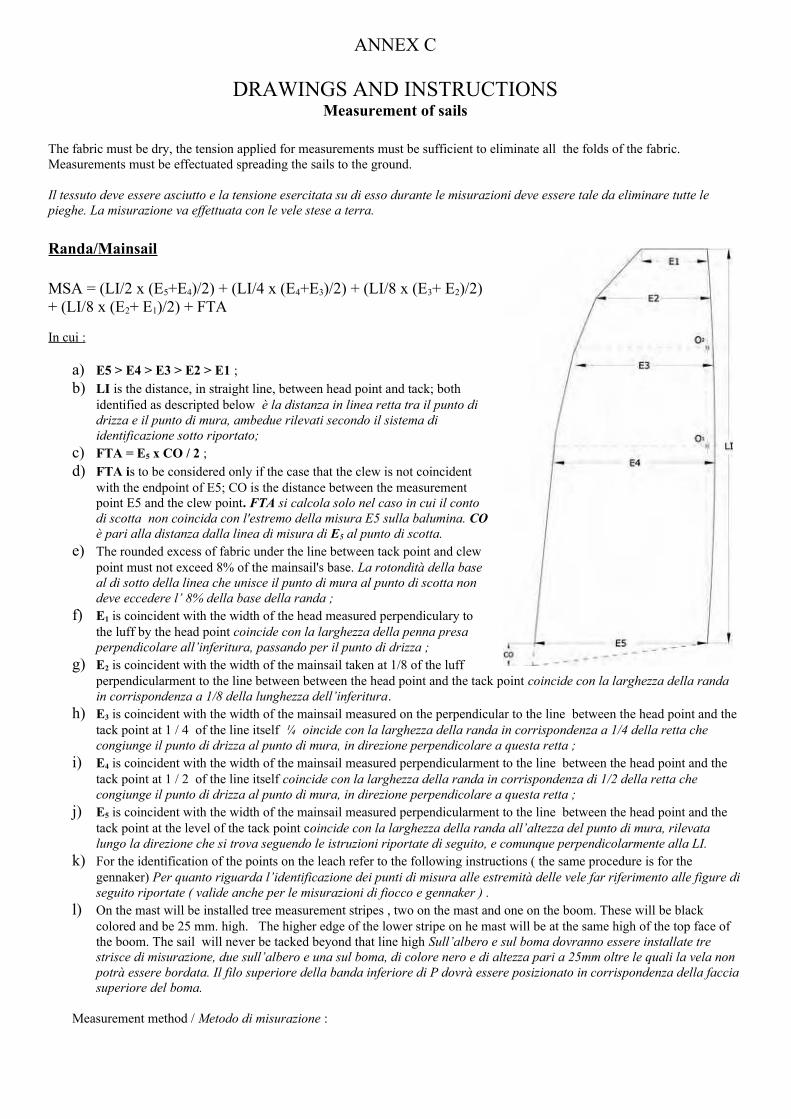
ANNEX C
DRAWINGS AND INS!RUC!IONSMeasurement of sails
!he fabric must be dry, the tension applied for measurements must be sufficient to eliminate all the folds of the fabric.
Measurements must be effectuated spreading the sails to the ground.
Il tessuto deve essere asciutto e la tensione esercitata su di esso durante le misurazioni deve essere tale da eliminare tutte le
pieghe. La misurazione va effettuata con le vele stese a terra.
Randa/Mainsail
MSA = (LI/2 x (E5+E4)/2) + (LI/4 x (E4+E3)/2) + (LI/8 x (E3+ E2)/2)
+ (LI/8 x (E2+ E1)/2) + F!A
In cui :
a) E5 > E4 > E3 > E2 > E1 ;
b) LI is the distance, in straight line, between head point and tack; both
identified as descripted below è la distanza in linea retta tra il punto di
drizza e il punto di mura, ambedue rilevati secondo il sistema di
identificazione sotto riportato;
c) FTA = E5 x CO / 2 ;
d) FTA is to be considered only if the case that the clew is not coincident
with the endpoint of E5; CO is the distance between the measurement
point E5 and the clew point. FTA si calcola solo nel caso in cui il conto
di scotta non coincida con l'estremo della misura E5 sulla balumina. CO
è pari alla distanza dalla linea di misura di E5 al punto di scotta.
e) !he rounded excess of fabric under the line between tack point and clew
point must not exceed 8% of the mainsail's base. La rotondità della base
al di sotto della linea che unisce il punto di mura al punto di scotta non
deve eccedere l’ 8% della base della randa ;
f) E1 is coincident with the width of the head measured perpendiculary to
the luff by the head point coincide con la larghezza della penna presa
perpendicolare all’inferitura, passando per il punto di drizza ;
g) E2 is coincident with the width of the mainsail taken at 1/8 of the luff
perpendicularment to the line between between the head point and the tack point coincide con la larghezza della randa
in corrispondenza a 1/8 della lunghezza dell’inferitura.
h) E3 is coincident with the width of the mainsail measured on the perpendicular to the line between the head point and the
tack point at 1 / 4 of the line itself ¼ oincide con la larghezza della randa in corrispondenza a 1/4 della retta che
congiunge il punto di drizza al punto di mura, in direzione perpendicolare a questa retta ;
i) E4 is coincident with the width of the mainsail measured perpendicularment to the line between the head point and the
tack point at 1 / 2 of the line itself coincide con la larghezza della randa in corrispondenza di 1/2 della retta che
congiunge il punto di drizza al punto di mura, in direzione perpendicolare a questa retta ;
j) E5 is coincident with the width of the mainsail measured perpendicularment to the line between the head point and the
tack point at the level of the tack point coincide con la larghezza della randa all’altezza del punto di mura, rilevata
lungo la direzione che si trova seguendo le istruzioni riportate di seguito, e comunque perpendicolarmente alla LI.
k) For the identification of the points on the leach refer to the following instructions ( the same procedure is for the
gennaker) Per quanto riguarda l’identificazione dei punti di misura alle estremità delle vele far riferimento alle figure di
seguito riportate ( valide anche per le misurazioni di fiocco e gennaker ) .
l) On the mast will be installed tree measurement stripes , two on the mast and one on the boom. !hese will be black
colored and be 25 mm. high. !he higher edge of the lower stripe on he mast will be at the same high of the top face of
the boom. !he sail will never be tacked beyond that line high Sull’albero e sul boma dovranno essere installate tre
strisce di misurazione, due sull’albero e una sul boma, di colore nero e di altezza pari a 25mm oltre le quali la vela non
potrà essere bordata. Il filo superiore della banda inferiore di P dovrà essere posizionato in corrispondenza della faccia
superiore del boma.
Measurement method / Metodo di misurazione :
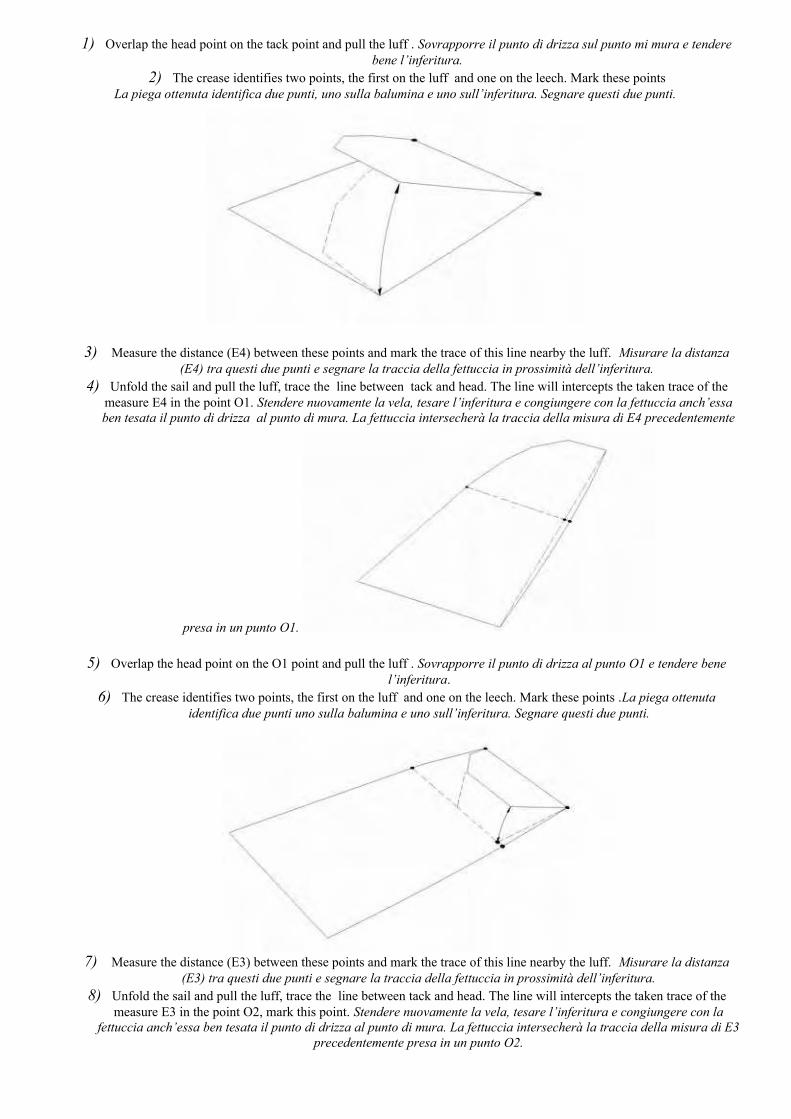
1) Overlap the head point on the tack point and pull the luff . Sovrapporre il punto di drizza sul punto mi mura e tendere
bene l’inferitura. 2) !he crease identifies two points, the first on the luff and one on the leech. Mark these points
La piega ottenuta identifica due punti, uno sulla balumina e uno sull’inferitura. Segnare questi due punti.
3) Measure the distance (E4) between these points and mark the trace of this line nearby the luff. Misurare la distanza
(E4) tra questi due punti e segnare la traccia della fettuccia in prossimità dell’inferitura.
4) Unfold the sail and pull the luff, trace the line between tack and head. !he line will intercepts the taken trace of the
measure E4 in the point O1. Stendere nuovamente la vela, tesare l’inferitura e congiungere con la fettuccia anch’essa
ben tesata il punto di drizza al punto di mura. La fettuccia intersecherà la traccia della misura di E4 precedentemente
presa in un punto O1.
5) Overlap the head point on the O1 point and pull the luff . Sovrapporre il punto di drizza al punto O1 e tendere bene
l’inferitura.
6) !he crease identifies two points, the first on the luff and one on the leech. Mark these points .La piega ottenuta
identifica due punti uno sulla balumina e uno sull’inferitura. Segnare questi due punti.
7) Measure the distance (E3) between these points and mark the trace of this line nearby the luff. Misurare la distanza
(E3) tra questi due punti e segnare la traccia della fettuccia in prossimità dell’inferitura.
8) Unfold the sail and pull the luff, trace the line between tack and head. !he line will intercepts the taken trace of the
measure E3 in the point O2, mark this point. Stendere nuovamente la vela, tesare l’inferitura e congiungere con la
fettuccia anch’essa ben tesata il punto di drizza al punto di mura. La fettuccia intersecherà la traccia della misura di E3
precedentemente presa in un punto O2.
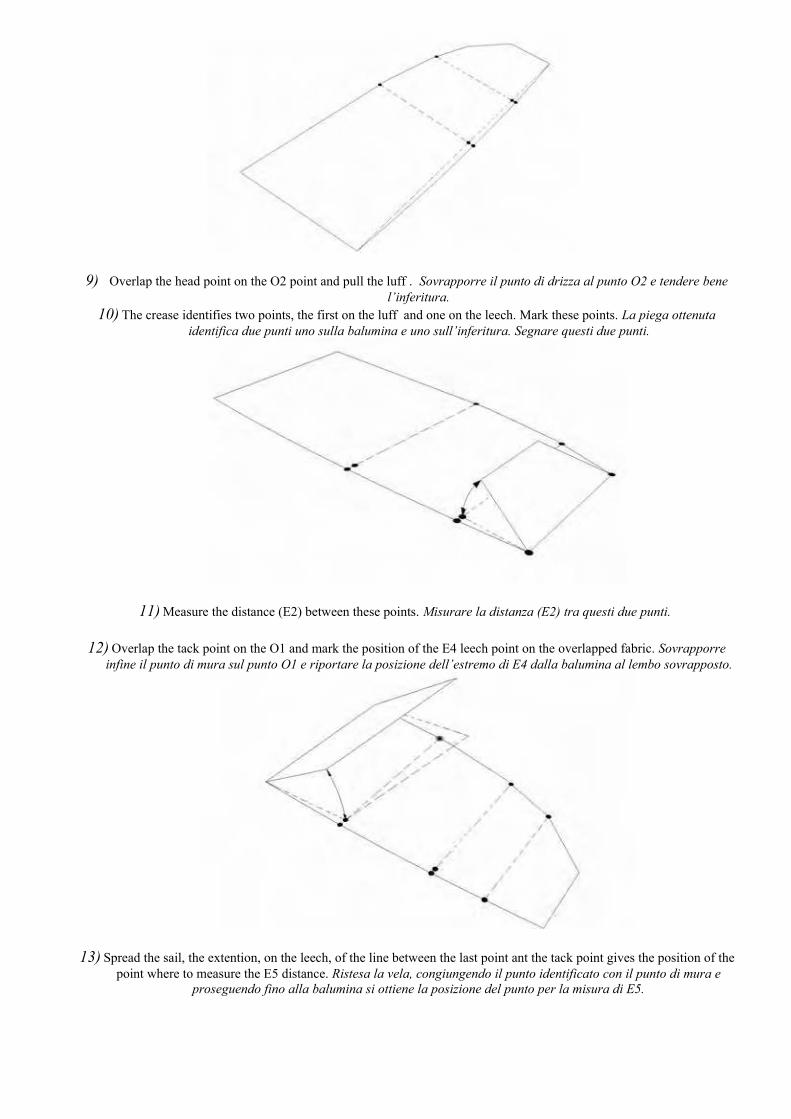
9) Overlap the head point on the O2 point and pull the luff . Sovrapporre il punto di drizza al punto O2 e tendere bene
l’inferitura.
10) !he crease identifies two points, the first on the luff and one on the leech. Mark these points. La piega ottenuta
identifica due punti uno sulla balumina e uno sull’inferitura. Segnare questi due punti.
11) Measure the distance (E2) between these points. Misurare la distanza (E2) tra questi due punti.
12) Overlap the tack point on the O1 and mark the position of the E4 leech point on the overlapped fabric. Sovrapporre
infine il punto di mura sul punto O1 e riportare la posizione dell’estremo di E4 dalla balumina al lembo sovrapposto.
13) Spread the sail, the extention, on the leech, of the line between the last point ant the tack point gives the position of the
point where to measure the E5 distance. Ristesa la vela, congiungendo il punto identificato con il punto di mura e
proseguendo fino alla balumina si ottiene la posizione del punto per la misura di E5.
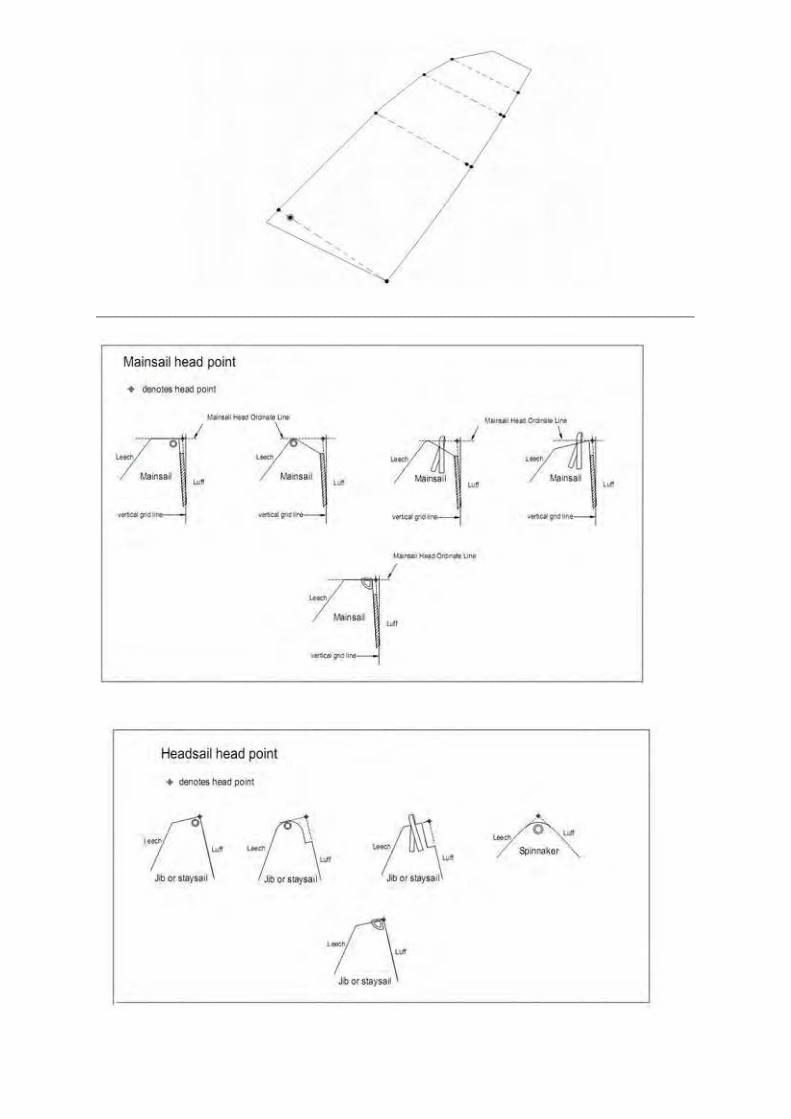
__________________________________________________________________________________________
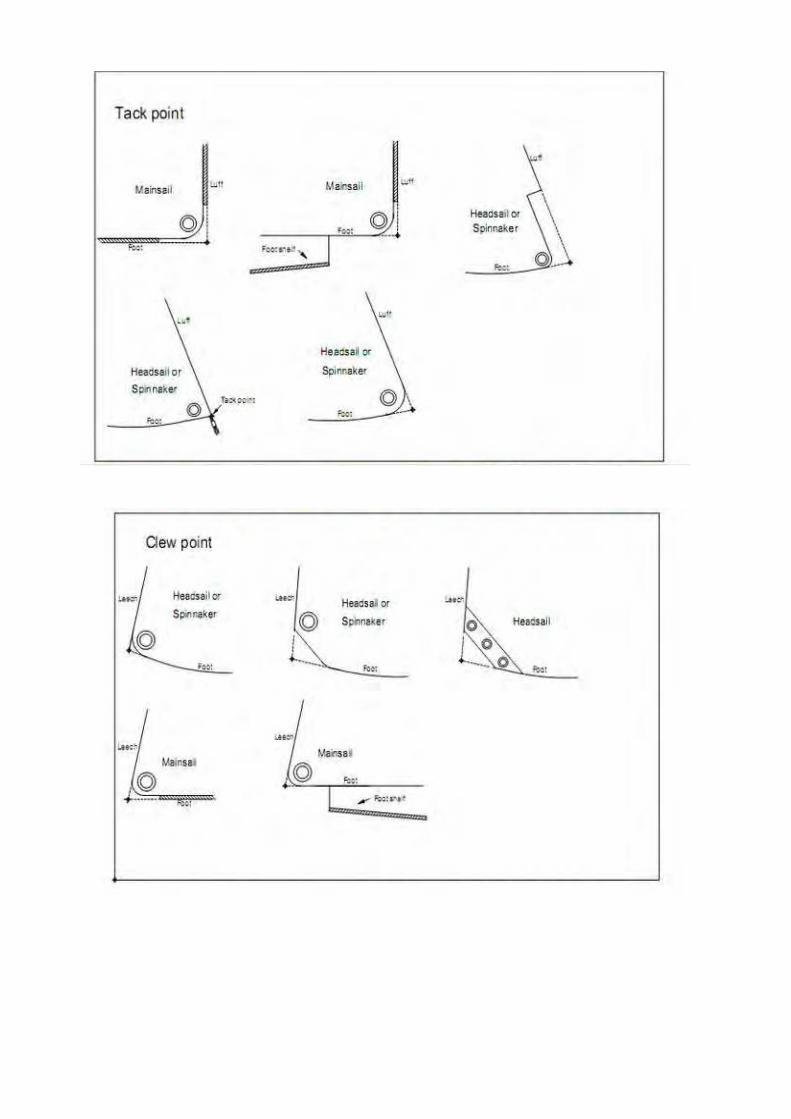
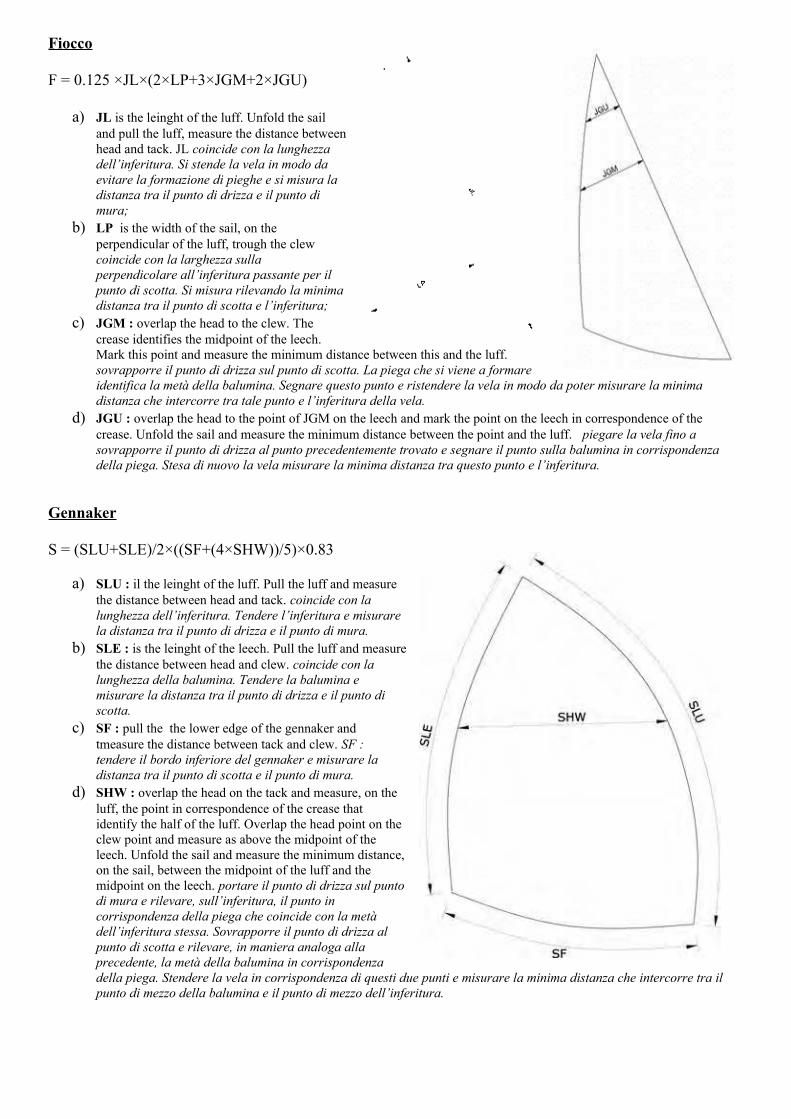
Fiocco
F = 0.125 ×JL×(2×LP+3×JGM+2×JGU)
a) JL is the leinght of the luff. Unfold the sail
and pull the luff, measure the distance between
head and tack. JL coincide con la lunghezza
dell’inferitura. Si stende la vela in modo da
evitare la formazione di pieghe e si misura la
distanza tra il punto di drizza e il punto di
mura;
b) LP is the width of the sail, on the
perpendicular of the luff, trough the clew
coincide con la larghezza sulla
perpendicolare all’inferitura passante per il
punto di scotta. Si misura rilevando la minima
distanza tra il punto di scotta e l’inferitura;
c) JGM : overlap the head to the clew. !he
crease identifies the midpoint of the leech.
Mark this point and measure the minimum distance between this and the luff.
sovrapporre il punto di drizza sul punto di scotta. La piega che si viene a formare
identifica la metà della balumina. Segnare questo punto e ristendere la vela in modo da poter misurare la minima
distanza che intercorre tra tale punto e l’inferitura della vela.
d) JGU : overlap the head to the point of JGM on the leech and mark the point on the leech in correspondence of the
crease. Unfold the sail and measure the minimum distance between the point and the luff. piegare la vela fino a
sovrapporre il punto di drizza al punto precedentemente trovato e segnare il punto sulla balumina in corrispondenza
della piega. Stesa di nuovo la vela misurare la minima distanza tra questo punto e l’inferitura.
Gennaker
S = (SLU+SLE)/2×((SF+(4×SHW))/5)×0.83
a) SLU : il the leinght of the luff. Pull the luff and measure
the distance between head and tack. coincide con la
lunghezza dell’inferitura. Tendere l’inferitura e misurare
la distanza tra il punto di drizza e il punto di mura.
b) SLE : is the leinght of the leech. Pull the luff and measure
the distance between head and clew. coincide con la
lunghezza della balumina. Tendere la balumina e
misurare la distanza tra il punto di drizza e il punto di
scotta.
c) SF : pull the the lower edge of the gennaker and
tmeasure the distance between tack and clew. SF :
tendere il bordo inferiore del gennaker e misurare la
distanza tra il punto di scotta e il punto di mura.
d) SHW : overlap the head on the tack and measure, on the
luff, the point in correspondence of the crease that
identify the half of the luff. Overlap the head point on the
clew point and measure as above the midpoint of the
leech. Unfold the sail and measure the minimum distance,
on the sail, between the midpoint of the luff and the
midpoint on the leech. portare il punto di drizza sul punto
di mura e rilevare, sull’inferitura, il punto in
corrispondenza della piega che coincide con la metà
dell’inferitura stessa. Sovrapporre il punto di drizza al
punto di scotta e rilevare, in maniera analoga alla
precedente, la metà della balumina in corrispondenza
della piega. Stendere la vela in corrispondenza di questi due punti e misurare la minima distanza che intercorre tra il
punto di mezzo della balumina e il punto di mezzo dell’inferitura.
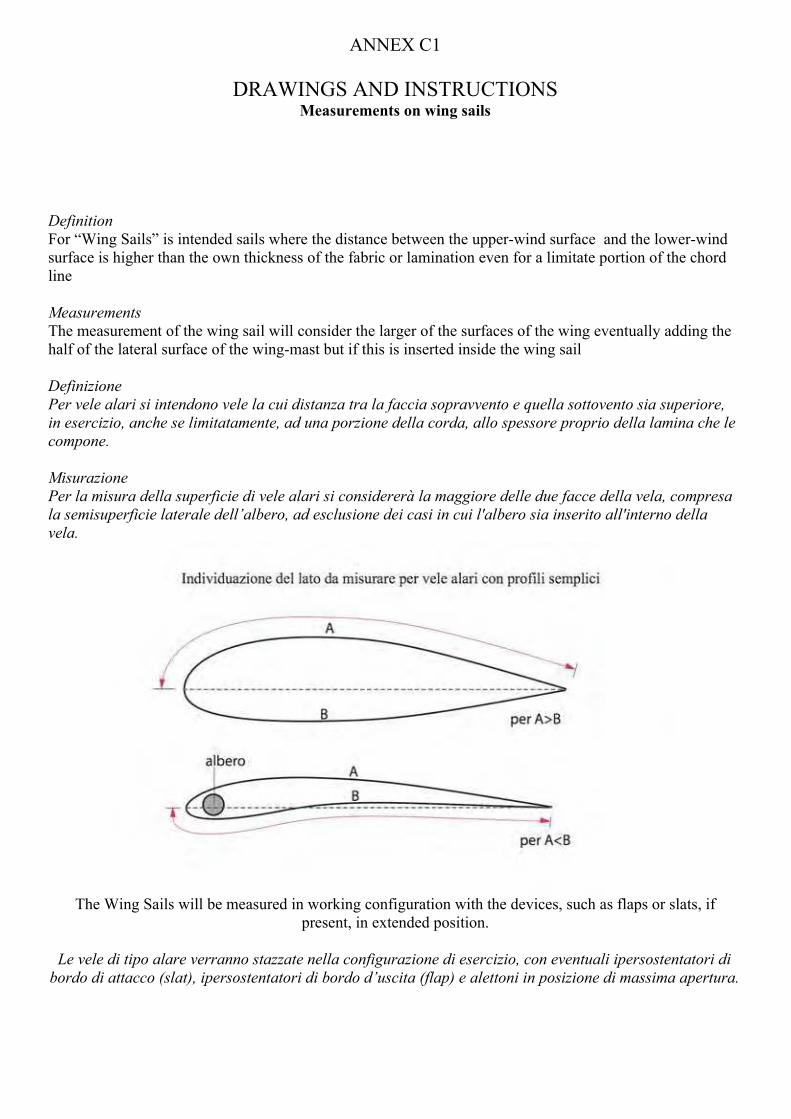
ANNEX C1
DRAWINGS AND INS!RUC!IONSMeasurements on wing sails
Definition
For “Wing Sails” is intended sails where the distance between the upper-wind surface and the lower-wind
surface is higher than the own thickness of the fabric or lamination even for a limitate portion of the chord
line
Measurements
!he measurement of the wing sail will consider the larger of the surfaces of the wing eventually adding the
half of the lateral surface of the wing-mast but if this is inserted inside the wing sail
Definizione
Per vele alari si intendono vele la cui distanza tra la faccia sopravvento e quella sottovento sia superiore,
in esercizio, anche se limitatamente, ad una porzione della corda, allo spessore proprio della lamina che le
compone.
Misurazione
Per la misura della superficie di vele alari si considererà la maggiore delle due facce della vela, compresa
la semisuperficie laterale dell’albero, ad esclusione dei casi in cui l'albero sia inserito all'interno della
vela.
!he Wing Sails will be measured in working configuration with the devices, such as flaps or slats, if
present, in extended position.
Le vele di tipo alare verranno stazzate nella configurazione di esercizio, con eventuali ipersostentatori di
bordo di attacco (slat), ipersostentatori di bordo d’uscita (flap) e alettoni in posizione di massima apertura.

individuation of the side to be measured for simple and multi sectioned profile
the measurement points will be indicated by the measurer or by the !.C.
!he calculation of the surface will be developed by decomposition of the surface in trapezes or triangles
where possible
In case it's present at last one curved edge on the leading edge and/or the trailing edge, will be adopted the
Cavalieri-Simpson method on min. 5 partitions
I punti di misura verranno definiti a discrezione dello stazzatore o della C.T.
Il calcolo della superficie sarà effettuato per scomposizione in trapezi e/o triangoli dove possibile.
Nel caso sia presente anche un solo bordo curvo si adotterà la formula di Cavalieri-Simpson su un minimo
di 5 partizioni
.
Some examples: Si riportano a seguito alcuni esempi:
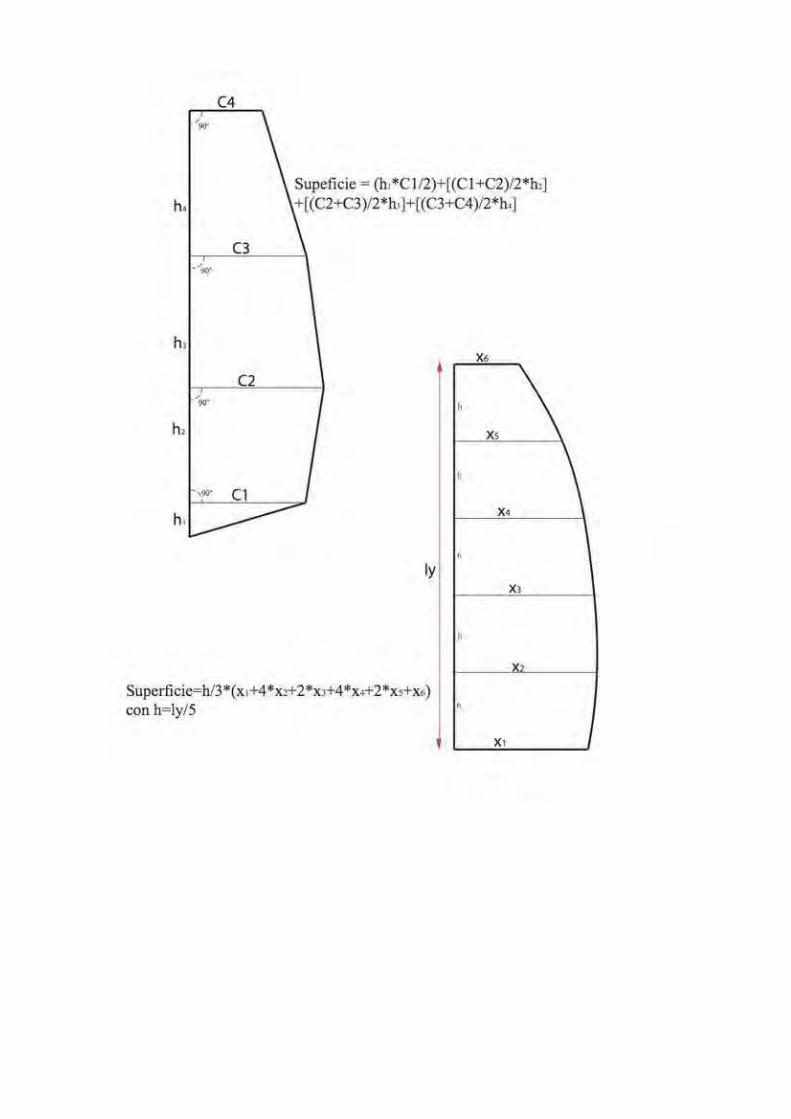
Annex D – CREW SHEET
MILLE E UNA VELA CUP
Place ___________________________ date _______
NOME IMBARCAZIONE – BOAT NAME ______________________________________________
Numero velico / Sail number _______
EQUIPAGGIO – CREW
Nome / Name Cognome / Surname Ruolo / RoleGroup (World
Sail)
Federation's
inscription N°
1
2
Trofeo “Paolo PADO1A” / “Paolo PADO1A” TROPHY
EQUIPAGGIO – CREW (Regata docente-studente / student-teacher Regatta)
Nome / Name Cognome / Surname Ruolo / Role
Docente/
!eacher
Studente/
Student
Data / Date FIRMA / SIGNA!URE
________________ ________________________
Gommone Accreditato/ Assistance Boat
___________________________________________ !EL. ___________________________
Annexed, at this sheet, the registration of the students for the current Academic Year
Certificate of conformity
Place ........................................ date …./..../20........
Sailmaker :
Address :
!el.:
Mail.
Web:
Certification of conformity for the sail set in accordance of the R3 class rules
I declare that the material used for the realisation of the sail set for the boat:
…......................... sail number: …............. DO NO! includes Kevlar, spectra, carbon or
other high modulus fibres.
I declare that the sail set has been measured in accordance with the “Annex C and C1” of the
R3 Class Rules
Sheet sails
MAIN SAIL JIB
LI JL
E1 LP
E2 JGL
E3 JGU
E4 GENNAKER
E5 SLU
C0 SLE
SF
SHW
Wing sails
H1 X1
H2 X2
H3 X3
H4 X4
H5 X5
Mr/Ms
….............…......................................
(stamp and signature)