Challenges towards Structural Integrity and Performance ...
272
Louisiana State University LSU Digital Commons LSU Doctoral Dissertations Graduate School 2015 Challenges towards Structural Integrity and Performance Improvement of Welded Structures Mohammad Washim Dewan Louisiana State University and Agricultural and Mechanical College, [email protected] Follow this and additional works at: hps://digitalcommons.lsu.edu/gradschool_dissertations Part of the Mechanical Engineering Commons is Dissertation is brought to you for free and open access by the Graduate School at LSU Digital Commons. It has been accepted for inclusion in LSU Doctoral Dissertations by an authorized graduate school editor of LSU Digital Commons. For more information, please contact[email protected]. Recommended Citation Dewan, Mohammad Washim, "Challenges towards Structural Integrity and Performance Improvement of Welded Structures" (2015). LSU Doctoral Dissertations. 2998. hps://digitalcommons.lsu.edu/gradschool_dissertations/2998
-
Upload
khangminh22 -
Category
Documents
-
view
6 -
download
0
Transcript of Challenges towards Structural Integrity and Performance ...

Louisiana State UniversityLSU Digital Commons
LSU Doctoral Dissertations Graduate School
2015
Challenges towards Structural Integrity andPerformance Improvement of Welded StructuresMohammad Washim DewanLouisiana State University and Agricultural and Mechanical College, [email protected]
Follow this and additional works at: https://digitalcommons.lsu.edu/gradschool_dissertations
Part of the Mechanical Engineering Commons
This Dissertation is brought to you for free and open access by the Graduate School at LSU Digital Commons. It has been accepted for inclusion inLSU Doctoral Dissertations by an authorized graduate school editor of LSU Digital Commons. For more information, please [email protected].
Recommended CitationDewan, Mohammad Washim, "Challenges towards Structural Integrity and Performance Improvement of Welded Structures" (2015).LSU Doctoral Dissertations. 2998.https://digitalcommons.lsu.edu/gradschool_dissertations/2998
CHALLENGES TOWARDS STRUCTURAL INTEGRITY AND
PERFORMANCE IMPROVEMENT OF WELDED STRUCTURES
A Dissertation
Submitted to the Graduate Faculty of the
Louisiana State University and
Agricultural and Mechanical College
in partial fulfillment of the
requirements for the degree of
Doctor of Philosophy
in
The Department of Mechanical and Industrial Engineering
byMohammad Washim Dewan
B. S., Bangladesh University of Engineering Technology, 2007
M.S., Tuskegee University, 2011
December 2015

To my parents and wife (Khurshida Sharmin)
for
their unconditional love and sacrifices.

iii
ACKNOWLEDGEMENTS
I would like to express my sincere gratitude to my major advisor Dr. Muhammad
A. Wahab (Professor, Department of Mechanical & Industrial Engineering, LSU) for his
excellent guidance, individual suggestions, and ardent encouragement throughout my PhD study.
His mentorship not only involved the development of technical skills and vision of
researches, it also provides the enlightening values of life experience. Without his
continuous patronage, this work could not have been completed. The author would also like
to express my deepest gratitude to his supervisors Dr. Ayman Okeil (Professor, Department
of Civil & Environmental Engineering, LSU) and Dr. T. Warren Liao (Professor, Department
of Mechanical & Industrial Engineering, LSU) for critically evaluating my research work and
providing helpful suggestions, constant encouragements, comments, and probing deeper
questions throughout this research.
I am also grateful to my graduate advisory committee members Dr. Shengmin Guo
(Professor, Department of Mechanical & Industrial Engineering, LSU) and Dr. Jonathan
Jingsheng Shi (Professor, Department of Construction Management, LSU) for their support and
suggestions.
The author would like to extend his thanks t o NASA employees at MAF (Michoud
Assembly Facility- New Orleans) for their sincere help and guidance during the welding
experimentations and allowing to use their facilities. The author also wishes to thank his
colleagues Daniel Huggett, Saad Aziz, J asem Ahmed, and Dr . J iandong Liang for their
sincere co-operation and generous sharing of their expertise during this research work.
Many technical critical reviews and suggestions relating to Friction-Stir-Welding
experimentations and analysis provided by Dr. Arthur Nunes, Jr. of NASA-MSFC, Huntsville, the

iv
technical controller of this particular NASA-SLS project is acknowledged with sincere thanks. The
financial supports received from b o t h the U.S. NRC (Grant # NRC-HQ-11-G-38-0052) and
NASA-SLS (Grant # NNM13AA02G) are acknowledged with gratitude; as without these supports
extensive experimental program which was undertaken within this research may not have been
possible.

v
TABLE OF CONTENTS
ACKNOWLEDGEMENTS................................................................................................................. iii
LIST OF TABLES............................................................................................................................... ix
LIST OF FIGURES ............................................................................................................................. xi
NOMENCLATURES ........................................................................................................................ xix
SYMBOLS ....................................................................................................................................... xxii
ABSTRACT ................................................................................................................................... xxiii
CHAPTER 1 : INTRODUCTION ........................................................................................................ 1
1.1. Research Rationale and Objectives ........................................................................................... 1 1.2. Analysis of Friction- Stir- Welded Aluminum Alloys AA2219-T87 ........................................ 2 1.3. Analysis of Fusion Arc Welded Aluminum Alloys AA6061-T651 .......................................... 4 1.4. Analysis of Fusion Arc Welded Steels ...................................................................................... 5 1.5. Chapters Overview .................................................................................................................... 6
CHAPTER 2 : LITERATURE REVIEW ............................................................................................. 8
2. Introduction .................................................................................................................................. 8
2.1. Friction-Stir-Welding (FSW) of Aluminum Alloys .................................................................. 8 2.1.1. Friction- Stir- Welding (FSW) Process ........................................................................ 10 2.1.2. Critical Evaluation of Existing Literature and Trend in FSW of AA2219 ................... 14
2.1.2.1. FSW process development and mechanical properties ................................. 15
2.1.2.2. Defects in FSW joints .................................................................................... 18 2.1.3. Post-Weld Residual Stress and Post-Weld Heat Treatment ......................................... 20 2.1.4. FSW Process Parameters Correlation ........................................................................... 21 2.1.5. Model to Predict Tensile Properties of FSW Joints ..................................................... 24
2.2. Fusion Arc Welding of Aluminum Alloys .............................................................................. 25 2.2.1. Gas Tungsten Arc Welding (GTAW) of AA6061-T651 .............................................. 26
2.2.2. Fusion Arc Weld Defects in Aluminum Alloy Joints ................................................... 28 2.2.3. Residual Stresses in Fusion Arc Welded Aluminum alloy AA6061 ............................ 29 2.2.4. Residual Stress Measurement ....................................................................................... 30 2.2.5. Post-Weld Heat Treatment of GTA-Welded Aluminum alloy AA6061 ...................... 32
2.3. Fusion Arc Welding of Alloy Steel ......................................................................................... 35
2.3.1. Post-Weld Heat Treatment (PWHT) of AISI-4140 Steel Joint .................................... 36 2.3.2. Electrolytic- Plasma- Treatment of Welded Alloy steel ............................................... 37
2.4. Fatigue Test of Welded Steel .................................................................................................. 39 2.4.1. Multiaxial Fatigue Test ................................................................................................. 40 2.4.2. Multiaxial Fatigue Test of Welded Steel ...................................................................... 42
2.5. Summary .................................................................................................................................. 42
CHAPTER 3 : EXPERIMENTAL PROGRAM OF WELD JOINTS ............................................... 46
3. Introduction ................................................................................................................................ 46

vi
3.1. Materials Selection .................................................................................................................. 46
3.1.1. Aluminum Alloys ......................................................................................................... 47 3.1.2. Alloy Steels................................................................................................................... 49
3.2. Welding Procedures ................................................................................................................. 51
3.2.1. FSW Procedure of AA2219-T87 .................................................................................. 51 3.2.1.1. Equipment and tooling................................................................................... 51 3.2.1.2. Experimental setup and procedure ................................................................ 53 3.2.1.3. Experimental schedules ................................................................................. 54
3.2.2. GTAW of AA6061-T651 ............................................................................................. 57
3.2.3. GTAW of AISI-4140 Alloy Steel ................................................................................. 58 3.2.4. GTAW of AISI-1018 Steel ........................................................................................... 59
3.3. Experimental Procedures ......................................................................................................... 60 3.3.1. Non-Destructive Evaluation (NDE) ............................................................................. 61
3.3.1.1. Phased array ultrasonic testing (PAUT) ........................................................ 61
3.3.1.2. Defect sizing capability of PAUT ................................................................. 63
3.3.1.3. Radiographic testing (RT) ............................................................................. 67 3.4. Ultrasonic Testing to obtain Residual Stresses ....................................................................... 68
3.5. Uniaxial Tensile Test ............................................................................................................... 69 3.6. Rotating-Bending-Torsional (RBT) Fatigue Testing .............................................................. 70 3.7. Micro-Hardness Analysis ........................................................................................................ 73
3.8. Microscopic Analysis .............................................................................................................. 73 3.8. Summary .................................................................................................................................. 74
CHAPTER 4 : FRICTION- STIR -WELDING DEFECTS LINKED TO WELDING PROCESS
PARAMETERS .................................................................................................................................. 75
4. Introduction ................................................................................................................................ 75
4.1. Scope ....................................................................................................................................... 76
4.2. Microstructure of FSW Joints ................................................................................................. 79 4.3. Weld Defect Classifications .................................................................................................... 84
4.3.1. Microscopic Analysis to Classify Weld Defects .......................................................... 84
4.3.2. Non-Destructive Evaluation to Classify Weld Defects ................................................ 86 4.4. Tensile Properties of FSW Joint .............................................................................................. 89
4.5. Fracture Surface Analysis ........................................................................................................ 93 4.6. Micro-Hardness of FSW Joint ................................................................................................. 98
4.7. Tensile Properties Related to Welding Process Parameters .................................................... 99 4.8. Correlation of Weld Process Parameters and Weld Quality ................................................. 105 4.9. Summary ................................................................................................................................ 110
CHAPTER 5 : PREDICTION OF TENSILE STRENGTH OF FSW JOINTS WITH ADAPTIVE
NEURO-FUZZY INFERENCE SYSTEM (ANFIS) AND ARTIFICIAL NEURAL NETWORK
(ANN) ............................................................................................................................................... 113
5. Introduction .............................................................................................................................. 113
5.1. Scope ..................................................................................................................................... 114 5.2. Methodology .......................................................................................................................... 116
5.2.1. Artificial Neural Network (ANN) .............................................................................. 116
5.2.2. Adaptive Neuro-Fuzzy Inference System (ANFIS) ................................................... 117

vii
5.2.3. Leave-One-Out Cross Validation (LOO-CV) ............................................................ 120
5.2.4. Experimental Data ...................................................................................................... 120 5.2.5. Input Variables Utilized in ANFIS Model ................................................................. 122
5.3. Building a Better ANFIS Model to Predict Tensile Strength ................................................ 123
5.3.1. ANFIS Model Utilizing 𝑁, 𝑉, 𝑎𝑛𝑑 𝐹𝑧 ` ...................................................................... 125
5.3.2. ANFIS Model Utilizing 𝑁, 𝑉, 𝐹𝑧, 𝑎𝑛𝑑 𝐸𝐹𝐼 ................................................................ 127 5.3.3. Optimized ANFIS Model and Surface Plot ................................................................ 129
5.4. ANN (Artificial Neural Network) Modeling and Validation ................................................ 132 5.5. Summary ................................................................................................................................ 134
CHAPTER 6 : EFFECTS OF POST- WELD HEAT TREATMENT (PWHT) ON FRICTION-
STIR- WELDED AA2219-T87 JOINTS ......................................................................................... 136
6. Introduction .............................................................................................................................. 136
6.1. Scope ..................................................................................................................................... 136 6.2. Post-Weld Heat Treatment (PWHT) Process ........................................................................ 138 6.3. Results and Discussions ........................................................................................................ 139
6.3.1. Effect of FSW on Tensile Properties .......................................................................... 139 6.3.2. Effect of PWHT on Tensile Properties ....................................................................... 140 6.3.3. Effect of PWHT on Fracture Surfaces of Tensile Tested Specimens ......................... 143
6.4. Effect of PWHT on Micro-hardness of FS-Welded AA2219-T87 ....................................... 145 6.5. Effect of PWHT on Microstructures of FS-Welded AA2219-T87 ....................................... 147
6.5.1. Optical Macro and Micrographs Analysis .................................................................. 147 6.5.2. SEM and EDS Analysis .............................................................................................. 150
6.6. Summary ................................................................................................................................ 152
CHAPTER 7 : INFLUENCE OF WELD DEFECTS AND POST-WELD HEAT TREATMENT
(PWHT) ON FUSION WELDED ALUMINUM ALLOY JOINT .................................................. 155
7. Introduction .............................................................................................................................. 155
7.1. Scope ..................................................................................................................................... 155 7.2. Effect of Weld Defects on Tensile Properties ....................................................................... 157
7.2.1. Weld Defect Identification and Defect Size Measurement ........................................ 157 7.2.2. Weld Defects Cross-Sectional Area Measurement utilizing PAUT and OM ............ 160 7.2.3. Effect of Different Types Defects on Tensile Properties ........................................... 161
7.2.4. Effect of Weld Defect Size on Tensile Properties ...................................................... 164 7.2.5. Effect of Weld Defects on Fracture Surfaces ............................................................. 165
7.3. Effect of Post-Weld Heat Treatment (PWHT) ...................................................................... 168 7.3.1. PWHT Process ............................................................................................................ 168 7.3.2. Effect of PWHT on Tensile Properties ....................................................................... 169
7.3.3. Effect of PWHT on Residual Stresses ........................................................................ 172
7.3.4. Effect of PWHT on Microstructures .......................................................................... 173
7.3.5. Effect of PWHT on Micro-Hardness .......................................................................... 176 7.3.6. Effect of PWHT on Fractographs ............................................................................... 177
7.4. Summary ................................................................................................................................ 178
CHAPTER 8 : EFFECT OF POST-WELD TREATMENT ON GAS TUNGSTEN ARC WELDED
AISI- 4140 ALLOY STEEL ............................................................................................................. 180

viii
8. Introduction .............................................................................................................................. 180
8.1. Scope ..................................................................................................................................... 181 8.2. Sample Preparation ................................................................................................................ 182 8.3. Post-Weld Treatment (PWT) Process ................................................................................... 183 8.4. Results and Discussions ........................................................................................................ 186
8.4.1. Effect of Fusion Arc Welding and PWT on Microstructures ..................................... 186 8.4.2. Effect of PWT on Micro-Hardness ............................................................................. 187 8.4.3. Effect of PWT on Residual Stresses ........................................................................... 189 8.4.4. Effect of PWT on Uniaxial Tensile Test Results ....................................................... 190 8.4.5. SEM Fractographs ...................................................................................................... 193
8.5. Summary ................................................................................................................................ 194
CHAPTER 9 : EFFECTS OF ROTATING, BENDING, AND TORSIONAL FATIGUE LOADS
ON WELDED STEEL JOINT ......................................................................................................... 197
9. Introduction .............................................................................................................................. 197
9.1. Scope ..................................................................................................................................... 198 9.2. Sample Preparation ................................................................................................................ 199 9.3. Results and Discussions ........................................................................................................ 200
9.3.1. Effect of Welding on Uniaxial Tensile Test and Fracture Morphology ..................... 200 9.3.2. Rotating-Bending-Torsional Fatigue Test Results ..................................................... 203 9.3.3. Fracture Morphology of Fatigue Tested Specimens ................................................... 208
9.4. Summary ................................................................................................................................ 210
CHAPTER 10 : CONCLUSIONS AND RECOMMENDATIONS FOR FUTURE WORK .......... 212
10. Overview ................................................................................................................................ 212
10.1. Conclusions ......................................................................................................................... 212
10.1.1. FSW Process Parameters Correlated to Weld Defects ............................................. 213 10.1.2. ANFIS Model to Predict Tensile Strength of FSW Joint ......................................... 214 10.1.3. Effects of PWHT on FS- Welded Aluminum Alloys Joints ..................................... 215 10.1.4. Effects of Weld Defects and PWHT on Fusion Arc Welded (GTAW) Aluminum
Alloys Joints ......................................................................................................................... 216 10.1.5. Effect of Post-Weld Treatment (PWT) on Fusion Arc Welded Steel ...................... 216 10.1.6. Effects of Multiaxial Loads on Fatigue Behavior of Fusion Arc Welded Steel ....... 217
10.2. Recommendations for Future Works ................................................................................... 218 10.2.1. Recommendations on FS-Welded Aluminum Alloy Joints ..................................... 218
10.2.1. Recommendations on Post-Weld EPP-treatment of Welded Joints ......................... 219
REFERENCES.................................................................................................................................. 222
APPENDIX ...................................................................................................................................... 245
A1. Pin-Tool Design for FSW of Aluminum Alloys ................................................................... 245
VITA ................................................................................................................................................. 247

ix
LIST OF TABLES
Table 2.1: Mechanical properties of AA2219 with different temper condition (Oberg
2012) ..................................................................................................................................... 15
Table 3.1: Chemical composition and tensile strength of AA2219-T87 aluminum
alloys (ASM-International 1993) .......................................................................................... 48
Table 3.2: Chemical composition and tensile strength of base metal (AA6061-T651)
and filler rod (ER-4043) (ASM-International 1990) ............................................................ 49
Table 3.3: Chemical composition and tensile strength of base metal (AISI-4140) and
filler rod (SAE-4130) (ASM-International 1993) ................................................................. 50
Table 3.4: Chemical composition and tensile strength of base metal (AISI-1018) and
filler rod (ER70-S2) (ASM-International 1993) ................................................................... 51
Table 3.5: GTAW specifications for AA6061-T651 Aluminum alloy ........................................ 57
Table 3.6: GTAW specifications for AISI-4140 alloy steel ........................................................ 58
Table 3.7: GTAW specifications for AISI-1018 low carbon steel .............................................. 60
Table 3.8: Comparison of defect sizing utilizing PAUT technique .............................................. 66
Table 4.1: Welding process parameters, tensile test results, and weld defects of FS
welded AA2219-T87 panels (WH = wormhole; IP = incomplete penetration; TR
= trenching; UF = Underfill) ................................................................................................. 89
Table 4.2: Verification of the effect of speed ratio (R) .............................................................. 103
Table 4.3: New weld schedules along with weld quality for the validation of
developed of empirical force index (EFI) in weld classification ........................................ 110
Table 5.1: FSW process parameters and ultimate tensile strength of friction- stir-
welded AA2219-T87 aluminum alloy ................................................................................ 121
Table 5.2: Results from ANFIS model developed utilizing different combinations of
three input variables (𝑁, 𝑉, 𝐹𝑧) along with types and numbers of membership
functions associated with input variables ........................................................................... 126
Table 5.3: Results from ANFIS model developed utilizing four input variables
(𝑁, 𝑉, 𝐹𝑧, 𝐸𝐹𝐼) ..................................................................................................................... 128
Table 5.4: Comparison between experimental and ANFIS predicted UTS ............................... 130
Table 5.5: Basic details of the best ANFIS model to predict UTS from FSW process
parameters ........................................................................................................................... 130

x
Table 5.6: RMSE and MAPE values for different combination of input variables
(Number of hidden layer=1; Number of nodes in hidden layer = 10; Training
function= Levenberg-Marquardt back propagation)........................................................... 133
Table 5.7: Basic details of the ANN model with lowest RMSE and MAPE .............................. 134
Table 6.1: The summary of tensile test results with different post- weld heat treatments
for FS- welded AA2219-T87 joint...................................................................................... 143
Table 7.1: Average tensile test results with different weld defects ............................................ 163
Table 7.2: Effects of PWHT on Joint Efficiency (JE) of GTA- welded AA6061-T651
aluminum alloy ................................................................................................................... 171
Table 8.1: Tensile test results of GTA- welded AISI- 4140 alloy steel ...................................... 192
Table 9.1: Tensile test results and joint efficiency (JE) of GTA-welded AISI-1018
steel ..................................................................................................................................... 201

xi
LIST OF FIGURES
Figure 2.1: Friction- Stir- welding (FSW) process phases of a butted work material
configuration (AWS 2007) ................................................................................................... 11
Figure 2.2: (a) Rigid body rotation, (b) Uniformly translation along the weld seam, (c)
Ring vortex flow through the metal thickness, and (d) Two inter-twined flow
paths (Schneider and Nunes Jr. 2004) .................................................................................. 13
Figure 2.3: Schematic of friction- stir- welding (FSW) process showing three critical
process parameters (𝐹𝑧, 𝑉, 𝑁) (HILDA) ............................................................................... 13
Figure 2.4: Typical FSW defects and related process parameters window (Arbegast
2004) ..................................................................................................................................... 19
Figure 2.5: Longitudinal and transverse direction along the but-weld shown in fig (a).
Typical distribution of (b) longitudinal (𝜎𝑙) and (c) transverse (𝜎𝑡) residual
stresses in a butt joint along weld line and line vertical to the weld line
(Masubuchi 2013) ................................................................................................................. 30
Figure 2.6: Pseudo-binary phase diagram for Al-Mg2Si (ASM-International 2002) ................... 34
Figure 2.7: Schematic of typical pre-heating, welding, and post-weld heating process
for chromium-molybdenum alloy steel................................................................................. 36
Figure 2.8: Schematic of electrolytic- plasma- processing (EPP) ................................................ 37
Figure 2.9: Typical fatigue test results in S-N curve .................................................................... 39
Figure 2.10: Schematic of R.R. Moore reversed-bending fatigue machine (ASM-
International 2002) ................................................................................................................ 41
Figure 3.1: FSW fixed pin-tool (top), I-Stir PDS (left), and UWS #2 (right) FSW
machines (Courtesy NCAM) located at the Michoud Assembly Facility (MAF)-
New Orleans ......................................................................................................................... 52
Figure 3.2: FSW process showing three critical weld process parameters (downward
plunge force Fz, spindle rotational speed N, and welding speed V) ..................................... 53
Figure 3.3: A plan view of FS-welded panel crown surface showing weld segments
with different schedules are marked. (AS-Advancing Side and RS-Retreating
Side) ...................................................................................................................................... 55
Figure 3.4: Schematic of FS- welded panel with acceptable and transition areas with
magnified images a plunge transition zone (PTZ) and schedule transition zone
(STZ) ..................................................................................................................................... 56

xii
Figure 3.5: Welding configuration, welded plate, and tensile specimens (all
dimensions in mm)................................................................................................................ 58
Figure 3.6: Welding configuration and welded plate after grinding (all dimensions in
mm) ....................................................................................................................................... 59
Figure 3.7: Welding configuration and sample preparation ......................................................... 60
Figure 3.8: Phased array ultrasonic testing unit showing A, S, and C- scan views ...................... 62
Figure 3.9: Determination of phased array probe resolution with ASTM E2491 phased
array calibration block (resolution determines flaw definition and sizing
accuracy) ............................................................................................................................... 63
Figure 3.10: Effect of A-scan amplitude and color drop (dB) on defect size estimation ............. 64
Figure 3.11: Effect of index offset and color drop (dB) on defect size estimation (fixed
gain value)............................................................................................................................. 64
Figure 3.12: Variations of A-scan amplitude with index offset to illustrate the effect of
“Time- Corrected- Gain (TCG)” calibration ........................................................................ 65
Figure 3.13: Aluminum alloy plate with seven varying-hole sizes with associated C-
scan view and echo-dynamic A-Scan view (encoded and XY-scanning A-scan
data are combined) ................................................................................................................ 66
Figure 3.14: Schematic of basic set-up for film radiography (GE-IT 2007;
International 2013) ................................................................................................................ 67
Figure 3.15: MTS-810 uniaxial tensile test set-up including control unit, hydraulic
unit, and grip system ............................................................................................................. 70
Figure 3.16: Schematic of a rotating bending fatigue testing unit including four points
bending load configuration ................................................................................................... 71
Figure 3.17: Photograph of rotating-bending fatigue testing unit with braking
mechanism for the application of torque .............................................................................. 72
Figure 4.1: Line diagram showing factors that affect the quality of a FSW joint ........................ 77
Figure 4.2: Typical cross-sectional view of a FSW joint. A FSW weld joint is
composed of weld nugget (WN), thermo-mechanically affected zone (TMAZ),
heat- affected -zone (HAZ), and base metal ......................................................................... 80
Figure 4.3: Optical micrographs of defect- free FSW AA2219 joint. Micrographs are
taken at different locations of weld joints showing variations in microstructures ............... 81

xiii
Figure 4.4: SEM micrographs of defect-free FS welded AA2219-T87 joint.
Micrographs are taken at different locations of weld joints showing variations in
microstructure ....................................................................................................................... 83
Figure 4.5: The electron backscatter diffraction (EBSD) images of friction- stir-
welded AA2xxx aluminum alloy (Image Courtesy: Oxford-EBSD).................................... 83
Figure 4.6: Cold-weld showing Trenching (TR), Wormholes (WH), and Incomplete
Penetration (IP) defects ......................................................................................................... 85
Figure 4.7: Hot-weld showing underfill (UF) and small voids defect .......................................... 86
Figure 4.8: Surface photographs (above) with corresponding radiographic images
(below) of FSW panels: (a) cold weld with wormhole (internal cavity), and (b)
cold weld with trenching (contraction of weld width observed at trench
suggesting shoulder slip appropriate for colder harder metal), (c) hot weld with
flash and underfill ................................................................................................................. 87
Figure 4.9: Optical image (above) and PAUT’s S-scan view (below): (a) wormhole
(WH) in cold weld, (b) trenching (TR) defect in cold weld, and (c) void in hot
weld ....................................................................................................................................... 87
Figure 4.10: Optical image (left) and associated S-scan image (right) of IP defect ..................... 88
Figure 4.11: Stress-strain plots of base and FS welded AA2219-T87 specimens (base,
nominal, hot, and cold welds) ............................................................................................... 91
Figure 4.12: Typical SEM micrographs showing microstructure in weld nugget (WN)
of (a) nominal weld (NW), (b) hot weld (HW), and (c) cold weld (CW) joints ................... 92
Figure 4.13: Effect of different weld defects on tensile properties (NW: nominal weld;
HW: hot weld; CW-IP: cold weld with incomplete penetration; CW-WH: cold
weld with wormhole; CW TR: cold weld with trenching) .................................................... 93
Figure 4.14: Nominal weld showing no defect. A 45° maximum shear fracture is on
retreating side of tool outside the weld nugget in heat-affected base metal.
Fracture surface exhibits ductile fracture dimples, larger corresponding to base
metal and weld nugget .......................................................................................................... 94
Figure 4.15: Hot weld showing internal voids. Fracture is on advancing side of tool
inside the weld nugget. Fracture surface exhibits equiaxed ductile fracture
dimples, smaller corresponding to base material. Unbonded void surface exhibits
some regularly space curved lines that may be internal ripples ........................................... 95
Figure 4.16: Cold weld showing internal cavity. Fracture is on the advancing side of
tool inside the weld nugget. Fracture surface exhibits ductile fracture dimples,
smaller corresponding to nugget material. Unbonded cavity surface appears to
exhibit surface ripples ........................................................................................................... 97
xiv
Figure 4.17: Cold weld showing trenching (TR) defect at weld crown and incomplete
penetration (IP) at weld root. Fracture is on advancing side of tool inside the weld
nugget. Fracture surface exhibits ductile fracture dimples, smaller corresponding
to nugget material. Unbonded trench surface exhibits surface ripples ................................. 97
Figure 4.18: (a) Cross sectional view and (b) Micro-hardness profile of FS- welded
AA2219-T87 joint................................................................................................................. 99
Figure 4.19: Effect of speed ratio (𝑅) on (a) UTS and (b) Toughness at constant
plunge force (Fz) ................................................................................................................. 101
Figure 4.20: Effect of plunge force (Fz) on (a) ultimate tensile strength (UTS) and (b)
Toughness at two different speed ratio (R) ........................................................................ 102
Figure 4.21: FSW process parameters for hot, nominal, and cold welds group together
into fields with distinct boundaries ..................................................................................... 104
Figure 4.22: Experimental ultimate tensile strength (UTS) values are plotted against
(a) energy input (Pew, Nelson et al. 2007), (b) Pseudo heat index (Kandukuri,
Arbegast et al. 2007), and c)Alternative heat index (Querin and Schneider 2012) ............ 107
Figure 4.23: Plunge force vs. speed ratio plotted to obtain empirical correlation among
three weld process parameters for nominal weld (goodness of fit = 0.92) ......................... 109
Figure 4.24: Variations of tensile properties with empirical force index (EFI): (a)
Ultimate tensile strength vs. EFI, and (b) Toughness vs. EFI. These properties
both decline on either side of an (EFI) of 1.00 ................................................................... 109
Figure 5.1: Schematic of artificial neural network (ANN) layers (two input variables,
two hidden layers with 3 nodes each, and one output) ....................................................... 116
Figure 5.2: Schematic of ANFIS architecture for two inputs and two rules based on the
First-order Sugeno model (Jang 1993) ............................................................................... 119
Figure 5.3: Experimental transverse ultimate tensile strength (UTS) of Friction- stir-
welded aluminum alloy joints are plotted against empirical force index (EFI) .................. 123
Figure 5.4: Variations of root- mean- square (RMS) error for different set of training
and testing data ................................................................................................................... 124
Figure 5.5: Experimental and ANFIS model predicted UTS plotted for best the model
developed utilizing three input variables (𝑁, 𝑉, 𝐹𝑧) ........................................................... 126
Figure 5.6: Experimental and ANFIS model predicted UTS plotted for the best model
developed utilizing three input variables (𝑉, 𝐹𝑧, 𝐸𝐹𝐼) ........................................................ 128
Figure 5.7: Surface plot showing ANFIS predicted ultimate tensile strength (UTS).
Model generated utilizing welding speed (𝑉) and empirical force index (EFI) as
input variables ..................................................................................................................... 132
xv
Figure 6.1: Effect of friction- stir- welding on tensile properties of AA2219-T87
aluminum alloy ................................................................................................................... 139
Figure 6.2: Effect of artificial age-hardening (AH) on tensile properties of FSW
AA2219-T87 joint............................................................................................................... 141
Figure 6.3: Effect of solution-treatment followed by age-hardening (STAH) on tensile
properties of FS-welded AA2219-T87 joint ....................................................................... 142
Figure 6.4: SEM fractographs of FS- welded and post- weld heat treated AA2219-T87
joints: (a) as-welded (AW), (b) age-hardened at 170°C for 18h (AH-18h), and (c)
solution-treatment followed by age-hardened at 170°C for 18h (STAH-18h) ................... 144
Figure 6.5: Cross section of FS- welded plate and schematic of points where HRB
microhardness were measured ............................................................................................ 145
Figure 6.6: Effect of artificial age-hardening (AH) at 170 °C on micro-hardness of FS-
welded AA2219-T87 .......................................................................................................... 145
Figure 6.7: Effect of solution-treatment followed by age-hardening (STAH) at 170 °C
on micro-hardness of FS-welded AA2219-T87.................................................................. 146
Figure 6.8: Cross section of a friction- stir- welding (FSW) joint showing four
different regions (WN, TMAZ, HAZ, and Base metal) in both advancing (AS)
and retreating side (RS) ...................................................................................................... 148
Figure 6.9: Optical micrographs of FS-welded AA2219-T87 joint (a) as- welded weld
nugget (AW-WN) and (b) as- welded thermo-mechanically affected zone (AW-
TMAZ) ................................................................................................................................ 148
Figure 6.10: Optical micrographs of FS- welded AA2219-T87 (a) AH-170°C-18h and
(b) STAH-170°C-18h ......................................................................................................... 149
Figure 6.11: SEM-BSE micrograph showing grain structure and precipitates
distribution in weld nugget (WN) of (a) as - weld (AW) and (b) age- hardened
(AH-170°C-18h) specimens ............................................................................................... 151
Figure 6.12: Typical X-ray energy dispersive spectroscopy (EDS) spectrum of FS-
welded AA2219-T87 joint .................................................................................................. 151
Figure 6.13: TEM bright field image of FS- welded AA2219 weld nugget (a) as-
welded and (b) age-hardening at 175°C for 12h (Malarvizhi and Balasubramanian
2011). Heat-treated specimen has contains more amount of precipitates than that
of AW joints........................................................................................................................ 152
Figure 7.1: The C and S- scan views of tensile test samples obtained with PAUT: a)
no-defect, b) voids, c) LOF (Lack- of- Fusion), and d) LOP (Lack- of-
Penetration) ......................................................................................................................... 159

xvi
Figure 7.2: Cross sectional view of tensile tested specimens with different weld
defects obtained with Optical Microscope (OM) ............................................................... 160
Figure 7.3: Plot shows the relationship between the defect sizes measured with OM
and PAUT ........................................................................................................................... 161
Figure 7.4: Tensile test curves of GTA- welded AA6061-T651 aluminum alloy with
different types of weld defect ............................................................................................. 163
Figure 7.5: Tensile strength vs. defect cross sectional area ratio measured with PAUT
and OM ............................................................................................................................... 164
Figure 7.6: Tensile toughness vs. area- reduction ratio measured with PAUT and OM ............ 165
Figure 7.7: SEM fractographs of (a) base metal of un-welded specimen, (b) weld metal
of as-welded (AW) specimen, and (c) HAZ metal of AW specimen ................................. 166
Figure 7.8: SEM fractographs of tensile tested welded specimens with various types of
weld defects, (a) Lack- of- Penetration (LOP), (b) Lack- of- Fusion (LOF), and
(c) Void ............................................................................................................................... 167
Figure 7.9: Schematic of post-weld heat treatment (PWHT) process ........................................ 168
Figure 7.10: Variations of tensile strength and toughness due to PWHT................................... 171
Figure 7.11: Transverse residual stresses (σt) measured by ultrasonic testing ........................... 172
Figure 7.12: Optical micrographs of weld zone for (a) as welded (AW), (b) age
hardened (AH-10h), and (c) solution treatment followed by hardened (STAH-5h)
specimens showing precipitation (Mg2Si and CuAl2) of alloying elements ....................... 174
Figure 7.13: SEM micrographs of weld zone for (a) as welded (AW), (b) AH-10h, and
(c) STAH-5h specimens showing precipitation of alloying elements ................................ 175
Figure 7.14: SEM image and EDS plot for weld zone of solution treatment followed
by age hardened (STAH-5h) specimen ............................................................................... 176
Figure 7.15: Effect of PWHT on hardness profile ...................................................................... 177
Figure 7.16: SEM Fractographs of PWHT samples: (a) AH-10h, (b) STAH-5h, (c)
STAH-18h ........................................................................................................................... 178
Figure 8.1: GTA- welded and grinded AISI-4140 plates and typical B and C-scan
views showing defective and defect- free region................................................................ 183
Figure 8.2: (a) Schematic and (b) experimental set-up of EPP- technique utilized on
GTA-welded AISI-4140 alloy steel .................................................................................... 184
Figure 8.3: Typical SEM micrographs of steel before and after EPP- treatment ....................... 184

xvii
Figure 8.4: Schematic illustrating different types of specimens utilized in current
investigation ........................................................................................................................ 185
Figure 8.5: Optical micrographs of AISI-4140 alloy steel (Etchant: 2% Nital) ......................... 187
Figure 8.6: Change of Brinell micro-hardness in GTA-welded AISI-4140 steel
(converted from Rockwell 30N) ......................................................................................... 188
Figure 8.7: Distribution of residual stresses in GTA- welded AISI-4140 alloy steel ................. 190
Figure 8.8: Tensile stress strain curves of GTA- welded AISI-4140 steel ................................. 191
Figure 8.9: Fracture surface of tensile tested 4140 steel- a. base metal, b. as- welded, c.
heat- treated (650°C), d. EPP treated (middle), and e. EPP- treated (near surface)
specimens ............................................................................................................................ 193
Figure 9.1: Picture of welded rods and R.R. Moore fatigue test specimens ............................... 199
Figure 9.2: Effect of welding on uniaxial tensile stress strain curve .......................................... 200
Figure 9.3: Scanning electron microscopic (SEM) fractographs of tensile tested
specimens ............................................................................................................................ 201
Figure 9.4: Optical micrographs of AISI 1018 steel- (a) base metal, (b) HAZ metal and
(c) weld metal ..................................................................................................................... 202
Figure 9.5: Effect of welding on rotating-bending (RB) fatigue life .......................................... 204
Figure 9.6: Effect of torsional load on rotating-bending fatigue life of non-welded
(NW) AISI- 1018 steel ........................................................................................................ 205
Figure 9.7: Effect of torsional load on rotating bending fatigue life of welded (W)
AISI 1018 Steel ................................................................................................................... 206
Figure 9.8: Effect of welding on rotating-bending-torsional (RBT) fatigue life ........................ 207
Figure 9.9: Photograph of rotating-bending-torsional (RBT) fatigue tested welded
specimen ............................................................................................................................. 208
Figure 9.10: Fracture morphology variation from center to surface of the rotating-
bending-torsional (RBT) fatigue tested AISI-1018 Steel ................................................... 209
Figure 9.11: Effect of rotating-bending (RB) and rotating-bending-torsional (RBT)
fatigue on fracture morphology of AISI 1018 steel ............................................................ 210
Figure 10.1: Tensile stress-strain curve of FS-welded AA2195-T8 plates at three
different lead angles (0°, 1.5° and 3°) while other process parameters are kept
constant (N=325 rpm, V=7 ipm, and Fz=8000 lbf) ............................................................. 219

xviii
Figure 10.2: Sample preparation for corrosion test of GTA-welded and EPP-treated
AISI-4140 steel ................................................................................................................... 221
Figure 10.3: Effect of post-weld EPP-treatment on corrosion potential and corrosion
current density of GTA-welded AISI-4140 alloy steel ....................................................... 221

xix
NOMENCLATURES
AA Aluminum alloy
AH Age hardening
AHI Alternative heat index
ANFIS Adaptive neuro-fuzzy inference system
ANN Artificial neural network
AS Advancing side
AW As-welded
CW Cold weld
EBSD Electron backscatter diffraction
EDS Energy dispersive spectroscopy
EDX Energy dispersive X-ray
EPP Electrolytic-plasma-processing
FCM Fuzzy C-means
FSW Friction- stir- welding
GA Genetic algorithm
gauss2mf Gaussian combination membership function
gaussmf Gaussian membership function
gbellmf Generalized bell membership function
GENFIS Generate fuzzy inference system
GMAW Gas metal arc welding
GTAW Gas tungsten arc welding
HAZ Heat-affected-zone
HIF Heat input factor
HW Hot weld
INFIS Initial fuzzy inference system
IP Incomplete penetration
IPM Inch per minute
JLR Joint line remnant

xx
KB Kissing bond
LOF Lack-of- fusion
LOO-CV Leave-one-out cross validation
LOP Lack-of- penetration
MF Membership function
NDE Non-destructive evaluation
NDT Non-destructive testing
NW Nominal weld
OM Optical microscope
PAUT Phased array ultrasonic testing
PEO Plasma electrolytic oxidation
PHI Pseudo heat index
pimf -membership function
PTZ Plunge transition zone
PWHT Post-weld heat treatment
PWT Post-weld treatment
RB Rotating- bending
RBT Rotating-bending-torsional
RPM Rotation per minute
RS Retreating side
RT Radiographic testing
SA Simulated annealing
SCC Stress- corrosion- cracking
SDH Side-drilled-holes
SEM Scanning electron microscope
ST Solution treatment
STAH Solution- treatment and age- hardening
STZ Schedule transition zone
TCG Time-corrected -gain
TMAZ Thermo-mechanically affected zone

xxi
TR Trenching (surface cavity)
trimf Triangular membership function
TSK Takagi-Sugeno-Kang
UF Underfill
UT Ultrasonic testing
UTS Ultimate tensile strength
W Welded
WH Wormhole (internal cavity)
WN Weld nugget
WZ Weld zone
YS Yield strength

xxii
SYMBOLS
N Spindle rotational speed (rev/mm)
V Welding speed (mm/min)
BHN Brinell hardness
d Specimen diameter at critical section (mm)
EFI Empirical force index
EI Energy input (kJ/mm)
FB Braking force (kN)
Fz Plunge force (kN)
HRB Rockwell hardness at B-scale
JE Joint efficiency (%)
Kt Acoustoelastic constant in transverse direction (1/MPa)
M Bending moment (Nm)
MAPE Mean absolute percentage error (%)
Q Heat input (kJ/mm)
R Dimensionless speed ratio
r Pin-tool radius (mm)
RMSE Root mean square error (MPa)
ᴠ Ultrasound velocity in metal (mm/s)
w Bending load (kg)
σb Bending stress (MPa)
σl Longitudinal residual stress (MPa)
σt Transverse residual stress (MPa)
τT Shear stress resulting from torque (MPa)
µ Friction coefficient

xxiii
ABSTRACT
Welding is a fabrication process that joint materials, is extensively utilized in almost every
field of metal constructions. Heterogeneity in mechanical properties, metallurgical and geometrical
defects, post-weld residual stresses and distortion due to non-linear welding processes are prime
concerns for performance reduction and failures of welded structures. Consequently, structural
integrity analysis and performance improvement of weld joints are important issues that must be
considered for structural safety and durability under loading. In this study, an extensive
experimental program and analysis were undertaken on the challenges towards structural integrity
analysis and performance improvement of different welded joints. Two widely used welding
techniques including solid-state “friction- stir- welding (FSW)” and fusion arc “gas tungsten arc
welding (GTAW)” were employed on two widely utilized materials, namely aluminum alloys and
structural steels. Various destructive and non-destructive techniques were utilized for structural
integrity analysis of the welded joints. Furthermore, various “post-weld treatment (PWT)”
techniques were employed to improve mechanical performances of weld joints. The work herein is
divided into six different sections including: (i) Establishment of an empirical correlation for FSW
of aluminum alloys. The developed empirical correlation relates the three critical FSW process
parameters and was found to successfully distinguish defective and defect-free weld schedules; (ii)
Development of an optimized “adaptive neuro-fuzzy inference system (ANFIS)” model utilizing
welding process parameters to predict ultimate tensile strength (UTS) of FSW joints; (iii)
Determination of an optimum post-weld heat treatment (PWHT) condition for FS-welded aluminum
alloys; (iv) Exploration on the influence of non-destructively evaluated weld-defects and obtain an
optimum PWHT condition for GTA-welded aluminum alloys; (v) Investigation on the influence of
PWHT and electrolytic-plasma-processing (EPP) on the performance of welded structural steel

xxiv
joints; and finally, (vi) Biaxial fatigue behavior evaluation of welded structural steel joints. The
experimental research could be utilized to obtain defect free weld joints, establish weld
acceptance/rejection criteria, and for the better design of welded aluminum alloy and steel
structures.
All attempted research steps mentioned above were carried out successfully. The results
obtained within this effort will increase overall understanding of the structural integrity of welded
aluminum alloys and steel structures.

1
CHAPTER 1 : INTRODUCTION
1.1. Research Rationale and Objectives
Structural integrity is the ability of a structure to withstand a designed service load,
resisting structural failure due to fracture, deformation, or fatigue. Structural integrity includes
tasks in many areas including structural analysis, failure analysis, non-destructive testing,
corrosion, creep analysis, metallurgy and materials characterizations, fracture mechanics, fatigue
life assessment, welding metallurgy, welding defects, structural monitoring and instrumentation,
etc. (James 1998; Alam 2005). Current research deals with the structural integrity analysis of
weld joints.
Welding is a fabrication process that joint materials, is an ancient art. Welds are
extensively utilized in almost every field of metal constructions including ships, bridges, cranes,
off-shore structures, pressure vessels, piping, automotive, aerospace, etc. Weld joint may contain
several complications especially complex weld metallurgy, weld defects, distortion, and post-
weld residual stresses. In most welded structures, failure usually initiates from a weld joint. In
order to maintain structural integrity of welded structures, relationship between welding process,
properties, and performance of the structure should be well-understood and established (Koçak
2010). Specific features of each welding and joining process should be well-understood as well,
for a particular material. Another important practice of weld joints is post-weld treatment (PWT).
Post-weld treatments are required to improve and refine microstructures and enhance
performances of weld joints. Each welding method and material requires specific PWT condition
to optimize performances.
2
In this research, structural integrity as well as the effect of weld defects and various post-
weld treatments techniques are experimentally investigated on different weld joints. Two
different welding techniques including friction-stir-welding (FSW) and gas tungsten arc welding
(GTAW) are employed in this research. Widely utilized two different types of aluminum alloys
(AA2219-T87 and AA6061-T651) and two different types of steels (AISI-4140 and AISI-1018)
are used to cover most important aspects broadly and encompassing all general aspects of the
investigation. Details of the scopes and objectives of this research are discussed below.
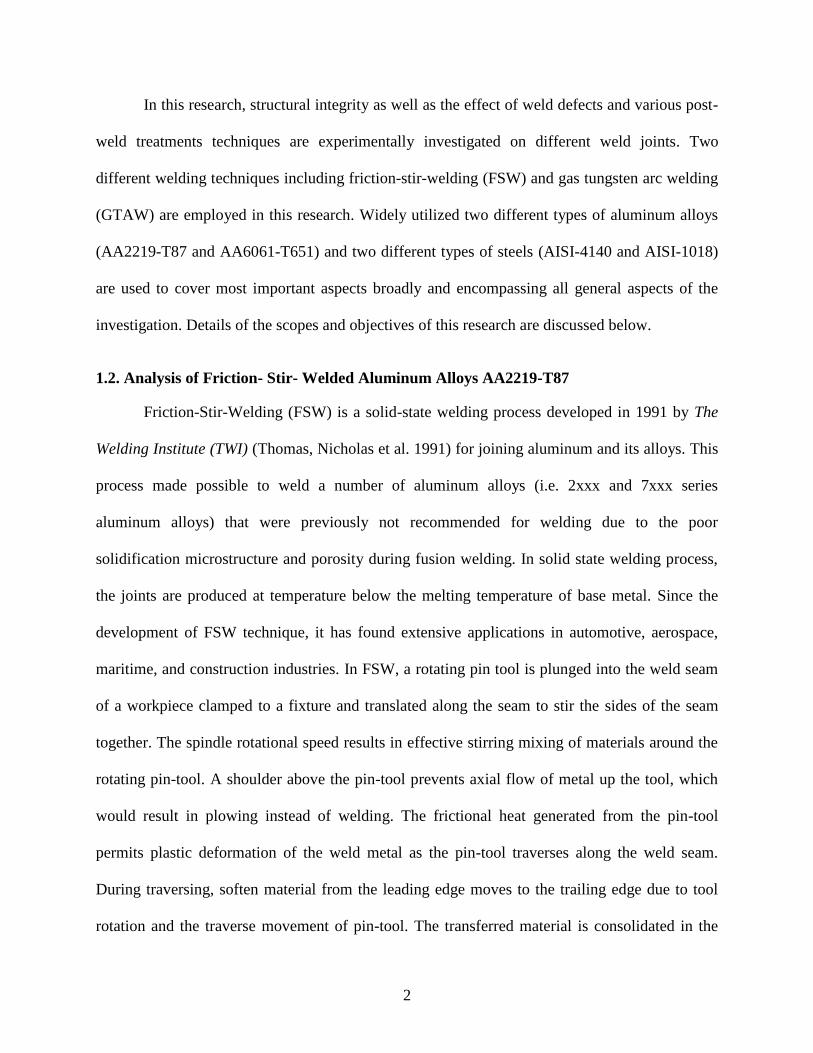
1.2. Analysis of Friction- Stir- Welded Aluminum Alloys AA2219-T87
Friction-Stir-Welding (FSW) is a solid-state welding process developed in 1991 by The
Welding Institute (TWI) (Thomas, Nicholas et al. 1991) for joining aluminum and its alloys. This
process made possible to weld a number of aluminum alloys (i.e. 2xxx and 7xxx series
aluminum alloys) that were previously not recommended for welding due to the poor
solidification microstructure and porosity during fusion welding. In solid state welding process,
the joints are produced at temperature below the melting temperature of base metal. Since the
development of FSW technique, it has found extensive applications in automotive, aerospace,
maritime, and construction industries. In FSW, a rotating pin tool is plunged into the weld seam
of a workpiece clamped to a fixture and translated along the seam to stir the sides of the seam
together. The spindle rotational speed results in effective stirring mixing of materials around the
rotating pin-tool. A shoulder above the pin-tool prevents axial flow of metal up the tool, which
would result in plowing instead of welding. The frictional heat generated from the pin-tool
permits plastic deformation of the weld metal as the pin-tool traverses along the weld seam.
During traversing, soften material from the leading edge moves to the trailing edge due to tool
rotation and the traverse movement of pin-tool. The transferred material is consolidated in the

3
trailing edge of the tool by the application of axial force. During FSW processing, deformation
takes place at very high strain rates, leaving a fine equiaxed structure in the weld nugget (WN)
region (Stewart, Adams et al. 1998; Colligan 1999; Guerra, Schmidt et al. 2002; Nunes Jr. 2010).
FSW is considered as a combination of extrusion, forging, and stirring of the material where a
high strain rate and temperature are generated. Further the process involves complex movement
of materials and intense plastic deformation. In general, FSW is a complex process that depends
on many variables that affect the quality of the weld joint produced. In order to produce a high
quality defect-free weld, the welding process parameters (rotational speed, welding speed, and
plunge force) and pin-tool design must be chosen carefully (Jata and Semiatin 2000; Colligan
2007; Schneider, Nunes Jr. et al. 2010; Rajakumar, Muralidharan et al. 2011). Since the onset of
FSW process two and a half decades ago, investigators have researched the influence of
parameters on microstructure and mechanical properties of various aluminum alloy joints.
The current study explores FSW process parameters of a fixed pin-tool to obtain defect
formation mechanisms. The study aims to utilize the defect formation mechanism and apply the
results to a general understanding of process parameter correlation. The experiments investigated
butt-welded 8.13 mm thick AA2219-T87 by varying the three welding process parameters:
rotational speed (𝑁), welding speed (𝑉), and downward plunge force (𝐹𝑧). All other features,
including pin-tool geometry and fixture conditions are held constant. Aluminum alloys AA2219-
T87 was chosen because of its light-weight and high strength properties as well as extensively
employed in present-day aerospace industries. The effect of the various weld schedules on
uniaxial tensile strength, toughness, and fracture configuration of tensile specimens are
determined. Based on experimental investigations, an empirical correlation has been developed
to identify defective and defect-free weld schedule. Then an optimized adaptive neuro-fuzzy

4
inference system (ANFIS) model has been developed utilizing experimental data to predict
tensile strength of FSW- joints. Lastly, an optimized post-weld heat treatment condition has been
obtained to achieve optimum tensile properties of FS-welded AA2219-T87 joints.
1.3. Analysis of Fusion Arc Welded Aluminum Alloys AA6061-T651
For aluminum alloys, generally friction-stir-welding (FSW) and fusion arc welding
techniques are used to make a weld joint. FSW usually offers better performances on aluminum
alloy joint compared to conventional fusion arc welding techniques. Due to higher initial cost
and non-portability of FSW machine, it is only utilized in some specific applications; but in
general fusion arc welding techniques are utilized in many structural applications to join
aluminum alloys. Two of the most common fusion arc welding practices are gas tungsten arc
welding (GTAW) and gas metal arc welding (GMAW). Among two of them, GTAW is a high
quality fusion arc welding technique which is typically utilized for joining heat-treatable
aluminum alloys. High coefficient of thermal expansion of aluminum, solidification shrinkage,
and high solubility of hydrogen during its molten state creates problem in fusion arc welding of
aluminum alloys (Lakshminarayanan, Balasubramanian et al. 2009). Intrinsic weld defects (i.e.,
porosity in weldment), post-weld residual stresses, and microstructural changes are the key
factors for the performance reduction and failure of fusion welded aluminum alloys (Leggatt
2008). The influences of weld defects and post-weld heat treatment (PWHT) on tensile
properties of gas tungsten arc (GTA) - welded aluminum alloy AA6061-T651 joints are
investigated for this particular project. Aluminum alloys AA6061-T651 was chosen because of
its weldability and corrosion resistance properties over many high strength aluminum alloys as
well as extensively utilized in many structural applications (Dudas and Collins 1966; Metzger
1967). The objective of this work is to obtain tensile test data for GTA- welded AA6061-T651
5
joints containing specific weld defects and to correlate these data with the nondestructive phased
array ultrasonic testing (PAUT) results. Tensile test data are also correlated with microscopic
evaluation; and a comparison is made between these two inspection methods relative to the
evaluation of weld discontinuities. The present investigation also included the evaluation of the
influences of PWHT on mechanical properties of GTA- welded AA6061-T651 aluminum alloy
joints.
1.4. Analysis of Fusion Arc Welded Steels
In many structural applications conventional and alloy steels are utilized for their higher
modulus, strength, and toughness properties. For structural steels, different fusion welding
techniques are usually employed to make a weld joint. In the current investigation, one type of
high strength alloy steel (AISI-4140) and one type of low carbon steel (AISI-1018) are welded
using commonly utilized gas tungsten arc welding (GTAW) technique. Unlike aluminum alloy
joints, weld defects are not of prime concern for steel joints. By controlling welding conditions
and weld process parameters, defect-free weld joint can be obtained fairly easily; but residual
stress development, microstructure changes, and unstable brittle fracture are unavoidable active
problems for alloy steel joints that require special attention to address these types of problems.
To improve mechanical performances of fusion arc welded alloy steel joints, two different post-
weld treatment (PWT) techniques e.g., post-weld heat treatment (PWHT) and electrolytic-
plasma-processing (EPP) are utilized. The effects of PWHT and EPP on the residual stresses,
micro-hardness, microstructures, and mechanical properties of GTA- welded joints are
investigated. Finally, tensile tests are carried out to identify the effect on the strength recovery
and change of ductility due to different heat treatment processes. At the end, biaxial fatigue

6
behavior of GTA-welded steel is investigated utilizing specifically designed and fabricated
rotating-bending-torsional (RBT) fatigue testing machine.
1.5. Chapters Overview
The research encompassing in this dissertation of the above mentioned studies are
presented in chronological order as follows:
In Chapter 1, a rationale for the study of structural integrity analysis and performance
improvement of different weld joints are given.
In Chapter 2, an extensive critical literature review related to different welding techniques,
welding process parameters, welding defects, non-destructive testing (NDT) of welds,
microstructures, residual stresses, mechanical performances of weld joints are discussed. The
literature related to post-weld treatments and multiaxial fatigue analysis of weld joints are
also reviewed in this chapter.
In Chapter 3, materials and welding techniques utilized in this research are discussed.
Different destructive and non-destructive testing utilized for structural integrity analysis of
weld joints are also described in this chapter.
In Chapter 4, an analysis of Friction-Stir-Welding (FSW) process parameters, weld defects,
and weld quality of friction-stir (FS) butt weld joints of AA2219-T87 are explored. FSW
process parameter window and empirical correlation for effective joining of AA2219-T87 are
also discussed in this chapter.
In Chapter 5, an optimized Adaptive neuro-fuzzy inference system (ANFIS) model has been
developed utilizing experimental data to predict tensile strength of FSW joints. This chapter
also comprised the development of an optimized predictive Artificial Neural Network (ANN)
model and comparison with ANFIS model established.
7
Effects of post-weld heat treatment (PWHT) on tensile and microstructural behavior of FS-
welded AA2219-T87 joints are discussed in Chapter 6.
The influences of weld defects and post-weld heat treatment (PWHT) on tensile properties of
gas tungsten arc (GTA) - welded aluminum alloy AA6061-T651 joints are investigated
Chapter 7.
In Chapter 8, the influences of two post-weld treatment (PWT) techniques including post-
weld heat treatment (PWHT) and electrolytic-plasma-processing (EPP) are investigated on
gas tungsten arc (GTA) - welded AISI-4140 alloy steel joint.
In Chapter 9, the influences of rotating-bending (RB) fatigue loading conditions along with
the pulsed torsional load are evaluated on commonly used welded steel (AISI-1018).
In Chapter 10, conclusions arrived from the findings of this research and recommendations
for future work are presented.

8
CHAPTER 2 : LITERATURE REVIEW
2. Introduction
Various welding techniques are extensively utilized in manufacturing sector for different
structures ranging from bridges and machinery to all kinds of automobiles, marines, nuclear
reactors, and space vehicle, etc. But a weld joint may contain several complications especially
complex weld metallurgy, weld defects, distortion, and post-weld residual stresses. These
complications are responsible for performance reduction in service conditions as well as failure
of welded structures. Hence, structural integrity analysis and performance improvements of weld
joints are an important issue which needs to be investigated comprehensively. In the current
research, widely utilized two different types of aluminum alloys (AA2219-T87 and AA6061-
T651) and two different types of steels (AISI-4140 and AISI-1018) are used to cover broadly, all
general aspects of the investigation. Different destructive and non-destructive testing techniques
are utilized for structural integrity analysis of weld joints. Different post-weld treatment
techniques are utilized for different materials to improve mechanical performances of weld
joints. At the beginning of current research, an extensive literature review has been undertaken to
appreciate current research topic and obtain essential information which are required to
contribute in the field of structural integrity analysis and performance improvement of welded
structures. Details of literature review are discussed below.
2.1. Friction-Stir-Welding (FSW) of Aluminum Alloys
The big advancement in aluminum structures came during the World War II when just
about every aircraft was produced using this particular non-ferrous material. The extensive
applications required for a dependable welding technique to develop. From that time, widely

9
utilized gas metal arc welding (GMAW) and gas tungsten arc welding (GTAW) techniques are
usually employed to join aluminum. High coefficient of thermal expansion of aluminum,
solidification shrinkage, and high solubility of hydrogen during its molten state
(Lakshminarayanan, Balasubramanian et al. 2009) makes it difficult to utilize these two fusion
arc welding techniques. Meanwhile different aluminum alloys are devised and makes more
complication to apply fusion arc welding techniques. Fusion arc welding in which heat results
due to the intrinsic nature of the welding processes causes various weld defects as well as,
responsible for strength reduction in heat- treatable aluminum alloy joints. To overcome this
problem solid- state friction- stir- welding (FSW) technique has been developed. FSW process
has been developed in 1991 by The Welding Institute (TWI) (Thomas, Nicholas et al. 1991). In
FSW process, the metal that needs to be welded is not melted during the welding process. Thus
the cracking and porosity often associated with fusion welding of aluminum and its alloys are
eliminated in FSW (Knipstrom and Pekkari 1997; Liu, Murr et al. 1997; Mahoney, Rhodes et al.
1998; Sato, Kokawa et al. 1999). Now-a-days, the FSW process is widely utilized to weld
aluminum and its alloys in order to obtain high quality weld joints. A study using aluminum
alloy AA2219-T87 performed to compare three welding techniques, i.e., FSW, gas tungsten arc
welding (GTAW), and electron beam welding (EBW) (Malarvizhi and Balasubramanian 2011).
The paper illustrated that FS- welded joints had UTS joint efficiency 20% higher than GTAW
and 12% higher than EBW. Another three similar studies published by same research group
(Malarvizhi and Balasubramanian 2011; Malarvizhi and Balasubramanian 2011; Malarvizhi and
Balasubramanian 2012) and showed that the fatigue strength and fatigue life of the AA2219
aluminum alloy greatly reduced by welding processes. Among the three as-welded joints, the
joints fabricated by FSW process exhibited higher fatigue strength and fatigue life compared to

10
GTAW and EBW joints. One more comparative study of GTAW and FSW was conducted in
(Lei, Deng et al. 2014) with AA2219-T87 panels. It was concluded that the FSW joints had
better mechanical properties than the GTA- welded joints.
2.1.1. Friction- Stir- Welding (FSW) Process
In FSW process, a rotating pin-tool is plunged into the weld seam of a workpiece
clamped to a fixture and translated along the seam to stir the sides of the seam together. A
shoulder above the pin-tool prevents axial flow of metal up the tool. According to the design of
pin-tool, FSW technique is classified into two categories: (a) conventional (fixed-pin) FSW and
(b) self-reacting FSW. Self-reacting FSW incorporates two opposing shoulders on the crown and
root sides of the weld joint. In self-reacting friction stir welding, the weld forge force is reacted
against the crown shoulder portion of the weld pin-tool by the root shoulder. On the other hand,
conventional (fixed-pin) FSW incorporates a fixed pin-tool with single shoulder on crown side of
the weld joint.
During FSW process, the high plunge force on the immersed pin-tool ensures that it
seizes in the weld metal. The mechanical power input from the tool is transformed into heat and
results in plastic deformation within the weld metal. Plastic deformation takes place at very high
strain rates, leaving a fine equiaxed structure in the weld nugget region (Stewart, Adams et al.
1998; Colligan 1999; Guerra, Schmidt et al. 2002; Guerra, Schmidt et al. 2002; Su, Nelson et al.
2003; Nunes Jr. 2010). FSW process involves four segments which are: (1) plunging phase, (2)
dwelling phase, (3) welding phase, and finally (4) exit or retract phase (Figure 2.1). The welding
process starts with rotating pin-tool thrusting onto the configured work materials under a
constant axial load to generate frictional heat. This process will continuously increase the
temperature at the immediate contacting surface of the rotating tool and work material. The

11
process continue until the temperature at the immediate contact of the rotating tool and the work
material increased to a temperature which causes the work material to soften, plasticized and
significantly lose its strength. Consequently, these conditions allow the rotating tool to penetrate
to a certain depth usually almost to the thickness of work material. This process is known as
plunging phase. The end of the plunging phase is signified by the sound contact of the rotating
tool shoulder with the immediate work material surface. At this moment, the process enter the
dwelling phase where the rotating tool is allowed to dwell for a certain time, causing the
temperature to increase further, up to its hot working temperature. Once this condition is
reached, thin soft material layers is produced and would stick to the dynamic rotating tool
surfaces (pin and shoulder) and being forced to be displaced along. The dwelling phase is
followed by welding phase.
Figure 2.1: Friction- Stir- welding (FSW) process phases of a butted work material configuration
(AWS 2007)
12
After the local temperature of work- material under the rotating tool approaches its hot working
temperature and is soft enough to be stirred and displaced, the rotating tool is moved transversely
along the welding line. This traverse motion caused the plasticized soft material at the leading
edge of the rotating tool being squeezed and sheared through a small slit formed by the displaced
soft material at the side or lateral of the tool, preferably in the direction of tool rotation. The
displaced soft material is then deposited to the gap at the trailing edge, left by rotating pin-tool or
probe. In (Schneider and Nunes Jr. 2004), a kinematic flow model is developed to explain
material flow during FSW process. They break down the movement of metal flow into 3
incompressible flow fields (Figure 2.2). The first flow component is a plug of metal in rigid body
rotation which is separated from rest of the weld metal by a cylindrical shearing surface. The
rotating plug is perceived as attached to the friction-stir pin-tool and has same rotational speed of
the pin-tool (Figure 2.2a). The second flow-component is a homogeneous and isotropic flow
field and moves opposite to the tool travel velocity (Figure 2.2b). The third flow component is a
ring-vortex flow field encircling the pin-tool (Figure 2.2c). The ring-vortex flow is driven by
threads on the pin and is reversed if the direction of the threads or the direction tool rotation is
reversed. These three incompressible flow fields combine to predict metal flow along two
possible paths, the Straight-through current and the Maelstrom current (Schneider and Nunes Jr.
2004). At the end or exit phase of FSW process, the rotating tool is retracted away from the work
material leaving a cylindrical hole mark that once occupied by the pin-tool.
To produce a high quality defect-free weld, welding process parameters such as: rotational
speed, welding speed, and axial plunge force or displacement, and tool pin design must be
chosen carefully (Jata and Semiatin 2000; Peel, Steuwer et al. 2003; Colligan 2007; Schneider,
Nunes Jr. et al. 2010; Rajakumar, Muralidharan et al. 2011).

13
Figure 2.2: (a) Rigid body rotation, (b) Uniformly translation along the weld seam, (c) Ring
vortex flow through the metal thickness, and (d) Two inter-twined flow paths (Schneider and
Nunes Jr. 2004)
For a particular pin-tool, three variables called plunge or forge force (Fz), spindle rotational
speed (𝑁), and travel or welding speed (𝑉), are considered the three critical process parameters
which are utilized to soften metal near the pin-tool to create a plastic deformation field.
Schematic of FSW process and three critical process parameters are shown in Figure 2.3.
Figure 2.3: Schematic of friction- stir- welding (FSW) process showing three critical process
parameters (𝐹𝑧 , 𝑉, 𝑁) (HILDA)

14
Since the beginning of FSW process, investigators have researched the influence of parameters
on microstructures and mechanical properties of different series of aluminum alloys (Rhodes,
Mahoney et al. 1997; Flores, Kennedy et al. 1998; Li, Murr et al. 1999; Abbasi Gharacheh,
Kokabi et al. 2006; Khodir, Shibayanagi et al. 2006; Elangovan and Balasubramanian 2007;
Record, Covington et al. 2007; Scialpi, De Filippis et al. 2007; Balasubramanian 2008;
Cavaliere, Squillace et al. 2008; Colligan and Mishra 2008; Kulekci, Şik et al. 2008;
Lakshminarayanan and Balasubramanian 2008; Babu, Elangovan et al. 2009; Commin, Dumont
et al. 2009; Moreira, Santos et al. 2009; Rajakumar, Muralidharan et al. 2011; Querin and
Schneider 2012; Rajakumar and Balasubramanian 2012; Shashi Prakash 2014) with a view to
optimize FSW processes. Among different grades of aluminum alloys, AA2219 has found wide
applications in aerospace industry. Presently, AA2219-T87 is used by the National Aeronautics
and Space Administration (NASA) for construction of the Space Launch System (SLS) and
Orion crew module. The current FSW research study is limited to the investigation of aluminum
alloys AA2219-T87.
2.1.2. Critical Evaluation of Existing Literature and Trend in FSW of AA2219
In different research study, heat- treatable AA2219 is utilized at various temper
conditions. Different heat treatment results in different mechanical properties. In Table 2.1,
various heat treatment techniques with associated mechanical properties are listed for AA2219
(Oberg 2012). It is observed that AA2219-T87 gives better ultimate tensile and yield strengths
compared to other heat treatments; however, the elongation percentage is lower. The high
strength qualities of this material are the reasons why aerospace companies utilize this particular
material.

15
Table 2.1: Mechanical properties of AA2219 with different temper condition (Oberg 2012)
Aluminum alloy UTS,
[MPa] Yield Strength [MPa]
Elongation in 50.8 mm
(%) for 1.59 mm thick
specimen
2219-T87 475.7 393.0 10
2219-O 172.4 75.8 18
2219-T81, T851 455.1 351.6 10
2219-T62 413.7 289.6 10
2219-T37 393.0 317.2 11
2219-T42 358.5 186.2 20
A review of literature available in public domain is presented in this section. The literature
review analyzes welding procedures including pin-tool type, FSW machine, number of welds
conducted, AA2219 temper designations, and essential conclusions. Firstly, works conducted
analyzing effects of varying process parameters, mechanical properties, and FSW defects are
reported. Secondly, residual stress and post-weld heat treatment (PWHT) analysis of AA2219 are
presented. Correlations among FSW process parameters are provided after. Fourthly, works
related to model to predict tensile properties of FSW weld joints are reviewed.
2.1.2.1. FSW process development and mechanical properties
Due to the extensive applications of AA2219, a number of research efforts have been
conducted pertaining to FSW of AA2219 and analyzed the effect of FSW process parameters. In
(Arora, Pandey et al. 2010), reported that plunge force is dependent only on pin-tool shoulder
diameter and rotational speed. Welding signal data of plunge force and welding force in the
longitudinal, or travel direction were analyzed. The force in the travel direction of the pin-tool
was exclaimed to be dependent on the welding speed and pin diameter. In their study a total of 9-
weld schedules were used to join AA2219-T62 specimens, followed by microstructural analysis.
It was shown that grain structure in the weld zone (WZ) had an average size decrease by a factor
of 10 as compared to the base metal.

16
Xu and his research group utilized AA2219 (Xu, Liu et al. 2009) and AA2219-T6 (Xu,
Liu et al. 2009) to analyze temperature evolution, microstructures, and mechanical properties of
FS-welded thick plates. The results from their study indicated that advancing side (AS)
temperatures are higher as compared to retreating side (RS) temperatures. It was also shown that
by increasing rotational speed and decreasing travel speed, heat input into the system as well
grain size can be increased. In another study from the same research group (Xu, Liu et al. 2013),
investigated the effect of two different pin-tools for FSW of AA2219-T62 with varying travel
speed and rotational speed on microstructure variation along the thickness. It was shown that
there is a change in apparent grain size at varying thicknesses in a FSW joint. At the top of the
weld close to the shoulder, large grain sizes were observed whereas the bottom exhibited smaller
grain sizes. It was exclaimed that the pin- tool profile had little effect on the tensile properties,
but rather changing travel speed and rotational speed had considerably more significant effects.
Another research group (Chen, Liu et al. 2006) studied FSW characteristics on aluminum
alloys AA2219 and AA2219-T6. In their study rotational speed was kept constant with varying
travel speeds. It was concluded that the base material tempering conditions had a significant
impact in welding morphologies, resulting in significant effects on the tensile properties. Similar
to previous study by (Xu, Liu et al. 2009), this research group published another study (Li, Shen
et al. 2011). In that study, FSW experiments were carried out on AA2219-T6 thick panels with
14 welds schedules by varying rotational speed and travel speed. The paper presented defects
found; consequently, a variety of non-destructive evaluation (NDE) techniques were conducted
to illustrate each type’s inherent limitations, which revealed X-ray detection, ultrasonic C-scan
testing, phased array ultrasonic testing (PAUT), and fluorescent penetrating fluid inspection were
able to successfully detect welding defects. In another study by this group (Liu, Zhang et al.

17
2012), investigated how process parameters affect welds and their microstructures utilizing
AA2219-T6. The study reported 10- weld schedules with various weld defects. The study
concluded that with increasing rotational speed the tensile properties increased to a maximum,
then slowly decreased where defects were formed. Reported maximum ultimate tensile strength
(UTS) was 340 MPa; which is 79% of the base material strength.
Elangovan and Balasubramanian published two research papers (Elangovan and
Balasubramanian 2007; Elangovan, Balasubramanian et al. 2008). They investigated the effects
of various pin-tool profiles on tensile properties of FS-welded AA2219. It was shown that the
square pin-tool geometry produce superior tensile properties. A study by the same research group
(Elangovan, Balasubramanian et al. 2008) developed an empirical relation to predict tensile
strength of FS- welded AA2219. Similar to their previous study, it was concluded that a square
pin-tool with a rotational speed of 1600 RPM, travel speed of 0.75 mm/sec, and plunge force of
12 kN result in superior tensile properties. An optimization investigation was conducted in
another study (Babu, Elangovan et al. 2009) on aluminum alloy AA2219. The study involves
development of a mathematical model to predict tensile strength by incorporating process
parameters and tool profiles. The optimization study was conducted utilizing the Hooke and
Jeeves technique. In (Lakshminarayanan, Malarvizhi et al. 2011), a friction-stir-welding window
was developed for effective joining of AA2219 aluminium alloy. They showed that the defect-
free FSW AA2219 joints are produced under a wide range of rotational and welding speed. The
experiments were performed utilizing position control techniques and the effect of plunge force
was not considered in that study.
Davis, in his MS thesis showed the effect of different welding process parameters and
pin-tool profile on tensile properties of FSW joint of AA2219-T87 (Davis 2010). Querin and

18
Schneider developed an alternative heat indexing equation for effective FSW of AA2219-T87
plates (Querin and Schneider 2012). In another study by Schneider and other researchers
investigated the influence of FSW tool and welding process parameters on weld structure and
properties of AA2219-T87 plates (Schneider, Nunes Jr. et al. 2010).
Detailed descriptions of the pin-tool, welding machine, fixture conditions, process
parameters, and control settings are often overlooked in most of the reported literatures. FSW
research is a costly endeavor, and for this reason university studies are quite limited due to these
constraints. Therefore, innovative approaches have been taken to circumvent this issue. One such
method is to utilize milling machines that have been converted into FSW machines. This
practice, however, has never been evaluated as to whether it affects FSW results and introduces
other pitfalls which may lead to an investigation to inaccurate data.
2.1.2.2. Defects in FSW joints
In general, friction- stir- welded joints are generally known to be free from defects like
porosity, slag inclusion, solidification cracks, etc., which are common in fusion arc welding of
aluminum alloys (Fujii, Cui et al. 2006). But FSW joint efficiency depends on several operating
parameters. Generally improper plastic flow and insufficient consolidation of metal result in
weld defects in the FS- process region (Rhodes, Mahoney et al. 1997). Internal cavity or
Wormholes (WH), Surface cavity or Trenching (TR), Incomplete Penetration (IP), Underfill
(UF), and micro-voids are most common weld defects are usually observed in friction- stir-
welded aluminum alloy joints (Kim, Fujii et al. 2006). In (Arbegast, Coletta et al. 2001; Arbegast
2004), different types of FS weld defects are discussed (Figure 2.4).

19
Figure 2.4: Typical FSW defects and related process parameters window (Arbegast 2004)
Internal cavity or Wormholes are defined as an advancing side tunnel of inadequately
consolidated and forged material running in the longitudinal direction. Wormholes are usually
observed in cold welds. Surface cavity or Trenching are known as a continuous or intermittent
top surface void on the advancing side of the weld nugget (Chen, Yan et al. 2006). Trenching is
also observed in cold welds where plunge force is insufficient. Inadequate pin depth or
insufficient metal flow (Sato, Takauchi et al. 2005; Di, Yang et al. 2006) might result in
incomplete penetration defect in a cold welds. Unfavorable design of the pin also contributes to
IP (Oosterkamp, Djapic et al. 2004). The nomenclature of incomplete penetration is not
established and unified in the literature (Le Jolu, Morgeneyer et al. ; Sato, Yamashita et al. 2004;
Chen, Yan et al. 2006). IP is also known as lack of penetration (LOP), kissing bond (KB), and
joint line remnant (JLR). Flash or underfill resulted for the excessive expulsion of material on

20
the top surface leaving a corrugated or ribbon like effect along the retreating side of the weld
nugget. Underfills are commonly observed in hot welds. A large mass of flash defects are formed
at a higher plunge force or rotational speed or a lower welding speed. The large mass of flash is
ejected to the outside due to the softening of the metal by the excess heat input during the FSW.
In hot weld case, the tip of the tool probe sometimes touches the backing plate. By controlling
welding conditions and critical weld process parameters, a defect free aluminum alloy weld joint
can be easily obtained utilizing FSW techniques.
2.1.3. Post-Weld Residual Stress and Post-Weld Heat Treatment
Friction- stir- welding (FSW) is an innovative solid phase welding process in which the
metal to be welded is not melted during welding rather plasticized sufficiently, thus the cracking
and porosity often associated with fusion welding processes are eliminated (Knipstrom and
Pekkari 1997). Therefore, the FSW process can also be used to weld heat-treatable aluminum
alloys in order to obtain high quality joints. However, some studies (Mahoney, Rhodes et al.
1998; Campbell and Stotler 1999; Liu, Fujii et al. 2003) on the microstructural characteristics
and mechanical properties of the friction-stir-welded joints have indicated that FSW gives rise to
softening in the joints of the heat-treatable high strength aluminum alloys because of the
dissolution or growth of strengthening precipitates during the welding thermal cycle. The
softening might result in the degradation of mechanical properties of weld joints. In literature, it
is showed that the tensile strength of FS- welded heat treatable aluminum alloy joints varied
from 60% to 70% of base metal tensile strength (Elangovan and Balasubramanian 2007; Babu,
Elangovan et al. 2009; Moreira, Santos et al. 2009).
During FSW process, generated frictional heat is not uniform. Non-uniform heat
generation results in development of non-uniform microstructures and post weld residual stresses

21
around the weld nugget. In (Xu, Liu et al. 2011), AA2219-T62 panels with 12 mm thickness
were FS- welded and top and bottom residual stresses were determined. It was shown that on the
top surface of the plate, the residual stresses decreased with increased rotational speed. On the
other hand, the residual stress on the bottom surface increased with an increase in rotational
speed. Post-weld heat treatment is commonly utilized to remove residual stresses and improve
strength of heat treatable aluminum alloy joints. In (Liu, Chen et al. 2006), artificial age-
hardening (165 °C for 18h) was employed on FS- welded AA2219-T6 to determine the effects of
PWHT on tensile properties. It was shown that PWHT sample exhibited 89% tensile strength of
the base material. Fractures in the defect-free tensile specimens (both as- welded and PWHT)
were found to occur in the heat-affected-zone (HAZ) of retreating side (RS). In (Chen, Liu et al.
2006), the effect of PWHT conducted on FS-welded AA2219. Their PWHT involves solution
treatment at 535 °C for 32 min, followed by quenching at 25 °C and artificial aging at 165 °C for
18h. They showed that the PWHT increases tensile strength of FS-weld joint. In another study
(Feng, Chen et al. 2006), the effect of solution temperature was analyzed on FS- welded AA2219
panels. According to that study, higher solution temperature has resulted in higher tensile
properties and PWHT had a significant effect on fracture locations of the weld joints.
2.1.4. FSW Process Parameters Correlation
In FSW of any material, the first and foremost issue is defining the processing window to
avoid generation of defective welds. In manufacturing settings, determining this operating
window is a key task as material, time, and operating conditions are costly. To date, a “trial and
error” method is used to establish process parameters for each tool design, material, and setup.
There are many research study reported the effect of various weld process parameters on tensile
and microstructural behavior of different FSW joints (Rhodes, Mahoney et al. 1997; Flores,
22
Kennedy et al. 1998; Khodir, Shibayanagi et al. 2006; Moreira, Santos et al. 2009; Rajakumar,
Muralidharan et al. 2011; Shashi Prakash 2014). For a particular material and welding condition,
FSW process parameter ranges are established by welding over a range of spindle speeds (𝑁)
and welding speeds (𝑉) in displacement control or load control modes and selecting parameter
windows to obtain the required weld strength or other desired property. In (Lakshminarayanan,
Malarvizhi et al. 2011; Balaji and Mahapatra 2013), have presented an example of parameter
window determination for FSW of AA2219. In (Lakshminarayanan, Malarvizhi et al. 2011),
derived a process parameter window based on a total of 22 weld schedules with varying
rotational speed and travel speed conducted on AA2219-T87 panels with 8 mm thickness. In
their study, the welding window was established based upon macro-structural analysis of tensile
properties, hardness distribution, and microstructural analysis. In (Balaji and Mahapatra 2013),
conducted an experimental and modeling study of AA2219-T87 using only 2- weld schedules
with varying rotational, travel, and plunge force values. Ultimate tensile strength (UTS) and
percent elongation of welds were evaluated. Analysis-of-variance (ANOVA) result has indicated
that the plunge force has the most influencing factor on UTS and percent elongation. An
optimized welding schedule was determined by using the multi-response desirability function-
based optimization technique. The scope of their studies was somewhat limited.
Some simplified theoretical aids, e.g., similarity indices, have been suggested to assist in
the FSW process. An ideal similarity index determines how parameters can be varied together to
obtain similar welds. The ideal is seldom achieved in practice, but even an approximation may
be helpful. An empirical Pseudo Heat Index (PHI) has been proposed (Kandukuri, Arbegast et al.
2007) to correlate the heat input during FSW with spindle speed and welding speed; if heat input
determines weld properties, similar welds are obtained by holding the index constant. The PHI
23
does not include many process features affecting weld properties and is only good for
extrapolations of welding speed and spindle speed for a specified welding situation. Nunes
(Nunes Jr. 2010) has proposed a temperature index based on a physical model of the FSW
process in which temperature is computed from a balance between estimated mechanical heat
input and estimated heat losses. In that model, shear stress is assumed to be linearly related to
temperature. Querin and Schneider (Querin and Schneider 2012) have proposed an Alternative
Heat Indexing (AHI) equation considering heat generation terms and thermal dissipation.
Dehghani et al. (Dehghani, Amadeh et al. 2013) suggested a Heat Input Factor (HIF) to
determine weld quality. In their model plunge force is assumed to be constant and welding speed
having a linear relation with welding heat generation. None of these indices include plunge force,
yet plunge force may make the difference between the presence and absence of a defect. In the
work reported by (Ramulu, Narayanan et al. 2013), proposed a simplified equation relating to
plunge force or spindle torque with welding speed or spindle rotational speed to identify
defective and defect- free weld schedules. They concluded that for an internal defect- free weld,
higher tool rotational speed yields to lesser axial force and torque (Ramulu, Narayanan et al.
2013). From their equation, a qualitative comparison needs to be established to identify only
internal defect- free weld joint.
A more powerful theoretical aid would be a defect formation criterion, a parametric
relationship establishing the boundary between welds (i) with a particular defect and (ii) welds
without a defect. To do that, it needs to consider as many defect criteria as there are defect types.
In another approach, all the defect criteria can be superposed together to establish a defect-free
window in parameter space. Currently, there are no theoretical defect criteria available to
determine the operational window. The computations to obtain them are hugely complex.

24
2.1.5. Model to Predict Tensile Properties of FSW Joints
Development of an appropriate physical model which can predict the process's main
characteristics (weld defects and mechanical properties) is really complex. Hence, researchers
focused on creation of predictive models based on numerical analysis such as finite element
methods or empirical models based on experimental observations (Record, Covington et al.
2007; Elangovan, Balasubramanian et al. 2008; Jayaraman, Sivasubramanian et al. 2008;
Lakshminarayanan and Balasubramanian 2009; Rajakumar, Muralidharan et al. 2010; Tansel,
Demetgul et al. 2010; Gopalakrishnan and Murugan 2011; Rajakumar, Muralidharan et al. 2011;
Bilici 2012; Bozkurt 2012; Dinaharan and Murugan 2012; Rajakumar and Balasubramanian
2012; Pradeep and Muthukumaran 2013). Some study reported on nontraditional optimization
algorithm like genetic algorithm (GA)- Taguchi approach (Bilici 2012; Bozkurt 2012) and
simulated annealing (SA) (Yang, Srinivas et al. 2009; Chen, Lin et al. 2010; Zain, Haron et al.
2011) to predict tensile strength of FSW joint. Response Surface Methodology (RSM)
(Elangovan, Balasubramanian et al. 2008; Jayaraman, Sivasubramanian et al. 2008;
Lakshminarayanan and Balasubramanian 2009; Rajakumar, Muralidharan et al. 2011; Dinaharan
and Murugan 2012; Rajakumar and Balasubramanian 2012) has been extensively utilized to
predict mechanical properties of FS- weld joint. RSM consists of a group of mathematical and
statistical techniques that can be used to define the relationships between the response and the
independent variables. The major drawback of RSM is to fit the data to a second order
polynomial (Baş and Boyacı 2007). Highly nonlinear FSW process parameters and tensile
properties might not be well accommodated by the second order polynomial. Some investigators
applied Artificial Neural Network (ANN) (Okuyucu, Kurt et al. 2007; Lakshminarayanan and
Balasubramanian 2009; Tansel, Demetgul et al. 2010) to predict mechanical responses of FSW
joint. Most of them utilized few experimental data and none of them seems to be decisive.

25
Adaptive network-based fuzzy inference system (ANFIS) is a hybrid predictive model
which uses both of neural network and fuzzy logic to generate mapping relationship between
inputs and outputs (Jang 1993). Although ANFIS is a powerful tool for prediction of
manufacturing processes but there is only one study (Babajanzade Roshan, Behboodi Jooibari et
al. 2013) utilized this technique in modeling of FSW process.
Solid- state friction- stir- welding is usually employed on aerospace grade aluminum alloys quite
widely. Still in many applications, fusion techniques are employed to join heat treatable medium
strength aluminum alloys. For structural integrity analysis that also need to be considered. In
next section, critical literatures are reviewed on fusion welding of commonly utilized AA6061.
2.2. Fusion Arc Welding of Aluminum Alloys
Among different aluminum alloys, heat treatable AA6061 (Al- Mg-Si alloys) is most
widely used medium strength aluminum alloy, and has gathered wide acceptance in the
fabrication of light weight structures for its excellent corrosion resistance and weldability quality
(Dudas and Collins 1966; Metzger 1967; Balasubramanian, Ravisankar et al. 2008). Strength
reduction after welding is a great challenge for weld joints of aluminum and it alloys. Apart from
softening in the weld fusion zone and heat- affected-zone (HAZ); weld defects and hot- cracking
are other serious problems in fusion arc welded aluminum alloy joints (Mohandas and Reddy
1996). As discussed earlier, FSW is the best welding technique developed for joining aluminum
alloys. Due to cost, design, and portability constraints it cannot be applied in all applications. For
these reasons, the most commonly used fusion welding technique is still utilized in many
applications. The preferred fusion welding processes for aluminum alloys are gas tungsten arc
welding (GTAW- also known as TIG) and gas metal arc welding (GMAW- also known as MIG)
due to their comparatively easier applicability and better economy (Reddy, Gokhale et al. 1998).

26
GTAW is a high quality weld that uses a non-consumable electrode. The use of welding current
in GTAW is smaller than in GMAW and it may or may not be used with a filler wire.
Lakshminarayana and other researchers studied the effect of GTAW, GMAW, and FSW on the
mechanical properties of aluminum alloys AA6061 (Lakshminarayanan, Balasubramanian et al.
2009).The yield strength of the weld joint after GMAW was 141 MPa with the ultimate strength
being 163 MPa. There was about 50% reduction in strength was observed in GMAW joint. For
GTAW, the yield and ultimate strength were measure to be 188 MPa and 211 MPa, respectively,
resulting in a 37% decrease in strength. The FSW process had the best results, with only a 34%
reduction in strength.
2.2.1. Gas Tungsten Arc Welding (GTAW) of AA6061-T651
The weld quality of a GTAW aluminum joints largely depends on degree of heat input;
and the degree of heat input depends on welding speed, distance between arc-gap, welding
current, shielding gas, and filler metals used. In (Kumar and Sundarrajan 2006), studied the
effects of welding parameters on the mechanical properties of the GTA-welded aluminum alloy
AA6061-T6. Analysis-of-variance (ANOVA) technique was applied to investigate which
welding process parameter has significant effect on the weld joint UTS. The shielding gas
generally utilized to protect the weld pool from oxygen and nitrogen in the atmosphere. Apart
from only weld pool protection, shielding gas can also influence the weld strength, ductility,
toughness, and corrosion resistance of weld joints. Thus choice and flow rate of shielding is
important. There are two different shielding gases are commonly used for arc welding of
aluminums, and these are argon and helium. These gases are used as pure argon, pure helium and
various mixtures of both argon and helium. Plate-gap distance is another important factor that
has influence on weld quality. In (Rao, Liu et al. 2014), it is showed that the gap between two

27
plates helps to expand the arc plasma and transfer metal. Narrow gap may results in incomplete
penetrations defects and large gap result in wider fusion zone. Low welding current might cause
lack of penetration and high welding current might result in porosity in fusion zone. Welding
speed is also related to different weld defect. Higher welding speed or lower welding voltage can
result in lack of fusion in weld joints.
Selection of filler metal is another critical issue for fusion welding. Strength of GTA-
welded aluminum alloy joint largely depends of welding technique and filler metal. Two
different filler metal series (5xxx and 4xxx) are usually utilized for GTAW of 6xxx series
aluminum alloys. If 6xxx series aluminum alloys are welded employing filler metal from 5xxx
series, cracking can occurs in the partially melted zone (PMZ) as the weld zone solidifies
rapidly. To alleviate hot cracking in weldment of AA6061, Si-rich filler metal such as ER-4043
is generally utilized (Mathers 2002; Rahman, Kumar et al. 2010; Cao, Sun et al. 2014; Rao, Liu
et al. 2014), which possess high fluidity and exhibit lowest melting point. In a study by Malin
(Malin 1995), performed hardness and tensile tests on a piece of AA6061-T6 that has been
welded using pulsed gas metal arc welding (GMAW) with a filler metal of AA-4043. The study
showed that the hardness profiles in the heat- affected- zone were (HAZ) around 70% of the base
material. The yield strength of the base material before welding was 305.7 MPa, with an average
value of 206.8 MPa after welding. In another study (Coniglio, Cross et al. 2008), it is showed
that for an 6xxx series aluminum alloy, AA-5356 filler rod is used for high strength, whereas
Aluminum Alloy 4043 is used to improve crack resistance. They concluded that alloy 4043
generally selected because of its weld dilution property which usually decrease the risk of
solidification cracking. Although alloy 5356 may increase the strength, a small crack in a thin
piece of aluminum can significantly reduce its overall strength and life. When 4xxx series filler

28
metal is employed, the weld zone doesn’t respond to only post-weld aging as sufficient
magnesium is not present for the precipitation of Mg2Si, which is the main strengthening phase.
However, these welds respond to solution treatment followed by aging (STA) (Reddy,
Mastanaiah et al. 2006).
2.2.2. Fusion Arc Weld Defects in Aluminum Alloy Joints
Fusion arc welding of Aluminum and its alloys is always a great challenge for designers
and technologists due to the intrinsic problem of porosity in aluminum welding and its eventual
strength reductions. High coefficient of thermal expansion of aluminum (aluminum being a high
heat-sink), solidification shrinkage, and high solubility of hydrogen during its molten state
creates associated problems during fusion welding of aluminum alloys (Martukanitz 1993;
Lakshminarayanan, Balasubramanian et al. 2009). As a consequence, weld defects are quite
common, which result in the lower mechanical properties in aluminum alloys joints. The weld
defects can be in the form of surface or sub-surface cracks, undercut, porosity, or sub-surface
inclusions. The failures of welded structures generally start from preexisting weld defects
(Greenberg 1966) which are intrinsic to the fusion arc welding processes. An important decision
relating to its structural integrity must be made regarding weld defects and their effects on the
strength of welded components. Only a limited number of studies have been reported in the open
literatures on the effects of weld defects on mechanical performances (Rudy and Rupert 1970;
Morton 1971; Lawrence Jr, Munse et al. 1975; Burk and Lawrence 1976). Rudy and Rupert
(Rudy and Rupert 1970) and Lawrence et al. (Lawrence Jr, Munse et al. 1975) studied the effect
of porosity on welded AA2xxx and AA5xxx aluminum alloys, respectively. Morton (Morton
1971) showed a linear relationship between fracture strength and projected defect areas of GTA-
welded AA2xxx aluminum alloys. However, no conclusive study reported on weld defects and
29
their effects on GTA- welded AA6xxx aluminum alloy. A relation between non-destructively
evaluated weld defects and tensile properties can help in designing a welded structure efficiently.
2.2.3. Residual Stresses in Fusion Arc Welded Aluminum alloy AA6061
During the fusion arc welding process, high amount of heat input and rapid cooling
causes the material to yield and results in post-weld residual stresses development along the weld
line and in the HAZ (Leggatt 2008). The material in the HAZ effectively becomes softer and
more susceptible to failure (Malin 1995). Withers (Withers 2007) investigated the effects of heat
input on a material surface. The author concluded that the area at the surface cools much faster
once the heat input is taken away from the material. Because of faster cooling, cool surface
wants to contract while the inside of the material is still under higher temperatures. This will
cause the surface to form tensile residual stresses while the inside of the material will be under
compression. The same theory applies to welding. Since the weld line is the last to cool, this
results in tensile residual stresses that form at the weld line on the surface and moving to
compressive residual stresses below the surface. In some materials, the maximum tensile residual
stress reaches almost to the yield strength of the material. Different factors play a role in the
magnitude of residual stresses that accumulate around the weldment. The geometry of the weld,
the pass sequence (one or multi-pass welds), or the use of fabrication aids, such as jigs, tacks
may have influence on where residual stresses arise. The resistant of the welded joint to expand
and contract has an effect on the various residual stresses in each direction; transversely,
longitudinally, and in the direction normal to the plane of welding. In Figure 2.5, typical residual
stress distribution is illustrated for a butt-weld joint (Masubuchi 2013). Longitudinal residual
stresses (𝜎𝑙), are generally higher than transverse residual stresses (𝜎𝑡), unless the work-piece has
an external constraint that can in part or fully prevent the weld shrinkage. In the case of complete

30
weld shrinkage prevention the resulting residual stresses, 𝜎𝑙 and 𝜎𝑡, may reach the yielding
strength of the weld material. As it can be seen in Figure 2.5, longitudinal stresses (𝜎𝑙) has
reached the maximum in the middle part of the weld, where thermal contraction in the transverse
direction is restrained more than in the surrounding of the much cooled base metal. These tensile
stresses must be balanced by compressive stresses in the base material.
Figure 2.5: Longitudinal and transverse direction along the but-weld shown in fig (a). Typical
distribution of (b) longitudinal (𝜎𝑙) and (c) transverse (𝜎𝑡) residual stresses in a butt joint along
weld line and line vertical to the weld line (Masubuchi 2013)
2.2.4. Residual Stress Measurement
During the in-service operation of weld parts residual stresses can cause harmful
damages. Therefore, measuring the amount of residual stresses in a welded structure has a great
importance. Over the last few decades various residual stress measurement techniques have been
developed. In general, these techniques are qualified as destructive and non-destructive

31
techniques. Destructive methods measure by destroying the state of equilibrium of the residual
stress and measure only the consequences of stress relaxation occurred by destruction. Most
common destructive techniques are the hole-drilling method, the ring core technique, the bending
deflection method, and the sectioning method (Ajovalasit, Petrucci et al. 1996; Thompson, Lu et
al. 1996; Rossini, Dassisti et al. 2012). These methods are widely used in industry and they are
sensitive to the macroscopic residual stress levels. Non-destructive methods are developed on the
basis of relationship between residual stress and the physical or crystallographic parameters.
Different non-destructive techniques are developed such as the X-ray diffraction method, the
neutron diffraction method, the ultrasonic method, and the magnetic method. X-Ray diffraction
method is used for measurement of surface and subsurface stresses (Schajer, Roy et al. 1996). It
can be defined as a surface method. On the other hand, neutron diffraction method allows
measurement up to the depth of 50 mm (Holden and Roy 1996). X-Ray and neutron diffraction
methods are expensive and cannot be carried out in-situ and require the removal of components
(Rossini, Dassisti et al. 2012). Non-destructive ultrasonic testing can be used in most materials to
measure residual stresses. Variations in velocity of the ultrasonic waves can be related to the
residual stress state (Sanderson and Shen 2010). Ultrasonic waves and acoustoelasticity allows
measurement of surface and subsurface residual stresses. Surface and subsurface stresses can be
determined by using shear waves or longitudinal waves. Many attempts have been proposed for
this purpose. Recent studies are mostly focused on critically refracted longitudinal (LCR) wave
method (Clark and Moulder 1985; Don E. Bray 2001; Uzun and Bilge 2011). This technique
allows measurement of in-plane stresses. Surface stresses, as well as bulk stresses can be
determined by using ultrasonic longitudinal waves. Longitudinal waves polarize in the same
direction that it propagates. Anisotropy in the material caused by stress, affect the propagation

32
velocity of longitudinal waves. Stresses normal to the wave propagation direction can be
measured using the longitudinal waves. Furthermore, related to the development of computer
technologies, numerical modeling methods such as finite element method have an important role
on prediction of residual stress.
2.2.5. Post-Weld Heat Treatment of GTA-Welded Aluminum alloy AA6061
As discussed above, besides weld defects, residual stresses and microstructural changes
are the two other key factors for performance reduction as well as failure of welded heat treatable
aluminum alloy joints. During welding process, exposure to high temperature fusion followed by
non-linear rapid cooling near the fusion areas cause grain coarsening and post-weld residual
stress development in the heat- affected- zone (HAZ) and fusion zone of the weld joint (Leggatt
2008). Then again, multipass welding causes strain hardening during the cooling of subsequent
passes. The strain hardening also has a significant influence on the residual stress development in
the weld zone (Deng, Murakawa et al. 2008). The materials in the HAZ and fusion zone
effectively become softer and more susceptible to failure (Malin 1995). Although a number of
research studies have investigated the application of post-weld heat treatment (PWHT) to
different aluminum alloy welding joints using several welding processes (Akhter, Ivanchev et al.
2007; Bhanumurthy, Kumbhar et al. 2007; Elangovan and Balasubramanian 2008; Malarvizhi,
Raghukandan et al. 2008; Aydın, Bayram et al. 2010; Ahmad and Bakar 2011; Maisonnette,
Suery et al. 2011; El-Danaf and El-Rayes 2013; Peng, Shen et al. 2013; Damodaram, Ganesh
Sundara Raman et al. 2014; Ding, Wang et al. 2014; Sivaraj, Kanagarajan et al. 2014), but only a
few investigations showed the effect of PWHT on fusion welded AA6061 aluminum alloys
(Ahmad and Bakar 2011; Maisonnette, Suery et al. 2011; Dewan, Liang et al. 2013; Peng, Shen
et al. 2013). Uniformly distributed Mg2Si precipitates, smaller grain size, and higher dislocation

33
density have been shown to be the reasons of enhanced mechanical properties due to PWHT of
AA-6061 (Elangovan and Balasubramanian 2008). Heat treatment involves various heating and
cooling cycles to change microstructures in a material. The PWHT contributes to precipitation of
alloying elements, grain refinement, and higher dislocation density in welded AA6061 aluminum
alloys; and consequently enhanced mechanical properties that can be achieved (Ravindra and
Dwarakadasa 1992; Liu, Chen et al. 2006; Elangovan and Balasubramanian 2008). In the
literature, it is shown that the improvement in yield strength, tensile strength, and hardness of the
welded joints can be achieved by solution treatment followed by artificially aging (Metzger
1967; Periasamy, Sundararajan et al. 1995).
The thermal treatment for aluminum alloy AA6xxx series consists of three main processes:
solution heat treatment, quenching, and aging (Garrett, Lin et al. 2005). Solution treatment is
done by heating the welded samples above solution temperature followed by quenching. During
solution treatment, the precipitates (solute atoms) are dissolved into the solvent (Gao, Stiller et
al. 2002). Quenching after solution treatment causes the development of supersaturated solid
solution (SSS). During the artificial aging process solution treated quenched material is kept to a
specified temperature for an extended period of time, depending on the type of material being
used, and the types of precipitates existing within the materials. Ageing can be done artificially
by exposing the material to a high temperature, or naturally by letting the material sit before any
outside loads are applied to it. During the ageing process, precipitation of the supersaturated
solute atoms takes place around the grain boundaries. The atoms then form Guinier-Preston (GP)
zones which are connected with the solvent matrix. After a period of time and temperature rise,
the “β” phase forms, which are much larger than the GP zones. For the aluminum alloy AA6061,
the age- hardening process reaches maximum hardness just after the “β’’ phase forms. There is a

34
fine line between precipitation hardening and over-ageing the material. Exposing the material to
a temperature for longer than required aging time, can cause the precipitates to grow too large
and more widely dispersed within the material (Tan and Said 2009). This effect causes the
material eventually to lose its strength. Therefore, optimum aging temperature and time are
essentially required for PWHT process to obtain improved mechanical properties. Typical
pseudo-binary phase diagram for Al-Mg2Si is shown in Figure 2.6 (ASM-International 2002).
Figure 2.6: Pseudo-binary phase diagram for Al-Mg2Si (ASM-International 2002)
In many structural applications conventional and alloy steels are utilized for their higher
modulus, strength, and toughness properties. So, steels joints are also needed to be investigated
to complete the structural integrity analysis of welded structures. In the next two sections,

35
literatures on most commonly utilized fusion welded high strength alloy steel and low carbon
structural steel joints are reviewed.
2.3. Fusion Arc Welding of Alloy Steel
Among different alloy steel, AISI-4140 chromium-molybdenum alloy steel is widely
utilized in structural, automotive, petroleum, and gas industries due to its superior hardenability,
good corrosion resistance, and higher strength properties. Chromium-molybdenum steel pipe are
also considered as major construction material for next generation power plants. The wide
applications of alloy steel call for more efficient and reliable welding processes which has
always represented a great challenge for designers and technologists. Commonly utilized fusion
arc welding techniques are usually employed for joining AISI-4140 steels. Instead of weld
defects, unstable brittle fracture of welded alloy steel is an active global problem. A weldment,
especially the heat-affected-zone (HAZ), is a complex problem where variable microstructures
are formed from different thermal treatments and environmental conditions. This complexity
involves inherent mechanical behavior such as strength, ductility, hardness, and fracture
toughness. In addition, three-dimensional residual stress field can result in significant decrease of
fracture toughness values in the HAZ area (Mac Henry and Potter 1990; Venkata Ramana,
Madhusudhan Reddy et al. 2010). It is well known that the post-weld heat treatment (PWHT) of
welded structure strongly affects their microstructure and their mechanical properties (Olabi and
Hashmi 1995; Smith, Pistorius et al. 1997; Ahmad and Bakar 2011). Besides PWHT, a number
of other post-weld treatment operations such as grinding, shot peening, re-melting, and ultrasonic
peening are also utilized to remove post-weld tensile residual stresses and induce compressive
residual stresses in welded structures (Abdullah, Malaki et al. 2012).

36
2.3.1. Post-Weld Heat Treatment (PWHT) of AISI-4140 Steel Joint
Post-weld heat treatment (PWHT) is a common practice to relieve undesirable post-weld
tensile residual stresses and improve mechanical properties of welded low alloy and high
strength steel structures by grain refinement. PWHT can encompass many different potential
treatments. Depending on the heat treatment, the microstructure of alloy steel can be different.
Sometimes it becomes ferritic - pearlitic (Jahazi and Egbali 2000; Korda, Miyashita et al. 2007)
or tempered martensitic or even bainitic (Tau, Chan et al. 1996).
Figure 2.7: Schematic of typical pre-heating, welding, and post-weld heating process for
chromium-molybdenum alloy steel
The degree of PWHT embrittlement is dependent upon heating rate, holding time or duration of
treatment, applied stress, and grain size of the weld and HAZ microstructures (Zhang, Yang et al.
2013). The filler metal composition is also important on the degree of PWHT embrittlement.
After heat treatment, the properties of the deposited weld can be considerably different than the
“as-welded” properties. For chromium-molybdenum alloy steel, PWHT usually performed

37
around 675 °C to 700 °C temperature range to relieve post-weld residual stresses (Funderburk
1998). Particularly for AISI-4140, stress relieving can be performed by hardening at 500 °C to
550 °C or by annealing at 600 °C to 650 °C. In Figure 2.7, typical heating and cooling cycle for
chromium-molybdenum alloy steel joint is illustrated schematically.
Sometimes, PWHT is difficult to control and apply, as well as it is expensive and time-
consuming. For this reason the authors have explored different surface processing technique such
as, electrolytic-plasma-processing (EPP), a new and environmentally friendly technique.
2.3.2. Electrolytic- Plasma- Treatment of Welded Alloy steel
Electrolytic-plasma-processing (EPP) is an effective surface engineering technique that
combines cleaning and coating of metals (Kellogg 1950; Ryabkov 2003). EPP involves
electrolysis and electrical discharge phenomena (Meletis, Nie et al. 2002). During EPP-
treatment, Direct Current (DC) voltage is applied to the electrodes in the aqueous electrolyte,
which produces plasma at the surface of the submerged workpiece. In Figure 2.8, the schematic
of EPP technique is illustrated.
Figure 2.8: Schematic of electrolytic- plasma- processing (EPP)

38
During EPP, high temperature plasma is created within the small size hydrogen bubbles in the
thin electrolyte layer on the surface of the workpiece. This causes not only localized melting but
also shock waves from the collapsing of the bubbles and thus, strong surface forces on small
molten patches of steel (Meletis, Nie et al. 2002).
Thermal, chemical, electrical, and mechanical effects caused by EPP to the workpiece produce
unique surface features (Meletis, Nie et al. 2002; Gupta, Tenhundfeld et al. 2005). Until now,
EPP is fully developed for industrial applications in specific processes; and is being researched
for other possible commercial applications. EPP- treatment results in sub-micro-grained surface
structure and low martensite volume fraction at the top surface. This provides the benefits of
combination of high hardness and good corrosion resistance properties (Meletis, Nie et al. 2002;
Liang, Wang et al. 2011). It is reported that welded metals are poor corrosion resistant when
exposed to corrosive environment (Dadfar, Fathi et al. 2007). Therefore EPP might be an
important processing for post-weld treatment process to improve both corrosion resistant and
mechanical properties of welded structures. Only a few handfuls of studies are reported in the
open literature on the use of Plasma- Electrolytic- Oxidation (PEO) coating on welded structures,
corrosion, and stress corrosion cracking related studies (Prasad Rao, Janaki Ram et al. 2008;
Srinivasan, Blawert et al. 2008).
In previous sections, weld qualities are analyzed utilizing different destructive and non-
destructive testing techniques. Uniaxial tensile test is typically employed for mechanical
performance analysis of weld joints. But in many structural applications, fatigue test data
especially multiaxial fatigue performances of welded structures are important. In the last section
of this study, biaxial fatigue performance of welded steel is analyzed. Literatures related to
multiaxial fatigue behavior of welded steel are reviewed below.

39
2.4. Fatigue Test of Welded Steel
Fatigue, as understood by materials researchers, is a process in which damage
accumulates due to the repetitive application of loads that may be well below the yield point.
Stresses responsible for fatigue failure are usually below the accepted values for static loading.
Fatigue failure was first believed to be sudden and not having any apparent causes (Callister
2010). The first known fatigue testing machine was constructed by Albert in 1838 to determine
the fatigue life of conveyor chains. Likewise, fatigue life prediction started gaining importance in
order to prescribed maintenance scheduling for rotating equipment. Eventually, rotating-bending
machines for materials were designed by Wöhler (1960) to obtain more accurate and reliable
results (Schütz 1996). The S‐N curve was introduced to characterize fatigue behavior of a
material. A typical S-N is consists of three different zones as shown in Figure 2.9.
Figure 2.9: Typical fatigue test results in S-N curve

40
The endurance limit can be interpreted as the maximum stress that can be applied repeatedly
without causing failure of the test piece. Its value ranges from 40 to 60 percent of the tensile
strength for steel (Callister 2010). However, this value can be affected by different variables such
as materials, surface condition, loading condition, specimens size, etc. For steels, there is a knee
occures after 𝑁 = 106 cycles; but for non‐ferrous metals, such as aluminum, the horizontal
section does exist. The finite section of the S‐N diagram behaves as straight line. However,
slopes are different for low cycle (for 𝑁 < 103) and high cycle (for 10 3 ≤ 𝑁 ≤ 106). This
behavior is a consequence of the high stresses being applied for low cycle, where the yield
strength is reached and the failure occurs by deformation rather than by fatigue.
2.4.1. Multiaxial Fatigue Test
Uniaxial fatigue and rotating-bending fatigue studies are common analysis for welded
structures (Gurney 1979; Mac Henry and Potter 1990; Schütz 1996; Almaraz, Tapia et al.
2010). But many structural welded components are experience torsional loading along with
rotating bending loading (Bäckström and Marquis 2001; Carpinteri, Spagnoli et al. 2009). It is
important to know the combined effect of rotating-bending and torsional load on structural
components. Earliest works on multi‐axial loads can be attributed to L a n z a (Lanza 1886),
and the first systematic research on multi‐axial fatigue was performed by Gough and
Pollard (Gough and Pollard 1935; Gough, Council et al. 1951). They have produced the
bending‐torsion test data and has used later for producing Gough models. Moreover,
evaluating the damage mechanisms and crack nucleation, McDiarmid (McDiarmid 1994)
introduced damage models using the “Critical Plane” concept. The most currently used
theory in predicting fatigue failure for multi‐axial loads is critical plane strain‐based approach
(Fatemi and Shamsaei 2011).

41
Conventional rotating-bending fatigue testing machine consists of a motor coupled to a
chuck to hold the specimen on one end and bending weight is suspended from the other end. In
that design the load being applied is pure bending at constant load amplitude, but the bending
moment is not uniformly applied over the length of the specimen. This is considered to be
acceptable for notched or tapered specimens. A constant bending moment is required to
produce uniform stress over the test section of non-tapered specimens. If the specimen can be
supported from both ends, a uniform bending moment can be obtained along the specimen
length during rotating-bending fatigue test. R.R. Moore type rotating-bending fatigue machine
(Figure 2.10) was designed and built to apply fully reversed uniform bending load (ASM-
International 2002). In (Stefanov and Stoychev 2004), designed a rotating-bending machine
which permitted the application of constant torsion. The torsion was applied using a weight
system coupled to a clamping pulley which allows easy torque calculation; however, due to
design constraints the maximum torque applied was 0.3 times of that of the bending stress.
Figure 2.10: Schematic of R.R. Moore reversed-bending fatigue machine (ASM-International
2002)

42
2.4.2. Multiaxial Fatigue Test of Welded Steel
Some study reported on the effect of biaxial loading (e.g., bending and torsion) on
different welded structures (Yung, Lawrence et al. 1985; Sonsino 1995; Sonsino and Kueppers
2001; Takahashi, Takada et al. 2003; Pelton, Fino-Decker et al. 2013). In (Costa, Abreu et al.
2005), biaxial fatigue behavior of tubular Al-Mg-Si welded specimens was investigated. The
influence of stress ratio (R = Smin/Smax) and bending–torsion stress ratio were analyzed. They
concluded that the static torsion has only a slight detrimental influence on fatigue strength. In
(Kueppers and Sonsino 2006), a suitable calculation procedure based on a combination of local
normal and shear stresses in the critical plane for multiaxial loaded aluminum welds has been
developed. Wahab and Sakano studied the effect of corrosion and biaxial fatigue on simulated
heat-affected-zone metal (Wahab and Sakano 2003). From their study, it was concluded that
both secondary thrust (torsional load) and corrosion results in reduced fatigue life as compared
to pure bending fatigue life. The fatigue strength of welded specimens under multiaxial cyclic
loading is still unclear due to lack of data and complexity of weldment analyses (i.e.
microstructures, residual stresses, weld defects, etc.) involved in weld joints. The lack of
clarities in estimating the residual stresses and fatigue life under multiaxial loads has led to
conservative assumptions in the current fatigue design of welds.
2.5. Summary
An extensive critical literature review was conducted on four different welded structural
materials. Microstructural changes, weld defects, and residual stresses are the key factors for
the performance reduction of welded structures. From the innovation of welding techniques,
there are many research studies conducted to understand behavior of a weld joint. But weld
metallurgy is really complex and many questions are still un-answered. On the other hand,
43
innovation of new welding techniques as well as new materials requires more research study to
understand structural integrity of newly designed weld joints. Key summaries derived from the
above literature review are listed below.
To produce a high quality defect-free friction-stir-welding (FSW) joint, the welding
process parameters such as: rotational speed, welding speed, and axial plunge force or
displacement, and tool pin design must be chosen carefully. Since the beginning, FSW
investigators have researched the influence of parameters on microstructures and
mechanical properties with a view to optimize FSW processes. As discussed above,
there is no conclusive study reported to correlate all critical weld process parameters. A
parametric relationship establishing the boundary between defective and defect-free
weld schedules will be helpful for finding optimum weld schedules.
For FSW, development of an appropriate physical model which can predict the process's
main characteristics (weld defects and mechanical properties) is really complex. As
discussed above, researchers focused on creation of predictive models based on
numerical analysis or empirical models based on experimental observations. Adaptive
network-based fuzzy inference system (ANFIS) is a hybrid predictive model which uses
both of neural network and fuzzy logic to generate mapping relationship between inputs
and outputs. Although ANFIS is a powerful tool for prediction of manufacturing
processes but there is only one study on FSW has been presented (Babajanzade Roshan,
Behboodi Jooibari et al. 2013) and utilized this technique and had some limitations.
Development of an optimized ANFIS model to predict weld quality from weld process
parameters will be an important step for FSW research.
In addition, strength reduction of FS-welded high strength aluminum alloys due to

44
dissolution of precipitation elements is another important apprehension for design
engineers. Post-weld heat treatment (PWHT) is a common practice to improve
mechanical performances of welded aluminum alloys. But optimum PWHT condition is
required for each welded materials to obtain best performances. An extensive
experimental analysis on PWHT of FS-welded AA2219-T87 aluminum alloys will help
design engineers to design safer and more reliable structures.
Welding defects and post-weld residual stresses are the foremost problems for fusion
welded aluminum alloys joints. An important decision relating to its structural integrity
must be made regarding weld defects and their effects on the strength of welded
components. Only a limited number of studies have been reported in the open literatures
on the effects of weld defects on mechanical performances. However, no conclusive
study reported on weld defects and their effects on GTA- welded AA6xxx aluminum
alloy. A relation between non-destructively evaluated weld defects and tensile properties
can help in designing a welded structure efficiently and cost-effectively. Besides weld
defects, residual stresses and microstructural changes are the two other key factors for
performance reduction as well as failure of welded heat-treatable aluminum alloy joints.
Post-weld heat treatment (PWHT) is a common practice to reduce residual stresses and
improve mechanical performances of weld joints. But only a limited number of
investigations reported on the effects of PWHT on fusion welded AA6061-T651
aluminum alloys. More research is needed for better understanding of the influences of
weld defects and post-weld heat treatment (PWHT) on gas tungsten arc (GTA) welded
aluminum alloy AA6061-T651 joints.
In many structural applications, alloy steels are utilized for its high strength and high

45
stiffness properties. Unlike aluminum alloy joints, weld defects are not of prime concern
for welded steel joints. Residual stress development, microstructure changes, and
unstable brittle fracture are all unavoidable active problems for alloy steel joints. Post-
weld heat treatment (PWHT) is a common practice to relieve undesirable tensile
residual stresses and improve mechanical properties of welded alloy steel structures by
grain refinement. Sometimes, PWHT is difficult to control and apply according to the
recommendations, as well as it might be expensive and time-consuming. For this reason
the authors have explored different surface processing technique such as, Electro-
plasma- processing (EPP).
Most welded structures are subjected to multiaxial fatigue load in real service situations
and majority of the fatigue failures are initiated from weld joints. Therefore, it is
important to evaluate multiaxial fatigue behavior of commonly utilized welded
materials. Uniaxial fatigue and rotating-bending (RB) fatigue analysis is common for
welded structures. A handful studies reported on the effect of biaxial loading (e.g.
bending and torsion) on different welded structures. Thus more multiaxial fatigue study
is required for structural integrity analysis of different weld joints.

46
CHAPTER 3 : EXPERIMENTAL PROGRAM OF WELD JOINTS
3. Introduction
Structural integrity analysis and performance improvements of weld joints are one of the
important topics in welding area. Depending on applications, different types of materials as well
as different types of welding processes are utilized to fabricate welded structures. In this current
research, four different types of materials along with two different welding techniques are
utilized to understand the structural integrity of different weld joints. Two materials are chosen
from aluminum alloys which are commonly utilized for lightweight engineering structures.
Other two materials are chosen from steels which are widely utilized for heavy structures where
strength and stiffness are of prime concerns. Friction- stir- welding (FSW) which is a solid- state
welding technique has been utilized in joining aerospace grade aluminum alloy. For other
materials, commonly employed fusion arc welding technique (i.e. Gas Tungsten Arc Welding) is
utilized. Along with microscopic analysis, different non-destructive and destructive testing
techniques are utilized to ascertain structural integrity analysis of weld joints. Commonly utilized
non-destructive ultrasonic testing (UT) is employed in this study. In some cases, radiographic
and microscopic analysis is employed to verify UT data. Widely utilized uniaxial tensile testing,
rotating bending fatigue testing, and micro-hardness testing are employed to measure mechanical
performances of different weld joints. This chapter details the materials, welding procedures, and
experimental procedures utilized in this research.
3.1. Materials Selection
Each material has a defined and distinct set of characteristics that makes it the right or the
wrong kind of material for particular applications. Among different types of materials, steel and
aluminum are the two most popular engineering materials used in many structural applications.

47
Aluminum alloys are desirable due to lightweight and higher strength to weight ratio. But
aluminum alloys have some limitations in application where higher temperature resistance and
higher stiffness are required. In such cases, different types of steels are mostly utilized. In the
current research, widely used two different types of aluminum alloy (AA2219-T87 and AA6061-
T651) and two different types of steel (AISI-4140 and AISI-1018) are selected for structural
integrity analysis and performance improvement of weld joints.
3.1.1. Aluminum Alloys
Aluminum alloys find wide applications in aerospace, automobile industries, railway
vehicles, offshore structure topsides, and high speed ships such as catamarans, due to its light-
weight and higher strength to weight ratio. Widely available and applicable two different grades
of aluminum alloys (AA2219-T87 and AA6061-T651) are utilized in this current study. Two
different series aluminum alloys have different alloying element and different properties. Series
2xxx aluminum alloys are alloyed with copper and can be precipitation hardened to improve
strength which is comparable to steel; but 2xxx series aluminum alloys are susceptible to stress
corrosion cracking. Among different 2xxx series aluminum alloys, AA2219-T87 is widely
utilized in aerospace industry. Then again, 6xxx series aluminum alloys are alloyed with
magnesium and silicon. They are easy to machine, are weldable, and can be precipitation
hardened, but not to the high strengths that 2xxx can reach. Among different 6xxx series
aluminum alloys, AA6061-T651 is one of the most commonly used general-purpose aluminum
alloy.
Aluminum alloy AA2219-T87:
Aluminum alloy AA2219 is the mostly used material for the construction of space shuttle
and liquid cryogenic rocket fuel tanks. It has a unique combination of properties such as, its good

48
weldability, high strength to weight ratio, and superior cryogenic properties (Srinivasa Rao,
Sivadasan et al. 1996). Aluminum alloy AA2219-T87 is a high strength aluminum alloy with an
alloying element nominal composition 6% copper, 0.3% manganese, and 0.2% zirconium. The
T87 designation describes the treatment of aluminum alloy, indicates the material is solution-
heat treated, cold-worked by stretching, and then artificially aged. AA2219-T87 exhibits an
ultimate tensile strength of 440 MPa and yield strength of 350 MPa (ASM-International 1993).
The chemical composition and tensile strength of AA2219-T87 are listed in Table 3.1. In the
current investigation, 8.13 mm thick × 152 mm wide × 609 mm long AA2219-T87 aluminum
alloy plates are utilized for friction- stir- welding.
Table 3.1: Chemical composition and tensile strength of AA2219-T87 aluminum alloys (ASM-
International 1993)
Aluminum Alloy AA6061-T651:
Fusion welding of aluminum alloys is a great challenge for material researchers. Among
different aluminum alloys, medium strength heat-treatable AA6061 appears to have good
weldability and wider applications over high strength aluminum alloys. Mechanical properties
and chemical composition of AA6061-T651 are listed in Table 3.2. In the current investigation,
300 mm long × 76 mm wide × 6.35 mm thick AA6061-T651 aluminum alloy plates are utilized
for gas tungsten arc welding (GTAW). Selection of filler metal is a critical issue for fusion arc
welding. Two different types of filler rods usually utilized in GTAW of AA6061-T651. If 6xxx
series aluminum alloys are welded employing filler metal from 5xxx series, cracking can occur
Cu Fe Mg Mn Si Ti Zn V Zr Al YS,
MPa
UTS,
MPa
AA2219-
T87 5.8-6.8 <= 0.3
<=
0.02
0.2-
0.4 <= 0.2
0.02-
0.1
<=
0.1
0.05-
0.15 0.1-0.25
91.5-
93.8 350 440

49
in the partially melted zone (PMZ) as the weld zone solidifies rapidly. To avoid this cracking
problem these alloys are typically welded with 4xxx, which possess high fluidity and exhibit
lowest melting point. When 4xxx series fillers are employed, the weld zone does not respond to
post- weld aging, as sufficient magnesium is not present for the precipitation of Mg2Si, which is
the main strengthening phase. However, these welds may respond to “solution treatment and
aging (STA)”. In this investigation, ER-4043 filler metal was utilized. Chemical composition and
mechanical properties of ER-4043 filler metal are listed in Table 3.2.
Table 3.2: Chemical composition and tensile strength of base metal (AA6061-T651) and filler
rod (ER-4043) (ASM-International 1990)
In some structural applications, instead of aluminum alloys different types of steels are needed.
In the next section, composition and tensile properties of two different types of steels, which are
used in this study, are discussed.
3.1.2. Alloy Steels
Different grades of steels are required for different structural applications. In the current
investigation, one high strength alloy steel (AISI-4140) and one low carbon steel (AISI-1018) are
utilized. Among different alloy steels, AISI-4140 offers higher strength, good atmospheric
corrosion resistance, and reasonable strength up to around 315 ºC. Then again, AISI-1018 low
carbon steel offers good toughness and ductility. AISI 1018 also offers excellent weldability and
machinability compared to high strength alloy steel.
Cr Cu Fe Mg Mn Si Ti Zn Al YS,
MPa
UTS,
MPa
AA6061-
T651 0.04-0.35 0.15-0.40 <0.70 0.80-1.2 <0.15 0.40-0.80 <0.15 <0.25 95.8-98.6 305 334
ER-4043 -- <0.30 <0.80 <0.05 <0.05 4.50-4.60 <0.20 <0.10 92.3-95.5 124 186

50
Alloy steel AISI-4140:
AISI-4140 chromium-molybdenum alloy steel is widely used in structural, automotive,
petroleum, and gas industries due to its superior hardenability, good corrosion resistance, and
higher strength. The chromium content provides good hardness and the molybdenum content
ensures uniform hardness and high strength. Lower carbon (0.40%) and manganese (0.85 %)
offers better toughness values and can be heat-treated to improve mechanical properties. AISI-
4140 is difficult to weld, but welding can be performed using any of the common welding
practices. Welding of AISI-4140 chrome-molybdenum steel in the annealed condition is widely
preferred. When welding AISI-4140 steel (in any condition), only low hydrogen electrodes
should be used. In the current investigation, rolled plates of AISI-4140 annealed multipurpose
alloy steel with 300 mm × 76 mm × 6.35 mm dimensions are GTA- welded with SAE-4130
chromoly filler rod. Chemical composition and tensile strength of AISI-4140 alloy steel and
SAE-4130 filler rod are listed in Table 3.3.
Table 3.3: Chemical composition and tensile strength of base metal (AISI-4140) and filler rod
(SAE-4130) (ASM-International 1993)
wt.% C Cr Mn Mo P Si S Fe YS,
MPa
UTS,
MPa
AISI-4140 0.38-0.43 0.8-1.1 0.75-1.0 0.15-0.25 0.035 0.15-0.30 0.04 96.7-97.7 415 655
SAE-4130 0.28-0.33 0.8-1.1 0.4-0.6 0.15-0.25 0.035 0.15-0.35 0.04 97.3-98.2 460 560
Low carbon steel AISI-1018:
Among different engineering materials, AISI-1080 steel is commonly used structural
materials in different industrial applications for its easy weldable and surface hardenable quality
(G.M. Almaraz, M. Tapia et al. 2010). It is especially suitable for carburized parts requiring soft

51
core and high surface hardness, such as gears, pinions, worms, ratchets, etc. In this study, general
purpose cold drawn AISI-1018 low carbon steel rod with 19.05 mm diameter is welded utilizing
GTAW technique. Welding was done according to AWS welding codes for steel
(AWSD1.1/D1.1M 2010) utilizing ER70-S2 filler rod. Chemical composition and tensile
strength of AISI-1018 alloy steel and ER70-S2 filler rod is listed in Table 3.4.
Table 3.4: Chemical composition and tensile strength of base metal (AISI-1018) and filler rod
(ER70-S2) (ASM-International 1993)
C Si Mn P S Cu Ni Cr Mo Ti Zr YS,
MPa
UTS,
MPa
ER70
-S2 0.04 0.55 1.08 0.0003 0.005 0.2 0.08 0.08 0.08
0.
1 0.07 400 482
AISI-
1018 0.18 -- 0.68 ≤ 0.04 0.043 -- -- -- -- -- -- 415 485
3.2. Welding Procedures
Two different types of welding techniques were employed in this study. Solid-state
friction- stir- welding (FSW) technique was utilized for joining aerospace grade AA2219-T87
aluminum alloy. Widely utilized gas tungsten arc welding (GTAW) technique was employed for
joining AA6061-T651 aluminum alloy, AISI-4140 alloy steel, and AISI-1018 low carbon steel.
3.2.1. FSW Procedure of AA2219-T87
Solid state friction-stir-welding (FSW) technique requires specific equipment and tooling,
experimental setup, and experimental schedules. Details are discussed below.
3.2.1.1. Equipment and tooling
The NASA Michoud Assembly Facility (MAF) in New Orleans houses the National
Center for Advanced Manufacturing (NCAM) that has a state-of-the-art FSW facility. This

52
facility was utilized to conduct all welds reported in this study; specifically, models I-Stir PDS
and UWS #2 FSW machines were employed.
Figure 3.1: FSW fixed pin-tool (top), I-Stir PDS (left), and UWS #2 (right) FSW machines
(Courtesy NCAM) located at the Michoud Assembly Facility (MAF)-New Orleans
The tool utilized is a two-piece fixed pin-tool. The shoulder was made from H13 steel with 30.48
mm diameter and 0.76 mm deep counter clockwise (CCW) spiral scroll of 2.92 mm pitch. The
pin, which is interchangeable, is a 10° tapered cone of MP159 Nickel-Cobalt based multiphase
alloy, 10.16 mm average diameter at the shoulder and extending to a depth of 7.112 mm. The pin
was threaded with an 18 TPI UNC LH thread. Figure 3.1 illustrates the pin-tool utilized during
welding with PDS and UWS #2 FSW machines.

53
3.2.1.2. Experimental setup and procedure
The material welded is AA2219-T87 with each panel having dimensions of 609.6 mm
long, 152.4 mm wide, and 8.13 mm thick. Two panels were welded in a typical butt-joint
configuration. The fixture that was utilized for welding entailed a steel anvil. Steel bars (often
called “chill bars”) were placed on the Advancing Side (AS) and Retreating Side (RS) of the
panels and were used for clamping down the panels (Figure 3.2).
Figure 3.2: FSW process showing three critical weld process parameters (downward plunge force
Fz, spindle rotational speed N, and welding speed V)
Side compression screws were used on the RS. Before the panels were clamped down into the
fixture, the area that would come into contact with the pin-tool was lightly grinded to remove top
layer of material to ensure oxide particles would not be pulled into the weld. The panels were
wiped with an alcohol solution and were inserted into the fixture. During welding, a 0° lead
angle was used with no index-offset from the centerline. Both FSW machines are instrumented
with several sensors. During experiments, signals including forces, torque, rotational speed,

54
welding speed, and pin-tool positions were recorded with a 60 Hz sampling rate. Temperature
was collected with a Midi Logger GL820 acquisition system with a sampling rate of 200 ms
utilizing 20- “k”-type thermocouples.
3.2.1.3. Experimental schedules
With any welding process determination of acceptable ranges of process parameters that
can be used for a pin-tool, fixture condition, and material used must be determined. FSW
conditions can greatly change when any of these variables are altered. For this reason, at the
onset of the research, two welds were conducted with the chosen fixture, material, and pin-tool
type to illuminate appropriate process parameter windows. The two initial welds utilized the
position-control setting. Based on prior experience and trial and error technique, spindle
rotational and travel speeds were estimated and employed. Consequently, a range of appropriate
plunge force values were determined where the pin-tool can operate. FSW experiments were
thereby conducted in the rest of the work with the load-control setting allowing the three process
parameters (spindle rotational speed, welding speed, and plunge force) to be varied. Typically in
manufacturing and production, weld schedules for a particular welding environment have been
optimized and consequently deemed acceptable. As the outcome of these weld schedules are
known, load-control is utilized which provides precise control of the welding parameters and
achieves steady-state welding conditions throughout the weld; consequently, variation in welding
forces are minimized.
A large number of weld schedules is needed to obtain a surface plot of three weld process
parameters and identify anticipated weld quality. But each welding and experiment involves
additional cost. To minimize the number of required weld schedules and cost, two process
parameters (welding speed and spindle rotational speed) were grouped together and coined as

55
“dimensionless speed ratio (R)”. In this study, a total of 66 weld schedules with different
combinations of plunge force, welding speed, and spindle rotational speed were welded utilizing
FSW technique. The panels, 304 mm wide × 609 mm long, each comprised of two plates, 152
mm wide × 609 mm long, joined together by a weld along the panel center as illustrated in
Figure 3.3. To save material two schedules were employed on each panel. Parameters comprising
the weld schedules ranged: spindle rotational speed (𝑁), 200 rpm to 450 rpm; welding speed (𝑉),
76.2 mm/min to 266.7 mm/min; and plunge force (𝐹𝑧), 12.46 kN to 37.80 kN.
Figure 3.3: A plan view of FS-welded panel crown surface showing weld segments with
different schedules are marked. (AS-Advancing Side and RS-Retreating Side)
At the onset of the experimental program, the UWS #2 FSW machine was utilized due to
machine availability. Consequently, after the first-set of experiments were conducted, the new I-
Stir PDS FS welder was installed and utilized for the remaining welds. Upon transition to the
PDS welder, three tests were conducted to verify weld quality and condition was similar with
exact weld schedules run on the UWS #2 FSW machine. Results from the tests showed similar
weld qualities and tensile properties which verify switching between the two I-Stir FS- welders
does not have any noticeable effect on welding results.
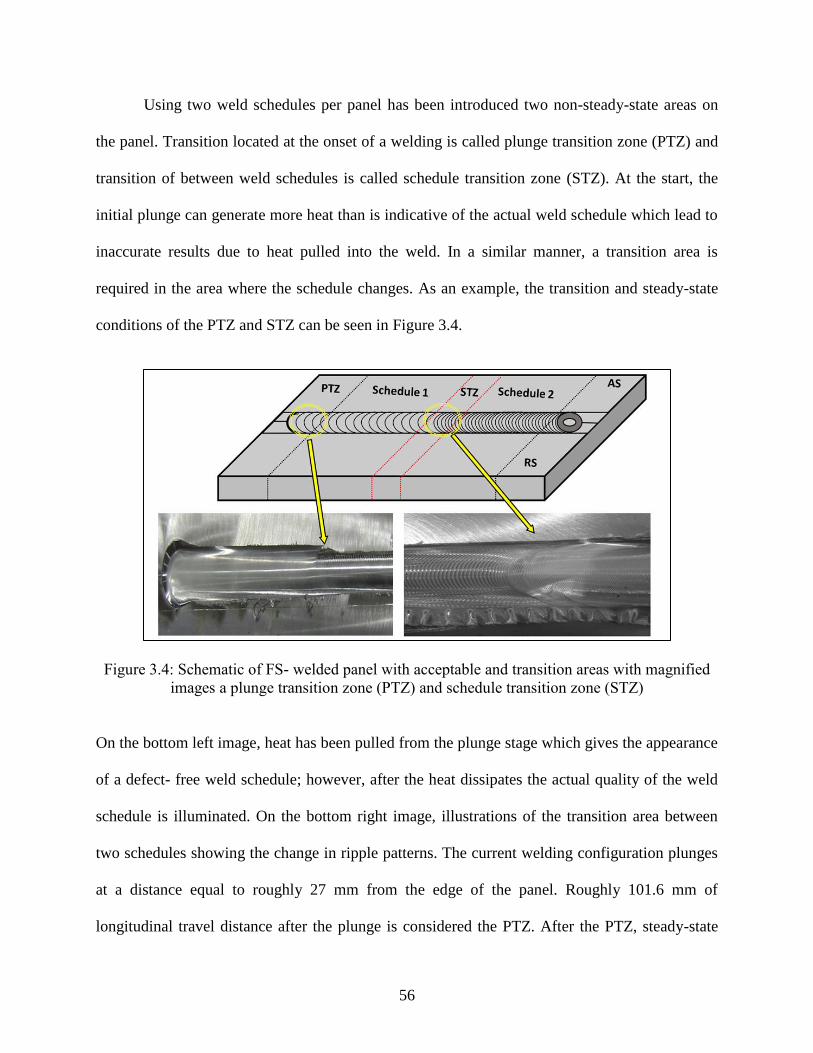
56
Using two weld schedules per panel has been introduced two non-steady-state areas on
the panel. Transition located at the onset of a welding is called plunge transition zone (PTZ) and
transition of between weld schedules is called schedule transition zone (STZ). At the start, the
initial plunge can generate more heat than is indicative of the actual weld schedule which lead to
inaccurate results due to heat pulled into the weld. In a similar manner, a transition area is
required in the area where the schedule changes. As an example, the transition and steady-state
conditions of the PTZ and STZ can be seen in Figure 3.4.
Figure 3.4: Schematic of FS- welded panel with acceptable and transition areas with magnified
images a plunge transition zone (PTZ) and schedule transition zone (STZ)
On the bottom left image, heat has been pulled from the plunge stage which gives the appearance
of a defect- free weld schedule; however, after the heat dissipates the actual quality of the weld
schedule is illuminated. On the bottom right image, illustrations of the transition area between
two schedules showing the change in ripple patterns. The current welding configuration plunges
at a distance equal to roughly 27 mm from the edge of the panel. Roughly 101.6 mm of
longitudinal travel distance after the plunge is considered the PTZ. After the PTZ, steady-state

57
conditions occur until the weld schedule changes at 304.8 mm (middle of panel). In a similar
fashion, schedule transition zone (STZ) occurs 101.6 mm after the second schedule begins
(transition area lengths will vary depending on the weld schedule). Lastly, the pin-tool is
extracted 27 mm before the end of the panel.
3.2.2. GTAW of AA6061-T651
Rolled plates of AA6061-T651 aluminum alloy with 300 mm × 76 mm × 6.35 mm
dimensions were GTA-welded utilizing ER- 4043 filler rod according to AWS structural welding
codes for aluminum (AWSD1.2/D1.2M: 2008). The direction of welding was normal to the
rolling direction and all necessary care was taken to avoid joint distortion while clamping the
plates at suitable positions. Multipass (3 passes: 1st- root pass, 2nd- filler pass, and 3rd -surface
pass) welding was used to fabricate the butt-joints. An inert shielding gas mixture of
Argon/Helium (50/50) was used as this mixture helps in the constriction of the arc and
concentrates the heat within a restricted weld nugget area, thereby reducing the size of the heat-
affected -zone (HAZ) (Howse and Lucas 2000). The welding speeds were calculated manually
from the time required to weld a particular length and maintained in the range of 60 - 70
mm/min. Welding specifications are listed in Table 3.5.
Table 3.5: GTAW specifications for AA6061-T651 Aluminum alloy
Base metal Filler Metal Welding type Shielding
gas
Welding
current Electrode Groove type
AA-6061-T651
plate (6.35mm
thick)
ER-4043
(1.6 mm dia.)
TIG
(Manual)
Argon/Helium
(50/50)
(25-30 CFH)
DCSP
(120-140
amps)
Tungsten
(2.38
mm dia.)
Single V-
offset (30°
bevel angle)
Welding was followed by natural air cooling at room temperature (25 °C) and grinding
afterwards. The dogbone tensile test specimens were cut from welded plates according to ASTM

58
standard (ASTM-International 2011). Figure 3.5 shows the schematic diagram of weld groove,
welded plate, and the configuration of the dogbone specimen.
Figure 3.5: Welding configuration, welded plate, and tensile specimens (all dimensions in mm)
3.2.3. GTAW of AISI-4140 Alloy Steel
Rolled plates of AISI-4140 annealed multipurpose alloy steel with 300 mm × 76 mm ×
6.35 mm dimensions were GTA- welded with SAE-4130 chromoly filler rod according to AWS
welding codes for steels (AWSD1.1/D1.1M 2010). The direction of welding for the specimens
tested were normal (transverse) to the rolling direction; and all necessary care was taken to avoid
joint distortion by clamping the plates at suitable positions. Multipass welding was used to
fabricate the butt joints. The welding specifications are listed in Table 3.6.
Table 3.7: GTAW specifications for AISI-4140 alloy steel
Base metal Filler Metal Welding type Shielding gas Welding
current Electrode Groove type
AISI4140 alloy
Steel plate
(6.35mm thick)
SAE4130
(3.2mm dia.) TIG (Manual)
Pure
argon
(10-18 CFH)
DCSP
(240-350
amps)
2% Thoriated
(3.2 mm dia.)
Single V-
offset (30°
bevel angle)

59
Welding was followed by natural air cooling at room temperature. After welding, the panels
were grinded utilizing manual hand grinder to remove weld reinforcement. Figure 3.6 shows the
schematic diagram of welding groove and welded plate after grinding.
Figure 3.6: Welding configuration and welded plate after grinding (all dimensions in mm)
3.2.4. GTAW of AISI-1018 Steel
In this program, low carbon steel rod was welded utilizing GTAW technique. Before
welding, a 254 mm long rod was cut into half and 33o bevel groove was machined on both pieces
as shown in Figure 3.7. For alignment during welding process, the specimens were placed in
horizontal position using a three jaw chuck and rotated at 5 rpm while multi-pass welding
(Figure 3.7) was completed. The welding specifications are listed in

60
Table 3.8. Welding was followed by natural air cooling at room temperature. Once
welding is done, specimens were machined according to ASTM E466-07 standard (ASTM-
International 2007) to obtain dog-bone specimens.
Figure 3.7: Welding configuration and sample preparation
Table 3.8: GTAW specifications for AISI-1018 low carbon steel
Base
Metal
Filler
Metal Welding Type Shielding Gas Current Groove Type
AISI-1018 ER70-S2
(2.38 mm dia)
GTAW
(Manual)
100 % Argon
(3.5 CFM)
DCEN (100-
120 amps)
V (33° bevel
angle)
3.3. Experimental Procedures
Two different non-destructive testing procedures, uniaxial tensile testing, and
microscopic analyses were employed throughout the project to analyze weld quality of different
weld joints. Along with quality analysis, different post-weld treatment techniques (post-weld

61
heat treatment and electrolytic-plasma-processing) are also employed to improve performances
of different weld joints. Details of the experimental techniques are discussed below.
3.3.1. Non-Destructive Evaluation (NDE)
A variety of NDE techniques are available depending on the applications; each with its
own advantages and disadvantages. Among the number of NDE techniques, radiography and
ultrasonic testing are most widely utilized for the inspection of weld defects. In this study, state-
of-the-art phased array ultrasonic testing (PAUT) technique was utilized to find defects in both
friction- stir and fusion arc weld joints. Consequently, a comparison to X-ray radiography is also
included for friction- stir- welded aluminum alloy joints.
3.3.1.1. Phased array ultrasonic testing (PAUT)
After welding each welded panels were non-destructively inspected utilizing phased array
ultrasonic testing (PAUT). Using PAUT one can find the A, B, C, and S scan views to find size,
shape, and location of defects. If there is a defect present in the scanned samples, it can be
visualized with 6-dB color change (Olympus-NDT 2007; ASTM-E2491 2008; Dewan, Liang et
al. 2014). Specifically, the A-scan represents waveforms which are the reflections from one
sound beam position in a test piece. The B-scan is an image showing a cross-sectional profile
through one vertical slice of the test piece, showing the depth of reflectors with respect to their
linear position. The C-scan is a two dimensional presentation of data displayed as a top or planar
view of a test piece. Lastly, the S-scan or sectorial scan represents a two-dimensional cross-
sectional view derived from a series of A-scans that are plotted with respect to time delay and
refracted angles. The horizontal axis corresponds to location of the defect from probe position,
and the vertical axis to depth of the test piece. The S-scan is perhaps the most useful asset to
current PAUT post-weld evaluation due to the ability to steer the sound waves in a range of

62
angles which allows for easy visualization of a specimen (Crowther 2004). The actual size,
shape, and location of the defect can be detected utilizing C and S scan views. In the current
research program, Olympus “Omniscan MX2.0” non-destructive phased array ultrasonic testing
(PAUT) unit was utilized (Figure 3.8). Angle beam wedge (30° - 70°) with 5 MHz and 10 MHz
frequencies, 16 and 32 elements linear phased array ultrasonic probe was used for the PAUT
inspection. Before inspections, the PAUT probes and wedges were calibrated with standard
calibration blocks made of the same material to be inspected. PAUT calibration included
velocity, wedge delay, sensitivity, and sizing calibration.
Figure 3.8: Phased array ultrasonic testing unit showing A, S, and C- scan views

63
3.3.1.2. Defect sizing capability of PAUT
Before inspection, PAUT unit was calibrated according to pressure vessel and piping
welding code (International 2013). Figure 3.9 shows ASTM E2491 calibration block along with
S-scan view showing side drill holes (SDH).
Figure 3.9: Determination of phased array probe resolution with ASTM E2491 phased array
calibration block (resolution determines flaw definition and sizing accuracy)
For defect sizing in PAUT, two important parameters need to be considered: (i) gain and
(ii) index offset. In this study, defects were measured with (-2 dB), (-3 dB), and (-6 dB) color
drop techniques and was compared with actual defect sizes. Higher gain value results in higher
A-scan amplitude; and higher A-scan amplitude leads to oversize estimation. It is also observed
that the higher color drop (-6 dB) technique implies larger defect sizing compared to smaller
color drop (-2 dB) techniques (Figure 3.10). Hence, during post-weld inspection the defect size is
dependent on the peak A-scan amplitude and color drop technique. The index offset is the

64
distance of the tip of the wedge from the weld-centerline. For constant A-scan amplitude, a
higher index offset results in higher defect size estimation (Figure 3.11).
Figure 3.10: Effect of A-scan amplitude and color drop (dB) on defect size estimation
Figure 3.11: Effect of index offset and color drop (dB) on defect size estimation (fixed gain
value)

65
Another important calibration parameter is “Time-Corrected-Gain (TCG)”. If the TCG
calibration is not performed, the A-scan amplitude will decrease with the increase of index
offset, which results error in defect size estimation. After TCG calibration, A-scan peak
amplitude remains constant with the variation of index offset (Figure 3.12).
Figure 3.12: Variations of A-scan amplitude with index offset to illustrate the effect of “Time-
Corrected- Gain (TCG)” calibration
To find the detectability and defect- sizing capability of PAUT, varying sizes (0.79 mm,
1.58 mm, 1.98 mm, 2.38 mm, and 2.78 mm, 4.76 mm, and 6.35 mm diameters) of seven holes
were prepared on an AA2xxx plate and scanned with a calibrated PAUT unit. Figure 3.13 shows
the C-scan view of the plate with varying-hole sizes. The PAUT unit can precisely detect the
sizes and locations of the holes. To identify the defect sizing precision and accuracy of PAUT,
different size side-drilled-holes (SDH) were bored into an Aluminum Alloy 2xxx block at
varying depths and were measured. The variation in measurement is shown in Table 3.9.

66
Figure 3.13: Aluminum alloy plate with seven varying-hole sizes with associated C-scan view
and echo-dynamic A-Scan view (encoded and XY-scanning A-scan data are combined)
Table 3.9: Comparison of defect sizing utilizing PAUT technique
Thick
-ness
(mm)
Actual
Dia.
(mm)
Meas.
Dia.
(mm)
Δ
Dia.
(mm)
Actual
Depth
(mm)
Meas.
Depth
(mm)
Δ
Depth
(mm)
Actual
Dist.
(mm)
Meas.
Dist.
(mm)
Δ
Dist.
(mm)
25.5 2.8 3.1 0.3 8.1 8.25 0.15 16.1 16.6 0.5
25.5 2.8 3 0.2 14.1 14.2 0.1 10.8 11.4 0.6
25.5 1.6 2.2 0.6 11.8 11.9 0.1 17.9 18.3 0.4
25.5 3.5 3.6 0.1 12.5 11.9 -0.6 18.5 19.0 0.5
8.35 1.6 1.5 0.1 4.2 3.9 -0.3 4.1 3.6 -0.5
8.35 2.4 2.0 -0.4 4.2 3.8 -0.4 3.6 3.0 -0.6
8.35 2.8 2.8 0 4.5 4.2 -0.3 12.5 12.4 -0.1
Absolute error in height, depth, and location sizing was 0.24 ± 0.20 mm, 0.28 ± 0.18 mm, and
0.46 ± 0.17 mm, respectively. It is generally accepted that the tolerance for PAUT is 0.5-1.0 mm
depending on how stringent the application requirement [13]. It was observed that there is
overestimation for thicker plates and underestimation for thinner plates. This exemplifies one of

67
the characteristics of waves propagating through a material. For a defect at larger thicknesses, the
sound waves travel a larger distance which causes the wave to expand. This results in the
elongation of the defect image; alternatively, for defects at smaller depths, the wave has not
reached its focal length and thereby underestimates the defect. In other words the defect image
depends on the near and far fields focusing distances of the wave. These results indicate that
PAUT has the ability to accurately detect defect sizes and locations.
3.3.1.3. Radiographic testing (RT)
One of the widely used NDT methods for volumetric examination is radiography. In the
current study FS-welded plates were analyzed employing digital X-ray radiography and
compared with PAUT results.
Figure 3.14: Schematic of basic set-up for film radiography (GE-IT 2007; ASME-International
2013)

68
In radiography, X-rays or gamma-rays are used to produce a radiographic image obtaining
differences in thickness, defects (internal and surface), and changes in structure. The procedure
for producing a radiograph is to have a source of penetrating (ionizing) radiation (X-rays or
gamma-rays) on one side of a specimen to be examined and a detector of the radiation
(radiographic film) on the other side, as shown in Figure 3.14. One important challenge of
radiographic analysis is the data interpretation and defect classification. For this reason, X-ray
images that are acquired are compared with standard radiographic images (GE-IT 2007; ASME-
International 2013).
3.4. Ultrasonic Testing to obtain Residual Stresses
Post-weld residual stresses of fusion arc welded aluminum alloy and AISI-4140 alloy
steel joints were calculated utilizing nondestructive ultrasonic testing (UT). Ultrasonic
longitudinal waves are propagated through the thickness of the material and wave transit time is
measured. The sound velocity can be calculated by knowing the thickness and the measured
time. As a result of these measurements average residual stress through the thickness of the
material can be measured (Dewan 2012; Javadi, Akhlaghi et al. 2013). During the welding
process, microstructure of the material changes and this causes the variations of wave velocities.
Effect of stress on wave propagation was investigated by Hughes and Kelly in their study
entitled “Second-Order Elastic Deformation of Solids”, in 1953. The expression relating to the
velocity of a wave propagating in the longitudinal direction to an internal stressed field can be
written as equation (3.1). If the measurement is made in a single propagation direction, the above
equation can be simplified and expressed as equation (3.2). For the majority of materials studied
𝐾1 ≫ 𝐾2 (Thompson, Lu et al. 1996), so the equation (3.2) can be reduced as equation (3.3).
(𝑣 − 𝑣0 ) 𝑣0⁄ = 𝐾1𝜎1 + 𝐾2( 𝜎2 + 𝜎3) (3.1)

69
(𝑣 − 𝑣0 ) 𝑣0⁄ = 𝐾1𝜎1 + 𝐾2 𝜎2 (3.2)
𝜎1 = (𝑣 − 𝑣0 ) (𝐾1 × 𝑣0)⁄ (3.3)
Here, 𝑣0, 𝑣 are sound speeds in an unstressed and stressed medium, respectively. 𝜎1,𝜎2, and 𝜎3
are principal stresses, and 𝐾1, 𝐾2 are the acoustoelastic constants. The acoustoelastic constant 𝐾1
relates to the ultrasonic velocity to the stress, and can be obtained experimentally (Javadi,
Akhlaghi et al. 2013). This constant is calculated by observing wave velocity variations due to
applied stress. From the slope of the wave velocity change vs. stress, acoustoelastic constant is
determined. In this study, I have used acoustoelastic constant 𝐾1 = 5.05 × 10⁻⁶(𝑀𝑃𝑎)−1 for
AA6061-T651 and 𝐾1 = −2.36 × 10⁻⁵(𝑀𝑃𝑎)−1 for AISI-4140 alloy steel. This acoustoelastic
constant is applicable in the elastic range of the material.
After nondestructive testing and residual stress measurement, different destructive mechanical
test performed to understand structural integrity of different weld joints.
3.5. Uniaxial Tensile Test
Uniaxial tensile test specimens were prepared and tested according to ASTM E8/8M-11
standard (ASTM-International 2011) to determine transverse tensile properties and weld quality.
Tensile properties were determined at room temperature using a displacement rate of 1.0
mm/min in an MTS-810 universal testing machine. The tensile strain was measured using a
25.4mm (1″) gage length extensometer which was attached to the middle of the specimen near
the weld zone (Figure 3.15). The yield strength was obtained employing the 0.2% offset yield
strength method. Tensile toughness value was calculated from the area under the tensile stress-
strain curve.

70
Figure 3.15: MTS-810 uniaxial tensile test set-up including control unit, hydraulic unit, and grip
system
3.6. Rotating-Bending-Torsional (RBT) Fatigue Testing
Many structural welded components has experienced torsional loading along with
rotating-bending loading (Bäckström and Marquis 2001; Carpinteri, Spagnoli et al. 2009). It is
important to know the combined effect of rotating-bending and torsional load on structural
components. Stefanov and Stoychev (2004) designed a rotating-bending (RB) machine which
permitted the application of constant torsion (Stefanov and Stoychev 2004). The torsion was
applied using a weight system coupled to a clamping pulley which allows easy torque
calculation; however, due to design constraints the maximum torque applied was 0.3 times of
that of the bending stress.
In the current study, a four‐point bending test configuration was adopted to provide
constant bending and stress moment along the specimen surface (Figure 3.16). A pinned‐roller
arrangement was used to support the apparatus that simplified the stress and deflection
calculations. A sliding mechanism incorporated into the design to compensate different size

71
specimens and ease to hold the specimens for the testing purposes. A spider coupling is used in
between the motor and the rotating shaft to transmit smoother power with lower vibration and
also compensates parallel and angular displacements. Parallel and angular shaft alignments were
performed to avoid unwanted loads and vibrations that might affect experimental results. To
eliminate the difference in applied and actual bending moment, bending load was applied along
the neutral axis of the test specimen.
Figure 3.16: Schematic of a rotating bending fatigue testing unit including four points bending
load configuration
Bending moment (𝑀) and bending stress (𝜎𝑏)were calculated using following equations.
𝑀 = 𝑤𝐿
2 (3.4)
𝜎𝑏 =16𝑤𝐿
𝜋𝑑3(3.5)

72
Where, 𝑤 is bending load, 𝐿 is the length from pivot point of the both platforms to the load
application point, and 𝑑 is the diameter of the specimen at critical (gage length) section.
Figure 3.17: Photograph of rotating-bending fatigue testing unit with braking mechanism for the
application of torque
The torsional load was applied using a newly designed braking mechanism (Figure 3.17).
The resulting braking force was high enough to stop the rotating shaft. A force sensor was
inserted in between braking pad and disk to measure applied braking load. Resulted braking
force(𝐹𝐵), normal to the braking disk is calculated by multiplying braking load (𝑃𝐵) and friction
coefficient (𝜇). Then the braking torque (𝑇) is determined by multiplying braking force by the
disk radius (𝑅𝑑𝑖𝑠𝑐) as follow:
𝑇 = 𝑅𝑑𝑖𝑠𝑐 × 𝐹𝐵 = 𝑅𝑑𝑖𝑠𝑐 × ( 𝜇 × 𝑃𝐵) (3.6)
Now the resulting shear stress from the torque:
𝜏𝑇 =16𝑇
𝜋𝑑3 (3.7)

73
The maximum torque that can be applied to the system is limited by the maximum torque
provided by the motor and the rotational speed.
3.7. Micro-Hardness Analysis
For better understanding the effect of welding on metallurgical and microstructural
changes during welding process, the hardness values across the weld surface were measured
using Rockwell hardness tester (Type: FUTURE-TECH Rockwell type hardness tester, Model:
Digital FR-3e). For a weld joint, hardness values are usually sensitive to welding condition,
welding process, heat input, preheat or inter-pass temperature, electrode compositions, and plate
thickness. Before hardness testing, the welded specimens were grounded and polished according
to ASTM standard (ASTM E18-14). For aluminum alloys (FS- welded AA2219-T87 and GTA-
welded AA6061-T651), 1.58 mm (1/16 inch) diameter steel ball indenter was utilized. For steels
(GTA- welded AISI-4140 and AISI-1018), diamond cone indenter was utilized. Before using
micro-hardness tester, it was calibrated utilizing appropriate calibration block. Hardness values
were taken to correlate with tensile and fatigue strength of the welded specimens.
After all mechanical tests are completed, microscopic analysis was performed to understand
fracture behavior and to correlate with mechanical test data.
3.8. Microscopic Analysis
To understand the effect of welding on microstructural variations, welded specimens
were sectioned and mirror polished utilizing diamond suspensions (6µm to 0.25µm) following
ASTM E3-11 standard (ASTM-International 2011). Polished specimens were then chemically
etched according to ASTM E407-07 standard (ASTM-International 2007) to reveal the
constituents and microstructures. Different metal and alloys required different types of etchant.

74
In the current study, Keller reagent was utilized for Aluminum alloys (AA2219-T87 and
AA6061-T651) and 2% Nital solution was utilized steels (AISI-4140 and AISI-1018). Keller
reagent is composed of 1.0 mL HF, 1.5 mL HCL, 2.5 mL HNO3, and 95 mL H2O. On the other
hand, Nital (2%) solutions comprise of 2 mL HNO3, and 98 mL ethyl alcohol. Chemically
etched specimens were then inspected under metallographic digital light optical microscope
(OM) and scanning electron microscope (SEM) to obtain micrographs. Fracture surfaces of the
tensile tested specimens were analyzed with a Quanta 3D FEG scanning electron microscope
(SEM) to understand microstructural and fracture behavior of weld joints.
3.8. Summary
During welding process, the non-linear heating from the welding results in microstructure
changes as well as development of residual stresses in weld joints. Moreover, weld joints may
contain weld defects which are detrimental to weld quality. Above mentioned destructive and
non-destructive testing techniques were employed throughout this study to access structural
integrity of different weld joints. The experimental data were collected utilizing the above
mentioned experimental techniques; which are aimed for safe and efficient design of welded
structures. Results obtained from the experimental investigations are discussed in the next six
Chapters.

75
CHAPTER 4 : FRICTION- STIR -WELDING DEFECTS LINKED TO
WELDING PROCESS PARAMETERS
4. Introduction
Friction-stir-welding (FSW) is comparatively a new solid-state joining process invented
by The Welding Institute (TWI) in 1991 (Thomas, Nicholas et al. 1991). Since the development
of FSW process, welding community is utilizing this technique for joining high strength
aluminum alloys for special applications (i.e. aerospace, space shuttle, high speed naval vehicles,
and automotive) and researchers are looking for its potential applications in other materials.
Friction-stir-welding (FSW) technique involves many critical process variables that affect the
quality of the weld; consequently, it is difficult to accurately predict the most favorable process
parameters to acquire high quality defect-free welds. Weld-defects generally occur during the
welding process and not due to the application of service loading. In this chapter, an analysis of
FSW process parameters, weld defects, and weld quality of friction-stir butt-weld of AA2219-
T87 aluminum alloys are explored. The effects of three critical weld process parameters
including spindle rotational speed (𝑁), welding speed (𝑉), and plunge force (𝐹𝑧) are
investigated. All other features including pin-tool geometry and clamping conditions are held
constant. Spindle rotational speed is defined as tool revolution per minute (rpm); welding speed
is defined as tool travel speed along the weld seam (mm/min); and plunge force is defined as the
downward vertical downward force applied on work piece (kilo newton). For a particular pin-
tool, these three process parameters are primarily responsible for the amount of frictional heat
generation during the welding process. The effect of the various weld schedules (i.e. combination
of the variations in these three critical process parameters) on weld defects formation, uniaxial
transverse tensile strength, toughness, and fracture configuration (i.e. fracture initiation side and

76
fracture surface morphology) are determined. In the current investigation, a FSW process
parameter window and empirical correlation is also established for effective joining of AA2219-
T87.
4.1. Scope
The quality of a FSW joint depend on several factors including tool design, welding
parameters (i.e. machine), clamp design, and materials need to be welded. Causes and effects
diagram of FSW is shown in Figure 4.1. For a particular welding condition, the geometry of the
pin-tool and weld process parameters play important roles in dictating the path that the material
takes. To produce a high quality defect-free weld, the welding process parameters such as:
spindle rotational speed, welding speed, and axial plunge force or displacement, and pin-tool
design must be chosen carefully (Jata and Semiatin 2000; Peel, Steuwer et al. 2003; Colligan
2007; Schneider, Nunes Jr. et al. 2010; Rajakumar, Muralidharan et al. 2011). Some researchers
studied the effect of different shape of pin-tool and found that tapered threaded pin-tool can
produce better quality weld (Boz and Kurt 2004; Zhao, Lin et al. 2005; Elangovan and
Balasubramanian 2007; Schneider, Nunes Jr. et al. 2010). In this current investigation, the most
commonly utilized threaded standard pin-tool was utilized and analyzed the effect of critical
weld process parameters. Since the beginning of FSW technique origination, investigators have
researched the influence of parameters on microstructures and mechanical properties (Rhodes,
Mahoney et al. 1997; Flores, Kennedy et al. 1998; Li, Murr et al. 1999; Abbasi Gharacheh,
Kokabi et al. 2006; Khodir, Shibayanagi et al. 2006; Elangovan and Balasubramanian 2007;
Record, Covington et al. 2007; Scialpi, De Filippis et al. 2007; Balasubramanian 2008;
Cavaliere, Squillace et al. 2008; Colligan and Mishra 2008; Kulekci, Şik et al. 2008;
Lakshminarayanan and Balasubramanian 2008; Babu, Elangovan et al. 2009; Commin, Dumont

77
et al. 2009; Moreira, Santos et al. 2009; Rajakumar, Muralidharan et al. 2011; Querin and
Schneider 2012; Rajakumar and Balasubramanian 2012; Shashi Prakash 2014) with a view to
optimize FSW processes. In particular, studies of FSW applications to high strength aluminum
alloy AA2219-T87 of aerospace interest and the subject of this present study are often found in
the literature (Elangovan and Balasubramanian 2007; Babu, Elangovan et al. 2009; Davis 2010;
Schneider, Nunes Jr. et al. 2010; Lakshminarayanan, Malarvizhi et al. 2011). To date, only a
“trial and error” method has been used to establish process parameters for each tool design and
setup. For a particular material and welding condition FSW process, parameter ranges are
typically established by welding over a range of spindle rotational speeds (𝑁) and welding
speeds (𝑉) in displacement control or load control modes and selecting parameter windows to
obtain the required weld strength or other desired property. Reference (Lakshminarayanan,
Malarvizhi et al. 2011) presents an example of such a parameter window determination for an
application of AA2219. Effects of plunge force on weld quality are not considered in that study.
Figure 4.1: Line diagram showing factors that affect the quality of a FSW joint

78
Some simplified theoretical similarity indices (i.e. combinations of critical process
parameters) have been suggested to assist in the FSW process. An ideal similarity index
determines how parameters can be varied together to obtain a similar quality welds. But in
reality, the similar quality weld is rarely achieved. An empirical Pseudo Heat Index (PHI) has
been proposed by Kandukuri and his research group (Kandukuri, Arbegast et al. 2007) to
correlate the heat input during FSW with spindle rotational speed and welding speed; if heat
input determines weld properties, similar welds are obtained by holding the index constant. The
PHI does not include many process features affecting weld properties and is only good for a
certain range of weld speed and spindle speed for a specified welding situation. Nunes (Nunes Jr.
2010) has proposed a temperature index based on a physical model of the FSW process in which
temperature is computed from a balance between estimated mechanical heat input and estimated
heat losses. In that model, shear stress is assumed to be linearly related to temperature. Another
research group (Querin and Schneider 2012) has proposed an Alternative Heat Indexing (AHI)
equation considering heat generation terms and thermal dissipation. A linear approximation was
used to capture thermal softening with temperature and eliminate flow stress term. But in reality,
flow stress might not be linearly related with temperature. Dehghani and other researchers
(Dehghani, Amadeh et al. 2013) suggested a Heat Input Factor (HIF) to determine weld quality.
In their model, plunge force is assumed to be constant and welding speed having a linear relation
with welding heat generation. None of these indices include plunge force, yet plunge force may
make the difference between presence or absence of a defect (Kandukuri, Arbegast et al. 2007;
Querin and Schneider 2012; Dehghani, Amadeh et al. 2013).
A more powerful theoretical aid would be a defect formation criterion, a parametric
relationship establishing the boundary between welds with a particular defect and welds without
79
a defect. There are as many defect criteria as there are defect types. All the defect criteria
superposed together to establish a defect-free window (if such a defect-free window exists) in
parameter space, in other words the operational window for the process. Currently, there are no
theoretical defect criteria available to determine the operational window. The computations to
obtain them are generally complex. The current study constitutes a preliminary exploration to see
the extent an empirical defect criterion may be established for a particular FSW situation and to
obtain information about defect formation mechanisms that may be applicable to a more general
understanding of what determines the operational parameter window for FSW in general. The
situation investigated is a friction-stir butt-weld of AA2219-T87. Three weld parameters are
varied: spindle rotational speed (𝑁), welding speed (𝑉), and plunge force (𝐹𝑧). Pin-tool design
and clamping condition are other important factors for FSW. But within the limit of this
research, all other features including pin-tool geometry are held constant. The effect of the
various weld schedules on uniaxial tensile strength, toughness, and fracture configurations of the
tensile specimens are determined.
From the next section, results obtained from various experimental investigations are discussed.
Initial analysis started with microstructure analysis of FSW joints followed by weld defect
classifications, tensile test results, and fracture surface analysis. At the end of this section, an
empirical correction will be established to predict weld quality utilizing weld process parameters.
4.2. Microstructure of FSW Joints
Microscopic analysis is important to understand weld quality of a FSW joint. Unlike
conventional welding process, two sides of the FS-welded plates are different. Tool rotation
identical as traversing direction is commonly known as the ‘advancing side (AS)’ and tool
rotation opposes the traversing direction is known as the ‘retreating side (RS)’ (Threadgill,
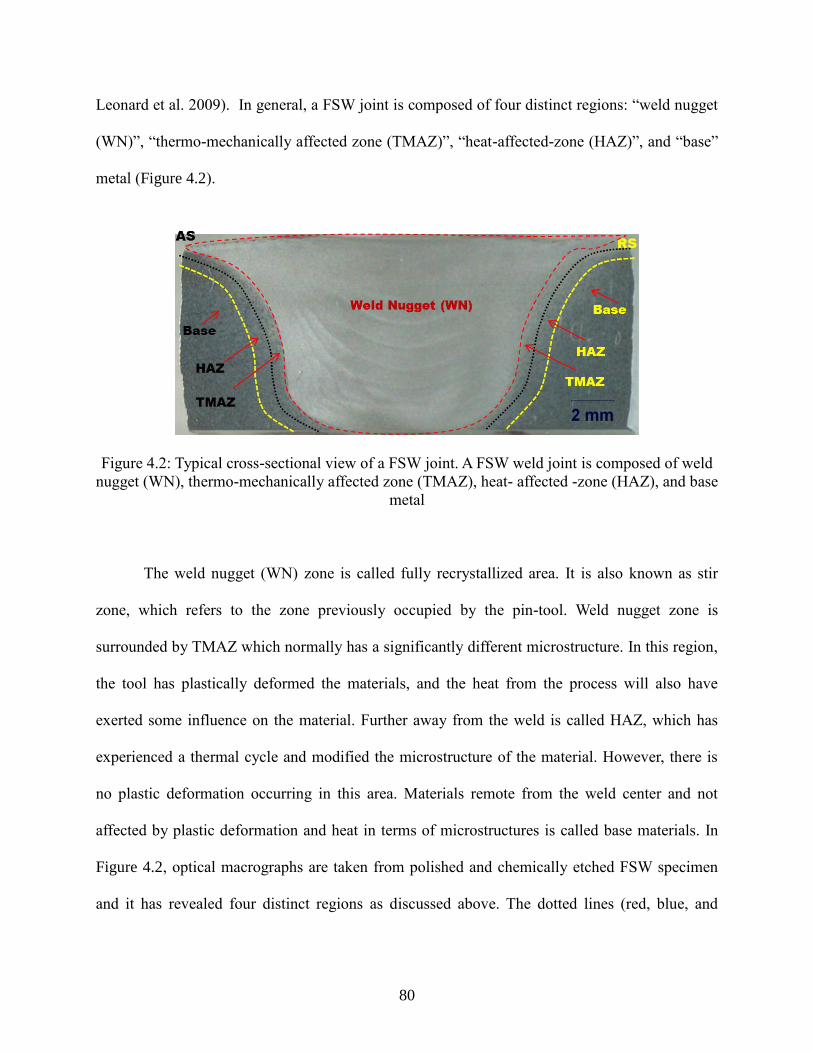
80
Leonard et al. 2009). In general, a FSW joint is composed of four distinct regions: “weld nugget
(WN)”, “thermo-mechanically affected zone (TMAZ)”, “heat-affected-zone (HAZ)”, and “base”
metal (Figure 4.2).
Figure 4.2: Typical cross-sectional view of a FSW joint. A FSW weld joint is composed of weld
nugget (WN), thermo-mechanically affected zone (TMAZ), heat- affected -zone (HAZ), and base
metal
The weld nugget (WN) zone is called fully recrystallized area. It is also known as stir
zone, which refers to the zone previously occupied by the pin-tool. Weld nugget zone is
surrounded by TMAZ which normally has a significantly different microstructure. In this region,
the tool has plastically deformed the materials, and the heat from the process will also have
exerted some influence on the material. Further away from the weld is called HAZ, which has
experienced a thermal cycle and modified the microstructure of the material. However, there is
no plastic deformation occurring in this area. Materials remote from the weld center and not
affected by plastic deformation and heat in terms of microstructures is called base materials. In
Figure 4.2, optical macrographs are taken from polished and chemically etched FSW specimen
and it has revealed four distinct regions as discussed above. The dotted lines (red, blue, and

81
yellow) are drawn schematically to distinguish weld nugget, TMAZ, HAZ, and base metal area
into an optical macrograph of FSW joint.
Figure 4.3 illustrates optical micrographs of a FSW joint at different location. There is a
clear difference observed between advancing and retreating sides’ microstructures of a FSW
weld joint. In FSW, frictional heat is usually generated due to high axial pressure and shearing
action of pin-tool and its shoulder. If generated temperature reaches to 80% - 90% of melting
temperature, plasticized softened zone is created around the tool. This softened material cannot
escape as it is constrained by the pin-tool shoulder (see Figure 3.1).
Figure 4.3: Optical micrographs of defect- free FSW AA2219 joint. Micrographs are taken at
different locations of weld joints showing variations in microstructures

82
As the pin-tool is traversed along the joint line, material is swept around the tool probe. Most of
the deformed material is extruded past the retreating side of the tool and results an asymmetrical
weld joint (Threadgill, Leonard et al. 2009). From near-weld and TMAZ interface, an evidence
of plastic deformation can be seen in the grain structures. In the outer part of the TMAZ,
deformed grain structure with the formation of sub-grain structures are observed. At weld
nugget, higher strains and temperatures allowed the formation of the recrystallized nugget with a
fine equiaxed structure. In general, the nugget comprised of dynamically recrystallized grains,
whereas, TMAZ comprised of deformed sub-grains separated by low angle grain boundaries
(Rhodes, Mahoney et al. 2003). The microstructure of the advancing side is characterized by a
sharp boundary between the weld nugget (WN) and TMAZ. The retreating side of the FSW joint
has a more complex microstructure, with no clear boundary between the WN and TMAZ.
For further investigations of grain sizes at different regions, SEM micrographs are
analyzed (Figure 4.4). It observed that the weld nugget (WN) is invariably composed of
equiaxed grains with an average grin size of 5 µm. A clear boundary between weld nugget
and TMAZ can easily be identified at the advancing side (AS); but in retreating side (RS) it
was not easy to identify the clear boundary between the WN and TMAZ, which is also
confirmed from optical micrographs (Figure 4.3) and electron backscatter diffraction (EBSD)
images (Figure 4.5). The TMAZ in both AS and RS observed to have elongated grains
structures.
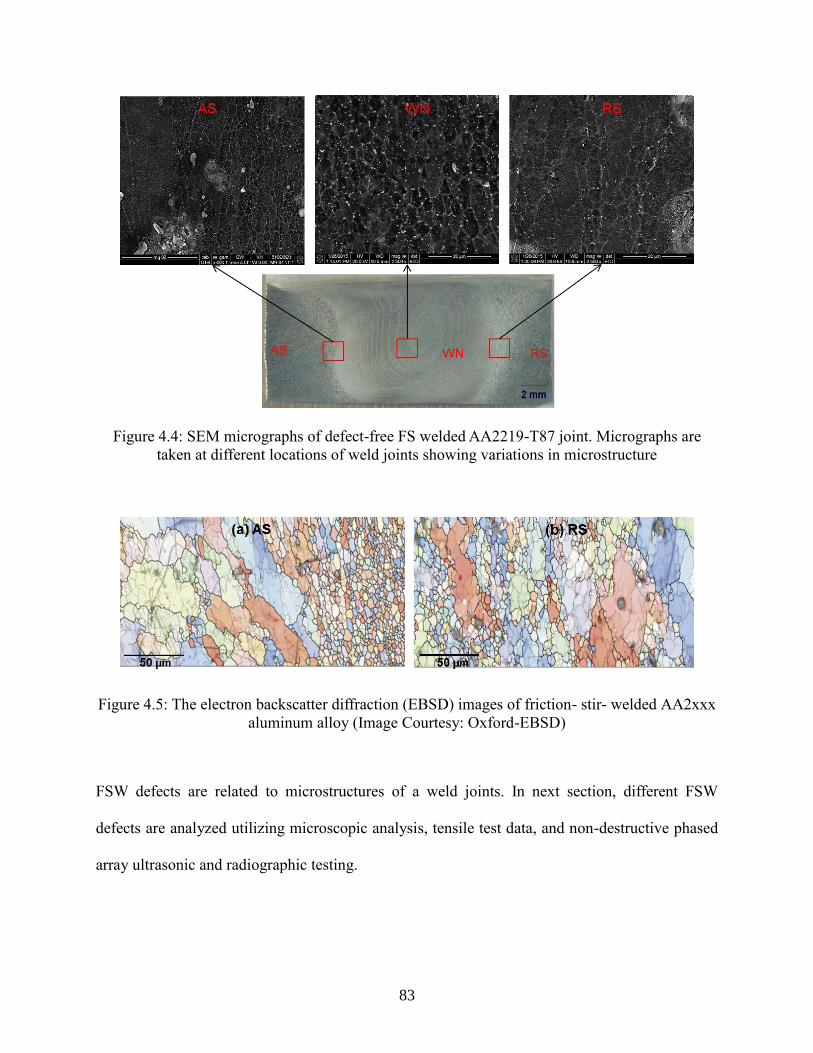
83
Figure 4.4: SEM micrographs of defect-free FS welded AA2219-T87 joint. Micrographs are
taken at different locations of weld joints showing variations in microstructure
Figure 4.5: The electron backscatter diffraction (EBSD) images of friction- stir- welded AA2xxx
aluminum alloy (Image Courtesy: Oxford-EBSD)
FSW defects are related to microstructures of a weld joints. In next section, different FSW
defects are analyzed utilizing microscopic analysis, tensile test data, and non-destructive phased
array ultrasonic and radiographic testing.

84
4.3. Weld Defect Classifications
The quality of a FS-welds are largely depends on heat generated (Q) during the welding
process by plastic flow processes. For a particular pin-tool and clamping condition, “Q” mainly
depends on the three critical process parameters (spindle rotational speed (𝑁), weld speed (𝑉),
and plunge force (𝐹𝑧)). Spindle speed and weld speed determine the weld temperature. High
temperatures promote small voids and underfill. Low temperatures promote Wormholes (WH),
i.e. internal cavities, Trenching (TR) defects, i.e. surface cavities, and incomplete penetration
(IP). Plunge force reduces the tendency for internal surfaces to open (WH and TR) and pushes
the crown surface down to maintain full pin length and prevent Incomplete Penetration (IP).
Microscopic analysis and non-destructive testing (NDT) of the FS- welded aluminum alloy
AA2219-T87 panels with 66 different schedules revealed welding defects for 32 schedules,
leaving “no-defects” for 34 schedules. Three weld categories were distinguished based on weld
process parameters and anticipated weld defects. These are (i) hot weld (high spindle speed, low
weld speed, and high plunge force), (ii) cold weld (low spindle speed, high weld speed, and low
plunge force), and (iii) nominal weld (optimum spindle speed, welding speed, and plunge force).
Nominal welds observed to have no visible weld defects. Both hot and cold welds were
associated with characteristic weld defects.
4.3.1. Microscopic Analysis to Classify Weld Defects
In cold welds, the defects observed include Wormholes (WH), Incomplete Penetration
(IP), and Trenching (TR). A cold weld schedule produced wormholes (WH) inside the nugget
metal on the advancing side of the nugget and incomplete penetration (IP) on the original seam
line below the nugget as shown in Figure 4.6. The IP presumably occurs when the tool shoulder
rides higher on colder and harder metal, retracting the end of the pin from the root side of the
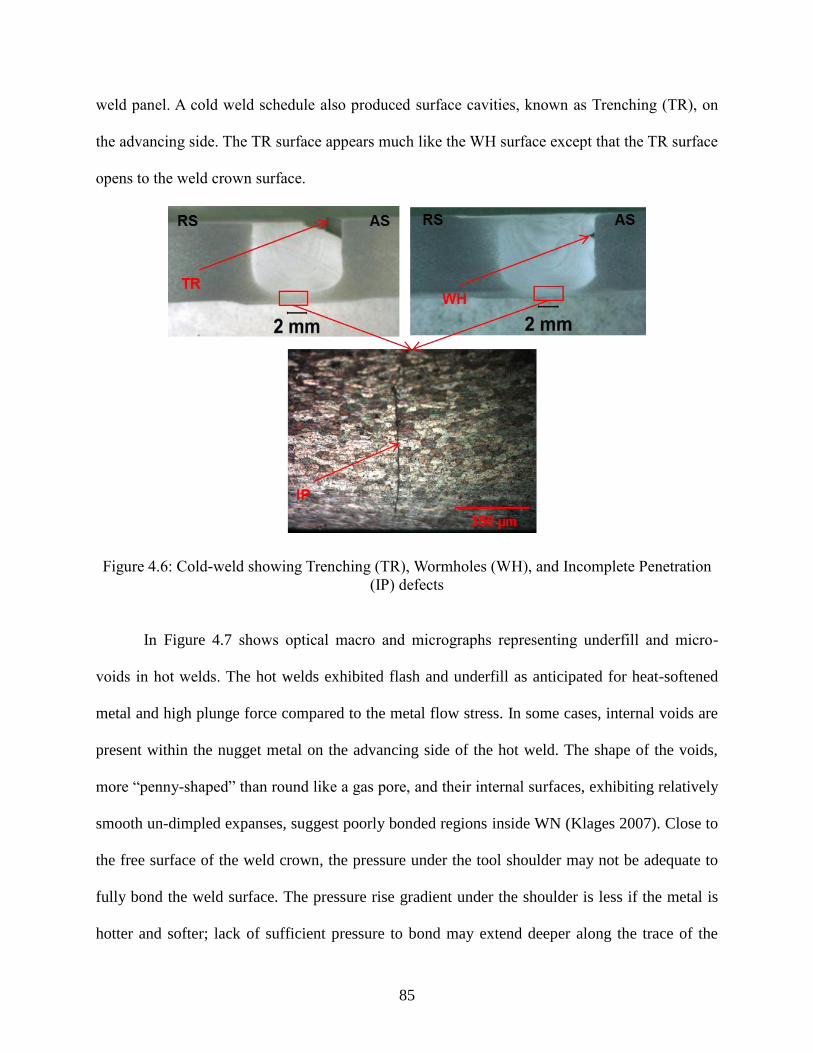
85
weld panel. A cold weld schedule also produced surface cavities, known as Trenching (TR), on
the advancing side. The TR surface appears much like the WH surface except that the TR surface
opens to the weld crown surface.
Figure 4.6: Cold-weld showing Trenching (TR), Wormholes (WH), and Incomplete Penetration
(IP) defects
In Figure 4.7 shows optical macro and micrographs representing underfill and micro-
voids in hot welds. The hot welds exhibited flash and underfill as anticipated for heat-softened
metal and high plunge force compared to the metal flow stress. In some cases, internal voids are
present within the nugget metal on the advancing side of the hot weld. The shape of the voids,
more “penny-shaped” than round like a gas pore, and their internal surfaces, exhibiting relatively
smooth un-dimpled expanses, suggest poorly bonded regions inside WN (Klages 2007). Close to
the free surface of the weld crown, the pressure under the tool shoulder may not be adequate to
fully bond the weld surface. The pressure rise gradient under the shoulder is less if the metal is
hotter and softer; lack of sufficient pressure to bond may extend deeper along the trace of the
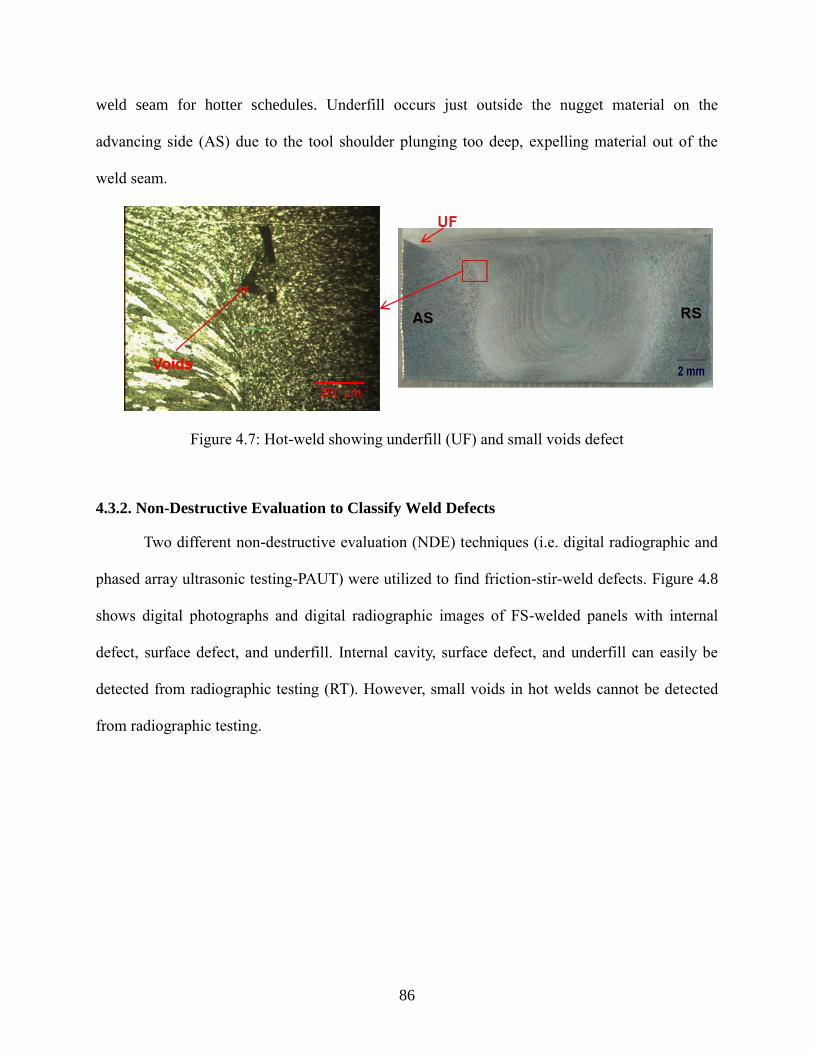
86
weld seam for hotter schedules. Underfill occurs just outside the nugget material on the
advancing side (AS) due to the tool shoulder plunging too deep, expelling material out of the
weld seam.
Figure 4.7: Hot-weld showing underfill (UF) and small voids defect
4.3.2. Non-Destructive Evaluation to Classify Weld Defects
Two different non-destructive evaluation (NDE) techniques (i.e. digital radiographic and
phased array ultrasonic testing-PAUT) were utilized to find friction-stir-weld defects. Figure 4.8
shows digital photographs and digital radiographic images of FS-welded panels with internal
defect, surface defect, and underfill. Internal cavity, surface defect, and underfill can easily be
detected from radiographic testing (RT). However, small voids in hot welds cannot be detected
from radiographic testing.
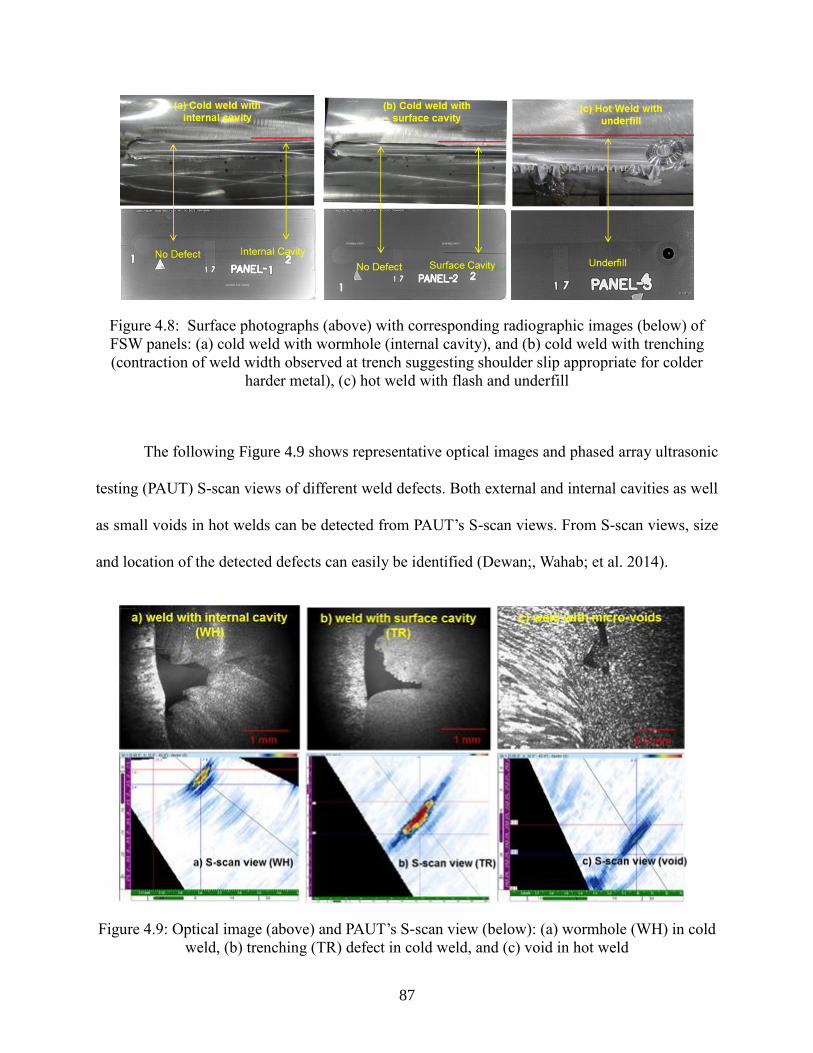
87
Figure 4.8: Surface photographs (above) with corresponding radiographic images (below) of
FSW panels: (a) cold weld with wormhole (internal cavity), and (b) cold weld with trenching
(contraction of weld width observed at trench suggesting shoulder slip appropriate for colder
harder metal), (c) hot weld with flash and underfill
The following Figure 4.9 shows representative optical images and phased array ultrasonic
testing (PAUT) S-scan views of different weld defects. Both external and internal cavities as well
as small voids in hot welds can be detected from PAUT’s S-scan views. From S-scan views, size
and location of the detected defects can easily be identified (Dewan;, Wahab; et al. 2014).
Figure 4.9: Optical image (above) and PAUT’s S-scan view (below): (a) wormhole (WH) in cold
weld, (b) trenching (TR) defect in cold weld, and (c) void in hot weld

88
One challenging effort for NDE techniques is to detect incomplete penetration (IP).
This type of defect has been also called “lack-of-penetration (LOP)”, kissing-bond (KB), and
sometime “joint-line-remnant (JLR)” in literature. In the present study, X-ray radiography
had difficulty in detecting IP defects. Alternatively, PAUT was able to discover IP defects;
however, an increase in gain value was needed in order to provide PAUT’s A-scan signal
peak amplitude values near acceptable limits with the aforementioned calibration, which
allowed 80% A-scan peak amplitude for 0.79 mm defects. The “signal to noise ratio” of the
system was still decent with this increase in gain. Few IP defects were unable to be
discovered by the PAUT system, not because the size of the defect wall, but rather due to
large defects present in the same specimen (wormholes and trenching). As the gain values
were increased, large wormhole or trench defects caused high noise, and in some cases,
distorted the location where the IP defects reside. In Figure 4.10 incomplete penetration (IP)
defect with associated S-scan view is shown. By analyzing location of the defects, it was
identified as IP.
Figure 4.10: Optical image (left) and associated S-scan image (right) of IP defect
After weld defects are classified from NDT and microscopic analysis, uniaxial tensile tests were
performed to correlate weld defects with tensile properties of FS-welded AA2219-T87 joints.

89
4.4. Tensile Properties of FSW Joint
Uniaxial ultimate tensile strength (UTS) and toughness have been investigated to
understand the effects of varying weld schedules. These two properties are important to define
weld quality. Defect-free weld joints usually observe to have highest UTS and toughness as
compared to defective weld joints. Tensile test was conducted along the transverse direction of
weld seam. The UTS of the welded specimens are compared with base metal’s UTS (471 MPa)
and joint efficiency (JE) results are reported in Table 4.1.
Table 4.1: Welding process parameters, tensile test results, and weld defects of FS welded
AA2219-T87 panels (WH = wormhole; IP = incomplete penetration; TR = trenching; UF =
Underfill)
SL # N
(rpm)
V
(mm/min)
Fz
(kN)
UTS
(MPa)
Toughness
(MJ/m³)
JE (%),
UTS Defects Class
1 300 152.40 24.47 310.24 32.90 65.78 None
No
min
al
wel
ds
(NW
)
2 200 152.40 33.36 323.31 42.18 68.55 None
3 350 76.20 15.57 331.68 44.89 70.32 None
4 350 152.40 22.24 362.08 41.91 76.77 None
5 300 152.40 22.24 339.66 37.80 72.01 None
6 350 266.70 30.25 356.36 41.78 75.55 None
7 350 236.98 26.69 359.96 38.57 76.32 None
8 350 118.62 19.57 347.61 44.52 73.70 None
9 350 88.90 16.46 333.45 36.08 70.70 None
10 300 228.60 30.25 326.33 39.64 69.19 None
11 200 152.40 31.14 313.99 45.51 66.57 None
12 350 88.90 15.57 326.84 37.48 69.30 None
13 300 152.40 26.69 324.83 33.80 68.87 None
14 350 76.20 14.46 320.25 30.79 67.90 None
15 350 76.20 16.68 324.41 33.72 68.78 None
16 350 76.20 14.01 337.38 37.21 71.53 None
17 300 130.56 24.47 333.74 30.89 70.76 None
18 300 101.60 22.24 335.62 35.87 71.16 None
19 300 76.20 17.79 320.65 31.23 67.98 None
20 400 101.60 17.79 337.37 37.80 71.53 None
21 400 77.98 15.57 327.46 35.02 69.43 None
22 350 88.90 17.79 343.43 47.42 72.81 None
23 350 152.40 22.24 352.29 33.76 74.69 None
24 400 76.20 15.57 340.99 39.79 72.30 None

90
25 400 76.20 13.34 330.69 31.34 70.11 None
26 250 76.20 20.91 311.93 45.95 66.13 None
27 300 203.20 31.14 343.12 35.68 72.75 None
28 300 203.20 33.36 347.34 34.10 73.64 None
29 300 228.60 33.36 346.34 34.06 73.43 None
30 300 203.20 26.69 328.14 36.55 69.57 None
31 300 228.60 35.59 335.09 30.14 71.04 None
32 400 228.60 24.47 347.44 29.34 73.66 None
33 300 228.60 31.14 354.05 45.24 75.06 None
34 400 228.60 26.69 353.71 33.44 74.99 None
35 300 152.40 21.13 288.12 11.59 61.09 WH
Cold
Wel
d (
CW
)
36 350 152.40 17.79 172.95 4.67 36.67 TR/IP
37 350 152.40 15.57 166.63 4.07 35.33 TR/IP
38 200 152.40 26.69 283.38 15.01 60.08 IP
39 300 203.20 21.13 178.06 2.38 37.75 TR/WH/IP
40 300 203.20 24.47 279.81 11.84 59.32 WH/IP
41 300 152.40 20.02 279.06 9.13 59.17 WH
42 300 203.20 22.24 315.00 17.54 66.79 WH
43 300 203.20 20.02 237.74 4.03 50.40 WH/IP
44 350 152.40 17.79 153.50 2.33 32.54 TR/IP
45 200 152.40 27.58 267.75 15.08 56.77 IP
46 300 101.60 16.01 167.38 6.56 35.49 TR/IP
47 350 76.20 12.46 157.56 5.76 33.41 TR/IP
48 300 76.20 14.23 176.95 7.20 37.52 TR/IP
49 300 101.60 17.79 192.24 6.74 40.76 TR
50 200 203.20 33.36 268.33 15.34 56.89 IP
51 250 168.91 26.69 293.75 17.62 62.28 IP
52 200 135.38 26.69 267.32 15.94 56.68 IP
53 300 152.40 33.36 292.16 22.05 61.94 UF H
ot
Wel
d (
HW
) 54 350 152.40 28.91 317.89 22.36 67.40 UF
55 300 101.60 24.47 309.77 23.14 65.68 UF
56 350 88.90 22.24 306.69 22.46 65.02 UF
57 350 76.20 21.35 295.15 19.53 62.58 UF
58 350 152.40 26.69 314.44 28.54 66.67 UF
59 350 88.90 20.02 315.53 22.00 66.90 UF
60 450 152.40 33.36 260.17 9.09 55.16 Voids/UF
61 450 152.40 28.91 290.59 10.83 61.61 Voids/UF
62 450 152.40 35.59 211.72 4.12 44.89 Voids/UF
63 400 228.60 33.36 341.18 23.04 72.34 UF
64 225 152.40 37.81 320.40 33.95 67.93 UF
65 350 76.20 17.79 314.44 31.65 66.67 UF
66 300 76.20 22.24 322.09 30.47 68.29 UF

91
As discussed above, the welds were classified into three categories (nominal, hot, and cold
welds) based on the three critical process parameters, weld defects, and tensile properties.
Typical tensile stress-strain curves for base metal, nominal, hot, and cold welds are shown in
Figure 4.11. Defect free nominal welds exhibited UTS and toughness values equal or more than
66% and 43% of base metal values.
Figure 4.11: Stress-strain plots of base and FS welded AA2219-T87 specimens (base, nominal,
hot, and cold welds)
The variation in tensile strength and toughness values of nominal, hot, and cold welds are related
to weld defects and microstructure. Typical weld nugget (WN) microstructures of nominal, hot,
and cold welds are shown in Figure 4.12. The grain growth in weld nugget (WN) zone is related
to heat input during the welding process (Arora, Pandey et al. 2010). The weld nugget of a defect
free FSW joint is commonly composed of fine equiaxed grains (Figure 4.12a). The high heat
input in hot weld has resulted in growth of dynamically recrystallized grain in WN zone (Figure

92
4.12b). Alternatively, low heat input in cold welds hinder formation of fully dynamically
recrystallized equiaxed grain (Figure 4.12c). The presence of weld defects and variations in
microstructures are related to lower tensile properties of cold and hot welds joints.
Figure 4.12: Typical SEM micrographs showing microstructure in weld nugget (WN) of (a)
nominal weld (NW), (b) hot weld (HW), and (c) cold weld (CW) joints
Both UTS and toughness values of welded specimens decreased with the increase of
defect size. Nominal welds were observed to have the highest average UTS (332 MPa) and
toughness (37 MJ/m³) values, followed by hot-welds with underfill (311 MPa and 24 MJ/m³),
cold-welds with IP (271 MPa and 15 MJ/m³), cold-welds with WH (273 MPa and 10 MJ/m³),
and cold-welds with TR (170 MPa and 5 MJ/m³). The following Figure 4.13 illustrates variations
of UTS and toughness values with different types of weld defects.

93
Figure 4.13: Effect of different weld defects on tensile properties (NW: nominal weld; HW: hot
weld; CW-IP: cold weld with incomplete penetration; CW-WH: cold weld with wormhole; CW
TR: cold weld with trenching)
After tensile test, it is important to understand fracture behavior of tensile test specimens and
correlate with microstructures. The following section includes the fracture surface analysis of
tensile tested specimens.
4.5. Fracture Surface Analysis
All defective specimens (hot and cold welds) failed on the Advancing Side (AS) of the
weld nugget and the defect-free nominal weld samples failed on the Retreating Side (RS) of the
thermo-mechanically affected zone (TMAZ) and heat-affected-zone (HAZ). The following
Figure 4.14 - Figure 4.17 show the fracture surfaces and related microstructural features of
tensile tested samples of a nominal, hot, and cold welds. Fracture surface of the nominal weld
with no-defects is shown in Figure 4.14. Fracture occurred on the 45o maximum shear line in the

94
heat-affected region outside the weld nugget on the retreating side of the weld. Beyond the
nugget in the TMAZ and HAZ, the softening effect of over-aging (Sato, Kokawa et al. 1999)
predominates and presents a weakened path for fracture. The fracture surface exhibits ductile
rupture dimples (Rhodes, Mahoney et al. 1997) of a larger size corresponding to the larger parent
metal grains outside the nugget zone.
Figure 4.14: Nominal weld showing no defect. A 45° maximum shear fracture is on retreating
side of tool outside the weld nugget in heat-affected base metal. Fracture surface exhibits ductile
fracture dimples, larger corresponding to base metal and weld nugget
The following Figure 4.15 illustrates optical images and fracture surfaces of a tensile
tested hot weld specimen. All hot welds observed to have underfill (UF) on advancing side of
the weld nugget. In some cases, internal voids were present within the nugget metal on the
advancing side of the weld. The voids might be entrained from a free surface by ring vortex
circulations and un-bonded regions on the weld seam trace. Close to the free surface of the weld

95
crown, the pressure under the tool shoulder may not be adequate to fully bond the weld surface.
The internal surface of the voids does show patches of ductile fracture dimples, but also smooth
surfaces with some regular linear grooves that suggest ripples produced on an internal un-bonded
surface in the same way that they are produced on the crown surface in the wake of the weld.
(Sometimes such ripples can be seen at the bottom of a crack in the rippled surface following the
tool.) The fracture is no longer a shear fracture, but now, judging by the orientation normal to the
test coupon surface, a tensile fracture.
Figure 4.15: Hot weld showing internal voids. Fracture is on advancing side of tool inside the
weld nugget. Fracture surface exhibits equiaxed ductile fracture dimples, smaller corresponding
to base material. Unbonded void surface exhibits some regularly space curved lines that may be
internal ripples
A cold weld schedule produced wormholes (WH) inside the nugget metal on the
advancing side; and incomplete penetration (IP) on the original seam line below the weld nugget
(Figure 4.16). It is also referred to as Joint- Line- Remnant (JLR), Kissing- Bond (KB), weak
bond or root flaw. In weld (Oosterkamp, Oosterkamp et al. 2004), showed that kissing bond is a

96
solid-state welding defect where two pieces of material are in contact but have failed to create
any metallic weld like bonds. The cause of JLR defect in FSW has been linked to slipping
conditions between the tool surface and metal in the shear zone and the oxide layers brought into
the. It is also reported that kissing bond originates from insufficient mixing of matter close to the
initial butt surfaces (Sato, Takauchi et al. 2005; Di, Yang et al. 2006). The IP presumably occurs
when the tool shoulder rides higher on colder and harder metal, retracting the end of the pin from
the root side of the weld panel. Under load control, colder and harder metal is more difficult to
indent because the pin will be pushed out of the seam and a compensatory increase in plunge
force will not occur which leads to IP. The WH exhibits two distinct surfaces: a smooth surface
following the nugget edge on the trace of the shear surface and rounded surfaces incorporating
ripples that appear on the free surface, trailing the weld shoulder (Figure 4.16). The surfaces are
separated by cusps. Above and below the WH defect the fracture surface exhibits ductile rupture
dimples. The streamlines of weld metal flow (Colligan 1999) past the upper portion of the pin
does not get close enough to the pin for the threads to produce an impression on the weld metal.
The pumping action on the weld metal due to slight eccentricity of the rotating pin-tool is
responsible for the ripples in the wake of the weld as well as internal bonding texture and ripples
on any internal open surface. Both apparently un-bonded clean ripples and adjacent periodic
bonded dimpled surfaces that appear to be banding texture are visible in SEM fractographs. The
fracture surface follows a less defined 45o line through a defect and along a direction suggesting
minimal shear strength. A small vertical fracture segment at the weld root indicates IP.

97
Figure 4.16: Cold weld showing internal cavity. Fracture is on the advancing side of tool inside
the weld nugget. Fracture surface exhibits ductile fracture dimples, smaller corresponding to
nugget material. Unbonded cavity surface appears to exhibit surface ripples
Figure 4.17: Cold weld showing trenching (TR) defect at weld crown and incomplete penetration
(IP) at weld root. Fracture is on advancing side of tool inside the weld nugget. Fracture surface
exhibits ductile fracture dimples, smaller corresponding to nugget material. Unbonded trench
surface exhibits surface ripples

98
The cold weld also exhibits trenching (TR) with ripples on the trench surface (Figure
4.17). The internal cavity on the advancing side of the cold weld has enlarged and moved to the
surface of the cold weld. The fracture surface is almost at 45o implying a shear mechanism. With
colder, harder metal under load control the shoulder may not press as deeply into the metal so
that the effective pin depth is reduced. As a result the IP at the weld root is more pronounced, as
anticipated, for load control operation.
4.6. Micro-Hardness of FSW Joint
To understand the fracture behavior of nominal, cold, and hot weld joints hardness profiles
are investigated. Rockwell hardness values (60-kgf, diamond cone, HRA scale) are measured at
the middle of the cross section of a FSW joint. Measured hardness profile is plotted against
distance from weld centerline, illustrated in Figure 4.18. Weld-nugget (WN) zone exhibited
higher hardness values compared to AS (Advancing Side) and RS (Retreating Side) thermo-
mechanically affected zones (TMAZ). Higher hardness values at the WN zone is related to
equiaxed fine grain structure. A lower hardness value near TMAZ is related to deformed and
elongated microstructure. The lowest hardness value (about 24 HRA) is exhibited near the
TMAZ on the RS, which correlates well with optical micrographs. As a result, tensile tested
nominal weld joint failed from retreating side of the weld nugget. However, the difference in
hardness values at AS and RS is not significant to dictate failure sites in defective joints in the
case of tensile test. Weld-defects generally act as a stress concentration and fracture initiation site
during tensile tests of defective weld. As discussed earlier, hot and cold welds observed to have
weld defects at the AS of weld nugget. Therefore, hot and cold weld joints fail from the AS of the
weld nugget.

99
Figure 4.18: (a) Cross sectional view and (b) Micro-hardness profile of FS- welded AA2219-T87
joint
In previous sections, FSW process parameters, weld defects, and tensile properties of FSW
joints are discussed. Tensile properties are varied with the variation of critical weld process
parameters. In next section, the effects of critical process parameters on tensile properties are
discussed.
4.7. Tensile Properties Related to Welding Process Parameters
For a particular pin-tool and clamping condition, the quality of a FS- weld largely
depends on the three critical process parameters (spindle rotational speed (𝑁), weld speed (𝑉),
and plunge force (𝐹𝑧)). Alternatively, all these three parameters (𝑁, 𝑉, 𝐹𝑧) act together to control
weld strength. An empirical correlation of these parameters yielding optimal strength has been
obtained for this study by comparing the influence of individual process parameters on tensile
properties.
In a FSW process, the spindle speed (𝑁) and welding speed (𝑉) has opposite
consequences on the frictional heat generation (Colligan 2007). It is believed that a better way to
represent welding process parameters in a more concise manner can be achieved by combining 𝑁
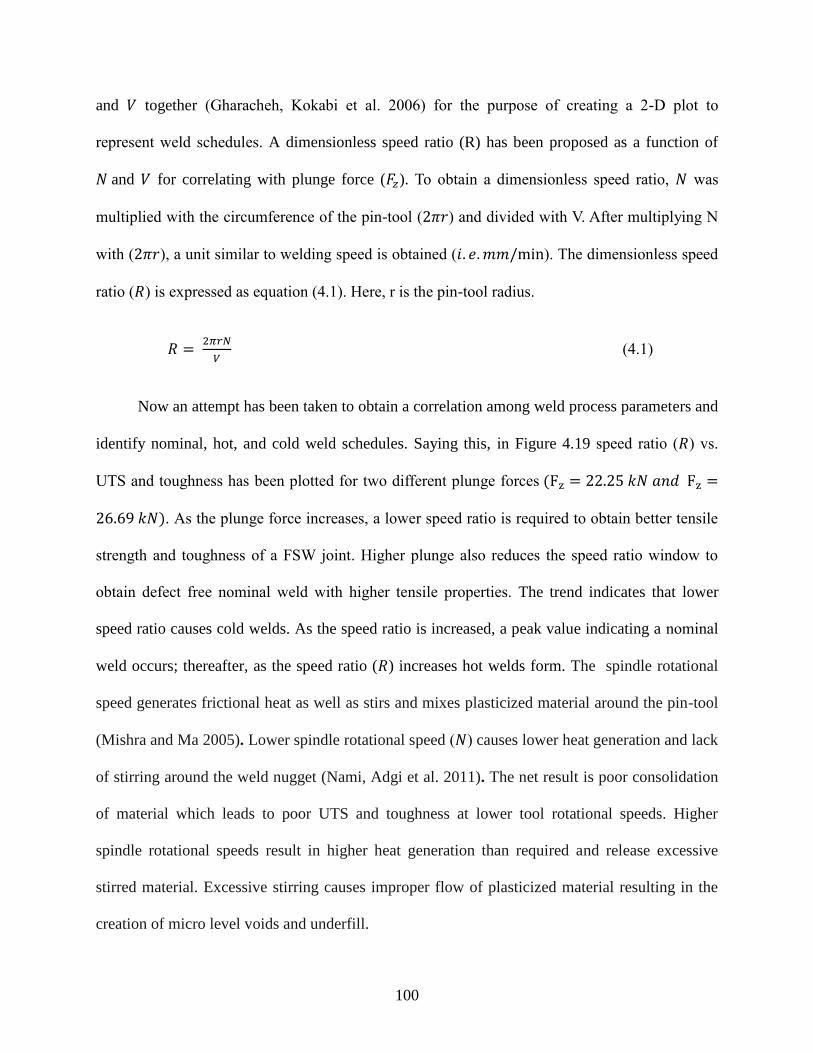
100
and 𝑉 together (Gharacheh, Kokabi et al. 2006) for the purpose of creating a 2-D plot to
represent weld schedules. A dimensionless speed ratio (R) has been proposed as a function of
𝑁 and 𝑉 for correlating with plunge force (𝐹𝑧). To obtain a dimensionless speed ratio, 𝑁 was
multiplied with the circumference of the pin-tool (2𝜋𝑟) and divided with V. After multiplying N
with (2𝜋𝑟), a unit similar to welding speed is obtained (𝑖. 𝑒. 𝑚𝑚/min ). The dimensionless speed
ratio (𝑅) is expressed as equation (4.1). Here, r is the pin-tool radius.
𝑅 = 2𝜋𝑟𝑁
𝑉(4.1)
Now an attempt has been taken to obtain a correlation among weld process parameters and
identify nominal, hot, and cold weld schedules. Saying this, in Figure 4.19 speed ratio (𝑅) vs.
UTS and toughness has been plotted for two different plunge forces (Fz = 22.25 𝑘𝑁 𝑎𝑛𝑑 Fz =
26.69 𝑘𝑁). As the plunge force increases, a lower speed ratio is required to obtain better tensile
strength and toughness of a FSW joint. Higher plunge also reduces the speed ratio window to
obtain defect free nominal weld with higher tensile properties. The trend indicates that lower
speed ratio causes cold welds. As the speed ratio is increased, a peak value indicating a nominal
weld occurs; thereafter, as the speed ratio (𝑅) increases hot welds form. The spindle rotational
speed generates frictional heat as well as stirs and mixes plasticized material around the pin-tool
(Mishra and Ma 2005). Lower spindle rotational speed (𝑁) causes lower heat generation and lack
of stirring around the weld nugget (Nami, Adgi et al. 2011). The net result is poor consolidation
of material which leads to poor UTS and toughness at lower tool rotational speeds. Higher
spindle rotational speeds result in higher heat generation than required and release excessive
stirred material. Excessive stirring causes improper flow of plasticized material resulting in the
creation of micro level voids and underfill.
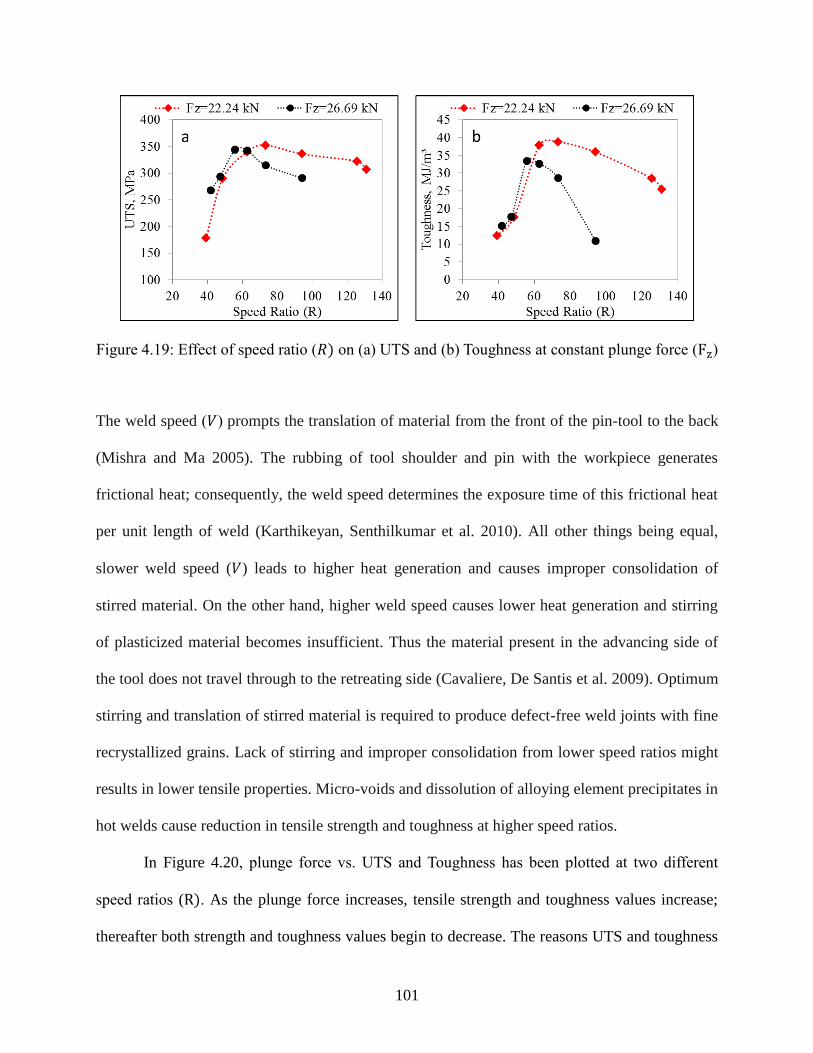
101
Figure 4.19: Effect of speed ratio (𝑅) on (a) UTS and (b) Toughness at constant plunge force (Fz)
The weld speed (𝑉) prompts the translation of material from the front of the pin-tool to the back
(Mishra and Ma 2005). The rubbing of tool shoulder and pin with the workpiece generates
frictional heat; consequently, the weld speed determines the exposure time of this frictional heat
per unit length of weld (Karthikeyan, Senthilkumar et al. 2010). All other things being equal,
slower weld speed (𝑉) leads to higher heat generation and causes improper consolidation of
stirred material. On the other hand, higher weld speed causes lower heat generation and stirring
of plasticized material becomes insufficient. Thus the material present in the advancing side of
the tool does not travel through to the retreating side (Cavaliere, De Santis et al. 2009). Optimum
stirring and translation of stirred material is required to produce defect-free weld joints with fine
recrystallized grains. Lack of stirring and improper consolidation from lower speed ratios might
results in lower tensile properties. Micro-voids and dissolution of alloying element precipitates in
hot welds cause reduction in tensile strength and toughness at higher speed ratios.
In Figure 4.20, plunge force vs. UTS and Toughness has been plotted at two different
speed ratios (R). As the plunge force increases, tensile strength and toughness values increase;
thereafter both strength and toughness values begin to decrease. The reasons UTS and toughness

102
values are low at the left and right portions of the plot are due to the defects in cold and hot
welds. Heat generated by weld metal deformation around the pin-tool softens the weld metal and
reduces the axial force required to indent the weld metal. Axial force also extends the plunge
depth of the pin (Elangovan, Balasubramanian et al. 2008; Kumar and Kailas 2008). For a FS-
weld joint, the pressure across the weld seam must be high enough to push down asperities
(several times the flow stress of the material) for joining to occur. Lower heat generation causes
higher flow stress and hence weld defects due to improper consolidation of material (Elangovan,
Balasubramanian et al. 2009) and results in lower tensile strength. Higher plunge force remedies
the effects of colder welds but excessive plunge force causes deeper tool shoulder penetration
depth which causes flash generation, local thinning (underfill) of the welded plate, and reduced
tensile strength. Optimum plunge force is required for avoidance of cold and hot defects and
production of sound weld joints. Speed ratio determines optimum plunge force. At lower speed
ratios higher plunge force is required to obtain nominal welds. For a particular pin-tool, all three
weld process parameters (𝑁, 𝑉, 𝐹𝑧) need to be controlled to obtain defect-free welds.
Figure 4.20: Effect of plunge force (Fz) on (a) ultimate tensile strength (UTS) and (b) Toughness
at two different speed ratio (R)

103
To verify the effect of dimensionless speed ratio (R), six weld schedules were
conducted at three different speed ratios (Table 4.2). For a particular plunge force, two welds
were conducted by varying rotational and weld speed while speed ratio remained the same.
The results indicate that at a constant speed ratio similar weld quality can be obtained.
However, there is a difference in UTS and toughness values observed between two schedules
which are still in the error limit. Therefore for a constant speed ratio and plunge force the
schedules are analogues.
Table 4.2: Verification of the effect of speed ratio (R)
N (rpm) V
(mm/min
Fz
(kN)
Dimensionless
Speed Ratio, R
UTS
(MPa)
Toughness,
MJ/m³
JE(%),
UTS Defect
350 237.0 26.7 47.1 359.96 38.57 76.32 None
300 203.2 26.7 47.1 318.59 27.52 67.55 None
300 76.2 17.8 125.6 320.65 31.23 67.98 None
400 101.6 17.8 125.6 337.37 37.8 71.53 None
350 266.7 30.2 41.9 356.56 41.78 75.55 None
300 228.6 30.2 41.9 326.33 39.64 69.19 None
By observing characteristic defect types identifiable by non-destructive evaluation of
radiographic testing (RT) and PAUT as well as metallographic procedures, the schedule-based
classification of friction- stir- welds as nominal, hot, and cold welds can be expanded to include
not just weld spindle rotational and travel speeds, but also plunge force. The characteristic of no-
defect microstructure of a nominal weld which is a category between hot and cold weld, can be
obtained for a wide range of speed ratios by altering plunge force. At lower speed ratios, higher
plunge is required to obtain nominal welds, while lower plunge force is required for higher speed
ratios. Consequently, the plunge force (𝐹𝑧) vs. (𝑅) ratio was plotted in Figure 4.21 for different
weld schedules to determine hot, cold, and nominal welds schedules.

104
Figure 4.21: FSW process parameters for hot, nominal, and cold welds group together into fields
with distinct boundaries
Any schedule within the bounded field produces defect-free welds. Two lines have been
superimposed to illustrate the (nominal/hot weld) and (nominal/cold weld) boundaries.
Schedules above the bounded line contributes to hot welds and schedules below the bounded line
produce cold welds. Among 66 weld schedules, 34 were classified as nominal welds, 18 cold
welds, and 14 hot welds.
From above discussions it is understand that the three critical process parameters (i.e. spindle
rotational speed, welding speed, and plunge force) have direct influence on the quality of a FSW
joint. In the next section, an empirical correlation between the FSW three process parameters has
been established to identify weld quality by looking at only weld process parameters.

105
4.8. Correlation of Weld Process Parameters and Weld Quality
In accord with above discussion, each weld can be classified as hot, nominal, and cold
welds. Both hot and cold welds are observed to have weld defects and result in lower tensile
properties. Furthermore, defect-free nominal (good quality) welds exhibited higher tensile
properties. It is obvious that the quality of a friction stir weld is directly linked to weld process
parameters.
Initial study started with the analysis of experimental results utilizing literature suggested
indices (Kandukuri, Arbegast et al. 2007; Pew, Nelson et al. 2007; Hamilton, Dymek et al. 2010;
Querin and Schneider 2012; Dehghani, Amadeh et al. 2013). In (Pew, Nelson et al. 2007;
Hamilton, Dymek et al. 2010; Dehghani, Amadeh et al. 2013), suggested energy input to
determine weld quality. In that model, heat input is assumed to be related to torque, spindle
rotational speed (𝑁), and welding speed (𝑉). Heat input per unit length can be expressed as
equation (4.2).
𝐸𝑛𝑒𝑟𝑔𝑦 𝐼𝑛𝑝𝑢𝑡 (𝐸𝐼) = 𝑇𝑜𝑟𝑞𝑢𝑒 × 𝑁
𝑉 (4.2)
In Figure 4.22a, UTS values are plotted against energy input and failed to separate nominal, cold,
and hot weld schedules. In their model, plunge force is assumed to be constant and weld speed
having a linear relation with welding heat generation.
Kandukuri and his research group (Kandukuri, Arbegast et al. 2007) proposed an
empirical Pseudo Heat Index (PHI) to correlate the heat input during FSW with spindle speed
and welding speed. If heat input determines weld properties, similar welds are obtained by
holding the index constant. The PHI can be expressed as equation (4.3).
𝑃𝐻𝐼 =𝑁
(10,000 ×𝑉) (4.3)

106
In Figure 4.22b, PHI vs. UTS value plotted and again failed to separate nominal, cold, and hot
weld schedules. The PHI does not necessarily include many process features affecting weld
properties and but is good for extrapolations of weld speed and spindle speed for a specified
welding situation.
Querin and Schneider (Querin and Schneider 2012) have proposed an Alternative Heat
Indexing (AHI) equation considering heat generation terms and thermal dissipation. The AHI can
be express as equation (4.4).
𝐴𝐻𝐼 = 𝑇−𝑇0
𝜏= 𝐴
𝑁
𝐵+𝑉(4.4)
Where, A and B are constants; related to material properties, heat transfer coefficients, and pin-
tool geometry; see reference (Querin and Schneider 2012) for details. In Figure 4.22c,
experimental UTS values are plotted against AHI and also failed to separate nominal, cold, and
hot weld schedules. The AHI however, did not include plunge force; yet plunge force may make
the difference between presence or absence of a defect.

107
Figure 4.22: Experimental ultimate tensile strength (UTS) values are plotted against (a) energy
input (Pew, Nelson et al. 2007), (b) Pseudo heat index (Kandukuri, Arbegast et al. 2007), and c)
Alternative heat index (Querin and Schneider 2012)
Now, with a view to determining parameters optimizing weld quality here a relation of weld
quality to three principal weld parameters (𝑁, 𝑉, 𝑎𝑛𝑑 𝐹𝑧) is obtained empirically. From a total 66
weld schedules, 34 schedules are classified as defect- free nominal welds. The nominal welds
exhibited UTS and toughness values equal or more than 66% and 43% respectively of base metal
values. In Figure 4.23, plunge force (𝐹𝑧) vs. dimensionless speed ratio (𝑅) has been plotted for
nominal welds. The values of 𝐹𝑧 vs. 𝑅 constitute a field and not a linear relation. It is also
observed that as the speed ratio increases, the plunge force required to achieve nominal welds
decreases. Using a non-linear regression approach, a correlation between plunge force and speed

108
ratio for producing defect free nominal welds can be written as equation (4.5). The goodness of
fit (𝑅2) value is 0.92.
𝐹𝑧 = 𝐶1(𝑅)−𝐶2 (4.5)
Where, 𝐹𝑧 is the plunge force measured in kN and 𝑅 is the dimensionless speed ratio. The
Constant 𝐶1 and exponent 𝐶2 depend on welding material, pin tool design, and other welding
conditions (e.g., clamping condition, chill bar, backing plate, environmental temperature
conditions, etc.). These constants C1 and exponent C2 can be determined experimentally. For
least square curve fitting, the coefficient 𝐶1 and 𝐶2 can be expressed as-
𝐶2 =𝑛 ∑ (𝑙𝑛𝑅𝑖×𝑙𝑛𝐹𝑧𝑖)−∑ (𝑙𝑛𝑅𝑖)×∑ (𝑙𝑛𝐹𝑧𝑖
𝑛𝑖=1 )𝑛
𝑖=1𝑛𝑖=1
𝑛 ∑ (𝑙𝑛𝑅𝑖)2−(∑ 𝑙𝑛𝐹𝑧𝑖)2𝑛𝑖=1
𝑛𝑖=1
(4.6)
𝐶1 = exp (∑ (𝑙𝑛𝐹𝑧𝑖)−𝐶2 ∑ (𝑙𝑛𝑅𝑖)𝑛
𝑖=1𝑛𝑖=1
𝑛) (4.7)
In the current study, the values of 𝐶1 and the exponent 𝐶2 are 256.93 and 0.561, respectively,
fitted from defect-free nominal weld data. In other words, equation (4.5) has been found to be
valid for defect-free nominal welds. Once the constants in equation (4.5) are established, it is
possible to correlate the types of defects to be anticipated (and hence weld quality) with an
“empirical force index (EFI)”. The EFI can be written as seen in equation (4.8), which is a
dimensionless ratio. When this non-dimensional EFI value deviates from unity, defect free
welding conditions are lost.
𝐸𝐹𝐼 =𝐹𝑧
𝐶1(𝑅)𝐶2 (4.8)
For nominal welds, the EFI is approximately 1.00. If the EFI is increased, the weld tends to be
within the hot range with associated defect characteristics. Alternatively, as the EFI drops below
1.00, defect characteristics of cold welds are observed. The EFI value deviation from 1.00 causes

109
degradation of weld quality. The ranges of the EFI associated with weld quality (UTS and
Toughness) are shown in Figure 4.24a and Figure 4.24b.
Figure 4.23: Plunge force vs. speed ratio plotted to obtain empirical correlation among three
weld process parameters for nominal weld (goodness of fit = 0.92)
Figure 4.24: Variations of tensile properties with empirical force index (EFI): (a) Ultimate
tensile strength vs. EFI, and (b) Toughness vs. EFI. These properties both decline on either side
of an (EFI) of 1.00

110
For the defect classification, three ranges of force index values can be expressed:
𝐸𝐹𝐼 ≤ 0.90 => 𝐶𝑜𝑙𝑑 𝑊𝑒𝑙𝑑 (𝑊𝐻, 𝑇𝑅, 𝐼𝑃) (4.9)
0.90 < 𝐸𝐹𝐼 ≤ 1.14 => 𝑁𝑜𝑚𝑖𝑛𝑎𝑙 𝑊𝑒𝑙𝑑 (𝑁𝑜 𝐷𝑒𝑓𝑒𝑐𝑡𝑠) (4.10)
𝐸𝐹𝐼 > 1.14 => 𝐻𝑜𝑡 𝑊𝑒𝑙𝑑 (𝑈𝐹, 𝑉𝑜𝑖𝑑𝑠) (4.11)
For validation of the developed empirical force index (EFI), six weld schedules were
experimented having different welding parameters (𝑁, 𝑉, 𝑎𝑛𝑑 𝐹𝑧). The welded plates were
inspected with PAUT and tensile tested to obtain joint properties and classification. Welding
parameters along with EFI, tensile properties, and quality of the joint are listed in Table 4.3. The
EFI predicted weld classification has exactly matched with the experimental result.
Table 4.3: New weld schedules along with weld quality for the validation of developed of
empirical force index (EFI) in weld classification
N (RPM) V
(mm/min) Fz (kN) UTS, MPa
Toughness,
MJ/m³ EFI (kN) Quality
1 250 228.60 36.48 336.69 48.33 1.04 NW
2 250 228.60 40.03 346.47 49.43 1.14 NW
3 250 203.20 28.91 285.38 15.19 0.88 CW
4 400 203.20 20.91 314.92 18.75 0.83 CW
5 400 203.20 23.58 357.46 35.11 0.94 NW
6 400 203.20 26.69 348.17 32.65 1.06 NW
4.9. Summary
The FSW process, if not correctly designed or the weld process is not controlled can
generate defects. For a particular pin-tool and welding condition, the quality of a FS- weld
greatly depends on three critical process parameters including plunge force, rotational speed, and
travel speed. A known relationship between critical process parameters (e.g., spindle rotational
speed (𝑁), welding speed (𝑉), and plunge force (𝐹𝑧)) with weld defects is necessary to design

111
defect- free weld schedules. An extensive study was conducted to determine the effects of
varying the FSW principal process parameters (𝑁, 𝑉, 𝐹𝑧) for 8.13 mm thick panels of AA2219-
T87 aluminum alloy.
To understand the effects of varying welding process parameters, the weld schedules are
classified into three categories (hot, nominal, and cold welds) based on three critical
process parameters (spindle rotational speed, weld speed, and plunge force), non-
destructively evaluated weld defects, and tensile test results. The presence of defects
reduces mechanical properties, especially ultimate tensile strength and toughness values.
For defect-free nominal-welds, the values of plunge force (𝐹𝑧) vs. dimensionless speed
ratio (𝑅) constitute a field; and any schedule within the bounded field produces a defect-
free weld. Weld schedules above the bounded line are considered hot-welds, and weld
schedules below the bounded line produces cold-welds. Using experimental results
obtained from various schedules, an empirical index (called “empirical force index-
EFI”), which is a function of critical weld process parameters (𝑁, 𝑉, 𝐹𝑧), is proposed to
identify hot, cold, and nominal- weld schedules.
Empirical Force Index (EFI) values correlate well to optimum welding condition. If 𝐸𝐹𝐼
values deviate from unity, the welding condition also deviates from the optimum
condition and be responsible for welding defects. The EFI is associated with three critical
process parameters and two materials and process dependent constants. The constant
values can be obtained experimentally. The empirical correlations between critical
process parameters can reduce huge amount of experimental works as well as save
money to generate sound weld.

112
Weld schedules within 0.90 < 𝐸𝐹𝐼 ≤ 1.14 yielded zero defects and produced optimal
mechanical properties. These schedules were labeled “nominal-weld”. Weld schedules
with 𝐸𝐹𝐼 ≤ 0.90 were labeled “cold-weld”. Cold weld schedules produced defects such
as: wormholes, trenching, and incomplete penetration. The UTS and more importantly,
the toughness were reduced. Weld schedules with 𝐸𝐹𝐼 > 1.14 were labeled “hot-weld”.
Hot schedules produced underfill and micro-voids. The UTS and toughness were reduced
with these defects.

113
CHAPTER 5 : PREDICTION OF TENSILE STRENGTH OF FSW JOINTS
WITH ADAPTIVE NEURO-FUZZY INFERENCE SYSTEM (ANFIS) AND
ARTIFICIAL NEURAL NETWORK (ANN)
5. Introduction
In previous Chapter 4, the effect of weld process parameters on weld defects,
microstructures, and tensile properties are discussed. From experimental investigations it was
observed that all three critical process parameters i.e. spindle rotational speed (𝑁), welding speed
(𝑉), and plunge force (𝐹𝑧), have direct influence on tensile strength of friction- stir- welding
(FSW) joint. But non-linear behavior of weld process parameters makes it complex to develop a
model to predict UTS (Ultimate tensile strength) of FSW joint. In this chapter, an adaptive
neuro-fuzzy inference system (ANFIS) model has been developed utilizing experimental data to
predict ultimate tensile strength of FSW joint. ANFIS is a hybrid predictive model which uses
both of neural network and fuzzy logic to generate mapping relationship between inputs and
outputs. Efforts were made to determine the best model based on best combination of input
variables, parameter optimization, and fuzzy inference architecture. The leave-one-out cross
validation (LOO-CV) approach was applied to validate each ANFIS model built in terms of root-
mean-square-error (RMSE) and mean-absolute- percentage-error (MAPE). A total of 1200
models were developed by varying the number of membership functions, the type of membership
function, and the combination of four input variables (𝑁, 𝑉, 𝐹𝑧 , 𝐸𝐹𝐼) in MATLAB platform;
where EFI denotes an empirical force index derived from the three process parameters, which is
discussed in Chapter 4. For comparison, artificial neural network (ANN) models were also
developed to predict UTS from FSW process parameters. This newly developed ANFIS model
could be utilized for the prediction of tensile strength of friction- stir- weld joints fabricated with
different operating conditions, mentioned above.

114
5.1. Scope
Development of an appropriate physical model which can predict the main characteristics
(i.e. weld defects and mechanical properties) of the FSW process is quite complex. Hence,
researchers have focused on building predictive models based on numerical analysis such as
finite element methods or empirical models derived from experimental observations (Record,
Covington et al. 2007; Elangovan, Balasubramanian et al. 2008; Jayaraman, Sivasubramanian et
al. 2008; Lakshminarayanan and Balasubramanian 2009; Rajakumar, Muralidharan et al. 2010;
Tansel, Demetgul et al. 2010; Gopalakrishnan and Murugan 2011; Rajakumar, Muralidharan et
al. 2011; Bilici 2012; Bozkurt 2012; Dinaharan and Murugan 2012; Rajakumar and
Balasubramanian 2012; Pradeep and Muthukumaran 2013). Nontraditional optimization
algorithm like genetic algorithm (GA)- Taguchi approach (Bilici 2012; Bozkurt 2012; Parida and
Pal 2015), simulated annealing (SA) (Yang, Srinivas et al. 2009; Chen, Lin et al. 2010; Zain,
Haron et al. 2011), and other metaheuristic algorithms (Liao and Daftardar 2009) have been used
to determine optimal operating parameters for various processes. The response surface
methodology (RSM) (Elangovan, Balasubramanian et al. 2008; Jayaraman, Sivasubramanian et
al. 2008; Lakshminarayanan and Balasubramanian 2009; Rajakumar, Muralidharan et al. 2011;
Dinaharan and Murugan 2012) has been extensively utilized to predict mechanical properties of
FSW joint. RSM consists of a group of mathematical and statistical techniques that can be used
to define the relationships between the response and the independent variables. The major
drawback of RSM is to fit the data to a second order polynomial (Baş and Boyacı 2007). Highly
nonlinear FSW process parameters and tensile properties might not be well accommodated by
the second order polynomial. Some investigators applied artificial neural network (ANN)
(Okuyucu, Kurt et al. 2007; Lakshminarayanan and Balasubramanian 2009; Tansel, Demetgul et
al. 2010; Shojaeefard, Behnagh et al. 2013; Ghetiya and Patel 2014) to predict mechanical

115
responses of FSW joint. Most of them utilized limited experimental data, and unfortunately, none
of them are decisive.
Adaptive network-based fuzzy inference system (ANFIS) is a hybrid predictive model
which uses both of neural network and fuzzy logic to generate mapping relationship between
inputs and outputs (Jang 1993). Although ANFIS is a powerful modeling tool; but there has been
only one study (Babajanzade Roshan, Behboodi Jooibari et al. 2013) utilized this technique in
modeling FSW process. In that study pin-tool profile, tool rotational speed, welding speed, and
axial force are utilized as input variables to predict ultimate tensile strength, yield strength, and
micro-hardness of friction- stir- welded AA7075 aluminum alloy joints. The data set used in that
study (Babajanzade Roshan, Behboodi Jooibari et al. 2013), however, seems low, especially
when 5- different pin tools were used. They utilized 31- data sets to develop a predictive model
and 10- data sets for testing the predictive model. Building and testing model based on simple
data splitting is known to be not reliable. For a small data set the leave-one-out cross validation
(LOO-CV) (Jalali-Heravi and Kyani 2007; Dong and Wang 2011; Shahbazikhah, Asadollahi-
Baboli et al. 2011; Tsujitani and Tanaka 2011) technique is beneficial to train on as many
examples as possible.
The current investigations entails experimental investigations and development an
optimized ANFIS model utilizing leave-one-out cross validation (LOO-CV) approach to predict
tensile properties of FSW joint of AA2219-T87 aluminum alloy. For comparison, an optimized
artificial neural network (ANN) model has been also developed in this study.

116
5.2. Methodology
In this chapter optimized artificial neural network (ANN) and adaptive neuro-fuzzy
inference system (ANFIS) were utilized to develop predictive models for FSW joints. Details of
the methodology for ANN and ANFIS are discussed below.
5.2.1. Artificial Neural Network (ANN)
The first artificial neural network (ANN) was designed in 1958 by psychologist Frank
Rosenblatt and he called this as ‘perceptron’. Artificial neural network (ANN) is a computational
model, which replicates the function of a biological network composed of neurons. ANN is often
used to model complex nonlinear functions in various applications. The basic unit in the ANN is
neuron. Neurons are connected to each other by links known as synapses. Andersen et al. (1990)
first applied ANN in welding area to predict weld bead shape during Gas Tungsten Arc welding
(GTAW) process (Andersen, Cook et al. 1990). A multilayer perceptron ANN system has three
layers which are input, hidden, and output layers. The input layer consists of all the input factors.
Information from input layer is next processed in the hidden layers, and then by output layer
(Figure 5.1). Details on the neural network modeling approach are given elsewhere (Zhang and
Friedrich 2003).
Figure 5.1: Schematic of artificial neural network (ANN) layers (two input variables, two hidden
layers with 3 nodes each, and one output)

117
Multilayer perceptron ANN can be learned using various algorithms; well-known learning
algorithms include back-propagation algorithm, counter-propagation algorithm, and genetic
algorithm. Back-propagation neural network had been widely used to model the welding
processes (Nagesh and Datta 2002); hence it is also adopted in this study. In building the model
input variables, training functions, and number of nodes in hidden layer were varied to obtain the
best model producing the lowest root- mean- square- error (RMSE) and mean- absolute-
percentage- error (MAPE). The MATLAB (R2012a) platform was used to train and test the
ANNs.
5.2.2. Adaptive Neuro-Fuzzy Inference System (ANFIS)
ANFIS constructs an input-output mapping based on human knowledge and generated
input-output data pairs by using a hybrid algorithm. According to Jang (Jang 1993), the ANFIS
is a neural network that is functionally the same as a Takagi-Sugeno-Kang (TSK) type inference
model (Takagi and Sugeno 1985). The TSK rules can be described as equation (5.1).
𝐼𝐹 (𝑥1 = 𝐴𝑖11 )𝑎𝑛𝑑 (𝑥2 = 𝐴𝑖2
2 ) 𝑎𝑛𝑑 … . 𝑎𝑛𝑑 (𝑥𝑛 = 𝐴𝑖𝑛𝑛 ) 𝑇𝐻𝐸𝑁 𝑦 = 𝑓(𝑥𝑗) (5.1)
Where, 𝑥𝑗 is the 𝑗𝑡ℎ input (𝑗 = 1, 2, … … . , 𝑛); 𝐴𝑖11 is the 𝑖𝑡ℎ linguistic term defined as a fuzzy
membership function on 𝑥𝑗 ; the mapping function 𝑓 could be linear, nonlinear, or simply a real
number (Liao 2003). Five distinct layers are used to explain the concept of ANFIS structure
(Jang 1993). The first layer is the fuzzification layer. In this layer the crisp inputs are
transformed into membership values by using the membership function at the node i. The output
can be stated as equation (5.2).
𝑂𝑖1 = 𝜇𝑥𝑖
(𝑥) (5.2)
Where, 𝜇𝑥𝑖 is the 𝑖𝑡ℎ membership function for the input 𝑥.

118
The second layer is the rule base layer. It calculates the firing strength for the next layer by
multiplying linguistic inputs (assuming “2”) to node i of this layer (equation (5.3)).
𝑂𝑖2 = 𝑤𝑖 = 𝜇𝑥𝑖
(𝑥) × 𝜇𝑦𝑖(𝑦) (5.3)
The third layer performs the normalization of membership values. The normalized firing strength
at node i of this layer is obtained using equation (5.4).
𝑂𝑖3 = 𝑤𝑖̅̅ ̅ = 𝑤𝑖/ ∑ 𝑤𝑗
𝐾𝑗=1 ; 𝑖 = 1, 2,3 … 𝐾 (5.4)
K denotes number of nodes in this layer, with each corresponding to a unique rule.
The fourth layer is the adaptive layer. The relation between inputs (assuming 2, i.e., x and y) and
output can be defined as equation (5.5).
𝑂𝑖4 = 𝑤𝑖̅̅ ̅ × 𝑝𝑖 = 𝑤𝑖̅̅ ̅ × (𝑠𝑖𝑥 + 𝑓𝑖𝑦 + 𝑛𝑖), (5.5)
Where parameters si, fi, ni of node i in this layer are called as consequent parameters.
The fifth layer is the de-fuzzification layer and the output is the final result of all fuzzy rules. The
results can be described as equation (5.6).
𝑂5 = ∑ 𝑤𝑖̅̅ ̅ × 𝑝𝑖𝐾𝑖=1 ; 𝑖 = 1, 2, … 𝐾 (5.6)
Where 𝑝𝑖 denotes the inferred output of the ANFIS rule i. Like neural network, in an ANFIS
structure, the inputs of each layer are obtained from the nodes of the previous layer. Considering
an ANFIS network with n inputs (𝑥1 … … 𝑥𝑛) and each input having 𝑚 membership functions
(MFs), the number of nodes (𝑁) in first layer is equal to the product of 𝑛 (as number of inputs)
and 𝑚 (as number MFs) (𝑁 = 𝑚. 𝑛). The number of nodes in other layers (layer 2–4) relates to
the number of fuzzy rules (𝑅). Figure 5.2 illustrates a typical ANFIS structure showing 5
different layers.

119
Figure 5.2: Schematic of ANFIS architecture for two inputs and two rules based on the First-
order Sugeno model (Jang 1993)
Construction of an ANFIS model requires the partition of the input-output data into rule
patches. This can be achieved by using three different clustering methods, i.e., grid partitioning,
subtractive clustering method, and fuzzy c-means (FCM) (Guillaume 2001). In the Matlab
FUZZY Toolbox, it is named as GENFIS1, GENFIS2, and GENFIS3. GENFIS1 produces grid
partitioning of the input space and GENFIS2 uses subtractive clustering to produce scattering
partition to define the membership functions. GENFIS3 uses fuzzy c-means (FCM) as a
mechanism to cluster the inputs. Apart from structure identification, a fuzzy interference system
has many other parameters that can also be optimized, i.e., membership-function parameters and
rule-consequent parameters (Guillaume 2001). Success in obtaining a reliable and robust model
depends heavily on the choice of the domain used for construction and training purposes.
Important factors that contribute to produce an accurate ANFIS model include type of fuzzy

120
based rule, number of MFs, and their MFs types. In this study, a first order TSK type fuzzy-
based rule is used for the creation of predictive models. Then, different types of MFs (triangular,
generalized bell, Gaussian, Gaussian combination (i.e. gauss2mf), and pi) with varying numbers
of MFs are applied to obtain the best model that produces the minimum root mean square error
(RMSE) and mean absolute percentage error (MAPE) by comparing experimental results.
5.2.3. Leave-One-Out Cross Validation (LOO-CV)
The leave-one-out cross-validation (LOO-CV) approach is a useful validation method for
small data set and it has been widely applied for model selection (Sheng, Xia et al. 2005). In this
technique one sample is left out and the remaining samples are utilized to build a model. If
𝑛 numbers of samples are available in a given data set, each model is trained with 𝑛 − 1 samples
and tested with the sample left out. This process repeated 𝑛 times until every sample in the data
set have been utilized once as a cross-validation instance. Finally, the root-mean-square-error
(𝑅𝑀𝑆𝐸) and mean-absolute-percentage-error (𝑀𝐴𝑃𝐸) are calculated using equations 5.7 and
5.8, respectively. The model with the minimum 𝑅𝑀𝑆𝐸 and 𝑀𝐴𝑃𝐸 is then selected (Dong and
Wang 2011).
RMSE = √1
𝑛∑ (𝑒𝑖 − 𝑎𝑖)2𝑛
𝑖=1 (5.7)
MAPE =1
n∑ ( ǀ𝑒𝑖 − 𝑎𝑖ǀ )/𝑒𝑖
𝑛𝑖=1 (5.8)
Where, 𝑛 total number of samples, 𝑒𝑖 is experimental output, and 𝑎𝑖 is ANFIS model predicted
output.
5.2.4. Experimental Data
As discussed is Chapter 4, a total of 66 FSW schedules (various combinations
of 𝑁, 𝑉, 𝑎𝑛𝑑 𝐹𝑧) are welded and tensile properties are obtained experimentally. From the

121
experimental analysis of weld process parameter and tensile strength of FSW joint, it was
concluded that all three critical process parameters (i.e. spindle rotational speed, welding speed,
and plunge force) act together to control the weld strength (See chapter 4). Weld process
parameters and corresponding average ultimate tensile strength (UTS) of 66- different weld
schedules are listed in Table 5.1.
Table 5.1: FSW process parameters and ultimate tensile strength of friction- stir- welded
AA2219-T87 aluminum alloy
SL
#
N
(rpm)
V
(mm/min)
Fz
(kN)
UTS
(MPa) SL #
N
(rpm)
V
(mm/min)
Fz
(kN)
UTS
(MPa)
1 300 152.40 24.47 310.24 34 400 228.60 26.69 353.71
2 200 152.40 33.36 323.31 35 300 152.40 21.13 288.12
3 350 76.20 15.57 331.68 36 350 152.40 17.79 172.95
4 350 152.40 22.24 362.08 37 350 152.40 15.57 166.63
5 300 152.40 22.24 339.66 38 200 152.40 26.69 283.38
6 350 266.70 30.25 356.36 39 300 203.20 21.13 178.06
7 350 236.98 26.69 359.96 40 300 203.20 24.47 279.81
8 350 118.62 19.57 347.61 41 300 152.40 20.02 279.06
9 350 88.90 16.46 333.45 42 300 203.20 22.24 315.00
10 300 228.60 30.25 326.33 43 300 203.20 20.02 237.74
11 200 152.40 31.14 313.99 44 350 152.40 17.79 153.50
12 350 88.90 15.57 326.84 45 200 152.40 27.58 267.75
13 300 152.40 26.69 324.83 46 300 101.60 16.01 167.38
14 350 76.20 14.46 320.25 47 350 76.20 12.46 157.56
15 350 76.20 16.68 324.41 48 300 76.20 14.23 176.95
16 350 76.20 14.01 337.38 49 300 101.60 17.79 192.24
17 300 130.56 24.47 333.74 50 200 203.20 33.36 268.33
18 300 101.60 22.24 335.62 51 250 168.91 26.69 293.75
19 300 76.20 17.79 320.65 52 200 135.38 26.69 267.32
20 400 101.60 17.79 337.37 53 300 152.40 33.36 292.16
21 400 77.98 15.57 327.46 54 350 152.40 28.91 317.89
22 350 88.90 17.79 343.43 55 300 101.60 24.47 309.77
23 350 152.40 22.24 352.29 56 350 88.90 22.24 306.69
24 400 76.20 15.57 340.99 57 350 76.20 21.35 295.15
25 400 76.20 13.34 330.69 58 350 152.40 26.69 314.44
26 250 76.20 20.91 311.93 59 350 88.90 20.02 315.53
27 300 203.20 31.14 343.12 60 450 152.40 33.36 260.17
28 300 203.20 33.36 347.34 61 450 152.40 28.91 290.59

122
29 300 228.60 33.36 346.34 62 450 152.40 35.59 211.72
30 300 203.20 26.69 328.14 63 400 228.60 33.36 341.18
31 300 228.60 35.59 335.09 64 225 152.40 37.81 320.40
32 400 228.60 24.47 347.44 65 350 76.20 17.79 314.44
33 300 228.60 31.14 354.05 66 300 76.20 22.24 322.09
5.2.5. Input Variables Utilized in ANFIS Model
To obtain an optimized ANFIS model, a total of four input variables were utilized in the
current investigation. The initial study started with the use of three critical process parameters
(𝑁, 𝑉, and 𝐹𝑧) as input variables and then another one input variable (i.e. empirical force index-
EFI) is introduced to build a better ANFIS model. The empirical force index (𝐸𝐹𝐼) is formulated
from the three critical process parameters (𝑁, 𝑉 𝑎𝑛𝑑 𝐹𝑧), as shown in equations (5.9 and 5.10).
𝑆𝑝𝑒𝑒𝑑 𝑟𝑎𝑡𝑖𝑜, 𝑅 = 2𝜋𝑟𝑁/𝑉 (5.9)
𝐸𝑚𝑝𝑖𝑟𝑖𝑐𝑎𝑙 𝐹𝑜𝑟𝑐𝑒 𝐼𝑛𝑑𝑒𝑥, 𝐸𝐹𝐼 =𝐹𝑧
𝐶1(𝑅)−𝐶2 (5.10)
Where, r is the pin-tool radius and 𝑅 is the dimensionless speed ratio. The Constant 𝐶1 and the
exponent 𝐶2 depend on materials to be welded, type of pin tool used, and the welding conditions
(e.g., clamping condition, chill bar, backing plate, environmental temperature conditions, etc.).
These constants C1 and C2 can be determined experimentally. In the current study, the values of
𝐶1and the exponent 𝐶2 are 256.93 and 0.56, respectively. Details relating to the significance of
dimensionless speed ratio R and empirical force index EFI are discussed in Chapter 4. The
empirical force index vs. experimental UTS plot is shown in Figure 5.3. It indicates that for EFI
values deviating from one there is a drop in UTS values observed. The drop is higher for lower
EFI values. A range of EFI values exist where high UTS can be obtained. The non-linear
behavior of process parameters and tensile strength makes it difficult to model the correlation
between process parameters and UTS.

123
Figure 5.3: Experimental transverse ultimate tensile strength (UTS) of Friction- stir- welded
aluminum alloy joints are plotted against empirical force index (EFI)
Now, the experimental investigation (see Chapter 4) indicates that all three critical process
parameters (𝑁, 𝑉, 𝐹𝑧) have direct influence on the UTS of FSW joints. It is desirable to obtain a
model that is able to accurately predict tensile strength for given FSW process parameters. In the
next section, details related to optimize adaptive neuro-fuzzy inference system (ANFIS) model
development utilizing experimental data listed in Table 5.1 is discussed.
5.3. Building a Better ANFIS Model to Predict Tensile Strength
A preliminary study was first made using exhaustive search technique to obtain the best
input parameters set. Before exhaustive search, all the 66- data instances were randomized and
divided into 40- training instances and 26- testing data instances. The same procedure was
repeated for four times utilizing the combination of two input variables out of 4- parameters. In
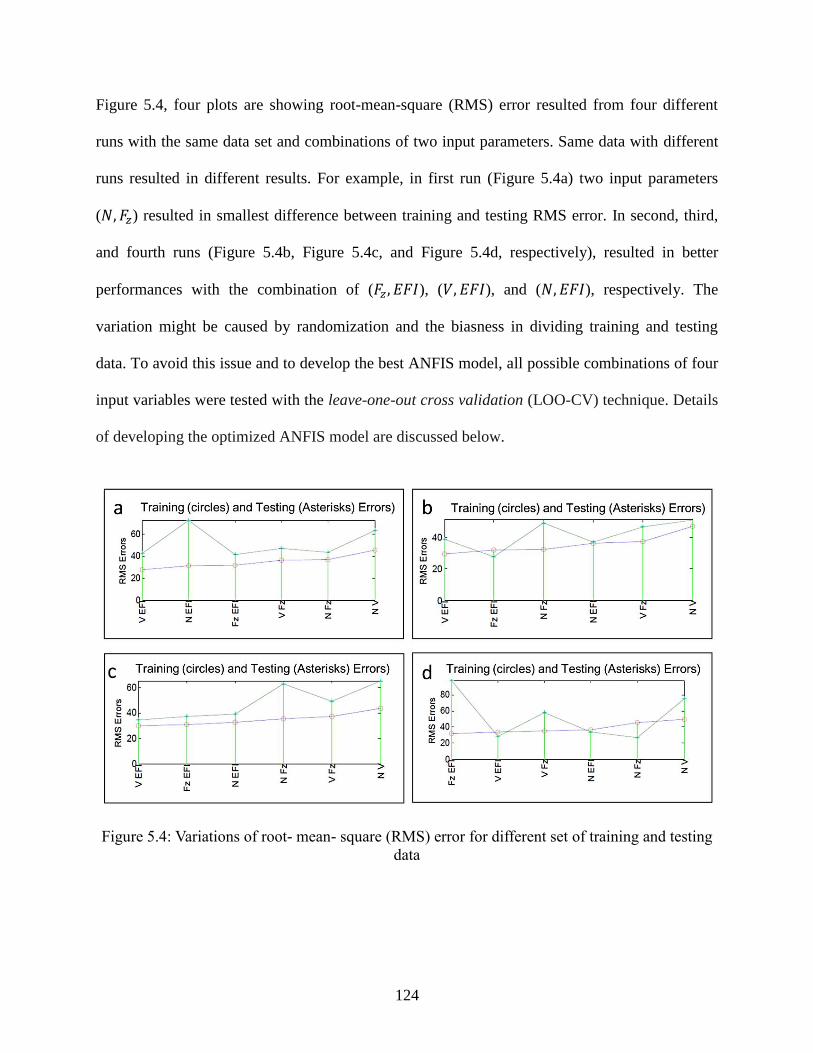
124
Figure 5.4, four plots are showing root-mean-square (RMS) error resulted from four different
runs with the same data set and combinations of two input parameters. Same data with different
runs resulted in different results. For example, in first run (Figure 5.4a) two input parameters
(𝑁, 𝐹𝑧) resulted in smallest difference between training and testing RMS error. In second, third,
and fourth runs (Figure 5.4b, Figure 5.4c, and Figure 5.4d, respectively), resulted in better
performances with the combination of (𝐹𝑧 , 𝐸𝐹𝐼), (𝑉, 𝐸𝐹𝐼), and (𝑁, 𝐸𝐹𝐼), respectively. The
variation might be caused by randomization and the biasness in dividing training and testing
data. To avoid this issue and to develop the best ANFIS model, all possible combinations of four
input variables were tested with the leave-one-out cross validation (LOO-CV) technique. Details
of developing the optimized ANFIS model are discussed below.
Figure 5.4: Variations of root- mean- square (RMS) error for different set of training and testing
data

125
5.3.1. ANFIS Model Utilizing 𝑵, 𝑽, 𝒂𝒏𝒅 𝑭𝒛
Initial modeling began with the three input variables: rotational speed (𝑁), welding speed
(𝑉), and plunge force (𝐹𝑧). Utilizing grid partitioning fuzzy interference system (𝐺𝐸𝑁𝐹𝐼𝑆1) with
different combinations of three input variables (N, V, Fz) and varied number and type of
membership functions (MFs) a total of 280 models were developed. Each model was related to a
particular membership function and number of membership function for each input variable.
Number of membership functions was varied from ‘1 to 3’ along with ‘5’ different types of
membership functions (i.e. trimf, gbellmf, gaussmf, gauss2mf, and pimf). In the ANFIS model,
at least one of the input variables ‘number of membership functions (# MFs)’ should be greater
than one. Therefore, the number of models can be defined as in equation (5.11).
𝑁𝑢𝑚𝑏𝑒𝑟 𝑜𝑓 𝑀𝑜𝑑𝑒𝑙𝑠 = [(𝑛)𝑖 × 𝑚 − 𝑚] × 𝑐 (5.11)
Where ‘n’ is the number of membership functions (n=3), ‘i’ denotes total number of input
variable utilized to build model, ‘m’ is the different types of MFs (m=5), and ‘c’ is the number of
combination of input variables. For example, 3 individual input variables ([N], or [V], or [Fz])
result in (3¹ × 5 – 5) × 3= 30 models. Similarly, 3 different combinations of two input variables
([N, V], or [N, Fz], or [V, Fz]) has results in (3² × 5 - 5) × 3= 120 models and 1 combination of
three input variables ([N, V, Fz]) has results in (3³ × 5 – 5) × 1= 130 models. Selected models
with different combinations of input variables, types and numbers of membership functions
associated with input variables are listed in Table 5.2. The ANFIS model with (1, 1, 2) Gaussian
membership functions for the three input variables (𝑁, 𝑉, 𝐹𝑧) results in the lowest RMSE (36.87
MPa) and MAPE (10.92 %) values.

126
Table 5.2: Results from ANFIS model developed utilizing different combinations of three input
variables (𝑁, 𝑉, 𝐹𝑧) along with types and numbers of membership functions associated with input
variables
Number of 'MF'
N V Fz Type of 'MF' RMSE (MPa) MAPE (%)
3 - - trimf 50.74 14.70
- 2 - pimf 50.80 15.17
- - 2 pimf 51.60 15.99
3 1 pimf 50.40 14.65
- 2 2 gbellmf 43.29 12.45
- 1 3 gaussmf 45.56 13.67
1 1 2 gaussmf 36.87 10.92
Figure 5.5: Experimental and ANFIS model predicted UTS plotted for best the model developed
utilizing three input variables (𝑁, 𝑉, 𝐹𝑧)
Based on the LOO-CV technique, a total of 66 data pairs of actual experimental outputs and
ANFIS predicted outputs were obtained for each model. In Figure 5.5 shown below, the ANFIS
127
predicted and experimental UTS values are plotted for the best ANFIS model developed using
three input variables. If the actual experimental and ANFIS predicted UTS values match
perfectly, then all points should follow the diagonal line.
5.3.2. ANFIS Model Utilizing 𝑵, 𝑽, 𝑭𝒛, 𝒂𝒏𝒅 𝑬𝑭𝑰
Now, empirical force index (EFI) is added as an input variable along with the three
process parameters (𝑁, 𝑉, 𝐹𝑧). A total of 920 models were developed utilizing different
combinations of the four input variables (𝑁, 𝑉, 𝐹𝑧 , 𝐸𝐹𝐼) taking EFI in common, along with
varying number and type of membership functions. With different number and type of
membership functions, 1 individual input variable ([EFI]) results in (3¹ × 5 – 5) × 1= 10 models.
Similarly 3 different combinations of two input variables ([N, EFI],or [V, EFI], or [Fz, EFI])
results in (3² × 5 - 5) × 3= 120 models, 3 different combination of three input variables ([N, V,
EFI], [V, Fz, EFI], [V, Fz, EFI]) results in (3³ × 5 – 5) × 3= 390 models, and 1 combination of
four input variables ([N, V, Fz, EFI]) results in (34 × 5 – 5) × 1= 400 models. As mentioned
earlier, each model is related to a particular membership function (i.e. trimf, gbellmf, gaussmf,
gauss2mf, pimf) and number of membership function (i.e. 1 to 3) for each input variable.
Selected models with low RMSE and MAPE values are listed in Table 5.3. It is interesting to
observe that the ANFIS model developed utilizing only EFI as the input variable results in lower
RMSE (36.51 MPa) and MAPE (9.90 %) values compared to the best model developed with 3
input variables without incorporating EFI (Table 5.2). In the current investigation, ANFIS
models were developed based on first order TSK inference model. The highly nonlinear behavior
between weld process parameters and UTS might result in higher RMSE and MAPE values in
model developed without EFI. In EFI, weld process parameters are non-linearly related; this non-

128
linear relation might be the reason for lower RMSE and MAPE values in ANFIS model
developed utilizing EFI.
Table 5.3: Results from ANFIS model developed utilizing four input variables (𝑁, 𝑉, 𝐹𝑧 , 𝐸𝐹𝐼)
Number of 'mf'
N V Fz EI Type of 'mf' RMSE (MPa) MAPE (%)
3 gaussmf 36.51 9.90
1 4 gauss2mf 34.76 9.34
2 3 pimf 30.84 8.28
2 3 pimf 31.82 8.78
1 2 3 pimf 31.02 7.96
1 2 3 pimf 31.86 7.87
2 1 3 pimf 29.70 7.75
1 1 2 3 pimf 30.68 7.81
Figure 5.6: Experimental and ANFIS model predicted UTS plotted for the best model developed
utilizing three input variables (𝑉, 𝐹𝑧 , 𝐸𝐹𝐼)

129
Nevertheless, EFI incorporated with other input variables was found to obtain the lowest
RMSE and MAPE values. Specifically, the ANFIS model with (2, 1, 3) - membership functions
for 𝑉, 𝐹𝑧 , 𝑎𝑛𝑑 𝐸𝐹𝐼 results in lowest RMSE (29.7 MPa) and MAPE (7.7%) values. Similarly, the
experimental and ANFIS model predicted UTS values are plotted in Figure 5.6 where, a lesser
amount of scattering is observed as compared to Figure 5.5. Lower scattering indicates a better
model with lower RMSE and MAPE values; however, there are discrepancies observed between
predicted and actual UTS data. The discrepancies might be related to the large variations in
experimental UTS values produced by different weld schedules. Taking defect-free nominal
welds as examples, UTS values vary from 310 to 360 MPa with a standard deviation of 13 MPa.
5.3.3. Optimized ANFIS Model and Surface Plot
In previous sections, GENFIS1 structure was applied and optimized by varying combinations of
input variables, number, and type of membership functions. As mentioned before, GENFIS1
produces grid partitioning of the input space. To investigate performances, the other two
partitioning methods for generating initial fuzzy inference system, namely GENFIS2 and
GENFIS3, were utilized for modeling (also available in the MATLAB fuzzy toolbox). For both
GENFIS2 and GENFIS3, the leave-one-out cross-validation (LOO-CV) technique was also
applied as in GENFIS1. Using the GENFIS2 structure, optimized ANFIS model was developed
by varying two parameters, namely ‘radii’, ‘epoch number’, and number of input variables
(𝑁, 𝑉, 𝐹𝑧 , 𝑎𝑛𝑑 𝐸𝐹𝐼). The ANFIS model with 𝑉, 𝐹𝑧 , 𝑎𝑛𝑑 𝐸𝐹𝐼 as input variables and 'radii = 0.5'
‘epoch=20’ produces the lowest RMSE (38.40 MPa) and MAPE (10.06%). In the case of
GENFIS3, number of input variables, ‘number of a clusters’ and ‘epoch number’ were varied in
the process to obtain the best ANFIS model. Using GENFIS3, the ANFIS model with
𝑉, 𝐹𝑧 , 𝑎𝑛𝑑 𝐸𝐹𝐼 as input variables and ‘number of clusters=4’ and ‘epoch numbers = 20’ has the

130
lowest RMSE (38.71 MPa) and MAPE (10.28 %). In summary, the ANFIS model generated with
the GENFIS1 structure using three input variables (𝑉, 𝐹𝑧 , 𝑎𝑛𝑑 𝐸𝐹𝐼) results in the lowest RMSE
(29.7 MPa) and MAPE (7.7%) values.
For validation of the developed ANFIS model, 6 schedules were experimented having different
spindle speed (N), welding speed (V), and plunge force (Fz). Tensile strength for these tests were
obtained and compared to the ANFIS model. Welding process parameters along with
experimental and ANFIS predicted UTS are listed in Table 5.4. ANFIS predicted UTS values are
comparable with the experimental data. The details of the best ANFIS model are given in Table
5.5.
Table 5.4: Comparison between experimental and ANFIS predicted UTS
Schedule N
(RPM)
V
(mm/min)
Fz
(kN) EFI
Experimental
UTS (MPa)
ANFIS predicted
UTS (MPa)
1 250 228.60 36.48 1.04 336.69 341.08
2 250 228.60 40.03 1.14 346.47 344.09
3 250 203.20 28.91 0.88 285.38 286.29
4 400 203.20 20.91 0.83 314.92 317.86
5 400 203.20 23.58 0.94 357.46 349.02
6 400 203.20 26.69 1.06 348.17 340.16
Table 5.5: Basic details of the best ANFIS model to predict UTS from FSW process parameters
Type of Inference: Sugeno (If x is 𝑀𝐹𝑥, y is 𝑀𝐹𝑦, and z is 𝑀𝐹𝑧, then output w=f(x,y,z))
Number of inputs =3 [(x, y, z)=(V, Fz, EFI)]; Number of output = 1 [w=UTS]
Number of input MFs for [𝑥, 𝑦, 𝑧] =[2,1,3]; Consequent Output: 6 [𝑤1, 𝑤2, 𝑤3, 𝑤4, 𝑤5, 𝑤6]
Number of Rules = 6
1. If (x is 𝑀𝐹1𝑥) and (y is 𝑀𝐹1𝑦) and (z is 𝑀𝐹1𝑧) then (w is 𝑤1)
2. If (x is 𝑀𝐹1𝑥) and (y is 𝑀𝐹1𝑦) and (z is 𝑀𝐹2𝑧) then (w is 𝑤2)
3. If (x is 𝑀𝐹1𝑥) and (y is 𝑀𝐹1𝑦) and (z is 𝑀𝐹3𝑧) then (w is 𝑤3)
4. If (x is 𝑀𝐹2𝑥) and (y is 𝑀𝐹1𝑦) and (z is 𝑀𝐹1𝑧) then (w is 𝑤4)
5. If (x is 𝑀𝐹2𝑥) and (y is 𝑀𝐹1𝑦) and (z is 𝑀𝐹2𝑧) then (w is 𝑤5)
6. If (x is 𝑀𝐹2𝑥) and (y is 𝑀𝐹1𝑦) and (z is 𝑀𝐹3𝑧) then (w is 𝑤6)
Input1 Range : V= [76.2 266.7]
Input2 Range : Fz = [12.46 37.81]

131
Input3 Range: EFI= [0.674 1.774]
Output Range : UTS= [157.6 360]
Input MF Types: pimf (𝜑 (𝑥; 𝑎, 𝑏, 𝑐, 𝑑)) = { 0, 𝑥 ≤ 𝑎
2(𝑥−𝑎
𝑏−𝑎)2 ; 𝑎 ≤ 𝑥 ≤
𝑎+𝑏
2
1-2× (𝑥−𝑏
𝑏−𝑎)2 ;
𝑎+𝑏
2≤ 𝑥 ≤ 𝑏
1-2(𝑥−𝑐
𝑑−𝑐)2 ; 𝑐 ≤ 𝑥 ≤
𝑐+𝑑
2
2(𝑥−𝑑
𝑑−𝑐)2 ;
𝑐+𝑑
2≤ 𝑥 ≤ 𝑑
0, 𝑥 ≥ 𝑑 }
1𝑠𝑡 𝑀𝐹 parameter of x, 𝑀𝐹1𝑥 [𝑎, 𝑏, 𝑐, 𝑑] = [-57.15 19.05 133.3 209.5]
2𝑛𝑑 𝑀𝐹 parameter of x, 𝑀𝐹2𝑥 [𝑎, 𝑏, 𝑐, 𝑑] = [133.3 209.5 323.9 400.1]
1𝑠𝑡 𝑀𝐹 parameter of y, 𝑀𝐹1𝑦 [𝑎, 𝑏, 𝑐, 𝑑] = [-Inf -Inf Inf Inf]
1𝑠𝑡 𝑀𝐹 parameter of z, 𝑀𝐹1𝑧 [𝑎, 𝑏, 𝑐, 𝑑] = [0.29 0.51 0.82 1.03]
2𝑛𝑑 𝑀𝐹 parameter of z, 𝑀𝐹2𝑧 [𝑎, 𝑏, 𝑐, 𝑑] = [0.83 1.04 1.39 1.61]
3𝑟𝑑 𝑀𝐹 parameter of z, 𝑀𝐹3𝑧 [𝑎, 𝑏, 𝑐, 𝑑] = [1.39 1.61 1.93 2.16]
Output parameters: w= 𝑓(𝑥, 𝑦, 𝑧) = 𝑎0 + 𝑎1𝑥 + 𝑎2𝑦 + 𝑎3𝑧Output parameters of rule 1: [𝑤1: 𝑎0, 𝑎1, 𝑎2, 𝑎3] = [2.46 -11.65 1293 -919.2]
Output Parameters of rule 2: [ 𝑤2: 𝑎0, 𝑎1, 𝑎2, 𝑎3] = [-0.0089 -0.86 -49.18 395.41]
Output parameters of rule 3: [𝑤3: 𝑎0, 𝑎1, 𝑎2, 𝑎3] = [6.39 -20.59 -1.079 0.041]
Output parameters of rule 4: [𝑤4: 𝑎0, 𝑎1, 𝑎2, 𝑎3] = [1.05 -9.21 661.8 -252]
Output parameters of rule 5: [𝑤5: 𝑎0, 𝑎1, 𝑎2, 𝑎3] = [0.22 1.25 9.61 243.9]
Output parameters of rule 6: [𝑤6: 𝑎0, 𝑎1, 𝑎2, 𝑎3] = [0.91 -2.93 -0.15 0.0059]
Finally, ANFIS predicted UTS values are plotted in a surface plot as shown in Figure
5.7for the model generated utilizing two input variables (V and EFI). For a particular weld speed
(V), a range of empirical force indexes (EFI) exist where higher UTS values can be obtained.
Higher UTS values are related to defect-free nominal welds. Lower and higher EFI values,
deviating more from one, result in lower UTS values, which are related to cold and hot welds
containing weld defects as also shown in Figure 5.3. The surface plot is helpful to visualize
required welding process parameters to achieve certain tensile strength.

132
Figure 5.7: Surface plot showing ANFIS predicted ultimate tensile strength (UTS). Model
generated utilizing welding speed (𝑉) and empirical force index (EFI) as input variables
5.4. ANN (Artificial Neural Network) Modeling and Validation
In ANN model construction a preliminary analysis was carried out by using all 4 input
variables (𝑁, 𝑉, 𝐹𝑧 , 𝐸𝐹𝐼) and dividing the 66 data sets into training (40 data), testing (13 data),
and validation (13 data) sets. Before partitioning, the data was randomized. For the same data set
and same ANN structure (4-10-1), different runs resulted in different results. To avoid the
variation, the LOO-CV approach was utilized to build ANN models, similar to building ANFIS
models. Initially, all 4 data input variables (𝑁, 𝑉, 𝐹𝑧 , 𝐸𝐹𝐼) were utilized along with different
network training functions (i.e. Levenberg-Marquardt back propagation, quasi-Newton back
propagation, and gradient descent with adaptive back propagation) in a MATLAB (R2012a)

133
platform to obtain lowest RMSE and MAPE. It was found that Levenberg-Marquardt back
propagation network training function produced best performance. Thereafter, different
combinations of input variables were utilized with single hidden layer and 10 nodes in the hidden
layer. For each case, the program was repeated for 6 times and average RMSE and MAPE values
were calculated (Table 5.6).
Table 5.6: RMSE and MAPE values for different combination of input variables (Number of
hidden layer=1; Number of nodes in hidden layer = 10; Training function= Levenberg-
Marquardt back propagation)
Input Parameters RMSE MAPE
N V Fz EI (MPa) (%)
✓ ✓ ✓ ✓ 41.03 12.38
✓ ✓ ✓ 38.28 10.64
✓ ✓ ✓ 46.36 12.9
✓ ✓ ✓ 42.27 11.61
✓ ✓ ✓ 38.87 10.85
✓ ✓ 61.79 17.39
✓ ✓ ✓ 52.52 15.18
✓ ✓ 45.62 12.59
✓ ✓ 56.85 16.05
✓ ✓ 43.5 11.57
✓ ✓ 43.31 11.95
✓ 49.68 13
✓ 68.71 19.14
✓ 57.14 16.46
✓ 53.35 15.66
Similar to ANFIS model, the ANN model (i.e. ANN structure: 3-10-1) based on the following
three input variables (𝑉, 𝐹𝑧 , 𝑎𝑛𝑑 𝐸𝐹𝐼) has resulted in lowest RMSE (38.28 MPa) and MAPE
(10.64 %) values. For further optimization, the number of nodes in the hidden layer was varied
from 3 to 15 to obtain the best model with three input variables (𝑉, 𝐹𝑧 , 𝑎𝑛𝑑 𝐸𝐹𝐼). For each case,
the program was run 6 times to obtain average RMSE and MAPE values. It was found that 5

134
nodes in the hidden layer (i.e. ANN structure: 3-5-1) resulted in best performance (RMSE=36.70
MPa, MAPE = 10.09%). The basic details of the best ANN model is listed in Table 5.7.
Table 5.7: Basic details of the ANN model with lowest RMSE and MAPE
ANN Model
Network Configuration 3-5-1
Number of input nodes 3 (V, Fz, EFI)
Number of output nodes 1 (UTS)
Number of hidden layer 1
Number of hidden nodes 10
Number of epoch 100
Learning factor (Mu) 0.001
Training function Levenberg-Marquardt back propagation
5.5. Summary
For a particular FSW condition, three critical process parameters (i.e. 𝑁, 𝑉, 𝐹𝑧) are
considered as key factors in the determination of quality of FSW joints. From experimental
investigations, it was observed that all three critical process parameters (𝑁, 𝑉, 𝐹𝑧) have direct
influence on ultimate tensile strength (UTS). But non-linear behavior of weld process parameters
makes it complex to develop a model to predict UTS of FSW joint. Utilizing experimental data,
an optimized adaptive neuro-fuzzy inference system (ANFIS) model has been developed to
predict tensile strength of FSW joint. The optimization process involves testing different
combination of four input variables (rotational speed, welding speed, plunge force, and empirical
force index) and varying ANFIS parameters to obtain a model with minimum error (RMSE and
MAPE). For comparison, the artificial neural network (ANN) approach was also utilized to
develop a fairly optimal model using the same experimental data set. The following summaries
and observations can be made:
For the limited number of experimental data set (66 data points), the leave-one-out cross-
validation (LOO-CV) approach was utilized for both ANFIS and ANN model generation
135
and cross validation. Using the LOO-CV approach every experimental data point was
cross validated and biasness aroused in dividing training and testing data set was avoided.
LOO-CV also allows to obtain the predicted UTS value for every experimental data point
and to calculate mean absolute percentage error (MAPE) easily.
To develop the ANFIS and ANN models, four input variables (𝑁, 𝑉, 𝐹𝑧 , 𝑎𝑛𝑑 𝐸𝐹𝐼) were
utilized and optimized. Among the four input variables, Empirical Force Index (EFI) was
observed to have stronger correlation with UTS compared to other parameters. EFI was
formulated from experimental investigations and found to be non-linearly correlated with
the three critical process parameters (𝑁, 𝑉, 𝐹𝑧).
A total of 1200 different ANFIS models were developed by varying number of
membership functions (MFs), type of membership function, and combination of four
input variables (𝑁, 𝑉, 𝐹𝑧 , 𝐸𝐹𝐼). It was found that the ANFIS model with three input
variables (𝑉, 𝐹𝑧 , 𝑎𝑛𝑑 𝐸𝐹𝐼) resulted in lowest RMSE and MAPE values of 29.7 MPa and
7.7%, respectively.
The ANN model with the three input variables (𝑉, 𝐹𝑧 , 𝑎𝑛𝑑 𝐸𝐹𝐼) also resulted in minimum
RMSE (36.7 MPa) and MAPE (10.09 %); however, error of the best ANN model is larger
than those of the optimized ANFIS model.
The developed best ANFIS model can be applied to select weld process parameters to
achieve desirable joint strength.
The fixed pin configuration for pin-tool has been used throughout this study. In the future,
the effect of pin-tool design can also be incorporated into the model to make the model more
robust. To this end, far more data is needed.

136
CHAPTER 6 : EFFECTS OF POST- WELD HEAT TREATMENT (PWHT)
ON FRICTION- STIR- WELDED AA2219-T87 JOINTS
6. Introduction
Effects of weld process parameters on the quality of friction-stir (FS) welded high
strength aluminum alloy (AA2219-T87) joints are discussed in the last two chapters (Chapters 4
and 5). Friction-stir-welding (FSW) offers better performances on aluminum alloy joints
compared to conventional fusion welding techniques. However plastic deformation, visco-plastic
flow of metals, and complex heating cycles during FSW process (Nandan, Roy et al. 2007)
results in dissolution of alloying elements, intrinsic microstructural changes, and post-weld
residual stresses development in the weld joints. Therefore, precipitate strengthened aluminum
alloys show lower mechanical properties in the weld and heat-affected-zone (Cabibbo, Meccia et
al. 2003; Aydın, Bayram et al. 2009). In the current investigation, an average 30% reduction in
the transverse ultimate tensile strength (UTS) and 60% reduction in yield strength (YS) were
observed in as-welded (AW) specimen as compared to base metal specimens. Post-weld heat
treatment (PWHT) is a common practice to refine grain-coarsened microstructures (Peng, Shen
et al. 2013), remove or redistribute post-weld residual stresses (Cho, Lee et al. 2004), and
improve mechanical properties of heat-treatable welded aluminum alloys by precipitation
hardening. In this chapter, the effect of PWHT on the tensile properties along with micro-
hardness, fracture, and microstructural behaviors of FS- welded AA2219-T87 joints are
discussed.
6.1. Scope
Friction-stir-welding (FSW) is an innovative solid-state welding process in which the
metal to be welded is not melt during the welding process. Thus the cracking and porosity often
137
associated with fusion arc welding of high strength aluminum alloys are eliminated by utilizing
FSW process (Knipstrom and Pekkari 1997). However, some studies (Mahoney, Rhodes et al.
1998; Campbell and Stotler 1999; Liu, Fujii et al. 2003) on the microstructural characteristics
and mechanical properties of the friction-stir-welded joints have indicated that FSW gives rise to
softening of the heat-treatable high strength aluminum alloys joint because of the dissolution or
segregation of strengthening precipitates during the welding thermal cycle. The softening might
result in the degradation of mechanical properties of the weld joints. In literature, it is showed
that the tensile strength of FS- welded heat treatable aluminum alloy joints varied from 60% to
70% of that of base metal (Elangovan and Balasubramanian 2007; Babu, Elangovan et al. 2009;
Moreira, Santos et al. 2009). Yield strength (YS) reduction is even more severe (i.e. about 60%
reduction in YS was observed for defect free FS- welded AA2219-T87 joints). Post-weld heat
treatment is commonly utilized to remove residual stresses and improve strength of heat treatable
aluminum alloy joints by precipitation hardening.
Liu and his research group (Liu, Chen et al. 2006) employed artificial age-hardening (165
°C for 18h) on FS- welded AA2219-T6 to determine the effects of PWHT on tensile properties.
It was shown that the PWHT sample exhibits 89% tensile strength of the base material. In
another study (Chen, Liu et al. 2006), they studied the effect of PWHT conducted on FS-welded
AA2219. Their PWHT involves solution-treatment at 535 °C for 32 min, followed by quenching
at 25 °C and artificial aging at 165 °C for 18h. They showed that the PWHT increases tensile
strength of FS-weld joint. Few study reported on the effect of PWHT on fusion arc welded
AA2219-T87 joints (Malarvizhi, Raghukandan et al. 2008; Zhu, Deng et al. 2015). In
(Malarvizhi and Balasubramanian 2011), showed that the post weld heat treated (AH-175°C-

138
12h) specimens has contains more amount of precipitates than that of AW joints and results in
higher tensile properties of different weld joints.
Different welding joints and different tempered materials require different PWHT
condition. On the other hand, improved mechanical properties of weld joints are closely related
to structural integrity of weld joints. High strength and light weight AA2219-T87 extensively
utilized in aerospace industries. Although AA2219 aluminum alloy is demonstrated to have
better weldability than other series of age- hardenable aluminum alloys; it suffers from a
significant reducing of joint strength. No study reported on the comprehensive study of PWHT
on FS-welded aerospace grade high strength AA2219-T87 joints. Thus, in the current study an
optimized PWHT condition is obtained to improve mechanical properties of FSW AA2219-T87
joints.
6.2. Post-Weld Heat Treatment (PWHT) Process
There are different types of PWHT techniques are utilized for different aluminum alloys
joint. Two common practices for welded aluminum alloys are artificial age-hardening (AH) and
solution-treatment followed by age- hardening (STAH). In this study, FS-welded and defect free
AA2219-T87 aluminum alloy plate was used for PWHT. For the base metal, T87 stands for
solution treatment at 535°C followed by age-hardening at 163-191°C for 18 to 36 hours (ASM-
International 1990). To study the effect of artificial age-hardening (AH), welded and defect-free
tensile test specimens were placed into conventional oven at 170 °C and aging-time was varied
from 5 to 18 hours followed by air cooling at room temperature. For Solution-Treatment (ST),
as-welded specimens were placed into conventional oven at 540 °C for 1.0 hour followed by
quenching into water (20 °C). Subsequently, the effect of artificial AH was investigated on ST-
samples to obtain peak aging time. In current study, aging temperature was kept constant at 170
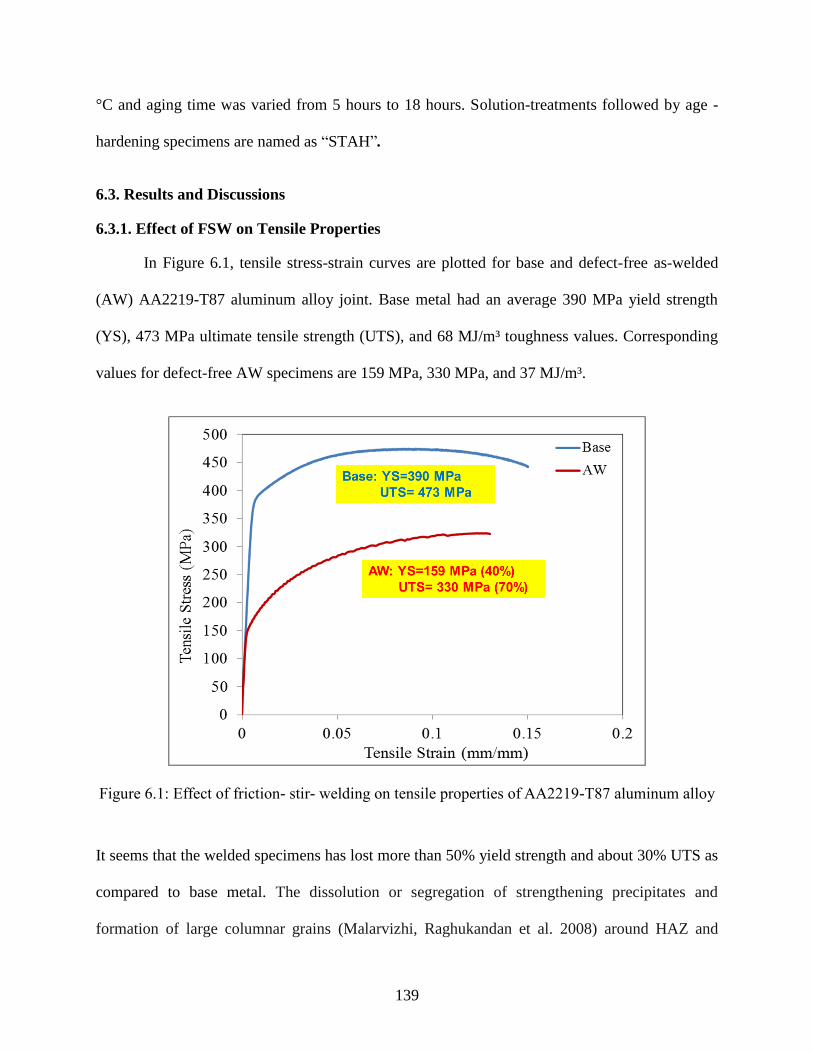
139
°C and aging time was varied from 5 hours to 18 hours. Solution-treatments followed by age -
hardening specimens are named as “STAH”.
6.3. Results and Discussions
6.3.1. Effect of FSW on Tensile Properties
In Figure 6.1, tensile stress-strain curves are plotted for base and defect-free as-welded
(AW) AA2219-T87 aluminum alloy joint. Base metal had an average 390 MPa yield strength
(YS), 473 MPa ultimate tensile strength (UTS), and 68 MJ/m³ toughness values. Corresponding
values for defect-free AW specimens are 159 MPa, 330 MPa, and 37 MJ/m³.
Figure 6.1: Effect of friction- stir- welding on tensile properties of AA2219-T87 aluminum alloy
It seems that the welded specimens has lost more than 50% yield strength and about 30% UTS as
compared to base metal. The dissolution or segregation of strengthening precipitates and
formation of large columnar grains (Malarvizhi, Raghukandan et al. 2008) around HAZ and

140
TMAZ areas during the welding thermal cycle are the main reasons for tensile properties
reduction of FS- welded aluminum alloy joint.
Post-weld heat treatment (PWHT) techniques are commonly applied to improve tensile
properties of FS-welded joints. Effects of PWHT techniques are discussed in sections below.
6.3.2. Effect of PWHT on Tensile Properties
Initially, the effect of only artificial age-hardening (AH) was analyzed. A tensile stress-
strain plot with varying age-hardening period (5h, 10h, and 18h) is shown in Figure 6.2.
Artificial age-hardening (AH) resulted in higher yield strength (YS) and ultimate tensile strength
(UTS) values as compared to as-welded (AW) specimens. In an average 20% improvement in
YS and 6% improvement in UTS was observed in specimens with age-hardening at 170 °C for
18 hours (AH-170°C-18h). However, about 12% reduction in toughness value was observed in
AH-170°C-18h specimens. Artificial age- hardening helps in the precipitation of super-saturated
alloying elements along the grain boundaries and results in higher tensile strength. But it cannot
help in the microstructure rearrangements or residual stress removal (Dewan, Wahab et al. 2015).
On the other hand, longer precipitation period results in lower ductility as well as toughness
value of the heat treated specimens. In general, the tensile properties of FS-welded AA2219-T87
aluminum alloy joints can be recovered up to a certain limit utilizing only AH. To achieve full
benefits PWHT, solution-treatment followed by artificial age- hardening (STAH) was performed.
Effect of STAH heat treatments are discussed below.

141
Figure 6.2: Effect of artificial age-hardening (AH) on tensile properties of FSW AA2219-T87
joint
Tensile stress-strain curves for as-welded (AW) and STAH specimens are shown in Figure 6.3.
Only solution-treated (ST) specimens showed lower YS, UTS, and toughness values as
compared to as-welded (AW) specimens. The lower tensile properties might be related to the
formation of super-saturated solid solution (SSSS) of alloying elements during ST process. AH
after solution-treatment helps in the formation of precipitation around the grain boundaries and
results in strengthening the welded specimens. STAH-170°C-18h treated specimens exhibited
about 77% joint efficiency based on YS and 79% joint efficiency based on UTS of base metal
specimens. Corresponding values for as-welded specimens were only 40% and 70% (Table 6.1).
However, STAH-170 °C-18h treated specimens showed about 40% lower joint efficiency based

142
on tensile toughness value of as-welded (AW) specimens. Longer aging time usually results in
over precipitation as well as precipitation-free zone (Krishnan 2002) which is related to reduced
ductility of aluminum alloys joint. Therefore, optimum aging period is important to achieve
better mechanical properties. For FS- welded AA2219-T87 peak aging time was 5 hours at
170°C. The STAH-170°C-5h treated specimens showed about 78% JE (joint efficiency) based on
UTS, 61% JE based on yield strength, and 35% JE based on tensile toughness values of base
metal. The summary of tensile test results with different post-weld heat treatments are listed in
Table 6.1.
Figure 6.3: Effect of solution-treatment followed by age-hardening (STAH) on tensile properties
of FS-welded AA2219-T87 joint

143
Table 6.1: The summary of tensile test results with different post- weld heat treatments for FS-
welded AA2219-T87 joint
Specimens YS, MPa UTS, MPa Toughness
MJ/m³
JE (%),
YS
JE (%),
UTS
JE (%),
Toughness
Base 390.7 ± 2.9 473.2 ± 0.9 67.7 ± 2.1 100 100 100
AW 159 ± 3.6 330.1 ± 5.6 37.4 ± 1.6 40.6 69.7 55.2
AH-5h 188.3 ± 10 337.7 ± 6.8 28.2 ± 1.9 48.1 71.3 41.7
AH-10h 219.3 ± 11 337.2 ± 2.4 22.4 ± 2.7 56.1 71.2 33.1
AH-18h 231.5 ± 8.5 355.6 ± 5.2 22.7 ± 3.5 59.2 75.1 33.6
ST 151.6 ± 10 313.8 ± 8.3 25.4 ± 5.8 38.8 66.3 41.5
STAH-5h 239.1 ± 6.8 370.4 ± 12 23.9 ± 4.4 61.2 78.2 35.2
STAH-10h 285.5 ± 12 371.5 ± 12 13.9 ± 3.2 73.1 78.5 20.5
STAH-18h 301.2 ± 9.3 375.3 ± 8.9 10.3 ± 3.9 77.1 79.3 15.2
6.3.3. Effect of PWHT on Fracture Surfaces of Tensile Tested Specimens
Fractographs analysis is essential to understand the variations of tensile test results in
welded and post-weld heat treated (PWHT) specimens. Fracture surfaces of the tensile tested
specimens were examined under scanning electron microscope (SEM). SEM fractographs of as-
welded (AW) and PWHT specimens (AH-18h and STAH-18h) are shown in Figure 6.4(a, b, c).
The SEM images were taken at the center of the failure surface. The fractographs indicate that all
the surfaces invariably consist of dimples, which is a typical indication that most of the failure
occurred due to ductile fracture. This interpretation was in good agreement with the work
reported by several earlier researchers (Malarvizhi and Balasubramanian 2012; Rajakumar and
Balasubramanian 2012; Zhu, Deng et al. 2015). During tensile testing of ductile materials, voids
are formed prior to necking. If the necking in the specimens is formed earlier, the void formation
would be much more prominent; and as a result, coarse and elongated dimples can be seen.
Typically larger and elongated dimples are related to higher ductility and lower tensile strength
of tensile test specimens. Conversely, smaller dimples are related to lower ductility and higher

144
tensile strength. Defect-free as-welded (AW) and only age-hardened (AH-18h) specimens failed
near TMAZ due to the presence of inhomogeneous and grain-coarsened structure. This is also
related to lowest hardness values at TMAZ of AW and AH-18h specimens. On the other hand,
STAH-18h specimens failed near the interface of weld nugget and TMAZ area. The STAH-18h
sample contains a large number of fine dimples, which are related to higher tensile strength of
STAH samples. The shiny and thick grain boundaries were also observed in STAH-18h sample.
The thick grain boundary is associated with the formation of precipitate-free zone (Krishnan
2002) and generally responsible for lower ductility as well as lower tensile toughness value.
Figure 6.4: SEM fractographs of FS- welded and post- weld heat treated AA2219-T87 joints: (a)
as-welded (AW), (b) age-hardened at 170°C for 18h (AH-18h), and (c) solution-treatment
followed by age-hardened at 170°C for 18h (STAH-18h)
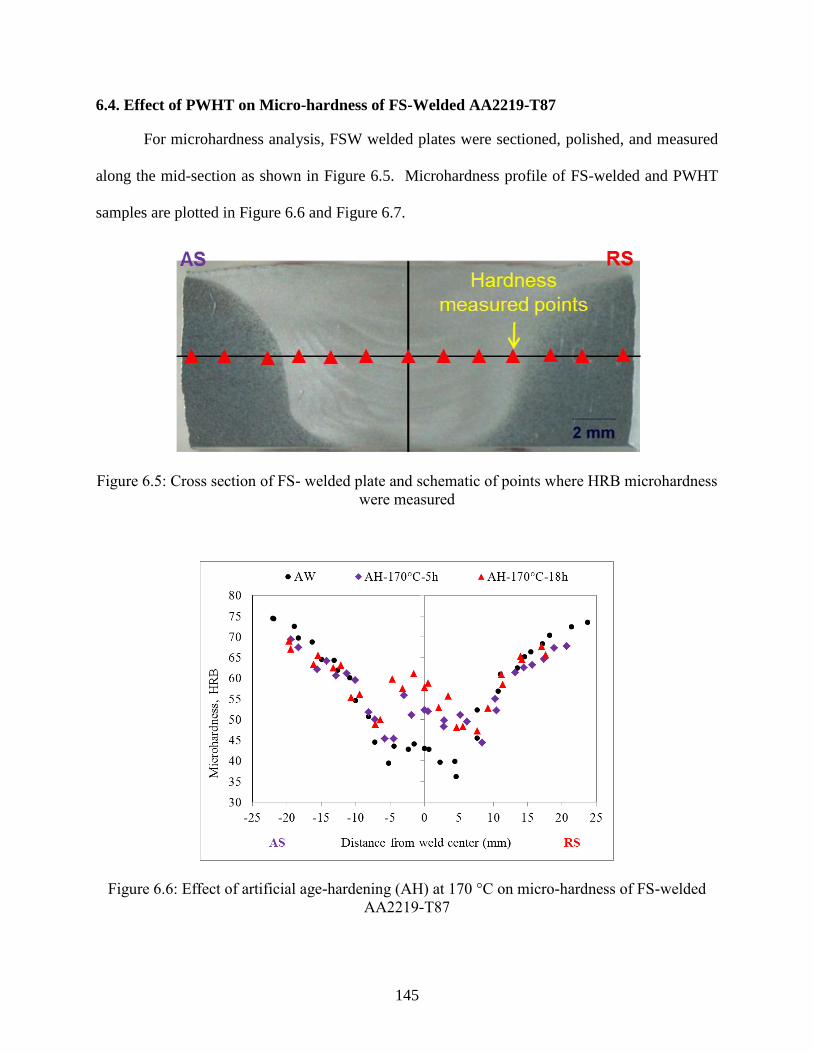
145
6.4. Effect of PWHT on Micro-hardness of FS-Welded AA2219-T87
For microhardness analysis, FSW welded plates were sectioned, polished, and measured
along the mid-section as shown in Figure 6.5. Microhardness profile of FS-welded and PWHT
samples are plotted in Figure 6.6 and Figure 6.7.
Figure 6.5: Cross section of FS- welded plate and schematic of points where HRB microhardness
were measured
Figure 6.6: Effect of artificial age-hardening (AH) at 170 °C on micro-hardness of FS-welded
AA2219-T87

146
Micro-hardness of aluminum alloys are related to tempering condition, precipitation of alloying
elements, and microstructures. Complex heating cycles and deformation of plasticized material
around weld zone results in microstructures refinements and decomposition of allying elements
during FSW of heat tempered aluminum alloys. As a consequence, as-welded (AW) specimen
exhibited lower micro hardness values near the weld nugget and TMAZ regions (Figure 6.6).
For initial analysis, the effect of only artificial age-hardening (AH) on micro-hardness
profile was studied (Figure 6.6). Age-hardening also known as precipitation hardening which
usually helps in the precipitation of supersaturated alloying elements. It does not have effect on
grain refinement and residual stresses. As a consequence, micro-hardness values can be
improved up to certain extends around the weld nugget and TMAZ area. The higher hardness
values are related to the precipitation of supersaturated alloying elements around grain
boundaries, which is also true for the improvement of tensile properties in artificially age-
hardened specimens.
Figure 6.7: Effect of solution-treatment followed by age-hardening (STAH) at 170 °C on micro-
hardness of FS-welded AA2219-T87

147
To analyze the effect of solution-treatment (ST) and solution-treatment followed by
artificial age-hardening (STAH) on micro-hardness, hardness profiles are drawn as shown in
Figure 6.7. Solution-treatment results in the formation of supersaturated alloying element in
aluminum matrix as well as grain refinement in heat treatable aluminum alloys. As a result,
solution-treated specimens showed relatively lower microhardness values compared to base
metal and hardness profile is uniform as compared to AW specimen. The lower hardness value is
related to the formation of supersaturated precipitate element and uniform hardness is related to
the grain refinement due to ST process. Now the age-hardening of ST specimens help in the
formation of precipitation of alloying elements around grain boundaries and enhance hardness
values. Thus, STAH-170°C-5h and STAH-170°C -18h specimens showed higher microhardness
values as compared AW and ST specimens. This higher microhardness also related to the higher
tensile strength of STAH specimens.
6.5. Effect of PWHT on Microstructures of FS-Welded AA2219-T87
To characterize the microstructures, the cross section of the FSW joint was cut, mounted
onto epoxy, polished with diamond suspension (6µ to 0.25µ solution), and then etched with
standard Keller’s reagent. Microstructural characterization and analysis were carried out utilizing
optical microscope and scanning electron microscopy (SEM) equipped with X-ray energy
dispersive spectroscopy (EDS).
6.5.1. Optical Macro and Micrographs Analysis
The optical macrograph of the as-welded AA2219-T87 aluminum alloy joint is shown in
Figure 6.8. It can be clearly seen from Figure 6.8 that there are four distinct regions including
weld nugget (WN), thermo-mechanically affected zone (TMAZ), heat-affected-zone (HAZ), and
base metal are identified in a FSW joint. In Figure 6.9, optical micrographs of WN and TMAZ

148
are shown for as-welded (AW) AA2219-T87 joint. Weld nugget is composed of very fine and
equiaxed grains. Then again, TMAZ and HAZ usually consist of elongated microstructures and
heterogeneity in microstructure is observed. There is clear boundary and difference in grain
orientation is observed between TMAZ and weld nugget (WN) area. The elongated and distorted
grains in TMAZ are responsible for higher stress concentration and lower strength of FSW joint.
As a result most of the defect-free tensile test specimens failed from TMAZ area.
Figure 6.8: Cross section of a friction- stir- welding (FSW) joint showing four different regions
(WN, TMAZ, HAZ, and Base metal) in both advancing (AS) and retreating side (RS)
Figure 6.9: Optical micrographs of FS-welded AA2219-T87 joint (a) as- welded weld nugget
(AW-WN) and (b) as- welded thermo-mechanically affected zone (AW-TMAZ)

149
Now, the effects of PWHT on microstructures are analyzed for FS-welded and post-weld
heat treated (PWHT) AA2219-T87 joints. Optical macrographs of artificial age-hardened (AH-
170°C-18h) and solution-treatment followed by age- hardened (STAH-170°C-18h) samples are
shown in Figure 6.10. There is no significant difference in macrograph is observed between only
age- hardened (AH-18h) and as- welded (AW) specimens (Figure 6.10a and Figure 6.8). This is
also reported by other researchers (Priya, Subramanya Sarma et al. 2009). However, there is a
significant difference is observed in solution-treated specimens (Figure 6.10b).
Figure 6.10: Optical micrographs of FS- welded AA2219-T87 (a) AH-170°C-18h and (b) STAH-
170°C-18h
There is an abnormal grain growth occurred in the fine grain weld nugget, TMAZ, and HAZ
areas due to solution-treatment and grain structure can be easily visualized from optical
macrographs. This is also confirmed in other articles (Krishnan 2002; Hassan, Norman et al.
2003; Attallah and Salem 2005). Some studies concentrated on the heterogeneity of the FSW

150
texture to explain abnormal grain growth in FSW joint (Field, Nelson et al. 2001). The second
phase particles and precipitates morphology within weld nugget, HAZ, TMAZ regions is one of
the parameters leading to abnormal grain growth after solution-treatment (Attallah and Salem
2005). Due to solution-treatment, alloying elements form an instable solid solution in the
aluminum matrix. As a consequence, only solution-treated specimens showed lower tensile
strength and microhardness values. Now artificial age-hardening (AH) after solution-treatment
results in the diffusion of the precipitates saturated solid solution into grain boundary and
strengthens the parts (Krishnan 2002).
6.5.2. SEM and EDS Analysis
In Figure 6.11 shows backscattered electron (BSE) images of the weld nugget before and
after PWHT. During FSW of AA2219-T87, welding temperature and plasticization of weld
nugget area leading to the fine 𝐴𝑙2Cu precipitates dissolve and segregate from grain boundaries
(Malarvizhi and Balasubramanian 2011; Ni, Chen et al. 2013). Some un-dissolved second-phase
precipitate particles are observed in SEM-BSE micrographs (Figure 6.11). The white dots in the
micrograph represent precipitate element (𝐴𝑙2𝐶𝑢) in the weld nugget zone. The second phase
particles are confirmed to be 𝐴𝑙2𝐶𝑢 eutectic particles based on X-ray energy dispersive
spectroscopy (EDS) analysis showing in Figure 6.12. The characteristic X-ray energy for α-Al is
1.48 keV. Two peaks of Cu are related to β-Cu (0.95 keV) and α-Cu (8.04 keV). The average
composition of Al and Cu was measured using EDS. In base metal, average amount of Cu is
6.5% (wt.) and Al is 92% (wt.). The corresponding values for as-welded weld nugget (AW-WN)
zone are 4.24% and 92 %. The lower amount of Cu in weld nugget zone is related the dissolution
and decomposition of precipitates during welding process.

151
Figure 6.11: SEM-BSE micrograph showing grain structure and precipitates distribution in weld
nugget (WN) of (a) as - weld (AW) and (b) age- hardened (AH-170°C-18h) specimens
Figure 6.12: Typical X-ray energy dispersive spectroscopy (EDS) spectrum of FS-welded
AA2219-T87 joint
Similar to as-weld (AW) joint weldment analysis, the amount of precipitates present in PWHT
specimens were also analyzed utilizing EDS (Energy dispersive spectroscopy). From EDS
analysis, it is found that the PWHT specimen (AH-170°C-18h) specimen has an average 6.46%
(wt.) Cu in the weld nugget zone. The higher percentage of precipitate element in heat treated

152
specimens is related to precipitation hardening during heat treatment process. The evidence can
be also visualized from SEM-BSE micrographs shown in Figure 6.11b. In heat treated
specimens, most of the alloying elements precipitated around the grain boundaries which are
responsible for the higher strength and micro-hardness in heat treated specimens. The
distribution of precipitates can be also seen from bright field transmission electron microscope
(TEM) images of FS -welded AA2219 before and after PWHT (Figure 6.13). PWHT results in
more in precipitations as compared to as-welded specimens (Malarvizhi and Balasubramanian
2011; Zhu, Deng et al. 2015).
Figure 6.13: TEM bright field image of FS- welded AA2219 weld nugget (a) as-welded and (b)
age-hardening at 175°C for 12h (Malarvizhi and Balasubramanian 2011). Heat-treated specimen
has contains more amount of precipitates than that of AW joints
6.6. Summary
The solid state nature of FSW leads to several benefits over fusion welding process and
possible defects during cooling from liquid phase are avoided in FSW of high strength aluminum
alloys. However, plastic deformation and complex heating cycles during FSW process results in
the dissolution of alloying elements, intrinsic microstructural changes, and post-weld residual

153
stresses development in the heat treatable aluminum alloy joints. As a consequence, about 30%
reduction in tensile strength and 60% reduction in yield strength were observed in defect-free as-
welded AA2219-T87 joints. In this chapter, an extensive experimental investigation was
accomplished on PWHT to improve tensile properties of FS-welded AA2219-T87 and obtain
optimum PWHT condition. The results obtained can be summarized below:
Artificial age-hardening (AH) helped in the precipitation of supersaturated alloying
elements produced around weld nugget area during the welding process resulting an
average 20% improvement in YS and 5% improvements in UTS were observed in AH-
170°C-18h specimens as compared to AW specimens. However, about 12% reduction in
toughness value was also observed in AH-170°C-18h specimens. The reduction is
toughness values might be related due to the formation of precipitation-free zone and
decrease ductility of age-hardened specimens.
To achieve full benefit of PWHT, solution-treatment followed by age-hardening (STAH)
was performed on FS-welded AA2219-T87 specimens. Solution-treatment (ST) helps in
the grain refinement and formation of supersaturated precipitates in aluminum alloys. Age-
hardening of ST specimens help in the precipitation of alloying elements around grain
boundaries and strengthen the specimens. Longer aging time usually results in over
precipitation as well as precipitation-free zone which are related to reduced ductility of
aluminum alloy joints. Therefore, optimum aging period is important to achieve better
mechanical properties. For FS- welded AA2219-T87 peak aging time was 5 hours at
170°C. STAH-170°C -5h treated specimens showed about 78% JE based on UTS, 61% JE
based on yield strength, and 36% JE based on tensile toughness values of base metal.

154
From microstructural study and EDS analysis, it can be concluded that the formation and
distribution of Al2Cu precipitates significantly changed after PWHT. In PWHT specimens,
the Al2Cu precipitated primarily distributed around the grain boundaries which led to
higher tensile and microhardness properties compared to as-welded specimens.
The results obtained from this study could be important for better design of FS-welded
AA2219-T87 structures and in the forthcoming; the effect of PWHT on fatigue behavior
can be analyzed as a future study.

155
CHAPTER 7 : INFLUENCE OF WELD DEFECTS AND POST-WELD
HEAT TREATMENT (PWHT) ON FUSION WELDED ALUMINUM
ALLOY JOINT
7. Introduction
Effects of post-weld heat treatments and process parameters on the quality of friction-stir
welded aluminum alloy (AA2219-T87) joint are discussed in last three Chapters (Chapters 4, 5,
and 6). Friction-stir-welding (FSW) offers better performances on aluminum alloy joint
compared to conventional fusion welding techniques. Due to higher initial cost and non-
portability of FSW machine it is only utilized in some specific applications, but in general,
fusion welding techniques are utilized in many structural applications to join aluminum alloys.
Welding defects and the reduction in mechanical performances are the foremost problems for
fusion welded aluminum alloys joints. The influences of weld defects and post-weld heat
treatment (PWHT) on tensile properties of Gas Tungsten Arc (GTA) - welded aluminum alloy
AA6061-T651 joints are investigated in this chapter. AA6061-T651 is chosen because this is one
of the most commonly used general-purpose aluminium alloys and usually employed fusion
welding techniques to join. The current investigations are divided into two sections: (1) influence
of weld defects and (2) influence of post-weld heat treatment (PWHT) on tensile properties of
GTA - welded AA6061-T651. The experimental investigations can be utilized to establish weld
acceptance/rejection criteria and for the design of welded aluminum alloy structures. Details of
the study are discussed below.
7.1. Scope
Weld defects and mechanical performances reduction are quite common in fusion arc
weld joints of aluminum alloys. The weld defects can be in the form of surface or sub-surface

156
cracks, undercut, porosity, or sub-surface inclusions. The failures of welded structures generally
start from preexisting weld defects (Greenberg 1966) which are intrinsic to the fusion arc
welding processes. An important decision relating to its structural integrity must be made
regarding weld defects and their effects on the strength of welded components. Only a limited
number of studies have been reported in the open literatures on the effects of weld defects on
mechanical performances (Rudy and Rupert 1970; Morton 1971; Lawrence Jr, Munse et al.
1975; Burk and Lawrence 1976). However, no conclusive study reported on weld defects and
their effects on GTA- welded AA6xxx aluminum alloy. A relation between non-destructively
evaluated weld defects and tensile properties can help in the designing of welded structures
efficiently. Besides weld defects, residual stresses and microstructural changes are the two other
key factors for performance reduction as well as failure of welded heat treatable aluminum alloy
joints.
Post-weld heat treatment (PWHT) is a common practice to improve mechanical
performances of weld joints. Heat treatment involves various heating and cooling procedures to
change microstructures in a material. Although a number of research studies have investigated
the application of post-weld heat treatment (PWHT) to different aluminum alloy welding joints
using several welding processes (Akhter, Ivanchev et al. 2007; Bhanumurthy, Kumbhar et al.
2007; Elangovan and Balasubramanian 2008; Malarvizhi, Raghukandan et al. 2008; Aydın,
Bayram et al. 2010; Ahmad and Bakar 2011; Maisonnette, Suery et al. 2011; El-Danaf and El-
Rayes 2013; Peng, Shen et al. 2013; Damodaram, Ganesh Sundara Raman et al. 2014; Ding,
Wang et al. 2014; Sivaraj, Kanagarajan et al. 2014) but only a few investigations showed the
effect of PWHT on fusion arc welded AA6061 aluminum alloys (Ahmad and Bakar 2011;
Maisonnette, Suery et al. 2011; Dewan, Liang et al. 2013; Peng, Shen et al. 2013).

157
From the critical reviews of the available literature, it is understood that few research
efforts have been published on the effect of weld defects and PWHT on AA6061-T651 joints
using Gas Tungsten Arc Welding (GTAW) method. The primary objective of this work is to
obtain tensile test data for GTA welded joints AA6061-T651 aluminum alloy containing specific
flaws and to correlate these data with the nondestructive phased array ultrasonic testing (PAUT)
results. Tensile test data are also correlated with microscopic evaluation; and a comparison is
made between these two inspection methods relative to the evaluation of weld discontinuities.
The present investigation also included residual stress measurement and the influence of PWHT
on mechanical properties of GTA - welded AA6061-T651 aluminum alloy joints.
7.2. Effect of Weld Defects on Tensile Properties
This section includes weld defects identification utilizing non-destructive evaluation
(NDE) technique, welded specimens classification based on measured weld defects, verification
of NDE measurement, defect size measurements and correlations with tensile strength and
toughness.
7.2.1. Weld Defect Identification and Defect Size Measurement
Rolled plates of AA6061-T651 aluminum alloy with 300 mm × 76 mm × 6.35 mm
dimensions were GTA-welded utilizing ER4043 filler rod. After welding, the plates were
grinded and “dogbone” tensile test specimens were prepared according to ASTM standard
(ASTM-International 2011). Each dogbone specimen was inspected with Olympus “Omniscan
MX2.0” nondestructive phased array ultrasonic testing (PAUT) unit. Angle beam wedge (30° -
70°) with 5 MHz, 16- elements linear phased array ultrasonic probe was used for the PAUT
inspection. Before inspections, the PAUT probe and wedge were calibrated with standard

158
calibration blocks made of the same material to be inspected. PAUT calibration included
velocity, wedge delay, sensitivity, and sizing calibration.
Using PAUT one can find the A, B, C, and S scan views to find size, shape, and location
of defects. The A-scan view represents waveforms which are the reflections from one sound
beam position in a test piece. The B-scan is an image showing a cross-sectional profile through
one vertical slice of the test piece, showing the depth of reflectors with respect to their linear
position. The C-scan is a two dimensional presentation of data displayed as a top or planar view
of a test piece. Lastly the S-scan or sectorial scan represents a two-dimensional cross-sectional
view derived from a series of A-scans that are plotted with respect to time delay and refracted
angles. Figure 7.1 shows the C-scan and S-scan views obtained from PAUT of dogbone
specimens before they were tensile tested. The specimens were chosen to have different types of
weld defects. The actual size, shape, and location of the defect can be detected utilizing C and S
scan views. After conducting the nondestructive PAUT inspection, the specimens were classified
into four categories according to the types of defects detected (no-defect, voids, lack- of - fusion
(LOF), and lack- of- penetration (LOP)). The defects were formed due to the variations in
welding conditions, welding process parameters, and control during manual fusion welding
process. Lack- of- penetration (LOP) is usually caused by the use of too low welding current.
Other causes can be the use of slow travel speed and narrow root gap. Lack - of - fusion (LOF)
is generally caused due to low welding voltage and low welding speed. Multipass welding can
also result in LOF and porosity, which are caused by entrapped gases in between the subsequent
passes. The porosities are mostly formed due to inadequate shielding gases during the welding
process.
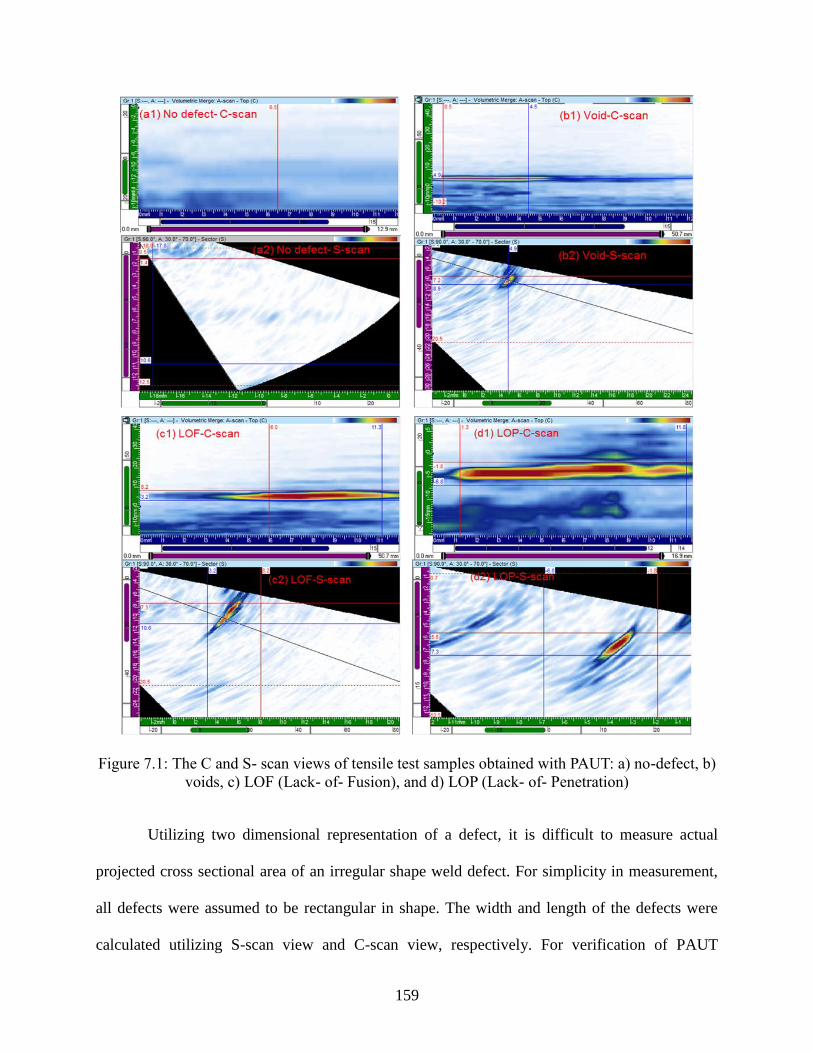
159
Figure 7.1: The C and S- scan views of tensile test samples obtained with PAUT: a) no-defect, b)
voids, c) LOF (Lack- of- Fusion), and d) LOP (Lack- of- Penetration)
Utilizing two dimensional representation of a defect, it is difficult to measure actual
projected cross sectional area of an irregular shape weld defect. For simplicity in measurement,
all defects were assumed to be rectangular in shape. The width and length of the defects were
calculated utilizing S-scan view and C-scan view, respectively. For verification of PAUT

160
measurement, actual projected cross sectional area was measured utilizing Optical Microscope
(OM) and compared to justify assumption made in PAUT measurement. A small discrepancy
between the two measurements techniques is observed which is discussed in the following
paragraph. Figure 7.2 shows the cross sectional view of the tensile tested samples with different
types of weld defects obtained with OM. Using image processing software (Image- J), the
projected cross sectional area of the defect was calculated.
Figure 7.2: Cross sectional view of tensile tested specimens with different weld defects obtained
with Optical Microscope (OM)
7.2.2. Weld Defects Cross-Sectional Area Measurement utilizing PAUT and OM
The cross sectional area of the defect was measured from phased array ultrasonic testing
(PAUT) and optical images, from which the cross sectional area-ratio was calculated by dividing
the measured cross sectional area of the defect with original cross sectional area of the sample.
PAUT measurements were performed before tensile test and OM measurements were performed
after the tensile test. Figure 7.3 shows the relation between cross sectional area-ratio measured

161
with PAUT and OM. Only small difference is observed in the plotted data, which shows that
PAUT can be confidently used to measure weld defects over a wide range of defect sizes as
indicated by the linear relationship between two different measurement techniques. The small
variation in the results may have occurred from measurement errors, assumption of a rectangular
defect shape in PAUT measurements, and deformation of the specimen after tensile testing. In
the current study, the tensile strains were below 5% for the defective samples and accordingly,
the deformation effect was neglected during cross sectional area measurement of the defects
using OM.
Figure 7.3: Plot shows the relationship between the defect sizes measured with OM and PAUT
7.2.3. Effect of Different Types Defects on Tensile Properties
By controlling welding conditions (e.g. surface cleaning, jig and fixture positions,
preheating, etc.) and welding process parameters weld defects can be controlled in automated
162
GTA welding. However, weld defects are common in manual GTA welding of aluminum alloys.
Therefore, it is important to know the effect of weld defects on mechanical performances. In the
current study the welded samples are classified into four different groups according to the defect
location, size, and shape. The four groups are named as: (a) weld with no- defect, (a) weld with
internal voids, (c) weld with lack- of- fusion, and (d) weld with incomplete penetration. Six
samples were tensile tested from each group to obtain mechanical performances. Figure 7.4
shows the average tensile stress-strain curve with different weld defects. As expected, defect-free
samples exhibited highest tensile strength and toughness values compared with the defective
welded samples. The ultimate tensile strength (UTS) for the six defect-free tensile specimens
ranged from 170 MPa to 182 MPa, averaging 177 MPa. The average toughness value was 14.1
MJ/m3. All defect-free tensile tested samples fractured near the heat-affected-zone (HAZ). The
weld-defect type is found to be directly related with the tensile strength and specimen toughness.
Specimens with voids had an average tensile strength of 162 MPa while their toughness was 8.3
MJ/m3. These tensile strength and toughness values were lower by 9% and 41% compared to
defect-free specimens, respectively. Lack- of- fusion (LOF) has resulted in an 18% reduction in
tensile strength and 65% reduction in toughness compared with defect-free welded samples. The
corresponding reduction was 32% and 81% for lack- of- penetration (LOP). Table 7.1 shows the
average tensile properties along with cross sectional area reduction ratio of four different groups
with their standard deviations. In a defective sample, crack generally initiates from the defect
sites. Defects on the surface (here, LOP) are more inclined to crack initiation sites as compared
to internal defects (Tobe and Lawrenece 1977). As a results, sample with LOP defects provided
lowest tensile properties. Internal defects (here, LOF and voids) are not so detrimental until the
defect size turned into a critical value of the crack length. Sample with LOF has larger internal

163
defect as compared to the sample with internal voids and accordingly, specimen with LOF defect
exhibited lower tensile properties as compared to the sample with internal voids.
Figure 7.4: Tensile test curves of GTA- welded AA6061-T651 aluminum alloy with different
types of weld defect
Table 7.1: Average tensile test results with different weld defects
Defects UTS (MPa) Strain
(mm/mm)
Toughness
(MJ/m³)
Area-ratio
(OM)
Area-ratio
(PAUT)
LOP 119.1 ± 2.9 0.01 ± 0.005 2.6 ± 0.26 0.15 ± 0.02 0.14 ± 0.02
LOF 146.5 ± 8.8 0.02 ± 0.007 4.8 ± 0.61 0.08 ± 0.02 0.08 ± 0.02
Voids 162.6 ± 10.1 0.04 ± 0.013 8.3 ± 2.12 0.05 ± 0.03 0.05 ± 0.02
No-Defect 176.8 ± 5.9 0.06 ± 0.012 14.1 ± 1.35 0.0 ± 0.0 0.0 ± 0.0

164
7.2.4. Effect of Weld Defect Size on Tensile Properties
Weld defects have direct influence on the reduction in tensile strength as well as in the
tensile strain. To study the effect of welding defect size on the tensile strength, UTS vs.
measured defect cross sectional area- ratio (i.e. ratio between defect cross sectional area and
specimen cross sectional area) is plotted (Figure 7.5). The tensile strength decreases linearly with
the increase of area reduction ratio (Morton 1971).
Figure 7.5: Tensile strength vs. defect cross sectional area ratio measured with PAUT and OM
Figure 7.6 shows the relation between toughness and measured cross sectional area ratio and it is
found that, for small voids (defect area-ratio less than 0.05) in the fusion zone, the ultimate
tensile strength decreased about 5%, whereas toughness decreased about 20%. A sudden drop in
the tensile toughness is observed near area-ratio around 0.05. About 16% and 60% reduction are
observed in tensile strength and toughness, respectively, when defect area-ratio reaches about

165
0.05. The sudden drop in toughness might be related to rapid decrease in tensile strain with
defect size. If the defect size is higher than a critical value, crack propagation resistivity
decreased, which results in sudden failure. After the threshold value, toughness value decreases
linearly with the increasing projected defect area. In Figure 7.5 and Figure 7.6, a good agreement
is observed between PAUT (red square marker) and OM (blue diamond marker) measured data.
Figure 7.6: Tensile toughness vs. area- reduction ratio measured with PAUT and OM
After analyzing the effect of weld defects of tensile properties, fracture surfaces of the tensile
tested specimens were analyzed utilizing scanning electron microscope. Fracture behavior is
discussed in next section.
7.2.5. Effect of Weld Defects on Fracture Surfaces
In order to understand the fracture pattern, tensile tested specimens were examined under
the scanning electron microscope (SEM). Micrographs were taken at weld zone and Heat-

166
Affected-Zone (HAZ) of As-Welded (AW) defect-free and base metal specimens (Figure 7.7).
Defect-free as-welded specimens generally failed near the weld zone. The fracture surface of
welded specimen shows ductile features, in addition to that, the size and the spacing between the
grains produced at welded area are large, which is indicative of the ductility of the weld area.
Based on Figure 7.7 it can be observed that the presence of dimples on fracture surface
dominated the fracture surfaces, reflecting that most of the failure is the result of the ductile
fracture; and this interpretation is in good agreement with the work reported by several earlier
researchers (Hu and Richardson 2007; Rajakumar and Balasubramanian 2012; Peng, Shen et al.
2013). In the case of un-welded specimen, the grain size is small and the distance between
different grains is also considerably small. The welded specimens with no-defects failed at the
HAZ. It is obvious that at this zone, large grain particles are visible. Furthermore, the
microstructure is inhomogeneous and coarse due to the welding process; therefore, a weak area
was formed at the HAZ, causing the specimen to fail (Menzemer, Lam et al. 1999).
Figure 7.7: SEM fractographs of (a) base metal of un-welded specimen, (b) weld metal of as-
welded (AW) specimen, and (c) HAZ metal of AW specimen

167
SEM fractographic analyses were also performed to understand the fracture behavior of
the defective samples (Figure 7.8). In defective samples, the cracks are initiate from the defective
region (e.g., LOP, LOF, and void) and then propagates through the weld metal. Brittle fracture
surfaces are observed in the defective areas followed by ductile failure behavior in the non-
defective regions. The LOP is a surface defect and results in higher stress concentration near the
defective area. As a consequence, lowest tensile strength and strain has been experienced. Voids
and LOF are sub-surface defects and are also a source of stress concentration but their effects are
considerably lower than surface defects. But within the sub-surface defects, tensile samples with
LOF indicated higher area reductions and lower strength, compared to tensile samples with
voids.
Figure 7.8: SEM fractographs of tensile tested welded specimens with various types of weld
defects, (a) Lack- of- Penetration (LOP), (b) Lack- of- Fusion (LOF), and (c) Void
From above analysis it is observed that the defect free GTA-welded AA6061-T651 aluminum
alloy joints have only 53% joint efficiency based on UTS and 33% joint efficiency based on
yield strength. Post-weld heat treatment (PWHT) is a common practice to improve tensile
properties of heat treatable aluminum alloy joints. Effects of PWHT are discussed in next
sections.

168
7.3. Effect of Post-Weld Heat Treatment (PWHT)
For post-weld heat treatment analysis, only defect-free welded specimens are utilized for
rational comparison. This section includes- PWHT process, effect of different PWHT process on
residual stresses, tensile properties, and micro-hardness on GTA-welded AA6061-T651.
7.3.1. PWHT Process
Post-weld heat treatment (PWHT) was performed to improve tensile properties of welded
specimens. To study the effect of artificial age-hardening (AH), welded and naturally cooled
specimens at room temperature were placed into conventional oven at 180 °C for 10 hours
followed by air cooling at room temperature. For solution-treatment (ST), as-welded specimens
were placed into conventional oven at 540 °C for 1.0 hour followed by quenching into cold water
(20 °C).
Figure 7.9: Schematic of post-weld heat treatment (PWHT) process

169
Subsequently, artificial AH was investigated on ST- samples to obtain peak aging time. Aging
temperature was 180 °C and aging-time was varied from 3 hours to 18 hours. Solution-
treatments followed by age- hardening specimens are named as “STAH”. Schematic of post-
weld heat treatment processes are shown in Figure 7.9. Horizontal axis represents time of heat
treatment and vertical represents heat treatment temperatures for ST, STAH, and AH.
7.3.2. Effect of PWHT on Tensile Properties
Complex heating cycles during welding process results in dissolution of alloying
elements, intrinsic microstructural changes, and post-weld residual stresses development in
welded structures. Therefore, precipitate strengthened aluminum alloys show lower mechanical
properties in the weld zone (Cabibbo, Meccia et al. 2003; Aydın, Bayram et al. 2009). In the
current investigation, about 47% reductions in the ultimate tensile strength observed in as-
welded (AW) specimens as compared to base metal specimens (Figure 7.10 and Table 7.2). Post-
weld heat treatment (PWHT) is a common practice to refine grain-coarsened microstructures
(Peng, Shen et al. 2013), remove or redistribute post-weld residual stresses (Cho, Lee et al.
2004), and improve mechanical properties of heat-treatable welded aluminum alloys. The effects
of PWHT on tensile properties are illustrated in Figure 7.10 and Table 7.2.
Initially, only age-hardening (AH) was performed on defect-free welded specimens.
Artificial age-hardening helps in supersaturated alloying element decomposes into precipitation
hardening phase (Zakharov 2003; Peng, Shen et al. 2013). But it cannot help in the
microstructure rearrangements or residual stress removal. Therefore, full benefit of PWHT
cannot be achieved from only AH. In other words, utilizing only AH tensile properties of GTA-
welded AA6061-T651 aluminum alloy joints can be recovered only up to a certain limit. About
7% improvements in ultimate tensile strength (UTS) and 16% improvement in yield strength
(YS) observed in the age-hardened (AH-10h) specimens.

170
Then solution-treatment (ST) followed by quenching was applied on defect-free welded
specimens to improve tensile properties. Closely packed atoms of the solute uniformly distribute
into the solution due to solution-treatment (ST). After quenching, the solute atoms then form
Guinier-Preston (GP) zones which are connected with the solvent matrix (Gao, Stiller et al.
2002). Conversely, solution treatment followed by quenching induces compressive stress fields
near the weld joints and subsequently reduces tensile residual stresses. Only solution-treated
(ST) specimens showed about 70% joint efficiency (JE) based on UTS and 51% JE based on YS.
Artificial age-hardening (AH) was performed on ST -specimens to obtain optimum tensile
strength. Age-hardening after the solution-treatment (STAH) helps in the precipitation hardening
of the aluminum alloy. The alloying elements slowly precipitate into the grain boundary and
impede the dislocations movement; thus higher strength can be obtained. However, longer aging
time results in over precipitation as well as precipitation-free zone (Krishnan 2002). Therefore,
optimum aging period is important to achieve better mechanical properties. For GTA- welded
AA6061-T651, peak aging time was 5 hours at 180°C. STAH-5h treated specimens showed
about 85% JE based on UTS and 71% JE based on yield strength. However toughness decreased
about 29% in a STAH-5h treated tensile specimen.
Filler metal ER4043 containing lower alloying element behaves differently than base metal
AA6061-T651 aluminum alloy with PWHT. Due to PWHT base and filler metal interface
became strengthened due to grain refinement and precipitation hardening. Therefore failure
occurred near fusion zone where weaker filler metal present. Aging time of 18 hours resulted
lowest toughness (6.7% JE based on toughness values). From Figure 7.10, it can be concluded
that the aluminum alloy weld joints results in about 50% reduction in UTS values as compared
base metal UTS. By applying PWHT, the tensile strength can be recovered only up to a certain

171
extent. The percentage of tensile strength recovering usually depends upon PWHT time and
temperature. For each material, there is a “peak artificial-aging time and temperature” is required
to recover maximum tensile strength and toughness values. Over aging might results in lowering
both tensile strength and toughness values.
Figure 7.10: Variations of tensile strength and toughness due to PWHT
Table 7.2: Effects of PWHT on Joint Efficiency (JE) of GTA- welded AA6061-T651 aluminum
alloy
Heat-
treatments UTS, MPa
JE (%),
UTS YS, MPa
JE (%),
YS
Toughness,
MJ/m3
JE (%),
Toughness
Base 334.08 ± 2.8 100.00 305.57 ± 3.5 100.00 31.07 ± 1.2 100.02
AW 176.87 ± 5.9 52.94 103.50 ± 3.6 33.87 16.91 ± 4.3 54.41
AH 197.27 ± 5.8 59.05 156.26 ± 13.4 51.14 13.04 ± 1.2 41.95
ST 234.53 ± 7.1 70.20 156.18 ± 6.3 51.11 18.04 ± 0.6 58.06
STAH-3h 273.32 ± 7.4 81.81 232.16 ± 14.2 75.98 7.38 ± 1.7 23.75
STAH-5h 283.83 ± 7.1 84.96 217.96 ± 7.4 71.33 8.00 ± 3.1 25.74
STAH-7h 248.01 ± 8.8 74.24 198.71 ± 16.4 65.03 4.58 ± 1.1 14.73
STAH-18h 227.23 ± 11 68.02 205.44 ± 10.9 67.23 2.09 ± 0.6 6.73

172
7.3.3. Effect of PWHT on Residual Stresses
Residual stresses are essentially “locked-in stress” to the material after production and
extremely difficult to detect. In this study, non-destructive ultrasonic testing method was utilized
to quantity transverse residual stresses in as- welded (AW) and post- weld heat treated specimens
(STAH-5h). In case of transverse residual stress measurement, the overall variations of sound
velocity in 50 mm long specimens were calculated. Average transverse residual stresses of the
as-welded (AW) and post- weld heat treated (PWHT) specimens is shown in Figure 7.11. The
PWHT results in about 45% removal of post-weld tensile residual stresses in GTA- welded
AA6061-T651 aluminum alloy.
Figure 7.11: Transverse residual stresses (σt) measured by ultrasonic testing
To compare the post-weld residual stress measured using ultrasonic testing and hole-
drilling methods were used for as- welded (AW) specimens. In this study, the residual stress is
measured at heat-affected-zone (5 mm from center of the weld seam). The average tensile
residual stress of about 44 MPa is found in the transverse welding direction. Both ultrasonic and
hole-drilling tested results are comparable, but there are few differences observed. In the case of

173
ultrasonic testing, residual stresses are measured within the bulk materials, whereas, in hole-drill
method, the hole was drilled up to a certain depth (equivalent to the diameter of the strain
rosette) for the measurement of the relaxed residual stresses. This might be the reasons for the
variations in the measured results. Steves in 2010 calculated 40 MPa transverse residual stresses
in GTAW welded aluminum alloy utilizing hole-drilling technique (Steves 2010), which is quite
close to our calculated values. Karunakaran and Balasubramanian in 2011 calculated residual
stress of GTAW welded AA6351-T6 aluminum alloy using X-ray diffraction method. They
obtained residual stress 74 MPa in transverse direction, which is also in the same order of
magnitude of our results, although X-ray diffraction results are generally obtained in the near-
surface condition.
7.3.4. Effect of PWHT on Microstructures
Tensile properties improvements of post-weld heat treated AA6061-T651 specimens are
directly related to the changes in microstructures and precipitation hardening. Optical
micrographs of weld zone of as-welded (AW), age-hardened (AH-10h), and solution-treatment
followed by age-hardening (STAH-5h) specimens are shown in Figure 7.12. Due to complex
thermal cycle during the welding process, the alloying elements usually dissolute into the
aluminum matrix and results in lower tensile properties. Artificial age-hardening helps in
precipitation of supersaturated alloying elements around the grain boundaries and does not
respond to change in microstructures (Figure 7.12b). As discussed earlier, silicon rich filler metal
ER4043 does not respond to only age-hardening. As a result, there is no significant difference
noticed between AW and AH-10h samples microstructures. To obtain full benefit of PWHT, it is
required to apply solution treatment then artificial hardening. There is clear difference in grain
structure and precipitation at weld zone can be noticed between STAH (Figure 7.12c) and AW

174
specimens (Figure 7.12a). In STAH-5h specimens, precipitates (Mg2Si and CuAl2) accumulated
around the grain boundaries and obstruct the dislocations movement during tensile test.
Consequently, STAH-5h specimens showed higher tensile strength but lower tensile toughness
value. This is also verified in other studies (Ravindra and Dwarakadasa 1992; Liu, Chen et al.
2006; Elangovan and Balasubramanian 2008; Dewan 2012). For further verification, SEM
images are taken at weld zone of AW, AH-10h, and STAH-5h specimens and observed similar
microstructures as observed in optical micrographs.
Figure 7.12: Optical micrographs of weld zone for (a) as welded (AW), (b) age hardened (AH-
10h), and (c) solution treatment followed by hardened (STAH-5h) specimens showing
precipitation (Mg2Si and CuAl2) of alloying elements
For the confirmation of precipitation elements, the average composition of precipitate elements
(Si and Mg) was measured using EDS (Energy dispersive spectroscopy). The typical EDS plot
along with SEM image for STAH-5h-weld zone is shown in Figure 7.14. Filler metal (ER4043)

175
contains about 4.5 wt.% Si. Weld zone of as welded (AW) specimens had about 1.5 wt.% Si. The
lower amount of Si in weld nugget zone of AW specimen is related to the dissolution and
decomposition of precipitates during the welding thermal cycles. The corresponding values for
AH-10h and STAH-5h specimens were 1.7 wt.% and 2.03 wt.%, respectively. For further
analysis, EDS analysis was also done on a spot of STAH-5h specimen and found about 4.9 wt.%
Si and confirmed the precipitates composition. The higher percentage of precipitate element in
STAH-5h specimens is related to precipitation hardening during PWHT process.
Figure 7.13: SEM micrographs of weld zone for (a) as welded (AW), (b) AH-10h, and (c) STAH-
5h specimens showing precipitation of alloying elements

176
Figure 7.14: SEM image and EDS plot for weld zone of solution treatment followed by age
hardened (STAH-5h) specimen
7.3.5. Effect of PWHT on Micro-Hardness
For better understanding of the effect of PWHT, hardness values were measured in the
welded specimens (Figure 7.15). As expected, for the as-welded (AW) specimens, the major
softened region is the weld-center area and the adjacent to HAZ area [21-23]. The lowest
hardness values for AW- specimens are obtained in the fusion zone and HAZ areas and the
hardness values are about 55 HR15T and 53 HR15T, respectively. Figure 7.15 also reveals that
heat treatment processes are beneficial as the hardness values for all of the three zones (i.e. weld,
HAZ, and base metal) are higher than the corresponding values of AW- specimens. Higher
hardness values also related to higher tensile strength of PWHT specimens. Hardness values
increased due to precipitation hardening and grain refinement during PWHT. However, only age-
hardening (AH) does not have the full effect on grain refinement. As a result, the weakest zone
of AW and AH-10h specimens are in the HAZ areas (about 10 mm away from weld-center). It is
also determined that the solution -treatment followed by artificial age-hardening (STAH) helps in
grain refinement (Figure 7.12) as well as precipitation hardening in welded specimens. For this
reason, higher hardness values are observed near HAZ of STAH specimens. But, the weld-zone

177
showed the lowest hardness values due to lower precipitating elements present in the filler metal.
Lowest hardness values in the welded zone are associated with the lower tensile properties of
ER4043 filler metal (See Table 3.2). STAH-5h specimens observed to have lowest hardness
values about 68 HR15T at the center of weld joint, which is about 25% higher than AW
specimens.
Figure 7.15: Effect of PWHT on hardness profile
7.3.6. Effect of PWHT on Fractographs
The fracture surfaces of the heat-treated specimens were characterized using SEM to
understand the failure patterns. The SEM images are taken at the center of the failure surface
(Figure 7.16). The micrographs indicate that all the surfaces invariably consist of dimples, which
is a typical indication that most of the failure occurred due to ductile fracture. During tensile
testing of ductile materials voids are formed prior to necking. If the necking in the specimens is

178
formed earlier, the void formation would be much more prominent; and as result, coarse and
elongated dimples can be seen. Defect-free, as- welded, and only age-hardened (AH) specimens
failed at the HAZ due to the presence of inhomogeneous and grain-coarsened structure. This is
also related to lowest hardness values at HAZ of AW and AH specimens. On the other hand,
STAH specimens failed near weld zone for the lower hardness as well as lower tensile properties
of the filler metal ( Table 3.2). STAH-5h sample contains a large number of fine dimples and
larger sized voids. Fine grain results in higher tensile strength and the larger voids might be
related to isolated second phases on the dendrite boundaries between filler metal and base metal.
Over-aging results in more voids and consequences lower tensile strength and lower toughness
values. The shiny and thick grain boundaries are observed in STAH-18h sample. The thick grain
boundary is associated with the formation of precipitate-free zone (Krishnan 2002) and generally
responsible for brittle failure.
Figure 7.16: SEM Fractographs of PWHT samples: (a) AH-10h, (b) STAH-5h, (c) STAH-18h
7.4. Summary
Welding defects and the reduction of mechanical performances are the foremost
problems especially for fusion welded aluminum alloy joints. The influences of weld defects and

179
post-weld heat treatment (PWHT) on tensile properties of gas tungsten arc (GTA) - welded
aluminum alloy AA6061-T651 joints are investigated in this Chapter. A brief summary from this
study are as follows:
Non-destructive phased array ultrasonic testing (PAUT) can be successfully applied to
locate welding defects. The PAUT results are compared with destructively measured
values for validation. The results showed that PAUT can be confidently used for
estimating weld-defect size and location.
Weld defects have direct effect on the tensile strength and toughness values of GTA-
welded structures. The tensile strength decreased linearly with the increase of weld defect
size. However, small voids (area-ratio < 0.05) do not have significant effect on toughness
values. Once the defective area-ratio exceeds a certain critical threshold value (≥ 0.05)
toughness value decline sharply. After the threshold value of the defect area-ratio
achieved, toughness value decreases linearly with increasing projected defect-area.
Solution-treatment followed by artificial age-hardening generally needed to enhance
tensile properties of fusion arc welded aluminum alloys. The experimental results
confirmed that the mechanical properties of the AA6061-T651 joints with PWHT are
significantly improved in comparison to as-welded specimens. However, exposing the
material to a temperature for longer time than optimally required aging time can create
larger precipitation-free zone, impose brittleness, and consequently lower the tensile
properties. And therefore, it is necessary to obtain optimum aging temperature and time
for achieving better strength.

180
CHAPTER 8 : EFFECT OF POST-WELD TREATMENT ON GAS
TUNGSTEN ARC WELDED AISI- 4140 ALLOY STEEL
8. Introduction
In the last four chapters (Chapters 4, 5, 6, and 7) structural integrity of two different
aluminum alloys joint are discussed. But in many structural applications, alloy steels are utilized
for its high strength and high stiffness properties. Therefore structural integrity analysis of alloy
steel joints is also an important topic. And therefore, the effect of fusion arc welding on
structural integrity of high strength AISI-4140 steel is investigated in this chapter. Unlike
aluminum alloy joints, weld defects are not prime concern for steel joints. By controlling
welding conditions and weld process parameters, defect- free weld joint can be obtained fairly
easily; but residual stress development, microstructure changes, and unstable brittle fracture are
unavoidable active problems for alloy steel joints that require special attention to address these
types of problems. To improve mechanical performances of fusion welded alloy steel joint, two
different post-weld treatment (PWT) techniques e.g. post-weld heat treatment (PWHT) and
electrolytic-plasma-processing (EPP) are utilized in this current study. An EPP has been
developed to improve corrosion behavior and wear resistance of structural materials; and can be
employed in several other applications and surface modifications aspects as well (Dewan, Liang
et al. 2014). In this study, surficial EPP employed on gas tungsten arc (GTA)- welded AISI-4140
alloy steel joint to improve mechanical performances and compared with commonly utilized
PWHT. The post-weld residual stresses are measured using ultrasonic testing. Surficial
microstructural and micro-hardness changes are examined by optical microscope and Rockwell
hardness readings, respectively. Finally, tensile tests are carried out to identify the effect on the
strength recovery and change of ductility of different heat treatment processes.

181
8.1. Scope
The wide applications of alloy steels call for reliable welding process and post-weld
treatment process which has always been a great challenge for designers and technologists.
Among different fusion welding techniques, gas tungsten arc welding (GTAW) technique is
widely employed for joining high strength alloy steels for its higher joint efficiency and higher
controllability properties. For a fusion weld joint, weldment especially the heat-affected-zone
(HAZ), is a complex problem where variable microstructures formed from different thermal
treatments and environmental conditions. This complexity involves inherent mechanical
behavior such as strength, ductility, hardness, and fracture toughness. In addition, three-
dimensional residual stress field can cause significant decrease of fracture toughness values in
the HAZ area (Mac Henry and Potter 1990; Venkata Ramana, Madhusudhan Reddy et al. 2010).
Post-weld heat treatment (PWHT) is a common practice to relieve undesirable post-weld tensile
residual stresses and improve mechanical properties of welded low alloy and high strength steel
structures by grain refinement. The degree of PWHT embrittlement is dependent upon heating
rate, holding time or duration of treatment, applied stress, grain size of the weld, and HAZ
microstructures (Zhang, Yang et al. 2013). Sometimes, PWHT is difficult to control and apply
according to the recommendations, as well as it might be expensive and time-consuming. For
this reason the authors have explored different surface processing technique such as, Electro-
plasma- processing (EPP) which is an environmental friendly technique. During EPP treatment,
Direct Current (DC) voltage is applied to the electrodes in the aqueous electrolyte, which
produces plasma at the surface of the submerged workpiece. Thermal, chemical, electrical, and
mechanical effects caused by EPP to the workpiece produce unique surface features (Meletis,
Nie et al. 2002; Gupta, Tenhundfeld et al. 2005). EPP- treatment might result in sub-micro-
grained surface structure and low martensite volume fraction at the top surface; which provides

182
the benefits of combination of high hardness and good corrosion resistance properties (Meletis,
Nie et al. 2002; Liang, Wang et al. 2011). It is reported that welded metals are poor corrosion
resistant when exposed to corrosive environment (Dadfar, Fathi et al. 2007). Therefore EPP
might be an important processing for post-weld treatment process to improve both corrosion
resistant and mechanical properties of welded structures. Only a handful of studies are reported
in the open literature on the use of Plasma-Electrolytic-Oxidation (PEO) coating on welded
structures, corrosion, and stress corrosion cracking related studies (Prasad Rao, Janaki Ram et al.
2008; Srinivasan, Blawert et al. 2008). But in the open literature, to the knowledge of the
authors, currently no study is reported on the effect of EPP on mechanical properties of the
welded alloy steel. This prompted the authors to conduct this current investigation on the welded
structures and joints; since welding is the largest fabrication industry in the western world; and
most marine structures fall into this category; and are susceptible to corrosion and failures due to
stress-corrosion-cracking (SCC). The duration for EPP treatment is relatively short and the
process could be used effectively in such environment.
8.2. Sample Preparation
In this study, rolled plates of AISI-4140 annealed multipurpose alloy steel with 300 mm
× 76 mm × 6.35 mm dimensions were manually gas tungsten arc (GTA)- welded utilizing SAE-
4130 chromoly filler rod. Welding was followed by natural air cooling at room temperature and
then grinding. For rational comparison among different post-weld treatment techniques, only
defect-free welded specimens were utilized. To ensure defect-free specimens, the welded and
grinded plates were tested with Olympus “Omniscan MX2.0” nondestructive phased array
ultrasonic testing (PAUT) unit. From the phased array ultrasonic testing A, B, C, and S scan
views can be obtained to find actual size, shape, and position of weld defects. Typical B and C

183
scan views from welded plates are shown in Figure 8.1. In plate 1, two defects are detected: one
defect is at the left side and another is at the right side of the plate (red color). Dog-bone
specimens were prepared by hydro-cutting from defect-free locations of the welded plates. The
specimens were again tested with PAUT. Only defect-free dogbone samples were utilized for
post weld treatment and tested in tension.
Figure 8.1: GTA- welded and grinded AISI-4140 plates and typical B and C-scan views showing
defective and defect- free region
8.3. Post-Weld Treatment (PWT) Process
Two different types of post-weld treatment (PWT) techniques (i.e. post-weld heat
treatment and electrolytic-plasma-processing (EPP)) are utilized to improve mechanical
performances of GTA-welded AISI-4140 steel. To study the influences of post-weld heat
treatment (PWHT) on the level of residual stresses and mechanical properties of the specimens,
the welded samples were subjected to two different stress-relieving heat treatment processes: i.e.,

184
(i) Annealing was done in a furnace at 650°C temperature for 1.0 hour and (ii) hardening at
500°C for 1.0 hour followed by air-cooling.
Figure 8.2: (a) Schematic and (b) experimental set-up of EPP- technique utilized on GTA-welded
AISI-4140 alloy steel
Figure 8.3: Typical SEM micrographs of steel before and after EPP- treatment
Electrolytic-plasma-processing (EPP) was applied on weld metal and heat-affected-
zones (HAZ) of the welded samples to study its ability to relieve post-weld residual stresses.
Continuously NaHCO3 electrolyte was delivered onto the sample surface through a tube
connected with porous anodic plate. The electrical conductivity of the NaHCO3 electrolyte is
43.1×10⁻³
S/cm. This connection ensures the plasma formation on the cathode side (the welded

185
samples). The applied voltage and current were (150 V) and (2 ± 0.2A), respectively; and EPP
was applied for 5 minutes on each side of welded flat samples. The schematic and experimental
set-up for EPP- treatment is illustrated in Figure 8.2. All EPP- tests were conducted at
atmospheric pressure and initiated from room temperature. Figure 8.3 shows typical SEM
micrographs before and after EPP- treatment (Liang, Wahab et al. 2011). Due to EPP- treatment,
spheroids are generated on the specimen surfaces and results in higher corrosion resistance
property (Liang, Wang et al. 2011).
Figure 8.4: Schematic illustrating different types of specimens utilized in current investigation
Five different types of specimens were tested in this study (Figure 8.4). All post weld
treated and welded specimens were compared with un-welded base specimens. Some defect- free
welded specimens were tested without applying post-weld treatment and named as as-welded
(AW) specimen. Some defect- free welded specimens were heat treated at 650 °C temperature
for 1.0 hour and named as W-HT-650 °C. Welded and heat treated at 500 °C temperature for 1.0

186
hour specimens are named as W-HT-500 °C. Welded and EPP treated specimens are named as
W_EPP. Some welded and annealed (heat- treated at 650°C) specimens were treated with EPP to
observe the combined effect. These specimens are named as HT-650 °C + EPP.
After acquiring different types of specimens, different experimental techniques including
microstructure analysis, micro-hardness testing, and tensile testing techniques are utilized to
characterize structural integrity. Obtained results are discussed from next section.
8.4. Results and Discussions
8.4.1. Effect of Fusion Arc Welding and PWT on Microstructures
Welded specimens were polished and etched with 2% Nital solution to analyze the effect
of welding heat on microstructure changes. In GTA-welded 4140 steel joint, heat- affected- zone
(HAZ) is considered as most critical section and all tensile test specimens failed near HAZ area.
Accordingly, optical micrographs are analyzed at HAZ (i.e. surface) for as welded (AW) and
EPP treated specimens and compared with base metal microstructure (Figure 8.5). The typical
microstructure of the base plate is ferrite and pearlite (Figure 8.5a). The base metal adjacent to
the weld metal is HAZ metal, which is subjected to a complex thermal cycle and rapid cooling
during the welding process. As result, HAZ region of an AW joint is composed of bainite with
small grains of pearlite (Figure 8.5b). The grains are extended compared to base metal. During
EPP- treatment, melting of surface takes place due to high temperature plasma produced within
small hydrogen bubbles. Quenching of the melted surface along with shock wave is created from
collapsing bubbles. Localize intense heating and rapid cooling during EPP treatment has resulted
in martensite or lenticular microstructure (lath) formation along with bainite and pearlite
microstructure (Figure 8.5c). This type of martensite is found in plain carbon and high strength
chromium-molybdenum alloy steels up to about 0.5 wt.% carbon. The martensite reaction is a
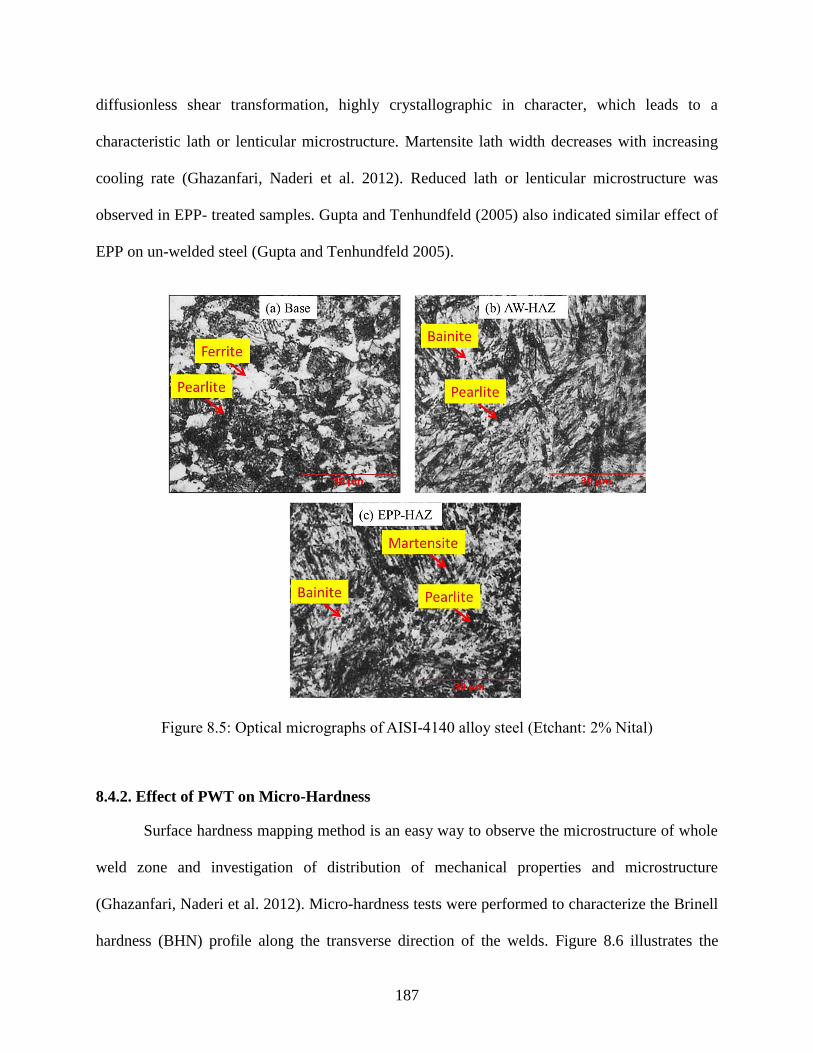
187
diffusionless shear transformation, highly crystallographic in character, which leads to a
characteristic lath or lenticular microstructure. Martensite lath width decreases with increasing
cooling rate (Ghazanfari, Naderi et al. 2012). Reduced lath or lenticular microstructure was
observed in EPP- treated samples. Gupta and Tenhundfeld (2005) also indicated similar effect of
EPP on un-welded steel (Gupta and Tenhundfeld 2005).
Figure 8.5: Optical micrographs of AISI-4140 alloy steel (Etchant: 2% Nital)
8.4.2. Effect of PWT on Micro-Hardness
Surface hardness mapping method is an easy way to observe the microstructure of whole
weld zone and investigation of distribution of mechanical properties and microstructure
(Ghazanfari, Naderi et al. 2012). Micro-hardness tests were performed to characterize the Brinell
hardness (BHN) profile along the transverse direction of the welds. Figure 8.6 illustrates the

188
hardness profile of GTA- welded AISI-4140 steel. At the interface to HAZ and weld zone is
known as fusion line, which is composed with large lath width martensite. The width of
martensite lath decreases at location closer to the weld center. So, higher hardness value is
observed in the weld center line compared to fusion line. Just after the fusion line, finer grain
region with highest hardness value is observed. Further away from that region toward base metal,
hardness value decreased for the grain coarsening effect during complex thermal cycle in the
heat-affected-zone. PWHT has resulted in grain refinement and lower difference in hardness
value between HAZ and base metal is observed. EPP- treatment does not have any significant
effect on the grain refinement. Therefore, a substantial change in hardness values is not observed
as compared with as-welded samples. Gupta and Tenhundfeld (2005) also showed that a passive
surface generated after EPP treatment, which is good for corrosion resistant, but do have
significant effect on microhardness (Gupta and Tenhundfeld 2005).
Figure 8.6: Change of Brinell micro-hardness in GTA-welded AISI-4140 steel (converted from
Rockwell 30N)
189
8.4.3. Effect of PWT on Residual Stresses
Residual stresses are essentially “locked-in” stress and a key part in determining the
overall strength of a welded component. In this study, non-destructive ultrasonic testing method
was used to measure residual stresses as discussed in chapter 3. To plot the distribution, residual
stresses were measured at five locations: 0, 5, 10, and 20 mm away from the weld centerline.
Residual stresses profile of the as-welded (AW), PWHT (650°C and 500°C), EPP- treated, and
PWHT (650°C) plus EPP- treated samples are plotted in Figure 8.7. Highest residual stresses are
generally experienced in the heat-affected-zone (HAZ) followed by fusion zone (Mei-juan and
Jin-he 2009). Away from the HAZ, the tensile residual stresses decreases and observed
compressive residual stresses. Lower tensile residual stresses are experienced in PWHT samples
for the grain refinement. As stated earlier, EPP was applied on the HAZ and fusion zone to
investigate its ability to relieve residual stresses. During EPP-treatment, a compressive thermal
shock is induced by the expansion of plasma bubbles on the surface (Gupta, Tenhundfeld et al.
2007), which helps to remove tensile residual stresses and induce compressive stresses. As a
result, lesser tensile residual stresses are illustrated in HAZ and fusion zone in EPP- treated
specimens compared to AW (As-welded) specimens. Application of EPP after PWHT did not
exhibit significant change on residual stresses, which is attributed to the fact that residual stresses
are already relieved by grain refinement during PWHT at 650°C. As stated earlier, acoustoelastic
constant is applicable only in the elastic range of the material. If the residual stress is above the
yield strength, acoustoelasticity may not be used to measure residual stresses. In his study, the
measured residual stresses (highest value was about 600 MPa) are quite below than the actual
yield strength (about 758 MPa) of AISI4140 steel. So, the use of acoustoelasticity to measure
residual stress is justified.

190
Figure 8.7: Distribution of residual stresses in GTA- welded AISI-4140 alloy steel
Once microstructures, micro-hardness and residual stress analysis are done; uniaxial tensile tests
are accomplished to understand the effect of post weld treatments on tensile properties. Tensile
test results and fractographs analysis are discussed in next section.
8.4.4. Effect of PWT on Uniaxial Tensile Test Results
Uniaxial transverse tensile stress strain curves of base metal (Base), as-welded (AW),
PWHT (W_HT_500°C and W_HT_650°C), and EPP- treated (W_EPP, W_HT_650°C_EPP)
samples are shown in Figure 8.8. Tensile stress-strain curve is utilized to calculate yield strength,
ultimate tensile strength and tensile toughness properties of different specimens. The average
0.2% offset yield stress and ultimate tensile strength of base materials are 758 MPa and 836
MPa, respectively. Corresponding values for as- welded specimen are 700 MPa and 839 MPa.
As welded specimens resulted about 39% lower failure strain as compared to base metal. GTA-

191
welded samples failed by pure shear fracture mode, resulting from the dislocation slip
(Arivazhagan, Singh et al. 2011; Kumar and Shahi 2011).
Figure 8.8: Tensile stress strain curves of GTA- welded AISI-4140 steel
The ability of a metal to deform plastically and to absorb energy in the process before
fracture is termed toughness. Toughness, which is measured by calculating the area under the
tensile stress strain curve, is a combination of stress levels and ductility. The key to improve
toughness is a good combination of strength and ductility. Note that the ductility is the ratio
between ultimate strain and yield strain. About 37% reduction in toughness value is observed
due to welding. Reduction in strength and ductility of welded joints can be attributed to the
prominent increase of grain size near the fusion zone (Mohandas, Banerjee et al. 1998; Kumar
and Shahi 2011). Improvement in ductility and reduction in yield strength is observed after
PWHT at 650 °C. This may be attributed to the decomposition of martensite and the grain
coarsening of alpha phase, which makes easy inter-granular slip and dislocation movement. In

192
addition, the yield point might locally be reached earlier because of the decrease of residual
tensile stress after PWHT, thus leading to an overall reduction in yield strength. About 88%
higher toughness is achieved by PWHT at 650 °C compared to as welded samples. PWHT at 500
°C does not have any significant effect on the tensile strength and ductility of GTA- welded 4140
alloy steel.
EPP-treated samples showed 743 MPa and 912 MPa, yield strength and ultimate strength,
respectively. The highest tensile strength of the welded joint after EPP- treatment is related with
the presence of fine martensitic structure in weld and HAZ metal, and removal of residual
stresses. Martensitic structures restricted the dislocation movement through the intragranular
region and results in lower ductility as well as lower toughness. As a result, only 10% toughness
improvement was perceived compared to as-welded samples. EPP was applied on welded
annealed samples (PWHT at 650 °C) to observe the effect on tensile strength. The results show
that EPP after PWHT do not exhibit any significant effect on the tensile strength and toughness,
as EPP works on the surface, which limits its effect on the grain refinement. However, when EPP
is applied on the as-welded samples, it relieved residual stress and resulted in higher tensile
strength. The summary of the uniaxial test results is given in Table 8.1.
Table 8.1: Tensile test results of GTA- welded AISI- 4140 alloy steel
Tensile properties Base AW HT_500°C HT_650°C EPP HT_650°C+ EPP
Yield Strength (MPa) 758.3±20.1 700.5±14.5 698.9±5.7 618.2±20.4 743.7±12.5 627.6±11.2
Ultimate Strength (MPa) 836.3±6.0 839.2±22.8 837.7±7.3 774.5±14.4 912.2±5.9 805.6±12.2
Failure Strain (%) 9.54±0.7 5.80±0.3 7.11±0.2 11.52±0.5 6.33±0.3 8.70±0.7
Toughness (MJ/m³) 65.98±4.9 41.44±4.6 46.51±3.8 78.09±3.9 46.76±4.1 58.25±4.8
Ductility 3.77±0.22 2.71±0.16 3.41±0.10 5.90±0.23 3.08±0.15 4.34±0.30

193
8.4.5. SEM Fractographs
The fracture surfaces of the specimens are characterized using SEM to understand the
modes of failure pattern. The SEM images (Figure 8.9 (a, b, c, d)) are taken at the center of the
failure surface of base, as-welded, PWHT 650°C, and EPP-treated samples.
Figure 8.9: Fracture surface of tensile tested 4140 steel- a. base metal, b. as- welded, c. heat-
treated (650°C), d. EPP treated (middle), and e. EPP- treated (near surface) specimens

194
The micrographs indicate that all the surfaces invariably consist of dimples, which is of typical
indication of ductile fracture. During tensile testing of ductile materials, voids are formed prior to
necking. If the neck is formed earlier, the void formation would be much more prominent; and as
a result, coarse and elongated dimples can be seen. Cleavage, which is the separation along
particular crystallographic planes is the foremost fracture mechanism shown by base metal
(Rubio-Gonzalez, Gallardo-Gonzalez et al. 2008). The as-welded tensile specimens fail by shear
in the heat-affected-zone and have resulted in finer dimples. Grain refinement occurred due to
PWHT at 650°C and turns into more ductile. As a consequence, cup and cone fracture surface
with coarse and elongated dimples are detected. Figure 8.9(e) is taken near surface of EPP-
treated sample. By comparing, Figure 8.9(d) and (e), it can be concluded that the EPP works only
on surface and have no significant effect on the bulk materials. As a result, core of the EPP-
treated specimens seems similar to AW specimens, but subsurface fracture seems finer dimples
with brittle fracture. The specimens after EPP- treatment has failed by quasi-cleavage fracture.
The petal-like cleavage faces and the tearing edges are observed in the rupture surface (Lin,
Starke et al. 1984).
8.5. Summary
Post-weld treatment (PWT) is commonly adopted on welded steel joints and structures to relieve
post-weld residual stresses; and restore the mechanical properties and structural integrity. An
electrolytic-plasma-processing (EPP) has been studied to improve corrosion behavior and wear
resistance of structural materials; and can be employed in other applications and surface
modifications aspects. In this study, the effects of PWHT and EPP-treatment on the residual
stresses, micro-hardness, microstructures, and uniaxial tensile properties are explored on gas
195
tungsten arc welded AISI-4140 alloy steel with SAE-4130 chromium-molybdenum alloy
welding filler rod. The following general conclusions can be drawn from this study:
The reduction in ductility and toughness is common in GTA- welded low alloy steel for
the development of tensile residual stresses and martensitic microstructures in HAZ and
weld zone. Consequently, as-welded (AW) samples showed about 39% and 37%
reduction in failure- strain and toughness values, respectively, compared to the base
metal.
Post-weld heat treatment (PWHT) is a general practice to relieve post-weld tensile
residual stresses and improve mechanical properties of welded AISI- 4140 alloy steel.
About 88% increase in toughness values and 12% lower yield strength was achieved by
PWHT at 650 °C compared to as-welded samples. This might be related to the
decomposition of martensite, grain refinement, and removal of tensile residual stresses
due to PWHT.
The electrolytic-plasma-processing (EPP) is developed to improve different materials
surface properties, especially the corrosion resistance property. EPP was applied on HAZ
and weld zone of GTA-welded AISI-4140 steel to improve tensile properties. EPP-treated
samples showed 743 MPa and 912 MPa yield and ultimate strength, respectively.
Corresponding values for the AW samples were 700 MPa and 839 MPa. The highest
tensile strength of EPP- treated sample is related with the presence of fine martensitic
structure in weld and HAZ metal; and removal of residual stresses by shock wave
generation from collapsing hydrogen bubbles. Due to the presence of fine martensitic
microstructures, surficial EPP-treatment has resulted in about 10% improvement in
toughness as compared to AW samples.

196
EPP-treatment might be a good candidate technology to improve tensile strength by
relieving of post-weld tensile residual stresses, as well as imparting corrosion resistant
property of GTA- welded low alloy and high strength steel structures.
EPP treatment takes very short time as compared to PWHT. For this particular study,
EPP was applied for only 5 minutes on each side of the dogbone specimens. So, it took
only 10 minutes to apply EPP on weld and HAZ area of each dogbone specimen.
Whereas, PWHT requires very high temperature and longer time which is time
consuming, expensive, and sometime difficult to apply for large welded structures.
Instead, EPP could be easily applied to a targeted area such as weld and HAZ area of
large welded structures to improve mechanical and corrosion performances.

197
CHAPTER 9 : EFFECTS OF ROTATING, BENDING, AND TORSIONAL
FATIGUE LOADS ON WELDED STEEL JOINT
9. Introduction
In the last five chapters (Chapters 4, 5, 6, 7, and 8) structural integrity and post-weld
treatment of two different aluminum alloys and alloy steel joints are discussed. For structural
integrity analysis of weld joints non-destructive test, uniaxial tensile test, micro-hardness test,
and microscopic analysis were performed. But many welded structures are subjected to
multiaxial fatigue load in real life situations and majority of the fatigue failure initiated from
weld joints. Therefore, it is important to evaluate multiaxial fatigue behavior of commonly
utilized welded materials, although, in general fatigue test results are reported for uniaxial
fatigue test (i.e. tensile-compression or rotating-bending). In the current investigations, the
influence of rotating-bending fatigue load along with pulsed torsional load was evaluated on
commonly used welded steel. A rotating-bending-torsional (RBT) fatigue testing unit was
specifically designed and fabricated for biaxial fatigue test of welded and non-welded R.R.
Moore specimens. For welded specimens, gas tungsten arc welding (GTAW) was carried out on
19.05 mm diameter round bar of AISI 1018 steel with ER-70S2 filler metal (Electrode). For
rational comparison, only defects-free specimens were carefully chosen and tested. After
welding, uniaxial tensile test was conducted to understand the fatigue loading criteria during
rotating-bending fatigue test. Rotating-bending (RB) and rotating-bending-torsional (RBT)
fatigue tests were conducted to obtain a systematic understanding of biaxial fatigue behavior.
Moreover microstructural characterization and fracture surface analysis were performed to
understand the fracture behavior of the tested specimens.

198
9.1. Scope
Multiaxial stress is a state of stress where two or more stress components act on a critical
plane of the structure. Railroad and vehicular bridges are known for sustaining static and cyclic
loads that might vary according to the service conditions such as, traffic loads, temperature
changes, or wind gusts. Welded pressure vessel components, gas turbines, power plants are also
subjected to cyclic loading (Wei and Dong 2010). Therefore, the fatigue behavior of the
structural materials is an important factor that needs to be taken into consideration during
designing. The vast majority of component fatigue failures go on at the weld joints (Rolfe and
Barsom 1977; Bokesjö, Al-Emrani et al. 2012). Uniaxial fatigue and rotating-bending fatigue
analysis is common for welded structures (Gurney 1979; Mac Henry and Potter 1990; Schütz
1996; G.M. Almaraz, M. Tapia et al. 2010). But many welded engineering structures are
subjected to multiaxial or biaxial stresses e.g. vehicle frames and bogies (Bäckström and
Marquis 2001). A handful studies reported on the effect of biaxial loading (e.g. bending and
torsion) on different welded structures (Yung, Lawrence et al. 1985; Sonsino 1995; Sonsino and
Kueppers 2001; Takahashi, Takada et al. 2003; Pelton, Fino-Decker et al. 2013). Current
experimental investigations executed to obtain multiaxial fatigue data of weld joint and help
engineering community to design more reliable welded structures. Among different engineering
materials, AISI 1080 steel is commonly used structural materials in different industrial
applications for its easy weldable and surface hardenable quality (G.M. Almaraz, M. Tapia et al.
2010). It is especially suitable for carburized parts requiring soft core and high surface hardness,
such as: gears, pinions, worms, ratchets, etc. In the current investigations, rotating-bending-
torsional fatigue tests are conducted on cold-drawn GTA-welded AISI-1018 low carbon steel
specimens. The influences of a torsional pulsed load are emphasized for both non-welded and
welded specimens.

199
9.2. Sample Preparation
General purpose cold-drawn AISI-1018 low carbon steel rod with 19.05 mm diameter
were gas tungsten arc (GTA)- welded using ER70-S2 filler rod according to AWS welding codes
for steel (AWSD1.1/D1.1M 2010). Before welding, a 254 mm long rod was cut into half and 33o
bevel groove was machined on both pieces. For alignment during welding process, the
specimens were placed in horizontal position using a three jaw chuck and rotated at 5 RPM while
multi-pass welding was completed. Welding was followed by natural air cooling at room
temperature. Once welding is done, specimens were machined according to ASTM standard
ASTM E466-07 (ASTM-International 2007) and R.R. Moore fatigue test specimens are
prepared. In Figure 9.1, welded AISI-1018 steel specimens are shown- (a) before machining, (b)
after machining.
Figure 9.1: Picture of welded rods and R.R. Moore fatigue test specimens

200
9.3. Results and Discussions
9.3.1. Effect of Welding on Uniaxial Tensile Test and Fracture Morphology
Uniaxial tensile test was performed to estimate the fatigue stress and observe the effect of
GTAW on tensile behavior. Figure 9.2 shows tensile stress-strain curve of non-welded (NW) and
welded (W) AISI 1018 low carbon steel. Tensile stress-strain curve is utilize to calculate tensile
strength, elongation and energy required (i.e. toughness) to break specimens. About 18%
decrease in ultimate tensile strength (UTS) and 5% increase in toughness are observed in GTA-
welded AISI- 1018 carbon steel as compared base metal (Table 9.1). Lower tensile strength in
welded specimens might be related to microstructure changes and residual stress development
during welding process. Then again, higher toughness in welded specimen is related to the use of
low carbon in filler metal (i.e. 0.04% carbon in filler metal and 0.18% carbon in base metal).
Figure 9.2: Effect of welding on uniaxial tensile stress strain curve

201
Table 9.1: Tensile test results and joint efficiency (JE) of GTA-welded AISI-1018 steel
UTS, MPa Toughness, MJ/mm
3
JE (%), UTS JE (%), Toughness
AISI 1018-NW 676.22 ± 7 83.55 ± 3.4 100.00 100.00
AISI 1018-W 563.52 ± 14 87.74 ± 7.1 83.33 105.02
For further investigations, scanning electron microscopic (SEM) fractographs and optical
micrographs are analyzed. Fractographs are used to understand fracture behavior and tensile
properties of weld joints. Optical micrograph provides information about fracture initiation sites
and mechanical behavior. Figure 9.3 shows the SEM fractographs of non-welded (NW) and
welded (W) AISI-1018 low carbon steel. Smaller dimples in un-welded specimens are related to
higher tensile strength of base metal. Elongated and larger dimples in welded specimens are
related to lower tensile strength and higher ductility of welded specimens.
Figure 9.3: Scanning electron microscopic (SEM) fractographs of tensile tested specimens
Tensile tested welded specimen failed from weld and heat-affected-zone (HAZ). Optical
micrographs are analyzed to understand the fracture initiation sites in tensile test specimens.
Figure 9.4 shows optical micrographs of base, HAZ, and weld metal of AISI 1018 steel. Base

202
metal composed of ferrite-pearlite microstructure where pearlite is dispersed on the ferrite
matrix. HAZ is known as grain refinement region where peak temperature reaches just above
austenitic critical temperature. At that temperature, austenite grains nucleate and later
decomposed into small pearlites and ferrite grains during subsequent cooling. The distribution of
pearlite and ferrite are not uniform because of limited diffusion time for carbon under high
heating rate during welding (Kou 2003). Weld metal microstructure has a ferrite-pearlite
microstructure as well; but since the carbon content of the filler metal is lower compared to the
base metal, the white ferrite matrix is larger with less two-phase pearlite structure. Less carbon
also related to higher toughness and lower tensile strength in welded specimens. On the other
hand, acicular ferrite structures developed in the weld zone due to welding heat. Acicular ferrite
is desirable because it improves toughness of the weld metal in association with fine grain size.
Figure 9.4: Optical micrographs of AISI 1018 steel- (a) base metal, (b) HAZ metal and (c) weld
metal

203
Once tensile and fracture behaviors are identified a systematic biaxial fatigue tests are
performed. Biaxial fatigue analysis starts with the rotating-bending (RB) fatigue test followed by
rotating-bending-torsional (RBT) fatigue test.
9.3.2. Rotating-Bending-Torsional Fatigue Test Results
Initially rotating-bending (𝑅𝐵) fatigue test was performed on base metal and compared
with literature to evaluate designed rotating-bending-torsional fatigue testing unit. Rotating-
bending fatigue test S‐N curve for AISI-1018 steel is shown in Figure 9.5. Fatigue life decreases
with the increase of bending stress, which is understandable. Rotating-bending (AISI 1018-NW-
RB) fatigue life obtained from current investigations is compared with literature results (Perovic
2007; G.M. Almaraz, M. Tapia et al. 2010) and the experimental results correlate well with
literature results. For non-welded specimens, 103 cycle bending fatigue strength (𝜎𝑓) is about
628 MPa and ultimate tensile strength (𝜎𝑢) is 676 MPa. The ratio between 𝜎𝑓 and 𝜎𝑢 is 0.93
which is close to value mentioned for R.R. Moore fatigue test (Juvinall and Marshek 2011).
Now, rotating-bending fatigue life of welded (W) and non-welded (NW) specimens is compared.
For welded specimen, 103 cycle bending fatigue strength (𝜎𝑓) is about 512 MPa and ultimate
tensile strength (𝜎𝑢) is 563 MPa. So, the ratio between 𝜎𝑓 and 𝜎𝑢 is 0.91 for welded specimens.
Whereas, at 105 rotating bending fatigue life, the ratio between fatigue strength and ultimate
tensile strength is 0.55 and 0.48, respectively for non-welded (NW) and welded (W) specimens.
Welded specimens showed lower RB fatigue strength as compared to non-welded specimens.
About 29% reductions in rotating-bending fatigue strength are observed in welded specimens as
compared to NW specimens (at 105cycles). This can be attributed to reduction on tensile and
development of residual stresses due to welding. Similar behavior also showed for laser welded
NiTi alloy wire in (Yan, Yang et al. 2006).

204
Figure 9.5: Effect of welding on rotating-bending (RB) fatigue life
Now, the effects of torsional load are investigated for welded (W) and non-welded (NW)
specimens separately. The comparative S-N curves on Figure 9.6 and Figure 9.7, illustrate results
obtained from rotating-bending (RB) and rotating-bending-torsion (RBT) fatigue tests. As
observed, for base metals, the application of the torsional load has no major effects on the fatigue
strength at higher bending strength level. Trend-lines for both RB and RBT loading conditions
overlap. Tendency that derived from two different causes: First, when comparing the maximum
bending stresses and the first principal stresses (calculated from Mohr circle considering
torsional load); maximum difference between bending and first principal stress is in the order of
1.0 MPa. The amount of applied torque is only 2.7 percent of the ultimate tensile strength (UTS)
of base metal. Secondly, the pulse-torque application at every 2000 cycles might not reflect on
the final results. However, at lower bending stress level, torsional stress has an effect on fatigue
strength and RBT fatigue life reduces as compared to RB test (Figure 9.6). At 105 cycles, the
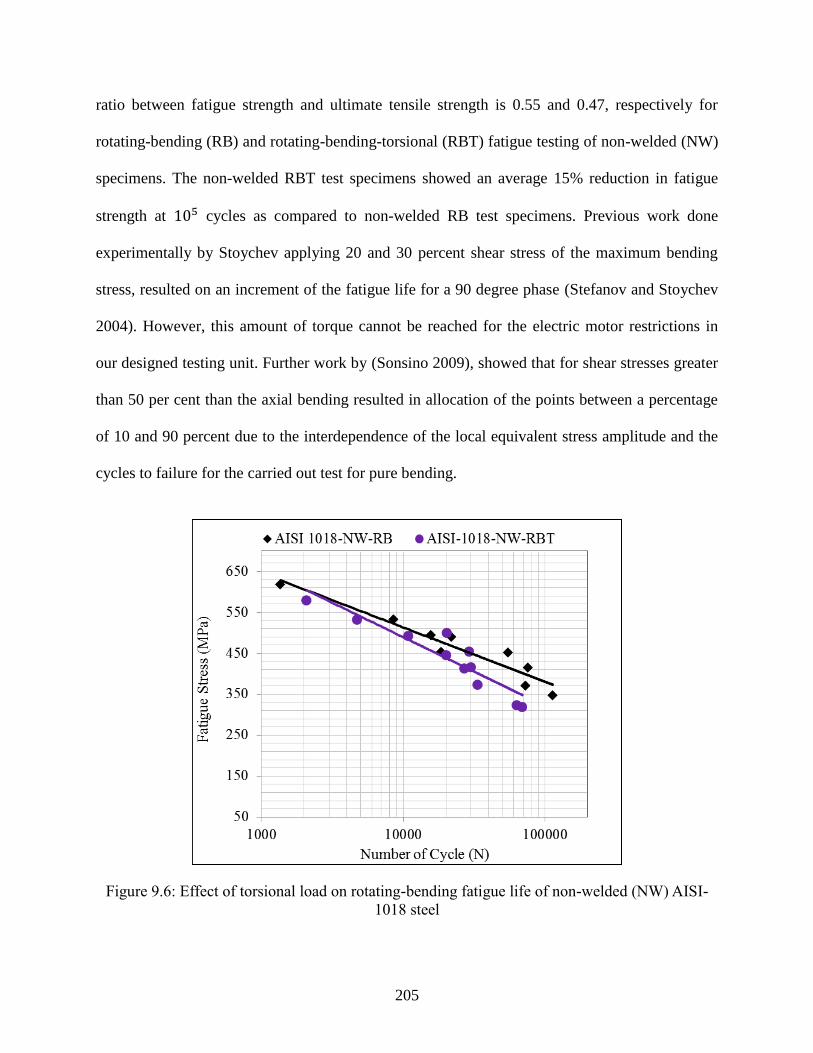
205
ratio between fatigue strength and ultimate tensile strength is 0.55 and 0.47, respectively for
rotating-bending (RB) and rotating-bending-torsional (RBT) fatigue testing of non-welded (NW)
specimens. The non-welded RBT test specimens showed an average 15% reduction in fatigue
strength at 105 cycles as compared to non-welded RB test specimens. Previous work done
experimentally by Stoychev applying 20 and 30 percent shear stress of the maximum bending
stress, resulted on an increment of the fatigue life for a 90 degree phase (Stefanov and Stoychev
2004). However, this amount of torque cannot be reached for the electric motor restrictions in
our designed testing unit. Further work by (Sonsino 2009), showed that for shear stresses greater
than 50 per cent than the axial bending resulted in allocation of the points between a percentage
of 10 and 90 percent due to the interdependence of the local equivalent stress amplitude and the
cycles to failure for the carried out test for pure bending.
Figure 9.6: Effect of torsional load on rotating-bending fatigue life of non-welded (NW) AISI-
1018 steel

206
Similar trends are also observed for welded specimens and reported by other researchers as well
(Wahab and Sakano 2003). However, for the welded specimens there is a noticeable difference
observed at higher cycles when the pulsating torsional load is applied. At 105 cycles, the ratio
between fatigue strength and ultimate tensile strength (i.e. welded specimen) is 0.48 and 0.37,
respectively for rotating - bending (RB) and rotating-bending-torsional (RBT) fatigue testing of
welded (W) specimens. The welded RBT test specimens showed an average 22% reduction in
fatigue strength at 105 cycles as compared to welded RB test specimens. The effect of torsion at
lower stress level is more notable (Figure 9.7).
Figure 9.7: Effect of torsional load on rotating bending fatigue life of welded (W) AISI 1018
Steel
As it is observed from tensile test, the welded specimen exhibits lower UTS as compared to non-
welded specimen. But the magnitude of applied torsional stress is same. So, the amount of

207
applied torque is higher in proportion as compared to base metal case. That might be one of the
causes of higher reduction in fatigue strength in RBT fatigue testing case of welded specimens.
Another reason might be the difference in microstructure at the core and surface of the weld
joints. During multi-pass welding, dissolution of δ occurs in weld core due to reheating below γ-
solvus temperature. Lower ferrite causes reduced ductility and consequence to faster crack
propagation during RBT test.
Now, the effect of welding on rotation-bending-torsion (RBT) fatigue life is investigated
for AISI-1018 low carbon steel (Figure 9.8). Similar to rotating-bending (RB) loading
conditions, welded specimens showed lower fatigue life as compared to non-welded specimens.
This might be related to the effect of torsional load on fatigue life. Torsional stress remained
fixed throughout the experiment. Therefore, at lower bending stress, effect of torsional stress is
significant. But at higher bending stress the effect of small proportion torsional stress (percentage
of bending stress) is also small.
Figure 9.8: Effect of welding on rotating-bending-torsional (RBT) fatigue life

208
The biaxial fatigue behavior of GTA-welded and non-welded AISI-1018 steel specimens is
discussed above. Welded specimens exhibited lower rotating-bending fatigue strength as
compared to base metal. Effect of pulsating torsional load is also analyzed on rotating-bending
fatigue life of welded and non-welded specimens. Pulsating torsional load has stronger effect on
welded specimens. It is also important to analyze fracture behavior of fatigue tested specimens to
understand the reasons of failure and fatigue strength variations in different specimens. Fracture
morphology of fatigue tested specimens is analyzed in next sanction.
9.3.3. Fracture Morphology of Fatigue Tested Specimens
Fatigue crack generally initiated from the surface and then propagate through the cross
sections of the critical section. For all specimens, shear failure mode observed due to rotating-
bending-torsion (RBT) fatigue loading (Figure 9.9). Figure 9.10 shows optical image and SEM
fractographs near surface and core of the specimen. A clear difference is observed between core
and surface fractographs. More fracture dimples are observed near the core as compared to near
the surface fractographs. This may have happened due to tension-compression loading nature of
RBT fatigue test.
Figure 9.9: Photograph of rotating-bending-torsional (RBT) fatigue tested welded specimen

209
Figure 9.10: Fracture morphology variation from center to surface of the rotating-bending-
torsional (RBT) fatigue tested AISI-1018 Steel
Figure 9.11 shows the SEM fractographs of non-welded (NW) and welded (W) AISI-1018 steel
after rotating-bending (RB) and rotating-bending-torsion (RBT) tests. Trans-granular fracture,
featuring cleavage facets and secondary cracks are observed in all fractographs (Wang, Duan et
al. 2014). There is no significant difference is observed un-welded specimens. The fracture
surface of un-welded metal is still in the ductile mode and it is evident from the presence of
dimples. Welded specimens also showed ductile fracture behavior, but the shape and size of the
dimples are different and it is influenced by the microstructure of the weld metal region. Due to
torsional loading, welded RBT specimens observed to have larger trans-granular fracture as
compared to welded RB specimens.

210
Figure 9.11: Effect of rotating-bending (RB) and rotating-bending-torsional (RBT) fatigue on
fracture morphology of AISI 1018 steel
9.4. Summary
Most welded structures are subjected to multiaxial fatigue load and majority of the
fatigue failure initiated from weld joints. Therefore, it is important to evaluate multiaxial fatigue
behavior of commonly used welded materials. In the current investigations, the influence of
rotating -bending fatigue load along with torsional pulsed load was appraised for most
commonly used AISI-1018 low carbon steel. A multi-axial rotating-bending-torsion fatigue
testing unit was successfully designed and manufactured to evaluate the effect of biaxial load on
211
welded specimens. The effects of rotating-bending and pulsating torsional load was studied on
welded (W) and non-welded (NW) AISI-1018 low carbon steel rods. Additionally, an attempt to
evaluate the failure mechanisms was studied by evaluating characteristic microstructure and
surface fractographs. After evaluating all the retrieved data, the following general conclusions
can be drawn:
Due to welding, rotating-bending (RB) fatigue strength of AISI 1018 carbon steel reduced by
about 29% when compared to the base metal (at 105 cycles). It was also observed that crack
initiation and final failure occurs at the HAZ and weld metal of welded specimens due to
grain refinement and residual stresses.
Under combined loading condition (RBT), welded specimens fatigue strength was reduced
by about 22% as compared RB fatigue strength of welded specimens (at 105 cycles)
All fracture surfaces invariably comprised of fracture dimples indicating ductile failure
during fatigue tests. Fatigue failure initiated from surface of the specimens and propagated
towards the critical section of the specimens.

212
CHAPTER 10 : CONCLUSIONS AND RECOMMENDATIONS FOR
FUTURE WORK
10. Overview
Various welding techniques are extensively utilized within manufacturing sectors for
various structures ranging from bridges and machinery to all kinds of automobiles, marines,
nuclear reactors, and space vehicle, etc. But the welding process involves different types of
complications such as weld defect, microstructure changes, distortion, and post-weld residual
stresses, which are responsible for performance reduction as well as, failure of welded structures.
Hence, structural integrity analysis and performance improvements of weld joints are extremely
important issues which need to be addressed. In this PhD research, an extensive analysis was
accomplished on the challenges towards structural integrity analysis and performance
improvement of different weld joints. Two different types of welding techniques (friction- stir-
welding and gas tungsten arc welding) were employed on widely utilized aluminum alloys of
two different types and two different structural steels joints. Different destructive and non-
destructive testing techniques were utilized for structural integrity analysis of different welded
joints. Different post-weld treatment techniques were also employed to improve mechanical
performances of different weld joints. Conclusions and future works of this current research are
discussed below.
10.1. Conclusions
In this PhD research, an extensive analysis on structural integrity and performance
improvement of different weld joints are addressed. The work herein is divided into six different
sections including: (i) FSW defects linked to weld process parameters; (ii) FSW joint strength
estimation from weld process parameters; (iii) Effects of PWHT on friction-stir (FS) - welded

213
aluminum alloys; (iv) Influence of weld-defects and PWHT on fusion arc welded aluminum
alloys; (v) Influence of PWHT on welded steel joint; and finally, (vi) Biaxial fatigue behavior of
welded steel joints. Detail conclusions related to each section are discussed at the end of each
chapter. A comprehensive summary of the complete work is discussed below.
10.1.1. FSW Process Parameters Correlated to Weld Defects
The solid-state FSW technique involves several critical process variables that affect the
overall quality of the weld produced; consequently, it is difficult to accurately predict the most
favorable process parameters to acquire high quality defect-free welds. This is one of the most
important challenges the FSW research is facing now-a-days and considerable international
efforts are ongoing throughout the world into this new research challenges. Defects arising in
FS- welding in 8.13 mm thick high strength aluminum alloy AA2219-T87 were correlated with
FSW weld process parameters from an assortment of different weld schedules generating
considerably large amount of experimental data (i.e. 66 data). The welds were classified into
three major categories (hot, nominal, and cold welds based on the three critical process
parameters (spindle rotational speed, weld speed, and plunge force), non-destructively evaluated
weld defects, and the results from tensile tests. Hot-welds (refer to higher plunge force or higher
spindle rotational speed or lower welding speed in comparison to optimal parameters) were
found to have Small-Voids and underfills; cold- welds (refer to lower plunge force or lower
rotational speed in comparison to optimal parameters) were observed to have Wormholes (WH),
Trenching (TR) and incomplete penetration (IP); and on the other hand, nominal- welds (refers
to local optimum process parameters) had no weld defects. From the point of view of
experimental investigations, an FSW process parameter window and a new empirical correlation
(i.e., “empirical force index-EFI”) were established for effective joining of AA2219-T87. This

214
novel empirical correlation relates the three critical process parameters and was found to
successfully distinguish among hot, nominal, and cold weld schedules. Weld schedules within
0.90 < 𝐸𝐹𝐼 ≤ 1.14 yielded zero defects and produced optimal mechanical properties. These
schedules were labeled “nominal” weld. Weld schedules with 𝐸𝐹𝐼 ≤ 0.90 were labeled “cold”
welds. Weld schedules with 𝐸𝐹𝐼 > 1.14 were labeled “hot” welds.
10.1.2. ANFIS Model to Predict Tensile Strength of FSW Joint
From experimental analysis it was observed that the FSW joint properties are very much
dependent on the weld parameters. For this reason, it is important to obtain a correlation between
these weld parameters and mechanical properties of weld joints. Utilizing experimental data, an
optimized “adaptive neuro-fuzzy inference system (ANFIS)” model was developed to predict
ultimate tensile strength (UTS) of FSW joints. Efforts were made to determine the best model
based on the best combination of input variables, parameter optimization, and fuzzy inference
architecture. Tensile strength obtained from the ANFIS model was thereafter compared with the
experimental results, by calculating “root-mean-square-error (RMSE)” and “mean-absolute-
percentage-error (MAPE)” values. For comparison, optimized artificial neural network (ANN)
model was also developed to predict UTS from FSW process parameters. A total of 1200
different ANFIS models were developed by varying number of membership functions (MFs),
type of membership function, and combination of four input variables (𝑁, 𝑉, 𝐹𝑧 , 𝐸𝐹𝐼). It was
found that the ANFIS model with three input variables (𝑉, 𝐹𝑧 , 𝑎𝑛𝑑 𝐸𝐹𝐼) has resulted in the
lowest RMSE and MAPE values of 29.7 MPa and 7.7%, respectively. The ANN model with the
similar three input variables (𝑉, 𝐹𝑧 , 𝑎𝑛𝑑 𝐸𝐹𝐼) also has resulted in minimum RMSE (36.7 MPa)
and MAPE (10.09 %); however, error of the best ANN model is larger than those of the

215
optimized ANFIS model. The developed best ANFIS model can be applied to select weld
process parameters to achieve desirable joint strength.
10.1.3. Effects of PWHT on FS- Welded Aluminum Alloys Joints
FSW offers significantly better performance on aluminum alloy joints compared to the
conventional fusion arc welding techniques; however, plastic deformation, visco-plastic flow of
metals, and complex non-uniform heating cycles during FSW processes, result in dissolution of
alloying elements, intrinsic microstructural changes, and post-weld residual stress development.
As a consequence, about 30% reduction in UTS and 60% reduction in yield strength (YS) were
observed in defect-free, as-welded AA2219-T87 joints. PWHT is a common practice to refine
grain-coarsened microstructures which removes or redistributes post-weld residual stresses; and
improves mechanical properties of heat-treatable welded aluminum alloys by precipitation
hardening. An extensive experimental program was undertaken on PWHT of FS- welded
AA2219-T87 to obtain optimum PWHT conditions and improvement of the tensile properties.
Artificial age-hardening (AH) helped in the precipitation of supersaturated alloying elements
produced around weld nugget area during the welding process. As a result, an average 20%
improvement in YS and 5% improvements in UTS was observed in age- hardened (AH-170°C-
18h) specimens as compared to AW specimens. To achieve full benefit of PWHT, solution-
treatment followed by age-hardening (STAH) was performed on FS-welded AA2219-T87
specimens. Solution-treatment (ST) helps in the grain refinement and formation of supersaturated
precipitates in aluminum alloys. Age-hardening of ST specimens help in the precipitation of
alloying elements around grain boundaries and strengthen the specimens. Longer aging time
usually results in over precipitation as well as precipitation-free zone which are related to reduce
ductility of aluminum alloy joints. Therefore, optimum aging period is important to achieve

216
better mechanical properties. For FS- welded AA2219-T87 peak aging time was 5 hours at
170°C. STAH-170°C -5h treated specimens showed about 78% JE based on UTS, 61% JE based
on yield strength, and 36% JE based on tensile toughness values of base metal.
10.1.4. Effects of Weld Defects and PWHT on Fusion Arc Welded (GTAW) Aluminum
Alloys Joints
In many applications fusion arc welding techniques are employed to join various
aluminum alloys. Weld defects and the reduction of mechanical performances are the foremost
problems for fusion arc welded aluminum alloy joints. The influence of weld defects and PWHT
on tensile properties of GTAW, employing AA6061-T651 was investigated. All welded
specimens were non-destructively inspected with “phased array ultrasonic testing (PAUT)” to
classify weld- defects and to measure the projected weld-defect’s “area-ratio”. It was found that
UTS value decreased linearly with the increase of the size of the weld-defects but tensile
toughness behaved non-linearly with the change of defect sizes. Defect-free, as-welded
specimens observed to have 53% joint efficiency based on UTS and 34% joint efficiency based
on YS of base metal. Furthermore, PWHT was applied on defect-free welded specimens to
improve tensile properties by precipitation hardening, microstructure refinement, and removal of
post-weld residual stress. Optimum PWHT specimens showed roughly 85% joint efficiency
based on UTS and up to 71% joint efficiency based on YS of base metal.
10.1.5. Effect of Post-Weld Treatment (PWT) on Fusion Arc Welded Steel
In many structural applications, alloy steels are utilized for their high strength and high
stiffness properties. The effect of fusion arc welding on structural integrity of high strength AISI-
4140 steel was thereby investigated. Unlike aluminum alloy joints, weld-defects are not
generally a prime concern for steel joints. Post-weld residual stresses, microstructure changes,

217
and unstable brittle fracture are few of the unavoidable problems for alloy steel joints.
Consequently, as-welded (AW) samples showed about 39% and 37% reduction in failure- strain
and toughness values, respectively, compared to the base metal. The PWHT is a common
practice to relieve undesirable post-weld (locked-in) residual stresses and improves mechanical
properties of welded steel joints by grain refinement. Due to the nature of the control
mechanisms sometimes, PWHT is difficult to control and apply effectively according to the
recommendations; and this procedure can be expensive and time-consuming. For this reason the
author has explored different surface modification processing technique including an
“electrolytic-plasma-processing (EPP),” a novel technique for surface modification and strength
improvement. The effects of PWHT and EPP on the residual stresses, micro-hardness,
microstructures, and tensile properties are explored on Gas Tungsten Arc- welded AISI-4140
alloy steel. The PWHT resulted in relief of undesired tensile residual stresses due to grain
refinement. As a consequence higher ductility but slightly lower strength existed in PWHT
samples. In comparison, EPP- treated samples revealed lower residual stresses but no significant
variation on grain refinement. Consequently, EPP- treated specimens exhibited higher tensile
strength but lower ductility and toughness values for the martensitic formation, which was due to
the rapid heating and quenching effects of the EPP.
10.1.6. Effects of Multiaxial Loads on Fatigue Behavior of Fusion Arc Welded Steel
Most welded structures are subjected to multiaxial fatigue loading in actual service
conditions, and the majority of the fatigue failure initiates from the grain-coarsened weld joints.
Therefore, it is important to evaluate multiaxial fatigue behavior of commonly utilized welded
joints. In this study, the influence of “rotating-bending (RB)” fatigue load along with the pulsed
torsional loading was evaluated on commonly used GTA-welded steel (i.e., AISI-1018). A

218
“rotating-bending-torsional (RBT)” fatigue testing unit was specifically designed for this purpose
and fabricated for biaxial fatigue testing of welded and non-welded R.R. Moore specimens. Both
RB and RBT fatigue tests were conducted to obtain a systematic understanding of the biaxial
fatigue behavior. The RB fatigue life of welded specimens reduced considerably (i.e. about 29%
lower fatigue strength at 105 cycles), compared to base material specimens in welded specimens
as a result of the complex thermal cycle and microstructural changes during the welding process.
Under the combined loading conditions of RBT, the average fatigue strength (at 105 cycles) of
the welded specimens was reduced considerably by 22%.
10.2. Recommendations for Future Works
The following recommendations are made based on experimental study performed on the
structural integrity analysis and performance improvements of different weld joints.
10.2.1. Recommendations on FS-Welded Aluminum Alloy Joints
During FSW of aluminum alloy, effects of three critical process parameters (i.e. spindle
rotational speed, plunge force, and welding speed) are analyzed and an empirical correlation has
been developed for a particular pin-tool, lead angle, welded material, and clamping conditions.
In practice, the value FSW process parameters (𝑁, 𝑉, 𝐹𝑧) largely depend on pin-tool design,
materials need to be welded, and lead angle utilized during the welding process. In the developed
empirical model, two constants were introduced to compensate the effect of pin-tool design,
materials, and clamping conditions. A robust model needs to take consideration all these factors
along with three critical process parameters. In a preliminary study, a different pin-tool was
employed to join AA2195-T8 aluminum alloy utilizing three different lead angles (0°, 1.5°, and
3°) while other welding parameters were kept constant. From tensile stress-stain plot shown in
Figure 10.1 can be seen that the higher lead angles (1.5° and 3°) provide better tensile properties

219
as compared to 0° lead angle. But there might be an optimum lead angle where tensile properties
will be maximized for this particular pin-tool design. In future, along with three critical process
parameters an optimized lead angle can be obtained for different pin-tool design and materials.
Then a generalized empirical correlation can be obtained for FSW of different materials at
different conditions.
Figure 10.1: Tensile stress-strain curve of FS-welded AA2195-T8 plates at three different lead
angles (0°, 1.5° and 3°) while other process parameters are kept constant (N=325 rpm, V=7 ipm,
and Fz=8000 lbf)
10.2.1. Recommendations on Post-Weld EPP-treatment of Welded Joints
Electrolytic-plasma-processing (EPP) is commonly utilized for surface treatment of
different materials to improve corrosion behaviors. In chapter 8, the effect of novel post-weld

220
EPP-treatment was analyzed on fusion arc welded high strength steel joints and improved tensile
properties were obtained after EPP-treatment. A preliminary study was also done on the effect of
post-weld EPP-treatment on corrosion behavior of welded alloy steel. For the corrosion test, 5
mm x 20 mm x 5 mm specimens were prepared from welded and EPP- treated specimens
containing weld, HAZ, and bulk metal as shown in Figure 10.2. Utilized corrosion medium was
aerated 3.5% NaCl and corrosion test was done utilizing potentiodynamic polarization from -0.8
to -0.1V at 1.0 mV/sec. From initial analysis, measured corrosion potential and corrosion current
density are plotted for different sections (Figure 10.3). Usually lower current density indicates
lower corrosion rate and higher corrosion potential indicates better corrosion resistance of the
specimen. From Figure 10.3, it can be found that the weld metal has higher corrosion rate as
compared to other specimens. Typically AISI-4140 is categorized as better corrosion resistance
steel as compared to other high carbon steels. Therefore no significant difference was observed
between as-welded (AW) and EPP- treated samples in terms on corrosion current density and
potential. In future, EPP can be applied to other carbon steels joints and analyze the effect of
post- weld EPP-treatment mechanical as well as corrosion behaviors.

221
Figure 10.2: Sample preparation for corrosion test of GTA-welded and EPP-treated AISI-4140
steel
Figure 10.3: Effect of post-weld EPP-treatment on corrosion potential and corrosion current
density of GTA-welded AISI-4140 alloy steel

222
REFERENCES
Abbasi Gharacheh, M., Kokabi, A. H., Daneshi, G. H., Shalchi, B., & Sarrafi, R. (2006). The
influence of the ratio of “rotational speed/traverse speed” (ω/v) on mechanical properties
of AZ31 friction stir welds. International Journal of Machine Tools and Manufacture,
46(15), 1983-1987. doi: http://dx.doi.org/10.1016/j.ijmachtools.2006.01.007
Abdullah, A., Malaki, M., & Eskandari, A. (2012). Strength enhancement of the welded
structures by ultrasonic peening. Materials & Design, 38(0), 7-18. doi:
http://dx.doi.org/10.1016/j.matdes.2012.01.040
Ahmad, R., & Bakar, M. A. (2011). Effect of a post-weld heat treatment on the mechanical and
microstructure properties of AA6061 joints welded by the gas metal arc welding cold
metal transfer method. Materials & Design, 32(10), 5120-5126. doi:
10.1016/j.matdes.2011.06.007
Ajovalasit, A., Petrucci, G., & Zuccarello, B. (1996). Determination of nonuniform residual
stresses using the ring-core method. Journal of Engineering Materials and Technology-
Transactions of the ASME, 118(2), 224-228. doi: 10.1115/1.2804891
Akhter, R., Ivanchev, L., & Burger, H. P. (2007). Effect of pre/post T6 heat treatment on the
mechanical properties of laser welded SSM cast A356 aluminium alloy. Materials
Science and Engineering: A, 447(1–2), 192-196. doi:
http://dx.doi.org/10.1016/j.msea.2006.10.148
Alam, M.S. (2005). Structural integrity and fatigue crack propagation life assessment of welded
and weld-repaired structures. Ph.D. Dissertation, Department of Mechanical Engineering,
Louisiana State University, Baton Rouge, LA.
Almaraz, D., Tapia, G., Silva, T., & Calderón, C. (2010). Fatigue life prediction based on
microscopic plastic zone on fracture surface of AISI-SAE 1018 steel. International
Journal of Automotive and Mechanical Engineering (IJAME), 1(0), 29-37.
Andersen, K., Cook, G.E., Karsai, G., & Ramaswamy, K. (1990). Artificial neural networks
applied to arc welding process modeling and control. IEEE Transactions on Industry
Applications, 26(5), 824-830. doi: 10.1109/28.60056
Arbegast, W. J., Coletta, E. R., & Li, Z. (2001). Characterization of friction stir weld defect
types. Session 3 - Frictions Stir Welding-Process and Process Development, TMS 2001
Annual Spring Meeting, New Orleans, LA, February 11-15, 2001.
Arbegast, W. J. (2004). Overview of friction stir welding and joining technology developments.
Aerospace Manufacturing & Automated Fastening Conference, St. Louis, Missouri,
September 20-23, 2004.
Arivazhagan, N., Singh, S., Prakash, S., & Reddy, G. M. (2011). Investigation on AISI 304
austenitic stainless steel to AISI 4140 low alloy steel dissimilar joints by gas tungsten arc,

223
electron beam and friction welding. Materials & Design, 32(5), 3036-3050. doi:
http://dx.doi.org/10.1016/j.matdes.2011.01.037
Arora, K.S., Pandey, S., Schaper, M., & Kumar, R. (2010). Microstructure evolution during
friction stir welding of aluminum alloy AA2219. Journal of Materials Science &
Technology, 26(8), 747-753. doi: http://dx.doi.org/10.1016/S1005-0302(10)60118-1
ASM-International. (1990). ASM Handbook Volume 2: Properties and Selection: Nonferrous
Alloys and Special-Purpose Materials (10th ed.). Materials Park, OH: ASM International.
ASM-International. (1993). ASM Metals Reference Book. Michael Bauccio (Ed.), Materials
Park, OH, ASM International
ASM-International. (2002a). ASM Specialty Handbook: Aluminum and Aluminum Alloys.
Materials Park, OH, USA: ASM International.
ASM-International. (2002b). Fatigue Failure: - Failure Analysis and Prevention. Materials Park,
OH, USA: ASM International.
ASME-International. (2013). ASME boiler and pressure vessel code (BPVC): Section V -
nondestructive examination. New York, NY, USA, ASME International.
ASTM-International. (2007a). ASTM E407-07: Standard practice for micro-etching metals and
alloys. West Conshohocken, PA, ASTM International.
ASTM-International. (2007b). ASTM E466-07: Standard practice for conducting force
controlled constant amplitude axial fatigue tests of metallic materials. West
Conshohocken, PA, ASTM International.
ASTM-International. (2008). ASTM-E2491: Standard guide for evaluating performance
characteristics of phased-array ultrasonic testing instruments and systems. West
Conshohocken, PA, ASTM International.
ASTM-International. (2011). ASTM E3-11: Standard guide for preparation of metallographic
specimens. West Conshohocken, PA, ASTM International.
ASTM-International. (2011). ASTM E8 / E8M – 11: Standard test methods for tension testing of
metallic materials. West Conshohocken, PA, ASTM International.
Attallah, M., & Salem, H.G. (2005). Friction stir welding parameters: a tool for controlling
abnormal grain growth during subsequent heat treatment. Materials Science and
Engineering: A, 391(1–2), 51-59. doi: http://dx.doi.org/10.1016/j.msea.2004.08.059
AWS. (2007). Welding Handbook- Volume-3: Welding Processes, Part-2, American Welding
Society, Doral, FL.
AWS. (2008). AWSD1.2/D1.2M: Structural welding code – Aluminum. American Welding
Society, Doral, FL.

224
AWS. (2010). AWSD1.1/D1.1M: Structural welding code – Steel. American Welding Society
Doral, FL.
Aydın, H., Bayram, A., & Durgun, İ. (2010). The effect of post-weld heat treatment on the
mechanical properties of 2024-T4 friction stir-welded joints. Materials & Design, 31(5),
2568-2577. doi: http://dx.doi.org/10.1016/j.matdes.2009.11.030
Aydın, H., Bayram, A., Uğuz, A., & Akay, K. S. (2009). Tensile properties of friction stir
welded joints of 2024 aluminum alloys in different heat-treated-state. Materials &
Design, 30(6), 2211-2221. doi: http://dx.doi.org/10.1016/j.matdes.2008.08.034
Babajanzade R. S., Behboodi J. M., Teimouri, R., Asgharzadeh-Ahmadi, G., Falahati-Naghibi,
M., & Sohrabpoor, H. (2013). Optimization of friction stir welding process of AA7075
aluminum alloy to achieve desirable mechanical properties using ANFIS models and
simulated annealing algorithm. The International Journal of Advanced Manufacturing
Technology, 69(5-8), 1803-1818. doi: 10.1007/s00170-013-5131-6
Babu, S., Elangovan, K., Balasubramanian, V., & Balasubramanian, M. (2009). Optimizing
friction stir welding parameters to maximize tensile strength of AA2219 aluminum alloy
joints. Metals and Materials International, 15(2), 321-330. doi: 10.1007/s12540-009-
0321-3
Bäckström, M., & Marquis, G. (2001). A review of multiaxial fatigue of weldments:
experimental results, design code and critical plane approaches. Fatigue & Fracture of
Engineering Materials & Structures, 24(5), 279-291. doi: 10.1046/j.1460-
2695.2001.00284.x
Balaji, S., & Mahapatra, M. (2013). Experimental study and modeling of friction stir welding
process to produce optimized AA2219 butt welds for aerospace application. Proceedings
of the Institution of Mechanical Engineers: Part B-Journal of Engineering Manufacture,
227(B1), 132-143. doi: 10.1177/0954405412462806
Balasubramanian, V. (2008). Relationship between base metal properties and friction stir
welding process parameters. Materials Science and Engineering: A, 480(1–2), 397-403.
doi: http://dx.doi.org/10.1016/j.msea.2007.07.048
Balasubramanian, V., Ravisankar, V., & Reddy, G. Madhusudhan. (2008). Effect of pulsed
current welding on mechanical properties of high strength aluminum alloy. International
Journal of Advanced Manufacturing Technology, 36(3-4), 254-262. doi: 10.1007/s00170-
006-0848-0
Baş, Deniz, & Boyacı, İsmail H. (2007). Modeling and optimization I: Usability of response
surface methodology. Journal of Food Engineering, 78(3), 836-845. doi:
http://dx.doi.org/10.1016/j.jfoodeng.2005.11.024
Bhanumurthy, K., Kumbhar, N., & Sharma, B. P. (2007). Effect of heat treatment on
microstructure, mechanical properties and composition variation across the interface for

225
the FSW 6061 Al alloy weldments. 4th Symposium on Friction Stir Welding and
Processing, Orlando, FL February 25, - March 1, 2007.
Bilici, M. K. (2012). Application of Taguchi approach to optimize friction stir spot welding
parameters of polypropylene. Materials & Design, 35(0), 113-119. doi:
http://dx.doi.org/10.1016/j.matdes.2011.08.033
Bokesjö, M., Al-Emrani, M., & Svensson, T. (2012). Fatigue strength of fillet welds subjected to
multi-axial stresses. International Journal of Fatigue, 44(0), 21-31. doi:
http://dx.doi.org/10.1016/j.ijfatigue.2012.06.004
Boz, M., & Kurt, A. (2004). The influence of stirrer geometry on bonding and mechanical
properties in friction stir welding process. Materials & Design, 25(4), 343-347. doi:
http://dx.doi.org/10.1016/j.matdes.2003.11.005
Bozkurt, Y. (2012). The optimization of friction stir welding process parameters to achieve
maximum tensile strength in polyethylene sheets. Materials & Design, 35(0), 440-445.
doi: http://dx.doi.org/10.1016/j.matdes.2011.09.008
Burk, J.D., & Lawrence, F.V. (1976). Effects of Lack-of-Penetration and Lack-of-Fusion on the
fatigue properties of 5083 aluminum alloy welds. Defense Technical Information Center,
Fort Belvoir, VA.
Cabibbo, M., Meccia, E., & Evangelista, E. (2003). TEM analysis of a friction stir-welded butt
joint of Al–Si–Mg alloys. Materials Chemistry and Physics, 81(2–3), 289-292. doi:
http://dx.doi.org/10.1016/S0254-0584(02)00604-1
Callister, William D. (2010). Materials Science and Engineering: An Introduction (8th
edition).
John Wiley & Sons, Inc.
Campbell, G., & Stotler, T. (1999). Friction stir welding of armor grade aluminium plate.
Welding Journal, 78(12), 45-47.
Cao, R., Sun, J. H., Chen, J. H., & Wang, Pei-Chung. (2014). Cold metal transfer joining of
aluminum AA6061-T6-to-galvanized boron steel. Journal of Manufacturing Science and
Engineering, 136(5), 051015-051015. doi: 10.1115/1.4028012
Carpinteri, A., Spagnoli, A., & Vantadori, S. (2009). Multiaxial fatigue life estimation in welded
joints using the critical plane approach. International Journal of Fatigue, 31(1), 188-196.
doi: http://dx.doi.org/10.1016/j.ijfatigue.2008.03.024
Cavaliere, P., De Santis, A., Panella, F., & Squillace, A. (2009). Effect of welding parameters on
mechanical and microstructural properties of dissimilar AA6082–AA2024 joints
produced by friction stir welding. Materials & Design, 30(3), 609-616. doi:
http://dx.doi.org/10.1016/j.matdes.2008.05.044
Cavaliere, P., Squillace, A., & Panella, F. (2008). Effect of welding parameters on mechanical
and microstructural properties of AA6082 joints produced by friction stir welding.

226
Journal of Materials Processing Technology, 200(1–3), 364-372. doi:
http://dx.doi.org/10.1016/j.jmatprotec.2007.09.050
Chen, Hsien-Ching, Lin, Jen-Chang, Yang, Yung-Kuang, & Tsai, Chih-Hung. (2010).
Optimization of wire electrical discharge machining for pure tungsten using a neural
network integrated simulated annealing approach. Expert Systems with Applications,
37(10), 7147-7153. doi: http://dx.doi.org/10.1016/j.eswa.2010.04.020
Chen, Hua-Bin, Yan, Keng, Lin, Tao, Chen, Shan-Ben, Jiang, Cheng-Yu, & Zhao, Yong. (2006).
The investigation of typical welding defects for 5456 aluminum alloy friction stir welds.
Materials Science and Engineering: A, 433(1–2), 64-69. doi:
http://dx.doi.org/10.1016/j.msea.2006.06.056
Chen, Yingchun, Liu, Huijie, & Feng, Jicai. (2006). Friction stir welding characteristics of
different heat-treated-state 2219 aluminum alloy plates. Materials Science and
Engineering: A, 420(1–2), 21-25. doi: http://dx.doi.org/10.1016/j.msea.2006.01.029
Cho, J. R., Lee, B. Y., Moon, Y. H., & Van Tyne, C. J. (2004). Investigation of residual stress
and post weld heat treatment of multi-pass welds by finite element method and
experiments. Journal of Materials Processing Technology, 155–156(0), 1690-1695. doi:
http://dx.doi.org/10.1016/j.jmatprotec.2004.04.325
Clark, A. V., & Moulder, J. C. (1985). Residual stress determination in aluminum using
electromagnetic acoustic transducers. Ultrasonics, 23(6), 253-259. doi: 10.1016/0041-
624x(85)90047-2
Colligan, Kevin. (2007). Relationships between process variables related to heat generation in
friction stir welding of aluminum. Friction Stir Welding and Processing IV, Edited by
Mishra R., Mahoney, M., Lienert, T. Jata, K., John Wiley & Sons, Inc.
Colligan, Kevin (1999). Material Flow Behavior during friction stir welding of aluminum.
Welding Journal, 78(7), 229s-237s.
Colligan, Kevin , & Mishra, Rajiv (2008). A conceptual model for the process variables related
to heat generation in friction stir welding of aluminum. Scripta Materialia, 58(5), 327-
331. doi: http://dx.doi.org/10.1016/j.scriptamat.2007.10.015
Commin, L., Dumont, M., Masse, J. E., & Barrallier, L. (2009). Friction stir welding of AZ31
magnesium alloy rolled sheets: Influence of processing parameters. Acta Materialia,
57(2), 326-334. doi: http://dx.doi.org/10.1016/j.actamat.2008.09.011
Coniglio, N., Cross, C. E., Michael, T., & Lammers, M. (2008). Defining a critical weld Dilution
to avoid solidification cracking in aluminum. Welding Journal, 87(9), 237S-247S.
Costa, J. D. M., Abreu, L. M. P., Pinho, A. C. M., & Ferreira, J. A. M. (2005). Fatigue behaviour
of tubular Al-Mg-Si welded specimens subjected to bending–torsion loading. Fatigue &
Fracture of Engineering Materials & Structures, 28(4), 399-407. doi: 10.1111/j.1460-
2695.2005.00875.x
227
Crowther, Paul. (2004). Practical experience of phased array technology for power station
applications. Insight-Non-Destructive Testing and Condition Monitoring, 46(9), 525-528.
Dadfar, M., Fathi, M. H., Karimzadeh, F., Dadfar, M. R., & Saatchi, A. (2007). Effect of TIG
welding on corrosion behavior of 316L stainless steel. Materials Letters, 61(11–12),
2343-2346. doi: http://dx.doi.org/10.1016/j.matlet.2006.09.008
Damodaram, R., Ganesh Sundara Raman, S., & Prasad Rao, K. (2014). Effect of post-weld heat
treatments on microstructure and mechanical properties of friction welded alloy 718
joints. Materials & Design, 53(0), 954-961. doi:
http://dx.doi.org/10.1016/j.matdes.2013.07.091
Davis, Aaron M. (2010). Interaction of the friction stir welding tool and work-piece as
influenced by process parameters. MS Thesis, Department of Mechanical Engineering,
Mississippi State University Mississippi, USA.
Dehghani, M., Amadeh, A., & Akbari Mousavi, S. A. A. (2013). Investigations on the effects of
friction stir welding parameters on intermetallic and defect formation in joining
aluminum alloy to mild steel. Materials & Design, 49(0), 433-441. doi:
http://dx.doi.org/10.1016/j.matdes.2013.01.013
Deng, D., Murakawa, H., & Liang, W. (2008). Numerical and experimental investigations on
welding residual stress in multi-pass butt-welded austenitic stainless steel pipe.
Computational Materials Science, 42(2), 234-244. doi:
http://dx.doi.org/10.1016/j.commatsci.2007.07.009
Dewan, M.W., Wahab, M.A., Liang, J., Okeil, A. (2012). Effects of residual stresses and the post
weld heat treatments of TIG welded aluminum alloy AA6061-T651. ASME 2012
International Mechanical Engineering Congress & Exposition, Houston, Texas,
November 9-15, 2012.
Dewan, M., Liang, J., Wahab, M.A. , & Okeil, A. . (2013). Post-weld residual stresses and heat
treatments of gas tungsten arc welded aluminum alloy AA6061-T651. World Journal of
Engineering, 10(1), 11-22.
Dewan, M.W., Liang, J., Wahab, M. A., & Okeil, A.M. (2014). Effect of post-weld heat
treatment and electrolytic plasma processing on tungsten inert gas welded AISI 4140
alloy steel. Materials and Design, 54, 6-13. doi: 10.1016/j.matdes.2013.08.035
Dewan, Mohammad, Wahab, Muhammad, & Okeil, Ayman M. (2015). Influence of Weld
Defects and Post-Weld Heat Treatment (PWHT) of Gas Tungsten Arc Welded (GTAW)
AA6061-T651 Aluminum Alloy. Journal of Manufacturing Science and Engineering,
137(5). doi: doi:10.1115/1.4030333
Dewan, M.W., Wahab, M.A., & Okeil, A. M. (2014). Effect of weld defects on tensile properties
of lightweight materials and correlations with phased array ultrasonic non-destructive
evaluation. ASME 2014 International Manufacturing Science and Engineering
Conference, Detroit, Michigan, June 9-13, 2014.

228
Di, S., Yang, X., Luan, G., & Jian, B. (2006). Comparative study on fatigue properties between
AA2024-T4 friction stir welds and base materials. Materials Science and Engineering: A,
435–436(0), 389-395. doi: http://dx.doi.org/10.1016/j.msea.2006.07.009
Dinaharan, I., & Murugan, N. (2012). Optimization of friction stir welding process to maximize
tensile strength of AA6061/ZrB2 in-situ composite butt joints. Metals and Materials
International, 18(1), 135-142. doi: 10.1007/s12540-012-0016-z
Ding, J., Wang, D., Wang, Yi., & Du, H. (2014). Effect of post weld heat treatment on properties
of variable polarity TIG welded AA2219 aluminium alloy joints. Transactions of
Nonferrous Metals Society of China, 24(5), 1307-1316. doi:
http://dx.doi.org/10.1016/S1003-6326(14)63193-9
Don, E.B., & Wei, T. (2001). Subsurface stress evaluation in steel plates and bars using the LCR
ultrasonic wave. Nuclear Engineering and Design, 27, 231–240.
Dong, M., & Wang, N. (2011). Adaptive network-based fuzzy inference system with leave-one-
out cross-validation approach for prediction of surface roughness. Applied Mathematical
Modelling, 35(3), 1024-1035. doi: http://dx.doi.org/10.1016/j.apm.2010.07.048
Dudas, J. H., & Collins, F. R. (1966). Preventing weld cracks in high strength aluminum alloys.
Welding Journal, 45(6), 241s-249s.
El-Danaf, E.A., & El-Rayes, M. M. (2013). Microstructure and mechanical properties of friction
stir welded 6082 AA in as welded and post weld heat treated conditions. Materials &
Design, 46(0), 561-572. doi: http://dx.doi.org/10.1016/j.matdes.2012.10.047
Elangovan, K., & Balasubramanian, V. (2007). Influences of pin profile and rotational speed of
the tool on the formation of friction stir processing zone in AA2219 aluminium alloy.
Materials Science and Engineering: A, 459(1–2), 7-18. doi:
http://dx.doi.org/10.1016/j.msea.2006.12.124
Elangovan, K., & Balasubramanian, V. (2008). Influences of post-weld heat treatment on tensile
properties of friction stir-welded AA6061 aluminum alloy joints. Materials
Characterization, 59(9), 1168-1177. doi: http://dx.doi.org/10.1016/j.matchar.2007.09.006
Elangovan, K., Balasubramanian, V., & Babu, S. (2008). Developing an empirical relationship to
predict tensile strength of friction stir welded AA2219 aluminum alloy. Journal of
Materials Engineering and Performance, 17(6), 820-830. doi: 10.1007/s11665-008-
9240-6
Elangovan, K., Balasubramanian, V., & Babu, S. (2009). Predicting tensile strength of friction
stir welded AA6061 aluminium alloy joints by a mathematical model. Materials &
Design, 30(1), 188-193. doi: http://dx.doi.org/10.1016/j.matdes.2008.04.037
Elangovan, K., Balasubramanian, V., & Valliappan, M. (2008). Influences of tool pin profile and
axial force on the formation of friction stir processing zone in AA6061 aluminium alloy.

229
The International Journal of Advanced Manufacturing Technology, 38(3-4), 285-295.
doi: 10.1007/s00170-007-1100-2
Fatemi, A., & Shamsaei, N. (2011). Multiaxial fatigue: An overview and some approximation
models for life estimation. International Journal of Fatigue, 33(8), 948-958. doi:
http://dx.doi.org/10.1016/j.ijfatigue.2011.01.003
Feng, J. C., Chen, Y. C., & Liu, H. J. (2006). Effects of post-weld heat treatment on
microstructure and mechanical properties of friction stir welded joints of 2219-O
aluminium alloy. Materials Science and Technology, 22(1), 86-90. doi:
10.1179/174328406x79298
Field, D., Nelson, T., Hovanski, Y., & Jata, K. (2001). Heterogeneity of crystallographic texture
in friction stir welds of aluminum. Metallurgical and Materials Transactions A, 32(11),
2869-2877. doi: 10.1007/s11661-001-1037-2
Flores, O.V., Kennedy, C., Murr, L. E., Brown, D., Pappu, S., Nowak, B.M., & McClure, J. C.
(1998). Microstructural issues in a friction-stir-welded aluminum alloy. Scripta
Materialia, 38(5), 703-708. doi: http://dx.doi.org/10.1016/S1359-6462(97)00551-4
Fujii, H., Cui, L., Maeda, M., & Nogi, K. (2006). Effect of tool shape on mechanical properties
and microstructure of friction stir welded aluminum alloys. Materials Science and
Engineering: A, 419(1–2), 25-31. doi: http://dx.doi.org/10.1016/j.msea.2005.11.045
Funderburk, R. S. (1998). Key concepts in welding engineering. Welding Innovation, 15(2), 17-
18.
Gao, R. Q., Stiller, K., Hansen, V., Oskarsson, A., & Danoix, F. (2002). Influence of aging
conditions on the microstructure and tensile strength of Aluminium alloy 6063. Materials
Science Forum, Edited by P. J. Gregson & S. J. Harris, 396-402, pp. 1211-1216.
Garrett, R. P., Lin, J., & Dean, T. A. (2005). An investigation of the effects of solution heat
treatment on mechanical properties for AA 6xxx alloys: experimentation and modelling.
International Journal of Plasticity, 21(8), 1640-1657. doi:
http://dx.doi.org/10.1016/j.ijplas.2004.11.002
GE-IT. (2007). Introduction to the overview of “Industrial Radiography”- Image forming
techniques: General Electric (GE) Inspection Technologies.
Ghazanfari, H., Naderi, M., Iranmanesh, M., Seydi, M., & Poshteban, A. (2012). A comparative
study of the microstructure and mechanical properties of HTLA steel welds obtained by
the tungsten arc welding and resistance spot welding. Materials Science and Engineering
A, 534, 90-100. doi: 10.1016/j.msea.2011.11.046
Ghetiya, N. D., & Patel, K. M. (2014). Prediction of tensile strength in friction stir welded
aluminium alloy using artificial neural network. Procedia Technology, 14(0), 274-281.
doi: http://dx.doi.org/10.1016/j.protcy.2014.08.036

230
Gopalakrishnan, S., & Murugan, N. (2011). Prediction of tensile strength of friction stir welded
aluminium matrix TiCp particulate reinforced composite. Materials & Design, 32(1),
462-467. doi: http://dx.doi.org/10.1016/j.matdes.2010.05.055
Gough, H. J., & Pollard, H. V. (1935). The strength of metals under combined alternating
stresses. Proceedings of the Institution of Mechanical Engineers, 131(1), 3-103. doi:
10.1243/pime_proc_1935_131_008_02
Gough, H.J., Pollard, H.V., & Clenshaw, W.J. (1951). Some experiments on the resistance of
metals to fatigue under combined stresses. H.M. Stationery Office, Aeronautical
Research Council, Great Britain.
Greenberg, H.D. (1966). Applications of fracture toughness parameters to structural metals. New
York: Gordon and Breach.
Guerra, M., Schmidt, C., McClure, J. C., Murr, L. E., & Nunes, A. C. (2002). Flow patterns
during friction stir welding. Materials Characterization, 49(2), 95-101. doi:
http://dx.doi.org/10.1016/S1044-5803(02)00362-5
Guillaume, S. (2001). Designing fuzzy inference systems from data: An interpretability-oriented
review. IEEE Transactions on Fuzzy Systems, 9(3), 426-443. doi: 10.1109/91.928739
Gupta, P., Tenhundfeld, G., & Daigle, E. O. (2005). Surface modification of brass-coated steel
cord by electro plasma technology. Wire Journal International, 38(2), 50-56.
Gupta, P., Tenhundfeld, G., Daigle, E. O., & Ryabkov, D. (2007). Electrolytic plasma
technology: Science and engineering - An overview. Surface & Coatings Technology,
201(21), 8746-8760. doi: 10.1016/j.surfcoat.2006.11.023
Gupta, P., & Tenhundfeld, G. (2005). Surface and mechanical properties of steel processed by
electro-plasma technology. Plating and Surface Finishing, 92(2), 48-52.
Gurney, T.R. (1979). Fatigue of Welded Structures. Cambridge University Press, Cambridge,
UK.
Hamilton, C., Dymek, S., & Sommers, A. (2010). Characteristic temperature curves for
aluminum alloys during friction stir welding. Welding Journal, 89(9), 189s-194s.
Hassan, A., Norman, A. F., Price, D. A., & Prangnell, P. B. (2003). Stability of nugget zone
grain structures in high strength Al-alloy friction stir welds during solution treatment.
Acta Materialia, 51(7), 1923-1936. doi: http://dx.doi.org/10.1016/S1359-6454(02)00598-
0
HILDA. FSW Process: http://www.hilda-europe.eu/FSWProcess/tabid/3196/Default.aspx
Retrieved March 03, 2015, 2015

231
Holden, T.M., & Roy, G. (1996). The application of neutron diffraction to the measurement of
residual stress and strain. Edited by James, M., Lu, J., & Roy, G. Handbook of
measurement of residual stresses, Lilburn, Princeton Hall, 133-148.
Howse, D. S., & Lucas, W. (2000). Investigation into arc constriction by active fluxes for
tungsten inert gas welding. Science and Technology of Welding and Joining, 5(3), 189-
193. doi: 10.1179/136217100101538191
Hu, B., & Richardson, I. M. (2007). Microstructure and mechanical properties of AA7075(T6)
hybrid laser/GMA welds. Materials Science and Engineering: A, 459(1–2), 94-100. doi:
http://dx.doi.org/10.1016/j.msea.2006.12.094
Jahazi, M., & Egbali, B. (2000). The influence of hot rolling parameters on the microstructure
and mechanical properties of an ultra-high strength steel. Journal of Materials Processing
Technology, 103(2), 276-279. doi: 10.1016/s0924-0136(00)00474-x
Jalali-Heravi, Mehdi, & Kyani, Anahita. (2007). Comparison of shuffling-adaptive neuro fuzzy
inference system (Shuffling-ANFIS) with conventional ANFIS as feature selection
methods for nonlinear systems. QSAR & Combinatorial Science, 26(10), 1046-1059. doi:
10.1002/qsar.200630156
James, M. Neil. (1998). Engineering materialism and structural integrity. Journal of Engineering
Design, 9(4), 329-342. doi: 10.1080/095448298261471
Jang, J. (1993). ANFIS: adaptive-network-based fuzzy inference system. IEEE Transactions on
Systems, Man and Cybernetics, 23(3), 665-685. doi: 10.1109/21.256541
Jata, K.V., & Semiatin, S.L. (2000). Continuous dynamic recrystallization during friction stir
welding of high strength aluminum alloys. Scripta Materialia, 43, 743-749.
Javadi, Y., Akhlaghi, M., & Najafabadi, M. A. (2013). Using finite element and ultrasonic
method to evaluate welding longitudinal residual stress through the thickness in austenitic
stainless steel plates. Materials & Design, 45(0), 628-642. doi:
http://dx.doi.org/10.1016/j.matdes.2012.09.038
Jayaraman, M., Sivasubramanian, R., Balasubramanian, V., & Lakshminarayanan, A. K. (2008).
Prediction of tensile strength of friction stir welded A356 cast aluminium alloy using
response surface methodology and artificial neural network. Journal for Manufacturing
Science and Production, 9, 45-60.
Juvinall, R.C., & Marshek, K.M. (2011). Fundamentals of machine component design: Fatigue
(5th
Edition). 316-333, John Wiley and Sons, Inc.
Kandukuri, S., Arbegast, W. J., Patnaik, A. K., & Allen, C. D. (2007). Development of design
curves for tensile strength and fatigue characteristics of 7075-T73 aluminum FSW butt
joints. Friction Stir Welding and Processing IV, Edited by Mishra R., Mahoney, M.,
Lienert, T. Jata, K., John Wiley & Sons, Inc.

232
Karthikeyan, L., Senthilkumar, V. S., & Padmanabhan, K. A. (2010). On the role of process
variables in the friction stir processing of cast aluminum A319 alloy. Materials &
Design, 31(2), 761-771. doi: http://dx.doi.org/10.1016/j.matdes.2009.08.001
Kellogg, H. H. (1950). Anode effect in aqueous electrolysis. Journal of the Electrochemical
Society, 97, 133-142.
Khodir, S., Shibayanagi, T., & Naka, M. (2006). Microstructure and mechanical properties of
friction stir welded AA2024-T3 aluminum alloy. Materials Transactions, 47(1), 185-193.
Kim, Y. G., Fujii, H., Tsumura, T., Komazaki, T., & Nakata, K. (2006). Three defect types in
friction stir welding of aluminum die casting alloy. Materials Science and Engineering:
A, 415(1–2), 250-254. doi: http://dx.doi.org/10.1016/j.msea.2005.09.072
Klages, Holli K. (2007). The “Lazy S” feature in friction stir welding of AA2099 aluminum-
lithium alloy. MS Thesis, Naval Postgraduate School, Monterey, California.
Knipstrom, K. E., & Pekkari, B. (1997). Friction stir welding process goes commercial. Welding
Journal, 76(9), 55-57.
Koçak, Mustafa. (2010). Structural integrity of welded structures: Process - Property –
Performance (3P) relationship. 63rd Annual Assembly & International Conference of the
International Institute of Welding, Istanbul, Turkey, July 2010.
Korda, A.A., Miyashita, Y., Mutoh, Y., & Sadasue, T. (2007). Fatigue crack growth behavior in
ferritic-pearlitic steels with networked and distributed pearlite structures. International
Journal of Fatigue, 29(6), 1140-1148. doi: 10.1016/j.ijfatigue.2006.09.008
Kou, S. (2003). Weld metal solidification II: Microstructure within grains welding metallurgy,
199-215: John Wiley & Sons, Inc.
Krishnan, K. N. (2002). The effect of post weld heat treatment on the properties of 6061 friction
stir welded joints. Journal of Materials Science, 37(3), 473-480. doi:
10.1023/a:1013701104029
Kueppers, M., & Sonsino, C. M. (2006). Assessment of the fatigue behaviour of welded
aluminium joints under multiaxial spectrum loading by a critical plane approach.
International Journal of Fatigue, 28(5–6), 540-546. doi:
http://dx.doi.org/10.1016/j.ijfatigue.2005.07.046
Kulekci, M.K., Şik, A., & Kaluç, E. (2008). Effects of tool rotation and pin diameter on fatigue
properties of friction stir welded lap joints. The International Journal of Advanced
Manufacturing Technology, 36(9-10), 877-882. doi: 10.1007/s00170-006-0901-z
Kumar, A., & Sundarrajan, S. (2006). Selection of welding process parameters for the optimum
butt-joint strength of an aluminum alloy. Materials and Manufacturing Processes, 21(8),
779-782. doi: 10.1080/03602550600728117

233
Kumar, K., & Kailas, S. (2008). On the role of axial load and the effect of interface position on
the tensile strength of a friction stir welded aluminium alloy. Materials & Design, 29(4),
791-797. doi: http://dx.doi.org/10.1016/j.matdes.2007.01.012
Kumar, S., & Shahi, A. S. (2011). Effect of heat input on the microstructure and mechanical
properties of gas tungsten arc welded AISI 304 stainless steel joints. Materials & Design,
32(6), 3617-3623. doi: http://dx.doi.org/10.1016/j.matdes.2011.02.017
Lakshminarayanan, A., & Balasubramanian, V. (2008). Process parameters optimization for
friction stir welding of RDE-40 aluminium alloy using Taguchi technique. Transaction of
Nonferrous Metals Society of China, 18, 548-554.
Lakshminarayanan, A., Balasubramanian, V., & Elangovan, K. (2009). Effect of welding
processes on tensile properties of AA6061 aluminium alloy joints. The International
Journal of Advanced Manufacturing Technology, 40(3-4), 286-296. doi: 10.1007/s00170-
007-1325-0
Lakshminarayanan, A. , Malarvizhi, S., & Balasubramanian, V. (2011). Developing friction stir
welding window for AA2219 aluminium alloy. Transactions of Nonferrous Metals
Society of China, 21(11), 2339-2347. doi: http://dx.doi.org/10.1016/S1003-
6326(11)61018-2
Lakshminarayanan, A. K., & Balasubramanian, V. (2009). Comparison of RSM with ANN in
predicting tensile strength of friction stir welded AA7039 aluminium alloy joints.
Transactions of Nonferrous Metals Society of China, 19(1), 9-18. doi:
http://dx.doi.org/10.1016/S1003-6326(08)60221-6
Lanza, G. (1886). Strength of shafting subjected to both twisting and bending. Transaction of the
American Society of Mechanical Engineers, 8, 121-196.
Lawrence Jr, F. V., Munse, W. H., & Burk, J. D. (1975). Effects of porosity on the fatigue
properties of 5083 aluminum alloy weldments. Welding Research Council Bulletin,206.
Le Jolu, T., Morgeneyer, T. F., Denquin, A., & Gourgues-Lorenzon, A. F. (2015). Fatigue
lifetime and tearing resistance of AA2198 Al–Cu–Li alloy friction stir welds: Effect of
defects. International Journal of Fatigue, 70, 463-472. doi:
http://dx.doi.org/10.1016/j.ijfatigue.2014.07.001
Leggatt, R. H. (2008). Residual stresses in welded structures. International Journal of Pressure
Vessels and Piping, 85(3), 144-151. doi: 10.1016/j.ijpvp.2007.10.004
Lei, X., Deng, Y., Yin, Z., & Xu, G. (2014). Tungsten inert gas and friction stir welding
characteristics of 4-mm-thick 2219-T87 plates at room temperature and −196 °C. Journal
of Materials Engineering and Performance, 23(6), 2149-2158. doi: 10.1007/s11665-014-
1013-9

234
Li, B., Shen, Y., & Hu, W. (2011). The study on defects in aluminum 2219-T6 thick butt friction
stir welds with the application of multiple non-destructive testing methods. Materials &
Design, 32(4), 2073-2084. doi: http://dx.doi.org/10.1016/j.matdes.2010.11.054
Li, Y., Murr, L. E., & McClure, J. C. (1999). Flow visualization and residual microstructures
associated with the friction-stir welding of 2024 aluminum to 6061 aluminum. Materials
Science and Engineering: A, 271(1–2), 213-223. doi: http://dx.doi.org/10.1016/S0921-
5093(99)00204-X
Liang, J., Wahab, M. A., & Guo, S. M. (2011). Corrosion behavior of SS 304 with ball milling
and electrolytic plasma treatment in NaCl solution. SEM Annual Conference on
Experimental and Applied Mechanics, Uncasville, CT, June 13 -16, 2011.
Liang, J., Wang, K. Y., Guo, S. M., & Wahab, M. A. (2011). Influence of electrolytic plasma
process on corrosion property of peened 304 austenitic stainless steel. Materials Letters,
65(3), 510-513. doi: 10.1016/j.matlet.2010.10.089
Liao, T. W. (2003). Classification of welding flaw types with fuzzy expert systems. Expert
Systems with Applications, 25(1), 101-111. doi: http://dx.doi.org/10.1016/S0957-
4174(03)00010-1
Liao, T. W., & Daftardar, S. (2009). Model based optimisation of friction stir welding processes.
Science and Technology of Welding and Joining, 14(5), 426-435. doi:
doi:10.1179/136217109X425847
Lin, F S, Starke, E A, Chakraborty, S B, & Gysler, A. (1984). The Effect of microstructure on
the deformation modes and mechanical properties of Ti-6AI-2Nb-ITa-0.8Mo: Part I.
Widmanstätten Structures. Metallurgical Transactions A, 15A(6), 1229-1246.
Liu, G., Murr, L. E., Niou, C. S., McClure, J. C., & Vega, F. R. (1997). Microstructural aspects
of the friction-stir welding of 6061-T6 aluminum. Scripta Materialia, 37(3), 355-361.
doi: http://dx.doi.org/10.1016/S1359-6462(97)00093-6
Liu, H. , Chen, Y. , & Feng, J. . (2006). Effect of heat treatment on tensile properties of friction
stir welded joints of 2219-T6 aluminium alloy. Materials Science and Technology, 22(2),
237-241. doi: 10.1179/026708306x81513
Liu, H. , Fujii, H., Maeda, M., & Nogi, K. (2003). Tensile properties and fracture locations of
friction-stir-welded joints of 2017-T351 aluminum alloy. Journal of Materials
Processing Technology, 142(3), 692-696. doi: http://dx.doi.org/10.1016/S0924-
0136(03)00806-9
Liu, H., Zhang, H., Pan, Q., & Yu, L. (2012). Effect of friction stir welding parameters on
microstructural characteristics and mechanical properties of 2219-T6 aluminum alloy
joints. International Journal of Material Forming, 5(3), 235-241. doi: 10.1007/s12289-
011-1048-5

235
Mac Henry, H. I., & Potter, J.M. (1990). Fatigue and fracture testing of weldments. ASTM
International, Philadelphia, PA.
Mahoney, M. W., Rhodes, C. G., Flintoff, J. G., Bingel, W. H., & Spurling, R. A. (1998).
Properties of friction-stir-welded 7075 T651 aluminum. Metallurgical and Materials
Transactions A, 29(7), 1955-1964. doi: 10.1007/s11661-998-0021-5
Maisonnette, D., Suery, M., Nelias, D., Chaudet, P., & Epicier, T. (2011). Effects of heat
treatments on the microstructure and mechanical properties of a 6061 aluminium alloy.
Materials Science and Engineering: A, 528(6), 2718-2724. doi:
10.1016/j.msea.2010.12.011
Malarvizhi, S., Raghukandan, K., & Viswanathan, N. (2008). Investigations on the influence of
post weld heat treatment on fatigue crack growth behaviour of electron beam welded
AA2219 alloy. International Journal of Fatigue, 30(9), 1543-1555. doi:
http://dx.doi.org/10.1016/j.ijfatigue.2007.12.002
Malarvizhi, S., & Balasubramanian, V. (2011a). Effect of welding processes on AA2219
aluminium alloy joint properties. Transactions of Nonferrous Metals Society of China,
21(5), 962-973. doi: http://dx.doi.org/10.1016/S1003-6326(11)60808-X
Malarvizhi, S., & Balasubramanian, V. (2011b). Effects of Welding Processes and Post-Weld
Aging Treatment on Fatigue Behavior of AA2219 Aluminium Alloy Joints. Journal of
Materials Engineering and Performance, 20(3), 359-367. doi: 10.1007/s11665-010-
9682-5
Malarvizhi, S., & Balasubramanian, V. (2011c). Fatigue crack growth resistance of gas tungsten
arc, electron beam and friction stir welded joints of AA2219 aluminium alloy. Materials
& Design, 32(3), 1205-1214. doi: http://dx.doi.org/10.1016/j.matdes.2010.10.019
Malarvizhi, S., & Balasubramanian, V. (2012). Influences of welding processes and post- weld
ageing treatment on mechanical and metallurgical properties of AA2219 aluminium alloy
Joints. Welding in the World, 56(9-10), 105-119. doi: 10.1007/bf03321386
Malin, V. (1995). Study of metallurgical phenomena in the HAZ of 6061-T6 aluminum welded
joints. Welding Journal, 74(9), s305-s318.
Martukanitz, R. P. (1993). Selection and weldability of heat-treatable aluminum alloys. ASM
Handbook: Welding, Brazing, and Soldering, ASM International, 6, 528-536.
Masubuchi, K. (1980). Analysis of welded structures: Residual stresses, distortion, and their
consequences. International Series on Materials Science and Technology, Volume 33,
Elsevier.
Mathers, G. (2002). The welding of aluminium and its alloys. Woodhead Publishing Series in
Welding and other Joining Technologies, Woodhead Publishing.
236
McDiarmid, D. L. (1994). A Shear stress based critical-plane criterion on multiaxial fatigue
failure for design and life prediction. Fatigue & Fracture of Engineering Materials &
Structures, 17(12), 1475-1484. doi: 10.1111/j.1460-2695.1994.tb00789.x
Mei-juan, H., & Jin-he, L. (2009). Effects of zonal heat treatment on residual stresses and
mechanical properties of electron beam welded TC4 alloy plates. Transactions of
Nonferrous Metals Society of China, 19(2), 324-329. doi: 10.1016/s1003-6326(08)60272-
1
Meletis, E. I., Nie, X., Wang, F. L., & Jiang, J. C. (2002). Electrolytic plasma processing for
cleaning and metal-coating of steel surfaces. Surface and Coatings Technology, 150(2–
3), 246-256. doi: http://dx.doi.org/10.1016/S0257-8972(01)01521-3
Menzemer, C., Lam, P. C., Srivatsan, T. S., & Wittel, C. F. (1999). An investigation of fusion
zone microstructures of welded aluminum alloy joints. Materials Letters, 41(4), 192-197.
doi: http://dx.doi.org/10.1016/S0167-577X(99)00129-9
Metzger, G. E. (1967). Some mechanical properties of welds in 6061 aluminum alloy sheet.
Welding Journal, 46(10), S457-S467.
Mishra, R. S., & Ma, Z. Y. (2005). Friction stir welding and processing. Materials Science and
Engineering: R: Reports, 50(1–2), 1-78. doi:
http://dx.doi.org/10.1016/j.mser.2005.07.001
Mohandas, T., Banerjee, D., & Rao, V. V. K. (1998). Observations on impact toughness of
electron beam welds of an alpha+beta titanium alloy. Materials Science and Engineering
A-Structural Materials Properties Microstructure and Processing, 254(1-2), 147-154.
doi: 10.1016/s0921-5093(98)00697-2
Mohandas, T., & Reddy, G. M. (1996). Effect of frequency of pulsing in gas tungsten arc
welding on the microstructure and mechanical properties of titanium alloy welds: A
technical note. Journal of Materials Science Letters, 15(7), 626-628. doi:
10.1007/bf00579271
Moreira, P. M. G. P., Santos, T., Tavares, S. M. O., Richter-Trummer, V., Vilaça, P., & de
Castro, P. M. S. T. (2009). Mechanical and metallurgical characterization of friction stir
welding joints of AA6061-T6 with AA6082-T6. Materials & Design, 30. doi:
10.1016/j.matdes.2008.04.042
Morton, T. M. (1971). Defects in 2021 Aluminum Alloy Welds. Welding Journal, 7, 304-312.
Nagesh, D. S., & Datta, G. L. (2002). Prediction of weld bead geometry and penetration in
shielded metal-arc welding using artificial neural networks. Journal of Materials
Processing Technology, 123(2), 303-312. doi: http://dx.doi.org/10.1016/S0924-
0136(02)00101-2
237
Nami, H., Adgi, H., Sharifitabar, M., & Shamabadi, H. (2011). Microstructure and mechanical
properties of friction stir welded Al/Mg2Si metal matrix cast composite. Materials &
Design, 32(2), 976-983. doi: http://dx.doi.org/10.1016/j.matdes.2010.07.008
Nandan, R., Roy, G. G., Lienert, T. J., & Debroy, T. (2007). Three-dimensional heat and
material flow during friction stir welding of mild steel. Acta Materialia, 55(3), 883-895.
doi: http://dx.doi.org/10.1016/j.actamat.2006.09.009
Ni, D. R., Chen, D. L., Wang, D., Xiao, B. L., & Ma, Z. Y. (2013). Influence of microstructural
evolution on tensile properties of friction stir welded joint of rolled SiCp/AA2009-T351
sheet. Materials & Design, 51, 199-205. doi:
http://dx.doi.org/10.1016/j.matdes.2013.04.027
Nunes Jr., A.C. (2010). Prolegomena to the study of friction stir welding. Paper presented at the
Materials Science & Technology 2010 Conference and Exhibition, Houston, TX, October
17-21, 2010.
Oberg, E. (2012). Machinery's Handbook (29th Edition). New York, NY: Industrial Press, Inc.
Okuyucu, H., Kurt, A., & Arcaklioglu, E. (2007). Artificial neural network application to the
friction stir welding of aluminum plates. Materials & Design, 28(1), 78-84. doi:
http://dx.doi.org/10.1016/j.matdes.2005.06.003
Olabi, A. G., & Hashmi, M. S. J. (1995). The effect of post-weld heat-treatment on mechanical-
properties and residual-stresses mapping in welded structural steel. Journal of Materials
Processing Technology, 55(2), 117-122. doi: http://dx.doi.org/10.1016/0924-
0136(95)01794-1
Olympus-NDT. (2007). Advances in phased array ultrasonic technology applications. Olympus
NDT, Waltham, MA.
Oosterkamp, A., Djapic, L., & Nordeide, A. (2004). ‘Kissing Bond’ phenomena in solid-state
welds of aluminum alloys. Supplement to the Welding Journal, 83 (8), 225s - 231s.
Parida, B., & Pal, S. (2015). Fuzzy assisted grey Taguchi approach for optimisation of multiple
weld quality properties in friction stir welding process. Science and Technology of
Welding and Joining, 20(1), 35-41. doi: doi:10.1179/1362171814Y.0000000251
Peel, M., Steuwer, A., Preuss, M., & Withers, P. J. (2003). Microstructure, mechanical properties
and residual stresses as a function of welding speed in aluminium AA5083 friction stir
welds. Acta Materialia, 51(16), 4791-4801. doi: http://dx.doi.org/10.1016/S1359-
6454(03)00319-7
Pelton, A. R., Fino-Decker, J., Vien, L., Bonsignore, C., Saffari, P., Launey, M., & Mitchell, M.
R. (2013). Rotary-bending fatigue characteristics of medical-grade Nitinol wire. Journal
of the Mechanical Behavior of Biomedical Materials, 27(0), 19-32. doi:
http://dx.doi.org/10.1016/j.jmbbm.2013.06.003

238
Peng, D., Shen, J., Tang, Q., Wu, C.P., & Zhou, Y.B. (2013). Effects of aging treatment and heat
input on the microstructures and mechanical properties of TIG-welded 6061-T6 alloy
joints. International Journal of Minerals, Metallurgy, and Materials, 20(3), 259-265. doi:
10.1007/s12613-013-0721-8
Periasamy, V. M., Sundararajan, S., Pathak, S. D., & Radhakrishnan, V. M. (1995). Effect of
welding and post weld heat treatment on the tensile and fracture toughness behavior of
Al-Mg-Si alloy. Transactions of the Indian Institute of Metals, 48(5), 373-382.
Perovic, Z. D. (2007). Investigation of the fatigue strength of the welded joints treated by TIG
dressing. Archives of Materials Science, 28(1-4), 113-117.
Pew, J. W., Nelson, T. W., & Sorensen, C. D. (2007). Torque based weld power model for
friction stir welding. Science and Technology of Welding and Joining, 12(4), 341-347.
doi: doi:10.1179/174329307X197601
Pradeep, A., & Muthukumaran, S. (2013). An analysis to optimize the process parameters of
friction stir welded low alloy steel plates. International Journal of Engineering, Science
and Technology, 5(3), 25-35. doi: 10.4314/ijest.v5i3.3
Prasad Rao, K., Janaki Ram, G. D., & Stucker, B. E. (2008). Improvement in corrosion
resistance of friction stir welded aluminum alloys with micro arc oxidation coatings.
Scripta Materialia, 58(11), 998-1001. doi: 10.1016/j.scriptamat.2008.01.033
Priya, R., Subramanya Sarma, V., & Prasad Rao, K. (2009). Effect of post weld heat treatment
on the microstructure and tensile properties of dissimilar friction stir welded AA 2219
and AA 6061 alloys. Transactions of the Indian Institute of Metals, 62(1), 11-19. doi:
10.1007/s12666-009-0002-4
Querin, J.A., & Schneider, J.A. (2012). Developing an alternative heat indexing equation for
FSW. Welding Journal, 91, 76s-82s.
Rahman, A. B. M., Kumar, S., & Gerson, A.R. (2010). The role of silicon in the corrosion of
AA6061 aluminium alloy laser weldments. Corrosion Science, 52(6), 1969-1975. doi:
http://dx.doi.org/10.1016/j.corsci.2010.02.012
Rajakumar, S., & Balasubramanian, V. (2012). Establishing relationships between mechanical
properties of aluminium alloys and optimised friction stir welding process parameters.
Materials & Design, 40(0), 17-35. doi: http://dx.doi.org/10.1016/j.matdes.2012.02.054
Rajakumar, S., Muralidharan, C., & Balasubramanian, V. (2010). Establishing empirical
relationships to predict grain size and tensile strength of friction stir welded AA 6061-T6
aluminium alloy joints. Transactions of Nonferrous Metals Society of China, 20(10),
1863-1872. doi: 10.1016/s1003-6326(09)60387-3
Rajakumar, S., Muralidharan, C., & Balasubramanian, V. (2011a). Influence of friction stir
welding process and tool parameters on strength properties of AA7075-T6 aluminium
alloy joints. Materials & Design, 32(2), 535-549. doi: 10.1016/j.matdes.2010.08.025
239
Rajakumar, S., Muralidharan, C., & Balasubramanian, V. (2011b). Predicting tensile strength,
hardness and corrosion rate of friction stir welded AA6061-T6 aluminium alloy joints.
Materials & Design, 32(5), 2878-2890. doi:
http://dx.doi.org/10.1016/j.matdes.2010.12.025
Ramana, V.P., Reddy, M.G., Mohandas, T., & Gupta, A.V. (2010). Microstructure and residual
stress distribution of similar and dissimilar electron beam welds – Maraging steel to
medium alloy medium carbon steel. Materials & Design, 31(2), 749-760. doi:
http://dx.doi.org/10.1016/j.matdes.2009.08.007
Ramulu, P. J., Narayanan, R. G., Kailas, S.V., & Reddy, J. (2013). Internal defect and process
parameter analysis during friction stir welding of Al 6061 sheets. The International
Journal of Advanced Manufacturing Technology, 65(9-12), 1515-1528. doi:
10.1007/s00170-012-4276-z
Rao, Z., Liu, J., Wang, P.C., Li, Y., & Liao, S. (2014). Modeling of cold metal transfer spot
welding of AA6061-T6 aluminum alloy and galvanized mild steel. Journal of
Manufacturing Science and Engineering, 136(5), 051001-051001. doi:
10.1115/1.4027673
Ravindra, A., & Dwarakadasa, E. S. (1992). Effect of post weld heat treatment on mechanical
properties of gas tungsten arc welds of Al-Li alloy 8090. Journal of Materials Science
Letters, 11(22), 1543-1546. doi: 10.1007/bf00729285
Record, J. H. , Covington, J. L. , Nelson, T. W. , Sorensen, C. D. , & Webb, B. W. . (2007). To
analyze the effects of nine friction stir welding input parameters on measured process
outputs, a 16-run fractional factorial experiment was used. Welding Journal, 86, 97s-
103s.
Reddy, G. M., Gokhale, A. A., & Rao, K. P. (1998). Optimisation of pulse frequency in pulsed
current gas tungsten arc welding of aluminium-lithium alloy sheets. Materials Science
and Technology, 14(1), 61-66.
Reddy, G. M., Mastanaiah, P., Murthy, C., Mohandas, T., & Viswanathan, N. (2006).
Microstructure, residual stress distribution and mechanical properties of friction-stir AA
6061 aluminium alloy weldments. National Seminar on Non-Destructive Evaluation,
Hyderabad, India, December 07-09, 2006.
Rhodes, C. G., Mahoney, M. W., Bingel, W. H., & Calabrese, M. (2003). Fine-grain evolution in
friction-stir processed 7050 aluminum. Scripta Materialia, 48(10), 1451-1455. doi:
http://dx.doi.org/10.1016/S1359-6462(03)00082-4
Rhodes, C. G., Mahoney, M. W., Bingel, W. H., Spurling, R. A., & Bampton, C. C. (1997).
Effects of friction stir welding on microstructure of 7075 aluminum. Scripta Materialia,
36(1), 69-75. doi: http://dx.doi.org/10.1016/S1359-6462(96)00344-2
Rolfe, S.T., & Barsom, J.M. (1977). Fracture and fatigue control in structures: Applications of
fracture mechanics. Prentice-Hall Inc., Engilewood Cliffs, NJ.

240
Rossini, N. S., Dassisti, M., Benyounis, K. Y., & Olabi, A. G. (2012). Methods of measuring
residual stresses in components. Materials & Design, 35, 572-588. doi:
10.1016/j.matdes.2011.08.022
Rubio-Gonzalez, C., Gallardo-Gonzalez, J. A., Mesmacque, G., & Sanchez-Santana, U. (2008).
Dynamic fracture toughness of pre-fatigued materials. International Journal of Fatigue,
30(6), 1056-1064. doi: DOI 10.1016/j.ijfatigue.2007.08.007
Rudy, J. F., & Rupert, E. J. (1970). Effects of porosity on mechanical properties of aluminum
welds. Welding Research Supplement, 49(7), 322s-336s.
Ryabkov, D. V. (2003). Process and apparatus for cleaning and/or coating metal surfaces using
electro-plasma technology. US Patent No. US 6585875.
Sanderson, R. M., & Shen, Y. C. (2010). Measurement of residual stress using laser-generated
ultrasound. International Journal of Pressure Vessels and Piping, 87(12), 762-765. doi:
10.1016/j.ijpvp.2010.10.001
Sato, Y., Yamashita, F., Sugiura, Y., Park, S., & Kokawa, H. (2004). FIB-assisted TEM study of
an oxide array in the root of a friction stir welded aluminium alloy. Scripta Materialia,
50(3), 365-369. doi: http://dx.doi.org/10.1016/j.scriptamat.2003.10.008
Sato, Y.S., Takauchi, H., Park, S.H.C., & Kokawa, H. (2005). Characteristics of the kissing-bond
in friction stir welded Al alloy 1050. Materials Science and Engineering: A, 405(1–2),
333-338. doi: http://dx.doi.org/10.1016/j.msea.2005.06.008
Sato, Y.S, Kokawa, H., Enomoto, M., & Jogan, S. (1999). Microstructural evolution of 6063
aluminum during friction-stir welding. Metallurgical and Materials Transactions A,
30(9), 2429-2437. doi: 10.1007/s11661-999-0251-1
Schajer, G.S., Roy, G., Flaman, M.T., & Lu, J. (1996). Hole-Drilling and ring core methods. In:
Handbook of measurement of residual stresses. Edited by Lu, J. Society for Experimental
Mechanics, Fairmont Press and Prentice-Hall, Englewood Cliffs, NJ.
Schneider, J., Nunes Jr., A.C., & Brendel, M.S. (2010). The influence of friction stir weld tool
form and welding parameters on weld structure and properties: Nugget bulge in self-
reacting friction stir welds. 8th International Symposium on Friction Stir Welding,
Timmendorfer Strand in Lubeck, Germany, May 18-20, 2010.
Schneider, J., & Nunes Jr., A. C. (2004). Characterization of plastic flow and resulting
microtextures in a friction stir weld. Metallurgical and Materials Transactions B, 35(4),
777-783. doi: 10.1007/s11663-004-0018-4
Schütz, Walter. (1996). A history of fatigue. Engineering Fracture Mechanics, 54(2), 263-300.
doi: http://dx.doi.org/10.1016/0013-7944(95)00178-6

241
Scialpi, A., De Filippis, L., & Cavaliere, P. (2007). Influence of shoulder geometry on
microstructure and mechanical properties of friction stir welded 6082 aluminium alloy.
Materials & Design, 28(4), 1124-1129. doi: 10.1016/j.matdes.2006.01.031
Shahbazikhah, P., Asadollahi-Baboli, M., Khaksar, R., Alamdari, R., & Zare-Shahabadi, V.
(2011). Predicting partition coefficients of migrants in food simulant/polymer systems
using adaptive neuro-fuzzy inference system. Journal of the Brazilian Chemical Society,
22, 1446-1451.
Shashi Prakash, D. (2014). Effect of process parameters on tensile strength of friction stir
welding A356/C355 aluminium alloys joint. Journal of Mechanical Science and
Technology, 28. doi: 10.1007/s12206-013-0967-0
Sheng, C., Xia, H., Harris, C. J., & Xunxian, W. (2005). Identification of nonlinear systems
using generalized kernel models. IEEE Transactions on Control Systems Technology,
13(3), 401-411. doi: 10.1109/tcst.2004.841652
Shojaeefard, M. H., Behnagh, R., Akbari, M., Givi, M.K.B., & Farhani, F. (2013). Modelling and
pareto optimization of mechanical properties of friction stir welded AA7075/AA5083
butt joints using neural network and particle swarm algorithm. Materials & Design,
44(0), 190-198. doi: http://dx.doi.org/10.1016/j.matdes.2012.07.025
Sivaraj, P., Kanagarajan, D., & Balasubramanian, V. (2014). Effect of post weld heat treatment
on tensile properties and microstructure characteristics of friction stir welded armour
grade AA7075-T651 aluminium alloy. Defence Technology, 10(1), 1-8. doi:
http://dx.doi.org/10.1016/j.dt.2014.01.004
Smith, C., Pistorius, P. G. H., & Wannenburg, J. (1997). The effect of a long post weld heat
treatment on the integrity of a welded joint in a pressure vessel steel. International
Journal of Pressure Vessels and Piping, 70(3), 183-195. doi:
http://dx.doi.org/10.1016/S0308-0161(96)00029-4
Sonsino, C. M. (1995). Multiaxial fatigue of welded joints under in-phase and out-of-phase local
strains and stresses. International Journal of Fatigue, 17(1), 55-70. doi:
http://dx.doi.org/10.1016/0142-1123(95)93051-3
Sonsino, C. M. (2009). Effect of residual stresses on the fatigue behaviour of welded joints
depending on loading conditions and weld geometry. International Journal of Fatigue,
31(1), 88-101. doi: http://dx.doi.org/10.1016/j.ijfatigue.2008.02.015
Sonsino, C. M., & Kueppers, M. (2001). Multiaxial fatigue of welded joints under constant and
variable amplitude loadings. Fatigue & Fracture of Engineering Materials & Structures,
24(5), 309-327. doi: 10.1046/j.1460-2695.2001.00393.x
Srinivasa Rao, P., Sivadasan, K. G., & Balasubramanian, P. K. (1996). Structure-property
correlation on AA 2219 aluminium alloy weldments. Bulletin of Materials Science, 19(3),
549-557. doi: 10.1007/bf02744827

242
Srinivasan, P. Bala, Blawert, C., Dietzel, W., & Kainer, K. U. (2008). Stress corrosion cracking
behaviour of a surface-modified magnesium alloy. Scripta Materialia, 59(1), 43-46. doi:
10.1016/j.scriptamat.2008.02.032
Stefanov, S., & Stoychev, B. (2004). Experimental data under combined loading of rotating
bending and constant torsion–verification of the integral method for fatigue life
prediction. 4th International Conference Research and Development in Mechanical
Industry, Zlatibor, Serbia and Montenegro, August 31-September 04, 2004.
Steves, Daniel. (2010). Characterization of residual stresses and mechanical performance of gas
tungsten arc welded aluminum alloy 6061-T6. MS Thesis, Department of Mechanical
Engineering, Texas Tech University, TX.
Stewart, M., Adams, G.P., Nunes Jr., A.C., & Romine, P. (1998). A combined experimental and
analytical modeling approach to understanding friction stir-welding. Developments in
Theoretical and Applied Mechanics, 19, 472-484.
Su, J., Nelson, T., Mishra, R., & Mahoney, M. (2003). Microstructural investigation of friction
stir welded 7050-T651 aluminium. Acta Materialia, 51(3), 713-729. doi:
http://dx.doi.org/10.1016/S1359-6454(02)00449-4
Takagi, T., & Sugeno, M. (1985). Fuzzy identification of systems and its applications to
modeling and control. IEEE Transactions on Systems, Man and Cybernetics, SMC-15(1),
116-132. doi: 10.1109/tsmc.1985.6313399
Takahashi, I., Takada, A., Ushijima, M., & Akiyama, S. (2003). Fatigue behaviour of a box-
welded joint under biaxial cyclic loading: effects of biaxial load range ratio and cyclic
compressive loads in the lateral direction. Fatigue & Fracture of Engineering Materials
& Structures, 26(5), 439-448. doi: 10.1046/j.1460-2695.2003.00645.x
Tan, C.F., & Said, M.R. (2009). Effect of hardness test on precipitation hardening aluminium
alloy 6061-T6. Chiang Mai Journal of Science, 36(3), 276-286.
Tansel, I., Demetgul, M., Okuyucu, H., & Yapici, A. (2010). Optimizations of friction stir
welding of aluminum alloy by using genetically optimized neural network. The
International Journal of Advanced Manufacturing Technology, 48(1-4), 95-101. doi:
10.1007/s00170-009-2266-6
Tau, L., Chan, S. L. I., & Shin, C. S. (1996). Hydrogen enhanced fatigue crack propagation of
bainitic and tempered martensitic steels. Corrosion Science, 38(11), 2049-2060. doi:
10.1016/s0010-938x(96)89123-2
Thomas, Wayne, Nicholas, E.D., Needham, J . C., Murch, M.G., Templesmith, P., & Dawes, C.J.
(1991). Friction stir butt welding. Int. Patent App. PCT/GB92/02203 and GB Patent App.
9125978.8, Dec. 1991. U.S. Patent No. 5,460,317, Oct. 1995.
Thompson, R.B., Lu, W.Y., & Clark, A.V. . (1996). Handbook of measurement of residual
stresses. In: Society for Experimental Mechanics. Edited by Lu, J., 149-178, Lilburn, GA.
243
Threadgill, P. L., Leonard, A. J., Shercliff, H. R., & Withers, P. J. (2009). Friction stir welding of
aluminium alloys. International Materials Reviews, 54(2), 49-93.
Tobe, T., & Lawrenece, F.V. (1977). Effect of inadequate joint penetration on fatigue resistance
of high-strength structural steel welds. Welding Research Supplement, 259s-266s.
Tsujitani, M., & Tanaka, Y. (2011). Cross-validation, bootstrap, and support vector machines.
Advances in Artificial Neural Systems, 2011, 1-6. doi: 10.1155/2011/302572
Uzun, Fatih, & Bilge, Ali Nezihi. (2011). Immersion ultrasonic technique for investigation of
total welding residual stress. Procedia Engineering, 10, 3098-3103. doi:
10.1016/j.proeng.2011.04.513
Wahab, M. A., & Sakano, M. (2003). Corrosion and biaxial fatigue of welded structures. Journal
of Materials Processing Technology, 143–144(0), 410-415. doi:
http://dx.doi.org/10.1016/S0924-0136(03)00412-6
Wang, B., Duan, Q. Q., Yao, G., Pang, J. C., Li, X. W., Wang, L., & Zhang, Z. F. (2014).
Investigation on fatigue fracture behaviors of spot welded Q&P980 steel. International
Journal of Fatigue, 66(0), 20-28. doi: http://dx.doi.org/10.1016/j.ijfatigue.2014.03.004
Wei, Z., & Dong, P. (2010). Multiaxial fatigue life assessment of welded structures. Engineering
Fracture Mechanics, 77(15), 3011-3021. doi:
http://dx.doi.org/10.1016/j.engfracmech.2010.03.045
Withers, P. J. (2007). Residual stress and its role in failure. Reports on Progress in Physics,
70(12), 2211-2264. doi: 10.1088/0034-4885/70/12/r04
Xu, W., Liu, J., Luan, G., & Dong, C. (2009a). Microstructure and mechanical properties of
friction stir welded joints in 2219-T6 aluminum alloy. Materials & Design, 30(9), 3460-
3467. doi: http://dx.doi.org/10.1016/j.matdes.2009.03.018
Xu, W., Liu, J., Luan, G., & Dong, C. (2009b). Temperature evolution, microstructure and
mechanical properties of friction stir welded thick 2219-O aluminum alloy joints.
Materials & Design, 30(6), 1886-1893. doi:
http://dx.doi.org/10.1016/j.matdes.2008.09.021
Xu, W., Liu, J., & Zhu, H. (2011). Analysis of residual stresses in thick aluminum friction stir
welded butt joints. Materials & Design, 32(4), 2000-2005. doi:
http://dx.doi.org/10.1016/j.matdes.2010.11.062
Xu, W., Liu, J., Zhu, H., & Fu, L. (2013). Influence of welding parameters and tool pin profile
on microstructure and mechanical properties along the thickness in a friction stir welded
aluminum alloy. Materials & Design, 47(0), 599-606. doi:
http://dx.doi.org/10.1016/j.matdes.2012.12.065
244
Yan, X. J., Yang, D. Z., & Qi, M. (2006). Rotating–bending fatigue of a laser-welded
superelastic NiTi alloy wire. Materials Characterization, 57(1), 58-63. doi:
http://dx.doi.org/10.1016/j.matchar.2005.12.009
Yang, .H., Srinivas, J., Mohan, S., Lee, D.M., & Balaji, S. (2009). Optimization of electric
discharge machining using simulated annealing. Journal of Materials Processing
Technology, 209(9), 4471-4475. doi: http://dx.doi.org/10.1016/j.jmatprotec.2008.10.053
Yung, J.Y., & Lawrence, F.V.B. (1989). Predicting the fatigue life of welds under combined
bending and torsion. Biaxial and Multiaxial Fatigue, EGF3, Edited by Brown, M.W. &
Miller, K.J., 53-69, Mechanical Engineering Publications, London.
Zain, A., Haron, H., & Sharif, S. (2011). Optimization of process parameters in the abrasive
waterjet machining using integrated SA–GA. Applied Soft Computing, 11(8), 5350-5359.
doi: http://dx.doi.org/10.1016/j.asoc.2011.05.024
Zakharov, V. V. (2003). Some problems of the use of aluminum-lithium alloys. Metal Science
and Heat Treatment, 45(1-2), 49-54. doi: 10.1023/a:1023904314848
Zhang, G., Yang, X., He, X., Li, J., & Hu, H. (2013). Enhancement of mechanical properties and
failure mechanism of electron beam welded 300M ultrahigh strength steel joints.
Materials & Design, 45(0), 56-66. doi: http://dx.doi.org/10.1016/j.matdes.2012.09.004
Zhang, Z., & Friedrich, K. (2003). Artificial neural networks applied to polymer composites: a
review. Composites Science and Technology, 63(14), 2029-2044. doi:
http://dx.doi.org/10.1016/S0266-3538(03)00106-4
Zhao, Y., Lin, S., Wu, L., & Qu, F. (2005). The influence of pin geometry on bonding and
mechanical properties in friction stir weld 2014 Al alloy. Materials Letters, 59(23), 2948-
2952. doi: http://dx.doi.org/10.1016/j.matlet.2005.04.048
Zhu, Z. Y., Deng, C. Y., Wang, Y., Yang, Z. W., Ding, J. K., & Wang, D. P. (2015). Effect of
post weld heat treatment on the microstructure and corrosion behavior of AA2219
aluminum alloy joints welded by variable polarity tungsten inert gas welding. Materials
& Design, 65, 1075-1082. doi: http://dx.doi.org/10.1016/j.matdes.2014.10.056

245
APPENDIX
A1. Pin-Tool Design for FSW of Aluminum Alloys
Figure A1: Design of FSW pin-tool shoulder
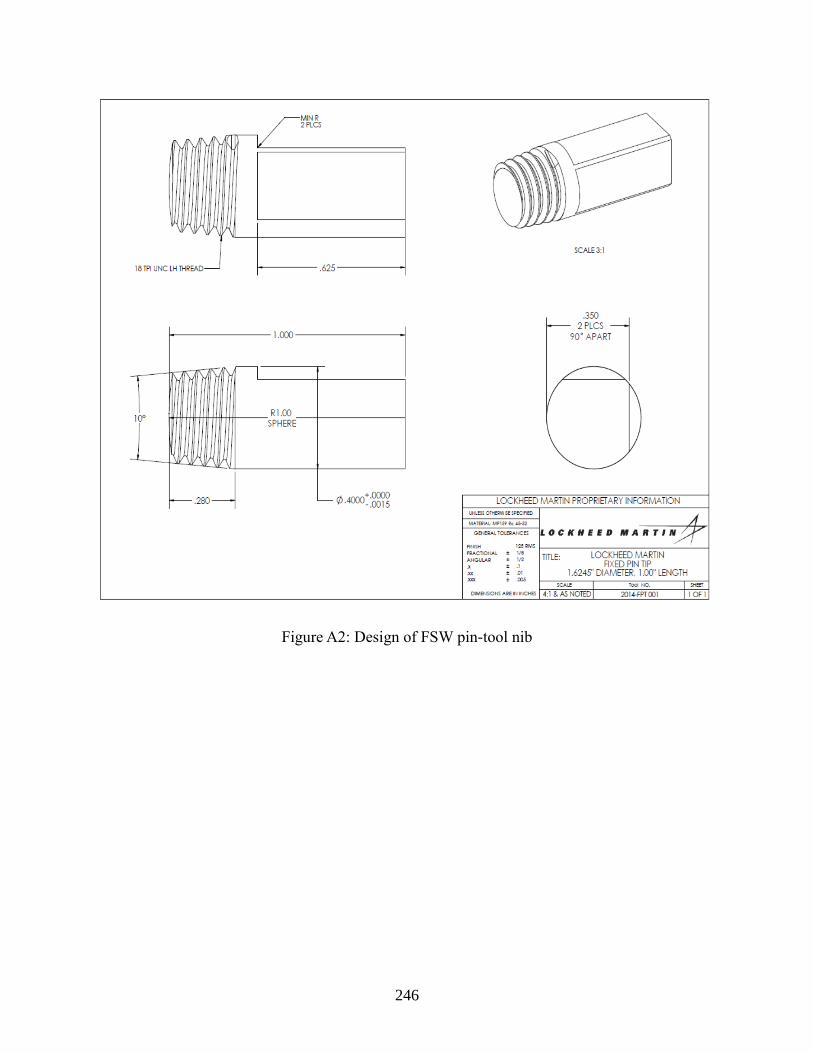
246
Figure A2: Design of FSW pin-tool nib

247
VITA
Mr. Mohammad Washim Dewan was born in Gazipur, a city of South-Asian country of
Bangladesh in January 1985. With enormous support from his parents, he received bachelor of
engineering (with Honors) in Mechanical Engineering in 2007 from Bangladesh University of
Engineering and Technology (BUET). After graduation he joined as a Lecturer in Mechanical
Engineering Department at Dhaka University of Engineering and Technology (DUET), Gazipur.
In fall 2009, he decided to go for higher study and joined in Master’s program in Mechanical
Engineering at Tuskegee University, Alabama, USA. In his MS thesis, he has worked on NSF
funded natural fiber reinforced green composites and published several articles in international
journals and conferences. After completing Master’s degree in fall 2011, he has joined in PhD
program in Mechanical Engineering Department at Louisiana State University, Baton Rouge,
USA. During his PhD study, he has worked on several prestigious projects funded by NASA-
SLS and U.S. NRC and published several articles. He is a candidate for the PhD degree in
Mechanical Engineering to be awarded at the commencement of December 2015.