CH2M HILL - REMEDIAL INVESTIGATION REPORT VOL 2
408
EPA Region S Records Ctr. 233293 ARCSV Remedial Activities at Uncontrolled Hazardous Waste Sites in Region V 00 0 5 8 United States Environmental Protection Afency REMEDIAL INVESTIGATION REPORT Volume 2 ONALASKA MUNICIPAL LANDFILL Onalaska, Wisconsin WA 01-5LL5.0 / Contract No. 68-W8-0040 December 22, 1989 O&iHIlL
-
Upload
khangminh22 -
Category
Documents
-
view
4 -
download
0
Transcript of CH2M HILL - REMEDIAL INVESTIGATION REPORT VOL 2

EPA Region S Records Ctr.
233293
ARCSVRemedial Activities atUncontrolled HazardousWaste Sites inRegion V
00 0 5 8
United States EnvironmentalProtection Afency
REMEDIAL INVESTIGATION REPORT
Volume 2
ONALASKA MUNICIPAL LANDFILLOnalaska, Wisconsin
WA 01-5LL5.0 / Contract No. 68-W8-0040
December 22, 1989
O&iHIlL

REMEDIAL INVESTIGATION REPORT
Volume 2
ONALASKA MUNICIPAL LANDFILLOnalaska, Wisconsin
WA 01-5LLS.O / Contract No. 68-W8-0040
December 22, 1989
GLT913/064.50-3

Appendix ASITE CHRONOLOGY
GLT913/035.50-1

Appendix ASITE CHRONOLOGY
1969
June 1 Town of Onalaska licensed by the Wisconsin Department of NaturalResources (DNR) to operate an 11-acre landfill (License No. 507), previouslyused as a gravel pit.
1970
July 7 Daily landfill operation reports through the end of July identify OutersLaboratories as depositing paper, wood, oil, and some drums at the site.Operation reports also .'entity disposal of refuse from private citizens and trashand rubbish collection Cervices.
1971
January 22 The DNR receives complaint concerning open burning of OutersLaboratories industrial wastes.
January 26 The DNR prohibits all open burning at Onalaska landfill; recordsindicate Outers Laboratories submitted solvent waste for incineration at theOnalaska site.
February 22 The DNR, in a letter to Outers Laboratories, suggests Outers'liquid waste be deposited in a designated area, covered immediately andcompacted. Outers also suggested a lockable gate be installed at the siteentrance.
August 31 The DNR claims operation of site is not in conformance with theWisconsin Solid Waste Disposal Standards. All open burning was prohibitedexcept clean wood, which could be burned in an area with restricted access.Metallic cleaner was to be dumped in a separate area and covered immediately.
May 25 Ordinance adopted by Town Board states landfill is to be used freelyby town residents, and with written permit by nonresidents, commercial garbageand trash haulers.
1972
August 22 The DNR inspects site for locational conformance and determines ifthe site meets the locational requirements of the Wisconsin Standards.
A-l

1973
March 19 The DNR indicates that the Town of Onalaska had difficultycovering waste because a school and an industry (unnamed) dumped waste daily.The DNR reminded town of waste burning restrictions.
1974
October 15 Relicensing and Inspection Report names City of Onalaska, Townof Medary, and Town of Campbell as also using site.
Solvent reportedly dumped in a separate area at rate of approximately500 gallons/2 weeks.
A DNR inspector observes leachate, deposition of unauthorized wastes(unspecified), open burning (unspecified), and monitoring wells in use.
1975
July 23 The DNR asks Town of Onalaska to identify the "acid and industrialchemicals" listed on license application as accepted by township from localindustry for immediate burial.
July 26 Township reports the material is naphtha, a "standard solvent" used asa cleaning fluid, and says the site receives approximately 2,500 gallons/month.The DNR later determines material was from Outers Laboratories.
August 14 The DNR recommends Outers Laboratories find alternative methodsto dispose of naphtha waste.
September 12 Outers Laboratories submits waste review form to the DNRclaiming 90 percent of waste was generated by a metal cleaning process thatcontained naphtha and toluene and remaining 10 percent from paint and spraygun cleaning and machine shop cleaning fluids.
1976
April 16 Outers Laboratories informs the DNR that disposal of liquid waste atOnalaska landfill has ceased.
June 17 The DNR cites need for a site engineering study because the presenceof highly permeable sand and gravel soils on site and evidence of periodic highgroundwater occurrences suggest waste material deposited in landfill mightgenerate leachate that will affect groundwater quality.
A-2

1977
July 21 Town of Onalaska reports to the DNR that Bill's Pumping Service isdumping rinsing material from a can manufacturing company in La Crosse at arate of approximately 600 gallons a week.
1978
February 9 The DNR issues an order to the township to submit a report of in-field site conditions. The DNR finds Onalaska Landfill is not in compliancewith Wisconsin solid waste codes. Violations are cited because site is operatingwithout surface water drain control; site is located in area of permeable soils;site is operated without proper engineering plans and specifications.
April 17 In-field conditions report by Warzyn is submitted to the DNR.Conclusions recommend phased abandonment of the site because ofdowngradient groundwater contamination.
May 21 DNR inspection says township no longer receives canning wastes.
June 1 Meeting is held with the DNR and Warzyn to discuss in-field conditionsreport for Onalaska Landfill; concludes that monitoring well water levels shouldbe determined monthly for 1 year and water quality analyses should bemonitored quarterly.
Organic odor detected in soil samples from monitoring levels B-4 and B-3A.
The DNR agrees to phased abandonment proposal.
June 27 The DNR's Standard Hydrogeologic Review identifies St. FrancisHospital, Continental Can of La Crosse, Metallics, and Outers Laboratories ascommercial refuse site generators. Continental Can is listed as major source ofnonresidential refuse at the site.
Hydrogeologic review also indicates an average of 1 foot between thegroundwater and refuse pile. Reported seasonal fluctuations in water levelscauses waste to be in contact with groundwater for extended periods of time.
October 19 Warzyn submits Plan of Operation and Phased Abandonment Plan.Suggested the site continue to operate until grades are reached where surfacewater drainage is acceptably achieved. Abandonment proposed in three phases:November 1, 1978; October 1, 1979; and May 30, 1980, followed by a 2-foot capand 6 inches of topsoil.
1979
May 1 Warzyn reports two sources of final cover material for landfill that meetDNR standards.
A-3

Warzyn water quality report concludes Onalaska Landfill is affectinggroundwater quality as indicated by observed levels of chloride, total hardness,and conductivity.
May 4 The DNR issues plan approval and orders landfill closure bySeptember 30, 1979.
October 1 Landfill license application lists Modern Clean-Up as a major wastehauler for Onalaska township. Mid-State Exterminators reportedly used tocontrol landfill pests. Open burning occurs once every 2 months.
1980
May 30 The DNR modifies order to close landfill. Changes closure date toSeptember 30, 1980.
December 11 A DNR memorandum reports copper wire was salvaged fromtransformers on the landfill site and identified Trempealeau Electric as apossible source.
1981
October 19 The DNR classifies Onalaska landfill as an open dump because ofimproper closure.
1982
January 20 The DNR informs Miller of plans to construct a replacement well.
July 15 Miller's attorney investigates Miller well water quality.
July 22 Final cap placed over the landfill. Cap seeding delayed untilSeptember 1, 1982.
September 7 The DNR samples monitoring wells and private wells forcompliance with drinking water standards and for organic contamination.
November 5 The DNR recommends that well Nos. 4 and 2 and Miller's well beabandoned and replaced with new wells. Suggests increased monitoring andsampling for barium, manganese, and organic compounds.
November 12 Miller receives $25,000 in damages from lawsuit against OuterLaboratories.
A-4

1983
January 14 Medary Well Drilling begins drilling a new, deeper well for CecilMiller.
January 20 The DNR says transformer oil was either dumped on the ground orused to burn insulation off the copper wire.
May 2 An EPA Potential Hazardous Waste Site Inspection Report is submitted.
June 16 A National Priorities List Score Sheet is submitted.
1984
September Onalaska Landfill is placed on the NPL with hazard ranking of42.97.
September 25 Tech Law, Inc., Fairfax, Virginia, submits draft report to theEPA identifying PRPs.
1986
September 24 Consent order negotiation meeting held with Town of Onalaska.Phased study approach to RI/FS is proposed.
1987
July 31 Town of Onalaska is named PRP by EPA.
October 9 In a Consent Order Negotiation Meeting, the Town of Onalaskaproposed $108,000 to do a preliminary investigation at the site. The town wouldnot sign an open ended consent order without a monetary cap and asked to bereleased from liability for the site if RI/FS costs exceeded $500,000. The townproposed that the EPA fund the remainder of the study if the cost exceeds thatamount
November 4 Deadline for consent order agreement. The EPA could notcommit to a mixed funding settlement for an RI/FS. EPA would conduct theRI/FS.
1988
March 28 The U.S. EPA issues a procurement request order for funding anRI/FS.
GLT913/036.50
A-5

Appendix BCHARACTERISTICS OF CHEMICALS
DEPOSITED ONSITE
GLT913/035.50-2

Appendix BCHARACTERISTICS OF CHEMICALS
DEPOSITED ON SITE
NAPHTHA (VM & P)
Composed of 40 to 80 percent aliphatic hydrocarbons, 25 to 50 percentnaphthenic hydrocarbons, 0 to 10 percent benzene, and 0 to 20 percent otheraromatic hydrocarbons. Derived from petroleum?
Observable Characteristics:
Watery liquidColorlessGasoline-like odor
Physical and Chemical Properties:
Flash point: 103°FBoiling point (1 atm): 266-311°FSpecific gravity: 0.84Latent heat of vaporization: 103-150 Btu/lbHeat of combustion: 18,200 Btu/lbImmiscible in water, components slightly soluble in water
NAPHTHA (Stoddard solvent)
Contains paraffins, naphthenes, alkylbenzenes, with a trace of benzene. Derivedfrom petroleum.
Observable Characteristics:
Watery liquidColorlessGasoline-like odor
Physical and Chemical Properties:
Flash point: 103°FBoiling point (1 atm): 320-390°FSpecific gravity: 0.78Latent heat of vaporization: 103-150 Btu/lbHeat of combustion: 18,200 Btu/lbImmiscible in water, components slightly soluble in water
B-l

NAPHTHA (High Flash)
A coal tar derivative consisting of a mixture of aromatic hydrocarbons,principally toluene, xylene, cumene, and possibly benzene (depending on grade).
Observable Characteristics:
Watery liquidColor - Crude - dark straw-colored
Refined - water-whiteHydrocarbon-like odor (like benzene, toluene, and
xylene)Produces irritating vapor
Physical and Chemical Properties:
Flash point: 107°FBoiling point (1 atm): 200-500°FSpecific gravity: 0.86-0.88Latent heat of vaporization: 101 Btu/lbHeat of combustion: 18,200 Btu/lbImmiscible in water, components slightly soluble in water
MINERAL SPIRITS
A naphtha composed of a fraction slightly lower in boiling point than Stoddardsolvent (names are often used interchangeably). Fraction contains paraffins,naphthenes, olefins and aromatics.
«
Observable Characteristics:
Watery liquidColorlessGasoline-like odor
Physical and Chemical Properties:
Flash point: 105-140°F, depending on gradeBoiling point (1/atm): 310-395°FSpecific gravity: 0.78Latent heat of vaporization: not availableHeat of combustion: not availableImmiscible in water, components slightly soluble in water
Solvosol (aka Mineral Spirits)
Ethanol (ethyl alcohol) used as a solvent for resins, oils, hydrocarbons, surface,cleaning preparations, surface coatings, etc.
B-2

Observable Characteristics:
Colorless, limpid, volatile liquidPungent tasteEthereal, vinous odor
Physical Chemical Properties:
Flash point: 55°FBoiling Point: 173°FSpecific gravity: 0.816Miscible in Water
TOLUENE (Toluol)
Methylbenzene (C7H8)
Observable Characteristics:
Mobile liquidColorlessDistinct aromatic odor, milder than benzene
Physical and Chemical Properties:
Flash point: 40°FBoiling point: 110°FSpecific gravity: 0.866Immiscible in water, components slightly soluble in water
ASPHALTUM
A dark brown to black oily liquid or semiliquid bituminous material resultingfrom the distillation of petroleum. Consists largely of asphaltic hydrocarbonswhich is a mixture of paraffinic and aromatic hydrocarbons and heterocycliccompounds containing sulfur, nitrogen, and oxygen. Aka residual oil, liquidasphalt, black oil, petroleum tailings and residuum.
Observable Characteristic:
Ofly liquid to semiliquidDark brown to black colorTarry odor
B-3

Physical and Chemical Properties:
Flash point: 300-550°FBoiling point: not pertinentSpecific gravity: 1.11 at 50°C (liquid)Molecular weight range--290 to 630Immiscible in water, components slightly soluble in water
PAINT FORMULAS
Proprietary formulas. Solvent components include high-flash petroleum andtoluene. Substance is not water soluble.
SYNTHETIC LUBRICANT (PTL-1009)
Amine soap with chemical lubricity and extreme pressure additives.
Observable Characteristics:
Clear fluidMild odor
Physical and Chemical Properties:
Flash point: 220°FBoiling point: 206°FSpecific gravity: 1.08pH2%soin: "7.2Saponification value: 24.8Neutralization No.: 26.45 mg KOH/gCloud point: 60°FSoluble in water
BARIUM
A silver white metallic element. A secondary mineral constituent in carbonatesedimentation rocks of barite. Barium compounds used in many commercialprocesses. Barium is not very mobile in soils because it forms water insolublesalts and is unable to form soluble complexes with humic and fuMc materials.In an aquatic environment, solubility of barium is controlled by the solubilityproduct of barium carbonate.
The properties of barium compounds vary with specific compounds. A fewselected compounds are shown with their physical/chemical properties listed:
B-4

Chemical Formula
Molecular Weight
Physical State
Boiling Point
Melting Point
Density (g/cnv*)
Vapor Pressure
WaterSolubility (mg/l)
Barium
Ba
137
SilverWhite Solid
163F°C
730°C
3.5
1.810 x 10'5 mmHg
decomposes
BariumCarbonate
BaCO3
197
WhiteCrystal/Powder
N/A
-
4.43
N/A
2(20»Q
BariumChloride
Bad 2
206
WhiteSolid
156°C
%0°C
3.9
N/A
31(0°Q
BanumOxide
BaO
153
ColorlessCrystals
2.000°C
1.923°C
5.72
N/A
3.5 (20°C)
BariumSulfide
BaS
169
InAqueousSolution
-
--
4.25
N/A
decomposes
BariumSultate
BaSo4
233
ColorlessSolid
--
1J80°C
4.5
N/A
._
GLT913/065.50
B-5

Appendix CCAP INVESTIGATION
GLT913/035.50-3

Appendix CCAP INVESTIGATION
INTRODUCTION
The cap investigation at the Onalaska Landfill was conducted in two stagesaccording to the scope of Task Fl, Subtask FS-Cap Investigation. The first wasconducted on April 19 and 20, 1989; the second between May 1 and 3, 1989.The objectives of this investigation were to:
o Determine the permeability of the existing cap soils to evaluate themagnitude of precipitation infiltration
o Determine engineering properties of the cap soils to evaluate theirsusceptibility to damage from freezing/thawing and desiccation and toevaluate the magnitude of damage that has occurred because offreezing and thawing, desiccation, and root damage
During the first stage of the cap investigation, 11 shallow test pits (STP-01through STP-11) were excavated through the cap to characterize the thickness ofthe cap and physical properties of the cap soil. Depths of the shallow test pitsranged from 2.5 to 5 feet. Soil samples, consisting of Shelby tubes and bagsamples, were taken at each location for geotechnical analysis. A total of 13Shelby tube (3-inch thin walled sampler) samples were taken in accordance withASTM D 1587. At least one Shelby tube was pushed at each test pit location.At locations STP-02 and STP-06, two tubes were pushed. At least one bagsample was taken at each test pit location. Two bag samples were taken atSTP-01, STP-03, and STP-04.
Test pit locations are shown in Figure C-l. Test pit logs are included asAttachment C-l. Sample intervals are shown on the test pit logs. In addition tothe shallow test pits, four deep test pits were excavated, as shown on Figure C-l,as part of the Task FI, Subtask Fl-Solvent Disposal Area Investigation. Deeptest pit wall logs were also used to aid in cap characterization; they are includedin Appendix H, Source Area and Test Pit Investigation.
The following persons were onsite specifically for the first stage of the capinvestigation:
Field Team Member Affiliation Responsibility
Chris Lawrence CH2M HILL Field Team Leader/Test Pit Logging
Jeff Salerno Exploration Technologies, Inc. Backhoe Operator
Dave Cruise Exploration Technologies, Inc. Helper
Geotechnical laboratory testing was performed by Warzyn Engineering, Inc., ofMadison, Wisconsin.
C-l

£S
Io — 100
SCALE IN FEEf~
LEGEND
STP-10*-*
DTP-04
LIMITS Of LANDFILLASDETERMINED BY GEOPHYSICAL SURVEY
SHALLOW TEST PIT LOCATION
DEEP TEST PIT LOCATION
NOTE: PITS NOT TO SCALE.
FIGURE O1TEST PIT ANDCROSS SECTION LOCATIONSONALASKA LANDFILL RI/FS

During the second stage of the cap investigation, double-ring infiltrometer testswere conducted to quantify the in situ permeability of the cap. In situ densitiesand moisture contents of the cap were also measured. Seven double-ringinfiltrometer tests were performed. Infiltrometer test locations are shown inFigure C-2. Infiltrometer test locations were chosen based on informationderived from shallow test pit excavations, and are roughly adjacent to selectedtest pits. Density and moisture tests were performed at ground surface on 100foot centers across the site and at selected locations in pits 1 to 1.5 feetunderground. Density and moisture tests were performed to characterize theuniformity of the site soils and the durability of the existing cap.
The following persons were onsite specifically for the second stage of the capinvestigation.
Field Team Member Affiliation Responsibility
Chris Lawrence CH2M HILL Field Team Leader/Cap Evaluation
Paul Boersma CH2M HILL Cap Evaluation
SHALLOW TEST PIT EXCAVATION, SAMPLING, AND TESTING
PURPOSE
Shallow test pits were excavated to determine the thickness and materialproperties of the existing landfill cap. Material from or near the test pits wassampled and tested to:
o Classify the soil in accordance with the Unified Soil ClassificationSystem
o Determine the in situ permeability and other engineering propertiesof the soil
o Characterize the moisture-density relations of the soils to provide abaseline from which to evaluate the extent of damage from freezeand thaw, desiccation, and root damage
o Determine the permeability of recompacted cap soil
FIELD PROCEDURES
Test pits were excavated using a JD-310A wheel-mounted backhoe/loader. Thebackhoe, operator, and helper were provided by Exploration Technologies, Inc.(ETT), an environmental services firm based in Madison, Wisconsin.
C-2

t- "%i
" "
rr-04
IT-04A
"""•"•'• .,. """"*--,.
TOWNSHIPSTORAGE V-,.
n6
LEOB4DUMTS OF LANDFILL AS
,«.„,.-.». DETERMINED BY GEOPHYSICAL SURVEY
ir-IO* LOCATION OF INRLTROMETER TEST CONDUCTED• ON EXISTING GROUND SURFACE
IT10AB LOCATION OF INRLTROMETER TESTII1UAB CONDUCTED IN PIT
RGURE C-2INRLTROMETER
TEST LOCATIONSONALASKA LANOFIU RW=S

Test pits were approximately 3 feet long by 2 feet wide. The actual depth ofeach test pit is shown on the test pit logs. Test pits were excavated in passesapproximately 12 inches deep. Test pit soil was classified by a CH2M HILLgeotechnical engineer in accordance with ASTM D 2487 during excavation. Allcover material was assumed to be uncontaminated and was stockpiled on theground surface adjacent to the test pit. Excavation continued through the entirethickness of the cap. In all cases, the cap was underlain by sand. Excavationwas discontinued when sand was encountered. In two cases (STP-03 and STP-04) refuse was encountered. Soil containing refuse was not stockpiled on theground surface, but was instead held in the bucket of the backhoe until the holewas backfilled. Test pits were backfilled in the reverse order they wereexcavated using the backhoe. Backfilled soil was tamped using the backhoebucket.
Air in the breathing zone was continuously monitored during excavation andbackfilling using an HNu photo-ionization device and an MSA explosimeter. Noreadings above background were observed during excavation of any of the 11shallow test pits.
Shelby tubes were 30 inches long by 3 inches in diameter. Shelby tubes werepushed from the surface to their full depth and extracted using the backhoe. Aspecial head, provided by ETI, allowed the tube to be pulled using the teeth onthe backhoe bucket. Holes left by the Shelby tubes were backfilled using dryconcrete. After the Shelby tubes were withdrawn, the ends were packed withdamp newspaper and plastic caps were taped into place. Bag samples,consisting of 10 to 20 pounds of soil placed in double-lined plastic bags, weretaken from material excavated from the test pits. Soil samples were transportedto the Warzyn Soils Lab in Madison by ETI. The Shelby tube samples weretransported vertically in a cushioned box.
TEST PIT EXCAVATION SUMMARY
Test pits were excavated in reverse order starting with STP-11 and ending withSTP-01. Test pits STP-11 through STP-05 were excavated on April 19, 1989,and test pits STP-04 through STP-01 were excavated on April 20, 1989.
Test pit logs are presented in Attachment C-l. Classifications shown in the logshave been adjusted from the field classifications based on the results oflaboratory and infiltrometer testing. Figures C-3 through C-5 show cross sectionsof the cap based on the test pit logs. Cross section locations are shown onFigure C-l. Table C-l summarizes material types and thicknesses encounteredat each test pit
LABORATORY TESTING SUMMARY
Soil samples taken from the cap were assumed to be uncontaminated andnonhazardous, so precautions during testing were considered unnecessary. Soilsamples from each location were analyzed for grain size, Atterberg limits,density, and permeability. Two moisture-density relation tests were performedon bag samples taken from STP-04. With the exception of one flexible-wall
C-3

GL065550RI Fig C DEDUCED 102789
STP-09
666
664
<f> 662 ~
660
oI
656
654
STP-06
OTP-04
60
APPROXIMATE HORIZONTALSCALE M FEET
STP-01
ASSUMED INTERFACE-NOT OBSERVED IN FIELD
K-A-'vS'-'J BROWN SILT (ML)
Rff.&Sfl LIGHT BROWN SILTY SANO (SM)
f///A GRAY LEAN CLAY (CL)
[•'•'•/•.'•/•.'•.•'•M BROWN SAND (SP-SM) .
^ BROWN TO GRAY SAND (SP-SM)p^%S^ AND REFUSE
NOTE: This cross-section was constructed based oninformation obtained Irorn test pits. Capmaterial and thickness shown between lestpits are interpolated, and variations Iromactual conditions are lihely.
FIGURE C-3SECTION A-AONALASKA LANDFILLHI
GLO65550.RI Fig C-4/HEDUCED 10-2789
STP-08
CO
B!Z
UJ
664 -,
662 -
MO
656
656
654
652 ~
650
DTP-02
STP-06
60
APPROXIMATE HORIZONTALSCALE IN FEET
BROWN SILT (ML)
LIGHT BROWN SILTY SAND (SM)
Y///A GRAY LEAN CLAY (CL)
BROWN TO GRAY SAND (SP SM)AND REFUSE
NOTE: This cross-section was constructed based oninformation obtained from last pits. Capmaterial and thickness shown between testpits are interpolated, and variations Iromactual conditions are likely.
STP-04
ASSUMED INTERFACE-NOT OBSERVED IN FIELD
FIGURE C-4SECTION B-BON ALASKA LAN DULL HI

GLO6S550.RI Fig OS/REDUCED
STP-05
064
662 _
660 _
656 -
Z 656
UJ
Ul
652 -
650 -
DTP-01
60
APPROXIMATE HORIZONTALSCALE IN FEET
STP-06
STP-07
LEGEND
ft* ASSUMED INTERFACE-NOT OBSERVED IN FIELD
BROWN SILT (ML)
LIGHT BROWN SILTY SAND (SM)
K/>»1 GRAY LEAN CLAY (CL)
BROWN TO GRAY SAND (SP-SM)AND REFUSE
NOTE: This cross-section was constructed based oninformation obtained from last pits. Capmaterial and thickness shown between testpits are interpolated, and variations fromactual conditions are likely.
FIGURE C-5SECTION C-CONALASKA LANDFIt I HI

Table C-1TEST PIT LOG SUMMARY
Location
STP-01
STP-02
STP-03
STP-04
STP-05
STP-06
STP-07
STP-08
STP-09
STP-10
STP-1 1
DTP-01
DTP-02
DTP-03
DTP-04
IntervalBelow GroundSurface (in)
0 - 1 616 - 24
>24
0 - 3 0>30
0 - 88 - 2 0
>20
0 - 1 818 - 48
>48
0 - 1 212 - 18
>18
0 - 1 919 - 24
>24
0 - 2 4>24
0 - 88 - 2 0
>200 - 1 2
12 - 20>20
0 -12 -
>
0 - 1 212 - 20
>20
0 - 2 424 - 26
>26
0 - 1 2>12
>0
>0
Soil Color
Light brownGrayBrown
Brown to grayBrown
Light brownGrayBrown
Light brownGrayBrownBrownGrayBrown
BrownGrayBrown
BrownGrayBrownGrayBrownBrownGrayGray
BrownGrayGrayBrownGrayGray
Brown to grayGrayBrown
BrownBrownBrown to gray
Brown
Summary (a)Classification
Sllty sandLean clayMed. to fine sand
Lean clayMed. to fine sandSilty sandLean clayMed. to fine sand
Sllty sandLean clayMed. to fine sand
SiltLean dayMed. to fine sand
SiltLean clayMed. to fine sand
SiltFine sand
SiltLean clayMed. to fine sandSiltLean clayFine sand
SiltLean dayRne sandSiltLean dayRne sand
Silty sandLean dayMed. to fine sandSiltMed. to fine sandMed. to fine sand
Med. to fine sand
USCS (a)Classification
SMCL
SP-SM
CLSP-SM
SMCL
SP-SM
SMCL
SP-SM
MLCL
SP-SM
MLCL
SP-SM
MLSP-SM
MLCL
SP-SMMLCL
SP-SM
MLCL
SP-SMMLCL
SP-SM
SMCL
SP-SM
MLSP-SMSP-SM
SP-SM
Comments
SP-SM containedrefuse includingmedical waste
SP-SM containedrefuse
Refuse observedbelow 12"
Refuse observedbelow 24'
Refuse observedbelow 36*
Refuse observedbelow 1 2"
(a) The classifications are based on the results of laboratory testing. Samples from every testpit were not laboratory classified, however, soils which were visual observed to be similar tothose which were laboratory tested have been given the same classification.

permeability test performed on a recompacted specimen taken from STP-04,permeability tests were performed on undisturbed samples taken from theShelby tubes.
Soil plasticities of many of the samples were lower than anticipated, resulting indeviations from the testing proposed in the original Work Plan. Rigid-wallpermeability tests were performed on samples that were not plastic enough tobe extruded and trimmed for flexible-wall permeability testing. Shrinkage limittests were not expected to provide any useful information and were omitted.With the exception of the permeability tests, laboratory tests were performed inaccordance with appropriate ASTM standards. No ASTM standards are availablefor the types of permeability tests performed. Permeability tests were conductedin accordance with COE EM 1110-2-1906, Appendix VII.
Laboratory analyses were performed on Shelby tube samples taken adjacent toshallow test pits STP-01, STP-02, STP-04, STP-06, STP-07, STP-08, STP-10, andSTP-11 and on a bag sample taken from STP-04. Samples to be analyzed werechosen based on visual inspection of sample type and condition. Results oflaboratory testing are summarized in Table C-2. Detailed results of laboratoryanalysis are presented in Attachment C-2.
INFILTRATION TESTING
PURPOSE
Infiltration testing was performed to provide information that would allow order-of-magnitude permeability estimates to be made and to aid in characterizationand comparison of different soil types used to construct the existing cap.
FIELD PROCEDURES
Infiltrometer testing was conducted in general accordance with ASTM D 3385,Standard Test Method for Infiltration Rate of Soils in Field Using Double-RingInfiltrometers. The double-ring infiltrometer method consists of driving twoopen cylinders, one inside the other, into the ground, partially filling the ringswith water, and then maintaining the water at a constant level. The volume ofwater added to the inner ring to maintain the water level constant is themeasure of the volume of water that infiltrates the soil. The volume infiltratedduring timed intervals is converted to an incremental infiltration velocity. Themaximum steady state infiltration velocity is equivalent to the infiltration rate.
Testing was performed using infiltrometer rings constructed from well casing, 55-gallon drums, and/or stovepipe. Water used for infiltration testing was takendirectly from the Black River and brought to the site in 6-galJon jugs.
For tests conducted underground, a pit large enough to allow placement of theinfiltrometer rings was excavated to the interface of the first underlying soillayer. The surface of the underlying soil layer was then leveled, and testingproceeded as described below.
C-4

Table C-2RESULTS OF LABORATORY TESTING
SampleInterval In
Shelby Tube (a)Sample
STP-01
STP-02B
STP-04
STP-06A
STP-06B
STP-07
STP-08
STP-10
STP-10
STP-11
STP-04
(In)
10 -
7 -
12 -
9 -
1 -
2 -
1 -
1 -
15 -
14 -
18 -
18
13
17
14
6
6
7
6
19
19
48(Bag Sample)
DMCriplion
Brown, silty. tine tomed. SAND: littleclay, trace gravel
Brown, lean CLAY.trace sand
Brown, silty. fine tomed. SAND; little clayBrown silt, some sand.little clay
Gray SILT, some sand.little clay
Brown SILT, littlesand and clay
Gray SILT, some sand.little clayBrown, fine to med.SAND, trace silt andclay
Gray-brown SILT, someclay, little sand
Brown, silty. fine tomed. SAND; little clay
Brown, lean CLAY.little sand
LaboratoryusesClassification
SM
CL
SM
ML
ML
ML
ML
SP-SM
ML
SM
CL
NaturalMoistureContent
<*)
11.5
22.5
15.0
15.6
18.6
22.2
19.6
7.2
22.5
13.4
19.4
DryDensity
(pet)
118.0
102.9
113.0
113.4
108.6
95.0
106.0
103.5
100.2
115.8
103.7
Permeability(cm/sec)
0.000049
0.00000032
0.000024
0.000002
0.0000011
0.000062
0.0000046
0.00068
0.00000055
0.0000063'
0.00000043(0
Type ofPermeability
Test
Rigid-wall
Flexible-wall
Rigid-wall
Flexible-wall
Flexible-wall
Flexible-wall
Flexible-wall
Rigid -wall
Flexible-wall
Rigid-wall
Flexible-wall
LiquidLimit
NP
30
NP
19
21
22
21
NP
26
NP
30
Maximum (b)Dry Optimum (b)
Plastic Density MoistureIndex (pel) (%)
NP
9
NP 120 11
1
2
2
1
NP
4
NP
10 112 14
(a) Zero Inches Is bottom of tube.
(b) Maximum Dry Density and Optimum Moisture Content were determined in accordance with ASTM D 698.Tests were performed on bag samples taken while excavating test pits.
(c) Permeability lest was performed on a trimmed moisture density specimen.

Infiltrometer rings constructed from well casing or 55-gallon drums were set bydriving them into place with a sledge hammer. Rings constructed fromstovepipe were too fragile to be driven into place and were set into place byexcavating a narrow trench with a screwdriver, pouring powdered bentonite intothe trench, forcing the ring into place, and backfilling and tamping the trencharound the ring.
Equipment constraints and the slow soil infiltration properties required thatsome deviations from the ASTM procedure be made during testing. Deviationsfrom the ASTM procedure included the following:
o The ASTM procedure requires that the rings be driven or pushedinto place, not trenched as previously described.
o The ASTM procedure requires the ratio between the diameters of theinner and outer ring be at least two. The actual ratio was less thantwo for some tests.
o The ASTM procedure requires that the level of water (head) in therings be no greater than 6 inches. During the first test no changes inwater level were observed at a head of 6 inches over a period of 4hours. Water levels in subsequent tests were increased to provideheads as high as 15 inches.
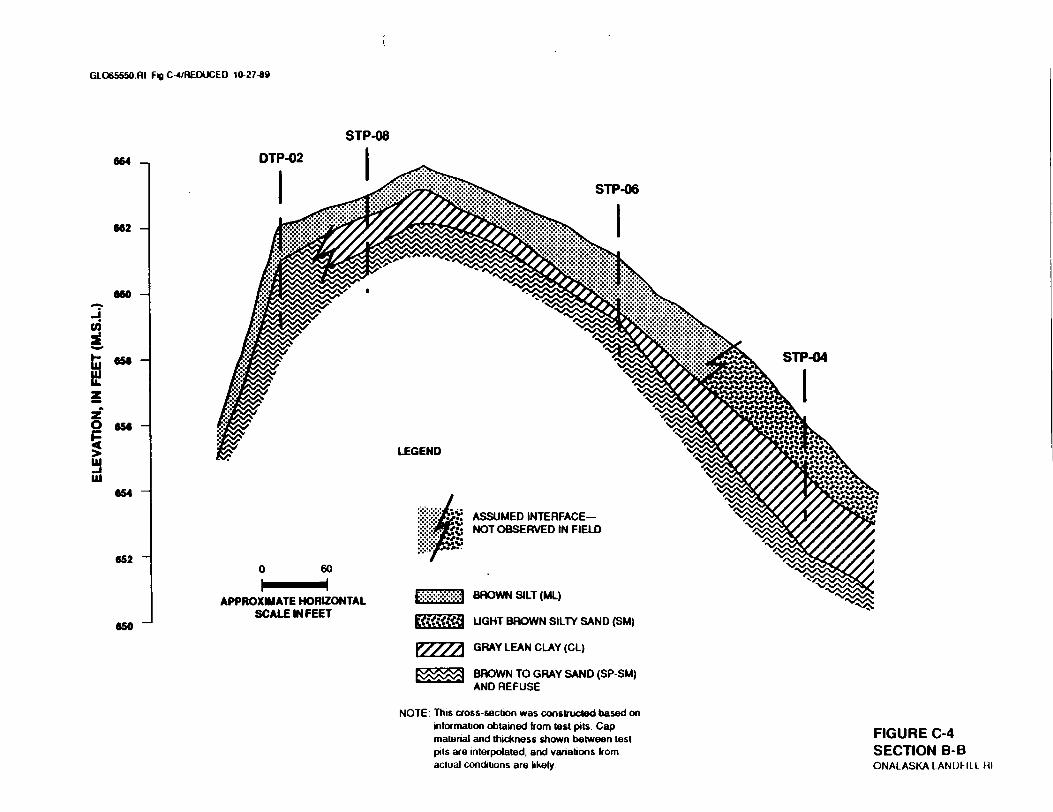
Water levels were measured using either a 1-foot ruler fastened to the inside ofthe ring, or a series of marks etched onto the inside of the ring. Constant headswere maintained by adding water to the rings at various time intervals. Recordswere kept of the time and volume of added water. Lengths of time the testswere run ranged from 23.5 hours to 46.8 hours. Table C-3 presents a summaryof test parameters and calculated infiltration rates.
After an infiltration test was completed, the rings were bailed and removed fromthe soil. After the rings were removed, a trench approximately 6 inches widewas dug along the centerline of the rings to observe the wetting front in the soil.Dye (green or red food coloring) was added to the inner ring water in TestsIT-4, IT-6, IT-9 and IT-10A to aid in the determination of the depth of wettingfront.
Trenches and pits resulting from infiltrometer testing were backfilled by hand.A layer of powdered bentonite, approximately 1 inch thick, was placed in eachpit before backfilling.
TESTING SUMMARY
Infiltration tests were numbered to correspond with the shallow test pit theywere adjacent to. Infiltration tests IT-4, IT-6, IT-9, and IT-10 were conductedon the ground surface adjacent to shallow test pits STP-04, STP-06, STP-09, andSTP-10, respectively. Tests IT-4A, IT-9A, and IT-10A were conducted 1 to 1.5feet underground and adjacent to shallow test pits STP-04, STP-09, and STP-10,
C-5
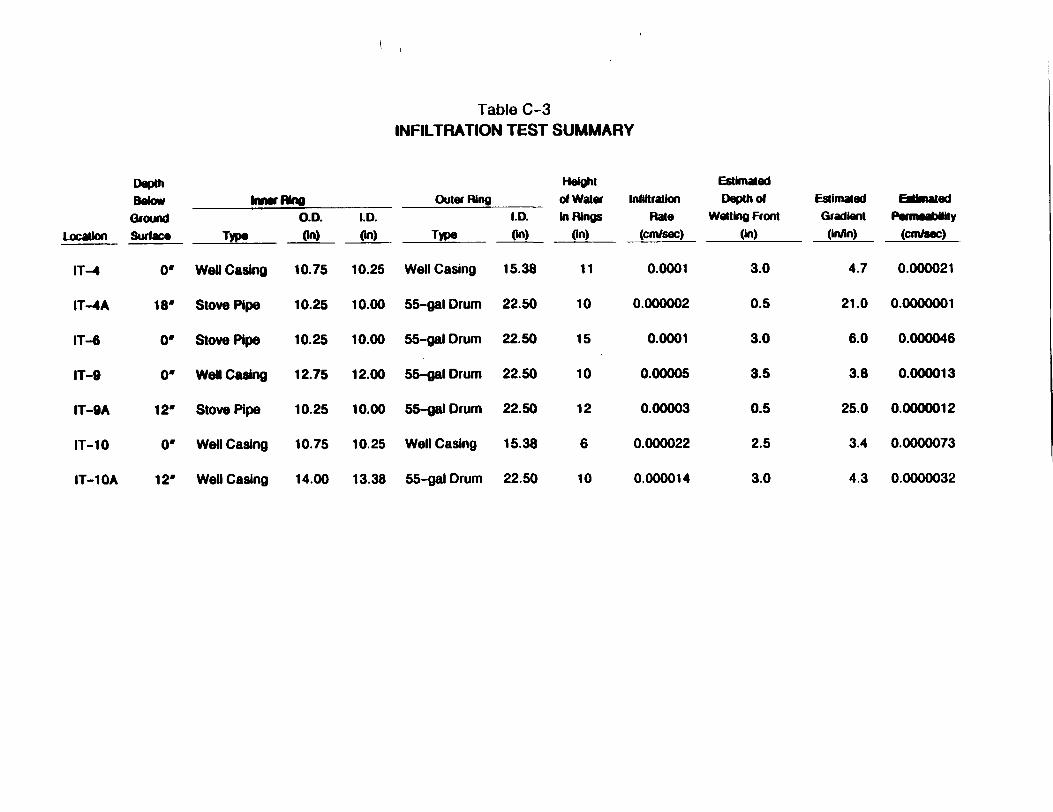
Table C-3INFILTRATION TEST SUMMARY
DepthBelowGround
Location Surface
IT-4
IT-4A
IT-6
IT-0
IT-9A
IT-10
IT-IDA
0'
IS-
C'
o-
12'
0'
12'
toner Ring
Typ«
WeU Casing
Stove Pipe
Stove Pipe
Well Casing
Stove Pipe
Well Casing
Well Casing
O.D.On)
10.75
10.25
10.25
12.75
10.25
10.75
14.00
I.D.(In)
10.25
10.00
10.00
12.00
10.00
10.25
13.38
Outer Ring
Type
Well Casing
55-gal Drum
55-gal Drum
55-gal Drum
55-gal Drum
Well Casing
55-gal Drum
I.D.
15.38
22.50
22.50
22.50
22.50
15.38
22.50
Heightof WaterIn Rings
On)
11
10
15
10
12
6
10
EstimatedInfiltration Depth of
Rate Wetting Front(cm/sac) (in)
0.0001
0.000002
0.0001
0.00005
0.00003
0.000022
0.000014
3.0
0.5
3.0
3.5
0.5
2.5
3.0
EstimatedGradient(In/in)
4.7
21.0
6.0
3.8
25.0
3.4
4.3
EstimatedPermeabNHy
(cm/tec)
0.000021
0.0000001
0.000046
0.000013
0.0000012
0.0000073
0.0000032

respectively. Tests IT-9, IT- 10, and IT-10A were started on May 1, 1989, andtests IT-4, IT-4A, IT-6, and IT-9A were started on May 2, 1989.
Incremental infiltration rates were computed using the following formula:
R = V/(A x t)
where:
R = incremental infiltration rate (cm/s)
V = volume of water added to maintain a constanthead (cc)
A — cross sectional area of inner ring or annular spacebetween rings (cm2)
t = time elapsed since head was last adjusted (s)
Average infiltration rates were computed as a logarithmic average ofrepresentative incremental infiltration rates taken after the test had been runningfor a minimum of 24 hours.
Average infiltration rates were computed using the following formula:
RAVG = INV Iog10 [(log^ + Iog10 R2 + . . . + loglo RN.t + Iog10 RN)/N]
where:
RAVG = average infiltration rate
RN = incremental infiltration rate
N = number of terms averaged
Permeability values are considered to be order-of-magnitude estimates becausegross assumptions concerning hydraulic boundary conditions had to be made.Estimated permeabilities of the soils at each test location were computed usingthe following formula:
k - RAVG/i
where:
k = permeability (cm/s)
= average infiltration rate (cm/s)
= Hydraulic gradient (cm/cm)
C-6

i = Hydraulic gradient (cm/cm)
(H+L)/L
where:
H = Hydraulic head (cm)
= Height of water in infiltration ring
L = Length of drainage path (cm)
* Depth of wetting front
A brief description of each infiltration test is given below, including the methodused to determine the depth of wetting front for each individual test. The depthof saturation referred to in the descriptions is the depth to which excessmoisture (excess relative to surrounding and underlying soil) was visuallyobserved.
Test IT-4
Test IT-4 was conducted using rings constructed from well casing. The innerring had an inner diameter of 10.25 inches and an outer diameter of 10.75inches. The outer ring had an inner diameter of 15.38 inches. Rings weredriven 6 inches into the ground. Soil at the surface was brown silty fine tomedium sand. A water level of 11 inches was maintained in the rings duringtesting. Two ounces of green food coloring were added to the inner ring. Thetest was run for 28.3 hours. An average infiltration rate of 1.0 x 10"* cm/s wascomputed based on the last three incremental infiltration rates measured in theinner ring.
A trench was excavated through the area after the test was completed. Greendye was clearly visible to a depth of 3 inches underground across the area of theinner ring. The depth to which dye was visible appeared to correspond with thedepth of saturation and the depth of the root mat. Green dye was also visiblealong individual deep roots paths to a depth of 6 inches. The depth of wettingfront was assumed to be 3 inches based on the presence of the dye and depthof saturation. The permeability of the soil was estimated to be 2.1 x 10*5 cm/s.
TestIT-4A
Test IT-4A was conducted using an inner ring constructed from stove pipe andan outer ring constructed from a steel 55-gallon drum. The inner ring had aninner diameter of 10 inches and an outer diameter of 10.25 inches. The outerring had an inner diameter of 22J inches. The test was conducted in a pitexcavated to 18 inches underground at the interface Between the brown silty fineto medium sand surface layer and the underlying gray lean clay layer. The ringswere placed 6 inches into the gray lean clay layer. A water level of 10 inches
C-7

was maintained in the rings during testing. The test was run for 29.8 hours. Aninfiltration rate of 2.2 x 10"6 cm/s was the only rate measured in the inner ring.
A trench was excavated through the area after the test was completed. Thedepth of wetting front was assumed to be 0.5 inches based on the depth ofsaturation. The permeability of the soil was estimated to be 1.0 x 10 cm/s.
Test TT-6
Test IT-6 was conducted using an inner ring constructed from stove pipe and anouter ring constructed from a steel 55-gallon drum. The inner ring had an innerdiameter of 10 inches and an outer diameter of 10.25 inches. The outer ringhad an inner diameter of 22.5 inches. Rings were placed 4 inches underground.Soil at the surface was brown silty fine to medium sand. A water level of 15inches was maintained in the rings during testing. Two ounces of green foodcoloring were added to the inner ring. The test was run for 25.4 hours. Anaverage infiltration rate of 1.0 x 10"* cm/s was computed based on the last threeincremental infiltration rates measured in the inner ring.
A trench was excavated through the area after the test was completed. Greendye was visible along individual deep root paths to a depth of 9 inches,'but thedepth of saturation appeared limited to the top 3 inches. The depth of wettingfront was assumed to be 3 inches based on the depth of saturation. Thepermeability of the soil was estimated to be 4.6 x 10"5 cm/s.
Test IT-9
Test IT-9 was conducted using an inner ring constructed from well casing and anouter ring constructed from a steel 55-gallon drum. The inner ring had an innerdiameter of 12 inches and an outer diameter of 12.75 inches. The outer ringhad an inner diameter of 22.5 inches. Rings were placed 6 inches underground.Soil at the surface was brown silt. A water level of 10 inches was maintained inthe rings during testing. Two ounces of red food coloring were added to theinner ring. The test was run for 46.8 hours. An average infiltration rate of 5.0x 10"5 cm/s was computed based on the last six incremental infiltration ratesmeasured in the inner ring.
A trench was excavated through the area after the test was completed. No reddye was visible in the excavation. The depth of wetting front was assumed to be3.5 inches based on the depth of saturation. The permeability of the soil wasestimated to be 1.3 x 10"s cm/s.
Test IT-9A
Test IT-9A was conducted using an inner ring constructed from stove pipe andan outer ring constructed from a steel 55-gallon drum. The inner ring had aninner diameter of 10 inches and an outer diameter of 10.25 inches. The outerring had an inner diameter of 22.5 inches. The test was conducted in a pitexcavated to 12 inches underground at the interface between the brown siltsurface layer and the underlying gray lean clay layer. The rings were placed 6
C-8
inches into the gray lean clay layer. A water level of 12 inches was maintainedin the ring* during testing. The test was run for 29.9 hours. An averageinfiltration rate of 3.0 x 10'5 cm/s was computed based on the last twoincremental infiltration rates measured in the inner ring.
A trench was excavated through the area after the test was completed. Thedepth of wetting front was assumed to be 0.5 inches based on the depth ofsaturation. The permeability of the soil was estimated to be 1.2 x 10"6 cm/s.
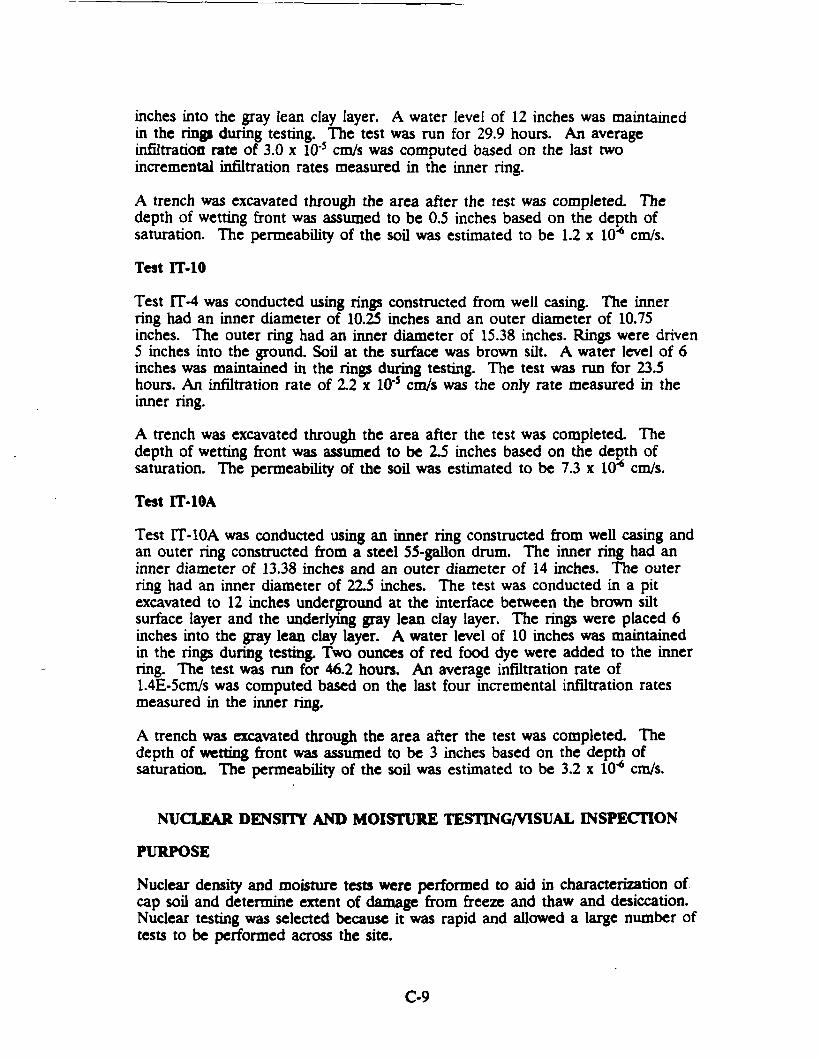
Test IT-10
Test IT-4 was conducted using rings constructed from well casing. The innerring had an inner diameter of 10.25 inches and an outer diameter of 10.75inches. The outer ring had an inner diameter of 15.38 inches. Rings were driven5 inches into the ground. Soil at the surface was brown silt. A water level of 6inches was maintained in the rings during testing. The test was run for 23.5hours. An infiltration rate of 2.2 x 10"5 cm/s was the only rate measured in theinner ring.
A trench was excavated through the area after the test was completed. Thedepth of wetting front was assumed to be 2 J inches based on the depth ofsaturation. The permeability of the soil was estimated to be 7.3 x 10"6 cm/s.
Test IT-10A
Test FT-lOA was conducted using an inner ring constructed from well casing andan outer ring constructed from a steel 55-gallon drum. The inner ring had aninner diameter of 13.38 inches and an outer diameter of 14 inches. The outerring had an inner diameter of 22.5 inches. The test was conducted in a pitexcavated to 12 inches underground at the interface between the brown siltsurface layer and the underlying gray lean clay layer. The rings were placed 6inches into the gray lean clay layer. A water level of 10 inches was maintainedin the rings during testing. Two ounces of red food dye were added to the innerring. The test was run for 46.2 hours. An average infiltration rate of1.4E-5cm/s was computed based on the last four incremental infiltration ratesmeasured in the inner ring.
A trench was excavated through the area after the test was completed. Thedepth of wetting front was assumed to be 3 inches based on the depth ofsaturation. The permeability of the soil was estimated to be 3.2 x 10"* cm/s.
NUCLEAR DENSITY AND MOISTURE TESTING/VISUAL INSPECTION
PURPOSE
Nuclear density and moisture tests were performed to aid in characterization ofcap soil and determine extent of damage from freeze and thaw and desiccation.Nuclear testing was selected because it was rapid and allowed a large number oftests to be performed across the site.
C-9

FIELD PROCEDURES
Density and moisture tests were conducted using a Troxler 3411 Nuclear DensityGage. Tests were conducted in accordance with ASTM D 2922, Density of Soiland Soil-Aggregate in Place by Nuclear Methods (Shallow Depth) and ASTM D3017, Water Content of Soil and Rock in Place by Nuclear Methods. Two tests,one with the source rod 6 inches deep and one with the source rod 12 inchesdeep, were conducted at each location. At three locations (STP-04, STP-09, andSTP-10), density and moisture tests were performed on the underlying gray leanclay layer. These tests were conducted in the pits excavated for infiltroraeterrings. The pits provided a minimum of 8 inches clearance on each side of thegauge. Holes drilled for density testing were backfilled with powdered bentonite.
Density and moisture tests were performed on a 100-foot grid across the site.While density testing, the site was visually inspected for depressions, erosionalgullies, soft or wet zones, ruts, and animal holes.
DENSITY AND MOISTURE TESTING/VISUAL INSPECTION SUMMARY
Density test locations and results are shown in Figure C-6. Nuclear moisturetest results for tests performed in pits are typically high because of the moisturein the side walls of the pit For tests taken in pits, dry densities were computedbased on the nuclear wet density and the average laboratory moisture contentfor the soil type being tested. Maximum dry densities were obtained from themoisture-density relation test performed during the laboratory analysis. In situdensities obtained from laboratory analysis of Shelby tube samples are alsoincluded in the figure.
Figure C-7 shows areas where significant cap damage or features were observed.Animal holes observed along the east side of the site appeared, from thesurface, to extend more than 2 feet underground. Erosional gullies as deep as 1foot were also observed on the east side of the site. A 6-inch depressionapproximately 15 feet in diameter was observed near Station 4+OON, 5+OOE.
EVALUATION OF PRECIPITATION INFILTRATION
PROCEDURES
Table C-4 summarizes results of laboratory and infiltrometer tests together. Soilswith similar properties have been grouped together and average engineeringproperty values (e.g., permeability, density, and moisture content) have beencomputed for each soil type. Permeabilities estimated from infiltrometer testingwere only used to compare soil types and were not included in thedetermination of average permeability values. Soils used to construct the capcan be classified into three categories: lean clay (CL), silt (ML), and silty sand(SM).
C-10

;
'•'••t**fff.. .
o — 100
SCALE IN FEET
360,2 "*•»-.:,.
>
o
U
I
660.2108.7 95.8 «
26.7 ^
103.021.1
, 106.219.7
f 100.820.6
I §96.926.5
94.023.0
25.6
LEGEND
102.417.6
LIMITS OF LANDFILLASDETERMINED BY GEOPHYSICAL SURVEY
DRY DENSITY (PCR
101.5: 103.6* 22.7* IgJ
664.7
99.1»20.5
663,9
94J 93
.•:-.-.-.-.-.:.-.-.-.x '•:::...v.:»:-rti'!'jwi-.o:",.
MOISTURE CONTENT (%)
LOCATION OF TEST PERFORMEDON GROUND SURFACE
LOCATION OF TESTPERFORMED IN PIT
RGURE C-6DENSITY TEST RESULTSONALASKARI/FS

«8
uau.
S
8<*
o — 100
SCALE IN FEET
66O.2
«<J
6S4.9
LEGEND
10
DTP-04
UMn-SOFLANOFlLASDETERMINED BY GEOPHYSICAL SURVEY
SHALLOW TEST PIT LOCATION
DEEP TEST PIT LOCATION
EROSION GULLIES FIGURE C-7SIGNIFICANT VISIBLE
ONALASKA LANDFILL Rl

(Page 1 ol 2)
Table C-4SUMMARY OF RESULTS
OF LABORATORY AND INFILTRATION TESTS
Location
STP-01
STP-04
IT-4IT-6
STP-11
Laboratory Description
Brown, sllty. fine tomed. sand; littleclay, trace gravel
Brown, sllty, tine tomed. sand: little clay
Brown, silly, fine to
LaboratoryusesClassification
SM
SM
SMSM
SM
MoistureContent(%)
11.5
15.0
13.4
DryDensity(pel)
118.0
113.0
115.8
Permeability(cm/sec)
0.000049
0.000024
0.0000210.000046
0.00000063
Liquid (a)Limit
NP
NP
NP
Plastic (a)Index
NP
NP
NP
Comments
Field classificationField classification
Permeability value Is considered
AVERAGE
med. sand: tittle clay
13.3 115.6 0.000034
outlying and Is not Inlcuded Inaverage
Based on results of standard proctor(ASTM D698) maximum dry density forthis material Is 120 pel and optimummoisture content is 11%
STP-06
STP-06
STP-07
STP-08
IT-9rr-10
Brown silt, some sand,little clay
Gray sift, some sand,little clay
Brown sttt, littlesand and clay
Gray silt, some sand,little clay
ML
ML
ML
ML
MLML
15.6
18.6
22.2
19.6
113.4
108.6
95.0
106.0
0.000002
0.0000011
0.000062
0.0000046
0.0000130.0000073
19
21
22
21
1
2
2
1
Sample is considered outlying andvalues are not included In averages
AVERAGE 17.9 109.3 0.0000021 21

(Page 2 ol 2)
Table C-4SUMMARY OF RESULTS
OF LABORATORY AND INFILTRATION TESTS
Location
STP-02
(T-4AIT-9A
STP-10
IT-IDA
STP-04
Labofatory Description
Brown lean clay, tracesand
Gray-brown sill, someclay, little sand
Brown, lean clay.little sand
LaboratoryusesOassiNcaiion
CL
CLCLML
CLCL
MoistureContent(%)
22.5
22.5
19.4
DryDensity(pcQ
102.9
100.2
103.7
Permeability(cm/sec)
0.00000032
0.00000010.000001
0.00000055
0.0000032
0.00000043
Liquid (a)Limit
30
26
30
Plastic (a)Index
9
4
10
Comments
Samples all border on classificationas a CL-ML. Because the exhibitrelatively similar properties theyhave been grouped together. Sample
Irom STP-04 was recompacted andvalues from STP-04 are not includedIn averages.
AVERAGE 22.5 101.5 0.00000042 28 Based on results of standard proctor(ASTM 0698) maximum dry density forthis material Is 113 pel and optimummoisture content Is 14%
STP-11 Brown, silly, fine tomed. sand; trace siltand clay
SP-SM 7.2 103.5 0.00068 NP NP
(a) NP - non-plastic

The three soil types are similar except for varying sand content and the leanclay and the silty sand both border on classifications as a silt. Sand contentranges from 57 percent by weight in the silty sand to 6 percent by weight in thelean clay. For tie purposes of this cap investigation, soil from STP-10 that wasclassified as a gray silt (ML) was grouped with soil from STP-2 that wasclassified as a lean clay (CL) because it was closer to lean clay in terms of visualappearance, grain size, Atterberg limits, and permeability than it was to othersilt encountered at the site.
A precipitation infiltration analysis was performed for each thickness and soil-type combination encountered during excavation of test pits. The infiltrationanalysis was initially performed using both the Wisconsin Department of NaturalResources Water Balance Program and the Hydrologic Evaluation of LandfillPerformance (HELP) Model. Both models use simplifying assumptions and havelimitations that must be considered when reviewing the results.
The WDNR Water Balance Analysis Program applies procedures that have beendeveloped from water balance computational methods originally published byThomthwaite and Mather (ref.), adapted by Fenn, Hanley and Degeare (ref.),and detailed by Kmet (ref). These methods do not account for retardation ofpercolation due to the inclusion of a low permeability barrier layer andincreased runoff from saturation of soil over a barrier layer.
The HELP Model was designed for comparison of candidate landfill caps anduses assumptions not appropriate for this analysis. The inappropriateassumptions include:
o The drainage rate out of a segment (vertical percolation soil layer)cannot be limited by the permeability of the segment below it.
o The barrier layer is always saturated and percolation through it iscontrolled by the head acting on it.
o No evapotranspiration can occur from the barrier layer.
Neither method accounts for either runoff from an adjacent area draining ontothe area being analyzed or for infiltration through channels such as cracks oranimal burrows.
An extensive parametric study was conducted using both models. No correlationwas seen between the models, and the WDNR model did not appear torecognize a low permeability barrier as a deterrent to infiltration. It wasconcluded that the assumptions made by the HELP Model were moreappropriate for this investigation than those made by the WDNR Model;therefore, only the HELP Model was used for the precipitation infiltrationevaluation.
Table C-5 summarizes input parameters and the results of the HELP Modelanalysis. The soil profiles (soil type and thickness) input to the model weredeveloped from the shallow test pit logs and laboratory soil classifications. Soil
Oil

26-OCI-89 (Page i ot 3)
Table C-5
RESULTS OF H.E.L.P. MODEL ANALYSIS
HELP Input Parameters
Location
STP-01
STP-02 v
8TP-03
STP-04
STP-06
STP-06
Sott Type
SMSMCL
SP-SM
SMCLCL
SP-SM
SMSMCL
SP-SM
SMSMCL
SP-SM
SMMLCL
SP-SM
SMSMCL
SP-SM
Layer (a)Type
VPVPBRVP
VPVPBRVP
VPVPBRVP
VPVPBRVP
VPVPBRVP
VPVPBRVP
LayerThickness
(In)
313aa
31512a
35
128
315308
3968
31658
PorosMy(vol/vol)
0.4730.3810.4060.351
0.4730.4060.4060.351
0.4730.3810.4060.351
0.4730.3810.4060.351
0.4730.41
0.4060.351
0.4730.38104060.351
FieldCapacity(vol/vol)
0.2220.1930.3090.071
0.2220.3090.3090.071
0.2220.1930.3090.071
0.2220.1930.3090.071
0.2220.2470.3090.071
0.222019303090071
WiltingPoint
(vol/vol)
0.1040.1040.2100.033
0.1040.2100.2100.033
0.1040.1040.2100.033
0.1040.1040.2100.033
0.1040.1350.2100.033
0.1040.1040.2100.033
Permeability(cm/sec)
0.000680.000034
0.000000420.00068
0.000680.000000420.00000042
0.00068
0.000680.000034
0.000000420.00068
0.000680.000034
0.000000420.00068
0.000680.0000021
0.000000420.00068
0.000680.000034
0000000420.00068
MoistureContent(vol/vol)
0.2440.2440.3710.120
0.2440.3710.3710.120
0.2440.2440.3710.120
0.2440.2440.3710.120
0.2440.3130.3710.120
0.2440.24403710120
SurfaceArea Assumed
Percolation Represented byThrough Cap Test Pit
(in/yr) (sq It)
1.10 20.000
0.25 27.000
1.90 16.000
0.88 19.000
0.74 19.000
0.91 20.000

26-OC1-89 (Page 2 of 3)
Table C-5RESULTS OF H.E.L.P. MODEL ANALYSIS
HELP Input Parameters
Location
STP-07
STP-06
STP-09
STP-10
STP-11
DTP-01
Sod Type(USCS)
SMMLML
SP-SM
SMSMML
SP-SM
SMMLCL
SP-SM
SMMLCL
SP-SM
SMMLCL
SP-SM
SP-SMSM
SP-SM
Layer (a)Type
VPVPBRVP
VPVPBRVP
VPVPBRVP
VPVPBRVP
VPVPBRVP
VPBRVP
LayerThickness
(in)
39
128
31168
3988
3988
3988
8128
Porosity(vol/vol)
0.4730.410.41
0.351
0.4730.3810.41
0.351
0.4730.41
0.4060.351
0.4730.41
0.4060.351
0.4730.41
0.4060.351
0.3510.3810.351
FieldCapacity(vol/vol)
0.2220.2470.2470.071
0.2220.1930.2470.071
0.2220.2470.3090.071
0.2220.2470.3090.071
0.2220.2470.3090.071
0.0710.1930.071
WillingPoint
(vol/vol)
0.1040.1350.1350.033
0.1040.1040.1350.033
0.1040.1350.2100.033
0.1040.1350.2100.033
0.1040.1350.2100.033
0.0330.1040.033
Permeability(cm/sec)
0.000680.0000620.0000620.00068
0.000680.000034
0.00000210.00068
0.000680.0000021
0.000000420.00068
0.000680.0000021
0.000000420.00068
0.000680.0000021
0.000000420.00068
0.000680.0000340.00068
SurfaceArea Assumed
Moisture Percolation Represented byContent Through Cap Test Ptt(vol/vol) (in/yr) (sq It)
0.244 2.300.3130.3130.120
0.244 1.800.2440.3130.120
0.244 0.730.3130.3710.120
0.244 0.730.3130.3710.120
0.244 0.730.3130.3710.120
0.120 4.100.2440.120
29.000
22.000
25.000
29.000
34.000
15.000

26-OCI-89 (Page 3 of 3)
Table C-5RESULTS OF H.E.LP. MODEL ANALYSIS
HELP Input Parameters
SoM TypeLocation (USCS)
DTP-02 SMMLML
SP-SM
DTP-03 SMSMSM
SP-SM
DTP-04 SMSMSM
SP-SM
Layer (a)Type
VPVPBRVP
VPVPBRVP
VPVPBRVP
LayerThickness
<»n)
3368
321128
354
8
Porosity(vol/vol)
0.4730.410.41
0.351
0.4730.3810.3810.351
0.4730.3810.3810.351
FieldCapacity(vol/vol)
0.2220.2470.2470.071
0.2220.1930.1930.071
0.2220.1930.1930.071
WillingPoint
(vol/vol)
0.1040.1350.1350.033
0.1040.1040.1040.033
0.1040.1040.1040.033
Permeability(cm/sec)
0.000680.00000210.0000021
0.00068
0.000680.0000340.0000340.00068
0.000680.0000340.0000340.00068
SurfaceArea Assumed
Moisture Percolation Represented byContent Through Cap Test Pit(vol/vol) (in/yr) (sq (1)
0.244 5.800.3130.3130.120
0.244 1.400.2440.2440.120
0.244 4.000.2440.2440.120
19.000
15.000
6.000
Average Infiltration Rate (weighted by area)Total Area
(a) VP denotes vertical percolation layer, BR denotes barrier layer.
NOTE: Depth of evaporative zone is 20 Inches.
1.60
315,000

profiles input to the model were adjusted from the test pit logs based on theresults of laboratory and infiltrometer testing. While laboratory classificationtests were not performed on soil samples taken from every test pit, soils thatwere observed to be similar to those laboratory tested, based on appearance andinfiltration rate, were assigned the laboratory classification. Permeabilities andmoisture contents input for each soil type were the average values presented inTable C-4.
The HELP Model was designed for parametric analysis; therefore, it wasnecessary to make assumptions common to all soil profiles to be able tocompare the results. The following assumptions were made for each soil profileanalyzed.
o The top layer of each soil was assumed to be 3 inches of silty sand,regardless of what was encountered in the field. This was done toaccount for the higher permeability expected in this area because ofthe presence of roots.
o The HELP Model assumes that a barrier layer is always saturated,and that no evapotranspiration can occur from it. Therefore eachprofile analyzed was assumed to have a barrier layer to allow themodel to make consistent assumptions. Labeling a layer as a barrierdoes not affect the soil layer type or permeability (i.e., if the soilprofile observed in the field consisted entirely of silty sand, thebarrier would consist of silty sand also).
o The cap was assumed to be underlain by 8 inches of fine sand.Percolation into the waste mass was assumed to be equal topercolation from the bottom of the sand layer.
SUMMARY OF RESULTS
The results of the infiltration study can be summarized as follows:
o The results of the infiltration analysis show annual infiltration rates torange from 0.25 inches per year in areas capped with 2 feet of clay to5.8 inches per year in areas capped with 1 foot of silt The averageinfiltration rate, weighted based on the area of the cap assumed to berepresented by each test pit, is 1.6 inches per year or 860 gallons perday across the 7.2-acre cap.
o The HELP Model indicates that infiltration is greatest in areas wherethe cap is thinnest (DTP-02 and DTP-04). This is because of the thinevaporative zone recognized by the model The actual evaporativezone may extend through the cap into the waste mass; in these cases,the volume of percolation through the cap may not corresponddirectly to the volume of leachate produced.
o The HELP Model computes percolation through a barrier layerassuming saturated flow. Percolation is directly related to the
C-12

hydraulic head acting above the barrier layer. The actualeffectiveness of a clay or silt layer as a barrier is greatly reducedbecause no lateral drainage layer is included above it, therebyallowing large hydraulic heads to build. The decreased effectivenessis accentuated by the model because of the conservative assumptionthat the barrier is always saturated.
4) The HELP Model indicated that a thick (> 24 inches) silty sand(SM) layer was nearly as effective a deterrent to infiltration as silt(ML) and clay (CL layers. This is most likely because of assumptionsmade by the HELP Model, particularly that the barrier layer is alwayssaturated and that no evapotranspiration can occur from it Becausethe silty sand is at least one order of magnitude more permeable thanthe silt or clay, it is likely that infiltration through areas of the capconstructed from sand is greater than through areas of the capconstructed from silt or clay.
5) The infiltration analysis was performed based on microscopic soilproperties. Infiltrometer and laboratory testing did not account formacroscopic cap features such as large cracks, erosion gullies, oranimal holes. It is likely that, at least in localized areas, precipitationinfiltration through these features is much greater than reported here.
FREEZE AND THAW, DESICCATION, AND ROOT DAMAGE EVALUATION
Mechanical stresses, such as those resulting from freeze and thaw, desiccation,and root damage, increase void space within soil, increasing its permeability anddecreasing its effectiveness as a cap. When a saturated soil freezes, the soilvolume increases 3 to 5 percent, creating mechanical stresses. This phenomenonis termed frost action. Under certain conditions, water near the top of thecapillary zone freezes in progressively growing lenses causing substantially highervolume changes. This phenomenon is termed frost heave. The three conditionsnecessary for frost heave to occur are a frost susceptible soil, freezing conditions,and a water supply. The most frost susceptible soils tend to be silts. Cap soilused at the site has been laboratory classified as silt, clay, sand bordering onclassification as a silt Reported depths of frost in the area range from 3.5 to 6feet (Sowers et al.). Assuming a minimum depth of frost of 3.5 feet, the entirethickness of the cap would usually be subjected to freezing conditions.Generally, large frost heaves will occur only if a constant supply of groundwateris available. However, the cap cross section observed during test pitting was notuniform, and the potential for perched water in the silt over the clay barrier islikely in some areas. This would provide a source of water that would allowfrost heave to occur. However, the magnitude of the frost heave would belimited by the volume of perched groundwater.
As previously described, two soil samples, one silty sand (SM) and one lean clay,were tested for moisture-density relationship (Standard Proctor, ASTM D 698).The silty sand had a maximum dry density of 120 pcf at an optimum moisturecontent of 11 percent The lean clay had a maximum dry density of 112 pcf at
C-13

an optimum moisture content of 14 percent. No moisture density test wasperformed on the silt (ML) but for the purposes of this report, it was assumedto have a maximum dry density of 116 pcf (the average of the sand and claymaximum densities).
Surface nuclear density tests indicate that the top foot of material has loosenedto a point where it is as low as 73 percent of maximum dry density. The cap isassumed to have an original dry density of 90 percent of maximum dry density.This is a common construction compaction requirement and is usually readilyattainable in the field. Actual compaction requirements during cap constructionare not known. Loosening can be attributed to root damage, frost action, anddesiccation damage. In most cases, material tested over 1 foot underground hada dry density of 90 percent or more of the maximum dry density determined inthe laboratory analysis.
Areas of low density coincided with areas of high moisture content, indicatingthat frost heave, as described above, may be occurring. One silt specimen takenfrom a Shelby tube sample obtained approximately 19 inches underground in thearea of STP-07 had a dry density of 95 pcf (81 percent of maximum dry density)indicating that deep frost damage could have occurred in some areas. Thisspecimen had a permeability an order of magnitude higher than other siltspecimens. Areas where deep frost damage ("deep" meaning frost damagegreater than 1 foot underground) is indicated by excessive (excessive relative tothe soil type and other moisture tests) surface soil moisture contents. This canbe attributed to the depth from which the moisture specimen was obtained. Alllaboratory samples were taken from at least 15 inches underground surface.Testing was conducted in early May, and it is likely that the ground surface wasstill saturated from snow melt.
CAP INVESTIGATION SUMMARY AND CONCLUSIONS
Based on the results of field testing, laboratory testing and precipitationinfiltration analysis, the cap has been divided into five general classes:
o Single sand layer cap greater than 12 inches thick
o Layered cap greater than 12 inches thick with clay barrier
o Layered cap greater than 12 inches thick with silt barrier
o Layered cap greater than 12 inches thick with evidence of frostdamage in the silt barrier
o Single layer sand or silt cap less than 12 inches thick
Figure C-8 shows the cap sectioned into these five classes. Interfaces betweencap classes were interpolated based on test pit locations and were not observedin the field.
C-14

o
u
i
0 100
SCALE IN FEET
66O.2
. . . . , . . . s t - : *' ^' " . ' . - ' . ' . ' I --^ ^*\X*4*tW ••*"*^.
~Va
i-JSTJwXvvX-3 • STP-o*
LAYERED CAP WITHCLAYBARRCR
y v ^ <»v v v \tv\> v.\%Arwo^A«5yv^
I.t
r
665.8•\STP-it: (
. .
7?.'7?.J7?.-7?.-??;?Z\ LAYERED CAP WITH- .' .- - - .Xi StTBARHCR
CAP LESS THAN iTHICK
'-T.'T-T.T'.Tl CAP WITH SINGLE^^^^^'J SANOLAYEH
AREAS WHERE DEEPFROST DAMAGE LIKELY
DTP-OC
LIMTTS OF LANDFILL ASDETERMMED BY GEOPHYSICAL SURVEY
SHALLOW TEST PfT LOCATION
DEEP TEST PfT LOCATION
NOTE: LAYERED CAP WITH CLAY BARRIER ENCOMPASSESAPPROXIMATELY ALL OTHER AREAS, WITHIN THE LANOFILLAREA,THAT ARE SHOWN AS BEING CAPPED.
RGURE C-8GENERAL CAP CLASSIFICATIONSONALASKA LANDFILL Rl

Areas of particular concern where infiltration may be greater include thosewhere the cap is less than 12 inches deep, constructed from a single sand layer,or has been affected by frost damage at depth. Areas which are 12 inches orless thick are of particular concern. The precipitation infiltration analysis showsthem to provide the least effective barrier to precipitation infiltration and theyprovide minimal coverage to prevent direct human or animal contact with thewaste.
While the Help Model indicates that areas of the cap constructed using siltysand are as effective limiting precipitation infiltration as areas of the capconstructed using clay or silt, this is based on a number of limiting assumptions,as discussed previously. Because the permeability of the silty sand is at leastone order of magnitude greater than the silt or clay at the site it is likely thatinfiltration through these areas is excessive relative to other areas of the cap.
Increased permeability can be explained by loosening and fracturing of the soilfrom frost action. The cap in the area of STP-07 appears to have beensignificantly damaged to depth by frost action or frost heave. The permeabilityof the silt in this area has been tested to be an order of magnitude greater thansimilar silt located elsewhere at the site and two times greater than silty sand atthe site. It is likely that infiltration through areas damaged at depth by frostaction or frost heave is substantially greater relative to the rest of the site.
During the visual inspection of the cap erosion gullies, animal holes, and animalholes in erosion gullies were found in some areas. The volume of precipitationinfiltration through animal holes in these areas may be more than infiltrationthrough the soil.
The WDNR requires existing landfills to be closed with a minimum 2-foot thickclay cap plus a 1.5- to 2.5- foot thick soil cover layer. Clay used in the capmust contain a minimum of 50 percent material by weight that passes theNumber 200 sieve and have a saturated hydraulic conductivity of 1 x 10"7 cm/s orless. The silty sand encountered at the site does not meet the particle sizerequirement, and none of the material encountered on the site has been shownto have a saturated hydraulic conductivity of 1 x 10'7 cm/s. Therefore, theexisting landfill cap is substandard relative to current State requirements.
GLT913/040JO
C-15

Attachment C-lTEST PIT LOGS
GLT913/035.50-14

TEST PIT LOG LEGEND:
SAMPLE TYPE:B - BAG SAMPLE
ST-SHELBY TUBE
NOTES:
1. THE TEST PIT LOGS AND RELATED INFORMATION DEPICT SUBSURFACECONDITIONS ONLY AT THE SPECIFIC LOCATIONS AND DATE INDICATED.SOIL CONDITIONS AND WATER LEVELS AT OTHER LOCATIONS MAY DIFFERFROM CONDITIONS OCCURRING AT THESE BORING AND/OR TEST PITLOCATIONS. ALSO. THE PASSAGE OF TIME MAY RESULT IN A CHANGE INTHE CONDITIONS AT THESE LOCATIONS.
2. TEST PITS WERE LOGGED IN THE FIELD BY A CH2M HILL ENGINEERINGGEOLOGIST OR GEOTECHNICAL ENGINEER. SAMPLES WERE EXAMINEDAND VISUALLY CLASSIFIED IN APPROXIMATE ACCORDANCE WITH ASTMD2488.
3. SOIL DESCRIPTIONS PRESENTED IN THESE LOGS ARE A SUMMARY OFFIELD LOGS. VISUAL CLASSIFICATIONS AND LABORATORY TESTS.
4. LABORATORY TEST RESULTS PRESENTED ON THESE LOGS ARE RESULTSOF TESTS PERFORMED ON SHELBY TUBE SAMPLES. SHELBY TUBES WEREPUSHED AS FAR AS 5 FEET AWAY FROM THE TEST PITS AND VERTICALINTERVALS DO NOT ALWAYS CORRELATE. TEST RESULTS ARE SHOWNADJACENT TO THE TYPE OF SOIL TESTED. AND ARE NOT NECESSARILY ATTHE SHELBY TUBE INTERVAL TESTED.
TEST PITLOG LEGEND
~PROJECT NUMBER
GLO65550.FI.FS
PROJECT Onalaskt Municipal UndfiU RI/FS LOCATION
ELEVATIONEXCAVATION EQUIPMENTWATER LEVELAND DATE
658 ft ± CONTHACTORJD310-A
TEST PIT NUMBERSTP-01 SHEET 1 OF I
TEST PIT LOG
3+«OE, 7-HiON LOGGERE.T.L
DATE EXCAVATEDNot encountered APPROX. DIMENSIONS: Lwrath 3 ft Width 2 ft
C. Lawrence
4/20/89
Maximum Depth 3f t
5 p3 i.UJ LJJa o
a to
"> IV/.u
4.0'-
5.01-
SAMPLE
INTE
RVA
L
0
IJ1
2.0'
23'
TYPE
AN
DN
UM
BER
to
CM
CO
CM
O
hiCO
SOIL DESCRIPTION
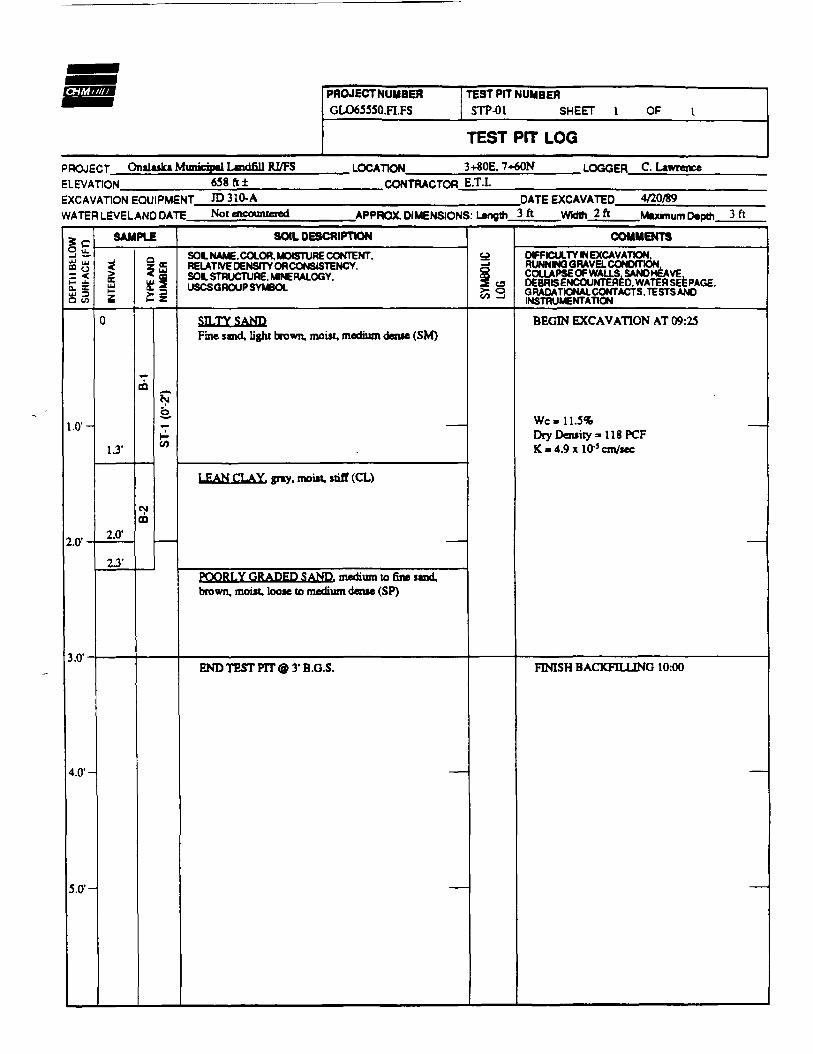
SOL NAME. COLOR, MOISTURE CONTENT.RELATIVE DENSITY OR CONSISTENCY,SOL STRUCTURE. MWERALOGY.USCSQROUPSYMBOL
STLTYSANDFine sand, light brown, moist, medium dense (SM)
LEAN CLAY, grey, moist, stiff (CL)
POORLY GRADED SAND, medium to fine sand.brown, moist, loose to medium dense (SP)
ENDTESTPTT@3>B.G.S.
58</> ij
COMMENTS
DIFFICULTY IN EXCAVATION.RUNNMQ GRAVEL CONDITION.COLLAPSE OF WALLS, SAND HEAVE,DEBRIS ENCOUNTERED, WATER SEfe PAGE.GRAOATK3NAL CONTACTS, TESTSANOINSTRUMENTATION
BEGIN EXCAVATION AT 09:25
We .11.5%Dry Density =1 18 PCFK - 4.9 x 10 5 cm/sec
FINISH BACKFILLING 10:00
—

fflli'iHtflM PROJECTNUMBER
GLO65550.FI.PS
PROJECT Onalaska Municioal Landfill RI/FS LOCATIONELEVATION 662 ft ± CONTRACTOREXCAVATION EQUIPMENT JD310-A
TEST PIT NUMBER
STP-02 SHEET 1 OF j
TEST PIT LOG
20G+40E. 6+OON LOGGERE.T.L
DATE EXCAVATEDWATER LEVELAND DATE Not encountered APPROX. DIMENSIONS: Length 3ft Width 2ft
C. Lawrence
4/20/89Maximum Depth 3f t
5~
DE
PTH
BE
LO
SU
RFA
CE
(F
1.0'-
~l fy
4.0'-
5.0'-
SAMPLE
INTE
RV
AL
0
2.0'
2S
TYPE
AN
DN
UM
BE
R
vCO
0
CD
,J.
cn
*C/)
SOIL DESCRIPTION
SOIL NAME , COLOR. MOISTURE CONTENT,RELATIVE DENSITY OR CONSISTENCY ,SOL STRUCTURE. MMERALOGY.USCSQROUP SYMBOL
LEAN CLAY, brown to gray, moist, stiff (CL)
POORLY GRADED SAND, medium to fine sand.brown, moist, loose to medium dense (SW)
END TEST PIT @ 31 B.G.S.
CO _l
COMMENTS
DIFFICULTY IN EXCAVATION.RUNWNGGRAVEL CONDITION.COLLAPSE OF WALLS. SAND HEAVE.DEBRIS ENCOUNTERED. WATER SEEPAGE.GRAOATIONAL CONTACTS, TESTS ANDINSTRUMENTATION
BEGIN EXCAVATION at 08:55
We = 2X5*LL«30 PI -9 —Dry Density » 10X9 PCFK = 3.2x10-' cm/sec
FINISH BACKFILLING @ 9:20
—

r»jt7,miiM PROJECT NUMBER
GLO65550.FI.PS
TEST PIT NUMBER
STP-03 SHEET l OF !
TEST PIT LOG
PROJECT Onalaika MuniCTD*! Landfill RI/FS LOCATIONELEVATION 659 ft ± CONTRACTOREXCAVATION EQUIPMENT JD310-A
4+00E. 6+OON LOGGERE.T.I.
DATE EXCAVATEDWATER LEVEL AND DATE Not encountered APPROX. DIMENSIONS: Larwth 3ft Width 2ft
C. Lawrence
4/20/89Maximum Depth 3f t
* c
DE
PTH
BE
LCS
UR
FA
CE
(F
1.0'-
t cv
4.01-
5.0'-
SAMPLE
INT
ER
VA
L
0
0.7
1.21
2.0
TYP
E A
ND
NU
MBER
,_CO
srm ^
»7h-'ft
SOIL DESCRIPTION
SOU. NAME. COLOR. MOISTURE CONTENT,RELATIVE OENSTTY OR CONSISTENCY.SOL STRUCTURE. MINERALOGY.USCSGROUPSYMBOL
STL.TY SAND, fine sand, light brown, moist.medium dense (SM)
LEAN CLAY, gray, moist, stiff (CL)
POORLY GRADED SAND, medium to fine sand.brown, moist, loose to medium dense (SP)
END TEST PIT @ 31 B.G.S.
S a553
COMMENTS
DFFICULTY IN EXCAVATION.RUNNMG GRAVEL CONDITION,COLLAPSE OF WALLS, SAND HEAVE,DEBRIS ENCOUNTERED. WATERSEEPAGE.GHADATIONAL CONTACTS. TESTS ANDINSTRUMENTATION
BEGIN EXCAVATION® 08:20
Gray silty clay layer ranged from 0.5' to 1.5'thick along east pit wall
Excavated material contained whatappeared to be medical waste (blood-stainedplastic bags and labels which read "T&G Bags ' ,
FINISH BACKFILLING @
—

F*I},',lfffIM PROJECT NUMBER
GLO65550.n.PS
PROJECT Onalaslca Municiutl Landfill RI/FS LOCATION
ELEVATION 656 ft ± CONTRACTOREXCAVATION EQUIPMENT JD310-A
TEST PIT NUMBER
STP-04 SHEET 1 Of i
TEST PIT LOG
5+OOE. 6+OON LOGGERE.T.L
DATE EXCAVATEDWATER LEVEL AND DATE Not encountered APPROX. DIMENSIONS: Lanoth 3ft Width 2ft
C. Lawrence
4/20/89Maximum D«pth 5 ft
?
DEP
TH B
ELO
SUR
FAC
E (F
1.01-
3.0'-
4 n1
SAMPLE
INTE
RVA
L
0
1.5'
2.0'
4.0'
TYP
E A
ND
NU
MBER
CO
CM
CD
W>
SOIL DESCRIPTION
SOIL NAME. COLOR. MOISTURE CONTENT.RELATIVE DENSITY OR CONSISTENCY.SOIL STRUCTURE. MINERALOGY.USCSGROUPSYMBOL
SILTY SAND, fine sand, light brown, moist.medium dense (SM)
LEAN CLAY, gray, moist, stiff (CL)
POORLY GRADED SAND, medium to fine.DRUNK, moist, loose to medium dense (SP)
END TEST PIT @ 5.0' B.G.S.
58V) .J
COMMENTS
DIFFICULTY IN EXCAVATION.RUNNING GRAVEL CONDITION,COLLAPSE OF WALLS. SAND HEAVE.DEBRIS ENCOUNTERED, WATER SEEPAGE ,GRAOATIONAL CONTACTS. TESTS ANDINSTRUMENTATION
BEGIN EXCAVATION® 07:30
We -15.0%Dry Density -1 13.0 PCFK = 2.4 xlO-J cm/sec —
"
Refuse observed in excavated material
FINISH BACKFILLING @ 08:15

~PROJECTNUMSER
GL065550.FI.FS
PROJECT Onaluk* MunkiMl LmdfiH Ryf^ LOCATIONELEVATION 664 ft ± CONTRACTOREXCAVATION EQUIPMENT JD310-A
TEST PIT NUMBER
STP-05 SHEET 1 OF i
TEST PIT LOG
2+OOE. 5+OON LOGGERE.T.I.
DATE EXCAVATEDWATER LEVELAND DATE Not encountered APPROX. DIMENSIONS: Lenath 3ft Width 2ft
C. Lawrence
4/19/89Maximum Depth 2.5ft
5
DE
PT
IIBE
LOS
UR
FAC
E (
F
1 IV
1 (V
3.0'-
4.01-
5.0'-
SAMPLE
INT
ER
VA
L
0
l.O1
IS
2.0'
TYPE
AN
DN
UM
BER
b.
,- H-
SOIL DESCRIPTION
SOIL NAME. COLOR. MOISTURE CONTENT,RELATIVE DENSITY OR CONSISTENCY,SOL STRUCTURE. MINERALOGY.USCSGROUPSYMBOL
SILT, brown, moist, firm to stiff (ML)
LEAN CLAY, gray, moist, stiff (CL)
POORLY GRADED SAND, medium to fine, brown.moist, loose to medium dense (SP)
END TEST PIT @ 2 S B.G.S.
?gCO _J
COMMENTS
DFFCULTY W EXCAVATION.RUNNING GRAVEL CONDmON,COLLAPSE OF WALLS, SAND HEAVE .DEBRIS ENCOUNTERED. WATERSEEPAGE.GRAOATIONALCONTACTS.TESTSANDINSTRUMENTATION
BEGIN EXCAVATION @ 16:20
FINISH BACKFILLING @ 16:55
—
—
—
IN
ob

f».*>.TJBCT PROJECT NUMBER
GLO63550.FI.PS
PROJECT Onal»«if» MupjcnMl Landfill RI/FS LOCATIONELEVATION 661 ft ± CONTRACTOREXCAVATION EQUIPMENT JD 310-A
TEST PIT NUMBER
STP-06 SHEET i OF 1
TEST PIT LOG
3+60E. 5+OON LOGGERE.T.I.
DATE EXCAVATEDWATER LEVEL AND DATE Not encountered APPROX. DIMENSIONS. LwiQlh 3ft Width 2ft
C. Lawrence
4/19/89Maximum Depth 3ft
$ c
EP
TIIB
ELQ
JRFA
CE
(F
Q CO
1.0'-
4.0f-
5.0'-
SAMPLE
TEH
VA
L
£
0
1.6'
2.01
z oc
*1I- z
ST0
CO
H-w<hi.CO
00
SOIL DESCRIPTION
SOIL NAME.-COLOR, MOISTURE CONTENT.RELATIVE DENSITY OR CONSISTENCY,SOW. STRUCTURE. MINERALOGY,USCSGROUPSYMBOL
SILT, brown, moist, firm to stiff (ML)
LEAN CLAY, gray, moist, stiff (CL)
POORLY GRADED SAND, medium to fine, brown.moist, loose to medium dense (SP)
END TEST PIT @ 3.0' B.G.S.
_j
(ft _i
COMMENTS
DFFCULTY IN EXCAVATION,RUNNING GRAVEL CONDITION,COLLAPSE OF WALLS, SAND HEAVE.DEBRIS ENCOUNTERED, WATER SEEPAGE ,GRADATIONAL CONTACTS. TESTS ANDINSTRUMENTATION
BEGIN EXCAVATION® 15:55
ST-1A ST-1BWc» 15.6% 18.6%Dry Density- 113.4 PCF 108.6 PCFLL=. 19 21PI- 1 1K* 2.0 * 10^ cm/sec 1.1 x 1Q-* on/sec
FINISH BACKFILLING @ 16:15
—
—

K!)?,tII}lM PROJECT NUMBER
GLO65550.FI.FS
PROJECT Onalaska Mankind Landfill RI/FS LOCATIONELEVATION 658 ft ± CONTRACTOREXCAVATION EQUIPMENT JD310-A
TEST PIT NUMBERSTP-07 SHEET 1 OF L
TEST PIT LOG
5-fOOE. 4+50N LOGGERE.T.L
DATE EXCAVATEDWATER LEVELAND DATE Not encountered APPROX. DIMENSIONS: Lenath 3ft WWth 2ft
C. Lawrence
4/19/89Maximum Depth 3f t
5 ^_C
DE
PT
H B
ELO
SU
RFA
CE
(F
l.O1-
4.0'-
5.0'-
SAMPLE
INT
ER
VA
L
0
2.0'
TYP
E A
ND
NU
MB
ER
™ &
SOIL DESCRIPTION
SOL NAME. COLOR. MOISTURE CONTENT.RELATIVE OeNSTTY OR CONSISTENCY.SOIL STRUCTURE. MMERALOGY.USCSGROUPSYMBOL
SILT, mostly brown with some gray zones, moist.stiff (ML)
POORLY GRADED SAND, fine. «nv. dry to moist.
loose to medium dense (SP)
END TEST PTT @ 3.0' B.G.S.
!§COMMENTS
DIFFICULTY IN EXCAVATION.RUNNING GRAVEL CONDITION,COLLAPSE OF WALLS. SAND HEAVE.DEBRIS ENCOUNTERED, WATER SEE PAGE .GRADATIONAL CONTACTS, TESTS ANDINSTRUMENTATION
BEGIN EXCAVATION @ 15:30
We -212%Dry Density- 95.0 PCFLL-21 PI»2K a rtli lO-'em/MC
FINISH BACKFILLING @ 15:50
—

~PROJECT Onalaska Municipal Landfill RI/FSELEVATION
PROJECT NUMBER
GL065550.FI.FS
LOCATIONCONTRACTOR
EXCAVATION EQUIPMENT JD 3 10- A
TEST PIT NUMBER
STP-08 SHEET i OF i
TEST PIT LOG
2-I-50E. 3+OON LOGGERE.T.L
DATE EXCAVATEDWATER LEVEL AND DATE Not encountered APPROX. DIMENSIONS: Lenoth 3ft Width 2ft
C Lawrence
4/19/89Maximum Depth 3f t
5 C
DE
PTH
BE
LOS
UR
FAC
E (F
l.O1-
•j n1
3.01-
4.0'^
5.0'-
SAMPLE
INTE
RV
AL
0
0.7'
i.r
2.01
TYPE
AN
DN
UM
BER
JM
0
a TCO
SOIL DESCRIPTION
SOO. NAME, COLOR. MOISTURE CONTEMT.RELATIVE DENSITY OR CONSISTENCY,SOL STRUCTURE. MMERALOQY.USCSGROUP SYMBOL
SANDY SILT, brown, rnoiat, fiim to stiff (ML)
LEAN CLAY, grey, moist, stiff (CL)
POORLY GRADED SAND, medium to fine.brown, moist, loote to medium dense (SP)
END TEST PIT @ 3.01 B.G.S.
3
1§
COMMENTS
OFFCULTY M EXCAVATION.RUNNING GRAVEL CCNDfTION.COLLAPSE OF WALLS, SAND HEAVE.DEBRIS ENCOUNTERED. WATER SEEPAGE ,GRADATIONAL CONTACTS . TE STS ANDINSTRUMENTATION
BEGIN EXCAVATION® 15:10
We - 19.6%Dry Density * 100.0 PCFLL * 21 PI = 1K 3 4.6x10-* cm/sec
—.
FINISH BACKFILLING @ 15:23
—
—

mm^™t PROJECT NUMBERGLO65550.FI.FS
TEST PIT NUMBERSTP-09 SHEET 1 OF 1
TEST PIT LOG
PROJECT Onalaska Municipal Landfill RI/FS LOCATIONELEVATION 664 ft ±EXCAVATION EQUIPMENTWATER LEVELAND DATE
CONTRACTORJD310-A
3+80E. 3+OON LOGGERE.T.L
DATE EXCAVATEDNot encountered APPROX. DIMENSIONS: Unath 3ft Width 2ft
C. Lawrence
4/19/89
Maximum Depth 3ft
$cr
DE
PTH
BE
LOS
UR
FAC
E (F
1 fVl.U
i.U
4.01-
5.0'-
SAMPLE
INTE
RVAL
0
1.0'
2.01
TYPE
AND
NUM
BER
0
T
ffi
SOIL DESCRIPTION
SOIL NAME. COLOR. MOISTURE CONTENT.RELATIVE DENSITY OR CONSISTENCY.SOIL STRUCTURE. MMERALOQY.USCSGROUPSYMBOL
SANDY STL.T. brown, moist, firm to stiff (ML)
LEAN CLAY. gray, moist, stiff (CL)
POORLY OB A flpn SAND- fine, diy to moist,loose to medium dense (SP)
END TEST PTT & 3.0* B.G.S.
V) — J
COMMENTS
OFFCULTY M EXCAVATION.RUNNMQ QRAVa CONOrTION.COLLAPSE OF WALLS.SANO HEAVE.DEBRIS ENCOUNTERED. WATER SEEPAGE.GRADATONAL CONTACTS, TESTS ANDINSTRUMENTATION
BEGIN EXCAVATION® 14:50
FINISH BACKFILLING @ 15:05
—
—

F»it,',nstw
PROJECT Onalaska MuniELEVATION 666 ft ±EXCAVATION EQUIPMENTWATER LEVELAND DATE
PROJECT NUMBER
GL065550.FI.FS
ctMl Landfill RI/FS LOCATIONCONTRACTOR
JD310-A
TEST PIT NUMBERSTP-10 SHEET i OF 1
TEST PIT LOG
4+80E. 1+OON LOGGERE.T.I.
DATE EXCAVATEDMot encountered APPROX. DIMENSIONS: Langth 3ft Width 2ft
C. Lawrence
4/19/89Maximum Depth 3f t
DE
PTH
BE
LOW
SU
RFA
CE (
FT
)
.u
3.0'-
4.0'-
5.0'-
SAMPLE
INTE
RVAL
0
1.0'
2.0'
TYPE
AND
NUM
BER
£
TU)
CO
SOIL DESCRIPTION
SON. NAME. COLOR. MOISTURE CONTENT.RELATIVE OENStTY OR CONSISTENCY,SOL STRUCTURE. MWERALOGY,USCSGROUP SYMBOL
SANDY SILT, brown, moist, firm to stiff (ML)
LEAN CLAY, gray, moist, stiff (CL)
POORLY GRADED SAND, fine, grty. dry tomoist, loose to medium dense (SP)
END TEST PIT @ 3.0' B.G.S.
Is
COMMENTS
DIFFICULTY IN EXCAVATION.RUNNWGGRAVEL CONDITION.COLLAPSE OFWALLS.SANO HEAVE.DEBRIS ENCOUNTERED. WATER SEEPAGE .GRAOATIONALCONTACTS.TESTSANOINSTRUMENTATION
BEGIN EXCAVATION® 14:20
LL = 26 PI-4K - 5 J x 10 7 cm/sec
We » 7.2*Dry Density - 103.5 PCFK = 6.8xlOJlcnVsec
FINISH BACKFILLING @ 14:45
—
—

f»St.r,tlSIM
PROJECT Ontlisk* Municipal Undffll RI/FS
ELEVATION 660 ft ±
PROJECT NUMBER
GL065550.FI.FS
TEST PIT NUMBER
STP-11 SHEET 1 OF i
TEST PIT LOG
LOCATION
CONTRACTOREXCAVATION EQUIPMENT JD310-A
5+50E. 2+50N LOGGERE.T.I.
DATE EXCAVATEDWATER LEVEL AND DATE Not encountered APPROX. DIMENSIONS: Lenoth 3ft Width 2ft
C. Lawrence
4/19/89
Maximum Depth 3 f t
5c
DE
PTH
BE
LOS
UR
FAC
E (F
l.U
2.0'-
4.0'-
5.01-
SAMPLE
INTE
RV
AL
0
l.O1
i.r
TYPE
AN
DN
UM
BE
R
CM
b
r- tf)
00
SOIL DESCRIPTION
SOIL NAME . COLOR. MOISTURE CONTENT,RELATIVE DENSITY OR CONSISTENCY.SOIL STRUCTURE. MINERALOGY.USCSGROUPSYMBOL
SANDY SILT, brown, moiit, fum to stiff (ML)
LEAN CLAY, grmy, moist, stiff (CL)
POORLY GRADED SAND, fine, grey, dry tomoist, loose to medium dense (SP)
END TEST PIT @ 3.0' B.G.S.
y
igCO _J
COMMENTS
DIFFICULTY IN EXCAVATION,RUNNINGGRAVEL CONDITION.COLLAPSE OF WALLS, SANDHEAVE.DEBRIS ENCOUNTERED. WATER SEEPAGE .GRAOATIONAL CONTACTS. TESTS ANDINSTRUMENTATION
BEGIN EXCAVATION® 13:50
We - 13.4%Dry Density * 1 15.8 PCFK. = 63 x 10-7 cm/sec
FINISH BACKFILLING @ 14:15

Attachment C-2GEOTECHNICAL LABORATORY DATA
GLT913/035.50-15
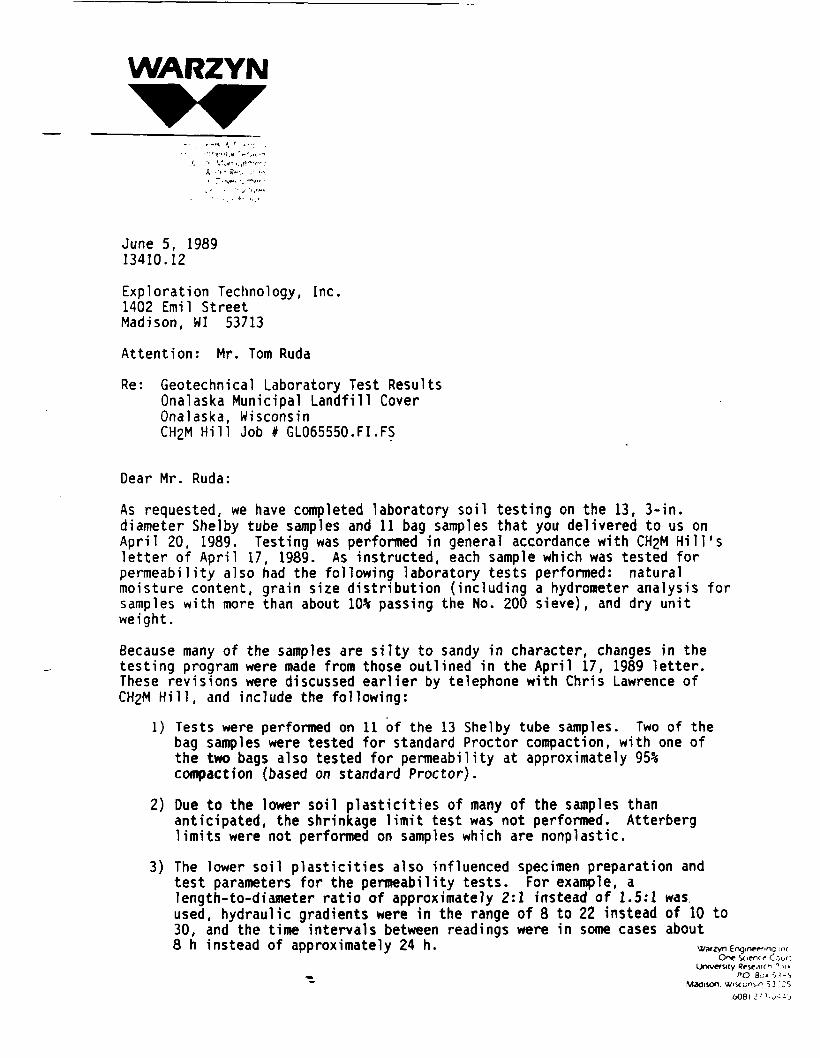
WARZYN
•'"(•"i.tl ',r-',,<
•• XVlf :,("••>
t. • • • • ;>-•, .•
June 5, 198913410.12
Exploration Technology, Inc.1402 Emil StreetMadison, WI 53713
Attention: Mr. Tom Ruda
Re: Geotechnical Laboratory Test ResultsOnalaska Municipal Landfill CoverOnalaska, WisconsinCH2M Hi l l Job I GL065550.FI.PS
Dear Mr. Ruda:
As requested, we have completed laboratory soil testing on the 13, 3-in.diameter Shelby tube samples and 11 bag samples that you delivered to us onApril 20, 1989. Testing was performed in general accordance with CH2M Hill'sletter of April 17, 1989. As instructed, each sample which was tested forpermeability also had the following laboratory tests performed: naturalmoisture content, grain size distribution (including a hydrometer analysis forsamples with more than about 10% passing the No. 200 sieve), and dry unitweight.
Because many of the samples are silty to sandy in character, changes in thetesting program were made from those outlined in the April 17, 1989 letter.These revisions were discussed earlier by telephone with Chris Lawrence ofCH2M Hill, and include the following:
1) Tests were performed on 11 of the 13 Shelby tube samples. Two of thebag samples were tested for standard Proctor compaction, with one ofthe two bags also tested for permeability at approximately 95%compaction (based on standard Proctor).
2) Due to the lower soil plasticities of many of the samples thananticipated, the shrinkage limit test was not performed. Atterberglimits were not performed on samples which are nonplastic.
3) The lower soil plasticities also influenced specimen preparation andtest parameters for the permeability tests. For example, alength-to-diameter ratio of approximately 2:1 instead of 1.5:1 wasused, hydraulic gradients were in the range of 8 to 22 instead of 10 to30, and the time intervals between readings were in some cases about8 h instead of approximately 24 h. WMZvnEnq,n«.f,nq-.^
One Soenc? C^ur:University (feif^fcn ? u«
-. r>O 9o. S.'i-S— Madison. Wnccnvr 53 'CS
16081 •?•'.' -o - - j

Mr. Tom Ruda -2- June 5, 1989Madison, Wisconsin 13410.12
4) An average net confining pressure of 2 Ib/sq in. was used for theflexible-wall permeability tests. The net confining pressures at theinfluent and effluent ends of the specimens were slightly lower andhigher, respectively, than the average pressure, to create a flowcondition during the "rising head/falling head" tests.
5) Because the spread sheets of flexible-wall permeability test datainclude incremental and cumulative influent and effluent flow volumesfor each permeability test reading, plots of water volumes entering andleaving the specimens as a function of time have not been included.
The test results are contained in the attached Grain Size Distribution TestReports, Moisture-Density Curve, Falling Head Permeability Test Reports andFlexible-Wall Permeability Test Laboratory Data Spread Sheets. Also enclosedare the record sheets used to visually classify the Shelby tube samples and toselect portions of the tube samples for laboratory testing.
All soil samples w i l l be stored for 30 days, at which time they will bediscarded unless otherwise instructed by you.
Should you have any questions concerning these results or require additionaltesting, please contact us.
Sincerely,
WARZYN ENGINEERING INC.
Donald W. ArenanderGeotechnical Laboratory Supervisor
DWA/mrnl/DLN[L-S-80]
Attachments: As Stated
WARZYN

WARZYN
INC
(C) FLEXBLE WALLFALLING HEAD
PERMEABUTY TEST RESULTSPflOJECT: ONALASKA LANDFILL
CH2M HILL JOB t GL065550.FI.FSONALASKA, WISCONSIN
1 • ONf SCIENCE COUfT • UNWWVTY tESEAUCH PA«K « f O BOX Mtfl
T...NO. 1Jo6No._ 13410.12D... 05-26-89ShMi 1 ^ 3
SW3BON. WBCONVN
3-INCH SHELBY TUBE
SAMPLE (a)
RECOVERY
SOIL DESCRIPTION
SAMPLE DIAMETER (cm)SAMPLE AREA, A (cm2)
SAMPLE LENGTH, 1 (an)MOISTURE CONTENT, %
DRY DENSITY (PCF)MAXIMUM GRADIENTNET CONFININGPRESSURE (PSI)
STP 08
0-2'
5ray SILT, Sane Sand,.ittle Clay (ML)
INITIAL
4.9519.25
10.11
19.6
106.0
8
2
FINAL
4.9419.17
10.09
20.5106.6
8
2
STP 10
0-2'
3ray-Brovnrv SILT,Some Clay, LittleSand (ML)
INITIAL
4.9619.29
10.11
22.5100.2
8
2
FINAL
4.9419.21
10.09
24.1100.9
22
2
STP 06A
0-1.7'
Brown SILT, Some SandLittle Clay (ML)
INITIAL
4.9719.39
10.03
15.6113.4
7
2
FINAL
4.9519.28
10.00
16.6114.4
7
2
COEFFICIENT OF PERMEABILITY, It (era/sec)
RUN NO. 1
234
56
7
89
10AVERAGE k, (cm/sec)(b
6.6 x 10⁻⁶
6.7 x 10⁻⁶
6.5 x 10⁻⁶
5.1 x ID'6
5.7 x 10⁻⁶
4.5 x 10⁻⁶
4.8 x 10⁻⁶
4.5 x 10-64.6 x 10-6
4.6 x 10⁻⁶
4.6 x 10⁻⁶
3.1 x 10⁻⁶
1.3 x 10⁻⁶
9.0 x 10⁻⁷
6.7 x 10~7
7.6 x 10-"7
6.4 x 10~7
6.1 x 10~7
5.4 x 10~7
5.4 x 10⁻⁷
5.7 x 10~7
5.5 x 10⁻⁷
2.9 x ID'6
3.0 x 10⁻⁶
2.9 x ID'6
2.8 x ID"6
2.2 x 10⁻⁶
2.0 x ID"6
2.2 x 10⁻⁶
2.0 x 10-62.1 x 10-6
2.0 x ID'6
2.0 x 10⁻⁶
FORMULA: (c)
K _ 2.3 a L
Atlog 10 ho
Where a • cross-sectional area of standplpe,t « time for water level to fall from
initial height, ho. to final height,(•All other terms are defined above)
REMARKS:
(a) Permeability tests were performed on relatively undisturbed 3-inch diameterShelby tube samples.
(b) Average coefficient of permeability based on run numbers 8 through 10.
(c) "Rising Head/Falling Head" formula.
TESTED BY CHECKED BY APPROVED BY

WARZYINJ
INC
(c) FLEXBLE WALLFALLING HEAD
PERMEABILITY TEST RESULTS
PWOJECT: ONALASKA LANDFILLCH2M HILL JOB # GL065550.FI.PSONALASKA, WISCONSIN
WACW ENGJNKWNG *<. • ON€ SCItNCE COU»T > UNIVtHJTY IC /MCH fA« • PO HOX %«r
TtttNo. 1
job NO. 13410.120«t« 05-26-89
.01 3
3-INCH SHELBY TUBE
SAMPLE (a)
RECOVERY
SOIL DESCRIPTION
SAMPLE DIAMETER (cm)
SAMPLE AREA, A (cm2)
SAMPLE LENGTH, L (cm)
MOISTURE CONTENT, %
DRY DENSITY (PCF)MAXIMUM GRADIENTNET CONFININGPRESSURE (PSI)
STP 02B
0-2 'Brown Lean CLAY,Trace Sand (CL)
INITIAL
5.0119.75
10.0322.5
102.98
2
FINAL
5.0119.75
10.0322.2
102.922
2
STP 06B0-2'Gray SILT, Sane Sand,Little Clay (ML)
INITIAL
4.9719.43
10.0918.6
108.68
2
FINAL
4.9619.30
10.0620.2
109.78
2
STP 070-1.8'Brown SILT,Little Sand & Clay(ML)
INITIAL
4.9619.34
10.1122.2
95.08
2
FINAL
4.9519.25
10.0927.4
95.7
8
2
COEFFICIENT OF PERMEABILITY, k (cm/sec)
RUN NO. 1
2
34-
56
7
89
10
AVERAGE k. (ca/stc)bj
3.4 x 10-"7
3.1 x ID"7
3.0 x 10~7
3.3 x lO-"7
3.4 x 10~7
3.0 x KT7
3.2 x lO-"7
3.2 x lO-7
3.2 x lO-7
3.1 x lO-7
3.2 x lO-7
1.9 x 10~6
1.6 x 10⁻⁶
1.3 x KT6
1.1 x 10⁻⁶
1.2 x 10~6
1.1 x 10~6
1.2 x 10~6
1.1 x 10~6
1.2 x 10~6
1.1 x 10⁻⁶
1.1 x 10"6
8.2 x ID'5
8.0 x ID"5
7.6 x 10~5
7.4 x ID"5
7.4 x 10⁻⁵
7.2 x ID'5
6.1 x ID"5
6.0 x 10~5
6.2 x lO'5
6.2 x 10~5
6.2 x 10⁻⁵
FORMULA: (c)
K _ 2.3 a L
Atlog 10 ho
Where a - cross-sectional area of standplpe,t - time for water level to fall from
Initial height, ho, to final height,(•All other terms arc defined above)
REMARKS:
(a) Permeability tests were performed on relatively undisturbed 3-inch diameterShelby tube samples.
(b) Average coefficient of permeability based on run numbers 8 through 10.
(c) "Rising Head/Falling Head" formula.
TESTED BY CHECKED BY APPROVED BY

WARZYN
INC
(c) FLEXBLE WALLFALLING HEAD
PERMEABILITY TEST RESULTSPflOJECT: ONAIASKA LANDFILL
CH2M HILL JOB # GL065550.FI.PS
TaslNo.Job No. 1.3410.12,D.t. 05-22-89Sh««« 3
ONAIASKA, WISCONSIN• WACtN CNONCEflNG IK. • ONC SCIfNCE COU»T • UNTV/tWTY «tf/WCH PAK - PO HOX SMK • VWOI5ON. WISCONSIN »K»
SAMPLE BAG (a)
RECOVERY
SOIL DESCRIPTION
SAMPLE DIAMETER (en)
SAMPLE AREA, A (cm2)
SAMPLE LENGTH, L (on)MOISTURE CONTENT, %
DRY DENSITY (PCF) (b)MAXIMUM GRADIENTNET C O N F I N I N GPRESSURE ( P S I )
STP 04
1.5-3.5'
Brown Lean CLAY,Little Sand (CL)
INITIAL
4.96
19.359.90
19.4103.7
8
2
FINAL
4.95
19.24
9.87
20.5
104.6
22
2
INITIAL FINAL INITIAL FINAL
COEFFICIENT OF PERMEABILITY, Ic (cm/sec)
RUN NO. 1
2
34
5
6
7
8
9
10
AVERAGE Ic. (en/sec}*,)
4.6 x 10~7
4.6 x 10~7
4.6 x 10~7
4.8 x 10~7
4.5 x 10~7
4.2 x 10~7
4.3 x 10⁻⁷
4.4 x 10⁻⁷
4.2 x 10~7
4.3 x 10~7
4.3 x KT7
FORMULA: (c)
K _ 2.3 a Llog 10 ho
Where a • cross-sectional area of standplpe,t - time for water level to fall from
Initial height, hQ. to f1nal height,(•All other terms are defined above)
REMARKS:
(a) This permeability test was performed on remolded soil, trimmed from a standardProctor sample.Initial percent compaction was 92.6X and the final percent compaction afterconsolidation was 93.4X at a confining pressure of 2 psi.
(b) Average coefficient of permeability based on run numbers 8 through 10.
(c) "Rising Head Falling Head" formula.
iooornnm nv

Job No. 13410Date: 04/20/39
F ,LIN<3 HEAD PERMEABILITY TEST»IH>. .diiaeerioi lie., I Scitice Ct . , Oiirenity leiearci Pirk, PO lox 5385, ladiioi, VI 5JT9S ((01) 2TM440
PROJECTCLIENT
SAMPLE (a)
ONALASKA LANDFILLCH2M HILL
STP 01 @ RECOVERY 0-2.0 FT
SOIL DESCRIPTION
SAMPLE DIAMETER ( cm)SAMPLE A R E A , A ( c r o 2 )
SAMPLE L E N G T H , L ( c m )MOISTURE CONTENT,XDRY DENSITY (Ib/cu ft)PERCENT COMPACTION
Brown Silty Fine-Medium SAND, LittleClay, Trace Gravel ( S M )
RUN
1o
345678910
7.442.6
INITIAL FINAL16.0 16.011.5 12.7
118.0 118.0
COEFFICIENT OFPERMEABILITY . k ( cm/sec }
5.0E-054.9E-055.0E-055.0E-054.9E-054.9E-055.0E-054.9E-054.9E-054.9E-05
AVERAGE COEFFICIENT OF PERMEABILITY = 4.9E-05 cm/sec(Based on run numbers 8 through 10)
2.J»l hi: I - lofit •• , die re a = crow- sect ion 1 area of itaidpipe,
At ii t = tiie for later lerel to fa l l froi iiitial hei(ht, ki, to fiial k t i fk t , hi(ill otter ten* are defiled above)
FOOTNOTES: (a) This permeability test was performed on a relatively undisturbed 3-in.diameter Shelby tube sample.
CHECKED BY: APPROVED BY: DATE: (g"S~

Job No. 13410Date: 04/20/89
FAILING HEAD PERMEABILITY TESTVar: jiieeriif IDC. , 1 Scicict Ct., Biireriitr Keiearek Pirk, PO lox 5)15, Bidlioi, HI 5J7I5 (til) 2TJ-H4I
PROJECTCLIENT
SAMPLE (a)
ONALASKA LANDFILLCH2M HILL
STP 04 @ RECOVERY 0-2.0 FT
SOIL DESCRIPTION
SAMPLE DIAMETER (cm)SAMPLE AREA,A(cm2)
SAMPLE LENGTH,L(cm)MOISTURE CONTENT,%DRY DENSITY (Ib/cu ft)PERCENT COMPACTION
Brown Silty Fine-Medium SAND, Little Clay(SM)
7 . 442 .6
I N I T I A L14.015.0
113.0
FINAL14.015.5
113.0
RUN
3456789
10
COEFFICIENT OFPERMEABILITY.k(
2.4E-052.4E-052.4E-052.5E-052.4E-052 .4E-052 .4E-052.4E-052.4E-052 .4E-05
AVERAGE COEFFICIENT OF PERMEABILITY = 2.4E-05 cm/sec(Based on run numbers 3 through 10)
2.3aL kiPORBOIA: k : logii -- , Ikcrt a : croii-tectioial area of staadpipe,
it hi t : tin for tattr le»el to fa l l froi iaitial aeifkt, a*, to fiial kcifat, ki(111 otker terae are defiaed ibore)
FOOTNOTES: (a) This permeability test was performed on a relatively undisturbed 3-in.diameter Shelby tube sample.
CHECKED BY: DATE: APPROVED BY: DATE:MMRZYN

Job No. 13410Date: 04/20/89
F '~ . ,L IN<3 HEAD FERMEAB Z L I T Y TESTNan. ,clieeni( lie., 1 Seieiee Ct . , hiferilty leieireh Pirk, PO Box SIM, Hidiioi, I! SJTIS (Ml) 273-0440
PROJECTCLIENT
SAMPLE (a )
ONALASKA LANDFILLCH2M HILL
STP 10 @ RECOVERY 0 -2 .0 FT
SOIL DESCRIPTION
SAMPLE DIAMETER (cm)SAMPLE A R E A , A ( c m 2 )
SAMPLE LENGTH,L(cm)MOISTURE CONTENT,%DRY DENSITY (Ib/cu ft)PERCENT COMPACTION
Brown Fine-Medium SAND, Trace Silt & Clay(SP-SM)
7 . 442 .6
INITIAL14.47 .2
103.5
FINAL14.419.2
103.5
COEFFICIENT OFBUN PERMEABILITY.k(cm/sec^
123456789
1011
1.1E-039.8E-048.7E-047.6E-04
2E-041E-04
6.9E-047.0E-046.8E-046.8E-046.8E-04
77
AVERAGE COEFFICIENT OF PERMEABILITY = 6.8E-04 cm/sec(Based on run numbers 9 through 11)
2.3iL It: k : lot11 — , Here a -' croit-Kctionl irei of lUtipipe,
It ki t : tiit for liter lerel to fill frot iiitial kel fkt , kt, to finl kei|kt, ki(ill otker tern ire defiied i»ore)
FOOTNOTES: (a) This permeability test was performed on a relatively undisturbed 3-in.diameter Shelby tube sample.
CHECKED BY: DATE: APPROVED BY: DATE:

Hart.
Job No. 13410Date: 04/21/89
HEAD P>ERMEAB I L, I TY TEST,imriif lie., 1 ScitM* Ct., lil?eriitr Itmrek Firk, PO Box S«5, Rtdiioi, HI S1TI5 ((U) 2T3-0440
PROJECTCLIENT
SAMPLE (a)
ONALASKA LANDFILLCH2M HILL
STP 11 @ RECOVERY 0-2.0 FT
SOIL DESCRIPTION
SAMPLE DIAMETER (cm)SAMPLE AREA,A(cm*)
SAMPLE LENGTH,L(cm)MOISTURE CONTENT,%DRY DENSITY {Ib/cu ft)PERCENT COMPACTION
Brown Silty Fine-Medium SAND, Little Clay (SM)
RUN
123456789101112
7.442.6
INITIAL FINAL10.7 10.713.4 13.7115.8 115.8
COEFFICIENT OFPERMEABI LI TY . k ( cm /see ")
6.8E-076.6E-075.9E-075.8E-075.6E-076.0E-075.9E-076.1E-076.1E-076.1E-076.5E-076.3E-07
AVERAGE COEFFICIENT OF PERMEABILITY = 6.3E-07 cn/eec(Based on run numbers 10 through 12)
2.3iL k«?02ROLA: k : locii - , fttrt < : crwi-iectioul area of lUidpipe,
U k i t : tiM for later level to fill trot ioitial aeitit, it, to fiuJ keifit, 11(All otter tern ire defiled ibore)
FOOTNCTTES: (a) This permeability test was performed on a relatively undisturbed 3-in.diameter Shelby tube sample.
CHECKED BY: DATE: APPROVED BY: DATE:MMRZYN

c
»It.
0L
100
99
80
70
5 60
59
u 40u
30
20
10
02e
Symbolo
o
GRAIN SIZE
i i i i < : ~ ^„ M i _ A ji S
!
I ; i
• • •
I
25
USTRIBUTION TEST REPORTCMtftf HUtum rtrv
s 5 I J = 8••
^s
]\l
Vi; 1.
- !
•1t1s
<...
e 100 10.0 1.0 0.1GRAIN SIZE - mm
X+3"0.0
X. GRAVEL1.2
X SAND53.0
•3i'*->«.•*o
.01 .001
'/. SILT37.9
X CLAY5.9
LL—
PI—
DSS0.41 1
0603.20
D300.12
D390.05S
DIS0.0314
D10
0.0152Cc
1.00
MATERIAL DESCRIPTION
0 Broun Silty Fine-Medium SAND, Little Cl»v» True* Qr»vel
(Rigid Wall Permeability Test Sample)
Project No. : 13410. 12Project: ONALASKA LANDFILL0 Sample: STP 01 (3 RECOVERY 0-2.0 FT
D- »: 04-20-89
GRAIN SIZE DISTRIBUTION TEST REPORT
WARZYN ENGINEERING INC.
Cu
13.2
usesSM
Remarks:
TESTED BY: DWA/RWP
ENTERED BY: MML
CHECKED BYt CbJY^
APPROVED BY: k/k/\^
Sheet No.
\MARZYN

100
90
80
70
£ 68i-L
tL
&
K
c^
E 5eu
S 40
30
20
10
0
GRAIN SIZE DISTRIBUTION TEST REPORT
*• ^ ^ c Co*r** rw4tM« Fine^ ^ i 2 i ; ; : . . ., « «
^ « J. _ J. S ^ 2 5 5 12 S 2
:
; i ^ ;
! i
i ; i
1 |
; I
Oo— i,
^
^
1 \
^
\,
^
Lv\
*•* Ks^»-o—
209 100 10.0 1.9 0.1 .01 .001GRAIN SIZE - mm
Symbolo
o
X+3"0.0
^ GRAVEL0.5
'/. SAND4.0
X SILT79.4
X CLAY16.2
LL
30
PI
9D83 D«0 ^50
0.02D30
0.013
»130.0041
Die
0.0017Cc
4.52
MATERIAL DESCRIPTIONO Broun Lean CLAY* True* Sand
(Flexible Mall Permeability Test Sample)
Project No.: 13410.12Project: ONALASKA LANDFILL
0 Sample: STP 02B 0 RECOVERY 0-2.0 FT
D»*e: 04-20-89
6RAIN SIZE DISTRIBUTION TEST REPORT
WARZYN ENGINEERING INC.
Cu
17.6
usesCL
Remarks:
TESTED BY: DWA/RWP
ENTERED BY: MML
CHECKED BY: iQuu }
APPROVED BY: Q^jf\
Sheet No.
MMMZYN

c.
*L
h.
aL0
100
90
80
70
5 60— «
50j
5 40L
30
20
10
02C
Symbolo
o
GRAIN SIZE DISTRIBUTION TEST REPORT1 • • • • • • • •— ^ ^ C«k^ •• N»«t«a F 1 «•
* : H fS ij , i s ! i ! !
I ': i'
;
-^^5i,
: i
\ \
r s,\ :
i X i: \
1 i
SsN
.vv •0 «».
-^*^o
10 100 10.0 1.0 0.1 .01 .001
GRAIN SIZE - mm
X+3*0.0
'/. GRAVEL0.4
X SAND36.7
'/. SILT37.2
y. CLAY3.7
LL—
PI—
DSS0.33 \
°66
*. 15D30
0.10
D300.032
Dl50.0268
D10
0.0136Cc
1.30
MATERIAL DESCRIPTION
0 Brown Silty Fine-Medium SAND, Little Clay
(Rigid Wall Permeability Test Sample)
Project No.: 13410.12Project: ONALASKA LANDFILL0 Sample: STP 04 & RECOVERY 9-2.0 FT
Date: 04-20-89
3RAIN SIZE DISTRIBUTION TEST REPORT
WARZYN ENGINEERING INC.
c.,.11.1
usesSM
Remarks:
TESTED BY: DWA/RWP
ENTERED BY: MML
CHECKED BY: Qo^fY
APPROVED BY: fcfa.^
Sheet No.
WAHZYN

100
90
80
70
uj 60
U-
i- 50
g 40o.
30
20
10
02C
Symbolo
o
GRAIN SIZE DISTRIBUTION TEST REPORT- ' M»4I
; i • ! : I i i * = 5 II ! 8
i
i • !
^ i 1
: i
: •:
• • — *-— »ll
! |
r\
:
\I> ;
.
^
X
.
\c«5^•o«•*o
10 100 10.0 1.0 0.1 .01 .001
GRAIN SIZE - mm
X+Z"0.0
'/. 8RAVEL0.4
•/. SAND44.7
# SILT46.1
y. CLAY8.8
LL—
PI—
&850.32 S
I>60.10
D300.06
D300.034
Dl
0.0i:
5 Diei4 0. 0066 1
MATERIAL DESCRIPTION
0 Brown Sandy SILT, Little Clay
(Standard Proctor Sample)
Project No.: 13418.12Project: ONALASKA LANDFILL0 Sample: STP 04 Q 8-. 73 FT
(Bag Sample)
Date: 04-20-89
QRAIN SIZE DISTRIBUTION TEST REPORT
WARZYN ENGINEERING INC.
cc.71
C,j.15.4
usesML
TESTED BY: DWAxRWP
ENTERED BY: MML
CHECKED BY: j X-T^
APPROVED BY: l/j£
Sheet Ho.
MMMZYN

188
90
88
78
u| 60
u_
z
£ 40
30
28
18
82e
SymbolO
O
GRAIN SIZE DISTRIBUTION TEST REPORT
rf J i i i «— "•"- '-: : : z f s s s * s 8 !3 * !
i
: :
\ \
\ \
*; •N^00—,
^ > I 1
m\
1\V\\,
18 188 18.8 1.8 8. 1GRAIN SIZE - mm
y.+z»8.8
'/. GRAVEL8.8
X SAND8.3
N is 0^
^>^o
.81 .881
X SILT73.1
y. CLAY18.4
LL
30
PI
10D85 D60 D5e
8.82
D30
8.813°13
8.8823
D18 cc
MATERIAL DESCRIPTION
O Broun Letn CLAY* Little Sand(Standard Proctor andFlexible Wall Permeability Test Sample)
Project No.: 13418.12
Project: ONALASKA LANDFILL
0 Sample: STP 04 9 1.5-3.3 FT
(Bag Sample)
Date: 04-28-89
GRAIN SIZE DISTRIBUTION TEST REPORT
UIARZYN ENGINEERING INC.
cu
usesCL
Remairks:
TESTED BY: DWA/RWP
ENTERED BY: MML
CHECKED BY: O1-
APPROVED BY: L/3TC-.
Sheet No.
MMAZYN

c
*L
H•
1
100
98
80
70
5 60•4
L.
505
5 40L
30
20
19
0
2C
Symbolo
o
GRAIN SIZE DISTRIBUTION TEST REPORT— c e rf Catr ** Me 4 1 \im f 1 n»
i i i s • ; : : . . 9, «|CT^j._aSS z s ^2 II : 5
r scN,
^\,
1\
1 \\\
1\
\-*a •».•o* — «o
i
0 100 10.0 1.0 0.1 .01 .001GRAIN SIZE - mm
X+Z"0.0
•/. GRAVEL0.0
^ SAND31.8
X SILT39.3
X CLAY8.9
LL
19
PI
1D85
0.21
D60 D500.04
D300.027
Dl50.0123
Dl00.0065
Cc
2.07
MATERIAL DESCRIPTION
o Brown SILT, Son* Sand, Little Cl»v
(Flexible Wall Permeability Test Sample)
Project No.: 13410.12Project: ONALASKA LANDFILL0 Sample: STP 6A & RECOVERY 0-1.6 FT
P *: 04-20-89
3RAIN SIZE DISTRIBUTION TEST REPORT
WARZYN ENGINEERING INC.
C1JL r-3.4
usesML
ReiMirks:
TESTED BY: DWA/RWP
ENTERED BY: MML
CHECKED BY: QuJrAPPROVED BY: -1 f\
Sheet No.

cfl»i
L
h*L
0LC
100
90
80
70
5 60-4
E 50
u
g 40L
30
20
10
026
Symbolo
o
GRAIN SIZE DISTRIBUTION TEST REPORT* J J ,1 CMTM *>4IW FltV
< * i s ^ ; :; ~ . • , 5 «•. « ^ A _ a i i ^ s $ i a ss
i i i
I i i
i • i:
; i
i i
; |
i
:
•Cs
; J
! ]U
\
\\>^vN^.
10 100 10.0 1.0 0. 1GRAIN SIZE - mm
X+3"0.0
* GRAVEL0.0
'/. SAND16.0
"r<- 1!!5MI>-i^o~
.01 .001
Ji SILT72.1
X CLAY11.9
LL
21
PI
2DOS
0.08&60 D5e
0.03D30
0.023DIS
0.0078Die
0. 0029cc
4.53
MATERIAL DESCRIPTION
o Gray SILT, SCDB Sand, Little Clay
(Flexible Vfaii Permeability Test Sample)
Project No.: 13410.12Project: ONALASKA LANDFILL0 Sample: STP 06B & RECOVERY 0-2.0 FT
T »: 04-28-89
GRAIN SIZE DISTRIBUTION TEST REPORT
UARZYN ENGINEERING INC.
Cu13.6
usesML
Remarks:
TESTED BY: DWA/RWP
ENTERED BY: MML
CHECKED BY: |CX> 1
APPROVED BY: £rtj/\
Sheet No.
MMRZYN

c
fr
I£•
C
100
99
88
70
5 60-4
1.
5055 40L
30
20
10
0
GRAIN SIZE DISTRIBUTION TEST REPORT- 1 4 4 CMTM N.4IIM Fin*
i 1 11 i s is x : ^s j j ! !!
; ; ';
^ •sk"«-.,
: I
!\: i
\
\
^
\nv,200 100 10.0 1.0 0.1
6RAIN SIZE - mm
Symbolo
G
%+3"0.0
X GRAVEL0.0
'/. SAND11.8
L**
f
•«o
.01 .001
y. SILT79.4
?i CLAY8.8
LL
22
PI2
D85 D60 Use8.03
I>300.023
DIS0.0122
.
Dl00.006*
Cc
2.11
MATERIAL DESCRIPTION
0 Brown SILT, Little S»nd 8- Cl*v
(Flexible Wall Permeability Test Sample)
Project No.: 13418.12Project: ONALASKA LANDFILL0 Sample: STP 07 & RECOVERY 0-1.8 FT
D>*e: 04-20-89
GRAIN SIZE DISTRIBUTION TEST REPORT
WARZYN ENGINEERING INC.
Cu
5.8
usesML
Remarks:
TESTED BY: DMA'RWP
ENTERED BY: MML
CHECKED BY: ]Qujft
APPROVED BY: JJ^ J^
Sheet No.
VWMIZYN

100
90
80
79
iu 60I—*u.H- 50LU
g 40
30
20
10
02e
Symbol0
o
GRAIN SIZE DISTRIBUTION TEST REPORT* j j j CMTM 1 NXIIM rir»
, m J t* ,J ' •* 'i 4 jj S < „ ~ _ . . _ * |. n M J L . A ^ 5 z s s i i s s
:
; - M
: :•
; |
; •:
1
; i
•c N
k.^
\\
^I
: i ^.\>^
^
10 100 10.0 1.0 0. 1GRAIN SIZE - mm
X+3*0.0
'/. GRAVEL0.9
% SAND22.8
i.tod•S *ta,
—0
.01 .001
•/. SILT67.9
X CLAY
10.2
LL
21
PI
1D85
0.19&60 059
0.04
^300.023
DIJ0.0105
Die0.0046
Cc
2.51
MATERIAL DESCRIPTION
o Gray SILT, Sane Sand, Little Clay
(Flexible Mall Permeability Test Sample)
Project No.: 13410.12Project: ON ALASKA LANDFILL0 Sample: STP 08 fi RECOVERY 0-2.0 FT
D-"e: 94-29-99
GRAIN SIZE DISTRIBUTION TEST REPORT
WARZYN ENGINEERING INC.
cu10.0
usesML
Remarks:
TESTED BY: DWAXRWP
ENTERED BY: MML
CHECKED BY: j£>tMft
APPROVED BY: ^^J^
Sheet No.
MMRZYN

GRAIN SIZE DISTRIBUTION TEST REPORT
c
*I£
t
§
.30
80
78
5 68-•L.
50
§u 40
30
20
10
02e
SymbolO
o
i 4 i €«•»»• H>«l
J J J «? J s - -- * - T * S ? S i *.. „ „ i _ i i A X .,
! I
• \
\
}
S*cK
i
t••
Fin*
i ! S>*.c ,
•
l\\ \<
.
L\1
^ r0 100 10.0 1.0 0. 1
GRAIN SIZE - mm
%+Z"0.0
'/. GRAVEL0.0
y. SAND5.7
r^ •*ik " ~
.01 .801
X SILT79.7
X CLAY14.6
LL
26
PI
4
DSS D60 D50
0.03
D.300.017
DIS0.8052
Die0.0020
Cc
4.66
MATERIAL DESCRIPTION
o Gray-Brown SILT, Some Clay, Little Sand
(Flexible Wall Permeability Test Sample)
Project No.: 13410.12Project: ONALASKA LANDFILL0 Sample: STP 10 Q RECOVERY 0-2.0 FT
(Upper Part of Shelby Tube)
D'-'-e: 04-20-89
GRAIN SIZE DISTRIBUTION TEST REPORT
WARZYN ENGINEERING INC.
ctj.15.6
usesML
Remarks:
TESTED BY: DWA/RWP
ENTERED BY: MML
CHECKED BY:Qujft
APPROVED BY: k)~t^i\
Sheet No.
MMMZYN

c
»L
£.
0L0
100
?0
80
70
5 60-«
50j
u 40L.
30
20
10
02C
Symb o 10
o
GRAIN SIZE DISTRIBUTION TEST REPORT' J £ f Ca*r*» N»41<M rin*
A i i S ^ ; - : . . _ _ 9 |„ „ i _ A ^ 5 .1 : 5 21 s 5
: ;
s
\:
1
11
1\
I I"1\
\s
* 2 > :— «>., i 3ii>^^^ •i )
0 100 10.0 1.0 0.1 .01 .001GRAIN SIZE - mm
X+3"0.0
'/. GRAVEL0.0
'/. SAND92.8
X SILT3.2
X CLAY4.0
LL
—
PI—
DSS0.34 C
D*0
1.24Dse
0.22D30
0. 173BIS
0. 1209Dl0
0.0957Cr_
1.31
MATERIAL DESCRIPTION
O Brown Fine-Medium SAND. True* Silt & Claw
(Rigid Wall Permeability Test Sample)
Project No.: 13410.12Project: ONALASKA LANDFILL0 Sample: STP 10 Q RECOVERY 0-2.0 FT
(Lower Part of Shelby Tube)
D"-»: 04-20-89
3RAIN SIZE DISTRIBUTION TEST REPORT
WARZYN ENGINEERING INC.
Cu2.S
usesSP-SM
Remarks:
TESTED BY: DWAxRWP
ENTERED BY: MML
CHECKED BY:iQu/ft
APPROVED BY: £;^A
Sheet No.
WAftZYN

cM
»
LH
L
L0
100
90
80
70
5 60.*
? 58U
a 40L
30
20
10
02C
Symbolo
o
GRAIN SIZE DISTRIBUTION TEST REPORT— J ^ J C*»r »* Me «| tu» . r | ne
; : ; i : s i s * 5 8 i i II>\ vl 1
M"
\\ !
; *s\
-
S
1kNs.,,,
3*3.
^^•«3
>
10 100 10.0 1.0 0.1 .01 .001GRAIN SIZE - mm
X+3"0.0
•/. GRAVEL0.0
'/. SAND33.2
X SILT40.3
X CLAY6.4
LL—
PI—
D836.34
X>609.15
D50
0.09D30
0.040Dl3
0.0231
D10
0.0171Cc
6.62
MATERIAL DESCRIPTION
o Brown Silty Fine-Medium SAND, Little Clay
(Rigid Mall Permeability Test Sample)Project No.: 13418.12Project: ONALASKA LANDFILL0 Sample: STP 11 & RECOVERY 0-2.8 FT
D»te: 04-20-89
GRAIN SIZE DISTRIBUTION TEST REPORT
WARZYN ENGINEERING INC.
C.JL
3.7 "-*
usesSM
R*m»rks:
TESTED BY: DWA/RWP
ENTERED BY: MML
CHECKED BY: QuTT]
APPROVED BY: QlA
Sheet No.
"
f

rWARZYN MOISTURE- DENSITY CURVE
PROJECT: ONALASKA LANDFTLT,
CLIENT: CH« HILL
fOT Report No
13410.12
04-20-391
WAKYN ENGINEERING INC • OUt SCIENCE COU*T • UMVeHSTY «t«A«CH CAW • PO HOX S«H • VWOBON. WISCONSIN SJ7«
190
143
140
133
130
123
120
Ul
I 113
<rQ
110
103
100
90
11 •
1
1
\ \\\
' \
~P
; i
ii. i
i' !
c
it 1 '
1 ' 1i
i : i .
r 1
i 1
•
'|
|
1
I
\
1
I
V,\|\\
\ \• \v\\ i\ \ .
_! ' 1 \i\ 1 \\
\i \ i
•• • ii • .! . J
I I I -
I-1^1 * J
/
1 '
• III
' ' ' K 1 :
: • • /\1L
* 1' ; /
: / •'• t ' '
•t
I
1
{• 1 T < ~
xl""1" '/ i • i
' . ii
: ' i• i '• I .
• • 1 :
I J
1 . I
1 1 •
' 1
1 '
i
\V
\ V\ \\ (
1 \I '
3AMPIIOeSKlNATX)N
0n
iii1
\\v ,V
i \ '*\ \
n * KI
I
i ,i
L_|
I*«. r1
J.
/.
1J
*»-X
• ' ' i
i • ' :i i
,• i .
•i i
,
• • I I. i •
• ic
1 i
MINIMUM MAXIMUM OPTIMUMsoiuoiSCHimoN otNsmr O«N»TY MOISTXJM
Brown LSand (C
Brown S
Clay (
aan PT AY T,l^t"lP * - . - ^ -. * * ~/r \ L L £• }*—*• *-^ /ou)
andy SILT, Little -n ^ML)
.
1;t
i [ ' | !\ • iV, •
\y\ ;1 \V\
('•KiWy^vlx^ A1
\ ' Y\' V
1 I • Ji '"yT"
\
\: • 'i :
i: 1
, >!
1 :i i. • .' , i; ii i
' • '
(13) BAG
^ BAG
11
Vly'l
^, iSj j\\ i' V^i ' \\: ' V
i \\i
11
> iit
•1NCLUOC5 COfWCCnON POM QIUVCL MKTA1NCO ON 3/4 IN. Sieve
STP U<a '& 1.5-3.? tT, NA'ITJKAL MUlblTJkt UJNTtM'L'
STP 04 1> 0.0-0.75 FT
i
. J i l lX j i i ;\\ i j
y>
~T>Ti^V tV
1 _J_10 13 20 30
MOISTURE CONTENT. %
TEST METHOD: d MODIFIED PHOCTOM
00 STANOAAOPROCTOM
'(MM MO 1M3
TESTED BY: DWA/RWP CHECKED BY: APPROVED BY:

Appendix DHYDROGEOLOGY INVESTIGATION
GLT913/035.50-4

Appendix DHYDROGEOLOGY INVESTIGATION
INTRODUCTION
This appendix describes the field procedures and presents results of thehydrogeologic investigation (Subtask FQ) of the Onalaska Municipal Landfill siteRI/FS. The following activities were performed:
o Geotechnical Boringo Monitoring Well Installationo Water Level Monitoringo Slug Testing
The start and finish dates for the major activities of the hydrogeologicinvestigation are listed below.
Stan Finish
Geotechnical Boring 3/6/89 3/20/89
Monitoring Well Installation 3/10/89 3/30/89
Survey Elevation/Location 3/30/89 3/31/89
Groundwater Elevation 3/31/89 3/31/894/17/89 4/17/896/12/89 6/12/89
Slug Testing 4/27/89 4/27/89
All work was done or observed by CH2M HILL personnel. The overallhydrogeologic investigation was directed by Jeff Lament. Either Kevin Olson,Jewelle Imada, or Dan Plomb was the field hydrogeologist assigned to logindividual boreholes, collect samples, and monitor subcontractor activities.Drilling and monitoring well installations were subcontracted to ExplorationTechnology, Inc. (ETI), Madison, Wisconsin. Surveying, leveling, and the firstround of groundwater elevations were measured by Dan Plomb and KevinOlson. The second round of groundwater elevations were measured by PhilSmith and Kevin Adler/EPA. Slug testing was performed by Dan Plomb andKevin Olson.
D-l

FIELD PROCEDURES AND RECORDS
GEOTECHNICAL AND MONITORING WELL BORINGS
Eight geotechnical boreholes were drilled and sampled to provide informationabout the stratigraphy, extent of soil contamination, and preliminary waterquality data. Borehole locations are shown in Figure D-l. Soil samples werecollected at regular intervals for geologic logging. Soil samples were collectedfrom select boreholes for grain-size analysis or for analysis of routine (RAS) andspecial (SAS) parameters as specified in the QAPP. Water samples werecollected from pre-selected intervals and analyzed at the onsite laboratory forselected VOCs.
Eighteen additional boreholes were drilled for installing groundwater monitoringwells (see Figure D-l). Inasmuch as the drilling and sampling methods areidentical and the observations tend to supplement information from thegeotechnical borings, the monitoring well boreholes are included in the followingdiscussion. Monitoring well construction details are presented in a later section.
Drilling
Two rigs, a CME 75 and a CME 750, and crews were provided by ETI. Allboreholes were drilled by hollow-stem auger or rotary methods.
Four-and-one-quarter inch (ID) hollow-stem augers were used for medium depth(to 80 feet) borings. The lead auger was screened to allow a head of water toenter the hollow stem to minimize sand "blow" into the augers. A wooden plugwas also used in the lead auger to prevent sand blow-in in monitoring wellboreholes when no soil or water sampling was required during drilling.
The augering methods specified in the Work Plan were not possible below about80 feet because of limitations of the drilling method. Sand blow-in below80 feet became significant, which interfered with soil and water sampling. Insome cases it was not possible to drive the sand-point (for water samples) pastthe sand in the auger stem. Below 80 feet, it was difficult to turn the augersbecause of loose sand caving around the auger flights. In addition, augermethods were not appropriate for drilling through layers of floating free productbecause of the possibility of contaminating soil and water samples taken fromdeeper horizons. Accordingly, rotary drilling replaced augering whenappropriate.
Rotary drilling was done using a 4'/2-inch roller bit with a bentonite mud wash.Rotary methods were modified, as described below, to prevent spreadingcontaminants when drilling through the landfill or through floating naphtha andto avoid using drilling mud in zones to be screened.
Floating naphtha was encountered along the southern and western edges of thelandfill. Temporary surface casing was installed in these boreholes to isolate thecontaminated zone. The temporary casing was then flushed with clear water toremove contaminants from inside the casing. The flush continued until the flush
D-2

O MW1S, M
MW2S.M.D
O
MW5S,GB1
GB2 OMW3S.M.D
GB3+ GB8GB4 QMW4S
GB7GB5
MW10M
LEGEND ? MW1
-250-
MW9M O
-250' I
0 GEOTECHNICAL BORING
O MONITORING WELL
9 MONITORING WELL INSTALLED INGEOTECHNICAL SORING
MW7M
0 200
SCALE IN FEET
FIGURE D-1
GEOTECHNICAL BORINGSONALASKA LANDFILL Rl

water was free of visible contamination. The borehole was then advanced with anew batch of drilling mud.
Where monitoring wells were to be built, such as at GB2, the use of drillingmud was discontinued approximately 5-feet above the intended screened zone.Casing was then installed to the bottom of the borehole and the drilling mudwas flushed from the casing. The borehole was advanced to the desired depthby drilling and driving casing in 5-foot intervals using clear water. Drilling anddriving casing by this method was extremely slow. In addition, a single deepborehole required all of the available 5-inch casing at the site. Because of this,the borehole for MW-8D was drilled to its final depth with mud, eliminating theneed for the casing, which was being used in another borehole.
Drilling methods for each borehole are summarized in Table D-l. Additionalinformation regarding drilling methods may be found in the Soil Boring Logs(Attachment 1), which were completed for the geotechnical borings, and in thefield notebooks (stored in project files).
Soil Sampling
All soil samples were collected by driving a split-spoon soil sampler into the soilahead of the open borehole. Normally, a 2-inch spoon was driven with a140-pound hammer in accordance with ASTM D 1586. However, 3-inch spoonswere used when analytical samples were collected to obtain the required volumefor RAS and SAS samples.
Locations, depths, and geologic descriptions for all samples taken fromgeotechnical boreholes are given on the Soil Boring Logs (Attachment 1). Forconvenience as a quick reference, locations and depths for grain-size samplesand analytical samples are also given on Tables D-2 and D-3. Laboratoryresults for the grain-size analyses are presented in Attachment 2.
Water Samples
Water samples were collected from predetermined depths in the geotechnicalboreholes or from screened zones of monitoring wells. Samples were analyzedfor selected VOCs in the onsite laboratory to obtain preliminary information onthe distribution of VOCs in the groundwater. Analytical results from watersamples from the geotechnical boreholes and initial monitoring well boreholeswere used to modify, if necessary, the planned depth of the remainingmonitoring wells and to evaluate the need for and location of additionalmonitoring wells.
Samples from geotechnical borings and the initial monitoring well boreholeswere collected by driving a 2-inch-diameter, 3-foot screened sandpoint into theundisturbed soil ahead of the augers or casing. Two-inch galvanized riserconnected to the sandpoint and extending to the surface formed the temporarywell from which samples were taken. At least three volumes from thetemporary well were removed before sampling. Samples from monitoring wellsinstalled toward the end of the well-construction period were collected directly
D-3

Table D-l (Page 1 of 2)SUMMARY OP DRILLING METHODS
Method Comments
GB1 Mud rotary to 118 feet Floating productSurface casing (5 inches)to 30 feet
GB2 Flight auger (pilot hole) Floating productto 10 feet , Installed MW-3M in boreholeSurface casing (6 inches) to 15 feetMud rotary to 65 feetWater rotary to 80 feetCasing (5 inches) to 80 feet
GB3 Auger to 16 feet Floating productSurface casing (6 inches) to 20 feetMud rotary to 68 feet
GB4 Auger to 60 feet
GB5 Auger to 80 feet Installed MW-6M in borehole
GB6 Auger to 80 feet Installed MW-8M in borehole
GB7 Auger to 69 feet
GB8 Auger to 50 feet
MW-1S Auger to 26 feetMW-1M Auger to 80 feetMW-2S Auger to 28 feetMW-2M Auger to 78 feet, Wooden plug in
screened lead augerMW-2D Auger to 18 feet
6-inch Surface casing to 20 feetMud rotary to 110 feetWater rotary to 139 feet5-inch Casing to 134 feet
MW-3S Auger to 18 feetMW-3M See GB-2 for detailsMW-3D Flight auger to 10 feet (pilot hole)
6-inch Surface casing to 15 feetMud rotary to 100 feetWater rotary to 142 feet5-inch Casing to 138 feet
MW-4S Auger to 28 feetMW-5S Auger to 22 feet
MW-6M See GB-5 for detailsMW-7M Auger to 80 feet

Table D-l (Page 2 of 2)SUMMARY OF DRILLING METHODS
Method
MW-8S Auger to 24 feetMW-8M See GB-6 for detailsMW-8D Mud rotary to 138 feet
MW-9M Auger to 80 feetMW-10M Auger to 80 feetMW-11M Auger to 80 feet
MW-12S Auger to 23 feetMW-13S Auger to 25 feetMW-14S Auger to 18 feet
Comments
Drilled 3 times (well problem)
GLT913/007.WP

Table D-2GRAIN-SIZE SAMPLE LOCATIONS
Boring Nmnber Depth, (ft)
GB-1 78GB-3 22GB-3 39GB-3 59GB-4 13GB-4 38GB-4 55GB-5 78GB-8 18GB-8 48MW-1 20MW-1 53MW-1 78MW-3 18MW-7 30MW-7 80
Table D-3RAS/SAS SAMPLE LOCATIONS
Boring H.VB>b,?r Depth (ft)
GB-1 113-117GB-2 14GB-2 55GB-2 75GB-6 20GB-6 80MW-1 18-22MW-1 53-55MW-1 78-80MW-2 24MW-2 58MW-2 75MW-2 108
GLT913/008.WP

from the installed screen. At this point in the investigation, the need foradditional wells had been established and rapid turnaround times for analyticalresults were not critical.
Sample locations and depths are given in Table D-4.
MONITORING WELL INSTALLATION
Well Construction
Boreholes were drilled or augered to the desired depth. Ten feet of screen andenough riser to result in 2 to 3 feet of stick-up were placed in the borehole.Wells penetrating the landfill or floating product were constructed of stainlesssteel. The other wells are PVC.
Depending on the drilling method, augers or 5-inch casing were then removed toallow approximately 13 feet of sand to cave around the screen to form a naturalgravel pack that extended at least 3 feet above the top of the screen.
Approximately 1 foot of bentonite pellets formed a bentonite pellet seal abovethe gravel pack. One foot of fine-sand was added to prevent the bentoniteslurry from penetrating the pellet seal. The borehole was grouted to the surfacewith a bentonite slurry to form an annular seal. The slurry was added using atremie pipe that extended to within 2 feet of the fine sand.
The remaining augers or casing were removed after the grout was added.Typically, the grout would settle overnight at or near the water table (10 to20 feet below the surface). A bentonite/cement grout was used to top off theannular seal. This, in conjunction with a 2-foot-diameter concrete pad, formed asurface seal. The concrete pad also supported the locking 6-inch diameter steelprotective casing that was installed over the riser pipe. Bumper posts wereinstalled around wells along the road and in the farm field south of the site.
Attachment 3 contains construction details for each monitoring well. Deviationsfrom the typical construction method are noted on the diagram.
Well Development
Groundwater monitoring wells were developed by removing water from the well.Water was removed with a hand operated (BK pump) or an air-driven (QEDwell-development pump) positive displacement type pump. The amount ofwater removed was based on the clarity of the water, the amount of wateradded during drilling, and the volume of the riser. At least 100 gallons wereremoved. For deeper wells, five well volumes plus the estimated quantity of lostcirculating fluid, were removed. Actual purge volumes are given in Table D-5.
Well Locations/Elevations
Well elevations were established using a tripod level and rod. All riserelevations were measured from the north side of the uncapped riser pipe unless
D-4

Table D-4GROUNDWATER SAMPLE LOCATIONS
CSL FIELD SCREENING
Boring N'unber
GB-1GB-1GB-1GB-3GB-3GB-4GB-4GB-5GB-5GB-6GB-6GB-6GB-7GB-7GB-8GB-8MW-1MW-1MW-2MW-2MW-2MW-3MW-3MW-4MW-7MW-7MW-9MW-9MW-10MW-10MW-llMW-11MW-12MW-13MW-1 A
Depth (ft)
20801201760
8-1154-57
1080
18-2173
121-1312270
18-2855-58
2380
28-3178-81
108-1111869
20-3025-3080-82
2580
18-2176-7820-22
7613-2314-246-16
Field I.D. No.
MW-5S-01GB-01-OK80)GB-01 (120)GB-03-01GB-03-02GB-04 (8-11)GB-04 (54-57)GB-5 (10)GB-5 (80)GB-06-(18-21)GB-6M-73MW-8DGB-07-01GB-07-02GB08 (18-28)GB-08 (55-58)MW-1S-23 feetMW-1M-01MW-2S-01MW-2M-01MW-2D (108-111)MW-3S-01MW-3MMW04 (20-30)MW-7S (25-30)MW-7M (80-82)MW-9M (25)MW-9M (80)MW-10M (18-21)MW-10M (76-78)MW11M (20-22)MW11M (76)MW-12SMW-13SMW-14S
GLT913/009.WP

Table D-5PURGE VOLUMES FOR WELL DEVELOPMENT
Wall ftntjlpay Purge Volume
MW-1S 100MW-1M 100MW-2S 100MW-2M 400MW-2D 400MW-3S 100MW-3M 350MW-3D 400MW-4S 100MW-SS 100MW-6M 100MW-7M 100MW-8S 100MW-8M 100MW-8D 400MW-9M 100MW-10M 100MW-11M 100MW-12S 100MW-13S 100MW-14S 100
GLT913/010.WP

otherwise noted. Measuring points other than the north side of the riser aremarked on the riser pipe. Ground surface elevations are measured from arepresentative point in the general vicinity of the well.
All elevations were tied to the National Geodetic Vertical Datum (NGVD)through the bench mark establish by Martinez, Inc., as part of the sitetopographic mapping. Surveyed elevations are given in Table D-6.
The location of each new monitoring well was determined by taping distancesfrom known landmarks or based on the grid established on the site during thegeophysical survey. Monitoring well locations were marked on a 1:1200topographic site map. Monitoring well locations are also shown on Figure D-l.The topographic map is stored in the project file.
GROUNDWATER ELEVATIONS
Depth to water in the monitoring wells was measured with an electric waterlevel indicator. Depths and elevations for March 31, April 17, June 12, andAugust 2, 1989, are given in Table D-7.
SLUG TESTS
A schematic diagram of the gas-displacement slug test apparatus used in themedium and deep wells is shown in Figure D-2. The apparatus allows for thedepression of the water level in the well using compressed nitrogen gas. Whenthe gas pressure in the well equilibrated with the difference in elevation headbetween the well and aquifer, the test was started by venting the well. Datawere collected using a Campbell Scientific, Inc., Model 21X Micrologger linkedto Druck pressure transducers.
The gas displacement apparatus cannot be used on wells screens that straddlethe water table, as is the case for the shallow wells. Slug tests in shallow wellsused the apparatus shown in Figure D-3. A hollow slug was placed in the wellto displace water. The test was started by rapidly removing the slug. Data werecollected using a single transducer connected to the Micrologger.
Three tests were done on each well that was tested. Raw data for each testwere plotted on the graphs in Attachment 6. Data were analyzed according tothe method described by Bouwer and Rice (1976) and Bouwer (1989). Theaverage hydraulic conductivity for each well is given in Table D-8.
D-5

Well
New Walls
MW-1SMW-1MMW-2SMW-2MMW-2DMW-3SHW-3MMW-3MMW-3DMW-4SMW-5SMW-6MMW-7MMW-8SMW-8MMW-8DMW-9MMW-10MMW-11MMW-12SMW-13SMW-14S
Old Wells
Table D-6WELL ELEVATIONS
RiserElevation (ft)
663.22663.47664.88664.93665.07656.44655.43655.43656.46665.01659.46648.46662.51661.88662.63661.65656.10656.51657.17662.95664.87656.19
GroundElevation (ft)
660.9660.9662.3662.9662.75653.7653.6653.6653.9662.6656.4646.0660.3659.659.659.
.4,4.2
653.6653.3654660661.8654.8
.3
.2
B-lB-2B-3B-4SB-40B-5
663.42667.23661.06656.16656.62662.00
660.6665.3659.9655.1655.0659.4
GLT913/011.WP

Table D-7GROUNDWATER ELEVATIONS IN FEET
WellNumber
New Wells
MW-1SMW-1MMW-2SMW-2MMW-2DMW-3SMW-3MMW-3DMW-4SMW-5SMW-6MMW-7MMW-8SMW-8MMW-8DMW-9MMW-10MMW-11MMW-12SMW-13SMW-14S
Old Wells
6/1/88Elev.
3/31/89 4/17/89 6/12/89 8/2/89
16.8717.1317.8219.0719.6111.1710.1211.0620.1913.823.2118.1217.1517.8016.8411.7311.7113.1018.4320.0311.48
646.35646.34647.06645.86645.46645.27645.31645.40644.82645.64645.25644.39644.73644.83644.81644.37644.80644.07644.52644.84644.71
19.1319.3520.3320.9421.0512.5011.5812.5221.1615.544.8318.5818.1518.9017.8912.5313.0713.5519.1420.8613.44
644.10644.12644.55643.99644.02643.94643.85643.94643.85643.92643.63643.93643.73643.73643.76643.57643.44643.62643.81644.01642.75
18.4819.2220.1620.6720.7912.3511.3612.3020.9015.354.6618.2819.9318.6617.6512.3512.9313.2118.8720.5513.24
644.25644.25644.72644.26644.28644.09644.07644.16644.11644.11643.80644.23643.95643.97644.00643.75643.58643.96644.08644.32642.95
20.8821.1222.1122.5922.8114.4613.3514.2922.8217.526.5520.3919.9120.6319.6313.7114.2215.1420.9022.6915.14
642.34642.35642.77642.34642.26641.98642.08642.17642.19641.94641.91642.12641.97642.00642.02642.39642.29642.03642.05642.18641.05
B-lB-2AB-3AB-4SB-4DB-5
642.61642.45642.42642.45
--642.57
17.76 645.66
--16.09 644.9711.24 644.9211.20 645.9216.92 645.08
19.28 644.1423.30 643.9317.20 643.8612.82 643.3412.75 643.8718.12 643.88
19.03 644.3923.12 644.1116.93 644.1312.60 643.5612.58 644.04
—River 642.56
GLT913/012.WP

PressureRegulator
Well-HeadAssembly
T / ' O P V C
ExpandableRubberPacker
PressureRegulator
, hQ » Head at time, tQ
L = Length of Test Zone
PressureTransducerNo 1
NOT TO SCALE
LJ r or rc =• Radius of well
r or R • Radius'of borehole
RGURE D-2SCHEMATIC DIAGRAM OFNITROGEN SLUG TESTASSEMBLYONALASKA LANDFILL fll
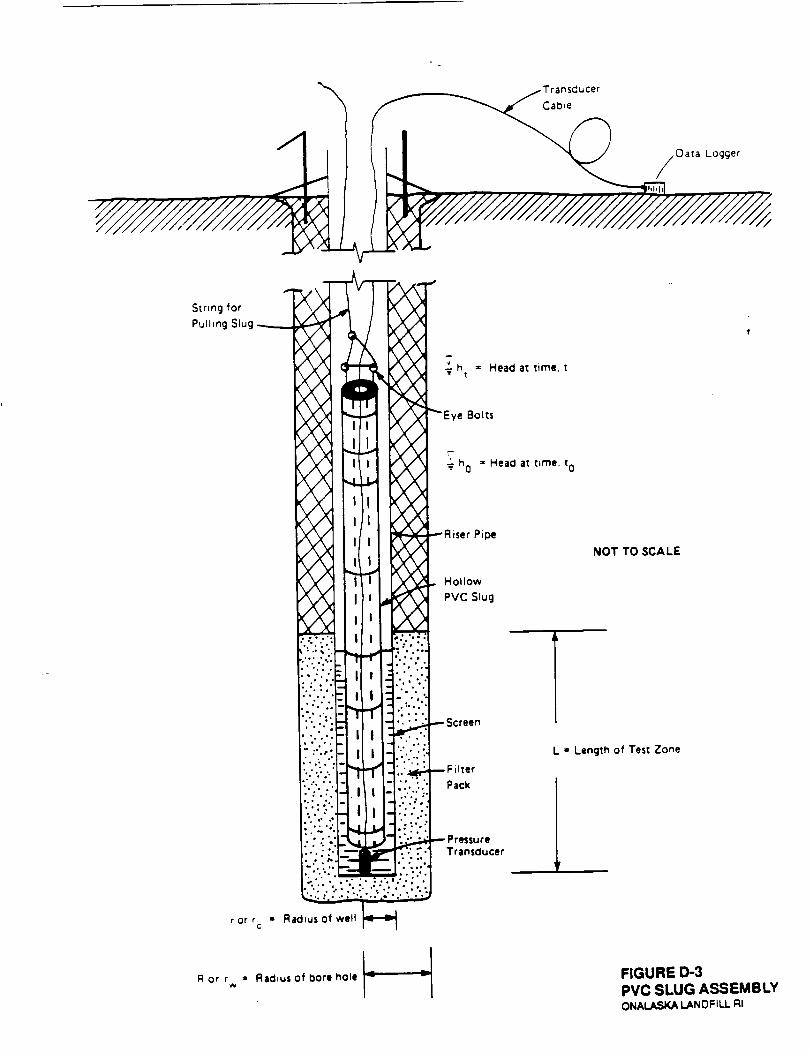
Transducer
Cabie
Data Logger
String forPulling Slug
h * Head at time, t
Eye Bolts
^ h - Head at time, tQ
Riser Pipe
HollowPVC Slug
NOT TO SCALE
Screen
L * Length of Test Zone
PressureTransducer
• or r » Radius of well U »j
R or r » Radius of bore hole FIGURE 0-3PVC SLUG ASSEMBLYONALASKA LANDFILL Rl

Table D-8HYDRAULIC CONDUCTIVITY
WellNumber
Haw Wells
MW-1SMW-1MMW-2MMW-2DMW-3MMW-3DMW-7MMW-8MMW-8DMW-9MMW-10MMW-11MMW-13S
Old Wells
B-LB-2AB-3AB-4SB-4D
Average HydraulicConductivity (cm/s)
0.040.040.030.030.030.060.030.030.002a
0.030.030.030.06
0.010.050.010.0090.05
Number ofTests
3333333333333
44442
•Hydraulic Conductivity on MW-8D is probably not representative of theaquifer. It is low most likely because of the drilling method andinsufficient well development.
GLT913/013.WP

REFERENCES
Bouwer, Herman and R. C. Rice. Slug Test for Determining HydraulicConductivity of Unconfined Aquifers With Completely or Partially PenetratingWells. Water Resources Research, Vol. 12, No. 3, June, 1976.
Bouwer, Herman. The Bouwer and Rice Slug Test-An Update. Groundwater.Vol. 27, No. 3, May-June, 1989.
GLT913/006.50
D-6

Attachment 1GEOTECHNICAL BORING LOGS
GLT913/014JO-1

PROJECT NUMMH
GLO6S5M.F1.ra
BORING NUMBER
G8-01 SHEET 1 OF 4
SOIL BORING LOG
PROJECT ONALASKA SEOFMW-5S
ORLLINQ CONTRACTOR ETI (CME 750)ELEVATION _
ORLLMQ METHOD AMD EQUIPMENT MUD ROTAflY WITH SPUT- SPOON SAMPUNG
WATER LEVEL AND DATE _ START 3-13-69 FINISH 3- 15-89 LOGGER JAI
DE
PTH
BE
LOW
SU
RFA
CE
(FT)
5-
10 -
15 -
20 -
25 -
30neaao.pi
SAMPLE
INTE
RV
AL
7/••••••1
7/••••••i
z/zz/ie om-o
TYP
E A
ND
NU
MBE
R
ssr
SS2
SS5
SS4
SS5
SS«
RE
CO
VE
RY
(FH
1.6
1.0
0.7
0.3
0.6
STANDARDPENETRATION
TESTRESULTS
r-r-r(N)
2-1-2-2
4-7-64
5-7-8-10
4+4-5
10-9-9-6
7-5-7-7
SOIL DESCRIPTION
SOL NAME. COLOR. MOISTURE CONTENT.RELATIVE DENSITY OR CONSISTENCY, SOLSTRUCTURE. MMERALOGY. USCS GROUPSYMBOL
Light Brown SMty - Rna Sand
-
No Recovery
•
LOOM Madkjm to Coarse Sand
;-
Loose Coane Sand and Fine Gravel
•
"
Looee Coane Sand and Una Gravel
Cobblam
Looee Coane Send and Fine Gravel
B
SM
SP
SP
SP
SP
COMMENTS
DEPTH OF CASING. DRILLING RATE.DRILLING FLUID LOSS. TESTSAND INSTRUMENTATION
HNu-0 ppm(t' 11:50)
-
HNu • 0 ppm (t - 1 1:56)
-
HNu -6-9 ppm SSm 10-12 ppm in Borehole
Note: Slight oil sheen on waterfromSS
Hard DrilSng - Gravelly
HNu » 4 ppm in Borehole• 0 ppm in Breathing Zone• 2-3 ppm in SS
Hard DrilSng -Gnvety
HNumO ppminMud
HNu -2-6 ppm in Boreholem 0 ppm in Breathing Zonem 0 ppm in Mud and SS
HNu m 1-2 ppm in Borehole• 1 ppm in S3m 0 ppm in Breathing Zone

PROJECT NUMBER
GLO 6S550.F1.ro
BORING NUMBER
GB-01 SHEET 2 OF 4
SOIL BORING LOG
PROJECT ONALASKA LOCATION.
DRLLING CONTRACTOR ETI (CME 750)ELEVATION
DRILLING H*THCO AND EQUIPMENT MUD ROTARY WITH SPLIT- SPOON SAMPLING
WATER LEVEL AND DATE START 3-13-89 FINISH. 3-15-89 LOGGER, JAI
DEP
TH B
ELO
WS
UR
FAC
E (F
T)
-
35 -
40-
45-
;
50 -
;55 -
60HUMP DC
SAMPLE
INTE
RV
AL
7z7/•••••M
7/mmemmmmmmmtm
7</
i
L
7
TYP
E A
ND
NU
MBE
R
SS7
SS8
SS9
SS10
SS11
SS12
at OKM 2 HT-H
RE
CO
VE
RY
(FT)
0.6
0.2
0.2
1.0
1.3
0.5
STANDARD
TESTRESULTS
r-r-r(N)
4-14-54
6-9-8-8
14-1 4-16-22
12-14-22-16
12-15-14-28
15-10-10-13
SOIL DESCRIPTION
SON. NAME, COLOR. MOISTURE CONTENT,RELATIVE dCNSfTY OR CONSISTENCY, SOLSTRUCTURE, MMERALOGY. USCS GROUPSYMBOL
-
GreveHy Send
Fine Gnvel with Some Coene Send
•
Fine to Medhm Gravel w*h Some CoeneSend (Rot* BMong End of Spoon)
-
OJ-Fine-MedumGrevet
Medkim Coene Send
-
Medhtm- Coene Send
0.5* Grtveiy Send
Medbm - Coene Send wHh Trace fine Qiwel
11
SP
Gf>
OP
SP
SP
COMMENTS
DEPTH OF CASING. DRILLING RATE,ORN.LMG FLUO LOSS. TESTSAND INSTRUMENTATION
No»: 30* Casing in Holt(t- 4-20)
Driving Rough • Gnv*9yLotingWattr
HNu - 0 pom in Borehole(tm 4:40)
(t - 5.-00)
-
HNu.Oppm
-
Dating Easier Lou Gravel
HNu-Oppm(tm8:lS)
(t - 8:40)Me* Another Btlctt of Mud
HNu - 0 pom in Mud
HNu - 0 ppm (t - 9OO)
HNu. 0 pom

PROJECT HUM MM
GLOMHO.Fl.raBORING NUMBER
GB-01 SHEET 3 OF 4
SOIL BORING LOG
PROJECT ONALASKA LOCATION.
DRIJJNG CONTRACTOR ETI (CME 750)ELEVATION
DRILLING METHODANO EQUIPMENT MUD ROTARY WITH SPUT- SPOON SAMPLING
WATER LEVEL AND DATE STAHT 3-13-89 FINISH. 3-15-89 LOGGER JAI
DE
PTH
BE
LOW
SU
RFA
CE
(FT)
•
65 -
70 -
75 -
;80 -
85-
•
90
SAMPLE
MT
ER
VA
L
Z
\7/^^^^ ••M
z~7£.
z7
LMMttOt.OE OX)
t|
SS13
SS14
SS15
SS18
SS17
SS18
RE
CO
VE
RY
(FT)
r.5
0.9
1.7
1.8
0.9
-
STANDARDPENETRATION
TESTRESULTS
(N)
3-1-1-1
12-11-14-17
11-19-13-3
9-2-2-9
2040-31-35
7-1-5-13
SOIL DESCRIPTION
SON. NAME, COLOR. MOISTURE CONTENT,RELATIVE OENSfTY OR CONSISTENCY, SOLSTRUCTURE, MMERALOGY, USCS GROUPSYMBOL
Sand
Mfdktm - Coana Smnd
~
— — - ^
SamemAbwt
""
Broom Mtdkm - Com* Sand
Brown MMum - CMVW Sand w*» Fint Orgvtl
Si
SP
SP
SP
SP
SP
SP
COMMENTS
DEPTH OF CASING. DRILLING RATE.DRLLING FLUID LOSS. TESTSAND INSTRUMENTATION
(I.1SS)
HNU-Oppm(l.t*2)
™"
HNumOppm (t-1:SO)MxBatcfiofMud
-
~"
OVAmOppm* 1-2 ppm from SSm4-6ppmmMud
•
17-21-M

PROJECT NUMBER
GLO 65550.F1.ra
BORING NUMBER
GB-01 SHEET 4 OF 4
SOIL BORING LOG
PROJECT ONALASKA LOCATION.
DRILLING CQMTRACTQH ED (CME 750)ELEVATION
DRILLING METHOD AND EQUIPMENT MUD ROTARY WITH SPUT-SPOON SAMPUNQ
WATER LEVEL AND DATE START 3-13-89 FINISH. 3-1549 LOGGER JAI
DE
PTH
BE
LOW
SU
RFA
CE
(FT)
95 -
100-
106 -
110 -
115 -
MHCLDg
SAMPLE
j
zzzz
I
TYP
E A
ND
NU
MBER
SS19
SS20
SS21
SS22
SS23
y-ss
RE
CO
VE
RY
(FT)
1.8
1.0
STANDARDPENETRATION
TESTRESULTS
f-tr-f(N)
12-10-31-33
13-17-25-30
11-15-19-24
2-2-11-21
31-4O-33-28
17-22
SOU. NAME. COLOR. MOISTURE CONTENT,RELATIVE DENSITY OR CONSISTENCY. SOLSTRUCTURE. MMERALOGY, USCS GROUPSYMBOL
fl»ddW> Brown S8ty Fit* Sand withTrtet Mtdum Sand
O.F Mfdutn Fir* Stnd
Apdbb/i Brown Sity rVw Stnd withTract Mtdum Sand
StmtmAbovt
Rfddmh Firm Stnd
-
ENDOFBORMQ
g
SM
SM
SP
SP
COMMENTS
DEPTH OF CASNG. DRLLING RATE.DflLLMGFLUlO LOSS, TESTSAND INSTRUMENTATION
(t-SOS)OVA m 40-50 ppm in Mud
« 0 ppm in Breathing Zon»m 0 ppm in Bonholf
Cobblu
(1*5:40)
(t-8SO)Hnu-Oppm
HNumOppmT*l»CLPS*npli(-0.1)
JN OB<W47-aVM

PROJECT NUMI
OLO 6S650.F1.FO
BORINQ NUMBER
GB-02 SHEET 1 OF 3
SOIL BORING LOG
PROJECT ONALASKA WESTOFSHED.SWOFLANDRLL
ORLLMQ CONTRACTOR ETlELEVATION _
DflLLING METHOD AND EQUIPMENT FLIGHT AUGERS TO MUD ROTARY. WATER ROTARY THROUGH SCREENED ZONE
WATER LEVEL AND DATE _ START 3-19-69 f»usM 3-20-89 K. OLSON
DE
PTH
BE
LOW
SU
RFA
CE
(FT)
5 -
-
10-
•
-
15 -
-
20 -
25-
30•4UI&AI
SAMPLE
(
z** ama^m
z•MMH H
— 7
/6 — 7
/• •M
//•MM^
//mammmmm
Of OM
TYP
E A
ND
NU
MBE
R
SSf
SS2
SS3
SS4
SS5
SS9
1 t-17-M
RE
CO
VE
RY
(FT)
2.0
to
0
0.9
0.7
0
STANDARDPINCTRATION
TESTRESULT*
f-f-f(N)
4-5-6-3
Z+±5
S-10-15-23
7-7-64
6-10-8-9
7-7- S
9OLDESCMPDON
SOIL NAME, COLOR. MOISTURE CONTENT,RELATIVE DENSITY OR CONSISTENCY. SOLSTRUCTURE. MMEHALOGY. USCS GROUPSYMBOL
Vtoofum to Count Smd, Shown. Moist AltS«gucncM of Cotnt Sand Gndng toMfdum Sand. Firming upwtrd in Appmt.4'Stqutnom.
Sinw, but wtoltttApptnnl LaminarStnetun, That fin* ID /UMum Grmnl
.
AHStough
FnttoCotnt Sand. Toot Sit and Grmrtt.QHMHI in Gator.
StmtmAbovt
•
•
i§
SP
SP
SP
SP
SP
SP
COMMENTS
DEPTH OF CASING, DRLLING RATE.DRILLMQ FLUID LOSS. TESTSAND NSTRUMENTATION
HNu . 0 ppm Down HobHnu » 0 pom Sampfe HfmdspKt90~LEL-5
HNu - 5 ppm in Bntthing Zone -Diminish*! to 0 ppm within/Mrr.
HNu - 70 ppm on Stmptu Haad-30** OOLELmlO
6'CmingimuHfdtolS'
3' Spoon (14' to 161 CLP S*npb -Ad3SdMud. Flush* lo 16" thinStonpfert OH4B02-16
VOAt (4 • 4oz. jsn) and(8-aoijan)
-
HNu - 0 ppm Down hoi*
-

PROJECT NUMBER
GLO 65550.F1.FO
BORING NUMBER
GB-02 SHEET 2 OF 3
SOIL BORING LOG
ONALASKA WEST OF SHED, SW OF LANDFILL
DRIUNG CONTRACTOR ET1ELEVATION
DRILLING METHOD AND EQUIPMENT FLIGHT AUGERS TO MUD ROTARY. WATER ROTARY THROUGH SCREENED ZONE
WATER LEVEL AND DATE 5TABT 3-19-89 FINISH 3-20-89 LOGGEH K. OLSON
*_
!tSuia
35-
40 -
45-
50-
55 .
60j44d&o6
!
i
z
/_
~7£_
M QKX
UUPLI
1
SS7
SS8
559
2*-174t
i?
a£
0.4
0.9
STANDARD
TESTRESULT*
f-V-V(N)
13-19-15-17
12-13-11-14
1 9-27-49-21
SaLDfJCMPTION
SOIL NAME, COLOR. MOISTURE CONTENT.RELATIVE DENSITY OR CONSISTENCY SOILSTRUCTURE. MINERALOGY. USCS GROUPSYMBOL
Sand with Oratw/fen than 1'
Firm to Coww Sand, Tract Gnvti
Stint tt About, Exotot Encounttmt 1 4 Gttvtl -Zont,Qnvt<L»u*tn2'ttS4t
GftvtIZontt
„
II
SP
SP
CO
COMMENTS
DEPTH OF CASING. DRILLING RATE,DRILLING FLUID LOSS TESTSAND INSTRUMENTATION
HNu m o 0pm on SampltHtadspace. Could be moeOyslough. Kg ha* ottn noisy, socould bt occasional Graval Seamsin Last 10'
HNu - o ppm on SampltHtadspact
Samplt (2 - 402. jtn) for VCAsand(S-8oz.jan)ON-6802-5SHnu m 0 ppm on SampltHttdtpaot
r*y i*nauenng mm at nan

PNQJBbTM
GLO«$SO.Fl.ra
•ORINU NUM
GB-02 SHEET 3 OF 3
SOIL BORING LOG
PROJECT ONALASKA WEST OF SHED. SW OF LANDFILL
DfllLING CONTRACTOR ET1ELEVATION ,
DRILLING METHOD AND EQUIPMENT FLIGHT AUGERS TO MUD BOTARY. WATER ROTARY THROUGH SCREENED ZONE
WATER LEVEL AND DATE START 3-19-69 FINISH 3-20-89 LOGGER K. OLSON
DE
PTH
BE
LOW
SU
RFA
CE
(FT)
65 -
70-
75-
U6MO.CT
SAMPLE
INTE
RV
AL
z
/.
JX OKI
TYP
E A
ND
NU
MBER
SS10
SS11
1 »-17-«
RE
CO
VE
RY
(FT)
0.4
0
STANDAHDPCMITRATION
TESTRESULTS
r-r-r(N)
21-19-16-13
2640-15-18
SOL DESCRIPTION
SOIL NAME. COLOR. MOISTURE CONTENT.RELATIVE DENSITY OR CONSISTENCY. SOLSTRUCTURE. MINERALOGY. USCS GROUPSYMBOL
SamaatAbovf.FinatoCoanaSand,TracaGftvtt
END Of BORING
e
SP
SP
COMMENTS
DEPTH OF CASING. DRILLING RATE.DRILLING FLUID LOSS. TESTSAND INSTRUMENTATION
Iratal 5" Casing to 65". andFhjshadwithClaarWa*r
CLP Samp* CoHKtad from 73'toApprox. TV, VOAtwtrtCoAcMd from UntftturttadSampif. Soma ofothar Pmramatarswarm CoUtctad from Undiituitad .Sampta and Slough that SttOadout in Catad Bonhda ON-GB02-75

PROJECT MUM ECU
OLO«MOF1.ra GB-03 SHEET 1 OF 3
SOIL BORING LOG
LOCATION 75FT WEST OF SOUTH GATE.PROJECT ONALASKA
E LEVATION — WTIEU.WU ^n i n«^ i w»i __••"
DRILLING METHOO AND EQUIPMENT CME-75 HSA (4 1/T) AND MUD ROTARY WITH SPLIT-SPOON SAMPLING
WATER LEVEL AND DATE START 3-8-M
ORLLMQ CONTRACTOR ETI
FINISH 3-9-» LOGGER JAI
It
il
-
---
10-
"
1C
-
-
-
20 -
25 -
•
•
30LJMM.FI
f
b7
////
r?///
• •••H
• MMMI
/
Z
z/~7FQOMl
SAMPLE
9<E
SS
ss
Ofi
SS
ss
cc
SS
ss
ssor
ss
ss
ssiMMi
5
t.3
r.fi
/I A
1.3
0.5
(\ 7
0.3
04
0.8
1.4
0.7
0
STANDARD
TESTRESULTS
<N>
29-21-13
3-4-3-3
9JLJL7
6-3-1-1
3-2-2-3
9 1 1 1
2-3-12-13
8-11-13-19
30-18-20-18
5-5-7-5
10-13-12-11
SON. NAME. COLOR. MOISTURE CONTENT.RELATIVE DENSITY OR CONSISTENCY SOLSTRUCTURE. MMERALOQY, USCS GROUPSYMBOL
Qflrir Brown Swty - Pint Swcf wnh inot Fin9
-
-
RuttSHly- FkmSmdmtiTrmofRn»Oimfl-
Hnm to CaMimm 3amf lUfth gjiu it
"
•». |» Pti« f^nrV naVh T • ~>M CtfkA / fMHJWkfUAVN UUfMf TMTW <JEVIU UWJ ffmGm rlf19 WaTW
MMbm 19 CO.WM Stone/ant* Rrw Gnv
-
-
s .*^ ;
— :
MK*MI to COM* SM/ IMA r«e» flw CVtv^
s-«.«« ;*l-fc i tfMM^MKtfno rivoowjr
„I!
SM
SM
ep
SP
CO
SP
SP
SP
SP
SP
COMMENTS
DEPTH OF CASING. DRILLING RATE.DRLUNG FLUID LOSS TESTSAND INSTRUMENTATION
HSA
No HNu Of Otction
-
LEL.O*
-
LEL mlHt
NoHNuD*«Kton
HNuDfOtaionFrom SS 40-50p(>mBonhok 10-ISfipmBntthing Zone oppm
Bf9fthny 2on9 Oop/nLMt 1/Z ffmcolond- Gny 1 > 4 .
AfoflPtfCtf typ9 Sh99ft
From SS 12-13ppm8onhot*20ppm
HNu 0*toc*oofrom Borthott 10-1SppmBntthing 2or» 3 4ppm
OVA.OCotecttd Gain Sin Stmplt
NoOVAf**ingt
»*»»*. ;-

PROJECT NUMBER
GL065S50.Fl.Fa
•ORMQ NUMBER
6B-03 SHEET 2 OF 3
SOIL BORING LOG
PROJECT ONALASKA LOCATION.
ELEVATION. ORLLING CONTRACTOR .
DRILLING METHOD AND EQUIPMENT.
WATER LEVEL AND DATE START. FMISH. LOGGER
DE
PTH
BE
LOW
SU
RFA
CE
(FT)
30
35-
40-
45 -
50 -
55-
60LMM&F1
SAMPLE
!</_
vz/7/Z/Z/z/2
i|
ss
ss
ss
SS02
ss
ss
ss
ss
ss
ss
ss
ss
RECO
VERY
(FT)
0.8
1.3
0.8
0.9
0.8
0.9
0.8
1.1
0.9
0.7
1.0
0.9
STANDARDPENETRATION
TESTRESULTS
f-f-f(N)
7-8-9-23
27-27-21-22
11-12-13-12
11-10-10-13
15-21-22-24
12-13-12-12
10-18-20-20
10-15-18-17
8-10-11-18
15-15-13-13
18-18-18-23
50-48-29-20
SOL DESCRIPTION
SOIL NAME. COLOR. MOISTURE CONTENT,RELATIVE dENSTTY OR CONSISTENCY SOISTRUCTURE. MMERALOGY, USCS GROUPSYMBOL
Modum - Com* Sand with Tract Fin* Gnvtl
Sand with son* Fine Gravel
Mfdkim - Coana Sand with aoma GravaiGravity Madhtm Coana Sand
Madum ID Coana Sand. Mora Qravaify at Bottom
Madkm to Coana Sand with Traoa Fna Graval -
SameatAbova
SamamAbova
SamamAbova
SamaatAbova
SamaatAbova
SamaatAbova
Qmaiy Madam -Coana SandRnatoMadkmQfavat
SamamAbova
ll
SP
SP
SP
SP
SP
SP
SP
SP
SP
SP
SP
SP
COMMENTS
DEPTH OF CASMQ, DRILLING RATE.DRLLING FLUD LOSS, TESTSAND INSTRUMENTATION
OVA m Oppm ft m 11:15)
OVA m 0 ppm ft m 11:40)CotfOtd Gan Sia Sample
OVAmOppmftml3M)
OVA - Oppm ft * 1330)
FQQ*-0127aMt

sS•••PROJECT ONALASKA
ELEVATION
nni i IMA uerwnn AMD PTM IIPWFMT
WATER I EVFL AND DATE
PROJtbT NUUlU BORING NUHHH
GLOOUMJM.FQ G8-03 SHEET 3 OF 3
SOIL BORING LOG
LOCATION
DflUJNG CONTBAeTOP
STAHT FINISH 3-»-«» 1 n«GPQ JAI
i60
-
70 -
jaaaoFi
SAMPLE
MTE
RV
AL
^M^M^H
/
z/
TYP
E A
ND
NU
MBER
SS
SS
SS
FQQB-0)37/2Mi
RE
CO
VE
RY
(FT)
1.2
0.9
1.0
STANDARDPENETRATION
TESTRESULTS
F-f-f(N)
20-20-4545
19-14-11-10
10-10-15-18
SOIL DESCRIPTION
SOIL NAME. COLOR. MOISTURE CONTENT.RELATIVE riENSfTY OR CONSISTENCY, SOLSTRUCTURE. MINERALOGY. USCS GROUPSYMBOL
StmtmAbovt
Qmtty firm • Mtdkm Sand
Uudum - Count Smnd
Firm -Mtdkm Sand
Rn» - MMlum Sand wtih Ttmof Fin» Gmtl
-
END OF BORING
|§
SP
SP
SP
COMMENTS
DEPTH OF CASING, DRILING RATE.DRILLING FLUID LOSS, TESTSAND INSTRUMENTATION
OVA m 0 ppm (t - 14:45)
OVA ' 0 ppm (I- 15:10)

PHOJiCT NUHSKH •ORINQ NUUSER
GB-04 SHEET 1 OF 2
SOIL BORING LOG
PROJECT ONALASKA RAVINE SW OF SHED
ELEVATION DRIUINQ CONTRACTOR
DRILLING METHOD AND EQUIPMENT 4 1/4* AUGERS. LEAD SCREENED. SS SAMPLING WITH 2"-2' SPUT-SPOONS
WATER LEVELAND DATE START__§±§? FINISH 3-9-89 loeacp KLO/JJI
DE
PTH
BE
LOW
SU
RFA
CE
(FT)
]-
5-
:
10 -
15-
20 -
;:
25-
30
SAMPLE
1
z//_
1 — 7zz• ^ ^M^H
~7
/_emmmma m
*—Jz• ^^ •
^__
mamaemmeM
TYP
E A
ND
NU
MBER
ssr
SS2
SS3
SS4
SS5
SS8
SS7
SS8
SS9
SS10
SS11
SS12
RE
CO
VE
RY
(FT)
1.0
1.2
1.5
OJ
0.8
1.5
0
1.0
0.8
1*
1.8
2.0
STANDARDPENETRATION
TESTRESULTS
r-r-r(NJ
2-3-3-3
6-4-2-2
1-3-3-5
2-1-2-1
114-4-2
2-13-15-20
2-2-44
18-154-12
40-1344
21-1244
12-9-11-17
24-17-28
SOIL DESCRIPTION
SON. NAME. COLOR. MOISTURE CONTENT,RELATIVE DENSITY OR CONSISTENCY, SOLSTRUCTURE. MMERALOGY. USCS GROUPSYMBOL
Brown Madum ID Coane Sand, Uoitt to Wat.Trace Gravel (Una).
Same, but Saturated.
_
Same, with a Trace of Sit.
Same
Same
Brown, Medktm to Coane Send. Wet,Trace Gravel (up to 1").
Same
(tuoengutar).
Same
Seme
Seme
Seme
I,SP
SP
SP
SP
SP
SP
SP
SP
SP
SP
SP
SP
COMMENTS
DEPTH Of CASING. ORLLING RATE.DRLLING FLUID LOSS, TESTSAND INSTRUMENTATION
HNu - 0 pom
HNu - 0 pom
-
HNu mO pom
HNu - 0 ppm (Suspect of Validity -of theee Pint 4 reading*).
Instated Sandpoint from 8 to 11'to -Sample. Collected CSL Sample1S-O6 - 3W89.
Cotected a Sample for Grain Size -Anafym*. HNu-OppmSS.
A Sole fine Gravel Left in Spoon. -
HNu-OppmSS
_
HNu -0 ppm S3
-
HNu -0 ppm S3
jjaMOFIJOqi-041 ••17-W

PROJECT NUMBER
GLO«S50.F1.FO
BORING NUMBER
GB-04 SHEET 2 OF 2
SOIL BORING LOG
PROJECT ONALASKA LOCATION.
ELEVATION. ORLLMQ CONTRACTOR .
DRILLING METHOD AND EQUIPMENT.
WATER LEVEL AND DATE START. FINISH LOGGER KLO/JJI
DE
PTH
BE
LOW
SU
RFA
CE
(FT)
35-
40 -
"
45 -
•
50.
-
55 -
•
SAMPLE
MT
ER
VA
L
z7/*—?
£_
7Z7^_
</7/6 — 7z7Z7
TYP
E A
ND
NU
MBER
SS13
SS14
NoSamp*
SSTS
NoSampla
SS16
SS17
SS16
No
NoSwnpfe
SS19
NoSampla
RE
CO
VE
RY
(FT)
1.5
2.0
0
2.0
0
2.0
1.5
1.0
0
0
0.9
0
STANDARDPENETRATION
TESTRESULTS
r-r-r(N)
20-15-12-25
3-5-13-35
5-2-6-11
S-1 2-36-500"
10-6-7-23
7-7-14-41
15-12-9-13
21-104-30
16-29-13-13
37-29-29-50
18 49 44 33
2949
SOIL DESCRIPTION
SOIL NAME. COLOR. MOISTURE CONTENT.RELATIVE DENSITY OR CONSISTENCY. SOILSTRUCTURE, MINERALOGY. USCS GROUPSYMBOL
Swm
Sim*
-
-
Sama
-
Sim* with SUghtfy Laat QavwL
-
Sama
SWIM
-
ENDQFBORMQ
11
SP
SP
SP
SP
SP
SP
SP
SP
COMMENTS
DEPTH OF CASING, DRILLING HATE.DRILLING FLUID LOSS. TESTSAND INSTRUMENTATION
-
'
-
-
Colactad a Sampta tor Grain-size •Analyst*.
-
HNu - 0 pom SS
-
HNu-OppmSS
™
-
Blow CoumtOafact a Full Spoon. -Not tha Formation. Maplacad
Gnin-tizt Samplt.HNu m 0.2 pom on Cuttings 4ft of -Blow tn into Auywn, CouU only
l.««aaO,F1JO QB-O* 2 7/21/M

GB-05 SHEET 1 OF 2
SOIL BORING LOG
PROJECT ONALASKA WEST EDGE OF ACKERMAN PROPERTY
ELEVATION ___ _^_
DRILNG METHOD AND EQUIPMENT * 1/4* AUGERS
WATER LEVEL AND DATE
DRLUNQ CONTRACTOR _§IL
3-20-68 P>.«M 3-20-89 LQOQPP D. PLOMB
DE
PTH
SE
LOW
SU
RFA
CE
(FT)
5-
10 -
15-
20-
25 -
30
SAMPLE
(
zzzzz7
TYP
E A
ND
NU
MBE
R
ssr
SS2
SS3
SS4
SS5
SS*
£
Oi""*UJ ™
1.1
1.0
2.0
2.0
1.S
-
STANDARDPENETRATION
TESTRESULTS
r-r-r(N)
4-T-2-2
2-2-2-2
««
24-29-7
14-24-26-23
2343-27-19
SOIL DESCRIPTION
SO*. NAME, COLOR, MOISTURE CONTENT.RELATIVE DENSITY OR CONSISTENCY. SOISTRUCTURE. MMERALOGY, USCS GROUPSYMBOL
Oar* arown firw Coama Sand, twin * //Ma SiltLOOM, and Dry.Oar* Brown Afcdum (o Coana Sand. LOOM, andSab/wad.
Sama
Sam
LarpaGraW
— :
Sama, our Vay Canat
li
stv
SP
SP
SP
SP
SP
SP
COMMENTS
DEPTH OF CASMQ. ORU.INQ RATE.DRLUNQ FLUO LOSS. TESTSAND INSTRUMENTATION
HNu m 0 ppm on BoranoMiHMu.OppmSS
HNu m 0 ppm on Sorvno/aHNu.OppmSS
HNu • 0 ppm on SoranotoHNu -0 ppm S3
HHumO ppmonBonhotfHNumOppmSS
HNu m 0 pom on Bonho*HNu.OppmSS
-
unnnnri rnnim i n?-ai

^s^™PQTL.FCT ONALASKA
PIPVATION
DPII 1 INft UCTWOO AND EQUIPMENT
WATFR 1 PVFl AND QATP
PHOJCCT NUMICH BOJUNQ NUMBER
GLOMSSO.Fl.Fa GB-OS SHEET 2 OF 2
SOIL BORING LOG
IDCATION
DHMJJNG COWTRACTOB
STAPT FINISH 3-20-89 LQGGEB D. PLOMB
1
40-
50 -
60 -
70 -
80
JMM.F1
SAMPLE
INTE
RV
AL
~z.
z
z
z
^
FQQB4I
II
SS7
SS8
SS9
SS70
SSJt
Ie
0.4
NoSample
0.4
0.3
1.5
STANDARD
TESTRESULTS
r-r-r(N)
11-11-7-7
9-27-2947
19-36-3S-12
45-19-22-13
56-27-27-4
SOLDESCMPTION
SON. NAMEjCOLOR, MOISTURE CONTENT.RELATIVE DENSITY OR CONSISTENCY, SOLSTRUCTURE. MMERALOGY, USCS GROUPSYMBOL
Same
Same
Same
Gravel Content.
ENOOFBORMQ
!§
SP
SP
SP
SP
COMMENTS
DEPTH OF CASING. DRILLING RATE.DRILLING FLUID LOSS. TESTSAND INSTRUMENTATION
HNu m 0 ppm on BoreholeHNu-OppmSS
HNu m 0 ppm on Borehole
HNu - 0 ppm on BoreholeHNumOppmSS
HNu - 0 ppm on BoreholeHNumOppmSS
HNu m 0 ppm on BoreholeHNu - 0 ppm SS
-
27/34W . . . .

SB^™PROJECT ONALASKA
ELEVATION
DPI 1 (MR l THOn ANO POLIIPUFNT * 1/<" AUGI
WATFB 1 PVR ANO nATP
PROJICT MUMBm BORING NUMNER
GLO6S580.F1^Q G8-M SHEET 1 OF 3
SOIL BORING LOG
mcATON ENTRANCE TO ACKERMANS
DRLLMG CQ»m»ACTnfl ETI
ERS
STAPT 3-19-OT FINISH 3-19-89 i QGQEH D. PLOMB
DE
PTH
BE
LOW
SU
RFA
CE
(FT)
5 -
10 -
15 -
20 -
25.
30U6MOF1
SAUPLI
|
zzzzzz
TYP
E A
ND
NU
MBE
R
ssr
SS2
SS3
SS4
SS5
SS9
RE
CO
VE
RY
(FT)
f.S
0.9
0.4
1.8
1.1
t*9—
STANDARDPENETRATION
TfSTRESULTSr-r-r
(N)
2-2-3J
2-3-3-5
£4-5-5
104*4-3
18-17-12-5
-10-10-12-8
SOIL DESCRIPTION
SOIL NAME. COLOR. MOISTURE CONTENT.RELATIVE DENSITY OR CONSISTENCY. SOLSTRUCTURE, MMERALOGY. USCS GROUPSYMBOL
n*«* a CM* *n fnmrmm CM*H \AMttt m ItHim Oifr
Dry arid LOOM.
0** anmn Mrium fo Com S*ndl Momtand -LOOM
Sim*
Smafk>Mta**n<3wrt.
SMW
Svrw
i§
sw
SP
SP
SP
SP
SP
COMMENTS
DEPTH OF CASING. DRILLING RATE.DRLLING FLUID LOSS, TESTSAND INSTRUMENTATION
HNu m 0 ppm on BonhobHNu-OppmSS
HNu m 0 ppm on BonhobHNu -0 ppm S3
HNu • 0 ppm on BonbobHNumOpomSS
HNu m 0 ppm on BonnolfHNumOppmSS
HNu • 0 ppm on BonholtHNu-OpomSS
HNu m 0 ppm on Bonno*HNumOppmSS
raOS-Mlt-17-M

• B••"PBOJFCT ONALASKA
Fl FVATKVJ
nPM 1 IMft UPTHOn AND FOUIPMFNT
W4TFB 1 FVPL AND DATE
PROJECT NUMBER BORING NUMBER
GLOSS550.F1.FQ GB-06 SHEET 2 OF 3
SOIL BORING LOG
IQCAT1QN
ORILLMQ CONTRACTOR
START FINISH LOGGER 0. PLOMB
DE
PTH
BE
LOW
SU
RFA
CE
(FT)
35-
40-
45 -
50 -
55_
60
SAMPLE
MT
ER
VA
L
z
z
7
uaawiN
ON
V3dA
l
SS7
$58
SS9
RE
CO
VE
RY
(FT)
1.3
1.8
0
STANDARDPENETRATION
TESTRESULTS
r-r-c(N)
35-42-17-13
S1-98-80-4S
SOL DESCRIPTION
SOIL NAME COLOR MOISTURE CONTENTRELATIVE DENSITY OR CONSISTENCY, SOLSTRUCTURE. MMERALOGY. USCS GROUPSYMBOL
SWTM, with an OccMMruf Coco* or BouUtr,
-
SWTW, CoOOlff tf9 StiM Pffftntt MMy U9H99.
-
•
il
SP
SP
COMMENTS
DEPTH OF CASING, DRILLING RATE.DRILLING FLUID LOSS, TESTSAND INSTRUMENTATION
-
HNu * 0 pom on BonhokHNu.OppmSS
-
HNu • 0 pom on BonhoffHNu.OppmSS
-
HHumQ ppm on Bonholf

PROJK
GLO655U.Fl.ro
BORING NUMBER
GB-06 SHEET 3 Of 3
SOIL BORING LOG
PROJECT ONALASKA LOCATION.
ELEVATION. ORM.LMQ CONTRACTOR.
DRILLING METHOD AND EQUIPMENT.
WATER LEVEL AND DATE START. FINISH 3-19-69 LOGGER _D1PLOM§_
*_
hSUIn
65-
70 -
75 -
-
LMMOF1
!
I
z
7
TO OK*
SAMPLE
9BC
ml
SS10
SS11
37/20M
$
a£
0.5
2.0
STANDARDPENETRATION
TESTRESULTS
f-f-tT(N)
40-8O-10&3'
SOLDESCRIPHON
SOIL NAME. COLOR, MOISTURE CONTENT.RELATIVE DENSITY OR CONSISTENCY SOLSTRUCTURE. MMERALOGY, USCS GROUPSYMBOL
Stunt, VtryDtntf
Sanrn, CotMm and V§ry Dmt*.
ENOOFBORMQ
„
l§
SP
SP
COMMENTS
DEPTH OF CASING. DRILLING RATE,DRILLING FLUID LOSS TESTSAND INSTRUMENTATION
HNu m 0 ppm on BonhoteHNumOppmSS
HNu m 0 ppm on BonhobHNu-OppmSS
-

PROJECT NUMBER
GLO855M.F1.FO
BOflINO NUMBER
GB-07 SHEET 1 OF 3
SOIL BORING LOG
PROJECT ONALASKA LOCATION SOUTH OF SITE ENTRANCEDRIUNG CONTRACTOR ET1 (CML75)ELEVATION
DRILLING METHODAND EQUIPMENT HSA (4 1/2*) WITH SPLIT SPOON SAMPLING EVERY 2.5'
WATER LEVEL AND DATE STAHT 3-7-89 FINISH 3-7-89 LOGGER JAI
DEPT
H B
ELO
WSU
RFAC
E (F
T)
5-
10-
15 -
20-
25-
30LMMOF1
3AMPLI
MT
ER
VA
L
/
/z/z/p^^ l ^^
^M^ ^H
[/^^^^^ i
^^ t ^^m
/••M^B^M
^^^^^^m
y
FQOKJ7
TYPE
AND
NUM
BER
SS
SS
SS
SS
SS
SS
SS
SS
SS
SS
SS
17/2KM
RECO
VERY
(FT)
1.8
1.6
0.4
0.8
0.9
0.7
0.4
0.7
STANDARDPENETRATION
TESTRESULTS
r-r-r(N)
33-21-17-11
2-1-2-3
1-2-34
1-3-3-3
3*5-5
1-2-2-2
4-3-2-2
2-3-13-17
4-3-17-18
2-3-17-37
SOIL DESCRIPTION
SOIL NAME .COLOR, MOISTURE CONTENT.RELATIVE DENSITY OR CONSISTENCY. SOLSTRUCTURE. MMERALOGY. USCS GROUPSYMBOL
F**S*xiw*h»am9SitFin* to Cotnt Sand, Poorly Sorted withtomtGfmvtt
LOOM firw - CMVM S*nd with Tract GnvtlPoofly Softto
StmtmAbovt
MMfum S*nd wfft 7hK» Fine Sand and toirmCotntSand
NoRfoovtry (CttctmBrokt)
Mtdum Sand wr*» 7hM« Fin* Sand mnd sormCoamStnd
SfmtmAbov*
MoANOwy
Mfdtum - CMTM Sana
Ufdum - Coant Sand mM Tract Rna OHM?
No flMovwr (Catehar Bn*»)
K
SP
SP
SP
SP
SP
SP
SP
COMMENTS
DEPTH OF CASING. DRILLING RATE.DRLUNG FLUID LOSS, TESTSAND INSTRUMENTATION
FmtttofHNu - 0
LEL-0% It * 935)RAD- 0.05 (BKG)HNUmO
HNUmO
LEL-0%
LEL-0%HNu-OppmWH.~lr
TUt HjQ Svnp/t
HNumOppm

PROJECT NUMBER
GL.oas5M.Fi.raBORING NUMBER
GB-07 SHEET 2 OF 3
SOIL BORING LOG
PHCUECT ONALASKA LOCATION.
ELEVATION. ORLLINQ CONTRACTOfl.
DRILLING METHOD AND EQUIPMENT.
WATER LEVEL AND DATE START. FINISH. LOGGER JAI
*-.1•830
-
35-
-
40 -
-
45 -
-
50 -
-
55-
-
60LMMO.F1
!I/
/
y/%/z/yz/z• "-
~7/£
ZFOOa-07
SAMPLE
Q_
ISK|ss
ss
ss
ss
ss
ss
ss
ss
ss
ss
ss
ss
27/am
£
g£—
1.1
0.5
03
—
1.3
0.7
0.4
0.5
—
00
0.9
STANDARDPENETRATION
TESTRESULTS
r-r-r(N)
6-18-13-33
3-5-33
13-27-33
8-13-17
5-8-13
6-25-26
8-10-24
8-12-28
5-13-22
5-5-21
5-10-34
3-17-22
SOIL DESCRIPTION
SOIL NAME. COLOR, MOISTURE CONTENT.RELATIVE DENSITY OR CONSISTENCY SOLSTRUCTURE. MINERALOGY, USCS GROUPSYMBOL
No Recovery
MKSumStnd
M*Sum S*td »nd Mtttum Gnv* j
Firm-MtdiumGrmnl 0.3 1f
Mfdkun - Fine Sand
No HtGovtfy
Mtdum Smnd with totrm Cottm Sand andTrmcf fin* Gnvtl
M§dkm Sand wto tonm Fin* Grtvtl
StoyFimStnd
Mfdum - COOT* Sand with torn* Fir* Grmttl
Mtdkm-CotntSandwt^rnct^ntGnytl
NoRtoovmy
MMbmSmd 0.8 ,MMbm-nrwGrav« t /[
MMum - COM* Stnd wtfi «NIW firw Qn»4
o
!§
SP
SP
SP
SP
SP
SP
SP
SP
SP
SP
COMMENTS
DEPTH OF CASMG, DRILLING RATE.DRILLING FLUID LOSS TESTSAND INSTRUMENTATION
-
18' Drives
HNumOppm
-
HNumOppm
Hard DrilSng - Gnvafy
-
-
-
:-
-
-

PMOJECT NUHHJI BOMNO NUMBER
GB-07 SHEET 3 OF 3
SOIL BORING LOG
PROJECT ONALASKA LOCATION.
ELEVATION. ORMJ.NQ CONTRACTOR.
DRILING METHOD AND EQUIPMENT.
WATER LEVEL AND DATE START. FINISH 3-7-89 LOGGER. JAI
DE
PTH
BE
LOW
SU
RFA
CE
(FT
)
60
•
•
65-
_
•
70 -
LMMOF1
SAMPLE
(/z/z
TYP
E A
ND
NU
MBER
SS
SS
SS
SS
RE
CO
VE
RY
(FT)
0.5
0.8
1.5
31MHMU1W
PENETRATIONTEST
RESULTS
F-V-9-(N)
13-20-32
11-13-15
4-21-34
14-21-57
SOtLDMCMPTION
SOIL NAME, COLOR, MOISTURE CONTENT,RELATIVE DENSJTY OR CONSISTENCY. SOILSTRUCTURE. MMERALOGY. USCS GROUPSYMBOL
MMR/OT Stndwhh •ortw G»*ww(La»t OJf firw - COWM Sand twrt fmc»VAflmMfl &•«••• Ctffl
No Recovery
Mtdum to Com* S»nd with aomt Fin* Grantand Trmot Utdkjm GnnW
SflffWfll^OM
iiSP
SP
SP
COMMENTS
DEPTH OF CASING, DRILLING RATE.DRILLING FLUID LOSS, TESTSAND INSTRUMENTATION
-
FOOB4737/2M*

PRODUCT MMKH
GLO6S550.F1.FO
BORMO NUMBER
GB-06 SHEET 1 OF 2
SOIL BORING LOG
PROJECT ONALASKA LOCATION SE OF LANDFILL
ELEVATION. DRIOJNG CONTRACTOR ETI
DRILLING METHOD AND EQUIPMENT * V4' AUGERS
WATER LEVEL AND DATE STAHT 3-7-89 FINISH 3-6-69 LOGGER. KLO
*_.
«-5
-
5 -
-
10 -
-
15 -
-
20 -
25 -
30LMM&F1
i
i
7z7</_Vz7/
7fQOMt
IAMPLI
a1$si
ssr
SS2
SS3
SS4
SS5
SS6
SS7
SS8
SS8
1*17-M
g
st
1.5
r.5
0.0
r.o
0.6
1.0
1.0
0.8
1.3
—
STANDARDPENETRATION
TMTRESULTS
f-f-f(N)
32-18-20
3-5-6
2-2-2
15-4-S
7-4-S
12-12-5
3-3-4
2-2-2-2
12-19-17
SOIL DESCRIPTION
SOL NAME, COLOR. MOISTURE CONTENT.RELATIVE DENSITY OR CONSISTENCY SOLSTRUCTURE. MMERALOGY. USCS GROUPSYMBOL
M»dkjmtoCotfMS»f>dwrthTr»c»Gf»v9l. Moot.Cotorm7.S VH ** LOOM Bftow FrogOint, Mostly 'Quwtr Mf tfi rttbht and Parietal of Granite,MtgntHtt. tte., and Glacial Ouiwash.
THnl-yRnf Sand WUi Sit. rneaGnvtl. DarkRaddmti Brown, Color .7.5 YR 3/4, Moiat
-
Madkm to Coana Sand, at abova, but Gating\tltml^tnvnVf.
-
Madkm Sand, Tnoa Geaval. Mont
MMbm to Coana Sand. Traca Graval,Cofor-7.5VR4*
San*,butSaluralad.
Warn* Samplad for CSL2S to 2811. w*h Wai point -
SarmUot MaofumSandwtoaomaCoaraa.
„
1§
SP
aw
SP
SP
COMMENTS
DEPTH OF CASING. DRILLING RATE.DRILLING FLUID LOSS TESTSAND INSTRUMENTATION
Fnat Down to 2 ft
-
HNu - 0 pom on Bcrahole
-
-
-
QUA » 0 ppm on Borahota
^Cotaciada Grain-tiza Samp/a.
QUA m 0 pom on BcnMa
BHndDriHto29IL
QUA • 0 ppm on Purga Watar.

PROJECT NUHMH
GLOS5SM.Fl.ra
•ORMO NUUSiR
OB-OS SHEET 2 OF 2
SOIL BORING LOG
PROJECT ONAUASKA LOCATION.
ELEVATION
DfllLING METHOD AND EQUIPMENT.
WATER LEVEL AND DATE
DRILUNQ CONTRACTOR.
START. PMISH 3-0-69 LOGGER _KLO_
ftil
-
35 -
;40 -
-
-
45 -
-
50 -
SBBTr
SAMPLE
|
z7Z7/
<L—
7Z—7/
WZi
^1tl
SS10
SS11
I SS12
SS13
ssu
SS15
SS16
SS17
5
LtlP^Pl' U
7.0
1.0
"
,.,
2.0
J.3
0
2.0
STANDARD
TESTRESULTS
tr-r-r
11-8-8
10-10-12
12-1S-10
2046-42
7-29-29
12-19-10
75- 7*4
12-15-18
SOL DESCRIPTION
SON. NAME. COLOR. MOISTURE CONTENT.RELATIVE DENSITY OR CONSISTENCY. SOLSTRUCTURE. MMERALOQY. USCS GROUPSYMBOL
StUT*
SM ;Some
SttTM
-
SWM, but /Md * 2* Submundtd Gnvtl SMTH(Una 3/41 in Bottom of Spoon
SMW-
A*,*^ '
-
Sam.
-
ENDOFBORMQ
1II
COMMENTS
DEPTH OF CASNQ. DR1LINQ RATE.DRLUNQ FLUO LOSS. TESTSAND WSTRUMENTATON
OVAmOppmonBonhob
•
-
;;---
OVA mOppmonBonholu-
•
CoMtcmta Gain-tin Sampfe
-
DfwtStndpointtoSBIlandCoftclvdc CSL Wtttf 3tin>lt.
-
2^i74f - - — - -

Attachment 2GRAIN-SIZE ANALYSES
GLT913/014.50-2

Is
GRAIN SIZE DISTRIBUTION TEST REPORT
100
90
0209 100 10.0 1.0
GRAIN SIZE0.1 .01 .001
- mm
Symbol '/. GRAVEL y. SAND y. SILT y. CLAY0.0 3.5 . 1 0.4
LL PI0.73 0.54 0.52 0.449 0.3870 0.3S89 1.01 1.5
MATERIAL DESCRIPTION usesBrown Fine-Medium SAND, Trace Gravel SP
Project No.: 13410.11Project: ONALASKA LANDFILLO S»wpl«: BORING: GB-l 9 78-80 FT
D*t»: 83-23-89
Remarks:
TESTED BY: DWA^RWPENTERED BY: MMLCHECKED BY:APPROVED BY
0RAIN SIZE DISTRIBUTION TEST REPORT
WARZYN ENGINEERING INC. Sheet No.
WArtZYN

c«NL
£
0L0
106
90
98
78
£ 68•*L
58j
5 40L
38
28
10
026
Symbolo
o
GRAIN SIZE DISTRIBUTION TEST REPORT* 4 4 4 c*«r** . N*«ttt* rin*
* * * - * • * ? - A » 1 « l_ ~ i _ ^ ;; 5 x s 5 xi s 8
:
n0-!-.
' | i
: i
| •
i i
>•^ Illl1 ri
V
1
1
r
\
<i
^
18 188 18.8 1.8 8.1 .01 .081GRAIN SIZE - nun
X+3-8.8
X GRAVEL5.2
y. SAND92.8
X SILT X CLAY2.9
LL—
PI—
DBS8.97 6
D6ei.«i
D5e8.55
»388.457
Dl58.3741
Die8. 3221 1
MATERIAL DESCRIPTION
o Brown Fin*-Co*rs« SAND* Little 9r»v»l,
Project No.: 13418.11Project: ONALASKA LANDFILL0 Sampl*: BORING: 6B3 SAMPLE: 2 9 39-41
D»t»: 83-14-69
TPJLC* Silt l> Cl»g
FT
8RAIN SIZE DISTRIBUTION TEST REPORT
WARZYN ENGINEERING INC.
Cc
.87Cu
1.9
usesSP
Rwurks:
TESTED BY: DWAxRWP
ENTERED BY: MML
CHECKED BY: jQooA-APPROVED BY:LXJ^
3h**t No.
WUCZYN

I*•u1-C0Lla
100
90
80
70
5 604
; 50a
[3 40L.
30
20
10
026
Symbolo
o
GRAIN SIZE DISTRIBUTION TEST REPORT* £ i i £•**»*• n»4tu» Flrw
: ^: f I f s x s 5 r i 2 !^s .
: '1
1s :
\ :
L :
V
N; \
1 Al 1 •
V>
-10 100 10.0 1.0 0.1 .01 .001
GRAIN SIZE - mm
%+Z"0.0
'/. GRAVEL16.6
X SAND79.5
y. SILT X CLAY3.9
LL
—
PI Des5.07
D601.74
D501.14
°300.696
i I i
Dl50.4694
Die0.3686 0
1MATERIAL DESCRIPTION
O Brown Fin*-Co»rs* SAND, Som* Gr»v«l, True* Silt Si Cl»v
Project No.: 13410. 11Project: ONALASKA LANDFILL0 Sample: BORING: 6B3 SAMPLE: 1 9 22-24 FT
D»t«: 03-14-87
8RAIN SIZE DISTRIBUTION TEST REPORT
WARZVN ENGINEERING INC.
cc.76
Cu4.7
usesSP
R«n»*rk»:
TESTED BY: DWAx-RWP
ENTERED BY: MML
CHECKED BY: CjU-1^
APPROVED BY:(/j(
Sh«*t No.
WAJIZYN
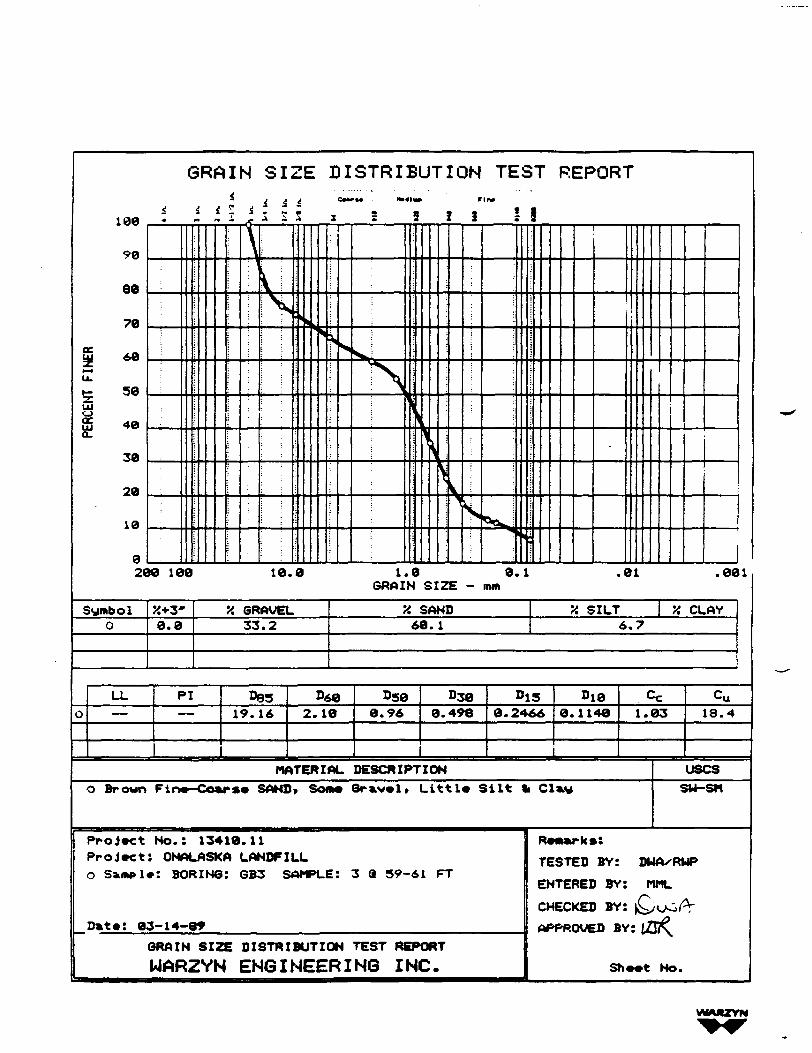
sd^utSc8
100
99
88
78
^ 68^
58
g 48
38
28
10
a2C
Symbol0
o
GRAIN SIZE DISTRIBUTION TEST REPORT
3 ^ d ^ C*t»«* N»«| rirtf
i ^ i ~ i ; : ; . , .. * t. „ ^ ^_ A i 5 x : 5 13 ss
: : :
: : :
yk \
SV^^
N!
vk*»0^^
• ' •
\
-
10 188 18.8 1.8 8.1 .81 .081GRAIN SIZE - mm
K+3-8.8
'/. GRAVEL33.2
y. SAND68.1
y. SILT y. CLAY6.7
LL—
PI—
D8519.16
D*e2.18
Dse0.96
D3e8.498
Dl58.2466
Die8.1148 1
MATERIAL DESCRIPTION
0 Brown Fin»-Co*r*« SAND, Son* 3r»v»l, Littl* Silt fc Cl&v
Project No.: 13418.11Project: ONALASKA LANDFILL0 S»mpl»: BORING: GB3 SAMPLE: 3 <J 59-61 FT
D»t»: 83-14-89
GRAIN SIZE DISTRIBUTION TEST REPORT
UARZYN ENGINEERING INC.
Cc
.83Cu
18.4
usesSU-SM
R*Mu»k»:
TESTED BY: DWAxRWP
ENTERED BY: MML
CHECKED BY: >QvX»(°r
APPROVED BY: l£j?^
Sh**t No.
WMUIZYN

0iHLltL
cI
100
90
80
70
5 60•«
E 50
Ll
5 40L.
30
20
10
0
26
Symbol0
o
GRAIN SIZE DISTRIBUTION TEST REPORT- t 4 i OMFft* . *•«*«• VIA*
- i i ? i : .: ; T . . . , « i. - ^ _ _ ^ z : 9 11 s 8
; i :
•% AS
1
A!] \i \i i ;11i;1 ;
!V
r<.°<»-.,f
10 100 10.0 1.0 0.1 .01 .001GRAIN SIZE - mm
8+3*0.0
X GRAVEL4.0
•/. SAND93.0
% SILT X CLAY0.9
LL—
PI
—D83
1.64°60
B. 83DSO
0.72030
0.343Dl3
0.4293Die
0.3784 0cc.94
MATERIAL DESCRIPTION
O Brown Fin»-Co»r«» SAND, Trace Oravel It Silt It Claw
Project No. : 13410.11Project: ONALASKA LANDFILL0 Sample: BORING: GB4 SAMPLE: 1 a 13-13 FT
D*te: 03-14-89
3RAIN SIZE DISTRIBUTION TEST REPORT
WARZYN ENGINEERING INC.
Cu2.2
usesSP
R«m«rks:
TESTED BY: DMAxRWP
ENTERED BY: MML
CHECKED BY: ]Q,ooPr
APPROVED BY: u£)t .
Sheet No.
MMRZVN

ctH
u£
I
0
ij
180
98
88
78
J 68*L
1
g 40L
30
28
10
02C
Symbolo
o
GRAIN SIZE DISTRIBUTION TEST REPORT
i i 1 11 i l_ 1 .""" i ~7 i i"~ 1 1
! I
; !
i j
^~>;t1\
\!
fr •
>0 188 18.8 1.8 8.1GRAIN SIZE - mm
%+Z"8.8
y. 8RAVEL2.3
y. SAND93.7
.81 .881
X SILT Y. CLAY2.8
LL
—
PI
—083
8.98&68
8.59DSO
8.53
I>38
8.438°13
8.3431Die
8.3841Cc
1.83
MATERIAL DESCRIPTION
o Brown Fine-Coarse SAND* Trace Sravel It Silt ti Clay
Project No.: 13418.11Project: ONALASKA LANDFILL
0 Simple: SAMPLE: QB4 SAMPLE: 2 0 38-48 FT
Date: 83-14-89
3RAIN SIZE DISTRIBUTION TEST REPORT
WARZYN ENGINEERING INC.
Cu
1.9
usesSP
TESTED BY: DMAxRMP
ENTERED BY: MML
CHECKED BY: jQoo/^APPROVED BY: 10^
Sheet No.
WAJtZYN

GRAIN SIZ
£ - _ _ . { . £
0t^LhLcuQ
90
90
70
cLf 60
*L.
5Ei 40L
30
20
10
026
SymbolO
o
E DISTRIBUTION TEST REPORTCMTM NMIM : rin*
x ' 9 2 3 ' !«s
^NI ^J1
1I1;1r
o*v^_i
10 100 10.0 1.0 0.1 .01 .001
GRAIN SIZE - mm
'/.+Z" j0.0
'/. GRAVEL2.5
^ SAND92.5
X SILT y. CLAY5.0
LL—
PI—
D830.91
0600.57
D50
0.51I>30
0.400DIS
0.2951
Die
0. 2239 1
t |
MATERIAL DESCRIPTION
o Brown Fine-Coar»e SANDt Trace Gravel fc Silt fc Claw
Project No.: 13410.11Project: ONALASKA LANDFILL
0 Sample: BORING: GB4 SAMPLE: 3 9 53-57 FT
Date: 03-14-99
GRAIN SIZE DISTRIBUTION TEST REPORT
WARZYN ENGINEERING INC.
cc.26
Ca
2.5
usesSP
TESTED BY: DWAxRWP
ENTERED BY: MML
CHECKED BY: J^XoA
APPROVED BY: vG?3,
Sheet No.
VWAftZYN

GRAIN SIZE DISTRIBUTION TEST REPORT
100
0208 188 10.0 1.8 0.1
GRAIN SIZE - m*.001
Symbol X+Z* X GRAVEL '/. SAND SILT V. CLAY0.0 0.0 97.1 2.9
LL PI Dgg D^0 Dj0 D30 DJJ DIQ Cc Cu
0 — — 0.73 0.54 0.49 0.408 0.3203 0.2726 1.13 2.0
MATERIAL DESCRIPTION USCS
o Brown Fine-Median SAND, Trace Silt & Clay SP
Project No.: 13410.11Project: ONALASKA LANDFILL0 Simple: BORING: GB-5 9 78-80 FT
D*te: 03-23-89
I 8RAIN SIZE DISTRIBUTION TEST REPORT
WARZYN ENGINEERING INC.
Remarks:
TESTED BY: DUA
ENTERED BY: MML
CHECKED BY: (CbJAAPPROVED BY: lOf
Sheet No.
WARZYN

oI^uKiucua
100
79
88
78
\ 68•4
E 50a!J 48L
38
28
18
e2C
Symb o 1o
0
GRAIN SIZE DISTRIBUTION TEST REPORT4 ^ ^ C***«« M»«iua Fir«
f * 11 i l i i x = 811 18
N\\ k
^ V :-^^:^V
: "V
i
NN
N'O'O i,, C
18 188 18.8 1.8 8.1 .81 .881GRAIN SIZE - mm
%+3"8.8
'4 GRAVEL16.4
X SAND88.9
Y. SILT y. CLAY2.7
LL—
PI—
DBS5.25
D«e1.14
Dse8.89
0388.608
Dl50.4385
I
D10
0.3698 0
1
MATERIAL DESCRIPTION
O Brown Fine-Cours* SAND, So«« 8r*v»l, True* Silt It Cl»w
Project No.: 13418.11Project: ONALASKA LANDFILL0 Sample: BORING: 6B8 SAMPLE: 8 8 18.5-20.5 FT
Out*: 83-14-69
GRAIN SIZE DISTRIBUTION TEST REPORT
WARZYN ENGINEERING INC.
Cc
.85Cu
3. 1
usesSP
R«M*rk»:
TESTED BY: DWA^RWP
ENTERED BY: MML
CHECKED BY: )Q<_Or\
APPROVED BY: Vti^
Sh**t No.
WMRZYN

IN
L
1-
186
90
80
70
u 60•*L.
ZLU
S 400L
30
20
10
026
SymbolO
o
GRAIN SIZE DISTRIBUTION TEST REPORT4 £ i C*ar«* rtotfiM Pin*
- * * * * 1 * * , - 8 T? » 1. _ ^ i _ ^. 5 x s 8 si : 8
: '. T
: : |
^sSi
i\Si
VU!V11:1
\
'
10 100 10.0 1.0 0.1 .01 .001
GRAIN SIZE - mm
X+3*0.0
'/. GRAVEL2.4
y. SAND93.6
Ji SILT '/. CLAY4.0
LL
—
PI—
DBS1.27
D60
0.3>DSO
0.52D3e
0.412BIS
0.3190
Die0.2712 1
MATERIAL DESCRIPTION
O Brown Fine- Coarse SAND* Trace Gravel It Silt fc Claw
Project No.: 13410.11Project: ONALASKA LANDFILL0 Sample: BORING: GB8 SAMPLE: 17 9 48-49.3 FT
Date: 03-14-89
GRAIN SIZE DISTRIBUTION TEST REPORT
WARZYN ENGINEERING INC.
cc.06
cu2.2
usesSP
TESTED BY: DMAxRMP
ENTERED BY: MML
CHECKED .'Y: J )uoA:
APPROVED _Y: t£jT^^
She-t Mo.
MMIOYN

GRAIN SIZE DISTRIBUTION TEST REPORT
100
288 188 18.8 1.8 8.1GRAIN SIZE - mm
.881
Symbol '/. GRAVEL y. SAND '/. SILT '/. CLAYa.a 1.9 97.7 8.4
LL PI
1.33 8.73 8.63 8.491 8.3936 8.3588 8.94 2. 1
MATERIAL DESCRIPTION usesO Brown Fln*-Co%rs* SAND, Trace Gr»v»l SP
Project No.: 13418.11Project: ONALASKA LANDFILL
O Sample: BORING: J*t-l 9 20-22 FT
Date: 03-23-99
GRAIN SIZE DISTRIBUTION TEST REPORT
WARZYN ENGINEERING INC.
Remarks:
TESTED BY: DWA/RWP
ENTERED BY: MML
CHECKED BY: OoJAAPPROVED BY:(£j'P
Sheet No.
WARZYN

GRAIN SIZE DISTRIBUTION TEST REPORT
i 1 i S100
90
80
70
£ 60
u.
5 ^Ul
S 40a.
30
20
10
0
! I
200 100 10.0 1.0 0.1GRAIN SIZE - mm
.01 .001
Symbol GRAVEL Y. SAND SILT X CLAY0.0 0.8 97.3 2.7
LL PI D83 D30 -u0.68 0.49 0.43 0.331 0.2111 0.1618 1.39 3.0
MATERIAL DESCRIPTION usesO Brown Flrw-ttodium SAND, Tr*c» Silt fc Cl*v SP
Project No.: 13410.11Project: ONALASKA LANDFILLO Sampl»: BOftINQ: NW-1M $ 53-55 FT
D*t»; 03-23-99
GRAIN SIZE DISTRIBUTION TEST REPORT
WAR2YN ENGINEERING INC.
Remrks:TESTED BY: DMAxRMP
ENTERED BY: MML
CHECKED BY:
APPROVED BV
Sh**t No.
WARZYN

GRAIN SIZE DISTRIBUTION TEST REPORT
0200 100 10.0 1.0
GRAIN SIZE0.1 .901
— mm
Symbol X+X" GRAVEL '/. SAND y. SILT y. CLAY0.0 8.1 90.6 1.3
LL PI D83 DS00.94 0.57 0.51 0.427 0.3536 0.3221 1.00 1.8
MATERIAL DESCRIPTION usesO Brown Fine— Coarse SAND, Little Gravel, Trace Silt & Clay SP
Project No.: 134:0.11Project: ONALASKA LANDFILLo sample: "BORING: MW-IM o 78-eo FT
Date: 03-23-89
GRAIN SIZE DISTRIBUTION TEST REPORT
WARZYN ENGINEERING INC.
Remarks:
TESTED BY: DUA^RWP
ENTERED BY: MML
CHECKED BY:
APPROVED BY:
Sheet No.
WARZYN

GRAIN SIZE DISTRIBUTION TEST REPORT
199
uioS
288 188
SymbolO
2+3"8.8
LL
o —PI
—
18.8
y. GRAVEL7.9
D83 D2.99 8.7
1.8 8.1 .81 .001GRAIN SIZE - mm
'/. SAND98.5
y. SILT y. CLAY1.6
68 °58»9 8.64
039
8.491
MATERIAL DESCRIPTION
O Brown Fine— Coarse SANDi Little Gravel » Trace
Project No.: 13418.11Project: ONALASKA LANDFILL
0 Sample: BORING: MW-7 0 80-82
Date: 83-23-89
FT
DIS D10 Cc Cu
8.3945 8.3544 0.86 2.2 ]
usesSilt Si Claw SP
[ GRAIN SIZE DISTRIBUTION TEST REPORT
| WARZYN ENGINEERING INC.
Remarks:
TESTED BY: DUAxRWP
ENTERED BY: MML
CHECKED BY: \O<x/Y^APPROVED BY: uCj??,
Sheet No.
r'
WAMZYN

GRAIN SIZE DISTRIBUTION TEST REPORTi 4
OC
»—•U.
ccUJa.
100
90
80
70
60
50
40
30
10
0
|i::
200 100
SymbolO
y.+z"0.0
'•
\
10.0 1.0GRAIN SIZE
'/. GRAVEL
5.0
LL
O —
PI—
D851.15
^
0.1— mm
y. SAND91.8
1
.01
y. SILT
.001
y. CLAY3.2
D*0 BSO0.70 0.41
D300.471
Dl50.333.
Die2 0.2838
cc1.11
MATERIAL DESCRIPTION
O Brown Fine— Coarse SAND, Trace Gravel & Si It 8. Claw
Project No.: 13410.11Project: ON ALASKA LANDFILL0 Sample: BORING: MW-7M 9 30-32 FT
Date: 03-23-89
(
i
GRAIN SIZE DISTRIBUTION TEST REPORT
WARZYN ENGINEERING INC.
C.JL
2.5
usesSP
Remarks:
TESTED BY: DWA/RWP
ENTERED BY: MML
DECKED BY: OoJ'AAPPROVED BY: l Ji
Sheet No.

GRAIN SIZE DISTRIBUTION TEST REPORT
100
200 100 10.0 1.0GRAIN SIZE
.01 .801
Symbol GRAVEL X SAND '/. SILT CLAY0.0 2.2 93.2 2.6
LL PI »851.07 0.73 0.64 0.501 0.3890 0.3273 1.05 2.2
MATERIAL DESCRIPTION uses'Brown Fine-Medium SAND, Trace Gravel & Silt & Clay SP
Project No.: 13410.11Project: ONALASKA LANDFILLO Sampl*: BORDJB: MW-35 • 18-20. FT
D»t»: 03-23-89
GRAIN SIZE DISTRIBUTION TEST REPORT
WARZYN ENGINEERING INC.
TESTED BY: DWAxRUP
ENTERED BY:. MMLCHECKED BY:APPROVED BY
Sh»«t No.
WMftZYN

Attachment 3GROUNDWATER MONITORING WELL
AS-BUILT CONSTRUCTION DATA
GLT913/014.50-3

WSIALUOiV
DATE.
MUMS
HIM
Wit
rpve
ess
HI*
UU
U7J
IMMM
»M»
Ml*
rrvc
»•>»
Ml*
IMJ
H»
MW-2S
H4-M
MU
rM
CSS
MI*
*ni
•MI
HW-2M
H4-M
Ml*
ru
•SET
«••
KM
MW-2D
1-IIM
Mil
ru
Cl»«llOw
"ET'
to.r
Uit
ior
MW-3S
HIM
U>7
rsi
ZSSi
«•;
Ul.>
Mil
MM-3M
»»M
*U<
ru
*ssr
WI<
»>»*im
MW-30
>3*M
tut
ru
»"»
uo«
SMI
ill t
111 u
y>*M
MU
rsi
Cmtmti
*4*l
Utl
i»l
MM-SS
>I*M
M*4
ru
CMJM)
•474
«W4
•144
MW-4M
»M
t4t*
rpvc
•MM>»w»
M;O
1M«
Mil
yw-Tii
>I»M
Mtl
rrvc
"•ST
IMJ
Mil
H»
uw-ts
lltM
MI4
rwc
Oi».«-
t**4
Utl
U§4
MW-MI
1I»M
M*4
rfvc
»-i
•M4
Utl
Ul 4
MM-M)
J»M
tMJ
rrvc
• t
t74i
Uil
UI2
MW-MI
1JIM
Mil
rrvc
*»sr
Ml
tTtl
S71I
MM-10U
12IM
Mil
rwc
*«5r
Mil
&7&S
ina
UW-11M
>22M
•641
rwc
*5ST
SMI
MO 7
5/4 J
UW-12S
) W M
Mt,
rrvc
Q*Mm»w
Ml 2
»)'«
U/2
MW-13S
3 ZfrH
Ml •
rf*vc
Cfa-m^*
•Ml
utz
«MI
UW-14
3»»
•MJ
rss
Qrt^Jar
•ta.
*»•
Utl
WELL CONSTRUCTION DETAILSOMALASKAM

Attachment 4SLUG TEST PLOTSAND ANALYSES
GLT913/014.50-4

LULU
ONflLflSKR LflNDFILLMW-1STEST 1
O_
0,0 25.0
K CCM/SJ « O.CW55UO
HELL SPECS. (FEET)
SCREEN LENGTH -5.8
WELL SCREEN/BORE RROIUS • 0.08
HELL CRSING RADIUS - 0.08
RQUIFER THICKNESS - 130.0
H (FEET) - 5.8U
COEFFICIENTS
fl - 3.57
B - 0.60
C - 0.00
T-INTERCEPT - 1.79
SLOPE - -0.3939

LU
QNflLflSKfl LflNDFILLMW-1STEST 2
0,0 15.0(SECS)
20.0 25.0
K (CM/S) - 0.0112155
HELL SPECS. (FEED
SCREEN LENGTH -5.8
WELL SCREEN/BORE RflDIUS - 0,08
HELL CflSING RADIUS • 0.08
RQUIFER THICKNESS - 130,0
H (FEET) » 5.8U
COEFFICIENTS
fl - 3.57
B - 0.60
C - 0.00
T-INTERCEPT - 2.64
SLOPE - -0.36H7

LU
CNRLflSKfl LflNDFILLMW-1STEST 3
0,0 16,0 24,0TIME (SECS)
K (CM/S) - 0.036110
WELL SPECS. (FEET)
SCREEN LENGTH - 5.8
WELL SCREEN/BORE RflDIUS - 0,08
HELL CASING RflOIUS • 0.08
HQUIFER THICKNESS - 130.0
H (FEET) - 5.811
COEFFICIENTS
fl - 3.57
B - 0.60
C * 0.00
Y-INTERCEPT - 4.06
SLOPE - -0.3124

0NRLRSKR LRNDFILLMW-1MTEST 1
r--
\f>-
cn-
cg-
0,8 1.6 2,UTIME (SECS)
3.2 14.0
K (CM/5) - 0.036630
HELL SPECS. (FEET)
SCREEN LENGTH - 10.0
HELL SCREEN/BORE RftDIUS - 0,08
HELL CRSING RROIUS • 0.08
RQUIFER THICKNESS - 130.0
H (FEET) - 55.60
COEFFICIENTS
fl - 14.76
B - 0.82
C » 0,00
Y-INTERCEPT - 29.41
SLOPE - -0.3756

QNRLRSKR LflNDFILLMW-1MTEST 2
0,0 1,0 1,5TIME (SECS)
2,0 2.5
K (CM/S) - 0.0393914
HELL SPECS. (FEET)
SCREEN LENGTH » 10.0
WELL SCREEN/BORE RflDIUS - 0.08
HELL CflSING RADIUS • 0.08
RQUIFER THICKNESS - 130.0
H (FEET) - 55.60
COEFFICIENTS
fi - 1.76
B * 0.82
C * 0.00
Y-INTERCEPT - 17.52
SLOPE - -0.4040

ONflLflSKfl LflNDFILLMW-1MTEST 3
0,0 0,5 1,0 1,5TIME (SECS)
2,0
K (CM/S) -0.032188
HELL SPECS. (FEET)
SCREEN LENGTH » 10.0
WELL SCREEN/BORE RflDIUS - 0,08
HELL CRSING RflOIUS - 0.08
HQUIFER THICKNESS - 130,0
H (FEET) - 55.60
COEFFICIENTS
R - 4.76
B * 0.82
C - 0,00
Y-INTERCEPT - 18.06
SLOPE - -0.3301

ONRLflSKfl LflNDFILLMH-2MTEST 1
O _
oo H
coH
c\H
°0
0.0 0.5 1.0 1.5TIME (SECS)
2.0 2.5
K (CM/S) - 0.035767
HELL SPECS. (FEET)
SCREEN LENGTH - 10.0
WELL SCREEN/BORE RflOIUS - 0.08
HELL CRSING RflOIUS - 0.08
flQUIFER THICKNESS - 130.0
H (FEET) « 55.60
COEFFICIENTS
fl - 14.76
B • 0.82
C - 0.00
T-INTERCEPT - 15.76
SLOPE - -0.3668

QNflLflSKfl LflNDFILLMN-2M
0,0 1.0 1,5TIME (SECS)
2.0 2.5
K (CM/S) • 0.032852
WELL SPECS. (FEET)
SCREEN LENGTH - 10.0
WELL SCREEN/BORE RflDIUS - 0.08
HELL CRSING RflDIUS « 0.08
flQUIFER THICKNESS - 130,0
H (FEET) - 55.60
COEFFICIENTS
fl - 4.76
B • 0.82
C - 0.00
T-INTERCEPT - 15.38
SLOPE - -0.3369

QNflLflSKfl LflNDFILLMH-2MTEST 3
O _
OT-
00-
03-
in-
— CO-
>-
CM-
°0
0.0 0.5 1.0 1.5TIME (SECS)
2.0 2.5
K (CM/S) - 0.03UH97
HELL SPECS. (FEET)
SCREEN LENGTH • 10.0
HELL SCREEN/BORE RflDIUS -0.08
HELL CflSING RflOIUS « 0.08
flQUIFER THICKNESS - 130.0
H (FEED - 55.60
COEFFICIENTS
fl - U.76
B - 0.82
C - 0.00
T-INTERCEPT - 15.26
SLOPE - -0.3537

>-
QNflLflSKfl LflNDFILLMN-2DTEST 1
(Mo _
00-r^-03-
LO-
cn-
(M-
LU O
00-
oO
0,0 0,8 1,6 2.4TIME (SECS)
3.2 14,0
K (CM/S) - 0.030967
HELL SPECS. (FEET)
SCREEN LENGTH • 10.0
WELL SCREEN/BORE RflOIUS - 0.08
HELL CASING RflOIUS - 0.08
flQUIFER THICKNESS - 130.0
H (FEET! - 116.80
COEFFICIENTS
R » 0.00
B • 0.00
C - 1.74
T-INTERCEPT - 19.06
SLOPE - -0,2132

QNflLflSKfl LflNDFILL
1,6 2,TIME (SECS)
3.2
K (CM/S) - 0.035611
HELL SPECS. (FEET)
SCREEN LENGTH • 10.0
HELL SCREEN/BORE RADIUS • 0.09
HELL CASING RADIUS • 0.08
RQUIFER THICKNESS » 130.0
H (FEET) - 116.80
COEFFICIENTS
R - 0.00
B - 0.00
C - 1.7«4
T-INTERCEPT - 19.72
SLOPE - -0.2796

QNflLflSKfl LflNDFILLMN-2DTEST 3
0,0 1.6 2ATIME (SECS)
3,2 14,0
K (CM/S) - 0.034363
HELL SPECS. (FEET!
SCREEN LENGTH - 10.0
WELL SCREEN/BORE RflOIUS - 0.08
HELL CflSING RflOIUS - 0.08
RQUIFER THICKNESS - 130.0
H (FEET] - 116.80
COEFFICIENTS
PI - 0.00
8 - 0.00
C - 1.7H
T-INTERCEPT - 18.95
SLOPE - -0.2698

QNflLflSKfl LflNDFILLMW-3MTEST 1
0.0 0.8 1.2TIME (SECS)
1.6 2,0
K (CH/S) • 0.054232
HELL SPECS. tFEET)
SCREEN LENGTH « 10.0
HELL SCREEN/BORE RADIUS -0.08
HELL CASING RADIUS • 0.08
RQUIFER THICKNESS • 130.0
H (FEED - 68.20
COEFFICIENTS
fl - U.76
B - 0.82
C - 0.00
T-INTERCEPT « U.93
SLOPE • -0.5»W7

ONflLflSKfl LflNDFILLMW-3MTEST 2
b
0.0 0,8 1.2TIME (SECS)
1.6 2.0
K (CM/SJ « 0.040155
HELL SPECS. (FEET)
SCREEN LENGTH « 10.0
HELL SCREEN/NFC RflDIUS -0.08
HELL CRSING RflOIUS • 0.08
RQUIFER THICKNESS - 130.0
H (FEED - 68.20
COEFFICIENTS
fl - 4.76
B - 0.82
C • 0.00
Y-INTERCEPT - 4.18
SLOPE - -0,«4033

QNflLflSKfl -LflNDFILLMW-3MTEST 3
00-
OJ-
b0.0 o.u 0.8 1.2
TIME (SECS)
1.6 2.0
K (CM/S) - 0.056394
HELL SPECS. (FEET)
SCREEN LENGTH « 10.0
HELL SCREEN/BORE RflDIUS -0.09
HELL CRSING RFC IUS - 0.08
flQUIFER THICKNESS - 130.0
H (FEED - 68.20
COEFFICIENTS
R - 4.76
B • 0.82
C - 0.00
T-INTERCEPT - 7.13
SLOPE - -0.566H

QNRLflSKfl LflNDFILLMN-3DTEST 1
O.U 0.8 1,2TIME (SECSJ
1,6 2,0
K (CM/S) • 0.065404
WELL SPECS. (FEET)
SCREEN LENGTH > 10.0
WELL SCREEN/BORE RfiOIUS - 0.09
HELL CRSING RADIUS • 0.08
HQUIFER THICKNESS - 130.0
H (FEET) - 128.60
COEFFICIENTS
fl - 0.00
B - 0.00
C - 1.74
Y-INTERCEPT » 7.01
SLOPE - -0.5082

QNflLflSKfl LflNDFILLMH-3DTEST 2
O^
o_
0,0 0,8 1.2TIME (SECS)
K (CM/S) - 0.0731429
HELL SPECS. (FEET)
SCREEN LENGTH - 10.0
NELL SCREEN/BORE RRDIUS - 0.08
HELL CflSING RflOIUS - 0.08
flQUIFER THICKNESS - 130.0
H (FEED - 128.60
COEFFICIENTS
R » 0.00
B - 0.00
C - 1,7«4
T-INTERCEPT - 5.94
SLOPE « -0.5706

QNflLflSKfl LflNDFILLMN-3DTEST 3
CJ
o_
oO_
0.0 0,4 0,8 1.2TIME (SECS)
1.6 2.0
K (CN/S) - 0.053289
HELL SPECS. (FEET)
SCREEN LENGTH « 10.0
NELL SCREEN/BORE RflDIUS -0.08
HELL CRSING RADIUS • 0.08
RQUIFER THICKNESS - 130.0
H (FEET) - 128.60
COEFFICIENTS
R - 0.00
B - 0.00
C - H.7»t
Y-INTERCEPT - 5.8U
SLOPE

QNRLRSKfl LflNDFILLMW-7MTEST 1
0.0 0,5 1.0 1.5TIME (SECS)
K (CM/S) • 0.036418
HELL SPECS. (FEET)
SCREEN LENGTH • 10.0
WELL SCREEN/BORE RflDIUS -0.09
HELL CASING RflDIUS - 0.08
flQUIFER THICKNESS « 130.0
H (FEET) » 60.00
COEFFICIENTS
fl - 4.76
B - 0.82
C - 0.00
T-INTERCEPT - 1U.5U
SLOPE - -0.3705
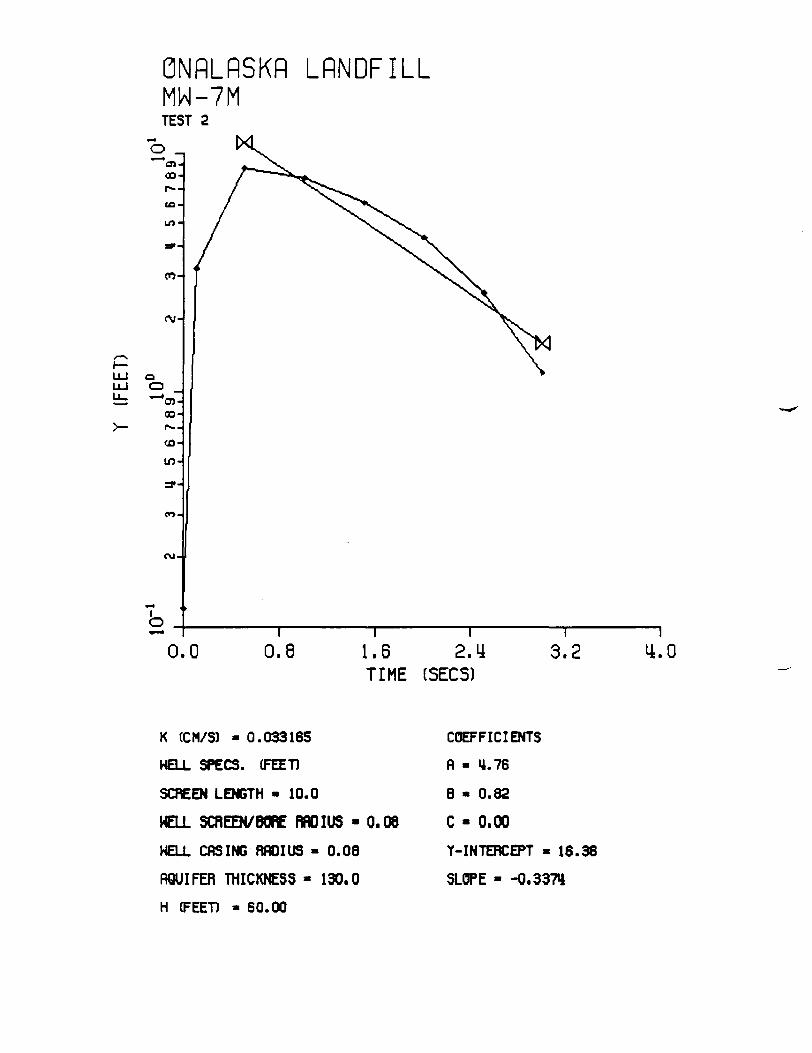
QNflLflSKfl LRNDFILLMN-7MTEST 2
0.0 1.6 2.UTIME (SECS)
14.0
K (CM/S) - 0.033165
HELL SPECS. (FEET)
SCREEN LENGTH - 10.0
WELL SCREEN/BORE RflOIUS -0.06
HELL CRSING RADIUS « 0.08
RQUIFER THICKNESS - 130.0
H (FEED - 60.00
COEFFICIENTS
fl - H.76
B > 0.82
C « 0.00
Y-INTERCEPT - 16.36
SLOPE - -0.337H

ONRLflSKfl LflNDFILLMH-7MTEST 3
*H
o
00-
co-
in-
CJ-
°0
0.0 0.5 1.0 1.5TIME (SECS)
2.0 2.5
K (CM/S) - 0.0270U4
HELL SPECS. (FEET)
SCREEN LENGTH - 10.0
HELL SCREEN/BORE RflOIUS -0.08
HELL CflSING RADIUS - 0.08
flQUIFER THICKNESS « 130.0
H (FEED « 60.00
COEFFICIENTS
fl » 4.76
B » 0.82
C - 0.00
Y-INTERCEPT - 13.H6
SLOPE - -0.2751

ONflLflSKfl LflNDFILLMW-8MTEST 1
O _
00-
in-
cn-
f\i-
oO
0,0 0.5 1.0 1.5TIME (SECS)
2.0 2.5
K (CM/S) - 0.029835
HELL SPECS. (FEET)
SCREEN LENGTH - 10.0
WELL SCREEN/BORE RflOIUS - 0,06
HELL CHS IMG RflOIUS - 0.08
flQUIFER THICKNESS - 130.0
H (FEED - 56.80
COEFFICIENTS
fl - 4.76
B « 0.82
C - 0,00
T-INTERCEPT - 11.72
SLOPE - -0.3053

LLJLU
QNflLRSKR LRNDFILLMH-8MTEST 2
O
o>-
co-
r--
CO-
in-
C\J-
0.0 0,5 1.0 1,5TIME (SECS)
2,0 2.5
K (CM/S) - 0.030766
WELL SPECS. (FEET)
SCREEN LENGTH - 10.0
HELL SCREEN/BORE RflOIUS - 0.08
HELL CASING RflOIUS « 0.08
RQUIFER THICKNESS - 130.0
H (FEET) « 56.80-
COEFFICIENTS
fl » H.76
B - 0.82
C - 0.00
T-INTERCEPT - 11.70
SLOPE • -O.SIW

>-
ONRLflSKR LflNDFILLMH-8MTEST 3
O*"~'o>-
00-I
to.
cn-
cy-
LU O
00-
(£).
UV
<\J-
b0.0 0.8 1.6 2.
TIME (SECS)3.2
K (CM/S) - 0.034502
WELL SPECS. (FEET)
SCREEN LENGTH - 10.0
WELL SCREEN/BORE fflDIUS - 0.08
HELL CRSING RFC IUS • 0.08
flQUIFER THICKNESS - 130.0
H (FEED - 56.80
COEFFICIENTS
fl « 4.76
B • 0.82
C - 0.00
T-INTERCEPT « 14.02
SLOPE - -0.3530

ONflLflSKfl LflNDFILLMN-8DTEST 1
0_
0.0 20.0 40.0 60.0TIME (SECS)
80.0 100.0
K (CM/SJ - 0.003129
HELL SPECS. (FEET)
SCREEN LENGTH • 10.0
WELL SCREEN/BORE RRDIUS -0.08
HELL CASING RROIUS « 0.08
flQUIFER THICKNESS - 130,0
H (FEET) - 117.10
COEFFICIENTS
fl > 0.00
B • 0.00
C - H.7H
T-INTERCEPT - 16.79
SLOPE - -0.02*6

QNflLflSKfl LflNDFILLMW-8DTEST 2
140.0 80.0 120.0TIME (SECS)
160.0 200.0
K (CM/S) - 0.001324
HELL SPECS. (FEET)
SCREEN LENGTH • 10.0
WELL SCREEN/BORE RflDIUS - 0.08
HELL CASING RFC IUS • 0.08
flQUIFER THICKNESS - 130.0
H (FEED - 117.10
COEFFICIENTS
R * 0.00
B « 0.00
C - 4.74
T-INTERCEPT - 15.04
SLOPE - -0.0104

ONflLflSKfl LflNDFILLMW-8DTEST 3
O ^
oo-r--03-
CO-
OJ-
20.0 140.0 60.0TIME (SECS)
80.0 100.0
K (CM/S) - 0.001709
HELL SPECS. (FEET)
SCREEN LENGTH « 10.0
HELL SCREEN/wre RflOIUS - 0.09
HELL CASING RflOIUS - 0.08
flQUIFER THICKNESS • 130.0
H (FEED - 117.10
COEFFICIENTS
fl - 0.00
B • 0.00
C - H.7H
T-INTERCEPT - 10.82
SLOPE - -0.013H

ONflLflSKfl LflNDFILLMW-9M
1,6TIME (SECS)
3.2 4.0
K (CI1/S) • 0.033744
HELL SPECS. (FEET)
SCREEN LENGTH - 10.0
WELL SCREEN/BORE RflDIUS - 0,08
HELL CASING RRDIUS • 0.08
RQUIFER THICKNESS - 130.0
H (FEED » 66.60
COEFFICIENTS
R - 4.76
B - 0.82
C " 0.00
Y-INTERCEPT • 16.72
SLOPE - -0.3397

GNflLflSKfl LflNDFILLMW-13STEST 1
UJ
12,0(SECS)
16,0 20.0
K (CM/S) - 0.062068
HELL SPECS. (FEET)
SCREEN LENGTH - H.5
WELL SCREEN/BORE RflOIUS - 0.08
HELL CflSING RflOIUS - 0.08
flQUIFER THICKNESS - 130.0
H (FEED - 4.50
COEFFICIENTS
fl « 3.12
B - 0.52
C - 0.00
T-INTERCEPT - 1.97
SLOPE - -0.1182

0NRLRSKR LRNDFILLMW-13STEST 2
*-«
O
oo-
ua-
i/>-
a<-
co-
O
0.0 10,0TIME
15.0(SECS)
20.0 25.0
K CCM/S) - O.W7507
HELL SPECS. (FEET)
SCREEN LENGTH -4.5
WELL SCREEN/BORE RflOIUS - 0.09
HELL CflSING RflOIUS » 0.08
flQUIFER THICKNESS - 130.0
H (FEED - 4.50
COEFFICIENTS
fl - 3.12
B - 0.52
C « 0.00
T-INTERCEPT - 1.30
SLOPE - -0.3430

ONflLflSKfl LflNDFILLMW-11MTEST 2
LU oUJ O
en-
CM-
00-
CO
UT
b
0,0 0.8 1.6 2.TIME (SECS)
3.2 14.0
K (CM/S) - 0.032988
HELL SPECS. (FEET)
SCREEN LENGTH • 10.0
NELL SCREEN/BOflE RADIUS -0,08
HELL CflSING RfCIUS • 0.08
flQUIFER THICKNESS - 130.0
H (FEED - 62.80
COEFFICIENTS
fl • U.76
B > 0.82
C - 0.00
Y-INTERCEPT - 19.28
SLOPE - -0.33H1

0NRLRSKR LRNDFILLMW-11MTEST 3
O
0.0 0.8 1.6 2.UTIME (SECS)
3.2 14.0
K (CM/S) • 0.029394
WELL SPECS. (FEET)
SCREEN LENGTH « 10.0
WELL SCREEN/BORE RflDIUS « 0.08
HELL CRSING RROIUS « 0.08
flQUIFER THICKNESS - 130.0
H (FEET) » 62.80
COEFFICIENTS
fl - 4.76
B - 0.82
C - 0.00
Y-INTERCEPT - 17.9U
SLOPE « -0.2977

)-
ONflLflSKfl LflNDFILLMN-10MTEST 3
oo-
m-
LU O
00-
<o-
OJ-
0,0 0.8 1,6 2.TIME (SECS)
3,2 L4.0
K (CM/S) =• 0.033840
HELL SPECS. (FEET)
SCREEN LENGTH « 10.0
WELL SCREEN/BORE RflOIUS - 0,08
HELL CASING RflOIUS • 0.08
flQUIFER THICKNESS - 130.0
H (FEET! - 67.70
COEFFICIENTS
fl - 14.76
B • 0.82
C - 0.00
Y-INTERCEPT - 19.10
SLOPE - -0.3101

QNflLflSKfl LflNDFILLMW-11MTEST 1
O _
0,0 1,6 2.TIME (SECS)
3.2 14,0
K (CH/S) - 0.030938
HELL SPECS. (FEET)
SCREEN LENGTH - 10.0
WELL SCREEN/BORE RADIUS - 0.08
HELL CASING RADIUS • 0.08
flQUIFER THICKNESS - 130.0
H (FEET) - 62.80
COEFFICIENTS
fl « "4.76
8 - 0.82
C - 0.00
Y-INTERCEPT -16.611
SLOPE - -0.3133

QNflLflSKfl LflNDFILLMH-10MTEST 1
0.0 1.0 1.5TIME (SECS)
K (CM/S) - 0.0(40194
HELL SPECS. (FEET)
SCREEN LENGTH - 10.0
WELL SCREEN/BORE RflOIUS - 0.08
HELL CASING RROIUS - 0.08
RQUIFER THICKNESS - 130.0
H (FEET) - 67.70
COEFFICIENTS
fl - 4.76
B - 0.82
C - 0.00
Y-INTERCEPT - 17.52
SLOPE - -QAW

ONflLflSKfl LflNDFILLMW-10MTEST 2
O
D.
•
0 0,8 1.6 2.U 3,2 14,0TIME (SECS)
K (CM/S) » 0.029954
HELL SPECS. (FEET)
SCREEN LENGTH • 10.0
NELL SCREEN/BORE RflDIUS - 0.09
HELL CRSING RADIUS « 0.08
RQUIFER THICKNESS » 130.0
H (FEET) - 67.70
COEFFICIENTS
fl - H.76
B • 0.82
C - 0.00
T-INTERCEPT - 18.69
SLOPE - -0.3010

LU
QNfiLflSKfl LflNDFILLMN-9MTEST 2
0.0 1.6 2.4TIME (SECS)
K (CM/S) - 0.030127
HELL SPECS. (FEET)
SCREEN LENGTH - 10.0
WELL SCREEN/BORE RflDIUS - 0,08
HELL CRSING RROIUS - 0.08
flQUIFER THICKNESS - 130.0
H (FEED - 66.60
COEFFICIENTS
fl - 4.76
B - 0.82
C - 0,00
T-INTERCEPT - 16.19
SLOPE - -0.3033
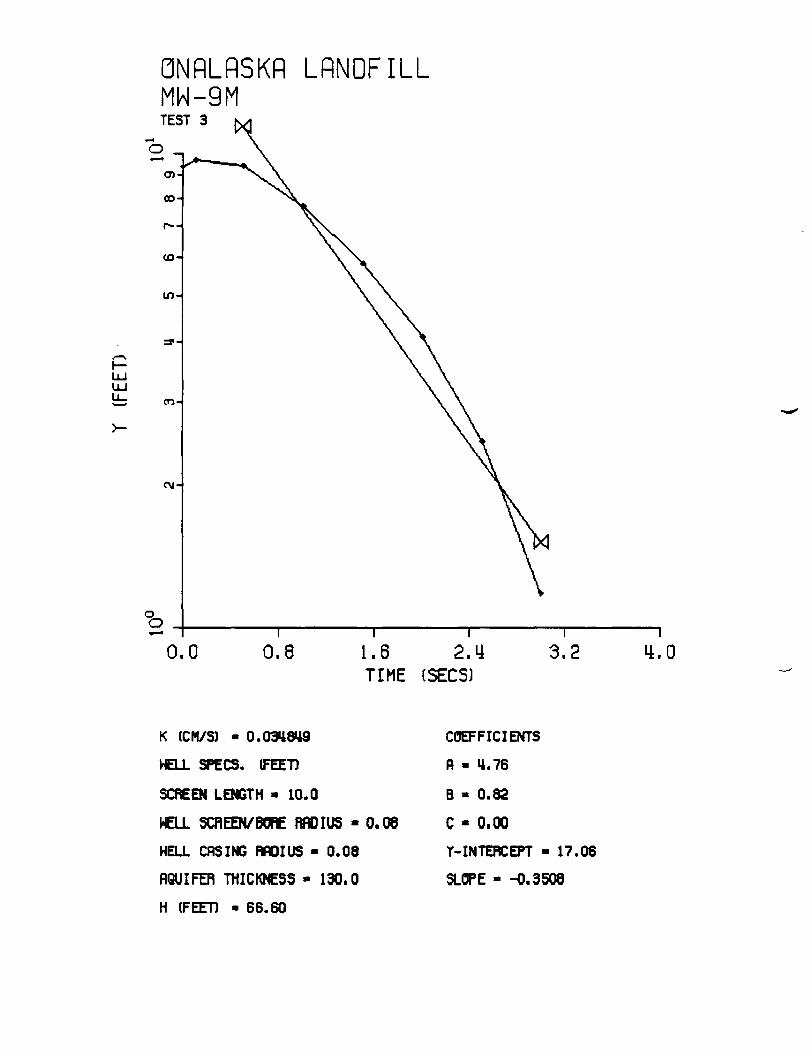
QNflLflSKfl LRNDFILLMH-9MTEST 3
O _
0.0 0,8 1.6 2.UTIME (SECS)
K (CM/S) • 0.03U8U9
HELL SPECS. (FEET)
SCREEN LENGTH - 10.0
WELL SCREEN/BORE RFC I US -0.08
HELL CRSING RADIUS - 0.08
RQUIFER THICKNESS « 130.0
H (FEED - 66.60
COEFFICIENTS
fi - U.76
B * 0.82
C - 0.00
T-INTERCEPT "17.06
SLOPE - -0.3508

LU
QNflLflSKfl LflNDFILLMW-13STEST- 3
12.0
(SECS)
16.0 20.0
K (CM/S) - 0.076396
HELL SPECS. (FEET)
SCflEEN LENGTH • 4.5
WELL SCREEN/BORE RADIUS • 0.08
HELL CASING RflOIUS - 0.08
flQUIFER THICKNESS « 130,0
H (FEED « 4.50
COEFFICIENTS
fl - 3.12
B - 0.52
C - 0.00
T-INTERCEPT » 2.52
SLOPE - -0.5516

t* n.33B -I
f a. 31 5 -j
J.JDQ -jI
3.15B -I
D.125 -iii
3.1 DO -I
1 :ma ->
1.794 -i
J .B31 -i
.1.501 -I
rj.398 -I
n.315 -I
a. :si
O.:QQ -|i
J.1SB -i
n.i:s J
4
:taga = -i :.:40C-ai /BBC: SO =« 13.38 1 at < H-HO>; K -.1.1E5C-01 em/mme. ?1.-95 - • •— — —: j '
i1 .259 -^-..
i *.i
i nn Q -4 t! -,
3.794 -i " - . . _
Ia.531 -J
3.3 3.5 -3.7 3.2
,jquir>r Slug T«it ^!2 i'Rising Hecrj) ct MV^B14;;5 -JJta ^= -11.14SC-ai /SBC; SO - a.53 "5 of •: H-i< o>; K = 1.1B4€-01 cm/Bi
a.j a.s a.7 a.9TKC

r
i ana -+--
a.B3i -j
3.33B -|
iM S3 -•
a . i n a -j
1.353 -|
:.Q4Q -j
J.025 -{
0.01 5 -ji
a.01 a -i
a.aas -j
a.ao2 -i-
Slug Test #1 i'SisifXj .-leod': at "MW— B1Cf 5 .-"c+r
= -I3.533C-Q1 /BBC; 3D = +.35 1 at ;,'U-io;-; K = f.7«t-01 cm/a«i .-3 a
3. 71 4
1.531
3.501
:;; 0.398
? a. 31 a
>' n.25 1
V a. 200
5 a.tsa
^ 0.125
a. -.no
a. 053
1050
-t ""*v "'•-.,
- i • - ,-i
-.1-i ' • • , _
H ''••-,..i
-I~^ ''••-..
— j!
-i "• '
j
i !
J.4 ii.a 3.3
TKC ''.nnamntii
rtquifsf SiLiq Test ?*2 (Risirq Head) at MW—810; 5 dote coint;: —1 1.3fi'!t —i'H ,.-'BBC: jD - j.42 'S nf >!'ri-^ a;-; 1C * 1.3i3C—01
j !U.2 il.4 0.5 Cl.fl i 1.2 1.4
TKC '.BBajndai

;:• Siuq T«it a, .'Rising rierjcj) ct UW—B2>y 20 data poirr>» = -2.BB5E-Q1 /'BBC; SO = 574 "5 of vH-Ha|; '%.*
ia.531 -4 "'- |
1398 -j
1.251 -i
0.158 -1
f a . - t a a -I- !•-• J.063 -|! i
C- 3.340 4•-r !
;> ;-^ a.tns -j
a.ci 5 -i
•121 a -ji
a.aos -i
ana
quifrsr 5iug Test #2 (Rising H*rjdj rjt M'W-B2ftr 40 data po r= -'3.;37E-u1 ./BBC: SO = 5.33 * of (H-Ho!-; K = 5.547E-03 cm/aac
3.331 -i
0.399 -1
a.:s i H
a.isa -•
-2 a.iaa -!t i•r- a. as 3 -4
T Q.D4D -jX !
a.ajs -i
a.ai 5 -ii
-I
a.aas -j
1.QD t -i
0 0 0 3 -J-

J
1 nn n1 . UU U
0.531
3.399
a. 351
:-: a. i59Vf a. iaa.1
§ a.aesT5; J.D40
-1 3. 025
d.01 5
a.ai a
0.005
n nn x
quifer 3iuq Tsst * 1 (Rising neraj'j .-Jt"|gg tf g|39 data poir
i
K-._-iJi ' """•-•-^ xj
""-.-,..."•;--.._
""•••-.,.i
i
ThC (
i .aoa -i-i
a .631 4-i
1.399 -j
J.251 -I
Aquifer Slug Tsst #2 (Rising Head) at MVY-B2G; H, S data points= -5a5BC-Q1 /BBC: ,50 = 9.93 1 of I'M-Ha}; K a 4.353C-03 cm/amQ
a. inn -
0.053 -
a.axa -
3.D3S -
:.aio
a. DOB -j
a. so-* -j
n.D03

^
aquifer Slue; 7r*st #\ (Rising rieod)Jb™ = -1.4?5E-ai /••e; 33 = 5."3 1 of
-
1.259 -r
i .aoa -) "3.794
3.531
3.501
3.398
3.31 5
0.251
Q.2QU
D.15B -I
Q.126 -4I
3.1 an -jo.arg -jLI.DBS -i
-a.Q4Q -I
3.332 -j
3.325 -j
O.EJ2Q -4-
30 data peir
1.*'414C-Q3 cm/«?
Tfr.C
Aauifer Sluq Test * 1 (Rising Head) at MW—83C; 76Tteata pcint-jj to OB = -1 323E-Q1 /SBC; 50 = I.3B 1 o-f ('H-Hol; 1C = 1.434C-03 cm/8BC
1.J53 -!
i .aaa -[i
i
J.531 -!
3.5D1 -j
3.399 -I
3 3 1 5
a.251I
3.2DO -j
a.isa -j
a.126 -iiQ.1QD -i
I
-I
O.DB3
S
ThC

f
IX
Aquifer Slug Test #2 (Rising Head) at tyf£f &3OH55 3
= -1.2B3E-ai /••c; SO = 5.15 ^ af'iH-H B|; CSP^^OF^Z tfi1 .359 -—! . 3D3 -k..
7.531 -|
•1.5D1 -i
-ij.3i g -H3.251 -j
3.2DQ -i
3.15B -i
Q.125
3.1D3 ]
a.assD.Q5D
D.340
a.332J.325
O.U2D
a.ai 3a. 01ia.ai airons
-I-i
~i
3 H
15
po in
.SB 5
Aouifer Slug Test ,*>2 i'Rising Headj rjt M'/V—B3i; '7; dote pcintsJo en = -!.3Q5C-ai ,. SBC; ;iQ = 4 65 I of 'X-^o;-; K » 1.387C-03 cm/BBC^
J.531
3.351
3.1 a 3
a. inn
U.34Q -
0. 023 -Ii
3.31 5 -j
a.aia -i
O.QD5 -
j.ao-v -I
Q.OD5i
11 13 1.'1'

t^uirer 3 Teat $1 (Rising Head) -A MW^B4SA; 3c
-7 306C-02 /BBC; 30 = 3.52 7 at I'H-Hol; R»>.:i jaa
l .aaQ
3.531
1399
J.251
.;. 0.153
T Q.1CQ
V D.QB 3
f' a.340
-t- a.il2 5
^ a.Di Bn.m o
G.QQ4
3.305
3.0D2
( I.
t CN.
j X;,
'*..
' '••_"
-
_j
I_i
J "•:-,.
4! I : I ( '
a ia 20 JD *
< W /fl£i*C- W Cp <«f *•! C* k.- V^»

.-r iffist *2 (Rising i-iead) at ft"W-B4S^ 57 data pointsi —32 /'BBC; SO = 5.30 1 o-f i'.H—Ho)-; Sf»'
:,;:iii.
• -
t
£~*
i »3 1
a. 79*U.B31
J.501
3.299
a. 31 5a. 251D.200
3.153
a. 125a. iaoa. 0733.QG3
o.asna.o>fla. 33:3.325
O n 1 "^.ui a
1 '---T
H " " ' " • - . |-i '••-, iiH •-. i
1-1 '•",. }
-j '"-•.,.-
*'"'...
-iJ
— « ' '•• .-i >-,
i. ' ' • • i
1
-1 " - ' " • - .
-i • " ' - , 1i •.-i•J 4 .1 12 In :0 24
TKC 'laBcnndat
Aquifer Slug Test #1 (Sis ing Hftid'l at MW— B4SC,'rSO ,-jata point
_L
V
1
.-%
yu
iX•"-r
-
1 no n
1531
J' j9a
;i.:'5i
o.isa•i.no
H.3B3
J.040
G.025
a.Q1b
Q.Q1Q
o.aas
1.004
J.ODj
ii nn i!J.UU A
onrn = -a.rOBC-n: .toe: 3D = 3.a:> T af .;«— <ai-; K s 9. 4B9C-03 cnv'aac *
_ • ~.
-ji -' • . !
i-i ""'••.. ' • ;
-i ""--••: . ;i * '""• " •
-41
-1J
i ' ._
i ' •"---.-j ' ' :"-->;,..
: ;•-_ (H -:..v. . .
j ' """--.1
—1 '••..
1
1
0 4 3 12 15 20 24 2B 32
ThC '!a«ajnd«|

aquifer- Slug Test #2 (Rising Head) at 1fotf~S4SC&D2 daw= -1.053E-01 /SBC; SO = 3.36 I at .;H-H oi; jt:»'9:-48BE-Ol"cm/"
.VX
X
t
"?-J
:.si 2
1.585
1 ODD
T.531
3.398
3.251
3. 153
Q.100
0. 35 3
3. 340
3.32S
3.31 5
3.01 0
J.3Q5
El. 00 +
n.uQ3
i r.n i
i i
l>>, ;H ' :X !
1 "''^,-. \-*
" •.. •
'"~<~<,
1i
-! ' ' ' ' • ' - .I • -'•-.-
1-ii
TKC '.Bocnndo;

f
.000
qufer slug Test i?1 rRisinq H.eed) rjt ttW-B4D£| o data ?Sb« = -/.SDOC-fll. /BBC; S3 = 152 1 af (H-Hai ; IT a"T:U75t-01 cnV«
d.734 -f""--.
3.531
a.501 -i
0.39H -)!
3.316 -I
3.251
3.:aa -j
3.153 -!
a . i 2 B -
0.279 -
n.afisCM a.3 3.3 a.7 3.3
TKC 'iaBcnndal-
M 1.5
.Arjuifer Slug (Rising Head'] at MW-B4D8; 5 data pcinti' B B C ; SO = 25.72 1 of ' iH-Hoj-; K = 1 .135E-01 cnv'HC '
'• aao --)a.79 4 -j
iiT.531 -Iia.501 -
a.31 a -I
a.:aa -a.153 -ja.126 -Ij . i a a -|11.079 -
[).Q53 -I
a.asaa.i
' - -I
a.3 a.sTKC •:«
a. 7 a. 3

7 343
fer 3 lug Test *i1 (Piling
jbpa = -:1.33BC-G1 ,'aac; 3D =
j'i at MW— 94 DC; 4 data
I af >;H->4a!; R * 9.D13E-02
r-..a. 31 0 -
5.D1 2 -
0-I1381
5.152 -)
"51 H" " !
.995
' . £ 3 5
1 . - J Q Q
a. 4
TKC 'innamda}
-Ha.5
; . 2 s y
Aquifer Slug Test *1 (Falling Head) at MW-B4DFAr 7 data
= -4.359C-G1 /aac; 3D = 4.44 !5 ot (H-4o|; K = 3.371C-C2 cm/»*
Ir
1 .DDQ -j
-)
a.63i
a.sm -I
G.33B H
0.31 6
Q.251 -I
a.200 1 1 1 1 1 1 1 I1 3.3 D.5 0.7 3.9
TKC i'>>cDnda}
1.1 1.5 1
Appendix EGEOPHYSICAL SURVEYS
GLT913/035.50-5

Appendix EGEOPHYSICAL SURVEYS
INTRODUCTION
Geophysical surveys were performed at the Onalaska landfill from October6 to 8, 1988 by Don Johnson and Jewelle Imada of CH2M HILL. Theobjectives of the investigations were:
o To determine the location, extent, and magnitude of the maindrum disposal area and the location of the buried truck.
o To map the groundwater conductivity plume extending south of thelandfill.
o To locate the "designated" solvent disposal area.
Magnetometer and electromagnetic conductivity methods were used to meet theobjectives. The magnetometer survey included measurement of the earth's totalmagnetic field and the vertical magnetic gradient. The electromagnetic surveywas performed by measuring the ground conductivity with the Geonics EM34 at10- and 20-meter coil separations.
The magnetometer survey defined several areas of buried metal. Themagnetometer interpretations were performed using the total field data. Thevertical gradient data were not used because the shallow, scattered metalthroughout the landfill caused excessive noise levels. The total field data are notaffected as much by the scattered metal.
The electromagnetic survey was unable to detect a conductivity plume on thesouth side of the landfill or to identify liquid disposal pits. The electromagneticdata have been used to delineate the limit of the landfill and to estimate itsthickness.
MAGNETOMETER SURVEY
PROCEDURES
Magnetometer readings were made over a 20- by 20-foot grid across the site.The readings were made using an EDA OMNI IV magnetometer thatsimultaneously measured total field and vertical gradient values. A base stationwas located off the landfill in an area with no nearby metal, and readings weremade there several times a day to determine the amount of diurnal drift in thetotal field. The amount of drift was small (less than 50 gammas) compared to
E-l

the observed anomaly sizes (several thousand gammas) and no drift correctionwas performed. The vertical gradient is not affected by diurnal drift.
Data were contoured with a 500-gamma contour interval (Figure E-l). Thesource locations for the anomalies were interpreted from profile plots (notincluded) and are shown on Figure E-2. Data are tabulated in Attachment 1.
RESULTS
The site was operated as a landfill accepting domestic, commercial, andindustrial wastes. Accordingly, a considerable amount of metal is scatteredthroughout the refuse. The scattered metal is the primary source of noise in themagnetometer data. Several areas throughout the landfill exhibit magneticanomalies with magnitudes much stronger than the noise, and extend acrossseveral lines. These anomalies are caused by areas of fill that contain moremetal than the remainder of the fill.
The approximate locations of the buried metal causing the most prominentanomalies are shown in Figure E-2. It is not possible using the magnetic dataalone to determine whether the buried metal is drums or not Additional siteinvestigations will be necessary to establish the nature of the source. The areasof buried metal have been listed according to anomaly size (both amplitude andextent). The strongest anomalies have amplitudes on the order of5,000 gammas. Anomalies less than about 500 gammas could not be usedbecause they could not be distinguished from noise. Areas A, B, and C havethe greatest anomalies. The remaining areas have smaller anomalies andrepresent smaller quantities of metal or less dense concentrations of metal.Since these areas are evident across at least two lines, they are presented here.Anomalies appearing on only one line are note discussed.
Area A
Area A the largest source area identified at the site, covering an area about 400feet by 100 feet It is located along the southern perimeter of the landfill. Thecharacter of the anomalies change across the area, so for descriptive purposes,Area has been divided into three subareas.
Sabare* AL The anomalies on the western end of Area A (lines 220 to 260,and possibly line 280) constitute Subarea Al. They indicate a narrower sourcethan the remainder of Area A, probably less than 40 feet wide. Because of itsdimensions, it has the best chances of being the buried tank truck. The truck,however, could be within Subareas A2 or A3 and not be identifiable.
E-2
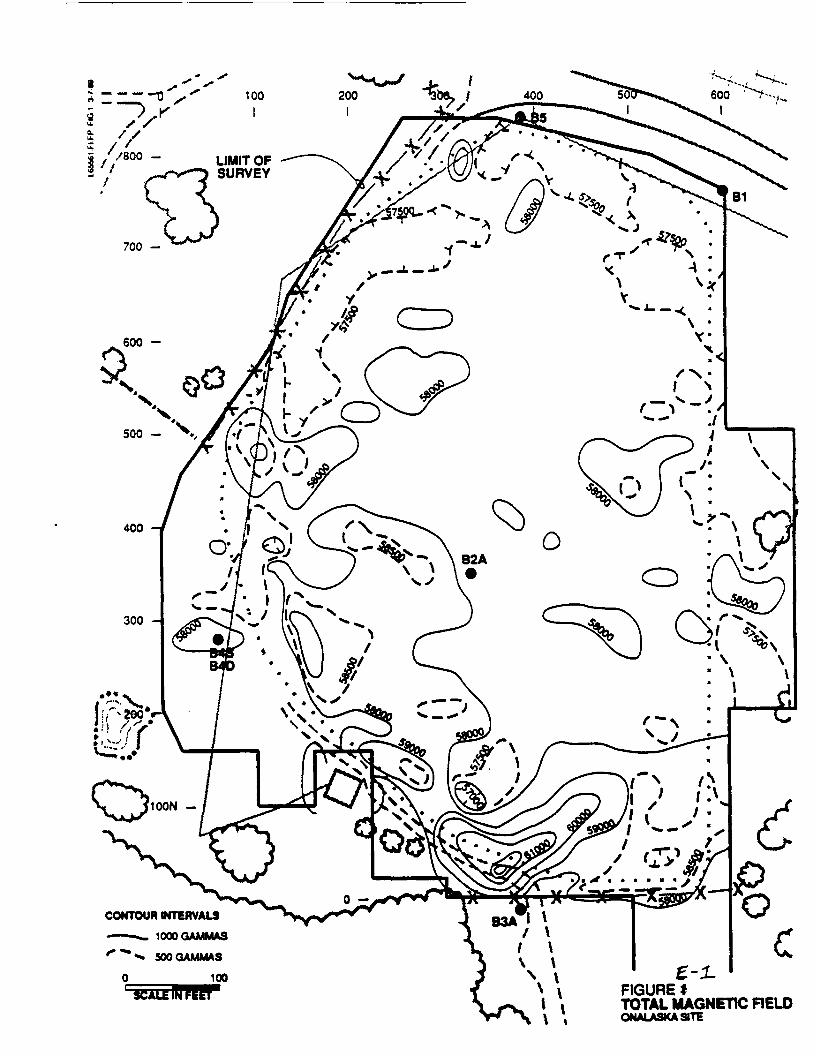
CONTOUR MTERVALS
-N_ 1000 GAMMAS
/"*' 500 GAMMAS
0 100FIGURETOTAL MAGNETIC FIELDONALASKASTTE

0 -
ETED AREAS OF BURIED METAL
Subarea A2. Subarea A2 extends from line 280 to line 480 and averages about100 feet in width. The strongest magnetic anomalies encountered in the surveyare included in this zone.
Subarea A3. Subarea A3 extends from line 500 to line 580. It is seen, butweakly, on line 600. The source of these anomalies is about 200 feet wide. Theanomalies are about half the amplitudes of the anomalies making upSubarea A2.
Area B
Area B is located along the southwestern edge of the fill. It is about 200 feetlong and 40 feet wide, and it is strongest on line 160.
AreaC
Area C is located along the western edge of the landfill, but its shape does notconform _to the edge of the landfill like Area B does. This source correspondsto an area of "barrels and oil seep" shown on Figure 2-4 of the work plan. Apowerline crosses Area C and may be distorting the shape. The powerline doesnot affect all the anomalies in this area, and cannot be the source.
Area D
The source of this anomaly is probably well nest B4.
Area E
Area E extends east of what appears to be the east edge of the landfill. Minoramounts of domestic trash and rusted drums were observed in the vicinity.
Area F
A small trench identified in the July 10, 1973, aerial photo is located withinArea F.
Areas G-K
Areas G through K are within the landfill. They have no distinguishing features,are small in amplitude, and are limited in extent relative to areas A through C.
E-3

ELECTROMAGNETIC SURVEY
PROCEDURES
Ground conductivity measurements were made using the Geonics EM34.Readings were made on a 40- by 40-foot grid across the site. An additionaleast-west line was run south of the landfill to determine if a plume could bedetected. Measurements were made with the system operated in the horizontaldipole position and at both 10- and 20-meter separations between receiver andtransmitter coils. Data are tabulated in Attachment 2.
Landfill thickness was estimated by comparing measured 10-meter and 20-meterelectromagnetic conductivities against a set of interpretation curves (Figure E-3).The curves indicate the theoretical instrument responses over a two-layer earth.The upper layer thickness and conductivity are variable. The bottom layer isinfinitely thick and at a constant conductivity of 5 mmhos/meter. The curveswere generated using a program supplied by Geonics for use with itsinstruments.
The edge of the landfill is identified in the data where the conductivity is greaterthan the average background (about 5 mmhos/m). Exceptions to this are in thevicinity of the powerline which crosses the site. The edge of the landfill can alsobe defined by comparing the 10-meter data with the 20-meter data. The valuesare the same off the landfill where the ground conductivity does not change withdepth. Cm the landfill, the fill material is more conductive than the nativematerial beneath and the 10- and 20-meter data differ since they are seeing todifferent depths.
RESULTS
The 10-meter conductivity data are presented in Figure E-4. No conductivityplume was detected south of the landfill. The data collected along grid line80 south indicates an increase in conductivity from background (about5 mmhos/m) to 9 mmho/m. The highest conductivity along this line occurs atthe powerline and the conductivity changes may be related to this feature. The20-meter data reflect the average ground conductivity to about twice the depthas the 10-meter data. The 10-meter and 20-meter data differed by very little,indicating the instrument was seeing no differences in conductivity with depthand therefore no groundwater conductivity plume.
No features that are recognizable as liquid waste disposal areas are evident inthe data. Four areas shown in Figure E-4 where localized conductivityanomalies correspond with magnetic anomalies. There is apparently sufficientmetal in these locations to cause both conductivity and magnetic anomalies.
E-4

60 -i
50 H
40-J
30 H
10 H
10l
20 30I
40
10 METER RESPONSE
50 60 70
MILLIUHOS/METERFIGURE 3INTERPRETATION CURVESFOR EM 34 DATAONALASKA SITE

FIGUREEM CON
LEGEND
LOCALIZED CONDUCT)ANOMALIES
EM 34 wtti 1 0 nwtor coil Mpmfen.horizon* dfcote.Contour intwvd:
100
ONALASKASITE

Two lie within magnetic area A2; the others correspond to magnetic areas Cand E.
The limit of the landfill and the estimated depths determined from the graph inFigure E-3 are shown in Figure E-5.
GLT913/025.50
E-5

CONTOUR INTERVAL: S FEET
iocs -* 5K3URE.r/VS~. j LANDRLL THICKNESS

Attachment 1MAGNETOMETER DATA
GLT913/039.50-1

3 < 0 *O tSORi"30 i
•>1Q >|
-rn u. uu ~
=30 t
:bO 1
6101
630 N580 H3i013'0 1320 "
"JO*":C «MO 1
120*«00 K530 H)b3 H
310.1"01jOfl*
ISO H250 M'140 »
220 H230 Hi80 HI S O *140 H120 H100 H30 Kb Q H1C M2013
2 0 5
3"b62=.767557J10
5754! 3"56S5?530 =7500i"'520 5757857503 5758837513 576555763S 57802S7«C 58091S7MI 5767257695 5767157711 57671S76S9 57812
5771257718
575985765257ii3957491=765557570575955784457355582115843S57751576655767357708577J137710
5753557519S7b72576125756657653533985771757687573715793S53216S79SI5731157?2S576515776057661
57551571155357058293=3111377575758157117575255739557JZS371915760258238577835717157730576665761157613
5718357480371915311153813593005881153008571575736S57279571725750573185724657865574895773857773577295765257583S75S45755757591
57*7157667579385732!576605763653154534115765957514
571 »568055328157958576055764857518574625741657563575525788157459572985733957635
57"3S
5725757! 455771137242=7273372975737:)537175B551531355815257790576413793658)945379559204381115791857712575215711157318S7S20570815729S57292
r,j,j57207^9945723157102
57147
5?42S=317457!125771153087573125771157782531345373459351593705947953637577K57191567%563665593256390572285754957532
57*34
-7,,7
573315"l 943750757515
57*79;73333300953062577345714757955•304553063573335735!53101586345353853656535235334758337"9643711257722
5^36
372' !•;737fl=7^76571":76125795837350573465771433135
5314257332372995306353661585165734553256531365311533577535573855758271579675811933812
!1
"S3?7:49
719350927187501?'769
57^7.5573'35750157*993342153505580725335633473=3343585485343733311330775301237927596125884655623555665701657415575765748157169
37"=
-^e?"39
5"386
5 "393
57753=730237553S798S53383=367253! 37=326058368534003341558923=7900530683335575453520159*63573783739857T657:33571275739558200

••00
jji] H
HOI;J9 Nsoon•"0 H•501n)Q 4"23 1•oa t:30«
:sO »
610 H
:23 N
aQGK530 H560 N5 * 0 1•20 15uO H
180 N4(iO N
HO H
120 1'00 H330 H•60 N340 H320 H;OQN<:eon•60 N
"10 H220 NZOOMI90K!50NI 4 0 »120 H
100 NS O N
50 H40120 N0
20 S
S'-IZ5:55957531575!4579515757617' -0571"!5-37557755-"39253112577?255271'134597s;i<]53027:7<!375-53657134530975793753G135332558515532325326658261SCII50129SOfll5017158301534885812753588533595742757331571175731157319
57*1557;94
'"50157564"361575! S5-T1357265571475753!"351531 aS577545*971533115ofl!357-4557?5457339575)657573:*6I5
57180532715370558589582025013957954STWSB*S046258710533065304959140535593395953849579235770757549
57-5857692575-857-73"530573315-<*95737"57139575325738253015579675314953134577525790557?flfl575355753357168575195756653074533035330658310582035792057728531215830258*17582895812258118536795399760200603405931358133
S77«657604539135:7*3
;"SO"57553S725957553•57564571915765I•736457S06573291S0085-7565791357727575495766857134573645731157629577585785758162581695798757799573465825158670533025771857746569065627159441
51783600665976757976
57626575245711157249575625791557331:715557513575:25775!577765792157338579565738857711
5750057371575585752357611575225750757561571855790257901579295795157597579445811153310576315791757019564425842661459610415047050764
5768557355577.31573*0575435798257619573735757257-2757S305751457722579275739457"13579355779757755575705768358009579365758457172575555767257711579355798957628576335765357369572725744757003571855953060539617506340359319
572385758857576577725303153076i736957502576945733057525576075792257719577755793657927577455765457599573445301057615577035759657545577335776757690574905746257607577355767657366578105370?5993250304626155957659055
57' 5157*3557-225317*530605731357637S7733577695771957509576095786757650575475768357368577315766857533575465790357302573915773057810570095767157524576165729457710578605771057838532995366759351515056047957386S78S2
5721257130571285763657303575335774957853573005782557S0957532575535772557672577355765057681577825772457707581125779457818573475801657867573365719357598576135787958028534S953941
593595001551330596285802257756
57417;7300
573525716057564'575455745657375576355734?5794757545573005725257555573525732657753577325762457595576405798257927577625795158215579955785037621574425759057867579015843159199530705036559372501755789050211
573715738I
3735557429575285757957659575415759157918577965751357591575945-6835730153212531115737357753578595731657801575395793953060578805773557501572905752557863531725328759136501715946753554507225806058729
57*6057473571085739957567
5-5315753557:355753!57323577995785757917576575758957559531265B256531385798257856576635759057477573575314658247
57938577765761857399577595798058G895973259822590495801158890584955852)
57SZS5:53057 '£9575*857«7«5757!57183572535724657650530015779157376576405-512575365?"0353153579615303157653575475755757536577835796653187580645776557661575015741157556582895896853883587775395058802588%5917857588


523 -,'JU
3801
323 H
'30 N• " JON?13 t"31"0 tlau N
si'J K
:iO K
;ZO N
SQQ.1580 i5 a O H
543 H
5:3 1500*:9Q 1•s'o K"0*o ,t' f lON
330 1•,si H
540 N
•16 !(
200 H230 If260 .1240 N220 H203 H;ao i»1SOM"0 I*120 N'(MM30 N60 H40 N20 N0
205
i-iZZ5"5?0o?57057544:7«9"3G9"*:757193576265737357327577975763357463577085300053070550105301 i"37357609577395317157893S77ZSSTfff571775792157111577115738957382531115365153882531135389253171536375969557S68
376565755557554575333"50257331TZ09574«75750557750577785736337373574?4573763323857389"3255:39757825573525776653120S793957913S751I5789B57717S7773STKf575875771558031532195327258312536525318953996SH2257591
577105767957i59576333757557!385733557454376155773057?3353116581 42577325796853078577775747457652577615772357770579695782258075S80CO577385761757965579385771057713530215356353529582195866053530588215882157633
37£635-5515-635375745-55957513"46557499:74S57721379255308757901377975779057601573025736357338575395759757739575105775558005577065771158129579915792353019531155852158711535675866153238579065783157631
5772457«66"632376245754657»?557377573665721157353574%3753057116573535742!573065714757090576105791953097582115311557330571125737257639573105771?577915800653046580615313258572583855789657617533115763S

: ::;
"5:3
S97

Attachment 2ELECTROMAGNETIC CONDUCTIVITY DATA
GLT913/039.50-2

LSHOfILL
? COIL 3EPEWICN -- -iJI^H^s in *t1hO:.>e'.e'
'33 !2Q MB 130 5:: Ib'C -00 J'0 4-0 i:a Isfl
;j'j .1-;•** if
"3 i;30.1
00 rtcO t
13 t45 1
10153 t
ZC it
:?o H2iG,i:M H6 0 *i3 Ijr. i
10 HJ
'0 5
30 3
10 56 0 5
100 5
^0 3
3 '.5u n
5 9 ? ! bu :; '3 3? ;; ?? i
9 13 11 !l
9 12 !! Hif) H |J q
• •< :3 iz 7i]1!
• j 3 3 3 3 ) 3
c •••
1 J 11 44
;i 43 56
34 45 31
:•? 5: '531 37 33•6 53 37:? 33 ;i:i 16 :o'9 37 137 30 36•? — 25a — 131 — 33 — 33 ._ —
3 7 5
. ; --_ _., y
iQ "4 '? "1 'C
•2 J! J5 :3 26:4 »2 13 1 52
36 31 '1 3 50
32 36 14 2 52:3 3< »Q ? 31'b 31 '2 15 11^9 50 11 15 15
r. -:a *6 j: isiZ 56 45 11 51:3 i2 52 ^ 55
51 il 36 12 H31 61 ^ 19 '542 19 67 52 1131 10 16 «5 1221 Z? 11 -6 45:3 3« 33 :2 28
? 23 26 :3 !34 I
25 5 5 5 4
— 3311
3933
4?
4C
49
1652525931<320_ 1
c
1*
3•34
^
35
51
511641
56
59*0
59
»037:?
21...
14
1
411
10•6rn
^i
'1
25
5833
31313537405023
2311
...
15
3U
5
i n
1 1
V1.1
'9:s:i232721;i1!
i4
4
1
1
1
4
35
i!14
21;«365514
1
2
33
33!
3
4
4
4
3
r
4
1
1
34
3;
3
3
333ij
...
...
...
...
...
...
...
3...
;...
7j
...
3...
5

:MLS«KB L.WILL
-"'(" **
-'* "
..J ..
• " 'jO !l
~°. 1,ij .
lir. "t 1
SJ-1:5 i•in y*tn y..u t
VJ 11
111 •'J :
' :'] 5
•JU :
_jj j•in o
'?:dini3s in rtlHOs/flctif •
t O
. . . . - — - - '1 "C
.... .- ... — ... --- T> ""4 "j
„ ... 77 -'C :n TQ
"" — - ... --- --- / _j <j J2 :a
•• ?7 ?3 ?? ^ ?6
s '.a is ^j :s ;o 4o: ;? :3 o 2! 3? =5
v 13 :6 :i :5 :3 52a it *Q '7 i7 'fl "^7 ib .-3 3 !J wj tt
} !9 !5 !Q 1 — 13
? 10 13 1 2 — 1!
-.. ... . ... '3 .- It
... ... .— t j
' j j 9 9 3 9 9 3 5
L i ? -a
^. • ' . i •??a 11 -c i T
rc •; "i <14n 7n ^ ""?
;c 71 *q -7
?« tc '1 1i;<7 7; '3 •;;
1! :4 :1 ^9
42 :* J3 ;3:3 44 -:b ;!!
35 43 ^3 2??C i1 7C 77
2S 25 :2 -6!3 CS 32 tS
t t' :n 11
S 5 i 5
*
1 Qid
11
"Q
:4
34I'
34•"1
« r13
5
c3
C
:3Q
3
1C•3
1 Q
17
-1
72
TS
37
3fi3470i7
5
J
4
-:22
3
'0
1 T
74
if
33i'i
31
2417
IF13
1
4
»
'C13
'6
1 1IDt o13
11
23
24
2523ibinf U
•*
4
j
,3
J
i ?
ifl;U
in
• 4
17
13
13
1713
1
7L
«t
T
„
r5
in
I]
13
13
hc5
4s
3
7
«fl
c
7
b
5
4
4
T
3
^J
?:3
...
...
...
3
,i
7

Appendix FSHALLOW GROUNDWATER SAMPLING
GLT913/035.50-6

Appendix FSHALLOW GROUNDWATER SAMPLING
INTRODUCTION
The shallow groundwater sampling investigation consisted of samplinggroundwater through a narrow probe and analyzing the samples in the onsiteclose support laboratory. The analysis and results are discussed in Appendix G.This investigation was substituted for the soil gas survey of Subtask FT, SolventDisposal Area Investigation, when evaluation of the initial soil gas resultsindicated a high degree of variability in analytical results. Also soil moisture,which reduces soil gas VOC concentrations, was high as a result of the springthaw.
The objectives of the shallow groundwater sampling investigation were:
o To locate the major disposal area for solvent waste within thelandfill
o To determine the extent of the floating naphtha downgradient ofthe landfill
o To provide additional groundwater analytical data to aid inselecting locations for monitoring wells
The third objective was not originally an objective of the soil gas survey, but wasadded during the field investigation to reduce drilling costs and potentially avoidthe need for an additional phase of monitoring well installations.
Sampling was conducted in two episodes, from March 19 to 21 and fromMarch 28 to 30, 1989. The sample team leader on all days of sampling was PhilSmith. Additional samplers were:
o Jeff LaMont on March 19 to 21, 28, and 30
o Dan Plomb on March 28 and 29
o Kevin Olson on March 29
FIELD PROCEDURES
Sampling was accomplished by driving a 0.625-inch O.D. stainless steel probe toabout 2 feet below the water table and withdrawing a 40-ml sample with aperistaltic pump. The probe consisted of a 10-inch slotted intake tip and2.5-foot sections of stainless steel.
A slide hammer was used to drive and remove the probe. Once the probe wasat the desired depth, a 2-foot length of silicon tubing was attached to a nipple at
F-l

the end of the probe. At least three probe volumes were withdrawn with theperistaltic pump prior to rilling three 40-ml VOA vials. One of the vials wasfilled halfway for subsequent headspace analysis. The other two were rilled andcapped with no air bubbles. The vials were marked with the sample locationand stored in a cooler. Several times per day samples were delivered to theclose support laboratory for analysis of toluene, xylene, TCE, PCE, and1,1,1-TCA.
A headspace analysis was performed in the field to provide information forsample dilution and to aid in the selection of the subsequent probe samplinglocations. A half-filled VOA vial was heated for 5 minutes on the auto heateroutlet. The vial lid was opened slightly to allow insertion of an HNu probe tomeasure organic vapors.
Field blanks were collected by drawing distilled water through the probe tip and5 feet of pipe with the peristaltic pump. Field duplicates were taken by fillingsix VOA vials instead of three.
Decontamination of the probe and silicone tubing was performed at each samplelocation. The probe tip and each 2.5-foot section were removed anddecontaminated individually. The sections were scrubbed in a solution of waterand trisodium triphosplate and rinsed in distilled water; a 10 percent solution ofmethanol and distilled water, and again in distilled water. Silicon tubing wasdecontaminated by drawing at least three tubing volumes through the tubing.
RESULTS
Shallow groundwater sampling locations were selected based on HNu headspaceresults and laboratory testing results. Table F-l presents the probe samplinglocations, HNu headspace results, and observations during sampling.
GLT913/074.50
F-2

Table F-l
SHALLOW GROUNDWATER SAMPLING RESULTS
Saiple
Hu«ber
PB-01
PB-02
PB-03
PB-04
PB-05
PB-O6
PB-07
PB-08
PB-O9
PB-10
PB-11
PB-12
PB-13
PB-14
PB-15
PB-16
PB-17
FB-1B
PB-19
PB-20
PB-21
PB-22
PB-23
PB-24
PB-25
PB-26
PB-27
PB-28
PB-29
Grid
Coordinates
160E 160N80E 90N
20H SON
80E 30N
160E 30N
Probe blankBottle blank40H 30NSON 90N160E 80S
240E 70S
320E 80S
372E 40S
400E 160S
570E 70S
680E SOS
600E 160S
480E 160S
OE 200N
40H 330N
10E 430N
70E S40N
15OH 410N
680E 430N
680E 280N
655E 160N
Probe blank
Depth ofProbleTip
13 ' 6"51
4' 3"4' 3"5, 4«
—~5' 10"3, 4«
41 10"15" 10"17' 0"19' 6"16* 6"21' 6"21' 0"18' 6"21' 0"3' 4"12'6"15' 6"21' 0"14' 4"8' 4"8' 0"15' 10"
—
Date
3/19/89
3/19/89
3/19/89
3/19/89
3/19/89
3/19/89
3/19/89
3/19/89
3/19/89
3/19/89
3/19/89
3/20/89
3/20/89
3/20/89
3/20/89
3/20/89
3/20/89
3/20/89
3/20/89
3/20/89
3/20/89
3/20/89
3/20/89
3/21/89
3/21/89
3/21/89
3/21/89
Ti«e
1050
1137
1145
1330
1340
1409
1420
1437
1504
1534
1605
8048459181022
1115
1150
1337
1404
1430
1505
1608
1700
8419211000
1025
HNuHeadspace(PP>)
50040050550070.5551.517020018125351401.51.526048060260631151.5
Observations
Sheen on water saiple
Slight sheen on water sampleHNu reading Bay be due to Moisture evaporation froa probe
Light allky brown colorSlight yellow-green color; slight foa»lng when shakenSlight yellow-green color; slight foailng when shaken
Slightly cloudy; naphtha siYellow-green colorSlightly cloudy; foavlng
ill during purging
Yellow-green color; slightly cloudyYellow-green color; slightly cloudyYellow-green color; slightly cloudyYellow-green color; slightly cloudy

Table F-l (Continued)
SampleNuaber
PB-30PB-31PB-32PB-33Pfi-34PB-35PB-36FB-37PB-38PB-39PB-40FB-41PB-42PB-43PB-44
GridCoordinates
UOE 440N180E 450N120E 530N200E 350N120E 350N190E 160N300N 400N290N 490N340H 310N210H 420N2 ION 420N2 ION 340NProbe blank300N 200N200N BON
Depth ofProbleTip
19' 0"21 ' 0"20' 0-21 '14' 0"13' 0"8' 0"41 0"5' 0"10' 4"10' 4"8' 0"~51 6"8' 0"
Date
3/29/893/29/893/29/893/29/893/30/893/30/893/30/893/30/893/30/893/30/893/30/893/30/893/30/893/30/893/30/89
Tine
101213531435
11071205142314501700150815081S30154316371612
HNuHeadspace
(ppa) Observations
400 Slight foaaing60 Slight foanlng90
No saaple obtained450420 Slight foaaing96433 Field duplicate of PB-393024
GLT866/46

Appendix GCLOSE SUPPORT LABORATORY ANALYSIS
GLT913/035.50-7

Appendix GCLOSE SUPPORT LABORATORY ANALYSIS
INTRODUCTION
From March 21, 1989 to April 30, 1989, a CH2M HILL Close SupportLaboratory (CSL) was deployed at the Onalaska Municipal Landfill ARCS Vsite in Onalaska, Wisconsin. The CSL, equipped with a Hewlett-Packard 5890Agas chromatograph in conjunction with both a flame ionization detector andelectron capture detectors, was used to analyze soil and water samples for thefollowing target compounds, which were selected based on available historicaldata from previous investigations at the site:
Compound Abbreviation
1,1,1-Trichloroethane 1,1,1-TCATrichloroethene TCEPerchloroethylene PCEToluene TOLXylenes XYL
The purpose of the CSL was to provide an onsite Level II sample screeninganalysis with quick turnaround, and thereby allow for informed and timely fielddecisions on where to place monitoring wells and what samples to submit to theCLP. This technical memorandum addresses both the usability of the resultantCSL data and compliance with the project data quality objectives.
Before using the CSL analytical data, the user must be familiar with the generalworkings of gas chromatography (GC) methods, the QA/QC protocolincorporated in the named methods, the major influences on the GC system, andthe onsite CSL operations. This memorandum provides the reader with ageneral understanding of gas chromatography and how GC was integrated intothe Onalaska project as part of the CSL. In addition, this memorandum willaddress the qualify control/quality assurance measures needed to assess dataquality and describe how these measures were incorporated into the CSL.Finally, the memorandum focuses on the actual CSL data and discusses itsusability.
ANALYTICAL APPROACH
The basic components of a laboratory gas chromatograph include the oven,column, integrator, and carrier gas. The standard GC analytical method isdescribed below.
Prior to GC analysis, soil samples are extracted with a suitable solvent. Thesolvent allows for mass transfer of organics from the sample into the solvent.Once the sample has been extracted with solvent (done by physically agitatingthe solvent/sample mixture), the resultant extract may be used for GC analysis.
G-l

A small portion of the extract (0.5 jil to 5 jjl) is then injected into the injectionport of the GC, where it is vaporized.
Next the carrier gas, which continuously purges the system, sweeps the samplecomponents into the GC column. As the compounds are swept through thecolumn, the individual compounds will begin to separate. Chromatographicseparation is a function of both chemical and physical properties of the columnand the sample constituents. Consequently, the individual compounds elute atdifferent characteristic retention times. (Retention time is the time betweenextract injection and compound detection.) Detection occurs at the column'send by use of various detectors. The relative response by the detector is ameasure of a compounds concentration. Identification and quantification ofcompounds are based on expected retention time and response as compared tocalibration standards.
A site-specific method was developed that met project objectives for theOnalaska site. CSL staff employed standard gas chromatography methods toanalyze soil samples (EPA Method 3550-Sonification Extraction and Method8000-Gas Chromatography Analysis as found in SW846, Test Methods forEvaluating Solid Waste, 3rd edition, 1986). Pentane was used in conjunction withphysical agitation to extract the Onalaska target compounds from the samplematrix. The extract was subsequently analyzed on a capillary gas chromatographusing an electron capture detector (ECD) for the chlorinated compounds and aflame ionization detector (FID) for the aromatic compounds. Gaschromatography with an ECD or FID is a common instrumental analysis used bylaboratories for the qualification and quantification of complex mixtures.
CSL OPERATIONS
The CSL was housed in the EPA laboratory trailer. During mobilization of theCSL, the HP5890A GC with the HP3392 Integrator and the HP7673Autosampler were interfaced and powered up. The required GC gases werethen installed, and appropriate flows were established. Nitrogen (ultrapure) waschosen as the carrier gas, and air (zero grade) and hydrogen (ultrapure) wereneeded for the FID. The system was checked for leaks.
As mentioned earlier, both the ECD and FID detectors were used at theOnalaska CSL. The ECD is very sensitive to chlorinated compounds such asTCA, TCE, and PCE, while the FID is more appropriate for nonchlorinatedaromatics such as TOL and XYL.
To record detector response, an integrator was used to electronically calculatethe concentration of a compound. The presence of compounds eluting from theGC column results in a peak shaped response drawn on the integrator chartpaper. The integrator integrates the area under the peak, and this areacorrelates to a concentration. However, many "area counts," as they are called,do not necessarily correlate to a high compound concentration because everycompound responds differently to a detector. A 1 iig/ml standard of a givencompound may register a large peak and many area counts by GC/FID, while a
G-2

1 pg/ml standard of another compound registers a small peak with a few areacounts by GC/FID.
Calibration is required to establish gas chromatographic performance, detectorresponse factors, and retention times for each target compound. A responsefactor is defined as the standard concentration of a compound divided by thearea counts as produced by the integrator. For example, a 1 pg/ml toluenestandard that produces 20,000 area counts produces a response factor of 0.00005pg/ml per area counts.
A five-point standard calibration curve was used for the Onalaska CSL. Using2,000 pg/ml custom standards prepared and assayed by Supelco, Inc., serialdilutions to concentrations of 2.0 pg/ml, 1.0 pg/ml, 0.2 pg/ml, 0.1 pg/ml, and 0.02pg/ml were made for the ECD compounds and 5.0 pg/ml, 2.0 pg/ml, 1.0 pg/ml,0,5 pg/ml, and 0.1 pg/ml for the FID compounds. All standards were preparedusing Burdick & Jackson GC-Capillary Grade Pentane. Before any standardswere analyzed, the pentane was analyzed by GC/FID-ECD to establish the levelof purity.
A five-level calibration was performed to assess detector linearity because adetector does not respond uniformly over a wide concentration range. As aresult, a good working range must be found where the detector response islinear and the subsequent response factors are relatively constant. Samples ofunknown concentration are then analyzed within this working range. If a sampleconcentration exceeds the working range, it must be diluted and reanalyzed.
QUALITY ASSURANCE/QUALITY CONTROL AND CSL DATA VALIDATION
The Onalaska CSL analytical program involves a number of special analyses tocharacterize the quality of a data set. The following questionnaire presents theconcerns of an environmental chemist regarding the validity of any analyticalmethod. They are followed by QA/QC procedures that must be pan of theanalytical approach to address the issue of concern.
1. Is the instrument-system working?
Relevant QA/QC Procedure: Initial calibration, continuingcalibration, and retention time markers
2. Is the method working?
Relevant QA/QC Procedure: Matrix spike/matrix spike duplicates
3. Are analytical results reproducible?
Relevant QA/QC Procedure: Laboratory duplicates
G-3

4. Is there a problem with laboratory cross-contamination?
Relevant QA/QC Procedure: Laboratory blanks—solvent, syringe,method
5. Is there a problem with cross-contamination due to sampling?
Relevant QA/QC Procedure: Field blanks
6. Is the sampling being performed in a reproducible fashion?
Relevant QA/QC Procedure: Field duplicates
CALIBRATION
Instrument calibration must precede any sample analysis. More specifically,instrument calibration conforming to QA/QC criteria must be demonstrated. Forthe Onalaska CSL, initial calibration consisted of the analysis of a series ofstandards. Specifically, the concentrations mentioned earlier were analyzed byGC/FED-ECD in succession. A calibration curve for each compound could thenbe constructed by plotting standard concentration on the abscissa and thecorresponding area counts on the ordinate. The plot should show a directrelationship between the standard concentration and area counts. Between thelow and high standards, the calibration curve should be linear, and hence thisregion defines the working linear range for the analysis. The linearity of theworking range is determined by using least squares to compute the correlationcoefficient from the calibration data. The correlation coefficient for a linearsegment is 1.00. Standards were analyzed until the calibration curve correlationcoefficients were 0.98 and better.
CONTINUING CALIBRATION
After initial calibration was completed, analysis of samples began. GC systemschange with time due to factors such as column condition and changing flowrates, so it was necessary to continuously monitor the GC by continuing tocalibrate. The midrange standard was analyzed periodically to determine GCperformance. The Onalaska CSL SOP set a continuing calibration frequency ofone in twenty, but CSL staff checked calibration more frequently to ensure thereliability of GC results.
RETENTION TIME MARKER
A retention time (RT) marker is a compound that can be used to measureretention time drift and injection reproducibility. In most cases, a solventimpurity peak is likely to be chosen as an RT marker because it exists at aspecific concentration that will not change and it elutes at a characteristicretention time. Therefore, both the retention time and the area counts of theRT marker should be consistent from run to run. By monitoring the RTmarker, the GC system is monitored indirectly.
G-4

SPIKED SAMPLES
Spike sample analyses are done to determine the effect of the sample matrix onthe solvent extraction method and on measurement procedures. To prepare amatrix spike (MS), a known amount of compound is added to a sample, thesample is analyzed, and the amount of the spiked compound recovered iscompared to the amount added
Matrix spike analysis was performed as part of the CSL analysis. A matrix spikeis a target compound added to a sample and prepared as a sample. Matrixspike samples are analyzed to evaluate matrix effects on the analytical method.Poor recoveries may be due to poor sample preparation and an inefficientextraction process, a GC system that has changed, matrix interferences, or otherfactors.
Percent recovery for a target compound spike is calculated by:
R = [(SSR-SR)/SA] x 100
where:
SSR = spike sample resultSR = sample resultSA = spike added
Because of their physical/chemical characteristics, certain compounds can bereadily extracted. After years of performing rigorous statistical analyses onhistorical data, the EPA has developed acceptable recovery ranges for TCLcompounds. These ranges represent empirical benchmarks; however, they areuseful in gauging the extraction efficiency of a solvent for a given compound.
Using matrix spike/matrix spike duplicate data, it is possible to construct qualitycontrol charts that illustrate the accuracy of the spike analysis. Such a controlchart is constructed by plotting percent recoveries on the ordinate and datesanalyzed on the abscissa. Reading the chart from left to right, the data pointsshould cluster near the 100 recovery line.
If there is just one analyst for a project's duration, recoveries will trend closer tothe 100 percent recovery line. This is because over time the analyst has honedhis or her technique. Conversely, a trend may not be discernable if more thanone analyst staffed the laboratory for the project's duration.
DUPLICATES
Duplicates refer to two representative aliquots from a discrete sample. Bothfield and laboratory duplicate samples were analyzed to determine dataprecision, a measure of reproducibility of the analysis. The results were thenreported as relative percent difference (RPD) and were calculated by:
G-5

RPD = [[(Dl-D2)/[(Dl+D2)/2]] x 100
where:
Dl = concentration of the first duplicateD2 = concentration of the second duplicate
Matrix Spike Duplicates
To prepare a matrix spike duplicate (MSD), a given sample is separated intotwo fractions and each fraction is spiked with the same amount of knowncompound There are now two samples: the matrix spike and the matrix spikeduplicate.
Taken together, the percent recoveries for the MS/MSD are used to calculatethe relative percent difference between the two numbers. RPD is a measure ofprecision. In other words, two samples derived from the same location andspiked with equal amounts of target compound should produce recoveries thatare identical. In practice it is very difficult to spike two different samples withexactly equal amounts of a target compound, so it is unlikely that the twosamples will be exactly the same. Consequently, the EPA has set quality controllimits for RPD.
Using MS/MSD data, a quality control chart can be constructed that willgraphically show the precision for the spike analysis. The control chart isconstructed by plotting RPDs on the ordinate versus dates analyzed on theabscissa. Reading from left to right, the data points should cluster near the 0.0RPD baseline.
Laboratory Duplicates
As the name suggests, laboratory duplicates are duplicates prepared in thelaboratory to monitor laboratory reproducibility. To prepare a laboratoryduplicate, a sample is split into two fractions and prepared and analyzed as twodiscrete samples. The results for the two samples should fall within certainQA/QC criteria for RPDs. Poor replication may indicate laboratory carelessness.Regardless, laboratory duplicates must be interpreted carefully since somematrixes are inherently difficult to replicate perfectly. In such cases, the QA/QCcriteria may be adjusted accordingly.
Field Duplicates
Two samples collected in the field at the same location, depth, and orientationcomprise a sample and a field duplicate. As might be expected, there is a greatdeal of variability associated with field duplicates, especially soil, because of theheterogeneous composition of the matrix.
G-6

BLANKS
A blank is a clean sample equivalent that is processed and analyzed as a sampleto determine the existence and magnitude of potential contamination introducedduring sampling, shipping, or analysis. The general heading of "blanks" can beseparated into field blanks and laboratory blanks.
Field Blanks
Field blanks check field decontamination procedures. They are collected in thefield during a sampling effort Laboratory grade deionized water or highperformance liquid chromatography (HPLC) water is used for aqueous fieldblanks. To prepare the field blank, the water is transferred to the samplingdevice (i.e., bailer) before being transferred to the sample container. Theprocess mimics the actual groundwater sampling procedure.
Laboratory Blanks
Laboratory blanks check laboratory procedures. They can be divided intomethod blanks, solvent blanks, and syringe blanks.
Method Blanks. Method blanks are prepared in the laboratory as part of theanalytical protocol. These blanks, prepared from HPLC grade water or washedsand, are processed along with the samples through each sample preparationand analysis step. Method blanks check possible contamination that might havebeen introduced during sample preparation.
Solvent Blanks. Since the analytical method used at Onalaska required asolvent extraction sample preparation, it was imperative to periodically check thesolvent for contamination. This was accomplished by analyzing the solvent byGC/F1D. A contaminated solvent could lead to false positives.
Syringe Blanks. All sample extracts are introduced into the GC by microlitersyringes. Even though the syringe is cleaned after each injection, it is importantto check the syringe for possible cross-contamination. This is accomplished byinjecting syringe headspace into the GC Syringe blanks also allow monitoring ofthe background signal and possible carryover caused by a previous contaminatedsample.
ONALASKA CSL DATA VALIDATION/DATA ASSESSMENT
The purpose of data validation is to determine the precision and accuracy of adata set, to characterize the weaknesses of questionable data, and to determinedata usability.
The Onalaska data were evaluated by assessing the QA/QC criteria describedearlier. These QA/QC criteria are evaluated quantitatively when their values arespecified in the analytical methods or as part of the project data qualityobjectives (DQOs). If values are not specified, a qualitative assessment is made
G-7

using established data validation procedures and a knowledge of good laboratoryprocedures.
All samples were analyzed using a flame ionization detector (FID) and electroncapture (ECD) detectors. The results for TOL and XYL were obtained usingthe FED. Due to its increased sensitivity, the ECD was used to quantify DCE,TCA, TCE, and PCE.
Overall, the data generated from the Onalaska site was determined to be goodand 100 percent usable for the DQO specified in the SOW (e.g., screeninganalysis). All CSL data is summarized in Table 1. Appendixes A and B inproject files contain the CSL computation sheets that were used to calculateconcentrations; these sheets provide a record of all samples analyzed, includingQA/QC samples. A discussion of the data validation parameters follows.
HOLDING TIMES
All samples and extracts were refrigerated from the time they were sampleduntil they were analyzed. All samples were extracted within 2 days (48 hrs) ofsampling. All extracts were analyzed within 2 days (48 hrs) of extraction. Theseholding times are well within Contract Laboratory Program (CLP) requirements.
INSTRUMENT CALIBRATION
Response factors for each detector (flame ionization detector and electroncapture detector) were calculated initially using a five-level calibration (2.0 jig/ml,1.0 pg/ml, 0.2 jig/ml, 0.1 yg/ml, and 0.02 fig/ml for the chlorinated compoundsand levels of 5.0 iig/ml, 2.0 yg/ml, 1.0 yg/ml, 0.5 yg/ml, and 0.1 yg/ml for thearomatics). Whenever a change was made in the system, a new initialcalibration was performed.
Initial Calibration
To assess the instrument performance before the analysis of any samples, thecorrelation coefficient of the least squares line was calculated for eachcompound and the total response was considered.
Continuing Calibration
A continuing calibration standard was analyzed before each set of samples andused to calculate the concentration of the target compounds in each batch. Toassess instrument stability before sample analysis, the percent difference betweenthe response factor (RF) for the initial standard and the continuing calibrationresponse factor was calculated. The criteria for continuing calibration RFsallowed for a +15 percent variance from the initial calibration RF. Allcontinuing caUBration criteria were met.
G-8

DETECTION LIMITS
The working ranges established for the target compounds were based onanticipated concentrations of Onalaska-derived samples. The working range forDCE, TCA, TCE, and PCE was 0.02 pg/ml to 2.0 yg/ml, while the working rangefor TOL and XYL was 0.1 pg/ml to 5.0 jig/ml. This is not to say theinstrument could not detect compounds at concentrations lower than the low endstandard of the working range; detection limits are a function of instrumentcapabilities and analytical methodologies.
The instrument detection limit (IDL) represents the lowest concentration aninstrument can detect. This concentration must be discernable from backgroundnoise. The EDL represents a theoretical detection limit because one is assuming100 percent extraction efficiency and no chemical/physical or electronicinterferences. The IDL is determined by analyzing the low standard of theworking range. This standard is analyzed repeatedly, and statistics areperformed on the pool of standards data.
The method detection limit (MDL) represents the lowest concentration theinstrument can detect for a certain methodology. Because of extractioninefficiencies and interferences, the MDL will always be greater than the IDL.To determine the MDL, matrixes are spiked with compounds at sequentiallylower concentrations until the concentrations can no longer be detected. Ingeneral, the MDL is twice the IDL
The Onalaska CSL results indicate that compounds are sometimes detectedabove the MDL but below the working range for the detector. In such case,compounds are qualitatively identified but quantitatively suspect because theconcentrations do not fall within the working calibration range. Accordingly,these values are flagged with a "J," meaning estimated.
BLANK ANALYSIS
A blank sample containing only the extraction solvent was analyzed with eachbatch of samples. The amount of target compound in the blank was consideredin determining whether any compound found in the sample could have comefrom the solvents. No blank contaminant was found at a level greater than 10percent of the compound at the reported detection limit; therefore, noqualification of the data was necessary due to blank contamination. See Table 1for blank sample results.
MATRIX SPIKE/MATRIX SPIKE DUPLICATES
Tables 3, 4, 5, 6, and 7 in the project files following the text summarize therecovery of compounds detected in the matrix spike and matrix spike duplicatesamples. Regarding the MS/MSD samples, the recovery of target compoundswas within the specified control limits set in the analytical method. In somecases the recoveries were outside of the control limits because the samplechosen to be spiked was highly contaminated. High levels of organic compoundbackground in highly contaminated samples caused inaccuracy in the integration,and therefore quantitation, of the target compounds. Regardless, the recoveries
G-9

for the "clean" samples demonstrated the validity of the method. As for theduplicate analyses, RPDs between like samples were within QA/QC acceptableranges.
No qualification of the data was necessary since these results do not indicate aproblem with the sample matrix in the recovery of target compounds. Figures 6,7, 8, 9, 10, 11, 12, 13, 14, and 15 in the project files graphically depict theresults of the MS/MSD samples.
For an interpretation of the control charts, please refer to relevant sections ofthis memorandum.
CSL UGC FINGERPRINT* STUDY
According to past records, it is known that naphtha was disposed of at theOnalaska site. However, it is unclear as to the specific identity of the naphthapollutants. In addition, soil was found to be visibly contaminated near MW14S,outside the area of suspected naphtha contamination. The area near MW14Shad a diesel fuel odor. As an aside experiment, the CSL staff analyzed anumber of samples of diesel fuels and attempted to match the resultantchromatograms with pure product sample chromatograms. Unfortunately, nopure product was captured for analysis and no obvious correlation was observedbetween the diesel fuel chromatograms and the sample chromatograms. This isnot surprising given the differences between the Onalaska CSL targetcompounds and typical naphtha (oil variety) constituents. Figures 16 and 17 inthe project files show example chromatograms.
GLT913/067.50
G-10

4/19/89
TABLE 1
ONALASKA CLOSE SUPPORT LABORATORY DATA
Units for Water - ug/ml (ppm)
Units for Soil = mg/kg
Field I.D.
GB-07-01GB-07-02GB-08 (55'-58')GB-03-01GB08 (18'-28')GB03-02GB04(8'-1V)GB04 (54'-571)MW04 <20'-30f)MW-2S-01GB-01-01 (80')GB-OH120')MW-5S-01MW-2M-01MW-1S-23'MW-2D(108'-111')MW-1M-01MW-3S-01MW-7S(25'-30')
GC RUN*
128129130131134135136137139140141147155156158159160161162
CSL I.D.
13579
1113151921232717252931333537
Date Analyzed
3/17/893/17/893/17/893/17/893/17/893/17/893/17/893/17/893/17/893/17/893/17/893/18/893/18/893/18/893/18/893/18/893/18/893/18/893/18/89
Toluene
0.080 N0.1200.040 N0.6900.040 N0.110 N0.390 N0.1000.1100.130 N0.150 N0.140 N4.51
BMDL
0./70 N
BMDL
0.030 N
6.580.160 N
Xvlenes
0.020 J0.010 JBMDL
1.12BMDLBMDLBMDL0.040 J0.060 JBMDLBMDLBMDL0.420BMDLBMDLBMDLBMDL0.530BMDL
Matrix
WaterWaterWaterWaterWaterWaterWaterWaterWaterWaterWaterWaterWaterWaterWaterWaterWaterWaterWater
N - Qualitatively suspect.J = Estimated value. Reported value is below quantitation limit.
BMDL = Below method detection limit.
20-Dec-89 ONALASKA CSL PAGE 1

4/19/89
TABLE 1
ONALASKA CLOSE SUPPORT LABORATORY DATA
Units for Water = ug/ml (ppm)Units for Soil =mg/kg
HaMI.D.
MW-7M (80--821)MW4PS01
GCRUNf CSL I.D. Date Analvzed Toluene Matrix
PB-02PB-03PB-O4PB-05PB-06PB-06PB-09PB-10PB-11GB-6M-73*Pfl-12PB-13PB-14PB-16PB-17PB-18PB-20PB-21
163206209213214215216218219220221222224225227228230231233236238
394143454749515355575961636567697375778183
3/18/893/20/893/20/893/20/893/20/893/20/893/20/893/20/893/20/893/20/893/20/893/20/893/20/893/20/893/20/893/20/893/20/893/20/893/20/893/21/893/21/89
0.IJ0 *37.9& J0.470 J0.44O0.4200.610 J8.690* J0.14O0.040 J0.050 J0.1300.3600.190 J0.010 J0.430 J0.410 J0.200 J0.1SO JS.STjd J0.14O3.40/
0.030 J1.39ff0.010 J0.020 J0.010 J0.010 J0.9500.010 J0.020 JBMOL0.22O0.230BMOL0.010 J0.220BMOLBMOLBMOL0.H00.1100.670
WaterWaterWaterWaterWaterWaterWaterWaterWaterWaterWaterWaterWaterWaterWaterWaterWaterWaterWaterWaterWater
IO-Aug-89 ONALASKA CSL PAGE 2
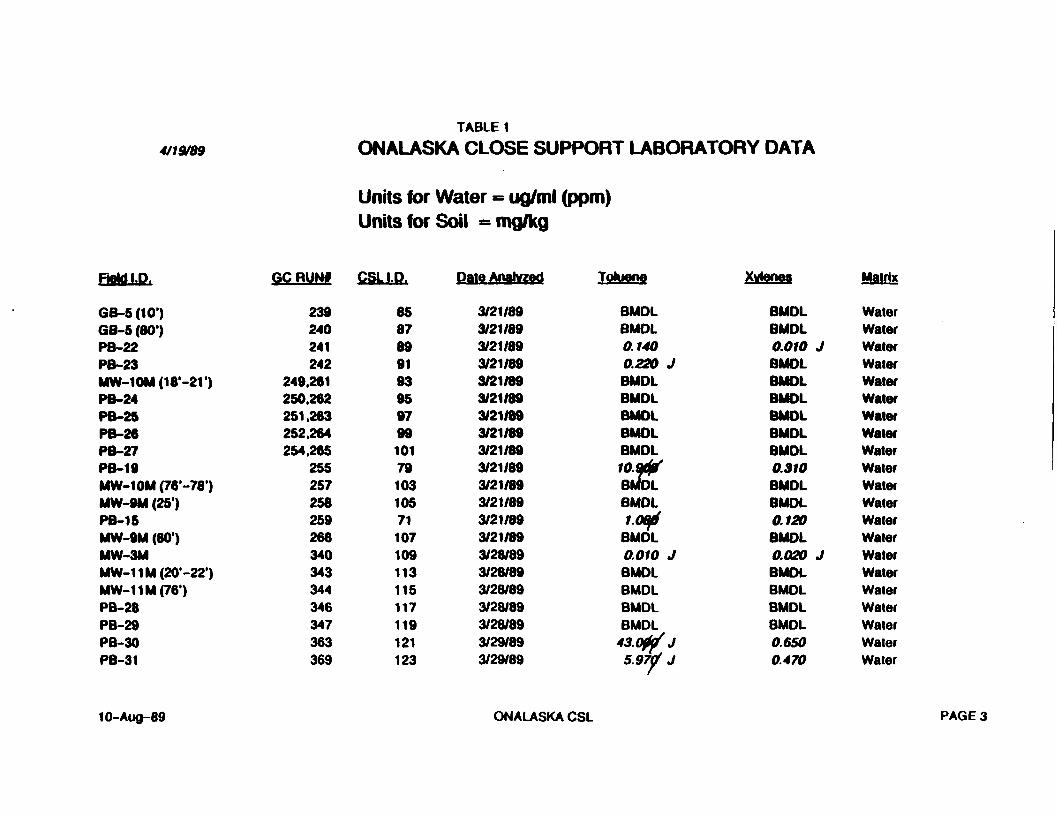
4/19/89
TABLE 1
ONALASKA CLOSE SUPPORT LABORATORY DATA
Units for Water = ug/ml (ppm)Units for Soil =mg/kg
ReMI.D. GC RUNf CSL I.D. Dale Analyzed Toluene Xvtenes Matrix
GB-S(IO')QB-5(80')PB-22PB-23MW-10M(18'-21')PB-24PB-26PB-26PB-27PB-19MW-10M (76'-78')MW-9M (25')PB-15MW-9M (80*)MW-3MMW-11M(20'-22')MW-11M(76')PB-28PB-29PB-30PB-31
239240241242
249,261250,262251,263252,264254,265
255257258259266340343344346347363369
85878991939597991017910310571107109113115117119121123
3/21/893/21/893/21/893/21/893/21/893/21/893/21/893/21/893/21/893/21/893/21/893/21/893/21/893/21/893/28/893/28/893/28/893/28/893/28/893/29/893/29/89
BMDLBMDL0.1400.220 JBMDLBMDLBMDLBMDLBMDL
BMDLBMDL
BMDL0010BMDLBMDLBMDLBMDL
5.9r
BMOLBMDL0.010 JBMDLBMDLBMDLBMOLBMDLBMDL0.310BMDLBMDL0. 120BMDL0.020 JBMDLBMDLBMDLBMDL0.6500.470
WaterWaterWaterWaterWaterWaterWaterWaterWaterWaterWaterWaterWaterWaterWaterWaterWaterWaterWaterWaterWater
10-Aug-89 ONALASKA CSL PAGES

4/19/89
TABLE 1
ONALASKA CLOSE SUPPORT LABORATORY DATA
Units for Water = ug/ml (ppm)Units for Soil =mg/kg
Field I.D.
PB-32MW-12SMW-14SMW-13SMW-8DPB-34PB-35PB-37PB-39PB-40PB-38PB-41PB-42PB-43PB-44PB-45PB-46TP-01 (CSL)TP-02(CSL)TP-03(CSL)TP-04 (CSL)
GCRUNi CSL I.D. Dale Analyzed Toluene Xvtenes
373380386389390391393395396397399401402403404405406454456463458
125127129135137131133139141143145147149151153155157159161163165
3/29/893/30/893/30/893/30/893/30/893/30/893/30/893/30/893/30/893/30/893/30/893/30/893/30/893/30/893/30/893/30/893/30/894/18/894/18/894/18/894/18/89 /v
0.770BMOLBMOLBMOLBMOL0.8900.766BMOLBMOLBMOLBMOLBMDLBMDLBMOLBMOLBMOLBMOL0.060 JBMOL0.190 J
J
WaterWaterWaterWaterWaterWaterWaterWaterWaterWaterWaterWaterWaterWaterWaterWaterWaterSoilSoilSoHSoil
10-Aug-89 ONALASKA CSL PAGE 4

4/19/89
TABLE 1
ONALASKA CLOSE SUPPORT LABORATORY DATA
Units for Water = ug/ml (ppm)Units for Soil -=mg/kg
ReMI.0.
TP-05(CSL)TP-06(CSL)TP-07(CSL)TP-06(CSL)TP-09(C8L)TP-IO(CSL)TP-FB-04 (CSL)TP-lt(CSL)TP-11-FR(CSL)TP-12(CSL)TP-13(CSL)TP-14 (CSL)
GCRUNf CSL I.D. Date Analyzed Toluene
464466467469472474479480483486488490
167169171173177179181183185187189191
4/18/894/18/894/18/894/18/894/18/894/18/894/19/894/19/694/19/894/19/894/19/894/19/89
BMOLBMOLBMOL0.670BMOLBMOLBMOL
9.67f JBMOLBMOLBMOL
Matrix
SoUSONSotfSONSONSONSONSONSONSoHSONSON
IO-Aug-89 ONALASKA CSL PAGES

4-20-89
TABLE 1
ONALASKA CLOSE SUPPORT LABORATORY DATAUnits for Water = ug/ml (ppm)Units for Soil = mg/kg
Field I.D. GCRUNi CSL I.D. DateAnalyzed
1.1.1-TCA JCE ECI Matrix
GB03-02QB04(8'-1V)GB04 (S4'-57')MW-5S-01MW04 (20--301)MW-2S-01GB-01-01 (80')MW-2M-01QB-07-01QB-07-02QBOBfSS'-SS')QB-01 (120')MW-1S-23'
MW-1M-01MW-3S-01
MW-7M-(801-82t)MW4PS-01GB-06<18'-2r)
9293949598979899
101102103171176177178179181182186187
1214161820222426246283032343638404244
3715/893/15/893/15/893/15/893/157893/15/893/15/893/15/893/15/893/15/893/15/893/19/893/19/893/19/893/19/893/19/893/19/893/19/893/19/893/19/89
BMDLBMDLBMOLBMDLBMDLBMDLBMDLBMOL0.010BMDLBMDLBMOLBMOLBMOLBMOL0.150BMOLBMDL0.730BMOL
BMOLBMOLBMDLBMOLBMOLBMDLBMDLBMOLBMOLBMOLBMDLBMOLBMOLBMOLBMOL0.010BMOLBMDL0.010BMOL
BMOLBMOLBMOLBMOLBMOLBMOLBMOLBMOLBMOLBMOLBMOLBMOLBMOLBMOLBMDLBMOLBMOLBMDLBMOLBMOL
WaterWaterWaterWaterWaterWaterWaterWaterWaterWaterWaterWaterWaterWaterWaterWaterWaterWaterWaterWater
10-Aug-89 ONALASKA CSL PAGE*

4-20-89
TABLE 1
ONALASKA CLOSE SUPPORT LABORATORY DATAUnits for Water = ug/ml (ppm)Units for Soil = mg/kg
Field I.D.
PB-02PB-03PB-04PB-05PB-06PB-09PS-10PB-11GB-6M (73*)PB-12PB-13PB-14Pfl-16PB-17PB-18PB-18OUPPB-20PB-21GB-S(IO')GB-5 (80')PB-22
WWf
192193195196197272273274276277278279280282283284285287288289290
CSL I.D.
464850525458606264666870747678
7BDUP8284868890
DateAnalyzed
3/19/893/19/893/19/893/19/893/19/893/21/893/21/893/21/893/21/893/21/893/21/893/21/893/21/893/21/893/21/893/21/893/22/893/22/893/22/893/22/893/22/89
1.1.1-TCA
BMDL0.008BMDL0.050BMDLBMDLBMDLBMDLBMDLBMDLBMDLBMDL0.0100.040BMDLBMDLBMDL0.090BMDLBMDLBMDL
ICE
BMDLBMDLBMDLBMDLBMDLBMDLBMDLBMDLBMDLBMDLBMDLBMDLBMDLBMDLBMDLBMDLBMDLBMDLBMDLBMDLBMDL
P£g
BMDLBMDLBMDL0.010BMDLBMDLBMOLBMDLBMDLBMDLBMDLBMDLBMDLBMDLBMDLBMDLBMDLBMDLBMDLBMDLBMOL
Mauls
WaterWaterWaterWaterWaterWaterWaterWaterWaterWaterWaterWaterWaterWaterWaterWaterWaterWaterWaterWaterWater
10-Aug-89 ONALASKA CSL PAGE

4-20-89
TABLE 1
ONALASKA CLOSE SUPPORT LABORATORY DATAUnits for Water = ug/ml (ppm)Units for Soil = mg/kg
FtehJID.
PB-23MW-10M (18-2V)P8-24PB-25PB-26PB-27MW-10M (76'-78')MW-9M (25')MW-9M (80')PB-06PB-15PB-19HOSE DISC WATERMW-3MMW-11M(20'-22')MW-11M(76')PB-28PB-29PB-30PB-31PB-32
QCRUNf
292293294295297298299300301302308309310311312313417418419424425
CSL I.D.
92949698100102104106108567280112110114116118120122124126
DateAnalyzed
3/22/893/22/893/22/893/22/893/22/893/22/893/22/893/22/893/22/893/22/893/22/893/22/893/22/893/22/893/22/893/22/893/31/893/31/893/31/893/31/893/31/89
1.1.1-TCA
BMOLBMOLBMDLBMOLBMOLBMDLBMDLBMDLBMDLBMDL0.450BMDLBMDLBMDLBMDLBMDLBMDLBMDL0.010 J0.4700.020
IQI
BMDLBMDLBMDLBMDLBMDLBMDLBMDLBMDLBMDLBMOLBMOLBMDLBMDLBMDLBMOLBMDLBMDLBMDLBMDLBMDLBMDL
PQE
BMDLBMDLBMDLBMDLBMDLBMDLBMDLBMOLBMOLBMOLBMDLBMOLBMOLBMDLBMOLBMOLBMDLBMDLBMDLBMOLBMDL
Matrix
WaterWaterWaterWaterWaterWaterWaterWaterWaterWaterWaterWaterWaterWaterWaterWaterWaterWaterWaterWaterWater
IO-Aug-89 ONALASKA CSL PAGE/

4-20-89
TABLE 1
ONALASKA CLOSE SUPPORT LABORATORY DATAUnits for Water = ug/ml (ppm)Units for Soil = mg/kg
FteMI.D.
MW-12SMW-14SPB-34PB-35PB-38MW-80PB-37PB-39PB-40PB-41PB-42PB-43PB-44TP-01TP-02TP-03TP-04TP-05TP-06TP-07TP-08
lUNf
426427431432433434435436437436439440441506507508509511512513514
CSLI.O.
128130132134136138140142144148150152154160162164166168170172174
DateAnalyzed
3/31/893/31/893/31/893/31/893/31/893/31/893/31/893/31/893/31/893/31/893/31/893/31/893/31/894/20/894/20/894/20/894/20/894/20/894/20/894/20/894/20/89
1.1.1-TCA
BMDLBMDL0.2100.040BMDLBMDLBMDLBMDLBMDLBMDLBMDLBMDLBMDLBMDLBMDLBMDLBMDLBMDLBMDLBMDLBMDL
JCE
BMDLBMDL0.010BMDLBMDLBMDLBMDLBMDLBMDLBMDLBMDLBMDLBMDLBMDLBMDLBMDLBMDLBMDLBMDLBMDLBMDL
P£E
BMDLBMDLBMDLBMDLBMDLBMDLBMOLBMDLBMDLBMDLBMDLBMDLBMDLBMDLBMDLBMDL0.010BMDLBMDLBMDLBMDL
Matrix
WaterWaterWaterWaterWaterWaterWaterWaterWaterWaterWaterWaterWaterSoHSONSoHSoilSoilSoilSoilSoil
IO-Aug-89 ONALASKA CSL PAGE

4-20-89
TABLE 1
ONALASKA CLOSE SUPPORT LABORATORY DATAUnits for Water «= ug/ml (ppm)Units for Soil = mg/kg
Field I.D.
MW-14S (8.5')TP-09TP-10TP-FR-04TP-11TP-11-FRTP-12TP-13
QCRUHi
515518517518519520521522
CSLI.D.
178178180182184186188190
DaleAnalyzed
4/20/894/20/894/20/894/20/894/20/894/20/894/20/894720/89
1.1.1-TCA
BMDLBMOLBMDLBMDLBMDLBMDLBMDLBMDL
IC§
BMDLBMDLBMDLBMDLBMDLBMDLBMDLBMDL
ES6
BMDLBMDLBMDLBMDLBMDLBMDLBMDLBMOL
Matrix
SOUSONSONSONSoMSONSONSON
IO-Aug-89 ONALASKA CSL PAGE* /,

Appendix HSOURCE AREA AND TEST PIT INVESTIGATION
GLT913/035JCW

Appendix HSOURCE AREA TEST PIT INVESTIGATION
INTRODUCTION
The source area test pit investigation was conducted between April 17 and 19,1989 to fulfill the requirements of Task FI, Subtask FT, Solvent Disposal AreaInvestigation. The objectives of the investigation were:
o To locate the major disposal area for the solvent waste within thelandfill and to evaluate the degree of contamination in theunsaturated soils in this area
o To obtain data important in the evaluation of soil incineration andoffsite disposal
o To locate and determine the condition of a cache of 300 drumsand a 500-gallon tank truck buried at the landfill site
Four test pits were excavated to a maximum depth of 14 feet. Test pit locationswere selected based on the results of the geophysical investigation andobservations made during the hydrogeological investigation. Test pit locationsare shown in Figure H-l.
Fourteen soil samples were taken from the test pits for analysis by the closesupport laboratory. Soil samples were extracted and analyzed for indicatorVOCs. Sample locations are shown on the test pit logs. Based on the results oftesting and visual observation, eight soil samples were submitted for CLPanalysis of TCL organic and inorganic chemicals as well as total organic carbon(TOC), total organic halides (TOX), sulfur, moisture content, Btu content andEP toxicity.
The following persons were on site specifically for the source area test pitinvestigation:
Team Member Affiliation Responsibility
Jeff Lament CH2M HILL Field Team LeaderKevin Olson CH2M HILL Site Safety OfficerChris Lawrence CH2M HILL Test Pit Logging/SamplingJeff Salerno ETI Backhoe OperatorDave Cruise ETI Helper
FIELD PROCEDURES
Test pits were excavated using a John Deere JD-310A wheel-mounted backhoeloader. The backhoe, operator, and helper were all provided by Exploration
H-l

STORAGE 645,5AREA .;; ,', : • - . - • ---
,-....s~i. ..::S;7...
±
Ik
s
LEGENDLIMITS OF LANDFILL AS
'-. — — "• DETERMINED BY GEOPHYSICAL SURVEY
DEEP TEST PIT LOCATION(Pttnottoscato)
•.":•.FK3URE H-1DEEP TEST PIT LOCATIONSONALASKA LANDFILL RVFS

Technologies, Inc. (ETT), an environmental services firm based in Madison,Wisconsin.
For aJJ test pits, the top 2 feet of soil was assumed to be uncontaminated covermaterial and was stockpiled separately from the material encountered duringfurther excavation. All excavated material encountered more than 2 feet belowground surface was stockpiled on a layer of 6-mil polyethylene, which was placedon the ground surface adjacent to the test pit before the start of excavation.
Test pits were excavated in passes approximately 12 inches deep. Uniformpasses were difficult because of the nature of the waste material. The maximumdepth of excavation was limited to approximately 14 feet by the reach of thebackhoe. The backhoe could excavate approximately 10 linear feet of trenchfrom one location. After the limits of excavation were reached from onelocation, the backhoe would move forward and excavation would continue. Testpit trenches ranged from 2 to 8 feet wide by 28 to 40 feet long. The actualdimensions of each pit are shown on the test pit logs. Each test pit was loggedusing the Unified Soil Classification System. Test pits were backfilled in reverseof the order by which they were excavated using the front-end loader bucket
Air in the breathing zone was continuously monitored during excavation andbackfilling, using an HNu photoionization device (PID). If sustained PIDreadings above background were observed, field team members would upgradeto level B personal protective equipment
Fourteen soil samples were taken for analysis by the close support laboratory.Sample locations were chosen on the basis of visual observations (materialchanges, discolorations, or adjacent to an anomaly). Samples were also takenfrom the last layer of soil excavated for all test pits.
TEST PIT EXCAVATION SUMMARY
Test pit DTP-01 was excavated on April 17, test pits DTP-02 and DTP-03 wereexcavated on April 18, and test pit DTP-04 was excavated on April 19. A briefdescription of each test pit is given below. The test pits varied laterally in thetypes and thicknesses of material encountered, and a more accurate descriptionof each pit is presented in the test pit wall logs (Figures H-2 through H-5).
DTP-01
DTP-01 was excavated from Station 1+OOE, 4+80N to Station 1+OOE, 4+40N.The ground surface elevation was approximately 662 feet The pit wasapproximately 40 feet long by 2 feet wide and was excavated to a maximumdepth of 13 feet
The first 12 inches of excavated material consisted of brown well-graded sandwith silt This was underlain by a layer of gray silty clayey sand, ranging inthickness from 6 inches at the south end of the pit to 12 inches at the north
H-2

PROJECT NUMBER
GLO65550.FLFT
TEST PIT NUMBER
DTP-O1 SHEET 1 OF 1
TEST PIT WALL LOG
1+OOE.4+eONTO1+OOE.4+40N
ELEVATION _$•* DATE EXCAVATEDCONTRACTORJ.IAMONT/C.LAWRENCEEXCAVATION METHOD BACKHOE - JD - 310AWATER LEVEL AND PATE 13* B.Q.S. 4/17/89
DEPTH 12-13 REMARKSAPPROXIMATE MMEN8ION8: LENGTH
X .SAMPLE TP-02 M.CUEOTOFME
MNDAROWHUOISTJIEDIUHOBMEfM'-W*UAMCLAK QBAYJ*OtSWTFF
UOMTJUEMJM DEN8E
OCNK. MTERLAYERCO WITH(IMA
WEU ORAOEO MMD MfTN ORAVEI.COARSE TO UEMJM SAND. COMttE TOFME ORAWL. DAflKBMMWLMOBTJIHMUU DENSE TO
*SAMPLE TP-01HNU >20ppm
DEN9E4.ITTLE TO NO REFUSE (8W)
KSAMPLE TIMM
NEti. OHAOftt MM* MUM TOAWVECMCEPTQAAYER.MIEfUWED WITH WFUK (MV)
BKMMTONTOMWTCNTMU LJmtts
«'.Excavation
FIGURE H-2DTP-01ONALASKA LANDFILL Rl
18 20 22 24 26 28 30 32 34 36 38 40 SOUTH
OlOMUOFIVTPOl 10-24-M

TEST PIT NUMBERDTP-02
TEST PIT WALL LOG
PROJECT NUMBERGLO65550.H.FT
APPROXIMATE DIMENSIONS: LENGTH
HJY1AM. MED TO FMESANO.BfKMWUIOaT.MEDUMDENSE ISM
.% „»» , / JDHUM *E0| t 2 CRUSHED . I ' if - *? ^ W M « ' VSA
*-'--* I TP-
38 36 34 32 30 28 26 24 22 20 10 16 14 12 10 8
SHEET 1 OF 1
1+40E, 2+50N TO 1+70E, 2+80N MAP OF*
WALL OF PIT
DATE EXCAVATE D-lilHIL
i QGGEB c- LAWRENCE
LENGTH (FT)
COMMENTSB«g«n •xcavatlon at 0820 hrs
Stop •xcavatlon and baglnbackfUUng at 1110 break forlunch 1230 -1330 stopbackfilling at 1500.
EAST
FIGURE H-3
DTP-02ONALASKA LANDFILL Rl

PROJECT NUMBERGLO65590.R.FT
TEST PIT NUMBERDTP-03 SHEET 1 OF 1
TEST PIT WALL LOG
SAMPLE PROJECT_OMALASKA_
PI FVAT1QM M** '
2+SOE.1+20NT02+60E.1+SON MAPOF_i_ WALLOP PIT
WATER LEVEL AMD HATE NOT ENCOUNTERED
APPROXIMATE OMENtJONS: LENGTH 28*
CONTRACTOR ETI
EXCAVATION up-mnn BACKHOE JD • 310 • A
WIDTH 2* - 3' DEPTH 10.5' REMARKS.
DATE EXCAVATED -All&i&JL
CHRIS LAWRENCE
I T^ T I I I I Iaurrawax F»CMNDMCMWUIOMTJ<ED DENSE tsp-sut
I I
2-
4-
9JO*
10-10.0*
TF4MTP-10
12-
r COMMENTS
I Began •xcavatlon at 1530.
UmHsofExcavation
—i—i—i—i—i—rEAST 0 2 4 6 8 10 12
Uttto avldano* of toav*decomposition
Stop excavation and beginbackfilling at 1700 atopbackfHMng at 1800.
~i i i i i—i—i—i—i—i—i—i—r~14 16 18 20 22 24 26 28 30 32 34 36 38 40 WEST
LENGTH (FT)
FIGURE H-4DTP-03ONALASKA LANDFILL Rl
(HOMMOFl\IP03 «2BM

PROJECT NUMBERGLO65550.H.FT
TEST PIT NUMBERDTP-04 SHEET 1 OF 1
TEST PIT WALL LOG
SAMPLE PROJECT ONALASKA MAP OF. N
ELEVATION J52L
WATER LEVEL AND DATE MOT ENCOUNTERED
APPROXIMATE DIMENSIONS: LENGTH 38'
_ i nr.ATinij 3+60E. 0+40N TO 3+80E 0+30N
ETI DATE EXCAVATED 4JJ_ftiftl_
WALL OF PIT
CONTRACTOR.
EXCAVATION uPTHnn BACKHOE JD • 310 • A
WIDTH__2U1_ DEPTH 10' -12* REMARKS.
C.LAWRENCE
2.0* TP-12
3.0*
4.0' TP-11
6-
10-
11.0
12 izo:TP-13TP-14
14
. . F M ESANOJAN.IKMST.UEDIUMDENSE <8U)
SAMPLETP-12 ' fOOHLY OJMOf0 MMD HTTM
•U MEOUM TO FME SAND,BROWN TO BLACK. PARTtCLES
HAftD(8P-SU)HNU-10FME.aAAXOflYTO
MOtSTlOOSE TO UEDUM- 60 PPM
MTERUWERED «WTH REFIJSE
SAMPLETP-13
WEU QHAOfO MHO MTM OMYCL.COARSE TO FME SAND.ROUNDEOCOARSE TO FME ORAVELJ5ARKBROWKMOIST.OENSITV UNKNOWN|SW)
LlmltoofExcavation
I I r I I I I I I I IWEST 0 2 4 6 8 10 12 14 16 18 20 22
LENGTH (FT)24 26
I I28 30
1 132 34 36
I38
- - on
COMMENTSBegan •xcavatlon at 0755 HNUraadbig 10 ppm at top of tranchon waat alda altar » QJS' of•xcavatlon.Sampto TP-11 takan at 0805upgrada to Laval B at 0815 (2 ppmn HNU In r~iBZ).
TP-12 takan at 0845.
TP-13 takan at 1022.
Large amounts of sheet metal,cans, and other metallic debrisobserved throughout excavation.
TP-14 taken at 1120.
Fine gray aand layer continuouslyeloughlng during pit excavation.
Stop excavation and beginbackfilling at 1130.Finish backfilling at 1215.
40 EAST
FIGURE H-5DTP-04ONALASKA LANDFILL Rl
OLOt&seo.FIVTP-M S2&-M

end The silty clayey sand layer was underlain by approximately 2 inches of graysilty clay.
From approximately 2 to 13 feet below ground, a well-graded sand wasencountered. Sand in the north half of the pit ranged in color from brown toblack to gray and was interlayered with refuse. Sand in the south half of the pitwas dark brown with gravel and contained little to no refuse. The water tablewas encountered at approximately 13 feet No drums were encountered.Sustained PID readings above background were observed in the breathing zoneafter approximately 6 feet of excavation at the north end of the pit, and fieldteam personal protection was upgraded to level B.
Four soil samples were taken for analysis. Sample TP-01 was takenapproximately 6.5 feet below ground, 2 feet from the north end of the pit. PIDreadings from the soil sample of over 20 ppm were observed. Sample TP-02was taken 2 feet below ground, 15 feet from the north end of the pit;sample TP-03 was taken 12J feet below ground, 22 feet from the north end ofthe pit; and Sample TP-04 was taken 9 feet below ground, 32 feet from thenorth end of the pit.
DTP-02
DTP-02 was excavated from Station 1+40E, 2+50N to Station 1+70E, 2+80N.The ground surface elevation ranged from 656 feet on the west side to 660 feeton the east side. The pit was approximately 40 feet long and 2 to 4 feet wideand was excavated to a maximum depth of 13 feet.
The first 12 inches of excavated material consisted of brown silty clay on thewest side of the pit, and a brown silty sand on the east side of the pit Thebrown silty sand was underlain by a 6- to 12-inch layer of gray to reddish brownsilty clay.
A well-graded sand was encountered approximately 2 feet to 13 feet belowground. Sand ranged in color from brown to black, and was interlayered withrefuse. Sand encountered lower than 12 feet below ground appeared to containless refuse. The water table was not encountered. Six crushed drums wereexcavated 6 to 8 feet below ground, 10 to 30 feet from the east wall of the pit.One drum contained oily rags and a blue pigmented material The other drumscontained no residue. No sustained PID readings above background wereobserved in the breathing zone.
Four sofl samples were taken for analysis. Sample TP-05 was takenapproximately 7.5 feet below ground, 8 feet from the east end of the pitSample TP-06 was taken 13 feet below ground, 14 feet from the east end of thepit; sample TP-07 was taken 11 feet below ground, 28 feet from the east end ofthe pit, and sample TP-08 was taken 12 feet below ground, 32 feet from theeast end of the pit
H-3

DTP-03
DTP-03 was excavated from Station 2+50E, 1+20N to Station 2+60E, 1+50N.The ground surface elevation ranged from 658 feet on the west side to 662 feeton the east. The pit was 28 feet long and 2 to 3 feet wide and was excavatedto a maximum depth of 10.5 feet.
The first 36 inches of excavated material consisted of brown to gray silty clayeysand. A well-graded sand was encountered 3 to 10.5 feet below ground. Sandranged in color from brown to black and was interlayered with refuse. Thewater table was not encountered. No drums were encountered, but metal debris(sheet metal, car oil pan, etc.) was excavated 8 to 10 feet below ground on theeast side of the pit No sustained PID readings above background wereobserved in the breathing zone.
Two soil samples were taken for analysis. Sample TP-09 was takenapproximately 10 feet below ground, 4 feet from the east end of the pit andsample TP-10 was taken 10 feet below ground, 17 feet from the east end of thepit.
DTP-04
DTP-04 was excavated from Station 3+50E, 0+40N to Station 3+80E, 0+20N.The ground surface elevation was approximately 657 feet The pit wasapproximately 38 feet long and 2 to 8 feet wide and was excavated to amaximum depth of 12 feet
The first 12 inches of excavated material consisted of brown well-graded sand tosilty sand. This was underlain by a 6-inch thick layer of dark brown to blackcemented sand and a 2- to 4-foot layer of fine gray sand. A brown to blackwell-graded sand interlayered with refuse was encountered in the rest of theexcavation.
Three crushed drums were excavated, and large amounts of sheet metal, cans,and other metallic debris were observed throughout the excavation. No residuewas observed on the drums. The backhoe bucket struck a large metal objectapproximately 16 feet from the west end of the pit The object could not beunearthed because the reach of the backhoe was not long enough. Efforts tounearth the object caused the fine gray sand to slough, increasing the width ofthe pit up to 8 feet in some locations. The water table was not encountered.Sustained PID readings above background were observed in the breathing zoneafter the first foot of excavation, and field team personal protection wasupgraded to level B..
H-4

Four soil samples were taken for analysis. Sample TP-11 was takenapproximately 4 feet below ground, 6 feet from the east end of the pit, in thefine gray sand. PID readings of 50 ppm were observed coming off of thesample. Sample TP-12 was taken 1.5 feet below ground, 1 foot from the eastend of the pit, from the layer of cemented sand. TP-13 was taken 11 feet belowground, 24 feet from the west end of the pit. TP-14 was taken 11 feet belowground, 34 feet from the west end of the pit.
GLT913/072.50
H-5

Appendix IENVIRONMENTAL SAMPLING
GLT913/035.50-9

Appendix IENVIRONMENTAL SAMPLING
INTRODUCTION
This appendix summarizes the sampling procedures and field analytical resultsfor residential well, monitoring well, surface water, and sediment sampling.Sampling of soils from borings is discussed in Appendix D and from test pits inAppendix H. Shallow groundwater sampling is discussed in Appendix F.
RESIDENTIAL WELL SAMPLING
PURPOSE AND SCOPE
Residential well sampling was performed to determine whether contaminantsfrom the landfill site had migrated to surrounding residential wells. Sevenresidential wells were sampled on March 15, 1989 (Figure 1-1). Three additionalresidential wells located on the property of Roy Ackerman could not be sampledbecause the Ackermans were gone for the winter but were sampled on April 20as part of the monitoring well sampling. The Sportsmen's Club well could notbe sampled because it was silted.
The sampling team consisted of:
o Phil Smith, CH2M HILL/Sample Team Leadero Cathy Kantowski, CH2M HILL/Sample Team Member
SAMPLING PROCEDURES
Sample bottles were rilled directly from faucets after allowing the water to runwide open for 10 minutes. Residents were asked if water softeners were presentand sample locations were chosen upstream of water softeners, if present. Fieldmeasurement of pH was made immediately preceding sample collection.Conductivity measurements were not taken because of the unavailability of ameter and difficulties in rescheduling sample analysis at the U.S. EPA CentralRegional Laboratory (CRL) in Chicago.
A duplicate of sample RW-04 was taken by filling two sets of bottles. A fieldblank was taken by filling VOA vials and organic sample bottles with HPLCwater. Inorganic 1-liter bottles were filled with locally obtained distilled waterfor the field blank. Samples were stored in coolers before packaging. Once allsamples were obtained, samples were packed in coolers and shipped the sameevening to the EPA CRL.
1-1

-r«*^^_C
—1
_J
10
•^rx«&v^
r
£
I
LEGEND
• RESIDENTIAL WELL SAMPLING LOCATp*
"«>v.

The wells sampled and field results are summarized in Table 1-1. Samples wereanalyzed at the CRL for the target organic and inorganic compounds.
MONITORING WELL SAMPLING
PURPOSE AND SCOPE
Monitoring well sampling was performed to determine the nature and extent ofgroundwater contamination. Twenty-one monitoring wells, five existing landfillwells, and the three residential wells on the Ackerman property were sampledfrom April 17 to 20. A second round of monitoring well sampling wasperformed from June 12 to 14.
Sampling personnel for the April sampling were:
o Phil Smith, CH2M HILL/Sample Team Leader, Crew 1o Paul Boersma, CH2M HILL/Sample Team Member, Crew 1o Brian Laude, CH2M HILL/Sample Team Leader, Crew 2o Cathy Kantowski, CH2M HILL/Sample Team Member, Crew 2o Kevin Adler, U.S. EPA/Sample Team Member, Crew 2
Sampling personnel for the June sampling were:
o Phil Smith, CH2M HILL/Sample Team Leader, Crew 1o Dorothy Hall, CH2M HILL/Sample Team Member, Crew 1o Paul Boersma, CH2M HILL/Sample Team Leader, Crew 2o Chris Lawrence, CH2M HILL/Sample Team Member, Crew 2o Cathy Kantowski, CH2M HILL/Sample Team Member, Paperworko Brian Laude, CH2M HILL/Sample Team Member, Crew 2
SAMPLING PROCEDURES
Round 1
Water levels were taken in all wells the morning of April 17. After opening thewell cap, HNu readings were taken according to the Site Safety Plan. Waterlevels were taken with an electric water level indicator. The indicator probe wasslowly lowered until the buzzer and the light responded. The correspondinglocation of the indicator line flush with the top of well casing was marked andthe probe was raised and lowered two more times. The depth to water wasrecorded and was later used to calculate purge quantity. The water levelindicator probe was decontaminated between wells first with a 10 percentmethanol and distilled water solution followed by a distilled water rinse.
1-2

Table 1-1RESIDENTIAL WELL SAMPLING
SampleNumber
RW-01
RW-02
RW-03
RW-04
RW-05
RW-06
RW-07
Residence
Ray HubleyW18672 CTH Z
Tom MarshallW8616 Lytle Road
Mary FritzW8602 Lytle Road
Scott DavisW8529 CTH Z
Don JohnsonW8451 North Shore Drive
Fred JohnsonM8463 North Shore Drive
Kathy KellicutH8346 Homestead Drive
Tap Location
Outside tap next to front door
Outside tap on east side of house
Outside tap on east side of house
Outside tap on south side of house
Outside tap on each side of house
Inside faucet in laundry room
Outside tap next to front door
SampleTime
1120
1140
1152
1731
1407
1423
1523
7.9
7.5
7.7
7.7
7.7
7.8
8.1
GLT866/51

The thickness of the floating naphtha layer was measured in wells on or near thelandfill with a clear bailer. Table 1-2 identifies the wells where the clear bailerwas used. The bailer was slowly lowered about 1 foot into the water table. Itwas withdrawn and the thickness of the floating layer recorded. The floatinglayer was found to be either 1/8 inch thick or absent in all wells sampled.
Dedicated teflon tubing was placed in all wells. In wells where the hydraulic liftwas less than 18 feet, a peristaltic pump was used for purging the well andcollecting all samples except the VOC sample. An 18-inch section of siliconetubing was secured to the teflon tubing and dedicated to the well for use in theperistaltic pump head. Wells with a hydraulic lift over 18 feet were purged andsampled with a Waterra pump from Solinist. The pump consists of a smalldiameter PVC check valve screwed to the bottom of the teflon tubing. Water ispumped by quickly lowering and raising the tubing. The pump achieved apumping rate of 1 to 2 gpm.
The wells were purged of five well volumes from near the top of the water level.To remove stagnant water in the well, the tubing was temporarily raised duringpurging until air was drawn in and then slowly lowered.
Following purging, a glass jar was partially filled and pH, conductivity, andtemperature were measured immediately as specified in the QAPP. Next,organic and SAS sample bottles were filled. The last bottle to be filled using thepumps was the 1-liter plastic bottle for the metals sample. Once filled, thissample was immediately filtered at the well through a 0.45-micron filter. Thefiltering pump was decontaminated with a dilute nitric acid solution and rinsedwith distilled water.
VOA samples were obtained using dedicated 3-foot PVC bailers. The bailer waslowered, raised, and emptied twice before a sample was obtained. Each VOAvial was filled with a separately bailed sample. Following sampling, the bailer,nylon rope, and tubing were replaced in the well and secured to the well cap.
Duplicate samples were obtained by twice filling the number of bottles in thesame manner described above. Field blanks were obtained for both samplingtechniques. In each case, a 5-foot section of tubing was used with either a\Vi foot section of silicone tubing or the PVC foot valve. HPLC water wasdrawn through the tube for the organic sample. Distilled water was used for theSAS and metals sample. The metals blank sample was also filtered. The VOAblank sample was obtained by pouring HPLC water into a 3-foot PVC bailer andthen into the VOA vials.
Samples were stored in coolers before packaging. The samples were packagedand shipped each afternoon. Table 1-2 presents field measurements forRound 1 sampling.
1-3

Table 1-2GROUNDHATER SAMPLING—ROUND
HellNumber
MH1SMH1MMH2SMH2MMH2D,MH3S.MOM*MOO*NH4SMISSMH6MMH7M,MH8S*MH8MNH8DMBITMUCH"Mil INMH12SMI13SMI14S.MHOS*,MI20D°MHIS"
BlB2B3B4SB4DB5
Depth toHaterTable(f t )
19.1319.3520.3320.9421.0512.5011.5812.5221.1615.544.83
18.5818.1518.9017.8912.5313.0713.5519.1420.8613.44
— _
19.2823.3017.2012.8212.7518.12
HaterTable
Elevation(feet USD
644.10644.12644.55643.99644.02643.94643.85643.94643.85643.92643.63643.93643.73643.73643.76643.57643.44643.62643.81644.01642.75
644.14643.98643.89643.34643.87643.88
HaterPurgeVolume(gallons)
5.246.06.250.096.013.057.0109.04.08.662.050.05.747.097.055.056.046.05.54.110.040.0
(15 Bins.)10.013.025.09.87.332.0
SampleDate and Time
4/19/894/19/894/18/894/18/894/18/894/17/894/17/894/18/894/18/894/18/894/18/894/18/894/19/894/19/894/19/894/20/894/20/894/20/894/19/894/19/894/20/894/20/894/20/894/20/894/19/894/19/894/19/894/18/894/18/89
13501310084010501200151117020949142514051604160009101044142111000930094007400830081512001040110011201030092510510918
pH_
7.27.56.86.77.56.67.17.46.76.67.57.67.07.57.57.67.27.47.37.16.57.27.27.17.16.86.97.67.4
Conductivity(umhos/cm*e 25°C)
385250
1,500675270560510505660695380370500405350335625390320305390945530714345840625970515
TemperatureCO
14151012121114121311131312121311111188111211101112111111
Pure Phase Thickness(Inches)"
1/8"
0" sheen present0"
0-0" sheen present"Old Miller" well"New Miller" wellAckerman Garden well
0"0"1/8"
"Peristaltic pump used for sampling all components except VOCs."Blank Indicates pure phase not measured.plo sample obtained, veil did not recharge.Residential wells on Ackenan property.
GLT866/52

Round 2
Water levels were taken the morning of June 12 by Paul Boersma andChris Lawrence. The measurement procedure was the same as that forRound 1. The thickness of the naphtha layer was not measured duringRound 2. An oil sheen on the purge water was noted for three wells (seeTable 1-2).
Purging and sampling procedures were as described for Round 1 with thefollowing exception. In wells where the peristaltic pump was used for purging,the dedicated 18-inch silicone tubing was removed before sampling and a PVCfoot valve was placed on the teflon tubing. Sampling of the well for allcomponents other than VOCs was then performed by quickly lowering andraising the tubing. As a result all wells were sampled using the same procedure.Table 1-3 presents the field measurements for Round 2 sampling.
SURFACE WATER AND SEDIMENT SAMPLING
PURPOSE AND SCOPE
Surface water and sediment sampling were performed to determine whethercontaminants from the site had migrated to surface waters near the site. Twelvelocations were sampled on June 12, 1989.
Sampling personnel were:
o Phil Smith, CH2M HILL/Sample Team Leadero Kevin Adler, U.S. EPA/Sample Team Member
SAMPLING PROCEDURES
Surface water sampling was begun at the most downstream locations andproceeded upstream to the background sample locations. Sample bottles forsurface water were filled by submerging the bottles as they filled at mid-depth inthe water column. The surface water sample was collected before any sedimentwas disturbed.
Samples in swampy areas or areas of ponded water were taken within a few feetof the dry bank nearest the site. Samples in the main channel (SW-03, SW-05,SW-ll and SW-12) were taken within 1 foot of the eastern bank. An extrasample jar was filled with water for field measurements of pH, conductivity, andtemperature. Field measurements were made within 5 minutes of samplecollection. Duplicate surface water samples were taken at SW-ll and SW-12. A
1-4

Table 1-3GROUNDWATER SAMPLING—ROUND 2
Depth toWaterTable(ft)
18.9819.2220.1620.6720.7912.3511.3612.3020.9015.354.66
18.2817.9318.6617.6512.3512.9313.2118.8720.5513.2419.0323.1216.9312.6012.58
WaterTable
Elevation(feet MSL)
644.25644.25644.72644.26644.28644.09644.07644.16644.11644.11643.80644.23643.95643.97644.00643.75643.58643.96644.08644.32642.95644.39664.16664.16643.56644.04
WaterPurge
Volume(gallons)
5.246.09.0
50.096.013.057.0
110.04.09.0
62.050.06.0
48.097.056.057.053.5.4.3
10.014.025.010.0
7.033.0
SampleDate and Tine
.0
.6
6/14/896/14/896/12/896/12/896/12/896/13/896/13/896/13/896/13/896/14/896/14/896/13/896/13/896/13/896/14/896/14/896/14/896/14/896/13/896/13/896/14/896/13/896/13/896/14/896/13/896/13/89
10301120144516101645093009501010082516310845094115301500102514051145161011281055092513551500082511101120
R!L
7.37.56.26.06.16.67.17.55.95.86.56.67.07.66.47.16.46.37.16.56.86.56.37.06.77.3
Conductivity(unhos/cn2
fl 25"C)
265160
1,965570250615605430650790485320540360350350650320345240405350710585925550
Temperature
1113171215141717141313141315131214121417121816101615
*No laaple taken. Well does not recharge.
GLT866/53

blank sample was prepared by pouring HPLC water directly into the sample jarsfor all samples except the metals sample. Distilled water was used for themetals blank. All surface water samples were unfiltered. Samples werepreserved as described in the QAPP.
Sediment samples were obtained at the same locations as the surface watersamples immediately following surface water sampling. A stainless steel spoonwas used to collect sediment from the depth interval of 0 to 6 inches. Sedimentwas spooned into the jars until full. The jars were capped and stored in acooler before packaging. Duplicate sediment samples were taken at locationsSD-11 and SD-12. A field blank was prepared by spooning laboratory gradediatomaceous earth into sample jars. The stainless steel spoon wasdecontaminated with solutions of trisodium phosphate, 10 percent methanol, anddistilled water between each sample.
Field measurements for the surface water and sediment samples are summarizedin Table 1-4.
NONAQUEOUS PHASE SAMPLING
PURPOSE AND SCOPE
Soil samples were collected from the unsaturated zone immediately above thewater table (approximately 15 feet) to assess the extent and nature ofnonaqueous phase contamination along the southwestern edge of the landfill. RIdata indicated that nonaqueous phase contamination floating on the water tablemay have been smeared through the soils that come in contact with seasonalwater table fluctuations. Five samples (SSB-01 through SSB-05) were collectedon September 20, 1989.
Sampling personnel were:
o Jeffrey Lamont/CH2M HILUSample Team Leadero Paul Boersma/CH2M HILL/Sample Team Member
SAMPLING PROCEDURES
Soil borings were advanced from 6 to 10 feet below ground using a "LittleBeaver" power auger. The auger is powered by a cart mounted gasoline enginedeveloped for shallow boring work.
The auger was first used to advance the borehole to its target depth forsampling. It worked well in the upper 3 to 4 feet of soil, but was quick to bindupon encountering obstructions such as sticks and rocks. When the auger could
1-5

Location"
SH-01
SH-02
Si-03
SH-04
SB-OS
SH-O6
SH-07
Coordinates
9OOE
500E
SOON
80E
4 SON
220H
380H
1900S
16OOS
17006
8508
310S
220S
240N
SH-O8
SH-09
SH-10
SH-11
SM-12
370H 330N
360H 440N
280H 650N
SON 1070N
130H 1000N
Table 1-4SURFACE HATER AND SEDIMENT SAMPLING
Description
Swa»py area. Hater depth approx. 6".
Svaapy area. Hater depth approx. 12".
Main channel. Sandy sediment.
Ponded water approx. 6" In occasionalchannel. Flow >0.1 cfe.
Main channel, sandy sediment.
area. Hater depth approx. 12".
Ponded water approx. 12" In backwater ofMln channel. No flow.
Ponded water approx. 6" In occasionalchannel.
Ponded water approx. 12" In occasionalchannel .
Ponded water approx. 12" In occasionalchannel .
Main channel, sandy sediment.
Main channel, sandy sedlaent.
SaipleTime
0950
1010
1105
1030
1330
1400
1430
1450
1500
1520
1640
1710
pH_
6.9
6.5
7.1
7.0
7.0
6.3
6.5
6.5
6.9
7.0
6.9
7.0
Conductivity(uBhos/CH1
8 25°C)
300
125
117
125
125
190
122
166
170
233
122
122
TemperatureCO
15.5
19.0
20.0
19.0
19.0
19.0
20.0
20.0
19.0
19.0
20.0
20.0
aS«dl*ent locations are Identical to surface water locations
GLT866/54
no longer be advanced, a 2-inch hand auger was used. Soil samples werecollected when the desired depth was reached. The hand auger was thendecontaminated with a series of TSP, methanol, and distilled water rinses. Aftersampling was completed boreholes were rilled with their cuttings. Boreholeswere monitored with an HNu during and after being completed to their targetdepth.
Sample analysis included Total Petroleum Hydrocarbons (TPH) for SSB-01through SSB-05, Benzene, Toluene, Ethylbenzene, and Sylenes (BTEX)compounds for SSB-02, SSB-04, and SSB-05, and the complete TargetCompound List (TCL) for SSB-03 and a partial TCL for samples SSB-01 andSSB-04. Results are presented in Appendix J.
GLT913/073.50
1-6

Appendix JANALYTICAL RESULTS AND DATA VALIDATION
GLT913/035.50-10

Appendix JANALYTICAL RESULTS AND DATA VALIDATION
INTRODUCTION
This appendix presents the data validation for the Onalaska RI/FS CLPlaboratory data and the analytical results (presented in Attachment A). [Note toReviewer: Round 2 groundwater, surface water and sediment results are notincluded in this draft]. Data validation is the technical review of a data packageas stipulated in the RI/FS Quality Assurance Project Plan.
Before the laboratory data are sent to CH2M HILL, the U.S. EPA SampleManagement Office receives the data packages from the participatinglaboratories and distributes them to the Environmental Sciences Assistance Team(ESAT) of the Central Regional Laboratory (CRL). The ESAT reviews thedata resulting from regional sampling efforts using a document that describesprocedures for Contract Compliance Screening (CCS) of Contract LaboratoryProgram (CLP) IFB contract reports and their QC deliverables (1,2). The CCSprocedures provide assessment of data in terms of both completeness andtechnical compliance with contract requirements. A CCS assessment worksheet,review narrative, and summarized analytical data are routed to CH2M HILL.
CH2M HILL further reviews the data using the Functional Guideline documents(3,4). The document offers guidance in laboratory data evaluation andvalidation. For methods not listed in the functional guidelines a procedureparallel to the guidance document was used. Data noted in the review thatshould be qualified are flagged with the appropriate symbol. Results for fieldduplicates and field blanks are also reviewed and the data further qualified.Finally, the data set as a whole is examined for consistency, anomalous results,and whether the data are reasonable for the samples involved.
The site investigation samples were analyzed for semivolatiles, volatiles,pesticides/polychlorinated biphenyls (pesticide/PCB), metals, and various wetchemistry parameters. The following discussion highlights non-compliant dataand their effect on specific samples or the whole data set.
The data review results are discussed in the following order: round onesampling, round two sampling, nonaqueous phase sampling.
Qualitative Symbols (Flags)
J = used when an analyte is present below the required detection limitor the values are estimated because QA/QC measures were notmet.
B = used when an analyte is also present in the associated laboratoryblank or field sample blank as well as the sample.
J-l

used when the reported value is unusable because QA/QCmeasures were not met.
ROUND ONE SAMPLES
SEMIVOLATILE ANALYSIS
Two matters are discussed in general which were regularly noted in the datareview for semfvolatile analysis. They are holding times and sample reanalysisfor contract compliance.
A sample prepared for analysis which exceeded the required holding times maynot be representative of its original condition. The analyte concentration mayhave been reduced or the analyte has become non-detectable. For samplesexceeding holding time criteria the data user should not use non-detectablevalues (i.e., values reported less than the contract required quantification limits,or CRQL) as an indication of the absence of an analyte. Additionally, analyteconcentration values reported greater than CRQL may be biased low.
Often times samples are re-extracted and reanalyzed to meet CLP SOW (5)contract compliance and reported as unique samples. These analyses aid thedata reviewer during evaluation of the data set; however they are not requiredfor the end data user and are excluded from the final result tables unless theyprovide additional information. In this case, the reanalyses either supplement orsupersede the original analysis.
Cas« 11542: Eight low level concentration soil samples (OTR numbers EBPOOto EBP09) were sent to CEIMIC laboratory.
Internal standard Perylene-dl2 for soil sample EBP02 was above acceptancerange. Analytes quantified with this internal standard are flagged J, estimated.
No target compound list (TCL) compounds were detected in field blank sampleEBP06.
Field duplicate samples EBP03 and EBP04 did not contain analytes above theCRQL.
Case 11639: Seven low-level concentration soil samples (OTR numbers EBP 10to EBP 16) were sent to Western Research Institute (WRI).
Field blank sample EPB10 contains the common contaminant bis(2-ethylhexyl)phtnalate. All samples containing this contaminant less than 10 timesthe field blank value are flagged B, blank contamination.
Field duplicate samples EPB11 and EBP12 do not contain analytes above theCRQL. Sample EBP11 has 2 TCL compounds less than CRQL and 10 TICS.Sample EBP 12 has 2 TCL compounds less than CRQL and 17 tentativelyidentified compounds (TICS). No qualification of the data set was applied
J-2

based on field duplicate results. The analytes present below CRQL and theTICS suggest agreement among the field duplicate.
Case 11790: 20 low-level concentration water samples (OTR numbers EBP 17 toEBP36) were sent to S-Cubed laboratory.
Holding time exceeded acceptable range for samples EBP 17, EBP21RE,EBP22RE, EBP26RE, EBP28RE, EBP31RE, EBP34RE, and EBP35RE. Forsample EBP17 all analyte concentrations reported above CRQL are flagged J,estimated; nondetects are unusable. Samples denoted with the -RE suffix arequalified in a following discussion.
GC/MS initial calibration and continuing calibration outliers were reported;however, samples did not contain the analytes affected by the outliers.
Acid fraction surrogate recoveries were below acceptable range for samplesEBP21, EBP22, EBP26, EBP31, EBP33, EBP34, and EBP35. Re-extraction andanalysis of these samples provided similar surrogate results; therefore, thesurrogate recovery difficulties are attributed to matrix interference. Acid fractionanalytes in these samples are flagged J, estimated; the nondetects are unusable.Only the original analyses are presented in the final sample result tables.
Acid fraction surrogate recoveries were below acceptable range for sampleEBP33. EBP33 was used for the MS/MSD which also had surrogate recoveriesbelow the acceptance range. Sample EBP33 is qualified as discussed in thepreceding paragraph.
Base/neutral (BN) fraction surrogate recoveries were below acceptable range forsample EBP28. Re-extraction and analysis provided acceptable BN fractionsurrogates but the acid fraction surrogates were below the acceptance range.BN fraction results from EBP28RE and acid fraction results from EBP28 arereported. All analytes greater than CRQL are flagged J, estimated and thenondetects are unusable.
Matrix spike recoveries were below acceptance range for the acid fractioncompounds 4-chloro-3-methylphenol and 2-chlorophenol. In addition two otheracid fraction spiking compounds were at the lower end of the acceptable range.These results are consistent with the low surrogate recoveries representative ofthe sample. Low recoveries of acid fraction compounds are suspected forsamples reporting low surrogate recoveries and have been previously qualified.Precision criteria for 1,4-dichlorobenzene were outside of acceptable range. Noqualification of the data set has been applied based on matrix spike recoverydata.
No TCL compounds were reported above CRQL in field duplicate samplesEBP18 and EBP19 or field duplicate samples EBP24 and EBP25.
Case 11790: 15 low-level concentration water samples (OTR numbers EBP37 toEBP41, EBP49, EBP53 to EBP58, and EBP60 to EBP62) were sent to S-Cubedlaboratory.
J-3

Holding time was exceeded for sample EBPSS and all analytes reported aboveCRQL are flagged J, estimated. Four samples which were re-extracted due topoor surrogate performance did not meet holding time requirements and arequalified below.
Laboratory blank SBLK03 contains the common contaminant di-n-butylphthaiate. Samples associated with this blank and containing this analyte lessthan 10 times the blank concentration are flagged B, blank contamination.
No TCL compounds were detected in the field duplicate samples EBPS6 andEBP57.
Acid fraction surrogate recoveries for samples EBP39, EBP53, EBP60, andEBP62 were below the acceptable range. These samples were re-extracted andanalyzed. The reanaiysis results paralleled the original results; therefore, the lowrecoveries are attributed to matrix influence. Only the original results arepresented in the final sample concentration tables. Because of the low surrogaterecoveries, results for the acid fraction compounds are not useable.
Case 11790: 10 low-level concentration soil samples (OTR numbers EPB42 toEBP48 and EBP50 to EBP52) were sent to S-Cubed.
Holding times were exceeded for the re-extraction of samples EBP43, EBPS1,and EBP52. No qualification of these samples was necessary, because theoriginal sample analyses are reported in the final sample concentration tables.
GC/MS initial calibration and continuing calibration outliers were reported;however, samples did not contain the analytes affected by the outliers.
Laboratory blanks contain TIC compounds including benzaldehydc. No TCLcompounds were detected in the field blank sample EBP48. Samples containingbenzaldehyde at less than 5 times the associated laboratory blank value areflagged B, blank contamination.
Sample EBP51 was re-extracted and analyzed because two acid fractionsurrogates were above the acceptance range. The reanaiysis produced similarresults; therefore, all acid fraction compounds are flagged J, estimated.
Matrix spike analyses were performed at twice the contract specifiedconcentration level. No qualification of the data set is applied because matrixspike recoveries were within acceptance range and the deviation isinconsequential.
Field duplicate samples EBPSO and EBP51 report similar TCL compounds butat significantly different concentrations. The analyses of these samplesencountered dissimilar analytical difficulties, either surrogate or internal standarddeficiencies. Differences in concentration can be explained by the deficiencies;however, the dissimilar difficulties suggests the deficiencies were an outcome ofpoor laboratory technique. Compounds associated with the acid fraction in field
J-4

duplicate samples are flagged J, estimated. Other samples affected by the fieldduplicates have been previously qualified.
Internal standard performance of l,4-dichlorobenzene-d4 was below acceptancerange for samples EBP43, EBP50, and EBP52. Subsequent re-extraction andreanalysis of these sample produced similar internal standard performance resultsand surrogate recoveries below acceptance range. The original analysis isreported because of the unacceptable surrogate recoveries in the reanalysis.Analytes reported above CRQL and associated with 1.4-dichlorobenzene-d4 areflagged J, estimated.
VOLATILE ORGANIC ANALYSIS
Samples which contain high concentrations of TCL compounds are frequentlyreanalyzed using a diluted aliquot. Reanalysis of the diluted sample bringsanalyte concentrations within instrument calibration range but the associatedlaboratory blank may also contain analytes as a contaminant at the sameconcentration level. The analyte is present in the sample as demonstrated bythe first analysis; however, the analyte would be qualified as blank contaminationin the diluted analysis. In these instances, the concentration value that exceedsthe calibration range is reported and qualified J, estimated.
The laboratory diluted and reanalyzed samples to determine analyteconcentration within the instrument calibration range or meet contractcompliance and submitted individual results for each analysis. For purposes ofdata end use, only one sample profile is needed. So, the multiple analyses arecombined using the following guideline to use all available information andmaintain consistency. First, values from the undiluted sample when the analytewas within the calibration range of the instrument are reported. Secondly,values from the greatest diluted analysis, within calibration range and notaffected by qualifiers, are reported. Thirdly, any reasonable value is reported.
Case 11542: Eight low-level concentration soil samples (OTR numbers EBPOOto EBP09) were sent to CEIMIC laboratory.
Matrix spike precision data for 1,1-dichloroethane were outside of control limits.The sample set is not qualified based on the precision deficiency.
The field blank samples contained methylene chloride and acetone.Additionally, the laboratory blank analysis for VBLK01 contained acetone and2-butanone and VBLK02 contained acetone. Samples containing methylenechloride at less than 10 times the field blank concentration and acetone or 2-butanone at less than 10 times the associated laboratory blank are flagged B,blank contamination.
Case 11639: Seven low-level concentration soil samples (OTR numbers EBP10to EBP 16) were sent to Western Research Institute.
Field blank sample EBP 10 contains acetone and benzene. No TCL compoundswere detected in the laboratory blanks. Samples containing these contaminants
J-5

at less than 10 times the acetone value and less than 5 times the benzene valueare flagged B, blank contamination.
Field duplicate samples EPB11 and EPB12 both have three TLC compoundsabove CRQL that meet precision criteria. Additionally, EBP 11 has xylene andfour low-concentration TICs, where EBP 12 has three low-concentration TICS.No qualification of the data set is made based on field duplicate results.
Case 11790: 20 low-level concentration water samples (OTR numbers EBP17 toEBP36 were sent to S-Cubed laboratory.
GC/MS initial calibration and continuing calibration outliers were reported;however, samples did not contain the anaJytes affected by the outliers.
Toluene was found in laboratory blank VBLK01 and VBLK02 and field blanksample EBP27. Xylene was found in the field blank sample EBP27. Samplescontaining toluene less than 10 times their associated laboratory blank value orxylene less than 5 times the field blank value are flagged B, blankcontamination.
Field duplicate samples EBP 18 and EBP 19 are not comparable. Sample EBP 18contains TCL compounds at concentrations greater than CRQL while sampleEBP19 does not report them or reports them at concentrations much less thanEBP 18. Three facts suggest laboratory results for the undiluted analysis ofEBP 18 result from cross contamination and are not real. First, Sample EBP 18was analyzed immediately after EBP17, which contains high concentrations ofvolatile*, without taking steps to decontaminate the GC system. This is thesource of cross contamination. Secondly, later analysis of a diluted aliquot ofEBP 18, when the GC system was operating free of contamination, did notcontain the anah/te concentrations reported in the undiluted analysis. Thirdly,field duplicate EBP 19 was not consistent with the results for undiluted analysisof EBP18. For these reasons all analytes associated with the undiluted analysisof EBP18 and found in sample EBP17 (analyzed preceding EBP18) areunusable. Data from EBP 19 should be used to evaluate groundwater from thiswell. Field duplicate samples EBP24 and EBP25 do not contain analytes aboveCRQL. No qualification of the data set is applied based on field duplicate data.
Case 11799: IS low-level concentration water samples (OTR numbers EBP37 toEBP41, EBP49, EBP53 to EBP58, and EBP60 to EBP62) were sent to S-Cubedlaboratory.
Surrogate recovery for l,2-dichloroethane-d4 was 1 percent above acceptancerange. No qualification was applied due to the marginal deficiency.
Toluene was present in the laboratory blanks VBLK03 and VBLK04. Fieldblank sample EEBP49 contains the contaminant chloroform. Samples containingthe above contaminants at less than 10 times the toluene values from theassociated laboratory blank and less than S times the chloroform value from thefield blank are flagged B, blank contamination.
J-6

Case 11790: 10 low-level concentration soil samples (OTR numbers EPB42 toEBP48 and EBP50 to EBP52) were sent to S-Cubed.
Calibration outliers were reported for acetone and xylene. Samples reportingthese analytes are flagged J, estimated.
Laboratory blank VBLKOl contains methylene chloride, 2-butanone, toluene, and10 TICs. Laboratory blank VBLK02 contains 2-butanone. Laboratory blankVBLK03, a medium level blank, contains methylene chloride and 2-butanone.The field blank sample EBP48 contains methylene chloride, carbon disulfide, 2-butanone, and xylene. Samples containing methylene chloride or 2-butanone lessthan 10 times the value found in the field blank are flagged B, blankcontamination. Samples containing carbon disulfide or xylene less than 5 timesthe value found in the field blank are flagged B, blank contamination. Samplesassociated with VBLKOl and contain toluene at less than 10 times the valuereported in the blank are flagged B, blank contamination.
The matrix spike recoveries for toluene (0 percent) were below acceptancerange. The unspiked sample contains 89 pg/Kg toluene and was spiked with 50jig/Kg toluene. Only 49 mg/Kg was recovered. The GC system was inefficientbut demonstrated an ability to recover toluene. For this reason samplescontaining toluene are flagged J, estimated, rather than unusable.
Field duplicate samples EBP50 and EBP51 contain the same TCL compoundsbut at different concentrations, a result of using different methodologies foranalysis. The low-level analysis of sample EBP50 found concentrations of TCLcompounds which exceeded the calibration of GC system. The sample wasreanalyzed as a medium level volatile. Sample EBP51 also contained TCLcompounds at levels exceeding the GC system calibration but was reanalyzed ata diluted level within the calibration range. No qualification was applied to thedata set based on field duplicate sample results.
Internal standard performance was below acceptance range for sample EBP50;however, this sample was reanalyzed as a medium level and internalperformance was acceptable.
PESTICIDE/PCB
Case 11542: Eight low-level concentration soil samples (OTR numbers EBPOOto EBP09) were sent to CEIMIC laboratory.
Matrix spike recoveries for heptachlor were above acceptable range. Samplesreporting this compound are flagged J, estimated value.
Surrogate recovery were above acceptable range for EBPOO, EPB01, EBP02,EBP04, EBP07, and EBP09. Acceptable surrogate recovery was reported in thelaboratory blank. The lab blank data suggests a matrix effect was responsiblefor the high sample surrogate recoveries. Analytes reported greater than theCRQL in these samples are flagged J, estimated.
J-7

Case 11639: Seven low-level concentration soil samples (OTR numbers EBP 10to EBP16) were sent to Western Research Institute (WRI).
All QA/QC measures are within acceptable range and the data can be usedwithout qualification.
Case 11790: 20 low-level concentration water samples (OTR numbers EBP 17 toEBP36) were sent to S-Cubed Laboratory.
Initial calibration linearity for p,p'-DDT and Aldrin were outside acceptablerange. Anah/te concentrations in the data set greater than CRQL are flagged J,estimated
Surrogate recovery for sample EBP22 was above acceptance range. No TCLcompounds are reported; therefore, no qualifying flag was applied.
The MS/MSD analyses were spiked at a level 10 times greater than SOWrequirements. MS recoveries were universally lower than MSD recoveries whichis consistent with the surrogate recovery differences resulting in a seemingly lowprecision. No qualification of the data set is applied based on matrix spike data.
Case 11790: 15 low concentration water samples (OTR numbers EBP37 toEBP41, EBP49, EBP53 to EBP58, and EBP60 to EBP62) were sent to S-CubedLaboratory.
The matrix spikes were within the acceptable range but the relative percentdifference for lindane, heptachlor, and endrin were outside the acceptance range.No qualification of the data was supported by this deficiency.
Surrogate recovery for EBP61 and EBP62 was above acceptance range. NoTCL compounds were detected in these samples; therefore no qualification ofthe data is applied.
The laboratory blank PBLK5 contains gamma BHC. No TCL compounds werereported in the field blank. All samples containing gamma BHC at less than 5times the laboratory blank value are flagged B, blank contamination.
The chromatographic system used to quantify pesticides experienced difficultywith endrin breakdown and continuing calibration check outliers. Noqualification of the data set was applied because no TCL compounds weredetected in the samples.
Case 11790: 10 low-level concentration sofl samples (OTR numbers EPB42 toEBP48 and EBP50 to EBP52) were sent to S-Cubed Laboratory.
The GC system experienced surrogate compound (dibutylchlorendate, or DBC)retention shifts. The acceptable limit is equal to or less than 0.3 percent andthis was exceeded by no more than 0.2 percent (0.5 percent total). Using DBCfor evaluation of retention shift represents a "worst case" scenario and does notinfer unacceptable GC performance.
J-8

Gamma BHC was found in the laboratory blanks PBLK01, PBLK02, and fieldblank EBP48. Samples containing this contaminant less than 5 times the valuefound in the associated field blank are flagged B, blank contamination.
Surrogate recoveries (199 to 999 percent) were above acceptable range for allsamples and laboratory blanks, except EBP50. The laboratory case narrativecites sample interference as the cause. All reported analytes, except those inEBP50, are flagged J, estimated.
TOTAL METALS
Case 11542: 10 low-level concentration soil samples (ITR numbers MEBCOO toMEBC09) were sent to Wilson Laboratory.
Matrix spike recoveries for lead and silver were above acceptable range.Samples containing these elements are flagged J, estimated value.
Case 11639: Seven low-level concentration soil samples (ITR numbers MEBC10to MEBC 16) were sent to Nanco Laboratory.
Matrix spike recoveries for antimony, copper, silver, and zinc were below theacceptance range. Acceptable post-digestion matrix spike for copper(101 percent) suggests the low pre-digestion spike recovery was matrix related.Low recoveries indicate possible elevation of detection limits. All samplescontaining these elements are flagged J, estimated value.
The matrix spike and duplicate audits for mercury were performed on the fieldblank. Using the field blank does not present a true reflection of matrixinfluence and the bias is unknown. Therefore all mercury data reported greaterthan CRDL are flagged J, estimated due to unknown precision and bias.
Duplicate analysis for copper was outside of control limits. Copper results werepreviously qualified.
CCS reports interference of aluminum, iron, and magnesium. Samples reportingthese elements are flagged J, estimated values.
Field blank sample MEBC10 was found to contain the elements aluminum,arsenic, copper, iron, lead, magnesium, mercury, and zinc. No qualification ismade for the field blank because the quality of the soil for use as a blankcontrol is unknown.
Field duplicate sample results (MEBC11 and MEBC12) compare acceptably forelements detected greater than CRDL, except copper. Copper was previouslyqualified.
Case 11790: 20 low-level concentration water samples (ITR numbers MEBC17to MEBC36) were sent to Rocky Mountain Analytical Laboratory.
J-9

Matrix spike recovery for iron was above acceptance range and selenium(0 percent) was below acceptance range. Samples reporting iron are flagged J,estimated value. Samples reporting selenium greater than IDL are flagged J,estimated value, and less than CRDL are unusable.
CCS reports the Laboratory Control Sample for arsenic and selenium was belowacceptance range. All samples reporting arsenic are flagged J, estimated value.Selenium was previously qualified.
The interference due to lead and arsenic was noted by the CCS. All leadresults are flagged J, estimated value. Arsenic was previously qualified.
Field blank sample MEBC27 was found to contain the elements barium, calcium,iron, magnesium, manganese, potassium, and zinc. No qualification is made forthe field blank because the quality of the water for use as a blank control isunknown.
Case 11790: 15 low-level concentration water samples (ITR numbers MEBC37to MEBC41, MEBC49, MEBC53 through MEBC58, and MEBC60 throughMEBC62) and 10 low-concentration soil samples (MEBC42 through MEBC48and MEBC50 through MEBC52) were sent to Rocky Mountain AnalyticalLaboratory. The water and soil analyses are separated to simplify discussion.
Water Analysis
The serial dilution for zinc indicates interference. Samples containing zinc areflagged J, estimated. The preparation blank contained zinc. Samples reportingzinc at less than 5 times the amount found in the preparation blank are flaggedB, blank contamination.
Field blank samples MEBC49 and MEBC55 contained lead and zinc. Noqualification was made for the field blank because the quality of the water foruse as a field blank is unknown.
The laboratory flagged arsenic, selenium, and thallium due to interference.Samples reporting these elements greater than CRDL are flagged J, estimatedvalue.
SoU Analysis
Matrix spike recovery for antimony was below acceptable range and formanganese was above acceptable range. Samples do not contain antimonyabove the IDL; however, detection limits may be elevated due to the lowrecovery. Samples reporting manganese above CRDL are flagged J, estimatedvalue.
Element interference was noted for arsenic, potassium, and thallium. Samplescontaining these elements are flagged J, estimated value.
J-10

The preparation blank contained zinc. Samples reporting zinc at less than 5times the amount found in the preparation blank are flagged B, blankcontamination.
Field blank sample MEBC48 contained aluminum, barium, calcium, iron,potassium, and zinc. No qualification was made for field blank contaminationbecause the quality of the soil for use as a field blank is unknown.
Field duplicate samples MEBC50 and MEBC51 meet precision criteria for sevenTCL components. Silver data does not meet precision criteria and are flagged J,due to poor precision.
Case SAS4558E: 10 low-level concentration water samples (SAS numbers4558E35 to 4558E44) were sent to JTC Environmental Consultants.
Calibration verification outliers were below acceptance range for barium,cadmium, and lead. Laboratory Control Samples were below acceptable rangefor mercury and arsenic. Matrix Spike recoveries were below acceptance rangefor cadmium, mercury, and selenium. Matrix Spike recoveries were aboveacceptable range for lead. Since all analytes were detected below CRDL andflagged J, estimated, no qualification is applied.
GENERAL CHEMISTRY PARAMETERS
Review of the Special Analytical Services (SAS) chemistry parameters does notfollow the form by form review used in evaluation of the organic and inorganicparameters. Instead a review procedure consisting of evaluating holding times,initial calibration or calibration verification, continuing calibration, matrix spikeanalyses, and blank versus sample results was implemented.
Case SAS4558E: 32 low-level concentration water samples (SAS numbers4558E01 to 4558E16 and 4558E17 to 4558E36) were sent to Rocky MountainAnalytical Laboratory for analysis of Alkalinity, Ammonia and Nitrate + Nitrite,BOD, Chloride, COD, Oil & Grease, Sulfide, Sulfate, TOC, Total Phosphorous,TDS, and TSS.
The samples were delivered as two separate groups. For ease of discussion thetwo delivery groups are combined and the discussion separated by analysis type.
ALKALINITY
Holding rimes were exceeded in some samples; however no qualification isapplied based on the deficiency. All other QA/QC measures were met and thedata can be used without qualification.
AMMONIA AND NITRATE + NITRITE
The field blank contains Nitrate + Nitrite. Samples 4558E19, E21 to E24, andE32 are flagged B, blank contamination.
J-ll

BOD
The depletion of the unseeded dilution water blanks exceeded the limits forBOD. All BOD concentrations are flagged J, estimated.
Field duplicates samples 4558E07 and 4558E08 were outside acceptableprecision range.
CHLORIDE
The primary SAS method was not used; instead an acceptable alternativemethod was performed. All data are acceptable for use.
COD
The matrix spike recovery is above acceptable range. COD data for samples4558E18 to E21, E23, E24, E27, E28, and E32 are flagged J, estimated.
OIL AND GREASE
Holding time was exceeded for all samples. Matrix spike recovery (130 percent)was above acceptable range. The field blank contains oil and grease. All datashould be flagged J, estimated. The detection limit may be elevated due to themissed holding times.
SULFATE
The primary SAS method was not used; instead an alternative method wasperformed. No information supports the exclusion of the data; therefore, thedata are acceptable for use.
SULFTOE
Holding times were exceeded for all samples. No concentrations were reportedabove detection limits. All data should be considered unusable fordetermination of the presence or absence of sulfide.
TOC
All QA/QC measures were met and the data are acceptable for use.
TOTAL PHOSPHORUS•
The lab did not use the primary SAS method; however, the method used isacceptable. All data are acceptable for use.
TSS/TDS
The field blank contained TDS and all data are flagged B, blank contamination.
J-12

Case SAS4558E: 10 low-level concentration soil samples (SAS numbers 4558E46to 4558E55) were sent to Hazen Research, Inc., for analysis of Sulfur Contentand Total Chlorine.
All QA/QC measures were met and the data are acceptable for use.
Case SAS4501E: 17 low-level concentration soil samples (SAS numbers 4501E01to 4501E17) were sent to Keystone Environmental Laboratory for the analysis ofTotal Organ Carbon (TOC).
Field blank sample 4501E07 contains TOC. Sample 450IE 13 and 450 IE 14 areflagged B, blank contamination.
Case SAS4501E: 10 low-level concentration soil samples (SAS numbers 4501E51to 4501E60) were sent to Keystone Environmental Laboratory for the analysis ofTotal Organ Carbon (TOC).
Field duplicate samples 4501E57 (TOC = 447 mg/Kg) and 4501E58 (TOC =4400 mg/Kg) show poor reproducibility. All samples are flagged J, estimated,due to the poor precision.
J-13

ROUND TWO SAMPLES
SEMIVOLATILES ANALYSIS
Case Number 12130: 20 low-concentration-level water samples (TR NumbersEBP63 TO EBP77 and EBP93 TO EBP97) were sent to S-Cubed.
Surrogate recoveries were below the acceptance range for sample EBP9S.Subsequent re-extraction and analysis produced similar results suggestinginterference from the matrix. The acid fraction analyte concentrations areestimated and flagged J and the non-detected acid fraction analytes areunusable.
Surrogate recoveries were below the acceptance range for the base/neutralfraction in sample EBP96. Subsequent re-extraction and analysis producedacceptable base/neutral recoveries but unacceptable acid fraction surrogate andinternal standard recoveries. The deficiencies were a result of interferencesfrom the large number of substituted benzenes present in the sample. Datafrom the original analysis is reported and base/neutral analytes concentrationsare flagged J, estimated.
No TCL compounds were detected in the field blank sample EBP77 or fieldduplicate samples EBP73/74 and EBP75/76. No qualification of the data wasmade based on field blank or duplicate sample data.
Case Number 12130: 15 low-concentration-level soil samples (TR NumbersEBP78 to EBP92) were sent to S-Cubed.
Field Blank sample EBP92 is free of contamination.
No TLC compounds were present in field blank sample EBP92 or field duplicatesamples EBP88/EBP89 and EBP90/EBP91 greater than CRQL. Noqualifications of the data set are applied based on field blank or duplicatesample data.
All other QA/QC measures are acceptable and the data can be used withoutadditional qualification.
Case Number 12130: 13 low-concentration-level water samples (TR NumbersEBP98 and EEFOO to EEF11) were sent to S-Cubed.
Extraction holding time was exceeded for sample EEF01. Analyteconcentrations reported greater than CRQL are estimated and flagged J, CRQLvalues may be elevated for non-detected analytes.
Continuing calibration outliers affect benzoic acid in sample EEFF01. Theconcentration value is flagged J, estimated.
Surrogate recoveries were below the acceptance range for the acid fractioncompounds in samples EEF03, EEF08, EEF10, and EEF11.
J-14

Re-extraction and analyses performed on these samples encountered similarsurrogate difficulties and suggest a matrix effect condition. Acid fractionanalytes reported at CRQL are unusable and analyte concentrations greater thanCRQL are J, estimated.
Matrix spike analysis were above acceptance range by 7 percent for twocompounds. The sample used for analysis contained eight native TCLcompounds representing a difficult sample to analyze. No qualification of thedata set was made on the basis of matrix recoveries.
Laboratory blank samples SBLK11 and SBLK12 contain phenol. No field blanksample was sent to the laboratory. Values for phenol are flagged B is samplesreporting less than five times the amount in the associated laboratory blank.
Field duplicate samples EEFOO/01 are qualitatively and quantitatively similar,except for Benzyl alcohol which differs by a factor of 10. No explanation can begiven for the apparent difference. The Benzyl alcohol concentrations areestimated and flagged J in samples reporting this analyte.
Case Number 12130: 13 low-concentration-level water samples (OTR NumbersEEF12 to EEF24) were sent to S-Cubed.
Extraction holding times were exceeded for samples EEF17, EEF18, and EEF19.Analyte concentrations reported greater than CRQL are estimated and flagged Jand the CRQL may be elevated for non-detected analytes.
Surrogate recoveries were below acceptance range for the acid fractioncompounds in samples EEF12, EEF14, EEF20, and EEF24. Re-extraction andanalyses performed on these samples encountered similar surrogate difficultiesand suggest a matrix effect condition. Acid fraction extractable compound datareported at CRQL is unusable and analyte concentrations greater than CRQLare estimated and flagged J.
Matrix spike recoveries were acceptable; however, the laboratory substituted thechain of custody specified sample with EEF13. The case narrative states thatanalytical difficulties were experienced using EEF12. No qualification of thedata set is applied based on matrix spike recovery data.
No TLC compounds greater than CRQL were detected in the field blanksamples EEF22 and EEF23 or field duplicate samples EER18/EEF19. Noqualifications of the data set are applied based on field blank or duplicate data.
VOLATILE ANALYSIS
Sample reanalysis was sometimes required to meet instrument calibration orcontract compliance and reported as individual results. For purposes of dataevaluation only one sample profile is needed. The multiple analyses arecombined into one profile by using the following guideline which uses allavailable information and maintains consistency. First, values from the undilutedsample when the analyte was within the instrument calibration range are
J-15

reported. Secondly, values from the greatest dilution within instrumentcalibration range and not affected by qualifiers, are reported. In the specialcase when anatytes from reanalysis of a diluted sample are qualified with blankcontamination and the anatyte is present in the sample as demonstrated by theundiluted analysis the concentration value that exceeds the calibration range isreported and qualified J, estimated. Thirdly, any reasonable value is reportedwith qualification.
Case Number 12130: 20 low-concentration-level water samples (TR NumbersEBP63 TO EBP77 and EBP93 TO EBP97) were sent to S-Cubed.
Sample EBP97 contains toluene which may be an artifact of instrumentcontamination from the preceding analysis of EBP96. This is possible becausesample EBP96 contains a high concentration of toluene which may causeinstrument contamination. No attempt to decontaminate the instrument wasperformed. No qualification of sample EBP97 was applied based on theavailable data.
All other QA/QC measures were met and the data are acceptable.
Case Number 12130: 15 low-concentration-level soil samples (TR NumbersEBP78 to EBP92) were sent to S-Cubed.
A continuing calibration outlier affects 2-butanone in sample EBP89. Theconcentration value is estimated and flagged J.
Laboratory blank samples VBLK01, VBLK02, and VBLK03 contain methylenechloride. Field blank sample EBP92 contains methylene chloride and toluene.Values for methylene chloride are flagged B in samples reporting less than 10times the amount found in the associated laboratory blank. Values for tolueneare flagged B in samples reporting less than 10 times the amount found in thefield blank sample.
No TCL compounds were detected at concentration levels greater than CRQLin field duplicate samples EBP90/91. The analyte 2-butanone was reported insample EBP89, but not its duplicate EBP90. Values for 2-butanone areestimated and flagged J.
Case Nutter 12130: 13 low-concentration-level water samples (TR NumbersEBP98 and EEPOO to EEFll) were sent to S-Cubed.
Matrix spike recovery for toluene was above the acceptance range. Noqualification of the data set is applied because the high toluene recoveries mayhave been influenced by contamination.
Surrogate recovery for toluene-d8 were below the acceptance range for fieldduplicate samples EEFOO and EEF01. These samples contain many non-TCLcompounds which have obstructed the quantification of the surrogate. Noqualification is applied to these samples because reanalysis of a diluted aliquotwas performed with acceptable surrogate performance.
J-16

Field duplicate samples EEFOO and EEF01 each contain 7 TCL compoundswhich exhibit acceptable precision. Ethyl benzene is present in EEFOO, but notEEFOl. No qualification of the data set is applied based on field duplicate data.
Laboratory blank samples VBLK15 and VBLK16 contain toluene. No fieldblank samples were sent to the laboratory. Values for toluene are flagged B insamples reported less than 10 times the amount found in the associatedlaboratory blank.
Samples EEF09, EEF10, and EEF11 contain toluene which may be the result ofinstrument cross contamination. Indication that contamination occurred issupported by three points. Analysis of sample EEF08 preceded theforementioned samples and contains a high concentration of toluene which maycause instrument contamination. In following sequential analysis of EEF09,EEF10, and EEF11 the toluene concentration diminishes. No attempt todecontaminate the instrument was performed.
Sample EEF02 contains toluene and xylene which may be the result ofinstrument contamination from the analysis of EEFOl. The claim is supportedfor reasons similar to those indicated in the previous paragraph.
Case Number 1213<h 13 low-concentration-level water samples (TR NumbersEEF12 to EEF24) were sent to S-Cubed.
All QA/QC measures are acceptable and the data are useable.
PESTICIDEyPCB ANALYSIS
Pesticide/PCB analyses were affected by non-TCL compounds eluting in theretention window of gamma-BHC. The problem is not sufficiently documentedin all data packages; however, each case has suggestive information whichrenders gamma-BHC data unusable.
Case Number 12130: 20 low-concentration-level water samples (TR NumbersEBP63 TO EBP77 and EBP93 TO EBP97) were sent to S-Cubed.
Continuing calibration response factors for delta BHC, ODD, DDE, endrin,endrin ketone, and endosulfan were outside the acceptable limits. Analyteconcentrations greater than CRQL, in all samples, are estimated based on theunstable response factors and flagged J.
Matrix spike recoveries were above the acceptable range for gamma-BHC. Thehigh recoveries may be the result of quantification errors caused by the presenceof non-TLC compounds in the gamma-BHC retention window. Dieldrinprecision data were marginally outside the acceptable limits; however, nosamples contain dieldrin. No qualification of the data set is applied based onmatrix spike recoveries.
J-17

No TCL compounds were reported for the field blank sample EBP77.Laboratory blank PBLK10 contains gamma-BHC. Values for gamma-BHC areflagged B in samples reporting less than 5 times the amount found in thelaboratory blank.
No TLC compounds were reported in field duplicate samples EBP73/74. Theanalyte gamma-BHC was reported in field sample EBP75 but not the duplicatesample EBP76. Analytical interferences with gamma-BHC have been previouslymention. No qualification of the data set is made based on field duplicate data.
Case Number 12130: 15 low-concentration-level soil samples (TR NumbersEBP78 to EBP92) were sent to S-Cubed.
The laboratory could not control instrument performance as demonstrated byretention time shifts, unstable calibration factors, and matrix spike and surrogaterecoveries above acceptance range. Analyte concentration values in all samplesreported above CRQL are estimated and flagged J. Data reported as non-detected are unusable.
Case Number 12130: 13 low-concentration-level water samples (TR NumbersEBP98 and EEFOO to EEF11) were sent to S-Cubed.
Extraction holding time was exceeded for sample EEF10. Analyte concen-trations reported greater than CRQL are estimated and flagged J and theCRQL may be elevated for non-detected analytes.
Matrix spike recoveries, ranging 284 to 580 percent, were above the acceptablerange for all spiking compounds. The high recoveries are attributed to samplespecific matrix interference. No qualification of the data set is made based onmatrix spike recoveries.
A field blank sample was not sent to the laboratory. No TLC compounds werereported in field duplicate samples EEF18/19. No qualification of the data set isapplied based on field blank or duplicate data.
Case Number 12130: 13 low-concentration-level water samples (TR NumbersEEF12 to EEF24) were sent to S-Cubed.
Surrogate recovery was below acceptance range for sample EEF24. The datafor this sample are unusable.
Extraction holding times were exceeded for samples EEF19 and EEF23.Analyte concentrations reported greater than CRQL are estimated and flagged Jand CRQL may be elevated for non-detected analytes.
INORGANIC ANAYSES
Case 12130: 10 low concentration level water samples (Numbers MEBC63through MEBC72) and 10 low concentration level soil samples(Numbers MEBC78 through MEBC87) were sent to Keystone Laboratories.
J-18

LCS analytical spike recoveries did not meet acceptance criteria for mostelements. Failure to produce acceptable LCS data provides sufficient basis toreject all the analytical data to be used in a decision making process. Becausesome cursory information may be obtained, the data is provided for review.
Case 12130: This case contained two sample delivery groups (SDG).SDG MEWCW28 contained 1 low concentration level water sample(Number MECW28). SDG MEBC73 contains 15 low concentration level watersamples (Numbers MEBC73 through MEBC77, MEBC93 through MEBC98, andMECW04 through MECW07) and 5 low concentration level soil samples(Numbers MEBC88 through MEBC92). The samples were originally sent toKeystone Laboratories then rerouted to Skinner and Sherman Laboratories afterKeystone was unable to fulfill its assignment.
Water Samples (SDG MEBC73)
Water sample MEBC73 was spiked and prepared at Keystone Laboratories thenrerouted to Skinner and Sherman Laboratories for analyses. Because thepreparation was formed at another lab the data can be used to qualify sampleMEBC73, but not the data set. Sample MEBC74, which is the field duplicate ofSample MeBC73, was prepared at Skinner and Sherman Labs and duplicatedacceptably. MEBC76 was spiked, prepared, and analyzed at Skinner andSherman and was used to evaluate spike recovery performance.
Reported values for sample MEBC73, even though they duplicate well withMEBC74, are flagged "R" because of unacceptable matrix spike recoveries.
Holding times for mercury analyses were exceeded. All reported values greaterthan IDL are flagged "J" and values reported less than CRDL are flagged "R".
The preparation blank contained iron, sodium, and zinc. Reported values lessthan 5 times the amount found in the blank are flagged "B".
Matrix interference of arsenic, selenium, and thallium were reported and thereported values flagged "J".
Samples MEBC75/76, MEBC73^74, MEBC97/98, and MECW04/05 are fieldduplicates. The RPDs are acceptable for all duplicate sets. Field duplicates arenot used to qualify the data set.
Sediment Sample (SDG MEBC73)
Laboratory spike recoveries for lead, manganese, and thallium were below theacceptance range and flagged "J" for values reported greater than IDL andflagged "R" for values reported less than CRDL.
Duplicate RPDs results did not meet acceptance criteria for aluminum and iron.Values reported greater than IDL are flagged "J".
J-19

Sodium was found in the preparation blank and flagged "B" on sample valuesless than 5 times the amount found in the blank.
Samples MEBC88 and MEBC89 were field duplicates. The duplicate RPD'sexceeded 35 percent for aluminum, iron, manganese, and zinc. No qualificationsof the data set were made based on the field duplicates.
Water Sample (SDG MECW28)
Laboratory spike recoveries for arsenic, lead, and selenium were belowacceptance range and flagged "J" for values reported greater than IDL andflagged "R" for values reported less than CRDL.
All other QA/QC measures were met and the data acceptable.
Case 12130: 20 low concentration level water samples (Numbers MECW09through MECW27). The samples were originally sent to Keystone Laboratoriesthen rerouted to Skinner and Sherman Laboratories after Keystone was unableto fulfill its assignment.
Water sample MECW23 was spiked and prepared at Keystone Laboratories thenrerouted to Skinner and Sherman Laboratories for analyses. Because of thepreparation was performed at another lab the data can be used to qualifysample MECW23, but not the data set MECW13 was spiked, prepared, andanalyzed at Skinner and Sherman and was used to evaluate spike recoveryperformance.
Laboratory spike recoveries were below acceptance range for arsenic andselenium in samples MECW13 and MECW23 and thallium in sample MECW23.Reported values greater than IDL are flagged "J" and reported values less thanCRDL are flagged "R", except thallium in samples MECW23 which is notflagged.
Iron and zinc were found in the preparation blank. Reported values less than 5times the amount in the blank are flagged "B".
Samples MECW26 and MECW27 are field blanks, which were found to containelements greater than IDL. No qualification of the data set was made based onfield blanks because the analytical quality of the water used is unknown.
OIL AND GREASE
Case Number SAS4668E: 31 low-concentration-level water samples (TRNumbers 4668E01 to 4668E31) were sent to National Environmental Testing,Inc.
Holding time criteria (10 days) were exceeded for all samples by 13 to 14 days.Exceeding the holding time may result in the decrease or loss of oil and greasecomponents. Samples reporting concentration values greater than the detectionlimit are estimated and flagged J. Samples which report the detection limit
J-20

cannot be used to evaluate the absence of oil and grease; however, grossconcentrations are not expected.
NONAQUEOUS SAMPLES
Analyses of five samples (SAMPLE ID SSB01 through SSB05) were performedat the CH2M HILL Montgomery laboratory. The samples were analyzed inaccordance with procedures described in the following EPA documents.
o Test Methods for Evaluating Solid Waste (1986)o Method 602, EPA-600/4 82 057 (1982)o Method 418.2 EPA-600/4_78_012 (1978)
The only deliverable was a sample result form analogous to the CLP FORM I.Data review consists of reviewing holding times, surrogate recoveries, detectionlimits, and laboratory blank contamination. For sample analysis using Method602 the initial and continuing calibration data was also provided. Additionalreview of these data consists of checking the relative percent difference of theinitial calibration response factors and response factor difference of thecontinuing calibration.
VOLATILE ANALYSIS (Method 8240)
Laboratory blank sample QC BLANK SM, a medium level analysis, containschloromethane, methylene chloride, toluene, and xylenes. Laboratory blanksample QC BLANK S contains methylene chloride and acetone. Sample resultsreporting the common laboratory contaminants methylene chloride or toluene atless than 10 times the amount found in the associated blank are flagged B.Sample results reporting chloromethane or xylene at less than 5 times theamount found in the associated blank are flagged B.
All other QA/QC measures were met and the data are acceptable for use.
SEMIVOLATILE ANALYSIS (Method 8270)
All QA/QC measures were met and the data are acceptable for use.
PESnCIDE/PCB ANALYSIS (Method 8080)
Ail QA/QC measures were met and the data acceptable for use.
PURGABLE AROMATICS-BENZENE, TOLUENE, and XYLENE; BTX(Method 602)
All QA/QC measures were met and the data acceptable for use.
J-21

TOTAL PETROLEUM RYDROCARBONS-TPH (Method 418.2)
All QA/QCmeasures were met and the data acceptable for use.
RESIDENTIAL WELL DATA VALIDATION
Organic Analysis
o Carbon disulfide (0.2 to 0.8 pg/1) was identified in the method andfield blank. Di-n-butylphthalate (9 pg/1) pp-DDT (0.04 yg/1) werefound in the field blank. Samples which contain thesecontaminants at concentrations less than ten times the blankpi-n-butylphthalate concentration or less than five times the blankcarbon disulfide or pp-DDT concentrations are considered unusableand flagged "B."
o Mass spectral confirmation failed for several compounds includingcarbon disulfide (87ZCO1SO8), 2-4 Dinitrophenol (87ZCO1RO7),4-Nitroso-DI-n-propylamine (87ZCO1SO1-SO6, RO7, DO9),Bis(2-chloroisopropyl)ether (87ZCO1SO4, SOS, ROT), Benzoic acid(89ZCO1SO5, SOS) and 4-Nitrophenol (89ZCO1SO5, SO6).
Results for these compounds are considered unusable and flagged "R."
Residential Wells
o Total of nine samples: 7 RW samples, one replicate, and one fieldblank
Inorganic Analysis
o Spike sample recovery for cadmium was beyond control limits for87ZCO1SO1 and cadmium was considered estimated (J) and maybe biased high.
o Barium (6&S yg/1), calcium (0.7 mg/1) and sodium (1.1 mg/I) wereidentified in the field blank. Samples which contain thesecontaminants at concentrations less than five times the blankconcentrations are considered unusable and flagged "B."
o Field duplicate sample differences for chromium and nickel wereoutside control limits and positive results for these compounds areconsidered estimated.
J-22

REFERENCES
1. U.S. EPA. Contract Compliance Screening Procedures for RAS OrganicsData Packages. 9/87 revision.
2. U.S. EPA. Contract Compliance Screening Procedures for RAS InorganicsData Under SOW N. 787. 1988 revision.
3. U.S. EPA. Laboratory Data Validation Functional Guidelines forEvaluation Organics Analyses. February 1, 1988
4. U.S. EPA. Laboratory Data Validation Functional Guidelines forEvaluation Inorganics Analyses. July 1, 1988
5. U.S. EPA. Contract Laboratory Program Statement of Work for OrganicAnalyses. 7/87 revision.
GLT913/068.50
J-23

Attachment 1DATA TABLES
GLT913/035.5Q-17

INOIUNIC CMI«K«l AWIT5IS 01 IISIDINIIAl •III SAHPLIS IP»»C I Ol 4)
INDHCAMC CMUICAIS (lit/I 1
AllMIMUB
ANTIMNV
AMIMC
OAIIUB
IflVtllUI
sUMAri•(•m
CAMUIMcuciia(MOSIUH
OOAlt
copraCWMM
IMN
IIA*
lltMMB
M04SIUI
MMGtMll
MICUV
•01MMMJI
M«ll
POUISIUl
tlllMUk
IHVtt
MMU1
imuiutTIIIAMW
VMftMUk
ZINC
MUCH
IIMIIJ
00.
1.i.».1.
JU
0.
MO.
0.
0.
0.
I.00.
t.10.
IM.
t.0.
II.It.
MOO.
I.*.
1000.
1.111.
40.
S4M>I< lOUIIWi: KOI -01 KWJ-OI
itslMni MM: nikio MrihtnMl* UH>lt<: M-01-15 («-01-l>
M Ctl tin*n MZCOISOI (ucoisoiuOMOMiy: IPA ai IPA cti
..no
•*.«••
O.J 1
11500.0
U.I J
11.*
..
1*7.0..
11*00. 0m.o
0 1....
..• 100 • MOOO.O
..
1*.*
••01-01 IM4-OI rtt«04-OI
mil otvis o»visM-01-11 tt-01-li M-ll-ll
**ZCOlS01 ItZCOIMI ttZCOlM*
(PA cu (PA ai IPA ai
k
..144.0 10.1 0 10.7 *
•-
..M200.0 ftMOO.O ttlOO.O
10.7
..11.1 1.0 II. 1
..10(0.0 11*. 0 7*1.0
..
..14100.0 11000 0 KMO 0
704.0 1*1.0 1*1.0
--..
n i l......
1400.0 0 1*00.0 0 1*00.0 0
..
..
..147 0
IMJ-OI KW4-OI tM7-OI
0. Johnson r. Johnson KMIculM-Ol-ll M-Ol-ll M-Ol-ll
MZCOIS04 **ZCOIS01 MZCOISO*IPA oil IPA ai IPA oil
..
..44.1 0 11.4 1 15. 1 0
•-
..
1*100.0 *2100.0 4*400.0
..
..
7.0 «.4..
IIM.O 111.0
..
..
14100.0 1*000.0 11*00.0
114.0 1*1.0
0.1
..
..
..
..
..
1700.0 1 1100 0 ( 4*00.0 (
..
..
..
IJO 0 }l}.0 (7.1
(•FI-OI
Meld Hintlf-01-11
MZCOII07
(PA Oil
-.
--
11.7
••
..
700.0
..
..
..
..
--
--
--
• •
--
• -
• •
- -
-•
• •
1 100.0
• •
- -
tens:• • 01** cwiUBlntllanI • ISlllBIU MllM
-- • Ml «tlccl*4 *l ftltcilon Mill

OICANIC COtfOUM) ANALYSIS Of ItSIMNTUl •III SAHFLtS (M*< I «l 4)
SUB)* IOOIIM: IMI-OI >mi-«i IMI-OI (M4-*i MIMI-OI ••oj-ei *M4-oi i«7-oi IM*-OI«til«wl MM: Hutlcy luftfull filli o*vli Mvli 0. lolwton I lohnwwi (clllcul Mild iiimMl* S*J*I*«: «*••>- II M-*J-U lt-01-ll •»••!• IS •«••>• IS •»-«!- IJ M-OI-IS ••-«!- 1» H-01- 1»
MTICTKM Oil MMMr: M/OIIMI «*ZCOIS01 MZCOIW) *tZC*lSM IMC* 100* MZCOIS04 MICOISOS MZUISM ItZCOIItTluits i*Wr*t*ry: IM oil IM oil IM oil IM oil in OIL IM oil IM cai IM OIL IM at
MONK OMMLMM tut/I)
MUTIll
OCMOMfMNI
VIMA. OCOIIMocetMimMMWM.IMI CM.WIMICIVQNi MCJMBI MfULtlMLI-MOtOMCIMHI1.1-MCM.OMtlHWtl1.1-MOt.OMtlMM (tOIAllOI.CMHHi.i-Mo*.aoin*u«1. 1. 1-MiCN.mMimMtCMMN lt«MM.OIIM
UMLIIM i
lilM- I.I-MOC«iOM«INIKIOCOMtlMNI
I.I.1-HICM.MM1MM1
cis- 1. >-Pi(M.aicnoriMt-at,MMHin.«iiMfiMi1-MWNMI
TltMOAMIMIMMI1. l.l.l>ftltMM.(MIIMU«MUXMt
IMMMMIMtmtM
IM » 24 IM
0
1
I 170 • 170
0 1.*
••
: ::
;;•.
• 0.
• "
0 no
•
•
•
.
-
•
•
IM * 0.) (
• -:
'.'.
'.'.
.
•
'•
'•
NPfU:• • tl" • Ml «tl*CU« M MUCtlM• • UMH**I* 4*1*
nctoi: i.»

on UNI c cowouo ANALYSIS or IISIHNIIAI •ILL SAWIINC IPACI } of «i
S4*ole tacit Ion. twOl-OI
MUCH ONtllllS
Icilocnl M0>l< S*w
Oil NUriL»kOt4t<
IK: HAIcyltd: M-OJ-U>tr. mcotsoi»i»: IPA an
••01-01Mr ihil 1M-Ol-ISntco isaiIM at
MQl-Otniiii*-ai- isMica tsoiIf* CIL
1*04-0 1fttvllM-OI-IS•91CO tSO%IPA Cll
II1M4-OIMvllI*-OI-ISt«tcaioo*IPA CIL
• Ml-OI0. JolMion•••01-11MICA ISO*fPA Cll
IM4-OIr lohnwnM-Ol-IJ•91CO IS4SIPA OIL
IM7-OIntlllculH-01-11MIC81SO*IPA CIL
••11-01Held IUMt«-01-ISIUCOII07IPA CIL
«GtNic UMfouaa (ug/D
suivoiAiiii
fMNM.usii-oioiof nm. >ITHII1-Ot.MOrMNOL1.1-OICM.ttOilNllM1.4-OIOftOiailNUHlIIWVI ALCOHOi1.1-OICH.OlOIINItM
•isii-ot.oiO<sapiarn)initi4-MIIMfMINaiH-Mino*o-oi-«-piapiVAmiNiHIXAOlOIOIlmNIMHOtlNTlNl
l-WnOFHIMHt.4-oi«iHn.rHiNaititaoic ACIO•1111-CM.MOflMKV MfTHU*1.4-01 CM. 010PM NOii.a.4-nicM.aoii»aiMMPHTmilM4-CH.«OANIllMMJUCM.CMIMA*! Wl4-aCWO-l-MINM.miNDl1-MMK1MMIMLIM
i.4.»-niot.oiomua.i-wnouHiiHiDIMIMfl PtltmiAtl
l-MnOAMUIN(ACINkPNfMMI1.4-OINITIOFNCN014-NinopntNoiDIMNlOfUIAN1.4-OIMflOTOLMNII.»-OIM1IIOTOIU(NIOlilHA4-CH.MOPHCMM.
4-NinOAHIllNI4. «-IMNI no-]••! 1MVIPMNOL
4-HOMPtCMn. PMUM. IIHCI
AMTMUCINI
•OTYV tIMin PMimiAII•POMOAMtMUCIMJiis<i-inmHixvi>pHimiAtiCHIVSIMoi-N-ocin PHimuTfHNZMI if iiauNiHiMis
DltlNZlA. NIAMTMACINI
NOUS•- • MM dcitcltd il Miccllon IIBIII • Dink cofliialntilonI • unuiciblc *4I<
OllulIon IACIOI l.o

OtUNIC OMPOM) IPISIICIMS »n« PCtll AMIVSIS Of IfSIDfNTlAl «U SAtPlfS <P««« 4 ol 41
I4*pl« LOO II MI:*til««*l MM:Ml* SMpl*d:
MIICTIW 01 Mifttr:lUITS UMfAKrr:
MO 1-0 1ItjOjIty•»-OJ. ISS*ZC*IS«IIPA 01
IM2-OI•II Hull••-01- IS••ZCOIM]IPA 01
1*01-0 1nut••••I- IS••ZCOIMlIPA 01
IM4-OIMvll••••1- ISItZCtllMIPA 01
UIM4-OIOOVll••-•1: IS•VZCO 100)9IPA 01
im-oiD. IdtMUMI••-•1- ISIUCOIS04IPA at
IKM-OI>. IC4WMA••-•1-11••ZCOIM1IPA Ol
IM7-OIKtlllCUlS9-OJ- IS•tzanmIPA Ot
«•(••« ifield llink11-01- 11••ico no;IPA ail
OICAMC CMPOMM lut/l)
PIITICIMS AH* PO(
AlPHA-HC t.MM1A-MC t.MMLTA-HC *.MGUWA-tHC IIIMMM) *.M1MPTAOC01 «.MAiMIN i.OlMPTAOt.Qi IPOKIM •••!IMWCUfAH I .01 I* .*> •- •- •• -• 0.01 | 0.01 J O.OI JMIIMIH O.*l4.4-MI *.MSMMIM O.OIutauLUM ii o.oi4.4-OCO t.OlfJOCMLIAH SUlfAII O.U4.4-CM « OJ 0.0) I. • 0.04 |. I 0.04 |. | 0.0] J. I 0.07 I•tnanraiM ».ojMMINHTOM t.OJ
-U4Iu«a«- ii4t
-ii««fNMIM AlOHflM
NDIU:J • IIIMIt* Mil*
•- • N»l MltCIM II «4IMIlM 11*11• • tlMk CWI

VUAIUE OXtANIC COtPOLWSCKOLMJOAtU
iitvlt tacit Ion «m-oistaple MHtiet iftf>32out Stapled 04-I4-B4
CIl MMfter: BUC02SIBLiboritorr s-cteeo
MK1S-0)(IMS
Ob- 14-14B4ZC40S4b
s-ciaioBound 2
Ml 10 01tBP)7
04- I4-B4B42C02SI1
S-CUBIO
•> 10-02iillb
Ob- U-t4B42C40S47
5-CKlDluund 2
NUIBOI-OI Mil bO 1-02IBP27 11112
04- 17 19 Ob- I4-B4•42(02KOI I4^(40«04
S-CIOEU S ClUtOHuund 2
•MI-OIf«P)6
04 11 <4B4/102SIS
s-cteio
MMU I-UJ
matOb- 11-14
•41140S17s-cieio•uund 2
4UWUV01(HI- II
04- 17-14•4/C02^0)
S CU1ID
HKO/S UJ1BP4J
Ob- !2-t4• 4/X40S2b
S-CHIDBuwtd 2
IIIMH1JS-OIIBP 14
04- 17 ••)I42C02UO}
S-CUltD
•MIB02-OI1BP49
04- 14-1414/CO 21101
S CUBIU
mtltuj ai1112)
Ob 14 »4•4/C40KO)
5 UdlDlulMld 2
*MO20-OIIBP 24
04- I7-B4!4ZC02SOb
S-Cl>IO
OIGANIC CQHPCU4DS (ug/ll
VOtATIlf
CHLOIIDicnotofnttM•tlmtlNf O4OIMAC! TDKCA1BON 01 SUlt lOt1.1-DIOtOiafTHiNtI. 1-OICH.OJIOfTmNf1.1-DICH.GIOITHINi (10o&aorauti 2-oio«oiotrmM2-BUTANON(i i i-nio«.ato(ii«MtdlMN TiniAO«OJIIDtVIH«l ACIIATE
i 2-0104 a* on or AMen- 1. i-oiCH.o*onicir(Nt
.1-raiom.oiof n«M
I-MMMMI4->IIMa->-MNTAMONf
i.i.i.i-Tira«cH.oio€imNfTOLUfNf(MMMINHNf
smiNfIOIAI
5 I
5 I
bb B
2 1
1 14 I
42
» I
•4 1
10
BB B
NOUS:
*I• lUnk conlMliullon• HtlBBtC* WllM• < centiicI itqHliti
•cuctlon Unit• potential contMilMni.
KC MlflllVt
rile: •-•noc MI

VOIATIU ORGANIC COWOUOS -CRDIMMATII
I
mcANic am
VOtATIll
*«>l< loot IonSAflpIC Ml l r •
Oil* !*•>!«*:ail lutxcLiberuoty:
rauos iua/1)
M02M-02fW4
M-I2-I*••2C40S27
S-CLXOlaund 2
•M) 20-01IIP22
04-17-1*112C02S07
S-CtSfO
•M2O-02flP*9
01-12-MI12C40S2I
S-CLSfOlound 2
OMI2-OI[IP 11
04- !«-!«IV2C92522
S-CUfO
•M2-02f[fO«
06-I1-I*I«2C40S1I
S-CttiORound 2
•M1S-OICIP 17
04- 17-11I12C02SOI
S-CLBID
•nis-02moo
M-ll-H•V2C40921
S-O4EOlound 2
H4MO1S-02[[101
0* 1) •»I*2C40021
s-cteto•ound 2
•» 101-01(IP99
04-20-1*•42C02I04
S-CLBCO
•KW-OIflPIO
04-17-1*I*2C02SO>
S CUtO
•MM-02[It02
at- ii-i*I42C40S12
S-CUBiOlaund 2
MOW- 01IIP1I
04- U-H»2ca2sia
S Ct«lD
•HIJU-02fllOl
Ob- 11-14•9/C40S11
S-Clif 0•uund 2
viNn. acaiiocCM.OMC1MMMf1>M.EMi OfcfltlOfACITONiCAIMM DliUriOfl.l-OIOt.OIOflH(MI. 1-MCM.dMHMtMl.t-MOCCMHWM I TOTAL)OtCMMUi.i-macaiotmtNi
7 I
191*0 290110 290
9 I
l.l.l-ni<M.O*«IHWCCAtMH 1IHMM.ttlMVIHM. ACIUTf
1 . 2-OICM.CMMOrANiCl 1- 1 . 1-MCH.MflMOPf HtniOMMfTMtM•IMMMOACMMIHINfi . i . t- n
ItnAOAOlMTMNf1 . 1 . 1. l>nnACN.«MIHAMTOltfM
fTsntfM
minu2 )
1100 |
210
2100 |
20000 )
210 |
,WO^
..
,700 S
IM 1
210
490 I
will:• llM* CMUBlMIIOA.
• < CMIrict ricjilctdMIWIIM 11*11.
• MtMtlll CMUalmnt.M* Mirillvt.
Hit. •-•NOCK I
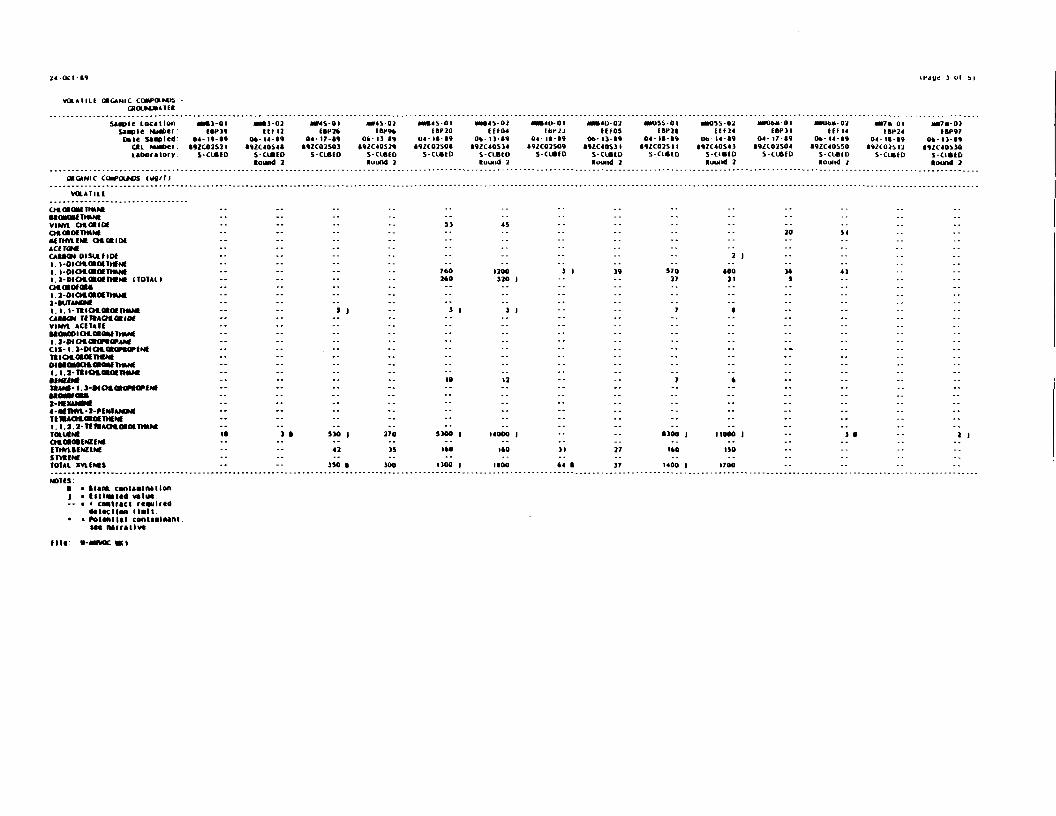
VOIAIIII OCCANIC COWOLIOS
sanpie Locationsanple MilderDate saanled:
Ctl Matter:Laboratory .
OICANIC COBPOLMB IUOVI)
VOLAIILf
aMll-01EBP14
04- tt-MMZC02S2I
S-C14UO
•Ml-02IIM2
0»-l4-«9I4ZC40S4I
5-CUIEDlound 2
MMS-OII1P2*
04-l7-t9•4ZC02S01
s-cuaiD
••4S-01IK- 94
04- 11-14I42C40S24
S-CKfORound 2
•M4S-01[BP20
04 U «9•4ZC02SO*
S-CKiO
KM4S-02f f»04
Ok- l)-»9I42C40S14
S CIBfUtumid 2
MM4D-OIIbfJJ
04 ia-a4142C02S09
s-cuaio
•MI4U-02IEIOJ
04- Il-a9•4ZC40S1 1
S Cl«lD•ound 2
•WOiS-OI[BP2>
04 ll-«9•42CQ2SII
S-CLCED
alMtS-02 MtOkM-OIE E ( 2 4 IBP1I
Ot 14 19 04-17-14(4ZC40S41 t4ZC02S04
S-CiatD S-CLBEDluwid 2
1MU6«- 02t(M4
04- 14 «9•4ZC40SJO
S-C16ID•omtd 2
W7« 01IBH24
04- It -19t9lC02SI2
S-CUItO
1M7M-0}IBP47
04 - 1 1 - 1*I9ZC40S10
S-CICIDlound ]
UOMMTHItMVINVL OtO«IMCMLOiaflHtMt•fTMVlIM OtOtID*ACiTONfOtMON OISU.HDC1.1-OIOt.OtOtIHfNfi . 1-oiaf.aiaf miNi1.1-DIOt.CIMIMM (t 01 AllOCOiWOUi.i-oiocaiofn«Mi2-tUTAMM1. 1. i-nicnoofimMOMIXM Tin*Oti«IMVIMVt ACIIAII
2 I
7602*0
1100120
) I 57027
•0021
341
> I 1 I
cis- 1 . )-oi<M.oi(iniar>iNfTtlOftOIOfTrCMtOIMOMOCOROM INtNii.i.a-niot.aMtnttMi(IWIM
I-MMMM
TI1MCH.OiafmfNfl.t.l 1-TinACH.OtotmtMTOtUNI I t
ITHinilMIlM
tOlAL XVlfMS
IM |
42
1M I
SJOO |
1*0
1100 |
11
44 1
•100 |
140
1400 1
110
1700
NDIIS:t1
• Hank, contamination• fiddled ¥>|IM> < contract required
detection Halt.• Potential contaailnanl.
M< narrative
rile: •-••voc «i

IH4VC 4 Ol 51
VOLATILE QiGANIC CQ«POLM»GtOMXMTfl
OICANIC UK
WXAIILt
la lt leullon:S»PlC MMftCCoil* s»pl*4:
oil MaMf :Likontofy:
*OU« (U9/II
F*a*7*-0tIIPJJ
1420)2012s-ciato
Flaw?*- 02IIP4I
I4ZC40010S-CLIIOIoun4 1
•MIS-OI MMIS-02IIP14 IIHO
04- It-It 0«j-l}-*4I4ZC02SU I4ZC40S14
S-CUIfO S-CUXDHound 2
•Mia- 01
04-14-ltitzco2si;
S-CUUD
•Mia- 02IIFM
Ot-ll-ltI4ZC40S40
luund 2
aMIO-OI(ICJ1
04 -It- 14I4ZC02S 14
S-OMID
a«nio-02(IM7
I4ZC40S4}S-CUtiOlound 2
•MM- 01
04-20-14ltZC02Sll
S-CUIfO
•M4H-02IIFII
06-14-14I4ZC40S42
s- cue to•ound 2
IMMM-02EEFI4
Ok- 14 -14ltZC40U41
S-CUIID•ound 2
aw KM 01IIPJ1
04-20-14I42C02S12
S-CLtlO
•KIOM-02fiF20
06- 14-lt•4Z140S4I
S-CUIIDlouid 2
IIP 9404-20-14
I4ZC02S19S-OAIO
VIMA OCMIMOtMOfTMNf•ITHVtfM OCOtlMACtTOMCAIMN OISU.HM
i-oicnoiatncMl-OIOCOMIIHtNl
OAOtWOM1-DICM.ttOfTMtNftUTAMM
CAIMN TtnAOtaMMVIMKl ACI1ATI
CIS- l.l-OIO&OIOMWINf1IIO4.01MTMMOl MOBMMiOlOal THtM
ItMINITtiM-1. i-oiocoionarcM
rinuocoioimiNii t.j j-TiHAO»o«ofTm*«
ITHltllMIMSTVttMIOIAI KYI (MI
Mills:• • •in* CMUalMtloaI • lllla*M4 vallM.• - • « cMirKi rtoilrtO
«il*cll«i I IBM.• • AiliAllil cmtiBlninl.
HI Mirallvt.
Fill: W-, m\

VOttllLE 0« UNI C COWOUNttCKOUOMIfl
s
<*GANK cat
VOlAIIll
4*>le location.SOP 1C NU4<ICf .D»lc Sampled
OU ftWOCrLaboratory
POLM8 lug/ II
fl«BII«-OIEAP97
04-10-14•4KOJOJS
S-CLIIb
«ll*-02(1121
UO- 14-14•42C40S44
S-CL610•ound 2
MI2S-OI[1P4I
04- 14-14•4/C02SI4
s a«<o
MNS-02(!IOt
Ot- I] 14•42C40S1S
S-ClAiORound 2
•rllS-OI MtlJS-02 t*ri4S-OItKP40 [EI07 EIPJ1
04 14 14 Ob- 11-14 04-20-14•4£t02:>)0 i42(40Slb I4^C02S)I
} U»ID S-CKID S-CL«EORuund 2
MHI4S-02 «Ur20S-01E E t l l EBPbO
Ob- 14-49 04-20-14•42(40S44 142C02SJ4
s-ctefu s-cmiu•ound 2
•W200-OIIBP6I
04-20-14142C02S16
S-CLBEO
4M2IS-OIEBPb2
04-20-14I4ZC02SJ7
s-ciatu
UOMMImNfVINVl CKOIOt
WTHtlfNI OtOtIM<C(IO4taiMN DISUHDCI. 1-OIOtOOI HUM1.1-OKM.aofimNi.
Oft 0* Of OUti
VIIM. ACIUTfMatODIOftOIOtt IHtNt.
CIS- 1 . l-OIOftOROPIOPINtTIIOtOlatTMNf
i. i.MNZf*
- i .
l-HIUNOM
TIIIAOftOCOITHIMI. 1.2 2-TIHAQ«.(M« IHANCTOiUfNCCM.OKBIN2CM!ITHDltlNZlNfSIVtfMrout
willt • Hum conliBlutIMI • (>lla>l<4 nlut-- • i canlrici tcoulied
•Kite tlan 11*11• • Patent U I conuclntni.
H«
rile:

P4ge i ol i)
Sl«l-VOlAIIIIS • C*OCHJ*AHt
Sliwle loci II onSMple NUtfWfOtic Slip led:
CBI MMttr:liboraioiy:
OBCANIC C(M"XM» lug/1)
StalVOLAlltf
MM 1-0 1fiP34
04-14-14B42C02SI5
S-04ID
•Ml -02fflOl
04-11-19•4ZC40S17
S-CiafDBound 1
••1101 01EBPJ7
04- 17-19I4ZC02BOI
S-CUUO
«»BOI-02IM22
04- 14-19142C40N04
s-ciatoBound 2
MII1-OI(BP12
04- 14-14I42C02SII
S-CtBID
wi*- atIIM4
04- 14-14I92C40S47
S-Cl«H>Round 2
Mris-aifBP32
04-19-19•92C02SII
S-CLBfO
4KIS-02H 1 1%
04-14-19•9ZC40S44
S-CLB1DBound 2
ami a\ mtti-oitBPll tt(04
04-14-14 04-11-14•42C02S22 I42C40S1!
S-CUIIO S-CLBtOBound 2
4MIB02-OItBP49
04- 19-14192C02B01
S-CUBtO
imitot-oiIIUl
04- 14-19• 4K40HOJ
S-CUBIDBound 2
HM2U-OIIBH22
04 17-14•92C02S07
b CLBtLl
4H02U-021BP4J
04- 12 14I42C40S2I
S-OJttDBound 2
PMfNDlBIJ(2-0»OB«>HVIIIIHH2-OtOBOrtlfMXI J-OIOtOBOBIWJNtl.4-DIOI.<BalN»NfKNZVl ALCOH01I 2-DIO«OBaitN2ENt
BIS(2-CM.OiOISOP«OPYL)tlH(l4-unfinfHfNoi
IMFKBOM2-2 4-CHMBtNIOtC ACID1 1 S I > • CMlOIOf IHOKV l«f IHtNf1.4-OIOt.WOHCMM.I 2 4-I(KH.aa>IMIfN(
4-Cn.CKHNILINiMf UCHtOMMIMOl IHt4-CH.OIO- 1-HtmvXWItNOt
2 4.4-niot.ciorHtNoi1.4.1-niCMalOMfNDl1 - CM.OMMWMimi f Ht2-NinO*MlllN(
I.t-OIMntOTOiWNi1-HinOMMllNl
I.4-MNI4-HIOIIHMfWANa.4-MNI1l«la.UfNfenmn.4-OftOMmMM
14
140
71
HMtl
4-WIMMNIIM4 . »-MM wo- IW-IHTMMMMIfm.A4tlM4-MOMMHM. tMMa IIHHMUQ*.OM»U«IIMPlMTACMO
wmucfMfoi-N-M/m.
torn Buan PMTHHAII]. t-DICM.atM(MZIOINfIfNUMOMOHIACiNi
-ITHnMtm tPHTHAIAIIoi-x-acm miwiATitlMEM* )f lUBANIHf Ni S•f NZOO tri
IMKNM 1 . 1 . >- CO IPVtl KDltlMZIA HIANTKACtNtif NICK oil )PiinfNt
NOUS:B > Blink conualiullonI • I it iw led vilut-- • < conuacl required
•election IIBII

Hjyc 2 ol
St* l -VOtAl l t tS - GKOUMMAltN
Savle locationSMVlC MUDtr .Out Sawlcd
Cll MMber :Laboratory
OtGANIC CCMPOXMK (U9/II
SEmvOIATIIE
HM2S-OIElf II
04- 17-19
S CUCED
WO2S-02IIH93
Ob- 12-19!9ZC40S2b
S-CLBEDlound 2
EHMM12S-OIEBHK
04- 17-19I91102UO}
S-CtBED
««>02*-OIEBP29
04 17-19
S-CUDEO
(Hl'94Ob- 12 14
Ituuild 2
«M« J - O I
04- 19-19
s cmio
art) 02EEI 12
Ob- 14-19•9ZC40S4I
S-UACDluund 2
MVtBOJ-OI
04-20-19I9ZC02K04
S CLBID
HHO3O-OIEBH2I
04- 11 19
S-CLBtO
MWJU 02tltO)
Ob- 13-19•92140S13
S ClBlORuuikd 2
u*OHt 0\(Of 30
04- 17 • 19• UC02S02
S-CUIEO
4WOMI-O2(1102
Ob- 13-19
S t(«(Oluund I
IBP 1704- 17-tt
I9/102SOIS C14f(U
•W03S 02EtIOO
Ob- 13- 19>9/L40!i23
S CUBEDKuimd 2
]-<M.C«OPHfMll1.1-DIOftOtOIINZlNtI 4-DIO«C*OtfNZEN(•iNZn AICOHOXl.7-DICN.a«Oi(N{iN(1-MntnptCNOitl5(2-OtOtOISOMOPVl HIHtl4-UTmtPMMXM-NiT*oso-Di-n-noriYA«iNfHtXACHOKXIHtM
ib
b4
ISCTHOICNfl-NinOPMNDt.2 4-oiwimvmtNutIINZOIC ACID•iS(i-o«.ctotfHaxv>»fit«Nii 4-oiocaapHtNui
tl
71
I J21 I
4-CMOiOWNllNiM WOtM«*UI*OI INI4-cn.ato >•« mrtPKNoi1-ttTHrt.Ntmimi.CMMMCM.MOCVC10riNT»OI INI2.4.»-1IICI«OiaPH(Nut1 . 4 . 1- It lOtOMPMNOiJ-CH.OMMMM1MIIMI
it. 1
2 J
PMTW14II
umi
1. t-OINI TIOIOiUCNl)-Nin(MNILINiiCfWPHTHiNt2 4-DINITIOPtVNOl4-NITI(»HfMllOltl*4ZOfl>AN] 4-OINITIOIOtU(NiDiiTHn. nnmiAif«-oft«arMMiri rmtlimn*4-NIII(MMIllN(4 . t-OIHI ItO- 1-M IMVl PHiNOl
flHfl
PWfNiturn tfNZvi1. l-OICHLOIWINZIDINIKMKMAXHIWACEM
4-MQM»MMn.HfWOt.OiOilNZfM
FHCNtMTHifNiANIMACIM
• ISIl-lnmHfXVllPHTHALAIIOI-N-OCIYl PtinwLATE• INZOd lllUOONTHf NtSHMZOIK >riuauNlr«Nf s• IMZO(A)PV1EMIMXNO( I 2 J COIPV«IN»Dlt(NZ(A HIANTHUCCM• (HtO(CHI IfilVltNf
NOUSI|
llant contMlrullou( II iMled value< cui i i (4ct icgui fcddfiec I luit I IMI i

Stai-V<XAlllfS • CROLMMAItl
SM»I« 1-XMlOO:SMtlt NUtfttf :m« SAW led:dl M*»l:litefiieir:
fl«M)lS-02f f tOI
04-11-14I42C4002)
i-OJKDtaunt t
•M4D-OIIIP21
04-11-14I4ZCA2S04
S-OAED
•M4D-02ftros
Ott- 11-14142C40SII
S-CtliOlotmd 2
•M4S-OIEIP70
04-11-14I42C02SOI
S-Ct*(0
•M4S-02ICI04
06- 11-14142C40S14
S-CLBfOlaund 2
MMS-OIIBP 26
04-17-14I42C02S01
S-CLBtO
MI4S-02fVP46
06- 13-1414ZC40S24
S-CIBIOlaund 2
•WJi-OIIIPH
04- 11-1414ZC02S 1 1
S-CIJBEO
MI03S-02Ell 24
06- 14-14HZC40S4)
S-CLBEDlaund 2
WHH.II-01E1P1I
04-17-14•42C02S04
S-CUHD
MM>6»-021(114
06-14-14I4ZC40S10
S-CUIEOluund 2
M>7*-OIIBH24
04-11-14I4ZC02SI2
5 Cl«tO
mnn-ojIBH47
06-11-14I4K40!>10
S-CICIO•ound 2
IIW7A-OIEW 25
04-11-14•42C020I2
S CUtfO
O1CANIC COMPOXMa (U»/ll
simvaiATiLi
1-CN.aomiMiiI J-PIOllBIBfMUttI 4-DIOt.OIO(INZiMtENZn AlCCHOil.2-OIO«.«<BfNIfNf
• I
H$(l-CM.aiOIMMWVI.IfThU4-MnMJMMHM-MIMM-OI-ll-HcriVABINiHOUCM-OMCTmM
ISJ-WT2.4-OIMmn.PHfNOltfNZOIC *<IOI 111 1-CM.OiOf IHDXVUK TtttNf1.4-OICM.OiOnCMX1.2.4-niCH.atOBENZINt
• I2> I
17
41
10 I
4-a«.au»NiiiNiwwatai«M(iM>i f NC4 -o»oio- »-•! wm mcNoi
MMOtOMCVClOPf NTAOI f HI1.4.»-TIIOI.CIOrHfN01
• I
7 )
21 I)
»• 10
110 40
II I
. .2-CM.MIMMIMUfM2-NI1IOAMIIIMOlMtltn. MIMLATI
l.t-MMMOTOUJM1-NinOMNllNiACIMimiMMIi. 4-Di HI none HOI4-NITM*WMM.OIMMWUUM1.4-PIMIIMTOiUINfDIITHM. M«n«tATf4-CM.OMPMIM. MNVL IIIKIrtuacn*4-M1MUM1IM4 . »-o»w mo- 2-M nmncNotM-MlMMMHCIMA4MMi4-MOMfMNM. PMtM ITMfl
CHIVSINI1110-CTHn.WXYl IPHTWLAIC61-M-acm. rtmtuiTiKMUNt I HUBAMmiNl StIMUMK iriUOiANTHiNiSIINKMAirvilNI
DlliMZIA HIANIMlAClNItttaotau ironlMl
NOIIiI • IKM canI • UllMltd
«lt( I ion i i

St«l-VUAIIUS - GAOLMMAltfl
Suvlc iotttlonSM*I« MHfcefMIC siipiea:
Ctl MMtter :liter t loir
r«4«7a-02[U*94
0»- 11-4944ZC40C10
S-Cl4)fDRound 2
MH>4O-OIl»P)3
04- 19-4449ZC02SI4
s-cteto
JMO4D-02til 17
06- 14-4944ZC40S45
S-CIHIO•aund 2
MW4M- 0 1OflS
04- 19-4949ZC02!>|7
S-Cl4)fO
«n>4* 02III II
0« • 13 -4949ZC40S40
S-CIDIDHound 2
AUVU4S-OIIBK34
04- 19-4949ZC02M6
s-cieiD
MW45-02HMO
06- 11-49HZC40SJ9
S-CL4)fDlauid 2
MH09X 01 M094I 02(6C5< II) l«
04-20-49 06-14-4941K02S11 49ZC40S42
5-CietD S-CL4VIDRound 2
IRWK9* 02in 19
06- 14-4949ZC40U42
s ciaioKuund 2
•MIOX 01IBFS)
04-20-4944ZC02S12
S-Cl«ID
MIO*-02 WVI IM-01III JO lUI'Sb
06-14-49 04- 20 4949ZC40S4I 49/L02^3%
S-CLAIO S-CL4ltDluund 2
IBI1)?04 • 20-49
WCANIC COM>OM>S lug/1 I
StalMtATILt
PMfNOlt!S<I-CH.C«OfTHVl>tlHtl
I 1-OIO4.0IC»(H2EN<.
ItNZYl UCOHDli.i-oio*a«oMMZtNt
4-MTHn.HCNOl
M nttfMtfMI SWUM ONt4-MlMMCNOii 4-oiwTtfnnKMX•INtOIC ACID
». 4-01 Oft OtOPHtNOtt . I . 4- tl ICHOtOf NZfNtKHPHTHtltMVOtOKMNILIM
4-O«.aiO-l-IKTMVtH«Naii-ainfitHtnnmiiNfMMOftaiacvawiNiwi i1.4.»-TIICMLOM»MN01
l-NintOMHlIMDIUTtWl
1.4-OIMI1tl»t«Nai
1.4-
DIITHVI4-a+atamiHn mtrm. IIHIIFttntNf4-MI1IMNIllNi4 t-oiMtio-1-unm.rtifMH.
4-MOMTM»M. PtCNVl IIHIIHlXtOtCtOiiNIfNI
ANIMACINiDI-N-MJTVI PHTHkLAItriUBAMIMfMfPVIINC•OTVt IINZn PH1H>IA1I1. )-DIOtGiafNZIOIMItNIOIAtAMimACiNfCHIVSIMtisii-OI-M-OCIVI
If NtOIK KIUOANTKWSUMZOUIPVItNtIMXNOt I . J. 3-O»PvtfNfDltlNZIA.H)ANTI«ACIN(
f HIM led vtlue« conflict fequlieqat i eel ton l i m n

Stkl-VO.AIII.tS - GROUOUItl
OUCANIC
Sf«IM
saaolt Location:Saaele Miaotr .0*1* saaplcd:
Oil NuMxr:laboratory:
OUPOLMB lug/I)
MATIlf
Mma-02llui
04- 14-M•9ZC40S44
S-UJMDtaunt 1
HM2S-OIt«*4l
04-l9-(9(9ZC02S i«
s-cuito
• I2S-02ff fOt
at- 11-19I9ZC40S1J
S-CutfOioond 2
MII1S-OIUP40
04-19-19
S-OAfO
MHI1S-02lito;
Ob- 11-19
S Cl«(Dlound 2
•OI4S-OI
04-20-19•9ZC02S1I
s-cteio
WI4S-02fff 11
Ok- 14-19•9ZC40S49
S-CKfD«ound ]
IW70S 01ftpto
04-20-19I9ZC02S14
S-CL4)tO
•W20U-OIIBPtl
04-20-19•9ZC02S16
s-ctato
•V2IS-OIIIP62
04-20-19I9ZC02S17
S-CUBfO
- - - • 21•iS(l-o«.aiotiifn.)tiHti2-otaiapHiNOi!.)-OICM.alOilN»NiI 4-OIOftOiaitMtfW•INtta AlCCHDtI.J-DICH.Oia*fNZfNt
4-MnmrHBa.
MIXtOCallOCIIttMiMIMtiWIM
2-11.4-MMTIM.MINOi•IMZOIC *cio• I SO- O»«Of THOKV )•( IHUNf1.4-OIOCOICPMNQlI >.4-HIO«.flt(»tNZfNt
4-OftOKMNILINfMXACMOMtUTAOl tNf4-CH.OtO-l-MTHn.PHtNOl1-MTIMMMTNU.INi
2 4i.4.1-cn.aiOMtmmami
OlMIMIi MflWUTI•CfMtmiMMIMII t-MMnOTOiKNf1-MI1MWM1INI
1 4-OIMHlOI«MOt4-MITiaMMm.DICIMMHAANi 4-oiMHara.utM01 11IM. MIHU.ATI4-OtOHMWM. fMIMrt. flHtl
4-M1MMMIIM4 .•-MMlMHi-
MMCM.OMMMIM
fHTmtAIt
IINIVl PHIHItATf1. 1-eiOftMOilMIIOINfIINUMOMOMIACiNfCMVIfM
oi-N-ocmtIMMl IHUOIANmMS
IMWNOt 1.3 1-COIPVIENCDiliNZU. HUNI«ACfNt•CNTOfail )MIVlENf
hfiiii• • •tank conttalrui IonI • I mailed value•• • • conflict requited
ociectlon llnii

PtSIlClDt/PlB! -
Smile Location.
Stavle MMOer:
UK sailed
OIL MJ*>er :
labocaiofy
WCANIC COWOLMB lug/I)
MWI-OI
lap 1404-l9->t
•9ZC02SI}
S-Cl>tD
MMI-02
11104
Ob- 11-19
I9ZC40S17
S-OAtD
•ound i
urmoi-oi
IHP27
04- l7-«9
t«ZCO»OI
S-Cl»10
«l.0.-02
11122Ob- 14 49
•4ZC40K04
S-CLBtD
Buuild 2
•Wl* 01 Ml«-02
lOflJ III Ib
04- 19-19 Ob- 14-19
•91C02SI1 a9/C40S47
S-CIMIU s-coeto
Kuund 2
MflS-OI
tapi2
04-19-19
•9ZC02&II
S Cl*(0
JMV1!»-U2 MkU2 01
till! IbHll
Ob- 14 -49 04-1") it
•42C40b4b !4ZC02b22
S-CUItU i-(HIID
lound 2
MWtt2-02
I1IU9
Ob- 11-19
a9ZC40Sll
5 CLBtD
Hound 2
MIIB02-OI MVIHU2 U2
ll)l>49 III 21
0 4 - I 4 C 9 Ob- 14 tt
•9ZC02i02 I9ZC40K01
5-CtVtD S-CIOIU
luuild 2
MWUJII Ul MV02O-02
lbH22 IOC95
04-17 -19 Ob- l2-(9
!9ZC02bQ7 t9/C40i2a
S-CLCID S-CIBI1>
lound 2
PES1ICIMS <n« PUS
Mllt-IHC
CAJUU-tnC UIMMKKI
MCPUO1.0*
ttUIN
HIPIACH.C* fPOXIM
(MXBU.UN I
OIUUIM
4 4 -EC*
IMXIN
4 4-OCO
(MX IN AIMHVM
IMXBtAFAN SUfAII
4 4 -DO I
•fTHDXYCN.01
fKOIIN KlIONt
CMOIOAM
TOUPHINf
AlOUOt-lOU
AIOCLOI-I22I
Aiaciai- UJ2AlOCld- 124]
AlOUCt- 1241
0 12 I
AIOCIOI-UM
•- > NOi detected *t
detectlaa I lilt
i • unusable
• • ftunk
I •

PtSIICIDt/PC*> - CXOUMJMItl
UMBIC lOC»Hon: M02«-OI 4M2H-02 4W2S-OI UUM2S-OI MM2S-02 1M1-OI MMJ-02 •tflOl-OI «M1U-OI
S*4»l« MHtCf : IM>2« f»P«4 ItPIt IWIt foP*] IIP)* UM2 i(Pit IBP2I
Ml* UlpICi: 04-17-1* M-ll-lt M-I7-** 04-17-1* Ot- 12-49 04- It-l* 0»- 14-t* 04-20-1* 04-14-4*
*~ "-*•" I*ZCMU» ««ZC4HJ7 tUC*2Mi *«ZCO200> l*ZC40S2k I1ZC02S2I KZC40S4I I4ZC02I04 44/C02S 10
IttWIIIOiy: S-OAtO S-OACO t-OSID S-CLBIO S-CL«eD S-CI«iO 1-O4){0 S-CUIO S-CL»D
«•«•< 2 louod 2 lound 2
OCtNIC COHPOLMM (Uf/ll
MMDU-02
1110)
Ot>- ll-l*
I*/C40S1)
S-CLBID
lound 2
•M14I-OI KKIUl-02 OW1S-UI
IIPIO ftioi tori;
04-17-4* 0*-ll-l* 04-17-lt
•*K02S02 I*ZC40S12 49ZC02SOI
S-CLSIO S-CKtO S-CLIfD
tUUfKl 2
•KOJS-02
((tooM- 11-4*
(*ZC40S21
S-Ct*fO
taunt 2
PtSTICIDCS (IX PCII
ALPHt-IHC
•IT1-MC
M11A-CHC
CMMM-MC 41IMMNC)
MPTAO&C*
tlUIN
HVTtCMKB IPCKIOf
IMXMU.fAM I
OII1OIIN
4.4-BM
IMMIN
(MXNUfAM II
4.4-BOO
IMMIH 4LMIMN
4.4-CDT
•ITHOKVa
M»IN »T(M
MM1121
-111)
-1243
IM*
«cltcilon I IM I.
I • uwwkU
• • tluik conualiuilo
I • fitmu*!
•HI

PtSIIClftt/PtBi - UtOlMMIAUB
SJWlC location MN»S-B2
S4WIC Ml*»l : t troiOitc Stapled. o*-ij-»9
OIL lUtMr : MZC40O21
LtMftlOry S-Cl»lO
lound 2
HW4O-OI
ilf21
04-ll-t*
»{CO»0«S-OBtD
«W4O OJ
IttOi
0»-ll-«»
I*ZC40S1I
s-c«to
lound 2
MW4S-OI
tap 20
04- !•-•«
•41C02SOI
S-CKIO
•mns uj11104
00 11 «•)
IWC40S14
S-U«IU
lluulld 2
JUV4!»-OI
IUH2t)
04- 17-19
•9^C02S01
S-CUIID
•K4S-02
t*H«k
Ok- 11- •»
•«£C40S21
S-CLXD
•aund 2
•OO5S-OI
IBK2I
04- I«-I9
• 9ZC02S 1 1
S-CUBfO
•MiS-02
11124
Ok- l4- t«
• •UC40S41
S-CtJBtD
Buund 2
JMHJkM-01
(BP1I
04- I7-I9
t«ZC02J04
S CLBID
M*Ub*-02
tt l!4
Ok- 14-19
•92C40S>0
s-ct>to•aund 2
MT7M-OI
t»>24
04- l« 44
•9ZC02SI]
S-CKtO
MT7M-U2
IBI*97
Ok-ll-«9
•92C40iM
S-CU»tD
•oun* 2
m«*7«.oit»H2>
04- !•-»
•92C02DI2
S-CLBtO
OICANIC 00*01*05 (U« / l l
risiiciixs ind POI
AlPt«-ttC
(IU-IHC
«m-iHCOUHU-ttC ILIMMNI)
MP1ACHLOI
AID* IN
HIF1ACMOI IPOXIH
INDOSUfAN I
OIILOilN
4.4-OM
IMKIN
0 14 I
00* |
4.4-CO)
I>CIIN HlMHtDf
IMX»14.»»N SU.FMI
4 4 -tor
20 J
0 ]2 J
1MKIN ItlONf
0&01C»N(
TOXAPHINI
tlOCl 01-10 It
tlOUd-1121
AlOUOt- till
A10CLOH- 1141
UOC10»-I14I
aacioi-ii>4AIOU01-I1M
-- • NO I delecle* it
Ociecllon HallI • uwutlct • lunk conUBlrallonI • mimed ¥iluc
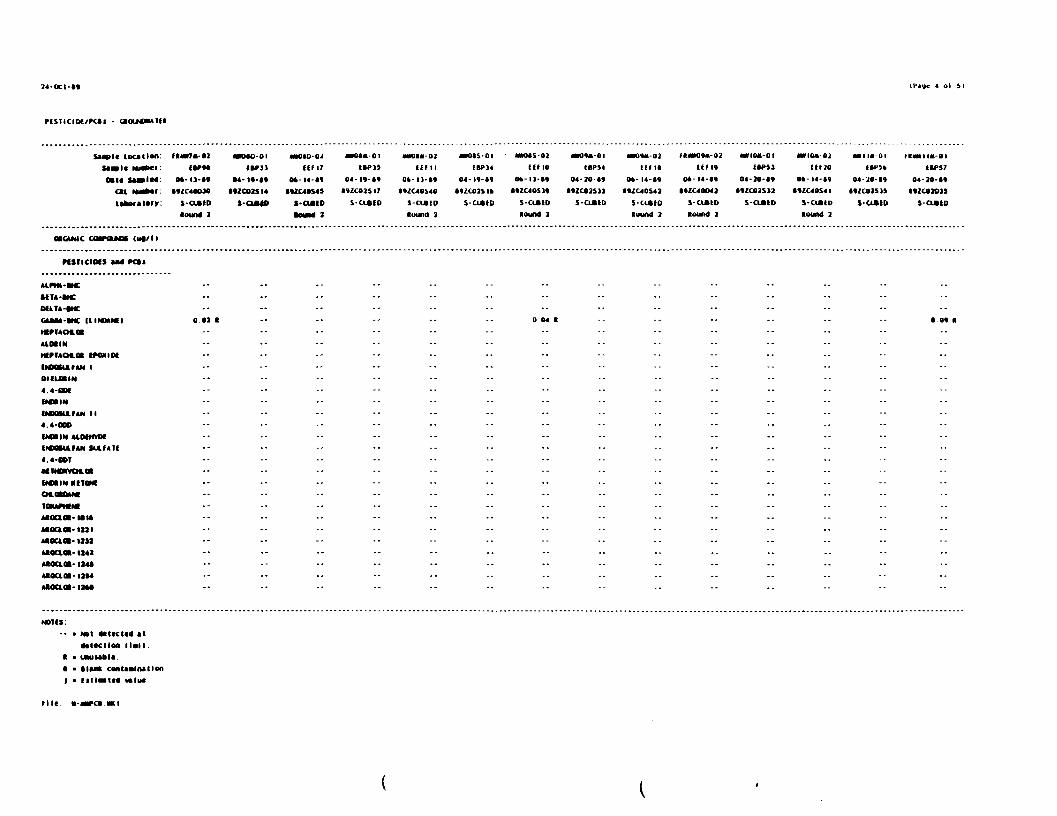
tl'rftfe 4 Ol 51
PtSTICIDC/PCtS
SMPIC tOC*llon MW7«-02
SM»I« MMkci: ItM*
oil* $4»l«d: o»-u-i»
cxi iimf-r- itzc4oojo
l**o«l«y: i-o*tO
lotmd 1
OUCMMC CdPOIMM (of /I)
•mtO-OI •MMD-02
itpn fir 17
•4-lt-t* 04-14-lf
I*ICO2II4 ««1X40S49
%-OMta f-O*fO
•awd t
•ra**-oi
IIP35
04- !«-!«
»ZC02SI7
s-ctcco
•MU-02
III IIOt-l)-**
•4ZC40S40
S-CL»ID
•aund 1
•MtS-OI • «M*S-02
iW>14 If MO
04-lf-» M-ll-«t
• 9ZCB2SI* MZC40SM
S-CttIO S-CtlfD
laund }
MKtH-OI
IBP54
04-20-tt
IWC02S11
S-ClBfD
«M>«<I-02 (MMWI-02
ftMl IIM*
M- 14-14 M-l4-(4
IUC40S41 M2C40CM2
S-Cl«[O S-CLCtD
lound 2 laund 2
•vioa-oi
ftp»
04-M-M
•tzcaisii
s-a«to
MIM-02 Ml 1*01
tttlO flPJt
Ok-l4-t« 04-20-»
•UC40S4I I9ZC02S»
s-aatD s-u*tD
laund 2
tKHIW-OI
1WJ7
04 -10- If
•«2CO2O1>
S-CUIO
riSIICIMS Md Fd>
MU-IHC
MLU-MC
CUU-tHC UlNUtNt) a. 01 I
AIMIN
HfPUOtOt (MXIOf
DlfUBIN
4.4-BM
[MM IN
4.4-OCO
UCilN AlMMMtt
4.4-BOI
•fTHOKVOCM
iMMINKITIM
<M.OMIM«
TOMfMM
aaaai-MJit-i*4i- 114*
t-IlM
Mioaoi-iN«
NDTIS:
-• • Not «ttec ltd al
•tucilon llslt
I • uwukl*.
t > (1*1* contMlnMlon
I • tlllBlte* wluc
rile.

PtSIIClM/PCBS - ClOLMWAItM
ttwle Location:
"*" "»*"
Ctl H*>tt
iikoitloiy:
(•CAMIC CCMPOLMS (ug/l>
•Ml 10-02
ttui
M2C40S44
S-CL«(0
Hound 2
IVI2S-OI
tM>4l
•«2C02$H
S-OiiiO
MII2S-02
ttiot
••2C40S19
>-o«tolound ]
MM1S-OI WIJS-02
IBP40 U107
•«C02SJO MZ^Oilt
5 tLBll) S-CIBID
Round 2
««I4S 01
IWSI
• 4ZC02!,)!
S-CLBID
<HI4S-02
tllll
•«ZC40S4«
S-OJltD
lound 2
W20D-OI
fOPtl
S-CLBIO
MT20S-OI
IBP 60
IUC02S14
S-CLBIO
MT2IS-OI
IBCU2
ȣC02Si;
S-CLBID
PiSTiciDts and PCIS
0 01 I
•IIA-tHC
OiLTA-IHC
CMHU-tHC (IIMMNI)
AlOtIN
HfriACHLOU IPOXIOt
(M)OSU.rAN I
OltLO* IN
4 4 -OCX
IMMIN
IMXMULHH II
4 4-OEO
4 4-HJI
•JTMWYCM.OI
IMaiN KtlONI
0 01 I
0 OS I
IQXAfWNI
AIOUCI -10 It
AIOCtOH-12]!
AIOCICB- 12)1
A«OUO«- 1241
AlOCICi- 1141
A10CIOI-I1J4
AIOCIOI-I2M
• Not detected «t
detection IIMI
• uwuble
• Hint conliBlnitlon
• Ell IN led vilue
* urni MI

INUGANICS - CtOMMMItl
suvle loci lion111 saiple MMfcer .
Dale sieplcdCii NuBbef :label a lory.
INOICANIC O**ICAIS (uo/l)
MO 1-0 1
•tlCtt
04- It-It
I12M2S94
UUl
MHO 1-0}
«lori20*- ll-lt
•1IC40SM
KIVtI<M
•MM 1
•MIOI-OI•CIC27
04- ll-lt
•110)2109
UML
M» 10 1-02
mjorit06-14-lt
I12C4M07
KfVSKMC
tound 2
MKIS-OI IM)IS-02
MII02 MtCWIt
04- It-It Ok- 14-lt
I12C02S97 l12C40StS
UUl KfYSIONt
found 2
•Km- oi«flC)7
04 -It- It
•12C02SJI
•«*l
•WK-02
•K*20
Ob- 14-11
I12C40S16
KtVSIONf
lound 2
•M02-OI HM02-02
•tool MOM)
04-11-11 0*- 11-11
I1/C02J9) I1ZC40SI7
•ML KtYSKMf
•ound 2
mn 102-01MIC41
04-11-11
I1ZC02R06
MMl
WI02-02
•ton;0*. 14-11
•I2C40IOI
mvsiONflound 2
•M2S-OI
MICH
04-11-11
I12C02S44
UUl
lit I •- •• 94 4 I -- -- -• -- 10) | •- -- -- 1010
AUflMC III 2lj -- -- I II -- I til 10 I | 21 2 -- I -- -- • 191
Mill* 271 274 II 10 ) | 91 | 17 7 I ]lt 297 2010 1*00 -- 17 2 ) 192
lunumCUMIIBI - - • - - - - - 92 - - - - - - 92 - - • - 99
CUCtUt >UM J4100 )»9 | 910 I 42900 MIOO MIOO 179OO TI30O tlbOO 101 I 711 > 4b)00
CMOaiUI -- -- -- -- -- -- •- •- -- -- -- -- 24 I
COMlf -• • - - - - - -• - - - - - - - - -• - - - - I I I
ccrrci . - - - - - - - 94 i - - - - - - • - - - 9 . 2 1 -- i ) iHIM 14100 Ik 100 72 1 I 49 I I It) tt 2 I 4460 9260 71100 7)600 -- 49 I | 99100
LtAD - - - • - - - - - - - - - • - - I I ) - - 211 - • 7b
CVANIM
UCMSIUI 1970 6110 69 9 I 44 9 I 1)700 1)700 1)10 I 1030 | 11900 16200 47.6 I -- 20600
MNCANtSI 62M 7070 I 4 I -• 426 14 4 114 142 204 1610 -- 61) 1)40
•(•a*rMOIIl *4| 791 -- -- •• -- -- -- -- •- -- -- 27 I |
fOTAUIUI 1760 I 2040 I 144 I -- 2120 I 2610 I 1160 I 1210 I 1)10 791O -- -- 44600
SILINIIM -- I -- • -- t -- • -- I -- I -- -- I -- -- I .- .-( -- I
HlVft
MBit* 4120 | 1140 I -- 1140 I 41)0 I 4210 I 1010 I 1230 | IOWO 1910 -- 1260 I 41900
IHUUUi
MMkOlta ) I I -- -- -- •• -- -- -- 19 | -- -- -- III
ZINC 14 | -- 14 7 I 111 21 9 •- 76 -- 7 4 I -- 6 9 I 161 41 I
NOUS:I • Hank conUBlMtlon.J > fiimiM value• • inuieaaie oata-- • < conuacl rtqulred
•election Hall.
fi le: »-**INOBKI

INORGANICS - CJUMJMMAltl
staple LocationIII SMple MHOer :
Cote saw ledOil MMfcer :Laboratory
INOIGANIC CHfalCALS (U«/l)
ALUUNLH
ANIIIWNV
AISINIC
IAIIUI
IttVUIUI
CAD*IU»
CALCIUI
O*O*I LM
cauircavilIION
HAD
CVANIOf
MOtfSluk•ANGANtSE
•iicutvNICKILPOIASSlUt
SELINIUK
SILV[I
SOOIUI
muiimVAWDILM
ZINC
4M2S-02
•IIC11
Ok- 12- 14
I12C01S7 1
KtrsiONiCouiW J
51 1- -
1 1 117k
12 k
11200--
11 k 1
4 1 191 MO
1 1-•
MIOO
1500
-- 1
II 7 >k0400
- -
40100
kl k
ruwus-o,•IBCI4
04-11-44
I4ZC02O44
UAL
4*0
4 1 I
141
• -
k
41300
11 3
7 1
k 7 |
34 IOO
I 4
•-
10400
1100
31.1 141100
-- I
41400
- -
4 4 |
140
4VM24I-OI
•IBC24
04-11-14
I1ZC02S45
••A I
44 1 |
•-
11 4
1140
--
19100
--
- -
14700
• 1
--
23100
972
- -
7 4 )
1410 |
-- 1
•-
31kO
- -54 4
4WO2M-02 4W02U-OI MM2U-02 WiBOl-OI 4WU01-O2 MVIB03-OI
WBC94 MBC22 (IBC95 «fBC]9 M(C»lb UBC55
04-12-19 04-11-19 Ob- 12-19 04-19-14 04-14-14 04-20-14
I42C02SII !4ZC02S4k I92C02S72 I9/C02S52 HIC40S10 I92C02«OI
KtVSIONt ««AI KLVSIONt >«AL KlYSIQNt MIAI
•ouiid 2 «ound 2 «ourid 2
25 2 1 -- 29 4 1
I I 1 1 2 4 1 1 1 1 k l l 4 I J
919 132 J 147 1 979 Ib9
- -
- -
441.00 11200 10100 51900 49100
..
7 2 1
III
14700 471 179 4010 50kO
1 | -- II (
- -
19100 12700 12000 224OO 22500
klO 1140 1120 IklO 1110
.. ( .. .. «
5 4 J
1270 | 411 | 144 | Ik 100 16000
-. I -- .. -- K
1410 | 3710 J 1130 1 7550 1100
..
12 4 B 441 21 B 441 - - 14
MH01S-OI
•I IK. 17
04- 17-14
•9ZC02S1I
• •AL
47 1 |
14 4
541
- -
31200
Ib k |
4 MOO
•-
ukoa1730
- -14 1 |
I70OO
-- •
14200
1 4 |
10 4 |
•M1S-02
•ICM4
Ok- 11-14
•92C40S40
KlrslONt
215
24 1 |
4)9
- -
49100
- -
13 1
3 2 |
149OO
2 1 1
11700
1170
-- I
13 1 |
13500
12900
13 1 1
IMHWJS-02
•LCMI5
Ob 13-19
I9K 401*0
KIV^IUNt
1
)42
22 1 1
410
32300
- -
12 4 |
42900
1 9 ]
14700
4210
-- •
10 1 J
14500
11300
- -
- -
10 2 B
4WOJM 01
•I ODU
04- 17-19
• 9K02b39
••At
43 5
41 4
2740
50*00
5 I
27100
- -
19500
1240
b 3
19/00
5910
14 4
1
1
1
I
1
NDtlS
I • Hani contamination) • iillBted valueI • uwiejble data-- • < contract required
detection Unit
f i l e W-M»IM> M I

IP4»e 3 ul 6)
SMPI* location:
in sa^lc Nurtur :
OIL NUttttt:
llkoitiory:
4M>1«-02
•too*
MZC40S* 1
KfVSTOMi
Round a
•n 10-01•UC2I
t*ZC*2J42
R4MI
•HO ID- 02
•iOM7
*«ZC40SI2
KfVSIONE
Round 2
4M045-OI
MRC24
MZC02S47
I«AL
••045-02
mtic*4
»*ZC02S77
KIVS1ONI
Round 2
MK04S-OI
«»C20
**ZC02S40
l««l
•M04S-02
«fCM>(
«9ZC40S*1
KfVSlONf
Round 2
•M04D-OI
MBC21
I»C02S4I
RtUL
•M04D-02
•ton*
•9ZC40S7*
KIVSIONf
Round 2
4*055-01
•tRC2*
•«ZC02S41
RML
•K55-02
•tons
MZC40S**
KtVSTOMf
Round 2
•Mb*- 01
•mcn
(9ZC02S4I
IIIUL
MM>4a-02
omit
*«ZC40S«1
KlVSIOHf
Round 2
INORGANIC OMICALS lug/11
AllBINLB
ANIIMNV
AlltNIC
•AtllM
•tlVHIlH
oumiuiCAICIUI
» » J1140
» I 10 2
401
CO411
comiIRON
HAD
CVANIM
•AMCANtlf
MICKY
NICXIl
POUUIIH
(ilUUU*
SIIVH
MBIUI
IMlllUt
VAHtOltB
1INC
20 MO
IIM
M40
» § I20*0 |
-- R
1*000 141000
2«70
I )
1**OO J1400
2* 10 1120
-- R
i(40 | moo
45*0 I 1750 |
» 2 t IS
29*00
II I
15100
2470
* * I11*00
12 *9(2
14 1
» 925IOO
17400
1090
17
10100
41 t
II I
414
17*00
I I J
2k tOO
11*0
1140 I
14 1 I
9(4
1*200
921
U200
2
2fckOO
471
t
147
II4OO
I* <
97(00
40100
4(*0
( * I1*10 |
-- R
2000 I
4 I I 111
12* I 1170
12100
• II
Ml I
-- R
19*00
4900
t I I
10*0 I
-- R
14000
4290
10 9 J
1110 I
-- R
NOUS:
•IR
• lUnk cofltMlntilon
• [UIMltd value
• uwtttbtc *»U
> < contract icqulrcd
4tci«ctlon Hull

INQtCANICS - CROLMMAUt
Sawlc location
IT! Sa^lc Nwri)er .
Oil NMfeCf : 1
l*kor*loiy.
W07M-OI MM7H-02 H«»7»-OI IIW07H-02 1HOIS-OI «K>«S-02 *M1*-OI MNMI-02 «W>O 0 1 HMtD-02
UIC24 «f!C*7 «t»CJ5 «tlC4l «t*C14 *tO>l4 UIC1J «IC1«I5 HtBCll HiC*2l
42C02S44 IUCO2S7* I92C02U44 *42C0207( I42C02S» 142040^91 t*ZC02S54 •42C40SI4 142C02S34 I4ZC40S44
UMl KIVSTONI IML KCVSIONC «Utl KtVSIUNf MMl KfVSIUNt IMt KEVSIONE
•aunt I lound 2 lound 2 lound 2 lound 2
"II l ~; «~«»
•92C02Sfc9 *9/C40S9t •9/C4OO9I
KIUL KlISlQNf KtlSTONf
Round 2 touiMj 2
IMHGANIC CnfUIULS (U«/l)
ALUklNUK
ANTIiUNV
AISINIC
tAIlUt
•iinnutCAOBIUI
CALCIUI
1.)
21J
4 I
Ilk
2 2 )
140 I
kiiao tiooo
12 1 I
4i4
2 I
2 |
1 4
• 7 I
5 1 I122 I
4 « J
107 I
121
115
41200 42700 91400 41400
avruIRONtuoCVAMIOf
MOKlll*
HHCkNtSI
UICUIV
NICXUPOIASSIUl
SiLIHILM
SllVfl
SflOllB
VAMtOIUI
I INC
1010 |
•• I
1140 I
14.4 |
1440
I.)
111009(2
*01 I
IS 2 t
IIM
1 I I
moo»A2
6 I
1010
11)00
J77
1.7 )
* 2 I
2.7 J
»«00
MM
l» t I
2470 I
22kuO
SJ70
17200
M4>0
11000
2110
11700
2»0
moo72»
I * 7 | • 7 | 41 9 I |
1310 | 11/0 I 1220 I 1110 I 1240 I
I2fc00
7>t
2440 |
1 I I
1 J Ik 1 t II • I t I
NOUS:
I
JI
• Hint conUBliullon
• fillmlcd wlue
• uwmbic «iu
• < conlrAcl icqulrcd
detection 11*11
rile •-•UNO «i

(p*ge s ui
SawIc location: amiw-oi •vioa-oiire Saa»l« MM*)*r: MCCSl •to>24
Ml* laa»U«: M-M-I* M-I4-I*OIL —*— : IUCOM4I **ZC4M*7lakOfalary: UUL KinTCM
11
•tiia-oi •> 11»-02 riMiiw-oi WI2S-OI a*i2S-02 nniis-oi NIIIS-OI «ii4S-oi wius-oi Miias-oi wrjau-oi•HC54 «ICW2I UIC57 «IC41 MtOIIO U(C40 «tO»ll MtCil «fO>l7 IUICIO UIC4I
04-20-1* 04-14-1* 04-20-1* 04-l«-l* M-ll-l* 04-l*-l* 04-I1-I* 04-20-11 04-14-1* 04-20-1* 04-20-1*
**ZC01S7* I*ZC4ISOI I1ZC01070 **ZC02S»0 I1ZC40M4 I«ZC02S5I I«ZC40SI9 I1ZC02S74 I«ZC40S*1 I*ZC01S7I MZC01S71
UUL KfVSTONf UUl UUL (iVSIONf UUl KIVSTONC UUL KiYSTOM UUl UUl
Hound 1 lound 2 lound 2 Round 2
INOIGANIC OCJUCALS IUC/1)
HIMIMHINTIMMTAUfMC•MIUI•CIVIL IUI
Ml )
-- I
112 I
1» J
141 |
OtlCIUI
CHKMIUI
urrttI ION
it*oCVAHIDf
MIUI*>i
•ucuvManMIAUlUt
111 UN Ul
IllVH
MM IB
IHM.UUI
WMOIIBZINC
174*0
27IO
« 2 J
1*10
*1 |
11400
11*0
7.5 I
I«M I
1J )
»7
17 I
4 4 I
41*00
-- I
17100
5*40
1000 J 14*0 |
1J I I
4 4 |
145 |-- I
17.2 I
42.2 I
14500 25400
II I I
-- I
151 I
15I1U 14 I |
4 IMO 474OO 1 1 1000 7 15OO
5.1 |
14.1 I
11100
1050
«45 |
15100
7 5 |
111 t *5.0
10100
I* I
1040 | 1570 t 1110 ) 11*0 | 741*
104 t 1470
I.I I
I07OO
*51
4541 0 |
40100
7710
11000
IOO
1*7 | 41* I 150 | 717 | 5710
-. | -- -- |
IIM | 1140 | 12700
1 7 | » I 1 1.2 t 51 I 5.1 1
5 * 1
1040 | 1450 I
12400 1140
12 I I
NOHJ:
•I
I
• •lain. conUBlnallon• flllVBIM VtllM.
• imiicakli «aia.• • conlnci i««julre4
otitcilon llali.

INORGANICS - OtOUCWUI
locltlon: KUI&-OI
III S4H>IC MMMI . «t»0bl
me SMpled 04-io-i»OIL M«Der MZCO2S?)
toiy l<ul
INOICANIC CHKIOtS IUfl/1)
ALUIINUI
AN1IKONV
AISINIC
IAIIUI
CAMIIM
CtUlUB MMO
CMCHIUI
CCCA1I « 1 I
COPf »
I ION 1*0
HAD
CVANHX
•ACNISIIM »400
•ANCANISf 1»0
•tiaavNiatti 13 4 iPOTASSIUM "»0 I
SILVfl
SODICB
IHALLlUt
VAMDIUk
ZINC
NOUS
t • lltnt conu«liullonI • Eillolcd nlue.I • unuiublc Uli-• • • conn 1C I required
detection Halt
f i le »-«riNO.«li

SPICIAL ANALVIICAl S t IVKfS -
o\ k>
SAt»Hf LOCA1ION. ON-4IMI-OI
SAI»ll MJMII. 499*f-10
DAM SAimio. 04/i4/»4Oil MUMil MZC02SI7
LAtOTUTOtV: lAAt
ON- OKI -02 ON-MMIOI-OI
4k4*i-l9 499*1-11
M/ll/M 04/1t/»4
MZC4I1I4 MZCOnOI
Allied IMALlound >
ON.MtOt.02
4kkli-2>
Ok/ 14/14
MZC4 1104
Al l iedlound 2
UN-«>I»-OI ON-anua-02
499*1-24 4kk(f-24
04/14/14 Ok/ 14/1*
MZC02S2 1 i»ZC4 IS11
MAI All ied
lound 2
ON-tWIS-OI ON-MTIS-02
49S*t-2) 4kk(l-2)
04/l«/(4 Ok/l4/(4
»*ZC02S20 t«ZC4 IS22
UAL All iedlound 2
ON-«Wt2-OI
499*1-1*
04/14/14
**ZC02S Ik
I*AL
ON-MM2-02
4kk*E- Ik
Ok/ 11/14
•4ZC4ISI9
Al l ied
lound 2
QN-WII02-OI UH^HOl 01
4»tt-29 4kk*[-27
04/14/14 Ok/ 14/44
(42COHO) 1*ZC4IIIO
I«AL All ied
lound 2
SAX ANALYSIS (•»/!)
TOTAL rtcamausiU.fl Of iniTIATISI
su.nof iniiusiCOD
IOC
TSS
IDS
NO2 • NO)
woam.uniMSUfAll
TOTAL AUULINITV
0 14
..
19 > j
k.7
2 9
1*0 (
--
0 11
9 k
)0 )
0 1)
--
4k |
4 .4
1 0
112 I
0 k« I0 10
5 •
k 0
• 2 1
0 11
--
-•
k |
) 2
k* 0
1*1 1
0 11
0 14
9 4
12 2
140
00) 1
--
29 k j
k 1
149
117 1
111 1
7 1
19 I
--
2*1
0 0*1
1*2
- -
on u» OIASI o > i
NOW:I • lluit conUBliutlaI • lillntM Mlue.
-- • < detection
rile: SASJM.WI

SPtCIAl AKKlVIICAl S1BVICIS
UOLMMIAItl
SAWlt LOCAIION: ON-tWHO-01 ON-KM2O-02 ON-MHI2K-OI CN-MO2M-0]
SAtmt MMCI 45511-10 4*4*1-01 45511-09 4bbli-02
DAIf SAIftfO: 04/17/19 04/12/19 04/11/19 Ob/ 12/19
OU MJMfl. 192C02S09 19ZC4IS44 I9ZC02SOI I9ZC4IS01
LAIUAI01V. IML All ied l*Al A l l i ed
lound 2 lound 2
S4I ANUMtS (•*/»
TOTAL PMISPHOIOt 0 017 0 Oil
SUFIDf (rilTIAllSISUHDf (IIITIISICOD SI 24 1
IOC -- 11
TSS - - 50
IDS 145 141
MH . NO)
WO -- 0 55
otanaf 7 7SU.M1IIOIAI AUKIINITY lit
MOon AW> aiASf < o 4 o » i
ON-KM2S-OI
45511-07
04/17/19
I9ZC02S07
II MAI
a n
- -104
11 1
2b9
441
• 1 1
54 1
521
100 |
ON MM2S-02 ON-FIAM)2S-OI
46kl[-OI 455lf-OI
06/12/19 04/17/19
•9ZC4 IS02 I9ZC02D07
Al l i ed IAULlaund 2
0 II
--
Ilk
10
219
425
--
75 7
55 2
- -
525
11 4 |
1 1
ON-HHtl-ai ON-tMl-02
455K-II 4tt>lf-ll
04/19/11 Ot/14/19
I9ZC02SI5 19ZC4ISI6
IMl Al l ied
lound 2
0 21
•-
- -
II J |
4 1
10 5
J»l 1
•-
14 1
I 1 0
271
-•
0 5 |
ON-AWf 101-01 04-AM11D-OI ON-AM11D-02
4SSIC-29 455K-05 4b*l[ 1 1
04/20/19 04/11/19 0*/ll/««
•9ZC02I04 19ZC02S05 19ZC4ISIO
•Ml »UL Al l ied
•ound 2
0 019 I 0 22
Ib 2
5 1
221 122 I
..
a 1411 5
215
1 1 1 0 7 |
witsI • lui* canl»!fuiion
) • fillMltd viluc• • • • detection 11*11
rile:

24-Ocl-l* IP4«e 1 ol t>
SKOAL ANALYTICAL SllVICfS •
CiOLMUMIIt
SA4»it LOCATION:SA4*>LC MMII:
DAT! lAHPltD:
OIL NLMfl:
LAlOUIOtv:
IAS ANALYIII <«|/ll
ON-HMU-OI
4is4t-oi04/17/4*
MZC02SM
UAL
OH-4BU1B-M
44441- M
M/ll/M
MIC4ISM
All 1*4
•ound 2
ON-IMIS-OI
41111-01
04/17/1*
t*ZC02SOI
UAl
ON-HKI1S-02
4tMI-OI
M/ll/l*
(•ZC4ISO*
Alliedlound 2
ON-flMKIlS-02
4»6II-0*
M/ll/H
•*ZC4 IDOI
All ied
«OWId2
ON-KMS-OI
41MI-II
04/17/1*
**ZC*2SIO
IMl
ON-MNS-01
4UII-O4
M/ll/l*
I*ZC4 IMl
Alliedlouml 2
ON-MC4O-OI
41UI-04
04/11/1*
KZC02S04
UAL
GN-«M4O-02
4M»t-07
M/ll/t*
MZC4ISD7
AlliedIMWd 2
ON-AM45-OI
4114C-01
04/K/M
KZC02M1
UAL
ON-M>4S-02
4k4lt-l2
M/ll/M
*<2C4ISII
Alliedlaund 2
ON-«a»-oi41M1-M
«4/l*/A*
I*ZC«2M4
UAL
IOJAL
OH 21.7 » 1 M I) 7 17 104
IOC 4.4 12 4 21 t 1.1 It 4 21 t
TSS 41.1 42 271 2( 1 M 2t*
Tl» 24} 112 1)1 2*1 »27 441
HOI • NU
M O I * 1 2 * « 2 2 1 2 1 I I
O4.O1IM II 4 l i t 4 44 14
MA f ATI -- -- -- -- 4*4
TOTAl ALIUIINITV 244 244 JOO «l 4O4 171
MO -- 21 J 44 | -• 41 J (4 1 J
Ml AM> CXtASt 0 41 j 17 J l| 17 | 104 I) J
MDtll:
• • tin* cI • (tll>il««) wlue.
•• • « delKilo* 11*11
file:
(

SPICIAL ANAIV1ICAI SIIVICIS -
SAWLf 1 OCA I ION ON-HM55-02 ON- MM**- 01 ON-IBOM-02 ON-MJ7H-OI ON-M7O-02 ON-HMK7H-OI
SAHPlf NUMfl. 444*f-M 49MC-I2 4»6«< 21 455«t-l4 4*4*1-0} 4»Af- |>
OAlf SA«f>l(0: 04/U/t« 04/I7/** 0*/l4/*« 04/ll/tt 04/ll/M 04/l*/««
CtL HLIMfl: MJC4IS2* *t£C*2XII »»/C4 IS20 (9K02SI2 «9ZC4IS04
LAtOtAIOKV: All ltd IAML Al l ied (MAI Al l ied KMl
found 2 lound 1 laund 2
SAS ANtlVSfS Of/I I
IOIAI fMOSPHOttA -- 0 Oil 1
SUflOf (UlTIAIfSI
SULflOf iriLIIlS)
COD « » 42
IOC 24mTM 244 111 ItiNO2 . NO)NH1 0 17 -- 01
CMLOilOf
SU.IATITOTAL AIKAIINITY 1M 170 147
|O> 2 J
on AND cause 12 i o 7 i < o 4
ON-IUHfTtl-Ol ON-MOID-OI ON-|M>U>-02 ON-Mnt«-OI ONMMM-02
44411-04 45MI-24 444*[-22 4»tf-22 444it-l*
04/ll/A* 04/l«/t« B4/I4/M 04/I«/M 04/ll/t«
I«ZC41004 I9ZC02S2] I9/C4 1S2 1 t9ZC02Slt •9ZC4ISI*
All ied iDAi Al l ied IMAI tilledlound 2 found 2 Hound 2
0 O4 I
..
..
..
2 4J» J20* 1 270 I
2*7 I
0.11
..
4 0
lit 222.-
< 0 4 -- < 0 4 -- < 0 4
QN-ants-oi415*1-21
*4/l*/*«
HIC02SI*
>MI
0 05» t
14 t J
i 1
51 J
14* •
247 1
1 1
19 1
- -
142
- -
NOUS:t • »l»nd canl»liuilanI • tillMled niue
-• • < detecilon Hall
rile $Aj_«f«i

IPfCIAL ANALV1ICAL SUVICU •
OOLMlMIfl
I Page 5 ol 41
SAM>if LOCATION: ON-**ois-«2 avA»D*ji-4iVU*l( NLBBfl: 44441-17 4>MI-2*
04TI SAJPLtO 04/O/M M/MJ/t*
Ol NUMII: MZC4ISI7 IMCMM4
LAiolATOtV: Al l ied I4UI
lound 1
44411-24
04/14/1*
4«ZC4IS21
A l l i e dlound 2
> ON-oirioii-oi ON-nnotv-02 ON-eBiim-ot OH-*an«-0244441-2* 4JJ41-27 44441-]4 4H4f-M 44441-11
04/14/4* 04/20/4* 04/14/4* 04/20/M 04/14/1*
I«ZC4IO29 41ZC02S2) I*ZC4IS24 (1ZC02S21 I«ZC4IS27
Allied iiui Allied UML Alliedlound 2 lound 2 lound 2
ON-HMin-OI CN-4HI2S-02
4»4C-)I 49941-14 44411-1)
44/20/4* 04/14/4* O4/11/4*
4*2C02O2> MZC02SI1 4*1 C4II11
tHAL IMl Al l ied
lound 2
ON-MI1S-OI
4»4I- 17
My 14/4*
4«ZCO2SI4
UAL
SAS ANALYSIS IK/I)
TOTAL
IU.HM IfllTlATiilStiriOf IfllHISI
COO
IOC
TU
0 044 t
10 4 J
4 4
0 02 I
211 • 17) I0 2*
4.S i
II* I
0 40
CM.MIOC
SU.MTI
TOTU ALKALINITY
9 0
12 S
OIL 4MB dJAJI
t • II4M canUdiulio
I • KtlMletJ mue
•• • « dtiecilon !!•!!
>llc:

SPtCIAL AWIVIICJU SflVICES
SA4PIE IOCAIION ON-«B1JS-01 OM-IMI4S-OI ON-MM4S-02
SU»Lt MJXtl 44*I[-I4 4>9tf-ll 4U*(-»
Mil SA*»IID M/ll/t* 04/M/M 04/14/19
CtL NUMII: MZC4ISI1 MZCOISI* M2C41SI*
11WM4IOIV All It* MUl Al l ied
lound 2 laund 2
SAS *MtlVS[S <X/I)
IOIAIsufiotsuriof (iitifis)coo i* • iIOC 4 1
is> 2* aIB 224 I
Ma • MU e •> •tO 0 24
CMOIDt
SU'AII II 5IOT.I A1KA1INITV 144
tooO n A H O CIIAlf < 0 4 1 4 1
NOUS
I • 11*1* COnUBllUllOA
I • dilated
-- • < 4ctccilon
flic: SAI_«B Ml

O4-OC1-M
VOLAIIlf (MGANIC COWOLMK
SOUS
Savle location.SiKkle MiM*i .MIc s*«> led:
cat wofeti .lakoralory:
FISBO 1
IIP04
01- IJ-i*
i*ica»e«cumc
CBOI-II1-II7
IWOS
0)-l»-*«
•UtttSM
CfllUC
ON-FIU02
IIP 10
1/20/1*
mcaitoiMl
ON-CBOM- 14
IBP 11
l/20/<«
I42COI&OI
Ml
CH ItUtOl* 14
KPI2
1/20/1*
•*2COIOOI
Ml
(M-caou-tiIIPH
1/20/lt
••tlCOtS02
Ml
ON-d02»-73
UP 14
1/20/1*
4<JC01S01
Ml
ON-OOkn-20
(IP IS
1/20/1*
M1CO ISO*
Ml
ON-UM>t*-ID
IIP Ik
1/20/1*
MictmaiMl
ITO1 01
IIP42
04- 17-t*
4SICO1S11
s-cutto
IPU4-OI
(HH41
04- 17-i*
ISKOJiJk
!.-Cl«tD
IPIBU4-OI
tHP4t
04- l«-(4
»<HU)»0>
s-ctsto
(•CAMIC CQHPOIM15 (ug/t«)
VOtAllli
cnatauHHu*UOMMtlmNI
VIIM. CM.OHIX
•tnmiMf ocoiiM 7i isi -- 11 » •• 10 ii 21 »• » aACfTOMf 14 I 2t • > I »« 19 I III II I 2» I Ml Ml
CA«KN DISUflM -- •- -- -- -- -- •• •- -- • I -- >•
I. 1-DICH.OtOtTMMt
I. 1-OICMOIOfIHItNf
l.2-OICH.CMO(IHfNf (IOUII
CM-OtOfOU
t i-oio*oto<n«Ntl-*UI*NONi •• •- -- -• •• -- -• -- -- Ml 15 I 101
1. 1. i-ni<M.o*att»ttNtCAHKM TiTIAO«.atMVIIWl ACIlATfMtMOOl Ot.OICM TmNfl.2-OIO«0«OMCPAMicis- 1men. DIM MM
i . i . i- n lotcioc IH»«•IMfM -- • - 4|
TMNS- i . 1-DicnaonartNt
4-MnM-l-PIMTAMMI
1-HfUMMI
IiT>ACH.a«0(It<M
1. 1.1.1 - II TIAOftOtOt TmM
TOLUtM -- » I 51 t >| 1| 4 | -• 2*0 20
of.manta.tmtltmtlNZIK -- -• -- -- -- -- -- -- -- -- 7
IIVtiNf
IOIAI XniNtS •• •• •- 51 -- -- II •- -- 1000 | 110 I 560 I
NOUS
I • lUni conuairul Ion
I • (iliMled v«lue
- - . < tfrlctI ion I!•!I

I 24-OtI-14
VOlAIILi OUCANIC COWOLWS
SOUS
staple local Ionstaple Miabei .Cult stapled.
C1L NUffcer
llboinoly
OiCANIC COMPOUMB (ug/l«l..... v ... ....
VOtAlllt
yum. cn_a*iof
•tTimiNf aioiiDtJtCflCMf
CAIBON OIXtAflOf
TP07-OI
tBPll
04- 11-14
I4K02S27
S-CL»10
1 B
54 |
1 B
TPOt-OI IP04-OI IPIO-OI IP11-OI IHIPI I -OI TPI1-UI MV02O-24 MM20- 5t MVOVO-7S MHI20- 101 INMHO2O IUI MNO li- II - 22
tBPU mH4(> IBP47 EBP50 IBPM tBI>32 18COO IBFUI IBP02 tOPOl l«l-04 1BP07
04-ll-K 04-ll-IV 01-11-14 04-14-14 04-14 14 04-14-14 01-15-14 01-IS-I4 01-15-14 01 15-19 01 IV19 01- Id 14
I42CO2S2I t«2C02S24 I42C02S10 I4ZC02S21 I4ZC02O21 I42C02S2I I4ZCO ISO 1 I42CO IS02 I9KOISOJ I42COIS04 19/10 IUO« 49/1.0 Ii06
s-CLXO s-cieio s-a«io s-ciato S-CLVIU S-CLBID ttiaic cti*ic ctmic ctntic ui«ic ctiMic
..
4B 7B 10 B «B 2B •- 47 10 B 27 B tB II 1 t7B
17 | -- 14 | -- 40 1 It 1 IM> 21 B 21 B It B 22 B 45 B
10 B -- tB 14 B it it
i.i-oicwoiotmiu«1.2-DIOtamMNt (TOTAL I
Ofiaiafauil.2-DIO&0*OfllttNI
2-tUT4MM
1. 1 i-matotoeTwKCAIMN 1IT«ACM.QIIDf
VINVt ACCTAlt
WCMODICH.OIOIU TtttM
I 2-DIO»0«OP«OPANt
cis- 1 i-oicnonceicrtNt
01 MOOOOtOJOlU TWM
I. 1.2-IKICH.OKXImNt
tfN2fNI
1IAM- 1 . 1-OIOtWOPIQPENf
4-mt inn. • I-MNIAMM1-XXANONi
I.I.].]- IfllAOtOtOt IWNl
CKOCKfNZINf
STVtttt
TOTAL XnlNfS
4 I
t7
14
»00 B
11 t I] I
urns• • ftUnk conl*«liution
j • tttiBiled value
•- • « tfeiecnon n»ii
otic oi/it/14
11 le b ll'vuc «K I

VOtATIlf OICANIC COHPOlMtt
SOUS
SMPK I (XI11 on •MM-7I-IO MHW-91-J9
StlDle MMOtf: itrot 1WO»
CM 1C SUP 1*4: OJ-ll-M 0)-It-It
cti Nutfxr: xzcaiso* ttzcdiurKboitiorr: Cfiaic cfUMC
<MC»N1C COHPOIMIS (u»/»9)
WUAlllf
CMLOMMFHItNC
HOMBfTmNt
VIIMI aiaiioc
u • 14 ItCITONf » t Ml
CAtKM OlSUUIOt
LI-OIOCOIMmiNi
!.>-DIO«OlO(IHtNI (101 All
010(010>*
i.i-Dio&oioin«Ntl-tUf*MM > I
i i i-nioftO<otnitMfCUIMM TIIIAO«.01IO(VINVl ACfUKMOMOI 0*.OiaM IHMfi.i-MOi.aiar«op*Nfen-1.1-oiototoMiartNtniocaiofmiMOl NflMOfcOIOM IHtNf
IfNMM
IMM- I. )-OICM.OIVt<»(Ni
4-«Cnm-l-P|NTANONf2-M)UMMf
I. I.J.l-IIItAOtOlOf THkNf
fTMVlMNZINi
SIVIINi
101*1 XYliNIS
NOUS
• • llAnfc conUMliutlonI > niiwicd vtluc• • • t aelettlDn lt«u
t I 1C ^ IFWOt

11*4 ye I ul Jj
St*l -VOtAl (US - SOUS
saaple locationSaaplc MMfcerDate saw led
cii Nuatttrlaboratoor:
OIGANIC COHPCU4QS (Ufl/HI
SlAtlVOtAllll
list oi(IPO*
01- u-»»I91COIIOI
clinic
ON-U)0;»- 14Etc II
1/20/19•92COISOI
Ml
ON- IHC4I02*- 14(IPI2
)/20/t9•*2caitx>i
Ml
ON-UlOJa SSCBPI3
••92COIS02Ml
ON- CBO in 75
1/20/19I92COIS01
OKI
OP 15
I92COIS04Ml
ON- CBOta- 10(IPIb
l/20/t«•92COIS05
Ml
(IP 101/20/49
I92COIIOIMl
GBOI- 111- III
OJ 15 19
CtlHIC
IP01 01IBP42
04- 17-49
S-CUB10
M'U4 UtISftl
04 i r -49
lr!DU4-UI
U4 l<4 19ttt\.oiua>
pnfNOiHSIl-O&OIOCIIIVDflHtl
1.1-oictftOiaiCNZiNfi 4-Diata«(»tKiztNfIINZVl ALCOHDtI ]-DICM(«atlKI2INt1-mfnm.rMNOi• ISd-CHlOIOISaPtOPVL II IHtl
H-Ninoso-Di-n-eta>ivA«iMKXAOtOtOftMJNtM1IGMNIINCUOfKMOMI
.ItNZOIC ACID
1.1.4-niCM.OIWIItffNt
4-CM.OiOtNILINI
4-CHiglO-l-MIHn.PMNOt1-MTim.MtmimLfMHOUOtCMCVCiaPiNIAOl (Nfi . 4 . »- n ICH.OIOPHINOI1.4.1-nicn.aiartCMii
4*0 I
1-HinCMNILINC
ACINkMnMINf2 t-DINinOlOLUtf*I-NinOANILIhtACfMHITHIMI.4-OlMITII2PMtNOt4-NimyMMnOltfMZOfUIAM1 . 4-OINI nOTOtUNCDIIIHVl fMIMALATf4-cH.atofHfNvtnuatiM4-NinOANItlN(4 4-OINI TlO-2-mtI>frtpH4NOC
unt«
4-UCMOnCNTt PMNVl [IHflWMCHLOIOilNttNi
PHfMtNTHIfNIANlHUCfNfDI-N-IUTVt HflHAlATIFtuaiANmfNtPYtlNlM/m UNZn PHTHtlAIf1. i-OIOftOmiNtlDINfIINIO4A>AMn«ACINI
10 I 22 I
IISd-ITMVVHf XVI IPHImiAllDI-M-OC1YI PHTmUIlICN70(I HLUOttHIHf NfSIf K1O<« )HUBAN»«Nf SIINZO(A>PVtlNfIMDfNW 1 . 2 . l-CO)PV«INtDIIINZIA HIANTMUCINfIfNZOICHI )PCIniNI
NOUSI • llank conuaiiuilonI • fulMted value• • uwscable data•- • * detect ion 1 1 all
20 I
70 I
170 I
S IPBKU UK I

lt>*gc l ol II
S4«plc lecjilon: |p07-oi IFOI-OI IPO«-OI IPIO-OI IPII-OI (IIPM-OI ipu-oi 11*020-24staple Mirtwr : lw>44 fu>4i ftP4t iteti ttpso tsm fipj2 ftpoo
OUMMMr: MZC02S27 HZC02SM **ZC01S1* ItZCOlSlO I4ZC02S21 *«ZC02D21 KZCO2S24 MZCOISOIL*Mf*leiy: S-CIBIO S-CttfO S-CUtlD S-CU»IO S-CLSID S-CLBfO S-Cl«fD CimlC
MOID-SI MO2D-7S O020- 10* HUHO1D- 101 (MIS- 11-42tlPOl IU>0] flPO) f(P04 IIP07
0) !}••• 0)-IS-t« 01-19-14 01-IS-I« 0)l!i-I9• tZCOISOl MZCOIM1 MZCOI!>O4 >«Z(OIO04 I4ZCOISO*
cfiaie CIIMIC cn«ic cemic CIIMIC
CICANIC OMMLMH (Uf/k9)
lOIVUATIlf
• ISU-OtOMfltWl KTHila-CMioiomiNail.)-DKMOtOilN»N(1.4-OKH.OHOliNZiNfUNZY1 M.OOMH.1.2-OIOt.CMi(NtlNII-MIMMMMH•is(i-at,€MNsaMarvi iiiHfi4-Mmn.ptCNDtN-MIMW-M-H-ffOPlYAAINI
NilIt1-N1.4-MM1HAMINDIMNMIC *CIO
1.1.4-niOt.OtOllNZiM
4-CM.CBbtNH.IMMMCM.OMM/UOI f M4 - atoio- i-MnmmtNOi1-MTtMMkftflmLtNiMXMN.eMKVO.Vf NI»OI IHf
J40 I
.* . 4 . »- II lOtOMMCNM.
I-NIIMMNIIMMMIMH. PMIMATI
l.t-MNHMMlWNI1-M1MMN1IM
»> I
70 J
IM I 440 I»» I
170 I110 I
IM i
IMXMM l.l.l-CDIFYICMoin»e(A niumctciNi•ctaoxan if (iniM
Wills:• • tUnt canlMlfUtlonI • ttllmt«4 v«lucI • uiusukle *•!••• • < Mlccllon II»H
S - IPtKH <K I

ll'AUe J ol 31
St«l-VOlAUllS - SOUS
location. KWla-71-to »nwi» SJ 55SMpIC NU*>CI . IWOi IBP01me uvied. <»-it-it o>- i t - t«
CtL M*>er KZCAISOt »i;tOlS07Liboiiloiy Cll»K cfi«ic
s(*ivoi«riit
PHfMH
l-OtOtOPHtNOl!.)-»! Oft OtOifNZtNi1.4-OIOftaOlfNZINfKNIVl «ICOHDtl.2-OICtftO«ai(N2tNf1-HtTHVlPHiNOI.tlSU-OftOtOISOPIOPVl (flHJI
M-HIItOSO-Ol-n-P«»L¥A«IKMjuatanocimi*HITIMINZINfISOTMMONt
.IfNZOIC AC ID1 1 S 1 1 - CM.WM IHOXV l«f TmNf1.4-Dicn.atarHfMii.
4-CHOCatNILINfHi)uo«aia*uiAOi f M4-OftOK- 1-Hf IHVlPtliNDL
1 . 4 . »• 11
omimnACfMPHTMUlM
1.4-01 Ml TIOTUUfMoiinm nnwiAif4-oftcicpt«mi
4-NMIIWNIllNf4 . 4-OINIT»O- l-«t IHVlPHf MX.
41 I
4-HMOmiNVt PHfWL ITHttHIIUOlMWfNIfNf
PMIMINTMfNfANTHIACIMoi-M-mmriUOiANTMINIrvtENfimn tiMtn). ]-OlOI.O«OtfNtlOIN(
CMVSfMiil(j-(iDI-H-OCIVV PHTmiATI• IMZIMOrLUDiANTHfNISIIMtMK iriUVANIHENIS
IMKNOI ii i-a»pyitNfOIIENZIA . HIANlKIACf M
NOTfS• • tunt c<MlUaln4l<onI • Kilwted vtlue
-- • < detect ion Halt

24-Oct-B9 (Page 1 of 3)
PESTIC1DE/PCBS - SOILS
SMple Location:SMple Nuaber:Data Saaplad:CRL Nuaber:Laboratory:
FBSB01EBP06
03-15-8989ZC01B01
CEINIC
G801-113-117EBP05
03-15-8989ZC01S05
CEIMIC
ON-GB02H-KEBP11
3/20/89892C01S01
Ml
ON-FRGB02H-UEBP12
3/20/89892C01D01
URI
ON-GB02N-55EBP13
3/20/898892C01S02
URI
ON-GB02M-75EBP14
3/20/89892C01S03
URI
ON-GB06H-20EBP1S
3/20/89B92C01S04
URI
ON-GB06H-80EBP16
3/20/89892C01S05
URI
ON-FBGB02EBP10
3/20/89892C01R01
URI
ORGANIC COMPOUNDS (ug/kg)
PESTICIDES and PCBs
ALPNA-INCKTA-MCDELTA-INC6ANNA-MC (LINDANE)NEPTACNLORALDRINHEPTACNLOR EPOX1DEENDOSULFAN IDIELDRIN4.4-DOEENDRINENDOSULFAN II4.4-ODDENDRIN ALDEHYDEENDOSULFAN SULFATE4,4-DDTMfTNOKTCNLORENDRIN KETONECNLORDANETOXAPNENEAROCLOR-1016AROCLOI-1221AROaOR-1232AROOOR-1242AROaOR-1248AROCUM-12S4AtOO.OR-1260
NOTES:• • Blank contamination.J • Estiaaud vali*.-- • < detection tiait.
Fila: S-PCPCB.UK1
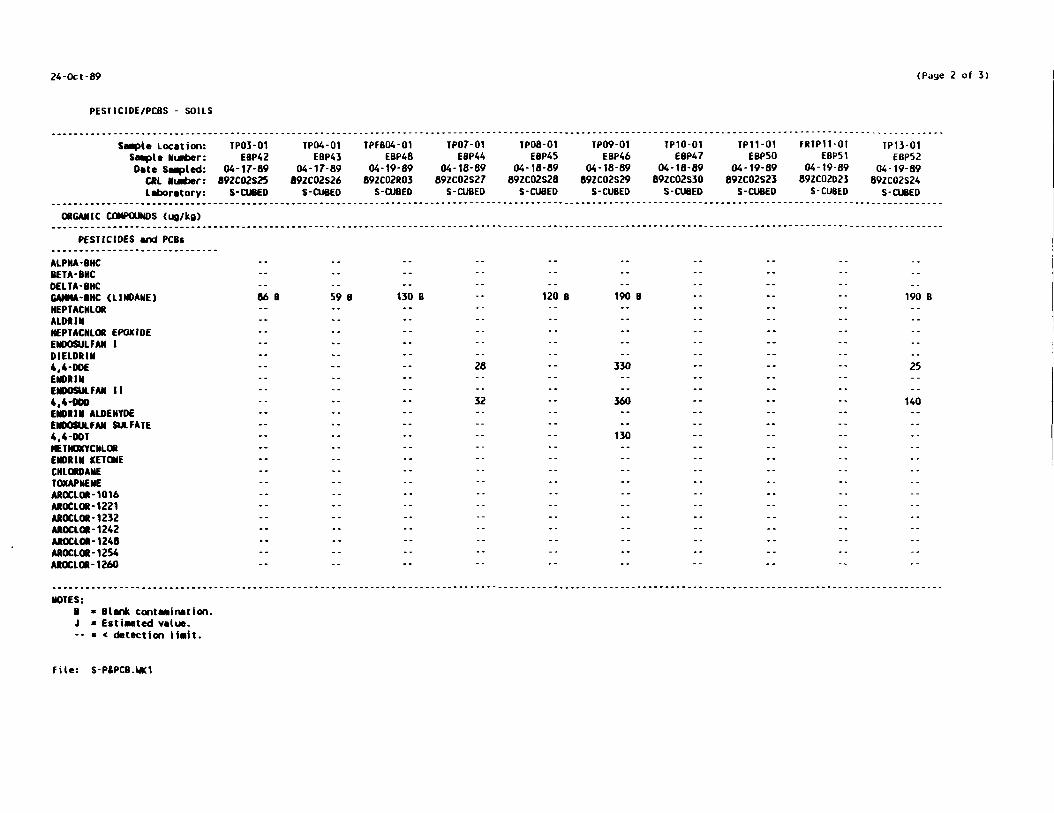
24-Oct-89 (Page 2 of J)
PESTIC10E/PCBS - SOILS
Saapte Location:Sample Number:Date Saapled:CRL Nuaber:Laboratory:
TP03-01EBP42
04-17-8989ZC02S25
S- CUBED
TP04-01EBP43
04-17-89892C02S26S-CUBED
TPFB04-01EBP48
04-19-89892C02ROJS-CUBED
TP07-01EBP44
04-18-8989ZC02S27S-CUBED
TP08-01EBP45
04-18-8989ZC02S28S-CUBED
TP09-01EBP46
04-16-8989ZC02S29S-CUBED
TP10-01EBP47
04-18-0989ZC02S30
S- CUBED
TP11-01EBP50
04-19-8989ZC02S23S-CUBED
fRTP11-01EBP51
04-19-8989ZC02D23
S-CUBED
TP13-01EBP52
04-19-8989ZC02S24S-CUBED
ORGANIC COMPOUNDS (ug/kg)
PESTICIDES and PCBs
ALPHA-BHCBETA-BHCDELIA-BHCGAMMA-BHC (LIMDANE)HEPTACHLORALDRINHEPTACNLOR EPOXIOEENOOSULFAN IDIELDRIH4.4-DOEENDRIHEMOOSULFAN II4 4-000EHORIH ALDEHYDEENOOSULFAN SULFATE4,4-DOIHETNOKTCULCRENOR1H KETONECHLOROANETOXAPHENEAROCLOR-1016AROCLOR-1221AROCLOR-1232AROCLOR-1242AROCLOR-1248AROCLOR-1254AROCLOR-1260
86 B 59 B 130 B -- 120 B 190
28 -- 330
32 -- 360
130
190 B
25
140
NOTES:Blank contamination.Estimated value.< detection U«it.
File: S-PIPCB.UK1

24-Oct-89 (Page 3 of 3)
PESTICIOE/PCBS - SOILS
Saapla Location:Saapla *M*r:Data Saoplad:CIL Nuabar:Laboratory:
NU02D-24EBPOOftE03-15-8989ZC01S01
CEINIC
HU020-58EBP01
03-15-8989ZC01S02
CEINIC
HU020-75EBP02
03-15-8989ZC01S03
CEINIC
NU02D-108EBP03
03-15-89892C01S04
CEINIC
FRNU02D-106EBP04
03-15-8989ZC01D04
CEINIC
MU01S-18-22EBP07
03-16-8989ZC01S06
CEINIC
MW01M- 78-80EBP08
03-16-8989ZC01SOB
CEINIC
NU01N-53-55EBP09
03-16-8989ZC01S07
CEINIC
ORGANIC COMPOUNDS (UB/kg)
PESTICIDES and PCBa
ALPHA-BNC•ETA-MCDELTA-UKfiANNA-MC (LINDAME)HEPTACHLOtALDtlHHEPTACHLC* EPOXIOEENDOSULFAN IDIELDRIN4.4-DOEENMINENDOCULFAN II4,4-000ENMIM ALDEHYDEENDOtUlFAN SULFATE4,4-DOTNETMKTCHLOtENMIN KETONECNLOHMNETOKAPHENEAMO.OJM016AUaOt-1221AROaOi-1232AtoaOK-1242AKKLOl-1248AMXL01-1254AM>aOI-1260
NOTES:8 • Blank contanination.J • OtiMtad value.-- • < dataction limit.
Fila: S-PtPCB.UKI

tl 'aye t ul Jl
INOftCANICS - SOILS
5aaple location
1 II MMfcef
Date supled
oil Moriier :
laboratory
INOICANIC CHfAICAlS (•0/111
AlUUMM
ANIIatfMV
AISfNIC
1AIIUK
IIIVLIIUI
ctoiut
CALCIU1
CHKMIUi
COull
com*
IION
I CAD
CVANIOf
•UCMSim
auMUMit
•tlCLIV
NICKIl
FOUSSIUI
tfllNIUI
SILVII
sooiui
Tmuiia
vAmoiui
ZINC
NOTtI:
I • liana contamination
1 • fiflHted value
-- • * contract required
•election Halt
IPOl-OI
•I1C42
04-17-14
(4ZC01SM
laul
14M
0.4* 1
17.1 |
--
--
IkkO
7 1
5 I
10 4
MM
1 4 J
- -
22kO
Ml 1
10 *
Ikl J
- -
11 4
111
1P04-OI
MIX41
04-17-19
I9ZCO2S* 1
I4MI
4550
- -
0 .71 |
14.5 |
--
1110
4 4
5 k |
14 45
*|M
1 1
--
KM
404 |
-•
12
117 1
• -14 7
21
1PtB04-OI IP07-OI
•1BC4I «UC44
04-11-19 04-11-19
I9ZC01I07 >4ZC02Sk2
IMAL IMl
57 5110
0 45 J
0 41 | 47
0 15 J
41 4 | 1IOO
4.4
5 4 |
14 7
kl I (240
17.4 1
..
41 4 | 1400
117 |
•-
14.4
11 | Ikl |
--
..
14 t
lit k5 4
IPOl-OI 1P09-OI
•tBC45 a\t(C4k
04-11-19 04-11-14
•4ZC02Skl !4ZC02Sk4
8«Al HJUL
14«0 1220
Ik/ 0 7 J
Ik | 14 7 |
--
IlkO 1)90
7 I 7k
4 1 41)
10 1 117
k450 kMO
41 ) k 7 J
..
1540 1150
141 | 155 1
..
41 10 1
Ikl 1 144
..
..
11 1 11
11 4 112
TP IO-O I IPII-OI
•IIC47 IUOC50
04-11-14 04-14-14
•4ZC02Sk5 !4ZC02Skk
IMl «4Ml
1410 2k 10
l it 0 74 J
k2 ) 50 I
0 11 1
7400 455 |
I 51
44| 4 1 |
10 4 4 J
k4IO 4(M
170 1 41 4 J
..
4740 4)1 |
142 1 IJ1 J
10 1 7 5 |
MO 1 1)4 |
1 4 |
..
12 7 4 4 |
14 5 5)
IIIPII-OI
•t!C5l
04-14-14
•4ZC020bk
laui
1120
07) |
45 k
- -
1 5 1
*lk J
7 i
4 2 1
7 4
4110
14 1 |
•-
*0) |
IM J
--
7.7 |
20k J
- -
14 k
4 7 J
54 1
IPII-OI
MtkC52
04-14-14
•4ZC02^k7
•Ml
10*00
- -
17 k J
114
0 14 1
15
14100
17 k
k 1 1
117
IkSOO
174 1
--
5«M
Ml J• -
M k
5*1 1
1 4 1- -
17 7
411
«W)21> -14 MHHU 51
MtBCOO otBlOl
01 15-19 01-15-19
•9/COIS09 I4ZCOISIO
•I lion *| lion
C7JO 1190
..20 1
..1210 k9IO
4 1 7 4
2 1 1 4k
1 7 7 1
1140 704.0
1 4 1 I I
..
14 10 M 10
5) 7 17k
7 9
..
.-
..
9 5 | 12 k
4 k 1 1 4
1
1
1
1
Hie: S-INOWI

INQBUNIC& • SOUS
sacple location mnio-ii111 MieOer : «<IC02
Date sae»led. 01-19-1*OH. Nueftcr : MZCfl is 1 1laboratory: •MM*
•M2D- 101
•ttcoi01-19-1*
OMOISI2
•II ton
ftmnjo 101•10C04
01-19-1*
I«ZCOIDI2
•Hum
C*OI- 111-117
•tocos01- is-i*
I*2COISI1
•II ion
IBSBOI•tocot
01- IS-I*
I«ZCOIR02
• II ton
lew is- 11-22UIC07
01-lt-l*
ItZCOISU
•M un
-0,.7,-M
•IBCOI
01-lt-l«
I1ZCO IS It
•llwn
MOI.-il.55
•uco*01- It-It
ItZCOISIl
•II ion
fica-02•tic 10
01-20-11*
I*ZCOI«02
NANCO
c*02«- 14MOC 1 1
01-20-1*
KZCOISOt
MUCH
(•(JI02.- 14
WICI2
01 -20- It
atlCO lOOt
MNCO
C«U2» 55
MIC 11
01-20-1*
MZCOIS07
MNCO
IMBGtMC OtUtlULS (Bf/lf)
1)10 1470 1470 It 10 -- 22tO 1170 1710 M 7 | 2400 I 24*0 I 2*Sfl I
AMTlaGNV
AISfNIC -- -- -• -- -- -- •• -• 0 It | I4| I ) I J
Ulll* I t .2 I -- 14.1 | IS.7 -- 11.2 I •- 20.1 I -- 19 4 I 20 I I* t I
• UnilUi •• -- -- -- -- •• •- -- -- 0 41 | 0 47 | 0 41 |
CADBIIB -- -- II | -- -- II
CAICIUI 1110 40*0 1410 1070 •- 1150 4700 1140 -- 1140 11*0 4120
CHJOKILM -- 4.9 4 47 -- 7.4 1 1 12 -- *.* It * I
COAIT - - • - - • - - - - 2.1 j 22 3t) - - I t I 421 1*1
terra sti t . t s* -- -- 74 1*1 -- 42 s i 45 * iIION 17tO 4tlO 4510 5StO 45 tOOO 1700 5170 19 1 I 5170 I 7210 J tltO I
IfAO I I 1 5 1 2 . 5 | 2 5 1 - - 4 7 ) 1 1 1 1 0 I I * 1 2 I 2 4 I t 1 4
CVAMDf
•tCMSIlm 1970 2120 1*20 2100 -- 2240 2 ItO I4M t l . l I 2210 I 2010 I 2150 I
III 7* I 107 111 17} -- 221 140 104 -- 115 215 III
• OSS | 0 072 I 0 051 | 0 Otl |
MOIL 47 | t I 4 .7 | - - - - * . l | 411 I I . t - - - - 44 | 14 )
MTAUIUI •• -- -- -- -- -- -- -- -- 117 |
ffLUHUI -- 12 1
SHVU
SOOIUI -- -- -- •- -- -- -- •• -- 221 I 22* | 200 I
TmltlLB
MMUMUI 5 t II I I III 111 -- * 2 II 12.4 -- II 9 I II t * t I
ZINC 9 * 1.9 * 7 10 4 •- IS I 79 II 2* * I SI t | It. I I It * I
NOUS:
I • (lank contaalnatlon.I • fitlaaltd value-- • < contract reejulred
•election Halt.
File: S-INOUKI

IMBGANICS - SOUS
SABile i OCA II onHI MMtoei
MIC s*n>lcdCli Muafeer :L Abort loi y
IMKCANIC oit«iCAis lag/kg)
ALUUMW
ANIIMNT
AISINIC
lAIIUI
•timiiMCAOHIu*
CALCIUB
cmam UKCOAL I
ttrritIION
HAD
CVANIDf
•A CM SI UK
MNCAMISI
AdicuivNlCXfl
POIASSimS1UMUI
SIlVll
IODIUA
THkt I ILM
VANADIUM
ZINC
NOTIS:1 > tltnk cool AB! rail on1 • EillMled value-- • < conlrAcl required
dclecllon 11*11
uio2tt-7>MIC 14
01-}0-»
•»zcoisoiNANCO
MIO |
..
2 1
17. « 1
0 41 1
a.t i11100
10 1
4 7 J
II 1
«MO 1
1.7
--
12000 |
411
0 19 1
S A 1
.-
• -
19 1
10 I 1
CBOtAI- 20
•IIC 19
01-20-lt
I1ZCOIS04
NtNCO
43AO |
0 71 |
11 1 |
0 71 |
--
1140
11 2
A • 1
- -
1900 1
It
--
JAM) J
l»l
• 4 |
10 9 |
21 9 )
C<W>k*-IO
•tic it01 -20- It
•42COISIO
NANCO
2200
1
21 1
0 41
--
1210
* 14 1
»<70
1 4
2410
It!
> 1
11 »
9t 1
t
1
1
1
)
/
1
J
1
f i le S-INOIKI

24-Oct-89 Page 1 of 4
SPECIAL ANALYTICAL SERVICES
SOILS
SAMPLE LOCATION:
SAMPLE NUMBER:
DATE SAMPLED:
CRL NUMBER:
LABORATORY:
ON-TP03-01
4501E-51
04/17/89
89ZC02S14
KEYSTONE
ON-TP04-01
4501 E- 5204/17/89
89ZC02S15
KEYSTONE
ON-TPFB04-01
4501E-60
04/19/89B9ZC02R03
KEYSTONE
ON-TP07-01
4S01E-53
04/18/89
89ZC02S16
KEYSTONE
ON-TP08-01
4501E-54
04/18/89
89ZC02S17
KEYSTONE
ON-TP09-01
4501E-55
04/18/8989ZC02S18
KEYSTONE
ON-TP10-01
4501E-56
04/18/89
89ZC02S19
KEYSTONE
ON-TP11-01
4501E-57
04/19/89
89ZC02S20
KEYSTONE
SAS ANALYSES («g/kg)
TOC 3000 J 300 J 11 J 3200 J 746 J 1400 J 8600 J 447 J
NOTES:
B « Blank contamination.J • Estimated value.
File: SAS TOC.UK1

24-Oct-89 Page 2 of 4
SPECIAL ANALYTICAL SERVICES -
SOILS
SAMPLE LOCATION:SAMPLE NUMBER:
DATE SAMPLED:CRL NUMBER:
LABORATORY:
ON-FRTP11-014501E-5804/19/8989ZC02020KEYSTONE
ON-TP13-014S01E-5904/19/89S9ZC02S21KEYSTONE
ON-NU02D-244501E-0103/15/8989ZC01S01
KEYSTONE
ON-MU020-5845016-02
03/1S/8989ZC01S02KEYSTONE
ON-HU020-75
4501E-0303/15/89
89ZC01S03KEYSTONE
ON-MU02D-1084501E-04
03/15/8989ZC01S04
KEYSTONE
ON-FRMU020-10B4501E-0503/15/89
89ZC01004KEYSTONE
ON-G801-113-4501E-0603/15/8989ZC01S05KEYSTONE
SAS ANALYSES (Mo/kg)
TOC 4400 J 14700 J 112 156 189 147 167 394
NOTES:
B • Blank contamination.
J « E«tia>ttd vmtu*.
Fil«: SAS TOC.MCI

24-Oct-89 Page 3 of 4
SPECIAL ANALYTICAL SERVICES
SOILS
SAMPLE LOCATION:SAMPLE NUMBER:DATE SAMPLED:
CRL NUMBER:LABORATORY:
117 ON-FBSB014501E-0703/15/8989ZC01R01
KEYSTONE
ON-HW01S-18-224501E-0803/16/8989ZC01S06KEYSTONE
OM-MW01M-53-554501E-0903/16/8989ZC01S07
KEYSTONE
OM-MU01M-78-80
4501E-1003/16/89
B9ZC01S08KEYSTONE
ON-GB02M-144501E-1103/20/89
892C01S09KEYSTONE
ON-FRGB02M-144501E-1203/20/8989ZC01D09KEYSTONE
ON-GB02M-55
4501E-1303/20/8989ZC01S10
KEYSTONE
SAS ANALYSES («8/kg)
TCC 13.1 9990 630 284 131 391 40 B
NOTES:B • Blank contMinatfon.J » E*ti«ated value.
File: SAS TOC.UK1

24-Oct-89 Page 4 of 4
SPECIAL ANALYTICM. SERVICES •
SOILS
SAMPLE LOCATION:
SAMPLE NUNKR:
DATE SAMPLED:
OU. HUME*:
LAMIATOtT:
ON-OM2M-75
4M1E-14
03/20/89
B9ZC01S11
KEYSTONE
OH-FBGB02
4S01E-17
03/20/89
89ZC01R02
KEYSTONE
ON-GB06M-20
4S01E-15
03/20/89
89ZC01S12
KEYSTONE
ON-GlOAN-80
4S01E-16
03/20/89
B9ZC01S13
KEYSTONE
SAS ANALYSES
TOC 19 • 13 79 1S6
NOTES:
• • llank contMiiiwtlan.J • EttiMt«d valu*.
SAS TOC.UK1

Page 1 of 1
SPECIAL ANALYTICAL SERVICES
SOILS
SAMPLE LOCATION:
SAS SAMPLE NUMBER:
DATE SAMPLED:
CRL NUMBER:
LABORATORY:
SAS ANALYSES (X)
CHLORINESULH*
ON-TPB-014558E55
04/19/89
89ZC40S09
HAZEN
0.03O.U
ON-TP03-01
4558E46
M/ 17/8989ZC40S01
HAZEN
<0.010.03
ON-TP04-01
4558E47
04/17/89
89ZC40S02
HAZEN
0.100.03
ON-FBTP04-01
4558E54
04/19/89
89ZC40ROB
HAZEN
<0.01
0.02
ON-TP07-01
4S58E48
04/18/89
89ZC40S03
HAZEN
0.130.03
ON-TPOB-01
4558E49
04/18/89
89ZC40S04
HAZEN
0.070.02
ON-TP09-01
4558E50
04/18/89
89ZC40SOS
HAZEN
0.02
0.06
ON-TP10-01
4S58ES1
04/18/89
89ZC40S06
HAZEN
<0.01
0.03
OM-TP11-01
4558E52
04/19/89
89ZC40S07
HAZEN
0.020.04
ON-FRTP11-01
4SS8ES3
04/19/89
89ZC40007
HAZEN
<0.010.03
File: SU-CL TP.UK1

tP IOXICITV - SOILS
savle location.
SAS SaipK M»*«r :
nit sa«> ie<>
Oil Nu**r :
later i lory
IPOl-OI
499*131
04-17-14
IUUU17
IK
IP04-OI
4S91I14
04-17-14
•MCMSli
lie
IPFI04-OI
4»lf44
04- 11-14
ItZCOMM
IK
IH07-OI IPOl-OI
4MII17 4»ltll
04-11-1* 04-11-14
I42C02S24 142C01S10
lie lie
IP04-OI
49J1I14
04-11-14
•4ZC02S1I
lie
IPIO-OI
49>lt40
04-11-14
I4ZC02S12
IIC
rpii-oi
4991(41
04- 14-14
141C02S11
IIC
riipii-oi
4991142
04-14-1*
11ZC0201)
lie
IPI1-OI
415«M3
04- 14-14
1UC02S34
IIC
IMXC4NIC CHtXCAlI (•t/t«)
AISfNIC
IMIUI
OUMIU»
cxomiuiI IM>
•CICltY
StlfNIUI
siivii
» » 1171.0
is.i i17 J |
• -• -
70 I
--
> 7 |
143 0
».4 j
11.4 1
** > 1
» 4 |
11.1 1
1 • 1 * » 14t» 0
4 I | 7 7 |
-.
tt.) |
..
4I| 1 • |
t 4 |
107 0
' 4 |
II 1 J
--
--
41 1
» 5 |
17 J 0
II 1 |
• » 1
--
4 1 1
-.
4 * 1
324 0
12 » 1
14 * 1
--
--
1 7 |
4 3 |
47 1 4.0 1 It 0 I
421 0 741.0 141.0
24 1 J
17 4 J
--
4 « | 4 1 1 4 0 1
12
I • Ittlmuo v*lu«
-- • « contract rcojulrcd
dclccllon Halt.

VOtAlll l MONK CCM>OtM>S
StOmlNI
Saaple Location.Saevle MiaOci .Out Saavled:
Oil Nualwi:
laboialocr
(•CANIC CCHFOLMIS (ug/kgl
ON-SOOl 01
EBP7B04-12-11
•92C40S01
S-ODED
ON-SOOl-OI
iap79
Ok- 12-tt
(MC40S02S-OBIO
UN-SU01-OItwio
Ok- IJ-19
a«zc4osoiS-ClBtD
ON-SD04-OItBPII
Ok- 12-H
I*2C40S04
S-CtltO
ON-bUO5 01 UN-SOOk 01ttett EBfai
Ok-l]-» Ok-ll-t«
a9ZC40S05 a9ZC40SOb
S-CtlED S-CUiD
UN-S007-OI
t*Pt4
Ok- 12-19
•UC40507
S-CLBEO
uN-su>a-oiIBPI5
Ok- 12 19
•«ZC40SO>
S-CLBtD
ON-SD09-OI
t»Ptk
Ok- 12 19
I92C40S09
S-Cl*)ED
ON-SDIO-OI
IBM7
Ok- 12-19
I9ZC40SIO
S-CLBED
ON- SUM 01
IBPII
Ok- li l«
IWC40S2I
S-ClBtD
UN- IKbl>l 1-01
IDHI9
Ok- U 19
ttlltOOll
S-CLBED
CM. <•<>•* TH»Nf
viNn. otaiiojOiaiOfTHkNfXTHVtINC O*. Oil CXtCITOMCAMON DISU.MMI. 1-OIOtOlOttWMIl.l-DICMOtO(n«M|
It I
.1-OfOt.OIOflMNI
It II. 1. 1-HICM.OM THkNt
CAtKM TinjtOt.<aiDf
en- i.i
OIUOBQCMOIOW TmNCI. I J-T1ICM.O«0« Trtinf
lEHZINf
- i . )-BI at.cicnorf Nt
4-«f 1MKI • J-Pf NIANCNi2-WXAMONfl(IIACH.O*Ot THINE
1 . 1 . 2 . 2- II nACMOROC THANITOtUtMCMOtatENZfNf
IT WINSTOIAl XYllNfS
• • lUnk canlMliulloI . fillHltd value
-- • Mil «(«clc< atdetection ll*lt
• SUVOC UK I

VUATIK OCANK COHPOMBSfOIWNT
location: oN-SDti-ti ON-HSOIJ-OI ON-swtu-oiStVllNUrtMi: ftPW IVfl IU>«]
0>l« U^ltd: 04-12-M 04-12-1* 06-12-1*
CBl MH**i: ••ZC40S22 1UC44O22 I1ZC40IOI
l«kof«loiy: S-uatO I-CMIO s-CL»to
OIOUMC CMMIMB (U0/ki)
¥01*1111
OICMM1MM*MHM
•fDMIMf 0*. Oil OfAUTOMCAUCM OlSU-flOti. i-nocoiatncM
I. l-WO&OMIflHkMiI.I-MCMOMflMINi (IOI»l)
CMMOHU1.1-DIOtOMtmutf
1. 1. i-rai<M.<»otn«tNi
VIMI ACIUII
MOMDKMOIOMIHW*i . t-MotoMnapM*
CIS- 1. 1-OI010MMMMM
I. l.t-IUCMMMINkMtuaiMt
IMM- 1 . l-M(M.CIOMflP(Ni
4-MTIM-I-r(NT>M»«1-HIXWO*
i. i.i.2-Tinua*.oiofTOlUfM
NOUS
t • Ilink conliBlrullonI • I HIM led value
-- • M»l delected <l•eitciiun linn

24-OCl-t4 IHjgc I ul It
Sl»l-VOl»miS - SiDIMNI
Saaple lotaiion: ON-SDOI-OI ON-soo2-oi ON-SDOI-OI on iuu« 01 GN-SUO* 01 on-iuo6 01 ON-SD07-OI UN-SOO>-OI oN-suo4-oi ON-iuio 01 C M - S D I I O I ON-ivbUii-oiSaMlt NU*)ei HP74 EIP74 flPIO flHtl [6fl2 ilPI) f«P4< f«P45 Clftb [Bf(7 (8P«4 IBPI9
Of 1C Stapled 04-II-» 0*-l2->4 06- l2- t4 Ot - l2 - t4 Ob-12-14 Ob-12-14 O b - l 2 - A 4 O6-12-44 06 -1244 Ob 12-14 Ob 1214 06-12-14CVL IVMtXr : t4ZC40SOI MZC40&02 C9ZC40SOJ <4ZC40^04 a4ZC40^0$ A9ZC40SM 19ZC40S07 •9ZC40S01 •9ZC40S04 A9ZC40SIO 44ZC40^21 44K40U2Iidutaioiy: s-ciaio s-ciaeo s-ctifo S-CKHD S-CHID S-CLIID s-ctiio s-ctsco S-CLBIO s CLBIO s ueiu s-ctnio
OICANIC CCMPOIMB (IW/tl)
S(«IVOIA1ILE
fHtHOL
I-CNtOtOPHINQl1.1-DICM.OUBINZtNf1.4-OICM.OIOIiMtfNCtINIVl MOMQ1l.l-OIOCOtOilNZEM1-AflHrtPHfNOt
4-unfnncMHM- M noso-oi - •- MOM vuii Nt
ISWtCKM2-MnOftCNOi1.4-OIMTIMrHEHDLIINZMC ACID1 1 S 1 1- OlttOt IHOXY )•! THMtf
1 . 1 . 4- TUCHLttWENMNf
4-OftdOWMLINiMf XAOftOKBUlADI INf4-oa.no- 1-xiHn.mfNOia-MMM.NWMMkl.tNiHUMCMOMCVatMNTHOI INt1 . 4 . •- tl I OCOiWMNOi1.4.1-niCH.CIOVMNOl1-CMOMNtnOHU.fNI1-MinOtNlllMIoi*f mn.l.t-DINITlOTUUtM)-Min<MMIllM
1.4-OINIIMPHMOt,4-NIIIVMfNDloiifNtaruuN1 4-DINinOTOlU(NtDiinm.4-CM.MOPMNM.fLUMINI4-MT«aAMIllMI4 . t-MNI WO- 3
4-MMOMMH. PMNn I1ICIHHUCMtOiOtiNIfNIMNTACM.at<WHINGi
ANIMUCINEOI-H-iOTW miHALATf
fVICMmm»tlNIWAIANtHUCfNIO« VMM
OI-N-OCm PHTHALATtlINZOdlFLUKAMTHINfS•INZOlKiriUKANIHINIStiNZO(A)PVtiNfI MM N0< I. 2. l-C(»P«t(N(DIXM2IA HXMIWACfNlIINIOCCHI >rf«VlEN(
MO!IS ( • tltlMIt* Vlluc•- • Ml tftUCKd •!
Oettclloa l i m i t
> I I C •- SOCMt IK I

1 01 II
suvlc location: ON-jou-oi cn-f«sou-oi ON-SWIIJ-OI
M-ll-M M-ll-1* 04-12-ltttZOOSll I42C40O11 MZC4MOI
S-CMfD S-OJ»ID S-CU*fD
(•OHIO CMMUM lut/ti)
SUIMUIIlt
iit(a-CM.auK mn.it net.
i . i-onM.aaiita.it*l.4-OICM.aiOHMIN(•INtVl MOOHM.I . l-M<M«MifNZCMf1-4KHMMMN01
4-MMAMMMO.H-M IMM-M -»-MBM VJUIIM
IS1-M11.4-0HMMC•ISO-OAOMIMOKVIMIHtM1.4-MCMMVMN011.1.4-MIOt.aMMNIfNE
4-CH.MaMNllNiWW(MCM*UT«OI IMf
2-MIMIlMMimu. INfMMMMLOMCVaOMNIUtl f M1.4.*-ni<MOi.4.t-nio«.a1-11-MIMIMillNtMMWM. mmujtit
1.4-MNI«WgitfNIMt«M. MMkUIt4-<M.«MM*M. MfMH. HHfl
MIMM.ATf. »IWIOI
•MCMAIMIMUCIMI
M-tt-acmlOXXt IHtOUNIMNilIHOMK iriUOUNTMMfS
IWfMM 1 . 1. >-CO>PV»NIOIIIMK* . H)*MIMAC(M(IMIM oil trim ftt
I • HllBiiK vjlix-- • N»I «iiccte< >l
Mice I Ion Hill
Ml

PtSIICIDt/PCI • SfDIMtNl
uiplc loci II on
SM»I< Mufcer
MIC tested
Oil MMfcei
Kbaiilaiy.
OtCANIC CCMPOUCS <u«/lg(
ON-SOOI-OI
ftt-71
M-II-M
IUC40MI
S-CU(iO
ON-SIW2-OI
11P79
0*- 12-19
1UC40S02
S-OAID
ON-bLMl 01
I BOO
at- ii-««
•V2C40S01
s-ciatD
QN-^U)4-OI ON-SUOS-U1
t>P«l (BH>2
0»-l2->« Ob- 12 19
•92C40S04 •92C40SOJ
s-cueio S-CLXU
UN SOOt-OI
IBP«3
Ob- 11 »9
•92C40SO*
S-CKIO
ON-SOOI-OI UN 5001-01 (M-SU04-OI
S«P«4 ((PIS IBPlt
0«-U-»9 Ob- l2->4 Ob-l2-t«
•42C40S07 I9ZC40SO« «9it40i09
S-C(j«tO S-ClltO S-Cl»tD
UN-SUIO-OI UNiUII-OI UTJtKbul l 01
(IPI7 10P«4 t9C«
Ob-l2-» Ok 12 «9 Ob-ll-l«
•4^C40SlO t9ZC40b2l I9ZC40O3 1
s-ci«io b-cmto s-oaio
ptsuciws <nd PCI s
tm-mc
otiu-tnc
CUMM-M1C (IIMUMI
HCPUCHOI
Aid IN
IPOXIDf
I
*.l I
ix (in IN4.4-OM
I MM IN
(XXBUfUN II
4 4-DCO
(MMIN ALDitnDI
IMXaU-fAN SUfAH
4.4-OO1
•MHOXVCM.O*
f fOIN IIKM
CM-OIMNi
lOMPMMf
AlOClOI-IOIt
AtOUO-1221
4 « I 4 • I
AIOU.Ct-1141
AIOC1OI- 1241
AIOCKB-1294
A> QUO- lit*
• Nat detected •<
detection Hall
' (illxled vtlue
Hit n-sofci MI

rfsuciot/pci - stointNi
SMMt IKttlOir. (M-SOI)-OI ON-ttSOIl-OI ON-SItttD-BI
Oil< U9'c<: M-l]-*« 04-ll-tt Ok-II-<«
at MHftcr. MZC4M» MZC44CQ1 *«ZC4MOI
Llfcoiaioiy: S-OBIO 1-OVfO S-O>ID
OIONIC OMMtMB (u«/tg)
PUIICIMS in« fell
•fM-MCMIU-IHC
UIMMNt) < I I
HVUCM.OI IPOKIDf
IMMBUirwt IoiitaiiN4.4-OMIMMINIMMtUfAN II4.4-tOO1MB IN AIMMHK
4.4-001MMOKVOt.!*UaHMKfTONf
MMO.M-MMI-IJJI•-111)I-1241I- IJ4«
-• • Ml «*UCI*d II«*IKII«« Hall.
I • IIIIBIM wlut.
••SOFO Xl

(IMge I ul 21
IMBCANICS - StOIMNIS
stop'* loctllon:ill s»ple NUriMf :
MIC StWlcd
OIL MItfMf
liboitloiy
INOICANIC CHIMICALS (10/19 1
AlUtlMJK
ANIIHONV
AISfNIC
1AIIIM
CAUMUt
CALCIUI
CHKMIIM
COMLI
COPPtl
(•ON
IfAO
wOCSiim•ANCANflf
UICUIV
NICK!!.
POTA11IU*
SIIINIUB
SUVII
SODIUK
THALillM
VANAOIl*
ZINC
SDOI-OI
*IIC7t
Ok- 12-19
I9ZC40S9 1
KtYSIONf
4J60 1
-• «
1 1
• 6 7 1
•- 1
1MO I
99 1
-• 1
9 1 1
•090 1
11.1 1
IIM 1
•411
-- 1
-- 1
-- 1
•• 1
-- 1
-- 1
-- 1
11 1
41 1 I
$002-01
KIBC79
Ok-ll-(9
•9ZC40S92
((YSIOM
70*0 1
•- 1
2.4 1
71 2 1
-- 1
1100 1
11.5 1
5 t 1
10 • 1
10100 1
15 7 1
1710 I
210 1
-- 1
11 7 1
927 I
-- I
-- 1
It 1 1
-- 1
21 1
41 2 1
SDOI-OI
Ml BOO
06 12 64
(9ZC40S51
KlrSIONt
2170 1
-- 1
1 7 1
19 9 1
-- 1
1010 1
t t 1
4 9 I
4 7 1
•420 1
9 2 1
•46 I
Itt 1
-- 1
-- 1
-- 1
-- 1
-- 1
•- I
-- I
II 1
26 1
bU04-OI
ktBC.ll
06- 12-49
•92C40S54
MrSIONf
1420 II
-- II
2 2 1
60 1
I
1140 1
7 1 1
9 I
9 1
4490 I
t 9 1
942 I
916 1
-- 1
9 2 1
•- 1
-- 1
-- II
-- •
0 74 •
10 4 1
17 I
SIM9-OI
»l«C«2O6- 12-19
•9ZC40Skl
KfVSIONt
II 100 1
-• 1
7 t II
101 1
-- 1
1690 •
10 9 1
9 9 1
14 9 1
11900 I
17 7 1
lltO I
140 t
-- I
2 1 9 1
922 1
-- II
•- II
19 1 II
-- «
17 2 a65 •
:> 006-01
•fBCtl
Ok- 12-19
t9ZC40S64
KiVSlONE
7070 •
-• •
2 4 •
7k 2 I
-- 1
1950 I
14 k 1
9 4 1
10 1 1
10200 I
7.1 1
1970 1
125 1
-- I
II k 1
740 1
-- •
• • 1
9k 1 «
-- II
21 1 I
91 4 1
5007-01
•tDCt4
Ok-l2-(9
•9ZC40S65
KlYSIONf
994 1
-- 1
Ik 1
11 7 1
-- 1
404 1
2 6 1
-• 1
-• 1
2910 I
0 71 1
140 1
III I
-- I
-- 1
-- 1
•- I
-- I
-- I
-- 1
4 4 1
II 1 I
S 004-01
•IBC4S
Ok- 12 49
•9ZC40i66
KIVSIO*
11000 1
-- I1 4 1
115 •
0 75 R
2640 1
24 2 I
• 1 I
17 2 I
14400 1
14 II
1590 1
l«9 1
-- I
16 7 I
1200 I
-- •
-- 1
79 1 II
•- II
16 9 1
106 I
SD09-OI
atBCtt06 12 49
•9ZC40S67
KtrSIONt
696 1
-- 1
-- 1
7 4 1
-- 1
179 1
111
-- 1
21 1
1650 1
0 4k 1
111 1
41 6 I
-- 1
-- 1
-• I
-- 1
-- 1
-- «
-- 1
4 1
10 2 1
SDIO-OI
»t«07
Ok- 12-19
•9ZC40S6*
KtVSICNf
9050 •
-- 1
2 k 1109 I
°"!29kO I
19 4 I
6 1 I
10 9 I
IlkOO I
17 2 I
2170 1
291 •
-- I
14 1 I
964 I
-- 1
-- I
91 9 i
-- «
27 2 I
9 1 5 1
SDII-OI
ailcitOk- 12-19
•9ZC40S79
SKINfl
2060 |
- -
1 4 |
29 9 J
..
1170 |
11
1 1 1
6 9
4170 |
2 • 1
102 1
191 |
--
1 5 |
229 |
0 k 1
14 1 1
-- II
5 1 1
20 2
IISDII 01 SOI2-OI
Ml 61 49 4UIC.90
06- 12-19 06 12 49
I9ZC40D79 I9ZC40S76
SftlNtt SHIM!
7tl 1 1260 |
..
II
10 2 | 16 4 |
171 | 1600
0 94 | 61
I 4 | 4 |
9 9 |
1410 | 7240 1
I I 4 |
274 | 1190
• 2 2 | 102 |
9 7 |
19 9 | lit |
0 54 |
25 1 1 19 7 •
-- 1 • - •
2 5 | I I 9 |
46 21 5
NOUS:
I • IUI* conualiuilonI • fximcd wlueI • uutublc tfiu-- • « conirtct icquiicd
«titcilon Hall

U'aye 1 ot f t
INMCANICS - SIDI»INIS
uople lociiionill SM»IC r*M*er :
Etttc stapled:cii MIMWI:ukoriioir
HSDI2-OI
•tic* iOt- 12-19
IUC4007»
SKINfl
SOHU-01
*nc*aOt-12-l*
HZC4MM
KINU
INOIC*NIC
AllBINLB
MKIMMT
AISINIC
•limit*C4MIUB
CALCIUI
COALT
I ION
itu>
SC
MIOIV
NICE II
POTASS I U»
IlLINIkM
SIIVII
MOIUB
muni*
5MO
I » I
»7
10 2
54 |
7.9
HMO I
t )
1120
4»t |
0 II |
4 » 1
10 1
14) I
-- I
79 5 )
I « )
tt.l I
1220
-• I
1INC
It 2
M.t
Will:• • Hint conlMliullonI • IsllKted talucI • uwiuble <bt>-- • « contract required
«etecllon 11*11
flit »-IOIM>«I

VOLAlILt OKCANIC CO«f><XJ*JS
SUUAU •AltR
Sttt'e LOC4IIO1I
Sawlc MMfcer
Wle Saipltd
Ctl Nutter .
Laboratory.
ON- sou r - o imt-b)
Ot U-i»
•*iC40S 1 1
S-UAtO
CN-SM2-OI
tM>b4
Ob- l2-t«
MIC40SI2
S-OJlfO
(M-SMJ-OI
IBPbS
Ob- 12-19
(92C40SI1
S-CLBIU
ONi»04-01
IBHbb
Ob - 1 2 M
I9ZC40SI4
S-CU)tl>
ON-SWO5-0 1
lBHt.7
Ob- 12-19
•9ZC4US15
S-CtBtD
UN-SMlb-OI
IBfbl
Ob- !2-««
•9^C40Slb
s-cisto
ON iWOJ-Ol
IBPb9
Ob- l2->«
141C40SI7
S-CLBIO
ON-SWOft-OI CN-SWO9-OI (JM-bWIO 01
IBP7U IBP7I llll'll
Ob- l2- t9 Ob- 12-1* O b - l 2 - > «
I9ZC40SI1 t92C40SI* >9/C40b20
S-CLBtO S ClBtD b CLBID
ON-b*ll 01 UN IK-.WI 1 III
tBt'/J tBt>74
Ob- 12-49 Ob- 12-19
49^L4JiJ4 t4^C4OU24
i-CIBHI S CLBIO
(U|/tB)
CHLOOHtimNf
MOHQMTmNf
viNta
•ttimfNi ototiot
CAIION oisunotI. 1-DIOftOIOflHfNI
i. i-oicnnofimM1.2-OICM.atOIIHfM (10IAI)
ocaiarcut
1-tUTAMM
1.1.otiKMVIMH ACIIAIt
CIS- 1. J-OICKMOMOPtK
i. 1.1-niai.oiocmutftiNlfNf
raAia- 1. 1-DicMtodOMociNi
•KHOfOM
4-MtIHn - 2-rfNlANQM
1-HIMMM
I. I 2 2-I€I«AO*C«OtIWN(
101 KMOft«C»tNZtNt
f IKrttf NZt M
SfVtENf
IO1AL XVllNfS
NDTtS
I i Bi4iii conuBitui(on
t • tlllBilea vilut
- i Mjl ae lCLled «I
Ur In I ton I )•! I

WHAIIlt (MGANIC CODPOIMB
MlfACt HA 111
ON-SII2-OI ON-flS»l2-OI CN-SWI1I1-OI
IIP7S llf>7» IBP77
me saw I id: 04- 12-11 ek-i>-i* M-u-*9Oil Ml*«r . »«ZC40SJJ MZC40MI t«ZC4(W02
iikoixoir S-CLBEO i-a»u> S-CLBID
OICWNC CCMrOMK (UC/k|l
MOMMIHINi
VIMA. CH.<> I DC
MIHAtM OCOtlM
AC! TOM
i.i-oi<M.aiatncNi1.1-OICM.aiOfTMlNI
1.1-OICMlCIOflHINi nOTAl)
OtCMfOM
2-tUIANQM
1. 1. i-niCH.a>af IHIMI
VIMH. ACITATI
Cl»- I . t-OIOCMOMOFf HE
i.i.i-niot.atocmw«IHOfM
- i. i
2-WXAMM
i. f.i.i-TOiUWi
IOIAL XVVtNtS
MIKS.
t • lUnk conualiuilonf • (illMUd value
-- • wi 4*i*cte4 *iMlccllon Halt
f l ic • s«voc mi

t t -«9 ll'dyv I ul
-VOtAHUS - Si* f AC I HAHK
saw It locationsample NUJACIDile sailed
laboiaioir
GTICANIC COIPOUOS (U9/II
staivotAiitf
ON- SM 1 - 0 1l»Pbl
Ot- 12-19
s-cteeo
ON-SMTO2-01tBPb4
Ob 12 >9
S-CICID
ON-iWOJ UltBPbi
Ob- 12-19
s-cueiD
fBPbbOb- 12 -»9
b-C-ljBID
ON- S»0-> • 0 1IBPb7
Ob- I2-B9
S-CUBID
UN- SVOb 0 1IBPbl
Ob- 12 >9
S-CHID
ON SM7-01[BH64
Ob !]••«
i-CUHO
IBP70Ob- 12-19
S-CLDID
ON-SM4-OIIBP7I
Ob- 12-14
s cceto
ON- bV 10 01 UN-bW
Ob- 12-19 Ub
S-CtBlO b
1 0 1Bl'7 JJ- 19
«<UU
UN IKbMrl 1 Ol
Ob U- 19
S CtBID
PMNOiliSd-omoiotiHn. itiHtKJ-CrtuSOPKMXI 1-DICnOIOtfNZfNf1.4-DICMOIOtINZfNf• 1M2YI AlCOHTXi j-oiatotwiNZtNt2-UTHVtPttfHOl
4-MTtmPHINDLN-NIT«OSO-DI-n-raOFLYA«INfMWOftOtOfllMNf
ISOPHMONt
J 4-OI«IIHVlPHfNOlIINZOIC ACIDIIS(I-CH.OIOi1HOKVI»fTt«Nt2.4-DIOt.OiCPHtNOl
4-OtaKMNIllN(MMCHOiaMJKOI INt4-CH.atO-l-MIHVtPHtMX
wmoi.a*ocvcioriNiA1. 4. 4-TIICK OtOPttf rot. .
2-acaKMtpMTmiiNtl-NITIIMNILINfoixnmI.»-DINinO10lU(N(1-NinCHMLINf
1.4-DINIIIOFHINai4-NinarHfNotOllfMZWUItNj 4-oiNinoiatuiNfoilitm mrmiAif4-CHi01CrHINVl PHtNVL [ IHt«nun (K4-NIT((MNIllNf4 »-OINIIIO-l-»JIHVtPH(«X
4-HQMMCNVl PHfNVl flHMHtXACH.Oiai(NZ(Ni
PHfMMIXINiAMIHUCfM
rilMANTHINfPYtiKmm tiNin1 . )-DICM.O*OBf Mi IDINfliNZOIA lANTMACINfocvsfNfiisti-f itmHfxvi )pHimLDI-N-OCIVl PMTmlATiIINZOd triUOtANIHCNf SIINZOU )f lUOlANIHf Nf SIIM7.0(A)PY«(N<IMMMX I 2 l-CDIPTIINtDIMNZIA HIANItHACftt• f«0(CMI IPCIVtINt
NOIfS t * Eitlwlcd value• • • M>I delected at
delect Ion I ia| i

IPige 1 ul 1}
Sfni-votAiuiS - ««rt«
toullon: ON-uil-oiU4>le NuoMr: IW7JMIC SMPIM: Ot-ll-l*
dl MMkcr:Itkoolocy:
(M-fl$»l2-OIflf>7t
04-IJ-HI«ZC400I3
s-CLifo
ON-SHfHIJ-OI
M-I2-I9I42C4U02
s CL»IO
01 ONI C OHPOLMX <U«/I)
SUIMM.ATILI
PMfNOlCHioiOf nm IIIMSI
1.1-DICMUBMfMZfNi1 . 4 -Ol CM.WMINM MUNTO. Aicacn
IISIl-OCMOIMMCPVl )ITHI«4-MI
HHUOCOHKIHW*
tftaoic »cion»ia-CM«k«1.4-OICMCIWICNOl
4-ot.aiatMitcuoiarau4 • CMOiO- J-M THUlPHiMHi-MTHktmrMTmtiMtNUMCMWOCVCtapf NTAOI f Nf
1 . 4 . i- H ICWMOHCNOil-OCMCMMMHtlfMfl-NITMMNLINiM«fHM. HflMUTIACIMIMIIMIM
1-WIUMMllM
4-wnarXNOiOlMWOMUM>.4-P«HITMTaiUfMMIUM MNMAtf4-OCOMNWM fMINin ETHil
4-MIMtMUIM
4-MOMTMHVt mtim. tmuMfMCM.«l«tMIN(
AMMACINtDI-M-MJIn PMTtttlATE
rvtwi•urn1. l-OIOCMMfNtlDINI•ENUXA lANIMACf MCHIVSUtl• ISO-f limWXVl IPHTHkLATIoi-H-ocm nmaiATfIIMZM»)HUOIAHn«MtS
• INZMAirVIINfIMXMMI.I J-0»PV*INfOltf «(A . H>ANI»«*CfNCIINIO<aillPflVtlNi
NOUS tlllwlcd v»lutNDI 4)*l*CICd *l4CUCIIOK llBll

PtSIICIDt/PCIS - SI*MCI BAUD
S«^>le LOC*I I IX): ON-S*Ol-Ol UN-SV02-01 UN- bWOJ-0 1 ON-SMU-Ol ON-SWU*-OI QN-^WOb-OI GN-SW7-OI ON-SWOI-Ol ON-SWU9-OI ON i* 10-01 ON bWI 1 U 1
SAaVlC N.Mt>ef : ttPtJ tit*64 tbHtei tttHbfa tU^b? tftft>« tBP69 (BH70 t»P7l IttPTi IBH7J
MIC Sailed M- 12-tl Ob- 12 ••* Ob- l.t-19 Ob- U-I<* Ob- U •* Ob- 12-19 06- U-19 06 U •«* Ob U-»<» Ob- IJ-»9 Ob u fl-J
L»tK)lllOfV S-04EO S-OACD S-CLUtD S-CL*(D S-CUBtD S-CKtO S-CL«ID S-CtBtD S-ClAtO S-CLBID S tltttD
QKCaANlC CQH.*Ol>DS tug/ky)
UN ItdWI 101
1HP74
Ob l<{ -IV
S LLillO
PiSiiciotS »nd PCI>
ttlA-ttC
ML1A-IHC
CMMM-IHC (lIMUNfl
MP1ACHLOI
AlUIN
HtPTACMOt i POX IDt
tNDOStAUN I
OIILMIN
4.4-OOf
IMKIN
IMKBUFAN II4.4-BOOIMMIN AlDiHVMIWXBU.IAN SUfATf
4 4-001
•tlHOXYCMLOU
fMKIN KIIONt
O«OIDANf
lOXAPHCNf
AlOCLOI-IOIbAIOCLOI- IJ2I
AIOCLOI- 1212
AIOU01- 1242
AIOUOI-I24I
AIOCLOI- 1214
AIOUO>- I1M
NOUS
-- • NO I delected >ldetection Hall
I • Hint coniaalMilonj • minted value
r i le •-SIPCI «i

14-OCI-M CH»ge I at
PtSnciM/PCIS - SUUACl Mill
tocitlon: ON-MII-OI QK-HSHII-OI ON-S»III-OISMpI* MJ*»r liPM I1P7* IBP77
Mlt U«plc« M-ll-M M-12-tt M-l2-«9
OL MMftcr: IUC40S1I MZC4M2I I4ZC4M01
Kkornory s-OBiD s-<UfO s-cuio
cairauos
PISTICIMS and Pdi
ALPMt-IHC
IfU-IMC
MLU-MC
OUM4-HC ItlMMNf*
MifUCMLM
UMIN
MPUO«.ai IPOXIM
IMM(U.r*N I
OIIIOIIN4.4-OOC
I MM IN
[MX^UfAN II
4.4-OOO
fMKIN AIMHVM
4.4-DO1
MIHOKVOCfli
IM
IDXAPHtNt
MOCiOI-IMI
AlOCLOt- 1111
MOO.M- 1141
AIOO.M- 12*0
NOUS:
-- • N»I dcucied <t•election Halt.
I • il«* CMitMlntllon.J • [>ll«t«« MlUC.
File:

INUGANICS - SlttfACt HA III
Saaple Location1 IB Sample Mjafeer
OIL Nuafieitaboiaioiy
INOBGANIC CHt«ICALS lug/I)
ALUMIUJK
ANIIkONY
ABStNIC
BABIl*
ttBVLLlUK
CAOBtlUt
CALCIUB
OBUMIUM.
CtBULI
comiIRON
IfAO
MOCSILM
BMNGAMSf
•ficutvMOtfl
FO1ASSIU>
StlfNIUt
SILVtB
SOOluk
imiiiukVANAOIUB
ZINC
NOUS:• • Blank conuolnailon1 • EsllBHled value• • UMiseable data-- • < contract fewiired
detection IIBII
SMl-OI
•IBC63
H- 12* M
I4/C40S5S
MVSIONf
74000 B
-- (
-• B
2470 B
43 1
7 1 B
I230OO B
4* 4 B51 B
114 B
23«000 B
nt i32*00 B
DM B
-- B
101 B
4*20 B
-- B
-- B
1210 B
-- B
414 B
421 B
SV02-OI
•IBC64
06- 12- *4
•4ZC40SJ*
tlttlC**
2450 B
-- B
-- B
46 4 B
-- B
-- B
11*00 B
-- B
-- B
11 4 B
I220O B
1 t B
4(40 B
2020 B
•• B
-- •
1420 B
-- B
6 1 B
2410 B
-- B
14 t •
32 2 B
S*03 01
•IHCD5
06- 12- a4
(4/X40S5/
KIVSIUM
460 II
•- B
-• B
11 1 1
-- B
-- B
12200 1
-- B
-- B
4 1 B
2010 B
-- B
4750 B
IBS B
-- B
•- B
1170 B
-- B
• 6 B
2420 i
•• 1
-- •
12 1 II
SW4-OI
•IB166
06- 1 2 - *4
•4/C40S5*
KlVblONI
1300 B
-- *
-- B
111 B
-- 1
•- B
11000 B
1} 4 B
-- B
-- B
14500 B
5 * B
7760 S
iaao B-• B
-- B
4160 B
-- B
-- B
2710 R
•- B
25 6 B
56 3 B
SMS-OI
•IBC67
a4«40SJt
KIVSIONt
112 II
-- B
-- B
11 B
-- B
-- B
I2BOO B
-• B
-- B
20 a B
1410 B
-- B
4440 B
I4B B
-- B
-- B
1420 B
-- B
-- B
2510 B
-• R
-- R
17 1 B
bWUb 01 SWU7-01
MtlKbl MIBC64
(WC40S60 a»;c4056iKtVblUNt MVSIONi
46 3 R 606 B
-- R -- R
-- R -- R
61 7 R 52 B
-- B -- B
-- R -- R
20aOO B 17000 B
-- B •- B
-• B •- B
16 5 B 16 1 B
I020O B (420 B
2 7 B 2.4 B
7150 B 6150 B
1410 B a 16 B
•- B -- B
-- B -- B
14BO ( 2620 B
-- B -- R
-- B 5 a B
2«20 R 2770 B
•- • -- R
6 1 R 6 4 R
2B 5 R ia 6 B
swa-oiMBC70
06 I2-B4
(41C40S62
MYMUNt
777 R
-- B
-- B
64 6 R
-- R
-- R
17200 R
-- R
-- B
6 4 B
10700 B
1 4 B
61*0 B
1540 B
•• B
-- B
2440 R
-- (
-- R
1040 R
- B
6 4 R
22 1 B
SH04-OI
MIBC7I
06- 12- *4
I4JC40S64
KtVSIONt
217
51 5
20500
- -
- -
* a1410
1 5
7140
2040
- -
5610
2540
IS 1
SO 10 . 0 1
Ml BC 7 2
06' I2-B4
(42C40S70
MVSIONt
R 76 ( R
( -- B
R 6 1 R
R 74 1 B
B -- R
B •- B
R 27600 B
B -- R
B -- R
B -- B
B B260 B
B -- 1
B «(20 B
B 1410 B
B -- B
B -- B
B 1770 B
B •- B
( •- R
B 2420 R
B -- B
B -- R
B • 4 B
SKII -Ot IRbHII 01MIBC73 XttKM
awclos" a°'( 400*1SKINNtB SHI Will
147 B 602
.. |
.. t
11 1 B 31 1 |
.- B
-- B
ii40o B i<aoo.. t
.. |
.. B
2060 B 2110
1 ( B 1(1
5240 B 5040
17* B 176
-- B -- R
.. B
2200 1 2110 |
2 7 B
-- B
2640 B 2540 J
-- R
._ (
16 B 10 1 B
b» 1 2 0 1
•IBC75
(WC40s"
*KIN*B
724
31 1 |
usoo
2iaoi • I
5100
164
0 15 1
2121) |
2bOO |
t J B
Hit H-SKINO Ml

IMMGANIC5 • UMHCl Mill
s«»lc loo I Ion MMii-oiill Vm>i< MMfccr: «»c7k
MU stapled ot-u-t* ot-ii-t*Oil NU*«r: ««ZC40O74 MZC4MM
»I>MII JKIMffl
INBC4NIC CMUklCALS (U«/l>
•ISINIC
taium M.7 i•fintiui
CALCIIM I MOO
CMtMIUI
COUIT
ctrrtt •• 4 t iIION 1MO 11 » I
I 1*0 1.1 I 2.7 )
•MMXIUi JIIO
Mld*V -- I -- I
manPOTASS I in 1IM |
MIINIUI
IllVN
SODIIM 1*40 | »4 5 •
IMLLIUI
ZINC II. I I 1 1 9 1
I • IfllMled valueI • UHlfUklC 0>t>
-- • < conlitcl itqul•clccllon Malt
flit. B-MIND.*!!

Appendix KRISK ASSESSMENT METHODOLOGY
GLT913/035.50-11

Appendix KRISK ASSESSMENT METHODOLOGY
EXPOSURE ESTIMATION
Exposure is defined as the contact of an organism with a chemical or physicalagent. In this assessment, exposure is normalized for time and body weight.Exposure normalized for time and body weight is termed "intake." Chemicalintake is expressed as mg chemical/kg body weight/day.
GENERIC ESTIMATION OF INTAKE
Equation K-l presents a generic equation for calculating chemical intake:
I = (C x CR x EF x ED) + (BW x AT) (K-l)
where:
I = Chemical intake (mg/kg body weight/day)C = Chemical concentration (e.g., mg/1)CR = Contact rate (e.g., liters/day)EF = Exposure frequency (days/year)ED = Exposure duration (years)BW = Body weight (kg)AT = Averaging time (days)
Carcinogens
A lifetime average intake (or chronic daily intake) of the chemical is estimatedfor carcinogens. This acts to prorate the total cumulative intake over a lifetime.An averaging time of 75 years is used for carcinogens.
Intake can change over a lifetime as body weight, contact rate, exposurefrequency, and chemical concentrations change. Equation K-l can be modifiedto address this issue:
K-l

M(I/AT) E (C, x CRt x EFi x EDj) + BW; (K-2)
where:
I = Chronic daily intake of the chemical (mg/kg body weight/day)AT = Averaging time (days)Q = Chemical concentration in ith time period (e.g., mg/1)
= Contact rate in ith time period (e.g., liters/day)= Exposure frequency in ilh time period (days/year)
M = Number of time periodsED = Exposure duration in ilh time period (years)
= Body weight in ith time period (kg)
U.S. EPA typically assumes a constant body weight (typically 70 kg) inestimating lifetime cancer risk. This assumption would alter equation K-2 toyield the following:
M1/(AT+BW) z (Q x CRf x EFj x ED,) (K-3)
Noncarcinogens
The chemical intake of noncarcinogens is estimated over the appropriateexposure period or averaging time. The averaging time selected depends on thetoxic endpoint being assessed.
This assessment evaluated exposure to noncarcinogenic systemic toxicants. Forsystemic toxicants, intakes are calculated by averaging intakes over the period ofexposure. The averaging time typically used is no longer than a year. In thisassessment, it was conservatively assumed that the averaging time was a day.Therefore, equation K-l can be simplified to:
I - (C x CR) + (BW) (K-4)
where:
I = Chemical intake (mg/kg body weight/day)C = Chemical concentration (e.g., mg/1)CR = Contact rate (e.g., liters/day)BW m Body weight (kg)
K-2

MEDIUM-SPECIFIC INTAKES
The following sections present the methodology for estimating intake fromspecific environmental media.
Intake-Drinking Water
An equation for calculating chemical intake through ingestion of drinking wateris presented below:
I = (CW x IR x EF x ED x CF) + (BW x AT) (K-5)
where:
I = Chemical intake (mg/kg body weight/day)CW = Chemical concentration in water (yg/1)IR = . Ingestion rate (liters/day)EF = Exposure frequency (days/year)ED = Exposure duration (years)CF = Conversion factor (10~3 mg/yg)BW - Body weight (kg)AT = Averaging time (days)
Intake-Soil Ingestion
An equation for calculating chemical intake through ingestion of soil or sedimentis presented below:
I = (CS x IR x EF x DF x ED x CF) + (BW x AT) (K-6)
where:
I = Chemical intake (mg/kg body weight/day)CS - Chemical concentration in soil (yg/kg)IR » Ingestion rate (grams/day)EF » Exposure frequency (daysfyear)DF * Desorption factor (assume 100%)ED = Exposure duration (years)CF = Conversion factor (10^ mg/yg x 10'3 kg/g)BW = Body weight (kg)AT = Averaging time (days)
K-3

Intake-Dermal Contact, Water
An equation for calculating chemical intake through dermal absorption ofchemicals in water is presented below:
I = (CW x SA x PC x ET x EF x ED x CF) + (BW x AT) (K-7)
where:
I = Chemical intake (mg/kg body weight/day)CW = Chemical concentration in water (iig/1)SA = Surface area (cm2)PC = Permeability of water (cm/hr)ET = Exposure time per day (hour/day)EF = Exposure frequency (days/year)ED = Exposure duration (years)CF = Conversion factor (volumetric for water and unit conversion-
10° I/cm3 x 10'3 mg/pg)BW = Body weight (kg)AT = Averaging time (days)
CARCINOGENIC RISK ESTIMATION
For carcinogens, risks are estimated as the incremental probability of anindividual developing cancer over a lifetime as a result of exposure to apotential carcinogen. The cancer potency factor or slope factor (SF) convertsestimated daily chemical intakes averaged over a lifetime of exposure directly toincremental risk.
To estimate risks from exposure to carcinogens, the following is needed:
o Chronic daily intake of the chemicalo Carcinogenic potency factor
ESTIMATING CANCER RISKS CAUSED BY EXPOSURE TO A SINGLECARCINOGEN
The one-hit equation can be used to describe excess lifetime cancer risk fromexposure to a carcinogen. This model can be described by the following:
K-4

Risk = 1 -exp-<SFxCDl) (K-8)
where:
Risk = Excess lifetime cancer risk as a unitless probabilityexp = the exponential (171828)SF = Slope factor or cancer potency factor (mg/kg/day)"1
GDI = Chronic daily intake averaged over a lifetime (mg/kg/day)
Where the risks are low (Risk < 10"3), it can generally be assumed that thedose-response relationship will be in the linear low-dose portion of themultistage model dose-response curve. Under this assumption, the slope factoris a constant and risk is directly related to intake. This can be described by:
Risk = SF x GDI (K-9)
ESTIMATING CANCER RISKS CAUSED BY EXPOSURE TO MULTIPLECARCINOGENS
Exposure situations may involve the potential exposure to more than onecarcinogen. To assess the potential for carcinogenic effects posed by exposureto multiple carcinogens, it is assumed in the absence of information onsynergistic or antagonistic effects that carcinogenic risks are additive. Thisapproach is based on the EPA's Guidelines for Health Risk Assessment ofChemical Mixtures (U.S. EPA 1986d) and the EPA's Guidelines for Cancer RiskAssessment (U.S. EPA 1986a).
For estimating cancer risks from exposure to multiple carcinogens from a singleexposure route, the following equation is used:
NRiskT = E Riskj (K-10)
i = 1
where:
RiskT » Total cancer risk from route of exposureRiskj = Cancer risk for the i* chemical
K-5

NONCARCINOGENIC RISK ESTIMATION
COMPARISON OF INTAKE TO REFERENCE DOSE
The potential for noncarcinogenic health effects from exposure to a contaminantis evaluated by comparing an exposure level over a specified time period with areference dose (RfO) for a similar time period. This ratio of exposure totoxicity is called a hazard quotient and is described below:
HQ = E + RfD (K-ll)
where:
HQ = Noncancer hazard quotientE = Exposure level (or intake in mg/kg/day)RfD = Reference dose (mg/kg/day)
This comparison can be interpreted as follows:
HQ i 1 Potential for health effects (K-12 )
HQ < 1 Health effects not anticipated (K-13)
HAZARD INDEX APPROACH
Exposure situations may involve the potential exposure to more than onechemical. To assess the potential for noncarcinogenic effects posed by multiplechemicals, a "hazard index" approach can be used. This approach, which isbased on EPA's Guidelines for Health Risk Assessment of Chemical Mixtures(U.S. EPA 1986d), assumes dose additivity and sums the ratios of the dailyintakes of individual chemicals to their reference doses. This sum is called thehazard index (HI).
HI = El/^fDl + Ej/RflV ... E/RfDi (K-14)
where:
HI a Hazard indexEJ = Daily intake of the i* chemical (mg/kg/day)RfDj = Reference dose of the 1th chemical (mg/kg/day)
When the hazard index exceeds unity, it is a numerical indicator of the transitionbetween acceptable and unacceptable exposure levels and there may be concernfor potential health effects. Any single chemical with an estimated daily intake
K-6

greater than the corresponding reference dose win cause the hazard index toexceed unity.
For multiple chemical exposures, the hazard index can exceed unity even if nosingle chemical exposure exceeds the reference dose for that chemical. Theassumption of additivity is most properly applied to chemicals that induce thesame effect by the same mechanism or in the same target organ. If the hazardindex is near or exceeds unity, the chemicals in the mixture are segregated bycritical effect or target organ and separated indices are derived for each effector target organ. If any of these separate indices exceed unity, then there maybe a concern for potential health effects. Chemicals that are essential nutrientsare excluded from the index when in the range of essentiality.
GLT913/038.50
K-7

Appendix LRISK ASSESSMENT DATA TABLES
GLT913/035.50-12

17-Oct-89 (Page 1 ol 2)
Table L-1SOURCE/PLUME AREA MONITORING WELL
Rl SAMPLE DATAONALASKA SITE
NONCARCINOGENS
Chemical
BariumBenzole acidChromiumCopper1.1-Dichloroethane1.1-DtehloroetheneElhylbenzeneLeadManganese2-Methylphenol4-Methylpheno)NaphthaleneNickelPhenolToluene1,1.1-TrichloroelhaneVanadiumXylenesZinc
CARCINOGENS
Chemical
ArsenicBenzeneODD1 ,4 Dichlorobenzene1,1-Dichloroethane1.1-DichloroetheneTricolor oethene
Detection (a)Limit
Values
2005010255555
15101010401055
505
20
DetectionLimit
Values
105
0.1010555
MW02S-01Concentration
(ug/l)
35225
24.88.32.52.5
57.6
1340555
27.85
2.52.58.12.5
49.8
MW02S-01Concentration
(ug/l)
9.55
0.052
2.52.52.5
MW02M-01Concentration
(ug/1)
1390255
12.52.52.52.58.1972
555
7.45
2.52.525
2.558.4
MW02M-01Concentration
(ug/l)
19.42.5
0.055
2.52.52.5
MW02D-01Concentration
(ug/l)
152255
8.12.52.5
22.5
1190555
5.45
2.52.5252.59.9
MW02D-01Concentration
(ug/l)
2.42.5
0.055
2.52.52.5
MW03S-01Concentration
(ug/»
593235
12.519015
2102.5
3720566456
19.86
83002403.4
230010.9
MW03S-01Concentration
(ug/l)
19.413
0.055
1901511
MW03M-01Concentration
(ug/l)
2760255
12.52.52.52.52.5
1260555
6.35
2.52.525
2.514.4
MW03M-01Concentration
(ug/i)68.4
2.50.05
52.52.52.5
MW04S-01Concentration
(ug/l)
401255
12.52.52.5422.5
332055
23205
5302.525
2.515.1
MW04S-01Concentration
(ug/l)
10.22.5
0.385
2.52.525
MW05S-01Concentration
(ug/l)
347715
12.55702.51602.5
689058
110478.8
58300
2.525
140031.6
MW05S-01Concentration
(ug/l)
87
0.055
5702.525

17-OCI-89 (Page 2 of 2)
Table L-1SOURCE/PLUME AREA MONITORING WELL
Rl SAMPLE DATA
ONALASKA SITE
NONCAHOHOGENS
ChemicalBariumBenzole acidChromiumCopper1.1-DfchloroethaneI.l-DtehtoroetheneEthytoenzeneLeadManganese2-Methytphenol4-MethytphenolNaphthaleneNickelPhenolToluene1,1,1-TrichloroeihaneVanadiumXyteneeZinc
CARCINOQENS
ChemicalArsenicBenzeneODD1 .4 Oichlorobenzene1.1-Dichkxoethane1.1-DtehtoroetheneTrlchloroethene
MWOflM-01Concentration
(uo/01370
255
12.536
2.52.52.5
4500555
8.15
2.52.5252.56.7
MW06M-01Concentration
(ugfl)
1.12.5
0.055
362.52.5
MW08S-01Concentration
(ugfl)14525
56.22.52.52.52.7
5690555
19.95
2.52.525
2.520.2
MW08S-01Concentration
(og/i)5
2.50.05
52.52.52.5
MWOBM-01Concentration
(ugfl)600
255
12.52.52.52.52.5
3060555
8.75
2.52.5252.5
13.8
MWOBM-01Concentration
(ugfl)
52.5
0.055
2.52.52.5
MW080-01Concentration
(ug/l)
88.2255
12.52.5
22.52.5
2530555
5.15
2.52.5252.5
9
MW06D-01Concentration
(ug/l)
3.22.5
0.055
2.52.52.5
MW21S-01Concentration
(ugfl)
201255
12.54902.52.52.5
3220555
13.45
2.52.5252.5
1010
MW21S-01Concentration
(ugfl)
52.5
0.055
4902.52.5
Average (a)Concentration
699.9328.676.65 •
11.26108.83
3.5036.383.41
3141.0013.6718.6714.2512.565.08 *
1429.3822.2921.79
310.42104.15
Average
13.053.960.08 '4.75
108.833.54 •3.21
HighestDetected
2760.0071.0024.8012.50
570.0015.00
210.008.10
6890.0058.00
110.0056.0027.806.00
8300.00240.0025.00
2300.001010.00
HighestDetected
68.4013.000.385.00
570.0015.0011.00
(a) One-half CLP detection limit value used where compound was not detected (or determinationof Average (Arithmetic Mean) Concentration Values.
NOTE: ' " indicates compound detected in less than 10% of monitoring wells, hence compound notrequired for estimation of risk.

17-OCI-89
Table L-2TEST PIT Rl SOIL SAMPLE DATA
ONALASKA SITE
Chemical
AcetoneArsenicBariumbis(2-Ethylhexyl)phthalateCadmiumChromiumCopperODDDDEDDTEthylbenzeneIsophoroneLeadManganeseNaphthaleneNickelPyreneTolueneTrichloroetheneVanadiumXylenesZinc
AverageConcentration
ug/kg
Highest DetectedConcentration
ug/kg
39.874380930104622620103603766071.552.8723.25206.68
6468000323000609.3714170
43299.252.68
154503140.3157788
88176001840002300350027600217000
3603301301600340
2740005620003500206001701700
41770024000918000

19-Oct-89 (Page 1 ol 7)
Table L-3EXCESS LIFETIME CANCER RISKGROUNDWATERINGESTION EXPOSUREONALASKA SITE
Chemical
ArsenicBenzeneODDMDichlorobenzene1.1-Dtohloroethane1.1-OichloroetheneTrlchloroethene
SUM OF RISKS
SUM of RISKS W/O As
U.S. EPACarcinogen
Classification
AA
B2B2CC
B2
CarcinogenicPotency Factor
(kg-day/mg) Source (a)
1.75 U.S. EPA0.029 IRIS0.24 IRIS
0.024 HEAST0.091 HEAST
0.6 IRIS0.011 IRIS
MW02D-01Liletime Average Excess
Concentration Chemical Intake Lifetimeug/l mg/kg/day Cancer Risk
2.4 6.657E-05 1E-04
0.0006*00 OE+00
O.OOOE+00 OE+00
O.OOOE+00 OE+00
O.OOOE+00 OE+00
O.OOOE+00 OE+00
O.OOOE+00 OE+00
1E-04
OE+00
MW02M-01Lifetime Average
Concentration Chemical Intakeug/l mg/kg/day
19.4 5.543E-04
O.OOOE+00
O.OOOE+00
O.OOOE+00
O.OOOE+00
O.OOOE+00
O.OOOE+00
ExcessLifetime
Cancer Risk
1E-03OE+00OE+00OE+00
OE+00
OE+00
OE+00
1E-03
OE+00
EXPOSURE ASSUMPTIONSExposure Setting ResidentialDally Water Intake (liters/day) 2Body Weight (kilograms) 70Number ol days/week exposed 7Number of weeks/year exposed 52Number of years exposed 70Lifetime Average Water Intake 0.029(liters/kg body v*./day)
(•) Source* ol Cane* Potency Factor*:MIS - Integrated Risk Information Syttem. U.S. EPA 108*.
HEAST - Health Effect* AtMMrnent Summary Tablet—Quarterly Summary, US. EPA 10 80U.S. EPA - U.S. EPA ie*8a.

19-Oct-89 (Page 2 ol 7)
Table L-3
EXCESS LIFETIME CANCER RISK
GROUNDWATER INGESTION EXPOSURE
ONALASKA SITE
Chemical
ArsenicBenzeneODD1 .4 Dichlorobenzene1.1-Dichloroethane1.1-OichloroetheneTrkchloroethene
U.S. EPACarcinogen
Classification
AA
B2B2CC
B2
CarcinogenicPotency Factor
(kg-day/mg)
1.750.0290.24
0.0240.091
0.60.011
Source (a)
U.S. EPAIRISIRIS
HEASTHEAST
IRISIRIS
MW02S-01
Concentrationug/l
9.55
2
Lifetime AverageChemical Intake
mg/kg/day
2.714E-041.429E-04O.OOOE+005.714E-05O.OOOE+00O.OOOE+00O.OOOE+00
ExcessLifetime
Cancer Risk
5E-044E-06OE+001E-06OE+00OEtOOOE+00
MW03S-01
Concentrationug/l
19.413
1901511
Lifetime AverageChemical Intake
mg/kg/day
5.543E-043.714E-04O.OOOE+00O.OOOEtOO5.429E-034.286E-043.143E-04
ExcessLifetime
Cancer Risk
1E-031E-0506+00OE+005E-043E-043E-06
SUM OF RISKS
SUM of RISKS W/O As
SE-04
6E-06
2E-03
8E-04
EXPOSURE ASSUMPTIONS
Exposure SettingDaily Water Intake (liters/day)Body Weight (kilograms)Number of days/week exposedNumber of weeks/year exposedNumber of years exposedLifetime Average Water Intake(liters/kg body wt./day)
Residential2
707
5270
0.029
(•) Sources ol Cancer Potency Factors:IRIS - Integrated Risk Information System, US EPA 1988
HEAST - Health Ellecls Assessment Summary Tablet—Quarterly Summary. US EPA 19U.S EPA-U S EPA1988*

19-OCI-89 (Page 3 ol 7)
Table L-3EXCESS UFETIME CANCER RISKGROUNOWATER INGESTION EXPOSUREONALASKA SITE
Chemical
ArsenicBenzeneDOOl.4D»chlorobenzene1.1-Dlchloroethane1.1-DtehtoroethenaTricMorosthene
SUM OF RISKS
SUM of RISKS W/O As
U.aEPACardnooen
Classification
AA
B2B2CC
B2
CarcinogenicPotency Factor
(kg-day/mg) Source (a)
1.75 U.S. EPA0.029 IRIS0.24 IRIS
0.024 HEAST0.091 HEAST
0.6 IRIS0.011 IRIS
MW03M-01Lifetime Average
Concentration Chemical Intakeug/l mg/kg/day
68.4 1.954E-03
O.OOOEtOO
O.OOOEtOO
O.OOOEtOO
o.oooEtOoO.OOOEtOO
O.OOOEtOO
Excess
LifetimeCancer Risk
3E-03OEtOOOEtOOOEtOOOEtOOoEtooOEtOO
3E-03
OEtOO
MW04S-01
Concentrationug/l
10.2
0.38
Lifetime AverageChemical Intake
mg/kg/day
2.914E-04
O.OOOEtOO
1.086E-05
O.OOOEtOO
O.OOOEtOO
O.OOOEtOO
O.OOOEtOO
Excess
LifetimeCancer Risk
5E-04OEtOO3E-06OEtOOOEtOOOEtOOOEtOO
5E-04
3E-06
EXPOSURE ASSUMPTIONSExposure Setting ResidentialOaUy Water Intake (liters/day) 2Body Weight (kilograms) 70Number of days/week exposed 7Number of weeks/year exposed 52Number ol years exposed 70Lifetime Average Water Intake 0.029(liters/kg body wt./day)
(•) 8oufc«t ol C*nc«r Potency Faclort:IRIS - Integrated Htk IntormaUon Syitem. U.S. EPA 1988
HEAST - HMkh Eltecte AMMMMM Summmiy T»bl««—Quailwly Summaiy, US. EPA 19U.S. EPA- U.S. EPA 19t8«.

19-OCI-89 (Page 4 o( 7)
Table L-3
EXCESS LIFETIME CANCER RISK
GROUNDWATER INGESTION EXPOSURE
ONALASKA SITE
Chemical
ArsenicBenzeneODDMDichlorobenzene1,1-Dlchloroethane1.1-DfchloroetheneTrlchtoroethene
SUM OF RISKS
SUM of RISKS W/O As
U.S. EPACarcinogen
Classification
AA
B2B2CC
B2
CarcinogenicPotency Factor
(fcg-day/mg)
1.750.0290.24
0.0240.091
0.60.011
Source (a)
U.S. EPAIRISIRIS
HEASTHEAST
IRISIRIS
MW05S-01
Concentrationug/l
87
570
Lifetime AverageChemical Intake
mg/kg/day
2.286E-042.000E-04O.OOOE+00O.OOOE+001.629E-02O.OOOE+00O.OOOE+00
ExcessLifetime
Cancer Risk
4E-046E-06OE+00OE+001E-03OE+00OE+00
2E-03
1E-03
MW06M-01
Concentrationug/l
1.1
36
Lifetime AverageChemical Intake
mg/kg/day
3.143E-05O.OOOE+00O.OOOE+00O.OOOE+001.029E-03O.OOOEtOOO.OOOE+00
ExcessLifetime
Cancer Risk
5E-05OEtOOOE«00OE+009E-05OE»00OE+00
1E-04
9E-05
EXPOSURE ASSUMPTIONS
Exposure SettingDally Water Intake (liters/day)Body Weight (kilograms)Number of days/week exposedNumber of weeks/year exposedNumber of years exposedLifetime Average Water Intake(liters/kg body wt./day)
Residential2
707
5270
0.029
(a) Source* ot Cancer Potency Faclms:(HIS - Integrated Riik Information System. US EPA 1988.
HEAST - Health Eltecli AiMtunenl Summary Table*—Quarterly Summary. U.S. EPA 19US EPA-US EPA 19888

19-OCI-89 (Page 5 ol 7)
Table L-3EXCESS LIFETIME CANCER RISKGROUNDWATER INGESTION EXPOSUREONALASKA SITE
Chemical
ArsenicBenzeneODDMDtehlorabenzeneU-Dfcntoroethane1.1-Olcnloro«hen*Trlchloroelhene
SUM OF RISKS
SUM of RISKS W/O As
U.S. EPACarcinogen
Classification
AA
62B2CC
B2
CarcinogenicPotency Factor
(kg-day/mg) Source (a)
V75 U.S. EPA0.029 IRIS0.24 IRIS
0.024 HEAST0.091 HEAST
0.6 IRIS0.011 IRIS
MW07M-01Lifetime Average Excess
Concentration Chemical Intake Liletlmeug/l mg/kg/day Cancer Risk
3.3 9.429E-05 2E-04O.OOOE+00 OE+00o.oooE+oo OE+OOO.OOOE+00 OE+00O.OOOE+00 OE+00O.OOOEtOO OE+00O.OOOE+00 OE+00
2E-04
OE+00
MW08D-01Lllelime Average
Concentration Chemical Intakeug/l mg/kg/day
3.2 9.143E-05
O.OOOE+00
O.OOOE+00
O.OOOE+00
O.OOOE+00
O.OOOE+00
O.OOOE+00
Excess
LifetimeCancer Risk
2E-04OE+00OE+00OE+00OE+00OE+00OE+00
2E-04
OE+00
EXPOSURE ASSUMPTIONS
Exposure Setting ResidentialDaily Water Intake (liters/day) 2Body Weight (kilograms) 70Number ol days/week exposed 7Number ol weeks/year exposed 52Number ol years exposed 70Lifetime Average Water Intake 0.029(liters/kg body wt./day)
(a) Soufca* ol CancM Patency Factor.IRIS - Integrated Hi* Information System. U.S. EPA 10U.
HEAST - HMkh Elfecls AcMMnMni Summary Tabtoi—Quwwcly Summary. U.S. EPA 19U.S. EPA - U.S. EPA IflMa

19-Oct-89 (Page 6 ot 7)
Table L-3EXCESS LIFETIME CANCER RISKGROUNDWATER INGESTION EXPOSUREONALASKA SITE
U.S. EPACarcinogen
Chemical Classification
ArsenicBenzeneODDMDichlorobenzene1.1-Dichloroethane1.1-DtehkxoetheneTrlchtoroethene
SUM OF RISKS
SUM of RISKS W/O As
EXPOSURE ASSUMPTIONS
Exposure SellingDaily Water Intake (liters/day)Body Weight (kilograms)Number ol days/week exposedNumber ol weeks/year exposedNumber of years exposedLifetime Average Water Intake(liters/kg body wt./day)
AA
B2B2CC
B2
CarcinogenicPotency Factor
(kg-day/mg) Source (a)
1.75 U.S. EPA0.029 IRIS0.24 IRIS
0.024 HEAST0.091 HEAST
0.6 IRIS0.011 IRIS
Residential2
707
5270
0.029
MW09M-01Lifetime Average Excess
Concentration Chemical Intake Lltetimeug/l mg/kg/day Cancer Risk
5.3 1.514E-04 3E-04
O.OOOE+00 OE+00
O.OOOE+00 OE+00
O.OOOE+00 OE+00
O.OOOE+00 OE+00
O.OOOE+00 OE+00
O.OOOE+00 OE+00
3E-04
OE+00
MW11M-01Lifetime Average
Concentration Chemical Intakeug/l mg/kg/day
4.1 1.171E-04
O.OOOE+00
O.OOOE+00
O.OOOE+00
O.OOOE+00
O.OOOE+00
O.OOOE+00
ExcessLifetime
Cancer Risk
2E-04
OE+00
OE+00
OE+00
OE+00
OE+00
OE+00
2E-04
OE+00
(a) Sources ol Cancer Potency Factor*:IRIS - Integrated Risk Information System. U S EPA 1988
HEAST - Health Effects Assessment Summary Tables—Quarterly Summary. US EPA IBUS EPA - US EPA 1088a

19-OCI-89 (Page 7 ot 7)
Table L-3
EXCESS UFETIME CANCER RISK
GROUNDWATER INGESTION EXPOSURE
ONALASKA SITE
Chemical
ArsenicBenzeneODDMDichlorobenzene1,1-DfcMoroethane1.1-DteMoroetheneTrlchloroelhene
SUM OF RISKS
SUM of RISKS W/O As
U.S. EPACarcinogen
dasslftratlo*1
AA
B2B2CC
B2
CarcinogenicPotency Factor
(kg-day/mg) Source (a)
1.75 U.S. EPA0.029 IRIS0.24 IRIS
0.024 HEAST0.091 HEAST
0.6 IRIS0.011 IRIS
MW20S-01Lifetime Average Excess
Concentration Chemical Intake Lifetimeug/l mg/kg/day Cancer Risk
3.5 O.OOOE+00 OE+00O.OOOE+00 OE+00O.OOOE+00 OE+00O.OOOE+00 OE+00o.oooe*oo oe+ooO.OOOE+OO oe+ooO.OOOE+OO OE+OO
OE+00
OE+00
MW21S-01Lifetime Average
Concentration Chemical Intakeuo/l mo/ko/dav
O.OOOE+00O.OOOEtOOO.OOOEtOOo.oooe+oo
490 O.OOOEtOOO.OOOE+00O.OOOE+00
ExcessLifetime
Cancer Risk
OE+00OE+00OE+00OE+00OE+00OE+00OE+00
OE+00
OE+00
EXPOSURE ASSUMPTIONS
Exposure Setting ResidentialDally Water Intake (liters/day) 2Body Weight (kilograms) 70Number of days/week exposed 7Number of weeks/year exposed 52Number ot years exposed 70Lifetime Average Water Intake 0.029(Utera/kgbodywt./day)
(•) Same** o4 Canc«f Potency Factcxv.IMS - Integrated Rlik bitornuuion SyMvin. U.S. EPA 19M.
HEAST - HMkh Eltocl* AMSSMIMM Summwy Tcbtat—Quarterly Summary. U.S. EPA 19U.S. EPA - U.S. EPA tetta.

17-occ-se (Page 1 ol U)
Table L-4COMPARISON OF ESTIMATED DAILY INTAKETO REFERENCE DOSE (RID)WATER INGESTION EXPOSURE
Chemical
BariumBenzole acidgamma BHC (lindane)bi*(2-ethylhexyl)phlhalale
CadmiumChromium VICopper1.1-Dtchloroelhana1.1-OichloroetheneElhyU>enzen*>LeadManganese2-Melhylpheoal4 MethytpheoolNaphthaleneNickelPhenolToluene1.1.1-TrichloroalhaneVanadiumXytenetZinc
Hazard Index (Sum ol DURfO)
EXPOSURE ASSUMPTIONS
Exposure SettingExposed IndividualWater Intake (liters/day)Body Weight (kilograms)
ReferenceDo*. (HO)mg/kg/day
0.054
0.0003002
000050.005003700000.000
0.10.0014
0.22
0.50.504
0.02
00403
0000.007
202
ResidentialAdult
270
Source (a)
IRISIRISIRISIRIS
HEASTIRIS
HEASTIRISIRISIRIS
HEASTHEAST
IRISIRIS
HEAST
(b)IRISIRISIRIS
HEASTIRIS
HEAST
MW02S-01Concentration
ug/l
352—
———
24883——
57.0
1340
—
—278
——
—
8.1—
408
Daily Intake
(DOmg/kg/day
00101000000000000000000000000700002000000.00000.00010.00020.03830.00000.00000.0000000080.0000000000000000002000000.0014
Intake Exceed*DI/RID Reference Dose?
0201 NO0000 NO0000 NO0000 NO0000 NO0142 NO0.000 NO0.000 NO0.000 NO0001 NO
0.1 55 NO0.174 NO0.000 NO0.000 NO0.000 NO0.040 NO0000 NO0.000 NO0.000 NO0033 NO0000 NO0.007 NO
0760
MW02M-01 Daily Intake
Concentration (Dl)ug/l mg/kg/day
1300 00307— 00000
0.00000000000000
— 00000— 00000
000000.0000
— 0.00008.1 0.0002072 0.0278
— 0.0000n Afifln— v.ww
— 0.00007.4 0.0002— 00000— 00000— 0.0000— 0.0000
0000058.4 0.0017
DI/RID
079400000000000000000000000000000.00000000 105
0 1200.0000.0000.0000011
000000000000000000000008
1 105
Intake Exceed*Reference Dose?
NONONONONONONONONONONONONONONONONONONONONONO
(a) Source* ol RIDt:IRIS - Integrated Rl*k Information System
U.S. EPA 1088.HEAST - Health Effects Assessment SummaryTables - Quarterly Summary. US EPA 1980.
(b) Nickel value bate on nickel-soluble sails

17-Oct-M (Pag«2of 11)
TabtoL-4COMPARISON OF ESTIMATED DAILY INTAKE
TO REFERENCE DOSE (BID)
WATER MQESTON EXPOSURE
Ct::r — '
BariumBwuotoMtdgamma BHC(Mndan«)
CadmiumChroMkMVICopperM-OteMoroMhan*1.1-OfcMoroatiMMEttiyttMnnneLeadUenganewS^Uettivfarfund
1 UattylnfienotNaphthalene
NlelMlPhenolToluene1.1.1-TrtcMoroMhanoVanadlUM
XyteneeZme
Hazard Index (Sum of DI/RID)
EXPOSURE ASSUMPTIONS
Expoeur* SettingExpoMd IndividualWater Intake (mart/day)Body Weight (kHograme)
(a) Source* o4 RC»:
ntlamiui
DOM (RB|•gfcjMay Sourca (a)
O.OC IRIS4 IRIS
0.0003 IRISA ra insV.WC Irllo
0.0006 HEAST0.006 IRIS0.037 HEAST0.000 IRIS0.000 IRIS
O.t IRIS0.0014 HEAST
022 HEAST0.6 IRISOS IRIS0.4 HEAST
0.02 (b)0.04 IRIS0.3 IRIS
0.00 IRIS0.007 HEAST
2 IRIS0.2 HEAST
RMidanttalAdutt
270
MW02D-01 DaHylnUka
Concantoalion (CM)ugM mgftgMay
162 0.0043— 0.0000— 0.0000
00000— 0.0000— 0.0000•.1 0.0002— 0.0000— 0.00002 0.0001
— 0.00001100 0.0340
— 0.0000— 0.0000— 0.0000
6.4 0.0002— 0.0000— 0.0000— 0.0000— 0.0000— 0.0000
0.0 0.0003
OVRD
0.0(7
0.0000.0000.0000.0000.000oooe0.0000.0000.0010.0000.1660.0000.0000.000000«
0.0000.0000.0000.0000.0000.001
0.267
MakaExc«ad(n«toranca Poaa?
NONONONO
NONONONONONONONONONONONONONONONONONO
MW03S-01Comwnlratkm
ug*60323
—
——
—100
16210
—3720
6004
6«10.0
6•3002403.4
230010.0
DaMy Intake
(DOmg/kgAday
0.01600.00070.0000
0.00000.00000.00000.00640.00040.00000.00000.10030.00100.00100.00160.00000.00020.23710.00600.00010.06570.0003
Dime0.3300.0000.0000.0000.00000000.0000.0030.0400.0600.0000.4*30.0030.0040.0040.0200.0040.7000.0700.0140.0330.002
2.401
Intafca Exoawte
nalatamiaDoaaT
NONONONOtw
NO
NO
NONONONONONONONONONONONO
NONONONO
IRIS - Integral** Mek Information Syetem.U.S. EPA 10M.
HEAST - Health ENaoU Auatam•nlSummarvTabtoa - Quarterly Summary. U.S. EPA 1000.
(b) Nickel value baaa on rOck«l-«olu6U MM*.

17-OCI-89 (Page 3 of II)
Table L-4COMPARISON OF ESTIMATED DAILY INTAKETO REFERENCE DOSE (RID)WATER INGESHON EXPOSURE
Chemical
BariumBenzoic acidgamma BHC (lindane)bie(2-ethylhexyl>phthalal«CadmiumChromium VICopper1.1-Dichloroethane1.1-OicWoroetheneEthylbenzeneLeadManganese2-«4e«hylphenol
NaphthaleneNickalPhenolToluene1.1.1-TrichloroelhaneVanadiumXylenes
Zinc
Hazard Index (Sum ol Di/RID)
EXPOSURE ASSUMPTIONS
Exposure SellingExposed IndividualWater Intake (liters/day)Body Weight (kilograms)
ReferenceDoee(RO)mg/kg/day Source (a)
005 IRIS4 IRIS
0.0003 IRIS002 IRIS
00005 HEAST0005 IRIS0037 HEAST0009 IRIS0.009 IRIS
0.1 IRIS0.0014 HEAST
0.22 HEAST0.5 IRIS0 5 IRIS04 HEAST
0.02 (b)004 IRIS03 IRIS
0.09 IRIS0007 HEAST
2 IRIS02 HEAST
ResidentialAdult
270
MW03M-01 Daily IntakeConcentration (Ol)
ug/l mg/kg/day
2760 0.07890.0000
— 0000000000000000.0000
— 0.00000.0000000000000000000
1200 0.0300— 0.0000
0 0000— 0.000083 0.0002— 00000
00000000000.000000000
14.4 00004
Intake ExceedsDI/RtD Reference Dose?
1577 YES0000 NO0000 NO0000 NO0000 NO0.000 NO0.000 NO0.000 NO0.000 NO0.000 NO0.000 NO0.164 NO0.000 NO0 000 NO0.000 NO0.009 NO0000 NO0000 NO0000 NO0000 NO0000 NO0.002 NO
1 752
MW04S-01 Daily IntakeConcentration (Dl)
ug/l mg/kg/day
401 00115000000000000000000000000000000000000.0000
42 000120.0000
3320 0.08490.00000 0000
23 0.00070.00000.0000
530 0.01510.00000.00000.0000
15.1 0.0004
DI/RID
0229000000000000000000000.00000000.00000120.0000.4310.0000 0000.0020.0000.00000500.000000000000002
0727
Intake ExceedsReference Does?
NONO
NO
NO
NO
NO
NO
NO
NO
NO
NO
NO
NONO
NO
NO
NO
NO
NO
NO
NO
NO
(a) Sources of RID*.IRIS - Integrated Risk Information System.
US EPA 1988.HEAST - Health Effects Assessment SummaryTables - Quarterly Summary. U.S. EPA 1989
(b) Nickel value base on nickel-soluble salts

17-Oct-M (Page 4 ol It)
Table L-4COMPARISON OF ESTIMATED DAILY INTAKE
TO REFERENCE DOSE (RID)
WATER INQESTION EXPOSURE
fluarinal
BariumBaruoioaddOMMMBHC(lindana)Map-atnymaxyQpMtalalaCadmiumChromtumVICoppar
EtnytbanianaLaadManpaima2-Uattiylphanal« UiatiylphanolNapMhatonaNtakalPhanolTokMna1.1.1-TriohloroaltianaVanadiumXytanaaZbw
Hazard Index (Sum of DVFWD)
EXPOSURE ASSUMPTIONS
Expoaura SattingExpoaad IndividualWalar Inlaka (Watt/day)Body MMght (kilogram*)
flalaranfnOoaa(MD)mgfcgMay
0.064
0.0003
0.02
0.0006
0.006
0.037A AAOU.UUVA AAOU.UUV
0.1
0.0014
0.22
0.6
0.6
0.4
0.02
0.04
0.3
0.09
0.007
2
0.2
RaatdanUal
AduM
270
Souroa (a)
IRISIRISIRISIRIS
HEASTIRIS
HEASTICUfiiruoICUfiini9IRIS
HEASTHEAST
IRISIRIS
HEAST(b)
IRISIRISIRIS
HEASTIRIS
HEAST
MW05S-01Concantrauon
>**34771————
K7AOf U
140
—
4690
66
110
47
8.6
—6300
—
—1400
31.6
Daily Inlaka(DQ
mgftgMay
0.00990.00200.00000.0000
0.0000
0.0000
0.0000A A ML?U.UHM
A AAAAU.UWU
0.00440.00000.19690.00170.00310.00130.00030.00000.23710.00000.00000.04000.0009
Inlaka Excaad*OUfVD Rataranca Doaa?
0.198 NO0.001 NO0.000 NO0.000 NO0000 NO0.000 NO0.000 NOi aia VPR1 .• Ill 1 CO
0.046 NO
0.000 NO
0.696 NO
0.003 NO
0.004 NO
0.003 NO
0.013 NO
0.000 NO
0.790 NO
0.000 NO
0.000 NO
0.020 NO
0.006 NO
3.789
MW06M-01 Daily mukaConcaMratton (DO
uo*. mgrkgMay
1370 0.0391
— 0.0000
— 0.0000
— 0.0000
— 0.0000
— 0.0000
— 0.0000
M A AA1AW.IMf 1W
A AAAA~~ V.IMUMI
— 0.0000
— 0.0000
4600 0.1266
— 0.0000
— 0.0000
— 0.0000
. 6.1 0.0002
— 0.0000
— 0.0000
— 0.0000
— 0.0000
— 0.0000
6.7 0.0002
DVRD
0.783
0.000
0.000
0.000
0.000
0.000
0.000A | «.«If. 1 !•*
A AAAu.uvw
0.000
0.000
0.664
0.000
0.000
0.000
0.012
0.000
0.000
0.000
0.000
0.000
0.001
1.494
Inlaka ExoaadaRatoranoaDoaa?
NO
NO
NO
NO
NO
NO
NOMOI \J
MOmj
NO
NO
NO
NO
NO
NO
NO
NO
NO
NO
NO
NO
NO
(a) SourcaaolRDa:IRIS - Magralad Rlak Information Sydam.
U.S. EPA 1966.HEAST - Haatth Eflaclt AMaMmant Summary
TaMaa - Quartarly Summary. U.S. EPA 1989.
(b) Nlckal valua bata on nlckal-aolubla *alu.

17-Oct-BO (Pagu 5 oil I)
Table L-4COMPARISON OF ESTIMATED DAILY INTAKETO REFERENCE DOSE (RID)WATER INGESTION EXPOSURE
Chemical
BariumBenzole acidgamma BHC (lindane)blat2-«lhvlhexyl)phtnalaieCadmiumChromium VICopper1.1-Otehloroelhane1.1-OtchloroetheneElhytbenzeneLead
Manganeae2-UethylphenolJ if AfhulrhtiaWkrJ
NaphthaleneNickelPhenolToluene1.1,1-TricMoroelhaneVanadiumXylenetZinc
Hazard Index (Sum ol DI/RID)
EXPOSURE ASSUMPTIONS
Expoeure SettingExpoted IndividualWater Intake (liters/day)Body Weight (kilogram*)
Reference
Doee(M»mg/kgMay Source (a)
0.06 IRIS4 IRIS
00003 IRIS002 IRIS
00005 HEAST0005 IRIS0037 HEASTOOOO IRISOOOO IRIS
O.t IRIS0.0014 HEAST
022 HEAST0.6 IRISn c IRIfi
04 HEAST002 (b)004 IRIS03 IRIS
000 IRIS0007 HEAST
2 IRIS0.2 HEAST
ResidentialAdult
270
MW07M-01 Daily IntakeConcentration (Dl)
ug/l mg/kg/day
235 000670000000000000000000000000000000.0000000000.000000000
718 0.02050.00000 OOOO
— 0.0000000000.00000.00000.0000000000.0000
144 00004
DI/RID
0 134OOOO0.000OOOOOOOOOOOOOOOOOOOOOOOOOOOO0.0000.0030.0000 000OOOO0.000OOOOOOOOOOOOOOOOOOOO0.002
0230
MW08S-01Intake Exceeda Concentration
Reference Doee? | ug/l
NONONONONONONONONONO .NONONOIJDNONONONONONONONO
145—
————62
——
—2V
5600—
—100
—————
202
Daily Intake(Dl)
mg/kg/day
000410000000000000000000000000000020000000000000000.00010.16260.0000n nonn
0.00000.00060.0000000000.000000000000000.0006
DI/RID Fta
0083OOOOOOOO0.000OOOOOOOO0005OOOO
OOOO
OOOO
00550.7300.0000 0000.0000.0280.000OOOOOOOO0.000OOOO0.003
0013
ferenceDoae?
NONONONO
NONONONONONONONONONONONONONONONONONO
(a) Sources ol RIDt:IRIS - Integrated Rltk Information System.
U.S. EPA 1088.HEAST - Health Effect* A«wument SummaryTable* - Quarterly Summary US EPA 1089
(b) Nickel value ba*e on nickel-ioluble tails

i7-oci-80 (Page 6 oil I)
Table L-4COMPARISON OF ESTIMATED DAILY INTAKE
TO REFERENCE DOSE (RID)
WATER INGESTION EXPOSURE
Chamlcal
BariumnaWTfair mriti
gamma BHCdindana)bis(2-amylhaxyl)pfiirialaiaCadmiumChromium VICoppar1.1-Okshloroalhana1.1-OicMoroathanaElhylbanzanaLeadUangamaa2-Mathylphanol4-MathylphanolNaphlhalanaNickalPhanolToluanat.M-TricMoroalhaneVanadiumXytonaaZinc
Hazard Index (Sum oi Dt/RID)
EXPOSURE ASSUMPTIONS
Expoaura SaltingExpoaad IndividualWalar Inlaka (Mara/day)Body Waighl (kilograms)
HalaranoaDoaa(MD)«t*gMay Sourca (a)
0.05 IRIS4 IRIS
0.0003 IRIS0.02 IRIS
0.0005 HEAST0.006 IRIS0.037 HEAST0.000 IRIS0.000 IRIS
01 IRIS0.0014 HEAST
022 HEAST05 IRIS05 IRIS04 HEAST
0.02 (b)0.04 IRIS0.3 IRIS
0.00 IRIS0.007 HEAST
2 IRIS0.2 HEAST
ResidentialAdull
270
MW08M-01 Daily InlakaConcentration (01)
ugfl mg/kgMay
000 0.01710 0000
— 00000
— 0.0000
— 0.0000
— 0.0000
— 0.0000
— 0.0000
— 0.0000
— 0.0000
— 0.0000
3000 0.0874
— 0.0000
— 0.0000
— 0.0000
8.7 0.0002
— 0.0000
— 0.0000
— 0.0000
0.0000
— 00000
13.8 0.0004
Inlaka ExceedsDI/FUD Ralaranca Ooaa?
0.343 NOo ooo NO0.000 NO0.000 NO0.000 NO0.000 NO0.000 NO0.000 NO0.000 NO0.000 NO0.000 NO0.307 NO0000 NO0.000 NO0000 NO0.012 NO0.000 NO0.000 NO0.000 NO0.000 NO0.000 NO0.002 NO
0.755
MW08D-01 Daily InlakaConcentration (Dl)
ugA mg/kgMay
882 00025— — O OOAQ
— 00000
— 0.0000
0.0000
— 0.0000
0.0000
— 0.0000
— 0.0000
— 0.0000
— 0.0000
2530 0.0723
— 0.0000
— 0.0000
— 0.0000
5.1 0.0001
— 0.0000
— 0.0000
— 0.0000
— 0.0000
0.0000
0 0.0003
Dime0050Q uuu
00000.00000000000000000000.0000.0000.0000.32000000.0000.00000070.000000000000.0000.0000.001
0.388
Inlaka Exceeds
NOM£l
NONONONONONONONONONONONONONONONONONONONO
(I) Sourcaa oi RIDa:IRIS - Inlagralad Riak Intormalion Syslam.
U.S. EPA 1088.HEAST - Haahh EliacU Asaatamant SummaryTab)** - Quarterly Summary. U.S. EPA 1089.
(b) Nickel value baaa on nickal-aolubla »alu.

17-OCI-89 (Page 7 of 11)
Table L-4COMPARISON OF ESTIMATED DAILY INTAKETO REFERENCE DOSE (RID)WATER INGESHON EXPOSURE
Chamical
BariumBanzotc acidgamma BHC (llndane)Ma(2-atttylh«xyl)phlhalai.aCadmiumChromium VICoppar1.1-Otchloroethane1.1-CNcMaroalhanaElhyttMnzan*LMdManganaaa2-Mattiylfihanol
NaphlhalanaNtekalPhanolToluana1.1 ,1-TrichloroBlhanaVanadiumXytonaaZinc
Hazard Index (Sum ol Dt/RID)
EXPOSURE ASSUMPTIONS
Expo*ur« SettingExpoaad IndividualWater Intake (HIM (/day)
Body Weight (kilogram*)
RatorancaDoaa(RD)
mgAgMay Source (a)
0.05 IRIS4 IRIS
0.0003 IRIS0.02 IRIS
0.0005 HEAST0005 IRIS0037 HEAST0.000 IRIS0.009 IRIS
0.1 IRIS00014 HEAST
022 HEAST0.5 IRISA ft IRISU.D Ifll9
0.4 HEAST0.02 (b)0.04 IRIS0.3 IRIS
009 IRIS0.007 HEAST
2 IRIS0.2 HEAST
ResidentialAdult
270
MW09M-01 Daily IntakeConcentration (01)
ugfl mg/kgMay
122 0.0035— 00000— 00000— 00000— 00000— 00000— 0.0000— 0.0000— 0.0000— 0.0000— 0.0000
991 0.0283— 0.0000
A fWWVl~~ w.uw/v— 0.0000— 0.0000— 0.0000
0.00000000000000
— 0000081 00002
Inlaka Exc«ed*OI/RID Rateranc* DOM?
0070 NO0.000 NO0000 NO0.000 NO0000 NO0.000 NO0.000 NO0.000 NO0.000 NO0.000 NO0.000 NO0.129 NO0.000 NOn AAA kinv.ww nv0.000 NO0.000 NO0.000 NO0000 NO0.000 NO0.000 NO0.000 NO0.001 NO
0.199
MW10M-01 Daily InlmkaConcanliaUon (Dl)
ug» mg/kg/day
141 00040— 0.0000
0.0000— 0.0000
00000— 0.0000
0.0000— 0.0000— 0.0000
00000— 0.0000
2780 0.0794— 0.0000
(\ nfiAA~™ U. ^HAJ
— 0.00009.2 0.0003— 0.0000— 00000— 00000— 0.0000— 00000
10.1 0.0003
DI/RID
0081000000000.0000.00000000.00000000.0000.00000000.3610.000A AAOU.MM
0.0000.0130.0000.00000000.0000.0000001
0450
InUka ExoMd*Ratxanca Doaa?
NONONONONONONONONONONONONOurinvjNONONONO
NONO
NONO
(a) Sourca* ol HIO»:IRIS - Integrated Rltk Information System
U.S. EPA 1988.HEAST - HaaNh EHactt AtMttmanl SummaryTabUt - Quarterly Summary. U.S EPA 1989.
(b) Nickel value bate on nickel-soluble salt*.

17-Oct-Bfl (Page 8 ot 11)
Tablet L-4COMPARISON OF ESTIMATED DAILY INTAKETO REFERENCE DOSE (RID)WATER INGESTION EXPOSURE
Ctijjijlral
BariumBafuateacidgamma BHCdlndan*)Mat2-«Niylri«xyt)f>hlhalal*CadmiumChromium VICopparM-OtoMoroMhaiM1 , 1 -OfcMOroathan*
EUtylbanMn*UodMangan***2-Mattiylph*nol4-MattiylprtanolNaphtrtaton*Nick*!PtwnalTohMM1.1.1-TricMQNMthan*VanadiumXylMWflBoo
Hazard Index (Sum ot CM/RID)
EXPOSURE ASSUMPTIONS
Expocur* SttlingEapoMil IndividualWalar Inlak* (lilait/day)Body WaiglM (kllogramt)
R**M*nO»
DoaalMDi•M^W fV^Vf
ajflftflMay Some* (a)
0.06 IRIS4 IRIS
0.0003 IRIS0.02 IRIS
O.OOOS HEAST0.006 IRIS0.037 HEAST0.009 IRIS0.009 IRIS
0.1 IRIS0.0014 HEAST
0.22 HEAST0.6 IRIS0.6 IRIS0.4 HEAST
0.02 (b)0.04 IRIS0.3 IRIS
0.09 IRIS0.007 HEAST
2 IRIS0.2 HEAST
R*tid*nlialAdult
270
MW11M-01 Daily Inlak*Conoanlralioii (Dl)
ugfl ring/kg/day
143 0.0041— 00000— 00000
— 0.0000
— 00000
0.0000
— 0.0000
— 0.0000
— 0.0000
— 0.0000
— 0.0000
1040 00297
— 0.0000
— 0.0000
— 0.0000
— 0.0000
— 0.0000
— 0.0000
— 0.0000
— 0.0000
0.0000
14.2 0.0004
1
Intakt ExcwdliDI/RID RaJaranc* DOM?
0082 NO
0.000 NO
0.000 NO
0.000 NO
0.000 NO
0.000 NO
0.000 NO
0.000 NO
0.000 NO
0.000 NO
0.000 NO
0.135 NO
0.000 NO
0.000 NO
0.000 NO
0.000 NO
0.1900 NO
0.000 NO
0.000 NO
0.000 NO
0.000 NO
0.002 NO
0.219
MW12S-01 Daily Inuk.Concentration (Dl)
uo* moAa/day
114.9 0.0004
— 0.0000
— 00000
— 0.0000
— 0.0000
— 0.0000
— 0.0000
— 0.0000
— 0.0000
— 0.0000
— 0.0000
7.6 0.0002
— 0.0000
— 0.0000
0.0000
— 0.0000
— 0.0000
— 00000
— 0.0000
— 0.0000
— 0,0000
9.6 0.0003
Dime0.009
0000
0000
0.000
0.000
0.000
0.000
0.000
0.000
0.000
0.000
0.001
0.000
0.000
0.000
0.000
0.000
0.000
0.000
0.000
0.000
0.001
0011
Inlak* ExcMd*fill! ttUM'M t^tmmf
NO
NONONONONONONONONONONONO
NO
NO
NO
NO
NO
NO
NO
NO
NO
(a) SourcM ot RIDrIRIS - lntogral*d Ri*k Inlormalion System
U.S. EPA 19M.HEAST - H*alth Eltectt A«**Mm*nt SummaryTablni - Quarterly Summary U.S. EPA 19B9
(b) Nick*l valu* bat* on nick*l-«olubl* Mil*.

17-Oct-89 (Pagedol II)
Table L-4COMPARISON OF ESTIMATED DAILY INTAKETO REFERENCE DOSE (RID)WATER INGESTION EXPOSURE
Chemical
Barium
Benzole acidgamma BHC (lindane)bi*(2-elhylhexyl)phlhaialeCadmiumChromium VICopperI.l-Dlchkxoethane1.1-OtChkxoelhene
EttiylbenzeneLeadManganeae2-Methyiphenot4-MelhylphenolNaphthaleneNickelPhenolToluene1.1.1-TrlchkwoelhaneVanadiumXytonMZinc
Hazard Index (Sum oi DI/RID)
RMMMKMDoe*(RC>)
•toAeMay
0.054
0.0003002
0000500050.03700090.009
0.1
0.00140.2205
OS
0.4
0.020.040.3
o.oa0.007
2
02
Source (a)
IRISIRISIRISIRIS
HEASTIRIS
HEASTIRISIRISIRIS
HEASTHEAST
IRISIRIS
HEAST
(t>)
IRISIRISIRIS
HEASTIRIS
HEAST
MW13S-01ConcMMralkm
"0/1
113
—
—
—
—
—
—
—
—
—
—
19.1—
—
—
—
—
—
—
—
—
58
Daily Intake
(01)moAg/day
0.0003000000.00000.00000.00000.00000.00000.00000.00000.00000.00000.00060.00000.00000.00000.0000000000.0000000000.0000000000.0002
DI/RID
0006000000000.000000000000.0000.0000.00000000.0000.002.0.0000.0000.0000.0000.000000000000.0000.0000.001
0.010
Intake Exceed*Helerence DOM?
NONONONONONONONONONONONONONONONONONONONONONO
MW14S-01Concentration
ug/l
134
—
--
—
—
—
—
——
—
—
952
—
—
—
—
——
—
—
—
5.8
DaMy Intake
(DOmgVkg/day
000380.00000000000000000000.00000.00000.00000.00000.00000.00000.02720.00000.00000.00000.0000000000.000000000000000000000002
Dl/RJD
007700000.0000000000000000.0000.0000.0000.0000.0000.1240.0000.0000.0000000000000000000000000000001
0201
Intake Exceed*Reference Doe* 7
NONO
NO
NO
NO
NO
NO
NO
NO
NO
NO
NO
NO
NO
NO
NO
NO
NO
NO
NO
NO
NO
EXPOSURE ASSUMPTIONS
Exposure Setting ResidentialExpoeed Individual AdullWater Intake (liters/day) 2Body Weight (kilogram*) 70
(a) Source* ot RID*:IRIS - Integrated Riik Information System
US. EPA 1988.HEAST - Health EHecl* As*e*smenl SummaryTable* - Quarterly Summary U S EPA 1989
(b) Nickel value bate on nickel-soluble salli

17-Oc«-89 (Page 10olU)
Table L-4COMPARISON OF ESTIMATED DAILY INTAKETO REFERENCE DOSE (RID)WATER INQESTION EXPOSURE
Chemical
BariumBenzole addgamma BHC Qindane)bM2 ythexyl)phUMualaCadmiumChromium VICopper1.1-OtcMoroethane1.1-DteMoroetheneEttiytbenzene
LeadManganese2-Methytphenol1 MsthylphenolNaphthalene
NickelPhenolToluene1.1.1-TftchloroethaneVanadiumXytanesZno
Hazard Index (Sum of Dt/RfD)
EXPOSURE ASSUMPTIONS
Exposure SellingExpoeed IndividualWalar Intake (Wart/day)Body Waighl (kilograms)
Reference)Doaa(MD)•OftgMay Sourca (a)
0.05 IRIS4 IRIS
0.0003 IRIS0.02 IRIS
0.0005 HEAST0006 IRIS0.037 HEAST0009 IRISO.OM IRIS
0.1 IRIS0.0014 HEAST
0.22 HEAST0.5 IRISO.S IRIS0.4 HEAST
0.02 (b)0.04 IRIS0.3 IRIS
0.09 IRIS0.007 HEAST
2 IRIS0.2 HEAST
ResidentialAdult
270
MW20S-01 Daily InUkaConcentration (Ol)
uoyi mg/kg/day
1280 0.03M— 0.0000— 0.0000— 00000— 0.0000— 0.0000— 0.0000— 0.0000— 0.0000— 0.0000
2 0.00017710 0.2203
— 0.0000— 0.0000— 0.00005.6 0.0002
— 0.0000— 0.0000— 0.0000— 00000
491 0.0140
Intake ExcaadtOUfVD Reference Does?
0.731 NO0.000 NO0.000 NO0.000 NO0000 NO0.000 NO0.000 NO0.000 NO0.000 NO0.000 NO0.041 NO1.001 YES0.000 NO0.000 NO0.000 NOO.OM NO
0.000 NO0.000 NO0.000 NO0.000 NO0.007 NO
1.7*9
.
MW20O-01 Daily Intake
Concentration <DQugA mg/kgMay
24.8 0.0007— 0.0000— 0.0000— 0.0000
0 0000
— 0 0000— 0.0000— — 0 0000— 0.0000— 0.0000— 0.0000
100 0.0029— 0.0000
o nAAA~™ V.IMHW
— 0.0000— 0.0000
0.0000— 0.0000— 0.0000— 0.0000— 0.0000
Dime0.014000000000.0000.0000.0000.0000.0000.0000.0000.0000.0130.0000.0000.0000.000
0.0000.0000.0000.0000.000
0.027
Intake ExceedaRalaranca Onaa?
NONONONONONONONONONONONONONONONO
NONONONONO
(a) Source* ol RIDt:IRIS - Integrated Rlak Information System.
U.S. EPA 1988.HEAST - Health Effects AaMiemenl SummaryTablet - Quarterly Summary. U.S. EPA 1989.
(b) Nickel value base on nlckel-aoluble Hit*.

17-OCI-89 (Paga 11 ol 11)
Table L-4COMPARISON OF ESTIMATED DAILY INTAKE
TO REFERENCE DOSE (RID)
WATER INGESTION EXPOSURE
Chemical
Barium
Benzoic acid
gamma BHC (lindane)
blt(2-elhyllMxyl)pnlf)alate
Cadmium
Chromium VI
Copper
1.1-Dlchloroe4hane
1.1-Dtehloroe4lMneEthylbenzene
LeadManganese
S-MMhylphwial4-Melhytphenol
NaphthaleneNickel
Phenol
Toluene
1.1.1-TtlchlofoethaneVanadium
Zinc
Hazard Index (Sum ol CM/HID)
DoM(MD)
moW*,
0.06
4
0.0003
0.02
00005
0006
0.037
O.OM
000ft
0.1
0.0014
0.22
O.S
OS
0.4
0.02
004
03
o.oa0.007
2
02
Source (a)
IRIS
IRIS
IRIS
IRIS
HEAST
IRIS
HEAST
IRIS
IRIS
IRIS
HEAST
HEAST
IRIS
IRIS
HEAST
(b)IRIS
IRIS
IRIS
HEAST
IRIS
HEAST
MW21S-01
Concentration
ug/l
201
490
3220
13.4
Daily Intake
(Dl)ing/kg/day
00057
00000
00000
0.0000
00000
00000
00000
00140
00000
0.0000
00000
0.0920
0.0000
0.0000
0.0000
0.0004
00000
00000
0.0000
0.0000
0.0000
DI/RD
0 115
0.000
0000
0.000
0000
0.000
0.000
1.556
0.000
0.000
0.000
0418
0.000
0.000
0.000
0.019
0.000
0000
0000
0000
0.000
2.108
Intake Exceed*
Helxence Doee?
NO
NO
NO
NO
NO
NO
NO
YES
NO
NO
NO
NO
NO
NO
NO
NO
NO
NO
NO
NO
NO
EXPOSURE ASSUMPTIONS
Exposure Selling Residential
ExpoMd Individual Adult
Water Intake (litert/day) 2
Body Weight (kilograms) 70
(a) Sources ol RIDr.
IRIS - Integrated Risk Information System.
U.S. EPA 198*.HEAST - Health Effect* Assessment Summary
Tables - Quarterly Summary US EPA 1989
(b) Nickel value base on nickel-soluble salts

19-OCI-89 (Page 1 ol 7)
Table L-5
EXCESS LIFETIME CANCER RISK
GROUNDWATER DERMAL ABSORPTION EXPOSURE
ONALASKA SITE
Chemical
ArsenicBenzeneDOO1.4 Dichkxobenzene1.1-Dtchloroethane1.1-OfchloroetheneTrlchloroethene
SUM OF RISKS
SUM of RISKS W/O As
U.S. EPACarcinogen
Classification
AA
B2B2CC
B2
CarcinogenicPotency Factor
(kg-day/mg) Source (a)
1.75 U.S. EPA0.029 IRIS0.24 IRIS
0.024 HEAST0.091 HEAST
0.6 IRIS0.011 IRIS
MW02D-01Lifetime Average Excess
Concentration Chemical Intake Lifetimeug/l mg/kg/day Cancer Risk
2.4 5.786E-08 1E-07O.OOOE+00 OE+00O.OOOE+00 OE+00O.OOOE+00 OE+00O.OOOE+00 OE+00O.OOOE+00 OE+00O.OOOE+00 OE+00
1E-07
OE+00
MW02M-01Lifetime Average
Concentration Chemical Intakeug/l mg/kg/day
19.4 4.677E-07O.OOOE+00O.OOOE+00O.OOOE+00O.OOOE+00O.OOOE+00O.OOOE+00
ExcessLifetime
Cancer Risk
8E-07OE+00OE+00OE+00OE+00OE+00OE+00
8E-07
OE+00
EXPOSURE ASSUMPTIONS
Exposure Setting ResidentialWater Absorption Rate (mg/cm2/hr) 0.5Body Weight (kilograms) 70Surface area (cm2) 18000Percent submerged 0.75Time in water (hr) 0.25Number ol days/week exposed 7Number ol weeks/year exposed 52Number ol years exposed 75Years In lifetime 75Lifetime Average Water Intake 0.00002(liters/kg body wt./day)
(•) SOUICM ot C«nc*r Potency FacloirIRIS- bu*gi«l«d Rirt Inkwmalion System. US EPA 1MB.
HEAST - H«ahh Effect* AiMtwwnt Summaiy Tablci. U.S. EPA 1089U.S. EPA -U.S. EPA 10U*

19-Oct-89 (Page 2 ol 7)
Table L-5
EXCESS LIFETIME CANCER RISK
GROUNDWATER DERMAL ABSORPTION EXPOSURE
ONALASKA SITE
U.S. EPACarcinogen
Chemical Classification
ArsenicBenzeneODD1.4Oichlorobenzene1.1-Dichloroethane1.1-DtehloroetheneTrichkwoethene
SUM OF RISKSSUM of RISKS W/O As
EXPOSURE ASSUMPTIONS
Exposure Setting
AA
B2B2CC
B2
Water Absorption Rate (mg/cm2/hr)Body Weight (kilograms)Surface area (cm2)Percent submergedTime In water (hr)Number of days/week exposedNumber of weeks/year exposedNumber of years exposedYears in lifetimeLifetime Average Water Intake(liters/kg body wt./day)
CarcinogenicPotency Factor
(kg-day/mg) Source (a)
1.75 U.S. EPA0.029 IRIS
0.24 IRIS0.024 HEAST0.091 HEAST
0.6 IRIS0.011 IRIS
Residential0.570
180000.750.25
7527575
0.00002
MW02S-01Lifetime Average Excess
Concentration Chemical intake Liletimeug/l mg/kg/day Cancer Risk
9.5 2.290E-07 4E-075 1.205E-07 3E-09
O.OOOE+00 OE+002 4.821E-08 1E-09
O.OOOE+00 OE+00O.OOOE*00 OE+00O.OOOEtOO OE»00
4E-07
5E-09
MW03S-01Lifetime Average
Concentration Chemical Intakeug/l mg/kg/day
19.4 4.677E-0713 3.134E-07
O.OOOEtOOO.OOOEtOO
190 4.580E-0615 3.616E-0711 2.652E-07
ExcessLifetime
Cancer Risk
8E-079E-09OE*00OE+004E-072E-073E-09
1E-06
6E-07
(a) Sources ol Cancer Potency Faclof«:IRIS - lnl»gralad Riik Inlotmalion SyMem. US EPA 1088
HEAST - Health Eltoclt A*wttm«nl Summaiy Tablai. US EPA 1989U.S. EPA-US. EPA1088a.

19-OCI-89 (Page 3 ol 7)
Table L-5
EXCESS LIFETIME CANCER RISKGROUNDWATER DERMAL ABSORPTION EXPOSUREONALASKA SITE
U.S. EPACarcinogen
Chemical Classification
Arsenic ABenzene AODD B21 .4 Otehtorobenzene B21.1-Dichlofoethane C1.1-Dfchloroethene CTrlchloroethene B2
SUM OF RISKS
SUM of RISKS W/O As
EXPOSURE ASSUMPTIONS
Exposure SettingWater Absorption Rale (mg/cm2/hr)Body Weight (kilograms)Surface area (cm2)Percent submergedTime In water (hr)Number of days/week exposedNumber of weeks/year exposedNumber of years exposedYears In lifetimeLifetime Average Water Intake(liters/kg body wt./day)
CarcinogenicPotency Factor
(kg-day/mg) Source (a)
1.75 U.S. EPA0.029 IRIS0.24 IRIS
0.024 HEAST0.091 HEAST
0.6 IRIS0.011 IRIS
Residential0.570
160000.750.25
7527575
0.00002
MW03M-01Lifetime Average Excess
Concentration Chemical Intake Lifetimeug/l mg/kg/day Cancer Risk
68.4 1.649E-06 3E-06O.OOOE+OO OE+OOO.OOOE+00 OE+OO
O.OOOE+00 OE+OO
O.OOOE+00 OE+OO
O.OOOE+00 OE+OO
O.OOOE+00 OE+OO
3E-06
OE+OO
MW04S-01Lifetime Average
Concentration Chemical Intakeug/l mg/kg/day
10.2 2.459E-07O.OOOE+00
0.38 9.161E-09O.OOOE+00O.OOOE+00O.OOOE+00O.OOOE+00
ExcessLifetime
Cancer Risk
4E-07OE+OO2E-09OE+OOOE+OOOE+OOOE+OO
4E-07
2E-09
(a) Sources ol Cancai Potency Factor*:IRIS - Integrated Riak Information Syatem. U.S. EPA 1988
HEAST - HMHh Eltocli A«MMimnl Summary Tabtot. U.S. EPA 1080U.S. EPA - U.S. EPA 19Ma.

19-Oct-89 (Page 4 of 7)
Table L-5EXCESS LIFETIME CANCER RISKGROUNDWATER DERMAL ABSORPTION EXPOSURE
ONALASKA SITE
U.S. EPACarcinogen
Chemical Classification
Arsenic ABenzene AODD B2
MDichlorobenzene B21.1-Dtehloroethane C1.1-Dichloroelhene CTrtchtoroethen* B2
SUM OF RISKS
SUM of RISKS W/O As
EXPOSURE ASSUMPTIONS
Exposure SettingWater Absorption Rate (mg/cm2/hr)Body Weight (kilograms)Surface area (cm2)Percent submergedTime In water (hr)Number of days/week exposedNumber ot weeks/year exposedNumber of years exposedYears in lifetimeLifetime Average Water Intake(liters/kg body wt./day)
CarcinogenicPotency Factor
(kg-day/mg) Source (a)
1.75 U.S. EPA0.029 IRIS
0.24 IRIS0.024 HEAST0.091 HEAST
0.6 IRIS0.011 IRIS
Residential0.570
180000.750.25
7527575
0.00002
MW05S-01Lifetime Average Excess
Concentration Chemical Intake Lifetimeug/l mg/kg/day Cancer Risk
8 1.929E-07 3E-077 1.687E-07 5E-09
O.OOOE+00 OE+00O.OOOE+00 OE+00
570 1.374E-05 1E-06O.OOOE+00 OE+00O.OOOE+00 OE+00
2E-06
1E-06
MW06M-01Liletime Average
Concentration Chemical Intakeug/l mg/kg/day
1.1 2.652E-08O.OOOE+00O.OOOE+00O.OOOE+00
36 8.679E-07O.OOOE+00O.OOOE+00
ExcessLifetime
Cancer Risk
5E-08OE+00OE+00OE+008E-08OE+00OE+00
1E-07
8E-08
(•) Sources o( Cancel Potency Factors:IRIS - Integrated Risk Information System. U S EPA 1088
HEAST - Health Effects Assessment Summary Tables. US EPA 1989US EPA - US EPA 1M8«

19-OCI-89 (Page 5 of 7)
Table L-5EXCESS LIFETIME CANCER RISKGROUNDWATER DERMAL ABSORPTION EXPOSUREONALASKA SITE
U.S. EPACarcinogen
Chemical Classification
Arsenic ABenzene AODD B2MDtahkxobenzene B21.1-Dicntoroethane C1.1-CHcMoroethene CTrichtoroethene B2
SUM OF RISKS
SUM of RISKS W/O As
EXPOSURE ASSUMPTIONS
Exposure SettingWater Absorption Rate (mg/cm2/hr)Body Weight (kilograms)Surface area (cm2)Percent submergedTime In water (hr)Number of days/week exposedNumber of weeks/year exposedNumber of years exposedYears In lifetimeLifetime Average Water Intake(Illers/kg body wt./day)
CarcinogenicPotency Factor
(kg-day/mg) Source (a)
1.75 U.S. EPA0.029 IRIS
0.24 IRIS0.024 HEAST0.091 HEAST
0.6 IRIS0.011 IRIS
Residential0.570
180000.750.25
7527575
0.00002
MW07M-01Lifetime Average Excess
Concentration Chemical Intake Lifetimeug/l mg/kg/day Cancer Risk
3.3 7.955E-08 1E-07O.OOOE+00 OE+00O.OOOE+00 OE+00O.OOOE+00 OE+00O.OOOE+00 OE+00O.OOOE+00 OE+00O.OOOE+00 OE+00
1E-07
OE+00
MW08D-01Lifetime Average
Concentration Chemical Intakeug/l mg/kg/day
3.2 7.714E-08
O.OOOE+00
O.OOOE+00
O.OOOE+00
O.OOOE+00
O.OOOE+00
O.OOOE+00
Excess
LifetimeCancer Risk
1E-07OE+00OE+00OE+00OE+00OE+00OE+00
1E-07
OE+00
(•) Some** o4 Cmcar Potency F«cloi •:IRIS - btUgiMrt Hi«k IntoriMlion Sytum. U.S. EPA 10BS.
HEAST - HMkh Eltocu AM«Mm«nl Summwy T«bto«. U.S. EPA 1089U.S. EPA-U.S. EPA IMS*.

19-Oct-89 (Page 6 ol 7)
Table L-5EXCESS LIFETIME CANCER RISKGROUNDWATER DERMAL ABSORPTION EXPOSUREONALASKA SITE
Chemical
ArsenicBenzeneODDMDichlorobenzeneI.l-Dtehtoroeihanel.l-DtehloroetheneTrtchloroethene
SUM OF RISKS
U.S. EPACarcinogen
Classification
AA
B2B2CC
B2
CarcinogenicPotency Factor
(kg-day/mg)
1.750.029
0.240.024
0.0910.6
0.011
Source (a)
U.S. EPAIRIS
IRIS
HEAST
HEAST
IRIS
IRIS
MW09M-01
Concentrationug/l
5.3
Liletime Average ExcessChemical Intake Lifetime
mg/kg/day Cancer Risk
1.278E-07 2E-07
O.OOOE+00 OE+00
O.OOOE+00 OE+00
O.OOOE+00 OE+00O.OOOE+00 OE+00
O.OOOE+00 OE+00
O.OOOE+00 OE+00
2E-07
MW11M-01Lifetime Average
Concentration Chemical Intakeug/l mg/kg/day
4.1 9.884E-08
O.OOOE+00
O.OOOE+00
O.OOOE+00
O.OOOE+00
O.OOOE+00
O.OOOE+00
ExcessLifetime
Cancer Risk
2E-07OE+00OE+00OE+00OE+00OE+00OE+00
2E-07
SUM of RISKS W/O As
EXPOSURE ASSUMPTIONS
Exposure SettingWater Absorption Rale (mg/cm2/hr)Body Weight (kilograms)Surface area (cm2)Percent submergedTime In water (hr)Number of days/week exposedNumber of weeks/year exposedNumber ol years exposedYears In lifetimeLifetime Average Water Intake(liters/kg body wt./day)
Residential0.570
180000.750.25
7527575
0.00002
OE+00 OE+00
(•) Source* ol Cancer Potency Faclot •:IRIS - imagined Risk Information SyHem. US EPA 1988
HEAST - Health Effects AMetMnent Summary Tablet. US EPA 1989U.S. EPA - US EPA I088a

19-Oct-89 (Page 7 ot 7)
Table L-5
EXCESS LIFETIME CANCER RISK
GROUNDWATER DERMAL ABSORPTION EXPOSURE
ONALASKA SITE
Chemical
ArsenicBenzeneODD1,4 Dtchkxobenzene1,1-Ofchloroethane1,1-OteMoroetheneTrlchloroelhene
SUM OF RISKS
SUM Of RISKS W/0 As
U.S. EPACarcinogen
Classification
AA
B2B2CC
B2
CarcinogenicPotency Factor
(kg-day/mg) Source (a)
1.75 U.S. EPA0.029 IRIS
0.24 IRIS0.024 HEAST0.091 HEAST
0.6 IRIS0.011 IRIS
MW20S-01Lifetime Average Excess
Concentration Chemical Intake Lifetimeug/l mg/kg/day Cancer Risk
3.5 O.OOOE+00 OE+00O.OOOE+00 OE+00O.OOOE+00 OE+00O.OOOE+00 OE+00O.OOOE+00 OE+00O.OOOE+00 OE+00O.OOOE+00 OE+00
OE+00
OE+00
MW21S-01Lifetime Average
Concentration Chemical Intakeug/l mg/kg/day
O.OOOE+00O.OOOE+00O.OOOE+00O.OOOE+00
490 O.OOOE+00O.OOOE+00O.OOOE+00
ExcessLifetime
Cancer Risk
OE+00OE+00OE+00OE+00OE+00OE+00OE+00
OE+00
OE+00
EXPOSURE ASSUMPTIONS
Exposure Setting ResidentialWater Absorption Rale (mg/cm2/hr) 0.5Body Weight (kilograms) 70Surface area (cm2) 18000Percent submerged 0.75Time In water (hr) 0.25Number of days/week exposed 7Number of weeks/year exposed 52Number of years exposed 75Years In lifetime 75Lifetime Average Water Intake 0.00002(liters/kg body wt./day)
(•) Sourcei ol Cancer Potency Factor*:IRIS - Integrated Riik Information System, US EPA 1988.
HEAST - Health Eltoclt A«eeMmenl Summary Table*. US EPA 1989U.S. EPA - US EPA 1M8«

17-OCI-89 (Page i olll)
Table L-6COMPARISON OF ESTIMATED DAILY INTAKETO REFERENCE DOSE (RID)DERMAL ABSORPTION EXPOSURE
Chemical
BwlumBcnioicacldgamma BHC («ndan«)blt(2-«ttiy1h«xyt)phirialaleCadmiumChromium VICoppar1.1-OfchlorMlhafM1.1-OichloroMhWMEUiyttMOMM
LaadManganaaa2-MatttytpTMnol4 M*>hytph«oolNapMhatoMNtoMPhMMl
TaluwMl.l.l-TrlchtoroMhan*VanadiumXytonatZinc
ReferenceDow (RID)mg/ko/day
0.064
0.00030.02
0000500050.0370.0090.009
0.100014
0.220.50.60.4
0.020.040.3
0.090.007
20.2
Source <•)
IRISIRISIRISIRIS
HEASTIRIS
SPHEMIRISIRISIRIS
SPHEMSPHEM
IRISIRIS
HEAST(b)
IRISIRISIRIS
HEASTIRIS
HEAST
MW02S-01Concentration
Ug/l
352—
———
2486.3——6
7.e1340
———
27.8———
8.1—
498
Daily Intake(Dl)
mg/kg/day
00008000000000000000000000.0001000000.00000.00000.00000.00000.00320.00000.00000.00000.0001000000000000000000000000000001
DI/RID
00170000000000000.000001200010.00000000.0000.0130.0150.00000000.00000030.0000.0000.000000300000.001
Intake ExceedsReference Dose?
NONONONONONONONONONONONONONONONONONONONONONO
MW02M-01Concentration
ug/l
1390—————————8.1
972———
7.4
———
——
584
Daily Intake(Dl)
mg/kg/day
00034000000.00000000000000000000.000000000000000.00000.00000.00230.00000.00000.00000.00000.0000000000000000000000000.0001
DI/RID
00670.0000000000000000000000000000000000000140.01 100000.00000000001000000000000000000000001
Intake ExceedsReference Dose?
NONONONONONONONONONONONONONONONONONONONONONO
Hazard Index (Sum of DI/RfD)
EXPOSURE ASSUMPTIONSExposure Setting ResidentialExposed Individual AdultWater absorption rate(mg/cm2/hr) 0.5Body Weight (kilograms) 70Surface area (cm2) 18000Percent submerged 75Time In water 0.25Water Intake (l/kg-day) 0.0024
(a) Source! ol RfD«:IRIS - Inlogialod Risk Inkxmalion System
U S EPA 1988
HEAST - H»«llh EllocU Aitetomenl SummaryT»W»» - Ouailaily Summit y U S EPA 1989
(b) Nickel valu* bad* on mckwl-totubl* tain
0.064 0.093
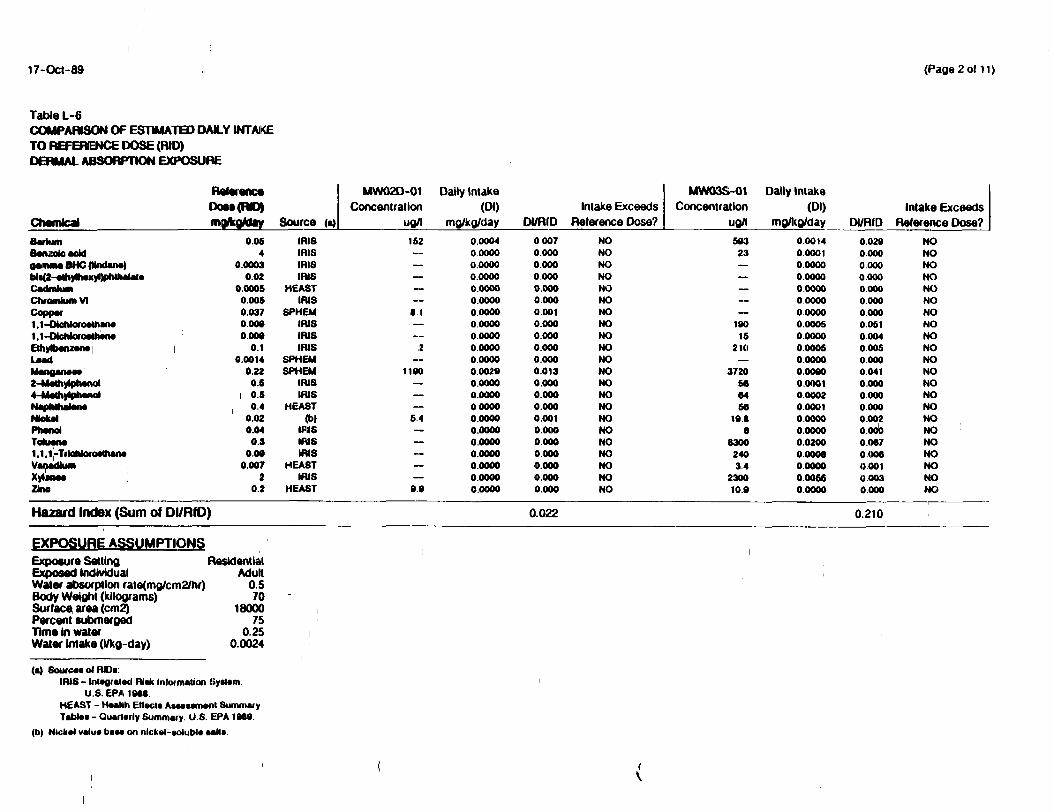
17-OCI-89 (Page2oMi)
Table L-6COMPARI8CIN OF ESTIMATED DAILY INTAKE
TO REFERENCE DOSE (RID)
DERMAL ABSORPTION EXPOSURE
Chemical
BariumBMUutoMMgamma BHC(ttndarw)
CadmiumChromium VICoppar1.1-DtaMoroattuuM1.1-OicMoroMlMMEmyttMfuanaLaadMmQinTTT
2-MtfhyfclMflot4 MattiylphandNapMhriMMNtofcalPmMMtToktMw1.1.1-TrioMoroMhanaVanadkMI
XytonaaZlno
ReferenceDOM (RID)ntWtay
0.064
0.0003A A9V.V&
0.000500050.0370.0000009
0.10.0014
0.220.60.60.4
0.020.040.3
0.000.007
20.2
Source (•)
IRISIRISIRISIRISimo
HEASTIRIS
SPHEMIRISIRISIRIS
SPHEMSPHEM
IRISIRIS
HEAST<b)
IRISIRISIRIS
HEASTIRIS
HEAST
MW02O-01Concentration
Ufl/l
162——
—81——2
—1100
———
6.4
—————9.0
Daily Intake(01)
mo/kg/day
0.00040.00000.00000 0000000000.00000.00000.00000.00000.00000.00000.00290.00000.0000000000.00000.00000.00000.00000.00000.00000.0000
Di/RID
00070.0000.0000 0000.0000.0000.0010.0000.0000.0000.0000.0130.0000.0000.0000.0010.0000.0000.0000.0000.0000.000
Intake ExceedsReference Dose?
NONONONONONONONONONONONONONONONONONONONONONO
MW03S-01Concentration
ug/l
59323—
——
19015
210—
3720586466
10.6
•83002403.4
230010.0
Dally Intake(Dl)
mg/kg/day
0.00140.00010.0000n AAAAW.W^AI
0000000000000000.00050.00000.00060.0000000800.00010.00020.00010.0000b.oooo0.02000.00000.00000.00660.0000
DI/RID
0.02900000.000A AAAU.UVN
0.00000000.0000.06100040.0050.0000.0410.0000.0000.0000.00200000.0670.0060.00100030.000
Intake ExceedsReference Dose?
NONONOMOnwNONONONONONONONONONONONONONONONONONO
Hazard Index (Sum of DI/RfD) 0.022 0.210
EXPOSURE ASSUMPTIONSExposure Setting ResidentialExposed Individual AdultWater absorption rate(mg/cm2/hr) 0.5Body Weight (kilograms) 70Surface area (cm2) 18000Percent submerged 75Time In water 0.25Water Intake (l/kg-day) 0.0024
(•) Sourc«t ol RIDi:IRIS - lnl*gr«M Ri* Information Sy«t«m.
U.S. EPA 19M.HEAST - H*aMi Eltecli ABMMnwnt SummaryTabtot - Quarterly Summary. U.S. EPA 1969.
(b) Ntck»» valu* bat* on nlckrt-iolubU aaNi.

17-OCI-89 (Page 3 of 11)
Table L-6
COMPARISON OF ESTIMATED DAILY INTAKE
TO REFERENCE DOSE (RID)
DERMAL ABSORPTION EXPOSURE
Reference
Dose (RID)
Chemical mg/kgMay Source (•)
Barium 0.06 IRISBwittte add 4 IRISgamma BHC(Undan«) 0.0003 IRISMa(2-«thyt»>«xyl)pt>triaial* 0.02 IRISCadmium 0.0005 HEASTChromium VI 0.005 IRISCoppar 0.037 SPHEM1.1-OicMoroathana 0.000 IRIS1.1-OicMonMttMiM 0009 IRISEttiylbMiMM 0.1 IRISLMMt 0.0014 SPHEMManganaa* 0.22 SPHEM2-MMhylphanoi 0.5 IRIS1 Maftytphtnol 0.5 IRISNapMhatana 0.4 HEASTNtakal 0.02 (b)Phanol 004 IRISTokMM 03 IRIS1.1.1-Trlcltloroalhana 0.00 IRISVanadium 0.007 HEASTXytanat 2 IRISZlno 0.2 HEAST
Hazard Index (Sum of OI/RfD)
EXPOSURE ASSUMPTIONS
Exposure Setting ResidentialExposed Individual AdultWater absorption rata(mg/cm2/hr) 0.5Body Weight (kilograms) 70Surface area (cm2) 1 8000Percent submerged 75Time in water 0.25Water intake (l/kg-day) 0.0024
MW03M-01 Daily Intake
Concentration (Dl)
uo/l mg/kg/day DI/R1D
2760 00067 0.133— 00000 0.000— 0.0000 0.000— 0.0000 0000— 0.0000 0.000— 0.0000 0000— 0.0000 0000— 00000 0.000— 0.0000 0.000— 0.0000 0.000— 0.0000 0.000
12«0 0.0030 0.014— 0.0000 0.000— 0.0000 0.000— 0.0000 0.000
6.3 0.0000 0.001— 0.0000 0000— 0.0000 0.000— 00000 0.000— 0.0000 0.000— 0.0000 0000
14.4 0.0000 0.000
0.148
Intake Exceeds
Reference Dose?
NONONONONONONONONONONONONONONONONONONONONONO
MW04S-01
Concentration
uo/l
401————————42—
3320
——23——
530—
——
151
Dally Intake
(Dl)mg/kg/day
00010000000.00000.0000000000.0000000000.00000.00000.00010.00000.00100.00000.00000.00010.00000.00000.00130.0000000000.00000.0000
DI/RID
o.oia0000000000000.00000000000000000000.00100000.0360.0000.0000.0000.0000.0000.0040000000000000000
0.061
Intake Exceeds
Reference Dose?
NONONONONONONONONONONONONONONONONONONONONONO
(•) Souicat ol RIDi:IRIS - Inlagralad Riik Inlormalion System.
US EPA 1088HEAST - H«allh Eltocli AiMttmcnl SummaryTabtot - Quarterly Summary. U.S. EPA 1080.
(b) Nickvl valua ban on nickel-»o)ubl» tallt

17-OCI-89 (Page 4 of 11)
Table L-6COMPARISON OF ESTIMATED DAILY INTAKETO REFERENCE DOSE (RID)DERMAL ABSORPTION EXPOSURE
Chemical
BariumBanzotoacidgamma BHC(ttndana)
CadmiumChromium VICoppaf1.1-OfcMoroathana1.1-OfcMoroathanaEihytbannnaLaadManganaaa2 Mamylphaool4-MattiylphanolMajMhalaHaNlekalPtwnolToluana1.1.1-TrtoMoroattianaVanadiumXytanatZJno
RelerenceDose (RID)mgftgMay
0.054
0.0003A A9W.W&
0.00050.0050.0370.0090.009
0.10.0014
0.220.50.50.4
0.020.040.3
o.oe0.007
20.2
Source (a)
IRISIRISIRISIfUfiimo
HEASTIRIS
SPHEMIRISIRISIRIS
SPHEMSPHEM
IRISIRIS
HEAST(b)
IRISIRISIRIS
HEASTIRIS
HEAST
MW05S-01Concentration
ug/l
34771
—
——
570—
160
—6890
5811047
8.8—
8300—
—140031.6
Daily Intake(Dl)
mg/kg/day
0.00080.00020.00000 00000.0000000000.00000.00140.00000.00040.0000001660.00010.00030.00010.00000.00000.02000.00000.0000000340.0001
D17RID
0.0170.0000.0000.0000.0000.0000.0000.1530.0000.0040.0000.0750.0000.0010.0000.0010.0000.0670.0000.0000.0020000
Intake ExceedsReference Dose?
NONONONOn\jNONONONONONONONONONONONONONONONONONO
MW06M-01Concentration
ug/l
1370——
——36——
—4500
———
8.1
——
———
6.7
Dally Intake(Dl)
mg/kg/day
0.0033000000.00000.00000.00000.0000000000.00010.00000000000000001080.00000.00000.00000.00000.00000.00000.00000.00000.00000.0000
DI/RID
006600000.0000 0000.000o.ooo0.0000.01000000.0000.0000.04900000.0000.00000010.0000.0000.0000.0000.0000.000
Intake ExceedsReference Dose?
NONONONONONONONONONONONONONONONONONONONONONO
Hazard Index (Sum of OI/RfO) 0.320
EXPOSURE ASSUMPTIONSExposure Setting ResidentialExposed Individual AdultWater absorption rate(mg/cm2/hr) 0.5Body Weight (kilograms) 70Surface area (cm2) 18000Percent submerged 75Time In water 0.25Water Intake (l/kg-day) 0.0024
(a) Sourcat ol RIDt:IRIS - Inlagialad Riik Information Syflam.
U.S. EPA 1988.HEAST - Haallh Eftecu AtMtamant SummaryTaMa* - Quarterly Summary. U.S. EPA 1989.
(b) Nlekal valua baw on nickal-tolubl* talu.
0.126

l7-Oct-89 (Page5of tl)
Table L-6COMPARISON OF ESTIMATED DAILY INTAKETO REFERENCE DOSE (RID)DERMAL ABSORPTION EXPOSURE
Chemical
BariumBenzole acidgamma BHC(ttndarw)bit<2-elhylh«xyl)ph<halaleCadmiumChromium VICOfifMf***T*f*^
1.1-OichkxoethaneI t — T>8>KaVwfM^h«na, I MMMJII VUIVI tv
ElhylbanMMLeadManganetet-MMhylprMnol
NaphthaleneNioketPhenolToiueoe1.1.1-TrlchloroethaneVanadiumXylenetZino
ReferenceDose (RIO)mg/kgMay
0.054
0.0003002
0.00050.00600370.009A AnaU.WIW
0.10.0014
0.22OSA ftU.O
0.40.020.040.3
0.090.007
20.2
Source (a)
IRISIRISIRISIRIS
HEASTIRIS
SPHEMIRISIRISinioIRIS
SPHEMSPHEM
IRISIBIAinio
HEAST
(b)IRISIRISIRIS
HEASTIRIS
HEAST
MW07M-01Concentration
ug/l
235———————
——
718—
—
——
———
144
Daily Intake(Dl)
mg/kg/day
000060.00000.0000000000.000000000000000.0000A AAAAU.IAAM
0.00000.00000.00170.0000A (M^Mtu.uuuu0.00000.0000000000.00000.000000000000000.0000
DI/RfD
001100000.0000.0000.0000.0000.0000.000A AAAu.ww0.0000.00000080.000A MA(f.MW
0.00000000.0000.0000.0000.0000.0000.000
Intake ExceedsReference Dose?
NONONONONONONONOMOnvNONONONOUl"»THJNONONONONONONONO
MW08S-01Concentration
ug/l
145—————
62—
—
2.7saoo
—
19.9—
———
—202
Daily Intake(Dl)
mg/kg/day
0.0003000000.00000.0000000000.0000000000.0000A fWU%U.UUUU
0.00000.00000.01370.00000.00000.00000.00000.000000000000000.00000.000000000
DI/RfD
000700000000000000000.00000000000A AAAU.IA/U
0.0000.0050.0620.000A AAAo.ouo0.0000.0020000000000000.00000000000
Intake ExceedsReference Dose?
NONONONONONONONOUf\n\JNONONONONONONONONONONONONO
Hazard Index (Sum of DI/RfD)
EXPOSURE ASSUMPTIONS
Exposure Setting ResidentialExposed Individual AdultWater absorption rate(mg/cm2/hr) 0.5Body Weight (kilograms) 70Surface area (cm2) 18000Percent submerged 75Time In water 0.25Water Intake (l/kg-day) 0.0024
(a) Sourc««o/WDtIRIS - Integrated Risk Information Syitem.
US EPA 1988
HEAST - Health Eftocli Attainment SummaryTablet - Quarterly Summary. US EPA 1989
(b) Nickel value bate on nlckel-toluble tain.
0.019 0.077

17-Oct-89 (Page 6 of 11)
Table L-6COMPARISON OF ESTIMATED DAILY INTAKETO REFERENCE DOSE (RID)DERMAL ABSORPTION EXPOSURE
Chemical
BwtumBenzole addOMMMBHCQilMtafM)
CadmfcjMChfomkjm VICopper1.1-OfcMorMttMuw1 . 1 -DkMOTMttMM
ElhylbenMneLMdMtngaiMM2-Melhylphenai4-MettiylphenalNapMMlMMNiokelPhenolToluene1.1.1-TrieMoroMtwjfMVanadiumXyteneeZlne
ReferenceDose (RIO)mg/kg/day Source (•)
0.06 IRIS4 IRIS
0.0003 IRIS0.02 IRIS
0.0006 HEAST0.006 IRIS0.037 SPHEM0.000 IRIS0.000 IRIS
0.1 IRIS0.0014 SPHEM
0.22 SPHEM0.6 IRIS0.6 IRIS0.4 HEAST
0.02 (b)0.04 IRIS0.3 IRIS
0.00 IRIS0.007 HEAST
2 IRIS0.2 HEAST
MW08M-01 Daily IntakeConcentration (Dt)
ug/l mg/kg/day
600 0.0014— 0.0000— 00000
ooooo— 0.0000— 0.0000— 0.0000— 0.0000
0.0000— 0.0000— 0.0000
3060 0.0074— 0.0000— 0.0000— 0.000087 0.0000— 0.0000— 0.0000— 0.0000— 0.0000— 0.0000
138 0.0000
Hazard Index (Sum of DI/RfD)
EXPOSURE ASSUMPTIONS
Exposure SettingExposed IndividualWater absorption rate(mg/cm2/hr)Body Weight (kilograms)Surface area (cm2)Percent submergedTime in waterWater Intake (l/kg-day)
ResidentialAdult
0.570
1800075
0.250.0024
Intake ExceedsDI/RfD Reference Dose?
0.020 NO0000 NO0.000 NO0.000 NO0.000 NO0.000 NO0.000 NO0.000 NO0.000 NO0.000 NO0.000 NO0.034 NO0000 NO0.000 NO0.000 NO0.001 NO0.000 NO0.000 NO0.000 NO0.000 NO0.000 NO0.000 NO
0.064
MW08D-01 Dally IntakeConcentration (Dl)
ug/l mg/kg/day
•82 0.0002— 0.0000— 0.0000
ooooo— ooooo— 0.0000— 0.0000— 0.0000— 0.0000— 0.0000— 0.0000
2530 0.0061— 0.0000— 0.0000— 0.0000
6.1 0.0000— 0.0000— 0.0000— 0.0000— 0.0000— 0.00000 0.0000
DI/RfD
00040.0000.0000.0000000000000000.00000000.00000000.02800000.000000000010.00000000.0000.00000000.000
0.033
Intake ExceedsReference Dose?
NONONONONONONONONONONONONONONONONONONONONONO
(•) Source* ol RtD»:IRIS- Integrated Riik Information Syttem.
U.S. EPA 10M.HEAST - Health Effect* Awettmenl SummaryTable* - Quarterly Summary. U.S. EPA 1089.
(b) Nickel value bate on nickel-soluble tain.

17-Oct-89 (Page 7 ol 11)
Table L-6COMPARISON OF ESTIMATED DAILY INTAKETO REFERENCE DOSE (RID)DERMAL ABSORPTION EXPOSURE
Chemical
BariumBenzole addgamma BHC(llndane)Ma(2-ethylhexyl)phlhalMeCadmiumChromium VICopper1.1-Otehloroelhana1.1-OicMoioelheneEthytberueneLeadUanganeee2-44emytptMnol< Mediytpheiiulaj— nfcii.— *—— • •-•nvpnuHMiwNickelPhenolToluene
1,1.1-TrtehloroelhanevanadiumXyleneeZJoc
ReferenceDose (RID)moAo/day Source (•)
0.06 IRIS4 IRIS
0.0003 IRIS0.02 IRIS
00006 HEAST0.006 IRIS0.037 SPHEM0009 IRIS0.000 IRIS
0.1 IRIS0.0014 SPHEM
0.22 SPHEM0.6 IRIS0.5 IRIS0.4 HEAST
0.02 (b)0.04 IRIS0.3 IRIS
0.09 IRIS0.007 HEAST
2 IRIS0.2 HEAST
MW09M-01Concentration
ug/l
122—————~————
991
———
———
———ei
Daily Intake(01)
mg/kg/day
000030.00000.00000.00000.00000.000000000000000.00000.00000.00000.00240.00000.00000.00000.00000.0000000000.00000.00000000000000
Hazard Index (Sum of DI/RID)
EXPOSURE ASSUMPTIONS
Exposure SettingExposed IndividualWater absorption rate(mg/cm2/hr)Body Weight (kilograms)Surface area (cm2)Percent submergedTime In waterWater intake (l/kg-day)
ResidentialAdult
0.570
1800075
0.250.0024
Intake ExceedsDI/RID Reference Dose?
0006 NO0.000 NO0.000 NO0000 NO0.000 NO0.000 NO0000 NO0.000 NO0000 NO0.000 NO0.000 NO0.011 NO0.000 NO0.000 NO0.000 NO0.000 NO0000 NO0000 NO0000 NO0000 NO0000 NO0000 NO
0.017
MW10M-01 Daily IntakeConcentration (Dl)
ug/l mg/kg/day
141 0.00030.00000.00000.00000.0000
— 0.00000.00000.00000.0000
— 0.0000— 0.0000
2780 0.0067— 0.0000
0.0000— 0.0000
9.2 0.0000— 0.0000
0.0000— 00000
0.00000.0000
101 0.0000
DI/RID
000700000000000000000.000000000000.0000.00000000.0300.0000.0000.00000010.00000000000000000000000
0.038
Intake ExceedsReference Dose?
NONONONONONONONONONONONONONONONONONONONONONO
(•) Sources ol RIDrIRIS - Integrated Riik Information SyMem.
U.S. EPA 1986HEAST - Health Eltoclt AMeitment SummaryTable* - Quarterly Summary. US. EPA 1M9.
(b) Nickel value bate on nickel-toluble wlt«.

17-Oct-89 (Page 8oMl)
Table L-6COMPARISON OF ESTIMATED DAILY INTAKE
TO REFERENCE DOSE (RID)
DERMAL ABSORPTION EXPOSURE
Chemical
BariumBenzole addgamma BHC(Undane)
CadmiumChromium VICopper1.1-Olchloroelhane
ElnylbenzeneLeadMtngintTi2-MethylpherMl4-MemylphenolNaphthaleneNickelPhenolToluene1.1.1-TrlchloroelhaneVanadiumXytoneeBnc
Reference
Dose (RID)
mg/kg/day
0.064
0.0003A A9
0.00060.0060.0370.0000.009
0.10.0014
0.220.6060.4
0.020.040.3
0.000.007
20.2
Source (a)
IRISIRISIRISIRIS
HEASTIRIS
SPHEMIRIS
IRISSPHEMSPHEM
IRISIRIS
HEAST(b)
IRISIRISIRIS
HEASTIRIS
HEAST
MW11M-01
Concentration
ug/l
143——
————
——
1040
—————
———~
14.2
Dally Intake
(Dl)mg/kg/day
0.00030.00000.00000.00000.00000.0000000000.0000
0.00000.00000.00260.00000.00000.00000.00000.00000.00000.00000.00000.00000.0000
DI/RfD
0.0070.00000000.0000.000000000000.000
0.0000.0000.0110.0000.0000.0000.0000.0000.0000.0000.0000.0000.000
Intake Exceeds
Reference Dose?
NONONONONONONONO
NONONONONONONONONONONONONO
MW12S-01
Concentration
ug/l
14.0——
————
——7.6
———
———_
——0.6
Dally Intake
(Dl)mg/kg/day
000000.00000.00000.00000.00000.00000.00000.0000
0.00000.00000.00000.00000.00000.00000.00000.00000.00000.00000.00000.00000.0000
DI/RfD
000100000.0000 0000000000000000.0000.0000.0000.0000.0000.0000.0000.0000.0000.0000.0000.0000.0000.0000.000
Intake Exceeds
Reference Dose?
NONONONONONONONO
NONONONONONONONONONONONONO
Hazard Index (Sum of DI/RfO) 0.018 0.001
EXPOSURE ASSUMPTIONS
Exposure Setting ResidentialExposed Individual AdultWater absorption rate(mg/cm2/hr) 0.5Body Weight (kilograms) 70Surface area (cm2) 18000Percent submerged 75Time In water 0.25Water intake (l/kg-day) 0.0024
(•) SOUTCM of RIDi:IRIS - lnl*gral«d Rltk Inhxnullon Sy*»m
U.S. EPA IMS.HEAST - HMNh Effect* AtMMffMnl SummwyTabtoi - QiMftefly Summery. U.S. EPA 1MB.
(b) Nickel v«lu« !>•*• on nlckal-wlubl* Milt.
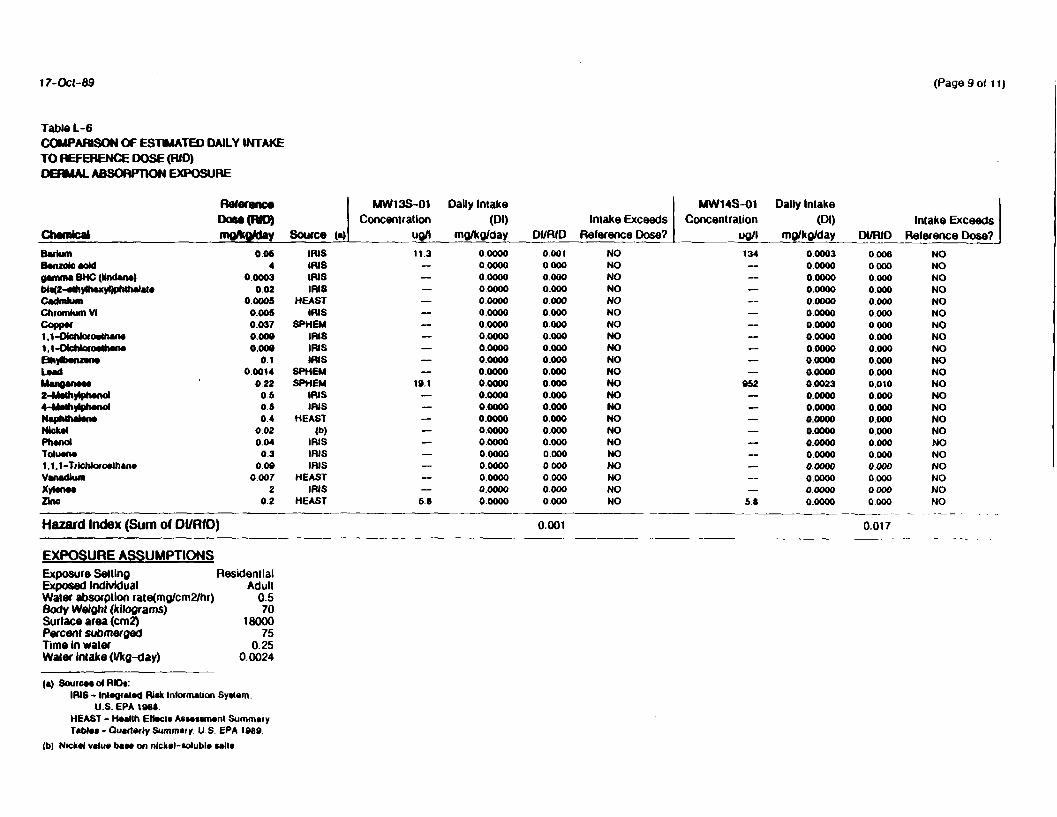
17-OCI-89 (Page 9 of 11)
Table L-6COMPARISON OF ESTIMATED DAILY INTAKETO REFERENCE DOSE (RID)DERMAL ABSORPTION EXPOSURE
ReferenceDose (RID)
Chemical moAg/day Source (•)
Barium 0.06 IRISB*nzota MM 4 IRISgamma BHC(Undan*) 0.0003 IRISbta(2-«hyttMxyl)pM>«te!« 0.02 IRISCadmium 0.0005 HEASTChromium VI 0.005 IRISCoppw 0.037 SPHEM1.1-OioMoro*lhaJW 0.00» IRIS1.1-OteMoroMtMiM 0.009 IRISEttiyttMiuww 01 IRISLMd 0.0014 SPHEMManpanaa* 022 SPHEM2-MMhytphMwl 06 IRIS4-M*ihylph*f>o< 06 IRISNapMhaton* 0.4 HEASTNick*) 0.02 (b)Ph*not 0.04 IRISToliMM 03 IRIS1.1.1-Trlchlo(o*lhan* 000 IRISVanadium 0.007 HEASTXytoitM 2 IRISDoc 0.2 HEAST
Hazard Index (Sum of DI/RfO)
EXPOSURE ASSUMPTIONS
Exposure Setting ResidentialExposed Individual AdultWater absorption rate(mg/cm2/hr) 0.5Body Weigh! (kilograms) 70Surface area (cm2) 1 8000Percent submerged 75Time in water 0.25Water intake (l/kg-day) 0. 0024
MW13S-01Concentration
ug/t
11.3——————————
10.1—————————6.8
Daily Intake(Dl)
mg/kg/day
000000.00000.000000000000000.00000.00000.00000.00000.00000.00000.00000.00000.00000.00000.00000.00000.00000.00000.00000.0000o.oooo
Intake ExceedsCM/RID Reference Dose?
0.001 NO0000 NO0000 NO0.000 NO0.000 NO0000 NO0.000 NO0.000 NO0.000 NO0.000 NO0.000 NO0.000 NO0.000 NO0.000 NO0.000 NO0.000 NO0.000 NO0.000 NO0000 NO0.000 NO0.000 NO0.000 NO
0.001
MW14S-01 Dally IntakeConcentration (Dl)
ug/l mg/kg/day
134 0.0003— 00000— 0.0000— 0.0000
00000— 0.0000— 0.0000— 0.0000— 0.0000— 0.0000
0.0000»52 0.0023
— 0.0000— 0.0000— 0.0000— 0.0000— 0.0000— 0.0000— 0.0000
0.00000.0000
58 0.0000
Dt/RID
000600000000000000000000000000000.0000.0000.0000.0100.0000.0000.0000.000000000000000000000000000
0.017
Intake ExceedsReference Dose?
NONONONONONONONONONONONONONONONONONONONONONO
(•) Sourc** ot HIDrIRIS - Integrated Risk Information SytUm.
U.S. EPA 1081
HEAST - Health Ertocu A8M*am*nt SummaryTabtoa - Quarterly Summary. U.S. EPA 1080.
(b) Nick*! value ba«* on nlckvl-tolubl* will.

17-OCI-89 (Page tool 11)
Table L-6
COMPARISON OF ESTIMATED DAILY INTAKE
TO REFERENCE DOSE (RID)
DERMAL ABSORPTION EXPOSURE
Chemical
BariumBenMtaaflMgamma BHC(Undane)Me(2-eMiylh«xyl)ptilhalaleCadmiumChromium VICafKMf•••^•(••i1.1-DlaMoioelhane1.1-OtoMororttiwwBhyHMnzMMLMdManganeee2-Me4iytptMnot4-MatfiylphanoiNapMhatwwNlokalPntMWM
TohMM1.1.1-TrtohtorortnaneVan aim imXyteneaOne
Reference
Dose (RID)
moftgMay
0064
0.00030.02
0.00060.0060.037o.ooe0000
0.10.0014
0.2206060.4
0.020.040.3
o.oe0.007
20.2
Source (•)
IRISIRISIRISIRIS
HEASTIRIS
SPHEMIRISIRISIRIS
SPHEMSPHEM
IRISIRIS
HEAST<b)
IRISIRISIRIS
HEASTIRIS
HEAST
MW20S-01
Concentration
ug/l
1280—————————2
7710———5.0
————
491
Dally Intake
(Dt)mg/kg/day
000310.00000.00000.00000.00000.00000.00000.00000.00000.00000.0000001800.00000.00000.00000.00000.00000.00000.00000.00000.00000.0012
CM/RID
0.0620.0000.0000.00000000.00000000.0000.0000.0000.0030.08400000.0000.0000.0010.0000.0000.0000.0000.0000006
Intake Exceeds
Reference Dose?
NONONONONONONONONONONONONONONONONONONONONONO
MW20D-01
Concentration
ug/l
24.8————
——————
100————
—__
——
Dally Intake
(Dl)mg/kg/day
0.00010.00000.00000.00000.00000.00000.00000.00000.00000.00000.00000.00020.00000.00000.00000.00000.00000.00000.00000.00000.00000.0000
CM/HID
0.001000000000.0000.0000.0000.0000.0000.0000.0000.0000.0010.0000.0000.0000.0000.0000.0000.00000000.0000.000
Intake Exceeds
Reference Dose?
NONONONONONONONONONONONONONONONONONONONONONO
Hazard Index (Sum of Ol/RfD) 0.156 0.002
EXPOSURE ASSUMPTIONS
Exposure Setting ResidentialExposed Individual AdultWater absorption rate(mg/cm2/hr) 0.5Body Weight (kilograms) 70Surface area (cm2) 18000Percent submerged 75Time In water 0.25Water Intake (Vkg-day) 0.0024
(•) 8ouf CM ot RlDrIRIS - Integrated Riik Information System.
US EPA 1088HEAST - Health Eftocli Ai«e««nenl SummaryTaMee - Quarterly Summery. US EPA 1088.
(b| Nickel value tww on nick*l-«alubto Milt

17-Oct-89 (Page 11 ol 11)
Table L-6
COMPARISON OF ESTIMATED DAILY INTAKE
TO REFERENCE DOSE (RID)
DERMAL ABSORPTION EXPOSURE
Chemical
BariumBcnzokacldgamma BHC(Nnd«M)bi*(2-«thy»Mxyl)ptUhalal*CadmiumChromium VICopper1.1-OteMoioMhaiM1 . t -DichloroattMMEthyttMnnn*LMdMMMMMMt-UMhylphMMl« MrthXphaoolfupntfutofMNtokdPhenolToiU»n«
1,1,1-TrtchtoroethaneVanadium
Zinc
ReferenceDose (RID)mg/kgMay
0.05
40.0003
0.02
0.00060.0060.037o.oo»0.000
0.10.0014
0.220.50.604
0.020.04
0.30.00
0.0072
0.2
Source (•)
IRISIRISIRISIRIS
HEA6TIRIS
SPHEMIRISIRISIRIS
SPHEMSPHEM
IRISIRIS
HEAST(b)
IRISIRISIRIS
HEASTIRIS
HEAST
MW21S-01
Concentration
ug/l
201
400
3220
13.4
Daily Intake
(Dl)mg/kg/day
00005000000.000000000000000.000000000000120.00000.00000.0000000780.00000.00000.00000.00000000000000000000.0000000000.0000
DI/RfD
0.0100.0000.0000.00000000.00000000.1310.0000.0000.00000350.0000.0000.0000.0020.00000000.0000.00000000.000
Intake Exceeds
Reference Dose?
NONONONONONONONONONONONONONONONONONONONONONO
Hazard Index (Sum of DI/RfD) 0.178
EXPOSURE ASSUMPTIONS
Exposure Setting ResidentialExposed Individual AdultWater absorption rate(mg/cm2/hr) 0.5Body Weight (kilograms) 70Surface area (cm2) 18000Percent submerged 75Time In water 0.25Water Intake (l/kg-day) 0.0024
(•) Source* ol HIDi:IRIS - Integrated Ritk Information Syilem
U S EPA 1988
HEAST - Health EHecl* AiMitmenl SummaryTablet - Quarterly Summary U S EPA 1080
(b) Nick*! valu« ba*a on nickel-tolubie Mill

17-Oct-89
Table L-7EXCESS LIFETIME CANCER RISK
WATER INGESTION - MEAN MONITORING WELL CONCENTRATIONSONALASKA SITE
U.S. EPACarcinogen
Chemical Classification
ArsenicBenzene1,1-Dlchloroethane
SUM OF RISKS
SUM of RISKS W/O As (d)
A
A
C
Carcinogenic Average (b) Lifetime Average ExcessPotency Factor Concentration Chemical Intake Lifetime(kg-day/mg) Source (a) (ug/l) (mg/kg/day) Cancer Risk
1.75 HEAST 13.05 3.729E-04 7E-040.029 IRIS 3.96 1.131E-04 3E-060.091 HEAST 108.83 3.109E-03 3E-04
9E-04
3E-04
EXPOSURE ASSUMPTIONS
Exposure SettingDaily Water Intake (liters/day)Body Weight (kilograms)Number of days/week exposedNumber of weeks/year exposedNumber of years exposedLifetime Average Water Intake(liters/kg body wt./day)
Residential2
707
5270
0.029
(a) Sources of Cancer Potency Factors:IRIS - Integrated Risk Information System. U.S. EPA 1988.HEAST - Health Effects Assessment Summary Tables - Quarterly Summary. U.S. EPA 1989
(b) Average - Arithmetic Mean Value for groundwater monitoring well data for compounds detectedin greater than 10% of 12 source/downgradient monitoring wells.
(c) Highest detected concentration in 12 source/downgradient monitoring wells.
(d) Arsenic detected above background concentration at one well only (MW03M), hence this value ismost representative of excess lifetime cancer risk.

17-Oct-89
Table L-8COMPARISON OF ESTIMATED DAILY INTAKE TO REFERENCE DOSE (RfD)
WATER INGESTION EXPOSURE
ONALASKA SITE
ReferenceDose (RfD)
Chemical (mg/kg/day)
BariumBenzole acidCopper1,1-DlchloroethaneEthylbenzeneLeadManganese2-Methylphenol4-MethylphenolNaphthaleneNickelTolueneVanadiumXylenesZinc
Hazard Index (Sum of DI/RfO)
0.054
0.0370.009
0.10.0014
0.220.50.50.4
0.020.3
0.0072
0.2
Average (b) Daily IntakeConcentration (DO
Source (a) (ug/l) (mg/kg/day)
IRISIRIS
dIRISIRIS
HEASTHEAST
IRISIRIS
HEASTc
IRISHEAST
IRISHEAST
699.9328.6711.26
108.8336.383.41314113.6718.6714.2512.56
1429.3821.79
310.42104.15
0.02000.00080.00030.00310.00100.00010.08970.00040.00050.00040.00040.04080.00060.00890.0030
Intake ExceedsDI/RfD eference Dose?
0.4000.0000.0090.3450.0100.0700.4080.0010.0010.0010.0180.1360.0890.0040.015
1.507
NONONONONONONONONONONONONONONO
EXPOSURE ASSUMPTIONS
Exposure Setting ResidentialExposed Individual AdultWater Intake (liters/day) 2Body Weight (kilograms) 70
(a) Sources of Cancer Potency Factors:IRIS - Integrated Risk Information System. U.S. EPA 1988.HEAST - Health Effects Assessment Summary Tables - Quarterly Summary. U.S. EPA 1989
(b) Average - Arithmetic Mean Value for groundwater monitoring well data for compounds detectedin greater than 10% of 12 source/downgradlent monitoring wells.
(c) Nickel value based on nicklessoluble salts
(d) Copper RfD based on proposed MCLG. See HEAST.

18-Oct-89
Table L-9EXCESS LIFETIME CANCER RISK
DERMAL ABSORPTION OF CONTAMINANTS IN GROUNDWATERONALASKA SITE
Chemical
U.S. EPACarcinogen
Classification
CancerPotency Factor
(kg-day/mg)
AverageConcentration
Source (a) ug/l
Lifetime AverageChemical Intake
mg/kg-day
ExcessLifetime
Cancer Risk
ArsenicBenzene1.1-Dichloroethane
AA
B2
20.0290.091
(c)IRIS
HEAST
13.053.96
108.83
3.146E-079.546E-082.624E-06
6E-073E-092E-07
SUM OF RISKS 9E-07
EXPOSURE ASSUMPTIONS
Exposure Selling
Exposed Individual
Water absorption rale (mg/cm2/hr)Body weight (kg)Surface area (cm2)Percent submergedTime In water (hrs/day)Number of days per weekNumber of weeks per yearNumber of years exposedYears in lifetimeLifetime average media Intake(I/kg body wt./day)
0.570
180000.750.25
7527575
0.0000241
(a) Cancer potency values based on ingestlon. Sources of cancer potency factors:IRIS - Integrated Risk Information System. U.S. EPA 1988.HEAST - Health Effects Assessment Summary Tables. U.S. EPA 1989
(b) Average • Arithmetic mean for groundwater MW da MW data for compounds detected in > 10% of MWs f 13 source/downgradient MWs(c) Based on Risk Assessment Council unit risk of 5x10⁻⁵(ug/l)-1. U.S. EPA 1988.

18-Oct-89
Table L-10COMPARISON OF ESTIMATED DAILY INTAKE TO REFERENCE DOSE (RfD)
DERMAL ABSORPTION OF CONTAMINANTS IN GROUNDWATER
ONALASKA SITE
ReferenceDose (RfD)
Chemical mg/kg-day Source (a
Barium 0.05 IRISBenzoic acid 4 IRISCopper 0.037 d1.1-Dichloroethane 0.009 IRISEthylbenzene 0.1 IRISLead 0.0014 HEASTManganese 0.2 HEAST2-Methylphenol 0.5 IRIS4-Methylphenol 0.5 IRISNaphthalene 0.4 HEASTNickel 0.02 cToluene 0.3 IRISVanadium 0.007 HEASTXylenes 2 IRISZinc 0.2 HEAST
Hazard Index (Sum of DI/RfD) »
EXPOSURE ASSUMPTIONS
Exposure SettingExposed Individual
Water absorption rate (mg/cm2/hr)Body weight (kg)Surface area (cm2)Percent submergedTime in water (hrs/day)Water Intake (l/kg-day)
(a) Based on ingeetton RfDs. Sources of RfDs:
AverageConcentration
ug/1
699.9328.6711.26
108.8336.383.41314113.6718.6714.2512.56
1429.3821.79
310.42104.15
ResidentialAdult
0.570
1800075
0.250.002411
Daily Intake(Dl)
mg/kg-day
0.00170.00010.00000.00030.00010.00000.00760.00000.00000.00000.00000.00340.00010.00070.0003
HazardQuotient
DI/RfD
0.0340.0000.0010.0290.0010.0060.0380.0000.0000.0000.0020.0110.0080.0000.001
0.131
Does IntakeExceed RfD?
NONONONONONONONONONONONONONONO
IRIS - Integrated Risk Information System. U.S. EPA 1988.HEAST - Health Effects Assessment Summary Tables. U.S. EPA 1989
(b) Average • Arithmetic mean for groundwater MW data for compounds detectedin >10% of 12 source/downgradient MW.
(c) Nickel value base on nickel-soluble salts.(d) Copper RfD based on proposed MCLG. See HEAST.

18-Oct-89
Table L-11EXCESS LIFETIME CANCER RISK
TRESPASS SOIL INGESTION EXPOSURE
ONALASKA SITE
U.S. EPA Cancer
Carcinogen Potency FactorAverage Lifetime Average
Concentration Chemical Intake
Chemical Classification (kg-day/mg) Source (a)
Arsenicbis(2-Ethylhexyl)phthalateODDDDEDDTTrichloroethene
SUM OF RISKS
SUM OF RISKS W/O As
AB2B282B282
20.0140.240.340.34
0.011
cIRISIRISIRISIRISIRIS
ug/kg
4380462
71.552.8723.252.68
Excess
Lifetime
mg/kg-day Cancer Risk
6.385E-086.735E-091.042E-097.707E-103.389E-103.907E-11
iE-079E-113E-103E-101E-104E-13
1E-07
7E-10
EXPOSURE ASSUMPTIONS
Exposure setting TrespassSoil ingestion rate (g/day) 0.1Body weight (kg) 70Number of days/week exposed 2Number of weeks/year exposed 26Number of years exposed 5Years in lifetime 70Lifetime average soil intake 0.000015(g/kg body weight per day)
(a) Sources of Cancer Potency Factors:IRIS - Integrated Risk Information System. U.S. EPA 1988.
(b) Based on Risk Assessment Council unit risk of 5xlO-5(ug/l)-l. U.S. EPA 1988.

18-Oct-89
TableL-12COMPARISON OF ESTIMATED DAILY INTAKE TO REFERENCE DOSE (RfD)
TRESPASS SOIL INGESTION EXPOSURE
ONALASKA SITE
ReferenceDose (RfO)
Chemical mg/kg-day
AcetoneBariumbis(2-Ethylhexyl)phthalateCadmium 0Chromium VICopperDDT 0EthylbenzeneIsophoroneLead 0ManganeseNaphthaleneNickelPyreneTolueneVanadiumXylenes
Zinc
Hazard Index (Sum of DI/RfD)
EXPOSURE ASSUMPTIONS
Exposure settingExposed individualSoil intake (grams/day)Body weight (kilograms)
0.10.050.02
.00050.0050.037.0005
0.10.15
.00140.20.4
0.020.003
0.30.007
2
0.2
AverageConcentration
Source (a)
IRISIRISIRIS
HEASTIRIS
dIRISIRISIRIS
HEASTHEASTHEAST
CHEAST
IRISHEAST
IRIS
HEAST
TrespassChildOOyrs)
0.135
ug/kg
39.8793010
4622620
103603766023.25
206.6864
68000323000609.3714170
43299.2515450
3140.3
158000
Daily Intake(01)
mg/kg-day
0.00000.00030.00000.00000.00000.00010.00000.00000.00000.00020.00090.00000.00000.00000.00000.00000.0000
0.0005
HazardQuotient
DI/RfD
0.0000.0050.0000.0150.0060.0030.0000.0000.0000.1390.0050.0000.0020.0000.0000.0060.000
0.002
0.1834
Does IntakeExceed RfD?
NONONONONONONONONONONONONONONONONO
NO
(a) Sources of RIDs:IRIS - Integrated Risk Information System. U.S. EPA 1968.HEAST - Health Effects Assessment Summary Tables. U.S. EPA 1989
(b) Cyanide value based on free cyanide.
(c) Nickel value base on nickel-soluble salts.(d) Copper RfO based on proposed MCLG. See HEAST.

lS-Oct-89
TableL-13EXCESS LIFETIME CANCER RISK
RESIDENTIAL SOIL INGESTION EXPOSURE
ONALASKA SITE
U.S. EPA CancerCarcinogen Potency Factor
Average (b) Lifetime AverageConcentration Chemical Intake
Chemical Classification (kg-day/mg) Source (a)
Arsenicbis(2-Ethylhaxyi)phthalat9ODDODEDDTTrichloroethene
SUM OF RISKS
SUM OF RISKS W/O As
AB282B2B2B2
20.0140.240.340.34
0.011
cIRISIRISIRISIRISIRIS
ug/kg
438046271.5
52.8723.252.68
ExcessLifetime
(mg/kg-day) Cancer Risk
6.257E-066.600E-071.021E-077.553E-083.321 E-083.829E-09
1E-059E-092E-083E-081E-084E-11
1E-05
7E-08
EXPOSURE ASSUMPTIONS
Exposure setting ResidentialSoil ingestion rate (g/day) 0.1Body weight (kg) 70Number of days/week exposed 7Number of weeks/year exposed 52Number of years exposed 75Years in lifetime 75Lifetime average soil intake 0.0014(g/kg body weight per day)
(a) Sources of Cancer Potency Factors:IRIS - Integrated Risk Information System. U.S. EPA 1988.
(b) Carcinogenic PAHs based on benzo[a]pyrene. Benzo[a|pyrene potency from Ambient Water Quality Criteria Document.U.S. EPA 1980.
(c) Based on Risk Assessment Council unit risk of 5xiO-5(ug/l)-l. U.S. EPA 1988.

18-Oct-89
Tablet-14COMPARISON OF ESTIMATED DAILY INTAKE TO REFERENCE DOSE (RfD)
RESIDENTIAL SOIL INGESTION EXPOSUREONALASKA SITE
ReferenceDose (RfO)
Chemical mg/kg-day
AcetoneBariumbis(2-Ethylhexyl)phthalateCadmium 0Chromium VICopperDOT 0EthylbenzeneIsophoroneLead 0ManganeseNaphthaleneNickelPyreneTolueneVanadiumXylenesZinc
Hazard Index (Sum of DI/RfD)
EXPOSURE ASSUMPTIONSExposure settingExposed individualSoil intake (grams/day)Body weight (kilograms)
0.10.050.02
.00050.0050.037.0005
0.10.15
.00140.20.4
0.020.003
0.30.007
2
0.2
AverageConcentration
Source (a)
IRISIRISIRIS
HEASTIRIS
dIRISIRISIRIS
HEASTHEASTHEAST
cHEAST
IRISHEAST
IRISHEAST
TrespassChild(toddler)
0.215
ug/kg
39.8793010
4622620
103603766023.25
206.6864
68000323000609.3714170
43299.2515450
3140.3158000
Daily Intake(Dl)
mg/kg-day
0.00000.00120.00000.00000.00010.00050.00000.00000.00000.00090.00430.00000.00020.00000.00000.00020.00000.0021
HazardQuotient
DI/RfD
0.0000.0250.0000.0700.0280.0140.0010.0000.0000.6480.0220.0000.0090.0000.0000.0290.0000.011
0.8556
Does IntakeExceed RfD?
NONONONONONONONONONONONONONONONONO
NO
(a) Sources of RfDs:IRIS - Integrated Risk Information System. U.S. EPA 1988.HEAST - Health Effects Assessment Summary Tables. U.S. EPA 1989
(b) Cyanide value based on free cyanide.(c) Nickel value base on nickel-soluble salts.(d) Copper RfD based on proposed MCLG. See HEAST.


![Capitulo1 HILL[1]](https://static.fdokumen.com/doc/165x107/6316ac67d16b3722ff0cffbf/capitulo1-hill1.jpg)