Cerebellar Sensory Processing Alterations Impact Motor Cortical Plasticity in Parkinson's Disease:...
35
Cerebellar sensory processing alterations impact motor cortical plasticity in Parkinson’s disease: clues from dyskinetic patients *Asha Kishore MD, DM 1 , *Traian Popa MD, PhD 2-5 , Ammu Balachandran B.Tech 1 , Shyambabu Chandran MD, DM 1 , Salini Pradeep M.Sc 1 , Febina Backer B.Tech 1 , Syam Krishnan MD, DM 1 , Sabine Meunier, MD, PhD 2-5 *Both authors contributed equally 1. Comprehensive Care Centre for Movement Disorders, Department of Neurology, Sree Chitra Tirunal Institute for Medical Sciences and Technology, Kerala-695011, India. 2. Université Pierre et Marie Curie, Centre de Recherche de l'Institut du Cerveau et de la Moelle épinière, UMR-S975, Paris, France. 3. CNRS, UMR 7225, Paris, France. 4. INSERM, U975, Paris, France. 5. ICM – Institut du Cerveau et de la Moëlle épinière, Paris, France. Word count: 7600 Running title: Cerebellum and L-dopa-induced dyskinesias Corresponding author: Asha Kishore MD, DM. Professor of Neurology Comprehensive Care Centre for Movement Disorders, Sree Chitra Tirunal Institute for Medical Sciences and Technology Kerala, 695011, India. Fax: +91-471-2446433 / Tel: +91-471-2524268 / Email: [email protected]
-
Upload
independent -
Category
Documents
-
view
0 -
download
0
Transcript of Cerebellar Sensory Processing Alterations Impact Motor Cortical Plasticity in Parkinson's Disease:...

Cerebellar sensory processing alterations impact motor cortical plasticity in Parkinson’s disease: clues from dyskinetic patients
*Asha Kishore MD, DM1, *Traian Popa MD, PhD2-5, Ammu Balachandran B.Tech1,
Shyambabu Chandran MD, DM1, Salini Pradeep M.Sc1, Febina Backer B.Tech1, Syam
Krishnan MD, DM1, Sabine Meunier, MD, PhD2-5
*Both authors contributed equally
1. Comprehensive Care Centre for Movement Disorders, Department of Neurology, Sree
Chitra Tirunal Institute for Medical Sciences and Technology, Kerala-695011, India.
2. Université Pierre et Marie Curie, Centre de Recherche de
l'Institut du Cerveau et de la Moelle épinière, UMR-S975, Paris, France.
3. CNRS, UMR 7225, Paris, France.
4. INSERM, U975, Paris, France.
5. ICM – Institut du Cerveau et de la Moëlle épinière, Paris, France.
Word count: 7600
Running title: Cerebellum and L-dopa-induced dyskinesias
Corresponding author:
Asha Kishore MD, DM.
Professor of Neurology
Comprehensive Care Centre for Movement Disorders,
Sree Chitra Tirunal Institute for Medical Sciences and Technology
Kerala, 695011, India.
Fax: +91-471-2446433 / Tel: +91-471-2524268 / Email: [email protected]

Summary
The plasticity of primary motor cortex (M1) in patients with Parkinson’s disease (PD) and
levodopa-induced dyskinesias (LIDs) is severely impaired. We recently reported in young
healthy subjects that inhibitory cerebellar stimulation enhanced the sensori-motor
plasticity of M1 that was induced by paired associative stimulation (PAS). This study
demonstrates that the deficient sensori-motor M1 plasticity in sixteen patients with LIDs
could be restored by a single session of real inhibitory cerebellar stimulation but not sham
stimulation. This was evident only when a sensory component was involved in the
induction of the plasticity, indicating that cerebellar sensory processing function is
involved in the restoration of M1 plasticity. The benefit of inhibitory cerebellar stimulation
on LIDs is known. To explore whether this benefit is linked to the restoration of sensori-
motor plasticity of M1, we conducted an additional study looking at changes in LIDs and
PAS-induced plasticity after 10 sessions of either bilateral, real inhibitory cerebellar
stimulation or sham stimulation. Only real and not sham stimulation had an anti-
dyskinetic effect and it was paralleled by an improvement in the sensori-motor plasticity
of M1. These results suggest that alterations in cerebellar sensory processing function
occuring secondary to abnormal basal ganglia signaling may be an important element
contributing to the maladaptive sensori-motor plasticity of M1 and LIDs.
Key words: Cerebellum, Dyskinesias, Motor cortex plasticity, Parkinson’s disease, L-
DOPA.

Introduction
The production of a normal, smooth movement requires the timely involvement of
numerous structures that issue concerted commands adapted to a given context and the
integration of the information from within and outside the body (Shadmehr et al. 2010).
Impairment in the functioning of any element in the chain of command will result in
movements unsuited for the desired aim or undesired movements. Levodopa-induced
dyskinesias (LIDs) exemplify such involuntary movements and are related to abnormal
signaling in the striato-thalamo-cortical system in Parkinson’s disease (PD). Non-invasive
cortical stimulations studies in PD patients with LIDs have shown an impaired ability of
the primary motor cortex (M1) to develop LTP and LTD-like plasticity (Morgante et al.
2006; Kishore et al. 2012) as well as to depotentiate LTP-like plasticity (Huang et al.
2011). These cortical abnormalities are viewed as the behavioral manifestation of the
maladaptive cortico-striatal plasticity that is transmitted to M1 through the striato-
thalamo-cortical network (Picconi et al. 2008). Human studies in PD indicate that the
cerebello-thalamo-cortical network may also influence LIDs (Nimura et al. 2004; Koch et
al. 2009).
We recently reported that in healthy young adults (Popa et al. 2013), the plasticity
induced in M1 by paired associative stimulation (PAS) was enhanced when PAS was
preceded by inhibitory stimulation of cerebellar cortex. Such a plasticity-enhancing effect
of cerebellar stimulation was not seen when theta-burst stimulation (TBS), which does not
involve peripheral sensory input, was used instead of PAS to stimulate M1. This
suggested that the cerebellum or related structures (thalamus, dentato-olivary nuclear
complex) might have an important role in controlling the plastic changes occurring within
M1 by modulating the sensory afferents upstream of M1. Here, we took advantage of the
same experimental paradigm to explore (1) if cerebellar inhibitory stimulation is able to
enhance the deficient and L-DOPA-unresponsive plasticity of M1 associated with LIDs in
PD (Morgante et al. 2006; Kishore et al. 2012), and (2) whether this could be the
functional mechanism underlying the reduction of LIDs after multiple session sessions of
cerebellar stimulation reported earlier (Koch et al. 2009). As the effects of L-DOPA on
motor signs in PD are primarily mediated through the striato-thalamo-cortical pathway,
any demonstrable influence of cerebellar modulation on both dyskinesias and the sensori-
motor plasticity of M1 would provide an evidence for the functional link between the
striato-thalamo-cortical network and the cerebello-thalamo-cortical network in human PD.

Materials and Methods
1. Subjects
Sixteen patients with PD (mean age: 55 ± 2.2 years) who experienced peak-dose LIDs
participated in the single-session study and twenty patients in the multiple sessions study
(included 10 patients from the single-session study and 10 new dyskinetic patients). All
patients satisfied the UK Parkinson’s Disease Society brain bank clinical criteria (Hughes
et al. 1992) and were selected by a movement disorders specialist. All patients were right
handed according to the Edinburgh handedness inventory (Oldfield, 1971). None of the
patients had any signs of dementia or were treated with antidepressants. All patients
agreed to maintain stable doses of the anti-parkinsonian medications for at least one
month prior to the study and till the end of the last follow-up session. The Unified
Parkinson’s Disease Rating Scale (UPDRS) III scores in OFF and ON (Fahn et al. 1987), as
well as the severity of LIDs, were measured at the screening visit using the CAPSIT
protocol (Defer et al. 1999). The study was approved by the local Ethics Committee and
performed according to the ethical standards laid down in the Declaration of Helsinki. All
subjects gave their written informed consent before the experiments.
2. Experimental protocol
2.1 Single session study
All 16 patients recruited in the study underwent three independent transcranial magnetic
stimulation (TMS) sessions on three different days (Fig. 1.A):
(1) One session was performed in OFF (after overnight withdrawal of dopaminergic
drugs). It consisted of PAS delivered on M1 (PASOFF) contralateral to the more affected
side of body, without any preceding cerebellar stimulation.
(2) A second session was performed in ON (1 hour after the usual morning dose of
levodopa equivalent of drugs given as L-DOPA/C-DOPA, and after clinical confirmation of
the ON state). It consisted of a continuous theta-burst stimulation (cTBS) of the
cerebellar hemisphere ipsilateral to the more parkinsonian side of the body, followed
immediately by PAS delivered on the contralateral M1 (cTBSCB-ON→PAS).
(3) A third session was performed in ON and consisted of a sham cTBS of the ipsilateral
cerebellar hemisphere, followed immediately by PAS delivered on the contralateral M1
(ShamCB-ON→PAS).

The order of the three sessions was randomized.
2.2 Single session study: control experiments
(1) In order to test whether the effects observed in the single session study were specific
to PAS (i.e. dependent on the peripheral input and on the heterosynaptic plasticity), some
of the patients (n=7) were tested further in ON, on two different days. In this
experiment, PAS was replaced with intermittent theta-burst stimulation (iTBS) of M1 (i.e.
a stimulation that induces LTP-like plasticity through a homosynaptic mechanism,
independent of peripheral inputs). These additional sessions were coded similar to the
sessions in the single session study as cTBSCB-ON→iTBS and ShamCB-ON→iTBS. In our
previous study in young healthy volunteers, the effects of cerebellar modulation were
specific to the PAS-induced plasticity, without any influence on the iTBS-induced plasticity
within M1 (Popa et al. 2013).
(2) The effects of cerebellar modulation on PAS-induced plasticity were also tested in 16
gender- and age-matched (54.5 ± 2.5 years) healthy volunteers (HV): cerebellar cTBS
followed immediately by PAS delivered on the contralateral M1 (cTBSCB→PAS), and sham
cerebellar stimulation followed immediately by the PAS on the contralateral M1
(ShamCB→PAS). The HV were not tested after L-DOPA.
2.3 Multiple sessions study
A beneficial effect of multiple sessions of bilateral cerebellar inhibitory stimulation on LIDs
has already been demonstrated (Koch et al. 2009). In order to confirm such an effect and
to find out whether the antidyskinetic effect of cerebellar stimulation is linked to the
improvement of sensori-motor plasticity of M1, we conducted an additional study with ten
sessions spread over 10 days. There was a minimum of a one-month gap between the
single session and the multiple-sessions study. Twenty PD patients with severe LIDs (i.e.
duration of LIDs for more than 25% of the awake time; UPDRS IV A, item 32 ≥ 2) that
were at least moderately disabling (UPDRS IV A, item 33 ≥2) were randomized in two
groups undergoing either real or sham, multiple cerebellar stimulation (Fig. 1B). Ten of
these patients had already participated in the single session study.
Each group received 10 daily sessions of bilateral, real inhibitory cerebellar, or sham
cerebellar stimulation in ON (bilateral cTBSCB-ON or bilateral ShamCB-ON). The cerebellar
stimulation was performed only in ON to demonstrate the effect of cerebellar modulation
on cortical plasticity, after potentially normalizing the dysfunction in the striato-thalamo-
cortical circuit by dopamine replacement. The severity of LIDs was evaluated before

treatment and 2 weeks after the end of the last stimulation session in both groups.
Patients who were randomized into the sham arm for the first session, crossed over to
real stimulation arm 2 weeks after the end of the sham stimulation and after completing
the 2nd week clinical assessment (Fig. 1B). Those in the real stimulation arm did not cross
over to sham stimulation, as the duration of benefit of real stimulation was also an
outcome measure of the study. Patients were told that they could receive either sham or
real stimulation in the first session, but they were not told that those receiving real
stimulation would not cross over to sham till the end point of the 2nd week assessment
was completed. Those who crossed over to the second session were not aware of the type
of stimulation they received in each session. Thus, it was ensured that both groups
remained blinded to the type of stimulation received by them till the end of the 2nd week
assessment.
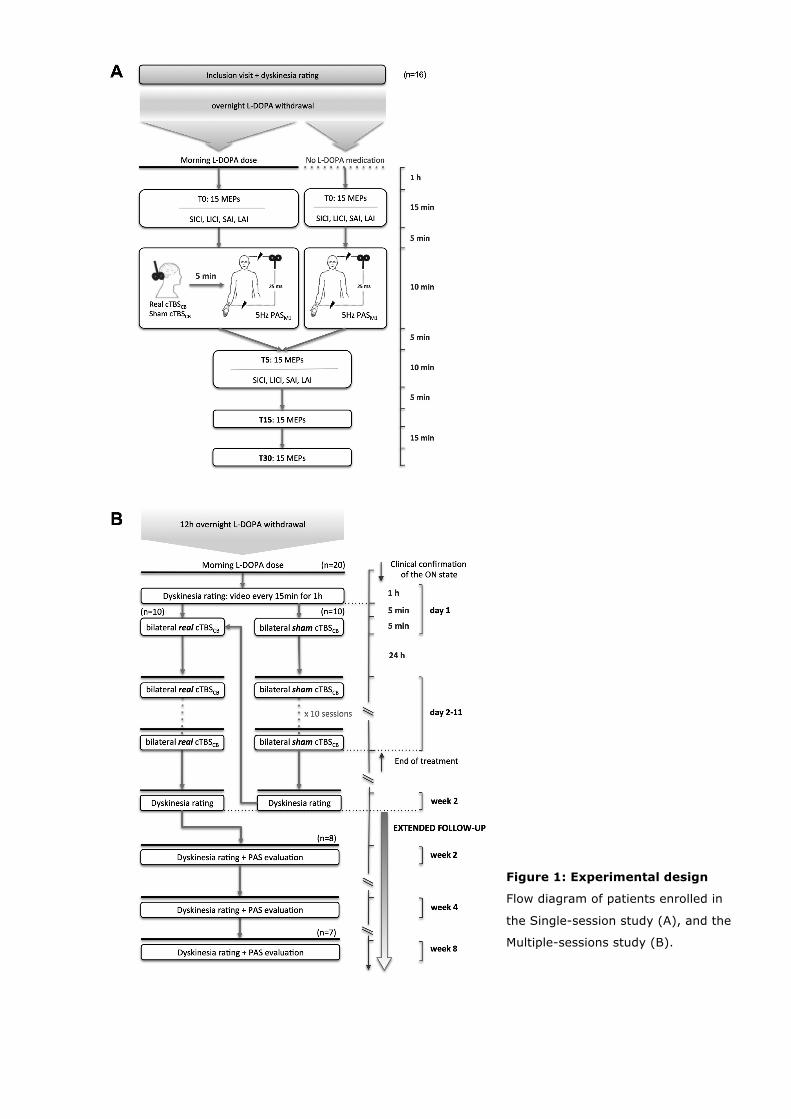
Figure 1: Experimental design
Flow diagram of patients enrolled in
the Single-session study (A), and the
Multiple-sessions study (B).

3. EMG recordings
The subjects were seated comfortably in an armchair, with both hands resting
symmetrically on a pillow in their lap. MEPs were recorded from the Abductor pollicis
brevis (APB) muscle. Responses were amplified (1000x) and filtered (100-3000 Hz) with
a Digitimer D360 amplifier (Digitimer Ltd, Welwyn Garden City, UK), then digitally
transformed at a sampling rate of 10000 Hz (CEDPower 1401 MkII, CED Ltd., Cambridge,
UK), and stored offline for analysis (Signal 4.02, CED Ltd., Cambridge, UK). The EMG
activity was continuously monitored to ensure muscle relaxation. Patient’s alertness was
monitored and verified. Trials contaminated by EMG activity anywhere within 500ms
around each MEP were discarded from the offline analysis.
4. TMS sessions
4.1 Evaluation of cortico-spinal excitability
The TMS pulses were applied over the M1 of the more affected hemisphere (contralateral
to the limbs with more LIDs) in PD patients and over the M1 of the dominant (left)
hemisphere in HV, with a 70mm figure-of-eight coil connected to a Bistim magnetic
stimulator (The Magstim Company, Whitland, UK). The “hot spot” for the APB muscle was
identified and marked on a default brain reconstruction with the help of an MRI-based
neuronavigation system (Brainsight2, Rogue Resolutions, Cardiff, UK). It allowed us to
maintain it throughout each session and from one session to the next, in the same
patient. The resting (RMT) and active (AMT) motor thresholds were calculated according
to the standard procedure (Rossi et al. 2009).
The cortico-spinal excitability was assessed with single-pulse TMS delivered at 0.2 Hz and
with an intensity of 130% RMT. Fifteen MEPs were averaged prior to the intervention
(T0), and at 5 min (T5), 15 min (T15), and 30 minutes (T30) after the end of the PAS.
4.2 Intracortical inhibitions
Intracortical inhibitions were evaluated with paired-pulse TMS, where the intensity for the
test TMS pulse was set to evoke an MEP ~1mV. Fifteen trials were recorded for each
condition.
For the short-interval intracortical inhibition (SICI), the intensity for the conditioning TMS
stimulus was set at 70% RMT and the inter stimulus interval (ISI) was 2.5 ms (Fisher et
al. 2002). For the long-interval intracortical inhibition (LICI), the intensity of the
conditioning stimulus was set at 110% RMT; the ISI was 100ms. For the short-latency

afferent inhibition (SAI) and the long-latency afferent inhibition (LAI), the conditioning
stimulation was an electrical stimulus (200 µs square pulse) delivered to the median
nerve with intensity 2 x perceptual threshold using a Digitimer DS7A Constant Current
Stimulator (Digitimer, Welwyn Garden City, Herts, UK). The ISI was 20ms for SAI, and
100ms for LAI.
Inhibitions were expressed as a percentage of the mean peak-to-peak amplitude of the
conditioned MEP referred to the unconditioned MEP in the respective block. The
inhibitions were measured pre and post intervention, with the test TMS pulse intensity
adjusted post intervention, if necessary, to get a test MEP ~1mV; the conditioning pulse
intensity was kept at the same level pre- and post-intervention.
4.3 Paired Associative Stimulation of M1
For PAS, electric stimulation pulses were delivered over the median nerve at the wrist at
2.5 x the perceptual threshold, or just below the electromyographically measured motor
threshold, whichever was lower. Each pulse was followed 25 ms later by a magnetic pulse
delivered over the hotspot of APB at 90% AMT. Six hundred pairs of stimuli were
delivered at 5Hz. This stimulation increases the excitability of M1 when delivered alone
(Quartarone et al. 2006). All experiments using PAS were performed at the same hour in
the morning in order to reduce variability (Sale et al. 2007).
4.4 Cerebellar stimulation target
Cerebellar stimulation targeted the lateral part of lobule VIII (Popa et al. 2010), since this
is the most superficial part of the sensori-motor cerebellum (Stoodley and Schmahmann
2009) and thus easily accessible to low-intensity rTMS. The landmark of 2 cm lower and
4 cm lateral to the inion was used for identifying this area (Popa et al. 2010) and it was
confirmed with MRI-guidance in patients having their own MRI.
4.5 Single session cerebellar inhibitory stimulation
The stimulation protocol was detailed in a previous paper (Popa et al. 2013) and will only
be summarized here. A figure-of-eight cooled coil (inner diameter of each loop 70 mm)
connected to a SuperRapid2 magnetic stimulator (Magstim Company, Whitland, Wales,
UK) was used to deliver classical cTBS stimulation (Huang et al. 2005) to the cerebellum
ipsilateral to the more affected side of the body. In young healthy subjects, such
stimulation potentiates for at least 20-30 minutes the facilitatory effect of a subsequent
PAS delivered over the M1 (Popa et al. 2013). It is unknown whether such a potentiation

occurs following cerebellar stimulation in older subjects. This was tested here in a group
of HV who were age-matched with the patient group.
4.6 Multiple sessions of cerebellar inhibitory stimulation
Twenty dyskinetic patients were randomized to receive a 10-day course of bilateral
cerebellar stimulation (bilateral cTBSCB-ON) or bilateral sham stimulation of cerebellum in
ON (bilateral-ShamcB-ON) (Fig. 1B). The severity of LIDs was evaluated at 2 weeks after
the end of the last stimulation session. The cerebellum was stimulated bilaterally to have
a clinical effect on both sides of the body. Sessions were conducted daily at the same
hour in the morning (9 AM) for each patient, 1 hour after the morning dose of drugs and
after confirming the clinical ON state. There were 10 consecutive days of stimulation (with
a break only on the 7th day, a Sunday). Two trains of cTBS (each of 600 pulses and
lasting 40 s) were applied at 80% AMT over the left and right lateral cerebellum, with a
pause of 2 minutes between the two trains. The order of the stimulated side was pseudo-
randomized in each subject in every session. Sham stimulation was performed by
maintaining the stimulation intensity at 80% AMT, but moving the coil down by 5 cm. This
type of stimulation has been shown not to influence the cerebellar output, but only induce
the same twitch in the neck muscles (Popa et al. 2010).
Eight patients (either from real cerebellar stimulation alone arm or from sham and real
stimulation arm) after the end of their real treatment sessions were monitored beyond the
2nd week follow-up from the end of treatment sessions, up to 4 weeks and 8 weeks (Fig.
1B). In this group, PAS-induced plasticity was tested in ON at each follow-up session to
find out whether clinical benefits on LIDs and restoration of cortical plasticity after
multiple bilateral-cTBSCB-ON had similar time courses.
5. Dyskinesia rating
LIDs were measured with the CAPSIT dyskinesias scale (Defer et al. 2009) at baseline
before the single session study and then at the beginning and the specific time points of
the follow-up in the multiple sessions study (Fig. 1). The LED of the usual morning dose
of drugs was administered as L-DOPA/C-DOPA after 12 hours of overnight medication
withdrawal. LIDs were videotaped every 15 minutes for 1 hour, starting from the
clinically confirmed beginning of ON. At the end of the study, LIDs from both pre-and
post-treatment assessments were rated on the videos presented in a random order to two
blinded movement disorder specialists. Total dyskinesia scores over the 4 time points and

the worst score among the 4 time points (both pre and post treatment) were used for
analyses.
Patients also completed an hourly “ON–dyskinesia–OFF “diary for 5 days before the start
of the treatment sessions, and 5 days prior to the 2 weeks follow-up from the end of each
treatment session (real or sham). Prior to the study, all patients were trained in the
identification of 4 motor states: no mobility or worst mobility (complete OFF), moderate
mobility (partial OFF), good mobility without troublesome dyskinesia (ON without
troublesome dyskinesias), and mobility with troublesome dyskinesia (ON with
troublesome dyskinesias).
6. Data analysis
6.1 Single session study
1. The effects of PAS were compared within each group (dyskinetic PD patients in OFF, in
ON and HV) using repeated-measures ANOVA (rANOVA) with the raw values of the MEPs
forming the repeats (at T0, T5, T15, T30, factor “TIME”). The effects of PAS were
compared among the 3 groups using rANOVA with the normalized values of the MEPs
(MEPT5/MEPT0, MEPT15/MEPT0, MEPT30/MEPT0) forming the repeats (“TIME”) and “GROUP”
(PD ON, PD OFF and HV) being the inter-subject variable.
2. The effects of PAS or iTBS delivered to M1 were compared between the 2 groups and
between the different interventions using rANOVA with the 6 normalized values of the
averaged MEPs forming the repeats (MEPT5/MEPT0, MEPT15/MEPT0, MEPT30/MEPT0, factor
“TIME”, after ShamCB and cTBSCB, factor “INTERVENTION”) and the factor “GROUP” (HV,
PD patients in ON) being the inter-subject variable. Bonferroni correction in post-hoc test
was applied to characterize the time course of the parameters after each type of
intervention.
3. The effect of L-DOPA on RMT, AMT, SICI, LICI, SAI and LAI were evaluated by
comparing their respective values at baseline in OFF (i.e. prior to PASOFF) and in ON (i.e.
prior to ShamCB-ON) using paired t-tests.
4. The effect of cerebellar stimulation on PAS-induced changes of cortical excitability was
evaluated by comparing the normalized values of RMT, AMT, SICI, LICI, SAI and LAI
recorded after the two interventions in ON (ShamCB-ON→PAS and cTBSCB-ON→PAS) with
paired t-tests. The normalization was done using the formula: [(value post-cerebellar
stimulation) - (value at baseline)] / (value at baseline).

5. The possible placebo effect of the sham cerebellar stimulation was tested by comparing
the effects of ShamCB-ON→PAS and PASON alone on M1 plasticity in 6 of the subjects who
underwent both interventions, using rANOVA.
6. Linear regression analysis was used to correlate the effect of PASOFF, ShamCB-ON→PAS,
and cTBSCB-ON→PAS with the clinical parameters (in Table 1). The effect of PAS was
assessed at its peak, i.e. mean MEP amplitude at 15min after the end of the PAS (MEPT15).
6.2 Multiple sessions study
1. Variations of the clinical scores [(scorebaseline-score2weeks)/scorebaseline] after 10 sessions
of real (n = 20) or sham (n = 10) stimulation were compared using unpaired t-test.
2. In order to find out whether one session of bilateral cerebellar stimulation alone is able
to improve LIDs, the worst dyskinesias score was recorded in a subgroup of 10 patients
receiving the real stimulation, on the second day of the treatment, just before the due
stimulation. This second day score was compared with the scores of the first day and at 2
weeks after the end of all ten sessions.
3. Linear regression analysis was used to correlate the change in the dyskinesia scores
with the additional effect elicited by one session of cTBSCB-ON→PAS on M1 plasticity beyond
the L-DOPA effect, i.e. [(MEP after cTBSCB-ON→PAS) – (MEP after ShamCB-ON→PAS) / MEP
after ShamCB-ON→PAS], in the 10 patients who participated in both the single- and
multiple-sesions studies. M1 plasticity was measured at its peak effect (MEPT15). We also
looked for a correlation between the baseline severity of LIDs and the additional effect
elicited by one session of cTBSCB-ON→PAS.
4. Because of the small size of the sample (n = 8), long-term effects (at 2nd week, 4th
week and 8th week follow-up from end of treatment) of 10 sessions of bilateral-cTBSCB-ON
on clinical scores were assessed by non-parametric Wilcoxon test (W-test). The
Bonferroni correction for multiple comparisons set the level of significance to P <0.017,
since 3 comparisons were performed. The long term effects of the treatment were also
tested on the PASON-induced plasticity using a rANOVA with the normalized values of the
MEPs forming the repeats, and “FOLLOW-UP” (weeks 2, 4 and 8) and “TIME” (5, 15 and
30 min post-PAS) being the intra-subject variables.
For all statistical analyses, a P < 0.05 was assumed to denote significance, unless
adjusted for multiple comparisons. Stat View software (SAS Institute Inc, Cary (NC),
USA) was used for all statistical analyses.

Results The clinical characteristics of the subjects who participated in the 2 studies are provided in
Tables 1 and 2. The subjects did not report any adverse effects after any of the
interventions. The intra-class correlation for the video-based dyskinesia ratings by the 2
movement disorder specialists was 0.92 and a consensus score was derived when there
was a difference between individual scores.
Table 1. Clinical characteristics of the 16 subjects in the single cerebellar
stimulation session study
Subjects enrolled Age Sex Disease duration in years
Duration of treatment in years
UPDRS III OFF
UPDRS III ON
Worst dyskinesia score
Total dyskinesia score
Total LED mg/day
Morning dose of DOPA given
Patient 1*
Patient 2
Patient 3
Patient 4*
Patient 5*
Patient 6
Patient 7*
Patient 8
Patient 9
Patient 10*
Patient 11*
Patient 12*
Patient 13
Patient 14*
Patient 15*
Patient 16*
Mean ±SEM
65
53
65
63
50
57
50
67
45
38
52
50
45
62
50
63
54.5 ± 2.2
M
M
M
M
M
M
M
F
M
M
M
M
M
M
F
F
M=13 F=3
4
11
10
10
10
8
6
9
6
12
11
11
8
15
6
6
8.9 ± 0.71
4
11
3
8
7
6
6
9
6
10
10
10
7
15
6
6
7.8 ± 0.74
37
48
47
23
60
34
24
46
69
39
49
51
22
22
39
24
39.6 ± 3.59
23
10
8
5
11
5
7
14
15
14
15
18
6
10
3
9
10.8 ± 1.34
9
10
7
13
8
7
7
10
7
13
7
9
8
8
12
14
8.7 ± 0.79
16
18
6
31
22
14
26
20
16
52
30
33
12
35
36
57
26.5 ± 3.51
500
654
890
665
750
665
2225
532
1025
482
330
1350
800
375
680
1100
688.9 ± 74.26
100
250
200
150
150
200
350
150
275
150
100
375
200
100
150
250
196.9 ± 21.02
* patients who also participated in the multiple sessions study.

Table 2. Clinical characteristics of subjects in the multiple cerebellar stimulation
study
Subjects enrolled Age Gender Disease
duration
in
years
UPDRS III
OFF
UPDRS III
ON
Worst dyskinesia
score
Total
dyskinesia score
Total LED
mg/day
Morning dose L-‐DOPA
mg/day
ACTIVE ONLY
Patient 1*
Patient 2*
Patient 3*
P atient4*
Patient 5*
Patient6*
Patient7*
Patient8
Patient 9
Patient 10
Mean ±SEM
SHAM and ACTIVE
Patient 11*
Patient12*
Patient13*
Patient14
Patient 15
Patient16
Patient17
Patient18
Patient19
Patient 20
Mean ±SEM
65
63
50
38
52
62
63
60
70
56
57.9±2.91
50
50
57
67
52
48
44
60
64
62
55.4 ± 1.91
M
M
M
M
M
M
F
F
F
F
M=6
F =4
M
F
M
F
F
F
M
M
M
M
M=6
F=4
4
10
10
12
11
15
6
10
10
10
9.8 ± 0.95
11
6
12
18
12
12
8
7
14
13
11.3 ±
0.89
37
23
60
39
49
22
24
70
51
41
41.6 ± 5.11
51
39
26
38
62
24
18
35
54
35
38.2 ± 3.49
23
5
11
14
15
10
9
26
20
11
14.4 ± 2.10
18
3
1
17
13
11
4
15
18
15
12.1±1.78
9
13
8
13
7
8
9
9
15
13
10.2 ± 1.21
9
12
7
10
18
6
23
8
11
15
12.1 ± 1.63
16
31
22
52
30
35
57
36
60
56
39.5 ± 4.95
33
36
26
27
69
22
84
37
14
52
40.1 ± 6.96
500
665
750
482
330
375
1100
1085
625
400
631.2 ± 87.51
1350
680
2225
675
685
880
700
200
1700
600
969.5 ± 151.73
100
150
150
150
100
100
250
250
150
100
150 ± 18.22
375
150
350
75
175
250
100
50
150
100
177.5 ± 28.17
*patients who also participated in the single session study

1. Single-session study
1.1 Plastic response of M1 to PAS is weak in dyskinetic PD patients in OFF and
ON and similar to age-matched HV
We found that M1 of dyskinetic PD patients in OFF was only weakly responsive to the 5 Hz
PAS protocol (raw MEP values: rANOVA: “TIME” F = 0.8, P = 0.5). Even in ON, patients
remained poorly responsive to 5 Hz PAS (“TIME” F = 0.4, P = 0.7). The effect of PAS in
older age-matched HV was similarly low (F = 1.6, P = 0.2) (Fig. 2.A). This was confirmed
by comparing the normalized values of MEPs (T5/T0, T15/T0, T30/T0) between HV and
patients in OFF and ON (rANOVA: “GROUP” F = 0.1, P = 0.7, “TIME” F = 0.8, P = 0.5, no
interaction F = 1.4, P = 0.2).
There was an effect of age on plasticity in both groups HV and PD subjects. Indeed when
the overall effect of PAS was compared between PD in OFF and HV with age as a
covariant, there was a significant effect of age (P < 0.05) and no effect of “GROUP” (P =
0.7), nor interaction (“GROUP” * ”AGE” P = 0.8). As shown on Fig. 2B, the younger the
subjects, the higher was the PAS-induced effect. However, a linear regression between
age and the PAS effect fitted only the PD patient data (R2=0.35, P < 0.01), but not the HV
data (R2=12, P = 0.2)
Figure 2: Comparison of PAS-
induced effects in PD patients
in OFF and ON and age-matched
healthy volunteers 2A: The mean amplitudes of the motor-
evoked potentials (MEP) normalized
to their mean pre-PAS amplitude are

plotted against the elapsed time from the end of the PAS. There was no significant difference in the effect of
PAS among the 3 groups. PD patients were tested OFF and ON. Healthy volunteers were not tested with L-
DOPA.
2B: Linear regression analysis shows that the older the subject, the lower was the peak effect of PAS-induced
plasticity (MEPT15). This relation was significant in the PD group, but not in healthy volunteers. Dotted lines
represent the respective 95% confidence intervals of the regressions.
1.2. Cerebellar inhibitory stimulation modifies PAS-induced M1 plasticity in PD
patients in ON and not in age-matched healthy volunteers
When preceded by ShamCB, PAS induced a similar, small increase of the test MEP size,
both in PD patients in ON and in HV. In contrast, when preceded by cTBSCB, PAS induced
a large and significant facilitation of the test MEP size in patients in ON but not in the HV
(Fig.3). This was confirmed by comparing the normalized values of the MEPs (T5/T0,
T15/T0, T30/T0) between the two groups and the 2 sessions. The analysis found a
significant interaction between “GROUP” and “INTERVENTION” due to the additional effect
of cTBSCB-ON on PAS-induced plasticity in the patient and not in the HV group (see Table
3).
Figure 3: Comparison of PAS-induced effects
when preceded by a single session of sham
or real inhibitory stimulation of cerebellum.
The mean amplitude of the MEPs normalized to
their mean pre-PAS amplitude is plotted against
the time elapsed from the end of PAS. PAS was
preceded by a sham or real cTBS cerebellar
stimulation.
Upper panel: In healthy volunteers, who were not
given L-DOPA, real cerebellar inhibitory
stimulation did not induce any additional effect on
PAS when compared to sham cerebellar
stimulation.
Lower panel: In PD patients tested in ON, the real
cerebellar inhibitory stimulation enhanced the
PAS-induced effect at all tested time points when
compared to the sham cerebellar stimulation.

Table 3. Statistical results for the single-session study
TIME GROUP TIME * GROUP
INTERVENTION GROUP * INTERVENTION
TIME * INTERVENTION
PAS-‐induced plasticity in PD OFF (raw data)
F=0.8, P=0.5
PAS-‐induced plasticity in PD ON (raw data)
F=0.8, P=0.5
PAS-‐induced plasticity in HV (raw data)
F=0.8, P=0.5
PAS-‐induced plasticity in PD OFF vs. PD ON vs. HV
F=0.8, P=0.5 F=0.1, P=0.7 F=1.4, P=0.2
Effect of cTBSCB vs. ShamCB on PAS-‐induced plasticity in PD and HV
F=2.8, P=0.07 F=0.5, P=0.5 F=0.1, P=0.8 F=6.4, P=0.02 F=5.4, P=0.03 F=0.6, P=0.9
Post-‐hoc: effect of cTBSCB vs. ShamCB in PD ON
F=1.8, P=0.2 F=16.5, P=0.001 F=0.4, P=0.6
Post-‐hoc: effect of cTBSCB vs. ShamCB in HV
F=1.7, P=0.2 F=0.3, P=0.6 F=0.9, P=0.4
Effect of cTBSCB vs. ShamCB on iTBSM1-‐induced plasticity in PD
F=0.6, P=0.6 F=0.006, P=0.9 F=0.8, P=0.5
No placebo effect of ShamCB in PD ON: ShamCB→PAS vs. PAS alone (norm data)
F=6.5, P=0.05 F=0.06, P=0.8 F=0.005, P=0.9

In PD patients, the additional effect of cTBSCB-ON→PAS versus ShamCB-ON→PAS on the peak
effect of plasticity (MEPT15) correlated with the worst dyskinesia score at baseline: in
patients with more severe LIDs, this additional effect of cerebellar stimulation on PAS-
induced plasticity was larger (R2 = 0.6, P <
0.001) (Fig. 4).
Figure 4: The severity of dyskinesia at baseline
predicts the efficacy of one session of real
inhibitory stimulation of cerebellum in enhancing
PAS-induced plasticity.
Linear regression shows that the more severe the worst
dyskinesia scores at baseline, the larger was the
additional effect of one session of real cerebellar
inhibitory stimulation on PAS over that of sham
stimulation.
There was no difference between the effect of cTBSCB-ON→PAS and ShamCB-ON→PAS on
RMT, AMT, SICI, LICI, SAI or LAI (Table 4).
Table 4. Measures of cortical excitability following SHAMCB-ON→PAS and cTBSCB-
ON→PAS
Pre intervention Post-SHAMCB-ON→PAS Post- cTBSCB-ON→PAS P
RMT 46.3 ± 1.7 45.9 ± 1.9 45.6 ± 1.3 0.9
AMT 32.2 ± 1.4 31.7 ± 1.4 31.8 ± 1.2 0.7
SICI 0.5 ± 0.1 0.6 ± 0.1 0.5 ± 0.1 0.4
LICI 0.2 ± 0.1 0.3 ± 0.1 0.1 ± 0.0 0.3
SAI 1.1 ± 0.1 1.1 ± 0.1 0.9 ± 0.1 0.2
LAI 0.9 ± 0.1 0.9 ± 0.1 0.9 ± 0.2 0.5
RMT = resting motor threshold, AMT= active motor threshold, SICI = short-interval intracortical inhibition, LICI= long-interval intracortical inhibition, SAI=short- latency afferent inhibition, LAI = long-latency afferent inhibition. P < 0.05 is considered significant. All values are Mean ± SEM

1.3. Cerebellar inhibitory stimulation does not enhance iTBS-induced plasticity of
M1
In dyskinetic patients, iTBS of M1 did not induce any significant plastic response when
preceded by ShamCB-ON or cTBSCB-ON (Fig. 5). This was confirmed by comparing the
normalized values of the MEPs (T5/T0, T15/T0, T30/T0) after ShamCB-ON→iTBSM1 and
cTBSCB-ON→iTBSM1 (see Table 3)
Figure 5: Comparison of iTBS-induced effects when
preceded by a sham or real cerebellar inhibitory
stimulation.
The mean amplitude of the MEPs normalized to their mean
pre-iTBS amplitude is plotted against the time elapsed from
the end of the iTBS. iTBS was preceded by a single session of
sham or real inhibitory stimulation of cerebellum.
iTBS-induced plasticity was weak after sham cerebellar stimulation and was not modified after real inhibitory
stimulation of cerebellum in a subgroup of PD patients (n = 7).
1.4. L-DOPA responsiveness of PAS-induced plasticity, cortical excitability and
cortical inhibitions in dyskinetic PD
After L-DOPA, the responsiveness of the M1 of dyskinetic PD patients to PAS protocol was
not enhanced compared to OFF (see result 1). The RMT, AMT, SICI, LICI, LAI were not
significantly modified in ON (RMT = 46.3 ± 1.7 % and AMT = 32.2 ± 1.4 % of the
maximum stimulator output, SICI = 0.70 ± 0.11 of the unconditioned MEP amplitude,
LICI = 0.23 ± 0.09, LAI = 0.79 ± 0.08) compared to OFF (RMT = 45.1 ± 2%, AMT = 32.1
± 1.9%, SICI = 0.72 ± 0.12, LICI = 0.38 ± 0.16, LAI = 0.74 ± 0.10). In contrast, SAI
was significantly decreased (P < 0.01) in ON (0.97 ± 0.09 of the unconditioned MEP
amplitude) when compared to OFF (0.69 ± 0.07).
5. No placebo effect of sham cerebellar stimulation
MEP were minimally changed after SHAMCB-ON→PAS and PASON alone in the 6 tested
subjects: MEPT15/MEPT0 1.12 ± 0.0 after PASON alone and 1.08 ± 0.15 after SHAMCB-

ON→PAS; MEPT30/MEPT0 0.95 ± 0.07 after PASON alone and 0.90 ± 0.15 after SHAMCB-
ON→PAS. rANOVA confirmed that SHAMCB-ON had no placebo effect as PAS-induced
plasticity was not significantly changed by SHAMCB-ON→PAS compared to PASON alone
(Table 3).
2. Multiple sessions study
2.1. Multiple sessions of bilateral cerebellar inhibitory stimulation in ON have
anti-dyskinetic effects
Treatment-induced changes of the dyskinesia scores (total and worst scores from the
blinded video ratings) and in the scores extracted from the patient-diaries were compared
between the real (n=20) and sham cerebellar stimulation (n=10) sessions at the end of
the 2nd week after the termination of each type of treatment session. Real cerebellar
inhibitory and not sham stimulation, led to a decrease of the total (P < 0.04) and worst (P
< 0.007) dyskinesia scores and a reduction in the self-rated “time spent in ON with
troublesome dyskinesias” (P <0.05). Self-rated “time spent in ON” (P = 0.3) and “in OFF”
(P = 0.8) remained unchanged.
2.2. Effects of one session versus 10 sessions
There was no durable change in the worst dyskinesia score lasting until the second day,
after just one session of cerebellar stimulation, while this score in these patients was
improved 2 weeks after the end of the 10 sessions of stimulations (rANOVA: “TIME” F =
9.6, P < 0.001, Fisher’s test: pre treatment versus day 2, P = 0.4; pre-treatment versus
day 28, P < 0.0006; day 2 versus day 28, P < 0.004).
2.3. The enhancement of PAS-induced plasticity after a single session of
cerebellar inhibitory stimulation in ON predicts improvement in LIDs after
multiple bilateral sessions in ON.
In the subgroup of the 10 patients from the single session study who participated in the
multiple sessions study, bilateral cerebellar stimulation in ON induced a significant
improvement of LIDs, just as in the whole group of 20 patients. There was a substantial
decrease in the blinded video rated total (P < 0.008) and worst dyskinesia scores (P <
0.003), shortening of the “time spent in ON with troublesome dyskinesias” (P < 0.02) and
lengthening of the “time spent in ON without troublesome dyskinesias” (P < 0.04).

The larger the additional plasticity generated by a single session of cTBSCB-ON→PAS, i.e.
[(MEPT15 after cTBSCB-ON→PAS) – (MEPT15 after ShamCB-ON→PAS)] / (MEPT15 after ShamCB-
ON→PAS), the greater was the decrease in the worst dyskinesia score after 10 days of
bilateral-cTBSCB-ON (P < 0.007, R2 = 0.6) (Fig. 6).
Figure 6: Efficacy of one session of real
cerebellar inhibitory stimulation in
enhancing PAS-induced plasticity is a
good predictor of the anti-dyskinetic
effect of 10 sessions of real, bilateral,
inhibitory stimulation of the
cerebellum.
Linear regression shows that the larger the additional effect on PAS after one session of real cerebellar
inhibitory stimulation over that of sham stimulation, the greater was the improvement in the worst
dyskinesias scores after 10 sessions of real bilateral cerebellar inhibitory stimulation.
2.4. Enhancement of PAS-induced plasticity paralleled the anti-dyskinetic effect
of 10 sessions of bilateral cTBSCB-ON
The results obtained in the 8 patients who had an extended follow-up for 8 weeks from
the end of the multiple sessions study are presented in Figure 7. PAS-induced plasticity
that was weak at baseline became strongly enhanced at the end of the 2nd week follow-up
and again dropped by the end of the 4th week follow-up (rANOVA: “FOLLOW-UP” F = 5.2,
P < 0.008; “TIME” F = 0.04, P = 0.9; no interaction F = 0.8, P = 0.5; Bonferroni: baseline
vs. 2nd week P < 0.005). A similar time course was observed for the anti-dyskinetic
effect. Indeed, both total and worst dyskinetic scores were significantly decreased at the
end of the 2nd week follow-up but were back to the baseline values by the end of the 4th
week (see Fig. 7C-D). The self-rated scores (“time spent in ON with and without

troublesome dyskinesia”) were also improved at the end of the 2nd week and remained so
till the end of the 4th week (Fig. 7E-F). The “time spent in OFF” did not change (Fig. 7B).
There was a trend for the improvement of the total dyskinesia score to correlate with the
additional effect of PAS-induced plasticity at the 2nd week follow-up compared to the
baseline (P = 0.07, R2 = 0.4).

Figure 7: Extended
follow-up after 10
sessions of real and
bilateral cerebellar
inhibitory stimulation.
A: Extended follow-up of
the M1 plasticity changes.
The mean MEP amplitude
normalized to the mean
pre-PAS value is plotted
against the time elapsed
from the end of the PAS.
PAS-induced effects are
compared among baseline,
2 weeks, 4 weeks and 8
weeks after completion of
the 10 days of bilateral real
cTBS stimulation of
cerebellum. A prominent
PAS effect was observed at
the end of the 2nd week
follow-up, lesser at the end
of the 4th week, and back to
the baseline level by the
end of the 8th week.
B-F: Extended follow-up of
dyskinesias and motor
fluctuations. Black bars represent the mean (± SEM) of the clinical scores at baseline and 2, 4 and 8 weeks
after the completion of 10 days of bilateral real cTBS of cerebellum. The total dyskinesia score (C) and the
worst dyskinesia score (D) were rated on videos by a blinded investigator. The time spent in ON without (E)
or with (F) troublesome dyskinesias as well as the duration of the OFF state (B) were self-rated by the
patients and recorded in their diaries. Total and worst dyskinesia scores were decreased at the end of the 2nd
week follow-up. “Time spent in ON without and with trouble some dyskinesias” were increased/decreased at
the 2nd and 4th week follow-up. Duration of the “Time spent in OFF” was not changed at these time points.

Discussion
The M1 of PD patients with LIDs in the present study had a poor or absent responsiveness
to a plasticity- induction protocols, be it PAS or iTBS, as in previous reports (Morgante et
al. 2006; Kishore et al. 2012). In striking contrast with the similar impairment of the
plasticity after PAS and iTBS, a single session of real cerebellar stimulation combined with
L-DOPA enhanced the PAS-induced plasticity, while it did not induce any change in the
iTBS-induced plasticity. The main difference between the 2 protocols is the involvement
of a sensory component in the PAS but not in the iTBS protocol. This points to the role of
a change in cerebellar sensory processing underlying the effect of cerebellar stimulation.
When repeated over 10 days, real inhibitory stimulation of cerebellum had an anti-
dyskinetic effect that was clearly superior to sham stimulation. This anti-dyskinetic effect
was accompanied by a sustained enhancement of the responsiveness of M1 to PAS; both
lasting for more than 2 weeks after the completion of the sessions, but lost by the end of
the 4th week.
Inhibitory stimulation of cerebellum reinstates sensori-motor plasticity of M1 in
dyskinetic PD
Inhibitory cerebellar stimulation in ON (applied either in a single session or repeatedly)
reinstates the responsiveness of M1 to PAS in dyskinetic PD patients. Cerebellar
stimulation could act by priming the M1 cortical excitability directly through the cerebello-
thalamo-cortical circuit (Koch et al. 2008) before the plasticity induction protocol to M1
was delivered. If it were true, then PAS- and iTBS-induced plasticity of M1 should be
similarly modulated after cerebellar stimulation. This was not the case, as iTBS-induced
plastic response of M1 was not modulated by cerebellar stimulation. It is unlikely that the
difference between the group sizes (n = 16 for PAS, n = 7 for iTBS) could bias the
difference observed; such a differential effect of cerebellar stimulation on PAS versus
iTBS-induced plasticity has been already reported in healthy young subjects and the
implications discussed in detail (Popa et al. 2013). The control experiments using iTBS of
M1 were only aimed at verifying whether this differential effect of cerebellar stimulation
was influenced by the presence of PD or by the age-related differences in baseline
responsiveness of M1 to a plasticity induction protocol (i.e. high in young healthy
subjects, low in PD patients who are older). Taken together, the results of the two
previous studies in young healthy subjects (Popa et al. 2013; Hamada et al. 2012) and
the present study in dyskinetic PD patients, suggest that cerebellar stimulation does not

influence M1 plasticity through a change in the tonic output of the cerebello-thalamo-
cortical pathway directly to M1. We propose that the effect of cerebellar stimulation in re-
establishing M1 responsiveness to PAS is mediated by a change of gain of the sensory
afferent volley reaching the motor cortex. This change could intervene either at the level
of the dentato-olivary complex, the cerebellar cortex or the thalamic nuclei (Popa et al.
2013). This argument is in keeping with the adaptive filtering role of the cerebellum on
sensory afferents (Dean et al. 2010). The possibility that cerebellar stimulation may
influence sensory processing in the primary somatosensory cortex was ruled out in
previous studies by the lack of change in cortical somatosensory-evoked potentials after
cerebellar stimulation in HV (Popa et al. 2013; Hamada et al. 2012). The lack of change
in SAI20ms after cTBSCB-ON→PAS compared to ShamCB-ON→PAS in the present study means
that cerebellar stimulation is unlikely to modulate the afferent volley in the pathway
activated in SAI20ms, which includes, most probably, the thalamic VP nucleus and M1
(Asanuma et al. 1980; Hirai and Jones 1988; Tokimura et al. 2000).
Cerebellar involvement in LIDs
Koch et al. (2009) have already shown that multiple sessions of bilateral cerebellar
inhibitory stimulation in ON lead to a sustained reduction of LIDs. The authors discussed
several potential mechanisms for this effect, but had not examined whether the clinical
benefit was accompanied by any change in the deficient M1 plasticity in ON that is
associated with LIDs and which contrasts with the preserved plasticity in those without
dyskinesias (Morgante et al. 2006; Kishore et al. 2012).
Two evidences from the current study support the view that the reduction of LIDs is linked
to the resurgence of M1 responsiveness to PAS after
cTBSCB-ON: (i) the larger the facilitation of M1 plasticity after a single session of cerebellar
inhibitory stimulation in ON in dyskinetic patients, the greater was the anti-dyskinetic
effect of 10 days of repeated stimulation in the same subjects at the end of 2nd week (Fig.
7); and (ii) the time course of the improvement of LIDs and that of the resurgence of M1
responsiveness to PAS after 10 cTBSCB-ON sessions was similar (Fig. 7). We also found
that patients with more severe pre-treatment LIDs showed a larger responsiveness of M1
to cTBSCB-ON→PAS (Fig. 4). This could be interpreted as an increasing involvement of the
cerebellum in the pathophysiology of dyskinesias as the severity of LIDs increases,
making cerebellar stimulation more effective in reversing the cerebellar dysfunction. The
critical involvement of the cerebellum in LIDs, but not in parkinsonian signs, (akinesia,
rigidity) is supported by our finding that 10 days of cerebellar inhibitory stimulation
improved the severity of LIDs and the “time spent in ON without troublesome

dyskinesias”, but not the duration of the OFF periods. Koch and colleagues (Koch et al.
2009) also observed that multiple sessions of cerebellar stimulation did not induce any
change in the UPDRS motor scores.
It is worth noting that there was a temporal dissociation between the responses of the
physiological parameter (resurgence of responsiveness of M1 to PAS) and the clinical
measure (severity of LIDs) after cerebellar stimulation. While one session of cTBSCB-ON was
able to immediately influence the responsiveness of M1 to PAS, multiple sessions were
necessary for the antidyskinetic effects to occur. This does not contradict the study by
Koch (Koch et al 2009) in which a weak beneficial effect of one session of bilateral cTBS-
CB on the dyskinesia score was found 30 and 45 min after the stimulation, but not later
on.
This is in line with the accepted view that cumulative effects of multiple sessions of rTMS
are necessary to influence clinical symptoms (Khedr et al. 2006; Lomarev et al. 2006;
Huang et al. 2012; Popa et al. 2013). This might indicate that different mechanisms
support the physiological effects seen after one session and the clinical effects seen after
multiple sessions. While the effects of one session of rTMS are linked to LTP/LTD
mechanisms, how multiple sessions work is still not fully understood. Putative
mechanisms include post-synaptic changes of GABA receptors, metaplasticity that induces
a slide of the threshold for inducing LTP/LTD, and structural changes of the synapses.
Is the effect of cerebellar inhibitory stimulation on the responsiveness of M1 to
PAS, dependent on dopamine?
The results of the study raise the question whether dopamine is necessary for the effect
of cerebellar inhibitory stimulation to develop. In this study it was noted that plasticity
induced by 5Hz PAS (Quartarone et al. 2006) is smaller in the older healthy volunteers
than the effect reported in the young healthy volunteers in our earlier study (Popa et al.
2013), even if responsiveness to PAS did not correlate well with age within our HV group.
This is similar to and reinforces the observations of studies using the classical PAS, that
the responsiveness of M1 to PAS is critically dependent on age (Muller-Dahlhaus et al.
2008; Fathi et al. 2010). It also highlights the need for an appropriately age-matched
control group when cortical plasticity is measured. The loss of ability of cerebellar
inhibitory stimulation to modulate M1 plasticity in the older healthy volunteers was
unexpected and contrasted with the dramatic effect of cerebellar stimulation on dyskinetic
PD patients who were tested in ON. It is plausible that the decline in striatal dopamine
levels with aging (Fearnley et al. 1991; Kish et al. 1992; Cordes et al. 1994; Darbin 2012)

and the low responsiveness of M1 to plasticity induction with aging (whatever its origin,
including a possible role of the low dopamine levels) are responsible for the lack of effects
of cerebellar stimulation in older healthy volunteers. Dyskinetic PD patients in ON also
had a similar low responsiveness of M1 to plasticity induction, but they are known to have
abnormally high striatal synaptic dopamine release after exogenous L-DOPA intake (de la
Fuente et al. 2004). This replenishment of dopamine could be a key factor that facilitates
the effect of cerebellar stimulation to occur.
Previous studies have speculated whether the worsening of proprioception (O’Suilleabhain
et al. 2001; Zia et al. 2004) and /or of SAI (Sailer et al. 2003, 2007) caused by
dopaminergic drugs may contribute to dyskinesias. While LAI was found to be lost or
even replaced by a small facilitation in PD patients OFF drugs in a previous report (Sailer
et al. 2003, 2007), LAI was present in the dyskinetic patients OFF drugs in the present
study. The discrepancy between the results might be explained by the differences in the
intensities used by us for median nerve stimulation which were always below the motor
twitch and therefore lower than in the previous studies (Sailer et al. 2003, 2007). As in
their study, LAI was not influenced by dopamine intake suggesting that LAI may be
related to non-dopaminergic features of PD (Sailer et al. 2007). Circuits supporting LAI
are not precisely known, but may involve cortical areas other than M1 and S1 or even
sub-cortical areas. However, as LAI was not modified by cerebellar stimulation in HV or
PD patients, it is unlikely that cerebellum is part of the LAI circuit.
In this study, SAI20ms was reduced in ON in dyskinetic patients when compared to OFF.
This effect of L-DOPA is congruent with an earlier report (Sailer et al. 2003) in which it
was tentatively explained by an inhibitory effect of dopamine on the response of
pyramidal and non-pyramidal neurons in M1 to inputs from the ventrolateral thalamus, as
observed in cats. The decrease of SAI20ms in ON could be the confirmation that dopamine
enhances M1 excitability at the cost of impairing the normal inhibitory response to
peripheral stimuli in the lemniscal pathway. This decreased inhibition of M1 in ON when
combined with the increase in the gain of the peripheral afferent input triggered by the
cerebellar cortex inhibition may lead to the enhancement of the responsiveness of M1 to
PAS after cerebellar inhibitory stimulation in PD patients in ON. However, the fact that SAI
is impaired irrespective of whether the patients had LIDs (the present study) or not
(Sailer et al. 2003) does not support a direct role of altered SAI in LIDs.

It is still debatable to what extent the level of striatal dopamine influences the effects of
cerebellar stimulation. We cannot rule out the possibility that cerebellar inhibitory
stimulation by itself, in the absence of L-DOPA, may have some effect on PAS-induced
plasticity in dyskinetic PD, as the patients in the present study were not tested with
cerebellar inhibitory stimulation in OFF. Another potential confounding factor is the
influence of the chronic dopaminergic treatment in PD when compared with healthy
volunteers. Future studies will therefore have to test the effect of cerebellar inhibitory
stimulation on PAS-induced plasticity, both alone and when combined with dopamine
replacement therapy, in early, untreated PD.
Cerebellum versus striatal involvement in dyskinesia
The view that cerebellum is involved in LIDs might appear to be in contradiction to the
existing view that LIDs are due to increased activity in the motor areas, secondary to the
abnormal output in the striato-thalamo-cortical circuit. Neuroimaging studies have found
increased activity of motor and premotor areas in dyskinetic PD patients when compared
to non-dyskinetic patients (Rascol et al. 1998; Brooks et al. 2000). This led to the view
that hyperactivity in cortical motor areas might be responsible for LIDs (Bezard et al.
2001, Koch et al. 2005). However, the results of studies using 1 Hz rTMS of SMA (Koch
et al. 2005; Brusa et al. 2006) or of M1 (Wagle Shukhla et al. 2007; Filipovic’ et al. 2009)
to reduce dyskinesias were conflicting. Even multiple sessions of rTMS failed to show
more than a transient or mild improvement in dyskinesias. In comparison to these
results, the antidyskinetic effect of cerebellar inhibition demonstrated in an earlier study
(Koch et al. 2009) and confirmed by the present study, are more robust and lasted up to
4 weeks. In a recent study, a global reduction in metabolism in bilateral cerebellar
hemispheres and dentate nuclei was found after multiple sessions of cerebellar cTBS that
led to reduction in LIDs in PD patients (Brusa et al. 2012). These evidences indicate that
the cerebellum is excessively active in dyskinesias and that this activity might play an
important role in the pathophysiology of dyskinesias. Cerebellar cTBS may act by
reversing the overactivity. SMA, pre-motor cortex and M1 are all targets of cerebellar
output (Akkal et al. 2007). Therefore altered cerebellar outputs might indeed trigger
abnormal fMRI activations in such areas, yet make them less suitable targets for a direct
stimulation for the treatment of LIDs.
We propose that the abnormal signaling within the striato-thalamo-cortical circuit,
possibly due to non-physiological and excessive release of striatal synaptic dopamine in

dyskinetic patients (de la Fuente Fernandez, 2004), could impinge on the cerebello-
thalamo-cortical circuit either at the cortical level or at a sub-cortical level through
topographically specific connections (Hoshi et al. 2005; Bostan et al. 2010). The lack of
cerebellar stimulation effects on intrinsic M1 plasticity (as evoked by iTBSM1) and on M1
excitability (measured by RMT, AMT, SICI, LICI) argue against an interaction at the
cortical level. Anatomical data have shown that the subthalamic nucleus (STN) is
connected to the cerebellar cortex through the pontine nuclei via an excitatory
glutamatergic pathway (Bostan et al. 2010). This pathway could be a good candidate for
the transmission of signals between the two circuits (schematically shown in Fig.8). An
interaction between the two circuits has been suggested to drive the tremor in PD
(Helmich et al. 2011). Such a propagation from basal ganglia circuits could affect the
normal modulatory filtering/processing of the sensory afferents by the cerebellum,
resulting in relevant sensory inputs to the cerebellum not getting transformed into motor-
relevant output signals to M1, thus leading to dyskinetic movements. Cerebellar
inhibitory stimulation, by increasing the final gain of the sensory volley before projecting
to M1, may attenuate this defect and reduce the severity of dyskinesias.
Figure 8: Schematic
diagram showing the
interconnections of the
basal ganglia and
cerebellar circuits.
PMC = premotor cortex, M1
= primary motor cortex,
SMA = supplementary
motor area, GPe = Globus pallidus externum, GPi = Globus pallidus internum, STN = subthalamic nucleus,
SNc = substantia nigra pars compacta, SNr = substantia nigra pars reticulata, VA = ventral anterior thalamic
nucleus, VLp = posterior part of the ventrolateral thalamic nucleus, VP = ventral posterior thalamic nucleus,
DN = dentate nucleus, CBctx = cerebellar cortex.

Conclusion
The results of the present study bring a new insight into the functional connectivity
between the basal ganglia and the cerebellum in human PD. Exploiting the pathological
model offered by the dyskinetic state of advanced PD, this study strengthens the existing
view of an involvement of the cerebellum in LIDs and raise a new hypothesis on how
changes in the striatal levels of dopamine may negatively impact the activity of the
cerebello-thalamo-cortical network. Alterations in the cerebellar sensory processing
function in advanced PD could lead to an inappropriate filtering of the relevant sensory
volley that is responsible for a maladaptive state of cortical plasticity. Such a maladaptive
state could predispose to the selection of abnormal motor programs thereby generating
abnormal movements. Cerebellar inhibition, by increasing the gain of the sensory
afferent volley to M1, permits better sensori-motor integration, thereby reducing
involuntary movements.
Funding
This study was funded by Sree Chitra Tirunal Institute for Medical science and Technology
(SCTIMST), Kerala, India (In-house project: 5171). T.P. and S.M were supported by
Institut National de la Santé et de la Recherche Médicale (INSERM). S.M. benefited from a
‘‘contrat d’ interface’’ from Assistance Publique Hopitaux de Paris (AP-HP).
Acknowledgement
We thank Gangadhara Sarma for coordinating the study, Mary Glenda for technical
assistance and all the subjects for participating in the study. The Indo-French co-
operation for this study was possible through a collaborative program between the Indian
Council of Medical Research (ICMR) and the Institut National de la Santé et de la
Recherche Médicale (INSERM).
References
Akkal D, Dum RP, Strick PL. 2007. Supplementary motor area and presupplementary motor area: targets of
basal ganglia and cerebellar output. Journal of Neurosci. 27:10659-‐10673.
Asanuma H, Larsen K, Yumiya H. 1980. Peripheral input pathways to the monkey motor cortex. Exp Brain Res.
38:349–355.
Bezard E, Brotchie JM, Gross CE. 2001. Pathophysiology of levodopa-‐induced dyskinesia: potential for new
therapies. Nat Rev Neurosci. 2:577–588.
Bostan AC, Dum RP, Strick PL. 2010. The basal ganglia communicate with the cerebellum. Proc Natl Acad Sci
USA. 107:8452–8456.
Brooks DJ, Piccini P, Turjanski N, Samuel M. 2000. Neuroimaging of dyskinesia. Ann Neurol. 47:S154–158.
Brusa L, Versace V, Koch G, Iani C, Stanzione P, Bernardi G, Centazone D. 2006. Low frequency rTMS of the
SMA transiently ameliorates peak-‐dose LID in Parkinson’s disease. Clin Neurophysiol. 117:1917–1921.
Brusa L, Ceravolo R, Kiferle L, Monteleone F, Iani C, Schillaci O, Stanzione P, Koch G. 2012. Metabolic changes
induced by theta burst stimulation of cerebellum in dyskinetic Parkinson’s disease patients. Parkinsonism and
relat disord. 18:59-‐62.
Cordes M, Snow BJ, Cooper S, Schulzer M, Pate BD, Ruth TJ, Calne DB. 1994. Age-‐dependent decline of
nigrostriatal dopaminergic function: a positron emission tomographic study of grandparents and their
grandchildren. Ann Neurol. 36: 667-‐70.
Darbin O. 2012. The aging striatal dopamine function. Parkinsonism Relat Disord. 18: 426-‐32.
Dean P, Porrill J, Ekerot CF, Jörntell H. 2010. The cerebellar microcircuit as an adaptive filter: experimental and
computational evidence. Nat Rev Neurosci. 11: 30-‐43.
Defer GL, Widner H, Marie RM, Remy P, Levivier M. 1999. Core assessment program for surgical interventional
therapies in Parkinson’s disease (CAPSIT-‐PD). Mov Disord. 14:572–584.
de la Fuente-‐Fernandez R, Sossi V, Huang Z, Furtado S, Lu JQ, Calne DB, Ruth TJ, Stoessl AJ. 2004. Levodopa-‐
induced changes in synaptic dopamine levels increase with progression of Parkinson’s disease: implications for
dyskinesias. Brain. 127: 2747–2754.

Fahn S, Elton RL and members of the UPDRS development committee. Unified Parkinson’s Disease rating scale.
1987. In: Fahn S, Marsden CD, Calne DB, Goldstein M, editors. Recent developments in Parkinson’s disease.
New Jersey: Macmillan.
Fathi D, Ueki Y, Mima T, Koganemaru S, Nagamine T, Tawfik A, Fukuyama H. 2010. Effects of aging on the
human motor cortical plasticity studied by paired associative stimulation. Clin Neurophysiol. 121:90-‐93.
Fearnley JM, Lees AJ. 1991. Ageing and Parkinson’s disease: substantia nigra regional selectivity. Brain.
14:2283-‐2301.
Filipović SR, Rothwell JC, van de Warrenburg BP, Bhatia K. 2009. Repetitive transcranial magnetic stimulation for
levodopa-‐induced dyskinesias in Parkinson's disease. Mov Disord. 24:246-‐253.
Fisher RJ, Nakamura Y, Bestmann S, Rothwell JC, Bostock H. 2002. Two phases of intracortical inhibition
revealed by transcranial magnetic threshold tracking. Exp Brain Res. 143: 240-‐248.
Hamada M, Strigaro G, Murase N, Sadnicka A, Galea JM, Edwards MJ, Rothwell JC. 2012. Cerebellar
modulation of human associative plasticity. J Physiol. 590:2365-‐2374.
Helmich RC, Janssen MJ, Oyen WJ, Bloem BR, Toni I. 2011. Pallidal dysfunction drives a cerebellothalamic circuit
into Parkinson tremor. Ann Neurol. 69: 269-‐281.
Hoshi E, Tremblay L, Féger J, Carras PL, Strick PL. 2005. The cerebellum communicates with the basal ganglia.
Nat Neurosci. 8:1491-‐1493.
Huang YZ, Edwards MJ, Rounis E, Bhatia KP, Rothwell JC. 2005. Theta burst stimulation of the human motor
cortex. Neuron. 45:201-‐206.
Huang YZ, Rothwell JC, Lu CS, Chuang WL, Chen RS. 2011. Abnormal bidirectional plasticity-‐like effects in
Parkinson’s disease. Brain. 134: 2312-‐2320.
Huang YZ, Lu CS, Rothwell JC, Lo CC, Chuang WL, Weng YH, Lai SC, Chen RS. 2012. Modulation of the disturbed
motor network in dystonia by multisession suppression of premotor cortex. PLoS One. doi:
10.1371/journal.pone.0047574.
Hughes AJ, Daniel SE, Kilford L, Lees AJ. 1992. Accuracy of clinical diagnosis of idiopathic Parkinson’s disease: a
clinico-‐pathological study of 100 cases. J Neurol Neurosurg Psychiatry. 55:181-‐184.
Khedr EM, Rothwell JC, Shawky OA, Ahmed MA, Hamdy A.2006. Effect of daily repetitive transcranial magnetic
stimulation on motor performance in Parkinson's disease. Mov Disord. 21: 2201-‐5.

Kish SJ, Shanna k K, Rajput A, Deck JH, Hornykiewicz O.1992. Aging produces a specific pattern of striatal
dopamine loss: implications in the etiology of idiopathic Parkinson’s disease. J. Neurochem. 58:642-‐648.
Kishore A, Popa T, Velayudhan B, Joseph T, Balachandran A, Meunier S. 2012. Acute dopamine boost has a
negative effect on plasticity of primary motor cortex in advanced Parkinson’s disease. Brain. 135:2074-‐2088.
Koch G, Mori F, Marconi B, Codeca C, Pecchioli C, Salerno S, Torriero S, Lo Gerfo E, Mir P, Olivieri M, Caltagirone
C. 2008. Changes in intracortical circuits of the human motor cortex following theta burst stimulation of the
lateral cerebellum. Clin Neurophysiol. 119:2559-‐2569.
Koch G, Brusa L, Carrillo F, Lo Gerfo E, Torriero S, Oliveri M, Mir P, Caltagirone C, Stanzione P. 2009. Cerebellar
magnetic stimulation decreases levodopa-‐induced dyskinesias in Parkinson disease. Neurology. 73:113-‐119.
Koch G, Brusa L, Caltagirone C, Peppe A, Oliveri M, Stanzione P, Centonzone D. 2005. rTMS of supplementary
motor area modulates therapy-‐induced dyskinesias in Parkinson disease. Neurology. 65:623-‐625.
Kojovic M, Bologna M, Kassavetis P, Murase N, Palomar FJ, Berardelli A, Rothwell JC, Edwards MJ, Bhatia KP.
2012. Functional reorganization of sensorimotor cortex in early Parkinson’s disease. Neurology. 78:1441-‐1448.
Lomarev MP, Kanchana S, Bara-‐Jimenez W, Iyer M, Wassermann EM, Hallett M. 2006. Placebo-‐controlled study
of rTMS for the treatment of Parkinson's disease. Mov Disord. 21:325-‐31.
Morgante F, Espay AJ, Gunraj C, Lang AE, Chen R. 2006. Motor cortex plasticity in Parkinson’s disease and
levodopa-‐induced dyskinesias. Brain. 129:1059-‐1069.
Muller-‐Dahlhauss JFM, Orekhov Y, Lin Y, Ziemann U. 2008. Interindividual variability and age-‐dependency of
motor cortex plasticity induced by paired associative stimulation. Exp Brain Res.187:467-‐475.
Nimura T, Ando T, Yamaguchi K, Nakajima T, Shirane R, Itoh M, Tominaga T. 2004. The role of sigma receptors in
levodopa-‐induced dyskinesia in patients with advanced Parkinson disease: a positron emission tomography
study. J Neurosurg.100:606–610.
Oldfield BC. 1971. The assessment and analysis of handedness: the Edinburgh inventory. Neurospychologia.
9:97-‐113.
O’Suilleabhain P, Bullard J, Dewey RB. 2001. Proprioception in Parkinson’s
disease is acutely depressed by dopaminergic medications. J Neurol
Neurosurg Psychiatry. 71:607–610.

Picconi B, Paillé V, Ghiglieri V, Bagetta V, Barone I, Lindgren HS, Bernardi G, Cenci AM, Calabresi P. 2008. L-‐
DOPA dosage is critically involved in dyskinesia via loss of synaptic depotentiation. Neurobiol Dis. 9:327-‐335.
Popa T, Russo M, Meunier S. 2010. Long-‐lasting inhibition of cerebellar output. Brain Stim.3:161–169.
Popa T, Velayudhan B, Hubsch C, Pradeep S, Roze E , Vidailhet M, Meunier S, Kishore A. 2013. Cerebellar
processing of sensory inputs primes motor cortex plasticity. Cerebral Cortex.23:305-‐314
Popa T, Russo M, Vidailhet M, Roze E, Lehéricy S, Bonnet C, Apartis E, Legrand AP, Marais L, Meunier S, Gallea C.
2012 b. Cerebellar rTMS stimulation may induce prolonged clinical benefits in essential tremor, and subjacent
changes in functional connectivity: An open label trial. Brain Stimul. do i:10.1016/j.brs.2012.04.009
Quartarone A, Rizzo V, Bagnato S, Morgante F, Sant'Angelo A, Girlanda P, Siebner HR. 2006. Rapid-‐rate paired
associative stimulation of the median nerve and motor cortex can produce long-‐lasting changes in motor cortical
excitability in humans. J Physiol.575:657-‐670.
Rascol O, Sabatini U, Brefel C, Fabre N, Rai S, Senard JM, Celsis P, Viallard G, Montastruc JL, Chollet F. 1998.
Cortical motor overactivation in parkinsonian patients with L-‐dopa-‐induced peak-‐dose dyskinesia. Brain.
121:527–533.
Raz N, Rodrigue KM, Kennedy KM, Dahle C, Head D, Acker JD. 2003. Differential age-‐related changes in the
regional metencephalic volumes in humans : a 5-‐year follow-‐up. Neurosci Lett. 349:163-‐166.
Rossi S, Hallett M, Rossini PM, Pascual-‐Leone A; Safety of TMS Consensus Group.2009. Safety, ethical
considerations, and application guidelines for the use of transcranial magnetic stimulation in clinical practice
and research. Clin Neurophysiol.120:2008-‐2039.
Sailer A, Molnar GF, Paradiso G, Gunraj CA, Lang AE, Chen R. 2003. Short and long latency afferent inhibition in
Parkinson’s disease. Brain.126:1883–1894.
Sale MV, Ridding MC, Nordstrom MA. 2007. Factors influencing the magnitude and reproducibility of
corticomotor excitability changes induced by paired associative stimulation. Exp Brain Res.181:615-‐626.
Shadmehr R, Smith MA, Krakauer JW. 2010. Error correction, sensory prediction, and adaptation in motor
control. Annu Rev Neurosci.33: 89-‐108.
Stoodley CJ, Schmahmann JD. 2009. Functional topography in the human cerebellum: a meta-‐analysis of
neuroimaging studies. NeuroImage. 44:489-‐501.

Tokimura H, Di Lazzaro V, Tokimura Y, Oliviero A, Profice P, Insola A, Mazzone P, Tonali P, Rothwell JC. 2000.
Short latency inhibition of human hand motor cortex by somatosensory input from the hand. J Physiol.523: 503-‐
513.
Wagle-‐Shukla A, Angel MJ, Zadikoff C, Enjati M, Gunraj C, Lang AE, Chen R. 2007. Low-‐frequency repetitive
transcranial magnetic stimulation for treatment of levodopa-‐induced dyskinesias. Neurology.68:704-‐5.
Zia S, Cody F, O’Boyle D. 2000. Joint position sense is impaired by Parkinson’s disease. Ann Neurol.47:218–28.