design, ancillary testing, analysis, and fabrication data for the ...
Upload
independentCategory
view
0download
0
Central Pulse Pressure in Chronic Kidney Disease: A CRICAncillary Study
Raymond R. Townsenda, Julio A. Chirinosa, Afshin Parsab, Matthew A. Weirb, Stephen M.Sozioc, James P. Lashd, Jing Chene, Susan P. Steigerwaltf, Alan S. Gog, Chi-yuan Hsug,h,Mohammed Rafeyi, Jackson T. Wright Jr.j, Mark J. Duckwortha, Crystal A. Gadegbekuk, andMarshall P. Joffea,l on behalf of the Chronic Renal Insufficiency Cohort (CRIC) InvestigatorsaDepartment of Medicine, University of Pennsylvania, Philadelphia, PAbDepartment of Medicine, University of Maryland School of Medicine, Baltimore, MDcDepartment of Medicine, Johns Hopkins University School of Medicine, Baltimore, MDdDepartment of Medicine, University of Illinois, Chicago, ILeTulane University Schools of Medicine and Public Health and Tropical Medicine, New Orleans,LouisianafDepartment of Medicine, St John Hospital and Medical Center and Wayne State University Schoolof Medicine, Detroit, MIgDivision of Research, Kaiser Permanente of Northern California, Oakland, CAhDivision of Nephrology, Department of Medicine, University of California, San Francisco, CAiDepartment of Nephrology and Hypertension, Cleveland Clinic Foundation, Cleveland, OHjDivision of Nephrology and Hypertension, University Hospitals Case Medical CenterkUniversity of Michigan Health System, Department of Internal Medicine, Division of Nephrology,Ann Arbor, MIlCenter for Clinical Epidemiology & Biostatistics, University of Pennsylvania, Philadelphia, PA
AbstractCentral pulse pressure can be non-invasively derived using the radial artery tonometric methods.Knowledge of central pressure profiles has predicted cardiovascular morbidity and mortality inseveral populations of patients, particularly those with known coronary artery disease and thosereceiving dialysis. Few data exist characterizing central pressure profiles in patients with mild-moderate chronic kidney disease who are not on dialysis. We measured central pulse pressure cross-sectionally in 2531 participants in the Chronic Renal Insufficiency Cohort study to determinecorrelates of the magnitude of central pulse pressure in the setting of chronic kidney disease. Tertilesof central pulse pressure (CPP) were < 36 mmHg, 36–51 mmHg and > 51 mmHg with an overallmean (± S.D.) of 46 ± 19 mmHg. Multivariable regression identified the following independent
Corresponding Author: Raymond R. Townsend, MD, University of Pennsylvania, 122 Founders Building, 3400 Spruce Street,Philadelphia, PA 19104, 215-662-4630 Office, 215-662-3459 Facsimile, [email protected]'s Disclaimer: This is a PDF file of an unedited manuscript that has been accepted for publication. As a service to our customerswe are providing this early version of the manuscript. The manuscript will undergo copyediting, typesetting, and review of the resultingproof before it is published in its final citable form. Please note that during the production process errors may be discovered which couldaffect the content, and all legal disclaimers that apply to the journal pertain.Conflict of Interest Statement: The Corresponding author (RRT) received funding from the NIH/NIDDK. There is no other COI to declare.
NIH Public AccessAuthor ManuscriptHypertension. Author manuscript; available in PMC 2011 September 1.
Published in final edited form as:Hypertension. 2010 September ; 56(3): 518–524. doi:10.1161/HYPERTENSIONAHA.110.153924.
NIH
-PA Author Manuscript
NIH
-PA Author Manuscript
NIH
-PA Author Manuscript

correlates of central pulse pressure: age, gender, diabetes mellitus, heart rate (negatively correlated),glycosylated hemoglobin, hemoglobin, glucose and PTH concentrations. Additional adjustment forbrachial mean arterial pressure and brachial pulse pressure showed associations for age, gender,diabetes, weight and heart rate. Discrete intervals of brachial pulse pressure stratification showedsubstantial overlap within the associated central pulse pressure values. The large size of this uniquechronic kidney disease cohort provides an ideal situation to study the role of brachial and centralpressure measurements in kidney disease progression and cardiovascular disease incidence.
KeywordsElasticity; epidemiology; diabetic nephropathies; hemodynamics; gender
IntroductionChronic kidney disease (CKD) confers a substantial risk of cardiovascular target organ damage,especially when kidney function falls below 60 mL/min/1.73m2 corresponding to NationalKidney Foundation stages 3, 4 and 5 1 2 that appears inadequately explained by traditionalcardiovascular risk factors 3. One goal of the Chronic Renal Insufficiency Cohort (CRIC) studyis to examine traditional and novel risk factors for cardiovascular target organ damage and forprogressive loss of kidney function in a diverse population with CKD 4. High blood pressureis known to influence the course of kidney disease progression 5. In recent years some datasuggest that the pulse pressure (the difference of systolic and diastolic blood pressure) asderived from the standard brachial blood pressure measurement is better correlated thantraditional blood pressure measures (systolic, diastolic) to the rate at which estimatedglomerular filtration rates (eGFR) decline in CKD 6.
Measurements of central pulse pressure have been used for more than two decades in an attemptto improve further upon the predictive value of standard brachial blood pressure measurements7. Studies have shown that there is substantial variability in the level of blood pressure in theaorta between people with similar brachial blood pressure measurements that is difficult toestimate without performing either an invasive or a non-invasive assessment of aortic pressure8. The increasing use of validated non-invasive devices that estimate central blood pressureprofiles based on radial artery tonometry has facilitated the incorporation of thesemeasurements into prospective cohort studies such as the Anglo-Cardiff Collaborative Trial9, the Strong Heart Study 10 and CRIC (which included measurements of central (aortic) pulsepressure using radial artery tonometry as an ancillary study beginning in 2005).
Aging has a marked effect upon the relationship between central and brachial pulse pressure,as does female gender 11. However, little is known about the determinants of central aorticpressure pulse in the setting of CKD. Thus we aimed to determine clinical factors independentlyassociated with central pulse pressure in CKD, and to evaluate how well brachial pulse pressurecorrelates with central pulse pressure in a large, ethnically diverse population of men andwomen with CKD.
MethodsParticipants
Enrollment characteristics of the CRIC study have been previously described in detail 12.Central aortic pulse pressure measurements were adopted into the CRIC protocol beginning atthe second annual follow-up visit and all participants enrolled in the CRIC study were invitedto become part of this ancillary protocol. The procedures were approved by the InstitutionalReview Boards at the 7 clinical centers and all participants provided written informed consent.
Townsend et al. Page 2
Hypertension. Author manuscript; available in PMC 2011 September 1.
NIH
-PA Author Manuscript
NIH
-PA Author Manuscript
NIH
-PA Author Manuscript

ProceduresCentral pulse pressure measurements were performed supine after at least 5 minutes of restusing the Sphygmocor PVx System (AtCor Medical, West Ryde, Australia) via the right radialartery at all CRIC sites. All personnel were trained and certified to take blood pressuremeasurements in the dominant arm with a Tyco aneroid sphygmomanometer using AmericanHeart Association standards and to perform the central pressure measurements using radialartery tonometry 13 14. The operator captured 10 seconds of stable radial artery waveform.Pulse pressure was defined as the difference between the systolic and the diastolic bloodpressure in mmHg. When this data was derived from standard blood pressure measurement itwas brachial PP; when derived by algorithm from the radial artery waveform it was CPP.
Laboratory measuresHemoglobin values were measured directly at the laboratories of each of the centers. Standardlaboratory testing (e.g. serum creatinine, glucose, uric acid, calcium and phosphorous, etc.)was performed at the CRIC central laboratory in the University of Pennsylvania. The estimatedglomerular filtration rate (eGFR) was determined according to the abbreviated MDRD formulausing creatinine values calibrated to the Cleveland Clinic Laboratory 15. Some laboratoryresults were only available at the baseline visit and are noted in Table 1.
RaceRace was classified as American Indian/Alaskan Native, Asian/Asian American, Black/African American, Native Hawaiian/Other Pacific Islander or White/Caucasian based onparticipant self-report.
Central Pulse Pressure DataThe data reported here represent central aortic pulse pressure measures obtained on participantswhose second annual follow up visit occurred on or before March 31, 2009. The augmentationindex is a ratio that reflects the portion of the central pulse pressure derived from pulse wavereflection.
Statistical AnalysesContinuous data are presented as mean ± standard deviation (S.D.). Categorical variables areexpressed as proportions. Independent variables were pre-specified for analyses based onprevious studies showing a relation to central pulse pressure (such as age, systolic bloodpressure) or because they may affect pulse pressure and are known to be affected by kidneydisease (such as calcium, hemoglobin). A plot of central pulse pressure in our populationshowed a substantial rightward skew and analyses were performed on both raw CPP data andnatural-log-transformed data. Univariable regression models for central pulse pressure wereused to assess the relationship between CPP and the selected variable. We performedmultivariable linear regression to examine the associations between variables of interest andcentral pulse pressure 16. All parameters significant at a p≤0.20 level in univariable regressionwere entered into both forward and backward selection algorithms. Where variables wereknown to be strongly correlated with each other (e.g. serum creatinine and eGFR) only the onewith the stronger association was entered. Variables significant at the p≤0.05 level in themultivariable model were retained in the final model.
We considered two multivariable regression models: one with LnCPP as the outcome,without measures of brachial blood pressure as predictor; and one with LnCPP as the outcome,including measures of natural log-transformed brachial pulse pressure and brachial meanarterial pressure as predictors. All multivariable models were adjusted for clinical site.Analyses were executed in SAS 9.1 (SAS Institute, Cary, NC).
Townsend et al. Page 3
Hypertension. Author manuscript; available in PMC 2011 September 1.
NIH
-PA Author Manuscript
NIH
-PA Author Manuscript
NIH
-PA Author Manuscript

ResultsDemographic characteristics of all participants eligible for central pulse pressure measurementat the year 2 follow up visit of the CRIC cohort are shown in Table 1, overall and stratified bythose who did or did not have a successful central pulse pressure measurement. We anticipateddata loss on approximately 20% of participants (due to arrhythmia and other difficulties withwaveform capture) and we were unable to obtain or use measurements on 746 of 3277 eligibleparticipants (22.7%).
Figure 1 shows the frequency distribution of central pulse pressure determinations in the overallsample and stratified by diabetes status. The tertiles of the central pulse pressure were < 36mmHg, 36–51 mmHg and > 51 mmHg with an overall mean value of 46 ± 19 (S.D.).
Figure 2 presents mean central pulse pressure values for the cohort by strata of renal functionthat correspond to CKD stages. Given the large number of participants in CKD stage 3 (30–59.9 mL/min/1.73m2 we divided this stage into stage 3A (45–59.9 mL/min/1.73m2) and 3B(30–44.9 mL/min/1.73m2). Each 10 mL/min/1.73m2 decrement in eGFR was associated withan increase in central pulse pressure of about 2.5 mmHg (Table 2). A central pulse pressure of50 mmHg was recently shown to be a significant independent predictor of cardiovascularoutcomes in the Strong Heart Study where it represented the lower boundary of the highestquartile 17. Figure 2 shows the increasing proportion (%) of those within each declining eGFRstrata in CRIC that had a central pulse pressure ≥ 50 mmHg.
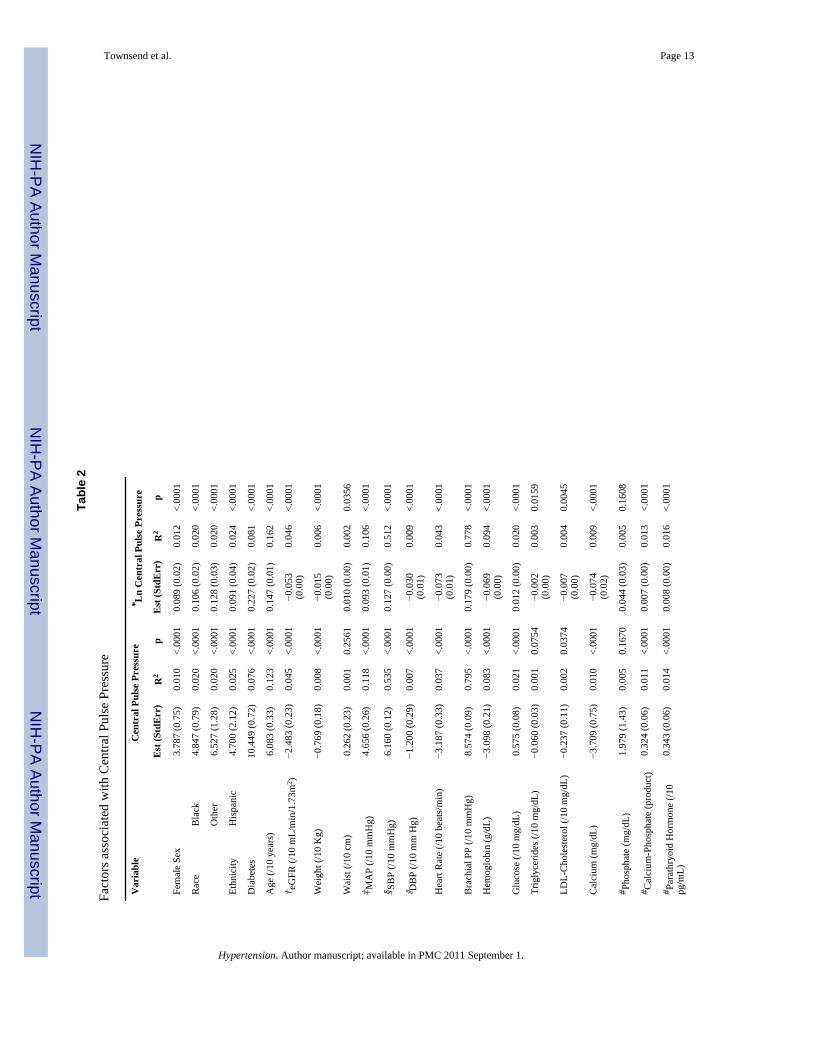
Table 2 displays the results of univariable regression of demographic, hemodynamic andlaboratory data of our participants on central pulse pressure. The strongest univariableassociations with central pulse pressure were presence of diabetes, brachial pulse pressure andbrachial systolic blood pressure, decade of age, female gender, non-white ethnicity, serumcalcium, the number of antihypertensive medications taken regularly and lower eGFR level.
Multivariable analyses are described in Table 3a–3c. In the absence of an adjustment forbrachial blood pressure (Table 3a), there were independent contributions to the natural log-transformed central pulse pressure (LnCPP) that included age (10 years), gender, diabetes,heart rate, glycosylated hemoglobin (HbA1C), hemoglobin, glucose and serum PTHconcentration at baseline. When brachial pulse pressure and brachial mean arterial pressurewere incorporated into the model (Table 3b) gender was the strongest non-blood pressurepredictor term for LnCPP followed by age (10 years), diabetes, weight (per 10 kg) and heartrate. Weight and heart rate had negative influences on LnCPP. Glucose, glycosylatedhemoglobin, hemoglobin and PTH concentrations were no longer independently associatedwith LnCPP. Table 3c shows that most of the variability in the multivariable model predictingLnCPP is explained from the natural log-transformed brachial pulse pressure. In thesupplemental Table (online) we expanded our multivariable regression incorporating the timeto central wave reflection (Tr) and augmentation index into the model to pursue these avenuesas possible mechanisms by which these clinical factors might influence CPP, demonstratingthat addition of augmentation index may mediate the effect of several clinical predictors ofCPP, while aortic Tr was not a predictor of CPP in univariate or multivariable analysis. Werefer the reader to the supplemental data section available at http://hyper.ahajournals.org forfurther details.
When discrete intervals of brachial pulse pressure were plotted against their correspondinglevels of central pulse pressure there was a substantial overlap within the associated centralpulse pressure values (Figure 3).
Townsend et al. Page 4
Hypertension. Author manuscript; available in PMC 2011 September 1.
NIH
-PA Author Manuscript
NIH
-PA Author Manuscript
NIH
-PA Author Manuscript

DiscussionWe performed central aortic pressure measurements on a population of 2531 participantsrecruited specifically with impaired kidney function but not on dialysis, of whomapproximately half were diabetic. Our results indicate that that central pulse pressure valuesare positively and independently correlated with increasing brachial pulse pressure, older age,female gender and the presence of diabetes in a population of participants with CKD. Inaddition we found a significant, though weaker, negative correlation between weight and heartrate, as noted in some other studies of central blood pressure 18. Our results confirm a substantialoverlap in central pulse pressures when participants are stratified by discrete levels of brachial-derived pulse pressures (Figure 3). This report adds to the literature because it examined auniquely large cohort with a spectrum of kidney dysfunction at high cardiovascular risk, apopulation infrequently studied using central pressure measures. Reproducibility of centralblood pressure measurements has been shown by others in non-CKD populations 19 20. Inaddition our prior work in this CKD population as well as that of others21 22 shows goodreproducibility supporting the validity of these findings.
Central pressure measurements offer the opportunity to estimate the pulse pressure that the leftventricle and aorta actually “see” 7. As the pressure wave travels from the elastic central vesselsinto the muscular arterial conduits there is a varying degree of increase (‘amplification’) in thesystolic pressure whereas there is little change in diastolic or mean arterial pressure in thecirculation. This rise in blood pressure is often expressed as an amplification ratio (defined asthe pulse pressure in the brachial artery divided by the central aortic pulse pressure) 8. As shownin our study and by others knowledge of the brachial blood pressure is an imperfect estimateof central blood pressure levels 8 (Figure 3).
Studies comparing brachial pulse pressure compared with central pulse pressure usingoutcomes such as left ventricular mass, or the occurrence of cardiovascular target organ damage(carotid intima-media thickness, or death) have shown independent predictive value for centralpulse pressure measurements 23 24 25 10 26. On the other hand, a recent meta-analysis ofcardiovascular outcomes in longitudinal studies in which central hemodynamic measures wereincorporated showed that whereas both central pulse pressure and the AIX predictedcardiovascular events and mortality, only the AIX did so independently of the brachial bloodpressure 27. The kidney is particularly vulnerable to increased pulsatile stress as reviewedrecently by Loutzenhiser 28.
Patients with CKD 1 29 and end stage renal disease have substantial cardiovascular risk 30 31.In a study of 349 subjects with CKD stages 4/5 a brachial pulse pressure of > 80 mmHg wasan independent predictor of cardiovascular death or progression to ESRD requiring dialysis32. In a non-CKD population, the Strong Heart Study, central pulse pressure measures weresuperior to brachial pulse pressure in predicting carotid intima-media thickness andcardiovascular outcomes 10. A second analysis of the Strong Heart Study data, includingadditional follow up time, derived a central pulse pressure of 50 mmHg or higher as a clinicalmeaningful threshold for increased cardiovascular target organ damage 17. For that reason wechose to show the proportion of our populations, stratified by kidney function, with a centralpulse pressure above 50 mmHg recognizing our study is observational while the Strong HeartStudy data were longitudinal (Figure 2). The recognition that reduced kidney function in CKDis related strongly to cardiovascular disease morbidity and mortality has stimulated an ongoingsearch for biologic markers beyond traditional Framingham risk factors since these explainsome but not all of the extra cardiovascular burden in CKD 1 33.
Our study had several limitations. We were unable to successfully capture radial pulsewaveforms in about 23% of our CKD participants and there were differences in patient
Townsend et al. Page 5
Hypertension. Author manuscript; available in PMC 2011 September 1.
NIH
-PA Author Manuscript
NIH
-PA Author Manuscript
NIH
-PA Author Manuscript

characteristics between those with versus without successful waveforms. Importantly, though,the brachial pulse pressure was identical in both groups. Some laboratory values are onlyavailable at the baseline visit which occurred about 2 years before the first central pulse pressuremeasurement and these may have changed between baseline and the second year follow upvisit. This caveat applies especially to glycosylated hemoglobin and serum PTHconcentrations. Lastly, our participants take a number of antihypertensive medications whichmay affect CPP, although we did not find an independent effect of the number ofantihypertensive agent classes taken.
Our findings in this large, diverse and unique CKD population show associations of age,gender, diabetes, heart rate, brachial systolic and pulse pressure with central pulse pressure.These are important associations in a group with such exceptional cardiovascular diseaseburden and are imperfectly represented by standard brachial pulse pressure determinations.The low resistance nature of the renal circulation predisposes the kidney to pressure-mediateddamage 34. Brachial pulse pressure measures have been shown to predict both the developmentof CKD and the rate of loss of kidney function when CKD is already present. Knowledge ofbrachial pulse pressure is an imperfect predictor of central pulse pressures, thus, measures ofcentral pulse pressure may be useful in patients with CKD to quantify their risk ofcardiovascular disease and CKD progression. The role of central pulse pressure in predictingprogressive kidney function loss as well as incident cardiovascular disease in established mild-to moderate CKD remains to be seen.
Perspectives
Our findings in this large, diverse and unique CKD population show associations of age,gender, diabetes, heart rate, brachial systolic and pulse pressure with central pulse pressure.These are important associations in a group with such exceptional cardiovascular diseaseburden and are imperfectly represented by standard brachial pulse pressure determinations.The low resistance nature of the renal circulation predisposes the kidney to pressure-mediated damage. Brachial pulse pressure measures have been shown to predict both thedevelopment of CKD and the rate of loss of kidney function when CKD is already present.Knowledge of brachial pulse pressure is an imperfect predictor of central pulse pressures,thus, measures of central pulse pressure may be useful in patients with CKD to quantifytheir risk of cardiovascular disease and CKD progression. The role of central pulse pressurein predicting progressive kidney function loss as well as incident cardiovascular disease inestablished mild-to moderate CKD remains to be seen. Longitudinal data from CRIC andother studies pursuing the value of central blood pressure measures will clarify further thisimportant issue.
Supplementary MaterialRefer to Web version on PubMed Central for supplementary material.
AcknowledgmentsMarshall Joffe, MD, had full access to all of the data in the study and takes responsibility for the integrity of the dataand the accuracy of the data analysis.
Sources of Support:
These studies were supported by NIH/NIDDK grants including R01-DK-067390, U01-DK-060984, and NIH/NCRRgrants UL1-RR024134, UL1 RR-025005, M01 RR-16500, UL1 RR-024989, M01 RR-000042, UL1 RR-024986,UL1RR029879, M01 RR-05096, UL1 RR-024131.
Townsend et al. Page 6
Hypertension. Author manuscript; available in PMC 2011 September 1.
NIH
-PA Author Manuscript
NIH
-PA Author Manuscript
NIH
-PA Author Manuscript
References1. Go AS, Chertow GM, Fan D, McCulloch CE, Hsu CY. Chronic kidney disease and the risks of death,
cardiovascular events, and hospitalization. N Engl J Med 2004;351:1296–1305. [PubMed: 15385656]2. Ix JH, Katz R, Kestenbaum B, Fried LF, Kramer H, Stehman-Breen C, Shlipak MG. Association of
mild to moderate kidney dysfunction and coronary calcification. J Am Soc Nephrol 2008;19:579–585.[PubMed: 18235089]
3. Astor BC, Hallan SI, Miller ER III, Yeung E, Coresh J. Glomerular filtration rate, albuminuria, andrisk of cardiovascular and all-cause mortality in the US population. Am J Epidemiol 2008;167:1226–1234. [PubMed: 18385206]
4. Feldman HI, Appel LJ, Chertow GM, Cifelli D, Cizman B, Daugirdas J, Fink JC, Franklin-Becker ED,Go AS, Ham LL, Hostetter T, Hsu C-y, Jamerson K, Joffe MP, Kusek JW, Landis JR, Lash JP, MillerER, Mohler ER III, Muntner P, Ojo AO, Rahman M, Townsend RR, Wright JT. The Chronic RenalInsufficiency Cohort (CRIC) Study: Design and Methods. J Am Soc Nephrol 2003;14:S148–S153.[PubMed: 12819321]
5. Hsu CY, McCulloch CE, Darbinian J, Go AS, Iribarren C. Elevated blood pressure and risk of end-stage renal disease in subjects without baseline kidney disease. Arch Intern Med 2005;165:923–928.[PubMed: 15851645]
6. Gosse P, Coulon P, Papaioannou G, Litalien J, Lemetayer P. Long-term decline in renal function islinked to initial pulse pressure in the essential hypertensive. J Hypertension 2009;27:1303–1308.
7. Laurent S, Cockcroft J, Van Bortel L, Boutouyrie P, Giannattasio C, Hayoz D, Pannier B, VlachopoulosC, Wilkinsin I, Struijker-Boudier H. Expert consensus document on arterial stiffness: methodologicalissues and clinical applications. Eur Heart J 2006;27:2588–2605. [PubMed: 17000623]
8. McEniery CM, Yasmin, McDonnell B, Munnery M, Wallace SM, Rowe CV, Cockcroft JR, WilkinsonIB. Central Pressure: Variability and Impact of Cardiovascular Risk Factors. The Anglo-CardiffCollaborative Trial II. Hypertension 2008;51:1476–1482. [PubMed: 18426997]
9. McEniery CM, Yasmin, Hall IR, Qasem A, Wilkinson IB, Cockcroft JR. Normal vascular aging:differential effects on wave reflection and aortic pulse wave velocity: the Anglo-Cardiff CollaborativeTrial (ACCT). J Am Coll Cardiol 2005;46:1753–1760. [PubMed: 16256881]
10. Roman MJ, Devereux RB, Kizer JR, Lee ET, Galloway JM, Ali T, Umans JG, Howard BV. Centralpressure more strongly relates to vascular disease and outcome than does brachial pressure: the StrongHeart Study. Hypertension 2007;50:197–203. [PubMed: 17485598]
11. Wilkinson IB, Prasad K, Hall IR, Thomas A, MacCallum H, Webb DJ, Frenneaux MP, COckcroftJR. Increased central pulse pressure and augmentation index in subjects with hypercholesterolemia.J Am Coll Cardiol 2002;39:1005–1011. [PubMed: 11897443]
12. Lash JP, Go AS, Appel LJ, He J, Ojo A, Rahman M, Townsend RR, Xie D, Cifelli D, Cohan J, FinkJC, Fischer MJ, Gadegbeku C, Hamm LL, Kusek JW, Landis JR, Narva A, Robinson N, Teal V,Feldman HI. Chronic Renal Insufficiency Cohort (CRIC) Study: baseline characteristics andassociations with kidney function. Clin J Am Soc Nephrol 2009;4:1302–1311. [PubMed: 19541818]
13. Perloff D, Grim C, Flack J, Frohlich ED, Hill M, McDonald M, Morganstern BZ. Human bloodpressure determination by sphygmomanometry. Circulation 1993;88:2460–2470. [PubMed:8222141]
14. Muntner P, Anderson A, Charleston J, Chen Z, Ford V, Makos G, O'Connor A, Perumal K, RahmanM, Steigerwalt S, Teal V, Townsend RR, Weir M, Wright JT. Hypertension Awareness, Treatment,and Control in Adults with Chronic Kidney Disease: Results from the Chronic Renal InsufficiencyCohort (CRIC) Study. Am J Kidney Dis 2009;55:441–451. [PubMed: 19962808]
15. Levey AS, Coresh J, Greene T, Stevens LA, Zhang YL, Hendriksen S, Kusek JW, Van Lente F. Usingstandardized serum creatinine values in the modification of diet in renal disease study equation forestimating glomerular filtration rate. Ann Intern Med 2006;145:247–254. [PubMed: 16908915]
16. Rosner, B. Regression and correlation methods. In: Rosner, B., editor. Fundamentals of Biostatistics.6th ed.. Belmont,CA: Thomson; 2006. p. 464-556.
17. Roman MJ, Devereux RB, Kizer JR, Okin PM, Lee ET, Wang W, Umans JG, Calhoun D, HowardBV. High central pulse pressure is independently associated with adverse cardiovascular outcomethe strong heart study. J Am Coll Cardiol 2009;54:1730–1734. [PubMed: 19850215]
Townsend et al. Page 7
Hypertension. Author manuscript; available in PMC 2011 September 1.
NIH
-PA Author Manuscript
NIH
-PA Author Manuscript
NIH
-PA Author Manuscript

18. Benetos A, Thomas F, Joly L, Blacher J, Pannier B, Labat C, Salvi P, Smulyan H, Safar ME. PulsePressure Amplification A Mechanical Biomarker of Cardiovascular Risk. J Am Coll Cardiol2010;55:1032–1037. [PubMed: 20202520]
19. Wilkinson IB, Fuchs SA, Jansen IM, Spratt JC, Murray GD, Cockcroft JR, Webb DJ. Reproducibilityof pulse wave velocity and augmentation index measured by pulse wave analysis. J Hypertens1998;16:2079–2084. [PubMed: 9886900]
20. Filipovsky J, Svobodova V, Pecen L. Reproducibility of radial pulse wave analysis in healthy subjects.J Hypertens 2000;18:1033–1040. [PubMed: 10953994]
21. Savage MT, Ferro CJ, Pinder SJ, Tomson CR. Reproducibility of derived central arterial waveformsin patients with chronic renal failure. Clin Sci (Lond) 2002;103:59–65. [PubMed: 12095404]
22. Wimmer NJ, Townsend RR, Joffee MM, Lash JP, Go AS. CRIC Study Investigators. Correlationbetween pulse wave velocity and other measures of arterial stiffness in chronic kidney disease. ClinNephrol 2007;68:133–143. [PubMed: 17915615]
23. London GM, Blacher J, Pannier B, Guerin AP, Marchais SJ, Safar ME. Arterial wave reflections andsurvival in end-stage renal failure. Hypertension 2001;38:434–438. [PubMed: 11566918]
24. Weber T, Auer J, O'Rourke MF, Kvas E, Lassnig E, Lamm G, Stark N, Rammer M, Eber B. Increasedarterial wave reflections predict severe cardiovascular events in patients undergoing percutaneouscoronary interventions. Eur Heart J 2005;26:2657–2563. [PubMed: 16183688]
25. Williams B, Lacy PS, Thom SM, Cruickshank K, Stanton A, Collier D, Hughes AD, Thurston H,O'Rourke M. Differential impact of blood pressure-lowering drugs on central aortic pressure andclinical outcomes: principal results of the Conduit Artery Function Evaluation (CAFE) study.Circulation 2006;113:1213–1225. [PubMed: 16476843]
26. Pini R, Cavallini MC, Palmieri V, Marchionni N, DiBari M, Devereaux RB, Masotti G, Roman MJ.Central but not brachial blood pressure predicts cardiovascular events in an unselected geriatricpopulation: the ICARe Dicomano Study. J Am Coll Cardiol 2008;51:2432–2439. [PubMed:18565402]
27. Vlachopoulos C, Aznaouridis K, O'Rourke MF, Safar ME, Baou K, Stefanadis C. Prediction ofcardiovascular events and all-cause mortality with central haemodynamics: a systematic review andmeta-analysis. Eur Heart J 2010;31:G1–G7.
28. Loutzenhiser R, Griffin K, Williamson G, Bidani A. Renal autoregulation: new perspectives regardingthe protective and regulatory roles of the underlying mechanisms. Am J Physiol Regul Integr CompPhysiol 2006;290:R1153–R1167. [PubMed: 16603656]
29. Go AS, Lo JC. Epidemiology of non-dialysis-requiring chronic kidney disease and cardiovasculardisease. Curr Opin Nephrol Hypertens 2006;15:296–302. [PubMed: 16609298]
30. Collins AJ. Cardiovascular mortality in end-stage renal disease. Am J Med Sci 2003;325:163–167.[PubMed: 12695721]
31. de Jager DJ, Grootendorst DC, Jager KJ, van Dijk PC, Tomas LM, Ansell D, Collart F, Finne P, HeafJG, DeMeester J, Wetzels JF, Rosendaal FR, Dekker FW. Cardiovascular and noncardiovascularmortality among patients starting dialysis. JAMA 2009;302:1782–1789. [PubMed: 19861670]
32. Banerjee D, Brincat S, Gregson H, Contreras G, Streather C, Oliveira D, Nelson S. Pulse pressureand inhibition of renin-angiotensin system in chronic kidney disease. Nephrol Dial Transplant2006;21:975–978. [PubMed: 16384830]
33. Collins AJ, Li S, Gilbertson DT, Liu J, Chen SC, Herzog CA. Chronic kidney disease andcardiovascular disease in the Medicare population. Kidney Int Suppl 2003;87:S24–S31. [PubMed:14531770]
34. O'Rourke MF, Safar ME. Relationship between aortic stiffening and microvascular disease in brainand kidney: cause and logic of therapy. Hypertension 2005;46:200–204. [PubMed: 15911742]
Townsend et al. Page 8
Hypertension. Author manuscript; available in PMC 2011 September 1.
NIH
-PA Author Manuscript
NIH
-PA Author Manuscript
NIH
-PA Author Manuscript

Figure 1.Plot of Central Pulse Pressure in 5 mmHg increments along X-axis and number of participantsin that increment on Y-axis. Green bars are all CRIC participants (n=2531). Yellow bars arethose without (n=1343) and Ochre bars are those with (n=1188) diabetes.
Townsend et al. Page 9
Hypertension. Author manuscript; available in PMC 2011 September 1.
NIH
-PA Author Manuscript
NIH
-PA Author Manuscript
NIH
-PA Author Manuscript

Figure 2.Upper Left panel plots central pulse pressure in 10 mmHg increments among those with eGFR< 30 mL/min/1.73m2. Upper Right plots those with eGFR 30–44.9, Lower Left plots thosewith eGFR of 45–59.9 and the Lower Right panel depicts those with an eGFR > 60. Arrowonset marks Central Pulse Pressure (CPP) of 50 mmHg and percent (%) indicates the portionof participants within that eGFR range with a CPP > 50 mmHg.
Townsend et al. Page 10
Hypertension. Author manuscript; available in PMC 2011 September 1.
NIH
-PA Author Manuscript
NIH
-PA Author Manuscript
NIH
-PA Author Manuscript

Figure 3.shows discrete intervals of brachial pulse pressure in 10 mmHg increments on Y-axis andcorresponding range of central pulse pressure measured on the X-axis. Box represents 25–75percentile, whiskers indicate 95th percentile, line inside box is median value.
Townsend et al. Page 11
Hypertension. Author manuscript; available in PMC 2011 September 1.
NIH
-PA Author Manuscript
NIH
-PA Author Manuscript
NIH
-PA Author Manuscript

NIH
-PA Author Manuscript
NIH
-PA Author Manuscript
NIH
-PA Author Manuscript
Townsend et al. Page 12
Table 1
Characteristics of CRIC participants
Central Pulse Pressure available
Variable All EligibleN = 3277
NoN=746
YesN=2531
Pvalue
Male 1796 (55.0%) 360 (48.3%) 1436 (57.1%) <.0001
White 1601 (49.1%) 339 (45.4%) 1262 (50.1%) <.0001
Black 1367 (41.9%) 364 (48.8%) 1003 (39.8%) <.0001
Other 295 (9.04%) 43 (5.8%) 252 (10%) <.0001
Diabetes (Yes) 1592 (48.8%) 404 (54.2%) 1188 (47.2%) 0.0008
Age, years 59.71 (10.82) 58.26 (10.47) 60.14 (10.88) <.0001
*eGFR, mL/min/1.73m2 41.32 (15.34) 41.22 (12.87) 41.34 (16) 0.8534
Weight, kg 91.23 (23.02) 98.85 (27.09) 88.97 (21.14) <.0001
Systolic BP, mmHg 127.38 (22.11) 128.36 (21.5) 127.09 (22.29) 0.1677
Diastolic BP, mmHg 70.16 (12.87) 71.34 (12.92) 69.82 (12.83) 0.0047
Pulse Pressure, mmHg 57.22 (19.47) 57.05 (19.06) 57.27 (19.59) 0.7800
Augmentation Index, %(M(SD)/F(SD))
--- --- 25(12)/31(11) ---
Amplification Ratio(M(SD)/F(SD))
--- --- 1.33(0.23)/1.25(0.19) ---
Seated Heart Rate,beats/min
67.99 (11.35) 68.97 (11.41) 67.7 (11.32) 0.0072
Hemoglobin, g/dL 12.7 (1.78) 12.47 (1.84) 12.77 (1.75) <.0001
Creatinine, mg/dL 1.95 (1.17) 1.77 (0.55) 2 (1.3) <.0001
Triglycerides, mg/dL 152.87 (116.19) 162.01(121.96)
149.95 (114.16) 0.0138
Calcium, mg/dL 9.28 (0.51) 9.2 (0.52) 9.3 (0.5) <.0001
Phosphate, mg/dL 3.7 (0.66) 3.81 (0.67) 3.67 (0.65) <.0001
Ca*Phosphate product 33.95 (6.24) 34.99 (6.22) 33.64 (6.21) <.0001
†PTH, pg/mL 73.11 (67.64) 80.97 (77.37) 70.76 (64.27) 0.0004
†Urine Protein, g/24H 0.94 (2.09) 1.19 (2.63) 0.85 (1.86) 0.0002
†Hemoglobin A1C, % 6.61 (1.54) 6.76 (1.64) 6.56 (1.51) 0.0032
†Uric Acid, mg/dL 7.37 (1.9) 7.72 (1.91) 7.27 (1.89) <.0001
Medication: ACE-inhibitor 1601 (49.2%) 388 (52.2%) 1213 (48.3%) 0.0629
Medication: ARB 851 (26.1%) 204 (27.4%) 647 (25.7%) 0.3615
Medication: CalciumAntagonist
1310 (40.2%) 340 (45.7%) 970 (38.6%) 0.0005
Medication: Beta-blocker 1569 (48.2%) 422 (56.7%) 1147 (45.6%) <.0001
Medication: Diuretic 1921 (59.0%) 523 (70.3%) 1398 (55.6%) <.0001
Medication: Other BPMed
614 (18.9%) 174 (23.4%) 440 (17.5%) 0.0003
*Estimated Glomerular Filtration Rate;
†Available at Baseline only
Hypertension. Author manuscript; available in PMC 2011 September 1.
NIH
-PA Author Manuscript
NIH
-PA Author Manuscript
NIH
-PA Author Manuscript
Townsend et al. Page 13
Tabl
e 2
Fact
ors a
ssoc
iate
d w
ith C
entra
l Pul
se P
ress
ure
Var
iabl
eC
entr
al P
ulse
Pre
ssur
e* L
n C
entr
al P
ulse
Pre
ssur
e
Est
(Std
Err
)R
2p
Est
(Std
Err
)R
2p
Fem
ale
Sex
3.78
7 (0
.75)
0.01
0<.
0001
0.08
9 (0
.02)
0.01
2<.
0001
Rac
eB
lack
4.84
7 (0
.79)
0.02
0<.
0001
0.10
6 (0
.02)
0.02
0<.
0001
Oth
er6.
527
(1.2
8)0.
020
<.00
010.
128
(0.0
3)0.
020
<.00
01
Ethn
icity
His
pani
c4.
700
(2.1
2)0.
025
<.00
010.
091
(0.0
4)0.
024
<.00
01
Dia
bete
s10
.449
(0.7
2)0.
076
<.00
010.
227
(0.0
2)0.
081
<.00
01
Age
(/10
yea
rs)
6.08
3 (0
.33)
0.12
3<.
0001
0.14
7 (0
.01)
0.16
2<.
0001
† eG
FR (/
10 m
L/m
in/1
.73m
2 )−2
.483
(0.2
3)0.
045
<.00
01−0
.053
(0.0
0)0.
046
<.00
01
Wei
ght (
/10
Kg)
−0.7
69 (0
.18)
0.00
8<.
0001
−0.0
15(0
.00)
0.00
6<.
0001
Wai
st (/
10 c
m)
0.26
2 (0
.23)
0.00
10.
2561
0.01
0 (0
.00)
0.00
20.
0356
‡ MA
P (/1
0 m
mH
g)4.
656
(0.2
6)0.
118
<.00
010.
093
(0.0
1)0.
106
<.00
01
§ SB
P (/1
0 m
mH
g)6.
160
(0.1
2)0.
535
<.00
010.
127
(0.0
0)0.
512
<.00
01
‖ DB
P (/1
0 m
m H
g)−1
.200
(0.2
9)0.
007
<.00
01−0
.030
(0.0
1)0.
009
<.00
01
Hea
rt R
ate
(/10
beat
s/m
in)
−3.1
87 (0
.33)
0.03
7<.
0001
−0.0
73(0
.01)
0.04
3<.
0001
Bra
chia
l PP
(/10
mm
Hg)
8.57
4 (0
.09)
0.79
5<.
0001
0.17
9 (0
.00)
0.77
8<.
0001
Hem
oglo
bin
(g/d
L)−3
.098
(0.2
1)0.
083
<.00
01−0
.069
(0.0
0)0.
094
<.00
01
Glu
cose
(/10
mg/
dL)
0.57
5 (0
.08)
0.02
1<.
0001
0.01
2 (0
.00)
0.02
0<.
0001
Trig
lyce
rides
(/10
mg/
dL)
−0.0
60 (0
.03)
0.00
10.
0754
−0.0
02(0
.00)
0.00
30.
0159
LDL-
Cho
lest
erol
(/10
mg/
dL)
−0.2
37 (0
.11)
0.00
20.
0374
−0.0
07(0
.00)
0.00
40.
0045
Cal
cium
(mg/
dL)
−3.7
09 (0
.75)
0.01
0<.
0001
−0.0
74(0
.02)
0.00
9<.
0001
# Pho
spha
te (m
g/dL
)1.
979
(1.4
3)0.
005
0.16
700.
044
(0.0
3)0.
005
0.16
08
# Cal
cium
-Pho
spha
te (p
rodu
ct)
0.32
4 (0
.06)
0.01
1<.
0001
0.00
7 (0
.00)
0.01
3<.
0001
# Par
athr
yoid
Hor
mon
e (/1
0pg
/mL)
0.34
3 (0
.06)
0.01
4<.
0001
0.00
8 (0
.00)
0.01
6<.
0001
Hypertension. Author manuscript; available in PMC 2011 September 1.

NIH
-PA Author Manuscript
NIH
-PA Author Manuscript
NIH
-PA Author Manuscript
Townsend et al. Page 14
Var
iabl
eC
entr
al P
ulse
Pre
ssur
e* L
n C
entr
al P
ulse
Pre
ssur
e
Est
(Std
Err
)R
2p
Est
(Std
Err
)R
2p
# Urin
e Pr
otei
n (g
/day
)1.
439
(0.2
1)0.
021
<.00
010.
027
(0.0
0)0.
016
<.00
01
# Hem
oglo
binA
1C (%
)2.
870
(0.2
4)0.
054
<.00
010.
063
(0.0
1)0.
058
<.00
01
# Uric
Aci
d (m
g/dL
)0.
848
(0.2
0)0.
007
<.00
010.
017
(0.0
0)0.
007
<.00
01
Num
ber o
f Ant
ihyp
erte
nsiv
eD
rugs
3.49
5 (0
.24)
0.08
3<.
0001
0.07
8 (0
.00)
0.09
3<.
0001
* Ln =
Nat
ural
loga
rithm
tran
sfor
mat
ion
of C
entra
l Pul
se P
ress
ure;
† eGFR
=est
imat
ed G
lom
erul
ar F
iltra
tion
Rat
e;
‡ MA
P=M
ean
Arte
rial P
ress
ure;
§ SBP=
Syst
olic
Blo
od P
ress
ure;
‖ DB
P=D
iast
olic
Blo
od P
ress
ure;
¶ Aor
tic T
r = T
ime
to re
flect
ed w
ave
in a
ortic
pre
ssur
e pr
ofile
;
# Ava
ilabl
e at
bas
elin
e vi
sit o
nly
Hypertension. Author manuscript; available in PMC 2011 September 1.

NIH
-PA Author Manuscript
NIH
-PA Author Manuscript
NIH
-PA Author Manuscript
Townsend et al. Page 15
Table 3
a: Multivariable regression model for *LnCPP (no adjustment for brachialblood pressure)
Variable Estimate (StdErr) p value
Age (/10 years) 0.13 (0.01) <.0001
Diabetes (Yes) 0.09 (0.02) <.0001
Heart Rate (beats/minute) −0.01 (0.00) <.0001
Sex (Male) −0.08 (0.01) <.0001
HemoglobinA1C (%) 0.03 (0.01) <.0001
Hemoglobin (gm/dL) −0.04 (0.00) <.0001
Glucose (mg/dL) 0.00 (0.00) 0.0079
†PTH Baseline (pg/mL) 0.00 (0.00) 0.0019
b: Multivariable regression model for *LnCPP (adjusted for brachial pulseand mean arterial pressure)
Variable Estimate (StdErr) p value
†LnBPP (mmHg) 0.98 (0.01) <.0001
Mean arterial pressure (mmHg) 0.00 (0.00) <.0001
Age (/10 years) 0.03 (0.00) <.0001
Sex (Male) −0.06 (0.01) <.0001
Diabetes (Yes) 0.02 (0.01) 0.0087
Heart Rate (beats/minute) −0.01 (0.00) <.0001
Weight (/10 kg) −0.012 (00) <.0001
c: Stepwise change in multivariable model R2 (from Table 3b)
Variable Model R2
*LnBPP 0.8395081
LnBPP + †MAP 0.8396461
LnBPP + MAP + Age(/10yrs) 0.8444102
LnBPP + MAP + Age(/10yrs) + Diabetes (Y) 0.8447113
LnBPP + MAP + Age(/10yrs) + Diabetes (Y) + Heart Rate 0.8589313
LnBPP + MAP + Age(/10yrs) + Diabetes (Y) + Heart Rate + Sex 0.8668658
LnBPP + MAP + Age(/10yrs) + Diabetes (Y) + Heart Rate + Sex + Weight (/10 kg) 0.8705188
*Natural logarithm of Central Pulse Pressure;
†Available Baseline only
†Natural Logarithm of Brachial Pulse Pressure
*Natural Logarithm of Brachial Pulse Pressure;
†Mean Arterial Pressure in mmHg
Hypertension. Author manuscript; available in PMC 2011 September 1.
Copyright © 2022 FDOKUMEN