
Ancillary benefits of climate policy in a small open economy: The case of Sweden
14
Ancillary benefits of climate policy in a small open economy: The case of Sweden $ Anna Krook Riekkola a,c,n , Erik O. Ahlgren a , Patrik S ¨ oderholm b a Energy Systems Technology, Division of Energy Technology, Department of Energy and Environment, Chalmers University of Technology, SE-412 96 G¨ oteborg, Sweden b Economics Unit, Lule˚ a University of Technology, SE-971 87 Lule˚ a, Sweden c Institute for Energy, Joint Research Centre, European Commission, P.O. Box 2, NL-1755ZG Petten, The Netherlands article info Article history: Received 10 February 2011 Accepted 8 June 2011 Available online 29 June 2011 Keywords: Ancillary benefits Climate policy Swedish energy system abstract It is increasingly recognised that GHG reduction policies can have important ancillary benefits in the form of positive local and regional environmental impacts. The purpose of this paper is to estimate the domestic ancillary pollution benefits of climate policy in Sweden, and investigate how these are affected by different climate policy designs. The latter differ primarily in terms of how the country chooses to meet a specific target and where the necessary emission reductions take place. The analysis relies on simulations within the energy system optimisation model TIMES-Sweden, and focuses on four non-GHG pollutants: Nitrogen Oxides (NO X ), Non Methane Volatile Organic Compounds (NMVOC), inhalable particles (PM 2.5 ), and Sulphur dioxide (SO 2 ). The simulations permit detailed assessments of the respective technology and fuel choices that underlie any net changes in the estimated ancillary effects. The results indicate that the ancillary benefits constitute a far from insignificant share of total system costs, and this share appears to be highest in the scenarios that entail the largest emission reductions domestically. This result reflects the fact that carbon dioxide emission reductions abroad also implies a lost opportunity of achieving substantial domestic welfare gain from the reductions of regional and local environmental pollutants. & 2011 Elsevier Ltd. All rights reserved. 1. Introduction The balance of evidence suggests that anthropogenic emis- sions of greenhouse gases – out of which carbon dioxide is the most significant – are having a distinct negative impact on the global climate (e.g., IPCC, 2007). Since the Framework Convention on Climate Change was concluded in 1992, nations have been negotiating commitments to stabilise and then reduce emissions of greenhouse gases, which will otherwise continue to build up in the atmosphere. The debate on climate change policy, particularly with respect to the Kyoto Protocol in 1997, has been heavily focused on the economic costs and feasibility of the proposed mitigation plans. Despite concerns about the costs of Kyoto implementation – expressed by politicians, analysts, and industry representatives in industrial countries – the Protocol was ratified by a large number of states and therefore came into force in February 2005. Some nations, such as the USA and Australia, based their decisions to withdraw from the Kyoto process in part on the high perceived costs for their respective economies. Also in the countries that have ratified the Protocol continued concerns exist, not the least about the future costs of the additional policy measures needed to stabilise greenhouse gas concentrations. This became evident during the 2009 Copenhagen (COP15) meeting at which no new global commitment of continued reductions of greenhouse gas (GHG) emissions could be reached. One of the most important strategies to reduce GHG emissions is to move away from the use of fossil fuels. In substituting carbon-free fuels for fossil fuels other harmful emissions are likely to be reduced along with the reduction of carbon dioxide, e.g., in replacing coal with renewable energy sources the emis- sions of regional air pollutants such as nitrogen oxides (NO X ) and sulphur dioxide (SO 2 ) are reduced as well. The resulting reduc- tions in damages to health, crops and materials represent real economic benefits, i.e., reduced costs that typically are referred to as the ancillary benefits from climate mitigation (e.g., Ekins, 1996; Hourcade et al., 2001; Burtraw et al., 2003). Clearly these side- effects can also be negative (e.g., increases in the emissions of particles when diesel replaces gasoline in the transport sector), Contents lists available at ScienceDirect journal homepage: www.elsevier.com/locate/enpol Energy Policy 0301-4215/$ - see front matter & 2011 Elsevier Ltd. All rights reserved. doi:10.1016/j.enpol.2011.06.015 $ Financial support from the Swedish Energy Agency (AES program and International Climate Policy program) as well as the European Commission funded FP6 project NEEDS (New Energy Externalities for Development for Sustainability) is gratefully acknowledged, as are the helpful comments from Rodica Sandu-Loisel and two anonymous reviewers. Any remaining errors, however, reside solely with the authors. n Corresponding author at: Economics Unit, Lule ˚ a University of Technology, SE-971 87 Lule ˚ a, Sweden. E-mail address: [email protected] (A. Krook Riekkola). Energy Policy 39 (2011) 4985–4998
Transcript of Ancillary benefits of climate policy in a small open economy: The case of Sweden

Energy Policy 39 (2011) 4985–4998
Contents lists available at ScienceDirect
Energy Policy
0301-42
doi:10.1
$Fina
Internat
FP6 pro
is gratef
and two
the authn Corr
SE-971
E-m
journal homepage: www.elsevier.com/locate/enpol
Ancillary benefits of climate policy in a small open economy: The caseof Sweden$
Anna Krook Riekkola a,c,n, Erik O. Ahlgren a, Patrik Soderholm b
a Energy Systems Technology, Division of Energy Technology, Department of Energy and Environment, Chalmers University of Technology, SE-412 96 Goteborg, Swedenb Economics Unit, Lulea University of Technology, SE-971 87 Lulea, Swedenc Institute for Energy, Joint Research Centre, European Commission, P.O. Box 2, NL-1755ZG Petten, The Netherlands
a r t i c l e i n f o
Article history:
Received 10 February 2011
Accepted 8 June 2011Available online 29 June 2011
Keywords:
Ancillary benefits
Climate policy
Swedish energy system
15/$ - see front matter & 2011 Elsevier Ltd. A
016/j.enpol.2011.06.015
ncial support from the Swedish Energy
ional Climate Policy program) as well as the E
ject NEEDS (New Energy Externalities for Dev
ully acknowledged, as are the helpful comme
anonymous reviewers. Any remaining errors
ors.
esponding author at: Economics Unit, Lule
87 Lulea, Sweden.
ail address: [email protected] (A. Kr
a b s t r a c t
It is increasingly recognised that GHG reduction policies can have important ancillary benefits in the
form of positive local and regional environmental impacts. The purpose of this paper is to estimate the
domestic ancillary pollution benefits of climate policy in Sweden, and investigate how these are
affected by different climate policy designs. The latter differ primarily in terms of how the country
chooses to meet a specific target and where the necessary emission reductions take place. The analysis
relies on simulations within the energy system optimisation model TIMES-Sweden, and focuses on four
non-GHG pollutants: Nitrogen Oxides (NOX), Non Methane Volatile Organic Compounds (NMVOC),
inhalable particles (PM2.5), and Sulphur dioxide (SO2). The simulations permit detailed assessments of
the respective technology and fuel choices that underlie any net changes in the estimated ancillary
effects. The results indicate that the ancillary benefits constitute a far from insignificant share of total
system costs, and this share appears to be highest in the scenarios that entail the largest emission
reductions domestically. This result reflects the fact that carbon dioxide emission reductions abroad
also implies a lost opportunity of achieving substantial domestic welfare gain from the reductions of
regional and local environmental pollutants.
& 2011 Elsevier Ltd. All rights reserved.
1. Introduction
The balance of evidence suggests that anthropogenic emis-sions of greenhouse gases – out of which carbon dioxide is themost significant – are having a distinct negative impact on theglobal climate (e.g., IPCC, 2007). Since the Framework Conventionon Climate Change was concluded in 1992, nations have beennegotiating commitments to stabilise and then reduce emissionsof greenhouse gases, which will otherwise continue to build up inthe atmosphere. The debate on climate change policy, particularlywith respect to the Kyoto Protocol in 1997, has been heavilyfocused on the economic costs and feasibility of the proposedmitigation plans. Despite concerns about the costs of Kyotoimplementation – expressed by politicians, analysts, and industry
ll rights reserved.
Agency (AES program and
uropean Commission funded
elopment for Sustainability)
nts from Rodica Sandu-Loisel
, however, reside solely with
a University of Technology,
ook Riekkola).
representatives in industrial countries – the Protocol was ratifiedby a large number of states and therefore came into force inFebruary 2005. Some nations, such as the USA and Australia,based their decisions to withdraw from the Kyoto process in parton the high perceived costs for their respective economies. Also inthe countries that have ratified the Protocol continued concernsexist, not the least about the future costs of the additional policymeasures needed to stabilise greenhouse gas concentrations. Thisbecame evident during the 2009 Copenhagen (COP15) meeting atwhich no new global commitment of continued reductions ofgreenhouse gas (GHG) emissions could be reached.
One of the most important strategies to reduce GHG emissionsis to move away from the use of fossil fuels. In substitutingcarbon-free fuels for fossil fuels other harmful emissions arelikely to be reduced along with the reduction of carbon dioxide,e.g., in replacing coal with renewable energy sources the emis-sions of regional air pollutants such as nitrogen oxides (NOX) andsulphur dioxide (SO2) are reduced as well. The resulting reduc-tions in damages to health, crops and materials represent realeconomic benefits, i.e., reduced costs that typically are referred toas the ancillary benefits from climate mitigation (e.g., Ekins, 1996;Hourcade et al., 2001; Burtraw et al., 2003). Clearly these side-effects can also be negative (e.g., increases in the emissions ofparticles when diesel replaces gasoline in the transport sector),

A. Krook Riekkola et al. / Energy Policy 39 (2011) 4985–49984986
but many previous studies show that compared to a baselinescenario the net economic cost of climate policy could be reducedsubstantially (e.g., Repetto and Austin, 1997; Boyd et al., 1985;Van Vuuren et al., 2006). In addition, by addressing the impacts ofancillary benefits and costs the optimal abatement strategy maychange in terms of the reduction level, the timing of policymeasures as well as the allocation of mitigation efforts acrossthe different sectors of the economy (OECD, 2002; Kuosmanenet al., 2009).
The objective of this paper is to estimate the ancillary pollu-tion benefits of climate policy in a small open economy, andcompare the outcomes of different climate policy designs. Weanalyse policy designs that differ in terms of how the countrychooses to meet a specific target in the year 2020 including wherethe necessary emission reductions take place. Sweden is used as acase country, and methodologically we employ the so-calledTIMES-Sweden model, a dynamic technology-rich energy systemoptimisation model. It represents a partial equilibrium model ofthe entire Swedish energy system, including stationary sources aswell as the transport sectors. In addition to the supply and energyconversion sectors, five different demand sectors are described:agriculture, commercial, residential, industry and transportation.TIMES-Sweden permits the analysis of several non-GHG pollutants,including Nitrogen Oxides (NOX), Non Methane Volatile OrganicCompounds (NMVOC), inhalable particles with a diameter less than2.5 mm (PM2.5), and Sulphur dioxide (SO2). For each climate policyscenario the model is here used to address three different ancillarybenefit measures: (a) total reduced damage cost; (b) reduceddamage cost per reduced tonnes of CO2; and (c) reduced damagecosts as a share of the total increase in system costs following theimposed climate policy.
For any country the choice between domestic GHG-reductionefforts on the one hand and financing similar efforts abroad onthe other is important. In accordance with the Kyoto Protocol andthe EU Burden Sharing Agreement, Sweden is committed to anAssigned Amount Unit (AAU) for the compliance period 2008–2012corresponding to an increase by 4% compared to the 1990emission level. Still, in an attempt to precede stricter futurerequirements Sweden decided in 2002 on a national emissiontarget stating that during this five-year period the country’sgreenhouse gas emission level must not exceed five times 96%of the 1990 level. An important implication of this policy targethas been that if a firm that participates in the European UnionEmissions Trading Scheme (EU ETS) buys permits, a correspond-ing emission reduction has to be made in the non-trading sector(e.g., through adjustments in the CO2 tax) (Carlen, 2004;Soderholm and Pettersson, 2008). In this way emission reductionburdens are transferred from the trading to the non-tradingsector. Other than Germany and Great Britain, Sweden is the onlyEU country that has decided to focus on a national emissionstarget, addressing thus emissions made on domestic soil. In aGovernment Bill (2008/09:162) a new target is outlined, namelyto decrease domestic emissions in the non-trading sector by 40%by the year 2020 (compared to the 1990 level). In meeting thesestricter reduction requirements the Swedish government aims atlocating one third of the obligated carbon dioxide reduction inother countries, thus increasing the reliance on internationalflexible mechanisms in the nation’s compliance strategy.
Previous studies indicate that accounting for the local andregional ancillary benefits arising from climate policy that areachieved jointly with the reduction of carbon dioxide can besignificant in the Swedish case, and may thus partly strengthenthe case for the present adoption of a domestic emissions target.For instance, Ostblom and Samakovlis (2004, 2007) employ thestatic general equilibrium model EMEC to evaluate the economicimpacts of Swedish climate policy in the presence of benefits to
health and labour productivity following reductions in nitrogendioxide (NO2) emissions. Their results indicate that the costs ofclimate policy could be substantially reduced, and the benefits ofinternational emissions trading for the Swedish economy becomeless pronounced once the ancillary benefits of nitrogen dioxidereductions are taken into consideration. Similar results for Swedenare presented in Nilsson and Huthala (2000), where the EMEC modelis used to address the ancillary impacts of both nitrogen oxides andsulphur dioxide. Bye et al. (2002) provide a review of the cost ofclimate policies and the associated ancillary benefits in the Nordiccountries, the UK and Ireland.
The approach in this paper differs from many earlier studies ina number of ways. First, a number of previous energy systemstudies use the estimated monetary damages costs for differentnon-GHG pollutants, and investigate, for instance, the conse-quences on CO2 emissions of internalising these external costs(e.g., Das et al., 2007; Klaassen and Riahi, 2007; Krook Riekkolaand Ahlgren, 2003). While these studies thus address the climate-related ancillary benefits of other environmental policies, weinstead focus on the corresponding side-effects of differentclimate policy designs. These earlier studies also address onlythe external costs of the electricity (and heat) sectors. Further-more, another set of previous studies employ general equilibriummodels to analyse the ancillary impacts of GHG mitigation (Daviset al., 2000; Ostblom and Samakovlis, 2007), while we insteadadopt a technology rich bottom-up representation of the entireenergy system. Van Vuuren et al. (2006) employ a similar bottom-up approach but with a focus on Europe (divided into East, Centraland West), and with no results for neither individual countriesnor different climate policy designs.
The TIMES-Sweden model can explicitly address importantdiscrete technology shifts and their consequences in the presenceof stringent climate policy. Moreover, the model covers the entirechain from energy supply to useful energy per demand segment,something which facilitates the identification of the sectors andtechnologies where the ancillary benefits are most prevalent.Moreover, in line with Ostblom and Samakovlis (2004, 2007),the present paper also addresses the ancillary benefits arisingfrom different climate policy designs for a small open economy,but unlike the previous studies we highlight in more detail thetechnology choice trade-offs involved in abating emissionsdomestically or relying more extensively on CO2 emission reduc-tions abroad. Specifically, we investigate how the estimatedancillary benefits are influenced by changes in the stringency ofthe policy target, the CO2 permit price within EU ETS and theenergy sector’s rate-of-return requirement. We also presentdetailed results for the electricity and transport sectors, andhighlight important differences in fuel mixes across the differentpolicy scenarios. Finally, the range of non-GHG pollutants consideredin the analysis is also wider, not the least given the inclusion ofparticles (PM2.5) and NMVOC, substances that are typically ignored inmost previous studies.
Section 2 presents the TIMES modelling framework, andclarifies how the assessment of ancillary benefits can be incorpo-rated into the model simulations. In Section 3 we discuss thedifferent policy scenarios, while Section 4 presents the modelsimulation results. Finally, some concluding remarks are providedin Section 5.
2. An energy-economic modelling framework
2.1. The TIMES modelling framework
In order to estimate the economic costs and the futureemission levels for each policy scenario the TIMES-Sweden model

A. Krook Riekkola et al. / Energy Policy 39 (2011) 4985–4998 4987
is used. TIMES-Sweden is built on the platform of TIMES (anacronym for The Integrated MARKAL-EFOM System), and repre-sents a linear programming cost-optimising model developedwithin ETSAP (www.etsap.org). TIMES minimises the totaldiscounted system cost over the modelled time-horizon to meeta given demand of useful energy in line with the followinggeneral objective function:
TSC ¼XY
y ¼ 2000
ASCy � ð1þdÞð2000�yÞð1Þ
where TSC is the total (discounted) system cost (in Euro) duringthe entire modelling period, y represents the modelling year, Y isthe last year of modelling (i.e., the modelling horizon plus anyadditional years during which costs must be borne), ASCy is theannual undiscounted system costs in year y, and d is the discountrate employed.
TIMES offers a technology-rich description of any local,national or multi-national energy system, and allows for anexploration of possible energy scenarios. The dynamic modellingframework permits a flexible number of time-slices over themodelling horizon (Loulou et al., 2005). Unlike many otherbottom-up energy system models, TIMES assumes that energydemand is responsive to price changes. The model is flexible indescribing different policy instruments, i.e., taxes, subsidies,tradable emission permits, and these policy instruments can beapplied on fuels, emissions and technologies (activity and capa-city). The cost of an imposed climate policy includes the increasedsystem cost compared to a baseline (no-policy) scenario. Since allinvestment costs have been annualised (given a certain economiclifetime and discount rate) it is straightforward to present thechange in system cost for a given year.
2.2. The TIMES-Sweden model
The TIMES-Sweden model was initially developed as one of theEuropean national models in the New Energy Externalities Devel-opments for Sustainability (NEEDS) project (see www.needs-project.org), and all national models were further improved and usedwithin the RES2020 project (www.res2020.eu). All national modelsoptimised together in turn constitute the Pan European TIMES (PET)model. TIMES-Sweden describes a large number of existing andpotential energy technologies, and includes a detailed description of
ENERGY
PRI
MARY
SUPPLY
Policy Instruments
IMPORT
Electri-city & Heat
International Markets
Fig. 1. An overview o
the stationary energy systems, the transport sector and severaldemand sectors in the country. In order to represent the load curve,the electricity and heat sectors can be divided into twelve time-slices (four seasons, day/night, as well as daily peak-hours). Alltwelve time-slices are used to describe electricity demand, whileonly four seasons are used to describe the corresponding demandfor heat.
A simplified description of the processes and commodities inTIMES-Sweden is provided in Fig. 1. Primary energy includes bothdomestic supplies and import of energy commodities to thecountry. Furthermore, the supply sector includes processes refin-ing some of the primary energy sources into secondary energycarriers. The electricity and heat sectors include units generatingelectricity and district heating services. In addition to differentindustrial segments, the industry sector also includes internallygenerated electricity and district heating production. The indus-trial segments are described in detail with different steps ofprocesses, and in TIMES-Sweden the two largest segments arethe iron and steel industry and the pulp and paper industry. Theagricultural sector is represented by only a few process alter-natives available, although all with several combinations ofinputs. The commercial and residential sectors are described indetail with different demand (and technology options) for spaceheating, water heating, cooling, lightning, coking, etc. Spaceheating can be served by different technologies relying on wood,oil, gas, electricity, heat pumps or district heating.
The useful demand is calculated outside the model, and it isderived based on assumptions about, for instance, GDP, popula-tion, changes in the residential housing stock, etc. However, finaluse of energy per demand segment is calculated endogenously inthe model, it is sensitive to price changes and presented by energycommodity. National price adjustments in TIMES-Sweden arebased on statistics from the Swedish Energy Agency (2006). Inthis study we use a uniform social discount rate of 4%, equal tothe one recommended by the Swedish Institute for Transport andCommunications Analysis for use in the case of publicly fundedinfrastructure projects (SIKA, 2002). In the sensitivity analyses,though, we also investigate the consequences of employingdifferent discount rate assumptions.
In-data are kept in line with the assumptions specified inRES2020 (2009), and with several national adjustments. The mainsource for the base-year energy balances is the Eurostat data-baseprovided by the Statistical Office of the European Communities.
EXPORT
ElectricityHeat
Commercial
Residential
Industry
DEMAND
USEFUL
Transport
Agriculture
Emissions
f TIMES-Sweden.

Table 1Three different ancillary benefit measuresa.
Ancillary benefit measure Definition Description
Reduced total damage cost DADC Annual reduced damage costs (Euro)
Reduced damage cost per reduced CO2 DADC/DCO2 Reduced annual damage costs per reduced tonne of CO2 emissions (Euro/tonne reduced CO2)
Reduced damage cost per increased system costs DADC/(�DASC) Reduced damage costs per increased annual total system costs (percentage share)
a All damage costs refer to changes in the emissions from non-GHGs, and do thus not incorporate the economic effects of greenhouse gas emissions.
A. Krook Riekkola et al. / Energy Policy 39 (2011) 4985–49984988
Specifically, base year energy flows and existing technologies arebased on Eurostat data for the year 2000, and the model iscalibrated for the year 2005. Other important data sources forthe RES2020 database are outlined in Garqiulo (2008). The strongreliance on official statistical sources as well as technology-specific information derived from previous research projects(e.g., the BRED study and the REFUEL project) should ensure thereliability of the RES2020 data.1
Moreover, details of the present Swedish energy system havebeen collected from various Statistics Sweden reports (e.g.,Statistics Sweden, 2007; Nordel, 2008). The database for newtechnologies, NewTechs-RES2020, contains more than 700 tech-nologies, described in terms of efficiency, availability factors,investment costs, annual fixed, variable operation and mainte-nance costs, emissions factors, output, etc. In TIMES-Sweden thisdatabase has been adjusted to account for country-specific condi-tions, e.g., for the electric power sector complementing data havebeen drawn from Elforsk (2007). TIMES-Sweden does not incor-porate endogenous technological change (learning-by-doing), i.e.,technological progress in, for instance, the energy conversionsector is assumed to be independent of domestic diffusion ratesand policies. The immature technologies are instead characterisedby exogenous efficiency improvements and thus lower costs overtime. In the model technological improvements can either beattributed to the entire stock of a specific technology, or bespecified to affect only new investments.
In TIMES-Sweden the following emissions are described indetail: Carbon Dioxide (CO2), Nitrogen Oxides (NOX), NonMethane Volatile Organic Compounds (NMVOC), Particulate 2.5(PM2.5) and Sulphur Dioxide (SO2). Emissions can be defined byfuel consumption (e.g., CO2 emissions from burning coal) and bythe activity of a process (e.g., SO2 emissions when generatingelectricity from CHP plants). In the RES2020 project, the emissionfactors were based on the average emission coefficients calculatedfrom the RAINS model, which includes regional data; the emissionfactors are in turn assumed to decrease over time. In TIMES-Sweden the emission factors have been validated and updatedbased on national data from, for instance, Bostrom et al. (2004)and the Swedish Environmental Protection Agency (2009). Overallthe Swedish emission factors are generally lower than thosetypically assumed for other European countries.
2.3. Incorporating the ancillary benefits of climate policy in TIMES-
Sweden
In analysing the ancillary benefits of climate policy the defini-tion of the baseline scenario is critical for the results(Morgenstern, 2000). For our purposes it is particularly importantto include policies that affect the emissions of regional and localair pollutants, and our baseline scenario therefore includes, for
1 Assumptions of future technology costs are of course afflicted with uncer-
tainties and this concerns in particular assumptions regarding technology devel-
opment (efficiency and cost developments) and factors related to site-specific
conditions. Most notably, the future costs of scaling up existing technology or
introducing still fairly new technology may be difficult to assess.
instance, the existing taxes on fossil fuels in Sweden. Theassumed baseline scenario is discussed in more detail in Section3.1. In TIMES-Sweden the annual emissions for each pollutant areultimately an outcome of the model optimisation. By multiplyingthese with the unit damage cost estimates from the literature,a monetary valuation of the yearly change in damage from a givenclimate policy is attained. We have
DADCy ¼XP
p
DQpyDCp ð2Þ
where DADCy is the change in total damage costs (in Euro) fromthe baseline scenario, DQpy is the net change (in tonnes) in theemissions of pollutant p (p¼1,y,P) in time period y, and DCp
represents the corresponding damage cost per tonne of pollutantp (Euro per tonne). In this paper we follow Hourcade et al. (2001),and present the yearly ancillary effects from each imposedclimate policy in terms of the changes in: (a) reduced totaldamage costs; (b) reduced damage cost per reduced tonne ofCO2; and (c) reduced damage costs as a share of the increase inannual system costs following the climate policy (all compared tothe baseline). These measures are summarised in Table 1.
The total amount of emissions generated from energy conver-sion can depend on technology, choice of fuel and be due tobehavioural changes. Our focus lies on the ancillary benefits fromfuel switching and technology choice (including the adoption ofmore efficient technologies that use less fuel). Overall behaviouralpatterns are assumed to change only as the result of the differenteconomic incentives provided by the varying climate policydesigns. For instance, the transport sector is defined by a fixedyearly demand (in million person kilometres) per vehicle category(e.g., short-distance person traffic) even though the sector has alarge potential to reduce emissions through behavioural changes(e.g., by moving away from studded tires in larger cities and byswitching from private to public transportation).
The included non-GHG emissions all have local and/or regionalenvironmental impacts (see Table 2). In Sweden the main sourcesof NOX and SO2 include shipping companies, process industries(e.g., pulp and paper, iron and steel, chemical industry, etc.), andother combustion. NOx derives from all kind of combustion, whileSO2 only derives from combustion with fuels containing sulphur,i.e., coal and oil. Both these pollutants cause acidification(on forests and buildings) and give rise to negative health effects.In addition, NOX emissions also stem from the transportation,agriculture and construction sectors, and cause eutrophication ofthe oceans. Nitrogen oxides are also involved in the formation ofground-level ozone.
The main sources of inhalable particles with a diameter lessthan 2.5 mm (PM2.5) are industry processes, traffic-exhaust andsmall-scale wood combustion. Particles cause negative healtheffects through, for instance, increased risks of respiratorydiseases. Inhalable particles with a diameter between 2.5 and10 mm also cause negative health effects; they stem mainly fromroad dust, but are not addressed in the TIMES-Sweden model.NMVOC origins from traffic-exhaust and small-scale wood com-bustion, and gives rise to ground-level ozone emissions and

Table 2Main sources and impact of selected non-GHG pollutants in Sweden.
Sources: Statistics Sweden (2008) and Swedish Environmental Protection Agency (2008).
Pollutant Symbol Main sources of the pollutant Main impacts
Nitrogen oxides NOX Shipping companies, transport, process industry (pulp and paper,
iron and steel, and chemical industry), agriculture, construction, and
combustion.
Health effects, acidification,
eutrophication, ground-level
ozone
Sulphur dioxide SO2 Shipping companies, process industry (pulp and paper, iron and
steel, and chemical industry), and combustion of coal and oil.
Health effects, acidification
Inhalable particles,
diametero2.5 mm.
PM2.5 Industry and combustion processes (traffic-exhaust and small-scale
wood combustion).
Health effects
Non methane volatile organic
compounds
NMVOC Small-scale wood combustion, traffic (evaporation
from gasoline), use of solvents.
Ground-level ozone, health
effects
Table 3External costs for non-GHG pollutants in Sweden (Euro2000 per tonne).
Source: Holland and Watkiss (2007).
Sources NOX SO2 PM2.5 NMVOC
ExternE core 760 1500 11,000 230
CAFE/WHO-low 2200 2800 12,000 330
CAFE/WHO-high 5900 8100 34,000 980
A. Krook Riekkola et al. / Energy Policy 39 (2011) 4985–4998 4989
negative health effects (including cancer). In the model, onlyemissions that origin from energy conversion are included.
In order to estimate the damage cost per pollutant we haveused country-specific external cost estimates per tonne of emis-sion of each pollutant generated within the MethodEx project(www.methodex.org), which in turn is based on the methodsdeveloped and used within ExternE and CAFE/WHO, respectively.The external cost estimates include health impacts and the effectsfrom ozone on crops, but not the impacts on the ecosystem or onmaterials. The so-called BeTa-MethodEx reference outputs forSweden are presented in Table 3, and they display a range ofmonetary estimates for the involved emissions. All three sets ofestimates include the total damage costs from core health effectsand crops, while the results presented in CAFE/WHO-high alsoinclude so-called sensitivity health effects.
In the empirical analysis we acknowledge the uncertaintiesthat exist with respect to these environmental damage costs, andsubsequently present model simulations that rely on all of thethree studies/approaches presented in Table 3.
3. Scenario definitions
In the baseline scenario the existing Swedish policy instru-ments are maintained over the modelling period (the year 2020),while the different climate policy scenarios all imply a stricteremission target but with different policy designs. The maininspiration for the design of the policy scenarios stems from theSwedish government’s goal to achieve a 40% reduction in GHGemissions in the non-trading sector compared to 1990 years levelby the year 2020. Two thirds of these GHG reductions should takeplace domestically, while one third can be achieved throughinvestments in other nations within the European Union orthrough the Clean Development Mechanism (CDM). However,our policy scenarios involve a 40% reduction for the entire country(trading sectorþnon-trading sector), but with varying opportu-nities for making use of the flexible mechanisms. Thus, this paperdoes not aim at providing an explicit evaluation of the existingSwedish climate policy; it investigates instead the ancillarybenefits in various climate policy scenarios that differ signifi-cantly in the importance placed to domestic reduction commit-ments versus the use of permit trading.
An important reason for departing from the current Swedishclimate policy target is also that our simulations indicate thatthis is close to being attained already in the baseline scenario.Moreover, in the presence of a future commitment on globalemissions reductions, any country would have to address inmore detail the interaction between the trading sector and thenon-trading sector. In our analysis the domestic reductions willbe achieved by the existing European Emissions Trading System(EU ETS) for the electricity and heat sectors and specified industrysegments (i.e., the trading sector), and through increased carbon,fuel and energy taxes for the non-trading sectors (GovernmentOffices of Sweden, 2009). The reductions in the trading sector willthus depend on the price of tradable emission permits.
3.1. The baseline scenario
In accordance with the Kyoto Protocol and the EU BurdenSharing Agreement, Sweden is committed to an Assigned AmountUnit (AAU) for the compliance period 2008–2012 correspondingto an increase by 4% compared to the 1990 emission level. Still, in2002 the Swedish government decided on a national emissiontarget stating that during this five-year period the country’sgreenhouse gas emission level must not exceed five times 96%of the 1990 level. In order to meet this goal, Sweden hasintroduced a number of policy instruments. One of the mostimportant policy instruments in Swedish climate policy is the CO2
tax, which was introduced already in 1991. The trading sector’semissions are in turn determined by the carbon permit prices inEU ETS. In the baseline scenario we assume that the existing CO2
taxes are remained unchanged throughout the modelling period.Moreover, the tradable emission permit (TEP) price is assumed tobe constant at 11 Euro2000 per tonne of CO2 based on the averageprices of Futures Contract at EEX (ECX, 2009). In addition to theabove-mentioned climate policies there are also a number ofadditional environmental and fuel taxes (Swedish Tax Agency,2008a, 2008b) and technology support schemes that influence theemissions of non-GHG pollutants in the baseline. These existingpolicy instruments are addressed in the analysis (see Appendix Afor an outline of existing energy-related taxes).
During an initial transition period, the trading sector pays botha TEP price and a CO2 tax. In the model these rebates areconsistent with the existing regulations for the trading sectors;fuels used for electric power generation and industrial heat have a100% tax rebate from the energy and CO2 taxes, while heatproduction in combined heat and power units has a 85% taxrebate from the CO2 taxes. Still, in the model simulations all CO2
taxes in the trading sector are assumed to be phased out in theyear 2010. The use of fossil fuels for motor-driven purposes issubject to energy and CO2 taxes. Biofuels are however not taxed,but following Kageson (2007) we assume that from 2010 andonwards also these renewable fuels will face an energy taxcorresponding to those currently facing the different fossil fuels.

Table 4Modelled CO2 restrictions in each policy scenario.
Baseline Country-cap Sector-cap EU
Trading sector No Not applicable No No
Non-trading sector No Not applicable Emitted CO2 in the non-trading sector
rnational target - emitted CO2 in the trading sector
No
Total No Emitted CO2
rnational target
Emitted CO2 in the trading sectorþemitted
CO2 in the non-trading sectorrnational target
Emitted CO2 in both sectors—
net purchase of TEPrnational target
Table 5National targets for each policy scenario, 2010 and 2020a.
Country-cap Sector-CapA Sector-CapB EU
2010 – 49.2 (96%) 49.2 (96%) 49.2 (96%) –
2020 – 30.8 (60%) 37.6 (73%) 30.8 (60%) –
a National emissions presented in million tonnes of CO2 and in the brackets
the ratios (in percentage) of the resulting CO2 emissions in the baseline scenario
(equalling 48.5 million tonnes of CO2 in the year 2000) and the emission level in
the year 1990 are outlined.
A. Krook Riekkola et al. / Energy Policy 39 (2011) 4985–49984990
In 2003 Sweden implemented a green certificate market forrenewable electricity; in 2016 the production of green electricityshould have increased by a total of 17 TWh compared to the 2002level (Swedish Energy Agency, 2007). This target has beenimplemented in the baseline model simulations.2 The energysources that entitle Swedish electric power producers to issuegreen certificates are wind power, solar energy, wave energy,geothermal energy, new hydropower, existing small-scale hydro-power, and biomass (including peat). In the model, the Swedishgreen certificate system is modelled endogenously to meet thequotas outlined in Swedish Energy Agency (2007). Each MWh ofelectricity from renewable energy sources gives one TradableRenewable Certificate (TRC), and the amount of TRC should beequal or greater than a given share of the total electricityconsumption for non-production purposes.
3.2. Climate policy scenarios
In this section we define three main climate policy scenarios,which all involve a stricter climate policy compared to thebaseline scenario. For all three policy scenarios the cap in EUETS is tightened, resulting in increasing prices of TEP. Theassumed prices are 22 EUR2000 per tonne of CO2 in the period2010–2014 and 44 EUR2000 per tonne of CO2 from the year 2015and onwards. In addition, following Ostblom and Samakovlis(2004) three scenarios, each describing a given climate policytarget at the country level, are employed:
�
incr
The Country-Cap scenario represents a scenario in which theentire 40% reduction target must be achieved through domes-tic reductions. Thus, in this scenario we have a national cap onemissions, which in addition to the existing cost of emittingCO2 (either through permit trading or a tax) creates a uniformshadow price on CO2 emissions. The marginal cost of abate-ment is equalized across all sources. In this way we obtain acost-effective reduction of emissions within the country, but itis not possible to utilise the benefits of emissions trading.
� The EU scenario is a scenario in which the domestic policiesremain the same as in the baseline scenario, and in which allsectors of the Swedish freely can trade permits at a pre-specified EU ETS price level (see above). The marginal abate-ment cost is thus equalized across all sources at the level ofthis exogenous price. In other words, in this scenario theclimate policy target is achieved by including the permitstraded, and total emissions may exceed the national target bypermits bought as these emission reductions are accomplishedin other countries.
� In the Sector-Cap scenario the trading sector can engage inpermit trading within EU ETS but (unlike the EU scenario) the40% target must be achieved exclusive of traded permits. Thus,an important implication of this national emission target is
2 In 2010 this target was revised, and the present Swedish target outlines an
ease in green electricity by 25 TWh by the year 2020.
that if a firm in the trading sector chooses to buy permits, acorresponding reduction has to be made in the non-tradingsector (e.g., through adjustments in the carbon tax). In thisway the EU ETS participants can ‘‘involuntarily’’ transferemissions reductions to the non-trading sector. Given thepresent Swedish policy it is useful to also consider the casewhere only a fraction of the national target must be achieveddomestically. The scenario is thus divided into two sub-scenarios: the Sector-CapA scenario allows for one third ofthe reductions abroad (through purchases of permits), while inSector-CapB the entire reduction target must be achieveddomestically.
Table 4 summarises the modelled restrictions on CO2 emis-sions in the respective scenarios, while Table 5 also outlines therespective national targets (in million tonnes) for the years 2010and 2020.
3.3. Sensitivity analyses
TIMES-Sweden relies on a representation of the base yearenergy system as well as on assumptions about the future. It istherefore important to perform some sensitivity analysis, and inthis paper we present simulation results, which rely on varyingassumptions concerning the CO2 target, the TEP price in EU ETSand the discount rate.
In the case of alternative CO2 targets, we focus solely on theCountry-Cap scenario, and illustrate to what extent the estimatedancillary benefits differ if this target is assumed to be both higher(53%) and lower (20%) than the current 40% target (all comparedto the 1990 emission level). The future prices of TEP are clearlyuncertain; only in the year 2008 the price of futures contracts(December 2010) varied from 15 to 32 Euro per tonne of CO2
(ECX, 2009). In the sensitivity analysis we assume that from theyear 2015 the price of TEP equals 22 Euro2000 and 99 Euro2000 pertonne of CO2, respectively, in the EU scenario (instead of 44Euro2000 per tonne). In this case we thus focus on the outcomes ofthe EU scenario. Moreover, the choice of discount rate whencomparing different climate mitigation policies have beendiscussed intensively in the literature (e.g., Azar and Sterner, 1996;Stern, 2006). The current Swedish practise for large public infra-structure investments is to use a social discount rate of 4% (SIKA,2002). The Swedish Institute for Transport and CommunicationsAnalysis recommends the use of 2% and 7% discount rates,

A. Krook Riekkola et al. / Energy Policy 39 (2011) 4985–4998 4991
respectively, in sensitivity analyses, and this is also the approachfollowed in this paper. In our analysis the discount rate is varied inthe Country-Cap scenario, and for consistency the baseline scenariohas been treated in the same manner.
4. Model simulation results and discussion
In this section we present and discuss the results of the modelsimulations. We pay particular attention to the assessment of theancillary benefits in each of the three main climate policyscenarios, and analyse the extent to which these results appearsensitive to varying assumptions about TEP prices, overall CO2
targets, and discount rates. It should be noted that since thebaseline scenario includes existing policy instruments, the esti-mated ancillary benefits are only those that arise as a result of thestricter policy targets. Before proceeding, however, it is useful tobriefly investigate the national CO2 emissions reductions in eachof the policy scenarios investigated.
4.1. Carbon dioxide emissions in the respective scenarios
Our simulation results for the year 2020 show that there is anet decrease in emissions already in the baseline scenario. Thisreduction is largely due to a phase out of oil for heating purposesas a result of increasing oil prices. In addition, there is also areduction of CO2 in the transport sector due to a shift to moreefficient vehicles as well as to biofuels, induced by the existingfuel taxation, increasing oil prices and technological progress. TheEU target of 10% renewable energy sources in the road transpor-tation sector is in fact achieved already in our baseline scenario.After the year 2020, however, the increases in CO2 emissions inthe industrial sector as well as in the electricity and heat sectorsexceed the emission decreases in the other sectors, thus callingfor additional and/or strengthened policy instruments to maintaina decreasing overall trend.
Table 6 presents the emissions of CO2 in the respective policyscenarios, all compared to the baseline scenario. In order to meetthe Swedish climate target of 40% emissions reduction by 2020solely through domestic measures (i.e., the Country-Cap andSector-CapB scenarios, respectively), the reduction from the base-line path needs to be 24.5%. The Sector-CapB scenario has equaloverall domestic reductions to that in the Country-Cap scenario,but with different policies for the trading and non-trading sectors,respectively. As will be illustrated below, this difference acrossthe two policy scenarios has some interesting implications for theestimated ancillary benefits.
The price of permits provides the main incentive for carbonreduction in the trading sector, and any additional domesticreductions needed to reach the 40% national target must be metby the strengthening of existing domestic policy instruments.
Table 6Swedish CO2 emissions in the baseline scenario and percentage reductions from
the baseline in the respective policy scenarios (2020).
Baseline(milliontonnes)
Country-cap
EU Sector-CapA
Sector-CapB
Percentage change from Baselinescenario (%)
Trading sectors 15,908 �37.4 �26.1 �26.0 �7.2
Non-trading
sectors
24,826 �16.2 5.0 2.3 �35.6
Total 40,734 �24.5 �7.1 �8.7 �24.5
In the model simulations we impose the residual target on thenon-trading sector and a new shadow price on CO2 emissions isattained. The results in Table 6 show that that in the Sector-CapBscenario the national target can only be met through deepreductions (�35.6%) in the non-trading sector. The correspondingreductions in the Country-Cap scenario are much more modest.
The EU and the Sector-CapA scenarios both imply that Swedencan depart from a national emissions target, and make use of thebenefits of permit trading. In both scenarios total domesticemissions are significantly higher compared to the other twoscenarios, this since the lack of domestic reductions is compen-sated by permits bought in the international market. Both thesescenarios thus imply a significant loosening of the aggregatenational target, something which in turn explains why the non-trading sector’s emissions increase (Table 6). This also indicatesthat compared to other Member States, Sweden is a country witha relatively high marginal cost of CO2 abatement (especially in thenon-trading sector).
In the EU scenario, the extent to which Sweden relies onreductions in other countries is determined entirely endogen-ously in the model simulations, while the Sector-CapA scenarioonly permits one third of total emissions reductions to take placeabroad. The decrease in domestic CO2 emissions is only slightlylower in the EU scenario, thus indicating that the two-thirdprinciple represents a binding constraint, but it does not imposea significant burden on the Swedish economy (see also Section4.2). Specifically, it appears that the flexibility to count one-thirdof internationally purchased permits toward the national target isenough flexibility to almost completely reverse the Sector-CapBoutcome. The Sector-CapA scenario thus comes close to the EUscenario with no ‘‘supplementarity’’ constraint.
4.2. An assessment of the resulting ancillary benefits
Fig. 2 shows – for each policy scenario – the estimates of thechanges (from the baseline) in: (a) total annual system costsexcluding any ancillary benefits (DASC); (b) the annual ancillarybenefits given three different estimates of the external costs(DADC); and (c) the total annual system costs including theancillary benefits (DASCþDADC).
The results are presented for the year 2020 and indicate thattotal system costs (excluding any ancillary benefits) are typicallylower in the two scenarios that permit Sweden to make use ofemissions trading to comply with the climate policy target. It canalso be noted that imposing a uniform additional price on CO2 inSweden (Country-Cap) would represent a more cost-effectivepolicy than the one represented by the Sector-CapB scenario inwhich the trading and the non-trading sectors face differentadditional CO2 prices. This result is well in line with other studiesusing computable general equilibrium models of the Swedisheconomy (e.g., Ostblom and Samakovlis, 2004)3. The results alsoillustrate that the Sector-CapA scenario imposes marginallyhigher system costs than the EU scenario, thus reinforcing theabove conclusion that the proposed minimum cap on domesticreduction in this scenario imposes only a very minor constrainton overall policy compliance. Moreover, the Sector-CapB scenarioimplies substantially higher costs than the other three scenarios,essentially since in this case the energy system is forced to
3 It should be noted, though, that the ways in which economic costs (or
reduced economic welfare) are defined differ between energy system models and
general equilibrium models, respectively. For instance, the former models typi-
cally address the importance of direct technology-specific costs, while ignoring,
for instance, the impacts that a policy targeted towards one market can have on
economic decisions in other markets. The ways in which non-market costs – and
the internalisation of these through policy – are treated may also differ.

-300
-100
100
300
500
700
900
1100
1300
-WHO -Low
CAFEWHO -High
ExternEWHO -Low
CAFEWHO -High
Change in Ancillary Effects
"CountryCap""EU""SectorCapA""SectorCapB"
MEuro
Change in Annual System
Cost excl Ancillary Effects
ExternE CAFE CAFE
Change in Annual System Costincl Ancillary Effects
Fig. 2. Estimated change in system cost and ancillary effects compared to the baseline scenario (million Euro2000).
Table 7Ancillary benefits (Euro) per ton CO2 reduced and as a share of total costs.
Country-Cap EU Sector-CapA Sector-CapB
Reduced damage cost (DADC)/tonnes of CO2 reduced (Euro2000/tonne CO2)ExternE 3.9 5.1 6.0 5.0
Cafe/WHO-low 7.5 8.9 11.6 10.9
Cafe/WHO-high 20.8 24.7 32.1 29.8
Reduced damage cost (DADC)/increased system cost (DASC) (percentageshare)ExternE 6.1 3.1 4.4 3.8
Cafe/WHO-low 12.0 5.4 8.5 8.3
Cafe/WHO-high 32.0 15.0 24.0 23.0
A. Krook Riekkola et al. / Energy Policy 39 (2011) 4985–49984992
undertake substantial domestic reductions in the non-tradingsector in which the marginal cost of CO2 abatement is highcompared to the corresponding cost in the trading sector.
Economically the ancillary benefits constitute a far frominsignificant share of total system costs (see also below), andthese appear to be most prevalent in the scenarios that entail thelargest emission reductions domestically. The latter results are farfrom unexpected since an increase in emission reductions abroadalso implies a lost opportunity of achieving substantial welfaregains from the reductions of a number of regional and localenvironmental pollutants. Still, the estimated size of the ancillarybenefits is not large enough to fundamentally alter the ranking ofclimate policy design in terms of system cost impacts. One cannote, though, that in the two cases where the CAFE/WHO externalcost estimates are used, the Sector-CapA scenario implies loweroverall system costs than the EU scenario, thus in part speaking infavour of the current Swedish government’s policy to restrictemission reductions abroad.
Table 7 presents more details on the estimated total ancillarybenefits, and displays these in terms of reduced (non-carbon)damage costs per tonne (domestically) reduced CO2 and as ashare of increased total system costs. The relatively low domesticCO2 reductions in the EU and the Sector-CapA scenarios imply ahigh reduced damage cost per tonne reduced CO2.
The ancillary benefits of Swedish climate policy, expressed as ashare of the total cost of the policy, are overall the highest in theCountry-Cap scenario. Again, the advantages of a climate policyrelying heavily on international permit trading become less
pronounced when taking into account the local and regionalenvironmental impacts of reduced CO2 emissions. Although thetotal policy costs is lower with permit trading the difference incost between, say, the Country-Cap scenario and the EU scenario,is significantly reduced when the ancillary benefits are subtractedfrom total system costs. The economic benefits of domesticreduction become even more significant with higher permitprices (see also Section 4.3), and higher economic valuations ofthe damages from regional and local pollution impacts.
On a per tonne basis it is also interesting to note that theSector-CapB scenario involves larger ancillary benefits than theCountry-Cap scenario. An important reason for this result is likelyto be that the former scenario puts more emphasis on limitingCO2 emissions in the non-trading sector that includes sourceswith presumably less pollution control and/or higher exposurethan the large stationary sources within the trading sector. Still, itis useful to analyse in more detail to what extent the differentpollutants contribute to the total ancillary benefits reported inFig. 2 as well as the role of different technologies and fuels.
Fig. 3 presents the total ancillary benefits by pollutant. It canbe noted that for all four types of pollutants, there is a positivebenefit in terms of reduced environmental costs. Thus, in none ofthe cases we witness a net emissions increase as a result of thedifferent climate policies. However, the relative contribution ofthe different pollutants to the total ancillary benefits differs, andthis is in part contingent on the choice of source for the externalcost estimates. For instance, the ExternE-based estimates indicatean important role for the reduction of particles, while theCAFE-estimates instead display a more significant contribution fromreduced nitrogen emissions. Still, overall all pollutants – with thenotable exception of NMVOC – contribute significantly to reducedsystem costs following the implementation of more stringentclimate policies.
Finally, the TIMES-Sweden model permits a technology-richdescription of the energy system, and for this reason it is useful toexploit this feature of the model to discuss some of the technol-ogy choices underlying the results presented above. Fig. 4 showsthe primary energy supply by fuel and technology source in 2020for each policy scenario, while Figs. 5 and 6 display the corre-sponding fuel mixes for the electricity and transport sectors,respectively. In Figs. 4–5 the generation from nuclear and hydro-power has been excluded, primarily since these do not changeover the relevant period. The installed capacity of large-scale
0.0
50.0
100.0
150.0
200.0
250.0
Cou
ntry
Cap EU
Sec
torC
apA
Sec
torC
apB
Cou
ntry
Cap EU
Sec
torC
apA
Sec
torC
apB
Cou
ntry
Cap EU
Sec
torC
apA
Sec
torC
apB
CAFE WHO - High
VOCSO2PM2.5NOX
MEuro
Extern ECAFE WHO - Low
Fig. 3. Ancillary benefits by pollutant in all policy scenarios for the year 2020 (million Euro2000).
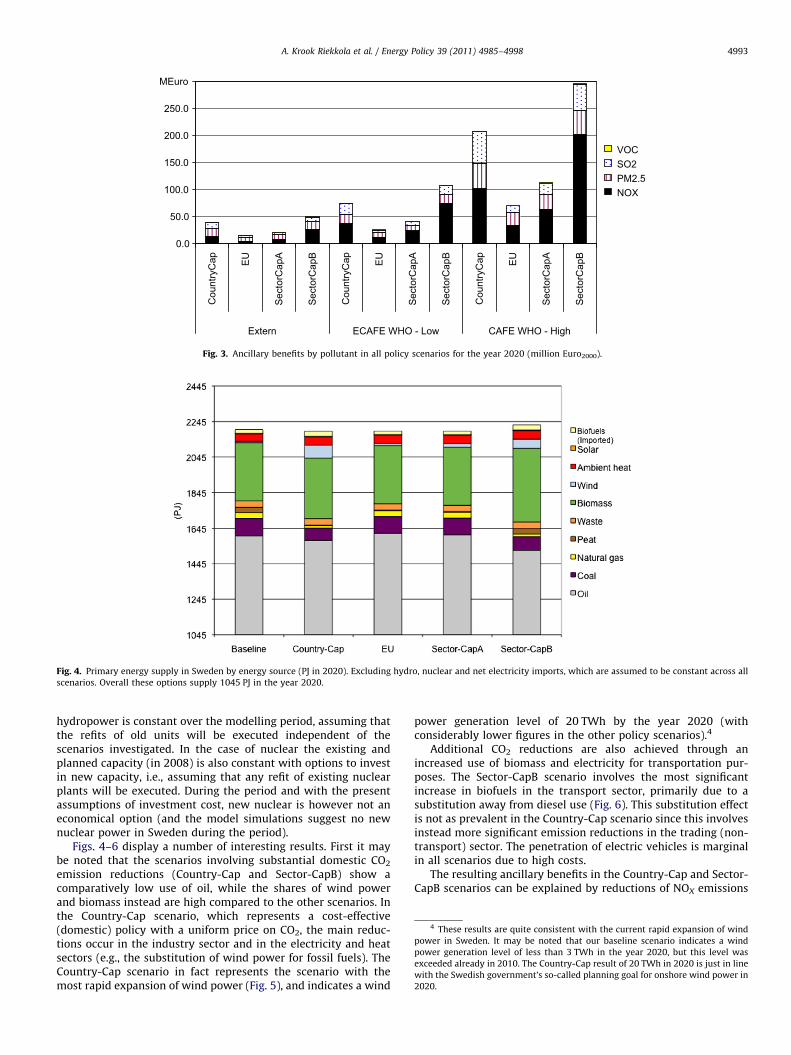
Fig. 4. Primary energy supply in Sweden by energy source (PJ in 2020). Excluding hydro, nuclear and net electricity imports, which are assumed to be constant across all
scenarios. Overall these options supply 1045 PJ in the year 2020.
4 These results are quite consistent with the current rapid expansion of wind
power in Sweden. It may be noted that our baseline scenario indicates a wind
power generation level of less than 3 TWh in the year 2020, but this level was
exceeded already in 2010. The Country-Cap result of 20 TWh in 2020 is just in line
with the Swedish government’s so-called planning goal for onshore wind power in
2020.
A. Krook Riekkola et al. / Energy Policy 39 (2011) 4985–4998 4993
hydropower is constant over the modelling period, assuming thatthe refits of old units will be executed independent of thescenarios investigated. In the case of nuclear the existing andplanned capacity (in 2008) is also constant with options to investin new capacity, i.e., assuming that any refit of existing nuclearplants will be executed. During the period and with the presentassumptions of investment cost, new nuclear is however not aneconomical option (and the model simulations suggest no newnuclear power in Sweden during the period).
Figs. 4–6 display a number of interesting results. First it maybe noted that the scenarios involving substantial domestic CO2
emission reductions (Country-Cap and Sector-CapB) show acomparatively low use of oil, while the shares of wind powerand biomass instead are high compared to the other scenarios. Inthe Country-Cap scenario, which represents a cost-effective(domestic) policy with a uniform price on CO2, the main reduc-tions occur in the industry sector and in the electricity and heatsectors (e.g., the substitution of wind power for fossil fuels). TheCountry-Cap scenario in fact represents the scenario with themost rapid expansion of wind power (Fig. 5), and indicates a wind
power generation level of 20 TWh by the year 2020 (withconsiderably lower figures in the other policy scenarios).4
Additional CO2 reductions are also achieved through anincreased use of biomass and electricity for transportation pur-poses. The Sector-CapB scenario involves the most significantincrease in biofuels in the transport sector, primarily due to asubstitution away from diesel use (Fig. 6). This substitution effectis not as prevalent in the Country-Cap scenario since this involvesinstead more significant emission reductions in the trading (non-transport) sector. The penetration of electric vehicles is marginalin all scenarios due to high costs.
The resulting ancillary benefits in the Country-Cap and Sector-CapB scenarios can be explained by reductions of NOX emissions

Fig. 5. Electricity generation by source in Sweden (TWh in 2020). Excluding hydro, nuclear and net electricity imports, which are assumed to be constant across all
scenarios. Overall these options supply 132 TWh (in net energy terms) in the year 2020.
0
50
100
150
200
250
300
350
400
Baseline
(PJ)
Biofuels forBlendingBiofuels
Natural Gas
Kerosene/JetFuelsOil
Electricity
Diesel
Gasoline
Country-Cap EU Sector-CapA Sector-CapB
Fig. 6. Fuel use in the Swedish transportation sector (PJ in 2020).
A. Krook Riekkola et al. / Energy Policy 39 (2011) 4985–49984994
from the transport sector (due to complex freight traffic fuelsubstitutions creating more favourable conditions for, for instance,the use of DME compared to methanol) as well as reductions ofSO2 in the non-trading industry segments when substituting awayfrom oil to biomass. The model simulations suggest a substitutionof biomass for oil for process heating within the agricultural andindustrial sectors. These impacts involve important reductions innon-GHG emissions (e.g., SO2). Moreover, as was noted abovethese scenarios are essentially forcing the energy system toundertake domestic emissions reductions in the non-tradingsector, implying greater use of biofuels in the transport sector.This means in turn that a significant share of the estimatedancillary benefits stem from the substitution of biomass andimported biofuels for diesel and gasoline. Even though electricityuse overall is higher in these scenarios, Fig. 5 shows that the use ofbiomass in the electricity sector is lower than in the baseline. Thiscan be explained by the fact that under these policy designs thewillingness-to-pay for biomass is higher in the transport sectorand in the other non-trading sectors.
In those scenarios where there instead exist fewer restrictionson the non-trading sector – i.e., the EU and the Sector-CapAscenarios – we find different results. In these scenarios, the primaryuse of biomass in the year 2020 is similar to the corresponding usereported for the baseline scenario (but lower compared to the
Country-Cap and the Sector-CapB scenarios). For this reason wealso witness a lower reduction in diesel use in the transport sector(Fig. 6). However, instead more biomass is used in the electricitysector at the expense of less wind power (Fig. 5), and there is also ashift from biomass to electricity within the industry sector resultingin lower net reductions of (primarily) NOX but also NMVOC.
Although the EU and the Sector-CapA scenarios are overallsimilar, important differences do exist. For instance, in the Sector-CapA scenario biomass is to a greater extent used to produce processheat in the non-trading industries compared to the EU scenario, andthe penetration of wind power is also higher in the former case. Thesubstitution of wind power for fossil fuels in the electric powersector is an important source of ancillary benefits. Significant NOX
and SO2-emissions (see Fig. 4) are avoided while wind power initself does not give rise to any of the emissions that are consideredhere. Still, the overall penetration of wind power is significantlylower in these flexible policy scenarios since these involve a greaterrange of cost-effective alternatives via permit trading.
4.3. Sensitivity analyses
The above model simulation results indicate that the magni-tude of the ancillary benefits is most significant in the policyscenarios that involve substantial CO2 emission reductions

-50.0
0.0
50.0
100.0
150.0
200.0
250.0
Low
Nat
iona
l
Hig
h
Low
Nat
iona
l
Hig
h
Low
Nat
iona
l
Hig
h
ExternE
VOCSO2PM2.5NOX
MEuro
CAFE WHO - Low CAFE WHO - High
Fig. 7. Ancillary benefits in 2020 by pollutant: country-cap scenario under various CO2-reduction targets (million Euro2000).
-20.0
0.0
20.0
40.0
60.0
80.0
100.0
Eur
o 22
Eur
o 44
Eur
o 99
Eur
o 22
Eur
o 44
Eur
o 99
Eur
o 22
Eur
o 44
Eur
o 99
ExternE
VOCSO2PM2.5NOX
MEuro
CAFE WHO - Low CAFE WHO - High
Fig. 8. Ancillary benefits in 2020 by pollutant: EU-scenario under various TEP-prices in EU ETS (million Euro2000).
A. Krook Riekkola et al. / Energy Policy 39 (2011) 4985–4998 4995
domestically. For this reason it is of interest to investigate in moredetail the role of the ancillary effects in the presence of differentambition levels for the required domestic reductions. Fig. 7 showsthe estimated ancillary benefits by pollutant for 2020 in theCountry-Cap scenario, and compares these to the correspondingimpacts in the case of a lower and a higher reduction target,respectively. The base (national) case assumes a 40% reduction inCO2 emissions compared to the 1990 level, while the ‘‘low’’ and‘‘high’’ cases build on the assumption of 20% and 53% emissionreductions, respectively.
The simulation results indicate that the absolute sizes of theestimated ancillary benefits are sensitive to the assumed CO2
reduction targets. For instance, the ancillary benefits increase by afactor of 1.5 as we increase the emission reduction target from40% to 53%. This result is fairly independent of the source used forthe external cost estimates. Fig. 7 also shows that the relativecontribution of SO2 to the estimated total ancillary benefitsincreases with stricter CO2 reduction targets. This can be attrib-uted to the increased substitution of biomass for oil for processheating within the agricultural and industrial sectors.
In Fig. 8 we illustrate some impacts on the estimated ancillaryeffects in the presence of higher TEP prices in EU ETS. In thissensitivity analysis we pay attention only to results from the EU
scenario. This is in part motivated by the fact that in our base case(44 Euro2000 per tonne of CO2), the ancillary benefits werecomparatively low compared to the other policy scenarios. Inthe sensitivity analysis we assume a TEP price of 22 and 99Euro2000 per tonne of CO2, respectively (from 2015 and onwards),and the model simulations permit thus an assessment of whether(and, if so, by how much) these changes induce a significantchange also in the estimated ancillary benefits as the relativeeconomic cost of domestic CO2 reduction options is altered.
The results in Fig. 8 show that with increases in the TEP pricesthe absolute size of the ancillary benefits increases since theeconomic viability of domestic reductions is improved (relativethe option of purchasing permits). This effect is most pronouncedwhen comparing the low TEP price of 22 Euro2000 per tonne ofCO2 with our base case of 44 Euro per tonne of CO2. In the formercase the ancillary benefits are even negative, that is in thisscenario climate policy induces net increases in non-GHG emis-sions (most notably NOX and SO2) that in turn cause an increase intotal system costs. The latter effect is partly a result of a higherelectricity price with a TEP price of 22 Euro2000 per tonne of CO2
compared to 11 Euro (in the Baseline scenario), resulting, forinstance, in more district heating (from biomass boiler) and lessuse of heat pumps in the residential sector.

0.0
50.0
100.0
150.0
200.0
DR
2
DR
4
DR
7
DR
2
DR
4
DR
7
DR
2
DR
4
DR
7
ExternE
VOCSO2PM2.5NOX
MEuro
CAFE WHO - Low CAFE WHO - High
Fig. 9. Ancillary benefits in 2020 by pollutant: country-cap scenario under various discount rate assumptions (million Euro2000).
A. Krook Riekkola et al. / Energy Policy 39 (2011) 4985–49984996
Finally, assumptions about the discount rate can affect theenergy system in various ways, the most obvious being perhapsthat the lifetime cost of new energy technologies will change andalter the merit orders for these. For instance, some technologies(e.g., wind power, nuclear energy, etc.) typically loose competitiveground from the use of higher discount rates (e.g., Pettersson andSoderholm, 2009). This is a result of the fact that the capital costsinvolved in the development of these technologies form a sizeablepart of the total lifetime costs, and this may in turn influence theresulting ancillary effects. Fig. 9 shows the resulting ancillaryeffects in the Country-Cap scenario when three different discountrates are used: the base case of 4% and then two alternativediscount rates of 2% and 7%, respectively.
The results indicate that the estimated ancillary benefitsappear to be only marginally affected by the use of alternativediscount rates in the model simulations. Moreover, discount ratechanges do not always imply monotonic changes in the magni-tudes of the estimated ancillary benefits. It may be noted, forinstance, that the total ancillary benefits decrease as the discountrate is raised from 4% to 7%. The main reason for this decrease is areduction in avoided NOX damages, in part due to a reduction inwind power generation. With its high share of investment costsout of total lifetime costs, this technology becomes significantlymore expensive with higher rate-of-return requirements.
The most significant emission reductions of particulates andVOC are found with a discount rate of 2%, when new investmentsin biomass based heating is partly switched to heat pumps (thelatter associated with higher investments costs). The SO2 reduc-tions from the baseline are largest when comparing scenarioswith a discount rate of 7% when coal based power plants areswitched to less capital-intensive natural gas (with no SO2
emissions) when implementing CO2 targets, while for lowerdiscount rates coal is instead replaced by biomass (which alsogives rise to some SO2 emissions).
When comparing these results to the corresponding results inthe Sector-CapA scenario the results are overall very similar to theones presented in Fig. 9 – i.e., marginal effects of the use ofalternative discount rates – and the differences in total estimatedancillary benefits across these two scenarios (i.e., higher in theCountry-Cap scenario) remain unaltered.
5. Concluding remarks
In this paper we build on the well-established literaturesuggesting that GHG reduction policies, which create incentives
to alter the use of fossil fuels, can have important local andregional environmental impacts quite distinct from the global andlonger-term benefits directly associated with avoided climatechange. The paper has addressed a number of health-relatedimprovements (ancillary benefits) that could accompany thereduction in CO2 under different climate policy designs inSweden. These designs differ primarily in terms of how thecountry chooses to meet a specific target and where the necessaryemission reductions take place. The reliance on a technology-richenergy system optimisation model of the Swedish energy system(TIMES-Sweden) has permitted us to address the economicsignificance of these environmental side-effects as well as toprovide a detailed assessment of the respective technology andfuel choices that underlie any net changes in the estimatedancillary benefits.
The results indicate that significant ancillary benefits accom-pany Swedish climate policy and they constitute a far frominsignificant share of the increase in total system costs, thusreducing the overall cost of climate policy. Moreover, this shareappears to be particularly significant in the scenarios that entailthe largest emission reductions domestically. The latter resultsreflect the fact that since an increase in emissions reductionsabroad also implies a lost opportunity of achieving importantwelfare gains from the reductions of a number of regional andlocal environmental pollutants. This shows, thus, that the notionof full flexibility in compliance measures (including geographicallocation) may not necessarily represent the most cost-effectivestrategy for an individual country. Still, in our case the estimatedsize of the ancillary benefits is overall not large enough tofundamentally alter the ranking of climate policy design in termsof system cost impacts. Nevertheless, under the model assump-tions made the results tend to provide some support for thecurrent Swedish government’s policy to partly restrict emissionreductions abroad.
While these overall results have been highlighted also inprevious work, an important contribution of the present paperhas been to investigate in more detail the technology choicesunderlying the aggregate figures, including a sensitivity analysisof the impact of policy target levels, permit prices and discountrates on the estimated ancillary benefits. The choice of bottom-up(technology-rich) energy system model facilitates these assess-ments. For instance, from an energy system perspective theresults suggesting higher ancillary benefits in the policy scenariosrestricting permit trading can be explained by the role of climatepolicy in inducing relatively large reductions of NOX emissionsfrom the transport sector as well as reductions of SO2 in the

Table A1Energy and fuel taxes in the baseline scenario.
Sources: Swedish Tax Agency (2008a, 2008b).
Energy tax CO2-tax SO2-tax Unit
Non-transportationResidual fuel oil 2.47 9.33 0 Euro/GJ
Heavy fuel oil—class 1 4.13 9.33 0 Euro/GJ
Heavy fuel oil—class 2 4.95 9.33 0.33 Euro/GJ
Heavy fuel oil—class 3 5.06 8.78 0.32 Euro/GJ
Liquefied petroleum gas 0.38 7.62 0 Euro/GJ
Natural gas 0.72 6.28 0 Euro/GJ
Hard coal, coke 1.39 10.70 0.61 Euro/GJ
Peat 0 0.56 Euro/GJ
Municipal solid waste 0.03 0.63 0 Euro/GJ
TransportationMotor spirit/gasoline 10.42 8.25 0 Euro/GJ
Diesel oil 4.13 9.33 0 Euro/GJ
Kerosene—jet fuels 4.13 9.33 0 Euro/GJ
Liquefied petroleum gas 0 3.93 0 Euro/GJ
Natural gas 0 3.86 0 Euro/GJ
Ethanol/methanol (bio) 0 0 0 Euro/GJ
Electricity consumptionNon-industry 8.70 Euro/GJ
Industry 0.15 Euro/GJ
Nuclear powerInstalled capacity 16.9 Euro/kW and Year
A. Krook Riekkola et al. / Energy Policy 39 (2011) 4985–4998 4997
non-trading industry segments when substituting away from oilproducts to biomass.
The model simulations also illustrate that the estimatedancillary benefits of climate policy in Sweden appear to be anon-linear function of the reduced CO2-emissions, both in termsof the ancillary benefits per reduced tonne of CO2 and as a shareof the total system cost. This is explained by differences in thetechnology choices following each of the policy scenarios. Overallour findings illustrate the usefulness of analysing the ancillarybenefits of climate policy with a bottom-up energy system model.In this paper we have, for instance, highlighted the allocation ofbiomass in the presence of the weight given to domestic emissionreduction versus the use of permit trading. We also find impor-tant differences across policy scenarios with respect to windpower and oil use, in part resulting in significantly higherancillary benefits from NOX and SO2 reductions in the scenariosinvolving a stronger focus on domestic emission reductions. Thesensitivity analyses show that the absolute size of the ancillarybenefits are sensitive to the assumed CO2 reduction target (in thedomestic reduction scenario) and to changes in the permit price(in the permit trading scenario), but appear not to be heavilyinfluenced by changes in the discount rate.
Clearly additional research efforts are needed to shed morelight on the issue of to what extent the ancillary benefits ofclimate policies could potentially offset a portion of the costs ofthese policies. For instance, in most studies the baseline issuesprobably deserve more attention. In our analysis we pay attentionmainly to the impact of environmental policy and fuel taxes. Still,other baseline issues may be equally important to consider inmore detail, including other policy issues (e.g., health policy) andnon-policy issues such as technological change, transportationtrends and demographic developments. In the Swedish context itis worth noting that a significant proportion of the estimatedancillary benefits appear in the transport sector, and limiteddiffusion of alternative fuels in the transport sector appearsalready in the baseline scenario. Clearly, however, the futureevolution of vehicles and fuels is highly uncertain, not the leastdue to the competition for the biomass (in part illustrated inthis paper), and the presence of significant network externalitiesin the fuel supply infrastructure. It is also useful to highlightin more detail the importance of domestic ancillary benefitsfollowing the implementation of JI and CDM projects. Forinstance, van Vuuren et al. (2006) show that Western Europeancountries may experience domestic non-climate ancillary effectsfrom JI projects in Eastern Europe, not the least through thereduction of reduced trans-boundary pollution (e.g., sulphurdioxide).
Additional research on understanding the presence of ancillarybenefits may not the least be motivated from a policy transitionperspective. In national climate mitigation strategies there is aneed to identify (no regrets) policy measures that generateimportant external benefits, and that for this reason becomepolitically legitimate. The resulting reductions in non-GHGdamages to health, crops and materials represent real economicbenefits, and other side-benefits of the promotion of carbon-freeenergy sources include, for instance, improved security of supplyand regional employment impacts. So far energy modellingstudies have tended to pay most attention to analysing the impactof well-defined and uniform carbon taxes on the energy system,while fewer studies factor in the role of policy and institutionalchange in achieving these energy futures in practices.
Appendix A
See Appendix Table A1.
References
Azar, C., Sterner, T., 1996. Discounting and distributional considerations in thecontext of global warming. Ecological Economics 19 (2), 169–184.
Bostrom, C.-A., Flodstrom, E., Cooper, D., 2004. Emissionsfaktorer for StationarForbranning (Emission Factors in Stationary Combustion). Report nr 3-2004,Swedish Environmental Emissions Data (SMED).
Boyd, R., Krutilla, K., Viscusi, W.K., 1985. Energy taxation as a policy instrument toreduce CO2 emissions: a net benefit analysis. Journal of EnvironmentalEconomics and Management 29, 1–24.
Burtraw, D., Krupnick, A., Palmer, K., Paul, A., Toman, M., Bloyd, C., 2003. Ancillarybenefits of reducing air pollution in the US from moderate greenhouse gasmitigation policies in the electricity sector. Journal of Environmental Econom-ics and Management 45 (3), 650–673.
Bye, B., Kverndokk, S., Rosendahl, K.E., 2002. Mitigation costs, distributional effectsand ancillary benefits of carbon policies in the Nordic countries, the UK andIreland: a survey of model results. Mitigation and Adaption Strategies forGlobal Change 7, 339–366.
Carlen, B., 2004. EU’s Emissions Trading System in the Presence of NationalEmission Target. Working Paper 2004:16, Department of Economics, Stock-holm University.
Das, A., Rossetti di Valdalbero, D., Virdis, M.R., 2007. ACROPOLIS: an example ofinternational collaboration in the field of energy modelling to support green-house gases mitigation policies. Energy Policy 35 (2), 763–771.
Davis, D.L., Krupnick, A., McGlynn, G., 2000. Ancillary benefits and costs ofgreenhouse gas mitigation—an overview. Paper presented at the IPCC ExpertWorkshop on Assessing the Ancillary Benefits and Costs of Greenhouse GasMitigation Policies, Washington, DC, March 27–29.
Ekins, P., 1996. The secondary benefits of CO2 abatement: how much emissionreduction do they justify? Ecological Economics 16 (1), 3–24.
Elforsk, 2007. El Fran Nya Anlaggningar 2007. Elforsk Report 07:50, Stockholm.European Climate Exchange (ECX), 2009. Prices and Volume: ECX EUA Futures
Contract (22 April 2005–17 March 2009). Internet: /www.ecx.eu/EUA-FuturesS.Garqiulo, M., 2008. RES 2020. The modeling approach in RES2020 and the data
used for the potential of renewable energy sources in EU27. Presentation atthe RES2020 International Workshop, 10–11 November, Prague. Internet:/www.res2020.euS.
Government Bill 2008/09:162. En sammanhallen klimat-och energipolitik—
klimat, Ministry of the Environment, Government of Sweden, Stockholm.Government Offices of Sweden, 2009. A Sustainable Energy and Climate Policy for
the Environment. Competitiveness and Long-term Stability, Swedish PrimeMinister’s Office, Internet: /www.sweden.gov.se/sb/d/2031/a/120088S.
Holland, M., Watkiss, P., 2007. Benefits Table Database: Estimates of the MarginalExternal Costs of Air Pollution in Europe. Version E1.02a.
Hourcade, J.-C., Shukla, P.R., Cifuentes, L., Davis D., Emonds, J., Fisher, B., Fortin, E.,Golub, A., Hohmeyer, O., Krupnick, A., Kverndokk, S., Loulou, R., Richels, R.,Segenovic, H., Yamaji, K., 2001. Global, Regional, and National Costs andAncillary benefits of Mitigation. Climate Change 2001: Mitigation. Intergo-vernmental Panel on Climate Change, Third Assessment Report (TAR). Cam-bridge University Press, Cambridge, UK, pp. 499–559.

A. Krook Riekkola et al. / Energy Policy 39 (2011) 4985–49984998
Intergovernmental Panel on Climate Change (IPCC), 2007. Climate Change 2007:The Physical Science Basis. Contribution of Working Group I to the FourthAssessment Report of the Inter-governmental Panel on Climate Change,Geneva.
Kageson, P., 2007. Miljobilar och Biodrivmedel—Hur Paverkas Sverige av EU:sDirektiv? Vinnova Report VR 2007:10, Stockholm.
Klaassen, G., Riahi, K., 2007. Internalizing externalities of electricity generation: ananalysis with MESSAGE-MACRO. Energy Policy 35 (2), 815–827.
Krook Riekkola, A., Ahlgren, E., 2003. Externaliteter—En Analys utifran EU:sExternE-Resultat. Nordleden 2003. Slutrapport for Etapp 2, Profu i GoteborgAB, Gothenburg, Sweden.
Kuosmanen, T., Bijsterbosch, N., Dellink, R., 2009. Environmental cost–benefitanalysis of alternative timing strategies in greenhouse gas abatement: a dataenvelopment analysis approach. Ecological Economics 68 (6), 1633–1642.
Loulou, R., Remne, U., Kanudia, A., Lehtila, A., Goldstein, G., 2005. Documentationfor the TIMES Model—PART I, Internet: /www.etsap.org/documentation.aspS.
Morgenstern, R.D., 2000. Baseline issues in the estimation of the ancillary benefitsof greenhouse gas mitigation policies. Paper presented at the IPCC ExpertWorkshop on Assessing the Ancillary Benefits and Costs of Greenhouse GasMitigation Policies, Washington, DC.
Nilsson, C., Huthala, A., 2000. Is CO2-Trading Always Beneficial? A CGE-model Ana-lysis on Secondary Environmental Benefits, Working Paper. National Instituteof Economic Research, Stockholm.
Nordel, 2008. Annual Statistics 2007. Nordel’s Statistics Report, Internet: /www.entsoe.eu/resources/publications/nordic/annualstatistics/S.
OECD, 2002. Ancillary Benefits and Costs of GHG Mitigation: Policy Conclusions,ENV/EPOC/GSP(2001)13/FINAL, Paris.
Ostblom, G., Samakovlis, E., 2004. Cost of Climate Policy when Pollution AffectsHealth and Labour Productivity: A General Equilibrium Analysis Applied toSweden. Working Paper No. 93, Swedish National Institute of Economic Research.
Ostblom, G., Samakovlis, E., 2007. Linking health and productivity impacts toclimate policy costs: a general equilibrium analysis. Climate Policy 7 (5),379–391.
Pettersson, F., Soderholm, P., 2009. The diffusion of renewable electricity in thepresence of climate policy and technology learning: the case of Sweden.Renewable and Sustainable Energy Reviews 13 (8), 2031–2040.
Repetto, R., Austin, D., 1997. The Costs of Climate Protection: A Guide for thePerplexed. World Resources Institute, Washington, DC.
RES2020, 2009. EU27 Synthesis Report. The European Commission’s ResearchProgram: Intelligent Energy. Project no: EIE/06/170/SI2.442662. DeliverableD.4.2. Internet: /www.res2020.euS.
Soderholm, P., Pettersson, F., 2008. Climate policy and the social cost of powergeneration: impacts of the Swedish national emissions target. Energy Policy 36(11), 4154–4158.
Statistics Sweden, 2007. Electric Supply, District Heating and Supply of Naturaland Gasworks Gas 2005. Statistical Report EN11SM0701, Stockholm.
Statistics Sweden, 2008. Statistical Data of Air Borne Emissions by Sector. Internet:/www.scb.seS.
Stern, N., 2006. The Economics of Climate Change, The Stern Review. OxfordUniversity Press.
Swedish Energy Agency, 2006. Energy in Sweden Facts and Figures 2006. Internet:/www.swedishenergyagency.seS.
Swedish Energy Agency, 2007. The Electricity Certificate System 2007. ID-NoET2007:27. Internet: /www.swedishenergyagency.seS.
Swedish Environmental Protection Agency, 2008. Forslag till ny Forordning omMiljo-Kvalitetsnormerna for Utomhusluft (Proposal for New Regulation ofEnvironmental Standards for Outdoor Air Quality). Report 5884, Stockholm.
Swedish Environmental Protection Agency, 2009. Thermal Values and EmissionFactors Energy CLRTAP sub2009. Appendix 2 to National Inventory Report2009 Sweden, Stockholm. Internet: /www.naturvardsverket.se/sv/Tillstandet-i-miljon/UtslappsdataS.
Swedish Institute for Transport and Communications Analysis (SIKA), 2002.Figures Underlying Economic Calculations (Overgripande kalkylparametrar).Report 2002:7. Internet: /www.sika-institute.seS.
Swedish Tax Agency, 2008a. Tax Rates in 2009 (Skattesatser 2009). Internet:/www.skatteverket.seS.
Swedish Tax Agency, 2008b. Selective Purchase Taxes, SKV 505 Edition 21(Punktskatter, SKV 505 utgava 21). Internet: /www.skatteverket.seS.
Van Vuuren, D.P., Cofala, J., Eerens, H.E., Oostenrijk, R., Heyes, C., Klimont, Z., denElzen, M.G.J., Amann, M., 2006. Exploring the ancillary benefits of the Kyotoprotocol for air pollution in Europe. Energy Policy 34 (4), 444–460.